UNITED STATES
SECURITIES AND EXCHANGE COMMISSION
Washington, D.C. 20549
Form 10-K
| |
|
|
| þ |
|
ANNUAL REPORT PURSUANT TO SECTION 13 OR 15(d) OF THE SECURITIES EXCHANGE ACT OF 1934 |
For the Fiscal Year Ended December 31, 2009
or
| |
|
|
| o |
|
TRANSITION REPORT PURSUANT TO SECTION 13 OR 15(d) OF THE SECURITIES EXCHANGE ACT OF 1934 |
For the transition period from to
Commission File Number: 333-84068
Crum & Forster Holdings Corp.
(Exact Name of Registrant as Specified in its Charter)
| |
|
|
| Delaware
|
|
04-3611900 |
| (State or Other Jurisdiction of
|
|
(I.R.S. Employer Identification Number) |
| Incorporation or Organization) |
|
|
305 Madison Avenue, Morristown, New Jersey 07962
(Address of principal executive office)
(973) 490-6600
(Registrant’s telephone number, including area code)
Securities registered pursuant to Section 12(b) of the Act:
None
Securities registered pursuant to Section 12(g) of the Act:
None
THE REGISTRANT MEETS THE CONDITIONS
SET FORTH IN GENERAL INSTRUCTION I(1)(a) AND (b) OF FORM 10-K
AND HAS THEREFORE OMITTED CERTAIN ITEMS FROM THIS REPORT IN ACCORDANCE WITH THE REDUCED DISCLOSURE
FORMAT PERMITTED UNDER INSTRUCTION I.
Indicate by check mark if the registrant is a well-known seasoned issuer, as defined in Rule 405 of
the Securities Act. Yes o No þ
Indicate by check mark if the registrant is not required to file reports pursuant to Section 13 or
Section 15(d) of the Act. Yes þ No o
Indicate by check mark whether the registrant (1) has filed all reports required to be filed by
Section 13 or 15(d) of the Securities Exchange Act of 1934 during the preceding 12 months (or for
such shorter period that the registrant was required to file such reports), and (2) has been
subject to the filing requirements for the past 90 days. Yes o No þ
Indicate by check mark whether the registrant has submitted electronically and posted on its
corporate Web site, if any, every Interactive Data File required to be submitted and posted
pursuant to Rule 405 of Regulation S-T (§232.405 of this chapter) during the preceding 12 months
(or for such shorter period that the registrant was required to submit and post such files).
Yes o No o
Indicate by check mark if disclosure of delinquent filers pursuant to Item 405 of Regulation S-K
(§229.405 of this chapter) is not contained herein, and will not be contained, to the best of
registrant’s knowledge, in definitive proxy or information statements incorporated by reference in
Part III of this Form 10-K or any amendment to this Form 10-K. þ
Indicate by check mark whether the registrant is a large accelerated filer, an accelerated filer, a
non-accelerated filer, or a smaller
reporting company. See the definitions of “large accelerated filer”, “accelerated filer” and
“smaller reporting company” in Rule 12b-2 of the Exchange Act.
| |
|
|
|
|
|
|
| Large accelerated filer o
|
|
Accelerated filer o
|
|
Non-accelerated filer þ
|
|
Smaller reporting company o |
Indicate by check mark whether the registrant is a shell company (as defined in Rule 12b-2 of the
Exchange Act). Yes o No þ
State the aggregate market value of the voting and non-voting common equity held by non-affiliates
computed by reference to the price at which the common equity was last sold, or the average bid and
asked price of such common equity, as of the last business day of the registrant’s most recently
completed second fiscal quarter. Not applicable
Indicate the number of shares outstanding of each of the registrant’s classes of common stock, as
of the latest practicable date:
| |
|
|
| Class |
|
Number of Shares Outstanding at February 25, 2010 |
| Common Stock, $.01 Par Value
|
|
100 |
Documents Incorporated by Reference
None
CRUM & FORSTER HOLDINGS CORP.
Form 10-K
Index
| |
|
|
|
|
|
|
|
4 |
|
|
|
|
|
|
PART I
|
|
|
|
|
|
|
|
|
|
|
|
|
|
|
|
|
|
|
5 |
|
|
|
|
|
|
|
|
|
5 |
|
|
|
|
|
|
|
|
|
7 |
|
|
|
|
|
|
|
|
|
10 |
|
|
|
|
|
|
|
|
|
10 |
|
|
|
|
|
|
|
|
|
11 |
|
|
|
|
|
|
|
|
|
12 |
|
|
|
|
|
|
|
|
|
13 |
|
|
|
|
|
|
|
|
|
18 |
|
|
|
|
|
|
|
|
|
18 |
|
|
|
|
|
|
|
|
|
22 |
|
|
|
|
|
|
|
|
|
22 |
|
|
|
|
|
|
|
|
|
24 |
|
|
|
|
|
|
|
|
|
25 |
|
|
|
|
|
|
|
|
|
25 |
|
|
|
|
|
|
|
|
|
29 |
|
|
|
|
|
|
|
|
|
29 |
|
|
|
|
|
|
|
|
|
37 |
|
|
|
|
|
|
|
|
|
37 |
|
|
|
|
|
|
|
|
|
38 |
|
|
|
|
|
|
|
|
|
38 |
|
|
|
|
|
|
|
|
|
38 |
|
|
|
|
|
|
PART II
|
|
|
|
|
|
|
|
|
38 |
|
|
|
|
|
|
|
|
|
38 |
|
|
|
|
|
|
|
|
|
40 |
|
|
|
|
|
|
|
|
|
40 |
|
|
|
|
|
|
|
|
|
50 |
|
|
|
|
|
|
|
|
|
52 |
|
|
|
|
|
|
|
|
|
60 |
|
|
|
|
|
|
|
|
|
63 |
|
|
|
|
|
|
|
|
|
63 |
|
|
|
|
|
|
|
|
|
63 |
|
|
|
|
|
|
|
|
|
63 |
|
|
|
|
|
|
|
|
|
64 |
|
|
|
|
|
|
|
|
|
64 |
|
|
|
|
|
|
|
|
|
66 |
|
|
|
|
|
|
|
|
|
67 |
|
|
|
|
|
|
|
|
|
68 |
|
|
|
|
|
|
|
|
|
68 |
|
|
|
|
|
|
|
|
|
69 |
|
|
|
|
|
|
|
|
|
70 |
|
|
|
|
|
|
|
|
|
71 |
|
|
|
|
|
|
|
|
|
72 |
|
|
|
|
|
|
|
|
|
73 |
|
|
|
|
|
|
|
|
|
74 |
|
|
|
|
|
|
|
|
|
76 |
|
2
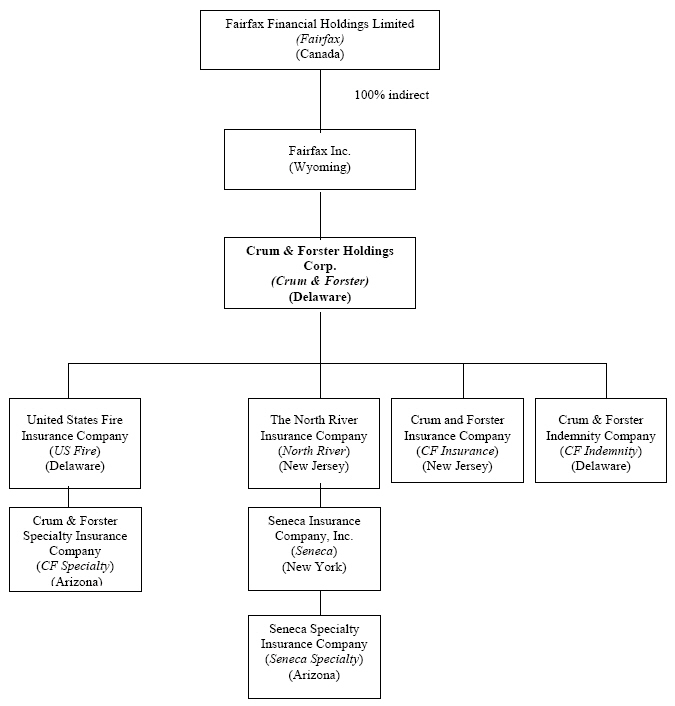
The following annual report on Form 10-K relates to the business operations and financial results
of Crum & Forster Holdings Corp. and its subsidiaries. References in this report to the “Company”
or “Crum & Forster” refer to Crum & Forster Holdings Corp. and its direct and indirect
subsidiaries, including United States Fire Insurance Company (“US Fire”), The North River Insurance
Company (“North River”), Crum & Forster Indemnity Company (“CF Indemnity”) and Crum and Forster
Insurance Company (“CF Insurance”). US Fire owns 100% of the stock of Crum & Forster Specialty
Insurance Company (“CF Specialty”). North River owns 100% of the stock of Seneca Insurance
Company, Inc. (“Seneca”) and its subsidiaries. Fairfax Financial Holdings Limited (“Fairfax”)
holds a 100% indirect interest in Fairfax Inc., Crum & Forster’s parent company.
The Company’s principal executive offices are located at 305 Madison Avenue, Morristown, NJ 07962
and its telephone number at that address is (973) 490-6600. The Company’s website is
http://www.cfins.com. The Company’s annual report on Form 10-K, quarterly reports on Form 10-Q,
current reports on Form 8-K and amendments, if any, to these reports filed or furnished pursuant to
Section 13 or 15(d) of the Securities Exchange Act of 1934 are available free of charge on this
website as soon as practicable after they have been electronically filed with, or furnished to, the
Securities and Exchange Commission (“SEC”). The Company’s website and the information therein does
not form a part of this Form 10-K and is not incorporated herein by reference.
STATEMENTS REGARDING FORWARD-LOOKING INFORMATION
Certain statements contained herein may constitute forward-looking statements and are made pursuant
to the “safe harbor” provisions of the United States Private Securities Litigation Reform Act of
1995. The words “anticipates”, “believes”, “expects”, “intends”, “estimates”, “projects”,
“plans”, “target”, “potential”, “likely”, “may”, “could”, “should” and similar expressions identify
forward-looking statements. These forward-looking statements involve known and unknown risks,
uncertainties and other factors that could cause the Company’s actual results, performance or
achievements to differ materially from any future results, performance or achievements expressed or
implied by these forward-looking statements. These risks, uncertainties and other factors, which
are described elsewhere in this report, include, but are not limited to, the following:
| |
• |
|
Competitive conditions in the insurance market and the ability to attract and retain new
business; |
| |
| |
• |
|
Adverse effect of volatility in the global financial markets including changes in
interest rates, credit spreads, foreign currency exchange rates and other factors; |
| |
| |
• |
|
Current economic conditions; |
| |
| |
• |
|
Insufficient loss reserves, including reserves for asbestos, environmental and other
latent claims; |
| |
| |
• |
|
Occurrence of natural or man-made catastrophic events; |
| |
| |
• |
|
Inability to realize the Company’s investment objectives; |
| |
| |
• |
|
Inability to obtain reinsurance coverage on reasonable terms and prices, particularly
property catastrophe reinsurance; |
| |
| |
• |
|
Exposure to credit risk, in the event reinsurers or policyholders fail to pay the
Company amounts owed to it; |
| |
| |
• |
|
Lowering or loss of one of the Company’s financial strength ratings; |
| |
| |
• |
|
Loss of key producers; |
| |
| |
• |
|
Changes in the business or regulatory environment in which the Company operates as a
result of recent insurance industry investigations by government authorities and other
parties; |
| |
| |
• |
|
Exposure to emerging claims and coverage issues; |
| |
| |
• |
|
Restrictions on the ability of the Company’s insurance subsidiaries to pay dividends; |
| |
| |
• |
|
Subordination of debt securities to the obligations and liabilities of the Company’s
insurance subsidiaries; |
| |
| |
• |
|
Ability of Fairfax to determine the outcome of corporate action requiring stockholder
approval; and |
| |
| |
• |
|
Changes in governmental regulations. |
Additional risks and uncertainties are described in this report in “Item 1A. Risk Factors”.
Although the Company believes that its forward-looking statements are based upon reasonable
assumptions, management can give no assurance that the Company’s goals will be achieved. Given
these uncertainties, prospective investors are cautioned not to place undue reliance on these
forward-looking statements. Any forward-looking statements made in this report are made by the
Company as of the date of this report. Except as otherwise required by federal securities laws,
the Company undertakes no obligation to publicly update or revise any forward-looking statements,
whether as a result of new information, future events or otherwise.
4
PART I
Overview
Crum & Forster is a national commercial property and casualty insurance company with a focused
underwriting strategy targeting specialty classes of business and underserved market opportunities.
The Company writes numerous lines of business including general liability, workers’ compensation,
commercial automobile, property, commercial multi-peril, accident and health, fidelity and surety,
personal automobile and homeowners. In 2009, approximately 44% of the Company’s gross written
premiums arose from the offering of general liability including umbrella, workers’ compensation,
commercial automobile and property policies to middle market commercial enterprises through the
Company’s regional branch network. The balance of Crum & Forster’s business is comprised of a
diverse portfolio of specialty businesses in which the Company has specific product, geographic or
customer group expertise. These include: products such as accident and health, directors’ and
officers’ liability and bail bonds; geographic specialties such as the Company’s coverage of
non-standard, inner-city risks not typically well served by the standard market and Crum &
Forster’s longstanding presence in the Hawaii market; and customer group expertise in the areas of
propane distributors, explosive contractors, agriculture enterprises, and construction contractors
written on a non-admitted basis.
The Company generally conducts business on a brokerage basis through its home office and regional
branch network, allowing it to control the underwriting process and build close relationships with
producers and policyholders. The Company may also conduct business through third parties such as
managing general underwriters where it is cost effective to do so and where the Company can control
the underwriting process such as in the Company’s niche accident and health business. The Company
has over 1,500 producers located throughout the United States including independent regional retail
firms, wholesale brokers, national brokers and managing general underwriters.
The Company’s objective is to expand opportunistically into classes of business or market segments
that have the potential to generate an underwriting profit. Additional growth in specialty lines is
a significant element of the Company’s business strategy. Management believes the Company’s
ability to identify profitable market opportunities where its underwriting expertise can be applied
provides it with a competitive advantage.
In 2009, the Company generated $863.8 million of gross premiums written, $716.4 million of net
premiums written and $1,095.1 million of total revenues. For the year ended December 31, 2009, the
Company’s combined ratio was 102.2%. At December 31, 2009, the Company had cash and invested
assets of approximately $4.0 billion, total assets of $5.3 billion, shareholder’s equity of $1.5
billion and statutory policyholders’ surplus of $1.6 billion.
Corporate Structure
Crum & Forster is a Delaware holding company that is 100% owned by Fairfax Inc., a Wyoming holding
company. Fairfax Inc. is ultimately owned by Fairfax, a Canadian financial services holding
company, which is publicly traded on the Toronto Stock Exchange. Crum & Forster is a major
component of the U.S. commercial property and casualty insurance operations of Fairfax, which is
principally engaged in property and casualty insurance, reinsurance and investment management.
Crum & Forster was acquired by Fairfax on August 13, 1998.
5
Each of the Company’s major subsidiaries is depicted below:
6
Crum & Forster’s insurance subsidiaries, except CF Specialty and Seneca and its subsidiaries,
participate in an intercompany pooling arrangement pursuant to which the premiums, losses and other
underwriting expenses of each participant are pooled by means of mutual reinsurance on a
fixed-percentage basis as follows: US Fire, 76%; North River, 22%; CF Insurance, 1%; and CF
Indemnity, 1%. The intercompany agreement provides that US Fire, acting as the lead company,
assumes from the other pool participants 100% of their premiums, losses and other underwriting
expenses, and, in turn, cedes to each pool participant its participating percentage of premiums,
losses and other underwriting expenses. The pooling arrangement permits each pool participant to
rely on the capacity of the entire pool, rather than solely on its own capital and surplus.
Further, it prevents any one pool participant from suffering undue losses, as all pool participants
share underwriting profits and losses in proportion to their respective pool participation
percentages. CF Specialty and Seneca and its subsidiaries operate independently from the pool.
Any transactions with pool participants are eliminated in the preparation of the consolidated
financial statements.
Lines of Business
Crum & Forster offers a broad range of property and casualty insurance coverages, primarily to
commercial accounts, located throughout the United States. Gross premiums written by line of
business are summarized as follows:
| |
|
|
|
|
|
|
|
|
|
|
|
|
|
|
|
|
|
|
|
|
|
|
|
|
| |
|
Years Ended December 31, |
|
| |
|
2009 |
|
|
2008 |
|
|
2007 |
|
| (dollars in millions) |
|
$ |
|
|
% |
|
|
$ |
|
|
% |
|
|
$ |
|
|
% |
|
General liability |
|
$ |
188.5 |
|
|
|
21.8 |
% |
|
$ |
216.3 |
|
|
|
21.2 |
% |
|
$ |
251.5 |
|
|
|
20.2 |
% |
Workers’ compensation |
|
|
188.5 |
|
|
|
21.8 |
|
|
|
196.0 |
|
|
|
19.2 |
|
|
|
258.9 |
|
|
|
20.8 |
|
Commercial automobile |
|
|
96.8 |
|
|
|
11.2 |
|
|
|
164.0 |
|
|
|
16.1 |
|
|
|
203.4 |
|
|
|
16.3 |
|
Property |
|
|
87.4 |
|
|
|
10.1 |
|
|
|
155.6 |
|
|
|
15.3 |
|
|
|
272.0 |
|
|
|
21.8 |
|
Commercial multi-peril |
|
|
81.5 |
|
|
|
9.5 |
|
|
|
83.8 |
|
|
|
8.2 |
|
|
|
88.2 |
|
|
|
7.1 |
|
Accident and health |
|
|
190.9 |
|
|
|
22.1 |
|
|
|
159.7 |
|
|
|
15.7 |
|
|
|
127.6 |
|
|
|
10.3 |
|
Other1 |
|
|
30.2 |
|
|
|
3.5 |
|
|
|
44.2 |
|
|
|
4.3 |
|
|
|
43.4 |
|
|
|
3.5 |
|
|
|
|
|
|
|
|
|
|
|
|
|
|
|
|
|
|
|
|
Total gross premiums written |
|
$ |
863.8 |
|
|
|
100.0 |
% |
|
$ |
1,019.6 |
|
|
|
100.0 |
% |
|
$ |
1,245.0 |
|
|
|
100.0 |
% |
|
|
|
|
|
|
|
|
|
|
|
|
|
|
|
|
|
|
|
| |
|
|
| 1 |
|
Other includes personal automobile, homeowners, surety and fidelity lines of
business. |
General liability provides coverage for third party liability exposures, including bodily
injury and property damage arising from products sold and general business operations. These
policies are written on both an admitted and non-admitted basis. General liability also includes
coverage to protect policyholders against third-party personal injury. This coverage is generally
written with a limit of $1 million. This line of business includes umbrella coverage, which
provides additional insurance protection to businesses for amounts that exceed the limits of their
primary liability policies with the Company or another insurance carrier. Approximately 76% of the
Company’s umbrella premiums are for accounts for which the underlying liability coverage is
provided by another insurance carrier. In 2009, approximately 69% of the Company’s umbrella gross
premiums written were associated with policies having an attachment point of $1 million, while the
average umbrella policy limit written was approximately $14 million. Gross limits offered on
umbrella policies did not exceed $25 million. The Company also writes specialty classes, such as
directors’ and officers’ liability, which involves coverage for liability arising from the actions
of directors and officers in their official capacities, and employment practices liability, which
protects the policyholder from liability arising from employment policies and plans, such as
liability related to discrimination and harassment. The average directors’ and officers’ policy
limit written in 2009 was approximately $5 million and gross limits offered generally did not
exceed $10 million.
The distribution of the Company’s total general liability gross premiums written by type of
coverage is summarized as follows:
| |
|
|
|
|
|
|
|
|
|
|
|
|
| |
|
Years Ended December 31, |
|
| |
|
2009 |
|
|
2008 |
|
|
2007 |
|
Umbrella liability |
|
|
48.7 |
% |
|
|
46.3 |
% |
|
|
42.2 |
% |
Products liability |
|
|
17.4 |
|
|
|
19.7 |
|
|
|
22.7 |
|
Directors’ and officers’ liability
Directors’ and officers’
liability |
|
|
8.8 |
|
|
|
8.5 |
|
|
|
7.2 |
|
Employment practices liability |
|
|
3.3 |
|
|
|
2.6 |
|
|
|
2.6 |
|
All other general liability |
|
|
21.8 |
|
|
|
22.9 |
|
|
|
25.3 |
|
|
|
|
|
|
|
|
|
|
|
Total general liability |
|
|
100.0 |
% |
|
|
100.0 |
% |
|
|
100.0 |
% |
|
|
|
|
|
|
|
|
|
|
In 2009 and 2008, the umbrella liability percentage of the total increased due to a decline in
products and general liability premiums as a result of competitive market conditions, particularly
for non-admitted business.
7
Workers’ compensation provides coverage for the obligations of an employer under state law to
provide its employees with specified benefits for work-related injuries, deaths and diseases,
regardless of fault. Typically, there are four types of benefits payable under workers’
compensation policies: medical benefits, disability benefits, death benefits and vocational
rehabilitation benefits. The benefits payable and the duration of such benefits are set by statute
and vary by state and with the nature and severity of the injury or disease and the wages,
occupation and age of the employee. The Company offers three types of workers’ compensation
products:
| |
• |
|
guaranteed cost products; |
| |
| |
• |
|
large deductible policies; and |
| |
| |
• |
|
retrospectively rated policies. |
Premiums are primarily a function of:
| |
• |
|
the applicable premium rate, which varies by state according to the employee’s
duties and the business of the employer; |
| |
| |
• |
|
the policyholder’s experience modification factor; and |
| |
| |
• |
|
the policyholder’s payroll. |
Generally, a deposit premium is paid at the beginning of the policy period and periodic
installments are paid during the policy period. The final premium is determined at the end of the
policy period after the employer’s payroll records are audited. Premiums are continually reviewed
for adequacy using an actuarial analysis of current and anticipated trends.
The Company applies a comprehensive approach to workers’ compensation business that benefits both
Crum & Forster and its policyholders. Loss prevention services focused on workplace safety and the
prevention of accidents are provided to the Company’s policyholders. The Company emphasizes loss
cost containment methods, which involve employers, employees and care providers that focus on
cost-effective quality care and early return to work for injured employees. The Company also
strives to prevent costs associated with fraudulent claims by applying a proactive approach to
investigation and litigation of claims, where appropriate.
The distribution of total workers’ compensation gross premiums written by type of coverage is
summarized as follows:
| |
|
|
|
|
|
|
|
|
|
|
|
|
| |
|
Years Ended December 31, |
|
| |
|
2009 |
|
|
2008 |
|
|
2007 |
|
Guaranteed cost |
|
|
89.4 |
% |
|
|
92.4 |
% |
|
|
91.0 |
% |
Large deductible |
|
|
7.8 |
|
|
|
6.5 |
|
|
|
7.7 |
|
Retrospectively rated |
|
|
2.8 |
|
|
|
1.1 |
|
|
|
1.3 |
|
|
|
|
|
|
|
|
|
|
|
Total workers’ compensation |
|
|
100.0 |
% |
|
|
100.0 |
% |
|
|
100.0 |
% |
|
|
|
|
|
|
|
|
|
|
With respect to large deductible policies, the average policyholder retention is approximately
$217,000 and the average premium discount from standard premium, recognizing the reduced net loss
exposure, is approximately 74%.
Commercial automobile provides coverage for businesses against losses arising from bodily injury,
bodily injury to third parties, property damage to a policyholder’s vehicle, property damage to
other vehicles and other property resulting from the ownership, maintenance or use of vehicles in a
business. The Company targets policyholders with fleets of 25 to 100 vehicles, particularly those
with low driver turnover and good driving records. The majority of the Company’s commercial
automobile business consists of local and intermediate operations where drivers can return to their
garage location within the same day. The commercial auto business declined significantly in 2009
as a result of both soft market conditions and specific underwriting actions taken by the Company
to reduce exposure to unprofitable transportation accounts.
Property provides coverage for loss or damage to buildings, inventory and equipment and financial
loss due to business interruption resulting from covered property damage. Policies written are
typically “all risk” in nature, providing protection from natural disasters, including losses from
hurricanes, windstorms, earthquakes, hail and severe winter weather, and other events, such as
theft and vandalism, fires, explosions, storms, and at the policyholder’s option, terrorism. It is
industry practice, as well as that of the Company, to exclude certain risks, including war and
nuclear risks, from all property policies. Gross limits offered on property business averaged
approximately $14 million and generally did not exceed $25 million per policyholder. Property
insurance is principally provided through fire and allied lines, inland marine and difference in
conditions coverages. Fire and allied lines coverage insures real and personal property from
direct physical damage from the perils covered as well as the loss of business income that might
result from such loss. Inland marine covers insureds specializing mainly in, but not limited to,
the transportation, communications and construction industries. Difference in conditions coverage
insures real and personal property from direct physical damage and the associated loss of business
income resulting primarily from earthquake and flood perils as well as other perils excluded from
standard fire and allied lines policies. Policies written on an excess basis comprised
approximately 4%, 8% and 9% of property gross premiums written in 2009, 2008 and 2007,
respectively, with the decline in 2009 related to underwriting actions discussed below.
8
The distribution of total property gross premiums written, by type of coverage, is summarized as
follows:
| |
|
|
|
|
|
|
|
|
|
|
|
|
| |
|
Years Ended December 31, |
|
| |
|
2009 |
|
|
2008 |
|
|
2007 |
|
Fire and allied lines |
|
|
73.5 |
% |
|
|
78.7 |
% |
|
|
82.5 |
% |
Inland marine |
|
|
24.0 |
|
|
|
15.5 |
|
|
|
10.7 |
|
Earthquake |
|
|
2.5 |
|
|
|
5.8 |
|
|
|
6.8 |
|
|
|
|
|
|
|
|
|
|
|
Total property |
|
|
100.0 |
% |
|
|
100.0 |
% |
|
|
100.0 |
% |
|
|
|
|
|
|
|
|
|
|
The significant decline in overall property gross premiums written and the change in the percentage
distribution of fire and allied lines over the last two years is due to competitive market
conditions and underwriting actions taken to improve the profitability of the Company’s fire
business. These underwriting actions significantly reduced certain property business, primarily
large garden apartment accounts and national accounts with multiple locations written on the basis
of total insured value. These actions also reduced the Company’s catastrophe exposures and
corresponding property reinsurance costs. The greater share of inland marine is due to the decline
in fire and allied gross premiums written.
Commercial multi-peril combines property and liability coverage under one insurance policy. The
Company typically writes these package policies for smaller businesses where expense advantages can
be gained by combining these coverages rather than purchasing two separate policies. This business
is primarily written by Seneca, which accounted for 69% of 2009 commercial multi-peril premiums.
For the years ended December 31, 2009, 2008 and 2007, approximately 47.3%, 50.9% and 53.6%,
respectively, of commercial multi-peril gross premiums written were attributable to liability
coverage.
Accident and health includes an array of coverages as follows: employer stop loss insurance
produced by agents and brokers; student medical insurance produced by agents and brokers, which
includes college accident and sickness, intercollegiate sports, international student insurance and
blanket special risk; pet insurance sold primarily online; travel insurance including wholesale and
retail coverage, which can be sold on a brochure basis through travel agents, online or through
insurance brokers; and other medical insurance, including (i) fully insured organ transplant,
provider excess of loss for physician and hospital groups, and health maintenance organization
reinsurance sold through insurance brokers; and (ii) limited medical coverage for associations and
employer groups and short term medical insurance sold online or through agents.
The distribution of the Company’s total accident and health gross premiums written, by type of
major coverage, is summarized as follows:
| |
|
|
|
|
|
|
|
|
|
|
|
|
| |
|
Years Ended December 31, |
|
| |
|
2009 |
|
|
2008 |
|
|
2007 |
|
Employer stop loss insurance |
|
|
39.5 |
% |
|
|
27.9 |
% |
|
|
21.8 |
% |
Student medical insurance |
|
|
24.9 |
|
|
|
30.6 |
|
|
|
29.7 |
|
Pet insurance |
|
|
14.9 |
|
|
|
15.6 |
|
|
|
10.1 |
|
Retail travel and accident insurance |
|
|
13.2 |
|
|
|
16.1 |
|
|
|
24.7 |
|
Other medical insurance |
|
|
7.5 |
|
|
|
9.8 |
|
|
|
13.7 |
|
|
|
|
|
|
|
|
|
|
|
Total accident and health |
|
|
100.0 |
% |
|
|
100.0 |
% |
|
|
100.0 |
% |
|
|
|
|
|
|
|
|
|
|
Other includes bail bonds, personal insurance (including personal automobile and homeowners’
policies) and fidelity and surety coverages. Bail bonds provide for the issuance of financial
security to a court to guarantee the return, at a specific date, of a person facing criminal
charges. Fidelity insurance provides for loss due to misappropriation of funds by an employee.
Surety coverages include contract and commercial bonds. Contract bonds secure a contractor’s
performance and/or payment obligation, generally with respect to a construction project, and are
typically required by federal, state and local governments for public works projects. Commercial
bonds cover obligations typically required by law or regulation such as license and permit and
fiduciary bonds. The Company also writes a small amount of personal automobile and homeowners’
policies which are limited to the state of Hawaii.
9
The distribution of the Company’s total other gross premiums written, by type of coverage, is
summarized as follows:
| |
|
|
|
|
|
|
|
|
|
|
|
|
| |
|
Years Ended December 31, |
|
| |
|
2009 |
|
|
2008 |
|
|
2007 |
|
Bail bonds |
|
|
34.5 |
% |
|
|
27.0 |
% |
|
|
30.2 |
% |
Personal automobile |
|
|
21.8 |
|
|
|
17.5 |
|
|
|
21.8 |
|
Fidelity |
|
|
21.7 |
|
|
|
40.4 |
|
|
|
30.3 |
|
Homeowners |
|
|
19.8 |
|
|
|
14.0 |
|
|
|
15.4 |
|
Contract and commercial bonds |
|
|
2.2 |
|
|
|
1.1 |
|
|
|
2.3 |
|
|
|
|
|
|
|
|
|
|
|
Total other |
|
|
100.0 |
% |
|
|
100.0 |
% |
|
|
100.0 |
% |
|
|
|
|
|
|
|
|
|
|
Geographic Distribution
The Company is licensed and currently writes insurance in all 50 states, the District of Columbia,
Virgin Islands and Puerto Rico. For the year ended December 31, 2009, the top ten states
represented 67.0% of direct premiums written. The distribution of direct premiums written by
state, as a percentage of total direct premiums written, is summarized as follows:
| |
|
|
|
|
|
|
|
|
|
|
|
|
| |
|
Years Ended December 31, |
|
| |
|
2009 |
|
|
2008 |
|
|
2007 |
|
California |
|
|
15.1 |
% |
|
|
13.9 |
% |
|
|
14.5 |
% |
New York |
|
|
10.6 |
|
|
|
10.1 |
|
|
|
9.0 |
|
Florida |
|
|
8.6 |
|
|
|
9.5 |
|
|
|
9.9 |
|
Texas |
|
|
7.7 |
|
|
|
8.4 |
|
|
|
8.9 |
|
New Jersey |
|
|
5.9 |
|
|
|
6.9 |
|
|
|
7.2 |
|
Hawaii |
|
|
4.6 |
|
|
|
4.4 |
|
|
|
4.5 |
|
Pennsylvania |
|
|
4.6 |
|
|
|
4.5 |
|
|
|
4.5 |
|
Massachusetts |
|
|
4.1 |
|
|
|
3.9 |
|
|
|
3.4 |
|
Illinois |
|
|
3.7 |
|
|
|
3.7 |
|
|
|
3.6 |
|
Virginia |
|
|
2.1 |
|
|
|
2.1 |
|
|
|
2.0 |
|
All other states |
|
|
33.0 |
|
|
|
32.6 |
|
|
|
32.5 |
|
|
|
|
|
|
|
|
|
|
|
Total direct premiums written |
|
|
100.0 |
% |
|
|
100.0 |
% |
|
|
100.0 |
% |
|
|
|
|
|
|
|
|
|
|
As a result of significant regulatory reforms of the California workers’ compensation system
enacted in 2003 and 2004 and strong rate increases, which resulted in a dramatic improvement in the
industry’s workers’ compensation accident year loss ratios, the California workers’ compensation
marketplace evolved to one where there were numerous carriers aggressively seeking growth in recent
years. As a result, the Company was affected by declining market prices and additional
competition, resulting in declining California workers’ compensation gross premiums written from
2003 to 2008. After several years of declining market prices, the Company has seen modest price
increases in California workers’ compensation pricing during 2009, resulting in gross premiums in
that line increasing by approximately 12% for the year ended December 31, 2009 as compared to
declines of approximately 15% and 20%, for the years ended December 31, 2008 and 2007,
respectively.
Business Development and Methods of Distribution
The Company’s gross premiums written are derived from renewal of in-force policies, generation of
new policies and endorsement activity, including additional or return premiums due upon audit.
Central to the Company’s premium production management are efforts to maintain or improve renewal
retention rates and to increase the Company’s new business production through improvements in the
“quote ratio” (the ratio of quotes issued to submissions received) and the “hit ratio” (the ratio
of new policies bound to quotes issued), while first and foremost maintaining adequate rates for
the exposures.
Crum & Forster depends on producers to provide it with access to a wide range of business
opportunities. The Company’s ability to develop strong and mutually beneficial relationships, and
successfully market its products and services to producers, is paramount to its success.
Generally, the Company’s business is distributed through more than 1,500 producers located
throughout the United States. Crum & Forster intends to continue to expand its producer force.
The Company offers its producers underwriting expertise and timely policy processing, which assists
them in placing business in underserved markets. The Company’s service extends to loss control and
claims management services, particularly on large accounts where this expertise is highly valued by
both the producer and the policyholder.
10
Producers are compensated principally on the basis of commissions negotiated between the producer
and the Company on an individual policy basis. Additionally, the Company pays contingent
commissions to certain producers based on achievement by the producer of agreed-upon targets.
Total producer compensation incurred in 2009, 2008 and 2007 was $117.5 million, $132.3 million and
$152.9 million, respectively, of which contingent commissions expense incurred in those years
totaled $5.3 million, $4.8 million and $4.7 million, respectively.
Crum & Forster’s producers generally fall into three categories: independent regional retail firms,
wholesale brokers and national brokers. Each of these channels has its own distinct distribution
characteristics and customers. Independent regional retail firms generally operate in a limited
geographic region. These producers often focus on mid-size accounts. Wholesale brokers primarily
produce business that retail firms have difficulty placing due to its unique, unusual or hazardous
nature. National brokers generally have a significant number of locations throughout the United
States and target larger risks requiring complex insurance analysis and placement.
The accident and health business is managed by approximately 40 producers, third party
administrators and managing general underwriters. These producers, third party administrators and
managing general underwriters may perform various aspects of program administration, including
pricing and underwriting. Those who have underwriting authority are required to follow strict
underwriting guidelines which are provided by the Company and are subject to annual audits by the
Company to ensure adherence to those underwriting guidelines.
The percentage of business from these categories of producers, based on gross premiums written,
excluding the accident and health and surety lines of business, is summarized as follows:
| |
|
|
|
|
|
|
|
|
|
|
|
|
| |
|
Years Ended December 31, |
|
| |
|
2009 |
|
|
2008 |
|
|
2007 |
|
Independent regional retail firms |
|
|
47.8 |
% |
|
|
43.3 |
% |
|
|
38.5 |
% |
Wholesale brokers |
|
|
33.0 |
|
|
|
36.1 |
|
|
|
41.5 |
|
National brokers |
|
|
19.2 |
|
|
|
20.6 |
|
|
|
20.0 |
|
|
|
|
|
|
|
|
|
|
|
Total direct premiums written |
|
|
100.0 |
% |
|
|
100.0 |
% |
|
|
100.0 |
% |
|
|
|
|
|
|
|
|
|
|
The increase in the percentage of gross premiums written attributable to independent regional
retail firms and corresponding decrease in business from wholesale brokers in 2009 as compared to
2008 and 2007 is largely due to decreases in non-admitted business as well as property and
transportation business written through wholesale brokers. The decrease is due to the combined
effects of market conditions, whereby accounts previously produced by wholesale producers have
moved to retail channels, the negative impact of the economy on the construction business and
specific underwriting actions taken by the Company to improve profitability.
Pricing and Underwriting
The Company adheres to a disciplined underwriting strategy that focuses on profitability without
regard to premium growth or market share. Other than in the accident and health and bail bond
lines of business in which third parties have underwriting authority, each policy is individually
underwritten by the Company’s underwriters based on the particular risk and class of business.
Prices are set based on these risk characteristics and consider other factors such as estimated
frequency and severity of expected losses, the expenses of producing the business and managing
claims and an allowance for an underwriting profit. The Company’s disciplined underwriting
strategy may restrict its premium growth when market conditions do not meet pricing and
underwriting standards.
The Company’s underwriting process is primarily controlled centrally by profit center managers in
the home office who have extensive experience in the insurance industry. Each executive is held
accountable for the underwriting results of his or her line of business. Underwriting authority
levels are established based on characteristics such as class of business, hazard grade and policy
limits and are assigned based on the experience and expertise of the underwriter. Regional
underwriting product line managers generally report to the home office profit center managers on
all underwriting matters.
The Company’s casualty business is either manually rated or loss rated, generally depending on the
size of the risk to be priced. Manual rating begins with a classification rate provided by an
industry rating bureau. Deviations from this rate based on the individual characteristics and loss
history of the risk, as well as the desirability of the class of business, are then determined.
Loss rating is a methodology utilized for large casualty risks wherein an individual risk’s
credible loss experience is the basis for rate and premium development for the risk. A portion of
the Company’s business is large enough to be rated on its own loss history. This loss rated
business is within the workers’ compensation, general liability and commercial automobile lines of
business and includes guaranteed cost policies, where policy premiums are fixed, and loss sensitive
rating programs, where the ultimate costs to the policyholder are dependent upon its loss
experience. The underwriting of loss rated business generally requires approval by home office
underwriting and actuarial personnel.
11
For workers’ compensation business, the Company considers aggregation of insured employees during
the quotation process at an account and location level. On a monthly basis, management monitors
insured employee aggregations, particularly in target cities, in proximity to target sites and in
earthquake-prone zones, in order to manage the Company’s potential exposure to terrorism and/or
earthquake losses.
Loss sensitive business includes large deductible policies, in which the policyholder must
reimburse the Company for any losses within the deductible and retrospectively rated policies, in
which premiums are adjusted based on the actual loss experience of the policyholder. Both of these
loss sensitive products expose Crum & Forster to potential credit risk since the Company may be due
payment from the policyholder after coverage has been provided. Loss sensitive policies are subject
to extensive financial analysis prior to binding and generally require that the policyholder
provide collateral as a condition to writing the policy. For further discussion of such credit
risk, see “Item 1A. Risk Factors—The Company bears credit risk with respect to its reinsurers and
certain policyholders, and if one or more of them fails to pay, the Company could experience
losses, which would reduce its net income”.
Property risks are underwritten on an individual risk basis. Underwriting considerations that
factor into the pricing of individual property risks include, but are not limited to, building
construction, occupancy classes and inherent internal exposures to loss, physical protection of the
property and external exposures to loss, as well as past loss experience. Approximately 96% of the
Company’s property business is written on a primary basis. The underwriting and pricing of such
risks requires significant underwriting expertise due to the complexities of individual risk
exposures. Inland marine is typically rated individually by the underwriter based on the
characteristics of the risk and the class of business, without the use of an industry manual rate.
The Company’s underwriting of any property risk always considers the aggregate exposures to natural
and man-made catastrophic losses and attempts to mitigate such exposure. The Company monitors
exposures in areas most susceptible to a hurricane, earthquake or terrorist event.
The accident and health business is a diverse portfolio of largely low policy premium specialty
products. College accident and sickness policies are generally experience rated based on a minimum
of three years’ historical premiums and claims experience. Travel insurance products are typically
rated based on portfolio or case experience, with rates fixed on trip cost and traveler age. The
various medical products are priced using industry standard, actuarially derived manuals obtained
from several industry actuarial sources. Pet insurance is rated using an actuarially derived
matrix based on coverage, type, policy limit, pet age and breed. Due to the short tail nature of
the accident and health products, results emerge more quickly allowing for rates to be adjusted as
needed.
Crum & Forster conducts its bail bond business through numerous agents across the U.S. who have
authority to underwrite and issue bonds, subject to limits established by the Company. The Company
must approve, prior to binding, all bail bonds with values in excess of each agent’s underwriting
authority, which can range from $5 thousand to $0.5 million. While collateral may be required as a
condition to writing the bond, the bail agent is required to indemnify the Company for any payments
made in respect of defaulted bonds.
Catastrophe Risk Management
The Company has exposure to losses caused by various natural and man-made events. Natural
catastrophic events include hurricanes, earthquakes, tornados, windstorms, hailstorms, explosions,
severe winter weather and fires. Man-made catastrophic events include terrorist acts, riots,
crashes and derailments. The incidence and severity of catastrophes are inherently unpredictable.
The extent of losses from a catastrophe is a function of both the total amount of insured exposure
in the area affected by the event and the severity of the event. Most catastrophes are restricted
to small geographic areas; however, hurricanes, earthquakes and windstorms may produce significant
damage in large, heavily populated areas. Catastrophes can cause losses in a variety of property
and casualty coverages and lines of business for which the Company provides insurance.
Seasonal weather variations may affect the severity and frequency of losses. Insurance companies
are not permitted to reserve for a catastrophe until it has occurred, and actual losses could
exceed expectations despite measures the Company might take to attempt to protect itself. It is
therefore possible that a catastrophic event or multiple catastrophic events could adversely affect
the Company’s net income, financial position and liquidity. Increases in the value and geographic
concentration of insured exposures and the effects of inflation could increase the severity of
claims from future catastrophic events. In addition, states have from time to time passed
legislation that has had the effect of limiting the ability of insurers to manage catastrophic
risk, such as legislation prohibiting insurers from withdrawing from catastrophe-prone areas.
The Company closely monitors catastrophe exposure on an individual risk and book of business basis.
Each property risk is written in accordance with the company’s underwriting guidelines which
determine the allowable limits given the buildings location and structure. Crum & Forster monitors
its aggregate property exposure in catastrophe-prone areas based on total exposed policy limits,
number of locations, total insured values and other information by region. In areas most
susceptible to a hurricane or earthquake event, the Company also runs a catastrophe model each
quarter to assess its average annual loss and its probable maximum loss for both a 250-year and
100-year return period event. The Company also monitors its aggregate exposed policy limits by
target city to mitigate terrorism risk.
12
The Company has established underwriting guidelines regarding its concentration of workers’
compensation exposures in target cities, in proximity to target sites and in earthquake-prone
areas. As a result of database enhancements and increased information gathered on the Company’s
policyholders, the majority of employees are captured by location in the Company’s systems,
permitting ongoing monitoring of compliance with concentration guidelines. The Company is required
to provide terrorism coverage under its workers’ compensation policies and has developed specific
underwriting and pricing guidelines for this coverage. For those classes where coverage is not
mandatory, policyholders may choose not to accept terrorism coverage. Based on experience through
December 31, 2009, approximately 30% of policyholders in the Company’s property lines of business
accepted terrorism coverage. Direct premiums written from terrorism coverage in 2009 were
approximately $7.2 million. The Company purchases property and workers’ compensation catastrophe
reinsurance to mitigate its losses in the event of catastrophes.
Reinsurance
In order to control the exposure to losses and protect capital resources, the Company cedes a
portion of its gross policy premiums to reinsurers in exchange for the reinsurer’s agreement to
share a portion of the covered losses. Reinsurance is a practice whereby one insurer, called the
“reinsurer”, agrees to indemnify another insurer, called the “ceding insurer”, for all or part of
the potential liability arising from one or more insurance policies issued by the ceding insurer.
The Company’s purchase of reinsurance does not discharge the Company from primary liability to its
policyholders. The net liability retained on individual risks varies by product and by the nature
of the risk. Insured liabilities can be reinsured either by treaty, wherein reinsurers agree in
advance to provide coverage above retained limits or for a specified percentage of losses
attributable to specific policies, or by facultative arrangements, wherein reinsurance is provided
for individual risks based on individual negotiations.
Crum & Forster’s underwriting results are significantly affected by reinsurance. The net impact of
ceded reinsurance transactions for each of the fiscal years 2009, 2008 and 2007 is summarized as
follows ((decrease) increase in components):
| |
|
|
|
|
|
|
|
|
|
|
|
|
| |
|
Years Ended December 31, |
|
| (dollars in millions) |
|
2009 |
|
|
2008 |
|
|
2007 |
|
Earned premiums ceded to reinsurers1 |
|
$ |
(151.1 |
) |
|
$ |
(141.3 |
) |
|
$ |
(149.0 |
) |
Commissions earned on ceded reinsurance premiums |
|
|
32.9 |
|
|
|
31.3 |
|
|
|
25.8 |
|
Claims incurred ceded to reinsurers |
|
|
68.0 |
|
|
|
(44.4 |
)2 |
|
|
52.3 |
|
Provision for uncollectible reinsurance |
|
|
(2.0 |
) |
|
|
(7.7 |
) |
|
|
(8.0 |
) |
|
|
|
|
|
|
|
|
|
|
Net impact of ceded reinsurance transactions |
|
$ |
(52.2 |
) |
|
$ |
(162.1 |
) |
|
$ |
(78.9 |
) |
|
|
|
|
|
|
|
|
|
|
| |
|
|
| 1 |
|
For the years ended December 31, 2009, 2008 and 2007, accident and health earned
premiums ceded to reinsurers were $60.7 million, $42.1 million and $18.6 million,
respectively. |
| |
| 2 |
|
For the year ended December 31, 2008, claims incurred ceded to reinsurers include
$75.9 million related to losses on commutations. |
The majority of reinsurance contracts purchased by the Company provide coverage for a one year
term and are negotiated annually. The ability of the Company to obtain reinsurance on terms and
prices consistent with historical results reflects, among other factors, recent loss experience of
the Company and the industry in general. The Company’s current maximum retention and reinsured
limits per risk or per insured for the major lines of business subject to significant reinsurance
are summarized as follows:
| |
|
|
|
|
|
|
|
|
| |
|
|
|
|
|
Maximum
Retained |
|
| (dollars in millions) |
|
Maximum
Retention |
|
|
and Reinsured
Limits |
|
General Liability: |
|
|
|
|
|
|
|
|
Umbrella |
|
$ |
5.0 |
|
|
$ |
25.0 |
|
Management Protection1,2 — primary and excess policies |
|
$ |
5.1 |
|
|
$ |
10.0 |
|
Property Per Insured/Per Risk |
|
$ |
5.0 |
|
|
$ |
25.0 |
|
Employer Stop Loss |
|
$ |
0.5 |
|
|
$ |
5.0 |
|
| |
|
|
| 1 |
|
Management protection includes directors’ and officers’ liability, errors and
omissions liability, employment practices liability, fiduciary liability and miscellaneous
professional liability. |
| |
| 2 |
|
The Company has a 30.0% co-participation in the excess layer, with the remaining 70%
ceded to Wentworth Insurance Company Limited (“Wentworth”), a Fairfax affiliate. |
In general, other general liability policies and commercial automobile policies are written
with limits of $1 million per occurrence and are not reinsured. General liability policies
typically contain a $2 million aggregate limit.
13
Effective April 1, 2009, the Company placed its workers’ compensation catastrophe treaty. Workers’
compensation risks are reinsured on a per occurrence basis only. This treaty provides coverage of
$80 million in excess of $20 million in two layers of $30 million and $50 million, excluding
California earthquake losses in the first layer, whereas the expiring treaty provided $130 million
of coverage in excess of $20 million per occurrence in three layers of $30 million, $50 million and
$50 million, with Company co-participation on the first layer of 30%, and excluded California
earthquake losses in that layer. The reduced coverage in 2009 recognizes the Company’s reduced
exposures. Odyssey America Reinsurance Corp (“Odyssey”), a Fairfax affiliate, has a 9.0%
participation in the $30 million in excess of $20 million layer. Wentworth, a Fairfax affiliate,
has a 5% participation in the $20 million in excess of $30 million layer and a 5% participation in
the $50 million in excess of $50 million layer. The Company is obligated to pay reinstatement
premiums equal to 100% of the original premium.
The Company’s property catastrophe reinsurance treaty protects it in the event of property losses
arising from one defined catastrophic occurrence or series of events. Effective June 1, 2009, the
Company placed its property catastrophe reinsurance treaty covering its standard property business.
The new treaty provides coverage of $35 million in excess of $40 million, whereas the expiring
treaty provided coverage of $85 million in excess of $65 million in two layers of $35 million and
$50 million. The reduced coverage in 2009 recognizes the Company’s reduced exposures. There was
no affiliate participation in this treaty. The Company is obliged to reinstate any limits used at
100% of the original premium.
Effective May 1, 2009, Seneca placed its property catastrophe treaty providing coverage for the
Company’s inland marine and non-admitted fire business along with Seneca’s property business. The
new treaty provides coverage of $45 million in excess of $15 million, whereas the expiring treaty
provided coverage of $50 million in excess of $10 million. There was no affiliate participation
in this treaty. Seneca is obliged to reinstate any limits used at 100% of the original premium.
In general, the Company’s reinsurance contracts provide coverage for domestic acts of terrorism.
Certain casualty contracts have additional terrorism coverage for acts of terrorism certified under
the Terrorism Risk Insurance Act of 2002 which was extended through December 31, 2014 with the
passage of the Terrorism Risk Insurance Program Reauthorization Act of 2007 (collectively,
“TRIPRA”). In particular, the workers’ compensation contract has coverage up to $80.0 million and
the umbrella contract has coverage equal to two times the coverage limit, up to a maximum of $40.0
million. None of the contracts covers acts of terrorism involving use of nuclear, biological or
chemical agents. For further discussion of TRIPRA, see “Insurance Regulatory Matters—Terrorism Risk
Insurance Program Reauthorization Act of 2007” and “Item 1A. Risk Factors—Catastrophic events could
cause unanticipated losses and reduce net income”.
For further discussion of the Company’s reinsurance agreements, see Notes 7 and 10 to the
consolidated financial statements included in “Item 8. Financial Statements and Supplemental Data”.
At December 31, 2009 and 2008, reinsurance recoverable was $892.7 million and $968.2 million,
respectively, net of uncollectible reinsurance reserves totaling $54.2 million and $56.0 million,
respectively. Reinsurance recoverable at December 31, 2009 was due from approximately 265
reinsurers. Credit exposure exists with respect to the Company’s reinsurance recoverable balances
to the extent that a reinsurer may not be able or willing to reimburse the Company under the terms
of the relevant reinsurance arrangements. The Company has guidelines and a review process in place
to assess the creditworthiness of the reinsurers to which it cedes. Internal guidelines generally
require reinsurers to have strong A.M. Best credit ratings and maintain certain capital and
surplus requirements. In addition, where contractually provided for, the Company has collateral
for outstanding balances in the form of cash, letters of credit or assets held in trust accounts.
This collateral may be drawn on for the amounts that remain unpaid beyond contractually specified
time periods on an individual basis. The Company held total collateral of $306.9 million (excluding
collateral in excess of the related recoverable exposure) at December 31, 2009, representing 34.4%
of total reinsurance recoverable.
Set forth below is a table showing the ten largest reinsurance recoverable balances by reinsurer:
| |
|
|
|
|
|
|
|
|
|
|
|
|
|
|
| |
|
At December 31, 2009 |
|
| |
|
A.M. Best |
|
Security |
|
|
Reinsurance |
|
|
% of |
|
| (dollars in millions) |
|
Rating1 |
|
Provided |
|
|
Recoverable |
|
|
Total |
|
North American Specialty Insurance Company |
|
A |
|
$ |
236.3 |
2 |
|
$ |
349.0 |
|
|
|
39.1 |
% |
TIG Insurance Company (“TIG”) 3,4 |
|
B+ |
|
|
— |
|
|
|
129.4 |
|
|
|
14.5 |
|
Fairmont Specialty Insurance Company3 |
|
B++ |
|
|
— |
|
|
|
37.7 |
|
|
|
4.2 |
|
Swiss Reinsurance America Corporation |
|
A |
|
|
— |
|
|
|
29.0 |
|
|
|
3.2 |
|
Munich Reinsurance America Inc. |
|
A+ |
|
|
— |
|
|
|
20.7 |
|
|
|
2.3 |
|
Wentworth3 |
|
NR5 |
|
|
18.5 |
6 |
|
|
19.2 |
|
|
|
2.2 |
|
Lloyds Syndicates |
|
A |
|
|
— |
|
|
|
17.0 |
|
|
|
1.9 |
|
nSpire Re Limited3 |
|
NR5 |
|
|
14.0 |
6 |
|
|
12.4 |
|
|
|
1.4 |
|
Hannover Ruckversicherungs-Aktiengesellschaft |
|
A |
|
|
11.4 |
7 |
|
|
11.6 |
|
|
|
1.3 |
|
Travelers Indemnity |
|
A+ |
|
|
— |
|
|
|
10.7 |
|
|
|
1.2 |
|
Other |
|
|
|
|
48.2 |
8 |
|
|
256.0 |
9 |
|
|
28.7 |
|
|
|
|
|
|
|
|
|
|
|
|
|
Total reinsurance recoverable |
|
|
|
$ |
328.4 |
|
|
$ |
892.7 |
|
|
|
100.0 |
% |
|
|
|
|
|
|
|
|
|
|
|
|
| |
|
|
| 1 |
|
The A.M. Best rating system includes ratings of “A++” and “A+” (which are
“Superior” ratings), “A” and “A-” (which are “Excellent” ratings), “B++” and “B+” (which are
“Very Good” ratings) and nine lower ratings categories. Ratings are as of February 20, 2010. |
14
| |
|
|
| 2 |
|
Funds held at December 31, 2009. The unsecured balance due from North American
Specialty Insurance Company is effectively guaranteed by an upstream affiliated insurer in the
Swiss Re Group. |
| |
| 3 |
|
Fairfax affiliate. |
| |
| 4 |
|
Effective December 16, 2002, International Insurance Company merged with TIG, a
Fairfax subsidiary. TIG had statutory capital and surplus at December 31, 2009 of
approximately $786.6 million. These recoverable balances arise principally from a
restructuring in 1993, prior to Fairfax’s acquisition of Crum & Forster. For further
discussion, see Note 10 to the consolidated financial statements included in “Item 8.
Financial Statements and Supplementary Data”. |
| |
| 5 |
|
Not rated. |
| |
| 6 |
|
Held in irrevocable trusts, principally comprised of cash and U.S. Treasury
securities. |
| |
| 7 |
|
Includes $5.4 million in trusts and $6.0 million in letters of credit. |
| |
| 8 |
|
Includes $26.9 million in letters of credit, $15.1 million in funds held and $6.2
million in trusts. |
| |
| 9 |
|
Includes reserves for uncollectible reinsurance of $54.2 million. 83% of these gross
recoverable balances are from companies having an A.M. Best rating of “A-” or better. |
Included in other in the table above are contingent obligations associated with structured
settlements with life insurance companies with a net present value of $141.0 million and amounts
recoverable from pools and associations in the amount of $15.2 million, which in the aggregate
amounted to $156.2 million, or 17.5%, of the total reinsurance recoverable balance at December 31,
2009. The three largest balances associated with the structured settlements are Genworth Life &
Annuity Insurance Company — $23.1 million; Life Insurance Company of North America — $20.9 million;
and Metropolitan Life Insurance Company — $17.6 million each of which has an A- rating or better
A.M. Best rating.
Affiliated Reinsurers
The Company has reinsurance agreements in effect with affiliates of Fairfax. As is the case with
all reinsurance agreements, Crum & Forster bears credit risk regarding ceded reinsurance
agreements, both with respect to reinsurance recoverable reflected on the Company’s balance sheets
as well as liabilities (development) associated with reinsurance recoverable on claims. For the
years ended December 31, 2009, 2008 and 2007, the Company ceded premiums of $12.9 million, $27.3
million and $36.3 million, respectively, to affiliates under these reinsurance contracts and
assumed premiums of $0 million, $0.1 million and $18.8 million, respectively, from affiliates under
these reinsurance contracts. The substantial decline in premiums assumed since 2007 is primarily
due to Fairmont premiums, which prior to 2007 were written by Fairmont and assumed by the Company
through a 100% quota share reinsurance agreement. Since the second half of 2007, substantially all
Fairmont business has been written directly by Crum & Forster resulting in negligible assumed
premiums in 2009 and 2008.
Reinsurance recoverable balances from affiliated reinsurers reflected on the consolidated balance
sheet are summarized as follows:
| |
|
|
|
|
|
|
|
|
|
|
|
|
|
|
|
|
| |
|
At December 31, 2009 |
|
| |
|
Total |
|
|
|
|
|
|
|
|
|
|
| |
|
Reinsurance |
|
|
Paid |
|
|
Outstanding |
|
|
|
|
| (dollars in millions) |
|
Recoverable |
|
|
Recoverable |
|
|
Reserves1 |
|
|
Collateral |
|
TIG |
|
$ |
129.4 |
|
|
$ |
— |
|
|
$ |
129.4 |
|
|
$ |
— |
|
Fairmont Specialty Insurance Company |
|
|
37.7 |
|
|
|
— |
|
|
|
37.7 |
|
|
|
— |
|
Wentworth |
|
|
19.2 |
|
|
|
0.1 |
|
|
|
19.1 |
|
|
|
18.5 |
|
nSpire |
|
|
12.4 |
|
|
|
— |
|
|
|
12.4 |
|
|
|
14.0 |
|
Odyssey America Reinsurance Corp. |
|
|
6.1 |
|
|
|
0.8 |
|
|
|
5.3 |
|
|
|
— |
|
Other |
|
|
1.6 |
|
|
|
0.1 |
|
|
|
1.5 |
|
|
|
3.0 |
|
|
|
|
|
|
|
|
|
|
|
|
|
|
Total affiliated reinsurance recoverable balances |
|
$ |
206.4 |
|
|
$ |
1.0 |
|
|
$ |
205.4 |
|
|
$ |
35.5 |
|
|
|
|
|
|
|
|
|
|
|
|
|
|
| |
|
|
| 1 |
|
Includes case and incurred but not reported (“IBNR”) reserves. |
Included in unpaid losses and loss adjustment expenses on the consolidated balance sheets are
assumed losses on the Fairmont business of approximately $12.6 million and $22.8 million at
December 31, 2009 and December 31, 2008, respectively. For a detailed description of the Company’s
reinsurance arrangements with affiliates, see Note 10 to the consolidated financial statements
included in “Item 8. Financial Statements and Supplementary Data”.
Corporate Aggregate Reinsurance
The Company’s corporate aggregate reinsurance contracts are of the type commonly referred to as
“finite” reinsurance and cover or covered, in varying amounts and on varying terms, accident years
2002 and prior. The majority of these contracts have been commuted or had limits paid. The
Company has not purchased corporate aggregate reinsurance since 2001 and does not currently have
plans to purchase corporate aggregate reinsurance in the future. At December 31, 2009, only one
retroactive contract with a reinsurance recoverable balance of $349.0 million and a remaining limit
of $51.0 million and one prospective contract with a remaining limit of $96.3 million are in force.
15
The effect of prospective and retroactive corporate aggregate reinsurance on components of the
Company’s consolidated statements of income is summarized as follows ((decrease) increase in
indicated components):
| |
|
|
|
|
|
|
|
|
|
|
|
|
| |
|
Years Ended December 31, |
|
| (dollars in millions) |
|
2009 |
|
|
2008 |
|
|
2007 |
|
Investment income |
|
$ |
(15.5 |
) |
|
$ |
(11.7 |
) |
|
$ |
(16.1 |
) |
Losses and LAE |
|
|
(14.9 |
) |
|
|
65.8 |
|
|
|
(13.7 |
) |
|
|
|
|
|
|
|
|
|
|
Decrease in income before income taxes |
|
$ |
(0.6 |
) |
|
$ |
(77.5 |
) |
|
$ |
(2.4 |
) |
|
|
|
|
|
|
|
|
|
|
At December 31, 2009 and 2008, reinsurance recoverable includes $349.0 million related to the 2000
retroactive adverse development, of which $98.8 million has been recognized as a reduction of
incurred losses and LAE on the Company’s consolidated statements of income.
Prospective Corporate Aggregate Reinsurance
The effect of prospective corporate aggregate reinsurance on components of the Company’s
consolidated statements of income follows ((decrease) increase in indicated components):
| |
|
|
|
|
|
|
|
|
|
|
|
|
| |
|
Years Ended December 31, |
|
| (dollars in millions) |
|
2009 |
|
|
2008 |
|
|
2007 |
|
Funds held interest charged to investment income |
|
$ |
— |
|
|
$ |
(1.6 |
) |
|
$ |
(2.3 |
) |
Less: losses and LAE |
|
|
— |
|
|
|
80.5 |
|
|
|
— |
|
|
|
|
|
|
|
|
|
|
|
Decrease in income before income taxes |
|
$ |
— |
|
|
$ |
(82.1 |
) |
|
$ |
(2.3 |
) |
|
|
|
|
|
|
|
|
|
|
The Company has one prospective contract in effect covering accident year 2002, which has an unused
limit available of $96.3 million in the event the net loss and LAE ratio for accident year 2002,
before the effect of this contract, exceeds 70%. The subject loss and LAE ratio as valued at
December 31, 2009 is 63.2%. No additional premium or funds held interest is due under this
contract upon usage of the remaining limit. The reinsurer under this contract is nSpire, a Fairfax
affiliate.
During 2008 the Company commuted its two other prospective contracts. The first contract was a
stop loss agreement, which the Company entered into in 1998, in connection with the acquisition of
the Company by Fairfax. The contract was with an unaffiliated reinsurer and provided coverage of
$367.5 million in excess of a retention. The contract provided coverage for loss reserve
development for accident periods prior to August 13, 1998, the date of acquisition of the Company
by Fairfax. In June 2008, the Company commuted this stop loss contract and the retroactive
amendment to that contract. As a result of the commutation the Company received cash proceeds of
$302.5 million, of which $287.4 million was recorded in prospective corporate aggregate reinsurance
activity and $15.1 million related to the retroactive amendment was recorded in retroactive
corporate aggregate reinsurance activity. The Company also recorded a decrease of $386.7 million
in the reinsurance recoverable balance, of which $367.5 million was attributable to the prospective
contract and $19.3 million was attributable to the retroactive amendment. The financial statement
effect of the commutation in 2008 was a non-cash pre-tax charge of $84.3 million, offset by the
release of the unamortized deferred gain balance of $8.8 million (related to the retroactive
amendment), resulting in a net charge to incurred losses and LAE of $75.5 million on the
consolidated statement of income. Of this amount $80.1 million was charged to prospective
corporate aggregate reinsurance activity and included in losses and LAE above and $4.6 million was
credited to retroactive corporate aggregate reinsurance activity.
The second contract was an aggregate stop loss agreement with unaffiliated reinsurers covering
accident year 2000, which provided coverage of $118.5 million and was fully utilized by the Company
at December 31, 2004. This stop loss agreement covered the casualty lines of business. The
contract was on a funds held basis with interest credited at 7.5%. In March 2008, the Company
commuted this contract and in accordance with the terms of the commutation agreement, the Company
commuted ceded loss reserves of $32.3 million in consideration of release to the Company of the
funds held balance of $31.9 million resulting in a commutation loss of $0.4 million which was
charged to incurred losses and LAE on the consolidated statement of income for the year ended
December 31, 2008.
16
Retroactive Corporate Aggregate Reinsurance
The effect of retroactive corporate aggregate reinsurance on components of the Company’s
consolidated statements of income follows ((decrease) increase in indicated components):
| |
|
|
|
|
|
|
|
|
|
|
|
|
| |
|
Years Ended December 31, |
|
| (dollars in millions) |
|
2009 |
|
|
2008 |
|
|
2007 |
|
Funds held interest charged to investment income |
|
$ |
(15.5 |
) |
|
$ |
(10.1 |
) |
|
$ |
(13.8 |
) |
Less: losses and LAE |
|
|
(14.9 |
) |
|
|
(14.8 |
)1 |
|
|
(13.7 |
) |
|
|
|
|
|
|
|
|
|
|
Increase (decrease) in income before income taxes |
|
$ |
(0.6 |
) |
|
$ |
4.7 |
|
|
$ |
(0.1 |
) |
|
|
|
|
|
|
|
|
|
|
| |
|
|
| 1 |
|
For the year ended December 31, 2008, losses and LAE is comprised of a loss on
commutation of $4.2 million offset by $8.8 million of unamortized deferred income released on
commutation as well as $10.2 million of recurring deferred income amortization. For the years
ended December 31, 2009 and 2007, losses and LAE was comprised of only recurring amortization
of deferred income only. |
An analysis of retroactive corporate aggregate reinsurance and related deferred income
follows:
| |
|
|
|
|
|
|
|
|
|
|
|
|
| |
|
Years Ended December 31, |
|
| (dollars in millions) |
|
2009 |
|
|
2008 |
|
|
2007 |
|
Decrease in reinsurance recoverable due from reinsurers |
|
$ |
— |
|
|
$ |
(20.0 |
) |
|
$ |
(3.6 |
) |
Less: related premiums paid |
|
|
— |
|
|
|
(8.2 |
) |
|
|
(1.3 |
) |
|
|
|
|
|
|
|
|
|
|
Decrease in income deferred during the year |
|
|
— |
|
|
|
(11.8 |
) |
|
|
(2.3 |
) |
Amortization of deferred income |
|
|
(14.9 |
) |
|
|
(18.9 |
) |
|
|
(13.7 |
) |
|
|
|
|
|
|
|
|
|
|
Decrease in deferred income |
|
|
(14.9 |
) |
|
|
(30.7 |
) |
|
|
(16.0 |
) |
Deferred income on retroactive reinsurance—beginning of year |
|
|
121.3 |
|
|
|
152.0 |
|
|
|
168.0 |
|
|
|
|
|
|
|
|
|
|
|
Deferred income on retroactive reinsurance—end of year |
|
$ |
106.4 |
|
|
$ |
121.3 |
|
|
$ |
152.0 |
|
|
|
|
|
|
|
|
|
|
|
The above activity arises from two retroactive contracts of which only the 2001 retroactive adverse
development contract for $400 million remains in effect at December 31, 2009. This contract covers
substantially all lines of business and provides $400 million of limit in excess of a retention for
accident years 2000 and prior, subject to a $200 million sublimit on 1998 and prior accident years
and an asbestos and environmental sublimit of $100 million. Premiums are currently based on 35% of
amounts ceded plus a reinsurer margin of $8 million. The contract contains provisions that would
increase the premium rate to as high as 62% under conditions that Company management considers
unlikely. The contract is on a funds held basis with interest credited at 7%. At December 31,
2009, the Company had ceded cumulative losses of $349.0 million, which is comprised of $0 million
in 2009, $(20.0) million in 2008, $(3.6) million in 2007 and $372.6 million prior to 2007 and paid
premiums of $143.8 million, which is comprised of $0 in 2009, $(8.2) million in 2008, $(1.3)
million in 2007 and $$153.3 million prior to 2007, related to this contract. At December 31, 2009
and 2008, the Company had reinsurance recoverable balances of $349.0 million, and funds held
balances of $236.3 million and $220.8 million, respectively, related to this agreement.
The second contract, which was commuted on June 26, 2008, covered all lines of business and
provided $100 million of limit in excess of a retention for accident periods prior to August 13,
1998, the date of acquisition of the Company by Fairfax. The contract contained sublimits relating
to asbestos, environmental and latent, construction defect and other losses and is subject to a
maximum economic loss provision. The contract was on a funds held basis with interest credited at
7%. The commutation had no impact on the financial statements as the Company had previously
reduced the reinsurance recoverable balance by funds held pursuant to the commutation provision
contained in the contract.
The premiums for the contract in effect at December 31, 2009, is included in funds held under
reinsurance contracts on the consolidated balance sheets and the reinsurance recoverable due from
reinsurers in excess of amounts paid for the coverage are reflected on the balance sheets as
deferred income on retroactive reinsurance. Such deferred income is amortized based on the
expected amount and timing of future recoveries, using the interest method. The Company amortized
deferred income of $14.9 million in 2009, $10.0 million in 2008, $13.3 million in 2007 and $60.6
million prior to 2007 in respect of this contract. This amortization of deferred income is
included as a reduction of losses and LAE in the consolidated statements of income.
In addition to the two contracts noted above, the Company also commuted the retroactive amendment
to its prospective 1998 aggregate stop loss agreement which is more fully discussed under
prospective corporate aggregate reinsurance above. The effect of this commutation was a loss of
$4.2 million, offset by $8.8 million of unamortized deferred income released on commutation which
resulted in a net pre-tax credit of $4.6 million included in losses and LAE on the consolidated
statement of income for the year ended December 31, 2008.
For additional information on reinsurance transactions with related parties, see Note 10 to the
consolidated financial statements included in “Item 8. Financial Statements and Supplemental
Data”.
17
Claims Management
Crum & Forster has developed claims management methodologies designed to monitor, control and
measure all aspects of the claims process. The Company’s claims management philosophy emphasizes:
| |
• |
|
maintenance of timely and adequate reserves for claims and the cost-effective delivery
of claims services by controlling losses and LAE; |
| |
| |
• |
|
financial integrity through the employment of investigative specialists who attempt to
limit fraudulent claims activity and a program to pursue appropriate subrogation and
recovery opportunities; and |
| |
| |
• |
|
exceptional customer service whereby the Company applies its resources toward pursuing
timely investigation and resolution of customer claims. |
Substantially all non-workers’ compensation claims are handled in the Company’s home office, with
the exception of accident and health claims which are outsourced to licensed administrators.
Workers’ compensation claims are handled in the regional offices. The Company has developed and
implemented competitive medical management and managed care programs to control workers’
compensation claim costs. At December 31, 2009, the Company had 370 employees dedicated to claims
management and administration, 206 of whom were located at the Company’s home office. These
employees include adjusters, litigation specialists, regional and corporate claims management, line
specialists and support staff. The Company regularly conducts internal reviews and audits to
monitor adherence to claims policies and procedures, the adequacy of case reserves, LAE,
productivity and service standards.
Pending and new claim counts by line of business, excluding asbestos, environmental and other
latent claims, accident and health claims, personal automobile claims and homeowners claims are
summarized as follows:
| |
|
|
|
|
|
|
|
|
|
|
|
|
| |
|
At December 31, |
|
| Pending Claims |
|
2009 |
|
|
2008 |
|
|
2007 |
|
Workers’ compensation1 |
|
|
8,999 |
|
|
|
9,473 |
|
|
|
10,301 |
|
General liability |
|
|
3,229 |
|
|
|
3,331 |
|
|
|
3,614 |
|
Commercial automobile |
|
|
3,316 |
|
|
|
4,416 |
|
|
|
5,125 |
|
All other |
|
|
1,524 |
|
|
|
1,890 |
|
|
|
2,387 |
|
|
|
|
|
|
|
|
|
|
|
Total pending claims |
|
|
17,068 |
|
|
|
19,110 |
|
|
|
21,427 |
|
|
|
|
|
|
|
|
|
|
|
| |
|
|
| 1 |
|
Excludes medical only claim counts. |
| |
|
|
|
|
|
|
|
|
|
|
|
|
| |
|
Years Ended December 31, |
|
| New Claims |
|
2009 |
|
|
2008 |
|
|
2007 |
|
Workers’ compensation1 |
|
|
5,615 |
|
|
|
6,595 |
|
|
|
7,169 |
|
General liability |
|
|
3,073 |
|
|
|
3,247 |
|
|
|
3,923 |
|
Commercial automobile |
|
|
10,185 |
|
|
|
15,014 |
|
|
|
15,935 |
|
All other |
|
|
2,716 |
|
|
|
3,361 |
|
|
|
3,541 |
|
|
|
|
|
|
|
|
|
|
|
Total new claims |
|
|
21,589 |
|
|
|
28,217 |
|
|
|
30,568 |
|
|
|
|
|
|
|
|
|
|
|
| |
|
|
| 1 |
|
Excludes medical only claim counts of 10,091, 11,953 and 13,628 for the years
ended December 31, 2009, 2008 and 2007, respectively. |
Crum & Forster uses an internal specialized claims unit to manage its asbestos, environmental
and other latent claims. For further details on the number of policyholders with open asbestos,
environmental and other latent claims see “Asbestos, Environmental and Other Latent Exposures”
discussed further below. Accident and health claims are handled by third party licensed
administrators and are subject to independent audits both on site and at the Company. Personal
automobile and homeowners claims are not material.
Reserves
Property and casualty insurers establish reserves to provide for future amounts needed to pay
claims with respect to insured events that have occurred, including events that have not yet been
reported to the insurer. Reserves are also established for LAE, representing the estimated
expenses of adjusting claims, including legal and other fees, and general expenses of administering
the claims settlement process.
18
After a claim is reported, claims personnel set up a case reserve for the estimated amount of the
settlement, if any. The estimate reflects the judgment of claims personnel, or of independent
claims adjusters hired by the Company, the scope of coverage available for the reported claim under
each individual policy assuming application of controlling state contract law, general reserving
practices, the experience and knowledge of such personnel regarding the nature of the specific
claim and, where appropriate, advice of counsel, with the goal of setting the reserve at the
ultimate expected loss amount as soon as sufficient information becomes available. Claims
personnel review and update their estimates as additional information becomes available and claims
proceed towards resolution. In addition, reserves are also established, on an aggregate basis, for
losses incurred but not reported to the insurer and for potential further loss development on
reported claims, including LAE. At December 31, 2009, total gross reserves for unpaid losses and
LAE were $2.7 billion, of which $1.0 billion related to case reserves and $1.7 billion related to
IBNR reserves.
The Company derives estimates for unreported claims and development on reported claims principally
from actuarial analyses of historical patterns of loss development by accident year for each type
of exposure and market segment. Similarly, the Company derives estimates of unpaid LAE principally
from actuarial analyses of historical development patterns of the relationship of LAE to losses for
each line of business and type of exposure. Management compares historical and current case
settlement and payment patterns by line of business to establish loss trends that recognize the new
development patterns and retention levels.
The process of estimating loss reserves is imprecise due to a number of variables. These variables
are affected by both internal and external events such as changes in claim handling procedures,
inflation, judicial trends and legislative changes. Many of these items are not directly
quantifiable, particularly on a prospective basis. Additionally, there may be significant
reporting lags between the occurrence of the insured event and the time it is actually reported to
the insurer. The Company continually refines reserve estimates as historical loss experience
develops and additional claims are reported and settled. The Company reflects adjustments to
reserves in the consolidated statements of income in the periods in which the estimates are
changed. In establishing reserves, estimated recoveries for reinsurance and salvage and
subrogation are taken into account. The aggregate reserves are also reviewed at least annually by
a nationally recognized actuarial firm.
The Company’s internal actuaries conduct full reserve studies using generally accepted actuarial
methods, for all lines of business except asbestos, environmental and other latent, every six
months, and for asbestos, environmental and other latent annually, from which central estimates of
ultimate losses and LAE by line of business are selected. These “target” loss ratios are used to
determine loss and allocated LAE expectations each month by accident year within each line of
business. Each month, reported losses are reviewed against these expectations to evaluate loss
emergence trends.
The recorded estimate and the high and low ends of the Company’s internal actuaries’ range of
reserves for each reserving line of business are summarized as follows:
| |
|
|
|
|
|
|
|
|
|
|
|
|
| |
|
At December 31, 2009 |
|
| |
|
|
|
|
|
Low End |
|
|
High End |
|
| |
|
|
|
|
|
of |
|
|
of |
|
| |
|
|
|
|
|
Actuarial |
|
|
Actuarial |
|
| (dollars in millions) |
|
Reserves |
|
|
Range |
|
|
Range |
|
General liability |
|
$ |
610.3 |
|
|
$ |
467.8 |
|
|
$ |
700.4 |
|
Workers’ compensation |
|
|
622.4 |
|
|
|
542.1 |
|
|
|
679.7 |
|
Asbestos, environmental and other latent |
|
|
356.3 |
|
|
|
257.7 |
|
|
|
476.1 |
|
Commercial automobile |
|
|
226.4 |
|
|
|
199.0 |
|
|
|
246.9 |
|
Property |
|
|
87.0 |
|
|
|
71.7 |
|
|
|
97.7 |
|
Other |
|
|
236.2 |
|
|
|
192.7 |
|
|
|
239.3 |
|
|
|
|
|
|
|
|
|
|
|
Net of per risk reinsurance, gross of corporate aggregate reinsurance |
|
|
2,138.6 |
|
|
|
1,731.0 |
|
|
|
2,440.1 |
|
Corporate aggregate reinsurance |
|
|
98.8 |
|
|
|
79.9 |
|
|
|
106.8 |
|
|
|
|
|
|
|
|
|
|
|
Total reserves, net of per risk reinsurance and corporate aggregate
reinsurance |
|
|
2,039.8 |
|
|
$ |
1,651.1 |
|
|
$ |
2,333.3 |
|
|
|
|
|
|
|
|
|
|
|
|
Ceded unpaid losses and LAE |
|
|
632.8 |
|
|
|
|
|
|
|
|
|
|
|
|
|
|
|
|
|
|
|
|
|
Gross unpaid losses and LAE |
|
$ |
2,672.6 |
|
|
|
|
|
|
|
|
|
|
|
|
|
|
|
|
|
|
|
|
|
A reconciliation of the beginning and ending net liability for unpaid losses and LAE is provided in
Note 5 to the consolidated financial statements included in “Item 8. Financial Statements and
Supplementary Data”. Reserves for losses and LAE were adjusted in each year based on the latest
actuarial estimates.
19
The components of (favorable) adverse development of prior years’ loss and LAE reserves are
summarized as follows:
| |
|
|
|
|
|
|
|
|
|
|
|
|
| |
|
Years Ended December 31, |
|
| (dollars in millions) |
|
2009 |
|
|
2008 |
|
|
2007 |
|
Workers’ compensation |
|
$ |
(34.1 |
) |
|
$ |
(86.9 |
) |
|
$ |
(65.4 |
) |
General liability |
|
|
0.9 |
|
|
|
66.0 |
|
|
|
(20.2 |
) |
Commercial automobile |
|
|
22.9 |
|
|
|
36.6 |
|
|
|
(6.6 |
) |
Property |
|
|
(10.5 |
) |
|
|
(17.1 |
) |
|
|
— |
|
Asbestos, environmental and other latent |
|
|
6.7 |
|
|
|
36.2 |
|
|
|
54.5 |
|
Commercial multi-peril |
|
|
(12.8 |
) |
|
|
6.6 |
|
|
|
(18.6 |
) |
Other |
|
|
1.9 |
|
|
|
(2.4 |
) |
|
|
6.1 |
|
|
|
|
|
|
|
|
|
|
|
Total adverse (favorable) development, net of per risk reinsurance |
|
|
(25.0 |
) |
|
|
39.0 |
|
|
|
(50.2 |
) |
Amortization of deferred gain on retroactive corporate aggregate reinsurance |
|
|
(14.9 |
) |
|
|
(18.9 |
) |
|
|
(13.7 |
) |
|
|
|
|
|
|
|
|
|
|
Total (favorable) adverse development, net of per risk and corporate
aggregate reinsurance |
|
|
(39.9 |
) |
|
|
20.1 |
|
|
|
(63.9 |
) |
Add back: Per risk and corporate aggregate reinsurance |
|
|
5.1 |
|
|
|
(111.6 |
) |
|
|
(37.1 |
) |
|
|
|
|
|
|
|
|
|
|
Total favorable development, gross of reinsurance |
|
$ |
(34.8 |
) |
|
$ |
(91.5 |
) |
|
$ |
(101.0 |
) |
|
|
|
|
|
|
|
|
|
|
For a discussion of loss development, see “Item 7. Management’s Discussion and Analysis of
Financial Condition and Results of Operations—Results of Operations—Losses and Loss Adjustment
Expenses”.
The following loss and LAE reserve development table illustrates the development of balance sheet
loss and LAE liabilities from 1999 through 2009 and the subsequent changes in those reserves,
presented on a historical basis. The first line of the table is the estimated liability for unpaid
losses and LAE, net of reinsurance recoverable, recorded at the balance sheet date for each year.
The next section of the table shows the cumulative amounts paid during successive years related to
the opening reserve.
For example, with respect to the net loss and LAE reserve of $2,225 million at December 31, 1999,
by the end of 2009, $2,175 million had been paid in settlement of those reserves. In addition, the
original reserve of $2,225 million was re-estimated to be $2,753 million at December 31, 2009.
This change from the original estimate would normally result from a number of factors such as
losses being settled for different amounts than originally estimated, more information becoming
available about the individual claims and overall claim frequency and severity patterns. The lower
section of the table shows the gross liability, reinsurance recoverable and net liability recorded
at the balance sheet date for each of the indicated years and the re-estimation of these amounts at
December 31, 2009.
Care must be taken to avoid misinterpretation by those unfamiliar with this information or familiar
with other data commonly reported by the insurance industry. The accompanying data is not accident
year data, but rather, a display of 1999 to 2009 calendar year-end reserves and the subsequent
changes in those reserves. We do not consider it appropriate to extrapolate future deficiencies
or redundancies based upon the table as conditions and trends that have affected development of
liability in the past may not necessarily recur in the future.
Through the year ended 2003, the subsequent adverse development of the net liability for unpaid
losses and LAE was primarily due to asbestos and environmental claims, reflecting an increase in
the number of claims filed, an increase in the severity of claims and an increase in litigation
costs associated with these claims. Offsetting the adverse development through 2003 was favorable
emergence for casualty claims, primarily non-latent umbrella claims. While the number of new
claimants filing asbestos claims against the Company’s policyholders has stabilized in the last few
years, the average value of alleged claims has increased. Offsetting the adverse development since
2004 was favorable emergence for most casualty lines, particularly for workers’ compensation and
non-latent umbrella claims.
20
Ten-Year Analysis of Consolidated Loss and LAE Development Presented Net of Reinsurance With
Supplemental Gross Data
| |
|
|
|
|
|
|
|
|
|
|
|
|
|
|
|
|
|
|
|
|
|
|
|
|
|
|
|
|
|
|
|
|
|
|
|
|
|
|
|
|
|
|
|
|
| |
|
At December 31, |
|
| (dollars in millions) |
|
1999 |
|
|
2000 |
|
|
2001 |
|
|
2002 |
|
|
2003 |
|
|
2004 |
|
|
2005 |
|
|
2006 |
|
|
2007 |
|
|
2008 |
|
|
2009 |
|
Reserves for unpaid losses
and LAE (net of reinsurance
recoverable) |
|
$ |
2,225 |
|
|
$ |
1,770 |
|
|
$ |
1,577 |
|
|
$ |
1,494 |
|
|
$ |
1,873 |
|
|
$ |
2,010 |
|
|
$ |
1,990 |
|
|
$ |
2,016 |
|
|
$ |
1,981 |
|
|
$ |
2,304 |
|
|
$ |
2,040 |
|
Paid (cumulative) as of: |
|
|
|
|
|
|
|
|
|
|
|
|
|
|
|
|
|
|
|
|
|
|
|
|
|
|
|
|
|
|
|
|
|
|
|
|
|
|
|
|
|
|
|
|
One year later |
|
|
757 |
|
|
|
676 |
|
|
|
454 |
|
|
|
160 |
|
|
|
460 |
|
|
|
481 |
|
|
|
482 |
|
|
|
571 |
|
|
|
272 |
|
|
|
633 |
|
|
|
|
|
Two years later |
|
|
1,300 |
|
|
|
1,026 |
|
|
|
533 |
|
|
|
521 |
|
|
|
809 |
|
|
|
815 |
|
|
|
852 |
|
|
|
637 |
|
|
|
657 |
|
|
|
|
|
|
|
|
|
Three years later |
|
|
1,565 |
|
|
|
1,097 |
|
|
|
824 |
|
|
|
795 |
|
|
|
1,065 |
|
|
|
1,084 |
|
|
|
816 |
|
|
|
912 |
|
|
|
|
|
|
|
|
|
|
|
|
|
Four years later |
|
|
1,626 |
|
|
|
1,328 |
|
|
|
1,049 |
|
|
|
988 |
|
|
|
1,277 |
|
|
|
985 |
|
|
|
1,025 |
|
|
|
|
|
|
|
|
|
|
|
|
|
|
|
|
|
Five years later |
|
|
1,850 |
|
|
|
1,504 |
|
|
|
1,208 |
|
|
|
1,162 |
|
|
|
1,139 |
|
|
|
1,144 |
|
|
|
|
|
|
|
|
|
|
|
|
|
|
|
|
|
|
|
|
|
Six years later |
|
|
2,023 |
|
|
|
1,637 |
|
|
|
1,360 |
|
|
|
986 |
|
|
|
1,269 |
|
|
|
|
|
|
|
|
|
|
|
|
|
|
|
|
|
|
|
|
|
|
|
|
|
Seven years later |
|
|
2,153 |
|
|
|
1,763 |
|
|
|
1,168 |
|
|
|
1,089 |
|
|
|
|
|
|
|
|
|
|
|
|
|
|
|
|
|
|
|
|
|
|
|
|
|
|
|
|
|
Eight years later |
|
|
2,277 |
|
|
|
1,563 |
|
|
|
1,263 |
|
|
|
|
|
|
|
|
|
|
|
|
|
|
|
|
|
|
|
|
|
|
|
|
|
|
|
|
|
|
|
|
|
Nine years later |
|
|
2,094 |
|
|
|
1,649 |
|
|
|
|
|
|
|
|
|
|
|
|
|
|
|
|
|
|
|
|
|
|
|
|
|
|
|
|
|
|
|
|
|
|
|
|
|
Ten years later |
|
|
2,175 |
|
|
|
|
|
|
|
|
|
|
|
|
|
|
|
|
|
|
|
|
|
|
|
|
|
|
|
|
|
|
|
|
|
|
|
|
|
|
|
|
|
Liability re-estimated as of: |
|
|
|
|
|
|
|
|
|
|
|
|
|
|
|
|
|
|
|
|
|
|
|
|
|
|
|
|
|
|
|
|
|
|
|
|
|
|
|
|
|
|
|
|
One year later |
|
|
2,258 |
|
|
|
1,953 |
|
|
|
1,596 |
|
|
|
1,611 |
|
|
|
1,942 |
|
|
|
1,941 |
|
|
|
1,894 |
|
|
|
1,952 |
|
|
|
2,001 |
|
|
|
2,264 |
|
|
|
|
|
Two years later |
|
|
2,445 |
|
|
|
1,969 |
|
|
|
1,749 |
|
|
|
1,718 |
|
|
|
1,932 |
|
|
|
1,855 |
|
|
|
1,840 |
|
|
|
1,990 |
|
|
|
1,951 |
|
|
|
|
|
|
|
|
|
Three years later |
|
|
2,460 |
|
|
|
2,093 |
|
|
|
1,857 |
|
|
|
1,702 |
|
|
|
1,862 |
|
|
|
1,830 |
|
|
|
1,917 |
|
|
|
1,959 |
|
|
|
|
|
|
|
|
|
|
|
|
|
Four years later |
|
|
2,584 |
|
|
|
2,203 |
|
|
|
1,836 |
|
|
|
1,643 |
|
|
|
1,877 |
|
|
|
1,908 |
|
|
|
1,915 |
|
|
|
|
|
|
|
|
|
|
|
|
|
|
|
|
|
Five years later |
|
|
2,680 |
|
|
|
2,180 |
|
|
|
1,787 |
|
|
|
1,660 |
|
|
|
1,968 |
|
|
|
1,934 |
|
|
|
|
|
|
|
|
|
|
|
|
|
|
|
|
|
|
|
|
|
Six years later |
|
|
2,676 |
|
|
|
2,148 |
|
|
|
1,804 |
|
|
|
1,748 |
|
|
|
1,998 |
|
|
|
|
|
|
|
|
|
|
|
|
|
|
|
|
|
|
|
|
|
|
|
|
|
Seven years later |
|
|
2,652 |
|
|
|
2,152 |
|
|
|
1,888 |
|
|
|
1,749 |
|
|
|
|
|
|
|
|
|
|
|
|
|
|
|
|
|
|
|
|
|
|
|
|
|
|
|
|
|
Eight years later |
|
|
2,660 |
|
|
|
2,242 |
|
|
|
1,888 |
|
|
|
|
|
|
|
|
|
|
|
|
|
|
|
|
|
|
|
|
|
|
|
|
|
|
|
|
|
|
|
|
|
Nine years later |
|
|
2,747 |
|
|
|
2,239 |
|
|
|
|
|
|
|
|
|
|
|
|
|
|
|
|
|
|
|
|
|
|
|
|
|
|
|
|
|
|
|
|
|
|
|
|
|
Ten years later |
|
|
2,753 |
|
|
|
|
|
|
|
|
|
|
|
|
|
|
|
|
|
|
|
|
|
|
|
|
|
|
|
|
|
|
|
|
|
|
|
|
|
|
|
|
|
Cumulative (deficiency)/redundancy |
|
|
(528 |
) |
|
|
(469 |
) |
|
|
(311 |
) |
|
|
(255 |
) |
|
|
(125 |
) |
|
|
76 |
|
|
|
75 |
|
|
|
57 |
|
|
|
30 |
|
|
|
40 |
|
|
|
|
|
|
|
|
|
|
|
|
|
|
|
|
|
|
|
|
|
|
|
|
|
|
|
|
|
|
|
|
|
|
|
|
|
|
|
|
|
|
|
|
|
|
|
|
|
|
Gross liability – end of year |
|
$ |
3,529 |
|
|
$ |
3,340 |
|
|
$ |
3,454 |
|
|
$ |
3,250 |
|
|
$ |
3,194 |
|
|
$ |
3,371 |
|
|
$ |
3,673 |
|
|
$ |
3,371 |
|
|
$ |
3,178 |
|
|
$ |
2,988 |
|
|
$ |
2,673 |
|
Reinsurance recoverable |
|
|
1,304 |
|
|
|
1,570 |
|
|
|
1,877 |
|
|
|
1,756 |
|
|
|
1,321 |
|
|
|
1,361 |
|
|
|
1,683 |
|
|
|
1,355 |
|
|
|
1,197 |
|
|
|
684 |
|
|
|
633 |
|
|
|
|
|
|
|
|
|
|
|
|
|
|
|
|
|
|
|
|
|
|
|
|
|
|
|
|
|
|
|
|
|
|
|
Net liability – end of year |
|
$ |
2,225 |
|
|
$ |
1,770 |
|
|
$ |
1,577 |
|
|
$ |
1,494 |
|
|
$ |
1,873 |
|
|
$ |
2,010 |
|
|
$ |
1,990 |
|
|
$ |
2,016 |
|
|
$ |
1,981 |
|
|
$ |
2,304 |
|
|
$ |
2,040 |
|
|
|
|
|
|
|
|
|
|
|
|
|
|
|
|
|
|
|
|
|
|
|
|
|
|
|
|
|
|
|
|
|
|
|
Gross re-estimated liability
at December 31, 2009 |
|
$ |
4,221 |
|
|
$ |
3,874 |
|
|
$ |
3,652 |
|
|
$ |
3,389 |
|
|
$ |
3,276 |
|
|
$ |
3,253 |
|
|
$ |
3,445 |
|
|
$ |
3,172 |
|
|
$ |
3,047 |
|
|
$ |
2,953 |
|
|
|
|
|
Re-estimated reinsurance
recoverable at December 31,
2009 |
|
|
1,468 |
|
|
|
1,635 |
|
|
|
1,764 |
|
|
|
1,640 |
|
|
|
1,278 |
|
|
|
1,319 |
|
|
|
1,530 |
|
|
|
1,213 |
|
|
|
1,096 |
|
|
|
689 |
|
|
|
|
|
|
|
|
|
|
|
|
|
|
|
|
|
|
|
|
|
|
|
|
|
|
|
|
|
|
|
|
|
|
|
|
Net re-estimated liability
at December 31, 2009 |
|
$ |
2,753 |
|
|
$ |
2,239 |
|
|
$ |
1,888 |
|
|
$ |
1,749 |
|
|
$ |
1,998 |
|
|
$ |
1,934 |
|
|
$ |
1,915 |
|
|
$ |
1,959 |
|
|
$ |
1,951 |
|
|
$ |
2,264 |
|
|
|
|
|
|
|
|
|
|
|
|
|
|
|
|
|
|
|
|
|
|
|
|
|
|
|
|
|
|
|
|
|
|
|
|
Cumulative gross
(deficiency)/redundancy |
|
$ |
(692 |
) |
|
$ |
(534 |
) |
|
$ |
(198 |
) |
|
$ |
(139 |
) |
|
$ |
(82 |
) |
|
$ |
118 |
|
|
$ |
228 |
|
|
$ |
199 |
|
|
$ |
131 |
|
|
$ |
35 |
|
|
|
|
|
|
|
|
|
|
|
|
|
|
|
|
|
|
|
|
|
|
|
|
|
|
|
|
|
|
|
|
|
|
|
|
21
Asbestos, Environmental and Other Latent Exposures
The Company has written general liability, commercial multi-peril and umbrella policies under which
its policyholders continue to present claims alleging asbestos-related injury and claims alleging
injury, damage or clean up costs arising from environmental pollution and other latent claims. The
vast majority of these claims are presented under policies written many years ago.
There is a great deal of uncertainty surrounding latent liabilities. This uncertainty affects the
ability of insurers and reinsurers to estimate the ultimate amount of unpaid claims and related
settlement expenses. The majority of these claims differ from other types of contractual claims
because there is limited consistent precedent to determine what, if any, coverage exists or which,
if any, policy years and insurers/reinsurers may be liable. These uncertainties are exacerbated by
inconsistent court decisions and judicial interpretations of coverage that, in many cases, have
expanded theories of liability. The industry as a whole is engaged in extensive litigation over
these coverage and liability issues and is, thus, confronted with continuing uncertainty in its
efforts to quantify latent exposures.
An analysis of gross and net reserves (net of per risk reinsurance, but before the benefit of
corporate aggregate reinsurance) from asbestos, environmental and other latent exposures is
presented below:
| |
|
|
|
|
|
|
|
|
|
|
|
|
|
|
|
|
|
|
|
|
|
|
|
|
| |
|
Years Ended December 31, |
|
| |
|
2009 |
|
|
2008 |
|
|
2007 |
|
| (dollars in millions) |
|
Gross |
|
|
Net |
|
|
Gross |
|
|
Net |
|
|
Gross |
|
|
Net |
|
Unpaid latent losses and allocated LAE (“ALAE”),
beginning of the year |
|
$ |
523.4 |
|
|
$ |
401.1 |
|
|
$ |
580.1 |
|
|
$ |
442.8 |
|
|
$ |
586.2 |
|
|
$ |
443.5 |
|
Latent losses and ALAE incurred during the year |
|
|
27.3 |
|
|
|
6.7 |
|
|
|
56.7 |
|
|
|
36.2 |
|
|
|
55.9 |
|
|
|
54.5 |
|
Latent losses and ALAE paid during the year |
|
|
91.8 |
|
|
|
51.5 |
|
|
|
113.4 |
|
|
|
77.9 |
|
|
|
62.0 |
|
|
|
55.2 |
|
|
|
|
|
|
|
|
|
|
|
|
|
|
|
|
|
|
|
|
Unpaid latent losses and ALAE, end of the year |
|
$ |
458.9 |
|
|
$ |
356.3 |
|
|
$ |
523.4 |
|
|
$ |
401.1 |
|
|
$ |
580.1 |
|
|
$ |
442.8 |
|
|
|
|
|
|
|
|
|
|
|
|
|
|
|
|
|
|
|
|
Net latent losses incurred in 2009 are net of an insurance recovery of $13.8 million associated
with an asbestos lawsuit which the Company settled in 2008. Excluding this recovery, net latent
losses incurred of $20.5 million were primarily attributable to increasing claim values and rising
legal costs associated with the asbestos liabilities of one policyholder. In 2008, net latent
losses incurred were primarily attributable to the aforementioned lawsuit settlement. In 2007, net
latent losses incurred were due to the combined strengthening of asbestos, environmental and other
latent reserves.
An analysis of the number of policyholders with open asbestos, environmental and other latent
claims is presented below:
| |
|
|
|
|
|
|
|
|
|
|
|
|
|
|
|
|
| |
|
Asbestos |
|
|
Environmental |
|
|
Other Latent |
|
|
Total Latent |
|
Number of policyholders
open at December 31,
2007 |
|
|
401 |
|
|
|
261 |
|
|
|
204 |
|
|
|
866 |
|
Opened during the year |
|
|
71 |
|
|
|
80 |
|
|
|
65 |
|
|
|
216 |
|
Closed during the year |
|
|
135 |
|
|
|
105 |
|
|
|
96 |
|
|
|
336 |
|
|
|
|
|
|
|
|
|
|
|
|
|
|
Number of policyholders
open at December 31,
2008 |
|
|
337 |
|
|
|
236 |
|
|
|
173 |
|
|
|
746 |
|
Opened during the year |
|
|
85 |
|
|
|
84 |
|
|
|
64 |
|
|
|
233 |
|
Closed during the year |
|
|
66 |
|
|
|
89 |
|
|
|
78 |
|
|
|
233 |
|
|
|
|
|
|
|
|
|
|
|
|
|
|
Number of policyholders
open at December 31,
2009 |
|
|
356 |
|
|
|
231 |
|
|
|
159 |
|
|
|
746 |
|
|
|
|
|
|
|
|
|
|
|
|
|
|
For a more detailed discussion of Asbestos, Environmental and Other Latent Exposures, see “Item 7.
Management’s Discussion and Analysis of Financial Condition and Results of Operations—Results of
Operations—Losses and Loss Adjustment Expenses”.
Investments
The Company’s investment strategy is to maximize the total return of the portfolio while preserving
invested capital for the protection of policyholders and providing sufficient liquidity for the
payment of claims and other obligations. Management believes that Crum & Forster’s investment
policy provides the flexibility to implement this strategy.
The investments of Crum & Forster Holdings Corp. and its subsidiaries are managed by Hamblin Watsa
Investment Counsel Ltd. (“Hamblin Watsa”), a subsidiary of Fairfax. The investment guidelines, as
promulgated by each insurance subsidiary’s investment committee and as set forth in each insurance
subsidiary’s respective investment agreement with Hamblin Watsa, stress preservation of capital,
market liquidity, diversification of risk and long-term, value-oriented investments. Long-term
investments generally are made using a value approach, by investing in securities which Hamblin
Watsa believes are selling below their intrinsic value, to protect capital from loss and generate
above average long-term total returns. The members of the investment committee of Hamblin Watsa,
all of whom are officers of Hamblin Watsa, are members of the investment committees of the Company
and its insurance subsidiaries. In addition, Mary Jane Robertson, Executive Vice President, Chief
Financial Officer and Treasurer of the Company is also a member of the investment committee of the
Company’s insurance subsidiaries.
22
At December 31, 2009, Crum & Forster’s investment portfolio including cash and cash equivalents and
assets pledged for derivatives totaled approximately $4.0 billion, with net unrealized gains
totaling approximately $389.3 million. The table below shows the value and percentage
composition of the Company’s investment portfolio by major investment category.
| |
|
|
|
|
|
|
|
|
|
|
|
|
|
|
|
|
| |
|
2009 |
|
|
2008 |
|
| |
|
|
|
|
|
% of |
|
|
|
|
|
|
% of |
|
| (dollars in millions) |
|
$ |
|
|
Total |
|
|
$ |
|
|
Total |
|
Fixed income securities, available-for-sale, at fair value1 |
|
$ |
1,519.5 |
|
|
|
38.0 |
% |
|
$ |
1,533.3 |
|
|
|
38.0 |
% |
Fixed income securities, held-for-trading, at fair value |
|
|
321.4 |
|
|
|
8.1 |
|
|
|
234.0 |
|
|
|
5.8 |
|
Equity securities, available-for-sale, at fair value |
|
|
1,284.1 |
|
|
|
32.2 |
|
|
|
1,020.2 |
|
|
|
25.3 |
|
Investments at equity |
|
|
167.3 |
|
|
|
4.2 |
|
|
|
117.6 |
|
|
|
2.9 |
|
Derivative and other invested assets, at fair value |
|
|
387.9 |
|
|
|
9.7 |
|
|
|
412.7 |
|
|
|
10.3 |
|
Cash, cash equivalents and short-term investments, at fair value2 |
|
|
311.8 |
|
|
|
7.8 |
|
|
|
714.2 |
|
|
|
17.7 |
|
|
|
|
|
|
|
|
|
|
|
|
|
|
Total investments |
|
$ |
3,992.0 |
|
|
|
100.0 |
% |
|
$ |
4,032.0 |
|
|
|
100.0 |
% |
|
|
|
|
|
|
|
|
|
|
|
|
|
| |
|
|
| 1 |
|
Includes securities deposited for derivative transactions of $29.4 million at
December 31, 2009. |
| |
| 2 |
|
Includes cash deposited for derivative transactions of $4.4 million at December 31,
2008. |
The Company’s investments are subject to market risks and fluctuations, as well as to risks
inherent in particular securities. For further discussion of market risks, see “Item 7A.
Quantitative and Qualitative Disclosures about Market Risk”.
Fixed income securities are selected on the basis of intrinsic value, keeping in mind yield spreads
over U.S. Treasury securities and credit analysis.
The Company seeks to purchase equity securities that are selling at prices below their estimated
intrinsic values. Downside protection is obtained by seeking a margin of safety in terms of a
sound financial position. The availability of equity securities meeting the Company’s value-based
criteria will generally dictate the portfolio’s exposure to equities. Similarly, the value-based
criteria, with a view to the availability of attractive yield spreads and strong credit, will
generally determine the level of exposure to corporate bonds. As part of the Company’s review and
monitoring process, the impact of a substantial reduction in equity prices on insurance regulatory
capital is tested regularly to ensure that capital adequacy will be maintained at all times.
From time to time, the Company uses derivative securities to mitigate financial risks arising
principally from its investment holdings and receivables. In the latter half of 2008, the Company
closed all of its equity hedge positions, realizing substantial gains on them and increased its
investments in equity securities, through additional acquisitions, as a result of the opportunities
presented by significant declines in the global equity markets. In addition, the equity markets
have experienced significant appreciation in value since the end of 2008, further increasing the
value of the Company’s holdings, while concurrently increasing the Company’s exposure to market
volatility. As a result, in the third quarter of 2009, the Company once again decided to protect a
portion of its equity and equity related holdings against a decline in equity markets and entered
into equity index total return swaps with a notional value of $452.3 million. The Company is
required to post collateral equivalent to 6% of the notional value of the total return swaps at the
time the swap is opened. These assets are recorded at fair value in assets pledged for derivatives
on the consolidated balance sheets. At December 31, 2009, the fair value of the collateral, in the
form of municipal bonds, was $29.4 million. The total return swap transactions terminate in the
third quarter of 2010, but may be replaced in greater or lesser amounts at that time, depending on
market conditions.
The Company has also significantly reduced its credit default swap portfolio relative to prior
years, largely as a result of closing transactions and fair value changes. In the latter part of
2008, the Company reviewed the financial objectives of its economic hedge program and decided not
to replace closed credit default swaps based on: (i) the Company’s judgment that its exposure to
elevated levels of credit risk had moderated and that its historical approaches to managing credit
risk were satisfactory in mitigating the Company’s exposure to credit risk arising from its
financial assets; (ii) the significant increase in the cost of purchasing credit protection; and
(iii) the fact that the Company’s capital and liquidity had benefited from approximately $450
million in realized gains from credit default swaps since inception of the hedge program. As a
result, the effects that credit default swaps as hedging instruments may be expected to have on the
Company’s future financial position, liquidity and results of operations may be expected to
diminish significantly relative to the effects in recent years. The Company may initiate new credit
default swap contracts as a hedging mechanism in the future, but there can be no assurance that it
will do so. The total cost of the credit default swaps was $21.6 million and $42.5 million as of
December 31, 2009 and December 31, 2008, respectively, and the fair value was $20.0 million and
$138.8 million, at December 31, 2009 and December 31, 2008, respectively. The notional amount of
the credit default swaps was $1.6 billion and $3.0 billion at December 31, 2009 and December 31,
2008, respectively.
23
The composition of the fair value of the Company’s fixed income securities by rating, as assigned
by Standard & Poor’s Insurance Rating Services or Moody’s Investors Service, using the higher of
these ratings for any security where there is a split rating, is summarized as follows:
| |
|
|
|
|
|
|
|
|
| |
|
At December 31, |
|
| Rating |
|
2009 |
|
|
2008 |
|
AAA/Aaa |
|
|
65.3 |
% |
|
|
82.0 |
% |
AA/Aa2 |
|
|
4.0 |
|
|
|
2.8 |
|
A/A2 |
|
|
8.7 |
|
|
|
1.9 |
|
BBB/Baa2 |
|
|
5.0 |
|
|
|
— |
|
BB/Ba2 |
|
|
3.1 |
|
|
|
— |
|
B/B2 |
|
|
3.5 |
|
|
|
2.1 |
|
CCC/Caa or lower, or not rated |
|
|
10.4 |
|
|
|
11.2 |
|
|
|
|
|
|
|
|
Total fixed income securities |
|
|
100.0 |
% |
|
|
100.0 |
% |
|
|
|
|
|
|
|
At December 31, 2009, 17.0% of the Company’s fixed income securities were rated non-investment
grade (BB/Ba2) or lower, as compared to 13.3% at December 31, 2008. The increase in 2009 was due
in part to the purchase of an additional $19.8 million of non-investment grade mortgage-backed
securities. Although the Company generally invests in high quality fixed income securities, the
Company will invest to a limited extent in non-investment grade high yield securities where
attractive market opportunities exist.
The Company’s fixed income securities had an average duration of 12.6 years and an average yield to
maturity of 5.9% before investment expenses at December 31, 2009.
For additional information about investments, see “Item 7. Management’s Discussion and Analysis of
Financial Condition and Results of Operations — Results of Operations — Investment Results” and
Note 3 to the consolidated financial statements contained in “Item 8. Financial Statements and
Supplementary Data”.
Competition
The property and casualty insurance industry is highly competitive as to both price and service and
the Company competes with large, national insurers that often have greater financial strength and
broader product offerings. In addition, the Company competes with regional companies that have an
in-depth knowledge of the local insurance marketplace and are positioned to be responsive to local
needs. According to A.M. Best, there are approximately 1,000 property and casualty organizations
in the United States, comprised of approximately 2,400 property and casualty companies, as reported
in Best’s Aggregates & Averages, Property/Casualty, 2009 Edition (“Best 2009”). Of those
organizations, the top 50 accounted for approximately 79% of the industry’s total net premiums
written in 2008 and no one company, or company group, had a market share greater than 11%. Based
on Best 2009, management believes that Crum & Forster ranked approximately 47th by net premiums
written in commercial lines in 2008 compared to 42nd in 2007.
Competition in the property and casualty insurance industry is based on many factors, including
overall financial strength of the insurer, ratings by rating agencies, premiums charged, policy
terms and conditions, services offered, reputation and experience. The Company’s challenge is to
retain existing business and attract new business on terms offering acceptable return potentials in
an environment in which both established competitors and newer entrants are aggressively seeking
premium growth.
The property and casualty insurance business is cyclical and influenced by many factors, including
price competition, economic conditions, natural and man-made disasters (for example hurricanes,
earthquakes and terrorism), availability and cost of reinsurance, credit conditions and interest
rates, state regulations, court decisions and changes in the law. For the last several years, the
property and casualty market has experienced challenging market conditions characterized by intense
competition and downward pricing trends. These soft market conditions heightened in 2008 and the
Company has continued to see soft market pricing through all lines of business, with the exception
of modest price increases in California workers’ compensation, throughout 2009.
Market conditions for the Company’s largest accident and health segment by gross written premiums,
employer stop loss, are currently intensely competitive. Competition in the Company’s other
accident and health segments, such as student medical, travel and pet insurance, varies from
product to product but generally is currently less intense.
Although there is some evidence of deceleration in rate decreases, the Company expects the market
to remain competitive through 2010, attributable to the combined effects of the light catastrophe
season in 2009, the restoration of capital throughout the industry, resulting from the improvement
in the financial markets, and additional competitors in some lines of business placing downward
pressure on price levels. Under such conditions, the Company will continue to reject underpriced
new business submissions and to shed accounts and classes of business that are unprofitable.
No assurance can be made that the Company will not face increased competition in the future and
that such increased competition will not have a material adverse effect on Crum & Forster. For
further discussion, see “Item 1A. Risk Factors—The Company operates in a highly competitive
environment, which makes it more difficult to attract and retain business”.
24
Ratings
Financial strength ratings issued by third party rating agencies are used by insurance consumers
and insurance intermediaries as an important means of assessing the financial strength and quality
of insurers. Higher ratings generally indicate relative financial stability and a strong ability
to pay claims. Ratings focus on the following factors: capital resources, financial strength,
demonstrated management expertise in the insurance business, credit analysis, systems development,
marketing, investment operations, minimum policyholders’ surplus requirements and capital
sufficiency to meet projected growth, as well as access to such traditional capital as may be
necessary to continue to meet standards for capital adequacy.
Crum & Forster’s insurance subsidiaries are assigned financial strength ratings from major rating
agencies which include A.M. Best Company (“A.M. Best”), Standard & Poor’s (“S&P”) Insurance Rating
Services and Moody’s Investors Service (“Moody’s”). Crum & Forster’s insurance subsidiaries
currently have an “A” financial strength rating from A.M. Best (the third highest of fifteen rating
categories) with a stable outlook, an “A-” (the third highest of nine major rating categories) with
a stable outlook from S&P and a “Baa2” financial strength rating (the fourth highest of nine major
rating categories) with a stable outlook from Moody’s. S&P upgraded the financial strength ratings
of Crum and Forster’s insurance subsidiaries from BBB+ to A- in November 2009.
The financial strength ratings assigned by rating agencies to insurance companies represent
independent opinions of an insurer’s financial strength and its ability to meet ongoing obligations
to policyholders, and are not directed toward the protection of investors. Ratings by rating
agencies of insurance companies are not ratings of securities or recommendations to buy, hold or
sell any security.
Insurance Regulatory Matters
The Company and its subsidiaries are subject to regulation under relevant insurance statutes,
including insurance holding company statutes of various jurisdictions, including Delaware, the
domiciliary state of US Fire and CF Indemnity; New Jersey, the domiciliary state of North River and
CF Insurance; New York, the domiciliary state of Seneca; and Arizona, the domiciliary state of CF
Specialty and Seneca Specialty. In addition, the Company is subject to regulation by the insurance
regulators of other states in which its insurance subsidiaries do business.
General
Crum & Forster’s insurance subsidiaries are subject to extensive regulation by the various states
in which they conduct business in the United States. Although there is limited federal regulation
of the insurance business, each state has a comprehensive system for regulating insurers operating
in that state. The laws of the various states establish supervisory agencies with broad authority
to regulate, among other things, authority to transact business, premium rates for certain
coverage, trade practices, market conduct, agent licensing, policy forms, underwriting and claims
practices, reserve adequacy, transactions with affiliates and insurer solvency. Many states also
regulate investment activities on the basis of quality, concentration by asset class and other
quantitative criteria. Further, most states compel participation in, and regulate composition of,
various shared market mechanisms. States have also enacted legislation that regulates insurance
holding company systems, including acquisitions, dividends, transactions with affiliates and other
related matters.
Insurance companies are also affected by a variety of state and federal legislative and regulatory
measures and judicial decisions that may alter the Company’s risk exposures under its insurance
policies, thereby potentially increasing its liability. Examples of affected risk exposures are
product liability, environmental damage and workers’ compensation. In addition, individual state
insurance departments may prevent premium rates for some classes of business from adequately
reflecting the level of risk assumed by the insurer for those classes and may also restrict the
Company’s ability to exit unprofitable lines of business or reduce its writings in those lines.
Such developments may result in adverse effects on the profitability of the Company. In addition,
many states require regulatory approval for policy forms used in their states, restricting the
ability of the Company to quickly enter new lines of business or alter existing forms responsive to
changing market conditions.
25
Possible Legislative and Regulatory Changes
In recent years, the insurance industry has been subject to increased scrutiny by regulators and
legislators. The National Association of Insurance Commissioners (“NAIC”) and a number of state
legislatures have considered or adopted legislative proposals that alter and, in many cases,
increase the authority of state agencies to regulate insurance companies and holding company
systems. In addition, several committees of Congress have made inquiries and conducted hearings as
part of a broad study of the regulation of insurance companies, and legislation has been introduced
in several of the past sessions of Congress which, if enacted, could result in the federal
government assuming a role in the regulation of the insurance industry. Although the federal
government does not currently regulate the business of insurance directly, federal initiatives
often affect the insurance business in a variety of ways. For example, Section 111 of the
Medicare, Medicaid, and SCHIP Extension Act of 2007 (MMSEA) put in place a new reporting system to
help the Centers for Medicare & Medicaid Services (CMS), the federal agency that administers
Medicare, recover from Medicare beneficiaries and insurers when Medicare erroneously pays on a
primary basis or when a beneficiary receives payment from both Medicare and an insurer for the same
injury. Section 111 requires insurers to electronically report substantial claims information to
CMS to determine if they are liable for the medical expenses of an injured Medicare beneficiary,
whether due to a court judgment or settlement. This electronic reporting is required for insurers
starting January 1, 2011.
New bills have been introduced in the US Congress from time to time that would amend the
McCarran-Ferguson Act of 1945 (“McCarran-Ferguson”) to make the federal anti-trust laws applicable
to the business of insurance.
It is not possible to predict the outcome of any of the foregoing legislative, investigative or
administrative activities or the potential effects thereof on the Company.
For a discussion of various investigations by governmental authorities regarding certain insurance
industry business practices, see “Item 1A. Risk Factors—Certain business practices of the insurance
industry have become the subject of investigations by government authorities and other parties and
the subject of class action litigation” and “Item 3. Legal Proceedings—Insurance Industry
Investigations”.
NAIC Model Audit Role
The NAIC has revised the Model Regulation Requiring Annual Audited Financial Reports (“Model Audit
Rule”) effective January 1, 2010 for the financial year ending December 31, 2010. These revisions,
which included renaming the model to the Annual Financial Reporting Model Regulation, require that
insurers comply with certain best practices related to auditor independence, corporate governance
and internal controls over financial reporting.
Producer Compensation Investigations
The insurance industry has been the subject of scrutiny with respect to broker and agent
compensation arrangements and sales practices. The New York State Attorney General and other state
and federal regulators have conducted investigations and other proceedings relating to compensation
and bidding arrangements between producers and issuers of insurance products. The practices under
investigation include, among other things, allegations that so-called contingent commission
arrangements may conflict with a broker’s duties to its customers and that certain brokers and
insurers may have engaged in anti-competitive practices in connection with insurance premium
quotes. In September 2009, The New York State Insurance Department announced it is proposing a new
Producer Compensation Transparency Regulation and has sent it to the Governor’s Office of
Regulatory Reform for review. The proposed regulation would require insurance producers to notify
insurance consumers of their right to request information on compensation provided to producers by
insurers for the sale or service of insurance. These investigations, regulatory developments and
proceedings, which are expected to continue, could result in legal precedents, legislation and the
emergence of new industry-wide practices for compensating insurance producers that could
significantly affect the insurance industry and how it sells its insurance products.
For a discussion of various investigations by governmental authorities regarding certain insurance
industry business practices, see “Item 1A. Risk Factors—Certain business practices of the insurance
industry have become the subject of investigations by government authorities and other parties and
the subject of class action litigation” and “Item 3. Legal Proceedings—Insurance Industry
Investigations”.
Regulation of Dividends and Other Payments from the Company’s Insurance Subsidiaries
Crum & Forster Holdings Corp. is a legal entity separate and distinct from its subsidiaries. As a
holding company with no other business operations, Crum & Forster Holdings Corp.’s primary sources
of cash to meet its obligations, including principal and interest payments with respect to
indebtedness, are dividends and other statutorily permitted payments, such as management and other
fees, from its insurance subsidiaries.
26
Crum & Forster Holdings Corp.’s insurance subsidiaries are subject to various state legal and
regulatory restrictions, including regulatory restrictions imposed as a matter of administrative
policy, applicable generally to any insurance company in its state of domicile, that limit the
amount of dividends or distributions an insurance company may pay to its shareholders without prior
regulatory approval. The restrictions are generally based on certain levels or percentages of
surplus, investment income and net income, as determined in accordance with Statutory Accounting
Principles (“SAP”), which differ from generally accepted accounting principles (“GAAP”).
Generally, dividends may be paid only out of earned surplus. In every case, the remaining surplus
subsequent to the payment of any dividends must be reasonable in relation to an insurance company’s
outstanding liabilities and must be adequate to meet its financial needs.
Crum & Forster Holdings Corp.’s insurance principal subsidiaries are domiciled in the states of
Delaware and New Jersey. Delaware laws provide that before a Delaware-domiciled insurer may pay
any dividend, it must have given notice within five days following the declaration thereof and 10
days prior to the payment thereof to the state insurance commissioner. The commissioner may, by
order, limit or disallow the payment of ordinary dividends if he or she finds the insurer to be
presently or potentially financially distressed or troubled. Without the prior approval of the
state insurance commissioner, a Delaware-domiciled insurer may only pay cash dividends from its
earned surplus. Earned surplus is defined as that amount equal to the unassigned funds of an
insurer, as set forth in the most recent annual statement of the insurer submitted to the state
insurance commissioner, including all or part of the surplus arising from unrealized capital gains
or revaluation of assets. Additionally, a Delaware-domiciled insurer may not pay any
“extraordinary” dividend or distribution until (i) 30 days after the state insurance commissioner
has received notice of a declaration of the dividend or distribution and has not within that period
disapproved the payment, or (ii) the state insurance commissioner has approved the payment within
the 30-day period. Under the Delaware Insurance Code, an “extraordinary” dividend of a property
and casualty insurer is a dividend, the amount of which, together with all other dividends and
distributions made in the preceding 12 months, exceeds the greater of 10% of an insurer’s
policyholders’ surplus at December 31, next preceding or net income, not including realized capital
gains, for the 12-month period ending December 31, next preceding.
New Jersey laws provide that before a New Jersey domiciled insurer may pay any dividend, it must
have given notice within 5 business days following the declaration thereof and 30 days prior to the
payment thereof to the New Jersey Department of Banking and Insurance. Except for extraordinary
dividends or distributions paid with the approval of the New Jersey Department of Banking and
Insurance, dividends may be paid by insurers domiciled in New Jersey only from earned surplus,
which means “unassigned funds (surplus)” as reported on the insurer’s annual statement at December
31 next preceding, less unrealized capital gains and revaluation of assets. A New Jersey-domiciled
insurer may not pay any “extraordinary” dividend or distribution until (i) 30 days after the state
insurance commissioner has received notice of a declaration of the dividend or distribution and has
not within that period disapproved the payment, or (ii) the state insurance commissioner has
approved the payment within the 30-day period. Under the New Jersey laws, an “extraordinary”
dividend of a property and casualty insurer is a dividend, the amount of which, together with all
other dividends and distributions made in the preceding 12 months, exceeds the greater of 10% of an
insurer’s policyholders’ surplus at December 31, next preceding or net income, not including
realized capital gains, for the 12-month period ending December 31, next preceding. The
commissioner is obligated to limit or disallow the payment of any dividend or distribution if he or
she finds that the insurer’s surplus is not reasonable in relation to its outstanding liabilities
or inadequate to its financial needs, or if the insurer is found to be in a hazardous financial
condition.
If insurance regulators determine that payment of a dividend or any other payment to an affiliate
(such as payment under a tax-sharing agreement or payment for employee or other services) would,
because of the financial condition of the paying insurance company, result in such insurance
company being in a hazardous financial condition or otherwise be adverse to the interests of
policyholders or creditors, the regulators may prohibit such payments that would otherwise be
permitted without prior approval.
In addition, under the insurance holding company laws of the various states in which the Company’s
insurance subsidiaries are incorporated, transactions between such insurance subsidiaries and their
affiliates must be fair and reasonable. Such transactions generally must be disclosed to the state
insurance regulators, and notice to and prior approval (or absence of disapproval) by the
applicable state insurance regulator is required for specified kinds of transactions.
Capital Adequacy
In connection with the licensing of insurance companies, an insurance regulator may limit or
prohibit the writing of new business by an insurance company within its jurisdiction when, in the
regulator’s judgment, the insurance company is not maintaining adequate statutory surplus. Crum &
Forster does not currently anticipate that any regulator would limit the amount of new business
that its insurance subsidiaries may write given their current levels of statutory surplus.
In order to enhance the regulation of insurer solvency, the NAIC has risk-based capital (“RBC”)
requirements for property and casualty insurance companies. These RBC requirements are designed to
monitor capital adequacy and to raise the level of protection that statutory surplus provides for
policyholders. The RBC formula measures four major areas of risk facing property and casualty
insurers: asset risk, underwriting risk, credit risk and business risk. Changes in the RBC formula
on how specific underwriting risks or assets are designated for purposes of applying the formula
could have disproportionate impacts on the Company relative to other insurers and could cause the
Company to exit or reduce its writings in lines of business, or dispose of assets that management
otherwise considers to be profitable, in order to maintain what management considers to be
acceptable RBC levels.
27
Based on the standards currently adopted, at December 31, 2009, the statutory surplus of each of
Crum & Forster’s insurance subsidiaries substantially exceeded the minimum RBC requirements.
Investment Regulation
Crum & Forster’s insurance subsidiaries are subject to state laws and regulations that require
diversification of investment portfolios and that limit the amount of investments in certain
investment categories. Failure to comply with these laws and regulations may cause non-conforming
investments to be treated as non-admitted assets for purposes of measuring statutory surplus and,
in some instances, would require divestiture. Either of these could result in the Company having to
sell an asset when market conditions would not otherwise warrant a sale. In 2009, under the
Delaware Insurance Code, the Company recorded a nonadmitted charge of approximately $81.8 million,
net of tax, due to the Company exceeding Delaware’s statutory limits for investments in equity
securities.
Guaranty Funds and Shared Markets
All 50 states have separate insurance guaranty fund laws requiring property and casualty insurance
companies doing business within their respective jurisdictions to be members of their guaranty
associations. These associations are organized to pay covered claims (as defined and limited by the
various guaranty association statutes) under insurance policies issued by insolvent insurance
companies. Such guaranty association laws, except the one applicable in New York, create
post-assessment associations which make assessments against member insurers to obtain funds to pay
association covered claims after insurer insolvency occurs.
These associations levy assessments (up to prescribed limits) on all member insurers in a
particular state on the basis of the proportionate share of the premiums written by member insurers
in the covered lines of business in that state. Some states permit member insurers to recover
assessments paid through surcharges on policyholders or through full or partial premium tax
offsets, while other states permit recovery for a portion of the assessments through premium tax
offsets, policyholder surcharges and/or the rate filing process.
Crum & Forster’s insurance subsidiaries are required to participate in mandatory property and
casualty shared market mechanisms or pooling arrangements, which provide various insurance
coverages to individuals or other entities that are otherwise unable to purchase such coverage in
the commercial insurance marketplace. These arrangements are in addition to the inter-company
pooling arrangement among the Company’s subsidiaries discussed in “Corporate Structure”. The
Company’s insurance subsidiaries’ participation in such shared markets or pooling mechanisms is
generally proportionate to the amount of each of the insurance subsidiaries’ direct premiums
written for the type of coverage written by the specific pooling mechanism in the applicable state.
Insurance Regulation Concerning Change or Acquisition of Control
The insurance holding company laws and regulations in the respective domiciliary states of Crum &
Forster’s insurance subsidiaries each contain similar provisions to the effect that the acquisition
of “control” of a domestic insurer, or of any person that directly or indirectly controls a
domestic insurer, cannot be consummated without the prior approval of the domiciliary insurance
regulator. In general, a presumption of “control” arises from the direct or indirect ownership,
control and possession of the power to vote or possession of proxies with respect to 10% or more of
the voting securities of a domestic insurer, or of a person that controls a domestic insurer.
An entity or person seeking to acquire control, directly or indirectly, of a domestic insurance
company, or of any person controlling a domestic insurance company, generally must file with the
relevant insurance regulatory authority a statement relating to the acquisition of control
containing certain information required by statute and published regulations and provide a copy of
such statement to the domestic insurer and obtain the prior approval of such regulatory agency for
the acquisition. In addition, certain states where the Company’s insurance subsidiaries conduct
business require pre-acquisition notification to state agencies of a change in control of a
non-domestic insurance company admitted in that state. While such pre-acquisition notification
statutes do not authorize the state agency to disapprove the change of control, such statutes do
authorize certain remedies, including the issuance of a cease and desist order with respect to the
non-domestic admitted insurer’s doing business in the state if certain conditions exist, such as
undue market concentration.
Terrorism Risk Insurance Program Reauthorization Act of 2007 (“TRIPRA”)
The Terrorism Risk Insurance Act of 2002, which was extended through December 31, 2014 with the
passage of the Terrorism Risk Insurance Program Reauthorization Act of 2007 (collectively,
“TRIPRA”), established a Federal program that provides for a system of shared public and private
compensation for insured losses resulting from acts of terrorism. It is applicable to substantially
all commercial property and casualty lines of business but excludes commercial automobile, burglary
and theft, surety, professional liability and farm owner’s multi-peril insurance. Participation by
insurers writing applicable lines is mandatory. Insurers are required to make available coverage
for losses arising from acts of terrorism as defined by TRIPRA on terms and in amounts that may not
differ materially from other policies. In order for a loss to be covered under the program, the
loss must meet certain aggregate industry loss minimums and must be the result of an event that is
certified as an act of terrorism by the U.S. Secretary of the Treasury.
28
TRIPRA maintains the Federal government’s share of compensation for insured losses (subject to a
$100 million program trigger) at 85% of that portion of the amount of insured losses that exceed
the insurer deductible. The insurer deductible is equal to 20% of the direct earned premiums in
the preceding calendar year of the insurer for covered lines of commercial property and casualty
insurance of all affiliated insurers within the same consolidated group. Based on Fairfax’s 2008
direct premiums earned, subject to TRIPRA, of approximately $1.3 billion, the aggregate deductible
of the Fairfax group was approximately $256 million for 2009.
Employees
At December 31, 2009, Crum & Forster had 1,345 employees. None of these employees is represented
by a labor union and management considers employee relations to be satisfactory.
The risks described below are those identified by management which could cause the Company’s net
income, financial position or liquidity, as well as other information and data in this Form 10-K,
including the financial statements and accompanying notes thereto, to be materially adversely
affected. This section does not, however, describe all risks applicable to the Company, its
industry or its business and is intended only as a summary of certain material factors affecting
the Company’s business.
The Company operates in a highly competitive environment, which makes it more difficult to attract
and retain business.
The commercial property and casualty insurance industry is highly competitive as to both price and
service and management believes that it will remain so for the foreseeable future. Prevailing
conditions relating to price, coverage and capacity can change very rapidly in this industry
sector.
The Company faces competition from domestic and foreign insurers, many of which may be perceived to
provide greater security to policyholders and many of which are larger and have greater financial,
marketing and management resources than Crum & Forster. The Company also faces competition from
government-financed insurance entities that are able to provide insurance at below-market rates.
Competition in the commercial property and casualty insurance industry is based on many factors,
including overall financial strength of the insurer, ratings by rating agencies, price, policy
terms and conditions, services offered, reputation and experience.
Over the last several years, the property and casualty market has experienced an acceleration of
softening market conditions and price competition has intensified. The Company is currently
operating in a soft market characterized by intense competition and rate decreases and if these
market conditions continue, it may be difficult for the Company to grow or renew its business
without adversely affecting underwriting profits and cash flow. For additional discussion, see
“Item 1. Business — Competition”.
Results in the property and casualty insurance industry are subject to fluctuations and
uncertainty, which may adversely affect management’s ability to write policies.
The results of companies in the property and casualty insurance industry historically have been
subject to broad fluctuations. These results can be affected significantly by price competition,
volatile and unpredictable developments (including catastrophes), changes in loss reserves
resulting from changing legal environments as different types of claims arise and judicial
interpretations relating to the scope of insurers’ liability develop, fluctuations in interest
rates and other changes in the investment environment which affect returns on invested assets and
inflationary pressures that affect the size of losses. The property and casualty insurance
industry historically has experienced pricing and profitability cycles related to levels of
industry underwriting capacity. As a result of fluctuations in pricing, the Company may be unable
to obtain business that meets its underwriting standards and pricing expectations. For additional
information, see “Item 1. Business — Competition” and “Item 7. Management’s Discussion and
Analysis of Financial Condition and Results of Operations”.
Volatility in the global financial markets and current economic conditions could have a material
adverse effect on the Company’s results of operations and financial position.
Since 2007, the capital and credit markets have experienced extreme volatility and disruption which
reached unprecedented levels through the first quarter of 2009. Though worldwide financial markets
improved in the latter half of 2009, economic conditions in the U.S. and other countries around the
world continue to remain weak and if these downward economic trends and market turmoil persist, the
Company’s results of operations, financial position and or liquidity could be adversely impacted.
29
During an economic downturn, demand for the Company’s products may decrease, and credit risk
associated with its policyholders, reinsurers and the Company’s investment portfolio will increase.
The Company has been adversely affected by the financial market volatility and economic downturn.
Among other effects, the Company recorded impairment charges on its investment portfolio of $110.8
million, $194.7 million and $25.4 million in 2009, 2008 and 2007, respectively. The charges in
2009 and 2008 were significantly higher than in any of the Company’s previous historical reporting
periods. However, losses that the Company suffered on its investment portfolio were mitigated by
significant investment gains realized from substantive defensive positions that the Company held in
the financial services industries through credit default swaps, equity and equity index short
positions and total return swaps. Since 2008, the Company has significantly reduced its credit
default swap portfolio and equity hedging positions and therefore the effects that these securities
as hedging instruments may be expected to have on the Company’s future results of operations and
financial position may be expected to diminish significantly relative to the effects in recent
years. Continuing volatility in the financial markets could result in reduced investment income and
higher realized and unrealized investment losses, which could have a material adverse effect on the
Company’s results of operations and financial position.
The Company expects the property and casualty market to remain competitive in 2010, particularly
for new business, which will adversely affect underwriting profitability. In addition, in an
economic downturn, competitors that are in financial difficulties may offer products at prices that
are lower than the Company’s and with terms that are considerably less restrictive than the
Company’s, making it difficult for the Company to retain existing business or write new business at
adequate rates. In addition, certain actions the U.S. government has taken or may take to
stabilize the financial markets and stimulate the economy could affect the property and casualty
industry and its competitive environment.
Although the Company does not anticipate needing additional capital in the near term, continued
financial market volatility and economic conditions may affect the Company’s ability to borrow on
acceptable terms in the future. If the Company cannot obtain adequate capital on favorable terms
or at all, its business, results of operations and financial position could be adversely affected.
The Company may incur a reduction in its net income if its reserves are insufficient.
Crum & Forster maintains reserves to cover its estimated ultimate liability for losses and LAE with
respect to reported and unreported claims incurred as of the end of each year. Its gross loss and
LAE reserves were $2.7 billion and $3.0 billion at December 31, 2009 and 2008, respectively. These
reserves do not represent an exact measurement of liability, but are estimates based upon various
factors, including: (i) actuarial projections of the cost of the ultimate settlement and
administration of claims reflecting facts and circumstances then known; (ii) estimates of future
trends in claims severity and frequency; (iii) assessment of asserted theories of liability; and
(iv) analysis of other factors, such as variables in claims handling procedures, economic factors,
including inflation, and judicial and legislative trends and actions. Most, if not all, of these
factors are not directly or precisely quantifiable, particularly on a prospective basis. In many
cases, estimates of liability for losses and LAE are made more difficult by significant reporting
lags between the occurrence of the insured event and the time it is actually reported to the
insurer, and additional lags between the time of reporting and final settlement of claims.
Variations between loss reserve estimates and the actual emergence of losses can be material. The
Company recorded $(25.0) million, $39.0 million and $(50.2) million of prior period (favorable)
adverse loss development before corporate aggregate reinsurance for the years 2009, 2008 and 2007,
respectively. Prior period (favorable) adverse loss development after corporate aggregate
reinsurance was $(39.9) million, $20.1 million and $(63.9) million for the years 2009, 2008 and
2007, respectively. For further discussion of the Company’s reserves, see “Item 7. Management’s
Discussion and Analysis of Financial Condition and Results of Operations — Results of Operations —
Losses and Loss Adjustment Expenses”.
Under GAAP, the Company is only permitted to establish loss and LAE reserves for losses that have
occurred on or before the financial statement date. Case reserves and reserves for IBNR
contemplate these obligations. No contingency reserves are established to account for future loss
occurrences. Losses arising from future events will be estimated and recognized at the time the
losses are incurred and could be substantial.
To the extent reserves prove to be deficient in the future, management will have to increase the
Company’s reserves by the amount of such deficiency and incur a charge to earnings in the period
such reserves are increased. The uncertainties regarding the reserves (including reserves for
asbestos, environmental and other latent claims) could result in a liability exceeding the reserves
by an amount that would be material to the Company’s net income, financial position or liquidity in
a future period, and such a liability would reduce future cash flows and the ability of its
insurance subsidiaries to pay dividends or make other distributions to the Company.
Even though most insurance policies have policy limits, the nature of property and casualty
insurance is such that losses can exceed policy limits for a variety of reasons and could very
significantly exceed the premiums received on the underlying policies. The Company attempts to
limit its risk of loss through reinsurance, the availability and cost of which is subject to market
conditions and beyond the Company’s control.
30
Reserves for asbestos, environmental and other latent claims may be insufficient.
There are significant additional uncertainties in estimating the amount of reserves required for
asbestos, environmental and other latent claims. The possibility that these claims would emerge
was often not anticipated at the time the policies were written, and traditional actuarial
reserving methodologies have not been generally useful in accurately estimating ultimate losses and
LAE for these types of claims. In addition, the loss settlement period of certain of these claims
may extend for decades after the expiration of the policy period, and during such time it often
becomes necessary to adjust, sometimes to a significant degree, the estimates of liability on a
claim either upward or downward. Gross asbestos reserves were $344.1 million, $387.2 million and
$428.1 million at December 31, 2009, 2008 and 2007, respectively; gross environmental reserves were
$93.3 million, $108.0 million and $117.8 million, respectively; and gross reserves for other latent
claims were $21.5 million, $28.2 million and $34.2 million, respectively. Asbestos reserves, net
of reinsurance, were $269.4 million, $301.9 million and $333.6 million, at December 31, 2009, 2008
and 2007, respectively; environmental reserves, net of reinsurance, were $70.8 million, $79.0
million and $85.0 million, respectively; and reserves for other latent claims, net of reinsurance,
were $16.1 million, $20.3 million and $24.1 million, respectively. Reserves ceded to corporate
aggregate reinsurance contracts are not reflected in the foregoing amounts.
Among the uncertainties relating to such reserves are a lack of historical data, long reporting
delays and complex, unresolved legal issues regarding policy coverage and the extent and timing of
any such contractual liability. Courts have reached different, and frequently inconsistent,
conclusions as to when losses occurred, what claims are covered, under what circumstances the
insurer has an obligation to defend, how policy limits are determined and how policy exclusions are
applied and interpreted. Plaintiffs often are able to choose from a number of potential venues to
bring an action in the court that they expect will be most advantageous to their claims. Because of
these uncertainties, the Company’s exposure to asbestos, environmental and other latent claims is
more difficult to estimate and is subject to a higher degree of variability than is its exposure to
non-latent claims. Bankruptcy filings by various defendants in the asbestos arena continue to
result in larger claim values to be paid by the remaining solvent defendants, including certain
Crum & Forster policyholders. In addition to increasing the claim severity, bankruptcy proceedings
may significantly accelerate the timing and amount of loss payments by insurers, including Crum &
Forster.
Increasingly, policyholders have asserted that their claims for asbestos-related insurance are not
subject to aggregate limits on coverage and that each individual bodily injury claim should be
treated as a separate occurrence under the policy. The Company expects that this trend will
continue. Although it is difficult to predict whether these policyholders will be successful on
the issue, to the extent the issue is resolved in their favor, Crum & Forster’s coverage
obligations under the policies at issue could be materially increased and bounded only by the
applicable per-occurrence limits and the number of asbestos bodily injury claims of the
policyholders. Accordingly, it is difficult to predict the ultimate size of the claims for
coverage not subject to aggregate limits. Another potentially negative trend is an apparent
increase in the filing of natural resource damage suits by a number of states and Native American
tribes seeking to recover funds for damages to natural resources, such as fishing rights and
wildlife depletion. This is a relatively new occurrence, so ultimate costs associated with this
new latent litigation remain uncertain.
In 2009, 2008 and 2007, the Company incurred total latent losses and ALAE of $6.7 million, $36.2
million and $54.5 million, respectively. The increase in each year was based on the Company’s
internal actuarial review. The increase in 2009 is net of an insurance recovery of $13.8 million
associated with an asbestos lawsuit which the Company had settled in 2008. Excluding this receipt,
the increase of $20.5 million was primarily due to developments related to one policyholder. In
2008, the increase was primarily due to the settlement of the aforementioned lawsuit. In 2007,
$24.3 million of the increase was in asbestos reserves, $22.2 million was in environmental reserves
and $8.0 million was in other latent reserves. The strengthening of asbestos reserves was partly
due to developments related to the lawsuit. The strengthening of environmental reserves was due to
a newly reported large claim, identification of additional policies associated with existing
policyholders, and a slight increase in the number of sites for policyholders with previously
reported claims.
Due to the inherent uncertainties described above, the Company’s ultimate liability for its
asbestos, environmental and other latent claims may vary substantially from the amounts currently
recorded. For further discussion of the Company’s asbestos, environmental and other latent
reserves, see “Item 7. Management’s Discussion and Analysis of Financial Condition and Results of
Operations — Results of Operations — Losses and Loss Adjustment Expenses”.
Catastrophic events could cause unanticipated losses and reduce net income.
Catastrophes can be caused by various natural and man-made events. Natural catastrophic events
include hurricanes, earthquakes, tornados, windstorms, hailstorms, explosions, severe winter
weather and fires. Man-made catastrophic events include terrorist acts, riots, crashes and
derailments. The incidence and severity of catastrophes are inherently unpredictable.
31
The extent of losses from a catastrophe is a function of both the total amount of insured exposure
in the area affected by the event and the severity of the event. Most catastrophes are restricted
to small geographic areas; however, hurricanes, earthquakes and windstorms may produce significant
damage in large, heavily populated areas. Catastrophes can cause losses in a variety of property
and casualty coverages and lines of business for which the Company provides insurance. Seasonal
weather variations may affect the severity and frequency of losses. Insurance companies are not
permitted to reserve for a catastrophe until it has occurred, and actual losses could exceed
measures the Company might take to attempt to protect itself. It is therefore possible that a
catastrophic event or multiple catastrophic events could adversely affect the Company’s net income,
financial position or liquidity. Increases in the value and geographic concentration of insured
property and the effects of inflation could increase the severity of claims from future
catastrophic events. In addition, states have from time to time passed legislation that has had
the effect of limiting the ability of insurers to manage catastrophic risk, such as legislation
prohibiting insurers from withdrawing from catastrophe-prone areas.
In response to the tightening of supply in certain insurance and reinsurance markets resulting
from, among other things, the September 11, 2001 terrorist attacks, the United States Congress
established a federal terrorism insurance program pursuant to the Terrorism Risk Insurance Act of
2002, which was extended through December 31, 2014 with the passage of the Terrorism Risk Insurance
Program Reauthorization Act of 2007 (collectively, “TRIPRA”). The program requires insurers to
offer terrorism coverage and the federal government to share in insured losses arising from acts of
terrorism in the United States. While the provisions of TRIPRA somewhat mitigate the Company’s
exposure in the event of a large-scale terrorist attack, the Company could incur a substantial loss
of up to the aggregate deductible of participating Fairfax insurers, which was approximately $256
million in 2009 based on 20% of Fairfax’s 2008 direct premiums earned, subject to TRIPRA, of
approximately $1.3 billion.
The Company’s estimates of catastrophe losses are subject to a high level of uncertainty arising
out of complex and unique causation and coverage issues, including the appropriate attribution of
losses to flood as opposed to other perils such as wind, fire or riot and civil commotion.
Causation and coverage issues may not be resolved for a considerable period of time and may be
influenced by evolving legal and regulatory developments. During 2009, 2008 and 2007, the
Company’s underwriting results were adversely affected by net catastrophe losses of $11.6 million,
$90.9 million and $15.0 million. In 2008 the majority of the catastrophe losses were attributable
to Hurricanes Gustav and Ike.
The Company’s actual losses from hurricanes may vary materially from estimates as a result of,
among other things, the receipt of additional information from policyholders, increases in ground
up losses causing the losses to reach the Company’s attachment point in the case of excess
policies, the attribution of losses to coverages that for the purpose of estimates the Company
assumed would not be exposed, the contingent nature of business interruption exposures, and
inflation in repair costs due to the limited availability of labor and materials, in which case the
Company’s financial results could be further materially adversely affected. In addition, actual
losses may increase if the Company’s reinsurers fail to meet their obligations.
If the Company is unable to realize its investment objectives, its net income and financial
condition may be adversely affected.
Investment returns are an important part of the Company’s overall profitability and its operating
results depend in part on the performance of its investment portfolio and the ability to achieve
its investment objectives. Accordingly, fluctuations in the fixed income and equity markets could
have a material adverse effect on the Company’s net income, financial position or cash flows. The
Company derives its investment income primarily from interest and dividends, together with realized
gains or losses arising primarily from the sales of investments and the mark-to-market adjustments
to derivatives, held-for-trading securities and other invested assets recorded at fair value.
Realized investment gains are typically a less predictable source of income than interest and
dividends, particularly in the short term. For the years ended December 31, 2009, 2008 and 2007,
net realized investment gains accounted for 47.8%, 88.0% and 62.0%, respectively, of total
investment earnings. The Company also invests in derivative securities which may be subject to
significant mark-to-market adjustments from period to period as a result of changes in fair value.
Valuations of these securities may subject the Company’s income statement and balance sheet to
significant volatility.
In 2009, 2008 and 2007, the Company reported investment income, including realized investment gains
and pre-tax equity in earnings of investees, of $313.8 million, $603.5 million and $413.3 million,
respectively. Included in these amounts are net (losses) gains of $(31.8) million, $713.4 million
and $246.7 million, respectively, attributable to changes in fair value of derivatives and
short-sale transactions. By the end of 2008, the Company had significantly reduced its credit
default swap portfolio through closing transactions and closed out its equity hedge positions,
realizing substantial gains in doing so. As such, the effects that credit default swaps as hedging
instruments may be expected to have on the Company’s future financial position, liquidity and
results of operations has diminished significantly relative to the effects in recent years. In the
fourth quarter of 2008, the Company reinvested a significant portion of the proceeds realized from
closing transactions of its derivative securities and short-sale positions in equity securities and
as a result, the Company’s investment portfolio is exposed to a significantly larger degree than in
prior periods, to volatility in the equity markets. Equity securities have historically produced
higher returns than fixed income securities; however, investing in equity securities may result in
significant variations in investment returns from one period to another and if market volatility
persists, the Company could experience declines in the fair value of its equity portfolio which
could have a material adverse effect on the Company’s financial position and shareholder’s equity.
In 2009, 2008 and 2007, the Company recorded other than temporary impairment charges of $110.8
million, $194.7 million and $25.4 million, respectively, primarily related to write downs of equity
securities.
32
The ability of the Company to achieve its investment objectives is affected by general economic
conditions that are beyond management’s control. General economic conditions can adversely affect
the markets for interest rate sensitive securities, including the extent and timing of investor
participation in such markets, the level and volatility of interest rates and, consequently, the
value of fixed income securities. Interest rates are highly sensitive to many factors, including
governmental monetary policies, domestic and international economic and political conditions and
other factors beyond the Company’s control. General economic conditions, stock market conditions
and many other factors can also adversely affect the equities markets and, consequently, the value
of the equity securities the Company owns. In addition, defaults by issuers and counterparties who
fail to pay or perform on their obligations could reduce investment income and realized investment
gains, or result in investment losses. The Company may not be able to realize its investment
objectives, which could significantly reduce net income and adversely affect the Company’s results
of operations or financial condition.
The Company may be unable to obtain reinsurance coverage at reasonable prices or on terms that
adequately protect it.
The Company uses reinsurance to help manage its exposure to insurance risks. The availability and
cost of reinsurance are subject to prevailing market conditions, both in terms of price and
available capacity, which can affect business volume and profitability. The availability of
reinsurance capacity can be affected by general economic conditions and conditions in the
reinsurance market, such as the occurrence of significant reinsured events. In addition, many
reinsurance companies continue to exclude certain coverages from, or alter terms in, the policies
that Crum & Forster purchases from them. Some exclusions are with respect to risks that cannot be
excluded in policies the Company writes due to business or regulatory constraints, such as coverage
with respect to acts of terrorism, mold and cyber risk. In addition, reinsurers are imposing
terms, such as lower per occurrence and aggregate limits and limited reinstatements, on primary
insurers that are inconsistent with corresponding terms in the policies written by these primary
insurers. As a result, Crum & Forster, like other primary insurance companies, is writing
insurance policies that, to some extent, do not have the benefit of reinsurance protection. These
gaps in reinsurance protection expose the Company to greater risk and greater potential losses.
Because of the risks set forth above, no assurances can be made that reinsurance will remain
continuously available in amounts that the Company considers to be sufficient and at acceptable
prices. The unavailability of such reinsurance would cause the Company to increase the amount of
risk retained with regard to business underwritten. This in turn, could have a material adverse
effect on the Company’s results of operations and financial position.
The Company bears credit risk with respect to its reinsurers and certain policyholders, and if one
or more of them fails to pay, the Company could experience losses, which would reduce its net
income.
Although reinsurance obligates the assuming reinsurer to the extent of the risk ceded, the Company
is not relieved of its primary liability to its policyholders as the direct insurer. As a result,
it bears credit risk with regard to its reinsurers with respect to both receivable balances
reflected on the balance sheet and contingent liabilities arising from reinsurance protection on
future claims. The Company cannot be assured that its reinsurers will pay all reinsurance claims
on a timely basis or at all. At December 31, 2009, the Company had reinsurance recoverable of
$892.7 million due from approximately 265 reinsurers, including approximately $141.0 million,
representing the net present value of amounts from insurance companies from which the Company has
purchased structured settlement annuities to settle certain claim liabilities; however, the
preponderance of this reinsurance recoverable was with relatively few reinsurers. The two largest
gross reinsurance recoverable balances aggregated $478.4 million, or approximately 53.6% of the
total reinsurance recoverable balance, against which the Company held collateral of $306.1 million.
The reinsurer with the largest gross recoverable balance (an unaffiliated company rated A by A.M.
Best Company) provided collateral in an amount of $236.3 million, which reduces its unsecured
exposure to $112.7 million. The collateral provided is in the form of a funds held balance in the
Company’s general account and equal premiums plus interest thereon credited at the rate stipulated
in the related reinsurance contract. There is no limitation on the ability of the Company to
access these funds in accordance with the related reinsurance agreement. Periodically, the Company
has contractual disputes with reinsurers regarding coverage under reinsurance policies.
Historically, this has principally occurred in the interpretation of coverage relating to asbestos
and environmental claims. Each reinsurance claim is evaluated based on the facts of the case,
historical experience with the reinsurer on similar claims and existing case law, and any disputed
amounts are considered in the reserve for uncollectible reinsurance. If reinsurers are unwilling
or unable to pay amounts due under reinsurance contracts, or to pay such amounts on a timely basis,
the Company will incur unexpected losses and cash flow will be adversely affected. For the years
ended December 31, 2009, 2008 and 2007, the Company incurred charges for uncollectible reinsurance
of $2.0 million, $7.7 million and $8.0 million, respectively. For additional discussion of credit
risk with regard to the Company’s reinsurers, see “Item 1. Business — Reinsurance”.
33
The Company writes certain large deductible policies (policies where the policyholder retains a
specific amount of any potential loss) and retrospectively rated policies (policies in which
premiums are adjusted based on the actual loss experience of the policyholder during the policy
period) in which the policyholder must reimburse the Company for certain losses. The Company had
aggregate recoverables, net of reserves for uncollectible deductibles, on such policies of $160.4
million and $168.8 million at December 31, 2009 and 2008, respectively. Accordingly, the Company
bears credit risk on these policies and cannot be assured that its policyholders will pay on a
timely basis or at all. However, the majority of these aggregate recoverables are secured by
collateral, primarily in the form of letters of credit.
In the ordinary course of business, the Company is sometimes unable to collect all amounts billed
to policyholders, generally due to disputes on audit and retrospectively rated policies and, in
some cases, due to policyholders having filed for bankruptcy protection. In addition, if a
policyholder files for bankruptcy, the Company may be unable to recover on assets such policyholder
may have pledged as collateral. The Company reserves for uncollectible premiums and policyholder
loss recoveries in the period in which the collection issues become known. The inability to
collect amounts due reduces net income and cash flows. During 2009, 2008 and 2007, the Company
incurred, or expected to incur, credit losses relating to policyholder insolvencies, disputed
premium audits and for policyholders experiencing financial difficulties. For the years ended
December 31, 2009, 2008 and 2007, (credits) charges incurred for uncollectible premiums and
policyholder recoveries were $(1.0) million, $(4.3) million and $3.0 million, respectively.
The Company also has certain policies with respect to which other insurance companies have assumed
liability from the Company (“novated policies”). Although novation of an insurance policy attempts
to effect the legal substitution of one insurance company for the original policy-issuing company
and generally requires either the express or implied consent of the policyholder, if the novation
process is challenged and not upheld (especially as to novation achieved by “implied” consent),
Crum & Forster’s insurance subsidiaries could be responsible for such novated business if the other
party were to become insolvent. Any potential liabilities that may exist due to novated policies
are not reflected on the consolidated balance sheets and the Company’s reinsurance recoverable
could be understated and the credit risk associated with these novated policies could also be
materially understated. To date, the Company has not experienced any challenges of novations of
these policies, which occurred principally in 1993.
To a large degree, the credit risk faced by the Company is a function of the economy and,
accordingly, in an economic downturn, the risk is greater. While the Company attempts to mitigate
these risks through underwriting and internal guidelines and collateral requirements, its efforts
may be unsuccessful. For example, collateral obtained may subsequently have little or no value and
as such the Company’s exposure to credit risk associated with its reinsurers and certain
policyholders, could adversely affect its results of operations or financial position.
The Company is a holding company and is dependent on dividends from its insurance subsidiaries to
pay its obligations, including interest and principal on its debt securities.
The Company is a holding company with no direct operations, and its principal asset is the capital
stock of several insurance subsidiaries. See “Item 15. Exhibits and Financial Statement Schedules
¾ Schedule II, Holding Company Condensed Financial Statements”. The Company relies,
and expects to rely in the future, on dividends from these insurance subsidiaries to meet its
obligations, including payment of interest on its debt securities, and, together with refinancing
opportunities then available in capital markets, if any, to repay its debt securities at maturity.
The Company’s principal insurance subsidiaries, US Fire and North River, account for 98.9% of
combined statutory surplus at December 31, 2009. US Fire and North River may pay dividends of
$105.5 million and $55.5 million in 2010, without prior regulatory approval.
The ability of the Company’s insurance subsidiaries to pay dividends depends on their statutory
earned surplus (which is increased by underwriting profit and investment income and decreased by
underwriting losses, including losses as a result of prior period adverse development and
investment impairments), net income, investment income and realized capital gains and other
regulatory restrictions, as well as any effects such dividends may have on the Company’s ratings.
State insurance commissioners have broad regulatory authority and may issue an order disallowing or
limiting the payment of dividends by an insurer if the commissioner determines that the insurer is
presently or potentially financially distressed or troubled. For further information on the
regulation of dividends, see “Item 1. Business ¾ Insurance Regulatory Matters”. Because
payment of dividends by the Company’s insurance subsidiaries would decrease their statutory
surplus, doing so would also adversely affect their ability to meet financial ratios and other
tests critical to maintaining their financial strength ratings and otherwise providing acceptable
security to brokers and to policyholders. Their ability to pay dividends and, therefore, the
Company’s ability to meet its obligations, is limited by these and other factors.
34
A downgrade in the financial strength ratings of the Company’s insurance subsidiaries, especially
in the ratings issued by A.M. Best, could make it difficult for the Company to write quality new
or renewal business, secure adequate reinsurance on acceptable terms and retain its key management
and employees.
The financial strength ratings assigned by third party rating agencies to insurance companies
represent independent opinions of an insurer’s financial strength and its ability to meet ongoing
obligations to policyholders, and are not directed toward the protection of investors. Ratings by
rating agencies of insurance companies are not ratings of securities or recommendations to buy,
hold or sell any security. Financial strength ratings are used by insurance consumers and
insurance intermediaries as an important means of assessing the financial strength and quality of
insurers. Higher ratings generally indicate relative financial stability and a strong ability to
pay claims. Ratings focus on the following factors: capital resources, financial strength,
demonstrated management expertise in the insurance business, credit analysis, systems development,
marketing, investment operations, minimum policyholders’ surplus requirements and capital
sufficiency to meet projected growth, as well as access to such traditional capital as may be
necessary to continue to meet standards for capital adequacy. Crum & Forster’s insurance
subsidiaries have an “A” financial strength rating (the third highest of fifteen rating categories)
with a stable outlook from A.M. Best, an “A-” financial strength rating (the third highest of nine
major rating categories) with a stable outlook from S&P’s Insurance Rating Services and a “Baa2”
financial strength rating from Moody’s (the fourth highest of nine major rating categories) with a
stable outlook.
There can be no assurance that the Company’s ratings will continue for any given period of time or
that they will not be changed. A downgrade or withdrawal of any rating could severely limit or
prevent the Company from writing quality new or renewal business, securing adequate reinsurance on
acceptable terms and retaining its key management and employees. The Company’s ratings by these
rating agencies are based on a variety of factors, many of which are outside of its control,
including the financial condition of Fairfax and Fairfax’s other subsidiaries and affiliates, the
financial condition or actions of parties from which the Company has obtained reinsurance, factors
relating to the sectors in which the Company or its reinsurers conduct business and the statutory
surplus of its insurance subsidiaries, which is adversely affected by underwriting losses and
dividends paid by them to Crum & Forster. A downgrade of any of the debt or other ratings of
Fairfax, or any of Fairfax’s subsidiaries or affiliates, or deterioration in the financial markets’
view of any of these entities, could have a negative impact on the Company’s ratings.
The loss of any of the Company’s key producers could have an adverse effect on the Company’s
ability to generate business.
The Company relies on a large number of wholesale brokers, independent regional retail firms,
national brokers and managing general underwriters to distribute its insurance products.
Accordingly, the Company’s business is dependent on the willingness of these producers to recommend
its products to their customers. The Company may not be successful in maintaining its current
relationships with its key producers, and the loss or deterioration of one or more of these
relationships could adversely affect the Company’s ability to generate business, which in turn,
could have a material adverse effect on results of operations or financial position.
Certain business practices of the insurance industry have become the subject of investigations by
government authorities and other parties and the subject of class action litigation.
In recent years, the insurance industry has experienced substantial volatility as a result of
current investigations, litigation and regulatory activity by various insurance, governmental and
enforcement authorities concerning certain practices within the insurance industry. These
practices include the payment of contingent commissions by insurance companies to insurance brokers
and agents and the extent of disclosure thereof, the solicitation and provision of fictitious or
inflated quotes, the alleged illegal tying of the placement of insurance business to the purchase
of reinsurance, and the sale and purchase of finite reinsurance or other non-traditional or loss
mitigation insurance products and the accounting treatment for those products. The Company has
received and may continue to receive in the future inquiries and informational requests from
insurance departments in several states in which its insurance subsidiaries operate, as discussed
below. The Company cannot predict at this time the effect that current investigations, litigation
and regulatory activity will have on the insurance industry or its business. Given its position in
the insurance industry, it is possible that the Company will become involved in these
investigations and have lawsuits filed against it, in addition to the lawsuit described below. The
Company’s involvement in any investigations and lawsuits would cause it to incur legal costs and,
if the Company were found to have violated any laws, it could be required to pay fines and damages,
perhaps in material amounts. In addition, the Company could be materially adversely affected by
the negative publicity for the insurance industry related to these proceedings, and by any new
industry-wide regulations or practices that may result from these proceedings. It is possible that
these investigations or related regulatory developments will mandate changes in industry practices
in a fashion that increases the Company’s costs of doing business or requires the Company to alter
aspects of the manner in which it conducts business.
35
Crum & Forster Holdings Corp. and US Fire, among numerous other insurance company and insurance
broker defendants, have been named as defendants in a class action suit filed by policyholders
alleging, among other things, that the defendants used the contingent commission structure to
deprive policyholders of free competition in the market for insurance. The action was filed in the
U.S. District Court for the District of New Jersey. Plaintiffs seek certification of a nationwide
class consisting of all persons who between August 26, 1994 and the date of the class certification
engaged the services of any one of the broker defendants and who entered into or renewed a contract
of insurance with one of the insurer defendants. The trial court dismissed the federal antitrust
claims and RICO claims with prejudice and declined to accept supplemental jurisdiction over
plaintiffs’ state law claims. On October 24, 2007, plaintiffs filed an appeal with the U.S. Court
of Appeal for the Third Circuit. The court heard oral arguments on April 21, 2009 in Philadelphia,
Pennsylvania. The court took the matter under submission and has not yet issued a ruling. Crum &
Forster Holdings Corp. and US Fire continue to be named as defendants and intend to vigorously
defend the action.
The effects of emerging claim and coverage issues on the Company’s business are uncertain.
As industry practices and legal, judicial, social and other environmental conditions change,
unexpected and unintended issues related to claims and coverage may emerge. These issues may harm
the Company’s business by either extending coverage beyond its underwriting intent or by increasing
the number or size of claims. Examples of contemporary claims and coverage issues that have
affected the Company are claims relating to construction defects, welding fumes, natural resource
damages, mold, lead and diet drugs. More recently, claims relating to “Chinese Drywall” have
emerged. Chinese drywall refers to wallboard or sheetrock imported from China starting in
approximately 2001 that, when exposed to heat or moisture, allegedly offgasses odorous fumes that
purportedly cause corrosion to copper and other metals. Some plaintiffs also allege bodily injury
associated with inhalation of the fumes. Multiple lawsuits have been filed in numerous states,
primarily in the southeast, including multiple class actions against manufacturers, distributors,
suppliers and contractors. At least 265 of these actions have been centralized in the Eastern
District of Louisiana. Less than a dozen of the Company’s policyholders have provided notice of
Chinese drywall claims. The majority of the policyholders that have provided notice are
contractors, and most of those policyholders have provided notice of multiple claims. Louisiana is
a direct action state, and in late 2009, the Company was named as a defendant in five lawsuits.
These claim types present complex coverage and damage valuation questions and may not come into
effect until sometime after their occurrence, making it difficult for management to estimate the
Company’s ultimate liability. The effects of these and other unforeseen emerging claim and
coverage issues are extremely hard to predict and could affect Crum & Forster’s business.
The Company’s debt securities are effectively subordinate to all of the obligations of the
Company’s insurance subsidiaries, including all of the Company’s liabilities with respect to
insurance policies that the Company has written or will write in the future.
None of the Company’s subsidiaries is a guarantor of the Company’s debt securities. Additionally,
the indenture governing the Company’s debt securities does not require subsidiaries the Company
acquires in the future to guarantee its debt securities. These subsidiaries will have no
obligation, contingent or otherwise, to pay any amounts due pursuant to the Company’s debt
securities or to make any funds available therefor, whether by dividends, loans, distributions or
other payments. Any right that the Company has to receive any assets of any of its subsidiaries
upon the liquidation or reorganization of any such subsidiary, and the consequent right of holders
of the Company’s debt securities to realize proceeds from the sale of such assets, will be
effectively subordinated to the claims of these subsidiaries’ creditors and to coverage claims
under insurance policies written by these subsidiaries. In addition, the Company’s debt has no
covenants related to the adequacy of statutory capital or any other measure of the Company’s
financial position.
Control of the Company’s corporate actions is retained by Fairfax, which may have interests that
are different from the interests of holders of the Company’s debt securities.
Because of its beneficial ownership of Crum & Forster, Fairfax is in a position to determine the
outcome of corporate actions requiring stockholder approval, subject to insurance and other
regulatory approvals or non-disapprovals, as applicable, including:
| |
• |
|
electing members of the Company’s board of directors and appointment of members of the
audit committee; |
| |
| |
• |
|
adopting amendments to the Company’s charter documents; |
| |
| |
• |
|
approving a merger or consolidation, liquidation or sale, of all, or substantially all,
of the Company’s assets; |
| |
| |
• |
|
approving transactions that would result in a change of control; |
| |
| |
• |
|
funding its or its affiliates’ requirements or losses by causing the Company to
distribute additional amounts to it, whether by requiring the Company to incur additional
indebtedness or otherwise engage in financial or other reinsurance, investment, tax sharing
or other transactions with Fairfax or its affiliates; and |
| |
| |
• |
|
entering into transactions with Fairfax or its affiliates. |
36
Because Fairfax’s interests as a stockholder may conflict with the interests of the holders of
Crum & Forster’s debt securities, Fairfax may cause the Company to take actions that favor its
stockholder at the expense of the holders of the Company’s debt securities.
Fairfax has the ability to cause the Company to pay dividends to it and to cause the Company to
incur additional indebtedness, subject to applicable law. Any amounts paid by the Company to
Fairfax in respect of dividends will not be available to make payments on the Company’s debt
securities. In addition, Fairfax has in the past provided the Company, and continues to provide
the Company, with certain services. All of the Company’s directors are also directors or officers
of Fairfax and certain of its affiliates. Conflicts of interest could arise between the Company
and Fairfax or one of its affiliates or subsidiaries, and any conflict of interest may be resolved
in a manner that does not favor the Company.
The Company is subject to extensive government regulation, which may limit the rates it can charge
or otherwise adversely affect its business.
The Company is subject to extensive regulation and supervision in the states in which it does
business. Regulators oversee matters relating to rate setting with respect to certain lines of
insurance, trade practices, market conduct, policy forms, claims practices, mandated participation
in shared markets, types and amounts of investments, reserve adequacy, insurer solvency, minimum
amounts of capital and surplus, authorized lines of business, transactions with related parties,
the payment of dividends and a variety of other financial and non-financial components of an
insurance company’s business. Regulators may limit the rates that an insurance company can charge
for certain lines of business so that premium rates may not keep pace with inflation. State
insurance laws and regulations are administered by agencies that have broad powers and are
concerned primarily with the protection of policyholders rather than stockholders or other
investors. It is possible that future regulatory changes or developments would impede rate
increases or other actions that the Company proposes to take to enhance its operating results, or
fundamentally change the business environment in which it operates.
The Company’s insurance subsidiaries typically are required to participate in mandatory property
and casualty shared market mechanisms or pooling arrangements that provide various insurance
coverages to individuals or other entities that are otherwise unable to purchase such coverages in
the commercial insurance marketplace. The amount of future losses or assessments from such shared
market mechanisms and pooling arrangements cannot be predicted with certainty. The underwriting
results of these pools historically have been unprofitable. Future losses or assessments from such
mechanisms and pooling arrangements could adversely affect the Company’s net income, financial
position or liquidity.
In recent years, the insurance regulatory framework has come under increased federal scrutiny and
certain federal and state legislatures have considered or enacted laws that altered and, in many
cases, increased the regulation of insurance companies and insurance holding companies, such as
TRIPRA and state guaranty funds. Further, the NAIC and state insurance regulators are re-examining
existing laws and regulations, specifically focusing on investment practices, RBC guidelines,
interpretations of existing laws and the development of new laws. In addition, several committees
of Congress have made inquiries and conducted hearings as part of a broad study of the regulation
of insurance companies. Although the federal government currently does not regulate the business
of insurance directly, federal initiatives often affect the insurance industry in a variety of
ways. Future legislation, or NAIC initiatives, may have a detrimental effect on the conduct of the
Company’s business. For further discussion, see “Item 1. Business—Insurance Regulatory Matters”.
|
|
|
| ITEM 1B. |
|
UNRESOLVED STAFF COMMENTS |
None.
Crum & Forster’s principal offices are located in space leased by the Company in Morristown, New
Jersey. The lease covers approximately 201,887 square feet of office space at 305 Madison Avenue.
The term of the lease ends December 31, 2022, and provides for up to four consecutive additional
terms totaling twenty-five years. The principal offices of Seneca are located in space leased by
Seneca in New York, New York. The lease covers approximately 21,500 square feet at 160 Water
Street. The term of the lease ends June 30, 2010. The Company also leases office space for its
field offices. Crum & Forster does not own any of the real estate used for its operations.
37
|
|
|
| ITEM 3. |
|
LEGAL PROCEEDINGS |
Litigation
Crum & Forster Holdings Corp. and US Fire, among numerous other insurance company and insurance
broker defendants, have been named as defendants in a class action suit filed by policyholders
alleging, among other things, that the defendants used the contingent commission structure to
deprive policyholders of free competition in the market for insurance. The action was filed in the
U.S. District Court for the District of New Jersey. Plaintiffs seek certification of a nationwide
class consisting of all persons who between August 26, 1994 and the date of the class certification
engaged the services of any one of the broker defendants and who entered into or renewed a contract
of insurance with one of the insurer defendants. The trial court dismissed the federal antitrust
claims and RICO claims with prejudice and declined to accept supplemental jurisdiction over
plaintiffs’ state law claims. On October 24, 2007, plaintiffs filed an appeal with the U.S. Court
of Appeal for the Third Circuit. The court heard oral arguments on April 21, 2009 in Philadelphia,
Pennsylvania. The court took the matter under submission and has not yet issued a ruling. Crum &
Forster Holdings Corp. and US Fire continue to be named as defendants and intend to vigorously
defend the action.
In the ordinary course of their business, Crum & Forster’s subsidiaries receive claims asserting
alleged injuries and damages from asbestos and other hazardous waste and toxic substances and are
subject to related coverage litigation. The conditions surrounding the final resolution of these
claims and the related litigation continue to change. Currently, it is not possible to predict
judicial and legislative changes and their impact on the future development of asbestos and
environmental claims and litigation. This trend will be affected by future court decisions and
interpretations, as well as changes in applicable legislation. As a result of these
uncertainties, additional liabilities may arise for amounts in excess of current reserves for
asbestos, environmental and other latent exposures. These additional amounts, or a range of these
additional amounts, cannot currently be reasonably estimated. As a result of these claims,
management continually reviews required reserves and related reinsurance recoverable. In each of
these areas of exposure, the Company litigates individual cases when appropriate and endeavors to
settle other claims on favorable terms.
The Company’s subsidiaries are involved in various lawsuits and arbitration proceedings arising in
the ordinary course of business. While the outcome of such matters cannot be predicted with
certainty, in the opinion of management, no such matter is likely to have a material adverse effect
on the Company’s consolidated net income, financial position or liquidity. However, it should be
noted that the frequency of large damage awards in some jurisdictions, including punitive damage
awards that bear little or no relation to actual economic damages incurred by plaintiffs, continues
to create the potential for an unpredictable judgment in any given matter.
|
|
|
| ITEM 4. |
|
SUBMISSION OF MATTERS TO A VOTE OF SECURITY HOLDERS |
Omitted pursuant to General Instruction I(2)(c) to Form 10-K.
PART II
|
|
|
| ITEM 5. |
|
MARKET FOR REGISTRANT’S COMMON EQUITY, RELATED STOCKHOLDER MATTERS AND ISSUER PURCHASES OF
EQUITY SECURITIES |
None.
|
|
|
| ITEM 6. |
|
SELECTED FINANCIAL DATA |
The table shown below presents selected financial data for each of the five years ended December
31, 2009. This financial information was prepared in accordance with GAAP. The GAAP statement of
income data for the years ended December 31, 2009, 2008, 2007, 2006, and 2005 and the GAAP balance
sheet data at December 31, 2009, 2008, 2007, 2006 and 2005 were derived from Crum & Forster
Holdings Corp.’s consolidated financial statements, which have been audited by
PricewaterhouseCoopers LLP, an independent registered public accounting firm. The consolidated
balance sheets at December 31, 2009 and 2008, and the related consolidated statements of income, of
shareholder’s equity, of comprehensive income and of cash flows for each of the three years ended
December 31, 2009, and accompanying notes, appear in “Item 8. Financial Statements and
Supplementary Data”. The combined statutory data has been derived from annual statutory financial
statements, which have been filed with the domiciliary states of the Company’s insurance
subsidiaries, and prepared in accordance with SAP, which differs from GAAP.
38
The selected financial data presented below should be read in conjunction with “Item 7.
Management’s Discussion and Analysis of Financial Condition and Results of Operations” and the
consolidated financial statements and accompanying notes included in “Item 8. Financial Statements
and Supplementary Data”. Certain amounts in the Company’s prior year consolidated financial
statements have been reclassified to conform to the 2009 presentation.
| |
|
|
|
|
|
|
|
|
|
|
|
|
|
|
|
|
|
|
|
|
| |
|
For the Years Ended December 31, |
|
| (dollars in thousands) |
|
2009 |
|
|
2008 |
|
|
2007 |
|
|
2006 |
|
|
2005 |
|
GAAP STATEMENT OF
INCOME DATA: |
|
|
|
|
|
|
|
|
|
|
|
|
|
|
|
|
|
|
|
|
Gross premiums written |
|
$ |
863,827 |
|
|
$ |
1,019,569 |
|
|
$ |
1,245,021 |
|
|
$ |
1,351,631 |
|
|
$ |
1,097,756 |
|
Net premiums written |
|
$ |
716,406 |
|
|
$ |
871,152 |
|
|
$ |
1,099,635 |
|
|
$ |
1,166,532 |
|
|
$ |
868,966 |
|
Premiums earned |
|
$ |
781,282 |
|
|
$ |
998,028 |
|
|
$ |
1,186,144 |
|
|
$ |
1,084,023 |
|
|
$ |
894,173 |
|
Investment income and
realized investment
gains and losses |
|
$ |
313,826 |
|
|
$ |
604,254 |
|
|
$ |
377,503 |
|
|
$ |
392,818 |
|
|
$ |
215,310 |
|
Losses and LAE |
|
$ |
526,112 |
|
|
$ |
822,867 |
|
|
$ |
752,969 |
|
|
$ |
666,079 |
|
|
$ |
615,505 |
|
Policy acquisition
costs and other
underwriting expenses |
|
$ |
272,315 |
|
|
$ |
320,447 |
|
|
$ |
340,196 |
|
|
$ |
314,403 |
|
|
$ |
254,452 |
|
Income before equity
in earnings of
investees, net of tax |
|
$ |
201,902 |
|
|
$ |
333,267 |
|
|
$ |
269,882 |
|
|
$ |
299,121 |
|
|
$ |
138,743 |
|
Equity in earnings
(losses) of
investees, net of tax |
|
$ |
79 |
|
|
$ |
(461 |
) |
|
$ |
23,300 |
|
|
$ |
13,162 |
|
|
$ |
17,193 |
|
Net income |
|
$ |
201,981 |
|
|
$ |
332,806 |
|
|
$ |
293,182 |
|
|
$ |
312,283 |
|
|
$ |
155,936 |
|
| |
|
|
|
|
|
|
|
|
|
|
|
|
|
|
|
|
|
|
|
|
| |
|
At December 31, |
|
| (dollars in thousands) |
|
2009 |
|
|
2008 |
|
|
2007 |
|
|
2006 |
|
|
2005 |
|
GAAP BALANCE SHEET DATA: |
|
|
|
|
|
|
|
|
|
|
|
|
|
|
|
|
|
|
|
|
Total investments
(including cash and cash
equivalents and assets
pledged for derivatives and
short-sale
obligations)1 |
|
$ |
3,992,020 |
|
|
$ |
4,032,034 |
|
|
$ |
4,547,529 |
|
|
$ |
3,926,276 |
|
|
$ |
3,720,538 |
|
Total assets |
|
$ |
5,304,023 |
|
|
$ |
5,598,880 |
|
|
$ |
6,612,812 |
|
|
$ |
6,443,554 |
|
|
$ |
6,482,879 |
|
Unpaid losses and LAE |
|
$ |
2,672,605 |
|
|
$ |
2,987,803 |
|
|
$ |
3,178,506 |
|
|
$ |
3,371,549 |
|
|
$ |
3,673,034 |
|
Long term debt |
|
$ |
312,114 |
|
|
$ |
310,502 |
|
|
$ |
313,220 |
|
|
$ |
293,170 |
|
|
$ |
292,470 |
|
Shareholder’s equity |
|
$ |
1,517,727 |
|
|
$ |
1,166,432 |
|
|
$ |
1,293,459 |
|
|
$ |
1,093,055 |
|
|
$ |
961,193 |
|
| |
|
|
|
|
|
|
|
|
|
|
|
|
|
|
|
|
|
|
|
|
| |
|
Years Ended December 31, |
|
| |
|
2009 |
|
|
2008 |
|
|
2007 |
|
|
2006 |
|
|
2005 |
|
SELECTED FINANCIAL RATIOS BASED ON GAAP DATA: |
|
|
|
|
|
|
|
|
|
|
|
|
|
|
|
|
|
|
|
|
Loss and LAE ratio |
|
|
67.3 |
% |
|
|
82.5 |
% |
|
|
63.5 |
% |
|
|
61.5 |
% |
|
|
68.8 |
% |
Underwriting expense ratio |
|
|
34.9 |
|
|
|
32.1 |
|
|
|
28.7 |
|
|
|
29.0 |
|
|
|
28.5 |
|
|
|
|
|
|
|
|
|
|
|
|
|
|
|
|
|
Combined ratio |
|
|
102.2 |
% |
|
|
114.6 |
% |
|
|
92.2 |
% |
|
|
90.5 |
% |
|
|
97.3 |
% |
|
|
|
|
|
|
|
|
|
|
|
|
|
|
|
|
| |
|
|
|
Ratio of earnings to fixed charges2 |
|
|
5.5 |
x |
|
|
11.9 |
x |
|
|
9.1 |
x |
|
|
11.0 |
x |
|
|
4.4 |
x |
|
|
|
|
|
|
|
|
|
|
|
|
|
|
|
|
| |
|
|
|
|
|
|
|
|
|
|
|
|
|
|
|
|
|
|
|
|
| |
|
Years Ended December 31, |
|
| (dollars in thousands) |
|
2009 |
|
|
2008 |
|
|
2007 |
|
|
2006 |
|
|
2005 |
|
SELECTED COMBINED
STATUTORY DATA: |
|
|
|
|
|
|
|
|
|
|
|
|
|
|
|
|
|
|
|
|
Loss and LAE ratio |
|
|
69.2 |
% |
|
|
74.1 |
% |
|
|
64.1 |
% |
|
|
61.9 |
% |
|
|
69.4 |
% |
Underwriting expense ratio |
|
|
37.5 |
|
|
|
34.3 |
|
|
|
30.0 |
|
|
|
28.0 |
|
|
|
28.4 |
|
|
|
|
|
|
|
|
|
|
|
|
|
|
|
|
|
Combined ratio |
|
|
106.7 |
% |
|
|
108.4 |
% |
|
|
94.1 |
% |
|
|
89.9 |
% |
|
|
97.8 |
% |
|
|
|
|
|
|
|
|
|
|
|
|
|
|
|
|
Policyholders’ surplus |
|
$ |
1,628,159 |
|
|
$ |
1,410,612 |
|
|
$ |
1,639,751 |
|
|
$ |
1,406,822 |
|
|
$ |
1,313,988 |
|
|
|
|
|
|
|
|
|
|
|
|
|
|
|
|
|
Ratio of net premiums
written to policyholders’
surplus |
|
|
0.44 |
x |
|
|
0.62 |
x |
|
|
0.67 |
x |
|
|
0.83 |
x |
|
|
0.66 |
x |
|
|
|
|
|
|
|
|
|
|
|
|
|
|
|
|
| |
|
|
| 1 |
|
Includes $29,425, $4,416, $1,043,436, $535,594 and $496,903 of assets pledged
for derivatives and short-sale obligations at December 31, 2009, 2008, 2007, 2006 and
2005, respectively. |
| |
| 2 |
|
For purposes of determining the ratio of earnings to fixed charges, earnings
include income before income taxes, adjusted for undistributed income or loss from equity
method investees and fixed charges. Fixed charges consist of interest expense,
amortization of capitalized expenses related to indebtedness and an estimate of implicit
interest included in rent expense. The calculation of the ratio of earnings to fixed
charges is filed as an exhibit to this Form 10-K. |
39
|
|
|
| ITEM 7. |
|
MANAGEMENT’S DISCUSSION AND ANALYSIS OF FINANCIAL CONDITION AND RESULTS OF OPERATIONS |
The following discussion and analysis should be read in conjunction with Crum & Forster’s
consolidated financial statements and accompanying notes included in “Item 8. Financial Statements
and Supplementary Data”. Certain information constitutes forward-looking statements that involve
risks and uncertainties. For further discussion of forward-looking statements, see “Statements
Regarding Forward-Looking Information”. Actual results may differ materially from the results
discussed in these forward-looking statements as a result of certain factors including, but not
limited to, those set forth under “Item 1A. Risk Factors”.
Critical Accounting Policies and Estimates
The Company’s consolidated financial statements and related notes thereto are prepared in
accordance with GAAP. GAAP requires management to make estimates and assumptions that affect the
reported amounts of assets and liabilities and the disclosure of material contingent assets and
liabilities as of the balance sheet date and the revenues and expenses reported during the relevant
period. In general, management’s estimates are based on historical experience, evaluation of
current trends, information from third party professionals and various other assumptions that are
believed to be reasonable under the known facts and circumstances.
Crum & Forster’s significant accounting policies are described in Note 2 to the consolidated
financial statements included in “Item 8. Financial Statements and Supplementary Data”. The
accounting policies and estimates discussed below are those that require management to make
assumptions about highly uncertain matters. If management were to make different assumptions about
those matters, or if actual results were to differ significantly from estimates, the Company’s
reported consolidated results of operations and financial condition could be materially affected.
Unpaid Losses and Loss Adjustment Expenses
The most significant accounting estimates relate to the Company’s reserves for unpaid losses and
LAE. Unpaid losses and LAE include reserves for both reported claims (case reserves) and IBNR.
When the Company is notified of insured losses, claims personnel set up case reserves for the
estimated amount of settlement, if any, which excludes estimates of expenses to settle claims, such
as legal and other fees and the general expenses of administering the claims adjustment process.
The estimate reflects the judgment of claims personnel, or of independent claims adjusters hired by
the Company, the scope of coverage available for the reported claim under each individual policy
assuming application of controlling state contract law, general reserving practices, the experience
and knowledge of such personnel regarding the nature of the specific claim and, where appropriate,
advice of counsel, with the goal of setting the reserve at the ultimate expected loss amount as
soon as sufficient information becomes available. The facts of the specific claim are investigated
and case reserves are established as soon as reasonably possible as follows:
General Liability ¾ an individual investigation of each loss reported is undertaken and the
claims personnel, using their experience and judgment, establish a case reserve in an amount
estimated to be the most likely ultimate loss amount to be paid considering the assumed
jurisdiction where the claim is pending and the applicable law of allowable direct and
consequential damages and defenses, the effect, if any, of the particular venue, including
settlement and verdict values, and, where applicable, the advice of counsel retained to represent
the defendant in the individual case.
Workers’ Compensation ¾ an individual investigation of each reported accident is undertaken
and the claims personnel, using their experience and judgment, establish a case reserve in an
amount estimated to be the most likely ultimate loss amount to be paid considering the unique
statutory scheme of the applicable jurisdiction. Claims personnel make assumptions as to the
likely cost of necessary medical treatment, including prescription medications, estimated time of
disability, degree of permanency, and, depending on the severity of the individual case, the
necessity and cost of vocational, rehabilitative, or long term care as well as other amounts
provided for under the applicable statutory scheme such as funeral and dependant benefits,
transportation costs, and employee attorney fees.
Commercial Automobile ¾ for third party claims, the methodology for establishing case
reserves is virtually identical to that of general liability. First party automobile reserves are
established based upon the cost of repair or actual cash value as appropriate under the
circumstances, generally confirmed by an appraisal, and consistent with applicable state claims
handling regulations.
Property ¾ an individual investigation of each loss reported is undertaken by claims
personnel, including conducting on site physical inspections of the covered property in determining
the scope of damage. Case reserves are established consistent with the coverages provided under
the specific policy applicable to the loss. Depending upon the severity of the loss and coverage
part or parts implicated in the specific claim reported, claims personnel may retain the services
of experts such as certified building consultants, salvors, forensic accountants, or construction
engineers to assist in projecting the ultimate loss to be reserved and paid on an individual claim
basis. In the event of a catastrophe loss, assumptions are made based upon the number of risks in
the affected area and the severity of the catastrophic events.
40
Accident and health ¾ claims are primarily handled by third party licensed administrators
with oversight by the Company. The short tail nature of the business results in claims being
reported and paid very quickly; therefore accident and health reserves are not a material part of
the Company’s total reserves.
In all lines of business, throughout the life of the claim, claims personnel evaluate any new
information that is received, analyze the impact of new information on the existing reserve, and,
if warranted, increase or decrease the case reserve as appropriate.
The Company’s internal actuaries conduct full reserve studies using generally accepted actuarial
methods for each line of business except asbestos, environmental and other latent, every six
months, and for asbestos, environmental and other latent, annually. For all lines of business
other than asbestos, environmental and other latent, ultimate losses and ALAE are projected by line
of business by accident year using several standard actuarial methodologies, including paid and
incurred loss development, the Bornhuetter-Ferguson incurred and paid loss methods, case reserve
adequacy methods and frequency and severity approaches. For ULAE, the Company utilizes paid ULAE
to paid loss analysis and the Wendy Johnson method. The Company’s actuaries utilize assumptions in
determining their estimates, including loss development factors, expected loss ratios, frequency
and severity trends, year-on-year price changes and inflation. These assumptions are affected by
items such as past loss experience, changes in legislative conditions, changes in judicial
interpretation of legal liability and policy coverage, and changes in claims handling practices.
In addition, prevailing economic, social and legal factors, such as inflation in medical services,
costs to repair damaged property or changes in statutory benefits, influence these assumptions.
After projecting ultimate losses for each of the various actuarial methodologies, the actuaries
select a central estimate ultimate for each accident year within a line of business based on many
factors, such as the age of the accident year and the risk characteristics of the individual line
of business.
For example, for older years where more credibility can be placed upon actual observed loss
emergence, paid or incurred loss development methods are generally the basis of the ultimate loss
selection. For more recent years where the actual emergence of losses is less credible, methods
that place more emphasis on expected loss development (e.g., the Bornhuetter-Ferguson method) may
be selected as the loss ultimate. A central estimate unpaid loss and ALAE reserve is determined by
subtracting actual paid losses and ALAE from the projected ultimate losses and ALAE for each line
of business by accident year. These reserves are aggregated by line of business and the IBNR
component is derived therefrom by deducting the recorded case reserves. The ULAE IBNR reserve is
calculated directly by the methods described above. The IBNR reserve includes anticipated
additional development of case reserves (either positive or negative), provision for claims that
have not been reported and estimated settlement expenses.
The majority of IBNR loss reserves relate to the Company’s casualty business, which generally has a
longer tail (meaning a longer period of time between the occurrence of the covered event and the
ultimate settlement of the claim) than the Company’s other lines of business. Line of business
specific factors that are considered in the aforementioned actuarial methodologies that affect the
IBNR reserves are as follows:
Workers’ Compensation ¾ medical inflation, willingness of insured to settle claims, case
reserve for known claims, long payment period for the medical portion of claims, expected loss
ratios for more recent accident years and legal jurisdiction of the claim.
General Liability ¾ delay of reporting the claim to the Company, court award inflation and
the expected loss ratio for the more recent accident years.
Commercial Automobile ¾ cost to repair damaged property, medical and court award inflation
and expected loss ratios for more recent accident years.
The shorter tailed lines, such as property and accident and health, in which claims are paid
shortly after the loss occurrence, have less variability in IBNR reserve estimates and are less
dependent on the above assumptions. The key assumptions for the property line of business are
catastrophe reserve estimates (when catastrophes occur) and cost to repair damaged property.
For liabilities other than asbestos, environmental and other latent, a range is developed around
the central estimate loss and LAE reserves using statistical techniques to create an aggregate loss
distribution. The methodology attempts to quantify the variability in the historical loss
development data for each line of business separately. The variability depends on the line of
business specific factors described above. From the aggregate loss distribution, an 80% confidence
interval is constructed which represents a reasonable range of possible outcomes.
The following table presents the impact of a 2% change in ultimate loss and ALAE ratios for each
line of business for the accident years shown. The years were selected to include those years
where management considers a 2% change in ultimates to be a reasonably likely outcome. The 2%
change was selected to represent a reasonably likely change in one of the factors described above.
For example, for workers’ compensation, this could be due to changes in medical inflation or claim
settlement rates. For general liability, this could be due to court award inflation.
| |
|
|
|
|
|
|
|
|
| |
|
|
|
|
Change in Ultimate Loss |
|
| Line of business |
|
Accident Years |
|
and ALAE ($ millions) |
Workers’ Compensation |
|
2002-2009 |
|
$37.0 |
General Liability1 |
|
2002-2009 |
|
$38.3 |
Commercial Automobile |
|
2006-2009 |
|
$14.0 |
| |
|
|
| 1 |
|
Excludes asbestos, environmental and other latent. |
41
If the Company experienced a change in its ultimate loss and ALAE reserves in the amount
depicted in the chart above, its income before income taxes and unpaid loss and loss adjustment
reserves would be affected by the same amount.
The Company’s actuaries also conduct an internal ground-up study of asbestos and environmental
reserves on an annual basis. Such ground-up studies involve a policyholder-by-policyholder
evaluation considering the following factors: available insurance coverage based upon the type of
loss being presented (premises/operations or products), including the role of any umbrella or
excess insurance purchased by the policyholder and court decisions concerning specific coverage
provisions; other policy specific provisions, including whether defense is included in or in
addition to loss; limits, deductibles and self-insured retentions; an analysis of each
policyholder’s ultimate potential liability; the jurisdictions involved; past and anticipated
future asbestos claim filings against the policyholder; past settlement values of similar claims
against the policyholder and their associated defense costs; dismissal rates of claims by
jurisdiction; distribution of claims by disease type (cancers, including mesothelioma, asbestosis
and no impairment) where known; the potential role of other insurance (estimating the Company’s
ultimate participation of loss settlements percentage); and applicable coverage defenses. The
evaluations are based on current trends without any assumption of potentially favorable or
unfavorable legislation in the future.
For asbestos, a range is developed for each policyholder based on variations in the estimates of
the future number of claimants and number of years in the available coverage period (if unknown).
For environmental exposures, a range is developed based on variations in alleged site costs and
variations in the number of years over which such costs may be allocated. The actuarial central
estimate is principally the average of the low estimate and the high estimate for each
policyholder.
At each balance sheet date, Company management establishes its “best estimate” based on the
actuarial central estimates by line of business from the most recent internal actuarial reserve
review, together with the actual loss emergence since such most recent review. Consideration may
also be given to the results of actuarial reserve reviews conducted by the Company’s independent
actuaries. Management considers a “best estimate” to be one where the total reserves have an equal
likelihood of developing a redundancy or deficiency as the loss experience matures. Following the
completion of each semi-annual internal actuarial reserve review, management reviews the actuarial
reserve valuation with the Company’s actuaries and compares the indicated reserve levels by line of
business to the corresponding recorded reserves. In general, management’s best estimate will
approximate the internal actuaries’ central estimates. There may, however, be circumstances in
which management chooses not to adjust its best estimate for assumptions made by its actuaries
regarding emerging trends – positive or negative – until the passage of further time or additional
information has confirmed the credibility of the trend. At December 31, 2009, the Company’s
actuaries concurred with the reasonableness of management’s best estimate.
Losses and LAE are charged to income as they are incurred. During the loss settlement period,
reserves established in prior years are adjusted as loss experience develops and new information
becomes available. Adjustments to previously estimated reserves, both positive and negative, are
reflected in the Company’s financial results in the periods in which they are made, and are
referred to as prior period loss development. Due to the high level of uncertainty, revisions to
these estimated reserves could have a material impact on the Company’s results of operations in the
period recognized, and actual payments for claims and LAE could ultimately be significantly
different from estimates.
The
Company recorded $(25.0) million, $39.0 million and $(50.2)
million of prior period (favorable) adverse
loss development before corporate aggregate reinsurance for 2009, 2008 and 2007,
respectively. After corporate aggregate reinsurance, the prior period
(favorable) adverse loss development
was $(39.9) million, 20.1 million and $(63.9) million for 2009, 2008 and 2007, respectively.
In 2009, the net favorable loss development before corporate aggregate reinsurance includes an
insurance recovery of $13.8 million associated with an asbestos lawsuit which the Company settled
in 2008. Excluding this recovery, the net favorable development of $11.2 million was primarily
attributable to favorable emergence in workers’ compensation, commercial multi-peril and property
lines of business, partially offset by adverse emergence in commercial automobile and asbestos
liabilities.
In 2008, the net adverse loss development before corporate aggregate reinsurance was primarily
attributable to a loss on commutation of a reinsurance treaty of $84.3 million ($75.5 million after
amortization of related deferred gain) as well as the settlement of an asbestos-related lawsuit of
$25.5 million, partially offset by favorable development, primarily in the workers’ compensation
and general liability lines of business, attributable to net favorable loss emergence in almost all
accident years. Specifically, favorable development in the workers’ compensation line was
principally attributable to favorable results in non-California medical reserves for older accident
years and non-California indemnity reserves for more recent accident years.
42
In 2007, the net favorable loss development before corporate aggregate reinsurance was primarily
attributable to favorable development across all major casualty lines as well as commercial
multi-peril with the largest redundancy being recognized in workers’ compensation. Specifically,
favorable development in the workers’ compensation line was principally attributable to favorable
results in non-California for older accident years due to favorable claim settlements and continued
recognition of favorable development for California in accident years 2004 and 2005 due to the
impact of industry reforms. Favorable development for general liability and commercial multi-peril
exposures in accident years 2003 through 2006 was due to the selection of faster loss development
factors, recognizing decreased loss activity in those years. The favorable development in these
lines was partially offset by $54.5 million of adverse development of asbestos, environmental and
other latent liabilities. Of the $54.5 million adverse development, $24.3 million of the increase
was in asbestos reserves, $22.2 million was in environmental reserves and $8.0 million was in other
latent reserves. The strengthening of asbestos reserves was principally due to developments
related to one asbestos policyholder. The strengthening of environmental reserves was due to a
newly reported large claim, identification of additional policies associated with existing
policyholders and a slight increase in the number of sites for policyholders with previously
reported claims. In addition, the Company also incurred losses for settlements which secured
broader releases on certain active exposures.
Asbestos Reserves
Asbestos is the most significant and difficult mass tort for the insurance industry in terms of
claim volume and dollar exposure. The litigation environment has become increasingly adverse.
Plaintiffs, including individuals that do not appear to be impaired by asbestos exposure, often are
able to choose from a number of potential venues to bring an action in the court that they expect
will be most advantageous to their claims. Many of the lawsuits are filed in a small number of
plaintiff-oriented jurisdictions, where significant verdicts historically have been rendered
against commercial defendants. Management believes that the insurance industry has been adversely
affected by judicial interpretations that have had the effect of maximizing insurance recoveries
for asbestos claims, from both a coverage and liability perspective. Even when these claims are
resolved without loss payment, as a large portion of them are, significant costs are incurred to
defend the claims.
The Company’s asbestos exposure is related mostly to policyholders that are peripheral defendants,
including a mix of manufacturers, distributors and installers of asbestos-containing products, as
well as premises owners. For the most part, these policyholders are defendants on a regional,
rather than a nationwide, basis. As the financial assets and insurance recoveries of traditional
asbestos defendants have been depleted, plaintiffs are increasingly focusing on these peripheral
defendants. Generally, only policies underwritten prior to 1986 have potential asbestos exposure
since most policies underwritten after that date contain an absolute asbestos exclusion.
Early asbestos claims focused on manufacturers and distributors of asbestos-containing products.
Thus, the claims at issue largely arose out of the products hazard and typically fell within the
policies’ aggregate limits of liability. Increasingly, policyholders, and to some extent the
asbestos plaintiffs’ bar, have been asserting that asbestos claims are not subject to these
aggregate limits and that each individual bodily injury claim should be treated as a separate
occurrence, potentially creating even greater exposure for primary insurers.
Generally, policyholders who assert these positions are installers of asbestos products or property
owners who allegedly had asbestos on their property. In addition, in an effort to seek additional
insurance coverage, some policyholders that have eroded their aggregate limits are submitting new
asbestos claims as “non-product” claims or attempting to reclassify previously resolved claims as
non-product claims. Unlike product exposures, these non-product exposures are argued not to be
subject to aggregate limits, creating potentially greater exposure. The extent to which
policyholders will be successful in obtaining coverage on this basis is uncertain and court
decisions have been inconsistent to date. Accordingly, it is difficult to predict the ultimate
size of the claims for coverage not subject to aggregate policy limits.
In 1994, Congress enacted a new section of the bankruptcy code aimed at facilitating the
reorganization of businesses with large asbestos liabilities. Under this law, an asbestos
defendant can receive a discharge from present and future asbestos claims by following the
provisions of the bankruptcy code. Insurers of the defendant have typically been excluded from the
pre-petition negotiations between the asbestos defendant and the asbestos plaintiffs’ lawyers,
although the typical plan presumes the insurers will pay for claims under negotiation. These
“pre-packaged bankruptcies” can inflate claim costs and accelerate the timing of claims payments.
Although the pace of new filings has slowed considerably, bankruptcy filings by various defendants
in the asbestos arena continue to result in larger claim values to be paid by the remaining solvent
defendants, including certain Crum & Forster policyholders. To date, this continued flow of claims
has forced a number of manufacturers and users of asbestos products into bankruptcy. These
bankruptcies have, in turn, aggravated both the volume and the value of claims against viable
asbestos defendants. Accordingly, there is a high degree of uncertainty with respect to future
exposure from asbestos claims, both in identifying which additional policyholders may become
targets in the future and in predicting the total number of asbestos claimants.
Many coverage disputes with policyholders are resolved only through aggressive settlement efforts.
Settlements involving bankrupt policyholders may include extensive releases, which are favorable to
the Company but which could result in settlements earlier and for larger amounts than originally
expected. As it has done in the past, the Company will continue to aggressively pursue settlement
opportunities.
43
Tort reform in certain jurisdictions initially resulted in increased filings by plaintiffs seeking
to avoid the potential effective date of the reform legislation in 2003. Since 2004, insurers,
including Crum & Forster, generally experienced either flat or slightly decreased frequency in
numbers of newly reported asbestos-related claims due to, among other things, tort reform in
certain jurisdictions previously known for large volume filings. As a result of tort reform the
landscape of asbestos litigation is changing in the U.S. Many states (Mississippi, Texas, Ohio,
for example) have enacted reforms serving to restrict the volume of filings, increase plaintiffs’
burden of demonstrating injury, and provide seriously injured plaintiffs with preferential
treatment on the docket. Also, within the past few years, the doctors and screening companies that
diagnosed large numbers of unimpaired plaintiffs have come under scrutiny. The result has been a
significant decrease in the number of unimpaired plaintiffs filing claims. The number of
mesothelioma, lung cancer and impaired asbestosis cases have remained at consistent levels, and
accordingly now make up a larger percentage of the total filings. The reduction in the number of
new filings has resulted in the defense bar focusing on individual cases involving higher severity
injuries. As such, average severities have increased. California continues to be the most active
and challenging venue for defendants, and increased filing activity has been identified in
Illinois.
At the same time, the loss of revenue to the plaintiffs’ bar due to the decrease in filings,
combined with increased scrutiny on individual cases, has resulted in an increase in plaintiffs’
settlement demands. The risk of taking a seriously injured asbestos plaintiff to trial continues
to be significant.
Reserves for asbestos cannot be estimated with traditional loss reserving techniques that rely on
historical accident year loss development factors. Since each policyholder presents different
liability and coverage issues, the Company evaluates its asbestos exposure on a
policyholder-by-policyholder basis. Crum & Forster utilizes ground-up, exposure-based
methodologies, which draw upon Company experience and supplemental databases, to assess asbestos
liabilities on reported claims. The methodology was initially critiqued by outside actuarial
consultants, and the results are annually reviewed by independent actuaries, all of whom have found
the methodology appropriate and the results reasonable.
In the course of the policyholder-by-policyholder evaluation, the following factors are considered:
available insurance coverage, including the role of any umbrella or excess insurance issued to the
policyholder; limits, deductibles and self-insured retentions; an analysis of each policyholder’s
potential liability; the jurisdictions involved; past and anticipated future asbestos claim filings
against the policyholder; loss development on pending claims; past settlement values of similar
claims; allocated claim adjustment expenses; the potential role of other insurance; and applicable
coverage defenses. The evaluations are based on current trends without any assumption of
potentially favorable or unfavorable legislation in the future.
In addition to estimating liabilities for reported asbestos claims, reserves for IBNR claims are
estimated using information as to the reporting patterns of known policyholders, historical
settlement costs per policyholder and characteristics of policyholders such as the number of
coverage years. Once the gross ultimate exposure for indemnity and ALAE is determined for each
policyholder and policy year, the amount ceded to reinsurers is estimated by reviewing the
applicable reinsurance treaty.
As part of the overall review of the Company’s asbestos exposure, management compares the level of
reserves to various industry benchmarks. The most widely reported benchmark is the survival ratio,
which equals the outstanding loss and ALAE reserves (including IBNR) at December 31 divided by the
average paid losses and ALAE for the past three years. The resulting ratio is a simple measure of
the estimated number of years before the year-end loss and ALAE reserves would be exhausted using
recent payment run rates. The higher the ratio, the more years the loss and ALAE reserves would be
expected to cover.
The reported asbestos survival ratios based on asbestos loss and ALAE reserves, net of per risk
reinsurance but before the benefit of corporate aggregate reinsurance, are presented below:
| |
|
|
|
|
| |
|
At December 31, |
|
| (dollars in millions) |
|
2009 |
|
Net unpaid losses and ALAE |
|
$ |
269.4 |
|
3-year average net paid losses and ALAE |
|
$ |
43.7 |
|
3-year survival ratios |
|
|
6.2 |
|
44
Another industry benchmark that management reviews is the relationship of asbestos loss and ALAE
reserves to the estimated ultimate asbestos loss, i.e., the sum of cumulative paid losses and the
year-end outstanding loss reserves. These comparisons are summarized as follows:
| |
|
|
|
|
|
|
|
|
| |
|
Amount |
|
|
% of Total1 |
|
Crum & Forster (dollars in millions) 1 |
|
|
|
|
|
|
|
|
Paid losses and ALAE at December 31, 2009 |
|
$ |
550.8 |
|
|
|
67.2 |
% |
Net unpaid losses and ALAE (case and IBNR) at December 31, 2009 |
|
|
269.4 |
|
|
|
32.8 |
% |
|
|
|
|
|
|
|
Ultimate losses and ALAE at December 31, 2009 |
|
$ |
820.2 |
|
|
|
100.0 |
% |
|
|
|
|
|
|
|
|
|
|
|
|
|
|
|
|
Industry, as represented by A.M. Best Company (“A.M. Best”)2 (dollars in millions) |
|
|
|
|
|
|
|
|
Paid losses and ALAE at December 31, 2008 |
|
$ |
51,400 |
|
|
|
68.5 |
% |
Net unpaid losses and ALAE (case and IBNR) at December 31, 2008 |
|
|
23,600 |
|
|
|
31.5 |
|
|
|
|
|
|
|
|
Ultimate losses and ALAE at December 31, 2008 |
|
$ |
75,000 |
|
|
|
100.0 |
% |
|
|
|
|
|
|
|
| |
|
|
| 1 |
|
Net of per risk reinsurance, but before the benefit of corporate aggregate
reinsurance. |
| |
| 2 |
|
Extracted from an A.M. Best report dated December 7, 2009. |
The Company increased its reserves for asbestos liabilities in each of 2009, 2008 and 2007.
Asbestos liabilities are uniquely difficult to estimate due to both industry-wide issues and
Company-specific factors. Industry-wide trends and factors have generally been adverse to
insurance companies and include complex coverage issues, expansive judicial interpretation, long
reporting delays, substantial defense costs, venue shopping, bankruptcies of traditional defendants
and targeting of peripheral defendants whose exposures may not be subject to aggregate policy
limits. In developing its asbestos reserve estimates, the Company gives consideration to the
current state of industry trends and factors, particularly those that most directly affect its
policyholder universe such as the targeting of smaller, peripheral defendants. However, changes in
these trends or the emergence of new trends or factors may not be reasonably foreseeable or their
effects may not be reliably quantifiable as of the date of the Company’s estimate. Further, while
industry trends are considered by the Company, increases in the Company’s asbestos reserve
estimates are most directly and significantly affected by changes in the state of asbestos claims
against Crum & Forster’s specific policyholders. A comparatively small number of policyholders
account for a substantial share of the Company’s asbestos claim payout activity in any given period
and of the asbestos net unpaid losses and ALAE reserves at each balance sheet date. Changes in the
conditions of specific policyholders, such as being targeted by plaintiffs in a state or states
from which claims had not been previously filed or expected, adverse court decisions regarding
coverage or defense obligations, the discovery (or allegation) of the existence of additional
policies issued by the Company or the inability of another of the policyholder’s insurers to
discharge its policy obligations, thereby increasing the obligations of the remaining insurers, can
have a material impact on the previous estimate of the potential liability associated with that
policyholder. These changes may not have been foreseeable or lacked sufficient credibility, even
if foreseeable, as of the date of the Company’s previous estimate.
In 2009, the trends noted previously have continued, including flat or slightly decreased numbers
of claimants filing asbestos claims against the Company’s policyholders, increased value of claims
against viable asbestos defendants as co-defendants seek bankruptcy protection, an increased number
of policyholders asserting that their asbestos claims are not subject to aggregate limits and that
each individual bodily injury claim should be treated as a separate occurrence, and a shift towards
a focus on single cases with significant injury, rather than a large volume of cases with little,
if any, injury. In general, a small percentage of policyholders account for the majority of paid
losses. In 2009, 90% of gross payments for loss and ALAE were made on behalf of approximately 2%
of policyholders.
In 2009, 2008 and 2007, the Company incurred total asbestos losses and ALAE of $2.8 million, $25.2
million and $24.3 million, respectively, (approximately 1%, 8% and 7%, respectively, of the
preceding year-end reserves balances). The increase in 2009 is net of an insurance recovery of
$13.8 million associated with a lawsuit settlement. Excluding this receipt, the increase was
primarily attributable to increasing claim values and rising legal costs associated with one
policyholder. In 2008 and 2007, the increase in each year was largely associated with the
aforementioned lawsuit.
As a result of the processes, procedures and analyses described above, management believes that the
reserves carried for asbestos claims at December 31, 2009 are adequate based upon known facts,
current law and management’s judgment. However, there are a number of uncertainties surrounding
the ultimate value of these claims, which may result in changes in these estimates as new
information emerges. Among these are the following: the unpredictability inherent in litigation;
any impact from the bankruptcy protection sought by asbestos producers and defendants; an
unanticipated increase in the number of asbestos claimants; the resolution of disputes pertaining
to the amount of coverage for “non-product” claims asserted under premises/operations general
liability policies; and future developments regarding the ability to recover reinsurance on
asbestos claims. It is also not possible to predict, nor has management assumed, any changes in
the legal, social or economic environments and their impact on future asbestos claim development.
The carried asbestos reserves also do not reflect any effects of future legislation.
45
An analysis of gross and net reserves from asbestos exposures is presented in Note 6 to the
consolidated financial statements included in “Item 8. Financial Statements and Supplementary
Data”.
Environmental Reserves
Hazardous waste sites present another significant potential exposure. The federal “Superfund” law
and comparable state statutes govern the cleanup and restoration of toxic waste sites and formalize
the concept of legal liability for cleanup and restoration by Potentially Responsible Parties
(“PRPs”). These laws establish the means to pay for cleanup of waste sites if PRPs fail to do so,
and to assign liability to PRPs. Most PRPs named to date are parties who have been generators,
transporters, past or present landowners or past or present site operators.
Most sites have multiple PRPs. Most insurance policies issued to PRPs did not expressly cover the
costs of pollution cleanup since pollution was not a recognized hazard at the time many of these
policies were issued. Over time, judicial interpretations in many cases have found that the scope
of coverage of the policies included pollution exposure, unless excluded, with some courts narrowly
applying the early versions of the pollution exclusion to expand the scope of coverage provided.
Since 1986, however, most general liability policies exclude coverage for such exposures.
There is great uncertainty involved in estimating liabilities related to these exposures. First,
the number of waste sites subject to cleanup is unknown. Currently, approximately 1,270 cleanup
sites are included in the EPA’s National Priorities List. State authorities have identified many
additional sites. Second, the liabilities of the policyholders themselves are difficult to
estimate. At any given site, the allocation of remediation cost among the PRPs varies greatly
depending upon a variety of factors. Third, different courts have been presented with liability
and coverage issues regarding pollution claims and have reached inconsistent decisions on several
issues. These uncertainties are unlikely to be resolved in the near future.
Uncertainties also remain as to the Superfund law itself. The excise tax imposed to fund Superfund
lapsed at the end of 1995 and has not been renewed. While a number of proposals to reform
Superfund have been put forward by various parties, Congress has enacted no reforms since then. It
is unclear what legislation, if any, will be enacted in the future and what potential effect it
will have on the insurance industry. In the absence of federal movement on Superfund, the
enforcement of Superfund liability is shifting to the states, which are reconsidering state-level
cleanup statutes and regulations. As individual states move forward, the potential for conflicts
among states becomes greater, increasing the uncertainty of the cost to remediate state sites.
As with asbestos reserves, exposure for environmental pollution cannot be estimated with
traditional loss reserving techniques that rely on historical accident year loss development
factors. Since each policyholder presents different liability and coverage issues, the methodology
used to establish environmental reserves is similar to that used for asbestos liabilities. In the
course of performing these individual policyholder assessments, the following factors are
considered: the policyholder’s probable liability and available coverage; the number of sites; the
total number of PRPs at each site; the nature of environmental harm and the corresponding remedy at
each site; the involvement of other insurers and the potential for other available coverage; and
the applicable law in each jurisdiction. A provision for IBNR is developed, using methodology
similar to that for asbestos liabilities, and an estimate of ceded reinsurance recoveries is
calculated. Aggregate emergence against a benchmark is also considered.
New reports for environmental claims are generally trending downward while the cost of the remedy
in certain jurisdictions has increased. Claims against Fortune 500 companies are declining, and,
while policyholders with single-site exposures are still active, the Company has resolved the
majority of disputes with respect to policyholders with a large number of sites. Statutes in a
number of states require administrative involvement in business closures where the business used or
produced substances that are considered contaminants. Accordingly, the general economic climate
could result in an uptick of reported claims associated with such business or facility closures.
Due to the high level of uncertainty, revisions to these reserve estimates could have a material
impact on the Company’s results of operations in the period recognized and the ultimate actual
payments for claims and LAE could turn out to be significantly different from estimates.
The Company’s environmental survival ratio calculation, based on environmental loss and ALAE
reserves, net of per risk reinsurance, but before the benefit of corporate aggregate reinsurance,
is presented below:
| |
|
|
|
|
| |
|
At December 31, |
|
| (dollars in millions) |
|
2009 |
|
Net unpaid losses and ALAE |
|
$ |
70.8 |
|
3-year average net paid losses and ALAE |
|
$ |
12.8 |
|
3-year environmental survival ratio |
|
|
5.5 |
|
An analysis of gross and net reserves from environmental exposures is presented in Note 6 to the
consolidated financial statements included in “Item 8. Financial Statements and Supplementary
Data”.
46
Other Latent Reserves
In addition to asbestos and environmental pollution, the Company faces exposure to other types of
latent mass tort claims. These other latent claims include those associated with silica, gas and
vapors, lead, mold, chemicals, welding fumes and pesticides. Similar to asbestos and pollution,
traditional actuarial techniques cannot be used to estimate ultimate liability for these exposures.
Management sets reserves for other latent exposures at a selected gross survival ratio
(approximately 6 years) and selects a gross to net ratio based on the gross to net ratio of
historical payments. An analysis of gross and net reserves from other latent exposures is presented
in Note 6 to the consolidated financial statements included in “Item 8. Financial Statements and
Supplementary Data”.
Summary
Management believes that the asbestos, environmental and other latent reserves reported at December
31, 2009 are reasonable estimates of the ultimate remaining liability for these claims based on
facts currently known, the present state of the law and coverage litigation, current assumptions
and the reserving methodologies employed. These latent reserves are continually monitored by
management and reviewed by independent consulting actuaries. New developments will continue to be
evaluated as they arise in order to supplement the ongoing analyses and reviews of the latent
exposures. However, to the extent that future social, scientific, economic, legal or legislative
developments alter the volume of claims, the liabilities of the policyholders, or the original
intent of the policies and scope of coverage, increases in loss reserves may emerge in future
periods. Due to the inherent uncertainties in estimating reserves for unpaid losses and LAE
described above, and to the potential impact of recent trends, the ultimate liability for the
Company’s loss and LAE reserves, and, in particular, its asbestos, environmental and other latent
claims reserves, may vary substantially from the amounts currently reserved.
For additional discussion on the Company’s reserves, see “Item 1. Business—Reserves” and Notes 5
and 6 to the consolidated financial statements included in “Item 8. Financial Statements and
Supplementary Data”.
Investments
The Company is responsible for determining the fair value of its investment portfolio by utilizing
fair value measurements obtained from active markets where available, by considering observable and
unobservable inputs and by employing valuation techniques that make use of current market data.
The Company categorizes its financial instruments, based on the priority of the inputs to the
valuation technique, into a three-level fair value hierarchy. The fair value hierarchy gives the
highest priority to quoted prices in active markets for identical assets or liabilities
(Level 1) and the lowest priority to unobservable inputs (Level 3). For further details on the
fair value hierarchy refer to Note 4 to the consolidated financial statements.
A review of fair value hierarchy classifications is conducted on a quarterly basis. Changes in the
observability of valuation inputs may result in a reclassification for certain financial assets or
liabilities. Reclassifications impacting Level 3 of the fair value hierarchy are reported as
transfers in or out of the Level 3 category as of the beginning of the quarterly period in which
the reclassifications occur. During the first quarter of 2009, the Company transferred $47.6
million of Level 3 investments (comprised of investment grade mortgage-backed securities), to Level
2, after determining that broker-dealer quotes which utilize observable inputs, would be used to
determine the fair value of the instruments. During the fourth quarter of 2009, the Company
transferred its investment in Odyssey Re Holdings Corp. (“Odyssey”) at a fair value of $321.1
million from Level 1 to Level 3 and its investment in Advent Capital (Holdings) PLC (“Advent”) at a
fair value of $26.4 million from Level 2 to Level 3, following the privatization and subsequent
delisting from public stock exchanges of Odyssey and Advent. The privatization changed the inputs
used to value these investments from observable exchange traded quoted prices to unobservable
inputs. The Company now values these investments using internally developed valuation models based
on market multiples derived from a set of publicly traded comparable companies. The models, which
require a significant amount of judgment, use current and historical market prices and book values
of comparable companies to derive a current fair value. Because of the significant judgment
involved in selecting inputs and the effect of the inputs on the valuation model they are
considered to be Level 3. At December 31, 2009 Odyssey and Advent had fair values of $305.8
million and $26.6 million, respectively, based on these valuation models (approximately 8.3% of
total investment portfolio at that date). Also included in Level 3 securities are certain
non-investment grade mortgage-backed securities purchased at deep discounts to par, which are
valued using an internal discounted cash flow model. The cash flow model incorporates actual cash
flows on the mortgage-backed securities through the current period and projects the remaining cash
flows from the underlying mortgages, using a number of assumptions and inputs that are based on the
security-specific collateral. The Company assesses the reasonableness of the fair values of these
securities by comparing to models validated by qualified personnel, by reference to movements in
credit spreads and by comparing the fair values to recent transaction prices for similar assets
where available. At December 31, 2009, the fair value of the Company’s Level 3 non-investment grade
mortgage-backed securities was $14.3 million (less than 1% of total investment portfolio at that
date). At December 31, 2008, the fair value of the Company’s Level 3 securities (after the
aforementioned reclassification to Level 2), which were comprised of non-investment grade
mortgage-backed securities, was $18.8 million. Gains or losses arising from changes in the fair
value of Level 3 securities are recorded as realized investment gains or losses in the consolidated
statements of income and amounted to net losses of $3.5 million and $4.3 million in 2009 and 2008,
respectively.
47
Derivative securities held by the Company at December 31, 2009 are principally credit default swaps
and total return swaps. The credit default swaps are carried at estimated fair values on the
consolidated balance sheets with changes in fair value recorded in realized investment gains and
losses in the period in which they occur. The Company obtains broker-dealer quotes which are
based on observable credit spreads for its credit default swaps. In addition, the Company assesses
the reasonableness of the broker dealer quotes by comparing the fair values to values produced
using individual issuer credit default swap yield curves, by referencing them to movements in
credit spreads and by comparing them to recent market transaction prices for similar credit default
swaps where available. The fair values of credit default swaps are subject to significant
volatility arising from the potential differences in the perceived risk of default of the
underlying issuers, movements in credit spreads and the length of time to the contracts’ maturity.
Due to the inherent uncertainties of these valuations as well as the volatility in interest rates
and stock market conditions, realized values may differ from estimates reflected in the
consolidated financial statements. At December 31, 2009 and 2008, the fair value of the credit
default swaps was $20.0 million and $138.8 million, respectively. Gains or losses arising from
changes in the fair value of the credit default swaps are recorded in realized investment gains and
losses in the consolidated statements of income. For the years ended December 31, 2009, 2008 and
2007, realized investment gains and losses resulting from the net change in fair value of the
credit default swaps were (losses) gains of $(9.1) million, $283.5 million and $229.7 million,
respectively. The Company utilizes total return swaps to protect a portion of its equity and
equity related holdings against a decline in equity markets. These total return swaps contain
contractual reset provisions requiring counterparties to cash-settle on a monthly basis any market
value movements arising since the prior settlement. Any cash paid to settle unfavorable market
value changes and, conversely, any cash received in settlement of favorable market value changes
are recognized as realized investment gains or losses on the consolidated statements of income in
the period in which they occur. To the extent that a contractual reset date of a contract does not
correspond to the balance sheet date, the Company records additional realized investment gains or
losses on the consolidated statements of income to adjust the carrying value of the derivative
asset or liability associated with each total return swap contract to reflect its fair value at the
balance sheet date. For the years ended December 31, 2009 and 2008, realized investment gains and
losses resulting from total return swaps were (losses) gains of $(22.3) million and $362.1
million, respectively. The Company did not utilize total return swaps in 2007.
The Company holds significant investments in equities and equity related securities. The market
values of these investments are volatile and may vary dramatically either up or down in short
periods, and their ultimate value will therefore only be known over the long term. At each
reporting date, and more frequently when conditions warrant, management evaluates all
available-for-sale securities with unrealized losses to determine whether an other than temporary
decline in value exists and whether losses should be recognized in earnings rather than in
accumulated other comprehensive income (loss). The process for determining whether a security is
other than temporarily impaired requires judgment and involves analyzing many factors. These
factors include but are not limited to (i) the length of time and extent to which the fair value
has been less than its cost or amortized cost; (ii) the severity of the impairment; (iii) the cause
of the impairment; (iv) the financial condition and near-term prospects of the issuer as well as
specific credit issues related to the issuer such as changes in credit rating, reduction or
elimination of dividends or non-payment of scheduled interest payments; and (v) for fixed income
securities, the Company’s intent to sell a security or whether it is more likely than not that the
Company will be required to sell the security before recovery of its amortized cost, which in some
cases, may extend to maturity, and for equity securities, the Company’s intent and ability to hold
the security for a period of time sufficient to allow for any anticipated recovery of fair value in
the near term. To the extent management determines that a security is deemed to be other than
temporarily impaired, an impairment loss is recognized.
There are risks and uncertainties associated with determining whether declines in the fair value of
investments are other than temporary such as significant subsequent changes in general economic
conditions, as well as specific business conditions affecting particular issuers; subjective
assessments of issuer-specific factors (seniority of claims, collateral value, etc.); future
financial market effects; stability of foreign governments and economies; future rating agency
actions; and significant disclosures relating to accounting, fraud or corporate governance issues
that may adversely affect certain investments. For the years ended December 31, 2009, 2008 and
2007, charges for other than temporary impairments amounted to $110.8 million, $194.7 million and
$25.4 million, respectively, primarily related to write-downs of equity securities.
At December 31, 2009, the Company had unrealized losses of $9.2 million in investments in
available-for-sale fixed income and equity securities of which $8.4 million was attributable to
fixed income securities and $0.8 million was attributed to equity securities. The majority of the
gross unrealized losses in the fixed income portfolio are attributable to investment grade
municipal securities. Management has determined that the unrealized losses on its fixed income
securities at December 31, 2009 are principally attributable to changes in interest rates and that
the Company does not have the intent to sell these securities and it is more likely than not that
it will not be required to sell these securities before recovery of their cost bases.
Management’s evaluation of other than temporary losses is particularly sensitive to assumptions it
makes relative to forecasts of an issuer’s financial performance and near term prospects such as
earnings trends, dividends, analysts’ forecasts and cash flows supporting fixed income securities.
Although management is unable to quantify the likelihood of changes to these assumptions that may
occur in the future, any change in assumptions could result in recognition of impairments in the
future in an amount potentially greater than the unrealized losses on the securities at December
31, 2009.
48
Reinsurance Recoverable
Amounts recoverable from reinsurers are initially estimated in conjunction with the establishment
of reserves for unpaid losses and LAE. These amounts may be adjusted as actual case reserves are
recorded and reinsured claims are settled. The ceding of risk to reinsurers does not relieve the
insurance companies of their primary obligation to policyholders as the direct insurer.
Accordingly, the Company is exposed to the risk that any reinsurer may be unable, or unwilling, to
meet the obligations assumed under its reinsurance agreements. Management attempts to mitigate this
risk by obtaining collateral and by entering into reinsurance arrangements only with reinsurers
that have credit ratings and statutory surplus above certain levels.
In certain circumstances, the Company may engage in commutation discussions with an individual
reinsurer, essentially canceling and settling the contract at its net realizable value. The
outcome of such discussions may result in a lump sum settlement that is less than the recorded
recoverable balance. Losses arising from commutations could have an adverse impact on the Company’s
results of operations.
An estimated allowance for uncollectible reinsurance recoverable is recorded on the basis of
periodic evaluation of balances due from reinsurers, judgments regarding reinsurer solvency, known
disputes, reporting characteristics of the underlying reinsured business, historical experience,
current economic conditions and the state of insurer/reinsurer relations in general, and at the
Crum & Forster companies in particular.
At December 31, 2009 and 2008, reinsurance recoverable was $892.7 million and $968.2 million, net
of reserves for uncollectible reinsurance of $54.2 million and $56.0 million, respectively. Bad
debt expense for the years ended December 31, 2009, 2008 and 2007 related to uncollectible
reinsurance was $2.0 million, $7.7 million and $8.0 million, respectively. While management
believes the allowance for uncollectible reinsurance recoverable is adequate based on information
currently available, failure of reinsurers to meet their obligations could have a material adverse
impact on the Company’s financial position and results of operations. At December 31, 2009, the
two largest gross reinsurance recoverable balances aggregated $478.4 million, or 53.6%, of the
total reinsurance recoverable balance. The reinsurer with the largest gross recoverable balance
(an unaffiliated company rated A+ by A.M. Best) has provided collateral in an amount of $236.3
million, which reduces its unsecured exposure to $112.7 million. The collateral provided is in the
form of a funds held balance in the Company’s general account and equals premiums plus interest
thereon credited at the rate stipulated in the related reinsurance contract. There is no
limitation on the ability of the Company to access these funds in accordance with the related
reinsurance agreement.
Deferred Income Tax Assets
The Company recognizes deferred tax assets and liabilities based on differences between the
financial statement carrying amounts and the tax bases of assets and liabilities. Management
regularly reviews the Company’s deferred tax assets for recoverability based on history of
earnings, expectations for future earnings and expected timing of reversals of temporary
differences.
Although realization is not assured, management believes the recorded deferred tax assets are fully
recoverable based on estimates of the future profitability of Crum & Forster’s taxable subsidiaries
and current forecasts for the periods through which losses may be carried back and/or forward. The
Company has several material deferred tax assets arising from investments (a significant portion of
which relates to impairments), loss reserve discounting, deferred income on retroactive reinsurance
and unearned premium adjustments. The realizability of these reversing deferred tax assets is
considered in conjunction with similar originating deferred tax assets and other taxable income.
At December 31, 2009, there are no valuation allowances against the Company’s gross deferred tax
assets of $251.2 million. The Company’s current projections of future taxable income are based on
assumptions of level to modestly declining business growth and relatively stable combined ratios,
with portfolio yields approximating current levels. Should the assumptions of future profitability
change significantly, however, or the taxable income of these entities fall far below expectations,
a valuation allowance, which could be significant, may have to be established if management
believes any portion of the deferred tax asset will not be realized. A valuation allowance may
also be required if there is a material change in the tax laws such that the actual effective tax
rate or the time periods within which the underlying temporary differences become taxable or
deductible change.
Realization of the deferred tax asset under ASC 740, Income Taxes, ultimately depends on the
existence of sufficient taxable income available under tax law, including future reversals of
existing temporary differences, future taxable income exclusive of reversing differences, taxable
income in prior carryback years and tax planning strategies. Future profitability, as it relates
to taxable income expectations discussed above, can be negatively affected by substantial changes
in premium volume, underwriting losses resulting from significant events such as severe natural
disasters or large settlements for asbestos or environmental claims, or materially lower investment
results.
49
Summary of Operations
Overview
Crum & Forster is a national commercial property and casualty insurance company with a focused
underwriting strategy targeting specialty classes of business and underserved market opportunities.
The Company writes numerous lines of business including general liability, workers’ compensation,
commercial automobile, property, commercial multi-peril, accident and health, fidelity and surety,
personal automobile and homeowners. In 2009, approximately 44% of the Company’s gross written
premiums arose from the offering of general liability including umbrella, workers’ compensation,
commercial automobile and property policies to middle market commercial enterprises through the
Company’s regional branch network. The balance of Crum & Forster’s business is comprised of a
diverse portfolio of specialty businesses in which the Company has specific product, geographic or
customer group expertise. These include: products such as accident and health, directors’ and
officers’ liability and bail bonds; geographic specialties such as the Company’s coverage of
non-standard, inner-city risks not typically well served by the standard market and Crum &
Forster’s longstanding presence in the Hawaii market; and customer group expertise in the areas of
propane distributors, explosive contractors, agriculture enterprises, and construction contractors
written on a non-admitted basis.
The Company generally conducts business on a brokerage basis through its home office and a regional
branch network, allowing it to control the underwriting process and build close relationships with
producers and policyholders. The Company may also conduct business through third parties such as
managing general underwriters where it is cost effective to do so and where the Company can control
the underwriting process such as in the Company’s niche accident and health business. The Company
has over 1,500 producers located throughout the United States including independent regional retail
firms, wholesale brokers, national brokers and managing general underwriters.
The Company’s objective is to expand opportunistically into classes of business or market segments
that have the potential to generate an underwriting profit. Additional growth in specialty lines is
a significant element of the Company’s business strategy. Management believes the Company’s
ability to identify profitable market opportunities where its underwriting expertise can be applied
provides it with a competitive advantage.
The profitability of property and casualty insurance companies is primarily determined by their
underwriting results and investment performance. Underwriting results are the net result of a
company’s premiums earned and amounts paid, or expected to be paid, to settle insured claims and
policy acquisition costs and other underwriting expenses. The insurance business is unique in that
premiums charged for insurance coverage are set without certainty of the ultimate claim costs to be
incurred on a given policy. This requires that liabilities be estimated and recorded in
recognition of future loss and settlement obligations. Due to the inherent uncertainty in
estimating these liabilities, there can be no assurance that actual liabilities will not exceed
recorded amounts or premiums received. The ultimate adequacy of premium rates is affected mainly
by the severity and frequency of claims, which are influenced by many factors, including natural
and man-made disasters, regulatory measures and court decisions that define and expand the extent
of coverage. Insurance premium rates are also influenced by available insurance capacity or the
industry’s willingness to deploy capital to cover each insurable risk.
Premiums collected are invested until funds are required to pay settled claims. Insurance company
investment portfolios generally must provide a balance among total return, capital preservation and
liquidity in order to generate sufficient funds for payment of claims as they are settled. The
Company follows a long-term, value-oriented investment philosophy, with the goal of optimizing
investment returns viewed on a total return basis, without reaching for yield, while maintaining
sensitivity to liquidity requirements. The Company attempts to protect its capital from loss.
Management believes that investing in debt and equity securities selling at prices below intrinsic
value better protects the Company’s capital.
Management monitors the contribution to earnings of underwriting operations and investment results
separately. The ability to achieve underwriting profitability on a consistent basis is the core
competency of a property and casualty insurance company, demonstrating discipline, individual risk
selection and pricing skills, and effective risk management on a portfolio basis. The underwriting
functions of the Company are managed separately from the investment operations. Accordingly, in
assessing the Company’s results of operations, management evaluates underwriting results separately
from investment performance.
With respect to the Company’s underwriting operations, management monitors key indicators of growth
and profitability. Growth is generally measured in terms of gross premiums written. Management
further monitors growth in its gross premiums written in terms of its rate of retention of existing
policyholders, increases or decreases in the pricing of renewed policies and the growth in new
business premiums. Underwriting profitability is measured both in dollars and by the combined
ratio, a standard industry measure. Underwriting profit or loss equals premiums earned, less
losses and LAE, policy acquisition costs and other underwriting expenses. The combined ratio
expresses underwriting results as a percentage of premiums earned and generally comprises two
components: the loss ratio, which is the percentage of losses and LAE to premiums earned, and the
expense ratio, which is the percentage of the sum of policy acquisition costs and other
underwriting expenses to premiums earned. A combined ratio less than 100% indicates an
underwriting profit; a combined ratio greater than 100% indicates an underwriting loss.
50
Underwriting profit or loss expressed in dollars is considered a non-GAAP financial measure. The
table at the beginning of the Results of Operations section that follows presents the separate
contribution of underwriting and investment operations to income before income taxes on a GAAP
basis. An understanding of a property and casualty insurance company’s financial condition,
results of operations and profit and growth prospects begins with an assessment of the entity’s
ability to underwrite effectively. Underwriting is the core business of such companies; investment
operations are a separate function. Management monitors the Company’s consolidated results on this
basis and likewise reports such results to its board of directors. Rating agencies and securities
analysts also focus separately on underwriting and investment results. In annual and quarterly
statements to state insurance regulators prepared in accordance with SAP, underwriting profit or
loss is presented separately from investment results. Underwriting profit or loss, together with
the related combined ratio, are widely followed measures in the property and casualty insurance
industry.
Investment results are generally measured in terms of total return on assets under management.
Growth in the Company’s cash and invested assets is also a key measure of investment performance.
Market Conditions
The property and casualty insurance business is cyclical and influenced by many factors, including
price competition, economic conditions, natural and man-made disasters (for example hurricanes,
earthquakes and terrorism), availability and cost of reinsurance, financial market conditions,
state regulations, court decisions and changes in the law. For the last several years, the
property and casualty market has experienced challenging market conditions characterized by intense
competition and downward pricing trends, termed a “soft market”. These soft market conditions
heightened in 2008 and the Company has continued to see soft market pricing through all lines of
business, aside from modest price increases in California workers’ compensation, throughout 2009.
Although there is some evidence of deceleration in rate decreases, overall market conditions
deteriorated over the second half of 2009 and still remain extremely competitive. In the property
market, earlier in the year some property insurers were reducing available limits in peak
catastrophe zones as a result of significant catastrophe losses sustained by the industry in 2008,
primarily from Hurricane Ike, and increases in reinsurance costs, resulting in property rates
stabilizing. However, more recently, the Company has experienced downward pressure on prices
especially in non-catastrophe zones, attributable to the restoration of capital throughout the
industry and the light catastrophe season in 2009. In the catastrophe zones, rates have been
leveling off as capacity has increased.
Market conditions for the Company’s largest accident and health segment by gross written premiums,
employer stop loss, are currently intensely competitive. Competition in the Company’s other
accident and health segments, such as student medical, travel and pet insurance, varies from
product to product but generally is currently less intense.
During 2009, the Company’s renewal retention rates and renewal pricing remained level as compared
to 2008. Specifically, renewal retention rates for casualty lines increased by approximately 2
percentage points and renewal retention rates for property lines declined by approximately 4
percentage points, with the property renewal retention rates being depressed by underwriting
actions intended to improve profitability. Renewal prices for casualty lines remained flat and
renewal prices for property lines declined by approximately 1 percentage point. New business
declined by approximately 11%, attributable to a reduction in both casualty and property lines.
New business growth continues to be affected by the competitive market environment and ongoing
economic downturn.
Although there is some evidence of deceleration in rate decreases, the Company expects the market
to remain competitive throughout 2010, attributable to the combined effects of the light
catastrophe season in 2009, the restoration of capital throughout the industry, resulting from the
improvement in the financial markets, and additional competitors in some lines of business placing
downward pressure on price levels. Under such conditions, the Company will continue to reject
underpriced new business submissions and to shed accounts and classes of business that are
unprofitable. The Company expects continued pressure on its expense ratio despite aggressive cost
cutting measures and the loss ratio may deteriorate marginally as renewal price declines and
loss-cost trends take their toll on profitable business. In addition, if premium receipts continue
to decline and claim payments continue at current rates, the Company is likely to continue to have
negative cash flow from operations in the near future.
51
Results of Operations
The Company’s results of operations are summarized as follows:
| |
|
|
|
|
|
|
|
|
|
|
|
|
| |
|
Years Ended December 31, |
|
| (dollars in millions) |
|
2009 |
|
|
2008 |
|
|
2007 |
|
Gross premiums written |
|
$ |
863.8 |
|
|
$ |
1,019.6 |
|
|
$ |
1,245.0 |
|
|
|
|
|
|
|
|
|
|
|
Net premiums written |
|
$ |
716.4 |
|
|
$ |
871.2 |
|
|
$ |
1,099.6 |
|
|
|
|
|
|
|
|
|
|
|
|
|
|
|
|
|
|
|
|
|
|
|
|
Premiums earned |
|
$ |
781.3 |
|
|
$ |
998.0 |
|
|
$ |
1,186.1 |
|
Losses and LAE |
|
|
526.1 |
|
|
|
822.9 |
|
|
|
752.9 |
|
Underwriting expenses |
|
|
272.3 |
|
|
|
320.4 |
|
|
|
340.2 |
|
|
|
|
|
|
|
|
|
|
|
Underwriting (loss) profit |
|
|
(17.1 |
) |
|
|
(145.3 |
) |
|
|
93.0 |
|
Investment income and realized investment gains |
|
|
313.8 |
|
|
|
604.3 |
|
|
|
377.5 |
|
Interest and other expense |
|
|
31.2 |
|
|
|
36.7 |
|
|
|
39.4 |
|
Costs related to early retirement of debt |
|
|
— |
|
|
|
0.4 |
|
|
|
21.2 |
|
|
|
|
|
|
|
|
|
|
|
Income before income taxes and equity in earnings of investees |
|
|
265.5 |
|
|
|
421.9 |
|
|
|
409.9 |
|
Income tax expense |
|
|
63.6 |
|
|
|
88.6 |
|
|
|
140.0 |
|
|
|
|
|
|
|
|
|
|
|
Income before equity in earnings of investees |
|
|
201.9 |
|
|
|
333.3 |
|
|
|
269.9 |
|
Equity in earnings (losses) of investees, net of tax |
|
|
0.1 |
|
|
|
(0.5 |
) |
|
|
23.3 |
|
|
|
|
|
|
|
|
|
|
|
Net income |
|
$ |
202.0 |
|
|
$ |
332.8 |
|
|
$ |
293.2 |
|
|
|
|
|
|
|
|
|
|
|
|
|
|
|
|
|
|
|
|
|
|
|
|
Loss and LAE ratio |
|
|
67.3 |
% |
|
|
82.5 |
% |
|
|
63.5 |
% |
Underwriting expense ratio |
|
|
34.9 |
|
|
|
32.1 |
|
|
|
28.7 |
|
|
|
|
|
|
|
|
|
|
|
Combined ratio |
|
|
102.2 |
% |
|
|
114.6 |
% |
|
|
92.2 |
% |
|
|
|
|
|
|
|
|
|
|
The decrease in net income in 2009 as compared to 2008 was primarily attributable to substantially
lower net realized investment earnings, partially offset by improved underwriting results. Lower
investment earnings in 2009 were principally due to the non-recurrence of significant gains
realized on derivative and short-sale securities in 2008. Offsetting the lower gains on
derivatives and short-sale securities were higher realized gains on fixed income and equity
securities, mark-to-market accounting gains on investments accounted for at fair value, higher
investment income, primarily higher earnings from investments at equity, and lower other than
temporary impairment charges in 2009 as compared to 2008. The increase in underwriting income and
corresponding improvement in the loss and LAE ratios was principally due to a lack of major
catastrophes in 2009. By comparison, the 2008 loss ratio was adversely affected by one-time
charges, including: (i) a charge of $75.5 million arising from the commutation of a reinsurance
contract (7.6 loss ratio points); (ii) catastrophe losses associated with Hurricanes Gustav and Ike
of $71.5 million (7.2 loss ratio points); and (iii) a charge of $25.5 million associated with the
aforementioned lawsuit (2.6 loss ratio points). Excluding the effects of the reinsurance
commutation, Hurricanes Gustav and Ike and the asbestos lawsuit activity, the loss and LAE ratio
was 65.1% in 2008 as compared to 67.3% in 2009, the increase being primarily due to lower favorable
prior year loss development and the cumulative effect of the weak economy and challenging market
conditions.
The increase in net income in 2008 as compared to 2007 was primarily due to a significant increase
in investment earnings and lower costs related to early retirement of debt, partially offset by
substantially lower underwriting income due to catastrophes and other charges discussed above. The
increase in investment earnings was predominantly due to higher net realized gains on the Company’s
derivative and short-sale securities as well as an increase in net realized gains on sales of U.S.
Treasury securities, partially offset by higher other than temporary impairment charges, higher
mark-to-market accounting losses incurred on investments accounted for at fair value and lower
investment income. Underwriting results were substantially lower in 2008 as compared to 2007,
primarily attributable to the adverse effects of the reinsurance commutation, losses associated
with Hurricane Gustav and an asbestos lawsuit settlement as noted above.
Lower equity in earnings of investees in 2008 as compared to 2007, was principally due to lower
earnings from Northbridge Financial Corporation (“Northbridge”), an affiliated company, due to a
change in accounting for Northbridge from equity method to fair value effective January 1, 2008.
For further discussion of loss development in each year, see “—Results of Operations—Losses and
Loss Adjustment Expenses”. For further discussion of investment results, see “—Results of
Operations—Investment Results”, “—Liquidity and Capital Resources” and Note 3 to the consolidated
financial statements included in “Item 8. Financial Statements and Supplementary Data”.
52
Underwriting Results
Gross Premiums Written
Gross premiums written by line of business are summarized as follows:
| |
|
|
|
|
|
|
|
|
|
|
|
|
|
|
|
|
|
|
|
|
| |
|
Years Ended December 31, |
|
| |
|
|
|
|
|
|
|
|
|
2009 |
|
|
|
|
|
|
2008 |
|
| |
|
|
|
|
|
|
|
|
|
Increase/ |
|
|
|
|
|
|
Increase/ |
|
| (dollars in millions) |
|
2009 |
|
|
2008 |
|
|
(Decrease) |
|
|
2007 |
|
|
(Decrease) |
|
General liability |
|
$ |
188.5 |
|
|
$ |
216.3 |
|
|
$ |
(27.8 |
) |
|
$ |
251.5 |
|
|
$ |
(35.2 |
) |
Workers’ compensation |
|
|
188.5 |
|
|
|
196.0 |
|
|
|
(7.5 |
) |
|
|
258.9 |
|
|
|
(62.9 |
) |
Commercial automobile |
|
|
96.8 |
|
|
|
164.0 |
|
|
|
(67.2 |
) |
|
|
203.4 |
|
|
|
(39.4 |
) |
Property |
|
|
87.4 |
|
|
|
155.6 |
|
|
|
(68.2 |
) |
|
|
272.0 |
|
|
|
(116.4 |
) |
Commercial multi-peril |
|
|
81.5 |
|
|
|
83.8 |
|
|
|
(2.3 |
) |
|
|
88.2 |
|
|
|
(4.4 |
) |
Accident and health |
|
|
190.9 |
|
|
|
159.7 |
|
|
|
31.2 |
|
|
|
127.6 |
|
|
|
32.1 |
|
Other |
|
|
30.2 |
|
|
|
44.2 |
|
|
|
(14.0 |
) |
|
|
43.4 |
|
|
|
0.8 |
|
|
|
|
|
|
|
|
|
|
|
|
|
|
|
|
|
Total gross premiums written |
|
$ |
863.8 |
|
|
$ |
1,019.6 |
|
|
$ |
(155.8 |
) |
|
$ |
1,245.0 |
|
|
$ |
(225.4 |
) |
|
|
|
|
|
|
|
|
|
|
|
|
|
|
|
|
Other includes the following:
| |
|
|
|
|
|
|
|
|
|
|
|
|
| |
|
Years Ended December 31, |
|
| (dollars in millions) |
|
2009 |
|
|
2008 |
|
|
2007 |
|
Surety |
|
$ |
11.1 |
|
|
$ |
12.4 |
|
|
$ |
14.0 |
|
Fidelity |
|
|
6.5 |
|
|
|
17.8 |
|
|
|
13.2 |
|
Personal automobile |
|
|
6.6 |
|
|
|
7.8 |
|
|
|
9.5 |
|
Homeowners |
|
|
6.0 |
|
|
|
6.2 |
|
|
|
6.7 |
|
|
|
|
|
|
|
|
|
|
|
Total gross premiums written in other |
|
$ |
30.2 |
|
|
$ |
44.2 |
|
|
$ |
43.4 |
|
|
|
|
|
|
|
|
|
|
|
For the year ended December 31, 2009 gross premiums written associated with the Company’s core
commercial lines of business (excluding accident and health and “other” lines of business in the
table above), declined by $173.0 million, or 21.2%, as compared to the year ended December 31,
2008, primarily due to a decline in new business of approximately 11% whereas renewal retention
rates and prices on renewal policies remained flat. The decline in new business is attributable to
a reduction in both property and casualty writings. The prolonged soft market conditions and weak
economy continue to adversely affect premium growth, making it very challenging to write new
business at acceptable rates. In addition to competitive market conditions, the decline in gross
premiums written is also attributable to underwriting actions taken by the Company to reduce
unprofitable classes of business, most notably a reduction in the property and commercial
automobile lines of business. The Company continues to maintain its disciplined approach to
underwriting in a market environment that remains highly competitive, renewing business and writing
new business only where it believes rates are acceptable and terms and conditions are appropriate
for the exposure.
For the year ended December 31, 2008, gross premiums written associated with the Company’s core
commercial lines of business (excluding accident and health and “other” lines of business in the
table above) declined by $258.3 million, or 24.1%, as compared to the year ended December 31, 2007,
due to the combined effects of a decline in new business of approximately 36%, price decreases on
renewal policies of approximately 7% and a decline in renewal retention rates of approximately five
percentage points. The decline in new business was due to a reduction in both property and casualty
writings, attributable to a weak economy, competitive market conditions and underwriting actions
taken by the Company to reduce unprofitable classes of business, most notably a reduction in the
property and commercial automobile lines of business.
Overall decline in gross premiums written in the core commercial lines in 2009 and 2008 was
partially offset by growth from the accident and health business.
53
Casualty Gross Premiums Written
For the year ended December 31, 2009, gross premiums written in casualty lines, which include
workers’ compensation, general liability and commercial automobile lines of business, declined by
$102.5 million, or 17.8%, as compared to the year ended December 31, 2008, due to a decline in new
business of approximately 10%, reduced audit premiums and reduced renewal exposure due to the
economy, concurrent with a lower renewal premium base, although renewal retention rates increased
by approximately two percentage points and prices on renewal policies remained level. In addition,
the significant reduction in commercial automobile gross premiums written in 2009 as compared to
2008 and 2007 is due to the Company more aggressively reducing its exposure to transportation
accounts where loss experience has been unfavorable. The reduction in general liability largely
reflects a decrease in the non-admitted casualty business, primarily related to the impact of the
recession on the Company’s construction business. Aside from a modest improvement in California
workers’ compensation rates, casualty business across the industry is continuing to suffer from
inadequate rates. California workers’ compensation gross premiums written totaled $73.3 million,
$65.7 million and $77.5 million in 2009, 2008 and 2007, respectively
For the year ended December 31, 2008, gross premiums written in casualty lines, which include
workers’ compensation, general liability and commercial automobile lines of business, declined by
$137.5 million, or 19.3%, as compared to the year ended December 31, 2007, due to a decline in new
business of approximately 30%, price decreases on renewal policies of approximately 6% and a
decrease in renewal retention rates of approximately five percentage points. The decline in new
business was most significant for wholesale broker produced casualty business, although casualty
new business was down for all producer categories. Pricing pressure for casualty accounts
intensified countrywide in 2007 and continued throughout 2008, particularly for larger and middle
market accounts, with competitors focusing on retaining their renewals. In addition, casualty
gross premiums written in the commercial automobile line were also impacted by underwriting actions
taken by the Company as respects the commercial automobile business.
Property Gross Premiums Written
For the year ended December 31, 2009, gross premiums written in property lines, which include the
property and commercial multi-peril lines of business, decreased by $70.5 million, or 29.4%, as
compared to the year ended December 31, 2008, primarily due to a decline in new business of
approximately 13%, price decreases on renewal policies of approximately 1% and a decrease in
renewal retention rates of approximately four percentage points. In addition to soft market
conditions which have significantly affected the Company’s property business, the decrease in
property gross premiums written in 2009 as compared to 2008 and 2007, is also due to a reduction in
habitational business, where loss ratios have been higher than the remainder of the book of
business, as well as a reduction in accounts with larger total insured values.
For the year ended December 31, 2008, gross premiums written in property lines, which include the
property and commercial multi-peril lines of business, decreased by $120.8 million, or 33.5%, as
compared to the year ended December 31, 2007, primarily due to a decline in new business of
approximately 47%, price decreases on renewal policies of approximately 9% and a decrease in
renewal retention rates of approximately five percentage points. The decline in gross premiums was
due to the combined effects of soft market conditions and specific underwriting actions taken by
the Company.
The property market continues to experience downward pressure on rates, particularly in
non-catastrophe zones. In the catastrophe zones, more recently, capacity has increased and rates
have been leveling off.
Other Gross Premiums Written
For the years ended December 31, 2009 and 2008, other gross premiums written, which include the
accident and health, surety, fidelity, personal automobile and homeowners lines of business,
increased by $17.2 million, or 8.4%, and $32.9 million, or 19.2%, respectively, as compared to the
prior year periods. The increase in both years was primarily due to growth in the Company’s
accident and health book of business. Previously written in the “B++” rated Fairmont companies,
the accident and health business continues to benefit from Crum & Forster’s “A” A.M. Best rating,
which has resulted in the Company acquiring several new programs since 2007 that have contributed
to business growth. The growth in 2009 has primarily come from the employer stop loss business.
Additionally, in general, the accident and health business is not aligned with the traditional
property and casualty market cycle which has been experiencing soft market conditions.
54
Net Premiums Written
Net premiums written by line of business are summarized as follows:
| |
|
|
|
|
|
|
|
|
|
|
|
|
|
|
|
|
|
|
|
|
|
|
|
|
| |
|
Years Ended December 31, |
|
| |
|
2009 |
|
|
2008 |
|
|
2007 |
|
| (dollars in millions) |
|
$ |
|
|
%1 |
|
|
$ |
|
|
%1 |
|
|
$ |
|
|
%1 |
|
General liability |
|
$ |
137.5 |
|
|
|
72.9 |
% |
|
$ |
172.9 |
|
|
|
80.0 |
% |
|
$ |
213.2 |
|
|
|
84.8 |
% |
Workers’ compensation |
|
|
185.3 |
|
|
|
98.3 |
% |
|
|
192.1 |
|
|
|
98.0 |
% |
|
|
252.6 |
|
|
|
97.6 |
% |
Commercial automobile |
|
|
94.1 |
|
|
|
97.2 |
% |
|
|
159.6 |
|
|
|
97.3 |
% |
|
|
199.7 |
|
|
|
98.2 |
% |
Property |
|
|
65.2 |
|
|
|
74.6 |
% |
|
|
115.2 |
|
|
|
74.0 |
% |
|
|
212.0 |
|
|
|
77.9 |
% |
Commercial multi-peril |
|
|
75.7 |
|
|
|
92.9 |
% |
|
|
77.8 |
|
|
|
92.8 |
% |
|
|
81.5 |
|
|
|
92.4 |
% |
Accident and health |
|
|
130.2 |
|
|
|
68.2 |
% |
|
|
117.7 |
|
|
|
73.7 |
% |
|
|
103.9 |
|
|
|
81.4 |
% |
Other |
|
|
28.4 |
|
|
|
94.0 |
% |
|
|
35.9 |
|
|
|
81.2 |
% |
|
|
36.7 |
|
|
|
84.6 |
% |
|
|
|
|
|
|
|
|
|
|
|
|
|
|
|
|
|
|
|
|
|
|
Total net premiums written |
|
$ |
716.4 |
|
|
|
82.9 |
% |
|
$ |
871.2 |
|
|
|
85.4 |
% |
|
$ |
1,099.6 |
|
|
|
88.3 |
% |
|
|
|
|
|
|
|
|
|
|
|
|
|
|
|
|
|
|
|
|
|
|
| |
|
|
| 1 |
|
Percentage represents the percentage of net premiums written to gross premiums
written. |
For the years ended December 31, 2009 and 2008, net premiums written decreased by $154.8
million, or 17.8%, $228.4 million, or 20.8%, respectively, as compared to the prior year periods.
The decrease in both years was generally in line with the decrease in gross premiums written. The
lower percentage of net to gross premiums written in 2009 in the general liability line was due to
increased reinsurance rates and the purchasing of additional reinsurance coverage on the umbrella
book of business, whereas the lower percentage for accident and health was due to the purchase of
additional reinsurance principally related to the medical stop loss business.
Premiums Earned
Premiums earned by line of business are summarized as follows:
| |
|
|
|
|
|
|
|
|
|
|
|
|
| |
|
Years Ended December 31, |
|
| (dollars in millions) |
|
2009 |
|
|
2008 |
|
|
2007 |
|
General liability |
|
$ |
146.6 |
|
|
$ |
194.3 |
|
|
$ |
229.0 |
|
Workers’ compensation |
|
|
188.2 |
|
|
|
218.4 |
|
|
|
258.0 |
|
Commercial automobile |
|
|
119.0 |
|
|
|
187.2 |
|
|
|
210.4 |
|
Property |
|
|
88.7 |
|
|
|
164.4 |
|
|
|
267.5 |
|
Commercial multi-peril |
|
|
76.5 |
|
|
|
79.9 |
|
|
|
80.5 |
|
Accident and health |
|
|
130.2 |
|
|
|
117.7 |
|
|
|
103.9 |
|
Other |
|
|
32.1 |
|
|
|
36.1 |
|
|
|
36.8 |
|
|
|
|
|
|
|
|
|
|
|
Total premiums earned |
|
$ |
781.3 |
|
|
$ |
998.0 |
|
|
$ |
1,186.1 |
|
|
|
|
|
|
|
|
|
|
|
Premiums earned reflect the amount of net premiums written applicable to the portion of the policy
term that expires in a given period. The Company generally earns premiums on a pro-rata basis over
the period in which the coverage is provided. For the year ended December 31, 2009, premiums
earned decreased by $216.7 million, or 21.7%, as compared to the year ended December 31, 2008. For
the year ended December 31, 2008, premiums earned decreased by $188.1 million, or 15.9%, as
compared to the year ended December 31, 2007. For both years, the decrease in premiums earned was
generally comparable to the decrease in net premiums written.
55
Losses and Loss Adjustment Expenses
The Company’s incurred losses and LAE are summarized as follows:
| |
|
|
|
|
|
|
|
|
|
|
|
|
|
|
|
|
|
|
|
|
|
|
|
|
| |
|
Years Ended December 31, |
|
| |
|
2009 |
|
|
2008 |
|
|
2007 |
|
| (dollars in millions) |
|
Losses |
|
|
Ratio |
|
|
Losses |
|
|
Ratio |
|
|
Losses |
|
|
Ratio |
|
Accident year, as reported |
|
$ |
566.0 |
|
|
|
72.4 |
% |
|
$ |
802.8 |
|
|
|
80.4 |
% |
|
$ |
816.8 |
|
|
|
68.9 |
% |
|
|
|
|
|
|
|
|
|
|
|
|
|
|
|
|
|
|
|
|
|
|
(Favorable) adverse development of prior
years’ losses and LAE before impact of
corporate aggregate reinsurance: |
|
|
|
|
|
|
|
|
|
|
|
|
|
|
|
|
|
|
|
|
|
|
|
|
Accident year 2008 |
|
|
10.6 |
|
|
|
|
|
|
|
|
|
|
|
|
|
|
|
|
|
|
|
|
|
Accident year 2007 |
|
|
(19.5 |
) |
|
|
|
|
|
|
(17.1 |
) |
|
|
|
|
|
|
— |
|
|
|
|
|
Accident year 2006 |
|
|
(28.7 |
) |
|
|
|
|
|
|
(39.0 |
) |
|
|
|
|
|
|
(10.2 |
) |
|
|
|
|
Accident year 2005 |
|
|
(28.9 |
) |
|
|
|
|
|
|
(1.9 |
) |
|
|
|
|
|
|
(26.9 |
) |
|
|
|
|
Accident year 2004 |
|
|
(3.0 |
) |
|
|
|
|
|
|
(12.3 |
) |
|
|
|
|
|
|
(41.7 |
) |
|
|
|
|
Accident year 2003 |
|
|
28.8 |
|
|
|
|
|
|
|
2.1 |
|
|
|
|
|
|
|
(1.0 |
) |
|
|
|
|
Accident year 2002 and prior |
|
|
15.7 |
|
|
|
|
|
|
|
107.2 |
|
|
|
|
|
|
|
29.6 |
|
|
|
|
|
|
|
|
|
|
|
|
|
|
|
|
|
|
|
|
|
|
|
|
|
|
|
Total (favorable) adverse development |
|
|
(25.0 |
) |
|
|
(3.2 |
) |
|
|
39.0 |
|
|
|
3.9 |
|
|
|
(50.2 |
) |
|
|
(4.2 |
) |
|
|
|
|
|
|
|
|
|
|
|
|
|
|
|
|
|
|
|
|
|
|
|
|
|
|
|
|
|
|
|
|
|
|
|
|
|
|
|
|
|
|
|
|
|
|
|
Impact of corporate aggregate reinsurance: |
|
|
|
|
|
|
|
|
|
|
|
|
|
|
|
|
|
|
|
|
|
|
|
|
Amortization of deferred gain |
|
|
(14.9 |
) |
|
|
(1.9 |
) |
|
|
(18.9 |
) |
|
|
(1.8 |
) |
|
|
(13.7 |
) |
|
|
(1.2 |
) |
|
|
|
|
|
|
|
|
|
|
|
|
|
|
|
|
|
|
|
Incurred losses and LAE |
|
$ |
526.1 |
|
|
|
67.3 |
% |
|
$ |
822.9 |
|
|
|
82.5 |
% |
|
$ |
752.9 |
|
|
|
63.5 |
% |
|
|
|
|
|
|
|
|
|
|
|
|
|
|
|
|
|
|
|
The Company’s losses and LAE reflect the effect of amortization of deferred gain on retroactive
reinsurance. For further discussion of the accounting for reinsurance coverage and the
amortization of deferred income on retroactive reinsurance, see “Item 1. Business—Reinsurance” and
Note 7 to the consolidated financial statements included in “Item 8. Financial Statements and
Supplementary Data”.
In 2009, the Company recognized net favorable prior year loss development of $25.0 million (3.2
loss ratio points) prior to corporate aggregate reinsurance activity. Included in the favorable
loss development is an insurance recovery of $13.8 million (1.8 loss ratio points) associated with
the settlement of an asbestos lawsuit. Excluding this recovery, the Company recognized net
favorable loss development after corporate aggregate reinsurance activity of $26.1 million (3.3
loss ratio points), including $14.9 million of favorable development related amortization of
deferred gains on retroactive reinsurance. The favorable development was primarily attributable to
favorable emergence in workers’ compensation, commercial multi-peril and property lines of
business, partially offset by adverse emergence in commercial automobile and asbestos liabilities.
In 2008, the Company recognized net adverse prior year loss development of $39.0 million (3.9 loss
ratio points) prior to corporate aggregate reinsurance activity. Included in the adverse loss
development is $84.3 million (8.4 loss ratio points) attributable to a loss on commutation of a
reinsurance contract ($75.5 million after amortization of related deferred gain) and $25.5 million
(2.6 loss ratio points) attributable to the settlement of an asbestos lawsuit. Excluding these one
time charges, the Company recognized net favorable loss development after corporate aggregate
reinsurance activity of $89.7 million (9.0 loss ratio points) including $18.9 million of favorable
development related to amortization of deferred gains on retroactive reinsurance. The favorable
development was primarily in the workers’ compensation and general liability lines of business,
reflecting favorable loss emergence in almost all accident years, partially offset by unfavorable
ALAE emergence in general liability for both latent and non-latent exposures. Specifically,
favorable development in the workers’ compensation line was principally attributable to favorable
results in non-California medical reserves for older accident years and non-California indemnity
reserves for more recent accident years.
In 2007, the Company recognized net favorable prior year loss development of $50.2 million (4.2
loss ratio points) prior to corporate aggregate reinsurance activity. The net favorable
development was comprised of favorable development across all major casualty lines as well as
commercial multi-peril, with the largest redundancy being recognized in workers’ compensation.
Specifically, favorable development in the workers’ compensation line was principally attributable
to favorable results in non-California for older accident years due to favorable claims settlements
and continued recognition of favorable development for California in accident years 2004 and 2005
due to the impact of industry reforms. Favorable development for general liability and commercial
multi-peril exposures in accident years 2003 through 2006 was due to the selection of faster loss
development factors, recognizing decreased loss activity in those years. The favorable development
in these lines was partially offset by $54.5 million of adverse development of asbestos,
environmental and other latent liabilities.
56
Accident year loss and LAE ratios, as estimated at December 31, 2009 by line of business, are
summarized as follows:
| |
|
|
|
|
|
|
|
|
|
|
|
|
| |
|
Accident Years Ended December 31, |
|
| |
|
2009 |
|
|
2008 |
|
|
2007 |
|
General liability |
|
|
68.8 |
% |
|
|
73.3 |
% |
|
|
58.9 |
% |
Workers’ compensation |
|
|
80.7 |
% |
|
|
81.2 |
% |
|
|
69.4 |
% |
Commercial automobile |
|
|
77.9 |
% |
|
|
80.1 |
% |
|
|
76.9 |
% |
Property |
|
|
72.3 |
% |
|
|
121.4 |
% |
|
|
63.5 |
% |
Commercial multi-peril |
|
|
54.4 |
% |
|
|
47.0 |
% |
|
|
54.7 |
% |
Accident and health |
|
|
72.4 |
% |
|
|
71.6 |
% |
|
|
65.8 |
% |
Other |
|
|
63.7 |
% |
|
|
61.5 |
% |
|
|
60.3 |
% |
Accident year loss and LAE ratio |
|
|
72.4 |
% |
|
|
81.5 |
% |
|
|
65.8 |
% |
The accident year loss and LAE ratio decreased to 72.4% in 2009 from 81.5% in 2008, primarily due
to lower catastrophe losses. The accident year loss and LAE ratio increased to 81.5% in 2008 as
compared to 65.8% in 2007, primarily due to higher catastrophe losses (principally the effects of
Hurricanes Gustav and Ike which added 6.6 loss ratio points) as well as the adverse effect of
current unfavorable pricing trends and market conditions across all lines of business.
Catastrophes added approximately 1.5, 8.5 and 1.3 points to the Company’s loss and LAE ratio in
2009, 2008 and 2007, respectively, and added approximately 13.1, 51.6 and 5.6 points to the
property accident year loss and LAE ratios. In addition to catastrophes, the 2008 property
accident year loss ratio was also impacted by an increased frequency of large habitational fire
losses. The commercial automobile loss ratio declined in 2009 as a result of specific underwriting
actions taken by the Company to reduce exposure to unprofitable transportation accounts. The
commercial multi-peril loss ratio increased from 2008 to 2009 due to several large property claims
in the second half of 2009.
The accident year loss and LAE ratios represent management’s estimate, at December 31, 2009, of the
ultimate cost, expressed as a percentage of net premiums earned for each respective year, of
covered claims or events, including settlement costs. For casualty lines of business in
particular, where the “tail”, or period from the occurrence of the claim to final settlement, may
span several years, the estimates are based on a number of assumptions and, accordingly, are
subject to significant variability. See “—Critical Accounting Policies and Estimates— Unpaid
Losses and Loss Adjustment Expenses”.
Underwriting Expenses
Underwriting expenses include policy acquisition costs (costs that vary with and are primarily
related to the acquisition of new and renewal policies and are comprised of commissions paid to
producers and premium taxes) and other operating expenses associated with the Company’s
underwriting activities, such as salaries and benefits, information technology costs and rent. The
Company’s underwriting expense ratio was 34.9%, 32.1% and 28.7% for the years ended December 31,
2009, 2008 and 2007, respectively. Despite reduced other operating expenses in 2009, primarily
reflecting the combined effects of cost saving initiatives and a write-off of software development
costs of $4.2 million in 2008, the increase in the underwriting expense ratio in 2009 as compared
to 2008, is primarily attributable to a reduction in net earned premiums of approximately $216.7
million, or 22%, although general expenses were reduced by approximately $9.7 million, or 6%. The
Company is aggressively evaluating all general expenses to better align costs to premium volume in
the current economy, however, persistent soft market conditions and a weak economy will continue
to adversely affect the Company’s underwriting expense ratio.
The increase in the underwriting expense ratio in 2008 as compared to 2007, was primarily
attributable to a reduction in net earned premium of approximately 16% and an increase in other
operating expenses, largely due to higher compensation costs and higher technology costs
(reflecting the aforementioned write-off). Compensation costs in 2008 included severance costs
associated with the reduction in workforce to better align compensation costs with lower premium
volume.
57
Investment Results
Information on the Company’s investment results is summarized as follows:
| |
|
|
|
|
|
|
|
|
|
|
|
|
| |
|
Years Ended December 31, |
|
| (dollars in millions) |
|
2009 |
|
|
2008 |
|
|
2007 |
|
Average investments, including cash and cash equivalents, at book value1 |
|
$ |
3,695.0 |
|
|
$ |
4,345.5 |
|
|
$ |
4,157.9 |
|
|
|
|
|
|
|
|
|
|
|
|
|
|
|
|
|
|
|
|
|
|
|
|
Investment income |
|
$ |
163.8 |
|
|
$ |
72.4 |
|
|
$ |
143.4 |
|
Net realized investment gains |
|
|
150.0 |
|
|
|
531.9 |
|
|
|
234.1 |
|
Pre-tax equity in earnings (losses) of investees |
|
|
0.1 |
|
|
|
(0.7 |
) |
|
|
35.8 |
|
Change in unrealized investment gains and losses and foreign currency translation |
|
|
406.3 |
|
|
|
(37.9 |
) |
|
|
139.2 |
|
|
|
|
|
|
|
|
|
|
|
Total return on investments |
|
$ |
720.2 |
|
|
$ |
565.7 |
|
|
$ |
552.5 |
|
|
|
|
|
|
|
|
|
|
|
|
|
|
|
|
|
|
|
|
|
|
|
|
Gross investment yield2 |
|
|
5.3 |
% |
|
|
2.5 |
% |
|
|
5.1 |
% |
Net investment yield2 |
|
|
4.4 |
% |
|
|
1.6 |
% |
|
|
4.3 |
% |
Total return on investments |
|
|
19.5 |
% |
|
|
13.0 |
% |
|
|
13.3 |
% |
| |
|
|
| 1 |
|
Includes book value of assets pledged for derivatives and short-sale obligations of
$24.0 million, $4.4 million and $1,047.4 million at December 31, 2009, 2008 and 2007,
respectively. |
| |
| 2 |
|
Including pre-tax equity in earnings (losses) of investees. |
The Company manages its investment portfolio with an emphasis on total return on assets under
management. Total return for the period is the sum of investment income (including pre-tax equity
in earnings or losses of investees), net realized investment gains and losses and changes in the
market value of the portfolio expressed as a percentage of the average book value of the portfolio
during the period. General economic conditions, stock market conditions, fluctuations in interest
rates and many other factors can affect the returns on investments and the Company’s ability to
control the timing of the realization of investment income. In 2008, the Company significantly
reduced its credit default swap portfolio and closed out its equity hedging positions, realizing
significant gains and reinvesting the proceeds to a large extent in equity securities. As a
result, the investment portfolio is exposed to a larger degree than in previous reporting periods
to volatility in the equity markets, however, the Company has protected a portion of its equity and
equity related holdings against a decline in equity markets by entering into equity index total
return swaps. The significant increase in the annualized total return on investments for the year
ended December 31, 2009 as compared to 2008 and 2007, is primarily attributable to the improvement
in financial market conditions in the third and fourth quarters of 2009, resulting in unrealized
appreciation of the investment portfolio at the end of 2009.
The year over year decline in the average book value of investments is largely attributable to cash
used in operations in 2009 of $402.4 million, as well as dividends paid to Fairfax of $115.0
million, both of which were funded from the proceeds of sales of fixed income securities.
Investment Income
The increase in investment income of $91.4 million, or 126.2%, in 2009 as compared to 2008 is
primarily due to the combined effects of: (i) higher earnings from the Company’s investments at
equity, attributable to the underlying improvement in the equity markets in 2009; (ii) higher
dividends from equity securities due to a shift in portfolio composition to equity securities since
the fourth quarter of 2008; and (iii) lower investment expenses related principally to the Standard
& Poor’s Depositary Receipts (“SPDRs”) short-sales and total return swaps which were closed out in
the latter half of 2008. Offsetting these year-over-year increases in investment income was a
decline in interest on cash and cash equivalents due to lower cash collateral held in 2009 as
compared to 2008, related to the SPDRs short-sales and a decline in year-over-year short-term
interest rates.
The decrease in investment income of $71.0 million, or 49.5%, in 2008 as compared to 2007, was
primarily driven by substantially lower earnings from investments at equity which include
partnership investments, attributable to depressed equity market conditions, and a year-over-year
decline in average short-term interest rates. Losses from investments at equity were $(51.3)
million in 2008 as compared to earnings of $13.0 million in 2007. In addition, 2008 investment
income was also affected by higher investment expenses, attributable to higher expenses on the
SPDRs short-sales and total return swaps, as well as higher incentive management fees. The Company
executed an additional $320 million SPDRs short-sales in the latter half of 2007 and a further $105
million of SPDRs total return swaps in July 2008 which contributed to the increased SPDRs expense
for 2008.
58
Net Realized Investment Gains
Net realized investment gains for the years ended December 31, 2009, 2008 and 2007 are summarized
as follows:
| |
|
|
|
|
|
|
|
|
|
|
|
|
| |
|
Years Ended December 31, |
|
| (dollars in millions) |
|
2009 |
|
|
2008 |
|
|
2007 |
|
Fixed income securities, available-for-sale |
|
$ |
86.5 |
|
|
$ |
143.3 |
|
|
$ |
4.4 |
|
Fixed income securities, held-for-trading |
|
|
75.0 |
|
|
|
(90.9 |
) |
|
|
(31.0 |
) |
Equity securities |
|
|
69.6 |
|
|
|
2.8 |
|
|
|
27.9 |
|
Investments at equity |
|
|
2.3 |
|
|
|
(1.6 |
) |
|
|
10.9 |
|
Derivatives and other invested assets |
|
|
27.4 |
|
|
|
673.0 |
|
|
|
247.3 |
|
|
|
|
|
|
|
|
|
|
|
|
|
|
260.8 |
|
|
|
726.6 |
|
|
|
259.5 |
|
|
|
|
|
|
|
|
|
|
|
|
|
|
|
|
|
|
|
|
|
|
|
|
Other than temporary impairment charges: |
|
|
|
|
|
|
|
|
|
|
|
|
Equity securities |
|
|
(107.3 |
) |
|
|
(190.3 |
) |
|
|
(22.4 |
) |
Fixed income securities |
|
|
(3.5 |
) |
|
|
(4.4 |
) |
|
|
(3.0 |
) |
|
|
|
|
|
|
|
|
|
|
|
|
|
(110.8 |
) |
|
|
(194.7 |
) |
|
|
(25.4 |
) |
|
|
|
|
|
|
|
|
|
|
Total pre-tax net realized investment gains |
|
$ |
150.0 |
|
|
$ |
531.9 |
|
|
$ |
234.1 |
|
|
|
|
|
|
|
|
|
|
|
The decrease in net realized investment gains of $381.9 million, or 71.8%, in 2009 as compared to
2008, was principally due to net realized losses on the Company’s derivative securities, as
compared to significant realized gains in 2008, partially offset by net realized gains on
held-for-trading fixed income securities and other invested assets, primarily mark-to-market
accounting gains attributable to changes in fair value, as compared to mark-to-market losses in
2008, higher realized gains on sales of equity securities and lower other than temporary impairment
charges.
The increase in net realized investment gains of $297.8 million, or 127.2%, in 2008 as compared to
2007 was principally due to higher net realized gains on the Company’s derivative securities and
short-sale obligations, attributable to widening credit spreads and declining equity markets and
higher net realized gains on sales of fixed income securities, primarily U.S. Treasuries, partially
offset by higher mark-to-market accounting losses attributable to the change in fair value of
held-for-trading fixed income securities and other invested assets, and higher other than temporary
impairment charges.
Net realized losses on the Company’s derivative securities in 2009 include $9.1 million of net
losses on credit default swaps and $22.3 million of net losses on total return swaps. By
comparison, net realized gains on derivatives and short-sales in 2008 include $362.1 million of net
gains on total return swaps, $283.5 million of net gains related to credit default swaps and $70.3
million of net gains on SPDRs and common stock short-sale obligations. Net realized gains on
derivatives and short-sale obligations in 2007 include $229.7 million of net gains related to
credit default swaps and $15.4 million of net gains on SPDRs and common stock short-sales. For
further details on realized gains and losses incurred on the Company’s derivatives and short-sale
obligations, see Note 3 to the consolidated financial statements
included in “Item 8. Financial Statements and Supplementary Data”. At December 31, 2009, the
Company owned $1.6 billion notional amount of credit default swaps with an average term to maturity
of 2.3 years, an original cost of $21.6 million and a fair value of $20.0 million.
Gains on other invested assets in 2009 are principally attributable to mark-to-market gains of
$51.5 million and $4.9 million on the Company’s investments in Odyssey and Advent, respectively,
affiliated companies for which the Company has elected the fair value option. By comparison,
losses on other invested assets in 2008 were principally attributable to mark-to-market losses of
$40.8 million related to the change in fair value of the Company’s investment in Northbridge, an
affiliated company, which the Company sold in December 2008.
Included in realized investment gains in 2009, 2008 and 2007 were $110.8 million, $194.7 million
and $25.4 million, respectively, of other than temporary impairment charges, primarily related to
write downs of equity securities in all three years. The impairments recognized in 2009 and 2008
were primarily due to the increased volatility in the financial markets resulting from the global
credit and liquidity crisis that began in 2007.
Pre-tax Equity in Earnings (Losses) of Investees
Pre-tax equity in earnings (losses) of investees in 2009 and 2008 were not material. The decrease
in pre-tax equity in earnings (losses) of investees to $(0.7) million in 2008 from $35.8 million in
2007 was primarily attributable to a reduction in earnings from Northbridge, which was previously
accounted for under the equity method of accounting prior to January 1, 2008, when the Company
elected the fair value option for Northbridge under ASC 825, Financial Instruments. The Company
sold its investment in Northbridge in December 2008.
For further details of investments, see Note 3 to the consolidated financial statements included in
“Item 8. Financial Statements and Supplementary Data”.
59
Interest and Other Expense
Interest and other expense, excluding costs related to early retirement of debt, was $31.1 million,
$36.7 million and $39.4 million in 2009, 2008 and 2007, respectively. The lower expense in 2009 as
compared to 2008 was due to lower corporate overhead expense, primarily lower charitable
contributions and lower severance payments. The lower expense in 2008 as compared to 2007 was
attributable to both lower corporate overhead expenses and lower interest expense on long-term
debt. The lower corporate overhead expense was due in part to a retirement expense incurred in
2007 in respect of the Company’s then President and Chief Executive Officer, partially offset by
higher charitable contributions. The lower interest expense was attributable to the refinancing of
the Company’s long-term debt in mid-2007 at a lower interest rate.
Income Taxes
The effective income tax rate (including income taxes on equity in earnings of investees) was
24.0%, 21.0% and 34.2% for the years ended December 31, 2009, 2008 and 2007, respectively. For
2009, the difference between the Company’s effective income tax rate and statutory rate of 35%
primarily reflects net tax benefits of $19.2 million (7.2%) from tax exempt municipal bonds and
$6.4 million (2.4%) from dividend received deductions. For 2008, in addition to dividend received
deductions, the difference primarily reflects benefits recognized related to the utilization of
foreign tax credits associated with the sale of the Company’s investment in Northbridge. In
December 2008, the Company sold its investment in Northbridge to an affiliated foreign company,
which resulted in permanent tax benefits of approximately $51.6 million (12.2%), mainly as a result
of the utilization of foreign tax credits. For 2007, the difference is primarily due to dividend
received deductions. For further discussion of income taxes, see Note 9 to the consolidated
financial statements included in “Item 8. Financial Statements and Supplementary Data”.
Liquidity and Capital Resources
Holding Company
As a holding company with no direct operations, Crum & Forster Holdings Corp.’s (referred to in
this section as the Company) assets consist primarily of its investments in the capital stock of
its insurance subsidiaries. See “Item 15. Exhibits and Financial Statement Schedules
¾ Schedule II, Holding Company Condensed Financial Statements”. The Company requires cash to
meet its annual debt service obligations (approximately $26 million per year), to pay corporate
expenses, including income taxes, and, ultimately, to repay the $330.0 million aggregate principal
amount of senior notes due in 2017.
The Company’s ability to satisfy its corporate obligations is primarily dependent on the dividend
paying capacity of its subsidiaries and income tax payments from them under the Company’s tax
sharing agreement. State insurance laws restrict the amount of shareholder dividends that
insurance companies may pay without prior approval of regulatory authorities. The ability of the
Company’s insurance subsidiaries to pay dividends depends, among other things, on such subsidiaries
having positive statutory earned surplus. Dividends in excess of certain thresholds are considered
“extraordinary” and require prior regulatory approval. The Company’s principal insurance
subsidiaries are US Fire and North River. At December 31, 2009, US Fire reported statutory earned
surplus of $615.6 million and North River reported statutory earned surplus of $231.2 million. In
2009, the insurance subsidiaries paid dividends totaling $138.4 million to the Company. In March
2009, both US Fire and North River received approval from the Delaware Department of Insurance and
New Jersey Department of Banking and Insurance, respectively, to pay extraordinary dividends.
Although the amount of the dividend for both companies was 10% of prior year-end surplus (the
amount of an ordinary dividend), the extraordinary dividend approvals allowed acceleration of the
dividend payments from October 2009 to March 2009 for US Fire and from May 2009 to March 2009 for
North River. On March 27, 2009, North River paid a cash dividend in the amount of $44.1 million to
the Company and on March 30, 2009, US Fire paid a cash dividend in the amount of $94.3 million to
the Company. The maximum dividends that can be paid by the insurance subsidiaries to the Company
in 2010, without prior regulatory approval, are $163.8 million.
Cash used in financing activities was $115.0 million, $339.5 million and $118.5 million in 2009,
2008 and 2007, respectively and was primarily in respect of dividends paid to Fairfax as well as
refinancing of the Company’s long-term debt in 2007. On April 16, 2009 and December 22, 2009, the
Company paid cash dividends to Fairfax of $100.0 million and $15.0 million, respectively. In 2008,
the Company paid cash dividends to Fairfax of $335.2 million and in-kind dividends in the form of
fixed income securities, at fair value, of $158.8 million, resulting in total dividends paid to
Fairfax of $494.0 million. In 2007, the Company paid cash dividends to Fairfax of $128.8 million
and in-kind dividends of $54.9 million in the form of promissory notes.
In May 2007, the Company issued pursuant to a private offering (the “Offering”) $330.0 million
aggregate principal amount of 7-3/4% senior notes due May 1, 2017 at an issue price of 100%. Net
proceeds of the Offering to the Company, after commissions and expenses, of approximately $325.1
million were used to repurchase $295.7 million of the Company’s outstanding $300 million aggregate
principal amount of 10-3/8% senior notes due June 15, 2013 (the “2013 Notes”), through a tender
offer which the Company completed in May 2009. The Company paid approximately $325.7 million to
purchase the 2013 Notes tendered. For further information on the Company’s long-term debt see Note
8 to the consolidated financial statements included in “Item 8. Financial Statements and
Supplementary Data”.
60
Shareholder’s equity was $1,517.7 million and $1,166.4 million at December 31, 2009 and 2008,
respectively. The increase from prior year end reflects $202.0 million of net income and net
unrealized investment gains of $263.8 million, partially offset by dividends paid to Fairfax of
$115.0 million.
Insurance Subsidiaries
At Crum & Forster’s insurance subsidiaries, cash provided by operating activities primarily
consists of premium collections, reinsurance recoveries and investment income. Cash provided from
these sources is generally used for payment of losses and LAE, policy acquisition costs, operating
expenses, ceded reinsurance premiums, income taxes and shareholder dividends, when permitted.
Variability in cash provided by and used in operations can occur for many reasons, including
changes in gross premiums written, changes in the Company’s underwriting results, natural or
man-made catastrophes, settlements of large claims including asbestos and environmental claims,
commutation of reinsurance contracts and the timing of recoveries from reinsurers, particularly as
related to claim payments for natural or man-made catastrophes and asbestos and environmental
claims.
The table below provides a summary of cash flow provided by (used in) operations under the direct
method:
| |
|
|
|
|
|
|
|
|
|
|
|
|
| |
|
Year Ended December 31, |
|
| |
|
2009 |
|
|
2008 |
|
|
2007 |
|
Premiums collected |
|
$ |
645.1 |
|
|
$ |
802.0 |
|
|
$ |
1,004.0 |
|
Net paid losses and LAE1 |
|
|
(709.3 |
) |
|
|
(443.8 |
) |
|
|
(749.2 |
) |
Other underwriting expenses paid |
|
|
(279.4 |
) |
|
|
(271.0 |
) |
|
|
(277.7 |
) |
|
|
|
|
|
|
|
|
|
|
Cash (outflow) inflow from underwriting |
|
|
(343.6 |
) |
|
|
87.2 |
|
|
|
(22.9 |
) |
Investment income received |
|
|
120.1 |
|
|
|
139.2 |
|
|
|
131.0 |
|
Interest expense paid |
|
|
(25.6 |
) |
|
|
(26.0 |
) |
|
|
(37.1 |
) |
Income taxes paid |
|
|
(153.3 |
) |
|
|
(99.5 |
) |
|
|
(76.9 |
) |
|
|
|
|
|
|
|
|
|
|
Cash (outflow) inflow from operations |
|
$ |
(402.4 |
) |
|
$ |
100.9 |
|
|
$ |
(5.9 |
) |
|
|
|
|
|
|
|
|
|
|
| |
|
|
| 1 |
|
Net paid losses and LAE paid in 2008 are net of $302.5 million of proceeds from
the commutation of a finite reinsurance contract. |
The prolonged soft market conditions in which the insurance subsidiaries are currently
operating have resulted in double digit percentage declines in premium volume in each of the last
two years. In addition, the Company initiated actions in 2008 to eliminate unprofitable classes of
business. The Company’s property business is declining most markedly; however, due to the short
tail nature of the claims, it is expected that claim payments will also decline in the relative
near term as the exposures run off. The Company’s casualty business (approximately 55% of total
gross premiums written in 2009) in general has a longer tail, meaning the period of time from the
occurrence of a claim through the settlement of a liability may extend several years into the
future and as a result cash flow may be adversely affected by claims from prior years.
Additionally, the lapse of time between payments to claimants and recoveries from reinsurers, if
collections from reinsurers are not received on a timely basis, will directly affect cash flows.
Due to this uncertainty regarding the amount and timing of settlement of unpaid claims and ultimate
recoveries from reinsurers, the insurance subsidiaries’ cash flow from operations and liquidity
needs may vary from period to period. If premium receipts continue to decline and claim payments
continue at historical norms, the Company is likely to have negative cash flow from operations in
the near future.
Cash used in operations was $402.4 million as compared to cash provided from operations of $100.9
million in 2008, which included $302.5 million of proceeds from the commutation of a finite
reinsurance contract. Excluding the commutation proceeds, cash outflow from operations was worse
by $200.8 million. The unfavorable variance from prior year is primarily attributable to lower
premium collections (related to the decline in premiums written), higher income tax payments which
are substantially related to 2008 realized investment gains and lower investment income, affected
by the negative cash flow experienced over the last two years. These unfavorable variances were
partially offset by lower net paid losses and ALAE of $37.0 million (after adjusting for $302.5
million of commutation proceeds). The Company’s underwriting cash flows continue to be negative,
reflecting declining premiums as a result of the continued soft market and recent underwriting
actions in the face of steady or only marginally declining paid losses, ceded reinsurance costs and
fixed operating expenses.
2008 cash outflow from operations of $201.6 million (excluding the aforementioned commutation
proceeds) was $195.7 million worse than 2007. The unfavorable variance from 2007 was primarily
attributable to lower premium collections and higher income tax payments related to realized
investment gains.
61
During the fourth quarter of 2008 and the first quarter of 2009, the Company made significant
purchases of fixed income and equity securities, when the Company determined that market price
levels were attractive. In doing so, it reduced its historically high levels of cash, cash
equivalents and short-term investments to lower levels. During the first quarter of 2009, the
Company sold several municipal securities with a fair market value of approximately $146.2 million
to third-parties and Fairfax affiliates to meet operating needs and restore its cash and short-term
investments position to more normal levels. At December 31, 2009, the insurance subsidiaries held
$311.8 million in highly liquid, short-term and other marketable securities to meet their operating
needs and provide available cash in the event of unanticipated large claim payments. Management
believes that the insurance subsidiaries have sufficient cash and short-term investments, that
together with cash generated from future investing operations, will meet their operating liquidity
needs.
The aggregate carrying value of the Company’s investment portfolio, including cash and cash
equivalents and assets pledged for derivatives, was approximately $4.0 billion at December 31, 2009
and 2008, of which $311.8 million and $709.8 million was held in cash, cash equivalents and
short-term investments at December 31, 2009 and 2008, respectively. For detailed information on the
Company’s investment portfolio, see Note 3 to the consolidated financial statements included in
“Item 8. Financial Statements and Supplementary Data”.
The Company’s investment portfolio has exposure to credit risk primarily related to fixed income
securities. Management attempts to control this exposure by emphasizing investment grade credit
quality in the fixed income securities purchased, although the Company invests, to a limited
extent, in non-investment grade fixed income securities if market opportunities avail. Management
believes that this concentration in investment grade securities reduces the Company’s exposure to
credit risk to an acceptable level. The Company holds a small amount of mortgage-backed securities
(approximately 3% of the total investment portfolio of $4.0 billion), purchased at deep discounts
to par. The Company has purchased credit default swaps, referenced to various issuers in the
banking, mortgage and insurance sectors of the financial services industry, which serve as economic
hedges against declines in the fair value of the Company’s financial assets. Counterparties to the
credit default swaps expose the Company to credit risk in the event of non-performance, which the
Company endeavors to limit through the terms of agreements negotiated with the counterparties.
Pursuant to the swap agreements, the counterparties are required to pledge cash or U.S. Treasury
securities as collateral, in the event that appreciation in the fair value of the credit default
swaps meets certain thresholds. At December 31, 2009, there was no collateral held in the name of
the Company as the fair value of the Company’s credit default swap portfolio had declined
significantly through closing transactions and fair value changes. The Company believes that any
credit risk exposure, represented by the uncollateralized fair value of the credit default swaps
($20.0 million at December 31, 2009), is low given the diversification among the various
counterparties. The Company funds all its obligations relating to the credit default swaps through
the initial premium paid at purchase and as a result there are no requirements for the Company to
provide collateral.
At December 31, 2009 and 2008, 83.0% and 86.7%, respectively, of the Company’s fixed income
securities were rated investment grade. The decline in investment grade securities was due in part
to the sale of municipal securities with a fair market value of approximately $146.2 million in the
first quarter of 2009 to third-parties and Fairfax affiliates to meet operating cash needs and
restore the Company’s cash and short-term investments position to more normal levels as well as the
purchase of approximately $19.8 million of non-investment grade mortgage-backed securities. Fixed
income securities and cash and cash equivalents of $306.0 million and $431.9 million were on
deposit with various state regulatory authorities at December 31, 2009 and 2008, respectively, as
required by insurance laws.
The Company’s combined policyholders’ surplus and statutory operating leverage (the ratio of
statutory net premiums written to end of year surplus) are summarized below:
| |
|
|
|
|
|
|
|
|
|
|
|
|
| |
|
Years Ended December 31, |
|
| (dollars in millions) |
|
2009 |
|
|
2008 |
|
|
2007 |
|
Combined policyholders’ surplus |
|
$ |
1,628.2 |
|
|
$ |
1,410.6 |
|
|
$ |
1,639.8 |
|
Statutory operating leverage |
|
|
0.44 |
x |
|
|
0.62 |
x |
|
|
0.67 |
x |
Statutory surplus is an important measure utilized by management, regulators and rating agencies to
assess the Company’s ability to support its business operations. The increase in the Company’s
statutory surplus in 2009 from 2008 is principally attributable to net unrealized capital gains of
$199.4 million and statutory net income of $154.0 million, partially offset by dividends paid by
the insurance companies to Crum & Forster Holdings Corp. of $138.4 million. The decrease in the
Company’s statutory surplus in 2008 from 2007 is attributable to the payment of $511.3 million of
dividends from the insurance subsidiaries to Crum & Forster Holdings Corp. and net unrealized
capital losses of $224.2 million, partially offset by statutory net income of $484.0 million. The
Company’s ratio of statutory net premiums written to surplus, a measure of operating leverage,
improved in 2009 and, according to data from A.M. Best, was below the property and casualty
commercial lines sector ratios for 2008, 2007 and 2006 of 0.8x, 0.8x and 0.9x, respectively.
62
Contractual Obligations
Estimates of future payments pursuant to the Company’s contractual obligations at December 31,
2009 are summarized as follows:
| |
|
|
|
|
|
|
|
|
|
|
|
|
|
|
|
|
|
|
|
|
| |
|
|
|
|
|
|
|
|
|
2010 to |
|
|
2012 to |
|
|
2014 and |
|
| (dollars in millions) |
|
Total |
|
|
2009 |
|
|
2011 |
|
|
2013 |
|
|
beyond |
|
Unpaid losses and LAE |
|
$ |
2,672.6 |
|
|
$ |
723.4 |
|
|
$ |
831.8 |
|
|
$ |
419.0 |
|
|
$ |
698.4 |
|
Long-term debt, including interest payments |
|
|
521.9 |
|
|
|
25.6 |
|
|
|
51.2 |
|
|
|
51.2 |
|
|
|
393.9 |
|
Operating leases |
|
|
76.2 |
|
|
|
12.8 |
|
|
|
18.5 |
|
|
|
13.0 |
|
|
|
31.9 |
|
Other long-term liabilities |
|
|
42.0 |
|
|
|
2.1 |
|
|
|
10.3 |
|
|
|
12.0 |
|
|
|
17.6 |
|
|
|
|
|
|
|
|
|
|
|
|
|
|
|
|
|
Total contractual obligations |
|
$ |
3,312.7 |
|
|
$ |
763.9 |
|
|
$ |
911.8 |
|
|
$ |
495.2 |
|
|
$ |
1,141.8 |
|
|
|
|
|
|
|
|
|
|
|
|
|
|
|
|
|
Unpaid Losses and Loss Adjustment Expenses
The liability for unpaid losses and LAE includes reserves for unpaid reported losses and LAE and
for IBNR losses. The amounts shown above represent management’s best estimate of the expected
timing of payments for losses and LAE given information currently available. Actual results may
differ significantly from these estimates. For additional information on the Company’s unpaid
losses and LAE, see “Item 1. Business—Reserves”, “Item 1A. Risk Factors —The Company may incur a
reduction in its net income if its reserves are insufficient” and “—Critical Accounting Policies
and Estimates—Unpaid Losses and Loss Adjustment Expenses”.
Long-Term Debt, including Interest Payments
The Company has outstanding $330.0 million aggregate principal amount of 7-3/4% senior notes due
2017. Interest payments on such notes are approximately $25.6 million per year. For additional
information on the Company’s senior notes, see Note 8 to the consolidated financial statements
included in “Item 8. Financial Statements and Supplementary Data” and “– Liquidity and Capital
Resources—Holding Company”.
Operating Leases
The Company and its subsidiaries lease office space and equipment under long-term leases expiring
through the year 2025. The amounts above represent the minimum contractual rentals for such
operating leases at December 31, 2009. For more information on the Company’s operating leases, see
Note 12 to the consolidated financial statements included in “Item 8. Financial Statements and
Supplementary Data”.
Other Long-Term Liabilities
Included in other long-term liabilities are estimated payments under the Company’s long-term
incentive plans totaling $30.6 million, expected contributions to postretirement benefit plans
sponsored by the Company totaling $8.1 million and payments to former senior officers of the
Company totaling $3.3 million.
Regulatory Issues
For discussion of regulatory issues, see “Item 1. Business ¾ Insurance Regulatory Matters”.
Off-Balance Sheet Arrangements
The Company did not have any transactions, agreements or other contractual arrangements with an
unconsolidated entity that would be considered an off-balance sheet arrangement required to be
disclosed pursuant to Item 303(a)(4)of Regulation S-K.
|
|
|
| ITEM 7A. |
|
QUANTITATIVE AND QUALITATIVE DISCLOSURES ABOUT MARKET RISK |
The Company is exposed to several types of market risk related to its investment operations. These
risks are principally interest rate risk, credit risk, equity price risk and foreign currency
exchange risk. The term “market risk” refers to the risk of loss arising from adverse changes in
the fair value of financial instruments. All market sensitive instruments discussed here relate to
the Company’s investment portfolio.
Computations of the prospective effects of hypothetical interest rate, equity price and foreign
currency exchange rate changes shown below are based on numerous assumptions, including the
maintenance of the existing level and composition of fixed income, equity and foreign securities,
and should not be relied on as indicative of future results.
63
Certain shortcomings are inherent in the methods of analyses presented in the computations of the
fair value of fixed rate instruments and in the computations of the impact of potential market
movements on equity securities and foreign securities. Actual values may differ from those
projections presented should market conditions vary from assumptions used in the calculation of the
fair value of individual securities, including, but not limited to, non-parallel shifts in the term
structure of interest rates, changing individual issuer credit spreads and non-parallel shifts of
foreign exchange rates or equity prices.
Interest Rate Risk
At December 31, 2009, the fair value of Crum & Forster’s investment portfolio included
approximately $1.8 billion of fixed income securities which are subject to interest rate risk.
Fluctuations in interest rates have a direct impact on the market values of these securities. As
interest rates rise, market values of fixed income portfolios fall, and vice versa. The table
below displays the potential impact of market value fluctuations on the Company’s fixed income
portfolio based on parallel 200 basis point shifts in interest rates up and down, in 100 basis
point increments. This analysis was performed on each security individually.
| |
|
|
|
|
|
|
|
|
|
|
|
|
|
|
|
|
|
|
|
|
|
|
|
|
| |
|
At December 31, 2009 |
|
|
At December 31, 2008 |
|
| |
|
Fair Value of |
|
|
|
|
|
|
|
|
|
|
Fair Value of |
|
|
|
|
|
|
|
| |
|
Fixed Income |
|
|
Hypothetical |
|
|
Hypothetical |
|
|
Fixed Income |
|
|
Hypothetical |
|
|
Hypothetical |
|
| (dollars in millions) |
|
Securities |
|
|
$ Change |
|
|
% Change |
|
|
Securities |
|
|
$ Change |
|
|
% Change |
|
200 basis point decline |
|
$ |
2,114.9 |
|
|
$ |
274.0 |
|
|
|
14.9 |
% |
|
$ |
2,106.5 |
|
|
$ |
339.2 |
|
|
|
19.2 |
% |
100 basis point decline |
|
$ |
1,975.0 |
|
|
$ |
134.1 |
|
|
|
7.3 |
% |
|
$ |
1,958.5 |
|
|
$ |
191.2 |
|
|
|
10.8 |
% |
Base scenario |
|
$ |
1,840.9 |
|
|
|
— |
|
|
|
— |
|
|
$ |
1,767.3 |
|
|
|
— |
|
|
|
— |
|
100 basis point increase |
|
$ |
1,687.2 |
|
|
$ |
(153.7 |
) |
|
|
(8.4 |
)% |
|
$ |
1,584.3 |
|
|
$ |
(183.0 |
) |
|
|
(10.4 |
)% |
200 basis point increase |
|
$ |
1,518.5 |
|
|
$ |
(322.4 |
) |
|
|
(17.5 |
)% |
|
$ |
1,425.7 |
|
|
$ |
(341.6 |
) |
|
|
(19.3 |
)% |
Credit Risk
Credit risk is the risk of loss resulting from the failure of a counterparty to honor its financial
or contractual obligations to the Company. Credit risk arises predominantly with respect to
investments in debt instruments, reinsurance recoverables, premiums receivable and balances due
from counterparties to derivative contracts (primarily credit default swaps).
The Company has purchased credit default swaps, referenced to various issuers in the banking,
mortgage and insurance sectors of the financial services industry which serve as economic hedges
against declines in the fair value of the Company’s financial assets. Under a credit default swap,
as the buyer, the Company agrees to pay to a specific counterparty, fixed premium amounts based on
an agreed notional principal amount in exchange for protection against default by the issuers of
specified referenced debt securities. The credit events, as defined by the respective credit
default swap contracts establishing the rights to recover amounts from the counterparties, include
events such as bankruptcy, obligation acceleration, obligation default, failure to pay,
repudiation/moratorium and restructuring. As of December 31, 2009, all credit default swap
contracts held by the Company have been purchased from and entered into with either Citibank, N.A.,
Deutsche Bank AG or Barclays Bank PLC as the counterparty, with positions on certain covered risks
with more than one of these counterparties.
The credit default swaps are recorded at fair value with changes in fair value recognized as
realized investment gains or losses in the period in which they occur. The Company obtains
broker-dealer quotes which are based on observable credit spreads for its credit default swaps. The
Company assesses the reasonableness of the broker-dealer quotes by comparing the fair values to
values produced using individual issuer credit default swap yield curves, by referencing them to
movements in credit spreads and by comparing them to recent market transaction prices for similar
credit default swaps where available. The fair values of credit default swaps are subject to
significant volatility arising from the potential differences in the perceived risk of default of
the underlying issuers, movements in credit spreads and the length of time to the contracts’
maturity. The fair value of the credit default swaps may vary materially either up or down in
short periods, and their ultimate value may therefore only be known upon their disposition.
Counterparties to the credit default swaps expose the Company to credit risk in the event of
non-performance, which the Company endeavors to limit through the terms of agreements negotiated
with the counterparties. Pursuant to the swap agreements, the counterparties are required to
pledge cash or U.S. Treasury securities as collateral, in the event that appreciation in the fair
value of the credit default swaps meets certain thresholds. At December 31, 2009, there was no
collateral held in the name of the Company as the fair value of the Company’s credit default swap
portfolio had reduced significantly through closing transactions and fair value changes. The
Company believes that any credit risk exposure, represented by the uncollateralized fair value of
the credit default swaps ($20.0 million and $49.1 million at December 31, 2009 and 2008,
respectively), is low given the diversification among the various counterparties. The Company
funds all its obligations relating to the credit default swaps through the initial premium paid at
purchase and as a result there are no requirements for the Company to provide collateral.
64
The Company’s holdings of credit default swaps have declined significantly in 2009 relative to
prior years, largely as a result of closing transactions and changes in fair value. In the latter
part of 2008, the Company reviewed the financial objectives of its economic hedging program and
decided not to replace closed credit default swaps based on: (i) the Company’s judgment that its
exposure to elevated levels of credit risk had moderated and that its historical approaches to
managing credit risk were satisfactory in mitigating the Company’s exposure to credit risk arising
from its financial assets; (ii) the significant increase in the cost of purchasing credit
protection; and (iii) the fact that the Company’s capital and liquidity had benefited from
approximately $450 million in realized investment gains from credit default swaps since inception
of the hedge program. As a result, the effects that credit default swaps as hedging instruments
may be expected to have on the Company’s future financial position, liquidity and results of
operations has diminished significantly relative to the effects in recent years. The Company may
initiate new credit default swap contracts as a hedging mechanism in the future, but there can be
no assurance that it will do so. At December 31, 2009, the Company owned $1.6 billion notional
amount of credit default swaps with an average term to maturity of 2.3 years, an original cost of
$21.6 million and a fair value of $20.0 million. At December 31, 2008, the Company owned $3.0
billion notional amount of credit default swaps with an average term to maturity of 3.1 years, an
original cost of $42.5 million and a fair value of $138.8 million.
The following tables summarize the effect of the credit default swaps and related hedged items on
the Company’s financial position and results of operations and cash flows as of and for the years
ended December 31, 2009 and 2008:
| |
|
|
|
|
|
|
|
|
|
|
|
|
|
|
|
|
|
|
|
|
| |
|
As of and for the Year Ended December 31, 2009 |
|
| |
|
|
|
|
|
|
|
|
|
Effect on Pre-tax |
|
| |
|
Exposure/ |
|
|
|
|
|
|
Other |
|
|
|
|
|
|
|
| |
|
Notional |
|
|
Carrying |
|
|
Comprehensive |
|
|
|
|
|
|
|
| (dollars in millions) |
|
Value |
|
|
Value |
|
|
Income |
|
|
Earnings |
|
|
Net Equity |
|
Credit risk exposures: |
|
|
|
|
|
|
|
|
|
|
|
|
|
|
|
|
|
|
|
|
Fixed income securities1 |
|
$ |
1,753.1 |
|
|
$ |
1,753.1 |
|
|
$ |
131.6 |
|
|
$ |
156.9 |
|
|
$ |
288.5 |
|
Warrants |
|
|
101.2 |
|
|
|
— |
|
|
|
— |
|
|
|
— |
|
|
|
— |
|
Premiums receivable |
|
|
164.8 |
|
|
|
164.8 |
|
|
|
— |
|
|
|
1.8 |
|
|
|
1.8 |
|
Reinsurance recoverable |
|
|
892.7 |
|
|
|
892.7 |
|
|
|
— |
|
|
|
(2.0 |
) |
|
|
(2.0 |
) |
|
|
|
|
|
|
|
|
|
|
|
|
|
|
|
|
Total credit risk exposure |
|
$ |
2,911.8 |
|
|
$ |
2,810.6 |
|
|
|
131.6 |
|
|
|
156.7 |
|
|
|
288.3 |
|
|
|
|
|
|
|
|
|
|
|
|
|
|
|
|
|
Hedging instruments: |
|
|
|
|
|
|
|
|
|
|
|
|
|
|
|
|
|
|
|
|
Credit default swaps |
|
$ |
1,570.4 |
|
|
$ |
20.0 |
|
|
|
— |
|
|
|
(9.2 |
) |
|
|
(9.2 |
) |
Eurodollar futures contracts |
|
|
— |
|
|
|
— |
|
|
|
— |
|
|
|
(0.3 |
) |
|
|
(0.3 |
) |
|
|
|
|
|
|
|
|
|
|
|
|
|
|
|
|
Total hedging instruments |
|
$ |
1,570.4 |
|
|
$ |
20.0 |
|
|
|
— |
|
|
|
(9.5 |
) |
|
|
(9.5 |
) |
|
|
|
|
|
|
|
|
|
|
|
|
|
|
|
|
Net exposure |
|
|
|
|
|
|
|
|
|
$ |
131.6 |
|
|
$ |
147.2 |
|
|
$ |
278.8 |
|
|
|
|
|
|
|
|
|
|
|
|
|
|
|
|
|
|
|
| |
|
|
| 1 |
|
Excludes $87.8 million of U.S. government securities with a loss in other
comprehensive income of $26.4 million and a realized gain of $1.1 million. |
The net cash flow effect from disposals of the above credit risk exposures and related hedging
instruments for the year ended December 31, 2009 was $177.4 million.
| |
|
|
|
|
|
|
|
|
|
|
|
|
|
|
|
|
|
|
|
|
| |
|
As of and for the Year Ended December 31, 2008 |
|
| |
|
|
|
|
|
|
|
|
|
Effect on Pre-tax |
|
| |
|
Exposure/ |
|
|
|
|
|
|
Other |
|
|
|
|
|
|
|
| |
|
Notional |
|
|
Carrying |
|
|
Comprehensive |
|
|
|
|
|
|
|
| (dollars in millions) |
|
Value |
|
|
Value |
|
|
Income |
|
|
Earnings |
|
|
Net Equity |
|
Credit risk exposures: |
|
|
|
|
|
|
|
|
|
|
|
|
|
|
|
|
|
|
|
|
Fixed income securities1 |
|
$ |
1,597.9 |
|
|
$ |
1,597.9 |
|
|
$ |
38.7 |
|
|
$ |
(91.2 |
) |
|
$ |
(52.5 |
) |
Warrants |
|
|
101.2 |
|
|
|
— |
|
|
|
— |
|
|
|
(5.9 |
) |
|
|
(5.9 |
) |
Premiums receivable |
|
|
182.2 |
|
|
|
182.2 |
|
|
|
— |
|
|
|
0.1 |
|
|
|
0.1 |
|
Reinsurance recoverable |
|
|
968.2 |
|
|
|
968.2 |
|
|
|
— |
|
|
|
(7.7 |
) |
|
|
(7.7 |
) |
|
|
|
|
|
|
|
|
|
|
|
|
|
|
|
|
Total credit risk exposure |
|
$ |
2,849.5 |
|
|
$ |
2,748.3 |
|
|
|
38.7 |
|
|
|
(104.7 |
) |
|
|
(66.0 |
) |
|
|
|
|
|
|
|
|
|
|
|
|
|
|
|
|
Hedging instruments: |
|
|
|
|
|
|
|
|
|
|
|
|
|
|
|
|
|
|
|
|
Credit default swaps |
|
$ |
3,044.3 |
|
|
$ |
138.8 |
|
|
|
— |
|
|
|
283.5 |
|
|
|
283.5 |
|
Eurodollar futures contracts |
|
|
1,013.0 |
|
|
|
— |
|
|
|
— |
|
|
|
4.0 |
|
|
|
4.0 |
|
|
|
|
|
|
|
|
|
|
|
|
|
|
|
|
|
Total hedging instruments |
|
$ |
4,057.3 |
|
|
$ |
138.8 |
|
|
|
— |
|
|
|
287.5 |
|
|
|
287.5 |
|
|
|
|
|
|
|
|
|
|
|
|
|
|
|
|
|
Net exposure |
|
|
|
|
|
|
|
|
|
$ |
38.7 |
|
|
$ |
182.8 |
|
|
$ |
221.5 |
|
|
|
|
|
|
|
|
|
|
|
|
|
|
|
|
|
|
|
| |
|
|
| 1 |
|
Excludes $169.4 million of U.S. government securities with a gain in other
comprehensive income of $55.6 million and a realized gain of $139.2 million. |
65
The net cash flow effect from disposals of the above credit risk exposures and related hedging
instruments for the year ended December 31, 2008 was $342.7 million.
In the normal course of effecting its economic hedging strategy with respect to credit risk, the
Company expects that there may be periods where the notional value of the hedging instruments may
exceed or be deficient relative to the exposure items being hedged. This situation may arise when
management compensates for imperfect correlations between the hedging item and the hedge or due to
the timing of opportunities related to the Company’s ability to exit and enter hedged or hedging
items at attractive prices.
Equity Price Risk
At December 31, 2009, the Company’s investment portfolio included $1,726.4 million of equity
securities comprised of $1,284.1 million of available-for-sale equity securities, $367.9 million of
equity securities for which the Company has elected the fair value option and $74.4 million of
equities owned by investment companies and similar equity method investees. This equity portfolio,
which represented approximately 43.2% of the Company’s investment portfolio, including cash and
cash equivalents and assets pledged for derivatives, is exposed to equity price risk, which is
defined as the potential for loss in market value owing to declines in equity prices. A
hypothetical 10% decline in the price of each of these equity securities would result in a total
decline of $172.6 million in the fair value of the equity portfolio at December 31, 2009. At
December 31, 2008, a hypothetical 10% decline in the price of each of these equity securities would
have resulted in a total decline of $139.8 million.
During much of 2008 and immediately preceding years, the Company had been concerned about the
valuation of worldwide equity markets, uncertainty resulting from credit issues in the U.S. and
global economic conditions. As protection against a decline in equity markets, the Company held
short positions in SPDRs and U.S. listed common stocks and equity index and equity total return
swaps, referred to in the aggregate as equity hedges. The Company also in the past purchased S&P
Index call options to limit the potential loss on its equity index total return swaps and SPDRs
short positions and to provide general protection against the short position in common stocks. In
the latter half of 2008, following significant declines in global equity markets, the Company
reviewed the financial objectives of its hedging program and determined that elevated risks in the
global equity markets had moderated and subsequently closed all of its equity hedge positions,
realizing substantial gains. During the fourth quarter of 2008, the Company increased its
investments in equities as a result of the opportunities presented by significant declines in the
global equity markets. These additions to the investment portfolio, coupled with the significant
appreciation in the value of the worldwide equity markets during 2009, resulted in a significant
increase in the value of the Company’s equity holdings and, thus, to the exposure to future losses
should the equity markets again suffer a significant decline in value. The Company continues to
manage its exposure to market price fluctuations primarily through policies designed to monitor and
limit individual issuer exposures and aggregate equity exposure. In addition, during the third
quarter of 2009, the Company also entered into equity index total return swaps with a notional
value of $452.3 million to protect a portion of its equity and equity related holdings against
potential future declines in equity markets. The Company is required to post collateral equivalent
to 6% of the notional value of the total return swaps at the time the swap is opened. These assets
are recorded at fair value in assets pledged for derivatives on the consolidated balance sheets.
The following tables summarize the effect of equity risk hedging instruments and related hedged
items on the Company’s financial position and results of operations and cash flows as of and for
the years ended December 31, 2009 and 2008:
| |
|
|
|
|
|
|
|
|
|
|
|
|
|
|
|
|
|
|
|
|
| |
|
As of and for the Year Ended December 31, 2009 |
|
| |
|
|
|
|
|
|
|
|
|
Effect on Pre-tax |
|
| |
|
Exposure/ |
|
|
|
|
|
|
Other |
|
|
|
|
|
|
|
| |
|
Notional |
|
|
Carrying |
|
|
Comprehensive |
|
|
|
|
|
|
|
| (dollars in millions) |
|
Value |
|
|
Value |
|
|
Income1 |
|
|
Earnings |
|
|
Net Equity |
|
Equity exposures: |
|
|
|
|
|
|
|
|
|
|
|
|
|
|
|
|
|
|
|
|
Equity securities |
|
$ |
1,284.1 |
|
|
$ |
1,284.1 |
|
|
$ |
299.5 |
|
|
$ |
(37.7 |
) |
|
$ |
261.8 |
|
Investments at equity |
|
|
167.3 |
|
|
|
167.3 |
|
|
|
1.2 |
|
|
|
55.6 |
|
|
|
56.8 |
|
Other invested assets |
|
|
367.9 |
|
|
|
367.9 |
|
|
|
— |
|
|
|
58.9 |
|
|
|
58.9 |
|
|
|
|
|
|
|
|
|
|
|
|
|
|
|
|
|
Total equity exposure |
|
$ |
1,819.3 |
|
|
$ |
1,819.3 |
|
|
|
300.7 |
|
|
|
76.8 |
|
|
|
377.5 |
|
|
|
|
|
|
|
|
|
|
|
|
|
|
|
|
|
Hedging instruments: |
|
|
|
|
|
|
|
|
|
|
|
|
|
|
|
|
|
|
|
|
Total return swaps |
|
|
472.7 |
|
|
|
(1.9 |
) |
|
|
— |
|
|
|
(22.3 |
) |
|
|
(22.3 |
) |
|
|
|
|
|
|
|
|
|
|
|
|
|
|
|
|
Total equity hedging instruments |
|
$ |
472.7 |
|
|
$ |
(1.9 |
) |
|
|
— |
|
|
|
(22.3 |
) |
|
|
(22.3 |
) |
|
|
|
|
|
|
|
|
|
|
|
|
|
|
|
|
Net equity exposure |
|
|
|
|
|
|
|
|
|
$ |
300.7 |
|
|
$ |
54.5 |
|
|
$ |
355.2 |
|
|
|
|
|
|
|
|
|
|
|
|
|
|
|
|
|
|
|
| |
|
|
| 1 |
|
Excludes foreign currency translation gains of $0.5 million. |
66
The net cash flow effect from disposals of the above equity exposures and related hedging
instruments for the year ended December 31, 2009 was $1.2 million.
| |
|
|
|
|
|
|
|
|
|
|
|
|
|
|
|
|
|
|
|
|
| |
|
As of and for the Year Ended December 31, 2008 |
|
| |
|
|
|
|
|
|
|
|
|
Effect on Pre-tax |
|
| |
|
Exposure/ |
|
|
|
|
|
|
Other |
|
|
|
|
|
|
|
|
| |
|
Notional |
|
|
Carrying |
|
|
Comprehensive |
|
|
|
|
|
|
Net |
|
| (dollars in millions) |
|
Value |
|
|
Value |
|
|
Income1 |
|
|
Earnings |
|
|
Equity |
|
Equity exposures: |
|
|
|
|
|
|
|
|
|
|
|
|
|
|
|
|
|
|
|
|
Equity securities |
|
$ |
1,020.2 |
|
|
$ |
1,020.2 |
|
|
$ |
(108.3 |
) |
|
$ |
(187.5 |
) |
|
$ |
(295.8 |
) |
Investments at equity |
|
|
117.6 |
|
|
|
117.6 |
|
|
|
(22.3 |
) |
|
|
(53.5 |
) |
|
|
(75.8 |
) |
Other invested assets |
|
|
273.9 |
|
|
|
273.9 |
|
|
|
— |
|
|
|
(41.1 |
) |
|
|
(41.1 |
) |
|
|
|
|
|
|
|
|
|
|
|
|
|
|
|
|
Total equity exposure |
|
$ |
1,411.7 |
|
|
$ |
1,411.7 |
|
|
|
(130.6 |
) |
|
|
(282.1 |
) |
|
|
(412.7 |
) |
|
|
|
|
|
|
|
|
|
|
|
|
|
|
|
|
Hedging instruments: |
|
|
|
|
|
|
|
|
|
|
|
|
|
|
|
|
|
|
|
|
Total return swaps |
|
|
— |
|
|
|
— |
|
|
|
— |
|
|
|
362.1 |
|
|
|
362.1 |
|
S&P Index call options |
|
|
— |
|
|
|
— |
|
|
|
— |
|
|
|
(0.5 |
) |
|
|
(0.5 |
) |
SPDRs short-sales |
|
|
— |
|
|
|
— |
|
|
|
— |
|
|
|
65.5 |
|
|
|
65.5 |
|
Common stock short-sales |
|
|
— |
|
|
|
— |
|
|
|
— |
|
|
|
4.7 |
|
|
|
4.7 |
|
|
|
|
|
|
|
|
|
|
|
|
|
|
|
|
|
Total equity hedging instruments |
|
$ |
— |
|
|
$ |
— |
|
|
|
— |
|
|
|
431.8 |
|
|
|
431.8 |
|
|
|
|
|
|
|
|
|
|
|
|
|
|
|
|
|
Net equity exposure |
|
|
|
|
|
|
|
|
|
$ |
(130.6 |
) |
|
$ |
149.7 |
|
|
$ |
19.1 |
|
|
|
|
|
|
|
|
|
|
|
|
|
|
|
|
|
|
|
| |
|
|
| 1 |
|
Excludes foreign currency translation losses of $1.6 million. |
The net cash flow effect from disposals of the above equity exposures and related hedging
instruments for the year ended December 31, 2008 was $481.7 million.
In the normal course of effecting its economic hedging strategy with respect to equity risk, the
Company expects that there may be periods where the notional value of the hedging instruments may
exceed or be deficient to the exposure items being hedged. This situation may arise when
management compensates for imperfect correlations between the hedging item and the hedge or due to
the timing of opportunities related to the Company’s ability to exit and enter hedged or hedging
items at attractive prices.
Foreign Currency Exchange Rate Risk
Through investments in foreign securities, the Company is exposed to foreign currency exchange rate
risk. Foreign currency exchange rate risk is the potential for loss in value owing to a decline in
the U.S. dollar value of these investments due to a change in the exchange rate of the foreign
currency in which these assets are denominated. At December 31, 2009, the Company’s total exposure
to foreign denominated securities in U.S. dollar terms was approximately $283.1 million, or 7.1%,
of the Company’s total investment portfolio, including cash and cash equivalents and assets pledged
for derivatives. The primary foreign currency exposures were in Hong Kong dollar and British pound
denominated securities, which represented 2.5% and 0.7% of the Company’s investment portfolio,
including cash and cash equivalents and assets pledged for derivatives, respectively. The
potential impact of a hypothetical 10% decline in each of the foreign currency exchange rates on
the valuation of investment assets denominated in those respective foreign currencies would result
in a total decline in the fair value of the total investment portfolio of $28.3 million at December
31, 2009. At December 31, 2008, a hypothetical 10% decline in foreign currency exchange rates
would have resulted in a total decline of $29.5 million in the fair value of the total investment
portfolio.
67
|
|
|
| ITEM 8. |
|
FINANCIAL STATEMENTS AND SUPPLEMENTARY DATA |
INDEX TO CONSOLIDATED FINANCIAL STATEMENTS
| |
|
|
|
|
| |
|
Page |
|
| |
|
Number |
|
|
|
|
|
|
|
|
|
69 |
|
|
|
|
|
|
|
|
|
70 |
|
|
|
|
|
|
|
|
|
71 |
|
|
|
|
|
|
|
|
|
72 |
|
|
|
|
|
|
|
|
|
73 |
|
|
|
|
|
|
|
|
|
74 |
|
|
|
|
|
|
|
|
|
76 |
|
68
REPORT OF INDEPENDENT REGISTERED PUBLIC ACCOUNTING FIRM
To the Board of Directors and Shareholder of
Crum & Forster Holdings Corp. (an indirect wholly-owned subsidiary of Fairfax Financial Holdings Limited) and Subsidiaries:
In our opinion, the accompanying consolidated balance sheets and the related consolidated
statements of income, of shareholder’s equity, of comprehensive income and of cash flows present
fairly, in all material respects, the financial position of Crum
& Forster Holdings Corp. and Subsidiaries at
December 31, 2009 and 2008, and the results of their operations and their cash flows for each of
the three years in the period ended December 31, 2009 in conformity with accounting principles
generally accepted in the United States of America. These financial statements are the
responsibility of the Company’s management. Our responsibility is to express an opinion on these
financial statements based on our audits. We conducted our audits of these statements in
accordance with the standards of the Public Company Accounting Oversight Board (United States).
Those standards require that we plan and perform the audit to obtain reasonable assurance about
whether the financial statements are free of material misstatement.
An audit includes examining, on a test basis, evidence supporting the amounts and disclosures in
the financial statements, assessing the accounting principles used and significant estimates made
by management, and evaluating the overall financial statement presentation. We believe that our
audits provide a reasonable basis for our opinion.
PricewaterhouseCoopers LLP
New York, New York
February 26, 2010
69
CRUM & FORSTER HOLDINGS CORP.
CONSOLIDATED BALANCE SHEETS
(Dollars in thousands, except per share amounts)
| |
|
|
|
|
|
|
|
|
| |
|
At December 31, |
|
| |
|
2009 |
|
|
2008 |
|
|
|
|
|
|
|
|
|
|
ASSETS |
|
|
|
|
|
|
|
|
Investments: |
|
|
|
|
|
|
|
|
Fixed income securities, available-for-sale, at fair value (amortized cost of
$1,323,120 and $1,466,114 in 2009 and 2008, respectively) |
|
$ |
1,490,121 |
|
|
$ |
1,533,334 |
|
Fixed income securities, held-for-trading, at fair value |
|
|
321,359 |
|
|
|
233,998 |
|
Equity securities, available-for-sale, at fair value (cost of $1,070,577 and
$1,106,098 in 2009 and 2008, respectively) |
|
|
1,284,102 |
|
|
|
1,020,154 |
|
Investments at equity |
|
|
167,331 |
|
|
|
117,586 |
|
Derivatives and other invested assets, at fair value |
|
|
387,902 |
|
|
|
412,747 |
|
Short-term investments, at fair value |
|
|
68,211 |
|
|
|
549,937 |
|
|
|
|
|
|
|
|
Total investments |
|
|
3,719,026 |
|
|
|
3,867,756 |
|
Cash and cash equivalents |
|
|
243,569 |
|
|
|
159,862 |
|
Assets pledged for derivatives |
|
|
29,425 |
|
|
|
4,416 |
|
Accrued investment income |
|
|
31,244 |
|
|
|
29,378 |
|
Premiums receivable |
|
|
164,802 |
|
|
|
182,158 |
|
Reinsurance recoverable |
|
|
686,277 |
|
|
|
759,028 |
|
Reinsurance recoverable from affiliates |
|
|
206,420 |
|
|
|
209,189 |
|
Prepaid reinsurance premiums |
|
|
25,330 |
|
|
|
28,995 |
|
Deferred income taxes |
|
|
86,410 |
|
|
|
239,077 |
|
Deferred policy acquisition costs |
|
|
45,740 |
|
|
|
52,705 |
|
Other assets |
|
|
65,780 |
|
|
|
66,316 |
|
|
|
|
|
|
|
|
Total assets |
|
$ |
5,304,023 |
|
|
$ |
5,598,880 |
|
|
|
|
|
|
|
|
|
|
|
|
|
|
|
|
|
LIABILITIES |
|
|
|
|
|
|
|
|
Unpaid losses and loss adjustment expenses |
|
$ |
2,672,605 |
|
|
$ |
2,987,803 |
|
Unearned premiums |
|
|
297,821 |
|
|
|
366,362 |
|
Funds held under reinsurance contracts |
|
|
246,324 |
|
|
|
228,835 |
|
Accounts payable and other liabilities |
|
|
151,038 |
|
|
|
417,669 |
|
Deferred income on retroactive reinsurance |
|
|
106,394 |
|
|
|
121,277 |
|
Long-term debt |
|
|
312,114 |
|
|
|
310,502 |
|
|
|
|
|
|
|
|
Total liabilities |
|
|
3,786,296 |
|
|
|
4,432,448 |
|
|
|
|
|
|
|
|
Commitments and contingencies (Note 12) |
|
|
|
|
|
|
|
|
|
|
|
|
|
|
|
|
|
SHAREHOLDER’S EQUITY |
|
|
|
|
|
|
|
|
Common stock, $0.01 par value; 1,000 shares authorized; 100 issued and outstanding |
|
|
— |
|
|
|
— |
|
Additional paid-in capital |
|
|
740,993 |
|
|
|
740,993 |
|
Accumulated other comprehensive income (loss), net of tax |
|
|
256,859 |
|
|
|
(7,455 |
) |
Retained earnings |
|
|
519,875 |
|
|
|
432,894 |
|
|
|
|
|
|
|
|
Total shareholder’s equity |
|
|
1,517,727 |
|
|
|
1,166,432 |
|
|
|
|
|
|
|
|
Total liabilities and shareholder’s equity |
|
$ |
5,304,023 |
|
|
$ |
5,598,880 |
|
|
|
|
|
|
|
|
The accompanying notes are an integral part of the consolidated financial statements.
70
CRUM & FORSTER HOLDINGS CORP.
CONSOLIDATED STATEMENTS OF INCOME
(Dollars in thousands)
| |
|
|
|
|
|
|
|
|
|
|
|
|
| |
|
Years Ended December 31, |
|
| |
|
2009 |
|
|
2008 |
|
|
2007 |
|
REVENUES |
|
|
|
|
|
|
|
|
|
|
|
|
Premiums earned |
|
$ |
781,282 |
|
|
$ |
998,028 |
|
|
$ |
1,186,144 |
|
Investment income |
|
|
163,842 |
|
|
|
72,375 |
|
|
|
143,418 |
|
Net realized investment gains |
|
|
149,984 |
|
|
|
531,879 |
|
|
|
234,085 |
|
|
|
|
|
|
|
|
|
|
|
Total revenues |
|
|
1,095,108 |
|
|
|
1,602,282 |
|
|
|
1,563,647 |
|
|
|
|
|
|
|
|
|
|
|
EXPENSES |
|
|
|
|
|
|
|
|
|
|
|
|
Losses and loss adjustment expenses |
|
|
526,112 |
|
|
|
822,867 |
|
|
|
752,969 |
|
Policy acquisition costs |
|
|
113,890 |
|
|
|
152,325 |
|
|
|
177,408 |
|
Other underwriting expenses |
|
|
158,425 |
|
|
|
168,122 |
|
|
|
162,788 |
|
Interest expense |
|
|
27,818 |
|
|
|
27,885 |
|
|
|
29,850 |
|
Costs related to early retirement of debt |
|
|
— |
|
|
|
392 |
|
|
|
21,187 |
|
Other expense |
|
|
3,331 |
|
|
|
8,821 |
|
|
|
9,576 |
|
|
|
|
|
|
|
|
|
|
|
Total expenses |
|
|
829,576 |
|
|
|
1,180,412 |
|
|
|
1,153,778 |
|
|
|
|
|
|
|
|
|
|
|
Income before income taxes and equity in earnings of investees |
|
|
265,532 |
|
|
|
421,870 |
|
|
|
409,869 |
|
Income tax expense |
|
|
63,630 |
|
|
|
88,603 |
|
|
|
139,987 |
|
|
|
|
|
|
|
|
|
|
|
Income before equity in earnings of investees |
|
|
201,902 |
|
|
|
333,267 |
|
|
|
269,882 |
|
Equity in earnings (losses) of investees, net of tax |
|
|
79 |
|
|
|
(461 |
) |
|
|
23,300 |
|
|
|
|
|
|
|
|
|
|
|
NET INCOME |
|
$ |
201,981 |
|
|
$ |
332,806 |
|
|
$ |
293,182 |
|
|
|
|
|
|
|
|
|
|
|
The accompanying notes are an integral part of the consolidated financial statements.
71
CRUM & FORSTER HOLDINGS CORP.
CONSOLIDATED STATEMENTS OF SHAREHOLDER’S EQUITY
(Dollars in thousands)
| |
|
|
|
|
|
|
|
|
|
|
|
|
| |
|
Years Ended December 31, |
|
| |
|
2009 |
|
|
2008 |
|
|
2007 |
|
COMMON STOCK |
|
|
|
|
|
|
|
|
|
|
|
|
Balance, beginning and end of year |
|
$ |
— |
|
|
$ |
— |
|
|
$ |
— |
|
|
|
|
|
|
|
|
|
|
|
ADDITIONAL PAID-IN CAPITAL |
|
|
|
|
|
|
|
|
|
|
|
|
Balance, beginning and end of year |
|
|
740,993 |
|
|
|
740,993 |
|
|
|
740,993 |
|
|
|
|
|
|
|
|
|
|
|
ACCUMULATED OTHER COMPREHENSIVE (LOSS) INCOME, NET OF TAX |
|
|
|
|
|
|
|
|
|
|
|
|
Balance, beginning of year |
|
|
(7,455 |
) |
|
|
44,479 |
|
|
|
(36,978 |
) |
Cumulative effect of adoption of ASC 820 and 825 |
|
|
— |
|
|
|
(29,897 |
) |
|
|
— |
|
Cumulative effect of adoption of ASC 815-15 |
|
|
— |
|
|
|
— |
|
|
|
(10,146 |
) |
|
|
|
|
|
|
|
|
|
|
Balance, beginning of year, after cumulative effect of adjustments |
|
|
(7,455 |
) |
|
|
14,582 |
|
|
|
(47,124 |
) |
Unrealized investment gains (losses), net of transfers to
realized investment gains and losses |
|
|
263,782 |
|
|
|
(23,586 |
) |
|
|
71,285 |
|
Foreign currency translation |
|
|
322 |
|
|
|
(1,020 |
) |
|
|
19,236 |
|
Change in postretirement benefit costs not yet recognized in
net income |
|
|
210 |
|
|
|
2,569 |
|
|
|
1,082 |
|
|
|
|
|
|
|
|
|
|
|
Balance, end of year |
|
|
256,859 |
|
|
|
(7,455 |
) |
|
|
44,479 |
|
|
|
|
|
|
|
|
|
|
|
RETAINED EARNINGS |
|
|
|
|
|
|
|
|
|
|
|
|
Balance, beginning of year |
|
|
432,894 |
|
|
|
507,987 |
|
|
|
389,040 |
|
Cumulative effect of adoption of ASC 820 and 825 |
|
|
— |
|
|
|
86,101 |
|
|
|
— |
|
Cumulative effect of adoption of ASC 815-15 and equity method
investee adoption of ASC 740 |
|
|
— |
|
|
|
— |
|
|
|
9,465 |
|
|
|
|
|
|
|
|
|
|
|
Balance, beginning of year, after cumulative effect of adjustments |
|
|
432,894 |
|
|
|
594,088 |
|
|
|
398,505 |
|
Net income |
|
|
201,981 |
|
|
|
332,806 |
|
|
|
293,182 |
|
Dividends to shareholder |
|
|
(115,000 |
) |
|
|
(494,000 |
) |
|
|
(183,700 |
) |
|
|
|
|
|
|
|
|
|
|
Balance, end of year |
|
|
519,875 |
|
|
|
432,894 |
|
|
|
507,987 |
|
|
|
|
|
|
|
|
|
|
|
TOTAL SHAREHOLDER’S EQUITY |
|
$ |
1,517,727 |
|
|
$ |
1,166,432 |
|
|
$ |
1,293,459 |
|
|
|
|
|
|
|
|
|
|
|
The accompanying notes are an integral part of the consolidated financial statements.
72
CRUM & FORSTER HOLDINGS CORP.
CONSOLIDATED STATEMENTS OF COMPREHENSIVE INCOME
(Dollars in thousands)
| |
|
|
|
|
|
|
|
|
|
|
|
|
| |
|
Years Ended December 31, |
|
| |
|
2009 |
|
|
2008 |
|
|
2007 |
|
NET INCOME |
|
$ |
201,981 |
|
|
$ |
332,806 |
|
|
$ |
293,182 |
|
|
|
|
|
|
|
|
|
|
|
Change in components of other comprehensive income (loss) for the year,
before tax: |
|
|
|
|
|
|
|
|
|
|
|
|
Unrealized investment gains (losses), net of transfers to realized
investment gains and losses |
|
|
405,818 |
|
|
|
(36,287 |
) |
|
|
109,638 |
|
Foreign currency translation |
|
|
496 |
|
|
|
(1,569 |
) |
|
|
29,594 |
|
Postretirement benefit costs not yet recognized in net income |
|
|
323 |
|
|
|
3,953 |
|
|
|
1,664 |
|
|
|
|
|
|
|
|
|
|
|
Other comprehensive income (loss) for the year before tax |
|
|
406,637 |
|
|
|
(33,903 |
) |
|
|
140,896 |
|
|
|
|
|
|
|
|
|
|
|
|
|
|
|
|
|
|
|
|
|
|
|
|
Deferred income tax (expense) benefit for the year: |
|
|
|
|
|
|
|
|
|
|
|
|
Deferred income tax (expense) benefit from unrealized investment gains
and losses |
|
|
(142,036 |
) |
|
|
12,701 |
|
|
|
(38,353 |
) |
Deferred income tax (expense) benefit from foreign currency translation |
|
|
(174 |
) |
|
|
549 |
|
|
|
(10,358 |
) |
Deferred income tax expense from change in postretirement benefit
costs not yet recognized in net income |
|
|
(113 |
) |
|
|
(1,384 |
) |
|
|
(582 |
) |
|
|
|
|
|
|
|
|
|
|
Total deferred income tax (expense) benefit for the year |
|
|
(142,323 |
) |
|
|
11,866 |
|
|
|
(49,293 |
) |
|
|
|
|
|
|
|
|
|
|
Other comprehensive income (loss) for the year, net of tax |
|
|
264,314 |
|
|
|
(22,037 |
) |
|
|
91,603 |
|
|
|
|
|
|
|
|
|
|
|
COMPREHENSIVE INCOME |
|
$ |
466,295 |
|
|
$ |
310,769 |
|
|
$ |
384,785 |
|
|
|
|
|
|
|
|
|
|
|
The accompanying notes are an integral part of the consolidated financial statements.
73
CRUM & FORSTER HOLDINGS CORP.
CONSOLIDATED STATEMENTS OF CASH FLOWS
(Dollars in thousands)
| |
|
|
|
|
|
|
|
|
|
|
|
|
| |
|
Years Ended December 31, |
|
| |
|
2009 |
|
|
2008 |
|
|
2007 |
|
OPERATING ACTIVITIES |
|
|
|
|
|
|
|
|
|
|
|
|
Net income |
|
$ |
201,981 |
|
|
$ |
332,806 |
|
|
$ |
293,182 |
|
Adjustments to reconcile net income to net cash from operating activities: |
|
|
|
|
|
|
|
|
|
|
|
|
(Accretion of discount) amortization of premium on fixed income
securities |
|
|
(8,193 |
) |
|
|
103 |
|
|
|
(7,313 |
) |
Realized investment gains |
|
|
(149,984 |
) |
|
|
(531,879 |
) |
|
|
(234,085 |
) |
Losses (earnings) of equity method investees, net of dividends |
|
|
365 |
|
|
|
1,185 |
|
|
|
(30,528 |
) |
(Earnings) losses of investment companies and similar equity method
investees |
|
|
(53,187 |
) |
|
|
51,238 |
|
|
|
(12,985 |
) |
Loss on commutation |
|
|
— |
|
|
|
75,470 |
|
|
|
— |
|
Depreciation and amortization |
|
|
5,488 |
|
|
|
5,978 |
|
|
|
6,153 |
|
Deferred income tax expense (benefit) |
|
|
10,344 |
|
|
|
(164,313 |
) |
|
|
143,814 |
|
Non-cash costs related to early retirement of debt |
|
|
— |
|
|
|
170 |
|
|
|
9,216 |
|
Other non-cash net income adjustments |
|
|
785 |
|
|
|
15,692 |
|
|
|
9,313 |
|
Changes in: |
|
|
|
|
|
|
|
|
|
|
|
|
Accrued investment income |
|
|
(2,727 |
) |
|
|
8,013 |
|
|
|
(2,620 |
) |
Premiums receivable |
|
|
19,180 |
|
|
|
31,430 |
|
|
|
37,426 |
|
Reinsurance recoverable |
|
|
75,519 |
|
|
|
434,063 |
|
|
|
175,094 |
|
Prepaid reinsurance premiums |
|
|
3,665 |
|
|
|
(7,147 |
) |
|
|
3,582 |
|
Deferred policy acquisition costs |
|
|
6,965 |
|
|
|
19,577 |
|
|
|
11,682 |
|
Other assets |
|
|
2,771 |
|
|
|
11,482 |
|
|
|
(6,128 |
) |
Unpaid losses and loss adjustment expenses |
|
|
(315,198 |
) |
|
|
(188,558 |
) |
|
|
(193,043 |
) |
Unearned premiums |
|
|
(68,541 |
) |
|
|
(119,729 |
) |
|
|
(90,091 |
) |
Accounts payable and other liabilities |
|
|
(131,595 |
) |
|
|
125,301 |
|
|
|
(118,615 |
) |
|
|
|
|
|
|
|
|
|
|
Net cash (used in) provided by operating activities |
|
|
(402,362 |
) |
|
|
100,882 |
|
|
|
(5,946 |
) |
|
|
|
|
|
|
|
|
|
|
INVESTING ACTIVITIES |
|
|
|
|
|
|
|
|
|
|
|
|
Purchases of fixed income securities |
|
|
(457,293 |
) |
|
|
(1,931,145 |
) |
|
|
(151,814 |
) |
Proceeds from sales of fixed income securities |
|
|
488,870 |
|
|
|
2,360,186 |
|
|
|
211,461 |
|
Proceeds from maturities of fixed income securities |
|
|
50,300 |
|
|
|
1,260 |
|
|
|
2,395 |
|
Purchases of equity securities |
|
|
(351,786 |
) |
|
|
(672,716 |
) |
|
|
(254,035 |
) |
Proceeds from sales of equity securities |
|
|
351,104 |
|
|
|
9,422 |
|
|
|
239,458 |
|
Net sales (purchases) of investments at equity |
|
|
7,292 |
|
|
|
1,793 |
|
|
|
(20,483 |
) |
Purchases of derivatives and other invested assets |
|
|
(35,050 |
) |
|
|
(14,632 |
) |
|
|
(23,383 |
) |
Proceeds from sales of derivatives and other invested assets |
|
|
109,684 |
|
|
|
382,939 |
|
|
|
81,070 |
|
Purchases of short-term investments |
|
|
(165,529 |
) |
|
|
(1,807,749 |
) |
|
|
(335,404 |
) |
Proceeds from sales and maturities of short-term investments |
|
|
622,296 |
|
|
|
1,477,084 |
|
|
|
153,396 |
|
Net settlement of short-sale obligations |
|
|
— |
|
|
|
(649,517 |
) |
|
|
333,874 |
|
Net change in cash and cash equivalents held as collateral |
|
|
4,416 |
|
|
|
730,540 |
|
|
|
(329,484 |
) |
Net settlement of total return swaps and Eurodollar futures contracts |
|
|
(20,731 |
) |
|
|
366,085 |
|
|
|
— |
|
Purchases of fixed assets |
|
|
(2,504 |
) |
|
|
(2,604 |
) |
|
|
(1,875 |
) |
|
|
|
|
|
|
|
|
|
|
Net cash provided by (used in) investing activities |
|
|
601,069 |
|
|
|
250,946 |
|
|
|
(94,824 |
) |
|
|
|
|
|
|
|
|
|
|
FINANCING ACTIVITIES |
|
|
|
|
|
|
|
|
|
|
|
|
Dividends to shareholder |
|
|
(115,000 |
) |
|
|
(335,202 |
) |
|
|
(128,825 |
) |
Repayment of 10 3/8% senior notes |
|
|
— |
|
|
|
(4,270 |
) |
|
|
(295,730 |
) |
Issuance of 7 3/4% senior notes |
|
|
— |
|
|
|
— |
|
|
|
330,000 |
|
New debt issuance costs |
|
|
— |
|
|
|
— |
|
|
|
(23,912 |
) |
|
|
|
|
|
|
|
|
|
|
Net cash used in financing activities |
|
|
(115,000 |
) |
|
|
(339,472 |
) |
|
|
(118,467 |
) |
|
|
|
|
|
|
|
|
|
|
Net change in cash and cash equivalents |
|
|
83,707 |
|
|
|
12,356 |
|
|
|
(219,237 |
) |
Cash and cash equivalents, beginning of year |
|
|
159,862 |
|
|
|
147,506 |
|
|
|
366,743 |
|
|
|
|
|
|
|
|
|
|
|
Cash and cash equivalents, end of year |
|
$ |
243,569 |
|
|
$ |
159,862 |
|
|
$ |
147,506 |
|
|
|
|
|
|
|
|
|
|
|
SUPPLEMENTAL CASH FLOW INFORMATION |
|
|
|
|
|
|
|
|
|
|
|
|
Cash paid for interest |
|
$ |
25,575 |
|
|
$ |
25,797 |
|
|
$ |
24,907 |
|
|
|
|
|
|
|
|
|
|
|
Cash paid to parent for income taxes |
|
$ |
153,326 |
|
|
$ |
99,514 |
|
|
$ |
76,906 |
|
|
|
|
|
|
|
|
|
|
|
The accompanying notes are an integral part of the consolidated financial statements.
74
CRUM & FORSTER HOLDINGS CORP.
CONSOLIDATED STATEMENTS OF CASH FLOWS
(Dollars in thousands)
| |
|
|
|
|
|
|
|
|
|
|
|
|
| |
|
Years Ended December 31, |
|
| |
|
2009 |
|
|
2008 |
|
|
2007 |
|
SUPPLEMENTAL NON-CASH OPERATING, INVESTING AND FINANCING ACTIVITIES |
|
|
|
|
|
|
|
|
|
|
|
|
Fixed income securities transferred to parent as payment for income taxes |
|
$ |
54,008 |
|
|
$ |
— |
|
|
$ |
— |
|
|
|
|
|
|
|
|
|
|
|
Note received as consideration for the sale of an investment in affiliate |
|
$ |
— |
|
|
$ |
248,066 |
|
|
$ |
— |
|
|
|
|
|
|
|
|
|
|
|
Note paid for the purchase of an investment in an affiliate |
|
$ |
— |
|
|
$ |
246,066 |
|
|
$ |
— |
|
|
|
|
|
|
|
|
|
|
|
In-kind dividend payment to parent in the form of fixed income securities |
|
$ |
— |
|
|
$ |
158,798 |
|
|
$ |
— |
|
|
|
|
|
|
|
|
|
|
|
Note received from parent in partial settlement of the Company’s tax net
operating losses |
|
$ |
— |
|
|
$ |
— |
|
|
$ |
41,882 |
|
|
|
|
|
|
|
|
|
|
|
Note received from parent in settlement of the sale of a common stock investment |
|
$ |
— |
|
|
$ |
— |
|
|
$ |
12,993 |
|
|
|
|
|
|
|
|
|
|
|
In-kind dividend payment to parent representing cancellation of the
aforementioned notes received in 2007 |
|
$ |
— |
|
|
$ |
— |
|
|
$ |
54,875 |
|
|
|
|
|
|
|
|
|
|
|
The accompanying notes are an integral part of the consolidated financial statements.
75
NOTES TO THE CONSOLIDATED FINANCIAL STATEMENTS
(Dollars in thousands)
| 1. |
|
Organization and Basis of Presentation |
Crum & Forster Holdings Corp. (the “Company” or “Crum & Forster”) is a Delaware holding company,
which is 100% owned by Fairfax Inc., a Wyoming holding company. Fairfax Inc. is ultimately
owned by Fairfax Financial Holdings Limited (“Fairfax”), a Canadian financial services holding
company, which is publicly traded on the Toronto Stock Exchange. The Company, through its
subsidiaries, offers a full range of commercial property and casualty insurance distributed
through an independent producer force located across the United States.
The consolidated financial statements have been prepared in conformity with accounting
principles generally accepted in the United States of America (“GAAP”) and include the accounts
of the Company and its wholly-owned subsidiaries, including United States Fire Insurance Company
(“US Fire”), The North River Insurance Company (“North River”), Crum & Forster Indemnity Company
(“CF Indemnity”) and Crum and Forster Insurance Company (“CF Insurance”). US Fire owns 100% of
the stock of Crum & Forster Specialty Insurance Company. North River owns 100% of the stock of
Seneca Insurance Company, Inc. and its subsidiaries. All material intercompany accounts and
transactions have been eliminated in consolidation.
The preparation of consolidated financial statements in conformity with GAAP requires management
to make estimates and assumptions that affect the reported amounts of assets, liabilities,
revenues and expenses and disclosure of contingent assets and liabilities. Such estimates and
assumptions may differ from actual results.
Certain amounts in the Company’s prior year consolidated financial statements have been
reclassified to conform to the 2009 presentation.
| 2. |
|
Summary of Significant Accounting Policies |
Significant accounting policies followed by the Company are summarized below:
Investments
The Company’s fixed income and equity securities, the majority of which are classified as
available-for-sale, are carried at fair value. Fair value is defined as the amount that would
be received for an asset in an orderly transaction between market participants at the
measurement date. The Company is responsible for determining fair values by utilizing quoted
market prices in active markets for identical securities or other inputs, such as quoted market
prices for similar securities that are observable, either directly or indirectly and by
employing valuation techniques which make use of current market data. U.S. Treasury, corporate
and municipal fixed income securities are priced using broker-dealer quotes. Equity securities
prices are obtained from market exchanges. Unrealized gains or losses on the Company’s
available-for-sale fixed income and equity securities, net of applicable taxes, are included in
other comprehensive income.
For equity securities, unrealized losses that are deemed other than temporary are charged to
earnings. For debt securities in an unrealized loss position, if the Company intends to sell or
it is more likely than not that it will be required to sell a security in an unrealized loss
position prior to recovery of its cost basis, the security is deemed other than temporarily
impaired and the full amount of the impairment is recognized as a loss through earnings. If the
Company does not intend to sell a security and it is more likely than not that it will not be
required to sell a security that it considers to be other than temporarily impaired before
recovery of its cost basis, the other than temporary impairment is separated into its credit and
non-credit components with the credit portion of the other than temporary impairment recognized
as a loss through earnings and the non-credit portion recognized in other comprehensive income.
At each reporting date and more frequently when conditions warrant, management reviews all
available-for-sale securities with unrealized losses to determine whether an other than
temporary decline in value exists and whether losses should be recognized in earnings rather
than in accumulated other comprehensive income (loss). The process for determining whether a
security is other than temporarily impaired requires judgment and involves analyzing many
factors. These factors include but are not limited to (i) the length of time and extent to
which the fair value has been less than its cost or amortized cost; (ii) the severity of the
impairment; (iii) the cause of the impairment; (iv) the financial condition and near-term
prospects of the issuer as well as specific credit issues related to the issuer such as changes
in credit rating, reduction or elimination of dividends or non-payment of scheduled interest
payments; and (v) for fixed income securities, the Company’s intent to sell a security or
whether it is more likely than not that the Company will be required to sell the security before
recovery of its amortized cost, which in some cases, may extend to maturity, and for equity
securities, the Company’s intent and ability to hold the security for a period of time
sufficient to allow for any anticipated recovery of fair value in the near term.
76
NOTES TO THE CONSOLIDATED FINANCIAL STATEMENTS
(Dollars in thousands)
Fixed income securities classified as held-for-trading include those purchased for short-term
investment objectives and those voluntarily designated as such by management pursuant to the
fair value option under Accounting Standards Codification (“ASC”) 815-15, Derivatives and
Hedging, Embedded Derivatives (“ASC 815-15”). These securities include convertible securities
with embedded derivatives (which allow the Company to convert the fixed income securities to
equity securities), mortgage-backed securities purchased at deep discounts to par and certain
corporate fixed income securities. Held-for-trading securities are recorded at fair value in
the consolidated balance sheets with changes in fair value recognized as realized investment
gains and losses in the consolidated statements of income in the period in which they occur.
Short-term investments, which have an original maturity of greater than 90 days and less than
twelve months, are carried at fair value.
Investments in entities that are consolidated subsidiaries of Fairfax, but are less than 50%
owned by the Company, as well as investments in certain partnerships, are carried under the
equity method of accounting in accordance with ASC 323, Investments — Equity Method and Joint
Ventures, (“ASC 323”) or at fair value in accordance with ASC 825, Financial Instruments (“ASC
825”). For all other investments, the Company determines if it exercises significant influence
based upon its ownership of voting shares without consideration of the ownership interest of
other Fairfax affiliates. Investments accounted for under the equity method of accounting are
included as investments at equity on the consolidated balance sheets. The Company’s pro-rata
share of earnings of equity method investees is recorded in the consolidated statements of
income. Earnings of investment companies and similar equity method investees are reported in
investment income and earnings of other equity method investees are reported as equity in
earnings of investees, net of tax. The carrying value of investments at equity includes limited
partnerships, and is based upon the Company’s share of net asset values of each investee, as
determined by the general partner. Dividends from equity method investees reduce the carrying
value of the investment. Investments that would have been subject to the equity method of
accounting, but for which the Company has elected the fair value option under ASC 825, are
included in derivatives and other invested assets on the consolidated balance sheets, with
changes in fair value recorded as realized investment gains or losses in the period in which
they occur.
Realized investment gains or losses are determined on the basis of average cost. Investment
income is recorded as earned.
Derivatives
The Company uses derivatives to mitigate financial risks arising principally from its investment
holdings and receivables. Derivatives include credit default swaps, total return swaps and
warrants, none of which is specifically designated or meets the requirements for hedge
accounting. All derivative securities are recorded as either assets or liabilities on the
consolidated balance sheets and are measured at fair value with changes in fair value recorded
as realized investment gains or losses in the period in which they occur.
Cash collateral received from or paid to counterparties as security for derivative contract
assets or liabilities, respectively, is included in assets or liabilities on the consolidated
balance sheets. Securities received from counterparties as collateral are not recorded as
assets. Securities delivered are reflected as assets pledged for derivatives on the
consolidated balance sheets.
Cash and Cash Equivalents
The Company considers highly liquid investments, which have an original maturity of three months
or less, to be cash equivalents. Cash and cash equivalents on the balance sheet do not include
cash pledged as security for the Company’s derivative securities and short-sale obligations.
Deferred Policy Acquisition Costs
Certain costs that vary with and are primarily related to the acquisition of new and renewal
policies, consisting of commissions and premium taxes, are deferred and amortized over the
period in which the related premiums are earned. Deferred policy acquisition costs are limited
to their estimated realizable value, which considers anticipated losses and loss adjustment
expenses on the related policies and estimated remaining costs of servicing the contracts.
Realizability is determined without considering investment income.
Goodwill
Goodwill is subject to an assessment of impairment on an annual basis or more frequently under
certain circumstances. The assessment of impairment involves a two-step process whereby an
initial assessment for potential impairment is performed followed by a measurement of the
impairment, if any. Impairments are charged to earnings in the period in which the impairment
occurs. The Company’s impairment tests in 2009 and 2008 resulted in a conclusion that no
goodwill impairment had occurred. Goodwill in the amount of $7,311 is included in other assets
on the consolidated balance sheets at December 31, 2009 and 2008.
77
NOTES TO THE CONSOLIDATED FINANCIAL STATEMENTS
(Dollars in thousands)
Unpaid Losses and Loss Adjustment Expenses
The reserve for unpaid losses and loss adjustment expenses (“LAE”) includes estimates of the
ultimate settlement value of reported claims, incurred but not reported claims, future expenses
to be incurred in the settlement of claims and claim recoveries. These estimates are determined
based on the Company’s loss experience, as well as consideration of industry experience and
current trends and conditions. The reserve for unpaid losses and LAE is an estimate and future
loss payments could differ significantly from initial estimates. The methods of determining
such estimates and the resulting estimated liability are regularly reviewed and updated.
Changes in the reserve for unpaid losses and LAE are reflected in income in the period in which
such changes are required.
Reinsurance
The Company reinsures, in the ordinary course of business, certain risks with other insurance
and reinsurance companies (“reinsurers”). These arrangements provide the means for greater
diversification of business and serve to limit the net loss potential of unusually severe or
frequent losses. The ceding of insurance does not discharge the original insurer from its
primary liability to its policyholder; however, the reinsurer that accepts the risk assumes an
obligation to the original insurer (“ceding insurer”). The ceding insurer retains a contingent
liability with respect to reinsurance ceded to the extent that any reinsuring company might not
be able, or willing, to meet its obligations. Reinsurance recoverable includes the reinsurers’
obligations to reimburse the Company for a share of paid and unpaid losses and LAE pursuant to
the reinsurance contracts. Prepaid reinsurance premiums represent the portion of premiums ceded
to reinsurers applicable to the unexpired terms of the ceded contracts.
Reserves for uncollectible reinsurance are determined based upon reviews of the financial
condition of reinsurers and assessments of other available information.
For retroactive reinsurance contracts, the excess of reinsurance recoverable from reinsurers
pursuant to the contracts over premiums paid for such reinsurance coverage is deferred and
amortized as a reduction of losses and LAE over the expected period of recovery using the
interest method.
Funds held under Reinsurance Contracts
Premiums withheld from reinsurers pursuant to reinsurance contracts are included in funds held
under reinsurance contracts on the consolidated balance sheets. Interest accrues on these funds
in accordance with the contract terms and is included as a reduction of investment income on the
consolidated statements of income.
Income Taxes
The Company participates in tax sharing agreements that provide for the inclusion of the Company
in the consolidated federal income tax returns of Fairfax Inc. (the “Fairfax Group”), as well as
the consolidated or combined state income or franchise tax returns of Fairfax Inc. Subject to
these tax sharing agreements, every member of the Fairfax Group is severally liable for the
federal income tax liabilities of the Fairfax Group and may be liable under similar rules for
state income or franchise taxes of the entire group. Under the tax sharing agreements, Crum &
Forster and its insurance subsidiaries make payments to Fairfax Inc. equal to the amounts of
federal income taxes that each company would pay, subject to some adjustments, as if they each
had filed their own separate federal income tax returns, as well as their shares of any state
income or franchise taxes. Fairfax stands in the place of the Internal Revenue Service for
administering federal income tax payments, including the requirement to honor all valid tax
elections. Under a separate tax sharing agreement, between Crum & Forster Holdings Corp. and
Fairfax Inc., the Company and its subsidiaries are permitted to file federal income tax returns
on a consolidated basis for tax sharing purposes. The agreement provides that all tax sharing
payments otherwise payable directly to Fairfax from the Company’s subsidiaries be paid instead
to Crum & Forster Holdings Corp., where they are netted against holding company losses before
being remitted as net tax sharing to Fairfax.
Deferred income taxes are provided for temporary differences between the financial statement and
tax bases of assets and liabilities. Such differences relate principally to unpaid losses and
LAE, deferred income on retroactive reinsurance, unrealized net appreciation of investments and
certain realized investment gains and losses, deferred policy acquisition costs and employee
benefit plans. A valuation allowance against deferred tax assets is recorded if it is more
likely than not that all, or some portion of, the benefits related to deferred tax assets will
not be realized. As of December 31, 2009 and 2008, a valuation allowance was not required. The
Company has elected to recognize accrued interest and penalties, if any, associated with
uncertain tax positions as part of the income tax provision. The Company did not record any
liability for uncertain tax positions, interest or penalties in 2009 or 2008.
78
NOTES TO THE CONSOLIDATED FINANCIAL STATEMENTS
(Dollars in thousands)
Premiums
Insurance and reinsurance premiums are earned ratably over the terms of the related policies.
Unearned premium reserves are established for the unexpired portion of policy premiums.
Premiums are accrued for retrospectively rated policies and on policies subject to audit based
on estimates throughout the contract or policy term. The reserve for uncollectible premiums
includes both specific allowances for probable uncollectible amounts and a non-specific reserve
determined principally on the basis of past collection experience. At December 31, 2009 and
2008, the reserve for uncollectible premiums was $17,500 and $20,191, respectively.
Foreign Currency
Financial statements of foreign investees accounted for using the equity method are translated
into U.S. dollars in accordance with ASC 830, Foreign Currency Matters (“ASC 830”). Under ASC
830, investments in entities accounted for under the equity method are translated into U.S.
dollars at the rate of exchange in effect at the date of the transaction and related equity
earnings are translated at the average rate in effect during the period. At each balance sheet
date, the carrying amounts are translated into U.S. dollars at the rate in effect at the balance
sheet date and any translation gains or losses are recorded in other comprehensive income.
Accumulated Other Comprehensive Income (Loss), Net of Tax
Accumulated other comprehensive income or loss includes unrealized investment gains and losses
on the Company’s available-for-sale fixed income and equity securities, foreign currency
translation gains and losses arising from the translation of financial statements of equity
method investees denominated in foreign currencies and adjustments to recognize any change in
defined benefit postretirement plan costs not yet recognized in net income. At December 31,
2009 and 2008, included in accumulated other comprehensive income (loss) were unrealized
investment gains (losses) of $252,946 and $(10,836), net of tax, respectively, foreign currency
translation gains (losses) of $107 and $(215), net of tax, respectively, and defined benefit
postretirement plan gains of $3,806 and $3,596, net of tax, respectively.
Recent Accounting Pronouncements
Accounting Pronouncements Adopted
ASU 2010-06. In January 2010, the Financial Accounting Standards Board (“FASB”) issued
Accounting Standards Update 2010-06, Improving Disclosures About Fair Value Measurements, (“ASU
2010-06”) which amends previous guidance provided under ASC 820 to add new requirements for
disclosures about investment transfers into and out of Levels 1 and 2 of the fair value
hierarchy and separate disclosures about purchases, sales, issuances, and settlements relating
to Level 3 investments. ASU 2010-06 also clarifies existing fair value disclosures about the
level of disaggregation and about inputs and valuation techniques used to measure fair value.
ASU 2010-06 is effective for interim and annual reporting periods beginning after December 15,
2009, except for the requirement to provide the Level 3 activity of purchases, sales, issuances,
and settlements on a gross basis, which will be effective for interim and annual reporting
periods beginning after December 15, 2010. The Company adopted the provisions of ASU 2010-06
effective December 31, 2009 and has provided the additional disclosures in Note 4 to the
consolidated financial statements.
ASC 105. In June 2009, the FASB issued guidance under ASC 105, Generally Accepted Accounting
Principles, which establishes the FASB Accounting Standards Codification (“Codification”) as the
single source of authoritative GAAP to be applied to nongovernmental entities. The only other
source of authoritative GAAP is the rules and interpretive releases of the SEC, which apply only
to SEC registrants. The Codification was effective for interim and annual financial reporting
periods ending after September 15, 2009 and does not change or alter existing GAAP but changes
the way in which GAAP is referenced in the Company’s financial statements. The Company adopted
the Codification during the third quarter of 2009 and technical references to GAAP in this
report are provided under the new Codification structure.
79
NOTES TO THE CONSOLIDATED FINANCIAL STATEMENTS
(Dollars in thousands)
ASC 320. In April 2009, the FASB issued guidance under ASC 320, Investments — Debt and Equity
Securities (“ASC 320”), which amends previous other than temporary impairment guidance for debt
securities to make the guidance more operational and to improve the presentation and disclosure
of other than temporary impairments on debt securities in the financial statements. The
guidance requires that if the Company intends to sell, or it is more likely than not that it
will be required to sell a security in an unrealized loss position prior to recovery of its cost
basis, the security is other than temporarily impaired and the full amount of the impairment is
recognized as a loss through earnings. If the Company does not intend to sell a security and it
is more likely than not that it will not be required to sell a security that it considers to be
other than temporarily impaired before recovery of its cost basis, the other than temporary
impairment is separated into its credit and non-credit components with the credit portion of the
other than temporary impairment recognized as a loss through earnings and the non-credit portion
recognized in other comprehensive income. ASC 320 is effective for interim and annual reporting
periods ending after June 15, 2009. The Company adopted ASC 320 effective April 1, 2009 and the
adoption did not affect the Company’s financial position or results of operations. ASC 320
requires that the Company record, as of the beginning of the interim period of adoption, a
cumulative effect adjustment to reclassify the non-credit component of a previously recognized
other than temporary impairment on debt securities which are still held as investments at the
date of adoption, from retained earnings to accumulated other comprehensive income. The Company
reviewed other than temporary impairments it had previously recorded through earnings on fixed
income securities held at April 1, 2009, which were $10,855, and determined that all of these
other than temporary impairments were related to specific credit losses as the issuers had filed
for bankruptcy and were in default of interest payments, resulting in no cumulative effect
adjustment to opening retained earnings or accumulated other comprehensive income as of April 1,
2009.
ASC 820. In April 2009, the FASB issued guidance under ASC 820, Fair Value Measurements and
Disclosures (“ASC 820”), which provides additional guidance on estimating the fair value of an
asset or liability when the volume and level of activity for the asset or liability have
significantly decreased and on identifying transactions that are not orderly. The guidance
addresses the factors that determine whether there has been a significant decrease in the volume
and level of activity for an asset or liability when compared to the normal market
activity. Under this guidance, if the Company determines that the volume and level of activity
has significantly decreased and transactions are not orderly, further analysis is required and
significant adjustments to the quoted prices or transactions may be needed. The Company adopted
ASC 820 effective April 1, 2009 and the adoption did not have an impact on the Company’s
financial position or results of operations.
In September 2006, the FASB issued guidance under ASC 820, which defines fair value, establishes
a framework for measuring fair value in accordance with generally accepted accounting principles
and expands disclosures about fair value measurements. The guidance also establishes a fair
value hierarchy that prioritizes the inputs used in valuation techniques. The Company adopted
the guidance under ASC 820 effective January 1, 2008 and concurrent with the adoption
established a policy for those securities measured on the basis of bid-ask prices to use the bid
price for long positions (assets), which reflects the highest price that a buyer is willing to
pay for an asset, and the ask price for short positions (liabilities), which represents the
lowest price a seller is willing to accept for an asset. Prior to adoption the Company used a
market price within the bid-ask spread. The Company recorded a cumulative adjustment of $1,859,
net of tax, to opening shareholder’s equity as of January 1, 2008 (comprised of a reduction of
$521 to opening accumulated other comprehensive income and a reduction of $1,338 to opening
retained earnings). In October 2008, the FASB issued further guidance under ASC 820, which
clarified the guidance for the application of fair value measurements for financial assets in
inactive or distressed markets. The guidance was effective upon issuance and its adoption did
not impact the Company’s financial position or results of operations.
ASC 825. In April 2009, the FASB issued guidance under ASC 825, which amends previous guidance
to require disclosures about the fair value of financial instruments for interim reporting
periods in addition to annual reporting periods and also requires companies to disclose the
methods and significant assumptions used to estimate the fair value of financial instruments in
financial statements on an interim basis and to describe any changes during the period. The
Company adopted ASC 825 effective April 1, 2009 and the adoption did not have an impact on the
Company’s financial position or results of operations, but resulted in additional disclosures
which have been made in Note 4 to the consolidated financial statements.
In February 2007, the FASB issued guidance under ASC 825, which provides a fair value option to
measure many financial instruments and certain other items at fair value primarily on an
instrument-by-instrument basis, that are not otherwise accounted for at fair value under other
accounting standards. The irrevocable election to use the fair value option is available at
specified election dates, such as when an entity first recognizes a financial instrument.
Subsequent changes in fair value are recorded through earnings. Additionally, ASC 825 allows
for a one-time election for existing eligible financial instruments upon adoption, with the
transition adjustment recorded to beginning retained earnings. The Company adopted the fair
value option guidance under ASC 825 effective January 1, 2008 and upon adoption, elected the
fair value option for its investment in Northbridge Financial Corporation (“Northbridge”), an
affiliated company traded on the Toronto Stock Exchange, which was previously accounted for
under the equity method of accounting. Subsequently, the Company also elected the fair value
option for its investments in Advent Capital (Holdings) PLC (“Advent”), an affiliated company
traded on the Alternative Investment Market of the London Stock Exchange, and Odyssey Re
Holdings Corp. (“Odyssey”), an affiliated company traded on the New York Stock Exchange, both of
which would otherwise have been subject to the equity method of accounting as they are
subsidiaries of Fairfax.
80
NOTES TO THE CONSOLIDATED FINANCIAL STATEMENTS
(Dollars in thousands)
In determining the eligible financial instruments for which to elect the fair value option, the
Company considered all of its equity method investments. These investments are often carried at
values that do not reflect current fair market value. The Company decided that the fair value
option would be appropriate for equity method investments for which there is a publicly quoted
market price. Since Northbridge, Advent and Odyssey were traded on public stock exchanges at
the time of the fair value option election, their traded price was considered to be a better
indicator of value than carrying value under the equity method of accounting. During the fourth
quarter of 2009, Fairfax and its affiliates purchased additional shares of Advent and Odyssey,
bringing Fairfax’s ownership in each company to 100%. As a result, Advent and Odyssey are no
longer traded on public stock exchanges and the Company now values these investments using
internally developed valuation models. For further details, see Note 4 to the consolidated
financial statements.
Upon adoption of the fair value option guidance under ASC 825, the Company recorded a cumulative
adjustment of $89,328 to derivatives and other invested assets, a deferred tax liability of
$31,265 and a $58,063 adjustment (comprised of a reduction of $29,376 to opening accumulated
other comprehensive income and an increase of $87,439 to opening retained earnings), net of tax,
to shareholder’s equity as of January 1, 2008.
The Company’s investment in Advent became subject to the equity method of accounting during the
third quarter of 2008 as a result of Fairfax gaining majority ownership of Advent. Upon
election of the fair value option for Advent, the Company recorded a realized loss of $5,945 on
the consolidated statement of income and an unrealized gain of the same amount in other
comprehensive income, for the year ended December 31, 2008, which represents the
reclassification of the cumulative change in fair value previously recorded in accumulated other
comprehensive income.
The Company’s investments in Odyssey include investments in Odyssey common and preferred stock.
Upon election of the fair value option guidance for Odyssey preferred stock (concurrent with the
acquisition and fair value option election for Odyssey common stock in December 2008), the
Company recorded a realized loss of $2,350 on the consolidated statement of income and an
unrealized gain of the same amount in other comprehensive income, which represents the
reclassification of the cumulative change in fair value previously recorded in accumulated other
comprehensive income.
ASC 815. In March 2008, the FASB issued guidance under ASC 815, Derivatives and Hedging (“ASC
815”), which is intended to improve financial reporting about derivative instruments and hedging
activities by requiring enhanced disclosures about: (i) how and why an entity uses derivative
instruments; (ii) how derivative instruments and related hedged items are accounted for under
ASC 815 and its related interpretations; and (iii) how derivative instruments and related hedged
items affect an entity’s financial position, financial performance and cash flows. The Company
adopted ASC 815 effective January 1, 2009, which did not affect the Company’s financial position
or results of operations; however, the Company has expanded its disclosures regarding the
effects of hedging activities.
In February 2006, the FASB issued guidance under ASC 815-15, which applies to certain “hybrid
financial instruments” which are instruments that contain embedded derivatives. The guidance
established a requirement to evaluate beneficial interests in securitized financial assets to
determine if the interests represent freestanding derivatives or are hybrid financial
instruments requiring bifurcation and permits an election for fair value measurement of any
hybrid financial instrument that otherwise would require bifurcation under GAAP accounting for
derivative securities. The fair value election can be applied to existing instruments on an
instrument-by-instrument basis at the date of adoption and to new instruments on a prospective
basis. The Company adopted the guidance effective January 1, 2007 and as a result of the
adoption, no longer bifurcates embedded derivatives included in certain fixed income or equity
securities, and, beginning January 1, 2007, changes in the fair value of such securities are
recorded as realized investment gains or losses in the consolidated statements of income. Prior
to adoption, changes in fair value of the host instrument were recorded as unrealized investment
gains and losses as a component of shareholder’s equity, while changes in the fair value of the
embedded derivatives were recorded as realized investment gains and losses. Upon adoption of the
guidance under ASC 815-15, the Company recorded a cumulative adjustment of $10,146, net of tax,
to reclassify unrealized investment gains to opening retained earnings.
ASC 740. In June 2006, the FASB issued an interpretation under ASC 740, Income Taxes (“ASC 740”)
which clarifies the accounting for uncertainty in income taxes recognized in a company’s
financial statements. Specifically, the interpretation prescribes a recognition threshold and a
measurement attribute for the financial statement recognition and measurement of a tax position
taken or expected to be taken in a tax return. The interpretation also provides guidance on the
related derecognition, classification, interest and penalties, accounting for interim periods,
disclosure and transition of uncertain tax positions. Although the adoption of this guidance
did not have a direct impact on the Company’s results of operations or financial position,
adoption of the guidance by one of the Company’s equity method investees resulted in the Company
recording a charge of $681, net of tax, to opening retained earnings in 2007.
81
NOTES TO THE CONSOLIDATED FINANCIAL STATEMENTS
(Dollars in thousands)
Accounting Pronouncements Not Yet Adopted
ASU 2009-17. In June 2009, the FASB issued Accounting Standards Update 2009-17, Improvements to
Financial Reporting by Enterprises with Variable Interest Entities, (“ASU 2009-17”), which
amends previous guidance under ASC 810, Consolidation (“ASC 810”). The guidance replaces the
quantitative-based risks and rewards calculation for determining which enterprise has a
controlling financial interest in a variable interest entity with an approach focused on
identifying which enterprise has (i) the power to direct the activities of a variable interest
entity that most significantly impact the entity’s economic performance and (ii) the obligation
to absorb losses of the entity or the right to receive benefits from the entity. It also
requires an additional reconsideration event when determining whether an entity is a variable
interest entity when any changes in fact and circumstances occur and ongoing assessments of
whether an enterprise is the primary beneficiary of a variable interest entity. Additional
disclosures about an enterprise’s involvement in variable interest entities are also required.
ASC 810 is effective for interim and annual reporting periods beginning after November 15, 2009.
The Company is currently evaluating the impact of the adoption of ASC 810, but does not expect
adoption to have a material impact on its financial position or results of operations.
The aggregate carrying value of the Company’s investment portfolio was $3,992,020 and $4,032,034
at December 31, 2009 and 2008, respectively, and is comprised of available-for-sale securities,
held-for-trading securities, investments at equity, derivatives and other invested assets,
short-term investments, cash and cash equivalents and assets pledged for derivatives.
Available-For-Sale Securities
Investments in available-for-sale fixed income and equity securities are summarized below:
| |
|
|
|
|
|
|
|
|
|
|
|
|
|
|
|
|
| |
|
At December 31, 2009 |
|
| |
|
Cost or |
|
|
Gross |
|
|
Gross |
|
|
|
|
| |
|
Amortized |
|
|
Unrealized |
|
|
Unrealized |
|
|
|
|
| |
|
Cost |
|
|
Gains |
|
|
Losses |
|
|
Fair Value |
|
Fixed income securities: |
|
|
|
|
|
|
|
|
|
|
|
|
|
|
|
|
United States government and government agencies and
authorities |
|
$ |
81,282 |
|
|
$ |
6,945 |
|
|
$ |
462 |
|
|
$ |
87,765 |
|
States, municipalities and political subdivisions1 |
|
|
1,185,380 |
|
|
|
151,498 |
|
|
|
7,914 |
|
|
|
1,328,964 |
|
Other corporate |
|
|
80,483 |
|
|
|
22,334 |
|
|
|
— |
|
|
|
102,817 |
|
|
|
|
|
|
|
|
|
|
|
|
|
|
Total fixed income securities |
|
|
1,347,145 |
|
|
|
180,777 |
|
|
|
8,376 |
|
|
|
1,519,546 |
|
Equity securities — common stocks |
|
|
1,070,577 |
|
|
|
214,304 |
|
|
|
779 |
|
|
|
1,284,102 |
|
|
|
|
|
|
|
|
|
|
|
|
|
|
Total available-for-sale securities |
|
$ |
2,417,722 |
|
|
$ |
395,081 |
|
|
$ |
9,155 |
|
|
$ |
2,803,648 |
|
|
|
|
|
|
|
|
|
|
|
|
|
|
| |
|
|
| 1 |
|
Includes assets pledged for derivatives at a fair value of $29,425 (amortized
cost of $24,025). |
Included in equity securities at December 31, 2009 are certain holdings which represent
over 10% of shareholder’s equity at that date as follows: (i) a $177,316 investment in Dell
Inc. common stock, which represents 11.7% of shareholder’s equity; (ii) a $168,564 investment in
Johnson & Johnson common stock, which represents 11.1% of shareholder’s equity; and (iii) a
$162,617 investment in Wells Fargo & Company common stock, which represents 10.7% of
shareholder’s equity.
| |
|
|
|
|
|
|
|
|
|
|
|
|
|
|
|
|
| |
|
At December 31, 2008 |
|
| |
|
Cost or |
|
|
Gross |
|
|
Gross |
|
|
|
|
| |
|
Amortized |
|
|
Unrealized |
|
|
Unrealized |
|
|
|
|
| |
|
Cost |
|
|
Gains |
|
|
Losses |
|
|
Fair Value |
|
Fixed income securities: |
|
|
|
|
|
|
|
|
|
|
|
|
|
|
|
|
United States government and government agencies
and authorities |
|
$ |
136,551 |
|
|
$ |
32,879 |
|
|
$ |
— |
|
|
$ |
169,430 |
|
States, municipalities and political subdivisions |
|
|
1,279,232 |
|
|
|
54,230 |
|
|
|
17,997 |
|
|
|
1,315,465 |
|
Other corporate |
|
|
50,331 |
|
|
|
2,603 |
|
|
|
4,495 |
|
|
|
48,439 |
|
|
|
|
|
|
|
|
|
|
|
|
|
|
Total fixed income securities |
|
|
1,466,114 |
|
|
|
89,712 |
|
|
|
22,492 |
|
|
|
1,533,334 |
|
Equity securities — common stocks |
|
|
1,106,098 |
|
|
|
29,422 |
|
|
|
115,366 |
|
|
|
1,020,154 |
|
|
|
|
|
|
|
|
|
|
|
|
|
|
Total available-for-sale securities |
|
$ |
2,572,212 |
|
|
$ |
119,134 |
|
|
$ |
137,858 |
|
|
$ |
2,553,488 |
|
|
|
|
|
|
|
|
|
|
|
|
|
|
82
NOTES TO THE CONSOLIDATED FINANCIAL STATEMENTS
(Dollars in thousands)
Included in equity securities at December 31, 2008 is a $156,642 investment in Johnson & Johnson
common stock, which represents 13.4% of shareholder’s equity at that date.
The amortized cost and fair value of available-for-sale fixed income securities by contractual
maturity are summarized below. Actual maturities may differ from maturities shown below due to
the existence of call features.
| |
|
|
|
|
|
|
|
|
| |
|
At December 31, 2009 |
|
| |
|
Amortized Cost |
|
|
Fair Value |
|
Due in one year or less |
|
$ |
680 |
|
|
$ |
681 |
|
Due after one year through five years |
|
|
1,727 |
|
|
|
2,690 |
|
Due after five years through ten years |
|
|
34,815 |
|
|
|
39,760 |
|
Due after ten years through twenty years |
|
|
140,384 |
|
|
|
157,470 |
|
Due after twenty years |
|
|
1,169,539 |
|
|
|
1,318,945 |
|
|
|
|
|
|
|
|
Total fixed income securities |
|
$ |
1,347,145 |
|
|
$ |
1,519,546 |
|
|
|
|
|
|
|
|
Changes in net unrealized investment gains and losses, net of transfers to realized investment
gains and losses, and the related tax effects, are summarized as follows:
| |
|
|
|
|
|
|
|
|
|
|
|
|
| |
|
Years Ended December 31, |
|
| |
|
2009 |
|
|
2008 |
|
|
2007 |
|
Fixed income securities |
|
$ |
105,181 |
|
|
$ |
94,292 |
|
|
$ |
97,148 |
|
Equity securities |
|
|
299,469 |
|
|
|
(108,311 |
) |
|
|
(3,670 |
) |
Other, primarily investments at equity |
|
|
1,168 |
|
|
|
(22,268 |
) |
|
|
16,160 |
|
|
|
|
|
|
|
|
|
|
|
Change in unrealized investment
gains and losses, net of transfers
to realized investment gains and
losses, before income
taxes1 |
|
|
405,818 |
|
|
|
(36,287 |
) |
|
|
109,638 |
|
Deferred income taxes |
|
|
(142,036 |
) |
|
|
12,701 |
|
|
|
(38,353 |
) |
|
|
|
|
|
|
|
|
|
|
Net change in unrealized
investment gains and losses, net
of transfers to realized
investment gains and losses |
|
$ |
263,782 |
|
|
$ |
(23,586 |
) |
|
$ |
71,285 |
|
|
|
|
|
|
|
|
|
|
|
| |
|
|
| 1 |
|
The amounts are net of transfers to realized investment gains and losses of
$72,863, $54,520 and $21,904 in 2009, 2008 and 2007, respectively. |
The Company holds significant investments in equities and equity related securities. The
market values and liquidity of these investments are volatile and may vary dramatically either
up or down in short periods, and their ultimate value will therefore only be known over the long
term. Certain individual available-for-sale securities had gross unrealized losses at December
31, 2009 totaling $9,155, which represented 4.8% of the cost or amortized cost of such
securities in the aggregate, of which $8,376 was attributed to fixed income securities and $779
was attributed to equity securities.
83
NOTES TO THE CONSOLIDATED FINANCIAL STATEMENTS
(Dollars in thousands)
The number of continuous months in which securities in an unrealized loss position at December
31, 2009 were in such a position is summarized as follows:
| |
|
|
|
|
|
|
|
|
|
|
|
|
|
|
|
|
|
|
|
|
|
|
|
|
| |
|
December 31, 2009 |
|
|
December 31, 2008 |
|
| |
|
|
|
|
|
|
|
|
|
Number |
|
|
|
|
|
|
|
|
|
|
Number |
|
| |
|
Fair |
|
|
Unrealized |
|
|
of |
|
|
Fair |
|
|
Unrealized |
|
|
of |
|
| |
|
Value |
|
|
Loss |
|
|
Securities |
|
|
Value |
|
|
Loss |
|
|
Securities |
|
Fixed income securities: |
|
|
|
|
|
|
|
|
|
|
|
|
|
|
|
|
|
|
|
|
|
|
|
|
Investment grade: |
|
|
|
|
|
|
|
|
|
|
|
|
|
|
|
|
|
|
|
|
|
|
|
|
U.S. government and government agencies and
authorities: |
|
|
|
|
|
|
|
|
|
|
|
|
|
|
|
|
|
|
|
|
|
|
|
|
6 months or less |
|
$ |
11,284 |
|
|
$ |
462 |
|
|
|
3 |
|
|
$ |
— |
|
|
$ |
— |
|
|
|
— |
|
|
|
|
|
|
|
|
|
|
|
|
|
|
|
|
|
|
|
|
|
|
|
|
|
|
|
|
|
|
|
|
|
|
|
|
|
|
|
|
|
|
|
|
|
States, municipalities and political subdivisions: |
|
|
|
|
|
|
|
|
|
|
|
|
|
|
|
|
|
|
|
|
|
|
|
|
6 months or less |
|
|
134,841 |
|
|
|
7,873 |
|
|
|
8 |
|
|
|
385,140 |
|
|
|
16,865 |
|
|
|
27 |
|
7 – 12 months |
|
|
— |
|
|
|
— |
|
|
|
— |
|
|
|
15,462 |
|
|
|
1,132 |
|
|
|
3 |
|
Greater than 12 months |
|
|
518 |
|
|
|
41 |
|
|
|
1 |
|
|
|
— |
|
|
|
— |
|
|
|
— |
|
|
|
|
|
|
|
|
|
|
|
|
|
|
|
|
|
|
|
|
|
|
|
135,359 |
|
|
|
7,914 |
|
|
|
9 |
|
|
|
400,602 |
|
|
|
17,997 |
|
|
|
30 |
|
|
|
|
|
|
|
|
|
|
|
|
|
|
|
|
|
|
|
|
Non-investment grade, other corporate: |
|
|
|
|
|
|
|
|
|
|
|
|
|
|
|
|
|
|
|
|
|
|
|
|
6 months or less |
|
|
— |
|
|
|
— |
|
|
|
— |
|
|
|
36,100 |
|
|
|
4,495 |
|
|
|
1 |
|
|
|
|
|
|
|
|
|
|
|
|
|
|
|
|
|
|
|
|
Total fixed income securities |
|
|
146,643 |
|
|
|
8,376 |
|
|
|
12 |
|
|
|
436,702 |
|
|
|
22,492 |
|
|
|
31 |
|
|
|
|
|
|
|
|
|
|
|
|
|
|
|
|
|
|
|
|
Equity securities: |
|
|
|
|
|
|
|
|
|
|
|
|
|
|
|
|
|
|
|
|
|
|
|
|
6 months or less |
|
|
5,678 |
|
|
|
646 |
|
|
|
2 |
|
|
|
519,602 |
|
|
|
115,366 |
|
|
|
14 |
|
7 – 12 months |
|
|
21,439 |
|
|
|
133 |
|
|
|
1 |
|
|
|
— |
|
|
|
— |
|
|
|
— |
|
|
|
|
|
|
|
|
|
|
|
|
|
|
|
|
|
|
|
|
Total equity securities |
|
|
27,117 |
|
|
|
779 |
|
|
|
3 |
|
|
|
519,602 |
|
|
|
115,366 |
|
|
|
14 |
|
|
|
|
|
|
|
|
|
|
|
|
|
|
|
|
|
|
|
|
Total securities in an unrealized loss position |
|
$ |
173,760 |
|
|
$ |
9,155 |
|
|
|
15 |
|
|
$ |
956,304 |
|
|
$ |
137,858 |
|
|
|
45 |
|
|
|
|
|
|
|
|
|
|
|
|
|
|
|
|
|
|
|
|
The majority of the gross unrealized losses of $9,155 in the investment portfolio at
December 31, 2009 are attributable to investment grade municipal bonds, none of which had a loss
that exceeded 10% of its cost at that date. Management has determined that the unrealized
losses on its fixed income securities at December 31, 2009 are principally attributable to
changes in interest rates and that the Company does not have the intent to sell these securities
and it is more likely than not that it will not be required to sell these securities before
recovery of their cost bases.
For the year ended December 31, 2009, other than temporary impairment charges were $110,814, of
which $3,507 was in respect of fixed income securities, all of which was credit related, and the
remaining $107,307 was due to write downs of equity securities. There were no fixed income
losses for which a portion of the other than temporary impairment has been recognized in
accumulated other comprehensive income. For the year ended December 31, 2008, the Company
recorded other than temporary impairment charges of $194,670, of which $4,365 was in respect of
fixed income securities and $190,305 was due to write downs of equity securities.
84
NOTES TO THE CONSOLIDATED FINANCIAL STATEMENTS
(Dollars in thousands)
The fair value by contractual maturity of the Company’s fixed income securities in an unrealized
loss position is summarized as follows:
| |
|
|
|
|
|
|
|
|
| |
|
At December 31, 2009 |
|
| |
|
|
|
|
|
Unrealized |
|
| |
|
Fair Value |
|
|
Loss |
|
Due in one year or less |
|
$ |
— |
|
|
$ |
— |
|
Due after one through five years |
|
|
— |
|
|
|
— |
|
Due after five through ten years |
|
|
623 |
|
|
|
(44 |
) |
Due after ten years through twenty years |
|
|
19,223 |
|
|
|
(850 |
) |
Due after twenty years |
|
|
126,797 |
|
|
|
(7,482 |
) |
|
|
|
|
|
|
|
Total fixed income securities in an unrealized loss position |
|
$ |
146,643 |
|
|
$ |
(8,376 |
) |
|
|
|
|
|
|
|
Fixed Income Securities, Designated as Held-For-Trading
Fixed income securities classified as held-for-trading include those purchased for short-term
investment objectives and those designated as such by management pursuant to the fair value
option under ASC 815-15. These securities, which are recorded at fair value on the consolidated
balance sheets, include convertible securities with embedded derivatives, mortgage-backed
securities purchased at deep discounts to par and certain corporate fixed income securities.
Changes in fair value of held-for-trading securities (including gains or losses on disposal),
are recognized as realized investment gains and losses in the consolidated statements of income
in the period in which they occur and amounted to gains (losses) of $74,976, $(90,891) and
$(30,904) for the years ended December 31, 2009, 2008 and 2007, respectively. The fair values
of these securities were $321,359 and $233,998 at December 31, 2009 and 2008, respectively.
Included in held-for-trading securities are two convertible securities issued by Level 3
Communications, Inc. with a combined value of $145,714 which together with an investment in
Level 3 Communications, Inc. common stock of $36,828 represented 12.0% of shareholder’s equity
at December 31, 2009 (12.8% at December 31, 2008).
Investments at Equity
Investments at equity include investments in entities that are consolidated subsidiaries of
Fairfax, but are less than 50% owned by the Company, as well as investments in certain
partnerships, accounted for under the equity method of accounting. These investments consist of
equity interests of between approximately 1% and 47% at December 31, 2009, with a total carrying
value of $167,331 and $117,586 at December 31, 2009 and 2008, respectively. For the years ended
December 31, 2009, 2008 and 2007, total earnings (losses) of investments at equity were $53,308,
$(51,947) and $48,831, respectively. Earnings (losses) of investment companies and similar
equity method investees of $53,187, $(51,238) and $12,985 in 2009, 2008 and 2007, respectively,
are included in investment income on the consolidated statements of income. Pre-tax earnings
(losses) of other equity method investees of $121, $(709) and $35,846 in 2009, 2008 and 2007,
respectively, are included in equity in earnings of investees, net of tax, on the consolidated
statements of income. Dividends received from other equity method investees were $486, $475 and
$5,318 in 2009, 2008 and 2007, respectively.
The Company’s aggregate share of its equity investees’ balance sheets, which includes its share
of those investees accounted for under the fair value option pursuant to ASC 825, had they been
accounted for under the equity method, is summarized as follows:
| |
|
|
|
|
|
|
|
|
| |
|
At December 31, |
|
| |
|
2009 |
|
|
2008 |
|
Cash and investments |
|
$ |
1,057,406 |
|
|
$ |
832,936 |
|
Total assets |
|
$ |
1,290,825 |
|
|
$ |
1,015,502 |
|
Total liabilities |
|
$ |
788,967 |
|
|
$ |
674,362 |
|
Shareholders’ equity or partners’ capital1 |
|
$ |
501,858 |
|
|
$ |
341,140 |
|
| |
|
|
| 1 |
|
The difference between the Company’s aggregate share of shareholders’ equity or
partners’ capital and the carrying value on the consolidated balance sheets is primarily
due to mark-to-market adjustments for changes in fair value of equity investments for which
the Company has elected the fair value option. |
85
NOTES TO THE CONSOLIDATED FINANCIAL STATEMENTS
(Dollars in thousands)
The Company’s aggregate share of its equity investees’ statements of income, which includes
its share of income of those investees accounted for under the fair value provisions of ASC 825,
had they been accounted for under the equity method, is summarized as follows:
| |
|
|
|
|
|
|
|
|
|
|
|
|
| |
|
Years Ended December 31, |
|
| |
|
2009 |
|
|
2008 |
|
|
2007 |
|
Total revenues |
|
$ |
312,452 |
|
|
$ |
191,205 |
|
|
$ |
217,052 |
|
Total expenses |
|
$ |
210,243 |
|
|
$ |
200,906 |
|
|
$ |
150,715 |
|
Net income (loss) |
|
$ |
91,311 |
|
|
$ |
(22,664 |
) |
|
$ |
48,831 |
|
Derivatives and Other Invested Assets
Derivative Securities and Short-Sale Obligations
The Company’s derivative securities are principally comprised of credit default swaps and total
return swaps, none of which are designated as hedges, and are included in derivatives and other
invested assets or accounts payable and other liabilities on the consolidated balance sheets at
fair value. Changes in fair value of derivative securities are included in realized investment
gains and losses on the consolidated statements of income in the period in which they occur.
The following table summarizes the Company’s derivative securities at December 31, 2009 and
2008:
| |
|
|
|
|
|
|
|
|
|
|
|
|
|
|
|
|
|
|
|
|
|
|
|
|
| |
|
December 31, 2009 |
|
|
December 31, 2008 |
|
| |
|
|
|
|
|
|
|
|
|
Fair Value |
|
|
|
|
|
|
|
|
|
|
Fair Value |
|
| |
|
Notional |
|
|
|
|
|
|
Asset/ |
|
|
Notional |
|
|
|
|
|
|
Asset/ |
|
| |
|
Amount |
|
|
Cost |
|
|
(Liability) |
|
|
Amount |
|
|
Cost |
|
|
(Liability |
|
Credit default swaps |
|
$ |
1,570,393 |
|
|
$ |
21,624 |
|
|
$ |
20,027 |
|
|
$ |
3,044,313 |
|
|
$ |
42,477 |
|
|
$ |
138,830 |
|
Total return swaps |
|
|
472,706 |
|
|
|
— |
|
|
|
(1,917 |
) |
|
|
— |
|
|
|
— |
|
|
|
— |
|
Other derivatives1 |
|
|
101,201 |
|
|
|
10,225 |
|
|
|
— |
|
|
|
1,114,201 |
|
|
|
10,225 |
|
|
|
— |
|
| |
|
|
| 1 |
|
At December 31, 2009, other derivatives are comprised of warrants. At December
31, 2008, other derivatives are comprised of warrants and Eurodollar futures contracts. |
Credit Default Swaps
The Company has purchased credit default swaps, referenced to various issuers in the banking,
mortgage and insurance sectors of the financial services industry which serve as economic hedges
against declines in the fair value of the Company’s financial assets. Under a credit default
swap, as the buyer, the Company agrees to pay to a specific counterparty, fixed premium amounts
based on an agreed notional principal amount in exchange for protection against default by the
issuers of specified referenced debt securities. The credit events, as defined by the respective
credit default swap contracts establishing the rights to recover amounts from the
counterparties, include events such as bankruptcy, obligation acceleration, obligation default,
failure to pay, repudiation/moratorium and restructuring. As of December 31, 2009, all credit
default swap contracts held by the Company have been purchased from and entered into with either
Citibank, N.A., Deutsche Bank AG or Barclays Bank PLC as the counterparty, with positions on
certain covered risks with more than one of these counterparties.
The credit default swaps are recorded at fair value with changes in fair value recognized as
realized investment gains or losses in the period in which they occur. The Company obtains
broker-dealer quotes which are based on observable credit spreads for its credit default swaps.
The Company assesses the reasonableness of the broker-dealer quotes by comparing the fair values
to values produced using individual issuer credit default swap yield curves, by referencing them
to movements in credit spreads and by comparing them to recent market transaction prices for
similar credit default swaps where available. The fair values of credit default swaps are
subject to significant volatility arising from the potential differences in the perceived risk
of default of the underlying issuers, movements in credit spreads and the length of time to the
contracts’ maturity. The fair value of the credit default swaps may vary materially either up
or down in short periods, and their ultimate value may therefore only be known upon their
disposition.
86
NOTES TO THE CONSOLIDATED FINANCIAL STATEMENTS
(Dollars in thousands)
Counterparties to the credit default swaps expose the Company to credit risk in the event of
non-performance, which the Company endeavors to limit through the terms of agreements negotiated
with the counterparties. Pursuant to the swap agreements, the counterparties are required to
pledge cash or U.S. Treasury securities as collateral, in the event that appreciation in the
fair value of the credit default swaps meets certain thresholds. At December 31, 2009, there
was no collateral held in the name of the Company as the fair value of the Company’s credit
default swap portfolio had declined significantly through closing transactions and changes in
fair value. The Company believes that any credit risk exposure, represented by the
uncollateralized fair value of the credit default swaps ($20,027 and $49,114 at December 31,
2009 and 2008, respectively), is low given the diversification among the various counterparties.
The Company funds all its obligations relating to the credit default swaps through the initial
premium paid at purchase and as a result there are no requirements for the Company to provide
collateral.
The Company’s holdings of credit default swaps have declined significantly in 2009 relative to
prior years, largely as a result of closing transactions and changes in fair value. In the
latter part of 2008, the Company reviewed the financial objectives of its economic hedging
program and decided not to replace closed credit default swaps based on: (i) the Company’s
judgment that its exposure to elevated levels of credit risk had moderated and that its
historical approaches to managing credit risk were satisfactory in mitigating the Company’s
exposure to credit risk arising from its financial assets; (ii) the significant increase in the
cost of purchasing credit protection; and (iii) the fact that the Company’s capital and
liquidity had benefited from approximately $450 million in realized investment gains from credit
default swaps since inception of the hedge program. As a result, the effect that credit default
swaps as hedging instruments may be expected to have on the Company’s future financial position,
liquidity and results of operations has diminished significantly relative to recent years. The
Company may initiate new credit default swap contracts as a hedging mechanism in the future, but
there can be no assurance that it will do so.
At December 31, 2009, the credit default swap portfolio had an average term to expiry of 2.3
years. A maturity analysis of the credit default swaps at December 31, 2009 follows:
| |
|
|
|
|
|
|
|
|
| |
|
Notional |
|
|
|
|
| |
|
Amount |
|
|
Fair Value |
|
Expiring in one year or less |
|
$ |
702,591 |
|
|
$ |
1,277 |
|
Expiring after 1 year through 5 years |
|
|
867,802 |
|
|
|
18,750 |
|
|
|
|
|
|
|
|
|
|
$ |
1,570,393 |
|
|
$ |
20,027 |
|
|
|
|
|
|
|
|
The following tables summarize the effect of the credit default swaps and related hedged items
on the Company’s financial position and results of operations and cash flows as of and for the
years ended December 31, 2009 and 2008:
| |
|
|
|
|
|
|
|
|
|
|
|
|
|
|
|
|
|
|
|
|
| |
|
As of and for the Year Ended December 31, 2009 |
|
| |
|
|
|
|
|
|
|
|
|
Effect on Pre-tax |
|
| |
|
Exposure/ |
|
|
|
|
|
|
Other |
|
|
|
|
|
|
|
| |
|
Notional |
|
|
Carrying |
|
|
Comprehensive |
|
|
|
|
|
|
|
| |
|
Value |
|
|
Value |
|
|
Income |
|
|
Earnings |
|
|
Net Equity |
|
Credit risk exposures: |
|
|
|
|
|
|
|
|
|
|
|
|
|
|
|
|
|
|
|
|
Fixed income securities1 |
|
$ |
1,753,140 |
|
|
$ |
1,753,140 |
|
|
$ |
131,576 |
|
|
$ |
156,916 |
|
|
$ |
288,492 |
|
Warrants |
|
|
101,201 |
|
|
|
— |
|
|
|
— |
|
|
|
— |
|
|
|
— |
|
Premiums receivable |
|
|
164,802 |
|
|
|
164,802 |
|
|
|
— |
|
|
|
1,823 |
|
|
|
1,823 |
|
Reinsurance recoverable |
|
|
892,697 |
|
|
|
892,697 |
|
|
|
— |
|
|
|
(2,000 |
) |
|
|
(2,000 |
) |
|
|
|
|
|
|
|
|
|
|
|
|
|
|
|
|
Total credit risk exposure |
|
$ |
2,911,840 |
|
|
$ |
2,810,639 |
|
|
|
131,576 |
|
|
|
156,739 |
|
|
|
288,315 |
|
|
|
|
|
|
|
|
|
|
|
|
|
|
|
|
|
Hedging instruments: |
|
|
|
|
|
|
|
|
|
|
|
|
|
|
|
|
|
|
|
|
Credit default swaps |
|
$ |
1,570,393 |
|
|
$ |
20,027 |
|
|
|
— |
|
|
|
(9,143 |
) |
|
|
(9,143 |
) |
Eurodollar futures contracts |
|
|
— |
|
|
|
— |
|
|
|
— |
|
|
|
(344 |
) |
|
|
(344 |
) |
|
|
|
|
|
|
|
|
|
|
|
|
|
|
|
|
Total hedging instruments |
|
$ |
1,570,393 |
|
|
$ |
20,027 |
|
|
|
— |
|
|
|
(9,487 |
) |
|
|
(9,487 |
) |
|
|
|
|
|
|
|
|
|
|
|
|
|
|
|
|
Net exposure |
|
|
|
|
|
|
|
|
|
$ |
131,576 |
|
|
$ |
147,252 |
|
|
$ |
278,828 |
|
|
|
|
|
|
|
|
|
|
|
|
|
|
|
|
|
|
|
| |
|
|
| 1 |
|
Excludes $87,765 of U.S. government securities with a loss in other
comprehensive income of $26,395 and a realized gain of $1,066. |
87
NOTES TO THE CONSOLIDATED FINANCIAL STATEMENTS
(Dollars in thousands)
The net cash flow effect from disposals of the above credit risk exposures and related
hedging instruments for the year ended December 31, 2009 was $177,366.
| |
|
|
|
|
|
|
|
|
|
|
|
|
|
|
|
|
|
|
|
|
| |
|
As of and for the Year Ended December 31, 2008 |
|
| |
|
|
|
|
|
|
|
|
|
Effect on Pre-tax |
|
| |
|
Exposure/ |
|
|
|
|
|
|
Other |
|
|
|
|
|
|
|
| |
|
Notional |
|
|
Carrying |
|
|
Comprehensive |
|
|
|
|
|
|
|
| |
|
Value |
|
|
Value |
|
|
Income |
|
|
Earnings |
|
|
Net Equity |
|
Credit risk exposures: |
|
|
|
|
|
|
|
|
|
|
|
|
|
|
|
|
|
|
|
|
Fixed income securities1 |
|
$ |
1,597,902 |
|
|
$ |
1,597,902 |
|
|
$ |
38,728 |
|
|
$ |
(91,201 |
) |
|
$ |
(52,473 |
) |
Warrants |
|
|
101,201 |
|
|
|
— |
|
|
|
— |
|
|
|
(5,902 |
) |
|
|
(5,902 |
) |
Premiums receivable |
|
|
182,158 |
|
|
|
182,158 |
|
|
|
— |
|
|
|
100 |
|
|
|
100 |
|
Reinsurance recoverable |
|
|
968,217 |
|
|
|
968,217 |
|
|
|
— |
|
|
|
(7,700 |
) |
|
|
(7,700 |
) |
|
|
|
|
|
|
|
|
|
|
|
|
|
|
|
|
Total credit risk exposure |
|
$ |
2,849,478 |
|
|
$ |
2,748,277 |
|
|
|
38,728 |
|
|
|
(104,703 |
) |
|
|
(65,975 |
) |
|
|
|
|
|
|
|
|
|
|
|
|
|
|
|
|
Hedging instruments: |
|
|
|
|
|
|
|
|
|
|
|
|
|
|
|
|
|
|
|
|
Credit default swaps |
|
$ |
3,044,313 |
|
|
$ |
138,830 |
|
|
|
— |
|
|
|
283,456 |
|
|
|
283,456 |
|
Eurodollar futures contracts |
|
|
1,013,000 |
|
|
|
— |
|
|
|
— |
|
|
|
4,028 |
|
|
|
4,028 |
|
|
|
|
|
|
|
|
|
|
|
|
|
|
|
|
|
Total hedging instruments |
|
$ |
4,057,313 |
|
|
$ |
138,830 |
|
|
|
— |
|
|
|
287,484 |
|
|
|
287,484 |
|
|
|
|
|
|
|
|
|
|
|
|
|
|
|
|
|
Net exposure |
|
|
|
|
|
|
|
|
|
$ |
38,728 |
|
|
$ |
182,781 |
|
|
$ |
221,509 |
|
|
|
|
|
|
|
|
|
|
|
|
|
|
|
|
|
|
|
| |
|
|
| 1 |
|
Excludes $169,430 of U.S. government securities with a gain in other
comprehensive income of $55,564 and realized gain of $139,163. |
The net cash flow effect from disposals of the above credit risk exposures and related
hedging instruments for the year ended December 31, 2008 was $342,705.
In the normal course of effecting its economic hedging strategy with respect to credit risk, the
Company expects that there may be periods where the notional value of the hedging instruments
may exceed or be deficient relative to the exposure items being hedged. This situation may
arise when management compensates for imperfect correlations between the hedging item and the
hedge or due to the timing of opportunities related to the Company’s ability to exit and enter
hedged or hedging items at attractive prices.
Total Return Swaps and Short-Sales
During much of 2008 and immediately preceding years, the Company had been concerned about the
valuation of worldwide equity markets, uncertainty resulting from credit issues in the U.S. and
global economic conditions. As protection against a decline in equity markets, the Company held
short positions in Standard & Poor’s Depositary Receipts (“SPDRs”) and U.S. listed common stocks
and equity index and equity total return swaps, referred to in the aggregate as equity hedges.
The Company also in the past purchased S&P Index call options to limit the potential loss on its
equity index total return swaps and SPDRs short positions and to provide general protection
against the short position in common stocks. In the latter half of 2008, following significant
declines in global equity markets, the Company reviewed the financial objectives of its hedging
program and determined that elevated risks in the global equity markets had moderated and
subsequently closed all of its equity hedge positions, realizing substantial gains. During the
fourth quarter of 2008, the Company increased its investments in equities as a result of the
opportunities presented by significant declines in the global equity markets.
During the third quarter of 2009, as a result of the rapid increase in the valuation level of
worldwide equity markets, the Company once again decided to protect a portion of its equity and
equity related holdings against a decline in equity markets and entered into equity index total
return swaps with a notional value of $452,319. These total return swaps contain contractual
reset provisions requiring counterparties to cash-settle on a monthly basis any market value
movements arising since the prior settlement. Any cash paid to settle unfavorable market value
changes and, conversely, any cash received in settlement of favorable market value changes are
recognized as realized investment gains and losses on the consolidated statements of income in
the period in which they occur. To the extent that a contractual reset date of a contract does
not correspond to the balance sheet date, the Company records additional net realized investment
gains or losses on the consolidated statements of income to adjust the carrying value of the
derivative asset or liability associated with each total return swap contract to reflect its
fair value at the balance sheet date. The total return swaps were in a loss position at December
31, 2009 and are recorded in accounts payable and other liabilities on the consolidated balance
sheet.
The Company is required to post collateral equivalent to 6% of the notional value of the total
return swaps at the time the swap is opened. These assets are recorded at fair value in assets
pledged for derivatives on the consolidated balance sheets. At December 31, 2009, the fair
value of the collateral posted, in the form of municipal bonds, was $29,425.
88
NOTES TO THE CONSOLIDATED FINANCIAL STATEMENTS
(Dollars in thousands)
The following tables summarize the effect of equity risk hedging instruments and related hedged
items on the Company’s financial position and results of operations and cash flows as of and for
the years ended December 31, 2009 and 2008:
| |
|
|
|
|
|
|
|
|
|
|
|
|
|
|
|
|
|
|
|
|
| |
|
As of and for the Year Ended December 31, 2009 |
|
| |
|
|
|
|
|
|
|
|
|
Effect on Pre-tax |
|
| |
|
Exposure/ |
|
|
|
|
|
|
Other |
|
|
|
|
|
|
|
| |
|
Notional |
|
|
Carrying |
|
|
Comprehensive |
|
|
|
|
|
|
|
| |
|
Value |
|
|
Value |
|
|
Income1 |
|
|
Earnings |
|
|
Net Equity |
|
Equity exposures: |
|
|
|
|
|
|
|
|
|
|
|
|
|
|
|
|
|
|
|
|
Equity securities |
|
$ |
1,284,102 |
|
|
$ |
1,284,102 |
|
|
$ |
299,469 |
|
|
$ |
(37,667 |
) |
|
$ |
261,802 |
|
Investments at equity |
|
|
167,331 |
|
|
|
167,331 |
|
|
|
1,168 |
|
|
|
55,605 |
|
|
|
56,773 |
|
Other invested assets |
|
|
367,875 |
|
|
|
367,875 |
|
|
|
— |
|
|
|
58,908 |
|
|
|
58,908 |
|
|
|
|
|
|
|
|
|
|
|
|
|
|
|
|
|
Total equity exposure |
|
$ |
1,819,308 |
|
|
$ |
1,819,308 |
|
|
|
300,637 |
|
|
|
76,846 |
|
|
|
377,483 |
|
|
|
|
|
|
|
|
|
|
|
|
|
|
|
|
|
Hedging instruments: |
|
|
|
|
|
|
|
|
|
|
|
|
|
|
|
|
|
|
|
|
Total return swaps |
|
|
472,706 |
|
|
|
(1,917 |
) |
|
|
— |
|
|
|
(22,304 |
) |
|
|
(22,304 |
) |
|
|
|
|
|
|
|
|
|
|
|
|
|
|
|
|
Total equity
hedging
instruments |
|
$ |
472,706 |
|
|
$ |
(1,917 |
) |
|
|
— |
|
|
|
(22,304 |
) |
|
|
(22,304 |
) |
|
|
|
|
|
|
|
|
|
|
|
|
|
|
|
|
Net equity exposure |
|
|
|
|
|
|
|
|
|
$ |
300,637 |
|
|
$ |
54,542 |
|
|
$ |
355,179 |
|
|
|
|
|
|
|
|
|
|
|
|
|
|
|
|
|
|
|
| |
|
|
| 1 |
|
Excludes foreign currency translation gains of $496. |
The net cash flow effect from disposals of the above equity exposures and related hedging
instruments for the year ended December 31, 2009 was $1,203.
| |
|
|
|
|
|
|
|
|
|
|
|
|
|
|
|
|
|
|
|
|
| |
|
As of and for the Year Ended December 31, 2008 |
|
| |
|
|
|
|
|
|
|
|
|
Effect on Pre-tax |
|
| |
|
Exposure/ |
|
|
|
|
|
|
Other |
|
|
|
|
|
|
|
| |
|
Notional |
|
|
Carrying |
|
|
Comprehensive |
|
|
|
|
|
|
|
| |
|
Value |
|
|
Value |
|
|
Income1 |
|
|
Earnings |
|
|
Net Equity |
|
Equity exposures: |
|
|
|
|
|
|
|
|
|
|
|
|
|
|
|
|
|
|
|
|
Equity securities |
|
$ |
1,020,154 |
|
|
$ |
1,020,154 |
|
|
$ |
(108,311 |
) |
|
$ |
(187,491 |
) |
|
$ |
(295,802 |
) |
Investments at equity |
|
|
117,586 |
|
|
|
117,586 |
|
|
|
(22,268 |
) |
|
|
(53,497 |
) |
|
|
(75,765 |
) |
Other invested assets |
|
|
273,917 |
|
|
|
273,917 |
|
|
|
— |
|
|
|
(41,134 |
) |
|
|
(41,134 |
) |
|
|
|
|
|
|
|
|
|
|
|
|
|
|
|
|
Total equity exposure |
|
$ |
1,411,657 |
|
|
$ |
1,411,657 |
|
|
|
(130,579 |
) |
|
|
(282,122 |
) |
|
|
(412,701 |
) |
|
|
|
|
|
|
|
|
|
|
|
|
|
|
|
|
Hedging instruments: |
|
|
|
|
|
|
|
|
|
|
|
|
|
|
|
|
|
|
|
|
Total return swaps |
|
|
— |
|
|
|
— |
|
|
|
— |
|
|
|
362,059 |
|
|
|
362,059 |
|
S&P Index call options |
|
|
— |
|
|
|
— |
|
|
|
— |
|
|
|
(499 |
) |
|
|
(499 |
) |
SPDRs short-sales |
|
|
— |
|
|
|
— |
|
|
|
— |
|
|
|
65,506 |
|
|
|
65,506 |
|
Common stock short-sales |
|
|
— |
|
|
|
— |
|
|
|
— |
|
|
|
4,749 |
|
|
|
4,749 |
|
|
|
|
|
|
|
|
|
|
|
|
|
|
|
|
|
Total equity hedging
instruments |
|
$ |
— |
|
|
$ |
— |
|
|
|
— |
|
|
|
431,815 |
|
|
|
431,815 |
|
|
|
|
|
|
|
|
|
|
|
|
|
|
|
|
|
Net equity exposure |
|
|
|
|
|
|
|
|
|
$ |
(130,579 |
) |
|
$ |
149,693 |
|
|
$ |
19,114 |
|
|
|
|
|
|
|
|
|
|
|
|
|
|
|
|
|
|
|
| |
|
|
| 1 |
|
Excludes foreign currency translation losses of $1,569. |
The net cash flow effect from disposals of the above equity exposures and related hedging
instruments for the year ended December 31, 2008 was $481,736.
In the normal course of effecting its economic hedging strategy with respect to equity risk, the
Company expects that there may be periods where the notional value of the hedging instruments
may exceed or be deficient relative to the exposure items being hedged. This situation may
arise when management compensates for imperfect correlations between the hedging item and the
hedge or due to the timing of opportunities related to the Company’s ability to exit and enter
hedged or hedging items at attractive prices.
89
NOTES TO THE CONSOLIDATED FINANCIAL STATEMENTS
(Dollars in thousands)
Other Derivatives
The Company has investments in warrants, which are contracts that grant the holder the right to
purchase an underlying financial instrument at a given price and time. Warrants are recorded in
derivatives and other invested assets at fair value with changes in fair value recognized as
realized investment gains or losses in the period in which they occur.
The following table summarizes the changes in fair value of the Company’s derivative securities
and short positions included in net realized investment gains in the consolidated statements of
income for the years ended December 31, 2009, 2008 and 2007:
| |
|
|
|
|
|
|
|
|
|
|
|
|
| |
|
Years Ended December 31, |
|
| |
|
2009 |
|
|
2008 |
|
|
2007 |
|
Credit default swaps |
|
$ |
(9,143 |
) |
|
$ |
283,456 |
|
|
$ |
229,739 |
|
Total return swaps |
|
|
(22,304 |
) |
|
|
362,059 |
|
|
|
— |
|
SPDRs short-sales |
|
|
— |
|
|
|
65,506 |
|
|
|
(11,118 |
) |
Common stocks short-sales |
|
|
— |
|
|
|
4,749 |
|
|
|
26,498 |
|
Other1 |
|
|
(344 |
) |
|
|
(2,373 |
) |
|
|
1,532 |
|
|
|
|
|
|
|
|
|
|
|
Total net realized investment (losses) gains |
|
$ |
(31,791 |
) |
|
$ |
713,397 |
|
|
$ |
246,651 |
|
|
|
|
|
|
|
|
|
|
|
| |
|
|
| 1 |
|
Other includes warrants, Eurodollar futures contracts and S&P Index call
options. |
Further analysis of the 2009, 2008 and 2007 net realized investment gains is set forth in
the tables below. The net realized investment gains or losses on disposal represent inception
to date gains or losses:
| |
|
|
|
|
|
|
|
|
|
|
|
|
|
|
|
|
| |
|
Year Ended December 31, 2009 |
|
| |
|
Credit |
|
|
Total |
|
|
|
|
|
|
|
| |
|
Default |
|
|
Return |
|
|
Other |
|
|
|
|
| |
|
Swaps1 |
|
|
Swaps |
|
|
Derivatives |
|
|
Total |
|
Realized investment gains (losses) on disposal |
|
$ |
88,807 |
|
|
$ |
(20,387 |
) |
|
$ |
(343 |
) |
|
$ |
68,077 |
|
Reversal of mark-to-market gains recognized in
prior periods |
|
|
(60,119 |
) |
|
|
— |
|
|
|
— |
|
|
|
(60,119 |
) |
Mark-to-market (losses) gains recognized in period |
|
|
(37,831 |
) |
|
|
(1,917 |
) |
|
|
(1 |
) |
|
|
(39,749 |
) |
|
|
|
|
|
|
|
|
|
|
|
|
|
Net realized investment (losses) gains |
|
$ |
(9,143 |
) |
|
$ |
(22,304 |
) |
|
$ |
(344 |
) |
|
$ |
(31,791 |
) |
|
|
|
|
|
|
|
|
|
|
|
|
|
| |
|
|
| 1 |
|
During the year ended December 31, 2009, the Company sold credit default swaps
with a cost of $20,853 and notional amount of $1,387,500 for proceeds of $109,660. |
| |
|
|
|
|
|
|
|
|
|
|
|
|
|
|
|
|
|
|
|
|
|
|
|
|
| |
|
Year Ended December 31, 2008 |
|
| |
|
Credit |
|
|
Total |
|
|
|
|
|
|
Common |
|
|
|
|
|
|
|
| |
|
Default |
|
|
Return |
|
|
SPDRs |
|
|
Stock Short- |
|
|
Other |
|
|
|
|
| |
|
Swaps1 |
|
|
Swaps |
|
|
Short-Sales |
|
|
Sales |
|
|
Derivatives |
|
|
Total |
|
Realized
investment gains
(losses) on
disposal |
|
$ |
336,626 |
|
|
$ |
362,059 |
|
|
$ |
(22,523 |
) |
|
$ |
5,116 |
|
|
$ |
2,019 |
|
|
$ |
683,297 |
|
Reversal of
mark-to-market
(gains) losses
recognized in prior
periods on current
period disposals |
|
|
(130,866 |
) |
|
|
— |
|
|
|
88,029 |
|
|
|
(367 |
) |
|
|
1,555 |
|
|
|
(41,649 |
) |
Mark-to-market
gains (losses)
recognized in
period |
|
|
77,696 |
|
|
|
— |
|
|
|
— |
|
|
|
— |
|
|
|
(5,947 |
) |
|
|
71,749 |
|
|
|
|
|
|
|
|
|
|
|
|
|
|
|
|
|
|
|
|
Net realized
investment
gains (losses) |
|
$ |
283,456 |
|
|
$ |
362,059 |
|
|
$ |
65,506 |
|
|
$ |
4,749 |
|
|
$ |
(2,373 |
) |
|
$ |
713,397 |
|
|
|
|
|
|
|
|
|
|
|
|
|
|
|
|
|
|
|
|
| |
|
|
| 1 |
|
During the year ended December 31, 2008, the Company sold credit default swaps
with a cost of $46,652 and notional amount of $2,154,472 for proceeds of$383,278. |
90
NOTES TO THE CONSOLIDATED FINANCIAL STATEMENTS
(Dollars in thousands)
| |
|
|
|
|
|
|
|
|
|
|
|
|
|
|
|
|
|
|
|
|
|
|
|
|
| |
|
Year Ended December 31, 2007 |
|
| |
|
Credit |
|
|
Total |
|
|
SPDRs |
|
|
Common |
|
|
|
|
|
|
|
| |
|
Default |
|
|
Return |
|
|
Short- |
|
|
Stock Short- |
|
|
Other |
|
|
|
|
| |
|
Swaps1 |
|
|
Swaps |
|
|
Sales |
|
|
Sales |
|
|
Derivatives |
|
|
Total |
|
Realized
investment gains
(losses) on
disposal |
|
$ |
19,296 |
|
|
$ |
— |
|
|
$ |
— |
|
|
$ |
26,454 |
|
|
$ |
12,637 |
|
|
$ |
58,387 |
|
Reversal of
mark-to-market
(gains) losses
recognized in prior
periods on current
period disposals |
|
|
2,263 |
|
|
|
— |
|
|
|
— |
|
|
|
(326 |
) |
|
|
(5,808 |
) |
|
|
(3,871 |
) |
Mark-to-market
gains (losses)
recognized in
period |
|
|
208,180 |
|
|
|
— |
|
|
|
(11,118 |
) |
|
|
370 |
|
|
|
(5,297 |
) |
|
|
192,135 |
|
|
|
|
|
|
|
|
|
|
|
|
|
|
|
|
|
|
|
|
Net realized
investment
gains (losses) |
|
$ |
229,739 |
|
|
$ |
— |
|
|
$ |
(11,118 |
) |
|
$ |
26,498 |
|
|
$ |
1,532 |
|
|
$ |
246,651 |
|
|
|
|
|
|
|
|
|
|
|
|
|
|
|
|
|
|
|
|
| |
|
|
| 1 |
|
During the year ended December 31, 2007, the Company sold credit default swaps
with a cost of $3,104 and notional amount of $121,290 for proceeds of $22,400. |
Other Invested Assets
At December 31, 2009, other invested assets include the Company’s investments in Advent and
Odyssey, which are equity investments for which the Company has elected the fair value option,
and a convertible preferred security that has been designated as held-for-trading. Changes in
fair value of other invested assets are recognized as realized investment gains and losses in
the consolidated statements of income in the period in which they occur and amounted to gains
(losses) of $58,908, $(41,134) and $0 for the years ended December 31, 2009, 2008 and 2007,
respectively. Other invested assets had a carrying value of $367,875 and $273,917 at December
31, 2009 and 2008, respectively.
Investments in Related Parties
Investments in related parties are summarized as follows:
| |
|
|
|
|
|
|
|
|
|
|
|
|
|
|
|
|
|
|
|
|
|
|
|
|
| |
|
|
|
|
|
|
|
|
|
|
|
|
|
|
|
|
|
Ownership Percentage at |
|
| |
|
At December 31, 2009 |
|
|
At December 31, 2008 |
|
|
December 31, 2009 |
|
| |
|
|
|
|
|
Carrying |
|
|
|
|
|
|
Carrying |
|
|
Crum & |
|
|
|
|
| |
|
Cost |
|
|
Value |
|
|
Cost |
|
|
Value |
|
|
Forster |
|
|
Fairfax |
|
Equity securities: |
|
|
|
|
|
|
|
|
|
|
|
|
|
|
|
|
|
|
|
|
|
|
|
|
International Coal Group, Inc. |
|
$ |
34,618 |
|
|
$ |
41,875 |
|
|
$ |
— |
|
|
$ |
— |
|
|
|
6.3 |
% |
|
|
26.1 |
% |
Alliance Insurance Company |
|
$ |
21,572 |
|
|
$ |
21,440 |
|
|
$ |
21,572 |
|
|
$ |
21,440 |
|
|
|
20.0 |
% |
|
|
20.0 |
% |
Arab Orient Insurance Company |
|
$ |
6,582 |
|
|
$ |
6,582 |
|
|
$ |
11,277 |
|
|
$ |
8,848 |
|
|
|
21.9 |
% |
|
|
21.9 |
% |
Investments at equity: |
|
|
|
|
|
|
|
|
|
|
|
|
|
|
|
|
|
|
|
|
|
|
|
|
HWIC Asia Fund |
|
$ |
35,228 |
|
|
$ |
85,685 |
|
|
$ |
35,228 |
|
|
$ |
57,313 |
|
|
|
31.7 |
% |
|
|
98.9 |
% |
Dalton Greater China Fund |
|
$ |
13,266 |
|
|
$ |
15,214 |
|
|
$ |
13,266 |
|
|
$ |
7,893 |
|
|
|
46.4 |
% |
|
|
77.6 |
% |
TRG Holding Corporation |
|
$ |
5,025 |
|
|
$ |
8,090 |
|
|
$ |
5,025 |
|
|
$ |
8,091 |
|
|
|
1.4 |
% |
|
|
100.0 |
% |
Rutland Fund A |
|
$ |
4,666 |
|
|
$ |
2,448 |
|
|
$ |
4,676 |
|
|
$ |
4,036 |
|
|
|
12.7 |
% |
|
|
25.4 |
% |
Ivy Realty Fund II, L.P. |
|
$ |
1,277 |
|
|
$ |
874 |
|
|
$ |
1,169 |
|
|
$ |
1,118 |
|
|
|
11.3 |
% |
|
|
22.6 |
% |
Other invested assets: |
|
|
|
|
|
|
|
|
|
|
|
|
|
|
|
|
|
|
|
|
|
|
|
|
Odyssey common shares |
|
$ |
246,066 |
|
|
$ |
305,818 |
|
|
$ |
246,066 |
|
|
$ |
256,570 |
|
|
|
8.8 |
% |
|
|
100.0 |
% |
Odyssey preferred shares |
|
$ |
8,090 |
|
|
$ |
7,964 |
|
|
$ |
8,090 |
|
|
$ |
5,740 |
|
|
|
N/A |
|
|
|
N/A |
|
Advent |
|
$ |
30,142 |
|
|
$ |
26,603 |
|
|
$ |
20,092 |
|
|
$ |
11,607 |
|
|
|
17.5 |
% |
|
|
100.0 |
% |
The Company’s related party investment transactions are noted below. All transactions were
completed at fair value.
On September 15, 2009, the Company purchased additional shares of Advent, a Fairfax affiliate,
for cash consideration of $10,050. The Company’s ownership of Advent increased to 17.5% with
the purchase of the additional shares (11.7% at December 31, 2008).
On May 6, 2009, the Company sold municipal securities with a fair market value of $14,725 to
nSpire Re Limited (“nSpire”), a Fairfax affiliate, for cash consideration and a pre-tax gain of
$875.
91
NOTES TO THE CONSOLIDATED FINANCIAL STATEMENTS
(Dollars in thousands)
On March 5, 2009, the Company sold municipal securities with a fair market value of $97,112 to
certain Fairfax affiliates, for cash consideration and a pre-tax gain of $4,236. Also in March
2009, the Company transferred municipal securities with a fair market value of $54,008 to
Fairfax Inc., as partial settlement of its tax liability, resulting in a pre-tax gain of $5,907.
On December 30, 2008, the Company purchased an 8.2% interest in Odyssey common shares, from TIG
Insurance Group, Inc., a Fairfax affiliate, for $246,066. As consideration for its investment
in Odyssey, the Company released its Fairfax Inc. note (discussed below) of equal fair value.
On December 23, 2008, the Company sold its 15.7% interest in Northbridge to nSpire, for $248,066
and received a Fairfax Inc. note held by nSpire of equal value. Since Northbridge was accounted
for at fair value, no gain or loss was recorded on the sale.
On December 15, 2008, the Company liquidated its interest in TPF, recording a realized
investment loss of $171. The Company recorded pre-tax equity losses of $18,618 on TPF for the
year ended December 31, 2008 and inception to date losses of approximately $20,000 on its
investment in TPF. In September 2009, the Company transferred a portion of its interest in TPF
to TIG at net carrying value at the date of sale, for cash consideration of $6,516.
On November 7, 2008, the Company released its TPF, L.P convertible debenture in exchange for
securities in an amount of $331, resulting in a realized loss of $2,169.
On October 30, 2008, the Company purchased shares in Alliance Insurance Company, a publicly
traded insurance company based in Dubai at a cost of $21,572.
On September 23, 2008, October 24, 2008 and December 30, 2008, the Company purchased additional
shares in Advent for cash consideration totaling $4,096 and thereby increased its ownership
interest in Advent to 11.7% from 8.1% at December 31, 2008.
On June 3, 2008 and November 26, 2008, the Company purchased shares in Arab Orient Insurance
Company, a publicly traded insurance company based in Jordan, at a total cost of $11,277.
On May 1, 2008 the Company invested $1,000 in the Ivy Realty Fund II, L.P, which represented the
first capital call of a $10,000 capital commitment made to this fund.
On March 31, 2008, the Company sold its entire 9.3% ownership interest in MFX to Fairfax for
nominal consideration and recorded a realized loss of $1,550 on this security which was deemed
to have no value.
Regulatory Deposits
Fixed income securities and cash and cash equivalents of $306,012 and $403,892 were on deposit
with various state regulatory authorities at December 31, 2009 and 2008, respectively, as
required by insurance laws.
Investment Income
The components of net investment income for the years ended December 31, 2009, 2008 and 2007 are
summarized as follows:
| |
|
|
|
|
|
|
|
|
|
|
|
|
| |
|
Years Ended December 31, |
|
| |
|
2009 |
|
|
2008 |
|
|
2007 |
|
Interest on fixed income securities |
|
$ |
105,719 |
|
|
$ |
103,328 |
|
|
$ |
102,905 |
|
Dividends from equity securities |
|
|
34,346 |
|
|
|
25,169 |
|
|
|
21,713 |
|
Income (losses) from investments at equity and other invested assets |
|
|
54,906 |
|
|
|
(46,239 |
) |
|
|
12,985 |
|
Other, primarily interest on cash and cash equivalents1 |
|
|
1,272 |
|
|
|
27,074 |
|
|
|
40,030 |
|
|
|
|
|
|
|
|
|
|
|
Gross investment income |
|
|
196,243 |
|
|
|
109,332 |
|
|
|
177,633 |
|
Interest on funds held under reinsurance contracts |
|
|
(15,459 |
) |
|
|
(11,714 |
) |
|
|
(16,125 |
) |
Investment expenses |
|
|
(16,942 |
) |
|
|
(25,243 |
) |
|
|
(18,090 |
) |
|
|
|
|
|
|
|
|
|
|
Net investment income |
|
$ |
163,842 |
|
|
$ |
72,375 |
|
|
$ |
143,418 |
|
|
|
|
|
|
|
|
|
|
|
| |
|
|
| 1 |
|
Includes interest (expense) income of $(47), $25,609 and $16,893 in 2009, 2008
and 2007, respectively, on cash collateral pledged for derivatives and short-sale
obligations. |
92
NOTES TO THE CONSOLIDATED FINANCIAL STATEMENTS
(Dollars in thousands)
Realized Investment Gains and Losses
The components of realized investment gains for the years ended December 31, 2009, 2008 and 2007
are summarized below:
| |
|
|
|
|
|
|
|
|
|
|
|
|
| |
|
Years Ended December 31, |
|
| |
|
2009 |
|
|
2008 |
|
|
2007 |
|
Fixed income securities, available-for-sale: |
|
|
|
|
|
|
|
|
|
|
|
|
Gains |
|
$ |
86,513 |
|
|
$ |
154,219 |
|
|
$ |
5,347 |
|
Losses |
|
|
(3,507 |
) |
|
|
(15,365 |
) |
|
|
(3,994 |
) |
|
|
|
|
|
|
|
|
|
|
Net |
|
|
83,006 |
|
|
|
138,854 |
|
|
|
1,353 |
|
|
|
|
|
|
|
|
|
|
|
Fixed income securities, held-for-trading: |
|
|
|
|
|
|
|
|
|
|
|
|
Gains |
|
|
80,746 |
|
|
|
— |
|
|
|
249 |
|
Losses |
|
|
(5,770 |
) |
|
|
(90,891 |
) |
|
|
(31,153 |
) |
|
|
|
|
|
|
|
|
|
|
Net |
|
|
74,976 |
|
|
|
(90,891 |
) |
|
|
(30,904 |
) |
|
|
|
|
|
|
|
|
|
|
Equity securities: |
|
|
|
|
|
|
|
|
|
|
|
|
Gains |
|
|
72,095 |
|
|
|
2,814 |
|
|
|
33,952 |
|
Losses |
|
|
(109,762 |
) |
|
|
(190,305 |
) |
|
|
(28,562 |
) |
|
|
|
|
|
|
|
|
|
|
Net |
|
|
(37,667 |
) |
|
|
(187,491 |
) |
|
|
5,390 |
|
|
|
|
|
|
|
|
|
|
|
Investments at equity: |
|
|
|
|
|
|
|
|
|
|
|
|
Gains |
|
|
2,341 |
|
|
|
— |
|
|
|
10,959 |
|
Losses |
|
|
(44 |
) |
|
|
(1,550 |
) |
|
|
— |
|
|
|
|
|
|
|
|
|
|
|
Net |
|
|
2,297 |
|
|
|
(1,550 |
) |
|
|
10,959 |
|
|
|
|
|
|
|
|
|
|
|
Derivatives and other invested assets: |
|
|
|
|
|
|
|
|
|
|
|
|
Gains |
|
|
87,916 |
|
|
|
735,336 |
|
|
|
270,819 |
|
Losses |
|
|
(60,544 |
) |
|
|
(62,379 |
) |
|
|
(23,532 |
) |
|
|
|
|
|
|
|
|
|
|
Net |
|
|
27,372 |
|
|
|
672,957 |
|
|
|
247,287 |
|
|
|
|
|
|
|
|
|
|
|
Total realized investment gains and losses: |
|
|
|
|
|
|
|
|
|
|
|
|
Gains |
|
|
329,611 |
|
|
|
892,369 |
|
|
|
321,326 |
|
Losses |
|
|
(179,627 |
) |
|
|
(360,490 |
) |
|
|
(87,241 |
) |
|
|
|
|
|
|
|
|
|
|
Net |
|
$ |
149,984 |
|
|
$ |
531,879 |
|
|
$ |
234,085 |
|
|
|
|
|
|
|
|
|
|
|
Included in realized investment losses for the years ended December 31, 2009, 2008 and 2007 are
$110,814, $194,670 and $25,443, respectively, of other than temporary impairment charges. The
amount for 2009 includes write-downs of $107,307 attributable to equity securities and $3,507
attributable to fixed incomes securities, all of which was credit related. The amount for 2008
includes write-downs of $190,305 attributable to equity securities and $4,365 attributable to
fixed income securities. The amount for 2007 includes write-downs of $22,461 attributable to
equity securities and $2,982 attributable to fixed income securities. For further details of
realized investment gains or losses attributable to the Company’s derivatives transactions and
short-sale obligations, refer to the section above “Derivative Securities and Short-Sale
Obligations”.
93
NOTES TO THE CONSOLIDATED FINANCIAL STATEMENTS
(Dollars in thousands)
| 4. |
|
Fair Value Disclosures |
In accordance with ASC 820 the Company has categorized its financial instruments into the
three-level fair value hierarchy, based on priority of inputs to the valuation technique. ASC
820 defines fair value, establishes a framework for measuring fair value in accordance with
generally accepted accounting principles and expands disclosures about fair value measurements.
ASC 820 also clarifies that fair value is the exit price, representing the amount that would be
received to sell an asset or paid to transfer a liability in an orderly transaction between
market participants. The fair value hierarchy is designed to indicate the relative reliability
of fair value measurement. The highest priority is given to quoted prices in active markets and
the lowest to unobservable data. In certain cases, the inputs used to measure fair value may
fall into different levels of the fair value hierarchy. In such cases, the level in the
hierarchy within which the fair value measurement falls is determined based on the lowest level
significant input. The hierarchy is broken down into three levels based on the reliability of
inputs as follows:
Level 1 — Valuations based on unadjusted quoted prices in active markets for identical assets or
liabilities. A quoted price for an identical asset or liability in an active market provides the
most reliable fair value measure and, whenever available, should be used to measure fair value,
provided that (i) the market is the principal (or most advantageous) market and (ii) the entity
has the ability to access the principal (or most advantageous) market.
Level 2 — Valuations based on information (other than quoted prices included within Level 1)
that is observable for the asset and liability, either directly or indirectly. This includes
quoted prices for similar assets or liabilities in active markets, quoted prices for identical
or similar assets or liabilities in markets that are not active and observable inputs other than
quoted prices, such as interest rates and yield curves.
Level 3 — Valuations based on prices or valuation techniques that require inputs that are both
unobservable and significant to the overall fair value measurement. These inputs reflect the
Company’s own assumptions about the methodology and valuation techniques that a market
participant would use in pricing the asset or liability.
The Company is responsible for determining the fair value of its investment portfolio by
utilizing fair value measurements obtained from active markets where available, by considering
other observable and unobservable inputs and by employing valuation techniques which make use of
current market data.
For determining the fair value of its Level 1 investments (approximately 35% of total investment
portfolio at fair value), the Company utilizes quoted market prices in active markets for
identical securities. The Company’s Level 1 investments are primarily exchange-traded equity
securities that trade in active markets.
The Company’s Level 2 investments (approximately 55% of total investment portfolio at fair
value), the majority of which are in U.S. government, municipal and corporate fixed income
securities, are priced using publicly traded over-the-counter prices or broker-dealer quotes.
Observable inputs such as benchmark yields, reported trades, broker-dealer quotes, issuer
spreads and bids are available for these investments. The Company’s Level 2 investments also
include investment grade mortgage-backed securities, purchased at deep discounts to par, that
are priced using broker-dealer quotes, credit default swaps that are priced using broker-dealer
quotes which are based on observable credit spreads and inactively traded convertible corporate
debentures which are valued using a pricing model, the inputs of which are derived principally
from, or corroborated by, observable market data such as credit spreads and discount rates.
For credit default swaps, the Company assesses the reasonableness of the fair values obtained
from the broker-dealers by comparing the broker-dealer quotes to values produced using
individual issuer credit default swap yield curves, by referencing them to movements in credit
spreads and by comparing them to recent market transaction prices for similar credit default
swaps where available. During the first quarter of 2009, the Company transferred $47,611 of
Level 3 investments (comprised of investment grade mortgage-backed securities), to Level 2,
after determining that broker-dealer quotes would be used to determine the fair value of the
instruments.
The Company uses valuation models to establish the fair value of its Level 3 securities
(approximately 10% of total investment portfolio at fair value). Level 3 securities include the
Company’s investments in Odyssey and Advent, which were transferred from Level 1 and Level 2,
respectively, during the fourth quarter of 2009, following their privatization and subsequent
delisting from public stock exchanges. The Company values these investments using internally
developed valuation models based on market multiples derived from a set of publicly traded
comparable companies. The models, which require a significant amount of judgment, use current
and historical market prices and book values of comparable companies to derive a current fair
value. Also included in Level 3 are non investment grade mortgage-backed securities purchased
at deep discounts to par which are valued using an internal discounted cash flow model, which
includes unobservable inputs that are supported by limited market-based activity. The Company
assesses the reasonableness of the fair values of these securities by comparing the fair values
to models validated by qualified personnel, by reference to movements in credit spreads and by
comparing the fair values to recent transaction prices for similar assets where available.
94
NOTES TO THE CONSOLIDATED FINANCIAL STATEMENTS
(Dollars in thousands)
The following table presents the Company’s assets (excluding cash and cash equivalents) measured
at fair value on a recurring basis, within the fair value hierarchy, at December 31, 2009 and
2008:
| |
|
|
|
|
|
|
|
|
|
|
|
|
|
|
|
|
| |
|
December 31, 2009 |
|
| |
|
Quoted Prices in |
|
|
Significant |
|
|
|
|
|
|
|
| |
|
Active Markets |
|
|
Other |
|
|
Significant |
|
|
|
|
| |
|
for Identical |
|
|
Observable |
|
|
Unobservable |
|
|
|
|
| |
|
Assets |
|
|
Inputs |
|
|
Inputs |
|
|
|
|
| |
|
(Level 1) |
|
|
(Level 2) |
|
|
(Level 3) |
|
|
Total |
|
Assets |
|
|
|
|
|
|
|
|
|
|
|
|
|
|
|
|
Available-for-sale fixed income securities: |
|
|
|
|
|
|
|
|
|
|
|
|
|
|
|
|
U.S. government and government agencies and
authorities |
|
$ |
— |
|
|
$ |
87,765 |
|
|
$ |
— |
|
|
$ |
87,765 |
|
States, municipalities and political subdivisions |
|
|
— |
|
|
|
1,328,964 |
|
|
|
— |
|
|
|
1,328,964 |
|
Other corporate |
|
|
— |
|
|
|
102,817 |
|
|
|
— |
|
|
|
102,817 |
|
|
|
|
|
|
|
|
|
|
|
|
|
|
Total available-for-sale fixed income
securities |
|
|
— |
|
|
|
1,519,546 |
|
|
|
— |
|
|
|
1,519,546 |
|
Fixed income securities, held-for-trading: |
|
|
|
|
|
|
|
|
|
|
|
|
|
|
|
|
Residential mortgage-backed |
|
|
— |
|
|
|
89,746 |
|
|
|
14,272 |
|
|
|
104,018 |
|
Other corporate |
|
|
— |
|
|
|
217,341 |
|
|
|
— |
|
|
|
217,341 |
|
|
|
|
|
|
|
|
|
|
|
|
|
|
Total held-for-trading fixed income
securities |
|
|
— |
|
|
|
307,087 |
|
|
|
14,272 |
|
|
|
321,359 |
|
Equity securities |
|
|
1,256,081 |
|
|
|
28,021 |
|
|
|
— |
|
|
|
1,284,102 |
|
Derivatives and other invested assets |
|
|
7,964 |
|
|
|
47,516 |
|
|
|
332,422 |
|
|
|
387,902 |
|
Short-term investments |
|
|
— |
|
|
|
68,211 |
|
|
|
— |
|
|
|
68,211 |
|
|
|
|
|
|
|
|
|
|
|
|
|
|
Total |
|
$ |
1,264,045 |
|
|
$ |
1,970,381 |
|
|
$ |
346,694 |
|
|
$ |
3,581,120 |
|
|
|
|
|
|
|
|
|
|
|
|
|
|
| |
|
|
|
|
|
|
|
|
|
|
|
|
|
|
|
|
| |
|
December 31, 2008 |
|
| |
|
Quoted Prices in |
|
|
Significant |
|
|
|
|
|
|
|
| |
|
Active Markets |
|
|
Other |
|
|
Significant |
|
|
|
|
| |
|
for Identical |
|
|
Observable |
|
|
Unobservable |
|
|
|
|
| |
|
Assets |
|
|
Inputs |
|
|
Inputs |
|
|
|
|
| |
|
(Level 1) |
|
|
(Level 2) |
|
|
(Level 3) |
|
|
Total |
|
Assets |
|
|
|
|
|
|
|
|
|
|
|
|
|
|
|
|
Available-for-sale fixed income securities: |
|
|
|
|
|
|
|
|
|
|
|
|
|
|
|
|
U.S. government and government agencies and
authorities |
|
$ |
— |
|
|
$ |
169,430 |
|
|
$ |
— |
|
|
$ |
169,430 |
|
States, municipalities and political subdivisions |
|
|
— |
|
|
|
1,315,465 |
|
|
|
— |
|
|
|
1,315,465 |
|
Other corporate |
|
|
— |
|
|
|
48,439 |
|
|
|
— |
|
|
|
48,439 |
|
|
|
|
|
|
|
|
|
|
|
|
|
|
Total available-for-sale fixed income
securities |
|
|
— |
|
|
|
1,533,334 |
|
|
|
— |
|
|
|
1,533,334 |
|
Fixed income securities, held-for-trading: |
|
|
|
|
|
|
|
|
|
|
|
|
|
|
|
|
Foreign governments |
|
|
— |
|
|
|
— |
|
|
|
— |
|
|
|
— |
|
Residential mortgage-backed |
|
|
— |
|
|
|
— |
|
|
|
66,393 |
|
|
|
66,393 |
|
Other corporate |
|
|
— |
|
|
|
167,605 |
|
|
|
— |
|
|
|
167,605 |
|
|
|
|
|
|
|
|
|
|
|
|
|
|
Total held-for-trading fixed income
securities |
|
|
— |
|
|
|
167,605 |
|
|
|
66,393 |
|
|
|
233,998 |
|
Equity securities |
|
|
998,582 |
|
|
|
21,572 |
|
|
|
— |
|
|
|
1,020,154 |
|
Derivatives and other invested assets |
|
|
262,310 |
|
|
|
150,437 |
|
|
|
— |
|
|
|
412,747 |
|
Short-term investments |
|
|
— |
|
|
|
549,937 |
|
|
|
— |
|
|
|
549,937 |
|
|
|
|
|
|
|
|
|
|
|
|
|
|
Total |
|
$ |
1,260,892 |
|
|
$ |
2,422,885 |
|
|
$ |
66,393 |
|
|
$ |
3,750,170 |
|
|
|
|
|
|
|
|
|
|
|
|
|
|
95
NOTES TO THE CONSOLIDATED FINANCIAL STATEMENTS
(Dollars in thousands)
The following table provides a summary of changes in fair value of Level 3 financial assets
for the twelve months ended December 31, 2009 and 2008:
| |
|
|
|
|
|
|
|
|
|
|
|
|
|
|
|
|
|
|
|
|
|
|
|
|
| |
|
December 31, 2009 |
|
|
December 31, 2008 |
|
| |
|
Fixed |
|
|
|
|
|
|
|
|
|
|
Fixed |
|
|
|
|
|
|
|
| |
|
Income |
|
|
Equity |
|
|
|
|
|
|
Income |
|
|
Equity |
|
|
|
|
| |
|
Securities |
|
|
Securities |
|
|
Total |
|
|
Securities |
|
|
Securities |
|
|
Total |
|
Balance, beginning of period |
|
$ |
66,393 |
|
|
$ |
— |
|
|
$ |
66,393 |
|
|
$ |
2,500 |
|
|
$ |
— |
|
|
$ |
2,500 |
|
Purchases |
|
|
19,830 |
|
|
|
— |
|
|
|
19,830 |
|
|
|
68,148 |
|
|
|
— |
|
|
|
68,148 |
|
Settlements |
|
|
(35,948 |
) |
|
|
— |
|
|
|
(35,948 |
) |
|
|
— |
|
|
|
— |
|
|
|
— |
|
Transfers from Level 3 |
|
|
(47,611 |
) |
|
|
— |
|
|
|
(47,611 |
) |
|
|
— |
|
|
|
— |
|
|
|
— |
|
Transfers to Level 3 |
|
|
— |
|
|
|
347,494 |
|
|
|
347,494 |
|
|
|
— |
|
|
|
— |
|
|
|
— |
|
Realized investment gains
(losses) included in net
income |
|
|
11,608 |
|
|
|
(15,072 |
) |
|
|
(3,464 |
) |
|
|
(4,255 |
) |
|
|
— |
|
|
|
(4,255 |
) |
|
|
|
|
|
|
|
|
|
|
|
|
|
|
|
|
|
|
|
Balance, end of period |
|
$ |
14,272 |
|
|
$ |
332,422 |
|
|
$ |
346,694 |
|
|
$ |
66,393 |
|
|
$ |
— |
|
|
$ |
66,393 |
|
|
|
|
|
|
|
|
|
|
|
|
|
|
|
|
|
|
|
|
Realized investment gains
(losses) relating to assets
held at period end |
|
$ |
10,457 |
|
|
$ |
(15,072 |
) |
|
$ |
(4,615 |
) |
|
$ |
(2,086 |
) |
|
$ |
— |
|
|
$ |
(2,086 |
) |
|
|
|
|
|
|
|
|
|
|
|
|
|
|
|
|
|
|
|
Transfers into Level 3 for equity securities are in respect of the Company’s investments in
Odyssey and Advent, which were transferred from Level 1 and Level 2, respectively, during the
fourth quarter of 2009. Transfers from Level 3 and into Level 2 are in respect of
mortgage-backed securities for which broker-quotes, which utilize observable inputs, are used to
value those securities.
Fair Value Option
The Company has elected the fair value option for certain investments that would have otherwise
been accounted for under the equity method of accounting. The fair value option allows
companies to irrevocably elect fair value as the initial and subsequent measurement attribute
for certain financial assets and liabilities. Changes in the fair value of assets and
liabilities for which the election is made are recognized in net income as they occur. The fair
value option election is permitted on an instrument-by-instrument basis at initial recognition
of an asset or liability or upon occurrence of an event that gives rise to a new basis of
accounting for that instrument. In determining the eligible financial instruments for which to
elect the fair value option, the Company considered all of its equity method investments. These
investments are often carried at values that do not reflect current fair market value. The
Company decided that the fair value option would be appropriate for equity method investments
for which there is a publicly quoted market price.
In December 2008, the Company elected the fair value option for its investments in Odyssey’s
common and preferred stock. At the time, Odyssey was publicly traded on the New York Stock
Exchange and its traded price was determined to be a better indicator of its value than its
carrying value under the equity method. During the fourth quarter of 2009, Fairfax purchased
the remaining outstanding shares of Odyssey’s common stock that Fairfax did not already own,
which resulted in Odyssey becoming a wholly owned subsidiary of Fairfax. The Company owned
approximately 8.8% of Odyssey at December 31, 2009. At December 31, 2009 and December 31, 2008,
the Company’s investments in Odyssey’s common and preferred stock are recorded in derivatives
and other invested assets on the consolidated balance sheets at fair values of $305,818 and
$7,964, and $256,570 and $5,740, respectively. For the years ended December 31, 2009 and
December 31, 2008, the total change in fair value of the Company’s investments in Odyssey common
and preferred stock were gains of $51,472 and $8,154, respectively, which was recorded through
net realized investment gains and losses in the consolidated statements of operations.
Dividends of $1,719 and $636 were received from Odyssey for the twelve months ended December 31,
2009 and December 31, 2008, respectively, and have been recorded as investment income in the
consolidated statements of operations.
During the third quarter of 2008, the Company elected the fair value option for its investment
in Advent. At the time, Advent was publicly traded on a foreign stock exchange and its traded
price was determined to be a better indicator of its value than its carrying value under the
equity method. During the third and fourth quarters of 2009, Fairfax purchased the remaining
outstanding shares of Advent which Fairfax did not already own, resulting in Advent becoming a
wholly owned subsidiary of Fairfax. The Company owned approximately 17.5% of Advent at December
31, 2009. At December 31, 2009 and December 31, 2008, the Company’s investment in Advent is
recorded in derivatives and other invested assets on the consolidated balance sheets at a fair
value of $26,603 and $11,607, respectively. For the years ended December 31, 2009 and December
31, 2008, the change in fair value of the Company’s investment in Advent was a gain (loss) of
$4,946, and $(8,485), respectively, which was recorded through net realized investment gains and
losses in the consolidated statements of operations. Dividends of $0 and $907 were received
from Advent for the twelve months ended December 31, 2009 and December 31, 2008, respectively,
and have been recorded as investment income in the consolidated statements of operations.
96
NOTES TO THE CONSOLIDATED FINANCIAL STATEMENTS
(Dollars in thousands)
| 5. |
|
Unpaid Losses and Loss Adjustment Expenses |
Changes in the Company’s liability for unpaid losses and LAE are summarized as follows:
| |
|
|
|
|
|
|
|
|
|
|
|
|
| |
|
Years Ended December 31, |
|
| |
|
2009 |
|
|
2008 |
|
|
2007 |
|
Gross unpaid losses and LAE, beginning of year |
|
$ |
2,987,803 |
|
|
$ |
3,178,506 |
|
|
$ |
3,371,549 |
|
Less: ceded unpaid losses and LAE |
|
|
684,239 |
|
|
|
1,197,496 |
|
|
|
1,355,253 |
|
|
|
|
|
|
|
|
|
|
|
Net unpaid losses and LAE, beginning of year |
|
|
2,303,564 |
|
|
|
1,981,010 |
|
|
|
2,016,296 |
|
|
|
|
|
|
|
|
|
|
|
Losses and LAE incurred related to: |
|
|
|
|
|
|
|
|
|
|
|
|
Current year |
|
|
565,976 |
|
|
|
802,792 |
|
|
|
816,823 |
|
Prior years |
|
|
(39,864 |
) |
|
|
20,075 |
|
|
|
(63,854 |
) |
|
|
|
|
|
|
|
|
|
|
Total losses and LAE incurred |
|
|
526,112 |
|
|
|
822,867 |
|
|
|
752,969 |
|
|
|
|
|
|
|
|
|
|
|
Losses and LAE paid related to: |
|
|
|
|
|
|
|
|
|
|
|
|
Current year |
|
|
157,053 |
|
|
|
228,298 |
|
|
|
217,261 |
|
Prior years |
|
|
632,768 |
|
|
|
272,015 |
|
|
|
570,994 |
|
|
|
|
|
|
|
|
|
|
|
Total losses and LAE paid |
|
|
789,821 |
|
|
|
500,313 |
|
|
|
788,255 |
|
|
|
|
|
|
|
|
|
|
|
Net unpaid losses and LAE, end of year |
|
|
2,039,855 |
|
|
|
2,303,564 |
|
|
|
1,981,010 |
|
Add: ceded unpaid losses and LAE |
|
|
632,750 |
|
|
|
684,239 |
|
|
|
1,197,496 |
|
|
|
|
|
|
|
|
|
|
|
Gross unpaid losses and LAE, end of year |
|
$ |
2,672,605 |
|
|
$ |
2,987,803 |
|
|
$ |
3,178,506 |
|
|
|
|
|
|
|
|
|
|
|
A reconciliation of the ceded unpaid losses and LAE in the table above to the reinsurance
recoverable reflected on the balance sheets follows:
| |
|
|
|
|
|
|
|
|
| |
|
2009 |
|
|
2008 |
|
Ceded unpaid losses and LAE in the table above |
|
$ |
632,750 |
|
|
$ |
684,239 |
|
Reconciling items: |
|
|
|
|
|
|
|
|
Reinsurance receivable on paid losses and LAE |
|
|
9,705 |
|
|
|
18,853 |
|
Unamortized retroactive reinsurance recoverable |
|
|
250,242 |
|
|
|
265,125 |
|
|
|
|
|
|
|
|
Reinsurance recoverable on the consolidated balance sheets |
|
$ |
892,697 |
|
|
$ |
968,217 |
|
|
|
|
|
|
|
|
For the years ended December 31, 2009, 2008 and 2007, the Company’s calendar year loss and LAE
ratios were 67.3%, 82.5% and 63.5%, respectively, of which 72.4%, 80.4% and 68.9%, respectively,
were attributable to losses occurring in the current accident year and (5.1)%, 2.1% and (5.4)%,
respectively, were attributable to (favorable) adverse development of prior years’ losses.
The improvement in the 2009 accident year ratio as compared to 2008 is primarily due to lower
catastrophe losses. The deterioration in the 2008 accident year ratio as compared to 2007 is
primarily attributable to the impact of $71,500 of losses associated with Hurricanes Gustav and
Ike which contributed 7.2 loss ratio points, adverse development in property where there were
several large fire losses, adverse development in commercial automobile where the company
experienced increased large loss activity and the effects of current unfavorable pricing trends
and market conditions. Refer to Note 14 to the consolidated financial statements for a schedule
of the accident year loss and LAE ratios by line of business.
In 2009, the Company recognized $39,864 of favorable prior year loss development (5.1 loss ratio
points) including an insurance recovery of $13,750 associated with the settlement of an asbestos
lawsuit and $14,883 of amortization of deferred gains on retroactive reinsurance. The other net
favorable development of $11,231 was primarily attributable to favorable emergence in workers’
compensation, commercial multi-peril and property lines, partially offset by adverse emergence
in commercial auto and asbestos liabilities.
In 2008, the Company recognized $20,075 of adverse prior year loss development (2.1 loss ratio
points). Included in the adverse loss development is $75,470 (7.6 loss ratio points)
attributable to a loss on commutation of a reinsurance contract and $25,500 (2.6 loss ratio
points) attributable to the settlement of an asbestos lawsuit. Excluding these one-time
charges, the Company recognized net favorable loss development of $80,895 (8.1 loss ratio
points), including $10,172 related to amortization of deferred gains on retroactive reinsurance.
The favorable development was primarily in the workers’ compensation and general liability
lines of business, attributable to favorable loss emergence in almost all accident years,
partially offset by unfavorable ALAE emergence in general liability for both latent and
non-latent exposures.
97
NOTES TO THE CONSOLIDATED FINANCIAL STATEMENTS
(Dollars in thousands)
In 2007, the Company recognized net favorable prior year loss development of $63,854 (5.4 loss
ratio points) including $13,673 of amortization of deferred gains on retroactive reinsurance.
The net favorable development was comprised of favorable development across all major casualty
lines as well as commercial multi-peril, with the largest redundancy being recognized in
workers’ compensation. Specifically, favorable development in the workers’ compensation line
was principally attributable to favorable results in non-California for older accident years due
to favorable claims settlements and continued recognition of favorable development for
California in accident years 2004 and 2005 due to the impact of industry reforms. Favorable
development for general liability and commercial multi-peril exposures in accident years 2003
through 2006 was due to the selection of faster loss development factors, recognizing decreased
loss activity in those years. The favorable development in these lines was partially offset by
$54,547 of adverse development of asbestos, environmental and other latent liabilities.
The Company discounts workers’ compensation indemnity reserves using an interest rate of 5%.
The amount of related discount was $54,555 and $56,577, at December 31, 2009 and 2008,
respectively.
| 6. |
|
Asbestos, Environmental and Other Latent Losses and Loss Adjustment Expenses |
The Company has exposure to asbestos, environmental and other latent claims arising from the
sale of general liability, commercial multi-peril and umbrella insurance policies, the majority
of which were written for accident years 1985 and prior. Estimation of ultimate liabilities for
these exposures is unusually difficult due to such issues as whether or not coverage exists,
definition of an occurrence, determination of ultimate damages and allocation of such damages to
financially responsible parties. At December 31, 2009 and 2008, total net unpaid asbestos,
environmental and other latent losses were $356,262 and $401,125, respectively, representing
17.5% and 17.4% of total net unpaid losses at December 31, 2009 and 2008, respectively.
Changes in the Company’s liability for asbestos, environmental and other latent exposures are
summarized as follows:
| |
|
|
|
|
|
|
|
|
|
|
|
|
| |
|
Years Ended December 31, |
|
| |
|
2009 |
|
|
2008 |
|
|
2007 |
|
Asbestos |
|
|
|
|
|
|
|
|
|
|
|
|
Gross unpaid losses and allocated LAE (“ALAE”), beginning of year |
|
$ |
387,224 |
|
|
$ |
428,139 |
|
|
$ |
443,055 |
|
Less: ceded unpaid losses and ALAE |
|
|
85,336 |
|
|
|
94,497 |
|
|
|
94,817 |
|
|
|
|
|
|
|
|
|
|
|
Net unpaid losses and ALAE, beginning of year |
|
|
301,888 |
|
|
|
333,642 |
|
|
|
348,238 |
|
Net losses and ALAE incurred |
|
|
2,795 |
|
|
|
25,200 |
|
|
|
24,342 |
|
Less: Net losses and ALAE paid |
|
|
35,328 |
|
|
|
56,954 |
|
|
|
38,938 |
|
|
|
|
|
|
|
|
|
|
|
Net unpaid losses and ALAE, end of year |
|
|
269,355 |
|
|
|
301,888 |
|
|
|
333,642 |
|
Add: ceded unpaid losses and ALAE |
|
|
74,771 |
|
|
|
85,336 |
|
|
|
94,497 |
|
|
|
|
|
|
|
|
|
|
|
Gross unpaid losses and ALAE, end of year |
|
$ |
344,126 |
|
|
$ |
387,224 |
|
|
$ |
428,139 |
|
|
|
|
|
|
|
|
|
|
|
During 2009, net asbestos losses and ALAE incurred and paid reflect an insurance recovery of
$13,750 associated with a lawsuit that the Company settled in 2008. Excluding this recovery,
net asbestos losses and LAE incurred in 2009 are primarily attributable to increasing claim
values and rising legal costs associated with one policyholder. In 2008 and 2007, net asbestos
losses and ALAE incurred were primarily attributable to the aforementioned lawsuit. Net losses
and ALAE paid in 2009 and 2008 include payments of $18,333 and $22,700, respectively, related to
this lawsuit settlement.
| |
|
|
|
|
|
|
|
|
|
|
|
|
| |
|
Years Ended December 31, |
|
| |
|
2009 |
|
|
2008 |
|
|
2007 |
|
Environmental |
|
|
|
|
|
|
|
|
|
|
|
|
Gross unpaid losses and ALAE, beginning of year |
|
$ |
107,948 |
|
|
$ |
117,768 |
|
|
$ |
110,636 |
|
Less: ceded unpaid losses and ALAE |
|
|
28,969 |
|
|
|
32,725 |
|
|
|
37,103 |
|
|
|
|
|
|
|
|
|
|
|
Net unpaid losses and ALAE, beginning of year |
|
|
78,979 |
|
|
|
85,043 |
|
|
|
73,533 |
|
Net losses and ALAE incurred |
|
|
4,172 |
|
|
|
9,400 |
|
|
|
22,185 |
|
Less: Net losses and ALAE paid |
|
|
12,356 |
|
|
|
15,464 |
|
|
|
10,675 |
|
|
|
|
|
|
|
|
|
|
|
Net unpaid losses and ALAE, end of year |
|
|
70,795 |
|
|
|
78,979 |
|
|
|
85,043 |
|
Add: ceded unpaid losses and ALAE |
|
|
22,507 |
|
|
|
28,969 |
|
|
|
32,725 |
|
|
|
|
|
|
|
|
|
|
|
Gross unpaid losses and ALAE, end of year |
|
$ |
93,302 |
|
|
$ |
107,948 |
|
|
$ |
117,768 |
|
|
|
|
|
|
|
|
|
|
|
98
NOTES TO THE CONSOLIDATED FINANCIAL STATEMENTS
(Dollars in thousands)
In 2007, environmental losses incurred were significantly higher than both 2008 and 2009, due to
a newly reported large claim, identification of additional policies associated with existing
policyholders and a slight increase in the number of sites for policyholders with previously
reported claims. The 2007 incurred losses also include settlements which secured broader
releases on certain active exposures.
The Company also maintains reserves for other latent exposures such as those associated with
silica, lead, mold, chemical, gas and vapors and welding fumes. Changes in the Company’s
liability for other latent exposures are summarized as follows:
| |
|
|
|
|
|
|
|
|
|
|
|
|
| |
|
Years Ended December 31, |
|
| |
|
2009 |
|
|
2008 |
|
|
2007 |
|
Other Latent |
|
|
|
|
|
|
|
|
|
|
|
|
Gross unpaid losses and ALAE, beginning of year |
|
$ |
28,217 |
|
|
$ |
34,237 |
|
|
$ |
32,463 |
|
Less: ceded unpaid losses and ALAE |
|
|
7,959 |
|
|
|
10,109 |
|
|
|
10,705 |
|
|
|
|
|
|
|
|
|
|
|
Net unpaid losses and ALAE, beginning of year |
|
|
20,258 |
|
|
|
24,128 |
|
|
|
21,758 |
|
Net losses and ALAE incurred |
|
|
(261 |
) |
|
|
1,615 |
|
|
|
8,020 |
|
Less: Net losses and ALAE paid |
|
|
3,885 |
|
|
|
5,485 |
|
|
|
5,650 |
|
|
|
|
|
|
|
|
|
|
|
Net unpaid losses and ALAE, end of year |
|
|
16,112 |
|
|
|
20,258 |
|
|
|
24,128 |
|
Add: ceded unpaid losses and ALAE |
|
|
5,358 |
|
|
|
7,959 |
|
|
|
10,109 |
|
|
|
|
|
|
|
|
|
|
|
Gross unpaid losses and ALAE, end of year |
|
$ |
21,470 |
|
|
$ |
28,217 |
|
|
$ |
34,237 |
|
|
|
|
|
|
|
|
|
|
|
The components of the Company’s net premiums written and premiums earned are summarized as
follows:
| |
|
|
|
|
|
|
|
|
|
|
|
|
| |
|
Years Ended December 31, |
|
| |
|
2009 |
|
|
2008 |
|
|
2007 |
|
Premiums written: |
|
|
|
|
|
|
|
|
|
|
|
|
Direct |
|
$ |
830,193 |
|
|
$ |
995,905 |
|
|
$ |
1,205,545 |
|
Assumed from other companies, pools and associations |
|
|
33,634 |
|
|
|
23,664 |
|
|
|
39,476 |
|
Ceded to other companies, pools and associations |
|
|
(147,421 |
) |
|
|
(148,417 |
) |
|
|
(145,386 |
) |
|
|
|
|
|
|
|
|
|
|
Net premiums written |
|
$ |
716,406 |
|
|
$ |
871,152 |
|
|
$ |
1,099,635 |
|
|
|
|
|
|
|
|
|
|
|
Premiums earned: |
|
|
|
|
|
|
|
|
|
|
|
|
Direct |
|
$ |
897,541 |
|
|
$ |
1,114,356 |
|
|
$ |
1,260,828 |
|
Assumed from other companies, pools and associations |
|
|
34,827 |
|
|
|
24,942 |
|
|
|
74,292 |
|
Ceded to other companies, pools and associations |
|
|
(151,086 |
) |
|
|
(141,270 |
) |
|
|
(148,976 |
) |
|
|
|
|
|
|
|
|
|
|
Premiums earned |
|
$ |
781,282 |
|
|
$ |
998,028 |
|
|
$ |
1,186,144 |
|
|
|
|
|
|
|
|
|
|
|
The net impact of ceded reinsurance transactions for each of the fiscal years 2009, 2008 and
2007 is summarized as follows:
| |
|
|
|
|
|
|
|
|
|
|
|
|
| |
|
Years Ended December 31, |
|
| |
|
2009 |
|
|
2008 |
|
|
2007 |
|
Earned premiums ceded to reinsurers1 |
|
$ |
(151,086 |
) |
|
$ |
(141,270 |
) |
|
$ |
(148,976 |
) |
Commissions earned on ceded reinsurance premiums |
|
|
32,890 |
|
|
|
31,307 |
|
|
|
25,774 |
|
Claims incurred ceded to reinsurers |
|
|
67,967 |
|
|
|
(44,415 |
)2 |
|
|
52,325 |
|
Provision for uncollectible reinsurance |
|
|
(2,000 |
) |
|
|
(7,700 |
) |
|
|
(8,000 |
) |
|
|
|
|
|
|
|
|
|
|
Net impact of ceded reinsurance transactions |
|
$ |
(52,229 |
) |
|
$ |
(162,078 |
) |
|
$ |
(78,877 |
) |
|
|
|
|
|
|
|
|
|
|
| |
|
|
| 1 |
|
For the years ended December 31, 2009, 2008 and 2007, accident and health
earned premiums ceded to reinsurers were $60,672, $42,070 and $18,602, respectively. |
| |
| 2 |
|
For the year ended December 31, 2008, claims incurred ceded to reinsurers includes
$75,866 of losses on commutations. |
99
NOTES TO THE CONSOLIDATED FINANCIAL STATEMENTS
(Dollars in thousands)
The components of the Company’s total reinsurance recoverable are summarized as follows:
| |
|
|
|
|
|
|
|
|
| |
|
At December 31, |
|
| |
|
2009 |
|
|
2008 |
|
Reinsurance recoverable on unpaid losses and LAE |
|
$ |
882,992 |
|
|
$ |
949,364 |
|
Reinsurance receivable on paid losses and LAE |
|
|
9,705 |
|
|
|
18,853 |
|
|
|
|
|
|
|
|
Total reinsurance recoverable |
|
$ |
892,697 |
|
|
$ |
968,217 |
|
|
|
|
|
|
|
|
The reinsurance recoverable balances above are net of reserves for uncollectible reinsurance of
$54,228 and $55,999 at December 31, 2009 and December 31, 2008, respectively. Included in
reinsurance recoverable is $141,030 and $142,213 at December 31, 2009 and December 31, 2008,
respectively, representing the present value of amounts due from insurance companies from which
the Company has purchased annuities to settle certain claim liabilities.
The Company actively monitors and evaluates the financial condition of its reinsurers and
develops estimates of the uncollectible amounts due from reinsurers. Such estimates are made
based on periodic evaluation of balances due from reinsurers, judgments regarding reinsurers’
solvency, known disputes, reporting characteristics of the underlying reinsured business,
historical experience, current economic conditions and the state of reinsurer relations in
general and with the Crum & Forster companies in particular. Management attempts to mitigate
collection risk from reinsurers by obtaining collateral and by entering into reinsurance
arrangements only with reinsurers that have strong credit ratings and statutory surplus above
certain levels.
Corporate Aggregate Reinsurance
The Company’s corporate aggregate reinsurance contracts are of the type commonly referred to as
“finite” reinsurance and cover or covered, in varying amounts and on varying terms, accident
years 2002 and prior. The majority of these contracts have been commuted or had limits paid.
The Company has not purchased corporate aggregate reinsurance since 2001 and does not currently
have plans to purchase corporate aggregate reinsurance in the future. At December 31, 2009,
only one retroactive contract with a remaining limit of $51,000 and one prospective contract
with a remaining limit of $96,272 are in effect.
The effect of prospective and retroactive corporate aggregate reinsurance on components of the
Company’s consolidated statements of income is summarized as follows ((decrease) increase in
indicated component):
| |
|
|
|
|
|
|
|
|
|
|
|
|
| |
|
Years Ended December 31, |
|
| |
|
2009 |
|
|
2008 |
|
|
2007 |
|
Investment income |
|
$ |
(15,459 |
) |
|
$ |
(11,714 |
) |
|
$ |
(16,125 |
) |
Losses and LAE |
|
|
(14,883 |
) |
|
|
65,694 |
|
|
|
(13,673 |
) |
|
|
|
|
|
|
|
|
|
|
(Decrease) increase in income before income taxes |
|
$ |
(576 |
) |
|
$ |
(77,408 |
) |
|
$ |
(2,452 |
) |
|
|
|
|
|
|
|
|
|
|
At December 31, 2009 and 2008, reinsurance recoverable includes $349,000 related to one
retroactive corporate aggregate reinsurance contract, of which $98,758 has been recognized as a
reduction of incurred losses and LAE on the Company’s consolidated statements of income.
Prospective Corporate Aggregate Reinsurance
The effect of prospective corporate aggregate reinsurance on components of the Company’s
consolidated statements of income follows ((decrease) increase in indicated component):
| |
|
|
|
|
|
|
|
|
|
|
|
|
| |
|
Years Ended December 31, |
|
| |
|
2009 |
|
|
2008 |
|
|
2007 |
|
Funds held interest charged to investment income |
|
$ |
— |
|
|
$ |
(1,575 |
) |
|
$ |
(2,348 |
) |
Less: losses and LAE |
|
|
— |
|
|
|
80,521 |
|
|
|
— |
|
|
|
|
|
|
|
|
|
|
|
Decrease in income before income taxes |
|
$ |
— |
|
|
$ |
(82,096 |
) |
|
$ |
(2,348 |
) |
|
|
|
|
|
|
|
|
|
|
The Company has one prospective contract in effect covering accident year 2002, which has an
unused limit available of $96,272 in the event the net loss and LAE ratio for accident year
2002, before the effect of this contract, exceeds 70%. The subject loss and LAE ratio as valued
at December 31, 2009 is 63.2%. No additional premium or funds held interest is due under this
contract upon usage of the remaining limit. The reinsurer under this contract is nSpire, a
Fairfax affiliate.
100
During 2008 and 2007, the above activity arose from two prospective contracts both of which were
commuted in 2008. The first contract was a stop loss agreement, which the Company entered into
in 1998, in connection with the acquisition of the Company by Fairfax. The contract was with an
unaffiliated reinsurer and provided coverage of $367,500 in excess of a retention. The contract
provided coverage for loss reserve development for accident periods prior to August 13, 1998,
the date of acquisition of the Company by Fairfax. In June 2008, the Company commuted this stop
loss contract and the retroactive amendment to that contract. As a result of the commutation
the Company received cash proceeds of $302,500, of which $287,375 was recorded in prospective
corporate aggregate reinsurance activity and $15,125 was recorded in retroactive corporate
aggregate reinsurance activity. The Company also recorded a decrease of $386,748 in the
reinsurance recoverable balance, of which $367,500 was attributable to the prospective contract
and $19,248 was attributable to the retroactive amendment. The financial statement effect of
the commutation in 2008 was a non-cash pre-tax charge of $84,248, offset by the release of the
unamortized deferred gain balance of $8,778 (related to the retroactive amendment), resulting in
a net charge to incurred losses and LAE of $75,470 on the consolidated statement of income. Of
this amount $80,125 was charged to prospective corporate aggregate reinsurance activity and
included in losses and LAE above and $4,655 was credited to retroactive corporate aggregate
reinsurance activity.
The second contract was an aggregate stop loss agreement with unaffiliated reinsurers covering
accident year 2000, which provided coverage of $118,493 and was fully utilized by the Company at
December 31, 2004. This stop loss agreement covered the casualty lines of business. The
contract was on a funds held basis with interest credited at 7.5%. In March 2008, the Company
commuted this contract and in accordance with the terms of the commutation agreement, the
Company commuted ceded loss reserves of $32,348 in consideration of release to the Company of
the funds held balance of $31,952 resulting in a commutation loss of $396 which was charged to
incurred losses and LAE on the consolidated statement of income for the year ended December 31,
2008.
Retroactive Corporate Aggregate Reinsurance
The effect of retroactive corporate aggregate reinsurance on components of the Company’s
consolidated statements of income follows ((decrease) increase in indicated component):
| |
|
|
|
|
|
|
|
|
|
|
|
|
| |
|
Years Ended December 31, |
|
| (dollars in millions) |
|
2009 |
|
|
2008 |
|
|
2007 |
|
Funds held interest charged to investment income |
|
$ |
(15,459 |
) |
|
$ |
(10,139 |
) |
|
$ |
(13,777 |
) |
Less: losses and LAE |
|
|
(14,883 |
) |
|
|
(14,827 |
)1 |
|
|
(13,673 |
) |
|
|
|
|
|
|
|
|
|
|
Increase (decrease) in income before income taxes |
|
$ |
(576 |
) |
|
$ |
4,688 |
|
|
$ |
(104 |
) |
|
|
|
|
|
|
|
|
|
|
| |
|
|
| 1 |
|
For the year ended December 31, 2008, losses and LAE is comprised of a loss on
commutation of $4,123 offset by $8,778 of unamortized deferred income released on
commutation as well as $10,172 of recurring deferred income amortization. |
An analysis of activity in deferred income related to retroactive corporate aggregate
reinsurance contracts follows:
| |
|
|
|
|
|
|
|
|
|
|
|
|
| |
|
Years Ended December 31, |
|
| (dollars in millions) |
|
2009 |
|
|
2008 |
|
|
2007 |
|
Decrease in reinsurance recoverable due from reinsurers |
|
$ |
— |
|
|
$ |
(20,000 |
) |
|
$ |
(3,577 |
) |
Less: related premiums paid |
|
|
— |
|
|
|
(8,186 |
) |
|
|
(1,273 |
) |
|
|
|
|
|
|
|
|
|
|
Decrease in income deferred during the year |
|
|
— |
|
|
|
(11,814 |
) |
|
|
(2,304 |
) |
Amortization of deferred income |
|
|
(14,883 |
) |
|
|
(18,950 |
) |
|
|
(13,673 |
) |
|
|
|
|
|
|
|
|
|
|
Decrease in deferred income |
|
|
(14,883 |
) |
|
|
(30,764 |
) |
|
|
(15,977 |
) |
Deferred income on retroactive reinsurance—beginning of year |
|
|
121,277 |
|
|
|
152,041 |
|
|
|
168,018 |
|
|
|
|
|
|
|
|
|
|
|
Deferred income on retroactive reinsurance—end of year |
|
$ |
106,394 |
|
|
$ |
121,277 |
|
|
$ |
152,041 |
|
|
|
|
|
|
|
|
|
|
|
101
NOTES TO THE CONSOLIDATED FINANCIAL STATEMENTS
(Dollars in thousands)
The above activity arises from two retroactive contracts of which only the 2001 retroactive
adverse development contract for $400,000 remains in effect at December 31, 2009. This contract
covers substantially all lines of business and provides $400,000 of limit in excess of a
retention for accident years 2000 and prior, subject to a $200,000 sublimit on 1998 and prior
accident years and an asbestos and environmental sublimit of $100,000. Premiums are currently
based on 35% of amounts ceded plus a reinsurer margin of $8,000. The contract contains
provisions that would increase the premium rate to as high as 62% under conditions that Company
management considers unlikely. The contract is on a funds held basis with interest credited at
7%. At December 31, 2009, the Company had ceded cumulative losses of $349,000, which is
comprised of $(20,000) in 2008, $(3,577) million in 2007, and $372,577 prior to 2007 and paid
premiums of $143,848, which is comprised of $(8,186) million in 2008, $(1,273) in 2007 and
$153,307 prior to 2007, related to this contract. At December 31, 2009 and 2008, the Company
had a reinsurance recoverable balance of $349,000, and funds held balances of $236,302 and
$220,843, respectively, related to this agreement.
The second contract, which was commuted on June 26, 2008, covered all lines of business and
provided $100,000 of limit in excess of a retention for accident periods prior to August 13,
1998, the date of acquisition of the Company by Fairfax. The contract contained sublimits
relating to asbestos, environmental and latent, construction defect and other losses and is
subject to a maximum economic loss provision. The contract was on a funds held basis with
interest credited at 7%. The commutation had no impact on the financial statements as the
Company had previously reduced the reinsurance recoverable balance by funds held pursuant to the
commutation provision contained in the contract.
The premiums for the contract which remains in effect at December 31, 2009 is included in funds
held under reinsurance contracts on the consolidated balance sheets and the reinsurance
recoverable due from reinsurers in excess of amounts paid for the coverage is reflected on the
balance sheets as deferred income on retroactive reinsurance. Such deferred income is amortized
based on the expected amount and timing of future recoveries, using the interest method. The
Company amortized deferred income of $14,883 in 2009, $9,955 in 2008, $13,259 in 2007 and
$60,661 prior to 2007. This amortization of deferred income is included as a reduction of
losses and LAE in the consolidated statements of income.
In addition to the two contracts noted above, the Company also commuted the retroactive
amendment to its prospective 1998 aggregate stop loss agreement. The effect of this commutation
was a loss of $4,123 offset by $8,778 of unamortized deferred income released on commutation
which resulted in a net pre-tax credit of $4,655 included in losses and LAE on the consolidated
statement of income for the year ended December 31, 2008.
On May 7, 2007, the Company issued pursuant to a private offering (the “Offering”) $330,000
aggregate principal amount of 7-3/4% senior notes due May 1, 2017 (the “2017 Notes”) at an issue
price of 100%. The 2017 Notes are redeemable at the option of the Company beginning May 1,
2012, at prices set forth in the indenture governing the 2017 Notes. Net proceeds of the
Offering to the Company, after commissions and expenses, were approximately $325,100. In
connection with the sale of the 2017 Notes, the Company entered into a registration rights
agreement under which the Company agreed to use its reasonable best efforts to register with the
SEC notes having substantially the same terms as the 2017 Notes, as part of an offer to exchange
freely tradeable exchange notes for the 2017 Notes. Pursuant to an exchange offer which was
completed on August 16, 2007, the Company issued $330,000 aggregate principal amount of
registered notes with substantially the same terms as the 2017 Notes, in exchange for all of the
outstanding 2017 Notes. Concurrent with the Offering, the Company completed a cash tender offer
(the “Tender Offer”) to purchase any and all of its outstanding $300,000 aggregate principal
amount of 10-3/8% senior notes due June 15, 2013 (the “2013 Notes”). Pursuant to the Tender
Offer, all but $4,270 aggregate principal amount of the 2013 Notes were purchased and cancelled.
The purchase of the 2013 Notes was funded with proceeds from the sale of the aforementioned
2017 Notes and available cash on hand. On June 16, 2008, the Company redeemed the remaining
outstanding $4,270 aggregate principal amount of the 2013 Notes.
After May 1, 2012, the Company may redeem the 2017 Notes at its option, in whole or in part,
upon not less than 30 nor more than 60 days’ notice, at the following redemption prices
(expressed as percentages of the principal amount thereof) if redeemed during the twelve-month
period commencing on May 1 of the year set forth below:
| |
|
|
|
|
2012 |
|
|
103.875 |
% |
2013 |
|
|
102.583 |
% |
2014 |
|
|
101.292 |
% |
2015 and after |
|
|
100.000 |
% |
102
NOTES TO THE CONSOLIDATED FINANCIAL STATEMENTS
(Dollars in thousands)
For the years ended December 31, 2009, 2008 and 2007, total interest expense on the notes was
$27,818, $27,885 and $29,850, respectively, including amortization of related deferred financing
costs, and, in respect of the 2013 Notes, accretion of the discount. In 2007, the Company also
recognized additional costs related to the early retirement of its 2013 Notes of $21,187, which
were comprised of premium payments, related fees and expenses and write-off of unamortized
deferred financing costs. At December 31, 2009 and 2008, deferred financing costs incurred in
conjunction with the issuance of the notes totaled $4,627 and $5,258, respectively, and are
included in other assets on the consolidated balance sheet. These deferred financing costs are
being amortized to interest expense on a straight-line basis over the duration of the notes.
At December 31, 2009 and 2008, the book value of the long-term debt, net of unamortized
discount, was $312,114 and $310,502, respectively, and the fair value of the long-term debt, as
determined from quoted market prices, was $323,400 and $244,200, respectively.
The components of income tax expense are summarized as follows:
| |
|
|
|
|
|
|
|
|
|
|
|
|
| |
|
Years Ended December 31, |
|
| |
|
2009 |
|
|
2008 |
|
|
2007 |
|
Current |
|
$ |
53,329 |
|
|
$ |
252,666 |
|
|
$ |
8,721 |
|
Deferred |
|
|
10,301 |
|
|
|
(164,063 |
) |
|
|
131,266 |
|
|
|
|
|
|
|
|
|
|
|
Total income tax expense |
|
$ |
63,630 |
|
|
$ |
88,603 |
|
|
$ |
139,987 |
|
|
|
|
|
|
|
|
|
|
|
Income tax expense shown on the consolidated statements of income excludes $43, $(250) and
$12,548 of deferred income tax expense (benefit) on equity in earnings of investees in 2009,
2008 and 2007, respectively. Total income tax expense in 2009, 2008 and 2007, inclusive of
these amounts, was $63,673, $88,353 and $152,535, respectively. Income taxes paid in 2009, 2008
and 2007 were $207,333, $99,514 and $35,024, respectively. Included in accounts payable and
other liabilities on the consolidated balance sheets at December 31, 2009 and 2008,
respectively, is $11,108 and $165,622 in respect of current income taxes payable.
Deferred income taxes reflect the income tax impact of temporary differences between the amount
of assets and liabilities for financial reporting purposes and such amounts as measured by
income tax laws and regulations. Total deferred income tax expense/(benefit) in 2009, 2008 and
2007 was $10,344, $(164,313) and $143,814, respectively.
Components of deferred income tax assets and liabilities are summarized as follows:
| |
|
|
|
|
|
|
|
|
| |
|
At December 31, |
|
| |
|
2009 |
|
|
2008 |
|
Deferred tax assets: |
|
|
|
|
|
|
|
|
Investments |
|
$ |
105,335 |
|
|
$ |
103,025 |
|
Unpaid losses and LAE |
|
|
61,977 |
|
|
|
69,858 |
|
Deferred income on retroactive reinsurance |
|
|
37,238 |
|
|
|
42,447 |
|
Unearned premiums |
|
|
21,879 |
|
|
|
26,420 |
|
Employee benefit plans |
|
|
11,770 |
|
|
|
8,339 |
|
Unrealized net depreciation of investments and currency translation |
|
|
— |
|
|
|
5,951 |
|
Other |
|
|
12,970 |
|
|
|
15,509 |
|
|
|
|
|
|
|
|
Deferred tax assets |
|
|
251,169 |
|
|
|
271,549 |
|
|
|
|
|
|
|
|
Deferred tax liabilities: |
|
|
|
|
|
|
|
|
Deferred policy acquisition costs |
|
|
16,009 |
|
|
|
18,447 |
|
Capitalized debt costs |
|
|
6,618 |
|
|
|
7,231 |
|
Unrealized net appreciation of investments and currency translation |
|
|
136,259 |
|
|
|
— |
|
Other |
|
|
5,873 |
|
|
|
6,794 |
|
|
|
|
|
|
|
|
Deferred tax liabilities |
|
|
164,759 |
|
|
|
32,472 |
|
|
|
|
|
|
|
|
Total net deferred tax assets |
|
$ |
86,410 |
|
|
$ |
239,077 |
|
|
|
|
|
|
|
|
Management believes it is more likely than not that the Company will realize the benefits of its
net deferred tax assets and, accordingly no valuation allowance has been recorded at December
31, 2009 and 2008.
103
NOTES TO THE CONSOLIDATED FINANCIAL STATEMENTS
(Dollars in thousands)
A reconciliation of income taxes at the statutory federal income tax rate to the Company’s tax
expense is presented below:
| |
|
|
|
|
|
|
|
|
|
|
|
|
|
|
|
|
|
|
|
|
|
|
|
|
| |
|
Years Ended December 31, |
|
| |
|
2009 |
|
|
2008 |
|
|
2007 |
|
| |
|
|
|
|
|
% of |
|
|
|
|
|
|
% of |
|
|
|
|
|
|
% of |
|
| |
|
|
|
|
|
Pre-tax |
|
|
|
|
|
|
Pre-tax |
|
|
|
|
|
|
Pre-tax |
|
| |
|
Amount |
|
|
Income |
|
|
Amount |
|
|
Income |
|
|
Amount |
|
|
Income |
|
Income taxes computed on
pre-tax operating income |
|
$ |
92,936 |
|
|
|
35.0 |
% |
|
$ |
147,655 |
|
|
|
35.0 |
% |
|
$ |
143,454 |
|
|
|
35.0 |
% |
(Decrease) increase in income
taxes resulting from: |
|
|
|
|
|
|
|
|
|
|
|
|
|
|
|
|
|
|
|
|
|
|
|
|
Recognition of tax credits
associated with the sale of
an investment in affiliate |
|
|
— |
|
|
|
— |
|
|
|
(51,605 |
) |
|
|
(12.2 |
) |
|
|
— |
|
|
|
— |
|
Tax-exempt interest |
|
|
(19,207 |
) |
|
|
(7.2 |
) |
|
|
(3,380 |
) |
|
|
(0.9 |
) |
|
|
(44 |
) |
|
|
— |
|
Dividends received deduction |
|
|
(6,445 |
) |
|
|
(2.4 |
) |
|
|
(3,739 |
) |
|
|
(0.8 |
) |
|
|
(3,378 |
) |
|
|
(0.8 |
) |
Other, net |
|
|
(3,654 |
) |
|
|
(1.4 |
) |
|
|
(328 |
) |
|
|
(0.1 |
) |
|
|
(45 |
) |
|
|
— |
|
|
|
|
|
|
|
|
|
|
|
|
|
|
|
|
|
|
|
|
Total income tax expense |
|
$ |
63,630 |
|
|
|
24.0 |
% |
|
$ |
88,603 |
|
|
|
21.0 |
% |
|
$ |
139,987 |
|
|
|
34.2 |
% |
|
|
|
|
|
|
|
|
|
|
|
|
|
|
|
|
|
|
|
In December 2008, the Company sold its 15.7% investment in Northbridge to an affiliated foreign
company, which resulted in tax benefits of approximately $51,605 attributable to the utilization
of foreign tax credits.
The Internal Revenue Service has completed its audit of tax years 2005 and 2006 with no material
adjustments and is presently conducting their audit of tax years 2007 and 2008 in respect of the
Fairfax Group companies. There have been no material adjustments proposed for tax years 2007
and 2008. Income tax returns filed with various state and foreign jurisdictions remain open to
examination in accordance with the statutes of the respective jurisdictions. The Company did
not record any liability for uncertain tax positions, interest or penalties in 2009.
| 10. |
|
Related Party Transactions |
Reinsurance
The Company and its subsidiaries have entered into various reinsurance arrangements with related
parties. The approximate amounts by which income, expense, assets and liabilities are increased
(decreased) in the consolidated financial statements, with respect to reinsurance assumed and
ceded, are summarized as follows:
| |
|
|
|
|
|
|
|
|
|
|
|
|
| |
|
At December 31, |
|
| |
|
2009 |
|
|
2008 |
|
|
2007 |
|
Statements of income: |
|
|
|
|
|
|
|
|
|
|
|
|
Net premiums written |
|
$ |
(12,916 |
) |
|
$ |
(27,179 |
) |
|
$ |
(17,566 |
) |
Premiums earned |
|
$ |
(14,816 |
) |
|
$ |
(28,503 |
) |
|
$ |
14,876 |
|
Losses and LAE |
|
$ |
(32,666 |
) |
|
$ |
(38,281 |
) |
|
$ |
(2,836 |
) |
|
|
|
|
|
|
|
|
|
|
|
|
|
Balance sheets: |
|
|
|
|
|
|
|
|
|
|
|
|
Premiums receivable |
|
$ |
— |
|
|
$ |
(142 |
) |
|
$ |
644 |
|
Reinsurance recoverable from affiliates |
|
$ |
206,420 |
|
|
$ |
209,189 |
|
|
$ |
229,591 |
|
Prepaid reinsurance premiums |
|
$ |
4,958 |
|
|
$ |
6,903 |
|
|
$ |
8,246 |
|
Unpaid losses and LAE |
|
$ |
17,580 |
|
|
$ |
28,402 |
|
|
$ |
54,790 |
|
Unearned premiums |
|
$ |
28 |
|
|
$ |
73 |
|
|
$ |
92 |
|
Accounts payable and other liabilities |
|
$ |
1,868 |
|
|
$ |
2,813 |
|
|
$ |
5,589 |
|
104
NOTES TO THE CONSOLIDATED FINANCIAL STATEMENTS
(Dollars in thousands)
In the normal course of business, a Fairfax offshore reinsurance affiliate, Wentworth Insurance
Company Ltd. (“Wentworth”), participates in reinsurance agreements covering several reinsured
lines of business. In 2006 and prior, nSpire, also a Fairfax affiliate, participated in these
agreements. For the years ended December 31, 2009 and 2008, the Company ceded premiums of
$8,152 and $19,342, respectively, to Wentworth and had reinsurance recoverable balances of
$19,207 and $13,850, respectively, at December 31, 2009 and 2008.
For the years ended December 31, 2009, 2008 and 2007, the Company ceded premiums of $1, $77 and
$12,461, respectively, to nSpire and had reinsurance recoverable balances of $12,448 and $25,195
at December 31, 2009 and 2008, respectively. Pursuant to the terms of the reinsurance
agreements between Wentworth and nSpire and the Company, both Wentworth and nSpire, as foreign
reinsurers, are required to collateralize in full reinsurance balances due to the Company. This
collateral is comprised of irrevocable trusts in compliance with NAIC regulations. There are no
regulatory or other restrictions on payments to the Company from either Wentworth or nSpire.
In the normal course of business, Odyssey, an affiliate of Fairfax, may participate on the
Company’s reinsurance agreements. Currently, Odyssey participates on the umbrella per risk
contract, the workers’ compensation catastrophe treaty and a difference in conditions program.
For the years ended December 31, 2009, 2008 and 2007, the Company ceded $3,046, $5,197 and
$2,088, respectively, in premiums to Odyssey and had reinsurance recoverable of $6,062 and
$9,002 at December 31, 2009 and 2008, respectively, under these reinsurance agreements.
Reinsurance recoverable from TIG, a subsidiary of Fairfax, totaled $129,405 and $120,758 at
December 31, 2009 and 2008, respectively. TIG is domiciled in California and cessions to
domestic insurance companies do not require collateral to be recognized for statutory reporting
purposes. The Company has considered several factors in assessing the collectability of
reinsurance recoverable balances from TIG. TIG is a runoff company with a B+ (stable) financial
strength rating from A.M. Best, and a BB+ financial strength rating from Standard and Poor’s,
both nationally recognized rating agencies. TIG is a sizable regulated entity with
policyholders’ surplus of approximately $786,637 at December 31, 2009 and is subject to periodic
independent examination by the California Insurance Department. TIG also had short-term
liquidity represented by cash and short-term investments of $171,487 at December 31, 2009. The
Company has sixteen years of experience with TIG, during which the balances due from TIG have
declined from approximately $267,000 to $129,405 at December 31, 2009, principally through
settlement of underlying claims. There are no regulatory or other restrictions on payments to
the Company from TIG. A former parent of the Company required the transfer of a number of
policies and related assets and liabilities among insurance companies controlled by the former
parent, effective through assumption and indemnity reinsurance agreements. The assuming parties
were required to seek novation of certain policies. At December 31, 2009 and 2008, amounts
recoverable from TIG included $91,427 and $95,240, respectively, related to these policies,
which were not novated. Effective March 1, 1999, the Company entered into a reinsurance
agreement with Fairmont Specialty Insurance Company (formerly Ranger Insurance Company), an
affiliate of Fairfax, covering 100% of policies that are classified as excess liability for
public entities and that incept, renew, have an anniversary date or come into effect on or after
March 1, 1999. Effective June 30, 2002, this agreement was terminated and a new agreement was
signed with TIG covering the same business, at substantially the same terms. The new agreement
covers policies written on or after July 1, 2002. The agreement was terminated effective
September 1, 2003. At December 31, 2009 and 2008, the Company had reinsurance recoverable of
$37,694 and $38,237, respectively, from Fairmont, and $37,033 and $24,134, respectively, from
TIG, related to these agreements.
Effective February 1, 2002, the Company entered into an arrangement with TIG whereby the Company
issued policies on behalf of TIG totaling $22,923 in gross premiums written. The Company
entered into reinsurance agreements under which approximately 30% of the total risk under these
policies was ceded to TIG with the remaining 70% ceded to third party reinsurers. This
arrangement with TIG was terminated as of June 30, 2002. At December 31, 2009 and 2008, the
Company had reinsurance recoverable of $945 and $1,384, respectively, from TIG related to this
agreement.
Effective January 1, 2006, the Company, in connection with its assumption of the Fairmont
business, entered into a reinsurance agreement with Markel Insurance Company of Canada
(“Markel”), an affiliate of Fairfax, under which the Company has agreed to provide commercial
auto coverage to U.S. or Canadian domiciled companies, for which Markel has written the Canadian
auto coverage business, and to cede 100% of the coverage provided by the Company to Markel.
During the years ended December 31, 2009, 2008 and 2007, the Company ceded premiums of $1,646,
$2,128 and $1,966, respectively, to Markel and had a reinsurance recoverable balance of $1,444
and $1,959, respectively, at December 31, 2009 and December 31, 2008.
Advent Syndicate 780 (“Syndicate 780”), which is managed by Advent, a wholly-owned subsidiary of
Fairfax, is a participant on the Company’s property per risk, property catastrophe and workers’
compensation catastrophe treaties. For the years ended December 31, 2009 and 2008, the Company
ceded premiums of $41 and $533, respectively, to Syndicate 780 and had reinsurance recoverable
balances of $155 and $185, respectively, at December 31, 2009 and 2008, respectively.
105
NOTES TO THE CONSOLIDATED FINANCIAL STATEMENTS
(Dollars in thousands)
Investment Agreements
The Company and its subsidiaries have entered into agreements with Hamblin Watsa Investment
Counsel Ltd. (“Hamblin Watsa”), a wholly-owned subsidiary of Fairfax, for investment management
services, and with Fairfax for investment administration services. Pursuant to the agreements,
fees, based upon assets under management, totaled $11,334, $11,150 and $7,134 for the years
ended December 31, 2009, 2008 and 2007, respectively, and were included as investment expenses
in the consolidated statements of income.
Other Agreements
Since 2001, the Company has obtained certain information technology services, including
technology management, production and operations support and systems development, on a
non-exclusive basis from Fairfax Information Technology Services, Inc. (“FITS”), a wholly-owned
subsidiary of Fairfax. Beginning in April 2009, the Company assumed direct management
responsibility for these functions and hired employees or contractors to perform most of the
services previously received from FITS. FITS continues to provide data center, network and
hosting services to the Company. Charges for the services provided by FITS, including fees
recorded for services subcontracted by FITS to other vendors, for the years ended December 31,
2009, 2008 and 2007 were $17,025, $32,062 and $36,500, respectively. Of such fees, $16,430,
$30,056 and $30,462 were charged directly to expense for 2009, 2008 and 2007, respectively. The
remaining $595, $2,006 and $6,038 were software development projects capitalized in 2009, 2008
and 2007, respectively. The Company amortizes such fees over various periods beginning on the
date the software is placed in service. In 2009, 2008 and 2007, amortization of software
development costs of $2,557, $8,682 and $2,863, respectively, was charged to operations, and
unamortized costs of $13,582 and $15,544 were included in other assets for the years ended
December 31, 2009 and 2008, respectively. The increase in the amortization charge in 2008 was
attributable to a write-off of previously capitalized software development costs of $6,383.
Under an agreement effective from January 1, 2001 through December 31, 2007, FITS was provided
certain management and general services by the Company, for which the Company recorded $0, $0
and $172 for the years ended December 31, 2009, 2008 and 2007, respectively.
Under a royalty agreement effective from January 1, 2003 through April 30, 2009, the Company
received royalty payments from FITS for the use of software by other clients of FITS that was
developed for and funded by the Company. Under this agreement, the Company recorded $62, $186
and $265 for the years ended December 31, 2009, 2008 and 2007, respectively. Under a similar
marketing agreement effective from March 1, 2006 through April 30, 2009, the Company received
commissions from MFXChange Ireland Limited (“MFX Ireland”) for the introduction of customers to
MFX Ireland. Under this agreement, the Company recorded $83, $200 and $291 in the years ended
December 31, 2009, 2008 and 2007, respectively.
Under an agreement effective January 1, 2006, the Company provides underwriting, administration,
financial and claims services for the business of Fairmont Premier Insurance Company, Fairmont
Specialty Insurance Company and Fairmont Insurance Company, affiliates of Fairfax. The fees
recorded for such services were $1,800, $2,398 and $3,855 in 2009, 2008 and 2007, respectively.
Fairfax purchases insurance coverage for itself and on behalf of its subsidiaries, including
comprehensive crime, insurance companies’ professional liability, directors’ and officers’
liability, employment practices liability, fiduciary liability and special accident insurance.
The Company’s share of the expense incurred for this coverage was $771, $842 and $1,151 for the
years ended December 31, 2009, 2008 and 2007, respectively.
The Company receives loss adjustment services from Cunningham Lindsey U.S., Inc., an affiliate
of Fairfax. Expenses incurred for these services were $234, $602 and $794 for the years ended
December 31, 2009, 2008 and 2007, respectively.
Included in other expense for the years ended December 31, 2009, 2008 and 2007 are incurred
charitable contributions of $2,720, $6,600 and $3,986, respectively, related to the Six Four
Foundation, a not-for-profit entity affiliated with Fairfax.
Included in accounts payable and other liabilities at December 31, 2009 and 2008 are amounts
payable to Fairfax and affiliates of $1,475 and $70, respectively. Included in other assets at
December 31, 2009 and 2008 are amounts receivable from Fairfax and affiliates of $13 and $803,
respectively.
Management believes that the revenues and expenses related to the transactions with affiliated
entities would not be materially different if such transactions were with unaffiliated entities.
106
NOTES TO THE CONSOLIDATED FINANCIAL STATEMENTS
(Dollars in thousands)
The Company sponsors a qualified defined contribution plan pursuant to sections 401(k) and
401(a) of the Internal Revenue Code for which all employees are eligible. The Company makes an
annual contribution equal to 3% of base salary and a matching contribution equal to one-half of
each employee’s contribution up to the first 6% of base salary. Certain employees also have the
opportunity to participate in a non-qualified plan that permits contributions that would
otherwise be limited by IRS regulations. Total defined contribution plan expense was $5,431,
$5,582 and $6,091 for the years ended December 31, 2009, 2008 and 2007, respectively.
The Company provides postretirement health care and life insurance benefits to certain retired
employees. Medical benefits are provided to employees who were at least age 50 on January 1,
1994, and upon retirement are at least age 55 and have at least 15 years of service. Employees
hired before August 1, 1990 are eligible for retiree life insurance coverage based on defined
age, service and salary criteria. During the second quarter of 2009, the Company increased the
required retiree contributions for the optional supplemental life insurance coverage. This
change was treated as a negative plan amendment and reduced the accumulated postretirement
benefit obligation by $1,109 in 2009. During the fourth quarter of 2008, the Company announced
that effective January 1, 2009, retiree medical benefits for age 65 and older Medicare eligible
participants would be provided by individual “Medicare Advantage Plan” insurance policies and
participants under age 65 would be covered by a group insurance policy. This change, from
self-insurance was treated as a negative plan amendment and reduced the accumulated
postretirement benefit obligation by $3,401 in 2008.
In accordance with guidance provided under ASC 715, Compensation — Retirement Benefits, the
Company recognizes the over or underfunded status of its postretirement plans in its balance
sheet and records the change in funded status, in the year in which the change occurs, through
comprehensive income. At December 31, 2009 and 2008, the Company’s postretirement benefit
obligation for healthcare and life insurance benefits, which is an unfunded liability, was
$4,548 and $5,581, respectively. The weighted average discount rate used in determining the
accumulated postretirement benefit obligation was 5.5% and 6.25% at December 31, 2009 and 2008,
respectively. For purposes of measuring the accumulated postretirement benefit obligation at
December 31, 2009, the health care cost trend rates are assumed to decline gradually from 29.8%
in 2010 to 6.0% in 2022 and thereafter for all participants. Increasing or decreasing the
assumed health care cost trend rates by one percentage point in each year would not materially
increase or decrease the accumulated postretirement benefit obligation at December 31, 2009.
The Company has established various long term incentive plans for certain employees who hold
senior management or officer positions. These plans provide for the payment of cash bonuses in
the future, the value of which is either fixed or based on the book value of the Company. For
2009, 2008 and 2007, expenses relating to these plans, which are included in the consolidated
statements of income were $6,496, $4,944 and $7,260, respectively.
Certain employees of the Company have been granted shares of restricted common stock of Fairfax
under the Fairfax Financial 1999 Restricted Share Plan. The restricted stock vests over periods
ranging from five to ten years. Restricted stock expense of $67, $506 and $564 for the years
ended December 31, 2009, 2008 and 2007, respectively, is included in the consolidated statements
of income.
All employees of the Company are eligible to participate in the Fairfax Financial Holdings
Limited Employee Share Ownership Plan (the “Plan”). The Plan provides an opportunity to
purchase Fairfax subordinate voting shares through a combination of employee and company
contributions. Employees may elect to contribute from 1% to 10% of base salary through regular
payroll deductions, and the Company is required to make matching contributions equal to 30% of
the employee contributions. In addition, the Company is required to make an annual contribution
equal to 20% of employee contributions upon Fairfax and the Company achieving certain financial
objectives. The Plan expense of $462, $370 and $213 for the years ended December 31, 2009, 2008
and 2007, respectively, is included in the consolidated statements of income.
107
NOTES TO THE CONSOLIDATED FINANCIAL STATEMENTS
(Dollars in thousands)
| 12. |
|
Commitments and Contingencies |
The Company and its subsidiaries lease office space and equipment under non-cancelable operating
leases. These include a 20-year lease for the Company’s home office which expires on December
31, 2022 and has minimum lease payments remaining of $40,467. Minimum annual rentals are
summarized as follows:
| |
|
|
|
|
2010 |
|
$ |
12,828 |
|
2011 |
|
|
10,751 |
|
2012 |
|
|
7,759 |
|
2013 |
|
|
6,780 |
|
2014 |
|
|
6,194 |
|
2015 and thereafter |
|
|
31,889 |
|
|
|
|
|
Total minimum annual rentals |
|
$ |
76,201 |
|
|
|
|
|
Rental expense under these operating leases was $13,073, $13,023 and $13,178 in 2009, 2008 and
2007, respectively. The Company recognized $4, $83 and $163 in 2009, 2008 and 2007,
respectively, from subleases.
The Company has purchased structured settlement annuities from various insurance companies in
order to settle certain claim liabilities. Should these other companies become unable to make
the annuity payments, the Company would be liable. The present value of these annuities
included in reinsurance recoverable in the consolidated balance sheets at December 31, 2009 and
2008 was approximately $141,030 and $142,213, respectively. Approximately 82.8% of this balance
is due from insurance companies rated A- or better by A.M. Best Company.
The Company had commitments to fund limited partnership investments totaling $11,859 and $12,450
at December 31, 2009 and 2008, respectively. These capital commitments can be called by the
partnerships during the commitment period (generally five years or less) to fund working capital
needs or the purchase of new investments.
Crum & Forster Holdings Corp. and US Fire, among numerous other insurance company and insurance
broker defendants, have been named as defendants in a class action suit filed by policyholders
alleging, among other things, that the defendants used the contingent commission structure to
deprive policyholders of free competition in the market for insurance. The action was filed in
the U.S. District Court for the District of New Jersey. Plaintiffs seek certification of a
nationwide class consisting of all persons who between August 26, 1994 and the date of the class
certification engaged the services of any one of the broker defendants and who entered into or
renewed a contract of insurance with one of the insurer defendants. The trial court dismissed
the federal antitrust claims and RICO claims with prejudice and declined to accept supplemental
jurisdiction over plaintiffs’ state law claims. On October 24, 2007, plaintiffs filed an appeal
with the U.S. Court of Appeal for the Third Circuit. The court heard oral arguments on April
21, 2009 in Philadelphia, Pennsylvania. The court took the matter under submission and has not
yet issued a ruling. Crum & Forster Holdings Corp. and US Fire continue to be named as
defendants and intend to vigorously defend the action.
In the ordinary course of their business, Crum & Forster’s subsidiaries receive claims asserting
alleged injuries and damages from asbestos and other hazardous waste and toxic substances and
are subject to related coverage litigation. The conditions surrounding the final resolution of
these claims and the related litigation continue to change. Currently, it is not possible to
predict judicial and legislative changes and their impact on the future development of asbestos
and environmental claims and litigation. This trend will be affected by future court decisions
and interpretations, as well as changes in applicable legislation. As a result of these
uncertainties, additional liabilities may arise for amounts in excess of current reserves for
asbestos, environmental and other latent exposures. These additional amounts, or a range of
these additional amounts, cannot currently be reasonably estimated. As a result of these
claims, management continually reviews required reserves and reinsurance recoverable. In each
of these areas of exposure, the Company litigates individual cases when appropriate and
endeavors to settle other claims on favorable terms.
The Company’s subsidiaries are involved in various lawsuits and arbitration proceedings arising
in the ordinary course of business. While the outcome of such matters cannot be predicted with
certainty, in the opinion of management, no such matter is likely to have a material adverse
effect on the Company’s consolidated net income, financial position or liquidity. However, it
should be noted that the frequency of large damage awards in some jurisdictions, including
punitive damage awards that bear little or no relation to actual economic damages incurred by
plaintiffs, continues to create the potential for an unpredictable judgment in any given matter.
108
NOTES TO THE CONSOLIDATED FINANCIAL STATEMENTS
(Dollars in thousands)
| 13. |
|
Dividend Restrictions, Statutory Information and Capitalization |
The Company’s insurance subsidiaries are subject to state regulatory restrictions that limit the
maximum amount of dividends they can pay to the Company. These regulations vary by state. The
restrictions are generally based on the net income, investment income and policyholders’ surplus
of each insurance company, and further provide that the payment of dividends must be from the
earned policyholders’ surplus of the insurance company. Any payment of dividends above the
regulatory limits is considered “extraordinary” and is subject to the approval of the Insurance
Commissioner in the state of domicile. In October 2008, US Fire received prior regulatory
approval from the Delaware Department of Insurance to pay, and paid, a $350,000 extraordinary
dividend to the Company.
The Company’s insurance subsidiaries are domiciled in the states of Delaware, New Jersey, New
York and Arizona. The principal insurance subsidiaries are US Fire and North River domiciled in
Delaware and New Jersey, respectively. The maximum dividends that can be paid by the insurance
subsidiaries to the Company in 2010, without prior regulatory approval, ares $163,776.
The combined statutory basis net income and policyholders’ surplus of Crum & Forster’s insurance
subsidiaries are presented below:
| |
|
|
|
|
|
|
|
|
|
|
|
|
| |
|
Years Ended December 31, |
|
| |
|
2009 |
|
|
2008 |
|
|
2007 |
|
Net income |
|
$ |
153,979 |
|
|
$ |
484,003 |
|
|
$ |
191,699 |
|
Policyholders’ surplus |
|
$ |
1,628,159 |
|
|
$ |
1,410,612 |
|
|
$ |
1,639,751 |
|
GAAP differs in certain respects from the statutory accounting practices prescribed or permitted
by insurance regulatory authorities for the Company’s insurance subsidiaries. Prescribed
statutory accounting practices include state laws, regulations and general administrative rules,
as well as a variety of publications of the NAIC. Permitted statutory accounting practices
encompass all accounting practices that are not prescribed; such practices differ from state to
state, may differ from company to company within a state and may change in the future.
The principal differences between statutory policyholders’ surplus and shareholder’s equity
determined in accordance with GAAP relate to accounting for deferred gains on retroactive
insurance, unrealized gains and losses on fixed income securities, deferred policy acquisition
costs and deferred federal income taxes.
The Company operates in the commercial property and casualty insurance business. Premiums
earned for the Company’s lines of business are summarized as follows:
| |
|
|
|
|
|
|
|
|
|
|
|
|
| |
|
Years Ended December 31, |
|
| |
|
2009 |
|
|
2008 |
|
|
2007 |
|
General liability |
|
$ |
146,610 |
|
|
$ |
194,266 |
|
|
$ |
228,973 |
|
Workers’ compensation |
|
|
188,246 |
|
|
|
218,414 |
|
|
|
257,971 |
|
Commercial automobile |
|
|
118,976 |
|
|
|
187,206 |
|
|
|
210,490 |
|
Property |
|
|
88,696 |
|
|
|
164,397 |
|
|
|
267,496 |
|
Commercial multi-peril |
|
|
76,479 |
|
|
|
79,938 |
|
|
|
80,511 |
|
Accident and health |
|
|
130,187 |
|
|
|
117,653 |
|
|
|
103,910 |
|
Other |
|
|
32,088 |
|
|
|
36,154 |
|
|
|
36,793 |
|
|
|
|
|
|
|
|
|
|
|
Total premiums earned |
|
$ |
781,282 |
|
|
$ |
998,028 |
|
|
$ |
1,186,144 |
|
|
|
|
|
|
|
|
|
|
|
109
NOTES TO THE CONSOLIDATED FINANCIAL STATEMENTS
(Dollars in thousands)
The loss and LAE amounts and loss and LAE ratios of the Company’s lines of business, as
estimated at the respective year-end, are summarized as follows:
| |
|
|
|
|
|
|
|
|
|
|
|
|
|
|
|
|
|
|
|
|
|
|
|
|
| |
|
Years Ended December 31, |
|
| |
|
2009 |
|
|
2008 |
|
|
2007 |
|
| |
|
Amount |
|
|
Ratio |
|
|
Amount |
|
|
Ratio |
|
|
Amount |
|
|
Ratio |
|
Accident year loss and LAE ratios: |
|
|
|
|
|
|
|
|
|
|
|
|
|
|
|
|
|
|
|
|
|
|
|
|
General liability |
|
$ |
100,828 |
|
|
|
68.8 |
% |
|
$ |
134,998 |
|
|
|
69.5 |
% |
|
$ |
152,556 |
|
|
|
66.6 |
% |
Workers’ compensation |
|
|
151,945 |
|
|
|
80.7 |
% |
|
|
168,171 |
|
|
|
77.0 |
% |
|
|
196,816 |
|
|
|
76.3 |
% |
Commercial automobile |
|
|
92,682 |
|
|
|
77.9 |
% |
|
|
145,615 |
|
|
|
77.8 |
% |
|
|
144,308 |
|
|
|
68.6 |
% |
Property |
|
|
64,162 |
|
|
|
72.3 |
% |
|
|
204,469 |
|
|
|
124.4 |
% |
|
|
180,185 |
|
|
|
67.4 |
% |
Commercial multi-peril |
|
|
41,585 |
|
|
|
54.4 |
% |
|
|
45,986 |
|
|
|
57.5 |
% |
|
|
51,736 |
|
|
|
64.3 |
% |
Accident and health |
|
|
94,319 |
|
|
|
72.4 |
% |
|
|
83,279 |
|
|
|
70.8 |
% |
|
|
72,068 |
|
|
|
69.4 |
% |
Other |
|
|
20,455 |
|
|
|
63.7 |
% |
|
|
20,274 |
|
|
|
56.1 |
% |
|
|
19,154 |
|
|
|
52.1 |
% |
|
|
|
|
|
|
|
|
|
|
|
|
|
|
|
|
|
|
|
|
|
|
Total accident year losses and LAE |
|
|
565,976 |
|
|
|
72.4 |
% |
|
|
802,792 |
|
|
|
80.4 |
% |
|
|
816,823 |
|
|
|
68.9 |
% |
Prior years’ loss development |
|
|
(39,864 |
) |
|
|
(5.1 |
) |
|
|
20,075 |
|
|
|
2.1 |
|
|
|
(63,854 |
) |
|
|
(5.4 |
) |
|
|
|
|
|
|
|
|
|
|
|
|
|
|
|
|
|
|
|
Calendar year losses and LAE |
|
$ |
526,112 |
|
|
|
67.3 |
% |
|
$ |
822,867 |
|
|
|
82.5 |
% |
|
$ |
752,969 |
|
|
|
63.5 |
% |
|
|
|
|
|
|
|
|
|
|
|
|
|
|
|
|
|
|
|
The Company does not allocate investment results or certain corporate expenses for purposes of
evaluating financial performance of each line of business. For additional information on
current accident year losses and prior years’ development, see Note 5 to the consolidated
financial statements.
| 15. |
|
Quarterly Financial Data |
The Company’s quarterly financial data is summarized in the table below. This quarterly
financial data is unaudited. In the opinion of management, all adjustments necessary to present
fairly the results of operations for such periods have been made.
| |
|
|
|
|
|
|
|
|
|
|
|
|
|
|
|
|
|
|
|
|
|
|
|
|
|
|
|
|
|
|
|
|
| |
|
Three Months Ended |
|
| |
|
(Unaudited) |
|
| |
|
December 31, |
|
|
September 30, |
|
|
June 30, |
|
|
March 31, |
|
| |
|
2009 |
|
|
2008 |
|
|
2009 |
|
|
2008 |
|
|
2009 |
|
|
2008 |
|
|
2009 |
|
|
2008 |
|
Premiums earned |
|
$ |
191,539 |
|
|
$ |
230,358 |
|
|
$ |
182,032 |
|
|
$ |
232,978 |
|
|
$ |
200,281 |
|
|
$ |
262,882 |
|
|
$ |
207,430 |
|
|
$ |
271,810 |
|
Investment income1,2 |
|
$ |
30,677 |
|
|
$ |
10,583 |
|
|
$ |
34,213 |
|
|
$ |
14,706 |
|
|
$ |
63,681 |
|
|
$ |
31,248 |
|
|
$ |
35,393 |
|
|
$ |
15,129 |
|
Net realized investment gains
and losses3 |
|
$ |
7,659 |
|
|
$ |
204,533 |
|
|
$ |
210,394 |
|
|
$ |
162,369 |
|
|
$ |
23,002 |
|
|
$ |
9,709 |
|
|
$ |
(91,071 |
) |
|
$ |
155,268 |
|
Losses and LAE |
|
$ |
134,837 |
|
|
$ |
156,005 |
|
|
$ |
122,950 |
|
|
$ |
211,506 |
|
|
$ |
132,475 |
|
|
$ |
245,746 |
|
|
$ |
135,850 |
|
|
$ |
209,610 |
|
Net income (loss) |
|
$ |
20,915 |
|
|
$ |
189,253 |
|
|
$ |
154,761 |
|
|
$ |
69,728 |
|
|
$ |
57,252 |
|
|
$ |
(19,576 |
) |
|
$ |
(30,947 |
) |
|
$ |
93,401 |
|
Combined ratio |
|
|
105.0 |
% |
|
|
99.0 |
% |
|
|
105.9 |
% |
|
|
126.9 |
% |
|
|
100.5 |
% |
|
|
125.2 |
% |
|
|
98.0 |
% |
|
|
106.9 |
% |
| |
|
|
| 1 |
|
Investment income includes pre-tax equity in earnings (losses) of investees
of $122, $(709) and $35,846 in 2009, 2008 and 2007, respectively. |
| |
| 2 |
|
The increase in investment income in the fourth quarter of 2009 as compared to
the fourth quarter of 2008 was primarily attributable to higher earnings from
investments at equity. |
| |
| 3 |
|
The decrease in net realized investment gains in the fourth quarter of 2009 as
compared to the fourth quarter of 2008 was primarily attributable to lower gains on
total return swaps. |
110
|
|
|
| ITEM 9. |
|
CHANGES IN AND DISAGREEMENTS WITH ACCOUNTANTS ON ACCOUNTING AND FINANCIAL DISCLOSURE |
None.
|
|
|
| ITEM 9A |
|
(T). CONTROLS AND PROCEDURES |
Evaluation of Disclosure Controls and Procedures
The Company’s management, with the participation of the Chief Executive Officer and Chief Financial
Officer, completed an evaluation of the effectiveness of the design and operation of the Company’s
disclosure controls and procedures, as defined in Rules 13a-15(e) and 15d-15(e) under the
Securities Exchange Act of 1934, as amended (the “Exchange Act”). Disclosure controls and
procedures are designed to ensure that information required to be disclosed by the Company in
reports that it files or submits under the Exchange Act is recorded, processed, summarized and
reported within the time periods specified by the Securities and Exchange Commission (“SEC”) rules
and forms, and that such information is accumulated and communicated to management, including the
Chief Executive Officer and Chief Financial Officer, as appropriate, to allow timely decisions
regarding required disclosures. Based on this evaluation, the Company’s Chief Executive Officer
and Chief Financial Officer have concluded that the Company’s disclosure controls and procedures
were effective, as of the end of the fiscal year covered by this Form 10-K.
Management’s Report on Internal Control over Financial Reporting
Our management is responsible for establishing and maintaining adequate internal control over
financial reporting as defined in Rules 13a-15(f) and 15d-15(f) of the Exchange Act and for
assessing the effectiveness of internal control over financial reporting.
Because of its inherent limitations, internal control over financial reporting may not prevent or
detect misstatements. In addition, projections of any evaluation of effectiveness of internal
control over financial reporting to future periods are subject to the risk that controls may become
inadequate because of changes in conditions, or that the degree of compliance with the policies or
procedures may deteriorate.
Management, including the Company’s Chief Executive Officer and Chief Financial Officer, has
assessed the effectiveness of the Company’s internal control over financial reporting as of
December 31, 2009. In making its assessment of internal control over financial reporting,
management used the criteria established in Internal Control — Integrated Framework, issued by the
Committee of Sponsoring Organizations of the Treadway Commission (COSO). This assessment included
an evaluation of the design of the Company’s internal control over financial reporting and testing
of the operational effectiveness of those controls. Based on the results of this assessment,
management has concluded that the Company’s internal control over financial reporting was effective
as of December 31, 2009.
This annual report does not include an attestation report of the Company’s registered public
accounting firm regarding internal control over financial reporting. Management’s report was not
subject to attestation by the Company’s registered public accounting firm pursuant to temporary
rules of the SEC that permit the Company to provide only management’s report in this annual report.
There were no changes in the Company’s internal control over financial reporting identified in
connection with the foregoing evaluation that occurred during the three months ended December 31,
2009 that have materially affected or that are reasonably likely to materially affect the Company’s
internal control over financial reporting.
|
|
|
| ITEM 9B. |
|
OTHER INFORMATION |
None.
111
PART III
|
|
|
| ITEM 10. |
|
DIRECTORS, EXECUTIVE OFFICERS AND CORPORATE GOVERNANCE |
Directors and Executive Officers
The Company’s directors and executive officers are as follows:
| |
|
|
|
|
|
|
| Name |
|
Age |
|
Position |
V. Prem Watsa
|
|
|
59 |
|
|
Chairman |
Douglas M. Libby
|
|
|
58 |
|
|
President, Chief Executive Officer and Director |
Mary Jane Robertson
|
|
|
56 |
|
|
Executive Vice President, Chief Financial
Officer, Treasurer and Director |
Alan D. Horn1,2,4
|
|
|
58 |
|
|
Director |
Anthony F. Griffiths1,2,3
|
|
|
79 |
|
|
Director |
Robert J. Gunn1,2
|
|
|
64 |
|
|
Director |
Brandon W. Sweitzer1
|
|
|
67 |
|
|
Director |
| |
|
|
| 1 |
|
Audit committee member. |
| |
| 2 |
|
Compensation committee member. |
| |
| 3 |
|
Chairman of the compensation committee. |
| |
| 4 |
|
Chairman of the audit committee. |
V. Prem Watsa has served as the Company’s Chairman since March 7, 2002 and served as its Chief
Executive Officer from May 20, 2003 to March 31, 2004. Mr. Watsa has served as Chairman and Chief
Executive Officer of Fairfax since 1985 and as Vice President of Hamblin Watsa Investment Counsel
Ltd. since 1985. He formerly served as Vice President of GW Asset Management from 1983 to 1984 and
Vice President of Confederation Life Investment Counsel from 1974 to 1983. Mr. Watsa has served as
Chairman of Odyssey Re Holdings Corp. (“Odyssey”) since March 2001 and Northbridge Financial
Corporation (“Northbridge”) since April 2003.
Douglas M. Libby has served as the Chairman and Chief Executive Officer of the Company’s principal
insurance subsidiaries since January 1, 2008 and as President and Chief Executive Officer of the
Company since March 8, 2008 and a director since October 7, 2009. Mr. Libby previously served as
President and Chief Executive Officer of Seneca Insurance Company, Inc., the Company’s subsidiary,
from 1997 through 2009, and is currently its Chairman.
Mary Jane Robertson has served as the Company’s Executive Vice President and Chief Financial
Officer since March 7, 2002, its Treasurer since May 20, 2003 and a director since October 7, 2009.
Ms. Robertson has served as Executive Vice President, Treasurer and a director of the Company’s
principal insurance subsidiaries since 1999.
Alan D. Horn has served as a member of the Company’s board of directors since April 16, 2008 and is
chairman of the audit committee and a member of the compensation committee. Mr. Horn is a
chartered accountant and has been Chairman of Rogers Communications Inc., and President and Chief
Executive Officer of Rogers Telecommunications Limited since March, 2006. From 1996 to 2006, Mr.
Horn served as Vice President, Finance and Chief Financial Officer of Rogers Communications Inc.
From 1990 to 1996, Mr. Horn served as President and Chief Operating Officer of Rogers
Telecommunications Limited. He is currently a director of Fairfax and the chairman of its audit
committee as well as a director of March Networks Corporation and CCL Industries Inc.
Anthony F. Griffiths has served as a member of the Company’s board of directors since March 6,
2002. Since 1993, Mr. Griffiths has been an independent business consultant and corporate
director. He is currently a director of Fairfax and several of its subsidiaries, including
Odyssey. Mr. Griffiths is also a director of AbitibiBowater Inc., Bronco Energy Ltd., Jaguar Mining
Inc., Vitran Corporation Inc., Novadaq Technologies Inc., Gedex Inc., and Russel Metals Inc. Mr.
Griffiths is a director and serves on the audit committees of Fairfax and several of its
subsidiaries, as well as Jaguar Mining Inc. He is also a Trustee of The Brick Income Fund.
Robert J. Gunn has served as a member of the Company’s board of directors since March 30, 2007.
Mr. Gunn is currently an independent business consultant and corporate director. Since 2004, Mr.
Gunn has been Vice Chairman of the board of directors and a member of the audit committee of
Northbridge. Mr. Gunn previously served as the Chief Executive Officer and Chief Operating Officer
of Royal & SunAlliance PLC, in London, England, from 2002 to 2003 and 2001 to 2002, respectively.
He also served as Group Director, Americas, of Royal & SunAlliance, from 1998 to 2001. From 1990
to 2001, Mr. Gunn held the positions of President and Chief Executive Officer at Royal &
SunAlliance Canada. He is currently a director and member of the audit committees of Fairfax,
Energy Split Corp. Inc. and Energy Split Corp. II Inc.
112
Brandon W. Sweitzer has served as a member of the Company’s board of directors and audit committee
since October 7, 2009. Mr. Sweitzer is a Senior Fellow of the U.S. Chamber of Commerce. He is a
director of Fairfax, Odyssey, Falcon Insurance Company, First Capital Insurance Limited, and United
Educators. He also serves on the Board of the St. John’s University School of Risk Management.
Mr. Sweitzer became Chief Financial Officer of Marsh Inc. in 1981, and was its President from 1999
through 2000. From 1996 to 1999, Mr. Sweitzer served as President and Chief Executive Officer of
Guy Carpenter & Company.
Corporate Governance
Messrs. Horn, Griffiths, Gunn and Sweitzer are independent as independence is defined in the
listing standards of the New York Stock Exchange.
Audit Committee and Audit Committee Financial Expert
The Company’s board of directors has established an audit committee composed of Messrs. Horn,
Griffiths, Gunn and Sweitzer. The audit committee’s primary responsibilities include: engaging
independent accountants; consulting with management on the hiring of the chief internal auditor;
approving independent audit fees; reviewing quarterly and annual financial statements, audit
results and reports, including management comments and recommendations thereto; reviewing the
Company’s systems of controls and policies, including those covering conflicts of interest and
business ethics; evaluating reports of actual or threatened litigation; considering significant
changes in accounting practices; and examining improprieties or suspected improprieties, with the
authority to retain outside counsel or experts.
All of the members of the audit committee are independent as independence is defined in the listing
standards of the New York Stock Exchange. In addition, the board of directors has determined that
Mr. Horn, chairman of the audit committee, is qualified as an audit committee financial expert
within the meaning of the regulations of the Securities and Exchange Commission.
Compensation Committee
The Company’s board of directors has established a compensation committee comprised of Messrs.
Horn, Griffiths and Gunn, all of whom are independent of the Company’s management and are free of
any relationship that, in the opinion of the board of directors, would interfere with their
exercise of independent judgment as committee members. The compensation committee’s primary
responsibilities include administering, reviewing and making recommendations to the Company’s board
of directors regarding compensation of the Company’s executive officers and ensuring that the
executives’ performance meets corporate, financial and strategic objectives.
Compensation of Directors
Messrs. Horn, Griffiths, Gunn, and Sweitzer are compensated annually in the amount of $15,000,
plus $750 per board meeting attended and their reasonable expenses of each attendance. In
addition, Messrs. Horn, Griffiths, Gunn and Sweitzer serve on Crum & Forster’s audit and/or
compensation committees and receive $750 per committee meeting attended if held separately from a
board meeting.
Code of Ethics
The Company has adopted a Code of Ethics for Senior Financial Officers, which was filed as an
exhibit to the Company’s 2004 annual report on Form 10-K. The Company will provide, free of
charge, copies of the Code of Ethics upon written request directed to the Company’s Corporate
Secretary at the Company’s principal executive offices located at 305 Madison Avenue, Morristown,
NJ 07962.
|
|
|
| ITEM 11. |
|
EXECUTIVE COMPENSATION |
Omitted pursuant to General Instruction I(2)(c) to Form 10-K.
|
|
|
| ITEM 12. |
|
SECURITY OWNERSHIP OF CERTAIN BENEFICIAL OWNERS AND MANAGEMENT AND RELATED STOCKHOLDER MATTERS |
Omitted pursuant to General Instruction I(2)(c) to Form 10-K.
113
|
|
|
| ITEM 13. |
|
CERTAIN RELATIONSHIPS AND RELATED TRANSACTIONS AND DIRECTOR INDEPENDENCE |
Omitted pursuant to General Instruction I(2)(c) to Form 10-K. Information regarding related party
transactions is provided in Note 10 to the consolidated financial statements included in “Item 8.
Financial Statements and Supplementary Data”.
|
|
|
| ITEM 14. |
|
PRINCIPAL ACCOUNTANT FEES AND SERVICES |
The Company’s principal accountants are PricewaterhouseCoopers LLP (“PwC”). Aggregate fees billed
and services provided are summarized as follows:
| |
|
|
|
|
|
|
|
|
| |
|
Years Ended December 31, |
|
| (dollars in thousands) |
|
2009 |
|
|
2008 |
|
Audit fees |
|
$ |
1,309.2 |
|
|
$ |
1,385.0 |
|
Audit-related fees |
|
|
643.3 |
|
|
|
664.0 |
|
Tax fees |
|
|
85.4 |
|
|
|
14.3 |
|
All other fees |
|
|
3.1 |
|
|
|
2.5 |
|
|
|
|
|
|
|
|
Total fees billed by principal accountants |
|
$ |
2,041.0 |
|
|
$ |
2,065.8 |
|
|
|
|
|
|
|
|
Audit Fees
Audit fees incurred for the years ended December 31, 2009 and 2008 consisted of fees for
professional services rendered by PwC for the audit of the Company’s annual financial statements
and review of the financial statements included in the Company’s quarterly reports on Form 10-Q and
services that are normally provided by PwC in connection with statutory and regulatory filings or
engagements.
Audit-Related Fees
Audit-related fees incurred for the years ended December 31, 2009 and 2008 consisted of fees for
professional services rendered by PwC for review of management’s assessment of internal control
over financial reporting. Management’s assessment of internal control over financial reporting was
performed in support of Fairfax’s certification under Section 404 of the Sarbanes-Oxley Act of
2002.
Tax Fees
Tax fees incurred for the year ended December 31, 2009 consisted of fees for professional services
rendered by PwC for the review of tax returns and investment related tax services. Tax fees
incurred for the year ended December 31, 2008 consisted of fees for the review of tax returns.
All Other Fees
All other fees incurred for the years ended December 31, 2009 and 2008 were in respect of fees for
online accounting database subscription services.
Audit Committee Pre-Approval Policies and Procedures
All services to be performed for the Company by PwC must be pre-approved by the Company’s audit
committee. The audit committee has delegated the authority to grant such pre-approvals to the
committee chairman, which approvals are then ratified by the full committee at its next regular
meeting.
PART IV
|
|
|
| ITEM 15. |
|
EXHIBITS AND FINANCIAL STATEMENT SCHEDULES |
Financial Statement Schedules
See index to financial statements and related financial statement schedules on page 118.
114
Exhibits
| |
|
|
|
|
|
|
| Exhibit |
|
|
|
|
| Number |
|
Exhibit |
|
Location* |
| |
3.1 |
|
|
Certificate of Incorporation
|
|
Exhibit 3.1 to the Registration
Statement on Form S-4 (No.
333-107722) of the Company filed on
August 7, 2003. |
| |
3.2 |
|
|
Amended and Restated By-Laws
|
|
Exhibit 3.2 to the Registration
Statement on Form S-4 (No.
333-107722) of the Company filed on
August 7, 2003. |
| |
4.1 |
|
|
Indenture between the Company and the Bank
of New York dated as of May 7, 2007
|
|
Exhibit 4.2 to the form 8-K of the
Company filed on May 10, 2007 |
| |
10.1 |
|
|
Investment Agreement among Hamblin Watsa,
Fairfax and North River effective as of
January 8, 2004
|
|
Exhibit 10.1 to the Form 10-K of the
Company for the year ended December
31, 2004, filed on March 7, 2005. |
| |
10.2 |
|
|
Investment Agreement among Hamblin Watsa,
Fairfax and CF Insurance effective as of
January 8, 2004
|
|
Exhibit 10.2 to Amendment No. 3 to
the Registration Statement on Form
S-4 (No. 333-107722) of the Company
filed on February 24, 2004. |
| |
10.3 |
|
|
Investment Agreement among Hamblin Watsa,
Fairfax and Seneca Specialty effective as
of January 1, 2002
|
|
Exhibit 10.3 to the Form 10-K of the
Company for the year ended December
31, 2004, filed on March 7, 2005. |
| |
10.4 |
|
|
Master Repurchase Agreement between North
River and Fairfax effective as of January
8, 2004
|
|
Exhibit 10.4 to Amendment No. 3 to
the Registration Statement on Form
S-4 (No. 333-107722) of the Company
filed on February 24, 2004. |
| |
10.5 |
|
|
Master Repurchase Agreement between CF
Insurance and Fairfax effective as of
January 8, 2004
|
|
Exhibit 10.5 to Amendment No. 3 to
the Registration Statement on Form
S-4 (No. 333-107722) of the Company
filed on February 24, 2004. |
| |
10.6 |
|
|
Investment Management Agreement among
Hamblin Watsa, Fairfax and the Company
effective as of December 21, 2004
|
|
Exhibit 10.6 to the Form 10-K of the
Company for the year ended December
31, 2004, filed on March 7, 2005. |
| |
10.7 |
|
|
Investment Agreement among Hamblin Watsa,
Fairfax and US Fire effective as of October
1, 2002
|
|
Exhibit 10.7 to the Registration
Statement on Form S-4 (No.
333-107722) of the Company filed on
August 7, 2003. |
| |
10.8 |
|
|
Investment Agreement among Hamblin Watsa,
Fairfax and Seneca effective as of January
1, 2002
|
|
Exhibit 10.8 to the Registration
Statement on Form S-4 (No.
333-107722) of the Company filed on
August 7, 2003. |
| |
10.9 |
|
|
Investment Agreement among Hamblin Watsa,
Fairfax and CF Indemnity effective as of
January 1, 2002
|
|
Exhibit 10.9 to the Registration
Statement on Form S-4 (No.
333-107722) of the Company filed on
August 7, 2003. |
| |
10.10 |
|
|
Investment Agreement among Hamblin Watsa,
Fairfax and CF Specialty effective as of
January 1, 2002
|
|
Exhibit 10.10 to the Registration
Statement on Form S-4 (No.
333-107722) of the Company filed on
August 7, 2003. |
| |
10.11 |
|
|
Intentionally left blank |
|
|
| |
10.13 |
|
|
Intercompany Tax Allocation Agreement
between Fairfax Inc. and US Fire and CF
Indemnity and Seneca effective as of
December 15, 2000
|
|
Exhibit 10.13 to the Registration
Statement on Form S-4 (No.
333-107722) of the Company filed on
August 7, 2003. |
| |
10.15 |
|
|
Master Repurchase Agreement between CF
Indemnity and Fairfax effective as of July
1, 2000
|
|
Exhibit 10.15 to the Registration
Statement on Form S-4 (No.
333-107722) of the Company filed on
August 7, 2003. |
| |
10.16 |
|
|
Master Repurchase Agreement between US Fire
and Fairfax effective as of July 1, 2000
|
|
Exhibit 10.16 to the Registration
Statement on Form S-4 (No.
333-107722) of the Company filed on
August 7, 2003. |
| |
10.23 |
|
|
Put Agreement between US Fire, ORC Re
Limited and Fairfax effective as of June
28, 2002
|
|
Exhibit 10.23 to the Registration
Statement on Form S-4 (No.
333-107722) of the Company filed on
August 7, 2003. |
| |
10.25 |
|
|
Intentionally left blank |
|
|
| |
10.27 |
|
|
Intentionally left blank |
|
|
| |
10.28 |
|
|
Intentionally left blank |
|
|
| |
10.30 |
|
|
Blended Aggregate Stop Loss Reinsurance
Agreement between the Company and ORC Re
Limited effective as of January 1, 2000
|
|
Exhibit 10.30 to the Registration
Statement on Form S-4 (No.
333-107722) of the Company filed on
August 7, 2003. |
| |
10.37 |
|
|
Amendment Number 1 to the Investment
Agreement among Hamblin Watsa, Fairfax and
CF Specialty effective as of January 1,
2005
|
|
Exhibit 10.37 to the Form 10-Q of the
Company for the period ended
September 30, 2005, filed on October
28, 2005. |
115
| |
|
|
|
|
|
|
| Exhibit |
|
|
|
|
| Number |
|
Exhibit |
|
Location* |
| |
10.38 |
|
|
Amendment Number 1 to the Investment
Agreement among Hamblin Watsa, Fairfax and
Seneca Specialty effective as of January 1,
2005
|
|
Exhibit 10.38 to the Form 10-Q of the
Company for the period ended
September 30, 2005, filed on October
28, 2005. |
| |
10.40 |
|
|
Amendment Number 1 to the Investment
Agreement among Hamblin Watsa, Fairfax and
North River effective as of January 1, 2005
|
|
Exhibit 10.40 to the Form 10-Q of the
Company for the period ended March
31, 2007, filed on May 3, 2007. |
| |
10.41 |
|
|
Amendment Number 1 to the Investment
Agreement among Hamblin Watsa, Fairfax and
CF Insurance Company effective as of
January 1, 2005
|
|
Exhibit 10.41 to the Form 10-Q of the
Company for the period ended March
31, 2007, filed on May 3, 2007. |
| |
10.42 |
|
|
Amendment Number 1 to the Investment
Agreement among Hamblin Watsa, Fairfax and
US Fire Company effective as of April 1,
2007
|
|
Exhibit 10.42 to the Form 10-Q of the
Company for the period ended June 30,
2007, filed on August 3, 2007. |
| |
10.43 |
|
|
Amendment Number 1 to the Investment
Agreement among Hamblin Watsa, Fairfax and
CF Indemnity effective as of April 1, 2007
|
|
Exhibit 10.43 to the Form 10-Q of the
Company for the period ended June 30,
2007, filed on August 3, 2007. |
| |
10.45 |
|
|
Fairfax Inc. and Crum & Forster Holdings
Corp. Inter-Company Tax Allocation
Agreement effective as of January 1, 2007
|
|
Exhibit 10.45 to the Form 10-Q of the
Company for the period ended
September 30, 2007, filed on November
1, 2007. |
| |
10.46 |
|
|
Amendment Number 1 to the Investment
Agreement among Hamblin Watsa, Fairfax and
Seneca effective as of January 1, 2005.
|
|
Exhibit 10.46 to the Form 10-K of the
Company for the year ended December
31, 2008, filed on February 27, 2009. |
| |
10.47 |
|
|
Intercompany Tax Allocation Agreement
effective as of January 1, 2009 among Crum
& Forster Holdings Corp., US Fire, North
River, CF Insurance Company, CF Indemnity,
CF Specialty, Excelsior Claims
Administrators, Inc., Seneca Risk Services,
Inc., Seneca Specialty, and Fairmont
Specialty Insurance Managers, Inc.
|
|
Filed herewith |
| |
12.1 |
|
|
Statement Regarding Calculation of Ratio of
Consolidated Earnings to Consolidated Fixed
Charges
|
|
Filed herewith. |
| |
14.1 |
|
|
Code of Ethics for Senior Financial Officers
|
|
Exhibit 14.1 to the Form 10-K of the
Company for the year ended December
31, 2004, filed on March 7, 2005. |
| |
24.1 |
|
|
Power of Attorney
|
|
Included on the signature page hereof. |
| |
31.1 |
|
|
Certification of President and Chief
Executive Officer pursuant to Section 302
of the Sarbanes-Oxley Act of 2002
|
|
Filed herewith. |
| |
31.2 |
|
|
Certification of Executive Vice President,
Chief Financial Officer and Treasurer
pursuant to Section 302 of the
Sarbanes-Oxley Act of 2002
|
|
Filed herewith. |
| |
32.1 |
|
|
Certification of President and Chief
Executive Officer pursuant to Section 906
of the Sarbanes-Oxley Act of 2002
|
|
Filed herewith. |
| |
32.2 |
|
|
Certification of Executive Vice President,
Chief Financial Officer and Treasurer
pursuant to Section 906 of the
Sarbanes-Oxley Act of 2002
|
|
Filed herewith. |
| |
|
|
| * |
|
Exhibits not filed herewith are incorporated herein by reference to documents
previously filed with the Securities and Exchange Commission. |
116
SIGNATURES
Pursuant to the requirements of Section 13 or 15(d) of the Securities Exchange Act of 1934, the
registrant has duly caused this report to be signed on its behalf by the undersigned, thereunto
duly authorized.
| |
|
|
|
|
| |
CRUM & FORSTER HOLDINGS CORP.
(Registrant)
|
|
| Date: February 26, 2010 |
By: |
/s/ Douglas M. Libby
|
|
| |
|
Douglas M. Libby |
|
| |
|
President, Chief Executive Officer and Director |
|
| |
|
|
| Date: February 26, 2010 |
By: |
/s/ Mary Jane Robertson
|
|
| |
|
Mary Jane Robertson |
|
| |
|
Executive Vice President, Chief Financial
Officer,
Treasurer and Director |
|
Power of Attorney
Know all persons by these presents, that each person whose signature appears below constitutes and
appoints Douglas M. Libby and Mary Jane Robertson, and each of them separately, his or her true and
lawful attorney-in-fact, with full power of substitution and re-substitution, to sign in his or her
name, place and stead, in any and all capacities, to do any and all things and execute any and all
instruments that such attorney may deem necessary or advisable under the Securities Exchange Act of
1934, as amended, and any rules, regulations and requirements of the U.S. Securities and Exchange
Commission in connection with this annual report on Form 10-K and any and all amendments hereto, as
fully for all intents and purposes as he or she might or could do in person, and hereby ratifies
and confirms all said attorneys-in-fact and agents, each acting alone, and his or her substitute or
substitutes, may lawfully do or cause to be done by virtue hereof.
Pursuant to the requirements of the Securities Exchange Act of 1934, this report has been signed
below by the following persons on behalf of the registrant and in the capacities and on the dates
indicated.
| |
|
|
|
|
|
| Signature |
|
Title |
|
Date |
| |
|
|
|
|
|
| By: |
/s/ V. Prem Watsa
V. Prem Watsa
|
|
Chairman of the Board
|
|
February 26, 2010 |
| |
|
|
|
|
|
| By: |
/s/ Douglas M. Libby
Douglas M. Libby
|
|
President, Chief Executive Officer and Director
|
|
February 26, 2010 |
| |
|
|
|
|
|
| By: |
/s/ Mary Jane Robertson
Mary Jane Robertson
|
|
Executive Vice President, Chief Financial
Officer,
Treasurer and Director
|
|
February 26, 2010 |
| |
|
|
|
|
|
| By: |
/s/ Alan D. Horn
Alan D. Horn
|
|
Director
|
|
February 26, 2010 |
| |
|
|
|
|
|
| By: |
/s/ Anthony F. Griffiths
Anthony F. Griffiths
|
|
Director
|
|
February 26, 2010 |
| |
|
|
|
|
|
| By: |
/s/ Robert J. Gunn
Robert J. Gunn
|
|
Director
|
|
February 26, 2010 |
| |
|
|
|
|
|
| By: |
/s/ Brandon W. Sweitzer
Brandon W. Sweitzer
|
|
Director
|
|
February 26, 2010 |
117
INDEX TO FINANCIAL STATEMENTS AND RELATED FINANCIAL STATEMENT SCHEDULES
| |
|
|
|
|
| |
|
Page |
|
| |
|
Number |
|
|
|
|
|
|
|
|
|
68 |
|
|
|
|
|
|
Financial Statement Schedules |
|
|
|
|
|
|
|
|
|
|
|
|
119 |
|
|
|
|
|
|
|
|
|
120 |
|
|
|
|
|
|
|
|
|
121 |
|
|
|
|
|
|
|
|
|
122 |
|
|
|
|
|
|
|
|
|
123 |
|
|
|
|
|
|
|
|
|
124 |
|
|
|
|
|
|
Schedule III—Supplementary Insurance Information |
|
|
* |
|
|
|
|
|
|
Schedule IV—Reinsurance |
|
|
* |
|
|
|
|
|
|
|
|
|
125 |
|
|
|
|
|
|
Schedule VI—Supplementary Insurance Information |
|
|
* |
|
| |
|
|
| * |
|
Schedule omitted as required information is contained within the consolidated financial
statements included in “Item 8. Financial Statements and Supplementary Data”. |
118
REPORT OF INDEPENDENT REGISTERED PUBLIC ACCOUNTING FIRM
ON FINANCIAL STATEMENT SCHEDULES
To the Board of Directors and Shareholder of Crum & Forster Holdings Corp. and Subsidiaries:
Our audits of the consolidated financial statements referred to in our report dated February 26,
2010 appearing in this 2009 annual report on Form 10-K of Crum & Forster Holdings Corp. and
Subsidiaries also included an audit of the financial statement schedules listed in Item 15 of this
Form 10-K. In our opinion, these financial statement schedules present fairly, in all material
respects, the information set forth therein when read in conjunction with the related consolidated
financial statements.
PricewaterhouseCoopers LLP
New York, New York
February 26, 2010
119
SCHEDULE I
CRUM & FORSTER HOLDINGS CORP.
SUMMARY OF INVESTMENTS OTHER THAN INVESTMENTS IN RELATED PARTIES
(Dollars in thousands)
| |
|
|
|
|
|
|
|
|
|
|
|
|
| |
|
At December 31, 2009 |
|
| |
|
Cost or |
|
|
|
|
|
|
Amount at which |
|
| |
|
Amortized |
|
|
Estimated |
|
|
Shown in the |
|
| |
|
Cost |
|
|
Fair Value1 |
|
|
Balance Sheet |
|
Fixed income securities: |
|
|
|
|
|
|
|
|
|
|
|
|
Available-for-sale: |
|
|
|
|
|
|
|
|
|
|
|
|
United States government and government agencies
and authorities |
|
$ |
81,282 |
|
|
$ |
87,765 |
|
|
$ |
87,765 |
|
States, municipalities and political subdivisions |
|
|
1,185,380 |
|
|
|
1,328,964 |
|
|
|
1,328,964 |
|
Other |
|
|
80,483 |
|
|
|
102,817 |
|
|
|
102,817 |
|
|
|
|
|
|
|
|
|
|
|
Total fixed income securities available-for-sale |
|
|
1,347,145 |
|
|
|
1,519,546 |
|
|
|
1,519,546 |
|
Fixed income securities, held-for-trading: |
|
|
321,359 |
|
|
|
321,359 |
|
|
|
321,359 |
|
|
|
|
|
|
|
|
|
|
|
Total fixed income securities |
|
|
1,668,504 |
|
|
|
1,840,905 |
|
|
|
1,840,905 |
|
|
|
|
|
|
|
|
|
|
|
|
|
|
|
|
|
|
|
|
|
|
|
|
Equity securities — common stocks |
|
|
1,007,805 |
|
|
|
1,214,205 |
|
|
|
1,284,102 |
|
|
|
|
|
|
|
|
|
|
|
Investments at equity |
|
|
55,020 |
|
|
|
55,020 |
|
|
|
167,331 |
|
|
|
|
|
|
|
|
|
|
|
Derivatives and other invested assets |
|
|
47,517 |
|
|
|
47,517 |
|
|
|
387,902 |
|
|
|
|
|
|
|
|
|
|
|
Short term investments |
|
|
68,211 |
|
|
|
68,211 |
|
|
|
68,211 |
|
|
|
|
|
|
|
|
|
|
|
Total investments |
|
$ |
2,847,057 |
|
|
$ |
3,225,858 |
|
|
$ |
3,748,451 |
|
|
|
|
|
|
|
|
|
|
|
| |
|
|
| 1 |
|
Excludes investments in related parties at fair value of $522,593 at December 31,
2009. |
120
SCHEDULE II
CRUM & FORSTER HOLDINGS CORP. (PARENT COMPANY ONLY)
CONDENSED FINANCIAL INFORMATION OF CRUM & FORSTER HOLDINGS CORP.
BALANCE SHEETS
(Dollars in thousands)
| |
|
|
|
|
|
|
|
|
| |
|
At December 31, |
|
| |
|
2009 |
|
|
2008 |
|
|
|
|
|
|
|
|
|
|
ASSETS |
|
|
|
|
|
|
|
|
Cash and cash equivalents |
|
$ |
2,461 |
|
|
$ |
3,123 |
|
Short-term investments at cost, which approximates fair value |
|
|
— |
|
|
|
5,289 |
|
Investments in and advances to/from consolidated subsidiaries |
|
|
1,834,581 |
|
|
|
1,485,189 |
|
Current income taxes |
|
|
928 |
|
|
|
3,607 |
|
Other assets |
|
|
4,660 |
|
|
|
5,260 |
|
|
|
|
|
|
|
|
Total assets |
|
$ |
1,842,630 |
|
|
$ |
1,502,468 |
|
|
|
|
|
|
|
|
LIABILITIES |
|
|
|
|
|
|
|
|
Accounts payable and other liabilities |
|
$ |
7,423 |
|
|
$ |
19,612 |
|
Deferred income taxes |
|
|
5,366 |
|
|
|
5,922 |
|
Long-term debt |
|
|
312,114 |
|
|
|
310,502 |
|
|
|
|
|
|
|
|
Total liabilities |
|
|
324,903 |
|
|
|
336,036 |
|
|
|
|
|
|
|
|
SHAREHOLDER’S EQUITY |
|
|
|
|
|
|
|
|
Common stock, $0.01 par value; 1,000 shares authorized; 100 issued and outstanding |
|
|
— |
|
|
|
— |
|
Additional paid-in capital |
|
|
740,993 |
|
|
|
740,993 |
|
Accumulated other comprehensive income (loss), net of tax |
|
|
256,859 |
|
|
|
(7,455 |
) |
Retained earnings |
|
|
519,875 |
|
|
|
432,894 |
|
|
|
|
|
|
|
|
Total shareholder’s equity |
|
|
1,517,727 |
|
|
|
1,166,432 |
|
|
|
|
|
|
|
|
Total liabilities and shareholder’s equity |
|
$ |
1,842,630 |
|
|
$ |
1,502,468 |
|
|
|
|
|
|
|
|
The condensed financial statements should be read in conjunction with the consolidated financial statements and notes thereto.
121
SCHEDULE II
CRUM & FORSTER HOLDINGS CORP. (PARENT COMPANY ONLY)
CONDENSED FINANCIAL INFORMATION OF CRUM & FORSTER HOLDINGS CORP.
STATEMENTS OF INCOME
(Dollars in thousands)
| |
|
|
|
|
|
|
|
|
|
|
|
|
| |
|
Years Ended December 31, |
|
| |
|
2009 |
|
|
2008 |
|
|
2007 |
|
REVENUES |
|
|
|
|
|
|
|
|
|
|
|
|
Equity in earnings of subsidiaries |
|
$ |
222,978 |
|
|
$ |
357,610 |
|
|
$ |
326,962 |
|
Investment (loss) income |
|
|
(80 |
) |
|
|
310 |
|
|
|
1,592 |
|
Realized investment gains |
|
|
— |
|
|
|
— |
|
|
|
8,612 |
|
|
|
|
|
|
|
|
|
|
|
Total revenues |
|
|
222,898 |
|
|
|
357,920 |
|
|
|
337,166 |
|
|
|
|
|
|
|
|
|
|
|
EXPENSES |
|
|
|
|
|
|
|
|
|
|
|
|
Interest expense |
|
|
27,818 |
|
|
|
27,885 |
|
|
|
29,850 |
|
Costs related to early retirement of debt |
|
|
— |
|
|
|
392 |
|
|
|
21,187 |
|
Other expense, net |
|
|
4,406 |
|
|
|
10,199 |
|
|
|
11,135 |
|
|
|
|
|
|
|
|
|
|
|
Total expenses |
|
|
32,224 |
|
|
|
38,476 |
|
|
|
62,172 |
|
|
|
|
|
|
|
|
|
|
|
Income before income taxes |
|
|
190,674 |
|
|
|
319,444 |
|
|
|
274,994 |
|
Income tax benefit |
|
|
(11,307 |
) |
|
|
(13,362 |
) |
|
|
(18,188 |
) |
|
|
|
|
|
|
|
|
|
|
NET INCOME |
|
$ |
201,981 |
|
|
$ |
332,806 |
|
|
$ |
293,182 |
|
|
|
|
|
|
|
|
|
|
|
The condensed financial statements should be read in conjunction with the consolidated financial statements and notes thereto.
122
SCHEDULE II
CRUM & FORSTER HOLDINGS CORP. (PARENT COMPANY ONLY)
CONDENSED FINANCIAL INFORMATION OF CRUM & FORSTER HOLDINGS CORP.
STATEMENTS OF CASH FLOWS
(Dollars in thousands)
| |
|
|
|
|
|
|
|
|
|
|
|
|
| |
|
Years Ended December 31, |
|
| |
|
2009 |
|
|
2008 |
|
|
2007 |
|
OPERATING ACTIVITIES |
|
|
|
|
|
|
|
|
|
|
|
|
Net income |
|
$ |
201,981 |
|
|
$ |
332,806 |
|
|
$ |
293,182 |
|
Adjustments to reconcile net income to net cash from operating activities: |
|
|
|
|
|
|
|
|
|
|
|
|
Equity in earnings of subsidiaries, net of dividends and other payments
to/receipts from subsidiaries1 |
|
|
(84,578 |
) |
|
|
(5,108 |
) |
|
|
(213,135 |
) |
Realized investment gains |
|
|
— |
|
|
|
— |
|
|
|
(8,612 |
) |
Amortization and accretion |
|
|
2,243 |
|
|
|
2,108 |
|
|
|
1,958 |
|
Deferred income tax expense |
|
|
— |
|
|
|
— |
|
|
|
66,321 |
|
Other non-cash net income adjustments |
|
|
— |
|
|
|
170 |
|
|
|
8,259 |
|
Changes in: |
|
|
|
|
|
|
|
|
|
|
|
|
Other assets |
|
|
2,159 |
|
|
|
1,495 |
|
|
|
(2,129 |
) |
Accounts payable and other liabilities |
|
|
(12,756 |
) |
|
|
4,200 |
|
|
|
(32,211 |
) |
|
|
|
|
|
|
|
|
|
|
Net cash provided by operating activities |
|
|
109,049 |
|
|
|
335,671 |
|
|
|
113,633 |
|
|
|
|
|
|
|
|
|
|
|
INVESTING ACTIVITIES |
|
|
|
|
|
|
|
|
|
|
|
|
Purchases of short-term investments |
|
|
(5,580 |
) |
|
|
(30,701 |
) |
|
|
(9,652 |
) |
Proceeds from sales of short-term investments |
|
|
10,869 |
|
|
|
35,064 |
|
|
|
— |
|
Purchases of other invested assets |
|
|
— |
|
|
|
— |
|
|
|
(13,143 |
) |
Proceeds from sales of other invested assets |
|
|
— |
|
|
|
— |
|
|
|
28,510 |
|
|
|
|
|
|
|
|
|
|
|
Net cash provided by (used in) investing activities |
|
|
5,289 |
|
|
|
4,363 |
|
|
|
5,715 |
|
|
|
|
|
|
|
|
|
|
|
FINANCING ACTIVITIES |
|
|
|
|
|
|
|
|
|
|
|
|
Dividends paid to shareholder |
|
|
(115,000 |
) |
|
|
(335,202 |
) |
|
|
(128,825 |
) |
Repayment of 10 3/8% senior notes |
|
|
— |
|
|
|
(4,270 |
) |
|
|
(295,730 |
) |
Issuance of 7 3/4% senior notes |
|
|
— |
|
|
|
— |
|
|
|
330,000 |
|
New debt issuance costs |
|
|
— |
|
|
|
— |
|
|
|
(23,912 |
) |
|
|
|
|
|
|
|
|
|
|
Net cash used in financing activities |
|
|
(115,000 |
) |
|
|
(339,472 |
) |
|
|
(118,467 |
) |
|
|
|
|
|
|
|
|
|
|
Net change in cash and cash equivalents |
|
|
(662 |
) |
|
|
562 |
|
|
|
881 |
|
Cash and cash equivalents, beginning of year |
|
|
3,123 |
|
|
|
2,561 |
|
|
|
1,680 |
|
|
|
|
|
|
|
|
|
|
|
Cash and cash equivalents, end of year |
|
$ |
2,461 |
|
|
$ |
3,123 |
|
|
$ |
2,561 |
|
|
|
|
|
|
|
|
|
|
|
SUPPLEMENTAL CASH FLOW INFORMATION |
|
|
|
|
|
|
|
|
|
|
|
|
Cash paid for interest |
|
$ |
25,575 |
|
|
$ |
25,797 |
|
|
$ |
24,907 |
|
|
|
|
|
|
|
|
|
|
|
Cash refund received for income taxes |
|
$ |
(13,418 |
) |
|
$ |
(13,994 |
) |
|
$ |
(40,487 |
) |
|
|
|
|
|
|
|
|
|
|
SUPPLEMENTAL NON-CASH INVESTING AND FINANCING ACTIVITIES |
|
|
|
|
|
|
|
|
|
|
|
|
Fixed income securities transferred to parent as payment for income taxes |
|
$ |
54,008 |
|
|
$ |
— |
|
|
$ |
— |
|
|
|
|
|
|
|
|
|
|
|
In-kind dividend payment to parent in the form of fixed income securities |
|
$ |
— |
|
|
$ |
158,798 |
|
|
$ |
— |
|
|
|
|
|
|
|
|
|
|
|
Note received from parent in partial settlement of the Company’s tax net operating losses |
|
$ |
— |
|
|
$ |
— |
|
|
$ |
41,882 |
|
|
|
|
|
|
|
|
|
|
|
Note received from parent in settlement of the sale of a common stock investment |
|
$ |
— |
|
|
$ |
— |
|
|
$ |
12,993 |
|
|
|
|
|
|
|
|
|
|
|
In-kind dividend payment to parent representing cancellation of the aforementioned notes
received from parent in 2007 |
|
$ |
— |
|
|
$ |
— |
|
|
$ |
54,875 |
|
|
|
|
|
|
|
|
|
|
|
| |
|
|
| 1 |
|
Includes cash dividends received from subsidiaries of $138,400, $352,502 and
$129,195 in 2009, 2008 and 2007. |
The condensed financial statements should be read in conjunction with the consolidated financial statements and notes thereto.
123
SCHEDULE II
CRUM & FORSTER HOLDINGS CORP. (PARENT COMPANY ONLY)
NOTES TO CONDENSED FINANCIAL STATEMENTS OF CRUM & FORSTER HOLDINGS CORP.
(Dollars in thousands)
| 1. |
|
The accompanying condensed financial statements should be read in conjunction with the notes
to consolidated financial statements of Crum & Forster Holdings Corp. and subsidiaries
included in “Item 8. Financial Statements and Supplementary Data”. |
| 2. |
|
The Company’s ability to satisfy its corporate obligations is primarily dependent on the
dividend paying capacity of its subsidiaries. In 2009, 2008 and 2007, the insurance
subsidiaries paid dividends totaling $138,400, $511,300 and $138,200, respectively, to the
Company, including an extraordinary dividend of $350,000 in 2008, for which the Company
received prior regulatory approval. The maximum dividends that can be paid by the insurance
companies to the Company in 2010, without prior regulatory approval, are $163,776. |
124
SCHEDULE V
CRUM & FORSTER HOLDINGS CORP.
VALUATION AND QUALIFYING ACCOUNTS
(Dollars in thousands)
| |
|
|
|
|
|
|
|
|
|
|
|
|
|
|
|
|
|
|
|
|
|
|
| |
|
|
|
|
|
|
|
Charges |
|
|
|
|
|
|
|
|
|
|
|
| |
|
|
|
Balance at |
|
|
to Costs |
|
|
Charged to |
|
|
|
|
|
|
Balance at |
|
| |
|
|
|
Beginning of |
|
|
and |
|
|
Other |
|
|
|
|
|
|
End of |
|
| Year |
|
Description |
|
Year |
|
|
Expenses |
|
|
Accounts |
|
|
Deductions |
|
|
Year |
|
|
|
|
|
|
|
|
|
|
|
|
|
|
|
|
|
|
|
|
|
|
|
|
2009 |
|
Reserve for uncollectible premiums |
|
$ |
20,191 |
|
|
|
(496 |
)1 |
|
|
(1,327 |
)2 |
|
|
(868 |
)3 |
|
$ |
17,500 |
|
2008 |
|
Reserve for uncollectible premiums |
|
$ |
22,535 |
|
|
|
— |
|
|
|
(100 |
)2 |
|
|
(2,244 |
)3 |
|
$ |
20,191 |
|
2007 |
|
Reserve for uncollectible premiums |
|
$ |
25,331 |
|
|
|
— |
|
|
|
(1,000 |
)2 |
|
|
(1,796 |
)3 |
|
$ |
22,535 |
|
|
|
|
|
|
|
|
|
|
|
|
|
|
|
|
|
|
|
|
|
|
|
|
2009 |
|
Reserve for uncollectible reinsurance |
|
$ |
55,999 |
|
|
|
2,000 |
4 |
|
|
— |
|
|
|
(3,771 |
)5 |
|
$ |
54,228 |
|
2008 |
|
Reserve for uncollectible reinsurance |
|
$ |
50,021 |
|
|
|
7,700 |
4 |
|
|
— |
|
|
|
(1,722 |
)5 |
|
$ |
55,999 |
|
2007 |
|
Reserve for uncollectible reinsurance |
|
$ |
42,777 |
|
|
|
8,000 |
4 |
|
|
— |
|
|
|
(756 |
)5 |
|
$ |
50,021 |
|
|
|
|
|
|
|
|
|
|
|
|
|
|
|
|
|
|
|
|
|
|
|
|
2009 |
|
Reserve for uncollectible loss deductibles |
|
$ |
8,588 |
|
|
|
854 |
6 |
|
|
— |
|
|
|
(848 |
)7 |
|
$ |
8,594 |
|
2008 |
|
Reserve for uncollectible loss deductibles |
|
$ |
12,780 |
|
|
|
(4,192 |
)6 |
|
|
— |
|
|
|
— |
|
|
$ |
8,588 |
|
2007 |
|
Reserve for uncollectible loss deductibles |
|
$ |
8,811 |
|
|
|
4,008 |
6 |
|
|
— |
|
|
|
(39 |
)7 |
|
$ |
12,780 |
|
| |
|
|
| 1 |
|
Represents decreases to the reserve for uncollectible premiums charged against
operating expenses. |
| |
| 2 |
|
Represents decreases to the reserve for uncollectible premiums charged against
premiums earned. |
| |
| 3 |
|
Represents uncollectible premiums written off to the reserve. |
| |
| 4 |
|
Represents increases to the reserve for uncollectible reinsurance charged to losses
and LAE. |
| |
| 5 |
|
Represents uncollectible reinsurance recoverable balances written off to the reserve. |
| |
| 6 |
|
Represents increases (decreases) to the reserve for uncollectible loss deductibles
charged to losses and LAE. |
| |
| 7 |
|
Represents uncollectible loss deductibles written off to the reserve. |
125