Attached files
| file | filename |
|---|---|
| EX-23.1 - EXHIBIT 23.1 - Sonus, Inc. | a2196715zex-23_1.htm |
| EX-32.1 - EXHIBIT 32.1 - Sonus, Inc. | a2196715zex-32_1.htm |
| EX-32.2 - EXHIBIT 32.2 - Sonus, Inc. | a2196715zex-32_2.htm |
| EX-31.1 - EXHIBIT 31.1 - Sonus, Inc. | a2196715zex-31_1.htm |
| EX-31.2 - EXHIBIT 31.2 - Sonus, Inc. | a2196715zex-31_2.htm |
| EX-21.1 - EXHIBIT 21.1 - Sonus, Inc. | a2196715zex-21_1.htm |
| EX-10.20 - EXHIBIT 10.20 - Sonus, Inc. | a2196715zex-10_20.htm |
| EX-10.21 - EXHIBIT 10.21 - Sonus, Inc. | a2196715zex-10_21.htm |
| EX-10.22 - EXHIBIT 10.22 - Sonus, Inc. | a2196715zex-10_22.htm |
UNITED STATES
SECURITIES AND EXCHANGE COMMISSION
WASHINGTON, D.C. 20549
FORM 10-K
ý |
ANNUAL REPORT PURSUANT TO SECTION 13 OR 15(d) OF THE SECURITIES EXCHANGE ACT OF 1934 |
|
For the fiscal year ended December 31, 2009 |
||
o |
TRANSITION REPORT PURSUANT TO SECTION 13 OR 15(d) OF THE SECURITIES EXCHANGE ACT OF 1934 |
|
Commission File Number 000-34115
SONUS NETWORKS, INC.
(Exact name of Registrant as specified in its charter)
| DELAWARE (State or other jurisdiction of incorporation or organization) |
04-3387074 (I.R.S. Employer Identification No.) |
7 Technology Park Drive, Westford, Massachusetts 01886
(Address of principal executive offices, including zip code)
(978) 614-8100
(Registrant's telephone number, including area code)
Securities registered pursuant to Section 12(b) of the Act:
| Title of each class | Name of each exchange on which registered | |
|---|---|---|
| Common Stock, par value $0.001 | The NASDAQ Global Select Market |
Securities registered pursuant to Section 12(g) of the Act: None
Indicate by check mark if the registrant is a well-known seasoned issuer, as defined in Rule 405 of the Securities Act. Yes o No ý
Indicate by check mark if the registrant is not required to file reports pursuant to Section 13 or Section 15(d) of the Act. Yes o No ý
Indicate by check mark whether the registrant (1) has filed all reports required to be filed by Section 13 or 15(d) of the Securities Exchange Act of 1934 during the preceding 12 months (or for such shorter period that the Registrant was required to file such reports), and (2) has been subject to such filing requirements for the past 90 days. Yes ý No o
Indicate by check mark whether the registrant has submitted electronically and posted on its corporate Web site, if any, every Interactive Data File required to be submitted and posted pursuant to Rule 405 of Regulation S-T (§232.405 of this chapter) during the preceding 12 months (or for such shorter period that the registrant was required to submit and post such files). Yes o No o
Indicate by check mark if disclosure of delinquent filers pursuant to Item 405 of Regulation S-K (§229.405 of this chapter) is not contained herein, and will not be contained, to the best of the registrant's knowledge, in definitive proxy or information statements incorporated by reference in Part III of this Form 10-K or any amendment to this Form 10-K. o
Indicate by check mark whether the registrant is a large accelerated filer, an accelerated filer, a non-accelerated filer or a smaller reporting company. See definition of "large accelerated filer," "accelerated filer" and "smaller reporting company" in Rule 12b-2 of the Exchange Act. (Check one):
| Large accelerated filer o | Accelerated filer ý | Non-accelerated filer o (Do not check if a smaller reporting company) |
Smaller reporting company o |
Indicate by check mark whether the registrant is a shell company (as defined in Rule 12b-2 of the Exchange Act). Yes o No ý
The aggregate market value of the common stock held by non-affiliates of the Registrant was approximately $274,438,000 based on the closing price for the Common Stock on the NASDAQ Global Select Market on June 30, 2009. As of February 17, 2010, there were 274,640,560 shares of common stock, $0.001 par value, outstanding.
DOCUMENTS INCORPORATED BY REFERENCE
Portions of the definitive Proxy Statement to be delivered to stockholders in connection with the 2010 Annual Meeting of Stockholders are incorporated by reference into Part III of this report.
SONUS NETWORKS, INC.
FORM 10-K
YEAR ENDED DECEMBER 31, 2009
TABLE OF CONTENTS
This Annual Report on Form 10-K contains forward-looking statements. All statements other than statements of historical facts contained in this Annual Report on Form 10-K, including statements regarding our future results of operations and financial position, business strategy, plans and objectives of management for future operations, and plans for product development and manufacturing are forward-looking statements. These statements involve known and unknown risks, uncertainties and other factors that may cause our actual results, performance or achievements to be materially different from any future results, performance or achievements expressed or implied by the forward-looking statements. We discuss certain of these risks in greater detail in the "Risk Factors" section and elsewhere in this Annual Report on Form 10-K. Also, these forward-looking statements speak only as of the date of this Annual Report on Form 10-K, and we have no plans to update our forward-looking statements to reflect events or circumstances occurring after the date of this Annual Report. We caution readers not to place undue reliance upon any such forward-looking statements.
References in this Annual Report on Form 10-K to "Sonus," "Sonus Networks," "Company," "we," "us" and "our" are to Sonus Networks, Inc. and its subsidiaries, collectively, unless the context requires otherwise.
Overview
Sonus Networks is a leading provider of voice, video and data infrastructure solutions for wireline and wireless telephone service providers. Our infrastructure solutions allow such wireline and wireless operators to build converged voice over Internet Protocol ("VoIP") networks. Our products include carrier-class infrastructure equipment and software that enable voice services to be delivered over Internet Protocol ("IP") networks. IP networks, which transport traffic in "packets," can efficiently move disparate traffic types (such as voice, video and data) across a common infrastructure. Our products also interoperate with network operators' existing telephone infrastructure, allowing them to preserve the investment in their current networks.
Sonus Networks' architectural model presents a significantly more flexible, cost-effective and efficient means of providing a variety of communications services, especially as compared to legacy circuit-based networks that were primarily designed to deliver telephone calls. Our products offer a powerful and open platform for network operators to increase their revenues through the creation and delivery of new and innovative communications services. Our products are built on the same distributed, IP-based principles embraced by the IP Multimedia Subsystem ("IMS") architecture, as defined by the Third Generation Partnership Project ("3GPP"). This IMS architecture is being accepted by network operators globally as the common approach for building converged voice, data, wireline and wireless networks. Since the IMS architecture is based primarily on IP packets and the Session Initiation Protocol ("SIP"), which has been the foundation of our products since our formation, Sonus Networks is well positioned to offer an intuitive evolution from a distributed-softswitch architecture to IMS, with limited impact on existing Sonus equipment or services.
We have been recognized by independent market research firms as a worldwide market share leader in several key segments of the carrier-class packet voice infrastructure equipment market. Announced customers include many of the world's major service providers including: AT&T (including AT&T Wireless, and AT&T "Classic"), Belgacom ICS, BT Group, Carphone Warehouse, France Telecom, Global Crossing, KDDI, Level 3, Qwest, Softbank Corporation, T-Systems Business Services (a division of Deutsche Telekom Group), Tata Communications, Verizon and XO Communications. In a 2008 independent study performed by Infonetics Research, in which service providers were asked to rate Alcatel Lucent, Cisco, Ericsson, Huawei, Nokia Siemens, Nortel Networks and Sonus Networks, we
1
received the highest ratings for technology, product roadmap, security, management and price-to-performance.
We sell our products principally through a direct sales force in the United States, Europe, the Middle East, Africa, Japan and Asia-Pacific. We continue to expand our presence into new geographies and markets through our relationships with Motorola and regional channel partners.
Our target customers comprise both traditional and emerging communications service providers, including long-distance carriers, local exchange carriers, Internet service providers, wireless operators, cable operators, international telephone companies and carriers that provide services to other carriers. We also collaborate with our customers to identify and develop new advanced services and applications that they may offer to their customers.
Industry Background
The public telephone network is an integral part of our everyday lives. For most of its history, the global telephone industry was heavily regulated, which slowed the evolution of its underlying switching and infrastructure technologies and limited innovation in service offerings and pricing of telephone services. Two global forces—deregulation and expansion of the Internet—have revolutionized the public telephone network worldwide. The expansion in wireless voice and data services has further blurred many of the traditional telephone service models.
Deregulation of the telephone industry in the United States accelerated with the passage of the Telecommunications Act of 1996. The barriers that once restricted service providers to a specific geography or service offering, such as local or long distance services, have been largely eliminated. The migration to IP-based last mile technologies reduces the capital investments required to provide services over large geographies. The opportunity created by accessibility to the telephone services market has encouraged new participants to enter this market and incumbent service providers to expand into additional markets, both domestic and international.
Competition between new providers and incumbents is driving down service prices. With limited ability to reduce the cost structure of the public telephone network, profit margins for traditional telephone services have declined. In response, service providers are seeking new, creative and differentiated services as a means to increase revenues and as an opportunity to reduce costs. The first wave of service differentiation, typified by triple-play bundling of voice, internet and television, is commonplace and many market segments are seeking more advanced solutions in broadband wireline-wireless converged services, video transport and services, as well as other innovative business solutions for our customers.
Simultaneously, the rapid adoption of the Internet and broadband connectivity, followed by dramatic development in wireless telephone technology to deliver to telephones the same information that is delivered to computers, has driven the dramatic growth of data traffic and the need for service providers to offer more efficient and scalable services to their customers. Combined voice and data IP networks more efficiently fill available network bandwidth with packets of data and voice from many users. As the volume of data and voice traffic continues to increase, service providers need to build large-scale, more efficient packet networks.
Both wireless and wireline network operators are converging on a standard architecture designed as a single communications network architecture. The IMS architecture is a set of principles defined by the 3GPP that describes a standard way of building telecommunications networks. We believe significant opportunities exist in uniting separate, parallel networks into a new, integrated public network capable of transporting both voice and data traffic on wireless or wireline devices. IP architectures are more efficient at moving data, more flexible and reduce equipment and operating costs. Significant potential savings can be realized by converging voice and data networks, as well as
2
wireless and wireline networks, thereby reducing network operating costs and eliminating redundant or overlapping equipment purchases. Also, the combination of traditional voice services with Internet or web-based services in a single network is expected to enable new and powerful high-margin, revenue-generating service offerings such as voice virtual private networks, one-number/follow-me services, unified messaging, conferencing, prepaid and postpaid calling card services, sophisticated call centers and other IP voice services.
The public telecommunications network is large, highly complex and generates significant revenues, a substantial majority of which is derived from voice services. Historically, given service providers' substantial investment in, and dependence upon, traditional circuit-switched technology, their transition from one technology paradigm to another has been gradual. The current transition to IP appears to share many historical predispositions from the telecommunications industry as carriers deploy VoIP to expand capacity, replace obsolete equipment and reduce operational costs. The major difference between this technology transition and prior migrations, however, is the unprecedented convergence of wireline VoIP, wireless voice and wireless data, which is accelerating the construction of all innovative networks that are all-IP, and is breaking the traditional model of gradual network evolution.
Network Requirements and the Sonus Solutions
Users demand high levels of quality and reliability from the public telephone network, while service providers require a cost-efficient network that enables the latest revenue-generating services. We develop, market and sell a comprehensive suite of voice and data communications infrastructure products, whose architecture is aligned with the principles of IMS and which are purpose-built for the deployment and management of voice and data services over carrier packet networks to meet the following requirements:
Carrier-class performance. Service providers operate complex, mission-critical networks, demanding clear infrastructure requirements. Our products are designed to offer the highest levels of quality, reliability and interoperability, including:
- •
- full redundancy, designed for 99.999% availability;
- •
- voice quality equal or superior to that of today's circuit-switched network;
- •
- system hardware designed for Network Equipment Building Standards, or NEBS Level 3, compliance;
- •
- network monitoring and provisioning designed for Operations System Modifications for the Integration of Network Elements,
or OSMINE, compliance;
- •
- a complete set of service features addressing those found in the existing voice network and extending them to offer
greater flexibility; and
- •
- sophisticated network management and configuration capabilities.
Scalability and density. Carrier voice infrastructure solutions face challenging scalability requirements. Service providers' central offices typically support tens or even hundreds of thousands of simultaneous calls. In order to be economically attractive, modern infrastructure must compare favorably with existing networks in terms of performance, cost per port, space occupation, power consumption and cooling requirements. The Sonus solution is scalable to cost-effectively build packet-based switch configurations to support a range of a few hundred calls to hundreds of thousands of simultaneous calls. In addition, the capital cost of our equipment is typically lower than that of traditional circuit-switched equipment. At the same time, our switches offer unparalleled density, require significantly less space than needed by typical circuit-switching implementations and accordingly, significantly less power and cooling. Consequently, use of our products may result in a significant reduction in expensive central office facilities cost and allow service providers to deploy our
3
equipment in locations where traditional circuit switches would not generally be an option due to limited space and environmental constraints.
Compatibility with standards and existing infrastructure. New infrastructure equipment and software must sustain the full range of telephone network standards. It must also support data networking protocols as well as telephony protocols. Infrastructure solutions must seamlessly integrate with service providers' existing operations support systems. Therefore, our products are designed to be compatible with applicable voice and data networking standards and interfaces, including:
- •
- SS7 and other telephone network signaling protocols, including international signaling variants, advanced services and
simple call management and routing;
- •
- IP, TDM, Ethernet and optical data networking standards;
- •
- call signaling standards, including SIP, SIP-I, SIP-T, MGCP and H.323 and others;
- •
- voice coding standards, such as G.711 and echo cancellation standard G.168; and
- •
- all common interfaces, including T1, T3, E1 and optical interfaces.
The Sonus solution is designed to interface with legacy circuit-switching equipment and support the transparent flow of calls and other information between circuit and packet networks. As a result, our products allow service providers to migrate to a new packet voice infrastructure, while maximizing their revenue from existing investments.
Security. As carriers extend the network edge via IP, security is critical to provide manageable, predictable services at peering points between service providers while maintaining the integrity and privacy of subscriber information.
Intelligent software in an open and flexible platform. The architecture of packet communication infrastructure solutions decouples the capabilities of traditional circuit-switched equipment into robust hardware elements and highly intelligent software platforms that provide control, signaling and service creation capabilities. This approach is designed to transform the closed, proprietary circuit-switched public telephone network into a flexible, open environment accessible to a wide range of software developers. Innovative services may be developed by us, by network operators themselves or by any number of third parties, including software developers and systems integrators. The Sonus IMS architecture facilitates the creation of services that were previously not possible on the circuit-switched network.
Simple and rapid installation, deployment and support. Infrastructure solutions must be easy to install, deploy, configure and manage. Our equipment and software can be installed and placed in service by our customers more quickly than circuit-switched equipment. By offering comprehensive testing, configuration and management software, we expedite the deployment process as well as the ongoing management and operation of our products. We believe that typical installations of our solution only require weeks from product arrival to final testing, thereby reducing the cost of deployment and the time to market for new services.
Sonus Products
Sonus GSX9000 Open Services Switch
The Sonus GSX9000 Open Services Switch, or the GSX9000, enables voice traffic to be transported over packet networks by converting any type of voice signal into IP packets, transmitting those IP packets over a data network, and then converting whatever type of signal is necessary to be deposited back onto non-IP networks to be delivered to their intended destination. The GSX9000 is designed to deliver voice quality equal, or superior, to that of the legacy circuit-switched public
4
network. Further, it is devised to support multiple voice encoding schemes used in circuit switches and delivers a number of other voice compression algorithms. The GSX9000 minimizes delay, further enhancing perceived voice quality, and scales to very large configurations required by major service providers. A single GSX9000 shelf can support up to 22,000 simultaneous calls, while a single GSX9000 in a multiple-shelf configuration can support 100,000 or more simultaneous calls. The GSX9000 also operates with our PSX Policy & Routing Server and with softswitches and network products offered by other vendors.
Sonus GSX4000 Open Services Switch
The Sonus GSX4000 Open Services Switch, or the GSX4000, allows service providers to realize the benefits of the GSX9000 on a platform that is right-sized for their immediate needs. By delivering the proven reliability of the GSX9000 in a smaller form factor, service providers are able to cost-effectively support a highly distributed subscriber base or create an initial presence in a large market. The Sonus GSX family of products offers an expansion path from several hundred ports to several million ports to meet the demands of the worldwide market.
Sonus Network Border Switch
The Sonus Network Border Switch, or NBS, is an instantiation of the GSX9000 for packet to packet (IP) networks where session border control, or SBC, services are required for IP peering or IP access. The NBS can be deployed in a dedicated Sonus GSX product or in a hybrid environment where some traffic is circuit-to-packet, or gateway services, and other traffic is all packet. In addition to traditional SBC services, the NBS can leverage the media gateway services in a Sonus GSX product to provide media transcoding. With the proliferation of IP-based networks and industry convergence around IMS architectures, the ability to securely interconnect between networks has become paramount. The NBS also supports access session border controller functionality, allowing service providers to support business enterprises and individual voice customers over secure IP with full access to Sonus' centralized routing, network voice features, and management and provisioning tools.
Sonus PSX Policy & Routing Server
The Sonus PSX Policy & Routing Server, or the PSX, is a primary element of both our distributed softswitch and IMS architecture and plays an integral role in all of our solutions. The PSX, which serves as the policy and routing database element in the architecture, provides network intelligence, including call control, service selection and routing. The PSX is based upon a modular architecture that is designed for high performance and scalability, as well as interoperability with third-party gateways, devices and services.
Sonus SGX Signaling Gateway
The Sonus SGX Signaling Gateway, or the SGX, provides an integrated SS7 solution for our architecture. SS7/C7 signaling is the global standard for telecommunications procedures and protocol by which network elements in the public-switched-telephone network exchange information over a digital signaling network to effect wireless and wireline call setup, routing and control. The SGX is a SS7/C7 signaling gateway that interconnects Sonus-based packet solutions with legacy SS7 networks. The SGX can be deployed separately or with either the GSX9000 or the PSX in configurations that meet a wide range of network requirements.
Sonus ASX Call Feature Server
The Sonus ASX Call Feature Server, or ASX, provides functionality that extends our architecture to the access part of the network. The ASX is a call agent that handles call setup and basic call
5
features. The ASX provides local area calling features for residential and enterprise markets and regulatory features such as emergency services and lawful intercept. The ASX allows the same features to run over various transport technologies, including analog lines, Ethernet, voice over DSL, voice over cable or fixed wireless infrastructure. This flexibility enables a multitude of applications, such as residential access, cable access and business services, and new features available only on packet-based networks, such as unified messaging, multimedia conferencing and desktop integration capabilities.
Sonus ASX Access Gateway Control Function
Based on the ASX architecture, Sonus provides an IMS-compliant Access Gateway Control Function, or AGCF, as defined in the TISPAN, or Telecom and Internet Converged Services and Protocols for Advanced Networks, standards group. As an AGCF, traditional telephones can connect to a local access gateway or multi-services access node to gain access to IMS, IP-controlled networks and associated services. The ASX AGCF allows customers to effectively evolve an existing circuit connected network to IMS by allowing the majority of their customers to connect to the new network with no equipment or perceived service changes. Combined with the ASX Call Feature Server, network service providers can create a Class 5 replacement architecture that readily takes advantage of IMS solutions.
Sonus IMX Service Delivery Platform
The Sonus IMX Service Delivery Platform, or IMX, is a web-based multimedia environment that enables wireline and wireless service providers to develop, integrate, launch and manage enhanced telecommunication applications and services. The IMX combines Internet and telephony application models, enabling the creation and delivery of voice, video and data services in a scalable, standards-based platform. By providing the ability to integrate with a service provider's wireline or wireless network, this platform facilitates the development of innovative revenue-generating applications, improves time to market and streamlines the delivery of existing or third-party next-generation services.
Sonus Insight Management System
The Sonus Insight Management System, or Sonus Insight, is a complete, web-based management system designed to simplify the operation of carrier-class packet voice networks. Sonus Insight includes Element Management System, DataStream Integrator, Subscriber Management System, Network Traffic Manager and Sonus Insight Developer's Kit, that collectively provide comprehensive configuration, provisioning, security, alarm reporting, performance data and billing mediation capabilities. Sonus Insight integrates with service providers' existing back-office systems and offers many tools that enhance and consolidate management functions, thereby allowing service providers to streamline many of today's labor-intensive processes. Sonus Insight scales to support hundreds of switches and concurrent users, and is based upon industry standards and protocols to facilitate management from any location worldwide.
Sonus Insight xAuthority Provisioning System
The Sonus Insight xAuthority Provisioning System, or xAuthority, provides a flexible, customizable arbitration layer above the Sonus Insight Management System to help with back-office integration and customer self-provisioning. xAuthority also creates a management point for third-party products to enable customers to create a single point of provisioning management. xAuthority accelerates the integration and deployment of Sonus-architected solutions in major carriers worldwide.
Sonus Global Services and Sonus Professional Services
Sonus Global Services offers professional consulting and services in support of our industry-leading IP communications solutions. Through a rich portfolio of service offerings, Sonus consultants provide
6
the skill and expertise to help wireline, wireless and cable operators transform their communications networks with focused support from our network engineering and design teams through network integration and commissioning to network operations.
Sonus Professional Services deliver an end-to-end solution through well-defined service engagements that include program management; network deployment design; softswitch and subscriber database design; network verification; network audit services; service management solutions; custom application and adaptor development; OSS and API integration; engineering, furnishing and installation; migration services; resident engineers; upgrade services; managed services and other services.
In addition to our standard Sonus Professional Services engagements, Sonus Global Services offers customized engagements and workshops, ongoing training classes and, for our maintenance plan customers, ongoing support through our online knowledge center, technical document library and 24-hour telephone support from our worldwide technical assistance centers located in Westford, Massachusetts, Tokyo, Japan and Prague, Czech Republic. We also have customer test and support centers located in Richardson, Texas and Bangalore, India.
At December 31, 2009, our customer support and professional services organization consisted of 202 employees.
Sonus Strategy
Traditionally, Sonus Networks has provided robust solutions for carriers that need to operate in a hybrid environment of both IP traffic and traditional circuit-switched traffic. We believe the need for this core media gateway technology will persist for years to come, as the number of IP islands increases and vast portions of the world's class 5 and mobile infrastructure remain Time Division Multiplex-based, or TDM-based.
As networks evolve, however, Sonus must continue to develop solutions that are all-IP, which rely less on media gateways and more on security and policy elements. Further, the systems and software required to manage all-IP-based voice calls will need to evolve to support all types of media session types, not just voice. In response to this perceived shift, we have developed and will continue to develop solutions based on the following elements:
Leverage our technology leadership to attract and retain key service providers. As one of the first companies to offer IMS-ready carrier-class packet voice infrastructure products, we were selected by industry-leading service providers as they develop the architecture for their new voice networks. We expect service providers to select vendors that deliver leading technology and have the ability to maintain that technology leadership. Our equipment is an integral part of the network architecture and achieving these successes will enable us to expand our business as these networks are deployed. By working closely with our customers as they install these networks, we gain valuable knowledge regarding their requirements, positioning us to continue to develop product enhancements and extensions that address the evolving requirements of network operators globally.
Embrace the principles outlined by 3GPP and deliver the industry's most advanced IMS-ready product suite. IP Multimedia Subsystem ("IMS") is a well defined standard model of functional elements for offering services and application. IMS allows vendors to offer different ways of packaging the functional elements as long as the functional model and interfaces among elements are adhered to. Sonus IMS implementation while fully adhering to open standards based model, also offers additional operating and processing efficiency based on our long experience and successful implementation of VoIP solutions.
7
Expand and broaden our customer base by targeting specific market segments, such as wireless operators. We plan to leverage our early success to penetrate additional customer segments. We believe new and incumbent service providers will build out their VoIP infrastructures at different rates. The next-generation service providers, who are relatively unencumbered by legacy equipment, have been among the initial purchasers of our equipment and software. Other newer entrants, including wireless operators, cable operators and Internet service providers, or ISPs, have also been early adopters of certain products. Moreover, incumbents, including interexchange carriers, regional bell operating companies and international operators are adopting packet voice technologies.
Assist our customers' ability to differentiate themselves by offering a sophisticated application development platform and service creation environment. Today's communications providers face unprecedented challenges in attracting and retaining customers and driving revenue streams. One approach to win additional customers and foster loyalty among existing customers is to introduce innovative services that redefine how users communicate. Our technology drives down the cost of experimentation and thereby stimulates new innovation. With IP-based technologies and our IMX, our customers have powerful tools at their disposal for the development, integration and deployment of exciting new services.
Expand our solutions to address emerging IP-based markets, such as network border switching. The transformation of legacy networks to all-IP networks has created a set of security, peering and media manipulation requirements as well as an opportunity for creating IP-IP services at the edges of the IP networks. The requirements for security and peering go far beyond the legacy functionality of Session Border Controllers ("SBC") and includes not only the operator requirements for border gateway to other IP networks but also a wide variety of requirements associated with enterprises and their need for control of their own IP network. The multi-media nature of the emerging services also provides an opportunity to create innovative services at the edge of the network. Sonus Networks Border Switch family of products offers a comprehensive solution that empowers operators to address all of the above requirements as well as enable them to create unique IP-IP services.
Expand our global sales, marketing, support and distribution capabilities. Being a primary supplier of carrier packet voice infrastructure solutions to tier 1 service providers requires a strong worldwide presence. We have established sales presence throughout the United States, Western Europe, the United Kingdom and Japan. We also have sales teams in Singapore, Hong Kong, China, Mexico, Malaysia and Dubai. We augment our global direct sales effort by partnering with international distribution partners in key markets around the world and with our global partner, Motorola. As a carrier-class solution provider, we continue to invest in professional service expertise and customer support.
Actively contribute to the standards definition and adoption process. To advance our technology and market leadership, we will continue to contribute to standards bodies such as the Internet Engineering Task Force and the International Telecommunications Union. The definition of standards for carrier packet voice infrastructure is an on-going effort and we intend to drive these standards to meet the requirements for an open, accessible, scalable infrastructure.
Pursue strategic acquisitions and alliances. In addition to investing in organic growth, we will consider other compelling opportunities to deliver greater shareholder value if and when such opportunities arise.
Customers
Our target customer base includes all communications providers, such as long distance carriers, local exchange carriers, ISPs, wireless operators, cable operators, international telephone companies and wholesale operators. We have been selected for network deployments with operators including AT&T, Belgacom, BT Group, Cable and Wireless International, Carphone Warehouse, France Telecom,
8
Global Crossing, KDDI, Level 3, NTT Communications, Qwest, Softbank Corporation, T-Systems Business Services (a division of Deutsche Telekom Group), Verizon and XO Communications.
We had no customers in the year ended December 31, 2009 that contributed 10% or more of our consolidated revenue. For the years ended December 31, 2008 and 2007, one customer, AT&T, accounted for approximately 29% and 33%, respectively of our consolidated revenue. There were no other customers in 2008 or 2007 that contributed 10% or more of our consolidated revenue.
Sales and Marketing
We sell our products principally through a direct sales force and, in some markets, through or with the assistance of distributors and resellers, such as IBIL (Malaysia), Nissho Electronics Corporation (Japan), Sumitomo Corporation (Japan) and ECI. For geographic information, including revenue and tangible long-lived assets, please see our consolidated financial statements included in this Annual Report on Form 10-K, including Notes 19 and 7 thereto. We have an original equipment manufacturer relationship with Motorola, Inc. We intend to establish additional relationships with selected original equipment manufacturers and other marketing partners in order to serve particular markets or geographies and provide our customers with opportunities to purchase our products in combination with related services and products.
At December 31, 2009, our sales and marketing organization consisted of 137 employees located in sales and support offices in the United States and around the world.
Research and Development
We believe that strong product development capabilities are essential to our strategy of enhancing our core technology, developing additional applications, incorporating that technology into new products and maintaining comprehensive product and service offerings. Our research and development process leverages innovative technology in response to market data and customer feedback. In 2009, we delivered product enhancements in our trunking and access products, Network Border Switching and wireless and network management. In 2010, we plan to develop and introduce differentiated products to address market and customer needs. Our research and development expenses were $59.9 million, $73.1 million and $78.9 million for the years ended December 31, 2009, 2008 and 2007, respectively.
We have assembled a team of highly skilled engineers with significant telecommunications and networking industry experience. Our engineers have experience in and with leading wireline and wireless telecommunications equipment suppliers, computer data networking and multimedia companies. At December 31, 2009, we had 412 employees responsible for research and development, including 395 software and quality assurance engineers and 9 hardware engineers. Our engineering effort is focused on wireless product development, new applications and network access features, new network interfaces, improved scalability, interoperability, quality, reliability and next generation technologies. We maintain research and development offices in Massachusetts, New Jersey, Texas and Virginia in the United States; Bangalore, India; Swindon, United Kingdom and Ottawa, Canada. We have made, and intend to continue to make, a substantial investment in research and development.
Competition
The market for carrier packet voice infrastructure solutions is intensely competitive worldwide but there are historical regional differences in services, regulation and business practices between sub markets that can benefit individual vendors. Regardless of the region, the overall market is subject to rapid technological change, affected by new product introductions, changing customer demands, industry consolidation and other market activities of industry participants. To compete effectively, we must deliver innovative products that provide extremely high reliability and voice quality, scale easily and efficiently, interoperate with existing network designs and other vendors' equipment, provide
9
effective network management, are accompanied by comprehensive customer support and professional services, provide a cost-effective and space-efficient solution for service providers and meet price competition from low cost equipment providers. We expect competition to persist and intensify in the future. Our primary sources of competition include vendors of networking and telecommunications equipment, such as Ericsson, Alcatel-Lucent, Nokia Siemens Networks, Huawei, ZTE, NEC, Nortel Networks, Acme Packet, Genband, Metaswitch and Cisco Systems (including Cisco Systems' recent acquisition of Starent Networks). Although we believe we compete favorably because our solutions are widely deployed, highly scalable and cost-effective for our customers, some of our competitors have significantly greater financial resources and broader product portfolios than we have and are able to devote greater resources to the development, promotion, sale and support of their products. In addition, some of these competitors have more extensive customer bases and broader customer relationships than we have, including relationships with our potential customers. Other smaller private and public companies are also focusing on similar market opportunities.
Intellectual Property
Intellectual property is fundamental to our business and our success and ability to compete are dependent on our ability to develop, maintain and protect our technology. Therefore, we seek to safeguard our investments in technology and rely on a combination of United States and foreign patent, trademark, trade secret and copyright law and contractual restrictions to protect the proprietary aspects of our technology and to protect us against claims from others. Our general policy has been to seek to patent those patentable inventions that we expect to incorporate in our products or that we expect will be valuable otherwise. We have a program to file applications for and obtain patents, copyrights and trademarks in the United States and in selected foreign countries where we believe filing for such protection is appropriate.
At December 31, 2009, we held 16 U.S. patents with expiration dates ranging from April 2016 through October 2026, and had 32 patent applications pending in the United States. In addition, at December 31, 2009, we held 7 foreign patents with expiration dates ranging from June 2019 to October 2022, and had 34 patent applications pending abroad. We also have a number of registered trademarks in the United States, including Sonus, IMX, Mobiledge and Insignus. In addition to the protections described above, we seek to safeguard our intellectual property by:
- •
- protecting the source and object code for our software, documentation and other written materials under copyright laws and
trade secret;
- •
- licensing our software pursuant to signed license agreements, which impose restrictions on others' ability to use our
software; and
- •
- seeking to limit disclosure of our intellectual property by requiring employees and consultants with access to our proprietary information to execute confidentiality agreements.
We have incorporated third-party licensed technology into certain of our current products. From time to time, we may be required to license additional technology from third parties to develop new products or to enhance existing products. Based upon past experience and standard industry practice, we believe that licenses to use third-party technology generally can be obtained on commercially reasonable terms. Nonetheless, there can be no assurance that necessary third-party licenses will be available or continue to be available to us on commercially reasonable terms. As a result, the inability to maintain, license or re-license any third-party licenses required in our current products, or to obtain any new third-party licenses to develop new products and enhance existing products could require us to obtain substitute technology of lower quality or performance standards or at greater cost, and delay or prevent us from making these products or enhancements, any of which could seriously harm our business, financial condition and operating results.
10
Please see generally the risks that are more fully discussed in "Item 1A. Risk Factors," with particular attention to the following risk factors: "We depend on a single contract manufacturer and any disruption in this relationship may cause us to fail to meet the demands of our customers and damage our customer relationships" and "We and our contract manufacturer rely on a single or limited sources for supply of some components of our products and if we fail to adequately predict our manufacturing requirements or if our supply of any of these components is disrupted, we will be unable to ship our products."
Manufacturing
Currently, we outsource the manufacturing of our products. Our contract manufacturer provides comprehensive manufacturing services, including assembly and testing of our products and procurement of component materials on our behalf. We believe that outsourcing our manufacturing enables us to preserve working capital, allows for greater flexibility in meeting changes in demand and enables us to be more responsive in delivering products to our customers. At present, we purchase products from our outside contract manufacturer on a purchase order basis.
We and our contract manufacturer currently purchase several key components of our products, including commercial digital signal processors, from single or limited sources. We purchase these components on a purchase order basis.
Please see generally the risks that are more fully discussed in "Item 1A. Risk Factors," with particular attention to the following risk factors: "Our ability to compete and our business could be jeopardized if we are unable to protect our intellectual property or become subject to intellectual property rights claims, which could require us to incur significant cost; additionally, in some jurisdictions, our rights may not be as strong as we currently enjoy in the United States;" "Because our products are sophisticated and designed to be deployed in complex environments, they may have errors or defects that we find only after full deployment, which could seriously harm our business;" "If we are not able to obtain necessary licenses of third-party technology at acceptable prices, or at all, our products could become obsolete" and "Man-made problems such as computer viruses or terrorism may disrupt our operations and harm our operating results."
At December 31, 2009, we had 17 employees responsible for supply chain management, worldwide procurement, order fulfillment, product quality and technical operations.
Employees
At December 31, 2009, we had a total of 879 employees, including 412 in research and development, 137 in sales and marketing, 202 in customer support and professional services, 17 in manufacturing, 55 in finance and 56 in information technology and administration. Our employees are not represented by any collective bargaining agreement. We believe our relations with our employees are good.
Geographic Information
Information regarding the geographic components of our revenue is provided in Note 19 of the Notes to Consolidated Financial Statements included in this Annual Report on Form 10-K. Information regarding the geographic components of our property and equipment is provided in Note 7 of the Notes to Consolidated Financial Statements included in this Annual Report on Form 10-K.
11
Additional Information
We were incorporated in August 1997 as a Delaware corporation. Our principal executive offices are located at 7 Technology Park Drive, Westford, MA 01886. Our telephone number at our principal executive offices is 978-614-8100.
This Annual Report on Form 10-K, as well as all other reports filed with or furnished to the United States Securities and Exchange Commission (the "SEC"), are available free of charge through our Internet site (http://www.sonusnet.com) once we electronically file such material with, or furnish it to, the SEC. The public may read and copy any materials we file with the SEC at the SEC's Public Reference Room at 100 F Street, NE, Washington, DC 20549. The public may obtain information on the operation of the Public Reference Room by calling the SEC at 1-800-SEC-0330. The SEC maintains an Internet site (http://www.sec.gov) that contains reports, proxy and information statements, and other information regarding issuers that file electronically with the SEC.
The following discussion of risk factors contains "forward-looking statements," which may be important to understanding any statement in this Annual Report on Form 10-K or elsewhere. The following information should be read in conjunction with Item 1—Business, Item 7—Management's Discussion and Analysis of Financial Condition and Results of Operations and Item 8—Financial Statements and Supplementary Date of this Annual Report on Form 10-K.
Investing in our common stock involves a high degree of risk. You should carefully consider the risks described below before buying our common stock. If any of the following risks actually occurs, our business, financial condition and results of operations could be materially adversely affected, the trading price of our common stock could decline materially and you could lose all or part of your investment.
Readers are cautioned that forward-looking statements, including those contained in this Annual Report on Form 10-K, should be read in conjunction with our disclosures under the introduction of Item 7- Management's Discussion and Analysis of Financial Condition and Results of Operations, located in this Annual Report on Form 10-K, and the factors described below. The risks and uncertainties described in this Annual Report on Form 10-K are not the only ones facing our Company. Additional risks and uncertainties of which we are not presently aware, or that we currently consider immaterial, may also affect our business operations.
Our quarterly revenue and operating results are unpredictable and may fluctuate significantly from quarter to quarter, which could adversely affect our business, financial condition, results of operations and the trading price of our common stock.
Our revenues and operating results may vary significantly from quarter to quarter due to a number of factors, many of which are outside of our control and any of which may cause our stock price to fluctuate. Generally, purchases by service providers of telecommunications equipment from manufacturers have been unpredictable and clustered, rather than steady, as the providers build out their networks. The primary factors that may affect our revenues and operating results include the following:
- •
- consolidation within the telecommunications industry, including acquisitions of or by our customers;
- •
- general economic conditions, as well as those specific to the telecommunications, networking and related industries;
- •
- a general economic downturn that impacts the purchasing decisions of our significant customers or the timing and size of their orders;
12
- •
- fluctuation in demand for our voice infrastructure products and the timing and size of customer orders;
- •
- the cancellation or deferral of existing customer orders or the renegotiation of existing contractual commitments;
- •
- the mix of product configurations sold;
- •
- the length and variability of the sales cycle for our products;
- •
- the application of complex revenue recognition accounting rules to our customer arrangements;
- •
- the timing of revenue recognition;
- •
- changes in our pricing policies, the pricing policies of our competitors and the prices of the components of our products;
- •
- new product introductions and enhancements by our competitors or by us;
- •
- our ability to develop, introduce and ship new products and product enhancements that meet customer requirements in a
timely manner;
- •
- our ability to obtain sufficient supplies of sole or limited source components;
- •
- our ability to attain and maintain production volumes and quality levels for our products;
- •
- costs related to acquisitions; and
- •
- corporate restructurings, including layoffs.
As with other telecommunications product suppliers, we may recognize a portion of our revenue in a given quarter from sales booked and shipped in the last weeks of that quarter. As a result, delays in customer orders may result in delays in shipments and recognition of revenue beyond the end of a given quarter.
A significant portion of our operating expenses is fixed in the short-term. If revenues for a particular quarter are below expectations, we may not be able to reduce costs and expenses proportionally for that quarter. Any such revenue shortfall would, therefore, have a significant effect on our operating results for that quarter.
We believe that quarter-to-quarter comparisons of our operating results are not a good indication of our future performance. It is likely that in some future quarters, our operating results may be below the expectations of public market analysts and investors, which may adversely affect our stock price.
Our stock price has been and may continue to be volatile.
The market for technology stocks has been, and will likely continue to be, volatile. The following factors could cause the market price of our common stock to fluctuate significantly:
- •
- continued activism by any single large stockholder or combination of stockholders;
- •
- addition or loss of any major customer;
- •
- consolidation in the telecommunications industry;
- •
- changes in the financial condition or anticipated capital expenditure purchases of any existing or potential major
customer;
- •
- economic conditions for the telecommunications, networking and related industries;
- •
- quarterly variations in our operating results;
13
- •
- changes in financial estimates by securities analysts;
- •
- speculation in the press or investment community;
- •
- announcements by us or our competitors of significant contracts, new products or acquisitions, distribution partnerships,
joint ventures or capital commitments;
- •
- sales of common stock or other securities by us or by our stockholders in the future;
- •
- securities and other litigation; and/or
- •
- announcement of a stock split, reverse stock split, stock dividend or similar event.
We have incurred net losses and may incur additional net losses.
We have incurred net losses in fiscal 2009, fiscal 2008 and fiscal 2007. We may incur additional net losses in future quarters and years. Our revenues may not grow and we may never generate sufficient revenues to sustain profitability.
World-wide efforts to cut capital spending, general economic uncertainty and a weakening global economy could have a material adverse effect on us.
We are unable to predict the duration and severity of the current economic downturn and disruption in financial markets or their effects on our business and results of operations, but the consequences may be materially adverse and more severe than other recent economic slowdowns. Continuing market upheaval may have an adverse affect on us because we are dependent on customer behavior. Economic conditions worldwide and the recent financial crisis may continue to contribute to slowdowns in the communications and networking industries, as well as to specific segments and markets in which we operate, resulting in:
- •
- reduced demand for our products as a result of our customers choosing to refrain from building capital intensive networks;
- •
- increased price competition for our products, not only from our competitors, but also as a consequence of customers
disposing of unutilized products;
- •
- risk of excess and obsolete inventories;
- •
- excess facilities and manufacturing capacity; and/or
- •
- higher overhead costs as a percentage of revenue and higher interest expense.
Continuing turmoil in the geopolitical environment in many parts of the world, including terrorist activities and military actions, particularly the continuing tension in the Middle East, Iraq and Afghanistan, may continue to put pressure on global economic conditions. Our operating results and our ability to expand into other international markets may also be affected by changing economic conditions particularly germane to that segment or to particular customer markets within that segment.
Some of our current or prospective customers may cancel or delay spending on the development or roll-out of capital and technology projects with us due to the economic downturn and, consequently, our results of operations may be adversely affected. In addition, the current negative worldwide economic conditions and market instability make it increasingly difficult for us, our customers and our suppliers to accurately forecast future product demand, which could result in an inability to satisfy demand for our products and a loss of market share.
Our revenues are likely to decline in such circumstances and our profit margins could erode. In addition, in the event of extreme prolonged events, such as the global credit crisis, we could incur significant losses. Factors such as consumer spending, business investment, volatility and strength of the
14
capital markets and information all affect the business and economic environment, and, ultimately, the amount and profitability of our business. In an economic downturn characterized by higher unemployment, lower family income, lower corporate earnings, lower business investment and lower consumer spending, the demand for our products could be adversely affected. If global economic and market conditions, or economic conditions in the United States or other key markets, continue to deteriorate, we may experience material impacts on our business, operating results and financial condition.
We have adopted a new strategic focus and we are shifting our resources to support that new focus. If our new strategic plan is not aligned with the direction our customers take as they invest in the evolution of their networks, customers may not buy our products or use our services.
We have recently adopted a new strategic plan, and we are undergoing a strategic transformation and realignment of our operations in support of that new plan. The transformation we are undergoing includes accelerating the shift in our investments from mature technologies that previously generated significant revenue for us toward certain next-generation technologies. Our choices of specific technologies to pursue, including all-IP-based solutions, and those to de-emphasize may prove to be inconsistent with our customers' investment spending.
We are dependent upon our voice infrastructure products, and our future revenues depend upon their commercial success.
Our future growth depends upon the commercial success of our voice infrastructure products and our solutions that are all-IP. We intend to develop and introduce new products and enhancements to existing products in the future. We may not successfully complete the development or introduction of these products. Further, the systems and software required to manage All-IP-based voice calls will need to evolve to support all types of media session types, not just voice. If our target customers do not adopt, purchase and successfully deploy our current or planned products, our revenues will not grow.
If we do not respond rapidly to technological changes or to changes in industry standards, our products could become obsolete.
The market for packet voice infrastructure products is likely to be characterized by rapid technological change and frequent new product introductions. We may be unable to respond quickly or effectively to these developments. We may experience difficulties with software development, hardware design, manufacturing or marketing that could delay or prevent our development, introduction or marketing of new products and enhancements. The introduction of new products by our competitors, the market acceptance of products based on new or alternative technologies or the emergence of new industry standards could render our existing or future products obsolete. If the standards adopted are different from those that we have chosen to support, market acceptance of our products may be significantly reduced or delayed. If our products become technologically obsolete, we may be unable to sell our products in the marketplace and generate revenues.
If we fail to compete successfully against incumbent telecommunications equipment companies, our ability to increase our revenues and sustain profitability will be impaired.
Competition in the telecommunications market is intense. This market has historically been dominated by large incumbent telecommunications equipment companies, such as Alcatel-Lucent, NEC, Nokia Siemens, Huawei and Ericsson, all of which are our direct competitors. We also face competition from other large telecommunications and networking companies, including Cisco Systems, that have entered our market by acquiring companies that design competing products. Alcatel and Lucent merged and Siemens combined its networking business with Nokia's networking business. Other
15
competitors may also merge, intensifying competition. Additional competitors with significant financial resources may enter our markets and further intensify competition.
Many of our current and potential competitors have significantly greater selling and marketing, technical, manufacturing, financial and other resources than we have. Further, some of our competitors sell significant amounts of other products to our current and prospective customers and have the ability to offer lower prices to win business. Our competitors' broad product portfolios, coupled with already existing relationships, may cause our customers to buy our competitors' products or harm our ability to attract new customers.
To compete effectively, we must deliver innovative products that:
- •
- provide extremely high reliability and voice quality;
- •
- scale easily and efficiently;
- •
- interoperate with existing network designs and other vendors' equipment;
- •
- provide effective network management;
- •
- are accompanied by comprehensive customer support and professional services;
- •
- provide a cost-effective and space efficient solution for service providers; and
- •
- meet price competition from low cost equipment providers.
If we are unable to compete successfully against our current and future competitors, we could experience price reductions, order cancellations, loss of customers and revenues and reduced gross profit margins.
If we do not anticipate and meet specific customer requirements or if our products do not interoperate with our customers' existing networks, we may not retain current customers or attract new customers.
To achieve market acceptance for our products, we must effectively anticipate, and adapt in a timely manner to, customer requirements and offer products and services that meet changing customer demands. Prospective customers may require product features and capabilities that our current products do not have. The introduction of new or enhanced products also requires that we carefully manage the transition from older products in order to minimize disruption in customer ordering patterns and ensure that adequate supplies of new products can be delivered to meet anticipated customer demand. If we fail to develop products and offer services that satisfy customer requirements, or to effectively manage the transition from older products, our ability to create or increase demand for our products would be seriously harmed and we may lose current and prospective customers.
Many of our customers will require that our products be designed to interface with their existing networks, each of which may have different specifications. Issues caused by an unanticipated lack of interoperability may result in significant warranty, support and repair costs, divert the attention of our engineering personnel from our hardware and software development efforts and cause significant customer relations problems. If our products do not interoperate with those of our customers' networks, installations could be delayed or orders for our products could be cancelled, which would seriously harm our gross margins and result in loss of revenues or customers.
The market for voice, data and video infrastructure products for the public network is evolving and our business will suffer if it does not develop as we expect.
The market for our products continues to evolve. In particular, wireless, cable and broadband access networks are becoming important markets for our products. Packet-based technology may not become widely accepted as a platform for voice and a viable market for our products may not be
16
sustainable. If this market does not develop, or develops more slowly than we expect, we may not be able to sell our products in significant volume. Additionally, the introduction of new products with higher capacity may result in a decrease in the manufacturing volumes of our older products and a corresponding decrease in component purchase volume discounts. This could result in higher overall manufacturing costs.
We expect that a majority of our revenue will be generated from a limited number of customers and we will not be successful if we do not grow our customer base.
To date, we have shipped our products to a limited number of customers. One customer contributed approximately 29% of our revenue in fiscal 2008. Although we did not have any single customer that contributed 10% or more of our revenue in fiscal 2009, it is possible that we may have such customers in future periods. Factors that may affect our ability to grow our customer base include the following:
- •
- economic conditions that discourage potential new customers from making the capital investments required to adopt new
technologies;
- •
- deterioration in the general financial condition of service providers or their ability to raise capital or access lending
sources; and/or
- •
- new product introductions by our competitors.
If we are unable to expand our customer base, we will be forced to rely on generating recurring revenue from existing customers which may not be successful. Our future success will depend on our ability to attract additional customers beyond our current limited number.
If we are unable to generate recurring business from our limited number of existing customers, our financial position and results of operations could be materially and adversely affected.
We expect that in the foreseeable future, the majority of our revenue will continue to depend on sales of our products to a limited number of existing customers. Factors that may affect our ability to generate recurring revenues from our existing customers include the following:
- •
- customer willingness to implement our new voice infrastructure products;
- •
- acquisitions of or by our customers;
- •
- delays or difficulties that we may incur in completing the development and introduction of our planned products or product
enhancements;
- •
- failure of our products to perform as expected; and/or
- •
- difficulties we may incur in meeting customers' delivery requirements.
The loss of any significant customers or any substantial reduction in purchase orders from these customers could materially and adversely affect our financial position and results of operations.
Our large customers have substantial negotiating leverage, which may require that we agree to terms and conditions that may have an adverse effect on our business.
Large telecommunications providers have substantial purchasing power and leverage in negotiating contractual arrangements with us. These customers may require us to develop additional features, may require penalties for failure to deliver such features and may seek discounted product or service pricing. As we sell more products to this class of customer, we may be required to agree to such terms and conditions, which may affect the timing of revenue recognition, amount of deferred revenues or
17
product and service margins and may adversely affect our financial position in the applicable period affected.
Due to our reliance on significant customer contracts, we have financial exposure to the continued financial stability of our customers.
Due to our reliance on significant customer contracts, we are dependent on the continued financial strength of our customers. The current economic crisis could have already had or could have in the future a material adverse affect on these customers. If one or more of our significant customers experience financial difficulties, it could result in uncollectible accounts receivable and our loss of significant customers and anticipated service revenue.
We are exposed to the credit risk of some of our customers and to credit exposures in weakened markets, which could result in material losses.
Most of our sales are on an open credit basis, with typical payment terms of 30 to 45 days. We monitor individual customer payment capability in granting such open credit arrangements, seek to limit such open credit to amounts we believe our customers can pay and maintain reserves we believe are adequate to cover exposure for doubtful accounts. However, there can be no assurance that our open credit customers will pay the amounts they owe to us or that the reserves we maintain will be adequate to cover such credit exposure. Our customers' failure to pay and/or our failure to maintain sufficient reserves could have a material adverse effect on our operating results and financial condition. Additionally, in the event that the ongoing turmoil in the credit markets makes it more difficult for some customers to obtain financing, those customers' ability to pay could be adversely impacted, which in turn could have a material adverse impact on our business, operating results and financial condition.
A portion of our sales are derived through our distributors. As distributors tend to have more limited financial resources than other resellers and end-user customers, they generally represent sources of increased credit risk.
We rely on distribution partners to sell our products in certain markets, and disruptions to, or our failure to effectively develop and manage, our distribution channel and the processes and procedures that support it could adversely affect our ability to generate revenues from the sale of our products in those markets.
Our future success is highly dependent upon establishing and maintaining successful relationships with a variety of value-added reseller and distribution partners. A portion of our revenues is derived through distributors, many of which sell competitive products. The loss of or reduction in sales by these distributors could materially reduce our revenues. If we fail to maintain relationships with these distribution partners, fail to develop new relationships with distributors in new markets, fail to manage, train, or provide incentives to existing distributors effectively or if these partners are not successful in their sales efforts, sales of our products may decrease and our operating results could suffer.
In addition, we recognize a portion of our revenue based on a sell-through model using information provided by our distributors. If those distributors provide us with inaccurate or untimely information, the amount or timing of our revenues could be adversely affected.
We may face risks associated with our international expansion that could impair our ability to grow our international revenues.
International revenue approximated $69 million, or approximately 30% of revenue, in fiscal 2009, $94 million, or approximately 30% of revenue, in fiscal 2008 and $84 million, or approximately 26% of revenue, in fiscal 2007. We intend to continue to expand our sales in international markets. This expansion has and will continue to require significant management attention and financial resources to successfully develop direct and indirect international sales and support channels. In addition, we may
18
not be able to develop international market demand for our products, which could impair our ability to grow our revenues. We have limited experience marketing, distributing and supporting our products internationally and, to do so, we expect that we will need to develop versions of our products that comply with local standards. Furthermore, international operations are subject to other inherent risks, including:
- •
- reliance on distributors and resellers;
- •
- greater difficulty collecting accounts receivable and longer collection cycles;
- •
- difficulties and costs of staffing and managing international operations;
- •
- the impact of differing technical standards outside the United States;
- •
- the impact of the current global economic downturn and related market uncertainty;
- •
- changes in regulatory requirements and currency exchange rates;
- •
- compliance with international trade, customs and export control regulations;
- •
- certification requirements;
- •
- reduced protection for intellectual property rights in some countries;
- •
- potentially adverse tax consequences;
- •
- considerations that affect government and service provider spending patterns;
- •
- health or similar issues, such as pandemic or epidemic; and
- •
- political, social and economic instability.
If we fail to manage the operational and financial risks associated with our international operations, it could have a material adverse effect on our business, results of operations and financial condition.
We operate in international and emerging markets. In many international markets, long-standing relationships between potential customers and their local suppliers and protective regulations, including local content requirements and approvals, create barriers to entry. In addition, pursuing international opportunities may require significant investments for an extended period before returns on those investments, if any, are realized, which may result in expenses growing at a faster rate than revenues. Furthermore, those opportunities could be adversely affected by, among other factors: reversals or delays in the opening of foreign markets to new competitors or the introduction of new technologies into those markets; a challenging pricing environment in highly competitive new markets; exchange controls; restrictions on repatriation of cash; nationalization or regulation of local industry; economic, social and political risks; taxation; challenges in staffing and managing international opportunities; and acts of war or terrorism.
Difficulties in foreign financial markets and economies and of foreign financial institutions, particularly in emerging markets, could adversely affect demand from customers in the affected countries. An inability to maintain our business in international and emerging markets while balancing the higher operational and financial risks associated with these markets could have a material adverse effect on our business, results of operations and financial condition.
Our use and reliance upon development resources in India may expose us to unanticipated costs and/or liabilities.
We have a significant development center in Bangalore, India and, in recent years, have increased headcount and development activity at this facility. The employees at this facility consist principally of research and development personnel. There is no assurance that our reliance upon development
19
resources in India will enable us to achieve meaningful cost reductions or greater resource efficiency. Further, our development efforts and other operations in India involve significant risks, including:
- •
- difficulty hiring and retaining appropriate engineering resources due to intense competition for such resources and
resulting wage inflation;
- •
- the knowledge transfer related to our technology and resulting exposure to misappropriation of intellectual property or
information that is proprietary to us, our customers and other third parties;
- •
- heightened exposure to changes in economic, security and political conditions in India; and
- •
- fluctuations in currency exchange rates and tax compliance in India.
Difficulties resulting from the factors noted above and other risks related to our operations in India could expose us to increased expense, impair our development efforts, harm our competitive position and damage our reputation.
We are subject to governmental export and import controls that could subject us to liability or impair our ability to compete in international markets.
Our products are subject to U.S. export controls and may be exported outside the United States only with the required level of export license or through an export license exception because we incorporate encryption technology into our products. In addition, various countries regulate the import of certain encryption technology and have enacted laws that could limit our ability to distribute our products or our customers' ability to implement our products in those countries. Changes in our products or changes in export and import regulations may create delays in the introduction of our products in international markets, prevent our customers with international operations from deploying our products throughout their global systems or, in some cases, prevent the export or import of our products to certain countries altogether. Any change in export or import regulations or related legislation, shift in approach to the enforcement or scope of existing regulations or change in the countries, persons or technologies targeted by such regulations, could result in decreased use of our products by, or in our decreased ability to export or sell our products to, existing or potential customers with international operations. Any decreased use of our products or limitation on our ability to export or sell our products would likely adversely affect our business, operating results and financial condition.
We face risks related to securities litigation that could result in significant legal expenses and settlement or damage awards.
We have been named as a defendant in securities class action and derivative lawsuits. We are generally obliged, to the extent permitted by law, to indemnify our current and former directors and officers who are named as defendants in these lawsuits. Defending against existing and potential litigation may require significant attention and resources of management. Regardless of the outcome, such litigation will result in significant legal expenses. If our defenses in any of our pending litigation are ultimately unsuccessful, or if we are unable to achieve a favorable settlement, we could be liable for large damage awards that could have a material adverse effect on our business, results of operations and financial position.
Further, our director and officer liability insurance policies provide only limited liability protection relating to the securities class action and derivative lawsuits against us and certain of our officers and directors. If these policies do not adequately cover expenses and certain liabilities relating to these lawsuits, our results of operations and our financial position could be materially harmed. Increased premiums could materially harm our financial results in future periods. The inability to obtain this coverage due to its unavailability or prohibitively expensive premiums would make it more difficult to
20
retain and attract officers and directors and potentially expose us to self-funding any future liabilities ordinarily mitigated by director and officer liability insurance.
For additional information on our pending litigation, please see Part I, Item 3 "Legal Proceedings" in this Annual Report on Form 10-K.
Our ability to compete and our business could be jeopardized if we are unable to protect our intellectual property or become subject to intellectual property rights claims, which could require us to incur significant cost; additionally, in some jurisdictions, our rights may not be as strong as we currently enjoy in the United States.
We rely on a combination of patent, copyright, trademark and trade secret laws and restrictions on disclosure to protect our intellectual property rights. Despite our efforts to protect our proprietary rights, unauthorized parties may attempt to copy or otherwise obtain and use our products or technology. Monitoring unauthorized use of our products is difficult and we cannot be certain that the steps we have taken will prevent unauthorized use of our technology, particularly in foreign countries where the laws may not protect our proprietary rights as fully as in the United States. The legal systems of many foreign countries do not protect or honor intellectual property rights to the same extent as the legal system of the United States. It may be very difficult, time-consuming and costly for us to attempt to enforce our intellectual property rights in these jurisdictions. If competitors are able to use our technology, our ability to compete effectively could be harmed.
In addition, we and our customers have received inquiries from intellectual property owners and may become subject to claims that we or our customers infringe their intellectual property rights. Any parties asserting that our products infringe upon their proprietary rights could force us to license their patents for substantial royalty payments or to defend ourselves and possibly our customers or contract manufacturers in litigation. These claims and any resulting licensing arrangement or lawsuit, if successful, could subject us to significant royalty payments or liability for damages and invalidation of our proprietary rights. Any potential intellectual property litigation also could force us to do one or more of the following:
- •
- stop selling, incorporating or using our products that use the challenged intellectual property;
- •
- obtain from the owner of the infringed intellectual property right a license to sell or use the relevant technology, which
license may not be available on reasonable terms, or at all; or
- •
- redesign those products that use any allegedly infringing technology.
Any lawsuits regarding intellectual property rights, regardless of their success, would be time-consuming, expensive to resolve and would divert our management's time and attention. In addition, although historically our costs to defend lawsuits relating to indemnification provisions in our product agreements have been insignificant, the costs were significant in the fiscal 2008 and may be significant in future periods.
Because our products are sophisticated and designed to be deployed in complex environments, they may have errors or defects that we find only after full deployment, which could seriously harm our business.
Our products are sophisticated and are designed to be deployed in large and complex networks. Because of the nature of our products, they can only be fully tested when substantially deployed in very large networks with high volumes of traffic. Some of our customers have only recently begun to commercially deploy our products and they may discover errors or defects in the software or hardware, or the products may not operate as expected. As we continue to expand our distribution channel through distributors and resellers, we will need to rely on and support their service and support
21
organizations. If we are unable to fix errors or other performance problems that may be identified after full deployment of our products, we could experience:
- •
- loss of, or delay in, revenues;
- •
- loss of customers and market share;
- •
- failure to attract new customers or achieve market acceptance for our products;
- •
- increased service, support and warranty costs and a diversion of development resources; and/or
- •
- costly and time-consuming legal actions by our customers.
If we are not able to obtain necessary licenses of third-party technology at acceptable prices, or at all, our products could become obsolete.
We have incorporated third-party licensed technology into our current products. From time to time, we may be required to license additional technology from third parties to develop new products or product enhancements. Third-party licenses may not be available or continue to be available to us on commercially reasonable terms or may be available to us but only at significantly escalated pricing. Additionally, we may not be able to replace the functionality provided by third-party software currently offered with our products if that software becomes obsolete, defective or incompatible with future versions of our products or is not adequately maintained or updated. The inability to maintain or re-license any third-party licenses required in our current products or to obtain any new third-party licenses to develop new products and product enhancements could require us to obtain substitute technology of lower quality or performance standards or at greater cost, and delay or prevent us from making these products or enhancements, any of which could seriously harm the competitiveness of our products. Any significant interruption in the availability of these third-party software products or defects in these products could harm our sales unless and until we can secure an alternative source. Although we believe there are adequate alternate sources for the technology licensed to us, such alternate sources may not provide us with the same functionality as that currently provided to us.
Because our products are deployed in large, complex networks around the world, failure to establish a support infrastructure and maintain required support levels could seriously harm our business.
Our products are deployed in large and complex networks around the world. Our customers expect us to establish a support infrastructure and maintain demanding support standards to ensure that their networks maintain high levels of availability and performance. To support the continued growth of our business, our support organization will need to provide service and support at a high level throughout the world. If we are unable to provide the expected level of support and service to our customers, we could experience:
- •
- loss of customers and market share;
- •
- a failure to attract new customers in new geographies;
- •
- increased service, support and warranty costs and a diversion of development resources; and/or
- •
- network performance penalties.
Man-made problems such as computer viruses or terrorism may disrupt our operations and harm our operating results.
Despite our implementation of network security measures, our servers are vulnerable to computer viruses, break-ins and similar disruptions from unauthorized tampering with our computer systems. Any such event could have a material adverse effect on our business, operating results and financial condition. Efforts to limit the ability of malicious third parties to disrupt the operations of the Internet
22
or undermine our own security efforts may be met with resistance. In addition, the continued threat of terrorism and heightened security and military action in response to this threat, or any future acts of terrorism, may cause further disruptions to the economies of the United States and other countries and create further uncertainties or otherwise materially harm our business, operating results and financial condition. Likewise, events such as widespread blackouts could have similar negative impacts. The extent that such disruptions or uncertainties result in delays or cancellations of customer orders or the manufacture or shipment of our products, our business, operating results and financial condition could be materially and adversely affected.
Provisions of our stockholder rights plan, charter documents and Delaware law have anti-takeover effects that could prevent a change of control.
We adopted a three-year limited duration stockholder rights plan, commonly referred to as a "poison pill," on June 26, 2008. The stockholder rights plan is designed to protect stockholders, to the extent possible, from a creeping acquisition and other tactics to gain control of us without offering all stockholders an adequate price and control premium. Under the stockholder rights plan, the acquisition of 15% or more of our outstanding common stock by any person or group (which includes for this purpose common stock referenced in derivative transactions or securities), unless approved by our Board of Directors, will trigger the right of our stockholders (other than the acquirer of 15% or more of our common stock) to acquire additional shares of our common stock and, in certain cases, the shares of the potential acquirer, having a market value of twice the exercise price of each right. A person or group who beneficially owned 15% or more of the outstanding shares of our common stock prior to the adoption of the stockholder rights plan did not cause the rights to become exercisable upon adoption of the stockholder rights plan. However, such person or group would cause the rights to become exercisable (subject to certain limited exceptions) if it becomes the beneficial owner of additional shares of our common stock or if its beneficial ownership decreases below 15% and subsequently increases to 15% or more. Because the rights may substantially dilute the stock ownership of a person or group attempting to take us over without the approval of our Board of Directors, our stockholder rights plan could make it more difficult for a third party to acquire us (or a significant percentage of our outstanding capital stock) without first negotiating with our Board of Directors regarding that acquisition.
In addition, provisions of our amended and restated certificate of incorporation, our amended and restated by-laws and Delaware law could make it more difficult for a third party to acquire us, even if doing so would be beneficial to our stockholders.
Actions that may be taken by significant stockholders may divert the time and attention of our board of directors and management from our business operations.
Campaigns by significant investors to effect changes at publicly traded companies have increased in recent years. On January 9, 2009, we entered into a letter agreement with Legatum Capital and certain of its affiliates (collectively, "Legatum"), which was filed as Exhibit 10.1 to a Current Report on Form 8-K on January 12, 2009 (the "Letter Agreement"). Legatum is currently our largest stockholder and beneficially owns approximately 25% of our outstanding stock. The Letter Agreement provides that we agreed to add two new independent directors to our Board of Directors pursuant to the Letter Agreement. The directors would be designated by Legatum, subject to approval by our Board of Directors. Two directors have been designated by Legatum and have joined our Board of Directors. Pursuant to the terms of the Letter Agreement, we have recommended, and our stockholders have approved, an amendment to our amended and restated certificate of incorporation at the 2009 Annual Meeting of Stockholders to declassify our board structure by the 2011 Annual Meeting of Stockholders. Further, we formed an ad hoc Corporate Development and Investment Committee of our Board of Directors to focus on uses of our cash, tax planning, strategic acquisitions, mergers and joint ventures,
23
with the objective of enhancing stockholder value. While we believe we have satisfied in full our obligations under the Letter Agreement, there can be no assurance that Legatum and/or any other stockholder will not pursue actions to effect changes in our management and strategic direction, including through the solicitation of proxies from our stockholders. If a proxy contest were to be pursued by Legatum and/or any other stockholder, it could result in substantial expense to us, consume significant attention of our management and Board of Directors, and disrupt our business.
Failure or circumvention of our controls and procedures could impair our ability to report accurate financial results and could seriously harm our business.
Any system of controls, however well designed and operated, is based in part on certain assumptions and can provide only reasonable, and not absolute, assurances that the objectives of the system are met. The failure or circumvention of our controls, policies and procedures could impair our ability to report accurate financial results and could have a material adverse effect on our business, results of operations and financial position.
Changes in our business strategy related to product and maintenance offerings and pricing could affect vendor specific objective evidence ("VSOE") and revenue recognition.
Our business strategy and competition within the industry could exert pricing pressure on our maintenance offerings. Changes in our product or maintenance offerings/packages and related pricing could affect VSOE and require us to reestablish VSOE for some or all of our product or service offerings. If we are required to reestablish VSOE on any of our products or services, we could be required to defer revenue recognition with an impact on the amount of revenue recognized in a reporting period.
Any changes to existing accounting pronouncements or taxation rules or practices may cause adverse fluctuations in our reported results of operations or affect how we conduct our business.
A change in accounting pronouncements or taxation rules or practices can have a significant effect on our reported results and may affect our reporting of transactions completed before the change is effective. New accounting pronouncements, taxation rules and varying interpretations of accounting pronouncements or taxation rules have occurred in the past and may occur in the future. The change to existing rules, future changes, if any, or the need for us to modify a current tax position may adversely affect our reported financial results or the way we conduct our business.
If our goodwill or intangible assets become impaired, we may be required to record a significant charge to earnings.
Under generally accepted accounting principles, we review our intangible assets for impairment when events or changes in circumstances indicate the carrying value may not be recoverable. Goodwill is tested for impairment at least annually. Factors that may be considered a change in circumstances indicating that the carrying value of our goodwill or intangible assets may not be recoverable include significant underperformance relative to plan or long-term projections, strategic changes in business strategy, significant negative industry or economic trends, significant change in circumstances relative to a large customer, significant decline in our stock price for a sustained period and decline in our market capitalization to below net book value. In connection with the preparation of our financial statements for the second and fourth quarters of fiscal 2008, we identified several impairment indicators related to the intangible assets and goodwill allocated to Zynetix Ltd. and the intangible assets allocated to Atreus Systems, Inc. and performed assessments of the carrying value of these assets. As a result of these assessments, we recorded impairment charges aggregating $6.3 million for the year ended December 31, 2008, of which $3.6 million is included as a component of Loss from discontinued operations in our consolidated statement of operations. We may be required to record a significant charge to earnings in
24
our financial statements in future periods if any additional impairment of our intangible assets or goodwill is determined, negatively impacting our results of operations.
If we fail to hire and retain needed personnel, the implementation of our business plan could slow or our future growth could halt.
Our business depends upon highly skilled technical, managerial, engineering, sales, marketing and customer support personnel. Competition for these personnel is intense, especially once the economy begins to recover. Any failure to hire, assimilate in a timely manner and retain needed qualified personnel, particularly engineering and sales personnel, could impair our growth and make it difficult to meet key objectives, such as timely and effective product introductions.
Our future success depends upon the continued services of our executive officers who have critical industry experience and relationships that we rely on to implement our business plan. None of our officers or key employees is bound by an employment agreement for any specific term. The loss of the services of any of our officers or key employees could delay the development and introduction of, and negatively impact our ability to sell, our products and achieve our business objectives.
We have a limited number of shares available to issue to our employees, which could impact our ability to attract, retain and motivate key personnel.
We historically have used stock options as a significant component of our employee compensation program in order to align employees' interests with the interests of our stockholders, encourage employee retention, and provide competitive compensation packages. In 2007, our stockholders approved a stock incentive plan, which includes a limited amount of shares to be granted under such plan. The limited number of shares available for use as equity incentives to employees may make it more difficult for us to attract, retain and motivate key personnel.
Restructuring activities could adversely affect our ability to execute our business strategy.
In December 2008, we announced a restructuring of our business in which we reduced our workforce by approximately 5%. In January 2009, we announced a second restructuring initiative, which further reduced our workforce by approximately 4%. In August 2009, we announced a third restructuring initiative, which further reduced our workforce by approximately 10%. This restructuring and any future restructurings, should it become necessary for us to continue to restructure our business due to worldwide market conditions or other factors that reduce the demand for our products and services, could adversely affect our ability to execute our business strategy in a number of ways, including:
- •
- loss of key employees;
- •
- diversion of management's attention from normal daily operations of the business;
- •
- diminished ability to respond to customer requirements related to both products and services;
- •
- disruption of our engineering and manufacturing processes, which could adversely affect our ability to introduce new
products and to deliver products both on a timely basis and in accordance with the highest quality standards; and
- •
- reduced ability to execute effectively internal administrative processes, including the implementation of key information technology programs.
If we are subject to employment claims, we could incur substantial costs in defending ourselves.
We are subject to employment claims in connection with employee terminations. In addition, companies in our industry whose employees accept positions with competitors may claim that their
25
competitors have engaged in unfair hiring practices. These claims may result in material litigation. We could incur substantial costs defending ourselves or our employees against those claims, regardless of their merits. In addition, defending ourselves from those types of claims could divert our management's attention from our operations. The cost of employment claims may also increase as a result of our increasing international expansion. If we are found liable in connection with any employment claim, we may incur significant costs that could adversely impact our financial position and results of operations.
We depend upon a single contract manufacturer and any disruption in this relationship may cause us to fail to meet the demands of our customers and damage our customer relationships.
We rely on a contract manufacturer to manufacture our products according to our specifications and to fill orders on a timely basis. Our contract manufacturer provides comprehensive manufacturing services, including assembly and certain tests of our products and procurement of materials. Our contract manufacturer also builds products for other companies and may not always have sufficient quantities of inventory available to fill our orders or may not allocate their internal resources to fill these orders on a timely basis. We neither have a long-term supply contract with our manufacturer nor internal manufacturing capabilities to meet our customers' demands. Moreover, our manufacturer is not required to manufacture products for any specified period. Qualifying a new contract manufacturer and commencing commercial scale production is expensive and time consuming and could result in a significant interruption in the supply of our products. If a change in contract manufacturers results in delays in our fulfillment of customer orders or if a contract manufacturer fails to make timely delivery of orders, we may lose revenues and suffer damage to our customer relationships.
We and our contract manufacturer rely on single or limited sources for supply of some components of our products and if we fail to adequately predict our manufacturing requirements or if our supply of any of these components is disrupted, we will be unable to ship our products.
We and our contract manufacturer currently purchase several key components of our products, including commercial digital signal processors, from single or limited sources. We purchase these components on a purchase order basis. If we overestimate our component and finished goods requirements, we could have excess inventory, which would increase our costs. If we underestimate our requirements, we may not have an adequate supply, which could interrupt manufacturing of our products and result in delays in shipments and revenues. Moreover, we cannot be certain or provide any assurance that our contract manufacturer will accept any or all of the purchase orders and agree to supply any or all of the quantities requested. Additionally, if our contract manufacturers underestimate our requirements, they may not have an adequate supply, which could interrupt manufacturing of our products and result in delays in shipments. If any of our sole or limited source suppliers experience capacity constraints, work stoppages or other reductions or disruptions in output, they may not be able to meet, or may choose not to meet, our delivery schedules. In light of the continuing downturn in the global economic conditions, there is also a risk that our distributors could experience interruptions in production or operations or alter our current arrangements. If our supply of any key components is disrupted, we may be unable to deliver our products to our customers on a timely basis, which could result in lost or delayed revenue, injury to our reputation, increased manufacturing costs and exposure to claims by our customers. Even if alternate suppliers are available, we may have difficulty identifying them in a timely manner, incur significant additional expense in changing suppliers, and experience difficulties or delays in the manufacturing of our products. Any failure to meet our customers' delivery requirements could harm our reputation and may have a material adverse effect on our consolidated financial position, results of operations, or cash flows.
We currently do not have long-term supply contracts with our component suppliers and they are not required to supply us with products for any specified periods, in any specified quantities or at any set price, except as may be specified in a particular purchase order. In the event of a disruption or
26
delay in supply, or inability to obtain products, we may not be able to develop an alternate source in a timely manner or at favorable prices, or at all. A failure to find acceptable alternative sources could hurt our ability to deliver high-quality products to our customers and negatively affect our operating margins. In addition, reliance on our suppliers exposes us to potential supplier production difficulties, quality variations and unforeseen price increases. Our customers rely upon our ability to meet committed delivery dates, and any disruption in the supply of key components would seriously adversely affect our ability to meet these dates and could result in legal action by our customers, loss of customers or harm our ability to attract new customers. Additionally, any unforeseen price increases could reduce our profitability or force us to increase our prices, which could result in a loss of customers or harm our ability to attract new customers.
Failure by our strategic partners or by us in integrating products provided by our strategic partners could seriously harm our business.
Our solutions include the integration of products supplied by strategic partners, who offer complementary products and services. We rely on these strategic partners in the timely and successful deployment of our solutions to our customers. If the products provided by these partners have defects or do not operate as expected or if we do not effectively integrate and support products supplied by these strategic partners, then we may have difficulty with the deployment of our solutions that may result in:
- •
- loss of, or delay in, revenues;
- •
- increased service, support and warranty costs and a diversion of development resources; and
- •
- network performance penalties.
In addition to cooperating with our strategic partners on specific customer projects, we also may compete in some areas with these same partners. If these strategic partners fail to perform or choose not to cooperate with us on certain projects, in addition to the effects described above, we could experience:
- •
- loss of customers and market share; and
- •
- a failure to attract new customers or achieve market acceptance for our products.
Any investments or acquisitions we make could disrupt our business and seriously harm our financial condition.
In addition to investing in organic growth, we will consider other compelling opportunities to deliver greater shareholder value, if and when such opportunities arise. In the event of future investments or acquisitions, we could:
- •
- issue stock that would dilute our current stockholders' percentage ownership;
- •
- reduce significantly our cash and investments;
- •
- incur debt or assume liabilities;
- •
- incur significant impairment charges related to the write-off of goodwill and intangible assets;
- •
- incur significant amortization expenses related to intangible assets; or
- •
- incur large and immediate write-offs for in-process research and development and stock-based compensation.
27
Our integration of any acquired products, technologies or businesses could also involve numerous risks, including:
- •
- problems and unanticipated costs associated with combining the purchased products, technologies or businesses;
- •
- diversion of management's attention from our core business;
- •
- adverse effects on existing business relationships with suppliers and customers;
- •
- risks associated with entering markets in which we have limited or no prior experience;
- •
- potential loss of key employees, particularly those of the acquired organizations; and
- •
- integration of internal controls and financial systems.
We may be unable to successfully integrate any products, technologies, businesses or personnel that we might acquire in the future without significant costs or disruption to our business.
We are exposed to fluctuations in currency exchange rates that could negatively impact our financial results and cash flows.
Because a portion of our business is conducted outside the United States, we face exposure to adverse movements in foreign currency exchange rates. These exposures may change over time as business practices evolve, and they could have a material adverse impact on our financial results and cash flows. An increase in the value of the dollar could increase the real cost to our customers of our products in those markets outside the United States where we often sell in dollars, and a weakened dollar could increase the cost of local operating expenses and procurement of raw materials from sources outside the United States.
Consolidation in the telecommunications industry could harm our business.
The industry has experienced consolidation and we expect this trend to continue. Consolidation among our customers may cause delays or reductions in capital expenditure plans and/or increased competitive pricing pressures as the number of available customers declines and their relative purchasing power increases in relation to suppliers. Any of these factors could adversely affect our business.
Regulation of the telecommunications industry could harm our operating results and future prospects.
The telecommunications industry is highly regulated and our business and financial condition could be adversely affected by the changes in the regulations relating to the telecommunications industry. Currently, there are few laws or regulations that apply directly to access to or delivery of voice services on IP networks. We could be adversely affected by regulation of IP networks and commerce in any country where we operate, including the United States. Such regulations could include matters such as voice over the Internet or using Internet protocol, encryption technology, and access charges for service providers. The adoption of such regulations could decrease demand for our products, and at the same time increase the cost of selling our products, which could have a material adverse effect on our business, operating results and financial position.
Changes in government regulation relating to healthcare reform could negatively affect our operating results and revenues.
The federal government in the United States is currently considering healthcare reform legislation that will significantly change healthcare in the United States. We would be subject to the rules and regulations relating to such healthcare reform. Compliance with these and similar healthcare regulations, if any, may materially increase our healthcare costs, which could adversely affect our operating results and revenues.
Item 1B. Unresolved Staff Comments
Not applicable.
28
Our corporate headquarters is located in a leased facility in Westford, Massachusetts, consisting of 130,000 square feet under a lease that expires in July 2012. In addition to our corporate headquarters, we maintained, as of December 31, 2009, the following active facilities:
Location
|
Principal use | Square footage (approximate) |
Lease expiration | ||||
|---|---|---|---|---|---|---|---|
Bangalore, India |
Engineering/development | 45,900 | January 2011 | ||||
Freehold, New Jersey |
Engineering/development | 28,500 | December 2015 | ||||
Richardson, Texas |
Sales and customer support | 26,500 | October 2010 | ||||
Ottawa, Ontario |
Engineering/development and sales and customer support |
5,500 | December 2014 | ||||
Swindon, United Kingdom |
Engineering/development | 10,100 | June 2010 | ||||
Tokyo, Japan |
Sales and customer support | 6,700 | September 2011 | ||||
Staines, United Kingdom |
Sales and customer support | 4,300 | November 2012 | ||||
Darmstadt, Germany |
Sales and customer support | 3,600 | October 2012 | ||||
McLean, Virginia |
Engineering/development | 3,000 | November 2010 | ||||
As of December 31, 2009, we also leased short-term office space in Colorado, China, Czech Republic, France, Singapore and the United Arab Emirates. We believe our existing facilities are adequate for our current needs and that suitable additional space will be available as needed.
2001 IPO Litigation
In November 2001, a purchaser of our common stock filed a complaint in the United States District Court for the Southern District of New York against us, two of our officers and the lead underwriters alleging violations of the federal securities laws in connection with our initial public offering ("IPO") and seeking unspecified monetary damages. The purchaser seeks to represent a class of persons who purchased our common stock between the date of the IPO on May 24, 2000 and December 6, 2000. An amended complaint was filed in April 2002. The amended complaint alleges that our registration statement contained false or misleading information or omitted to state material facts concerning the alleged receipt of undisclosed compensation by the underwriters and the existence of undisclosed arrangements between the underwriters and certain purchasers to make additional purchases in the after market. The claims against us are asserted under Section 10(b) of the Securities Exchange Act of 1934, as amended (the "Exchange Act"), and Section 11 of the Securities Act of 1933, as amended (the "Securities Act"), and against the individual defendants under Sections 11 and 15 of the Securities Act and Sections 10(b) and 20(a) of the Exchange Act. Other plaintiffs have filed substantially similar class action cases against approximately 300 other publicly-traded companies and their IPO underwriters which, along with the actions against us, have been transferred to a single federal judge for purposes of coordinated case management.
On July 15, 2002, we, collectively with the other issuers named as defendants in these coordinated proceedings, filed a collective motion to dismiss the consolidated amended complaints on various legal grounds common to all or most of the issuer defendants. The plaintiffs voluntarily dismissed the claims against many of the individual defendants, including our officers named in the complaint. On February 19, 2003, the court granted a portion of the motion to dismiss by dismissing the Section 10(b) claims against certain defendants including us, but denied the remainder of the motion as to the defendants.
In June 2003, a special committee of our Board of Directors authorized us to enter into a proposed settlement with the plaintiffs on terms substantially consistent with the terms of a Memorandum of Understanding negotiated among representatives of the plaintiffs, the issuer defendants and the insurers for the issuer defendants. In October 2004, the court certified the class in a case against certain defendants. On February 15, 2005, the court preliminarily approved the terms of the proposed settlement contingent on modifications to the proposed settlement. On August 31, 2005,
29
the court approved the terms of the proposed settlement, as modified. On April 24, 2006, the court held a hearing on a motion to approve the final settlement and took the matter under advisement.
On December 5, 2006, the United States Court of Appeals for the Second Circuit reversed the court's October 2004 order certifying a class. On June 25, 2007, the court entered an order terminating the settlement. On November 13, 2007, the issuer defendants in certain designated "focus cases" filed a motion to dismiss the second consolidated amended class action complaints that were filed in those cases. On March 26, 2008, the court issued an Opinion and Order denying, in large part, the motions to dismiss the amended complaints in the "focus cases." On April 2, 2009, the plaintiffs filed a motion for preliminary approval of a new proposed settlement between plaintiffs, the underwriter defendants, the issuer defendants and the insurers for the issuer defendants. On June 10, 2009, the court issued an opinion preliminarily approving the proposed settlement, and scheduling a settlement fairness hearing for September 10, 2009. On August 25, 2009, the plaintiffs filed a motion for final approval of the proposed settlement, approval of the plan of distribution of the settlement fund, and certification of the settlement classes. On August 25, 2009, the plaintiffs filed a motion for final approval of the proposed settlement, approval of the plan of distribution of the settlement fund, and certification of the settlement classes. A settlement fairness hearing was held on September 10, 2009. On October 5, 2009, the court issued an opinion granting plaintiffs' motion for final approval of the settlement, approval of the plan of distribution of the settlement fund, and certification of the settlement classes. Various notices of appeal of the court's October 5, 2009 order have been filed. An Order and Final Judgment was entered on January 14, 2010. Due to the inherent uncertainties of litigation, the Company is unable to determine the ultimate outcome or potential range of loss, if any.
On October 5, 2007, Vanessa Simmonds, a purported shareholder, filed a complaint in the United States District Court for the Western District of Washington for recovery of short-swing profits under Section 16(b) of the Exchange Act against the underwriters in the IPO in 2000. On February 28, 2008, the plaintiff filed an amended complaint asserting substantially similar claims as set forth in the initial complaint. The amended complaint seeks recovery against the underwriters for profits they received from the sale of our common stock in connection with the IPO. The Company was named as a nominal defendant but has no liability for the asserted claims. No Sonus officers or directors were named in the amended complaint. Between October 2, 2007 and October 12, 2007, the plaintiff also filed 54 separate lawsuits naming 54 additional issuers as nominal defendants and ten underwriters as defendants. These 54 cases, along with the complaint filed by the plaintiff with respect to the Company's IPO, were reassigned to the Honorable James L. Robart (the "Judge") as related cases. On July 25, 2008, the underwriters and 29 of the issuer defendants (including Sonus) filed motions to dismiss the case. On September 8, 2008, the plaintiff filed oppositions to the motions, and the issuer and underwriter defendants filed replies in support of their motions to dismiss on October 23, 2008. Oral argument on all motions to dismiss was held on January 16, 2009, at which time the Judge took the pending motions to dismiss under advisement. The Judge stayed discovery pending his ruling on all motions to dismiss.
On March 12, 2009, the court entered its judgment and granted the moving issuers' motion to dismiss, finding plaintiff's demand letters were insufficient to put the issuers on notice of the claims asserted against them. The Judge also granted the underwriters' motion to dismiss as to the claims arising from the non-moving issuers' IPOs, finding plaintiff's claims were time-barred under the applicable statute of limitations.
On March 31, 2009, the plaintiff-appellant appealed the judgment to the United States Court of Appeals for the Ninth Circuit, and thereafter filed an amended notice of appeal on April 10, 2009 at the court's request. The underwriter defendants filed a cross-appeal in each of the cases wherein the issuers moved for dismissal (including the appeal relating to the Sonus IPO). The plaintiff's opening brief on appeal was filed on August 26, 2009, and the issuers' (including the Company) and the underwriters' responses were filed on October 2, 2009. The plaintiff filed a reply brief on November 2, 2009, and underwriters filed a reply brief on their cross-appeal on November 17, 2009. We do not currently expect that this claim will have a material impact on our financial position or results of operations.
Item 4. Submission of Matters to a Vote of Security Holders
None.
30
Item 5. Market for Registrant's Common Equity, Related Stockholder Matters and Issuer Purchases of Equity Securities
Market Information
Our common stock is quoted on the NASDAQ Global Select Market under the symbol "SONS." All companies listed on the NASDAQ Global Select Market are required to comply with certain continued listing standards.
The following table sets forth, for the time periods indicated, the high and low sale prices of our common stock as reported on the NASDAQ Global Select Market.
| |
High | Low | ||||||
|---|---|---|---|---|---|---|---|---|
Fiscal 2009 |
||||||||
First quarter |
$ | 2.01 | $ | 1.09 | ||||
Second quarter |
$ | 2.45 | $ | 1.51 | ||||
Third quarter |
$ | 2.35 | $ | 1.43 | ||||
Fourth quarter |
$ | 2.29 | $ | 1.82 | ||||
Fiscal 2008 |
||||||||
First quarter |
$ | 5.95 | $ | 2.92 | ||||
Second quarter |
$ | 4.78 | $ | 3.37 | ||||
Third quarter |
$ | 4.55 | $ | 2.55 | ||||
Fourth quarter |
$ | 2.91 | $ | 1.14 | ||||
Holders
At February 17, 2010, there were approximately 600 holders of record of our common stock.
Dividend Policy
We have never declared or paid cash dividends and have no present intention to pay cash dividends in the foreseeable future.
Recent Sales of Unregistered Securities
None.
Purchases of Equity Securities by the Issuer and Affiliated Purchasers
We have not announced any current plans or programs to repurchase shares of our common stock. However, upon vesting of restricted stock awards, our employees are permitted to return to us a portion of the newly vested shares to satisfy the tax withholding obligations that arise in connection
31
with such vesting. The following table summarizes repurchases of our common stock during the fourth quarter of fiscal 2009, which represent shares returned to satisfy tax withholding obligations:
Period
|
Total Number of Shares Purchased |
Average Price Paid per Share |
Total Number of Shares Purchased as Part of Publicly Announced Plans or Programs |
Approximate Dollar Value of Shares that May Yet be Purchased Under the Plans or Programs |
||||||||||
|---|---|---|---|---|---|---|---|---|---|---|---|---|---|---|
October 1, 2009 to October 31, 2009 |
1,389 | $ | 2.12 | — | — | |||||||||
November 1, 2009 to November 30, 2009 |
396 | $ | 2.01 | — | — | |||||||||
December 1, 2009 to December 31, 2009 |
64,496 | $ | 2.13 | — | — | |||||||||
Total |
66,281 | $ | 2.13 | — | — | |||||||||
Performance Graph
The following performance graph compares the cumulative total return to stockholders for our common stock for the period from December 31, 2004 through December 31, 2009 with the cumulative total return over the same period on the NASDAQ Composite Index and the NASDAQ Telecommunications Index. The comparison assumes an investment of $100 on December 31, 2004 in our common stock and in each of the indices and, in each case, assumes reinvestment of all dividends, if any. The performance shown is not necessarily indicative of future performance.
COMPARISON OF 5 YEAR CUMULATIVE TOTAL RETURN*
Among Sonus Networks, Inc., The NASDAQ Composite Index
And The NASDAQ Telecommunications Index
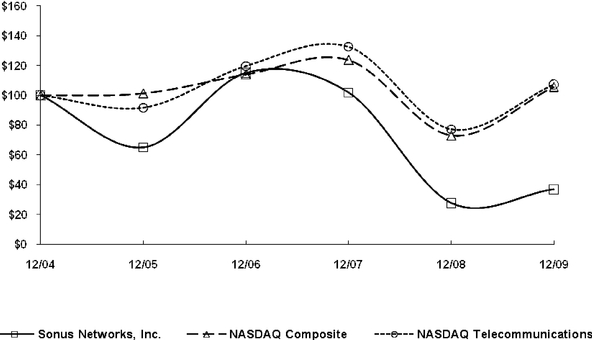
*$100 invested on 12/31/04 in stock or index, including reinvestment of dividends.
Fiscal year ending December 31.
32
ITEM 6. SELECTED FINANCIAL DATA
The following selected consolidated financial data should be read in conjunction with "Management's Discussion and Analysis of Financial Condition and Results of Operations" and our consolidated financial statements and notes thereto included elsewhere in this Annual Report on Form 10-K.
| |
Year ended December 31, | |||||||||||||||||
|---|---|---|---|---|---|---|---|---|---|---|---|---|---|---|---|---|---|---|
Consolidated Statement of Operations Data (In thousands, except per share amounts) |
||||||||||||||||||
| 2009 | 2008(1) | 2007 | 2006(2) | 2005 | ||||||||||||||
Revenue: |
||||||||||||||||||
Product |
$ | 136,276 | $ | 203,387 | $ | 225,644 | $ | 203,592 | $ | 135,198 | ||||||||
Service |
91,220 | 109,758 | 93,771 | 75,891 | 60,164 | |||||||||||||
Total revenue |
227,496 | 313,145 | 319,415 | 279,483 | 195,362 | |||||||||||||
Cost of revenue: |
||||||||||||||||||
Product |
38,893 | 74,274 | 90,976 | 70,823 | 53,542 | |||||||||||||
Service |
44,467 | 56,020 | 37,513 | 29,609 | 24,683 | |||||||||||||
Total cost of revenue |
83,360 | 130,294 | 128,489 | 100,432 | 78,225 | |||||||||||||
Gross profit |
144,136 | 182,851 | 190,926 | 179,051 | 117,137 | |||||||||||||
Operating expenses: |
||||||||||||||||||
Research and development |
59,864 | 73,098 | 78,898 | 55,446 | 47,581 | |||||||||||||
Sales and marketing |
48,929 | 74,364 | 81,602 | 65,748 | 45,913 | |||||||||||||
General and administrative |
43,217 | 62,045 | 56,652 | 35,366 | 27,699 | |||||||||||||
Litigation settlement, net of insurance recovery |
— | 19,100 | 24,672 | — | — | |||||||||||||
Impairment of intangible assets |
— | 2,727 | — | — | — | |||||||||||||
Restructuring expense |
3,510 | 702 | — | — | — | |||||||||||||
Total operating expenses |
155,520 | 232,036 | 241,824 | 156,560 | 121,193 | |||||||||||||
Income (loss) from operations |
(11,384 | ) | (49,185 | ) | (50,898 | ) | 22,491 | (4,056 | ) | |||||||||
Interest and other income (expense), net |
3,993 | 12,710 | 19,297 | 15,405 | 9,380 | |||||||||||||
Income (loss) from continuing operations before income taxes |
(7,391 | ) | (36,475 | ) | (31,601 | ) | 37,896 | 5,324 | ||||||||||
Income tax benefit (provision) |
2,459 | (79,675 | ) | 8,474 | 64,958 | (539 | ) | |||||||||||
Income (loss) from continuing operations |
(4,932 | ) | (116,150 | ) | (23,127 | ) | 102,854 | 4,785 | ||||||||||
Loss from discontinued operations |
— | (4,491 | ) | (1,086 | ) | — | — | |||||||||||
Loss on sale of discontinued operations |
— | (741 | ) | — | — | — | ||||||||||||
Net income (loss) |
$ | (4,932 | ) | $ | (121,382 | ) | $ | (24,213 | ) | $ | 102,854 | $ | 4,785 | |||||
Earnings (loss) per share: |
||||||||||||||||||
Basic: |
||||||||||||||||||
Continuing operations |
$ | (0.02 | ) | $ | (0.43 | ) | $ | (0.09 | ) | $ | 0.41 | $ | 0.02 | |||||
Discontinued operations |
— | (0.02 | ) | — | — | — | ||||||||||||
|
$ | (0.02 | ) | $ | (0.45 | ) | $ | (0.09 | ) | $ | 0.41 | $ | 0.02 | |||||
Diluted: |
||||||||||||||||||
Continuing operations |
$ | (0.02 | ) | $ | (0.43 | ) | $ | (0.09 | ) | $ | 0.40 | $ | 0.02 | |||||
Discontinued operations |
— | (0.02 | ) | — | — | — | ||||||||||||
|
$ | (0.02 | ) | $ | (0.45 | ) | $ | (0.09 | ) | $ | 0.40 | $ | 0.02 | |||||
Shares used to compute earnings (loss) per share: |
||||||||||||||||||
Basic |
273,730 | 271,477 | 262,924 | 253,771 | 248,584 | |||||||||||||
Diluted |
273,730 | 271,477 | 262,924 | 258,338 | 252,803 | |||||||||||||
| |
December 31, | |||||||||||||||
|---|---|---|---|---|---|---|---|---|---|---|---|---|---|---|---|---|
Consolidated Balance Sheet Data (In thousands) |
||||||||||||||||
| 2009 | 2008 | 2007 | 2006 | 2005 | ||||||||||||
Cash and cash equivalents |
$ | 125,323 | $ | 122,207 | $ | 118,933 | $ | 44,206 | $ | 155,679 | ||||||
Short-term marketable securities |
$ | 239,223 | $ | 180,786 | $ | 207,088 | $ | 256,485 | $ | 140,569 | ||||||
Long-term investments |
$ | 49,598 | $ | 84,965 | $ | 66,568 | $ | 60,189 | $ | 17,993 | ||||||
Working capital |
$ | 352,409 | $ | 327,088 | $ | 365,204 | $ | 312,197 | $ | 278,047 | ||||||
Total assets |
$ | 540,737 | $ | 535,585 | $ | 694,168 | $ | 589,604 | $ | 457,206 | ||||||
Long-term deferred revenue, net of current portion |
$ | 25,242 | $ | 37,991 | $ | 16,462 | $ | 33,787 | $ | 33,853 | ||||||
Long-term liabilities, net of current portion |
$ | 1,127 | $ | 1,865 | $ | 2,061 | $ | 1,467 | $ | 1,449 | ||||||
Convertible subordinated note |
$ | — | $ | — | $ | — | $ | — | $ | 10,000 | ||||||
Total stockholders' equity |
$ | 414,238 | $ | 406,435 | $ | 493,704 | $ | 432,533 | $ | 278,812 | ||||||
- (1)
- Includes
the results of operations of Atreus Systems, Inc. for the period subsequent to its acquisition by the Company on April 18, 2008 and
$88.4 million of income tax expense related to the recording of a valuation allowance on certain deferred tax assets.
- (2)
- Includes an income tax benefit of $82.6 million related to the reversal of a valuation allowance on certain deferred tax assets.
33
Item 7. Management's Discussion and Analysis of Financial Condition and Results of Operations
The following discussion should be read in conjunction with our consolidated financial statements and notes to those statements and other financial information appearing elsewhere in this Annual Report on Form 10-K. The following discussion contains forward looking information that involves risks and uncertainties. Our actual results could differ materially from those anticipated in the forward looking statements as a result of a number of factors, including the risks discussed in Item 1A. "Risk Factors" and elsewhere in this Annual Report on Form 10-K. These forward-looking statements are based on our current expectations, assumptions, estimates and projections about our industry and ourselves, and we do not undertake an obligation to update our forward-looking statements to reflect future events or circumstances.
Overview
We are a leading provider of voice infrastructure solutions for wireline and wireless service providers. Our products are a new generation of carrier-class infrastructure equipment and software that enables voice services to be delivered over Internet Protocol ("IP") packet-based networks. Our target customers include both traditional and emerging communications service providers, including long distance carriers, local exchange carriers, Internet service providers, wireless operators, cable operators, international telephone companies and carriers that provide services to other carriers. IP packet-based networks, which transport traffic in small bundles, or "packets," offer a significantly more flexible, cost-effective and efficient means for providing communications services than existing circuit-based networks, designed years ago to primarily deliver telephone calls.
Our voice infrastructure solutions allow wireline and wireless operators to build converged voice over IP ("VoIP") networks. Our products are built on the same distributed, IP-based principles embraced by the IP Multimedia Subsystem ("IMS") architecture, as defined by the Third Generation Partnership Project ("3GPP"). This IMS architecture is being accepted by network operators globally as the common approach for building converged voice, data, wireline and wireless networks. Since the IMS architecture is based primarily on IP packets and the Session Initiation Protocol ("SIP"), which has been the foundation of our products since our formation, we are uniquely positioned to offer an intuitive evolution from a distributed softswitch architecture to IMS with little or no impact on existing Sonus equipment or services. Additionally, the Sonus all-IP architecture is positioned to take advantage of wireless long-term evolution ("LTE") implementations as they emerge. Our investment in product development is focused on delivering high-growth solutions that leverage these IMS and LTE architectures.
We sell our products primarily through a direct sales force and, in some markets, through or with the assistance of resellers and distributors. Customers' decisions to purchase our products to deploy in commercial networks involve a significant commitment of resources and a lengthy evaluation, testing and product qualification process. Our revenue and results of operations may vary significantly and unexpectedly from quarter to quarter as a result of long sales cycles, our expectation that customers will tend to sporadically place large orders with short lead times and the application of complex revenue recognition rules to certain transactions, which may result in customer shipments and orders from multiple quarters being recognized as revenue in one quarter. We expect to recognize revenue from a limited number of customers for the foreseeable future.
We incurred net losses of $4.9 million in fiscal 2009, $121.4 million in fiscal 2008 and $24.2 million in fiscal 2007. We reported losses from operations of $11.4 million for fiscal 2009, $49.2 million for fiscal 2008 and $50.9 million in fiscal 2007. Our losses from continuing operations for fiscal 2008 and 2007 were $116.2 million and $23.1 million, respectively. Our loss from continuing operations in fiscal 2008 includes $88.4 million of income tax expense related to a valuation allowance recorded on all of our net deferred tax assets in the United States.
34
Our lower revenue in fiscal 2009 was a significant factor in our reported net loss. This lower revenue resulted in lower gross profit of $144.1 million, compared to $182.9 million in fiscal 2008 and $190.9 million in fiscal 2007.
Operating expenses were $155.5 million in fiscal 2009, compared to $232.0 million in fiscal 2008 and $241.8 million in fiscal 2007. Operating expenses included $19.1 million and $24.7 million of expense for litigation settlements, net of insurance recovery, in fiscal 2008 and fiscal 2007, respectively. In fiscal 2008 we recorded $19.1 million of litigation settlement expense in the aggregate for litigation against certain of our customers alleging patent infringement of U.S. Patent No. 6,243,373 entitled "Method and Apparatus for Implementing a Computer Network Internet Telephone System" (the "C2 Patent Litigation") and a Consolidated Amended Complaint alleging that we made false and misleading statements about our products and business (the "2002 Securities Litigation"). In fiscal 2007 we recorded $24.7 million of litigation settlement expense, net of insurance recovery, related to an agreement to settle litigation against the Company and certain of our former and then-current officers alleging violations of federal securities laws in connection with the restatement in 2004 of our financial statements (the "2004 Restatement Litigation").
In addition to the absence of litigation settlement expense in fiscal 2009, the reduction in operating expenses in fiscal 2009 compared to fiscal 2008 and fiscal 2007 is also attributable to lower personnel-related costs as a result of lower stock-based compensation and our recent restructuring initiatives. We recorded $3.5 million in fiscal 2009 for three separate restructuring initiatives, which occurred in January, March and August 2009, and which reduced our headcount by approximately 190 employees in the aggregate. We recorded $0.7 million in the fourth quarter of fiscal 2008 for a restructuring initiative that reduced our headcount by approximately 50 employees. However, while we have eliminated jobs in some areas of the business, we have continued to hire in some geographies to support future business plans, including increased hiring activity in our research and development facility in India. We recorded stock-based compensation expense of $12.8 million in fiscal 2009, $25.1 million in fiscal 2008 and $42.5 million in fiscal 2007.
Lower portfolio yield on our cash, cash equivalents and investments was also a factor in our current year net loss. Interest income was $4.1 million in fiscal 2009, compared to $12.6 million in fiscal 2008 and $18.4 million in fiscal 2007.
We continue to focus on the key elements of our strategy, which is designed to capitalize on our technology and leadership position in the market and to build a premier franchise in packet-based voice infrastructure solutions. We are currently focusing major efforts on the following aspects of our business:
- •
- leveraging our technology leadership to attract and retain key service providers;
- •
- embracing the principles outlined by 3GPP and delivering the industry's most advanced IMS-ready product suite;
- •
- expanding and broadening our customer base by targeting specific market segments, such as wireless operators;
- •
- assisting our customers' ability to differentiate themselves by offering a sophisticated application development platform
and service creation environment;
- •
- expanding our solutions to address emerging IP-based markets, such as network border switching;
- •
- expanding our global sales, marketing, support and distribution capabilities;
- •
- actively contributing to the standards definition and adoption process; and
- •
- pursuing strategic acquisitions and alliances.
35
Critical Accounting Policies and Estimates
Management's discussion and analysis of the financial condition and results of operations is based upon our consolidated financial statements, which have been prepared in accordance with accounting principles generally accepted in the United States of America. The preparation of these financial statements requires us to make estimates and judgments that affect the reported amounts of assets, liabilities, revenues and expenses, and related disclosure of contingent assets and liabilities. We base our estimates and judgments on historical experience, knowledge of current conditions and beliefs of what could occur in the future given available information. We consider the following accounting policies to be both those most important to the portrayal of our financial condition and those that require the most subjective judgment. If actual results differ significantly from management's estimates and projections, there could be a material effect on our financial statements. The significant accounting policies that we believe are the most critical include the following:
- •
- Revenue recognition;
- •
- Allowance for doubtful accounts;
- •
- Inventory reserves;
- •
- Loss contingencies and reserves;
- •
- Stock-based compensation;
- •
- Goodwill and intangible assets; and
- •
- Accounting for income taxes.
Revenue Recognition. We recognize revenue from product sales when persuasive evidence of an arrangement exists, delivery has occurred, the sale price is fixed or determinable, and collectibility of the related receivable is probable under customary payment terms. When we have future obligations, including a requirement to deliver additional elements which are essential to the functionality of the delivered elements or for which vendor specific objective evidence of fair value ("VSOE") does not exist or when customer acceptance is required, we defer revenue recognition and related costs until those obligations are satisfied.
Many of our sales involve multiple-element arrangements. When a sale includes multiple elements, such as products, maintenance and/or professional services, we recognize revenue using the residual method, as we have not established VSOE for our products or specified features/upgrades. Revenue associated with elements for which VSOE has been established is recorded based on the VSOE value; revenue associated with any undelivered elements that are considered not essential to the functionality of the product and for which VSOE has been established is deferred based on the VSOE value, and any remaining arrangement fee is then allocated to, and recognized as, product revenue. We have established VSOE for maintenance arrangements (post-contract support) and some professional services. VSOE for maintenance and professional services is either determined by the price charged when the same element is sold separately or established by management having the relevant pricing authority. The Company's Pricing Committee has the relevant authority for establishing pricing for products and services. If we cannot establish VSOE for any undelivered element, including specified features and upgrades, we defer revenue on the entire arrangement until VSOE for all undelivered elements is known or all elements are delivered and all other revenue recognition criteria are met.
Revenue from maintenance and support services is recognized ratably over the service period. Earned maintenance revenue is deferred until the associated product is accepted by the customer and all other revenue recognition criteria have been met. Maintenance and support services include telephone support, return and repair support and unspecified rights to product upgrades and enhancements.
36
Revenue from installation services is generally recognized when the services are complete and all other revenue recognition criteria have been met. Revenue from other professional services for which VSOE has been established is typically recognized as the services are delivered if all other revenue criteria have been met.
Revenue from consulting, custom development and other professional services-only engagements is recognized as services are rendered, provided all other revenue recognition criteria have been met.
We record deferred revenue for products delivered or services performed for which collection of the amount billed is either probable or has been collected but for which other revenue recognition criteria have not been met. Deferred revenue includes customer deposits and amounts associated with maintenance contracts. Deferred revenue expected to be recognized as revenue more than one year subsequent to the balance sheet date is reported with long-term liabilities in the consolidated balance sheets.
We defer recognition of incremental direct costs, such as cost of goods, third party installations and commissions until recognition of the related revenue. Such costs are classified as current assets if the deferred revenue is initially classified as current and noncurrent assets if the related deferred revenue is initially classified as long-term.
We sell the majority of our products directly to our service provider customers. For products sold to resellers and distributors with whom we have at least eight quarters of consistent history regarding the potential for product returns or refunds, or any form of concession, we recognize revenue on a sell-in basis. For all other resellers and distributors we recognize revenue on a sell-through basis.
Beginning in the fourth quarter of fiscal 2008, we concluded that we no longer had sufficient evidence of VSOE on maintenance services for one of our largest customers. Therefore, all revenue related to multiple element arrangements for this customer entered into beginning in the fourth quarter of fiscal 2008 is being recognized ratably over the maintenance period. Revenue recognition on multiple element arrangements with this customer will begin when the only undelivered element of the arrangement is maintenance.
We exclude any taxes assessed by a governmental authority that are directly imposed on a revenue-producing transaction (i.e., sales, use, value added) from our revenue and costs. Reimbursement for out-of-pocket expenses is recorded as revenue.
We record deferred revenue for product delivered or services performed for which collection of the amount billed is either probable or has been collected but other revenue recognition criteria have not been satisfied. Deferred revenue includes customer deposits and amounts associated with maintenance contracts. Deferred revenue expected to be recognized as revenue more than one year subsequent to the balance sheet date is classified as long-term deferred revenue.
We defer recognition of incremental direct costs, such as cost of goods, commissions and third-party installation costs, until satisfaction of the criteria for recognition of the related revenue. Deferred incremental direct costs that relate to deferred revenue that is classified as current are classified as current assets. When a portion of the deferred revenue related to a customer arrangement is classified as long-term, the incremental costs relating to the arrangement are classified as noncurrent assets.
Allowance for Doubtful Accounts. We establish billing terms at the time we negotiate purchase agreements with our customers. We monitor our outstanding receivables for timely payments and potential collection issues. The allowance for doubtful accounts is estimated based on our detailed assessment of the collectibility of specific customer accounts.
Inventory Reserves. Inventory purchases and commitments are based upon estimated future demand for our products. We value inventory at the lower of cost on a first-in, first-out basis or net realizable value. We provide inventory reserves based on excess and obsolete inventory determined
37
primarily by future demand forecasts and estimated returns of defective product, and record charges to cost of revenue. We assess such demand forecasts and return history on at least a quarterly basis. If we record a charge to reduce inventory to its estimated net realizable value, we do not increase its carrying value due to subsequent changes in demand forecasts or product repairs. Accordingly, if inventory previously reserved for is subsequently sold, we may realize improved gross profit margins on those transactions in the period the related revenue is recognized.
We record a full inventory reserve for evaluation equipment at the time of shipment to our customers, as it is not probable that the inventory value will be realizable.
Loss Contingencies and Reserves. We are subject to ongoing business risks arising in the ordinary course of business that affect the estimation process of the carrying value of assets, the recording of liabilities and the possibility of various loss contingencies. An estimated loss contingency is accrued when it is probable that a liability has been incurred or an asset has been impaired and the amount of loss can be reasonably estimated. We regularly evaluate current information available to determine whether such amounts should be adjusted and record changes in estimates in the period they become known. We are subject to various legal claims, including securities litigation. We reserve for legal contingencies and legal fees when the amounts are probable and reasonably estimable. Our director and officer liability insurance policies provide only limited liability protection relating to the securities class action and derivative lawsuits against us and certain of our officers and directors.
Stock-Based Compensation. Our stock-based compensation cost is measured at the grant date based on the fair value of the award and is recognized as expense over the requisite service period, which is generally the vesting period.
We use the Black-Scholes valuation model for estimating the fair value on the date of grant of employee stock options. Determining the fair value of stock option awards at the grant date requires judgment regarding certain valuation assumptions, including the volatility of our stock price, expected term of the option, risk-free interest rate and expected dividends. Changes in such assumptions and estimates could result in different fair values and could therefore impact our earnings. Such changes would not impact our cash flows. The fair value of restricted stock and performance stock awards is based upon our stock price on the grant date.
The amount of stock-based compensation expense recorded in any period for unvested awards requires estimates of the amount of stock-based awards that are expected to be forfeited prior to vesting, as well as assumptions regarding the probability that performance awards will be earned. Assuming it was probable that the performance conditions for all outstanding performance-based stock awards would be satisfied, we would have recognized approximately $500,000 of additional stock-based compensation expense in fiscal 2009.
Goodwill and Intangible Assets. Goodwill and intangible assets with indefinite lives are tested annually for impairment. Intangible assets with estimated lives and other long-lived assets are reviewed for impairment when events or changes in circumstances indicate that the carrying amount of an asset may not be recoverable. Recoverability of intangible assets with estimated lives and other long-lived assets is measured by comparing the carrying amount of the asset to future net undiscounted cash flows expected to be generated by the asset. If these comparisons indicate that an asset is not recoverable, we will recognize an impairment loss for the amount by which the carrying value of the asset exceeds the related estimated fair value. Estimated fair value is based on either discounted future operating cash flows or appraised values, depending on the nature of the asset. Considerable judgment is required to estimate discounted future operating cash flows. Judgment is also required in determining whether an event has occurred that may impair the value of goodwill or identifiable intangible or other long-lived assets. Factors that could indicate an impairment may exist include significant underperformance relative to plan or long-term projections, strategic changes in business strategy, significant negative
38
industry or economic trends, a significant change in circumstances relative to a large customer, a significant decline in our stock price for a sustained period and a decline in our market capitalization to below net book value. We must make assumptions about future cash flows, future operating plans, discount rates and other factors in the models and valuation reports. To the extent these future projections and estimates change, the estimated amounts of impairment could differ from current estimates. Our annual testing for impairment of goodwill is completed as of November 30 of each year. Our testing for fiscal 2009 and fiscal 2008 indicated that no impairment of goodwill existed. At November 30, 2009, our market capitalization was well above the carrying value of our reporting unit.
Accounting for Income Taxes. Our provision for income taxes is comprised of a current and a deferred portion. The current income tax provision is calculated as the estimated taxes payable or refundable on tax returns for the current year. We provide for deferred income taxes resulting from temporary differences between financial and taxable income. Such differences arise primarily from tax net operating loss and credit carryforwards, depreciation, deferred revenue, stock-based compensation expense, accruals and reserves.
We assess the recoverability of any tax assets recorded on the balance sheet and provide any necessary valuation allowances as required. In evaluating our ability to recover our deferred tax assets, we consider all available positive and negative evidence including our past operating results, the existence of cumulative income in the most recent fiscal years, changes in the business in which we operate and our forecast of future taxable income. In determining future taxable income, we are responsible for assumptions utilized, including the amount of state, federal and international pre-tax operating income, the reversal of temporary differences and the implementation of feasible and prudent tax planning strategies. These assumptions require significant judgment about the forecasts of future taxable income and are consistent with the plans and estimates we are using to manage the underlying businesses. Such assessment is completed on a jurisdiction by jurisdiction basis.
At December 31, 2009, we had valuation allowances of $117.8 million to offset deferred tax assets of $119.8 million. In the event we determine it is more likely than not we will be able to use a deferred tax asset in the future in excess of its net carrying value, the valuation allowance will be reduced, thereby increasing net earnings and increasing equity in the period such determination is made. We have approximately $27 million of deferred tax assets related to compensation expenses for financial reporting purposes that are not deductible for tax purposes until options are exercised or shares vest. As employees will not exercise the underlying options unless the current market price exceeds the option exercise price and our tax deduction for restricted shares is determined as the shares vest, the ultimate realization of this benefit is directly associated with the price of our common stock. At December 31, 2009, the Company's stock price of $2.11 was well below the weighted average exercise price of our common stock options of $4.90. We have recorded net deferred tax assets in some of our international subsidiaries. These amounts could change in future periods based upon our operating results and changes in tax law.
We provide for income taxes during interim periods based on the estimated effective tax rate for the full fiscal year. We record a cumulative adjustment to the tax provision in an interim period in which a change in the estimated annual effective tax rate is determined.
We have not provided for U.S. income taxes on the undistributed earnings of non-U.S. subsidiaries, as we plan to permanently reinvest these amounts.
We assess all material positions taken in any income tax return, including all significant uncertain positions, in all tax years that are still subject to assessment or challenge by relevant taxing authorities. Assessing an uncertain tax position begins with the initial determination of the position's sustainability and is measured at the largest amount of benefit that is greater than 50% likely of being realized upon ultimate settlement. As of each balance sheet date, unresolved uncertain tax positions must be reassessed, and we will determine whether (i) the factors underlying the sustainability assertion have
39
changed and (ii) the amount of recognized tax benefit is still appropriate. The recognition and measurement of tax benefits require significant judgment. Judgments concerning the recognition and measurement of a tax benefit might change as new information becomes available.
Results of Operations
Years Ended December 31, 2009 and 2008
Revenue. Revenue for the years ended December 31, 2009 and 2008 was as follows (in thousands, except percentages):
| |
Year ended December 31, |
Increase (decrease) from prior year |
||||||||||||
|---|---|---|---|---|---|---|---|---|---|---|---|---|---|---|
| |
2009 | 2008 | $ | % | ||||||||||
Product |
$ | 136,276 | $ | 203,387 | $ | (67,111 | ) | (33.0 | )% | |||||
Service |
91,220 | 109,758 | (18,538 | ) | (16.9 | )% | ||||||||
Total revenue |
$ | 227,496 | $ | 313,145 | $ | (85,649 | ) | (27.4 | )% | |||||
Product revenue is comprised of sales of our voice infrastructure products, including our GSX9000 and GSX4000 Open Services Switches, Network Border Switch, PSX Policy & Routing Server, SGX Signaling Gateway, ASX Call Feature Server, IMX Service Delivery Platform, Sonus Insight Management System, ASX Access Gateway Control Function, the Insight xAuthority Provisioning System and related product offerings. The decrease in product revenue in fiscal 2009 compared to the prior year is primarily attributable to lower product sales and shipments, principally resulting from the current macroeconomic environment, coupled with a change in the fourth quarter of fiscal 2008 to ratable recognition of revenue from AT&T over a two-year contractual maintenance period, which also impacts the timing of the recognition of product revenue attributable to this customer.
We expect that our product revenue in fiscal 2010 will be consistent with fiscal 2009 levels.
For orders received after October 1, 2008 from AT&T, we concluded that we no longer have sufficient evidence of VSOE on maintenance services. As a result, all revenue related to multiple element arrangements for this customer entered into beginning in the fourth quarter of fiscal 2008 is being recognized ratably over the arrangement's maintenance period. Revenue recognition on multiple arrangements with AT&T will begin when the only undelivered element of the arrangement is maintenance.
Service revenue is primarily comprised of hardware and software maintenance and support, network design, installation and other professional services. Lower maintenance revenue and professional services revenue accounted for $9.8 million and $8.7 million, respectively, of the decrease in fiscal 2009 compared to fiscal 2008. The decrease in fiscal 2009 is primarily attributable to pressure on maintenance pricing, coupled with the change in the fourth quarter of fiscal 2008 to ratable recognition of revenue from AT&T.
In fiscal 2009, we had no customers that contributed 10% or more of our revenue. In fiscal 2008, one customer, AT&T, contributed 10% or more of our revenue. There were no other customers that contributed 10% or more of our revenue in fiscal 2008.
International revenue was approximately 30% of revenue in both fiscal 2009 and fiscal 2008. Due to the uneven ordering patterns of customers and the timing of project completions, we expect that the domestic and international components as a percentage of our revenue will fluctuate from quarter to quarter and year to year.
40
Our deferred product revenue was $47.7 million and $30.7 million at December 31, 2009 and 2008, respectively. Our deferred service revenue was $52.3 million and $48.3 million at December 31, 2009 and 2008, respectively. Our deferred revenue balance may fluctuate as a result of the timing of revenue recognition, customer payments, maintenance contract renewals, contractual billing rights and maintenance revenue deferrals included in multiple element arrangements.
Cost of Revenue/Gross Profit. Our cost of revenue consists primarily of amounts paid to third-party manufacturers for purchased materials and services, royalties, manufacturing and professional services personnel and related costs and inventory obsolescence. Cost of revenue and gross profit as a percentage of revenue ("gross margin") for the years ended December 31, 2009 and 2008 were as follows (in thousands, except percentages):
| |
Year ended December 31, |
Increase (decrease) from prior year |
|||||||||||||
|---|---|---|---|---|---|---|---|---|---|---|---|---|---|---|---|
| |
2009 | 2008 | $ | % | |||||||||||
Cost of revenue |
|||||||||||||||
Product |
$ | 38,893 | $ | 74,274 | $ | (35,381 | ) | (47.6 | )% | ||||||
Service |
44,467 | 56,020 | (11,553 | ) | (20.6 | )% | |||||||||
Total cost of revenue |
$ | 83,360 | $ | 130,294 | $ | (46,934 | ) | (36.0 | )% | ||||||
Gross margin |
|||||||||||||||
Product |
71.5 | % | 63.5 | % | |||||||||||
Service |
51.3 | % | 49.0 | % | |||||||||||
Total gross margin |
63.4 | % | 58.4 | % | |||||||||||
The increase in product gross profit as a percentage of product revenue ("product gross margin") was primarily due to product and customer mix. Two key contributors to the higher product gross margin in fiscal 2009 compared to fiscal 2008 were the completion in fiscal 2009 of a multi-year project for which the majority of costs had been recorded as period expense in fiscal 2008 coupled with the completion in the fourth quarter of fiscal 2008 of a low-margin multi-year project. The increase in service gross profit as a percentage of service revenue ("service gross margin") was primarily due to our lower fixed service cost base through our recent restructuring initiatives, coupled with the completion of a low-margin multi-year project in fiscal 2008. Our service cost of revenue is relatively fixed in advance of any particular quarter and therefore, changes in service revenue will have a significant impact on service gross margins. We believe that our gross margin over time will remain in our long-term financial model of 58% to 62%.
Research and Development Expenses. Research and development expenses consist primarily of salaries and related personnel expenses and prototype costs related to the design, development, testing and enhancement of our products. Research and development expenses for the years ended December 31, 2009 and 2008 were as follows (in thousands, except percentages):
| Year ended December 31, | Increase (decrease) from prior year | ||||||||||
|---|---|---|---|---|---|---|---|---|---|---|---|
| 2009 | 2008 | $ | % | ||||||||
| $ | 59,864 | $ | 73,098 | $ | (13,234 | ) | (18.1 | )% | |||
The decrease in the current year primarily reflects lower employee-related costs, including salary and related costs as a result of our recent restructuring initiatives, partially offset by increased hiring activity in our India facility. Stock-based compensation was $3.3 million in fiscal 2009, compared to $7.9 million in fiscal 2008. Some aspects of our research and development efforts require significant short-term expenditures, the timing of which can cause significant variability in our expenses. We believe that rapid technological innovation is critical to our long-term success, and we are tailoring our
41
investments to meet the requirements of our customers and market. We believe that our research and development expenses for fiscal 2010 will increase from 2009 levels due to our increased focus on new product development, partially offset by lower development costs as a result of recent migration to lower cost geographies.
Sales and Marketing Expenses. Sales and marketing expenses consist primarily of salaries and related personnel costs, commissions, travel and entertainment expenses, promotions, customer evaluations inventory and other marketing and sales support expenses. Sales and marketing expenses for the years ended December 31, 2009 and 2008 were as follows (in thousands, except percentages):
| Year ended December 31, |
Increase (decrease) from prior year |
||||||||||
|---|---|---|---|---|---|---|---|---|---|---|---|
| 2009 | 2008 | $ | % | ||||||||
| $ | 48,929 | $ | 74,364 | $ | (25,435 | ) | (34.2 | )% | |||
The current year decrease is primarily attributable to lower employee-related costs, including commission, travel and stock-based compensation expenses. We believe that our sales and marketing expenses will increase in fiscal 2010 from fiscal 2009 levels, primarily attributable to higher personnel and related costs.
General and Administrative Expenses. General and administrative expenses consist primarily of salaries and related personnel costs for executive and administrative personnel, recruiting expenses, allowance for doubtful accounts and professional fees. General and administrative expenses for the years ended December 31, 2009 and 2008 were as follows (in thousands, except percentages):
| Year ended December 31, |
Increase (decrease) from prior year |
||||||||||
|---|---|---|---|---|---|---|---|---|---|---|---|
| 2009 | 2008 | $ | % | ||||||||
| $ | 43,217 | $ | 62,045 | $ | (18,828 | ) | (30.3 | )% | |||
The decrease in fiscal 2009 compared to the prior year is primarily attributable to $5.9 million of lower legal, audit and other consulting fees, $5.6 million of lower losses on foreign currency exchange and $5.0 million of lower stock-based compensation expense. The reduction in legal, audit and other consulting fees is primarily the result of reduced legal costs in fiscal 2009 resulting from our settlement in 2008 of litigation. We believe that our general and administrative expenses will decrease in fiscal 2010 from fiscal 2009 levels, primarily due to lower expected professional fees and other consulting costs and personnel-related expenses.
Litigation Settlements, Net of Insurance Recovery. We recorded $19.1 million of expense reported as Litigation settlements, net of insurance recovery in fiscal 2008. On September 16, 2008, we reached an agreement to settle the litigation by C2 Communications against certain of our customers alleging patent infringement of U.S. Patent No. 6,243,373 entitled "Method and Apparatus for Implementing a Computer Network Internet Telephone System (the "C2 Patent Litigation"). The parties entered into a settlement and license agreement that provided for the payment of $9.5 million in full settlement of all claims against our customers as well as fully paid licenses to us and our customers. The settlement was paid on September 24, 2008. On September 23, 2008, we reached a tentative agreement to settle the Consolidated Amended Complaint alleging that we made false and misleading statements about our products and business (the "2002 Securities Litigation"). Pursuant to the settlement, we paid $9.5 million to the shareholder class in the case, as well as $0.1 million toward the cost of the class notice process. At December 31, 2008, we had accrued $10.0 million for the settlement and class notice process. This amount includes $0.4 million for costs related to the confirmatory discovery process, which is included as a component of General and administrative expense. On February 17, 2009, we placed $9.5 million into escrow related to this settlement. On July 16, 2009, the escrow amount was
42
released to the plaintiff. We did not record any expense for litigation settlements reported as Litigation settlements, net of insurance recovery in fiscal 2009.
Restructuring. We recorded $3.5 million of restructuring expense in fiscal 2009 related to three restructuring initiatives, which reduced our workforce by approximately 190 employees in the aggregate. We recorded $0.7 million of restructuring expense in fiscal 2008 related to a restructuring initiative that affected approximately 50 employees.
Impairment of Intangible Assets. In the fourth quarter of fiscal 2008 we recorded $2.7 million of expense for the write-down of intangible assets related to our acquisition of Atreus Systems, Inc. (collectively with its subsidiaries, "Atreus"). In the second quarter of fiscal 2008 we recorded $3.6 million of expense for the write-down of intangible assets and goodwill related to our acquisition of Zynetix Ltd. ("Zynetix") intangible assets and goodwill, which is included as a component of Loss from discontinued operations, net of tax, in our consolidated statement of operations for the year ended December 31, 2008. We did not record any expense for the impairment of intangible assets in fiscal 2009.
Interest Income, net. Interest income and interest expense for the years ended December 31, 2009 and 2008 were as follows (in thousands, except percentages):
| |
Year ended December 31, |
Increase (decrease) from prior year |
||||||||||||
|---|---|---|---|---|---|---|---|---|---|---|---|---|---|---|
| |
2009 | 2008 | $ | % | ||||||||||
Interest income |
$ | 4,105 | $ | 12,643 | $ | (8,538 | ) | (67.5 | )% | |||||
Interest expense |
(183 | ) | (291 | ) | (108 | ) | (37.1 | )% | ||||||
Interest income, net |
$ | 3,922 | $ | 12,352 | $ | (8,430 | ) | (68.2 | )% | |||||
Interest income consists of interest earned on our cash equivalents, marketable debt securities and long-term investments. Interest expense in both fiscal 2009 and fiscal 2008 relates to capital lease obligations. The reduction in interest income, net, in the current year is primarily attributable to a lower average portfolio yield compared to fiscal 2008 as a result of the current economic environment.
Income Taxes. The income tax provision/benefit is computed on the basis of the various tax jurisdictions' income or loss before income taxes. Deferred income taxes reflect the tax effects of the differences between the carrying amounts of assets and liabilities for financial reporting purposes and the amounts used for income tax purposes. The Company uses judgment and assumptions to determine whether valuation allowances for deferred income tax assets are required if realization is not likely by considering future market growth, forecasted operations, future taxable income, and the amounts of earnings in the tax jurisdictions in which it operates.
For the year ended December 31, 2009, we recognized an income tax benefit of $2.5 million. This benefit is comprised of a recovery of prior year domestic tax payments as a result of tax law changes and a foreign tax benefit of $1.1 million impacted by international settlements. For the year ended December 31, 2008, we recognized income tax expense of $79.7 million, comprised of a tax benefit of $8.7 million, offset by an increase to our income tax expense of $88.4 million related to an increase in the valuation allowance on substantially all of our net deferred tax assets after considering all positive and negative factors as to the recoverability of these assets. This determination was based on many factors, including the severity of the current and prior year losses, cumulative three years of losses, the severe economic recession, a significant decrease to taxable income forecasted in future periods and other relevant factors. We have maintained a full valuation allowance in fiscal 2009.
43
Discontinued Operations
Loss from discontinued operations, net of tax. In the third quarter of 2008, we committed to a plan to sell our Zynetix subsidiary, which we completed on November 27, 2008. We had acquired Zynetix on April 13, 2007. Accordingly, the results of operations of Zynetix are included in discontinued operations for the periods subsequent to its acquisition. These results are reported under the caption Loss from discontinued operations, net of tax.
In connection with the preparation of our financial statements for the second quarter of fiscal 2008 and the update of our sales forecast for the second half of the fiscal year, we conducted a review of intangible assets and goodwill for impairment indicators, during which we determined that there were no impairment indicators related to the intangible assets and goodwill allocated to the Sonus reporting unit. However, this review identified several indicators related to the intangible assets and goodwill allocated to the Zynetix reporting unit, including significant underperformance relative to plan or long-term projections. In response, we performed an assessment of the carrying value of our intangible assets and goodwill. As a result, we recorded a charge to operations of $3.6 million for the write-down of intangible assets and goodwill. Of this charge, $1.5 million related to intangible assets and $2.1 million related to goodwill. As a result, the net book values of the intangible assets and goodwill attributable to the Zynetix reporting unit were reduced to zero at June 30, 2008. The write-down of these assets is included in the results of discontinued operations for the year ended December 31, 2008.
Loss on sale of discontinued operations, net of tax. On November 26, 2008, we completed the sale of Zynetix. In consideration for all of the equity of Zynetix we received a cash payment of £1.0 (approximately U.S. $2 at November 26, 2008); all cash on the books of Zynetix at the time of closing, the intellectual property we acquired at the time we purchased Zynetix that we subsequently included in certain of our products and the buyer's assumption of all contingent liabilities related to the Zynetix business, including but not limited to any customer and product support obligations. Prior to November 26, 2008, we had entered into intellectual property agreements between our subsidiary in the United Kingdom and Zynetix. These agreements allow for perpetual licenses between us and Zynetix for intellectual property used in both parties' respective products. We recorded a loss of $0.7 million, net of tax, on the sale of Zynetix.
We did not have any discontinued operations in fiscal 2009.
Years Ended December 31, 2008 and 2007
Revenue. Revenue for the years ended December 31, 2008 and 2007 was as follows (in thousands, except percentages):
| |
Year ended December 31, |
Increase (decrease) from prior year |
||||||||||||
|---|---|---|---|---|---|---|---|---|---|---|---|---|---|---|
| |
2008 | 2007 | $ | % | ||||||||||
Product |
$ | 203,387 | $ | 225,644 | $ | (22,257 | ) | (9.9 | )% | |||||
Service |
109,758 | 93,771 | 15,987 | 17.0 | % | |||||||||
Total revenue |
$ | 313,145 | $ | 319,415 | $ | (6,270 | ) | (2.0 | )% | |||||
The decrease in product revenue in fiscal 2008 compared to fiscal 2007 was attributable to lower product sales, partially offset by the recognition of approximately $17 million of revenue related to the completion of a multi-year project and for which all of the revenue recognition criteria were met in the fourth quarter of fiscal 2008. Product revenue was also negatively impacted by the current macroeconomic environment.
The increase in service revenue in fiscal 2008 compared to fiscal 2007 is primarily the result of our larger base of installed products in fiscal 2008. Higher maintenance revenue and professional services
44
revenue accounted for $8.2 million and $7.8 million, respectively, of the increase in fiscal 2008 compared to fiscal 2007.
AT&T contributed 10% or more of our revenue in both fiscal 2008 and fiscal 2007. There were no other customers that contributed 10% or more of revenue in either fiscal year.
International revenue was approximately 30% and 26% of revenue in fiscal 2008 and fiscal 2007, respectively.
Our deferred product revenue was $30.7 million and $44.1 million at December 31, 2008 and 2007, respectively. Our deferred service revenue was $48.3 million and $55.1 million at December 31, 2008 and 2007, respectively.
Cost of Revenue/Gross Profit. Cost of revenue and gross margin for the years ended December 31, 2008 and 2007 were as follows (in thousands, except percentages):
| |
Year ended December 31, |
Increase (decrease) from prior year |
|||||||||||||
|---|---|---|---|---|---|---|---|---|---|---|---|---|---|---|---|
| |
2008 | 2007 | $ | % | |||||||||||
Cost of revenue |
|||||||||||||||
Product |
$ | 74,274 | $ | 90,976 | $ | (16,702 | ) | (18.4 | )% | ||||||
Service |
56,020 | 37,513 | 18,507 | 49.3 | % | ||||||||||
Total cost of revenue |
$ | 130,294 | $ | 128,489 | $ | 1,805 | 1.4 | % | |||||||
Gross margin |
|||||||||||||||
Product |
63.5 | % | 59.7 | % | |||||||||||
Service |
49.0 | % | 60.0 | % | |||||||||||
Total gross margin |
58.4 | % | 59.8 | % | |||||||||||
The increase in product gross margin in fiscal 2008 compared to fiscal 2007 was primarily due to product and customer mix. The decrease in service gross margin in fiscal 2008 compared to fiscal 2007 was primarily due to increased personnel costs to support our 2008 global expansion efforts, coupled with the completion of a low margin multi-year project in fiscal 2008.
Research and Development Expenses. Research and development expenses for the years ended December 31, 2008 and 2007 were as follows (in thousands, except percentages):
| Year ended December 31, |
Increase (decrease) from prior year |
||||||||||
|---|---|---|---|---|---|---|---|---|---|---|---|
| 2008 | 2007 | $ | % | ||||||||
| $ | 73,098 | $ | 78,898 | $ | (5,800 | ) | (7.4 | )% | |||
The decrease in fiscal 2008 compared to fiscal 2007 primarily reflects lower stock-based compensation, partially offset by higher salary and related expenses associated with additional headcount. Stock-based compensation costs accounted for $8.2 million of lower research and development expense in fiscal 2008, compared to fiscal 2007.
Sales and Marketing Expenses. Sales and marketing expenses for the years ended December 31, 2008 and 2007 were as follows (in thousands, except percentages):
| Year ended December 31, | Increase (decrease) from prior year | ||||||||||
|---|---|---|---|---|---|---|---|---|---|---|---|
| 2008 | 2007 | $ | % | ||||||||
| $ | 74,364 | $ | 81,602 | $ | (7,238 | ) | (8.9 | )% | |||
45
The decrease in fiscal 2008 compared to fiscal 2007 primarily reflects lower stock-based compensation, partially offset by costs related to our continued expansion of our worldwide sales and support coverage. Stock-based compensation costs accounted for $8.7 million of lower sales and marketing expense in fiscal 2008, compared to fiscal 2007.
General and Administrative Expenses. General and administrative expenses for the years ended December 31, 2008 and 2007 were as follows (in thousands, except percentages):
| Year ended December 31, |
Increase (decrease) from prior year |
||||||||||
|---|---|---|---|---|---|---|---|---|---|---|---|
| 2008 | 2007 | $ | % | ||||||||
| $ | 62,045 | $ | 56,652 | $ | 5,393 | 9.5 | % | ||||
The increase in fiscal 2008 compared to fiscal 2007 is primarily attributable to higher personnel-related costs, coupled with $6.6 million of higher losses on foreign currency exchange compared to the prior year. Stock-based compensation costs accounted for $0.6 million of increased general and administration expense in fiscal 2008, compared to the prior year. In fiscal 2008, we recorded $4.8 million of stock-based compensation expense related to restricted stock granted to our former President and Chief Executive Officer (the "Former Executive") in connection with his Retention and Restricted Stock Agreement (the "Retention Agreement"), which was effective November 14, 2007. This amount includes $1.7 million of incremental stock-based compensation expense related to the accelerated vesting of such restricted stock. In fiscal 2007, we recorded $2.6 million of charges related to the departures of the Company's President and Chief Operating Officer, and Chief Financial Officer, as well as $1.8 million of charges related to the modification of options held by the Former Executive in connection with his Retention Agreement. These increases were partially offset by $14.2 million of lower professional fees in fiscal 2008 compared to fiscal 2007. Professional fees, including $12.1 million of legal fees primarily related to litigation, totaled $20.8 million in fiscal 2008. Professional fees, including $9.9 million related to our stock option historical review, totaled $25.3 million in fiscal 2007.
Litigation Settlements, Net of Insurance Recovery. We recorded $19.1 million and $24.7 million of net expense related to the settlement of litigation in fiscal 2008 and fiscal 2007, respectively.
On September 16, 2008, we reached an agreement to settle the C2 Patent Litigation. The parties entered into a settlement and license agreement that provided for the payment of $9.5 million in full settlement of all claims against customers as well as fully paid licenses to us and our customers. The settlement was paid on September 24, 2008. On September 23, 2008, we reached a tentative agreement to settle the 2002 Securities Litigation. Pursuant to the settlement, subject to confirmatory discovery and final court approval, we agreed to pay $9.5 million to the shareholder class in the case, as well as $0.1 million toward the cost of the class notice process. At December 31, 2008, we had accrued $10.0 million for the 2002 Securities Litigation settlement, including the aforementioned $9.6 million for the settlement and class notice process, as well as $0.4 million for costs related to the confirmatory discovery process. The $0.4 million for discovery costs is included as a component of General and administrative expense. On February 17, 2009, we placed the $9.5 million settlement amount into escrow. On July 16, 2009, the escrow amount was released to the plaintiff.
On November 7, 2007, we reached an agreement to settle litigation against the Company and certain of our former and current officers alleging violations of federal securities laws in connection with the restatement in 2004 of our financial statements (the "2004 Restatement Litigation"). Under the terms of the settlement, the plaintiffs agreed to release all claims against us and the other defendants in consideration for the payment of $40.0 million from us to the class of plaintiffs. In connection with the settlement, in the third quarter of fiscal 2007, we recorded a charge of $40.0 million and a related liability for the full amount of the settlement. Following the resolution of an insurance coverage dispute with our insurer on December 28, 2007, we recorded a $15.3 million
46
insurance recovery in the fourth quarter of fiscal 2007, as such recovery became probable following the resolution of the insurance coverage dispute in December 2007.
Pursuant to the settlement, in November 2007, we deposited $25.0 million in escrow toward the settlement fund. In January 2008, our insurer deposited $15.0 million into the escrow account and paid directly to us the remaining $0.3 million in available insurance coverage.
Impairment of Intangible Assets. In the fourth quarter of fiscal 2008 we recorded $2.7 million of expense for the write-down of intangible assets related to our acquisition of Atreus. In the second quarter of fiscal 2008 we recorded $3.6 million of expense for the write-down of intangible assets and goodwill related to our acquisition of Zynetix intangible assets and goodwill, which is included as a component of Loss from discontinued operations, net of tax, in our consolidated statement of operations for the year ended December 31, 2008. None of the Company's intangible assets were determined to be impaired in fiscal 2007.
Restructuring. We recorded $0.7 million of restructuring expense in fiscal 2008 related to a headcount reduction initiative. Approximately 50 employees were affected by the reduction. We did not record any restructuring expense in fiscal 2007.
Interest Income, net. Interest income and interest expense for the years ended December 31, 2008 and 2007 were as follows (in thousands, except percentages):
| |
Year ended December 31, | Increase (decrease) from prior year | ||||||||||||
|---|---|---|---|---|---|---|---|---|---|---|---|---|---|---|
| |
2008 | 2007 | $ | % | ||||||||||
Interest income |
$ | 12,643 | $ | 18,393 | $ | (5,750 | ) | (31.3 | )% | |||||
Interest expense |
(291 | ) | (164 | ) | 127 | 77.4 | % | |||||||
Interest income, net |
$ | 12,352 | $ | 18,229 | $ | (5,877 | ) | (32.2 | )% | |||||
The reduction in interest income, net, in fiscal 2008 compared to fiscal 2007 reflects lower average cash and investment balances, coupled with a lower average portfolio yield.
Income Taxes. For the year ended December 31, 2008, we recognized income tax expense of $79.7 million. This was comprised of a tax benefit of $8.7 million, offset by an increase to our income tax expense of $88.4 million related to an increase in the valuation allowance on substantially all of our domestic net deferred tax assets after considering all positive and negative factors as to the recoverability of these assets. This determination was based on many factors, including the severity of the current and prior year losses, cumulative three years of losses, the current severe economic recession, a significant decrease to taxable income forecasted in future periods and other relevant factors. For the year ended December 31, 2007, we recognized an income tax benefit of $8.5 million.
Discontinued Operations
Loss from discontinued operations, net of tax. In the third quarter of 2008, we committed to a plan to sell our Zynetix subsidiary, which we completed on November 27, 2008. We had acquired Zynetix on April 13, 2007. Accordingly, the results of operations of Zynetix are included in discontinued operations for the periods subsequent to its acquisition. These results are reported under the caption Loss from discontinued operations, net of tax.
In connection with the preparation of our financial statements for the second quarter of fiscal 2008 and the update of our sales forecast for the second half of the fiscal year, we conducted a review of intangible assets and goodwill for impairment indicators, during which we determined that there were no impairment indicators related to the intangible assets and goodwill allocated to the Sonus reporting unit. However, this review identified several indicators related to the intangible assets and goodwill
47
allocated to the Zynetix reporting unit, including significant underperformance relative to plan or long-term projections. In response, we performed an assessment of the carrying value of our intangible assets and goodwill. As a result, we recorded a charge to operations of $3.6 million for the write-down of intangible assets and goodwill. Of this charge, $1.5 million related to intangible assets and $2.1 million related to goodwill. As a result, the net book values of the intangible assets and goodwill attributable to the Zynetix reporting unit were reduced to zero at June 30, 2008. The write-down of these assets is included in the results of discontinued operations for the year ended December 31, 2008.
Loss on sale of discontinued operations, net of tax. On November 26, 2008, we completed the sale of Zynetix. In consideration for all of the equity of Zynetix we received a cash payment of £1.0 (approximately U.S. $2 at November 26, 2008); all cash on the books of Zynetix at the time of closing, the intellectual property we acquired at the time we purchased Zynetix that we subsequently included in certain of our products and the buyer's assumption of all contingent liabilities related to the Zynetix business, including but not limited to any customer and product support obligations. Prior to November 26, 2008, we had entered into intellectual property agreements between our subsidiary in the United Kingdom and Zynetix. These agreements allow for perpetual licenses between us and Zynetix for intellectual property used in both parties' respective products. We recorded a loss of $0.7 million, net of tax, on the sale of Zynetix.
Off-Balance Sheet Arrangements
We have no off-balance sheet arrangements that have or are reasonably likely to have a current or future material effect on our financial position, changes in financial position, revenues or expenses, results of operations, liquidity, capital expenditures or capital resources.
Liquidity and Capital Resources
At December 31, 2009, our cash, cash equivalents, marketable securities and long-term investments totaled $414.1 million.
Our operating activities provided $33.8 million of cash in fiscal 2009, compared to $16.7 million of cash used in operating activities in fiscal 2008.
Cash provided by operating activities in fiscal 2009 was primarily the result of a net decrease in accounts receivable, which was mainly driven by lower revenue levels and our focus on cash collections, partially offset by increases in other operating assets and inventory, as well as a net reduction in our operating liabilities. The increase in operating assets is primarily attributable to higher deferred costs, including cost of goods, royalties, commissions and third party installation costs, for which the related revenue has not yet been recognized. The decrease in our operating liabilities in fiscal 2009 is primarily attributable to the payment of litigation settlements and related costs, lower employee compensation and related costs, and lower professional fees, taxes payable and royalties. Our net loss, adjusted for non-cash items such as depreciation, amortization and stock-based compensation, contributed $18.9 million to the cash provided by operating activities.
Cash used in operating activities in fiscal 2008 was primarily attributable to the decreases in inventory, the insurance receivable for a litigation settlement, other operating assets and accounts receivable. These amounts were more than offset by the release of a $40.0 million litigation settlement from escrow to the plaintiffs, coupled with lower levels of deferred revenue, accrued expenses and accounts payable. The lower accounts receivable levels are the result of our efforts on cash collections. On March 31, 2008, our proposed litigation settlement related to the 2004 Restatement Litigation was approved by the court. Accordingly, the amounts that had been placed into escrow by us and our insurer were released to the plaintiff, and we eliminated the related liability and insurance receivable included in our consolidated balance sheet at December 31, 2007. As a result, our cash flows from operating activities were negatively affected by the release at March 31, 2008 of the $25.0 million we
48
had previously placed into an escrow account, partially offset by the $9.6 million liability recorded for the settlement of the 2002 Securities Litigation. The decrease in accrued expenses is primarily attributable to lower employee compensation and related costs, including reductions for the payment of bonuses to our executives and employees under our bonus programs, payments for professional fees and royalties previously accrued, the completion of an employee stock purchase under our original Employee Stock Purchase Plan and lower withholdings under the Amended and Restated 2000 Employee Stock Purchase Plan (the "ESPP").
Our investing activities used $31.6 million of cash in fiscal 2009, comprised of $25.0 million of net purchases of marketable securities and $6.6 million of investments in property and equipment. Our investing activities provided $18.5 million of cash in fiscal 2008, primarily comprised of $8.2 million of net sales and maturities of marketable securities, and $25.0 million related to the release at March 31, 2008 of that amount in the 2004 Restatement Litigation settlement escrow account as a result of the court's approval of the settlement agreement and the release of those funds to the plaintiffs. These amounts were partially offset by $9.7 million of investments in property and equipment, and cash payments aggregating $4.9 million, net of cash acquired, for our April 18, 2008 acquisition of Atreus.
Our financing activities provided $0.3 million and $2.5 million of cash in fiscal 2009 and fiscal 2008, respectively. The fiscal 2009 amount is primarily attributable to $1.1 million of proceeds from the sale of our common stock in connection with our ESPP and $0.1 million of proceeds from the exercise of stock options. These proceeds were partially offset by $0.7 million used to pay withholding obligations related to the net share settlement of restricted stock awards upon vesting and $0.2 million used for payments on our capital leases for office equipment. The fiscal 2008 amount includes $3.8 million of proceeds from the sale of common stock in connection with our ESPP and $0.4 million of proceeds from the exercise of stock options. These proceeds were partially offset by $1.5 million used to pay withholding obligations related to the net share settlement of restricted stock awards upon vesting and $0.2 million used for payments on our capital leases for office equipment.
Contractual Obligations
Our contractual obligations (both principal and interest) at December 31, 2009 consist of the following (in thousands):
| |
Payments due by period | |||||||||||||||
|---|---|---|---|---|---|---|---|---|---|---|---|---|---|---|---|---|
| |
Total | Less than 1 year | 1-3 years | 3-5 years | More than 5 years | |||||||||||
Capital lease obligations |
$ | 311 | $ | 240 | $ | 54 | $ | 12 | $ | 5 | ||||||
Operating lease obligations |
11,570 | 4,603 | 5,152 | 1,256 | 559 | |||||||||||
Purchase obligations |
15,790 | 15,149 | 641 | — | — | |||||||||||
Restructuring severance obligations |
82 | 82 | — | — | — | |||||||||||
Uncertain tax positions* |
177 | 177 | — | — | — | |||||||||||
|
$ | 27,930 | $ | 20,251 | $ | 5,847 | $ | 1,268 | $ | 564 | ||||||
- *
- This liability is not subject to fixed payment terms and the amount and timing of payments, if any, which we will make related to this liability are not known. See Note 17 to our Consolidated Financial Statements appearing in this Annual Report on Form 10-K for additional information.
Based on our current expectations, we believe our current cash, cash equivalents, marketable debt securities and long-term investments will be sufficient to meet our anticipated cash needs for working capital and capital expenditures for at least twelve months. It is difficult to predict future liquidity requirements with certainty. The rate at which we will consume cash will be dependent on the cash needs of future operations, including changes in working capital, which will, in turn, be directly affected by the levels of demand for our products, the timing and rate of expansion of our business, the
49
resources we devote to developing our products and any litigation settlements. We anticipate devoting substantial capital resources to continue our research and development efforts, to maintain our sales, support and marketing, to improve our controls environment and for other general corporate activities, as well as to vigorously defend against existing and potential litigation. See Note 22 to our consolidated financial statements for a description of our other contingencies.
Recent Accounting Pronouncements
In October 2009, an update was issued to Certain Arrangements that Include Software Elements. This update removes tangible products from the scope of software revenue guidance and provides guidance on determining whether software deliverables in an arrangement that includes a tangible product are covered by the scope of the software revenue guidance. This update will require the Company to account for many of its multiple element arrangements as non-software transactions and could impact the timing and amounts of revenue recognized. This update is effective for us beginning January 1, 2011, although early adoption is permitted, and adoption can be applied prospectively or retrospectively. We are currently evaluating the effect that implementation of this update will have on our consolidated financial position and results of operations upon adoption.
In October 2009, an update was issued to the accounting guidance related to the separation criteria used to determine the unit of accounting for multiple element arrangements. This update removes the objective-and-reliable-evidence-of-fair-value criterion from the separation criteria used to determine whether an arrangement involving multiple deliverables contains more than one unit of accounting, replaces references to "fair value" with "selling price" to distinguish from the fair value measurements required under the Fair Value Measurements and Disclosures guidance, provides a hierarchy that entities must use to estimate the selling price, eliminates the use of the residual method for allocation and expands the ongoing disclosure requirements. This guidance is effective for us beginning January 1, 2011, although early adoption is permitted, and adoption can be applied prospectively or retrospectively. We are currently evaluating the effect that implementation of this update will have, if any, on our consolidated financial position and results of operations upon adoption.
Item 7A. Quantitative and Qualitative Disclosures About Market Risk
We are exposed to a variety of market risks, including changes in interest rates affecting the return on our investments and foreign currency fluctuations.
At December 31, 2009, our cash, cash equivalents, marketable securities and long-term investments totaled $414.1 million. We maintain an investment portfolio of various holdings, types and maturities which may include money market funds, commercial paper, corporate notes, certificates of deposit and government debt securities. At any time a sharp rise in market interest rates could have a material adverse impact on the fair value of our investment portfolio. Conversely, declines in market interest rates could have a material impact on the interest earnings of our investment portfolio. We do not currently hedge these interest rate exposures. We place our investments with high quality issuers and have policies limiting, among other things, the amount of credit exposure to any one issuer. We seek to limit default risk by purchasing only investment grade securities. We manage potential losses in fair value by investing in relatively short-term investments, thereby allowing us to hold our investments to maturity. A hypothetical movement of plus or minus 50 basis points in market interest rates could affect the value of our investment portfolio by approximately $0.7 million. However, we have the ability to hold our investments until maturity, and therefore do not expect our operating results or cash flows to be affected to any significant degree by the effect of a sudden change in market interest rates on our investment portfolio.
Based on a hypothetical 10% adverse movement in all foreign currency exchange rates, our revenue would not be materially affected and our net loss would be adversely affected by approximately $0.4 million, although the actual effects may differ materially from the hypothetical analysis.
50
Item 8. Financial Statements and Supplementary Data
51
REPORT OF INDEPENDENT REGISTERED PUBLIC ACCOUNTING FIRM
To
the Board of Directors and Stockholders of
Sonus Networks, Inc.
Westford, Massachusetts
We have audited the accompanying consolidated balance sheets of Sonus Networks, Inc. and subsidiaries (the "Company") as of December 31, 2009 and 2008, and the related consolidated statements of operations, stockholders' equity and comprehensive loss, and cash flows for each of the three years in the period ended December 31, 2009. These financial statements are the responsibility of the Company's management. Our responsibility is to express an opinion on the financial statements based on our audits.
We conducted our audits in accordance with the standards of the Public Company Accounting Oversight Board (United States). Those standards require that we plan and perform the audit to obtain reasonable assurance about whether the financial statements are free of material misstatement. An audit includes examining, on a test basis, evidence supporting the amounts and disclosures in the financial statements. An audit also includes assessing the accounting principles used and significant estimates made by management, as well as evaluating the overall financial statement presentation. We believe that our audits provide a reasonable basis for our opinion.
In our opinion, such consolidated financial statements present fairly, in all material respects, the financial position of Sonus Networks, Inc. and subsidiaries as of December 31, 2009 and 2008, and the results of their operations and their cash flows for each of the three years in the period ended December 31, 2009, in conformity with accounting principles generally accepted in the United States of America.
We have also audited, in accordance with the standards of the Public Company Accounting Oversight Board (United States), the Company's internal control over financial reporting as of December 31, 2009, based on the criteria established in Internal Control—Integrated Framework issued by the Committee of Sponsoring Organizations of the Treadway Commission and our report dated February 25, 2010 expressed an unqualified opinion on the Company's internal control over financial reporting.
/s/ DELOITTE & TOUCHE LLP
Boston,
Massachusetts
February 25, 2010
52
SONUS NETWORKS, INC.
Consolidated Balance Sheets
(in thousands, except share data)
| |
December 31, 2009 |
December 31, 2008 |
||||||||
|---|---|---|---|---|---|---|---|---|---|---|
Assets |
||||||||||
Current assets: |
||||||||||
Cash and cash equivalents |
$ | 125,323 | $ | 122,207 | ||||||
Marketable securities |
239,223 | 180,786 | ||||||||
Accounts receivable, net |
47,998 | 75,788 | ||||||||
Inventory, net |
21,925 | 22,553 | ||||||||
Deferred income taxes |
562 | 111 | ||||||||
Other current assets |
17,508 | 14,937 | ||||||||
Total current assets |
452,539 | 416,382 | ||||||||
Property and equipment, net |
14,646 |
17,852 |
||||||||
Intangible assets, net |
341 | 568 | ||||||||
Goodwill |
5,053 | 5,025 | ||||||||
Investments |
49,598 | 84,965 | ||||||||
Deferred income taxes |
711 | 1,611 | ||||||||
Other assets |
17,849 | 9,182 | ||||||||
|
$ | 540,737 | $ | 535,585 | ||||||
Liabilities and stockholders' equity |
||||||||||
Current liabilities: |
||||||||||
Accounts payable |
$ | 5,337 | $ | 9,200 | ||||||
Accrued expenses |
19,292 | 28,231 | ||||||||
Accrued litigation settlements |
— | 9,600 | ||||||||
Current portion of deferred revenue |
74,748 | 40,962 | ||||||||
Current portion of long-term liabilities |
753 | 1,301 | ||||||||
Total current liabilities |
100,130 | 89,294 | ||||||||
Deferred revenue |
25,242 |
37,991 |
||||||||
Long-term liabilities |
1,127 | 1,865 | ||||||||
Total liabilities |
126,499 | 129,150 | ||||||||
Commitments and contingencies (Note 22) |
||||||||||
Stockholders' equity: |
||||||||||
Preferred stock, $0.01 par value; 5,000,000 shares authorized, none issued and outstanding |
— | — | ||||||||
Common stock, $0.001 par value; 600,000,000 shares authorized; 276,792,897 and 275,133,894 shares issued; 274,495,987 and 272,836,984 shares outstanding at December 31, 2009 and 2008, respectively |
277 | 275 | ||||||||
Additional paid-in capital |
1,286,326 | 1,272,952 | ||||||||
Accumulated deficit |
(878,810 | ) | (873,878 | ) | ||||||
Accumulated other comprehensive income |
6,712 | 7,353 | ||||||||
Treasury stock, at cost; 2,296,910 common shares |
(267 | ) | (267 | ) | ||||||
Total stockholders' equity |
414,238 | 406,435 | ||||||||
|
$ | 540,737 | $ | 535,585 | ||||||
See notes to the consolidated financial statements.
53
SONUS NETWORKS, INC.
Consolidated Statements of Operations
(in thousands, except per share data)
| |
Year ended December 31, | |||||||||||
|---|---|---|---|---|---|---|---|---|---|---|---|---|
| |
2009 | 2008 | 2007 | |||||||||
Revenue: |
||||||||||||
Product |
$ | 136,276 | $ | 203,387 | $ | 225,644 | ||||||
Service |
91,220 | 109,758 | 93,771 | |||||||||
Total revenue |
227,496 | 313,145 | 319,415 | |||||||||
Cost of revenue: |
||||||||||||
Product |
38,893 | 74,274 | 90,976 | |||||||||
Service |
44,467 | 56,020 | 37,513 | |||||||||
Total cost of revenue |
83,360 | 130,294 | 128,489 | |||||||||
Gross profit |
144,136 | 182,851 | 190,926 | |||||||||
Operating expenses: |
||||||||||||
Research and development |
59,864 | 73,098 | 78,898 | |||||||||
Sales and marketing |
48,929 | 74,364 | 81,602 | |||||||||
General and administrative |
43,217 | 62,045 | 56,652 | |||||||||
Litigation settlements, net of insurance recovery |
— | 19,100 | 24,672 | |||||||||
Impairment of intangible assets |
— | 2,727 | — | |||||||||
Restructuring |
3,510 | 702 | — | |||||||||
Total operating expenses |
155,520 | 232,036 | 241,824 | |||||||||
Loss from operations |
(11,384 | ) | (49,185 | ) | (50,898 | ) | ||||||
Interest expense |
(183 | ) | (291 | ) | (164 | ) | ||||||
Interest income |
4,105 | 12,643 | 18,393 | |||||||||
Other income, net |
71 | 358 | 1,068 | |||||||||
Loss from continuing operations before income taxes |
(7,391 | ) | (36,475 | ) | (31,601 | ) | ||||||
Income tax benefit (provision) |
2,459 | (79,675 | ) | 8,474 | ||||||||
Loss from continuing operations |
(4,932 | ) | (116,150 | ) | (23,127 | ) | ||||||
Loss from discontinued operations, net of tax of $0, $969 and $466 |
— | (4,491 | ) | (1,086 | ) | |||||||
Loss on disposal of discontinued operations, net of tax of $0 |
— | (741 | ) | — | ||||||||
Net loss |
$ | (4,932 | ) | $ | (121,382 | ) | $ | (24,213 | ) | |||
Loss per share |
||||||||||||
Basic: |
||||||||||||
Continuing operations |
$ | (0.02 | ) | $ | (0.43 | ) | $ | (0.09 | ) | |||
Discontinued operations |
— | (0.02 | ) | — | ||||||||
|
$ | (0.02 | ) | $ | (0.45 | ) | $ | (0.09 | ) | |||
Diluted: |
||||||||||||
Continuing operations |
$ | (0.02 | ) | $ | (0.43 | ) | $ | (0.09 | ) | |||
Discontinued operations |
— | (0.02 | ) | — | ||||||||
|
$ | (0.02 | ) | $ | (0.45 | ) | $ | (0.09 | ) | |||
Shares used to compute loss per share: |
||||||||||||
Basic |
273,730 | 271,477 | 262,924 | |||||||||
Diluted |
273,730 | 271,477 | 262,924 | |||||||||
See notes to the consolidated financial statements.
54
SONUS NETWORKS, INC.
Consolidated Statements of Stockholders' Equity and Comprehensive Loss
(in thousands, except share data)
| |
Common Stock | |
|
Accumulated Other Comprehensive Income (Loss) |
Treasury Stock | |
|
|||||||||||||||||||||
|---|---|---|---|---|---|---|---|---|---|---|---|---|---|---|---|---|---|---|---|---|---|---|---|---|---|---|---|---|
| |
Additional Paid-in Capital |
Accumulated Deficit |
Total Stockholders' Equity |
Comprehensive Loss |
||||||||||||||||||||||||
| |
Shares | Par Value | Shares | Cost | ||||||||||||||||||||||||
Balance, January 1, 2007 |
262,065,332 | $ | 262 | $ | 1,160,853 | $ | (728,233 | ) | $ | (82 | ) | 2,296,910 | $ | (267 | ) | $ | 432,533 | |||||||||||
Adjustment related to January 1, 2007 adoption of accounting for uncertain tax positions |
(50 | ) | (50 | ) | ||||||||||||||||||||||||
Issuance of common stock in connection with employee stock purchase plan |
1,375,668 | 2 | 5,611 | 5,613 | ||||||||||||||||||||||||
Exercise of stock options |
9,063,463 | 9 | 39,539 | 39,548 | ||||||||||||||||||||||||
Vesting of restricted stock |
92,500 | — | ||||||||||||||||||||||||||
Shares of restricted stock returned to the Company under net share settlements to satisfy tax withholding obligations |
(31,012 | ) | (210 | ) | (210 | ) | ||||||||||||||||||||||
Stock-based compensation expense |
42,642 | 42,642 | ||||||||||||||||||||||||||
Modifications of stock options—reclassification from equity to liability awards |
(1,255 | ) | (1,255 | ) | ||||||||||||||||||||||||
Settlement of stock options—liability awards |
1,231 | 1,231 | ||||||||||||||||||||||||||
Stock option tender offer—reduction of equity to establish tender offer liability |
(3,485 | ) | (3,485 | ) | ||||||||||||||||||||||||
Currency translation adjustment |
1,350 | 1,350 | $ | 1,350 | ||||||||||||||||||||||||
Net loss |
(24,213 | ) | (24,213 | ) | (24,213 | ) | ||||||||||||||||||||||
Comprehensive loss for the year ended December 31, 2007 |
$ | (22,863 | ) | |||||||||||||||||||||||||
Balance, December 31, 2007 |
272,565,951 | 273 | 1,244,926 | (752,496 | ) | 1,268 | 2,296,910 | (267 | ) | 493,704 | ||||||||||||||||||
Issuance of common stock in connection with employee stock purchase plan |
1,321,328 | 3,755 | 3,755 | |||||||||||||||||||||||||
Exercise of stock options |
184,845 | 437 | 437 | |||||||||||||||||||||||||
Vesting of restricted stock |
1,433,766 | 2 | 2 | |||||||||||||||||||||||||
Shares of restricted stock returned to the Company under net share settlements to satisfy tax withholding obligations |
(546,996 | ) | (1,510 | ) | (1,510 | ) | ||||||||||||||||||||||
Stock-based compensation expense |
25,031 | 25,031 | ||||||||||||||||||||||||||
Issuance of shares in connection with Zynetix earnout agreement |
175,000 | 313 | 313 | |||||||||||||||||||||||||
Unrealized gain on available-for-sale marketable securities, net of tax |
928 | 928 | $ | 928 | ||||||||||||||||||||||||
Currency translation adjustment |
5,157 | 5,157 | 5,157 | |||||||||||||||||||||||||
Net loss |
(121,382 | ) | (121,382 | ) | (121,382 | ) | ||||||||||||||||||||||
Comprehensive loss for the year ended December 31, 2008 |
$ | (115,297 | ) | |||||||||||||||||||||||||
Balance, December 31, 2008 |
275,133,894 | 275 | 1,272,952 | (873,878 | ) | 7,353 | 2,296,910 | (267 | ) | 406,435 | ||||||||||||||||||
Issuance of common stock in connection with employee stock purchase plan |
830,940 | 1 | 1,315 | 1,316 | ||||||||||||||||||||||||
Exercise of stock options |
96,304 | 51 | 51 | |||||||||||||||||||||||||
Vesting of restricted stock |
1,098,798 | 1 | 1 | |||||||||||||||||||||||||
Shares of restricted stock returned to the Company under net share settlements to satisfy tax withholding obligations |
(367,039 | ) | (673 | ) | (673 | ) | ||||||||||||||||||||||
Stock-based compensation expense |
12,681 | 12,681 | ||||||||||||||||||||||||||
Unrealized loss on available-for-sale marketable securities, net of tax |
(1,082 | ) | (1,082 | ) | $ | (1,082 | ) | |||||||||||||||||||||
Currency translation adjustment |
441 | 441 | 441 | |||||||||||||||||||||||||
Net loss |
(4,932 | ) | (4,932 | ) | (4,932 | ) | ||||||||||||||||||||||
Comprehensive loss for the year ended December 31, 2009 |
$ | (5,573 | ) | |||||||||||||||||||||||||
Balance, December 31, 2009 |
276,792,897 | $ | 277 | $ | 1,286,326 | $ | (878,810 | ) | $ | 6,712 | 2,296,910 | $ | (267 | ) | $ | 414,238 | ||||||||||||
See notes to the consolidated financial statements.
55
SONUS NETWORKS, INC.
Consolidated Statements of Cash Flows
(in thousands)
| |
Year ended December 31, | |||||||||||||
|---|---|---|---|---|---|---|---|---|---|---|---|---|---|---|
| |
2009 | 2008 | 2007 | |||||||||||
Cash flows from operating activities: |
||||||||||||||
Net loss |
$ | (4,932 | ) | $ | (121,382 | ) | $ | (24,213 | ) | |||||
Adjustments to reconcile net loss to cash flows provided by operating activities: |
||||||||||||||
Depreciation and amortization of property and equipment |
10,104 | 11,661 | 13,259 | |||||||||||
Amortization of intangible assets |
232 | 1,155 | 428 | |||||||||||
Impairment of intangible assets and goodwill |
— | 6,357 | — | |||||||||||
Impairment of marketable equity securities |
— | 92 | — | |||||||||||
Stock-based compensation |
12,810 | 25,298 | 42,642 | |||||||||||
Loss on disposal of property and equipment |
241 | 325 | 135 | |||||||||||
Deferred income taxes |
449 | 78,212 | (4,916 | ) | ||||||||||
Decrease in fair value of modified stock options held by former employees |
— | — | (1,068 | ) | ||||||||||
Changes in operating assets and liabilities: |
||||||||||||||
Accounts receivable |
27,790 | 10,010 | (13,966 | ) | ||||||||||
Inventory |
(2,456 | ) | 19,333 | (2,829 | ) | |||||||||
Insurance receivable—litigation settlement |
— | 15,328 | (15,328 | ) | ||||||||||
Other operating assets |
(7,836 | ) | 9,814 | (3,819 | ) | |||||||||
Accounts payable |
(4,229 | ) | (9,167 | ) | (1,427 | ) | ||||||||
Accrued expenses |
(9,803 | ) | (13,769 | ) | (1,131 | ) | ||||||||
Accrued litigation settlements |
(9,600 | ) | (30,400 | ) | 40,000 | |||||||||
Deferred revenue |
20,987 | (19,602 | ) | 4,481 | ||||||||||
Net cash provided by (used in) operating activities |
33,757 | (16,735 | ) | 32,248 | ||||||||||
Cash flows from investing activities: |
||||||||||||||
Purchases of property and equipment |
(6,612 | ) | (9,709 | ) | (11,669 | ) | ||||||||
Business acquisitions, net of cash acquired |
— | (4,909 | ) | (8,846 | ) | |||||||||
Purchases of marketable securities |
(268,971 | ) | (370,102 | ) | (403,906 | ) | ||||||||
Sale/maturities of marketable securities |
243,984 | 378,267 | 446,923 | |||||||||||
Decrease (increase) in litigation settlement escrow |
— | 25,000 | (25,000 | ) | ||||||||||
Decrease in restricted cash |
— | — | 341 | |||||||||||
Net cash provided by (used in) investing activities |
(31,599 | ) | 18,547 | (2,157 | ) | |||||||||
Cash flows from financing activities: |
||||||||||||||
Sale of common stock in connection with employee stock purchase plan |
1,119 | 3,755 | 5,613 | |||||||||||
Proceeds from exercise of stock options |
51 | 437 | 39,548 | |||||||||||
Payment of tax withholding obligations related to net share settlements of restricted stock awards |
(673 | ) | (1,510 | ) | (399 | ) | ||||||||
Principal payments of capital lease obligations |
(233 | ) | (175 | ) | (527 | ) | ||||||||
Repayment of notes payable to former Zynetix Limited shareholders |
— | — | (335 | ) | ||||||||||
Net cash provided by financing activities |
264 | 2,507 | 43,900 | |||||||||||
Effect of exchange rate changes on cash and cash equivalents |
694 | (1,045 | ) | 736 | ||||||||||
Net increase in cash and cash equivalents |
3,116 | 3,274 | 74,727 | |||||||||||
Cash and cash equivalents, beginning of year |
122,207 | 118,933 | 44,206 | |||||||||||
Cash and cash equivalents, end of year |
$ | 125,323 | $ | 122,207 | $ | 118,933 | ||||||||
Supplemental disclosure of cash flow information: |
||||||||||||||
Interest paid |
$ | 147 | $ | 291 | $ | 167 | ||||||||
Income taxes paid |
$ | 789 | $ | 1,650 | $ | 2,928 | ||||||||
Income tax refunds received |
$ | 1,759 | $ | 192 | $ | 6 | ||||||||
Supplemental disclosure of non-cash investing activities: |
||||||||||||||
Capital expenditures incurred, but not yet paid |
$ | 896 | $ | 562 | $ | 561 | ||||||||
Property and equipment acquired under capital lease |
$ | 70 | $ | 1,083 | $ | 261 | ||||||||
See notes to the consolidated financial statements.
56
SONUS NETWORKS, INC.
Notes to Consolidated Financial Statements
(1) NATURE OF THE BUSINESS
Sonus Networks, Inc. ("Sonus" or the "Company") was incorporated in 1997 and is a leading provider of voice, video and data infrastructure solutions for wireline and wireless service providers. The Company's infrastructure solutions allow such wireline and wireless operators to build converged voice over Internet Protocol ("IP") networks. Sonus' products include carrier-class infrastructure equipment and software that enables voice services to be delivered over IP packet-based networks. The Company's target customers include both traditional and emerging communications service providers, including long distance carriers, local exchange carriers, Internet service providers, wireless operators, cable operators, international telephone companies and carriers that provide services to other carriers.
(2) BASIS OF PRESENTATION AND SUMMARY OF SIGNIFICANT ACCOUNTING POLICIES
BASIS OF PRESENTATION
The consolidated financial statements have been prepared in United States dollars, in accordance with accounting principles generally accepted in the United States ("GAAP").
In the fourth quarter of 2008, the Company completed the sale of its Zynetix Ltd. ("Zynetix") subsidiary, as the Zynetix business was no longer considered part of the Company's core business. The Company recorded a loss of $0.7 million on the sale of Zynetix and a loss of $4.5 million on its operations in 2008. The results of operations of Zynetix have been classified as discontinued operations within these financial statements. The 2008 amounts reflect the results of operations of Zynetix for fiscal 2008 through November 26, 2008, the date of the sale of the subsidiary. The 2007 amounts reflect the results of operations for Zynetix for fiscal 2007 from April 13, 2007, the date of its acquisition by the Company. The loss from discontinued operations for the year ended December 31, 2008 includes $3.6 million related to the impairment of intangible assets and goodwill. Of this amount, $1.5 million relates to intangible assets and $2.1 million relates to goodwill.
Subsequent events have been evaluated through the date of this filing.
SIGNIFICANT ACCOUNTING POLICIES
Principles of Consolidation
The accompanying consolidated financial statements include the accounts of Sonus and its wholly owned subsidiaries. All intercompany transactions and balances have been eliminated in consolidation.
Use of Estimates and Judgments
The preparation of financial statements in conformity with GAAP requires management to make estimates and assumptions that affect the reported amounts of assets and liabilities and disclosure of contingent assets and liabilities at the date of the financial statements and the reported amounts of revenues and expenses during the reporting periods. Significant estimates and judgments relied upon in preparing these financial statements include revenue recognition for multiple element arrangements, allowances for doubtful accounts, inventory reserves, expected future cash flows used to evaluate the recoverability of long-lived assets, contingencies associated with revenue contracts, assumptions used to determine the fair value of stock-based compensation, assumptions used to determine the fair value of purchased intangible assets, contingent liabilities and recoverability of Sonus' net deferred tax assets and related valuation allowance. Sonus regularly assesses these estimates and records changes in estimates in the period in which they become known. Sonus bases its estimates on historical experience
57
SONUS NETWORKS, INC.
Notes to Consolidated Financial Statements (Continued)
(2) BASIS OF PRESENTATION AND SUMMARY OF SIGNIFICANT ACCOUNTING POLICIES (Continued)
and various other assumptions that it believes to be reasonable under the circumstances. Actual results could differ from those estimates.
Revenue Recognition
Sonus' products are primarily marketed based on the software elements contained therein. In addition, hardware sold generally cannot be used apart from the software. Therefore, Sonus considers its principal products to be software-related. Sonus recognizes revenue from product sales when persuasive evidence of an arrangement exists, delivery has occurred, the sale price is fixed or determinable, and collectibility of the related receivable is probable under customary payment terms. When Sonus has future obligations, including a requirement to deliver additional elements which are essential to the functionality of the delivered elements or for which vendor-specific objective evidence of fair value ("VSOE") does not exist or when customer acceptance is required, Sonus defers revenue recognition and related costs until those obligations are satisfied. The ordering patterns and sales lead times associated with customer orders may vary significantly from period to period.
Many of the Company's sales involve multiple-element arrangements. When a sale includes multiple elements, such as products, maintenance and/or professional services, Sonus recognizes revenue using the residual method. Revenue associated with elements for which VSOE has been established is recorded based on the VSOE value; revenue for any undelivered elements that are considered not essential to the functionality of the product and for which VSOE has been established is deferred based on the VSOE value, and any remaining arrangement fee is then allocated to, and recognized as, product revenue. VSOE is determined based upon the price charged when the same element is sold separately or established by management having the relevant pricing authority. If Sonus cannot establish VSOE for each undelivered element, including specified upgrades, it defers revenue on the entire arrangement until VSOE for all undelivered elements is known or all elements are delivered and all other revenue recognition criteria are met.
Revenue from maintenance and support services is recognized ratably over the service period. Earned maintenance revenue is deferred until the associated product is accepted by the customer and all other revenue recognition criteria have been met. Maintenance and support services include telephone support, return and repair support and unspecified rights to product upgrades and enhancements.
Revenue from installation services is generally recognized when the service is complete and all other revenue recognition criteria have been met. Revenue from other professional services for which VSOE has been established is typically recognized as the services are delivered if all other revenue recognition criteria have been met.
Revenue from consulting, custom development and other professional services-only engagements is recognized as services are rendered provided all other revenue recognition criteria have been met.
Sonus records deferred revenue for products delivered or services performed for which collection of the amount billed is either probable or has been collected but other revenue recognition criteria have not been met. Deferred revenue includes customer deposits and amounts associated with maintenance contracts. Deferred revenue expected to be recognized as revenue more than one year
58
SONUS NETWORKS, INC.
Notes to Consolidated Financial Statements (Continued)
(2) BASIS OF PRESENTATION AND SUMMARY OF SIGNIFICANT ACCOUNTING POLICIES (Continued)
subsequent to the balance sheet date is reported with long-term liabilities in the consolidated balance sheets.
Sonus defers recognition of incremental direct costs, such as cost of goods, third party installations and commissions until recognition of the related revenue. Such costs are classified as current assets if the deferred revenue is initially classified as current and noncurrent assets if the related deferred revenue is initially classified as long-term.
Sonus sells the majority of its products directly to its service provider customers. For products sold to resellers and distributors with whom the Company has at least eight quarters of consistent history regarding the potential for product returns or refunds, or any form of concession, the Company recognizes revenue on a sell-in basis. For all other resellers and distributors the Company recognizes revenue on a sell-through basis.
Beginning in the fourth quarter of fiscal 2008, the Company concluded that it no longer had sufficient evidence of VSOE on maintenance services for one of its largest customers. Therefore, all revenue related to multiple element arrangements for this customer entered into beginning in the fourth quarter of fiscal 2008 is being recognized ratably over the maintenance period. Revenue recognition on multiple element arrangements with this customer will begin when the only undelivered element of the arrangement is maintenance. At December 31, 2009 and 2008, Other assets included $3.9 million and $0.4 million, respectively, of deferred product costs related to arrangements with this customer in which both the revenue and product costs are being recognized ratably.
The Company excludes any taxes assessed by a governmental authority that are directly imposed on a revenue-producing transaction (i.e., sales, use, value added) from its revenue and costs. Reimbursement received for out-of-pocket expenses is recorded as revenue.
Financial Instruments
The carrying amounts of Sonus' financial instruments, which include cash equivalents, marketable securities, investments, accounts receivable and accounts payable approximate their fair values.
All investments in marketable securities are classified as available-for-sale and are reported at fair value, with unrealized gains and losses excluded from earnings and reported, net of tax, in Accumulated other comprehensive income (loss), which is a component of stockholders' equity. Unrealized losses that are determined to be other-than-temporary, based on current and expected market conditions, are recognized in earnings. Declines in fair value determined to be credit-related are charged to earnings. The fair value of marketable securities is determined based on quoted market prices at the balance sheet dates of the same or similar instruments. The cost of marketable securities sold is determined by the specific identification method.
Financial instruments with remaining maturities or that are due within one year from the balance sheet date are classified as current. Financial instruments with remaining maturities or that are payable more than one year from the balance sheet date are classified as noncurrent.
59
SONUS NETWORKS, INC.
Notes to Consolidated Financial Statements (Continued)
(2) BASIS OF PRESENTATION AND SUMMARY OF SIGNIFICANT ACCOUNTING POLICIES (Continued)
Cash and Cash Equivalents
Cash equivalents are stated at fair value, with unrealized gains and losses excluded from earnings and reported, net of tax, in Accumulated other comprehensive income (loss). Cash equivalents are liquid securities that have remaining maturities of three months or less at the date of purchase.
Foreign Currency Translation
For foreign subsidiaries where the functional currency is the local currency, assets and liabilities are translated into U.S. dollars at the current exchange rate on the balance sheet date. Revenue and expenses are translated at average rates of exchange prevailing during each period. Translation adjustments for these subsidiaries are included in Accumulated other comprehensive income (loss).
For foreign subsidiaries where the functional currency is the U.S. dollar, monetary assets and liabilities are translated into U.S. dollars at the current exchange rate on the balance sheet date. Nonmonetary assets and liabilities are remeasured into U.S. dollars at historical exchange rates. Revenue and expense items are translated at average rates of exchange prevailing during each period. Remeasurement adjustments are included in the consolidated statements of operations.
Realized and unrealized foreign currency gains and losses arising from transactions denominated in currencies other than the subsidiary's functional currency are reflected in earnings with the exception of intercompany transactions considered to be of a long-term investment nature.
The Company recorded losses on foreign currency remeasurement and transactions of $1.6 million, $7.2 million and $0.6 million for the years ended December 31, 2009, 2008 and 2007, respectively. These amounts include a gain of $0.8 million in the year ended December 31, 2009, a loss of $3.8 million in the year ended December 31, 2008 and a gain of $0.1 million in the year ended December 31, 2007 related to the Company's remeasurement of its U.S. dollar foreign subsidiaries. Foreign currency gains and losses are included as a component of General and administrative expenses in the consolidated statements of operations.
Unearned Accounts Receivable
Accounts receivable, net, include unearned accounts receivable which represent products shipped to customers where Sonus has a contractual right to bill the customer and collectibility is probable under ordinary collection terms, but for which Sonus' revenue recognition criteria has not yet been satisfied.
Inventory
Inventory is stated at the lower of cost (first-in, first-out basis) or market and consists of final assembly materials and finished goods.
Deferred product costs represent deferred cost of revenue for product shipments to customers prior to satisfaction of Sonus' revenue recognition criteria. Such costs are classified as inventory if the deferred revenue is initially classified as current and in Other assets if the related deferred revenue is initially classified as long-term.
60
SONUS NETWORKS, INC.
Notes to Consolidated Financial Statements (Continued)
(2) BASIS OF PRESENTATION AND SUMMARY OF SIGNIFICANT ACCOUNTING POLICIES (Continued)
Sonus provides inventory reserves based on excess and obsolete inventory determined primarily by future demand forecasts and estimated returns of defective product, and records charges to cost of revenues. Sonus assesses such demand forecasts and return history on at least a quarterly basis.
Sonus records a full inventory reserve for evaluation equipment at the time of shipment to its customers, as it is probable that the inventory value will not be realizable.
Property and Equipment
Property and equipment are stated at cost, net of accumulated depreciation. Expenditures for maintenance and repairs are charged to expense as incurred. Depreciation is computed using the straight-line method over the estimated useful lives of the related assets, which range from two to five years. Leasehold improvements are amortized over the lesser of the lease term or five years. When an asset is sold or retired, the cost and related accumulated depreciation or amortization is eliminated, and the resulting gain or loss, if any, is recognized in income (loss) from operations in the consolidated statement of operations. The Company reviews property and equipment for impairment in the same manner as intangible assets discussed below.
Intangible Assets and Goodwill
Intangible assets are primarily comprised of intellectual property, which is amortized over its estimated useful life of five years. Intangible assets are reviewed for impairment when events or changes in circumstances indicate that their carrying amounts may not be recoverable based upon the estimated undiscounted cash flows.
Goodwill is recorded when the consideration for an acquisition exceeds the fair value of net tangible and identifiable intangible assets acquired. Goodwill is not amortized, but instead is tested for impairment at least annually, or if indicators of potential impairment exist by comparing the fair value of the Company's reporting unit to its carrying value. The Company estimates the fair value of its reporting unit using a discounted cash flow model or other valuation models, such as comparative transactions and market multiples. During the years ended December 31, 2009 and 2008, the Company completed its annual testing for impairment of goodwill and, based on those tests, concluded that no impairment of goodwill existed. The Company performs its annual testing on November 30 of each year.
Intangible assets with estimated lives and other long-lived assets are reviewed for impairment when events or changes in circumstances indicate that the carrying amount of an asset may not be recoverable. Recoverability of intangible assets with estimated lives and other long-lived assets is measured by a comparison of the carrying amount of an asset or asset group to future net undiscounted cash flows expected to be generated by the asset or asset group. If these comparisons indicate that an asset is not recoverable, the Company will recognize an impairment loss for the amount by which the carrying value of the asset or asset group exceeds the related estimated fair value. Estimated fair value is based on either discounted future operating cash flows or appraised values, depending on the nature of the asset.
61
SONUS NETWORKS, INC.
Notes to Consolidated Financial Statements (Continued)
(2) BASIS OF PRESENTATION AND SUMMARY OF SIGNIFICANT ACCOUNTING POLICIES (Continued)
Other Assets
Other assets are primarily comprised of the long-term portion of deferred cost of goods sold, prepaid expenses and deposits.
Stock-Based Compensation
The Company's stock-based compensation cost is measured at the grant date based on the fair value of the award and is recognized as expense over the requisite service period, which generally represents the vesting period, and includes an estimate of the awards that will be forfeited. The Company uses the Black-Scholes valuation model for estimating the fair value on the date of grant of stock options. The fair value of stock option awards is affected by the Company's stock price as well as valuation assumptions, including the volatility of Sonus' stock price, expected term of the option, risk-free interest rate and expected dividends.
Research and Development Costs
Research and development costs are expensed as incurred.
Software Development Costs
The costs for the development of new software and substantial enhancements to existing software are expensed as incurred until technological feasibility has been established, at which time any additional costs would be capitalized until the product is available for general release. The Company has determined that technological feasibility is established at the time a working model of the software is completed. The Company's process for developing software is essentially completed concurrently with the establishment of technological feasibility. Accordingly, no costs have been capitalized to date.
Concentrations of Credit and Off-Balance Sheet Risk and Single Source Suppliers
The financial instruments that potentially subject Sonus to concentrations of credit risk are cash, cash equivalents, marketable debt securities and accounts receivable. The Company's cash and cash equivalents were managed by two financial institutions at both December 31, 2009 and 2008.
Certain components and software licenses from third parties used in Sonus' products are procured from single sources of supply. The failure of a supplier, including a subcontractor, to deliver on schedule could delay or interrupt Sonus' delivery of products and thereby materially adversely affect Sonus' revenues and operating results.
Sonus has a single contract manufacturer. Failure to manage the activities of the manufacturer could result in the disruption in the supply of its products and in delays in the fulfillment of the Company's customer orders.
Advertising Costs
Advertising costs are expensed as incurred. Advertising expenses were $0.2 million, $0.4 million and $0.2 million for the years ended December 31, 2009, 2008 and 2007, respectively.
62
SONUS NETWORKS, INC.
Notes to Consolidated Financial Statements (Continued)
(2) BASIS OF PRESENTATION AND SUMMARY OF SIGNIFICANT ACCOUNTING POLICIES (Continued)
Comprehensive Income (Loss)
Comprehensive income (loss) is comprised of net income (loss), unrealized gains and losses on available-for-sale marketable securities and foreign currency translation adjustments for all periods presented. The components of accumulated other comprehensive income (loss) are as follows (in thousands):
| |
Foreign currency translation adjustment |
Unrealized gain (loss) on available- for-sale marketable securities |
Tax impact of gain (loss) on available- for-sale marketable securities |
Total | |||||||||
|---|---|---|---|---|---|---|---|---|---|---|---|---|---|
Balance at January 1, 2007 |
$ | (82 | ) | $ | — | $ | — | $ | (82 | ) | |||
Activity |
1,350 | — | — | 1,350 | |||||||||
Balance at December 31, 2007 |
1,268 | — | — | 1,268 | |||||||||
Activity |
5,157 | 1,502 | (574 | ) | 6,085 | ||||||||
Balance at December 31, 2008 |
6,425 | 1,502 | (574 | ) | 7,353 | ||||||||
Activity |
441 | (1,082 | ) | — | (641 | ) | |||||||
Balance at December 31, 2009 |
$ | 6,866 | $ | 420 | $ | (574 | ) | $ | 6,712 | ||||
Operating Segments
The Company operates in a single segment. Operating segments are identified as components of an enterprise about which separate discrete financial information is available for evaluation by the chief operating decision maker in making decisions regarding resource allocation and assessing performance. To date, the chief operating decision maker has made such decisions and assessed performance at the company level, as one segment. The Company's chief operating decision maker is its President and Chief Executive Officer.
Loss Contingencies and Reserves
Loss Contingencies. Sonus is subject to ongoing business risks arising in the ordinary course of business that affect the estimation process of the carrying value of assets, the recording of liabilities and the possibility of various loss contingencies. An estimated loss contingency is accrued when it is probable that a liability has been incurred or an asset has been impaired and the amount of loss can be reasonably estimated. Sonus regularly evaluates current information available to determine whether such amounts should be adjusted and records changes in estimates in the period they become known.
Allowance for Doubtful Accounts. Sonus establishes billing terms at the time it negotiates purchase agreements with its customers. Sonus monitors its outstanding receivables for timely payments and potential collection issues. An allowance for doubtful accounts is estimated based on Sonus' assessment of the collectibility of specific customer accounts.
Royalty Accrual. Sonus accrues for royalties for technology it licenses from vendors based on established royalty rates and usage. In certain cases, Sonus has been contacted by third parties who
63
SONUS NETWORKS, INC.
Notes to Consolidated Financial Statements (Continued)
(2) BASIS OF PRESENTATION AND SUMMARY OF SIGNIFICANT ACCOUNTING POLICIES (Continued)
claim that Sonus' products infringe on certain intellectual property of the third party. Sonus evaluates these claims and accrues for royalties when it is probable that the obligation has been incurred and the amounts are reasonably estimable.
Reserve for Litigation and Legal Fees. Sonus is subject to various legal claims, including securities litigation. Sonus reserves for legal contingencies and legal fees when it is probable that a loss has been incurred and the amounts are reasonably estimable. Sonus' director and officer liability insurance policies provide only limited liability protection relating to the securities class action and derivative lawsuits against Sonus and certain of its officers and directors. The ultimate outcome of these items is uncertain and the potential loss, if any, may be significantly different than the amounts Sonus has previously accrued.
Accounting for Income Taxes
Deferred tax assets and liabilities are recognized for the expected future consequences of events that have been reflected in the financial statements. Deferred tax assets and liabilities are determined based on the differences between the book and tax bases of assets and liabilities and operating loss carryforwards, using tax rates expected to be in effect for the years in which the differences are expected to reverse. Such differences arise primarily from stock-based compensation, depreciation, accruals and reserves, deferred revenue, tax credits, net operating loss carryforwards and allowances for accounts receivable. Sonus records valuation allowances to reduce deferred income tax assets to the amount that is more likely than not to be realized. Sonus has not provided for U.S. income taxes on the undistributed earnings of non-U.S. subsidiaries, as the Company plans to permanently reinvest these amounts. Cumulative undistributed foreign earnings were $15.5 million and $10.1 million at December 31, 2009 and 2008, respectively.
The Company determines whether it is more likely than not that a tax position will be sustained upon examination. If it is not more likely than not that a position will be sustained, no amount of the benefit attributable to the position is recognized. The tax benefit to be recognized of any tax position that meets the more likely than not recognition threshold is calculated as the largest amount that is more than 50% likely of being realized upon resolution of the contingency. The Company accounts for interest and penalties related to uncertain tax positions as part of its provision for income taxes.
Immaterial Restatement
During the second quarter of 2009, the Company identified an error in the calculation of stock-based compensation expense for prior periods. The Company's third party equity accounting software calculated stock-based compensation expense after consideration of the impact of estimated forfeitures. However, the amount of stock-based compensation expense recognized at any date did not equal at least the grant date fair value of the vested portion of each award as of that date. Because the Company's stock option awards generally vest on a monthly basis after the first anniversary date of the award, the Company under-recognized stock-based compensation expense in certain periods. This error changes the timing of stock-based compensation expense recognition, but does not change the total stock-based compensation expense. As stock-based compensation expense is a non-cash item, this error did not impact net cash provided by (used in) operations in any period. This error resulted in the understatement of stock-based compensation expense, with a corresponding understatement of
64
SONUS NETWORKS, INC.
Notes to Consolidated Financial Statements (Continued)
(2) BASIS OF PRESENTATION AND SUMMARY OF SIGNIFICANT ACCOUNTING POLICIES (Continued)
additional paid-in capital, in the amounts of $2.5 million and $0.7 million for the years ended December 31, 2008 and 2007, respectively. The stock-based compensation related to deductible awards would also impact the tax provision prior to recognition of a valuation allowance on deferred tax assets in the fourth quarter of 2008.
The Company believes the correction of this error is not material to its previously issued historical consolidated financial statements; therefore, the Company has restated its 2007 and 2008 consolidated financial statements in this Annual Report on Form 10-K.
The effects of this restatement on the Company's Consolidated Balance Sheet as of December 31, 2008 and Consolidated Statements of Operations and of Cash Flows for the years ended December 31, 2008 and 2007 are as follows (in thousands, except per share data):
The effects of this immaterial restatement on the Consolidated Balance Sheet as of December 31, 2008 are as follows (in thousands):
| |
As previously reported |
Adjustment | As restated | |||||||||
|---|---|---|---|---|---|---|---|---|---|---|---|---|
Stockholders' equity: |
||||||||||||
Preferred stock |
$ | — | $ | — | $ | — | ||||||
Common stock |
275 | — | 275 | |||||||||
Additional paid-in capital |
1,269,790 | 3,162 | 1,272,952 | |||||||||
Accumulated deficit |
(870,716 | ) | (3,162 | ) | (873,878 | ) | ||||||
Accumulated other comprehensive income |
7,353 | — | 7,353 | |||||||||
Treasury stock |
(267 | ) | — | (267 | ) | |||||||
Total stockholders' equity |
$ | 406,435 | $ | — | $ | 406,435 | ||||||
65
SONUS NETWORKS, INC.
Notes to Consolidated Financial Statements (Continued)
(2) BASIS OF PRESENTATION AND SUMMARY OF SIGNIFICANT ACCOUNTING POLICIES (Continued)
The effects of this immaterial restatement on the Consolidated Statements of Operations for the years ended December 31, 2008 and 2007 are as follows (in thousands, except per share data):
| |
|||||||||||||||||||||
|---|---|---|---|---|---|---|---|---|---|---|---|---|---|---|---|---|---|---|---|---|---|
| |
Year ended December 31, 2008 | Year ended December 31, 2007 | |||||||||||||||||||
| |
As previously reported |
|
|
As previously reported |
|
|
|||||||||||||||
| |
Adjustment |
As restated |
Adjustment |
As restated |
|||||||||||||||||
Revenue: |
|||||||||||||||||||||
Product |
$ | 203,387 | $ | — | $ | 203,387 | $ | 225,644 | $ | — | $ | 225,644 | |||||||||
Service |
109,758 | — | 109,758 | 93,771 | — | 93,771 | |||||||||||||||
Total revenue |
313,145 | — | 313,145 | 319,415 | — | 319,415 | |||||||||||||||
Cost of revenue: |
|||||||||||||||||||||
Product |
74,168 | 106 | 74,274 | 90,947 | 29 | 90,976 | |||||||||||||||
Service |
55,704 | 316 | 56,020 | 37,424 | 89 | 37,513 | |||||||||||||||
Total cost of revenue |
129,872 | 422 | 130,294 | 128,371 | 118 | 128,489 | |||||||||||||||
Gross profit |
183,273 | (422 | ) | 182,851 | 191,044 | (118 | ) | 190,926 | |||||||||||||
Operating expenses: |
|||||||||||||||||||||
Research and development |
72,223 | 875 | 73,098 | 78,652 | 246 | 78,898 | |||||||||||||||
Sales and marketing |
73,499 | 865 | 74,364 | 81,358 | 244 | 81,602 | |||||||||||||||
General and administrative |
61,739 | 306 | 62,045 | 56,566 | 86 | 56,652 | |||||||||||||||
Litigation settlements |
19,100 | — | 19,100 | 24,672 | — | 24,672 | |||||||||||||||
Impairment of intangible assets |
2,727 | — | 2,727 | — | — | — | |||||||||||||||
Restructuring |
702 | — | 702 | — | — | — | |||||||||||||||
Total operating expenses |
229,990 | 2,046 | 232,036 | 241,248 | 576 | 241,824 | |||||||||||||||
Loss from operations |
(46,717 | ) | (2,468 | ) | (49,185 | ) | (50,204 | ) | (694 | ) | (50,898 | ) | |||||||||
Interest expense |
(291 | ) | — | (291 | ) | (164 | ) | — | (164 | ) | |||||||||||
Interest income |
12,643 | — | 12,643 | 18,393 | — | 18,393 | |||||||||||||||
Other income, net |
358 | — | 358 | 1,068 | — | 1,068 | |||||||||||||||
Loss from continuing operations before income taxes |
(34,007 | ) | (2,468 | ) | (36,475 | ) | (30,907 | ) | (694 | ) | (31,601 | ) | |||||||||
Income tax (provision) benefit |
(79,557 | ) | (118 | ) | (79,675 | ) | 8,356 | 118 | 8,474 | ||||||||||||
Loss from continuing operations |
(113,564 | ) | (2,586 | ) | (116,150 | ) | (22,551 | ) | (576 | ) | (23,127 | ) | |||||||||
Loss from discontinued operations, net of tax |
(4,491 | ) | — | (4,491 | ) | (1,086 | ) | — | (1,086 | ) | |||||||||||
Loss from disposal of discontinued operations, net of tax |
(741 | ) | — | (741 | ) | — | — | — | |||||||||||||
Net loss |
$ | (118,796 | ) | $ | (2,586 | ) | $ | (121,382 | ) | $ | (23,637 | ) | $ | (576 | ) | $ | (24,213 | ) | |||
Loss per share: |
|||||||||||||||||||||
Basic: |
|||||||||||||||||||||
Continuing operations |
$ | (0.42 | ) | $ | (0.01 | ) | $ | (0.43 | ) | $ | (0.09 | ) | $ | — | $ | (0.09 | ) | ||||
Discontinued operations |
(0.02 | ) | — | (0.02 | ) | — | — | — | |||||||||||||
|
$ | (0.44 | ) | $ | (0.01 | ) | $ | (0.45 | ) | $ | (0.09 | ) | $ | — | $ | (0.09 | ) | ||||
Diluted: |
|||||||||||||||||||||
Continuing operations |
$ | (0.42 | ) | $ | (0.01 | ) | $ | (0.43 | ) | $ | (0.09 | ) | $ | — | $ | (0.09 | ) | ||||
Discontinued operations |
(0.02 | ) | — | (0.02 | ) | — | — | — | |||||||||||||
|
$ | (0.44 | ) | $ | (0.01 | ) | $ | (0.45 | ) | $ | (0.09 | ) | $ | — | $ | (0.09 | ) | ||||
66
SONUS NETWORKS, INC.
Notes to Consolidated Financial Statements (Continued)
(2) BASIS OF PRESENTATION AND SUMMARY OF SIGNIFICANT ACCOUNTING POLICIES (Continued)
The effects of this immaterial restatement on the Consolidated Statements of Cash Flows for the years ended December 31, 2008 and 2007 are as follows (in thousands):
| |
Year ended December 31, 2008 |
Year ended December 31, 2007 |
|||||||||||||||||||||
|---|---|---|---|---|---|---|---|---|---|---|---|---|---|---|---|---|---|---|---|---|---|---|---|
| |
As previously reported |
Adjustment | As restated | As previously reported |
Adjustment | As restated | |||||||||||||||||
Cash flows from operating activities: |
|||||||||||||||||||||||
Net loss |
$ | (118,796 | ) | $ | (2,586 | ) | $ | (121,382 | ) | $ | (23,637 | ) | $ | (576 | ) | $ | (24,213 | ) | |||||
Adjustments to reconcile net loss to cash flows provided by (used in) used in operating activities: |
|||||||||||||||||||||||
Depreciation and amortization of property and equipment |
11,661 | — | 11,661 | 13,259 | — | 13,259 | |||||||||||||||||
Amortization of intangible assets |
1,155 | — | 1,155 | 428 | — | 428 | |||||||||||||||||
Impairment of intangible assets and goodwill |
6,357 | — | 6,357 | — | — | — | |||||||||||||||||
Impairment of marketable equity securities |
92 | — | 92 | — | — | — | |||||||||||||||||
Stock-based compensation |
22,830 | 2,468 | 25,298 | 41,948 | 694 | 42,642 | |||||||||||||||||
Loss on disposal of property and equipment |
325 | — | 325 | 135 | — | 135 | |||||||||||||||||
Deferred income taxes |
78,094 | 118 | 78,212 | (4,798 | ) | (118 | ) | (4,916 | ) | ||||||||||||||
Decrease in fair value of modified stock options held by former employees |
— | — | — | (1,068 | ) | — | (1,068 | ) | |||||||||||||||
Changes in operating assets and liabilities: |
|||||||||||||||||||||||
Accounts receivable |
10,010 | — | 10,010 | (13,966 | ) | — | (13,966 | ) | |||||||||||||||
Inventory |
19,333 | — | 19,333 | (2,829 | ) | — | (2,829 | ) | |||||||||||||||
Insurance receivable—litigation settlement |
15,328 | — | 15,328 | (15,328 | ) | — | (15,328 | ) | |||||||||||||||
Other operating assets |
9,814 | — | 9,814 | (3,819 | ) | — | (3,819 | ) | |||||||||||||||
Accounts payable |
(9,167 | ) | — | (9,167 | ) | (1,427 | ) | — | (1,427 | ) | |||||||||||||
Accrued expenses |
(13,769 | ) | — | (13,769 | ) | (1,131 | ) | — | (1,131 | ) | |||||||||||||
Accrued litigation settlements |
(30,400 | ) | — | (30,400 | ) | 40,000 | — | 40,000 | |||||||||||||||
Deferred revenue |
(19,602 | ) | — | (19,602 | ) | 4,481 | — | 4,481 | |||||||||||||||
Net cash provided by (used in) operating activities |
$ | (16,735 | ) | $ | — | $ | (16,735 | ) | $ | 32,248 | $ | — | $ | 32,248 | |||||||||
Recent Accounting Pronouncements
In October 2009, an update was issued to Certain Arrangements that Include Software Elements. This update removes tangible products from the scope of software revenue guidance and provides guidance on determining whether software deliverables in an arrangement that includes a tangible product are covered by the scope of the software revenue guidance. This update will require the Company to account for many of its multiple element arrangements as non-software transactions and could impact the timing and amounts of revenue recognized. This update is effective for the Company beginning January 1, 2011, although early adoption is permitted, and adoption can be applied prospectively or retrospectively. The Company is currently evaluating the effect that implementation of this update will have on its consolidated financial position and results of operations upon adoption.
67
SONUS NETWORKS, INC.
Notes to Consolidated Financial Statements (Continued)
(2) BASIS OF PRESENTATION AND SUMMARY OF SIGNIFICANT ACCOUNTING POLICIES (Continued)
In October 2009, an update was issued to the accounting guidance related to the separation criteria used to determine the unit of accounting for multiple element arrangements. This update removes the objective-and-reliable-evidence-of-fair-value criterion from the separation criteria used to determine whether an arrangement involving multiple deliverables contains more than one unit of accounting, replaces references to "fair value" with "selling price" to distinguish from the fair value measurements required under the Fair Value Measurements and Disclosures guidance, provides a hierarchy that entities must use to estimate the selling price, eliminates the use of the residual method for allocation and expands the ongoing disclosure requirements. This guidance is effective for the Company beginning January 1, 2011, although early adoption is permitted, and adoption can be applied prospectively or retrospectively. The Company is currently evaluating the effect that implementation of this update will have, if any, on its consolidated financial position and results of operations upon adoption.
(3) EARNINGS (LOSS) PER SHARE
Basic earnings (loss) per share is computed by dividing net income (loss) by the weighted average number of shares outstanding during the period. For periods in which the Company reports net income, diluted net income per share is determined by using the weighted average number of common and dilutive common equivalent shares outstanding during the period unless the effect is antidilutive.
The calculation of shares used to compute basic and diluted earnings (loss) per share is as follows (in thousands):
| |
Year ended December 31, | |||||||||
|---|---|---|---|---|---|---|---|---|---|---|
| |
2009 | 2008 | 2007 | |||||||
Weighted average shares outstanding—basic |
273,730 | 271,477 | 262,924 | |||||||
Potential dilutive common shares |
— | — | — | |||||||
Weighted average shares outstanding—diluted |
273,730 | 271,477 | 262,924 | |||||||
Options to purchase the Company's common stock, unvested shares of restricted stock and performance-based stock awards aggregating approximately 28.1 million shares, 40.9 million shares and 42.1 million shares have not been included in the computation of diluted loss per share for the years ended December 31, 2009, 2008 and 2007, respectively, because their effect would have been antidilutive.
(4) CASH EQUIVALENTS, MARKETABLE SECURITIES AND INVESTMENTS
Cash equivalents and marketable securities are invested in debt and equity instruments, primarily U.S. government-backed, municipal and corporate obligations, which management believes to be high quality (investment grade) credit instruments.
During the year ended December 31, 2009, the Company sold $6.0 million of available-for-sale securities and realized approximately $17,000 of gross gains and no gross losses as a result of these sales on a specific identification basis. These amounts are included in the Company's consolidated statement of operations for the year ended December 31, 2009.
68
SONUS NETWORKS, INC.
Notes to Consolidated Financial Statements (Continued)
(4) CASH EQUIVALENTS, MARKETABLE SECURITIES AND INVESTMENTS (Continued)
On June 12, 2008, the Company transferred its held-to-maturity portfolio of debt securities, aggregating $373.1 million, to the available-for-sale category. The Company recorded, at the time of the transfer, approximately $33,000 of net unrealized losses on available-for-sale securities in Accumulated other comprehensive income, net of tax. As a result of the transfer, there were no investments classified as held-to-maturity securities at December 31, 2008.
Subsequent to the transfer of its held-to-maturity portfolio to the available-for-sale category, the Company sold $90.6 million of available-for-sale securities. The Company realized approximately $82,000 of gross gains and $10,000 of gross losses in the period from June 12, 2008 through December 31, 2008 as a result of these sales. These amounts are included in the Company's consolidated statement of operations for the year ended December 31, 2008.
The Company had no marketable securities or investments with continuous unrealized losses for one year or greater at either December 31, 2009 or 2008. The Company does not intend to sell these securities and does not believe it will be required to sell any securities before they recover in value; accordingly, it does not believe these declines are other-than-temporary.
The amortized cost, gross unrealized gains and losses and fair value of the Company's marketable debt and equity securities and investments at December 31, 2009 and 2008 were comprised of the following (in thousands):
| |
December 31, 2009 | |||||||||||||
|---|---|---|---|---|---|---|---|---|---|---|---|---|---|---|
| |
Amortized cost |
Unrealized gains |
Unrealized losses |
Fair value |
||||||||||
Cash equivalents |
$ | 95,845 | $ | — | $ | (2 | ) | $ | 95,843 | |||||
Marketable securities |
||||||||||||||
Municipal obligations |
$ | 4,999 | $ | — | $ | — | $ | 4,999 | ||||||
U.S. government agency notes |
86,534 | 231 | (11 | ) | 86,754 | |||||||||
Corporate debt securities |
77,843 | 294 | (67 | ) | 78,070 | |||||||||
Commercial paper |
44,567 | 15 | (5 | ) | 44,577 | |||||||||
Certificates of deposit |
24,801 | 34 | (12 | ) | 24,823 | |||||||||
|
$ | 238,744 | $ | 574 | $ | (95 | ) | $ | 239,223 | |||||
Investments |
||||||||||||||
U.S. government agency notes |
$ | 6,444 | $ | 13 | $ | (2 | ) | $ | 6,455 | |||||
Corporate debt securities |
43,209 | 40 | (106 | ) | 43,143 | |||||||||
|
$ | 49,653 | $ | 53 | $ | (108 | ) | $ | 49,598 | |||||
69
SONUS NETWORKS, INC.
Notes to Consolidated Financial Statements (Continued)
(4) CASH EQUIVALENTS, MARKETABLE SECURITIES AND INVESTMENTS (Continued)
| |
December 31, 2008 | |||||||||||||
|---|---|---|---|---|---|---|---|---|---|---|---|---|---|---|
| |
Amortized cost |
Unrealized gains |
Unrealized losses |
Fair value |
||||||||||
Cash equivalents |
$ | 104,953 | $ | 2 | $ | — | $ | 104,955 | ||||||
Marketable securities |
||||||||||||||
Equity securities |
$ | 45 | $ | — | $ | — | $ | 45 | ||||||
Municipal obligations |
1,455 | — | (9 | ) | 1,446 | |||||||||
U.S. government agency notes |
85,202 | 649 | — | 85,851 | ||||||||||
Corporate debt securities |
24,293 | 163 | (40 | ) | 24,416 | |||||||||
Commercial paper |
68,834 | 194 | — | 69,028 | ||||||||||
|
$ | 179,829 | $ | 1,006 | $ | (49 | ) | $ | 180,786 | |||||
Investments |
||||||||||||||
U.S. government agency notes |
$ | 54,775 | $ | 585 | $ | — | $ | 55,360 | ||||||
Corporate debt securities |
29,647 | 125 | (167 | ) | 29,605 | |||||||||
|
$ | 84,422 | $ | 710 | $ | (167 | ) | $ | 84,965 | |||||
The Company's available-for-sale debt securities that are classified as Investments in the consolidated balance sheet mature after one year but within two years or less from the balance sheet date.
Fair value is an exit price, representing the amount that would be received to sell an asset or paid to transfer a liability in an orderly transaction between market participants. As such, fair value is a market-based measurement that should be determined based on assumptions that market participants would use in pricing an asset or a liability. A three-tier fair value hierarchy is established as a basis for considering such assumptions and for inputs used in the valuation methodologies in measuring fair value:
Level 1—Observable inputs that reflect quoted prices (unadjusted) for identical assets or liabilities in active markets.
Level 2—Include other inputs that are directly or indirectly observable in the marketplace.
Level 3—Unobservable inputs which are supported by little or no market activities.
The fair value hierarchy also requires an entity to maximize the use of observable inputs and minimize the use of unobservable inputs when measuring fair value.
The Company's cash equivalents and marketable securities are classified within Level 1 or Level 2. This is because the cash equivalents and marketable securities are valued using quoted market prices or alternative pricing sources and models utilizing market observable inputs.
The following table shows the fair value of the Company's financial assets that are measured at fair value at December 31, 2009 and 2008, comprised of the Company's available-for-sale debt and
70
SONUS NETWORKS, INC.
Notes to Consolidated Financial Statements (Continued)
(4) CASH EQUIVALENTS, MARKETABLE SECURITIES AND INVESTMENTS (Continued)
equity securities, and reported under the captions Cash and cash equivalents, Marketable securities and Investments in the consolidated balance sheet (in thousands):
| |
|
Fair value measurements at December 31, 2009 using: |
||||||||||||
|---|---|---|---|---|---|---|---|---|---|---|---|---|---|---|
| |
Total carrying value at December 31, 2009 |
Quoted prices in active markets (Level 1) |
Significant other observable inputs (Level 2) |
Significant unobservable inputs (Level 3) |
||||||||||
Cash equivalents |
$ | 95,843 | $ | 88,645 | $ | 7,198 | $ | — | ||||||
Marketable securities |
||||||||||||||
Municipal obligations |
$ | 4,999 | $ | — | $ | 4,999 | $ | — | ||||||
U.S. government agency notes |
86,754 | — | 86,754 | — | ||||||||||
Corporate debt securities |
78,070 | 54,297 | 23,773 | — | ||||||||||
Commercial paper |
44,577 | — | 44,577 | — | ||||||||||
Certificates of deposit |
24,823 | — | 24,823 | — | ||||||||||
|
$ | 239,223 | $ | 54,297 | $ | 184,926 | $ | — | ||||||
Investments |
||||||||||||||
U.S. government agency notes |
$ | 6,455 | $ | — | $ | 6,455 | $ | — | ||||||
Corporate debt securities |
43,143 | 21,328 | 21,815 | — | ||||||||||
|
$ | 49,598 | $ | 21,328 | $ | 28,270 | $ | — | ||||||
| |
|
Fair value measurements at December 31, 2008 using: |
||||||||||||
|---|---|---|---|---|---|---|---|---|---|---|---|---|---|---|
| |
Total carrying value at December 31, 2008 |
Quoted prices in active markets (Level 1) |
Significant other observable inputs (Level 2) |
Significant unobservable inputs (Level 3) |
||||||||||
Cash equivalents |
$ | 104,955 | $ | 90,965 | $ | 13,990 | $ | — | ||||||
Marketable securities |
||||||||||||||
Equity securities |
$ | 45 | $ | 45 | $ | — | $ | — | ||||||
Municipal obligations |
1,446 | — | 1,446 | — | ||||||||||
U.S. government agency notes |
85,851 | — | 85,851 | — | ||||||||||
Corporate debt securities |
24,416 | 24,416 | — | — | ||||||||||
Commercial paper |
69,028 | — | 69,028 | — | ||||||||||
|
$ | 180,786 | $ | 24,461 | $ | 156,325 | $ | — | ||||||
Investments |
||||||||||||||
U.S. government agency notes |
$ | 55,360 | $ | — | $ | 55,360 | $ | — | ||||||
Corporate debt securities |
29,605 | 29,605 | — | — | ||||||||||
|
$ | 84,965 | $ | 29,605 | $ | 55,360 | $ | — | ||||||
71
SONUS NETWORKS, INC.
Notes to Consolidated Financial Statements (Continued)
(5) ACCOUNTS RECEIVABLE
Accounts receivable consist of the following (in thousands):
| |
December 31, | ||||||||
|---|---|---|---|---|---|---|---|---|---|
| |
2009 | 2008 | |||||||
Earned accounts receivable |
$ | 20,759 | $ | 32,957 | |||||
Unearned accounts receivable |
27,905 | 43,859 | |||||||
Accounts receivable, gross |
48,664 | 76,816 | |||||||
Allowance for doubtful accounts |
(666 | ) | (1,028 | ) | |||||
Accounts receivable, net |
$ | 47,998 | $ | 75,788 | |||||
(6) INVENTORY, NET
Inventory consists of the following (in thousands):
| |
December 31, | ||||||
|---|---|---|---|---|---|---|---|
| |
2009 | 2008 | |||||
On-hand final assemblies and finished goods inventories |
$ | 11,036 | $ | 10,223 | |||
Deferred cost of goods sold |
20,132 | 18,617 | |||||
|
31,168 | 28,840 | |||||
Less current portion |
(21,925 | ) | (22,553 | ) | |||
Noncurrent portion (included in Other assets) |
$ | 9,243 | $ | 6,287 | |||
(7) PROPERTY AND EQUIPMENT
Property and equipment consists of the following (in thousands):
| |
|
December 31, | |||||||
|---|---|---|---|---|---|---|---|---|---|
| |
Useful Life | 2009 | 2008 | ||||||
Equipment |
3 years | $ | 61,504 | $ | 58,994 | ||||
Software |
2 years | 11,404 | 10,433 | ||||||
Furniture and fixtures |
3-5 years | 866 | 1,104 | ||||||
Leasehold improvements |
Shorter of the life of the lease or estimated useful life (1-5 years) | 8,094 | 7,274 | ||||||
|
81,868 | 77,805 | |||||||
Less accumulated depreciation and amortization |
(67,222 | ) | (59,953 | ) | |||||
Property and equipment, net |
$ | 14,646 | $ | 17,852 | |||||
The Company recorded $10.1 million, $11.7 million and $13.3 million of depreciation and amortization expense for the years ended December 31, 2009, 2008 and 2007, respectively, related to property and equipment.
72
SONUS NETWORKS, INC.
Notes to Consolidated Financial Statements (Continued)
(7) PROPERTY AND EQUIPMENT (Continued)
Property and equipment under capital leases included in the amounts above are as follows (in thousands):
| |
December 31, | ||||||
|---|---|---|---|---|---|---|---|
| |
2009 | 2008 | |||||
Cost |
$ | 735 | $ | 1,383 | |||
Less accumulated depreciation |
(592 | ) | (996 | ) | |||
Property and equipment under capital leases, net |
$ | 143 | $ | 387 | |||
In 2009 and 2008, the Company removed certain depreciable assets that were no longer in service. The gross amount of such assets totaled $3.3 million and $7.3 million in 2009 and 2008, respectively. The Company recorded losses on the disposal of these assets of $0.2 million and $0.3 million in the years ended December 31, 2009 and 2008, respectively.
The net book value of the Company's property and equipment by geographic area is as follows (in thousands):
| |
December 31, | ||||||
|---|---|---|---|---|---|---|---|
| |
2009 | 2008 | |||||
United States |
$ | 11,094 | $ | 14,976 | |||
Asia/Pacific |
2,404 | 1,216 | |||||
Europe |
1,062 | 1,545 | |||||
Canada |
85 | 114 | |||||
Other |
1 | 1 | |||||
|
$ | 14,646 | $ | 17,852 | |||
(8) INTANGIBLE ASSETS AND GOODWILL
The Company's intangible assets at December 31, 2009 and 2008 consist of the following (in thousands):
December 31, 2009
|
Useful life | Cost | Accumulated amortization |
Net carrying value |
||||||||
|---|---|---|---|---|---|---|---|---|---|---|---|---|
Intellectual property |
5 years | $ | 999 | $ | 658 | $ | 341 | |||||
Order backlog |
1 year | 287 | 287 | — | ||||||||
|
$ | 1,286 | $ | 945 | $ | 341 | ||||||
December 31, 2008
|
Useful life | Cost | Accumulated amortization |
Net carrying value |
||||||||
|---|---|---|---|---|---|---|---|---|---|---|---|---|
Intellectual property |
5 years | $ | 999 | $ | 504 | $ | 495 | |||||
Order backlog |
1 year | 247 | 174 | 73 | ||||||||
|
$ | 1,246 | $ | 678 | $ | 568 | ||||||
The Company amortizes its intangible assets over the estimated useful lives of the respective assets. Amortization expense related to intangible assets was $0.2 million, $1.2 million and $0.4 million
73
SONUS NETWORKS, INC.
Notes to Consolidated Financial Statements (Continued)
(8) INTANGIBLE ASSETS AND GOODWILL (Continued)
in the years ended December 31, 2009, 2008 and 2007, respectively. These amounts include $0.1 million of amortization expense for both years ended December 31, 2008 and 2007, that is included as a component of Loss from discontinued operations, net of tax, in the consolidated statements of operations.
Estimated future amortization expense for intangible assets recorded by the Company at December 31, 2009 is as follows (in thousands):
Years ending December 31,
|
|
|||
|---|---|---|---|---|
2010 |
$ | 152 | ||
2011 |
152 | |||
2012 |
37 | |||
|
$ | 341 | ||
In connection with the preparation of the Company's financial statements for the fourth quarter of fiscal 2008, the Company conducted its quarterly review for impairment indicators, during which it determined that there were several impairment indicators related to the intangible assets, including significant underperformance relative to plan or long-term projections, strategic changes in business strategy, significant negative industry and economic trends, a significant change in circumstances relative to a large customer and a significant decline in the Company's stock price for a sustained period. In response, the Company performed an assessment of the carrying value of its intangible assets. This analysis concluded that the customer relationship and intellectual property intangible assets acquired in the April 18, 2008 acquisition of Atreus Systems, Inc., a privately held company with its principal office located in Ottawa, Canada (collectively with its subsidiaries, "Atreus") were impaired. Accordingly, the Company recognized an impairment loss for the amount by which the carrying value of the intangible assets exceeded the related estimated fair value. As a result, the Company recorded a charge of $2.7 million for the write-down of intangible assets in the fourth quarter of fiscal 2008. This amount is reported under the caption Impairment of intangible assets in the Company's consolidated statement of operations for the year ended December 31, 2008.
Goodwill is recorded when the consideration for an acquisition exceeds the fair value of net tangible and identifiable intangible assets acquired. The changes in the carrying amount of goodwill during the years ended December 31, 2009 and 2008 are as follows (in thousands):
| |
2009 | 2008 | ||||||
|---|---|---|---|---|---|---|---|---|
Balance at January 1 |
||||||||
Goodwill |
$ | 8,131 | $ | 11,503 | ||||
Accumulated impairment losses |
(3,106 | ) | (3,106 | ) | ||||
|
5,025 | 8,397 | ||||||
Goodwill acquired during the year |
— | 276 | ||||||
Goodwill related to sale of business |
— | (2,068 | ) | |||||
Foreign currency translation adjustment |
28 | (1,580 | ) | |||||
Balance at December 31 |
||||||||
Goodwill |
8,159 | 8,131 | ||||||
Accumulated impairment losses |
(3,106 | ) | (3,106 | ) | ||||
|
$ | 5,053 | $ | 5,025 | ||||
74
SONUS NETWORKS, INC.
Notes to Consolidated Financial Statements (Continued)
(8) INTANGIBLE ASSETS AND GOODWILL (Continued)
The Company performed its annual test for impairment of goodwill at November 30, 2009, and concluded that there was no impairment.
(9) VALUATION AND QUALIFYING ACCOUNTS
Allowance for Doubtful Accounts
The activity in Sonus' allowance for doubtful accounts is as follows (in thousands):
Year ended December 31,
|
Balance at beginning of year |
Charges to expense |
Write-offs | Balance at end of year |
|||||||||
|---|---|---|---|---|---|---|---|---|---|---|---|---|---|
2009 |
$ | 1,028 | $ | 590 | $ | (952 | ) | $ | 666 | ||||
2008 |
$ | 474 | $ | 813 | $ | (259 | ) | $ | 1,028 | ||||
2007 |
$ | 592 | $ | 158 | $ | (276 | ) | $ | 474 | ||||
Inventory Reserves
The activity in Sonus' inventory reserves is as follows (in thousands):
Year ended December 31,
|
Balance at beginning of year |
Charges to expense |
Dispositions and sales |
Balance at end of year |
|||||||||
|---|---|---|---|---|---|---|---|---|---|---|---|---|---|
2009 |
$ | 8,560 | $ | 3,787 | $ | (3,281 | ) | $ | 9,066 | ||||
2008 |
$ | 9,845 | $ | 5,594 | $ | (6,879 | ) | $ | 8,560 | ||||
2007 |
$ | 5,969 | $ | 5,839 | $ | (1,963 | ) | $ | 9,845 | ||||
(10) ACCRUED EXPENSES
Accrued expenses consist of the following (in thousands):
| |
December 31, | ||||||
|---|---|---|---|---|---|---|---|
| |
2009 | 2008 | |||||
Employee compensation and related costs |
$ | 11,892 | $ | 13,190 | |||
Employee stock purchase plan |
653 | 1,229 | |||||
Professional fees |
863 | 2,422 | |||||
Royalties |
1,039 | 1,809 | |||||
Income taxes payable |
648 | 1,563 | |||||
Sales taxes payable |
2,278 | 2,715 | |||||
Other taxes |
96 | 902 | |||||
Restructuring |
82 | 567 | |||||
Other |
1,741 | 3,834 | |||||
|
$ | 19,292 | $ | 28,231 | |||
(11) RESTRUCTURING ACCRUAL
In the year ended December 31, 2009, the Company recorded restructuring expenses aggregating $3.5 million related to three restructuring initiatives implemented as part of the Company's efforts to
75
SONUS NETWORKS, INC.
Notes to Consolidated Financial Statements (Continued)
(11) RESTRUCTURING ACCRUAL (Continued)
right-size the business to align with market needs and opportunities while managing costs to position Sonus for profitable growth. These restructuring initiatives occurred on January 9, 2009, March 9, 2009 and August 12, 2009. As a result of these restructuring initiatives, the Company reduced its workforce by approximately 190 employees worldwide. The Company believes that the actions related to these restructuring initiatives are complete as of December 31, 2009 and that the payments related to these initiatives will be completed in the first quarter of fiscal 2010.
In fiscal 2008, the Company recorded $0.7 million of restructuring expense related to a restructuring initiative implemented as part of the Company's efforts to right-size the business to align with market opportunities while managing costs to position Sonus for profitable growth. Approximately 50 employees, or 5% of the then-current workforce, were affected by such restructuring initiative.
The Company reports expense for its restructuring initiatives as separately in the consolidated statements of operations. The table below summarizes the severance and related costs activity related to the Company's restructuring initiatives during the years ended December 31, 2009 and 2008 (in thousands):
Year ended December 31,
|
Balance at beginning of year | New initiatives charged to expense | Charges (reversals) for changes in estimate | Cash payments | Foreign exchange | Balance at end of year | |||||||||||||
|---|---|---|---|---|---|---|---|---|---|---|---|---|---|---|---|---|---|---|---|
2009 |
$ | 567 | $ | 3,548 | $ | (38 | ) | $ | (4,003 | ) | $ | 8 | $ | 82 | |||||
2008 |
$ | — | $ | 702 | $ | — | $ | (135 | ) | $ | — | $ | 567 | ||||||
The balances at December 31, 2009 and 2008 are included as components of Accrued expenses in the Company's consolidated balance sheets.
(12) LONG-TERM LIABILITIES
Long-term liabilities consist of the following (in thousands):
| |
December 31, | ||||||
|---|---|---|---|---|---|---|---|
| |
2009 | 2008 | |||||
Capital lease obligations |
$ | 285 | $ | 515 | |||
Deferred rent |
1,595 | 1,707 | |||||
Other |
— | 944 | |||||
|
1,880 | 3,166 | |||||
Current portion of long-term liabilities |
(753 | ) | (1,301 | ) | |||
Long-term liabilities, net of current portion |
$ | 1,127 | $ | 1,865 | |||
76
SONUS NETWORKS, INC.
Notes to Consolidated Financial Statements (Continued)
(12) LONG-TERM LIABILITIES (Continued)
The future minimum annual payments under capital leases at December 31, 2009 are as follows (in thousands):
Years ending December 31,
|
|
||||
|---|---|---|---|---|---|
2010 |
$ | 240 | |||
2011 |
42 | ||||
2012 |
12 | ||||
2013 |
7 | ||||
2014 |
5 | ||||
Thereafter |
5 | ||||
Total minimum lease payments |
311 | ||||
Less amount representing interest |
(26 | ) | |||
Present value of minimum lease payments |
285 | ||||
Less current portion |
(221 | ) | |||
Long-term liabilities portion |
$ | 64 | |||
(13) STOCK OPTION EXCHANGE OFFER
At the Company's Annual Meeting of Stockholders held on June 19, 2009 (the "2009 Annual Meeting"), the Company's stockholders approved a one-time voluntary stock option exchange program (the "Exchange Offer"). On September 8, 2009, the Company commenced the Exchange Offer, which allowed employees to surrender eligible outstanding stock options with exercise prices equal to or greater than the highest intra-day trading price of the Company's common stock as reported on The NASDAQ Global Select Market during the previous 52 weeks in exchange for a lesser amount of restricted stock. The number of shares of restricted stock granted to each participant in the Exchange Offer was determined according to exchange ratios based on a combination of exercise price and remaining contractual terms of surrendered stock options. Shares of restricted stock issued under the Exchange Offer were completely unvested at the time they were granted and will become vested on the basis of a participant's continued employment with the Company or any of its subsidiaries over a period of three years following the exchange date, with 331/3% of the shares vesting annually.
The Exchange Offer expired on October 5, 2009. Pursuant to the Exchange Offer, a total of 185 eligible participants tendered and the Company accepted for cancellation, options to purchase an aggregate of 5,476,701 shares of the Company's common stock with exercise prices greater than or equal to $3.54 per share, with an average exercise price of $5.48 per share. The eligible stock options that were accepted for cancellation represented approximately 36% of the options eligible for participation in the Exchange Offer. In accordance with the terms and conditions of the Exchange Offer, on October 6, 2009, the Company issued 1,015,360 shares of restricted common stock in exchange for the tendered stock options. The exchange ratios were designed to provide for the grant of replacement restricted stock that has a fair value, in the aggregate, that is no greater than the fair value of the stock options surrendered. The Company recognized the insignificant incremental expense resulting from this exchange in the fourth quarter of fiscal 2009. The Company will recognize the unamortized stock-based compensation expense related to the tendered stock options, aggregating
77
SONUS NETWORKS, INC.
Notes to Consolidated Financial Statements (Continued)
(13) STOCK OPTION EXCHANGE OFFER (Continued)
$3.5 million, over the three-year vesting period of the restricted common stock issued under the Exchange Offer.
(14) STOCK-BASED COMPENSATION PLANS
The Company's 2007 Stock Incentive Plan, as Amended (the "2007 Plan"), was approved at the Company's Annual Meeting of Stockholders held on November 12, 2007, and became effective on that date. The 2007 Plan provides for the award of options to purchase the Company's common stock ("stock options"), stock appreciation rights ("SARs"), restricted common stock ("restricted stock"), performance-based share awards, restricted stock units and other stock-based awards to employees, officers, directors (including those directors who are not employees or officers of the Company), consultants and advisors of the Company and its subsidiaries.
At the Company's 2009 Annual Meeting, the stockholders approved amendments to the 2007 Plan, including: (1) to increase the number of shares of the Company's common stock that may be issued under the 2007 Plan by the number of shares underlying the options that were surrendered and cancelled under the Exchange Offer (see Note 13); (2) to implement a "fungible share pool" approach to manage authorized shares in order to improve the flexibility of awards going forward; (3) to provide that, in determining the number of shares available for grant, a formula will be applied such that all future awards other than stock options and stock appreciation rights will be counted against shares available as 1.5 times the number of shares covered by such award; and (4) to increase the maximum number of shares to be granted to any participant under the 2007 Plan from one million to two million shares per calendar year (the "Amended 2007 Plan").
At December 31, 2009, there were 6.0 million shares available for future issuance under the Amended 2007 Plan, of which 0.3 million shares, or 0.5 million shares using the fungible share pool formula, are committed for potential future issuance to certain of the Company's executives in the form of performance-based share awards. Due to the fungible share pool, the number of total shares available for future awards under the Amended 2007 Plan would be reduced by the fungible share pool multiple of 1.5 for each share of common stock included in an award other than a stock option or SAR award. Accordingly, the total number of shares awarded in the future under the Amended 2007 Plan could be less than the number of shares currently available for issuance.
The Company issued stock options and restricted stock under the 1997 Stock Incentive Plan (the "1997 Plan") through November 18, 2007, when the 1997 Plan expired.
Stock Options
Options are issued to purchase shares of common stock of the Company at prices that are equal to the fair market value of the shares on the date the option is granted. Options generally vest over a period of four years, with 25% of the shares subject to the option vesting on the first anniversary of the grant date and the remaining 75% vesting in equal monthly increments thereafter through the fourth anniversary of the grant date. Options generally expire ten years from the date of grant. The grant date fair value of options, adjusted for estimated forfeitures, is recognized as expense on a straight-line basis over the requisite service period, which is generally the vesting period. Forfeitures are estimated based on historical experience.
78
SONUS NETWORKS, INC.
Notes to Consolidated Financial Statements (Continued)
(14) STOCK-BASED COMPENSATION PLANS (Continued)
The activity related to the Company's outstanding stock options during the year ended December 31, 2009 is as follows:
| |
Number of Shares |
Weighted Average Exercise Price |
Weighted Average Remaining Contractual Term (years) |
Aggregate Intrinsic Value (in thousands) |
||||||||||
|---|---|---|---|---|---|---|---|---|---|---|---|---|---|---|
Outstanding at January 1, 2009 |
36,875,380 | $ | 5.19 | |||||||||||
Granted |
1,973,000 | $ | 1.76 | |||||||||||
Exercised |
(96,304 | ) | $ | 0.53 | ||||||||||
Cancelled in connection with the Exchange Offer |
(5,476,701 | ) | $ | 5.48 | ||||||||||
Forfeited |
(1,719,688 | ) | $ | 5.04 | ||||||||||
Expired |
(7,474,122 | ) | $ | 5.09 | ||||||||||
Outstanding at December 31, 2009 |
24,081,565 | $ | 4.90 | 4.65 | $ | 1,055 | ||||||||
Vested or expected to vest at December 31, 2009 |
23,695,563 | $ | 4.92 | 4.59 | $ | 1,011 | ||||||||
Exercisable at December 31, 2009 |
19,159,462 | $ | 5.17 | 3.68 | $ | 329 | ||||||||
The Company used the Black-Scholes valuation model for estimating the grant date fair value of employee stock options granted using the following assumptions for the years ended December 31, 2009, 2008 and 2007:
| |
Year ended December 31, | |||||||||
|---|---|---|---|---|---|---|---|---|---|---|
| |
2009 | 2008 | 2007 | |||||||
Risk-free interest rate |
1.76%–2.47% | 2.18%–3.12% | 4.5 | % | ||||||
Expected dividends |
— | — | — | |||||||
Weighted average volatility |
64.3% | 71.75% | 60.1 | % | ||||||
Expected life (years) |
4.5 | 4.5 | 4.5 | |||||||
The risk-free interest rate used is the average U.S. Treasury Constant Maturities Rate for the expected term of the award. The expected dividend yield of zero is based on the fact that the Company has never paid dividends and has no present intention to pay cash dividends. The expected life for stock options is based on a combination of the Company's historical option patterns and expectations of future employee actions.
The weighted average grant-date fair values of options granted during the years ended December 31, 2009, 2008 and 2007 were $0.97, $2.23 and $3.33, respectively. The total intrinsic values of options exercised during the years ended December 31, 2009, 2008 and 2007 were $0.1 million, $0.3 million and $17.0 million, respectively.
The Company received cash from option exercises of $0.1 million, $0.4 million and $39.5 million in the years ended December 31, 2009, 2008 and 2007, respectively.
79
SONUS NETWORKS, INC.
Notes to Consolidated Financial Statements (Continued)
(14) STOCK-BASED COMPENSATION PLANS (Continued)
Restricted Stock Awards
Recipients of restricted stock awards have voting rights and rights to receive dividends, if declared. Restricted stock awards generally vest 25% on the first anniversary of the grant date, with the remaining 75% vesting in equal increments semi-annually thereafter. Restricted stock awards issued in connection with the Company's Exchange Offer vest over a period of three years following the exchange date, with 331/3% of the shares vesting annually. The grant date fair value of restricted stock awards, adjusted for estimated forfeitures, is recognized as expense on a straight-line basis over the requisite service period. The fair value of restricted stock is determined based on the market value of the Company's shares on the date of grant.
The activity related to the Company's unvested restricted stock awards for the year ended December 31, 2009 is as follows:
| |
Shares | Weighted Average Grant-date Fair Value |
||||||
|---|---|---|---|---|---|---|---|---|
Unvested balance at January 1, 2009 |
3,539,161 | $ | 4.40 | |||||
Granted |
372,500 | $ | 1.88 | |||||
Granted in connection with the Exchange Offer |
1,015,360 | $ | 2.04 | |||||
Vested |
(1,098,798 | ) | $ | 4.45 | ||||
Forfeited |
(383,727 | ) | $ | 5.25 | ||||
Unvested balance at December 31, 2009 |
3,444,496 | $ | 3.29 | |||||
The total fair value of restricted stock shares vested during the years ended December 31, 2009, 2008 and 2007 was $4.9 million, $7.0 million and $15.7 million, respectively.
Performance-based Stock Awards
Similar to recipients of restricted stock awards, recipients of performance-based stock awards have voting rights and rights to dividends, if declared. The Company begins to record stock-based compensation expense for performance-based stock awards at the time that it becomes probable that the respective performance conditions will be achieved. The Company will continue to recognize the grant date fair value of performance-based stock awards through the vest date of the respective awards so long as it remains probable that the related performance conditions will be satisfied. The Company recorded approximately $53,000 of stock-based compensation expense in the year ended December 31, 2009 related to 25,000 shares of common stock underlying performance-based awards for which the performance conditions were met and 50,000 shares of common stock underlying performance-based stock awards for which the Company believes it is probable that the performance conditions will be satisfied.
80
SONUS NETWORKS, INC.
Notes to Consolidated Financial Statements (Continued)
(14) STOCK-BASED COMPENSATION PLANS (Continued)
The activity related to the Company's performance-based stock awards for the year ended December 31, 2009 is as follows:
| |
Shares | Weighted Average Grant-date Fair Value |
||||||
|---|---|---|---|---|---|---|---|---|
Unvested balance at January 1, 2009 |
500,000 | $ | 4.35 | |||||
Granted |
75,000 | $ | 2.12 | |||||
Vested* |
(25,000 | ) | $ | 2.12 | ||||
Forfeited |
— | — | ||||||
Unvested balance at December 31, 2009 |
550,000 | $ | 4.15 | |||||
- *
- The shares underlying these performance-based awards will be issued to the employee during the first quarter of fiscal 2010.
There are 341,167 shares of the Company's common stock that are not included in the table above, as the Company has not determined the performance metrics for these awards. The Company will begin to record stock-based compensation expense at the time that the performance metrics are defined and when it becomes probable that the respective performance conditions will be achieved.
ESPP
The Amended and Restated 2000 Employee Stock Purchase Plan (the "ESPP") is designed to provide eligible employees of the Company and its participating subsidiaries an opportunity to purchase common stock of the Company through accumulated payroll deductions.
On January 25, 2008, the Company's Board of Directors approved the ESPP. The ESPP provides for six-month consecutive offering periods commencing with the March 1, 2008 purchase period. The purchase price of the stock is equal to 85% of the market price on the last day of the offering period. Under the ESPP, because employees are entitled to purchase a variable number of shares for a fixed monetary amount, future awards are classified as share-based liabilities and recorded at fair value. However, the maximum number of shares of common stock an employee may purchase during each offering period is 2,500, subject to certain adjustments pursuant to the ESPP. The Company reclassifies these liabilities to Additional paid-in capital at the time of the share purchase, which is the date of the award.
On January 1 of each year, the aggregate number of shares of common stock available for purchase under the ESPP increases by the lesser of (i) 2% of the outstanding shares on December 31 of the preceding year or (ii) an amount determined by the Board of Directors of the Company. At December 31, 2009, 25.0 million shares were authorized and 14.5 million shares were available under the ESPP for future issuance.
81
SONUS NETWORKS, INC.
Notes to Consolidated Financial Statements (Continued)
(14) STOCK-BASED COMPENSATION PLANS (Continued)
Stock-Based Compensation
The consolidated statements of operations include stock-based compensation for the years ended December 31, 2009, 2008 and 2007 as follows (in thousands):
| |
Year ended December 31, | |||||||||
|---|---|---|---|---|---|---|---|---|---|---|
| |
2009 | 2008 | 2007 | |||||||
Product cost of revenue |
$ | 361 | $ | 734 | $ | 860 | ||||
Service cost of revenue |
1,784 | 2,731 | 3,682 | |||||||
Research and development |
3,349 | 7,921 | 16,152 | |||||||
Sales and marketing |
4,231 | 5,662 | 14,316 | |||||||
General and administrative |
3,085 | 8,074 | 7,496 | |||||||
|
$ | 12,810 | $ | 25,122 | $ | 42,506 | ||||
Excluded from the amounts above are approximately $176,000 and $136,000 of stock-based compensation expense included in the loss from discontinued operations for the years ended December 31, 2008 and 2007, respectively. In addition, the Company included $0.1 million and $0.2 million of stock-based compensation in inventory at December 31, 2009 and 2008, respectively.
The income tax benefit for employee stock-based compensation expense was $12.4 million for the year ended December 31, 2007. There is no income tax benefit for employee stock-based compensation expense for the years ended December 31, 2009 and 2008 due to the valuation allowance recorded.
At December 31, 2009, there was $19.7 million, net of expected forfeitures, of unrecognized stock-based compensation expense related to unvested stock options and restricted stock awards, as well as performance-based stock awards for which the Company believes it is probable the performance conditions will be met. This expense is expected to be recognized over a weighted average period of 2.4 years.
Common Stock Reserved
Common stock reserved for future issuance at December 31, 2009 consists of the following:
2007 Stock Incentive Plan |
5,971,479 | |||
Employee Stock Purchase Plan |
14,457,200 | |||
|
20,428,679 | |||
The Company's policy is to issue new shares upon the exercise of stock options, vesting of restricted common stock and performance-based stock awards, and purchase of shares of common stock under the ESPP.
(15) STOCKHOLDER RIGHTS PLAN
On June 26, 2008, the Company's Board of Directors adopted a three-year stockholder rights plan (the "Rights Plan"). The Rights Plan is designed to protect stockholders, to the extent possible, from a creeping acquisition and other tactics to gain control of the Company without offering all stockholders an adequate price and control premium. The Rights Plan is intended to protect the interests of all the
82
SONUS NETWORKS, INC.
Notes to Consolidated Financial Statements (Continued)
(15) STOCKHOLDER RIGHTS PLAN (Continued)
Company's stockholders and to provide the Company's Board of Directors with the ability to attempt to maximize long-term stockholder value.
Under the Rights Plan, preferred stock purchase rights (the "Rights") were distributed as a dividend at the rate of one Right per share of common stock of the Company held by stockholders of record as of the close of business on July 7, 2008. Each Right entitles the stockholder to purchase from the Company a unit consisting of one one-thousandth of a share (a "Unit") of preferred stock at a purchase price of $25.00 per Unit, subject to adjustment. The Rights were issued as a non-taxable dividend and will expire on June 26, 2011 unless earlier redeemed or exchanged.
The Rights generally will be exercisable only if a person or group acquires beneficial ownership of 15% or more of the Company's common stock (which includes for this purpose shares of common stock referenced in derivative transactions or securities), or commences or publicly announces a tender or exchange offer upon consummation of which they would beneficially own 15% or more of the Company's common stock. A person or group who beneficially owned 15% or more of the outstanding shares of the Company's common stock prior to the adoption of the Rights Plan did not cause the Rights to become exercisable upon adoption of the Rights Plan. As a result, the Rights will not be triggered even though Legatum Capital Limited and certain of its affiliates (collectively, "Legatum") have reported that they beneficially owned approximately 25% of the outstanding shares of the Company's common stock prior to the adoption of the Rights Plan based on Legatum's public filings with the Securities and Exchange Commission (the "SEC"). However, Legatum and its affiliates will cause the Rights to become exercisable if they (subject to certain limited exceptions) become the beneficial owner of additional shares of the Company's common stock or their beneficial ownership decreases below 15% and subsequently increases to 15% or more. Should the Rights become exercisable, the effect would be to dilute the ownership of the beneficial owner(s) who triggered the Rights, as that beneficial owner or group of owners would not receive the Rights.
(16) EMPLOYEE DEFINED CONTRIBUTION PLAN
During the fourth quarter of fiscal 2007, the Company enhanced its 401(k) savings plan for employees by implementing a matching contribution of 50% of employee contributions, up to a maximum match of $3,000 per employee. In the first quarter of 2008, the Company's Board of Directors voted to increase the maximum match to $3,500 per employee effective January 1, 2008. The Company recorded expense related to its 401(k) savings plan of $1.2 million, $1.6 million and $0.5 million in the years ended December 31, 2009, 2008 and 2007, respectively.
(17) INCOME TAXES
The components of income (loss) from continuing operations before income taxes consist of the following (in thousands):
| |
Year ended December 31, | ||||||||||
|---|---|---|---|---|---|---|---|---|---|---|---|
| |
2009 | 2008 | 2007 | ||||||||
Income (loss) before income taxes: |
|||||||||||
United States |
$ | (8,135 | ) | $ | (39,253 | ) | $ | (34,843 | ) | ||
Foreign |
744 | 2,778 | 3,242 | ||||||||
|
$ | (7,391 | ) | $ | (36,475 | ) | $ | (31,601 | ) | ||
83
SONUS NETWORKS, INC.
Notes to Consolidated Financial Statements (Continued)
(17) INCOME TAXES (Continued)