Attached files
| file | filename |
|---|---|
| 8-K - FORM 8-K - PLAINS EXPLORATION & PRODUCTION CO | d8k.htm |
| EX-99.1 - PRESS RELEASE - PLAINS EXPLORATION & PRODUCTION CO | dex991.htm |
 4Q 2009
Presentation February 2010 Exhibit 99.2 |
 2
Corporate Headquarters Contacts Plains Exploration & Production Company 700 Milam, Suite 3100 Houston, Texas 77002 Forward-Looking Statements This presentation is not for reproduction or distribution to others without PXP’s
consent. Corporate Information James C. Flores – Chairman, President & CEO Winston M. Talbert – Exec. Vice President & CFO Hance V. Myers – Vice President Investor Relations Joanna Pankey – Manager, Investor
Relations & Shareholder Services Phone: 713-579-6000 Toll Free: 800-934-6083 Email: investor@pxp.com Web Site: www.pxp.com Except for the historical information contained herein, the matters discussed in this presentation are “forward-looking statements” as defined by the Securities and Exchange Commission. These statements involve certain assumptions PXP made based on its experience and perception of historical trends, current conditions, expected future developments and other factors it believes are appropriate under the circumstances. The forward-looking statements are subject to a number of known and unknown risks, uncertainties and other factors that could cause our actual results to differ materially. These risks and uncertainties include, among other things, uncertainties inherent in the exploration for and development and production of oil & gas and in estimating reserves, unexpected future capital expenditures, general economic conditions,
oil and gas price volatility,
the success of our risk management activities, competition, regulatory
changes and other factors discussed in PXP’s filings with the Securities
and Exchange Commission. References to quantities of oil or natural gas may
include amounts that the Company believes will ultimately be produced,
but that are not yet classified as "proved reserves" under SEC definitions. |
 3
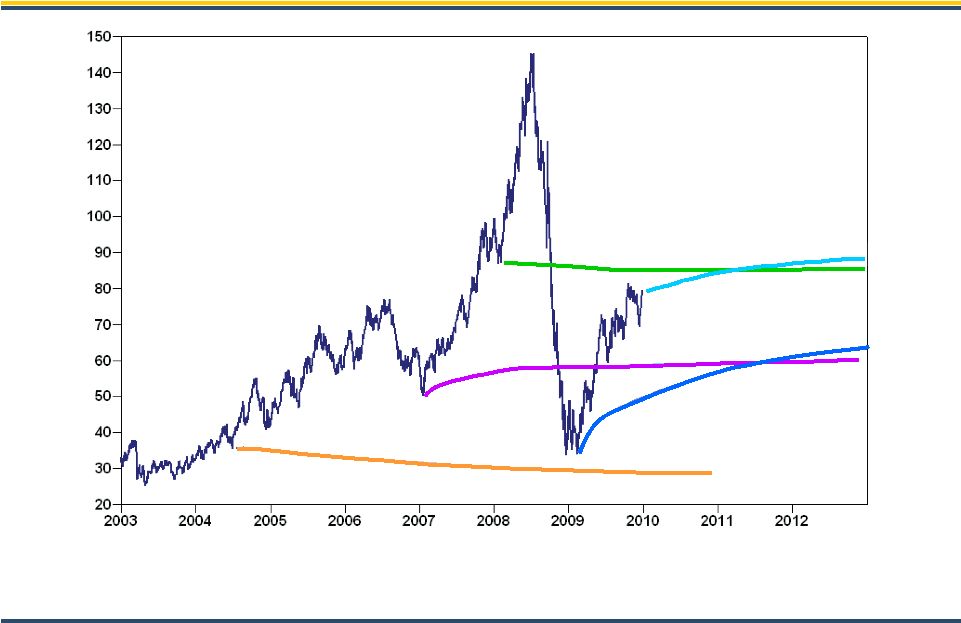
PXP WTI NYMEX Historical Prices and Forward Curves ($/bbl) February 6, 2008 June 29, 2004 January 18, 2007 Source: Goldman Sachs, NYMEX December 31, 2009 February 17, 2009 |
 4
PXP PXP Today • +$7 billion enterprise value (1) • 360 MMBOE proved reserves YE 2009 • 82,700 BOE per day production (2) • +2.0 billion BOE resource potential • 139 million shares outstanding (3) • 45% debt-to-total capitalization (3) (1) Reflects stock price as of January 29, 2010 and total debt. (2) Reported average production for FY 2009. (3) As of December 31, 2009. |
 5
PXP PXP Strategy Detail Operationally Balanced • Expand development of Diatomite, Non-Diatomite and Miocene projects to maintain oil production volumes • Accelerate Granite Wash potential in the Texas Panhandle • Continue Haynesville Shale development to increase natural gas production • Develop high potential deepwater Gulf of Mexico discoveries to increase future oil production • Develop high impact Gulf of Mexico deep shelf discoveries Financially Conservative • Almost $1 Billion available under Credit Revolver (1) • Nearest bond maturity 2015 (1) As of December 31, 2009, the revolver had $230 million of borrowings and $1.2
million letters of credit outstanding. |
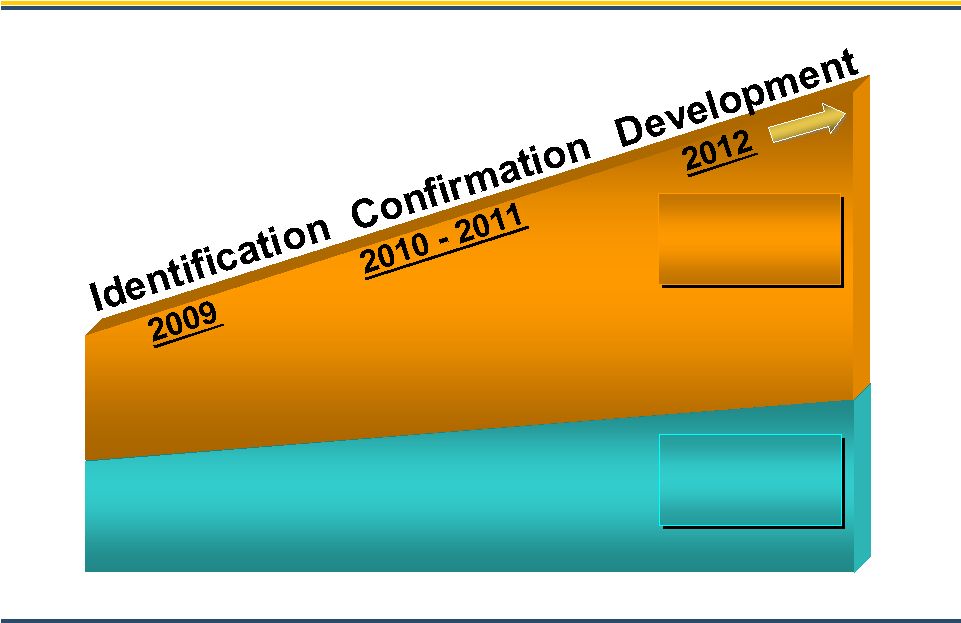 PXP Identification/Confirmation Growth Strategy Base Assets + Haynesville Base Assets + Haynesville Friesian Big Mac Granite Wash Phobos Friesian Big Mac Granite Wash Phobos Davy Jones Lucius Friesian Granite Wash Blueberry Hill Davy Jones Lucius Friesian Granite Wash Blueberry Hill Davy Jones Lucius Blueberry Hill Davy Jones Lucius Blueberry Hill 15% 5 YR CAGR 15% 5 YR CAGR 9% 5 YR CAGR 6 |
 7
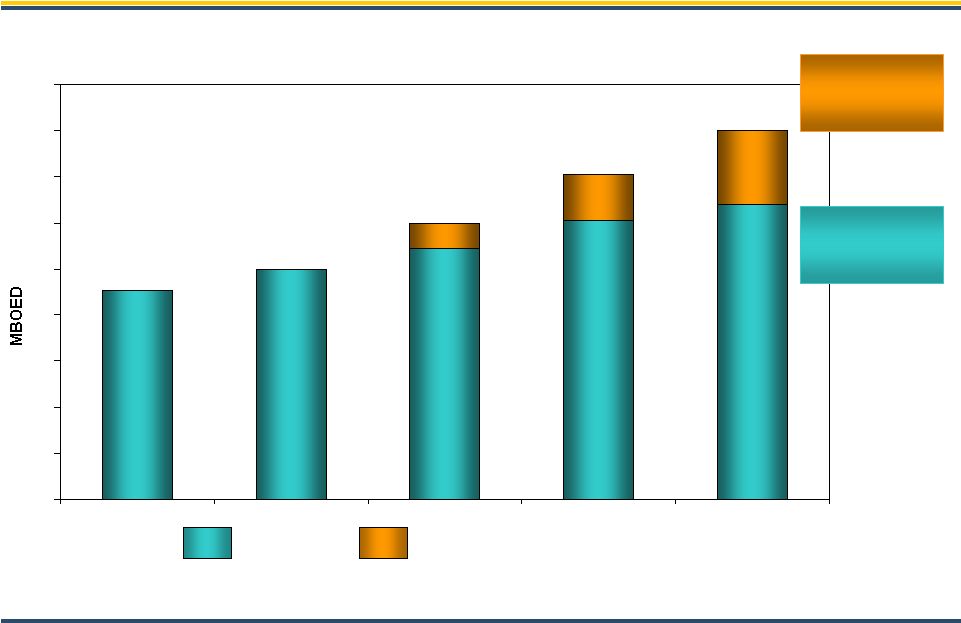
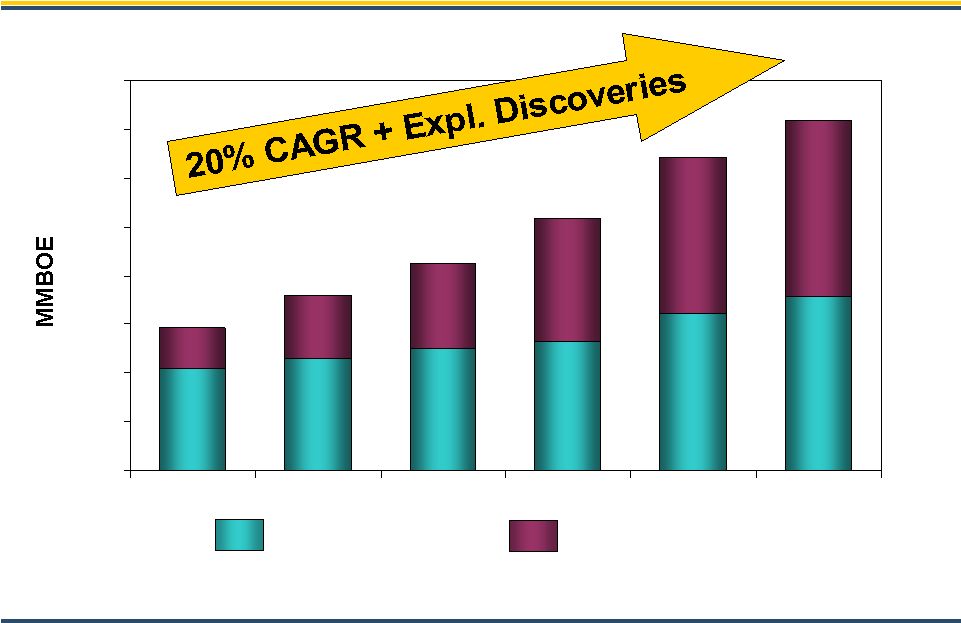
PXP 0 20 40 60 80 100 120 140 160 180 2010e 2011e 2012e 2013e 2014e Base 2009 Exploration Success Exploratory Success Driving Increased Production Target Growth Rate from10% to 15% 90 (1) (1) 2010e production represents guidance mid-point. (2) Represents corporate targets. 100 (2) 120 (2) 140 (2) 160 (2) 32 32 20 20 11 11 15% 5 YR CAGR 9% Base 5 YR CAGR |
 8
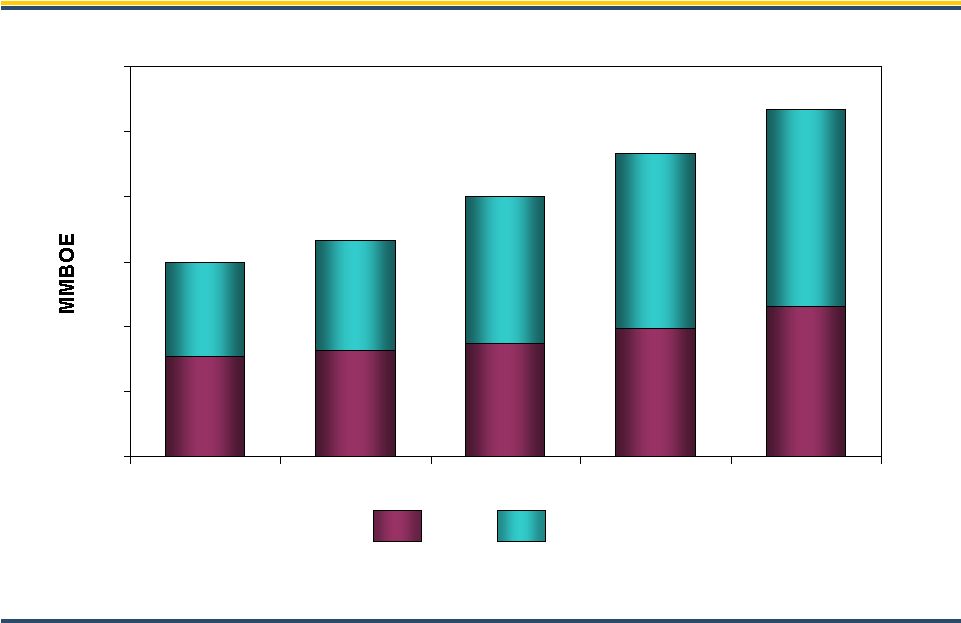
PXP 0 30 60 90 120 150 180 2010 2011 2012 2013 2014 Oil Gas Multi Year Balanced Oil/Gas Production Growth 49% 49% 51% 51% 51% 51% 49% 49% 58% 58% 42% 42% 57% 57% 43% 43% 57% 57% 43% 43% 90 (1) 100 (2) 120 (2) 140 (2) 160 (2) (1) 2010e production represents guidance mid-point. (2) Represents corporate targets. |
 PXP $0.00 $5.00 $10.00 $15.00 $20.00 $25.00 2008 2009 2010 2014 Total Lease Expense Targeted Reduction $9.06 Natural Gas $14.05 $3.97 Natural Gas <$12.00 $6.50 Natural Gas $16.02 $6.50 Natural Gas $3.96 $1.78 $2.04 $2.66 $18.90 Total Lease Expense per BOE Steam Costs per BOE
9 |
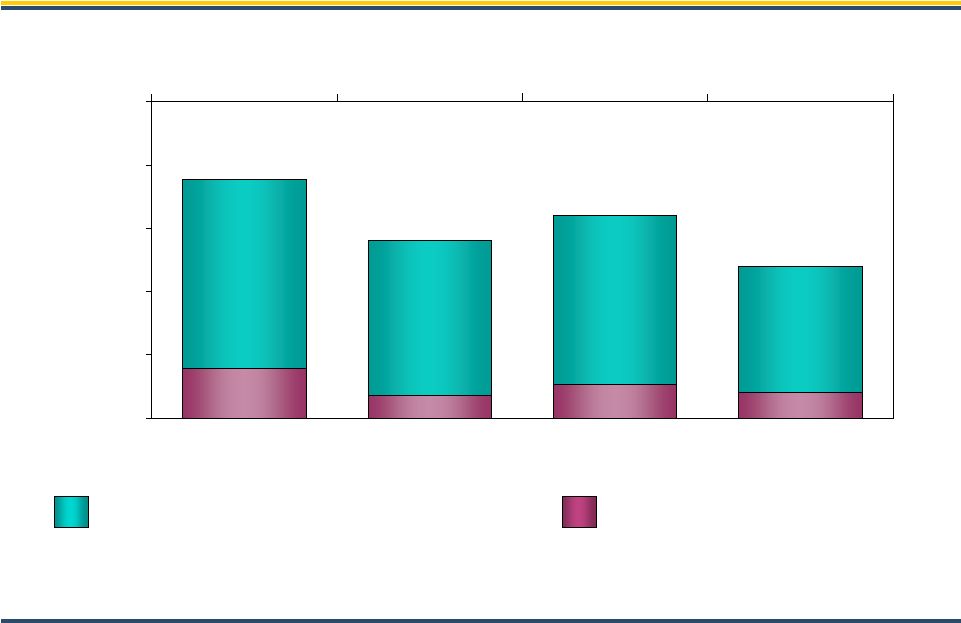
 10 PXP 0 100 200 300 400 500 600 700 800 2008 2009 2010 2011 2012 2013 Proved Developed Proved Undeveloped Proved Reserves Target Growth 292 360 426 (1) 517 (1) 209 72% 209 72% 83 83 130 130 230 64% 230 64% 176 176 250 59% 250 59% 253 253 264 51% 264 51% (1) Illustrates estimated reserves using NYMEX pricing. 643 (1) 321 321 322 50% 322 50% 719 (1) 359 359 360 50% 360 50% |
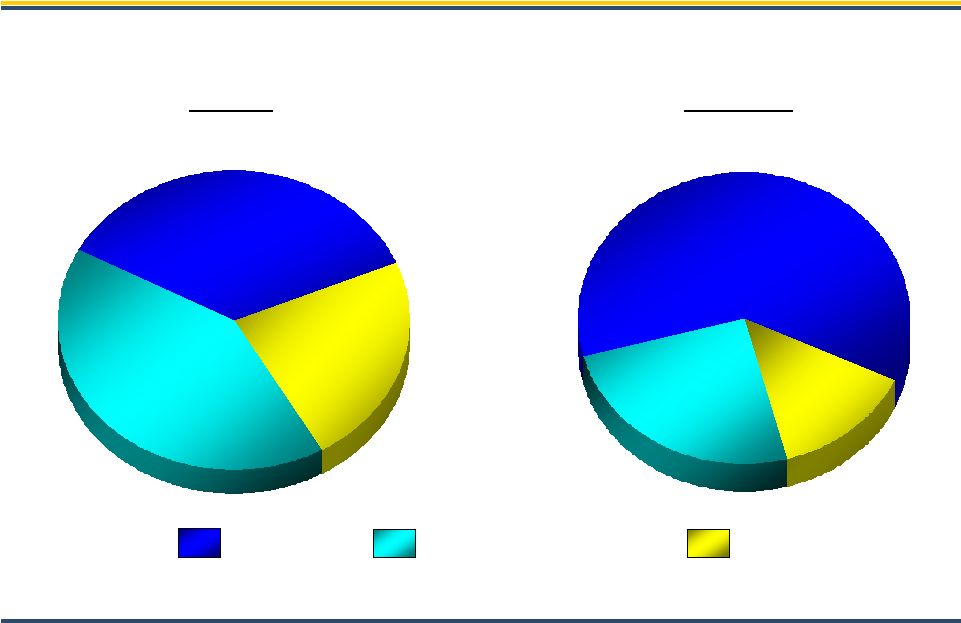 11 PXP Capital Allocation 2009 $1.58 billion 2010E $1.2 billion 25% 61% 14% Development Capital Program Exploration 23% 41% 36% Development capital includes exploitation, real estate, capitalized interest and G&A
costs but does not include additional capital for exploratory
successes. Exploration capital is defined as discovery and dry hole
costs. H'Ville H'Ville Development-Haynesville |
   12
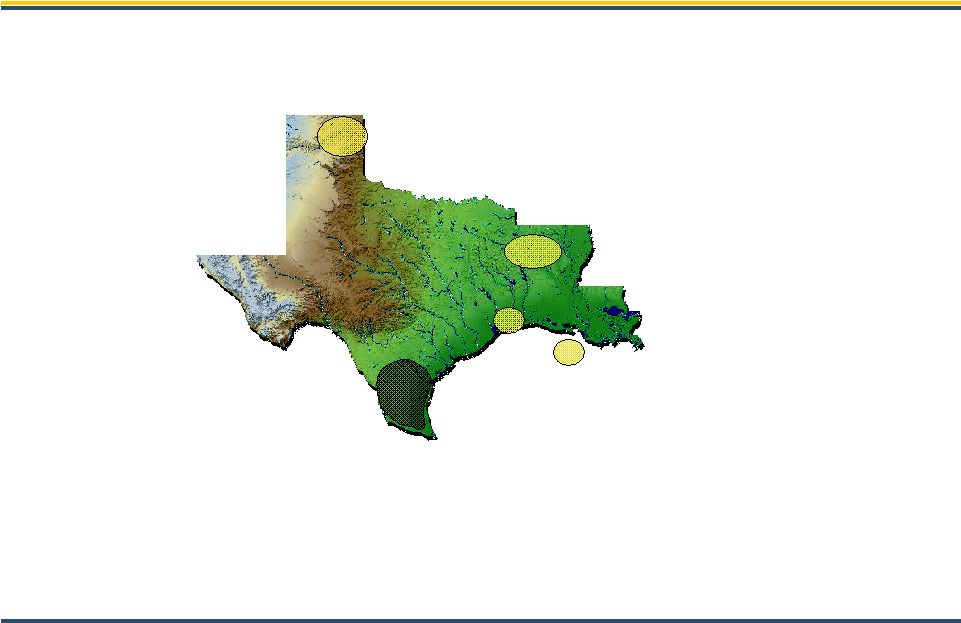
PXP Texas/Louisiana Haynesville Shale • 111,000 net acres • 1,400 potential net locations • 51 rigs operating (38 CHK, 13 other) (1) • Current production +70 MMcfe/d net (1) Texas Panhandle • 405,700 gross acres • 715 square miles 3D seismic • Horizontal Granite Wash potential • Current Production
+30 MMcfe/d net (1) South Texas • 90,400 gross acres • 321 square miles 3D seismic • Current production +50 MMcfe/d net (1) Big Mac • 33,400 gross acres • 275 square
miles 3D seismic (1) As of December 31, 2009. The shaded areas are for illustrative purposes only and do not reflect actual leasehold
acreage. South Texas South Texas Haynesville Panhandle Big Mac Big Mac Flatrock Area • 54,000 gross acres offshore Louisiana • 215 square miles 3D seismic • Current production +60 MMcfe/d net (1) |
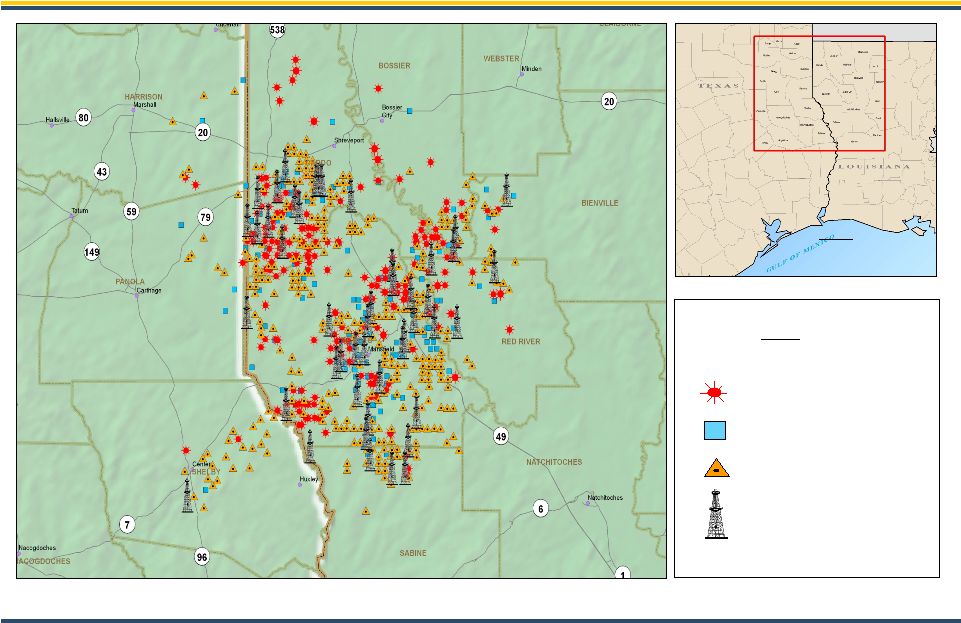 13 PXP Legend PRODUCING WAIT ON COMPLETION 2010 DRILL LOCATIONS ACTIVE DRILLING Location Map Haynesville Shale Leasehold and Activity Map TEXAS LOUISIANA |
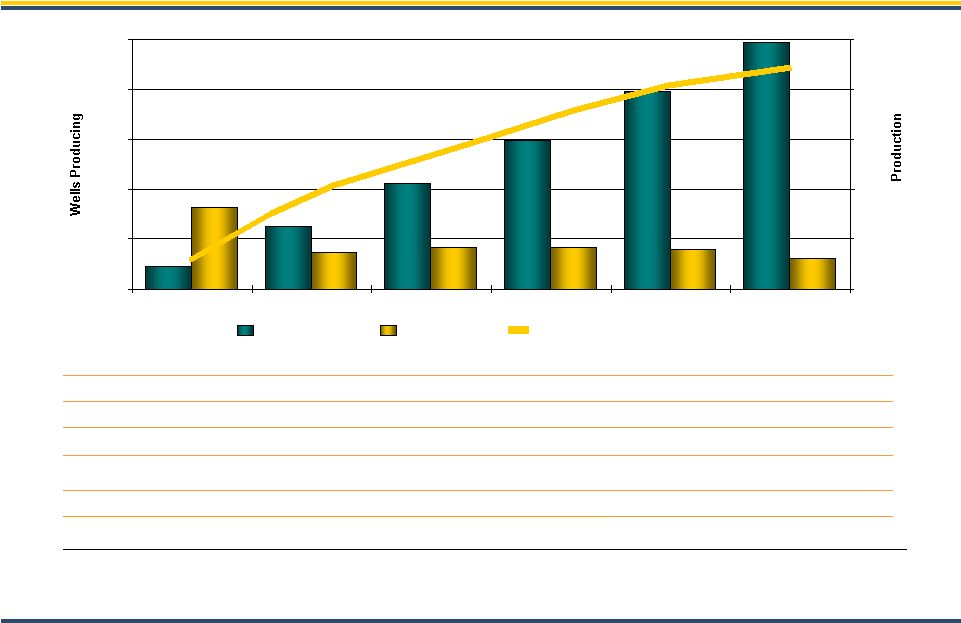 14 PXP 0 400 800 1,200 1,600 2,000 2009 2010 2011 2012 2013 2014 0 60 120 180 240 300 Haynesville Shale Economics $1.37 Mcfe or $8.24/BOE (2) January 1, 2010 Project Cost Forward F&D: (1) Assumes D&C costs for first 4 years = $7.5 MM per well, after 4 years = $6 MM
per well. (2) Assumes flat NYMEX natural gas pricing of $5.50 per
MMBtu. 6.5 Bcfe Est. Median Gross EUR per Well: $7.5 MM (1) Est. Median Gross Well Cost: 6.8 Tcfe Est. Net Resource
Potential: 1,400 Potential Net
Locations:
111,000 Net Acreage: 20% WI/15% NRI PXP
Interest:
Wells
Producing H'Ville CAPEX Avg. Yearly Production MMcf/d PXP Projected Net Production $652 MM $329 MM $332 MM $312 MM $238 MM $288 MM |
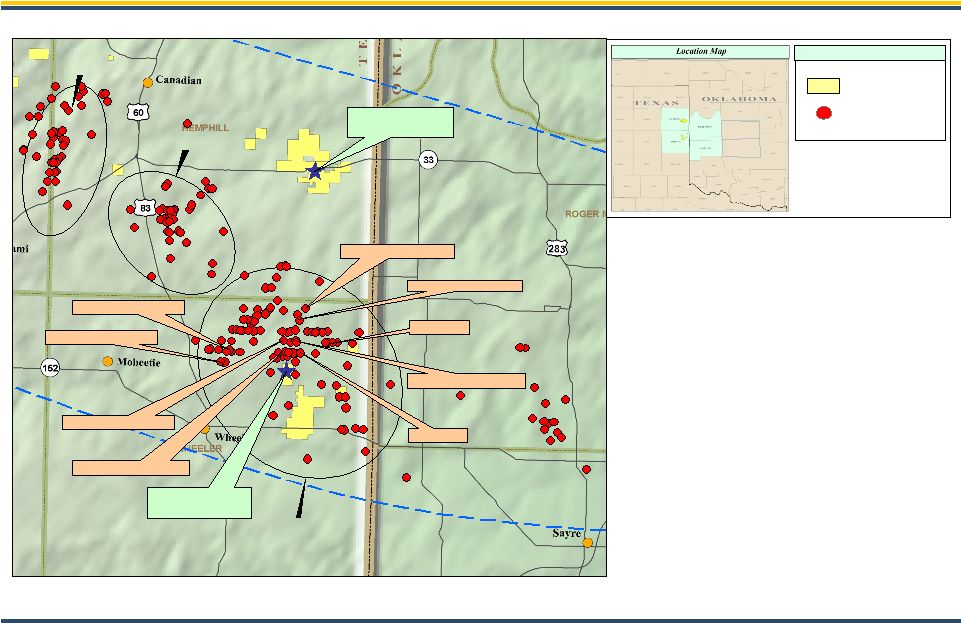 15 PXP Granite Wash Horizontal Play Recent High-Rate Completions • PXP acreage position – 19,500 net acres • Currently drilling two horizontal tests • 58 Primary Granite Wash Locations (PXP WI 86%) • 50+ Additional Granite Wash Locations • Industry ROI 35% @ $5.00/MMBtu & $70/bbl • 2010 Plan - 14 wells planned - $90 MM Capex NW. Mendota Area Buffalo Wallow Area PXP LEASES Horizontal Well Drilled/Permitted Legend Custer Washita Stiles Ranch/ Britt Ranch Area 8.6 MMCFD/1400 BPD 21 MMCFD 20 MMCFD 25 MMCFD / 1900 BPD 21 MMCFD / 1230 BPD 10 MMCFD/3300 BPD 15 MMCFD/3600 BPD 16 MMCFD/3500 BPD PXP Hanson #40-4H PTD: 15,350’ PXP Thomas #903H PTD: 16,500’ 21 MMCFD / 570 BPD |
     16
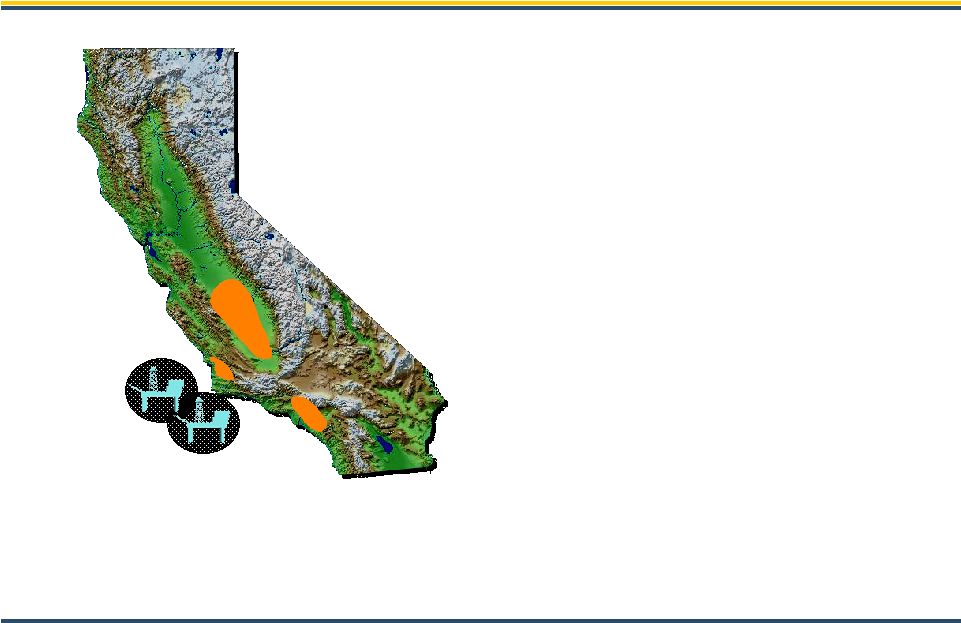
PXP California Onshore/Offshore Los Angeles Basin Los Angeles Basin San Joaquin Valley San Joaquin Valley Arroyo Grande Arroyo Grande Pt Pedernales Pt Arguello • 215 MMBOE Net Proved Reserves • 275 MMBOE Net Resource Potential • 68% Proved Developed • 2009 Capex $92 MM • 14 yr R/P • 2,500+ future well locations • Price differentials protected by contract • Achieved a 22% reduction in LOE for 2009 • Continue to pursue T-Ridge project |
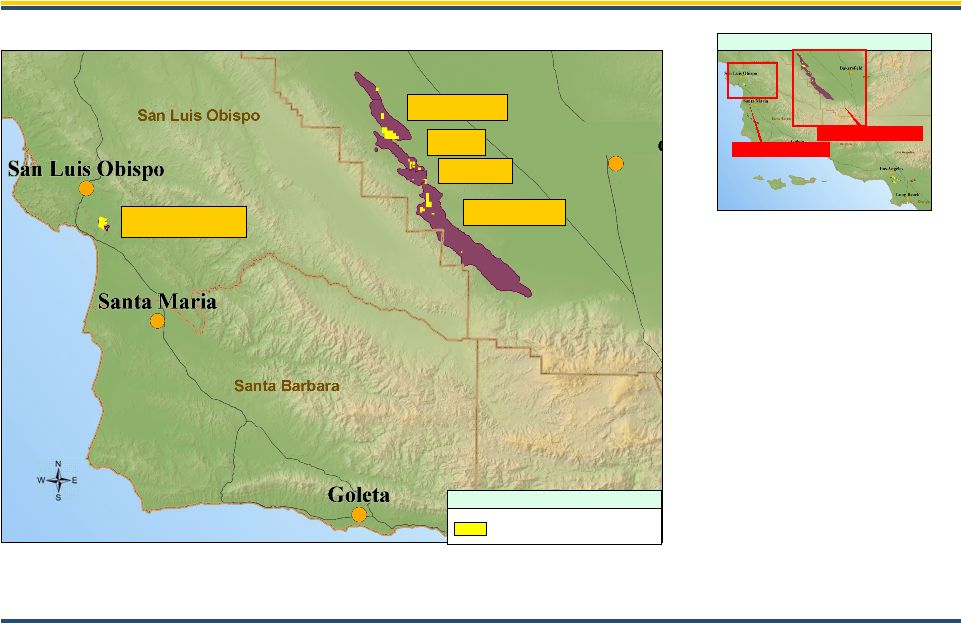 17 PXP Projection: NAD 1927 CAL VII Location Map San Joaquin Valley T:\California\Regional_CA\Graphics\ppt\\CA_Relief_maps.ppt Midway Sunset Cymric South Belridge McKittrick Legend PXP LEASES Diatomite/Non-Diatomite • Steam recovery • Development Resource ~ 165 MMBOE • Diatomite ~ 62 MMBOE • Non-Diatomite ~ 103 MMBOE • 2010 Capital ~$100 MM Diatomite/Non-Diatomite Onshore California – Bakersfield Arroyo Grande Santa Maria Basin Bakersfield |
       18
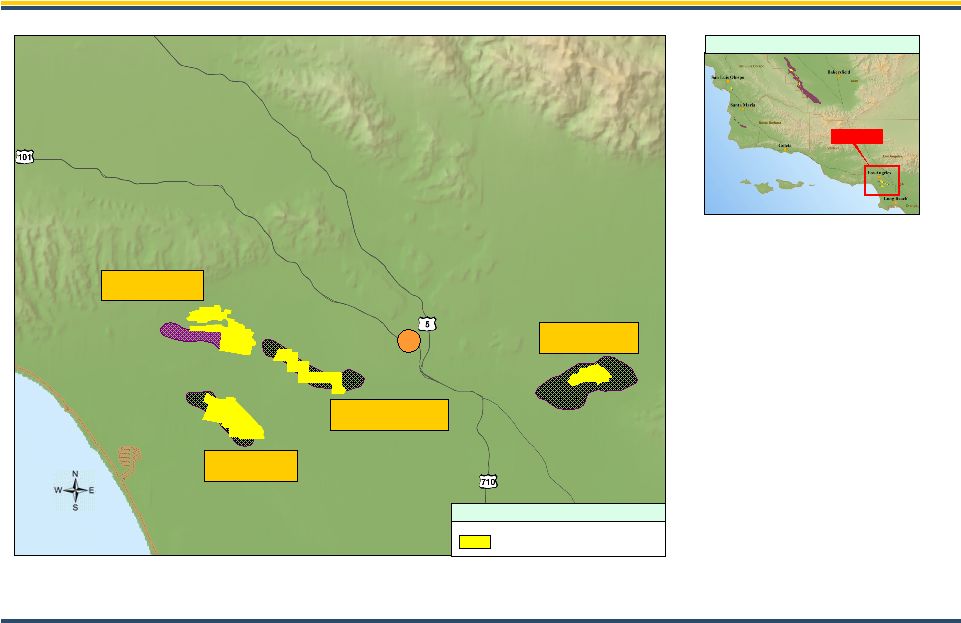
PXP Miocene Sands Onshore California - LA Basin Location Map LA Basin Projection: NAD 1927 CAL VII Legend PXP LEASES T:\California\Regional_CA\Graphics\ppt\\CA_Relief_maps.ppt Miocene/Pliocene Sands • Waterflood recovery • Development Resource ~ 112 MMBOE • 2010 Capital ~$75 MM Los Angeles Montebello Inglewood Urban Area Las Cienegas |
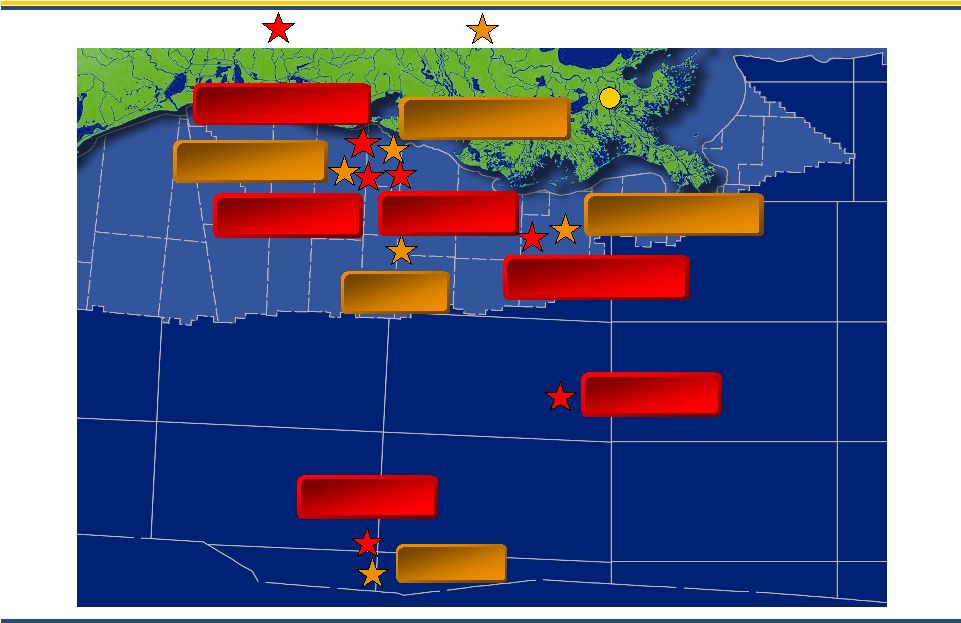 19 PXP Davy Jones Gulf of Mexico Exploration Current Operations and Discoveries Discoveries 2010-2011 Drilling New Orleans Flatrock Field Blueberry Hill Blackbeard West Friesian Lucius John Paul Jones Phobos Blackbeard East Davy Jones 2 Lafitte |
 20 PXP Gulf of Mexico – MMR Joint Venture Average production 4Q 2009. Blueberry Hill Type Log JB Mountain Blueberry Hill Miocene (2009) Development 48% WI / 33% NRI Flatrock Field Miocene Producing 272 MMcfed Net 9721 boepd 30% WI / 22% NRI |
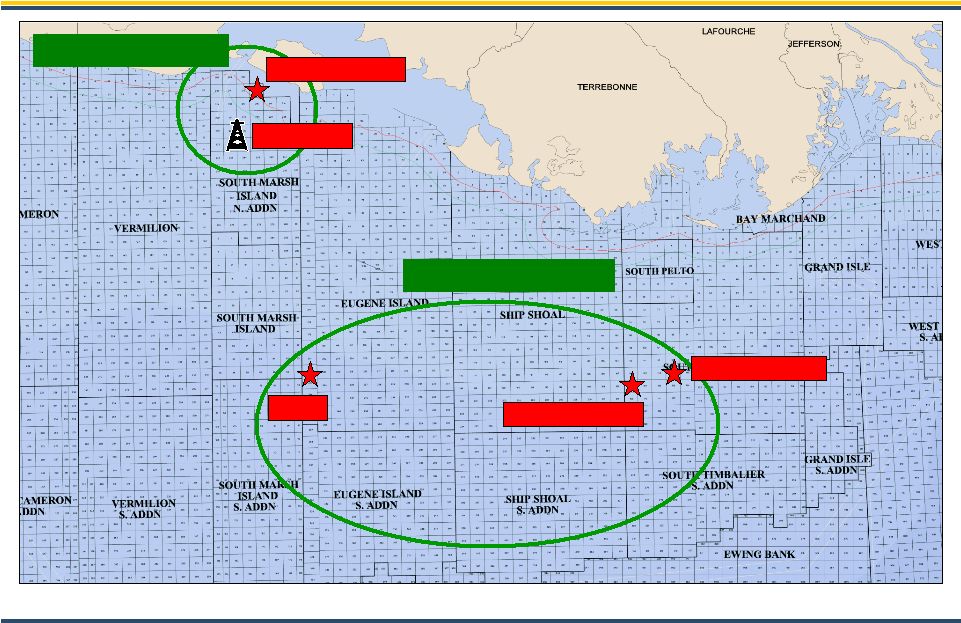 21 PXP Louisiana Lafitte John Paul Jones Davy Jones GOM Shelf Subsalt Prospects Blackbeard West Subsalt Wilcox Trend Subsalt Miocene Trend Blackbeard East |
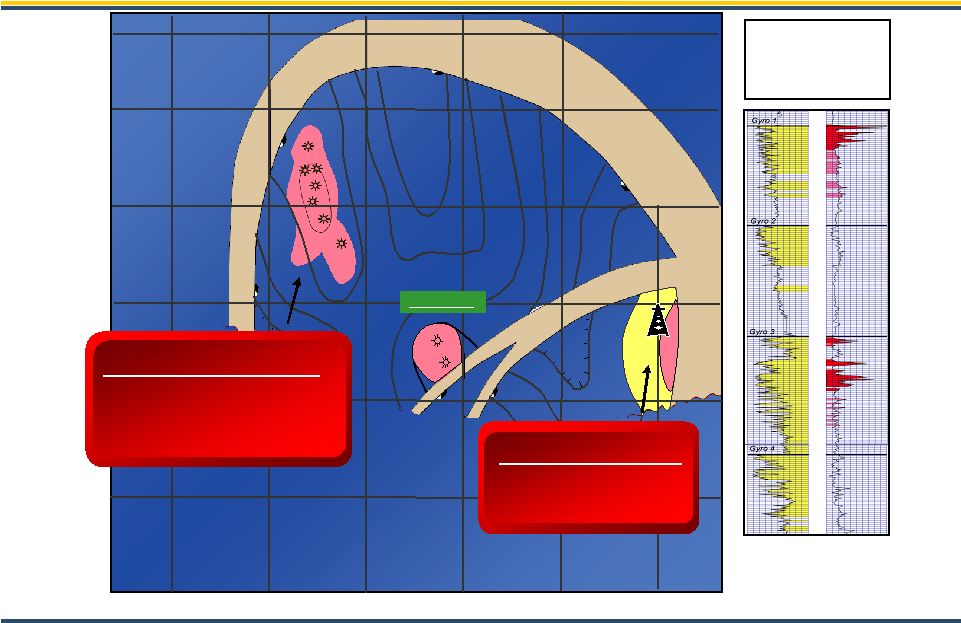
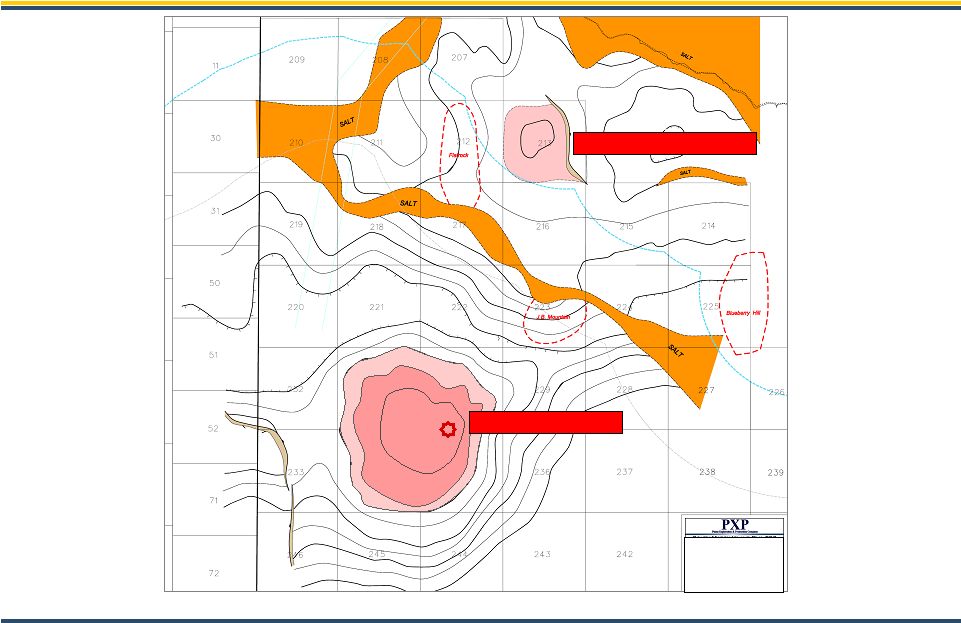 PXP Subsalt Eocene Prospects Davy Jones & John Paul Jones John Paul Jones Prospect Flatrock (Rob L. Operc) Structure Map Top Wilcox Davy Jones Discovery 22 |
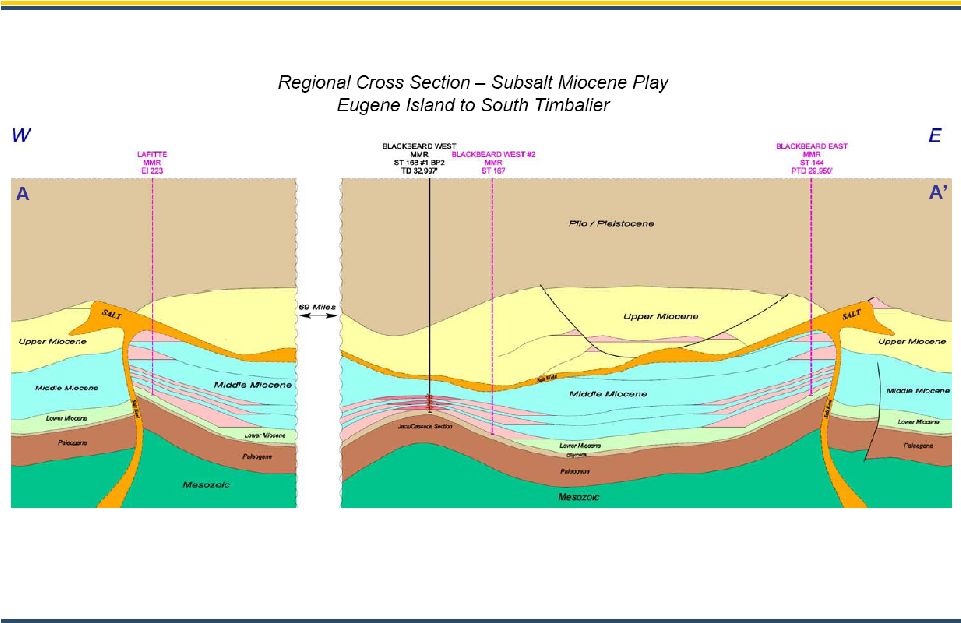 23 PXP Subsalt Miocene Prospects Blackbeard & Lafitte Regional Cross Section |
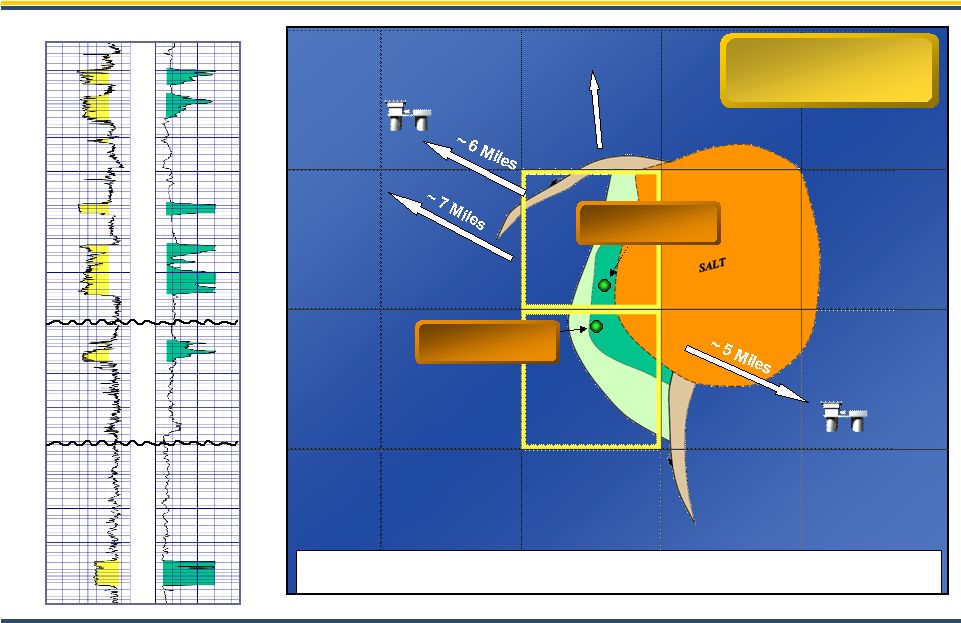 24 PXP Friesian Project Green Canyon Area, GOM Gross Reserve Potential Approx. 125-150 MMBOE “Holstein” Miocene Type Log Friesian 2 Friesian 1 Potential Production Hub Friesian Tahiti Front Runner ~ 22 Miles |
   25
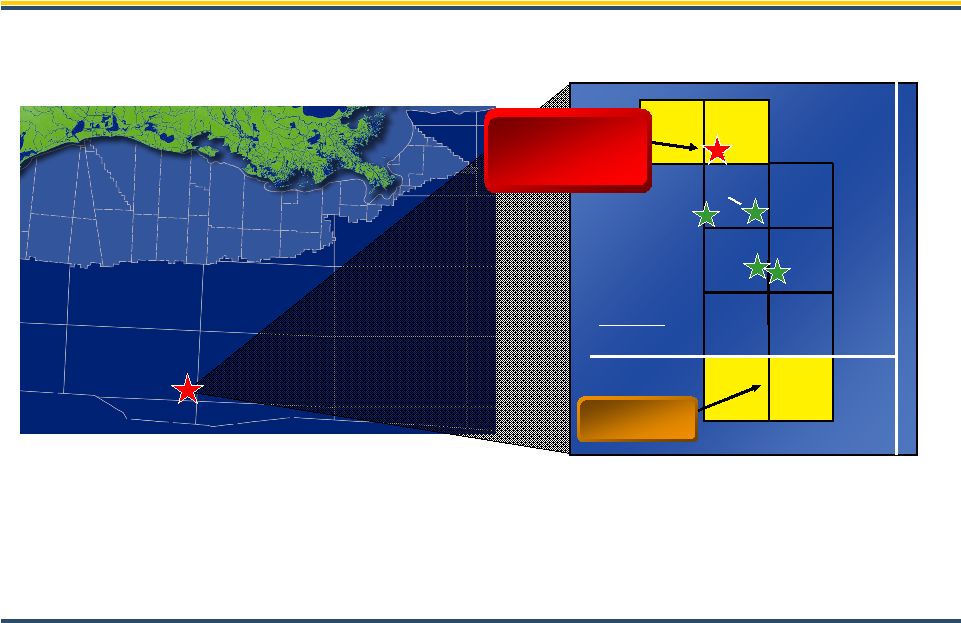
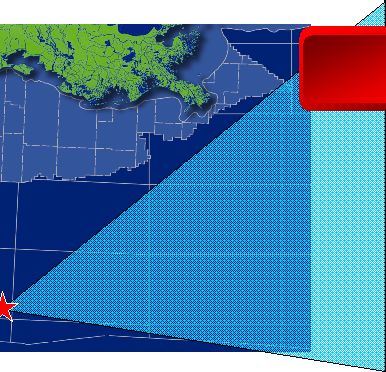
PXP Lucius Project Keathley Canyon Area, GOM LOUISIANA LOUISIANA 1007 1008 39 40 Keathley Canyon 875 874 963 964 919 920 Miles 0 3
HADRIAN PHOBOS Prospect Lucius Discovery PXP WI 33% |
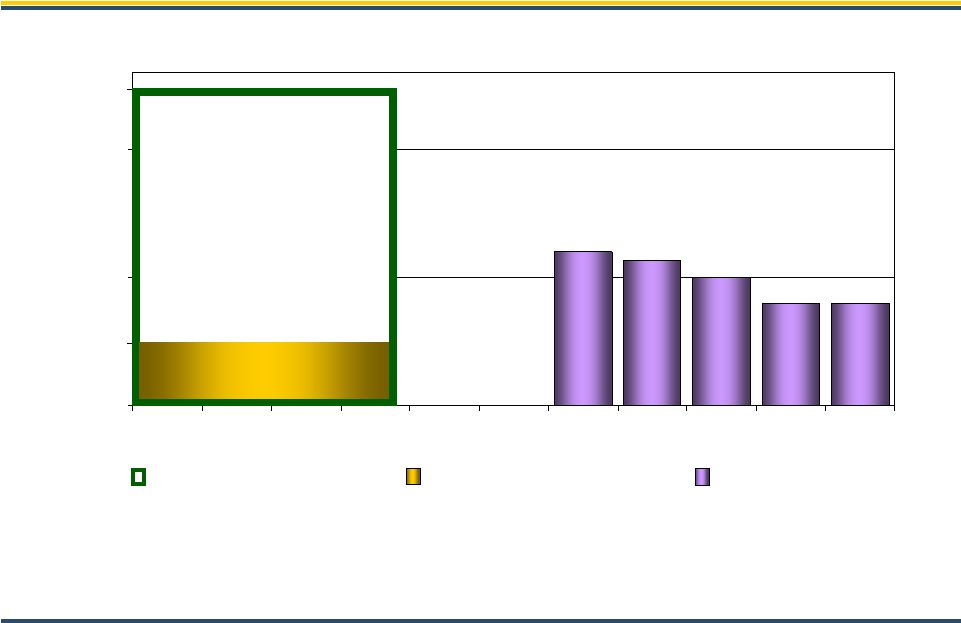
 26 PXP +2.0 Billion BOE Resource Potential Potential Reserves 950 MMBOE 275 MMBOE 100 MMBOE 110 MMBOE 10 MMBOE ~1.4 Billion BOE Development Resource Potential Region Haynesville California Panhandle/S. TX Gulf of Mexico Rockies ~600 Million BOE Exploration Resource Potential Potential Reserves 600 MMBOE Region Gulf of Mexico |
 27 PXP $600 $400 $565 $400 $1,220 $500 $0 $500 $1,000 2009 2010 2011 2012 2013 2014 2015 2016 2017 2018 2019 Debt Maturity Profile Strong Liquidity With No Near Term Debt Maturities Revolver Availability Revolver
Outstanding Senior Notes Millions $1,220 $989 (1) Available Liquidity $230 (1) As of December 31, 2009 the revolver had $230 million of borrowings and $1.2 million
letters of credit outstanding. |
 28 PXP PXP Targets Over Next 5 Years • Double reserves of Company resulting in +20% average per year reserve growth from existing asset portfolio • Grow production 15% per year over the next
5 years • Efficiently manage business focusing on cost reduction and profitability • Maintain conservative balance sheet with active hedging program |
 29 PXP Addendum |
 30 PXP Continued Commodity Price Protection Financial Settlement Derivatives (1) An upfront payment of $3.86 per barrel was paid upon entering into these derivative
contracts. (2) PXP receives difference between floor of $6.12 less NYMEX up to a maximum of $1.48 per MMBtu. PXP pays if NYMEX >$8.00 ceiling. $0.034 per MMBtu $5.00 per Bbl AVERAGE DEFERRED PREMIUM INDEX AVERAGE PRICE DAILY VOLUME INSTRUMENT TYPE PERIOD Crude Oil Derivatives Natural Gas Derivatives Henry Hub $6.12 - $4.64 Floor by $8.00 Ceiling 85,000 MMBtu Three-way Collars (2) Jan – Dec 2010 WTI $55.00 Strike Price 40,000 Bbls Put Options (1) Jan – Dec 2010 |
 31 PXP 87.3 - Legal Recovery (2.1) (0.6) Other Operating Expense $ 1.09 $ 0.34 Earnings Per Share - diluted $ 136.3 (2) $ 48.1 Net Income (1) $ 217.2 $ 88.4 Income Before Income Taxes $ 282.1 $ 101.0 Income From Operations (421.6) (130.2) DD&A & Accretion Expense (144.6) (33.5) General & Administrative Expenses (424.0) (102.4) Production Costs $ 1,187.1 $ 367.7 Revenues 12 mo. ended 12/31/09 3 mo. ended 12/31/09 (Millions) Income Statement Summary (1) Includes an after-tax loss on mark-to-market derivative contracts of
approximately $12.6 million for the three months ended December 31, 2009 and
$4.4 million for the year ended December 31, 2009. (2) Includes a beneficial
income tax effect of $23 million from a change in the balance of unrecognized tax benefits. |
 February 2010 4Q 2009 Presentation |