Attached files
| file | filename |
|---|---|
| 8-K - FORM 8-K - PEABODY ENERGY CORP | c56498e8vk.htm |
Exhibit 99.1

| Morgan Stanley Global Basic Materials Conference February 25, 2010 Mike Crews Chief Financial Officer Peabody Energy NYSE: BTU |

| Statement on Forward-Looking Information Some of the following information contains forward-looking statements within the meaning of Section 27A of the Securities Act of 1933 and Section 21E of the Securities Exchange Act of 1934, as amended, and is intended to come within the safe-harbor protection provided by those sections. Our forward-looking statements are based on numerous assumptions that the company believes are reasonable, but they are open to a wide range of uncertainties and business risks that may cause actual results to differ materially from expectations as of Jan. 26, 2010. These factors are difficult to accurately predict and may be beyond the company's control. The company does not undertake to update its forward-looking statements. Factors that could affect the company's results include, but are not limited to: demand for coal in United States (U.S.) and international power generation and steel production markets; price volatility and demand, particularly in higher-margin products and in our trading and brokerage businesses; reductions and/or deferrals of purchases by major customers and ability to renew sales contracts; credit and performance risks associated with customers, suppliers, trading, banks and other financial counterparties; geologic, equipment, permitting and operational risks related to mining; transportation availability, performance and costs; availability, timing of delivery and costs of key supplies, capital equipment or commodities such as diesel fuel, steel, explosives and tires; impact of weather on demand, production and transportation; successful implementation of business strategies, including our Btu Conversion and generation development initiatives; negotiation of labor contracts, employee relations and workforce availability; changes in postretirement benefit and pension obligations and funding requirements; replacement and development of coal reserves; access to capital and credit markets and availability and costs of credit, margin capacity, surety bonds, letters of credit, and insurance; effects of changes in interest rates and currency exchange rates (primarily the Australian dollar); effects of acquisitions or divestitures; economic strength and political stability of countries in which we have operations or serve customers; legislation, regulations and court decisions or other government actions, including new environmental requirements affecting the use of coal; litigation, including claims not yet asserted; and other risks detailed in the company's reports filed with the Securities and Exchange Commission (SEC). The use of "Peabody," "the company," and "our" relate to Peabody, its subsidiaries and majority-owned affiliates. EBITDA or Adjusted EBITDA is defined as income from continuing operations before deducting net interest expense, income taxes, asset retirement obligation expense, and depreciation, depletion and amortization. EBITDA, which is not calculated identically by all companies, is not a substitute for operating income, net income or cash flow as determined in accordance with United States generally accepted accounting principles. Management uses EBITDA as a key measure of operating performance and also believes it is a useful indicator of the company's ability to meet debt service and capital expenditure requirements. Adjusted Income from Continuing Operations and Adjusted EPS are defined as income from continuing operations and diluted earnings per share excluding the impact of the remeasurement of foreign income tax accounts. Management has included these measures because, in management's opinion, excluding such impact is a better indicator of the company's ongoing effective tax rate and diluted earnings per share, and is therefore more useful in comparing the company's results with prior and future periods. 01/26/10 |

| Peabody Energy: The Only Global Pure-Play Coal Investment Best access to fastest growing global markets with expanding Australia platform, trading activities and Asia growth projects Excellent U.S. contracting position and largest producer in fastest growing regions Unmatched reserve base and outstanding liquidity to create shareholder value |
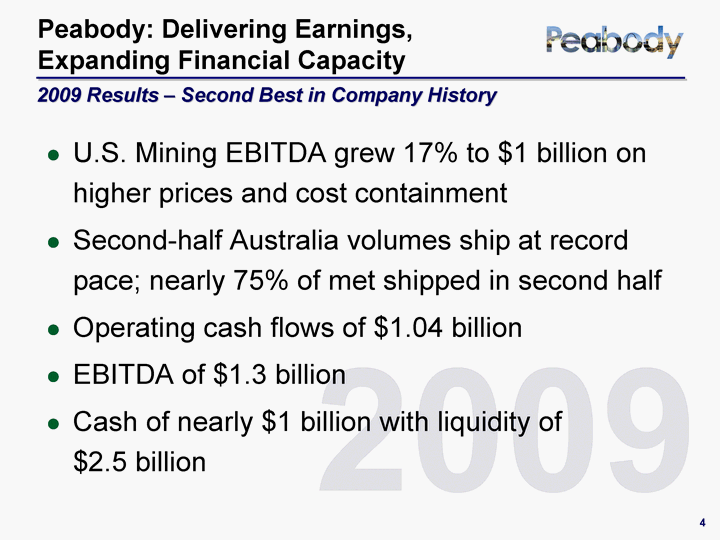
| 2009 Peabody: Delivering Earnings, Expanding Financial Capacity U.S. Mining EBITDA grew 17% to $1 billion on higher prices and cost containment Second-half Australia volumes ship at record pace; nearly 75% of met shipped in second half Operating cash flows of $1.04 billion EBITDA of $1.3 billion Cash of nearly $1 billion with liquidity of $2.5 billion 2009 Results - Second Best in Company History |

| Peabody Capitalizing on Outstanding Asia-Pacific Demand |

| Coal Demand Will Continue To Outpace Other Fuel Sources 2007 2030 Coal 3184 4887 Million Tonnes of Oil Equivalent Source: International Energy Agency World Energy Outlook 2009, Energy Information Administration Annual Energy Outlook and Peabody analysis. Global Coal Demand Global Coal Use Estimated to Grow 53% by 2030 Asia = 90% of Nearly 3 Billion Ton Global Coal Demand Growth |
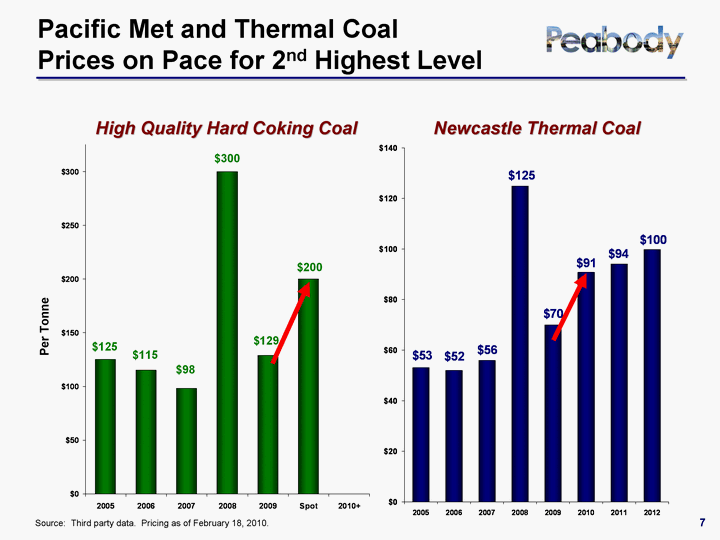
| 2005 2006 2007 2008 2009 Spot 2010+ 125 115 98 300 129 200 2005 2006 2007 2008 2009 2010 2011 2012 53 52 56 125 70 90.75 94.11 99.71 Newcastle Thermal Coal Source: Third party data. Pricing as of February 18, 2010. High Quality Hard Coking Coal Per Tonne Pacific Met and Thermal Coal Prices on Pace for 2nd Highest Level |

| 2003 2004 2005 2006 2007 2008 2009 Imports -83.124 -67.963 -45.548 -24.988 -2.087 -4.449 104.196 China Leading the Pacific Market Recovery 104 million tonne net importer 185+ MT shift in 6 years 2009 imports triple as exports cut in half; 2010 off to a strong start Structurally short of met coal Securing long-term thermal and met coal assets Australia the largest coal supplier to China 45 million tonnes in 2009, up from 4 million tonnes in 2008 $30 to $50 per ton rail/ship advantage over U.S. Structural Shortage and Strategic Intent Drive Shift to Net Imports Data and estimates based on industry reports and Peabody analysis. China Net Coal Imports |

| China: The Driving Force Behind Global Met Coal Demand Growth U.S. China India ROW East 14 612 64 306 ROW 306 U.S. 14 China 612 India 64 2009 U.S. China India ROW 44 54 6 354 ROW 354 China 54 India 6 1980 U.S. 44 2009 China Met Imports Soar... And China Met Demand Dwarfs U.S 2008 2009 Mongolia 3.6 4 Australia 1.4 22.7 Indonesia 0.8 1.3 Canada 0.6 3.3 Russia 0.2 1.9 U.S. 0 1 Other 0.4 0.3 China Met Coal Imports Met Coal Consumption 35 7 Australia Mongolia Indonesia Canada Russia U.S. & Other Tonnes in millions. Data and estimates based on third party data and Peabody analysis. |
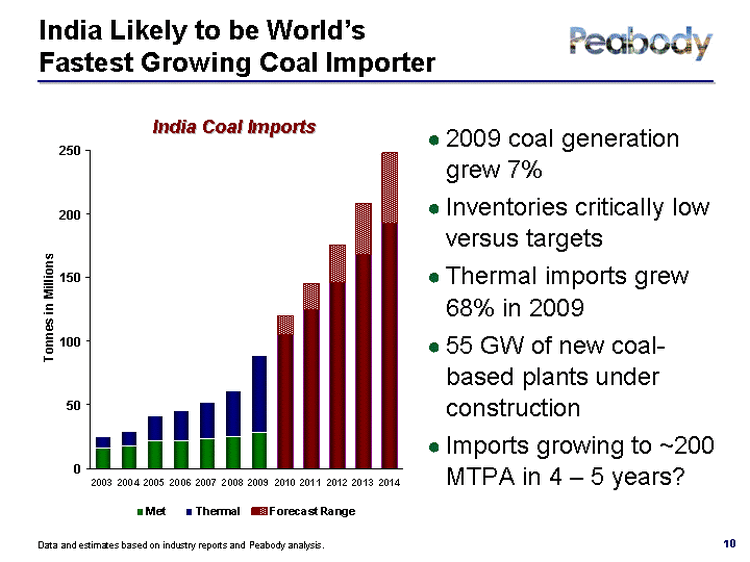
| 10 2003 2004 2005 2006 2007 2008 2009 2010 2011 2012 2013 2014 Met 16 18 22 22 23 25 28 Thermal 9 11 19 23 29 36 61 105 125 146 168 193 Forecast Range 15 20 30 40 55 India Likely to be World's Fastest Growing Coal Importer Data and estimates based on industry reports and Peabody analysis. 2009 coal generation grew 7% Inventories critically low versus targets Thermal imports grew 68% in 2009 55 GW of new coal- based plants under construction Imports growing to ~200 MTPA in 4 - 5 years? India Coal Imports |

| China India Other Asia USA Europe South America Other 35 17 8 7 2 2 1 Major New Global Coal-Fueled Generation Build-Out Under Way Data and estimates based on Platts Worldwide Power Plant Database and Peabody analysis. 80+% of New 2010 Coal Plants in China, India and Other Asia 2010 New Coal-Fueled Generation (GW) New Coal Plants for 2010 Tonnes in GW Millions China 35 132 India 17 80 Other Asia 8 34 USA 7 25 Europe 2 4 South America 2 8 Others 1 2 Total 72 285 China 35 India 17 Other Asia 8 USA 7 Europe 2 South America 2 Others 1 |

| Global Seaborne Demand: ~300 MTPA of Growth by 2014 Data and estimates based on Barlow Jonker and Peabody analysis. 100+ MTPA of new seaborne coal demand from generation under construction Pacific demand growth nearly 75% of total demand increases India to dominate growth in global coal imports India China Japan South Korea Taiwan Other Pacific Atlantic 125 45 25 20 10 30 45 Growth in Seaborne Imports 2009 - 2014 (Tonnes in Millions) |
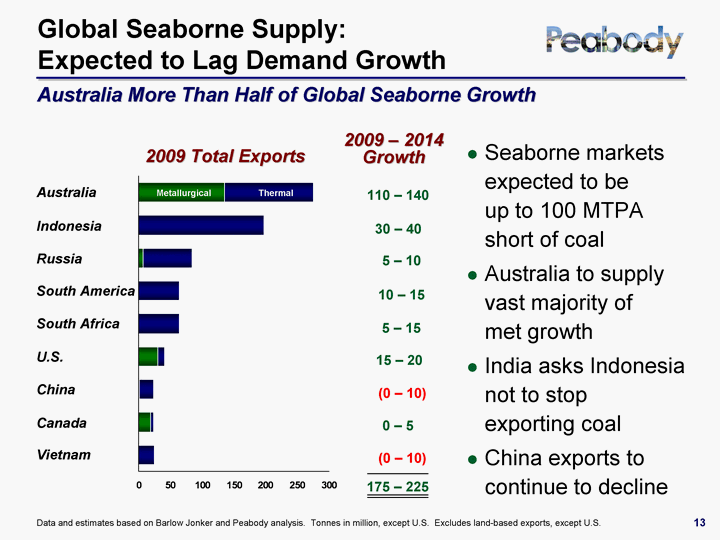
| Vietnam Canada China U.S. South Africa South America Russia Indonesia Australia Metallurgical 0 19 1 30 0 0 7 0 135 Thermal 25 4 22 11 64 64 77 197 140 2009 Total Exports Global Seaborne Supply: Expected to Lag Demand Growth Data and estimates based on Barlow Jonker and Peabody analysis. Tonnes in million, except U.S. Excludes land-based exports, except U.S. Metallurgical Thermal U.S. South Africa South America Russia Australia Indonesia Canada China Vietnam Seaborne markets expected to be up to 100 MTPA short of coal Australia to supply vast majority of met growth India asks Indonesia not to stop exporting coal China exports to continue to decline Australia More Than Half of Global Seaborne Growth 110 - 140 2009 - 2014 Growth 30 - 40 5 - 10 10 - 15 5 - 15 15 - 20 (0 - 10) 0 - 5 (0 - 10) 175 - 225 |

| 14 Location and Cost Advantage Over Other Seaborne Supply Peabody Competitively Positioned to Serve Growth Markets of Asia Optimal location to serve Asian demand Premium met and thermal coal products Lower cost seaborne supply Significant organic growth potential Expanding export capability with rail/port access Burton North Goonyella Eaglefield Millennium Metropolitan Dalrymple Bay Abbot Point Port Kembla Queensland New South Wales Conarco Exploration Area Wilkie Creek Brisbane Wilpinjong North Wambo Wambo NCIG Newcastle Met Coal Mine Thermal Coal Mine Port Gladstone |

| Peabody's 2010 Australian Thermal Exports, Met Coal Expanding 20 - 30% * Domestic thermal volumes priced under long-term contracts. Unpriced volumes as of Jan. 26, 2010. Actual results may differ from forecast. Statement on forward-looking information detailed on slide 2. HQHCC HCC SHCC PCI/Other 3.6 2.5 1.8 1.9 High Quality Hard 30 - 35% Hard 20 - 25% Semi-Hard 15 - 25% PCI 15 - 25% Expected 2010 Met Coal Mix BTU Australian Sales Profile |

| 2009 2010 5-Yr Forward Domestic Thermal 5.8 6.25 8 Seaborne Thermal 9.6 12.25 16 Seaborne Met 6.9 8.5 13.5 1.5 2.5 2.5 6.0 - 6.5 12.5 - 13.0 7.5 - 8.5 8.0 - 8.5 15.0 - 17.0 12.0 - 15.0 26.0 - 28.0 35.0 - 40.0+ Peabody's Australian Exports: Potential to Nearly Double in Five Years Met: Up to 117% Seaborne Thermal: Up to 77% 5-Year Growth Tons in Millions Matching Port Capacity Through NCIG and Dalrymple Bay Increases Actual results may differ from forecast. Statement on forward-looking information detailed on slide 2. Domestic Thermal 6.9 9.6 5.8 22.3 |

| Australia 5-Year Project Pipeline Peabody's Australian Growth Projects Target Exports Export Met S/UG MTPA Quality Denham Development S 3 - 6 HQHCC Burton Extension S 2 - 3 HCC Metropolitan Expansion UG 1 HCC Millennium Expansion S 2 - 3 Semi-Hard / PCI 8 - 13 Export Thermal Wambo Expansion S/UG 3 - 4 High Quality, Low Ash Wilpinjong Expansion S 2 - 3 Low Cost Complex 5 - 7 Short tons in millions. 'S' for surface, 'UG' for underground. |

| 2003 2004 2005 2006 2007 2008 2009 Domestic EBITDA 45.828 34.781 38.745 81.604 87.781 123.683 96.7 International EBITDA 0 6.258 4.313 11 28.819 95.217 96.7 St. Louis Newcastle London Beijing Singapore Jakarta Strong Trading & Brokerage Results from "Virtual Coal Mine" Trading & Brokerage EBITDA U.S. Non-U.S. Peabody Trading & Brokerage Offices $193 In Millions Growing, profitable global trading and brokerage operations Continued expansion; opening of Singapore Southeast Asia trading hub in 2009 Arbitrage opportunities; financial or physical settlements with asset base; pipeline of market intelligence |

| Peabody Well-Positioned in Fastest Growing U.S. Markets |

| PRB, Midwest Volumes Likely to Grow While Eastern Production Contracts PRB advantage Low end of cost curve Primary source for new plants Asian export potential Illinois Basin advantage Lower cost than NAPP and CAPP Major source for new plants Central Appalachia declines Significant production with costs above current prices PRB ILB NAPP Other CAPP 2009 57 25 12 3 -36 U.S. Production Change 2009 - 2014 50-60 20-30 10-15 0-5 (30-40) Estimates based on industry reports and Peabody analysis. Tons in Millions |

| Peabody Well Positioned in the U.S. Largest producer and reserve holder in the PRB and ILB PRB and ILB expected to serve more than 80% of U.S. demand growth through 2014 Fully committed/priced in U.S. for 2010 185 - 195 million tons of expected production Patient in 2011 contracting Major leverage to 2012> Short tons in millions. Sales based on 2009 data, reserves based on 2008 filed data. Peabody Energy Operations Dominion Terminal Associates Market Position Sales Reserves Wyoming PRB #1 137 3,199 Midwest #1 32 3,652 Colorado #1 8 203 Southwest #2 15 1,011 Australia #5 22 1,118 |

| U.S. Coal Demand Set to Recover 60 - 80 Million Tons in 2010 Data and estimates based on industry analysis and Peabody estimates. 2009 Coal Demand Electricity Generation Gas Back to Coal U.S. Exports 2010 Coal Demand 1062 1062 1062 1062 1062 35 35 35 35 35 20 20 20 20 20 5 5 5 5 5 2009 vs. 2010 Expected Demand Weather spurs record inventory draws; 30 million tons in less than 2 months Expected 60 - 80 MT demand growth in 2010 20 - 25 MT of additional production cuts likely Follows 105 MT in 2009 production cuts Winter-Driven Inventory Draw Accelerates Recovery |

| Prompt Month 2010 2011 2012 10.59 11.4 12.98 14.04 During Early Recovery, PRB Prices Rise Fastest Data and estimates based on third party data and Peabody analysis. Pricing as of February 18, 2010. PRB 8800 Price Per Ton $10 $14 Prompt PRB prices have risen 60% since Oct. 1, 2009, while CAPP prices have been flat/down The traditional lag of PRB prices to CAPP increases has not occurred Likely causes: ~25% higher Eastern stockpiles versus PRB stockpiles Greater competitiveness of natural gas to higher-cost Eastern coal Difficulty in CAPP producers to respond given permitting and cost issues |

| BTU: Targeting Continued Growth in Shareholder Value Unmatched size and global diversity Excellent access to high-growth markets Outstanding U.S. and Australia platform Global trading & brokerage activities Substantial liquidity to fuel growth Bargain P/E ratio given growth potential |

| For Further Information: Vic Svec Senior Vice President Investor Relations and Corporate Communications 1.314.342.7768 Christina Morrow Vice President Investor Relations 1.314.342.7651 |