Attached files
| file | filename |
|---|---|
| 8-K - NEWMONT Corp /DE/ | v175514_8k.htm |
| EX-99.1 - NEWMONT Corp /DE/ | v175514_ex99-1.htm |
|
Newmont
Mining Corporation
6363
South Fiddlers Green Circle, Suite 800
Greenwood
Village, CO 80111
T 303.863.7414
F 303.837.5837
www.newmont.com
|
||
 |
||
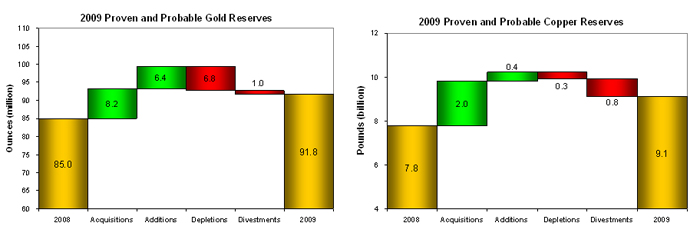
Newmont Reports 8%
Increase in Equity Gold Reserves to 91.8 Million Ounces; Details 2010
Exploration Funding and Opportunities
DENVER, February
25, 2010 – Newmont Mining Corporation (NYSE: NEM) (“Newmont” or “the Company”)
today reported 2009 equity gold reserves of 91.8 million ounces, an 8% increase
over 2008, and equity copper reserves of 9.1 billion pounds, a 17% increase over
2008.
Equity gold
measured and indicated resources (NRM) for 2009 were 1.1 billion tons at an
average grade of 0.020 ounces per ton, up from 0.8 billion tons at a grade of
0.026 ounces per ton for 2008. Equity copper NRM for 2009 were 796 million tons
at an average grade of 0.17%, up from 431 million tons at a grade of 0.13% from
2008.
|
(1)
|
For
detailed information on the Company’s year-end equity proven and probable
reserves and NRM, please refer to the Supplemental Information in this
release.
|
Reserve additions
came from all regions, with notable additions from Gold Quarry in Nevada,
Boddington in Australia, underground operations across Australia and New Zealand
and at Ahafo in Ghana.
“A
combination of strong 2009 exploration results and the Boddington acquisition
resulted in equity gold reserves at our highest level since 2006 and equity gold
NRM at the highest level since 2003.” said Guy Lansdown, Executive Vice
President of Discovery and Development. “These increases, combined
with our generative exploration opportunities, will support future
sustainability in each of our operating regions.”
Exploration,
Advanced Projects, Research & Development
The recent success
of the Company’s exploration program, combined with a demonstrated ability to
advance exploration programs through development and into production, has
established a platform for future growth. To provide increasing value
for shareholders, Newmont plans to continue aggressively advancing its most
prospective near mine and generative exploration development opportunities into
production.
The 2010
exploration budget is between $190 and $220 million, an increase of
approximately 10% from 2009. In addition, funding for Advanced
Project development has increased to between $185 and $210 million, a 40%
increase from 2009. These exploration and advanced project
development programs are designed to generate and develop the projects that will
help drive production in the decades to come.
Approximately 75%
of the exploration budget is focused on programs within Newmont’s existing
operating districts and major land packages, including the prospective gold
belts at Hope Bay in Canada and in Suriname. These exploration
programs are designed to support production, replace reserves, optimize existing
assets, explore and advance copper opportunities and to develop new brown field
projects that leverage existing facilities and infrastructure.
The additional
Advanced Project development programs are coordinated with our exploration
efforts, with exploration delivering new resources that are effectively advanced
through the development pipeline in each of the operating
regions. The Company’s more notable exploration and advanced project
development opportunities include Hope Bay in Canada, the Greater Leeville-Turf
project in Nevada, the Subika underground project in Ghana, expansion drilling
at Boddington in Australia, and multiple programs targeting underground resource
expansions across Australia and New Zealand and sulfide exploration and
development programs in Peru.
Hope
Bay, Canada
At
Hope Bay in Canada, positive 2009 drilling and regional exploration results have
reinforced the positive view of exploration potential across the 80 kilometer
greenstone belt. The Company is advancing development with an underground
focus, to be initiated with a decline at the Doris North deposit. The
Company has deployed an experienced project development team and key contractors
are in place to aggressively advance this underground
opportunity. With near-term development plans and district
exploration for years to come, Hope Bay remains a significant asset within the
Company’s portfolio. The Company expects to spend approximately $60 to $70
million on advanced project development and near mine exploration in 2010 at
Hope Bay, excluding capital.
Greater
Leeville-Turf, Nevada
In
Nevada, the Company has a portfolio of multiple open pit and underground
projects. One of these opportunities is the Greater Leeville-Turf
program, where the Company has a surface exploration program extending well
beyond known mineralization. Early results from both surface and
underground exploration programs suggest significant potential for resource
expansion, with recent surface gold intercepts including CGX-24 with 32 feet at
0.7 ounces per ton and CGX-12 with 151 feet at 0.6 ounces per ton, all
accessible by extensions of current underground infrastructure. The Company
expects to spend approximately $75 to $85 million on advanced project
development and near mine exploration in 2010 in Nevada, excluding
capital.
| Page 2 of 7 |
Subika
Expansion, Ghana
The Subika
Expansion project at our Ahafo operation in Ghana is focused on developing
reserves by expanding the existing open pit and through underground
development. The Company is concurrently advancing exploration and
development with surface drilling to define the exploration potential and
underground drifting and future drilling for resource and project
development. An exploration decline was successfully initiated in
February 2010 and underground development is advancing rapidly. The Company
expects to spend approximately $10 to $15 million on advanced project
development and near mine exploration in 2010 in Ghana, excluding
capital.
Australia
/ New Zealand
As
Boddington ramps-up to full production, the Company continues to step out with
exploration to the north and east, where preliminary results suggest significant
opportunity for higher grade, shallow resource additions. Across
Australia and in New Zealand, the Company is expanding underground resources
with surface and underground exploration and development
programs. One such opportunity is the Gateway project at Jundee,
where drilling continues to identify a new vein system to the south of current
resources with potential exploration drifting scheduled for late 2010 to early
2011. The Company expects to spend approximately $20 to $30 million on advanced
project development and near mine exploration in 2010 in Australia/New Zealand,
excluding capital.
Yanacocha
District, Peru
In
South America, the Company’s exploration focus is on unlocking the sulfide
opportunities within the Yanacocha district and around the Conga
project. Advanced exploration and development of the large
gold-copper sulfide resources underlying current Yanacocha oxide pits is
ongoing. As a result, research and development of metallurgical
process options for potentially minable resources is advancing. In
addition, the Chaquicocha Sur sulfide project has advanced into Stage 2, with a
program focused on an underground mining option to develop this high grade
resource. In addition, while basic engineering and permitting
advances on the Conga project, multiple gold-copper porphyry targets across the
prospective land package are being explored to maximize the value of this world
class project. The Company expects to spend approximately $25 to $30 million on
advanced project development and near mine exploration in 2010 in
Peru.
| Page 3 of 7 |
Supplemental
Information:
|
Equity Proven,
Probable, and Combined Gold Reserves(1)
|
||||||||||||||||||||||||||||||||||||||||||||||||||||||||
|
December
31, 2009
|
December
31, 2008
|
|||||||||||||||||||||||||||||||||||||||||||||||||||||||
|
Deposits/Districts
by Reporting Unit
|
Proven
Reserves
|
Probable
Reserves
|
Proven
and Probable Reserves
|
Metallurgical
Recovery
|
Proven
+ Probable Reserves
|
|||||||||||||||||||||||||||||||||||||||||||||||||||
|
Newmont
|
Tonnage
|
Grade
|
Gold
|
Tonnage
|
Grade
|
Gold
|
Tonnage
|
Grade
|
Gold
|
Tonnage
|
Grade
|
Gold
|
||||||||||||||||||||||||||||||||||||||||||||
|
Share
|
(000
tons)
|
(oz/ton)
|
(000
ozs)
|
(000
tons)
|
(oz/ton)
|
(000
ozs)
|
(000
tons)
|
(oz/ton)
|
(000
ozs)
|
(000
tons)
|
(oz/ton)
|
(000
ozs)
|
||||||||||||||||||||||||||||||||||||||||||||
|
NORTH
AMERICA
|
||||||||||||||||||||||||||||||||||||||||||||||||||||||||
|
Carlin Open Pits, Nevada(2)
|
100 | % | 24,400 | 0.067 | 1,640 | 234,900 | 0.042 | 9,760 | 259,300 | 0.044 | 11,400 | 74 | % | 202,400 | 0.045 | 9,050 | ||||||||||||||||||||||||||||||||||||||||
|
Carlin
Underground, Nevada
|
100 | % | 4,600 | 0.307 | 1,400 | 5,100 | 0.315 | 1,590 | 9,700 | 0.311 | 2,990 | 88 | % | 11,700 | 0.313 | 3,650 | ||||||||||||||||||||||||||||||||||||||||
|
Midas, Nevada(3)
|
100 | % | 400 | 0.480 | 200 | 300 | 0.347 | 100 | 700 | 0.425 | 300 | 95 | % | 900 | 0.436 | 390 | ||||||||||||||||||||||||||||||||||||||||
|
Phoenix,
Nevada
|
100 | % | 0 | 0 | 285,000 | 0.020 | 5,670 | 285,000 | 0.020 | 5,670 | 73 | % | 299,800 | 0.021 | 6,310 | |||||||||||||||||||||||||||||||||||||||||
|
Twin
Creeks, Nevada
|
100 | % | 9,300 | 0.097 | 900 | 40,900 | 0.072 | 2,950 | 50,200 | 0.077 | 3,850 | 80 | % | 51,700 | 0.077 | 3,960 | ||||||||||||||||||||||||||||||||||||||||
|
Turquoise Ridge, Nevada(4)
|
25 | % | 1,100 | 0.480 | 550 | 1,500 | 0.527 | 810 | 2,600 | 0.507 | 1,360 | 92 | % | 2,600 | 0.500 | 1,330 | ||||||||||||||||||||||||||||||||||||||||
|
Nevada In-Process(5)
|
100 | % | 33,800 | 0.021 | 730 | 0 | 0 | 33,800 | 0.021 | 730 | 65 | % | 36,000 | 0.026 | 940 | |||||||||||||||||||||||||||||||||||||||||
|
Nevada Stockpiles(6)
|
100 | % | 27,000 | 0.079 | 2,140 | 2,500 | 0.028 | 70 | 29,500 | 0.075 | 2,210 | 79 | % | 34,200 | 0.072 | 2,460 | ||||||||||||||||||||||||||||||||||||||||
|
Total
Nevada
|
100,600 | 0.075 | 7,560 | 570,200 | 0.037 | 20,950 | 670,800 | 0.042 | 28,510 | 77 | % | 639,300 | 0.044 | 28,090 | ||||||||||||||||||||||||||||||||||||||||||
|
La
Herradura, Mexico
|
44 | % | 46,100 | 0.019 | 900 | 47,100 | 0.019 | 880 | 93,200 | 0.019 | 1,780 | 66 | % | 76,100 | 0.025 | 1,890 | ||||||||||||||||||||||||||||||||||||||||
|
TOTAL
NORTH AMERICA
|
146,700 | 0.058 | 8,460 | 617,300 | 0.035 | 21,830 | 764,000 | 0.040 | 30,290 | 77 | % | 715,400 | 0.044 | 29,980 | ||||||||||||||||||||||||||||||||||||||||||
|
SOUTH
AMERICA
|
||||||||||||||||||||||||||||||||||||||||||||||||||||||||
|
Conga, Peru(7)
|
51.35 | % | 0 | 0 | 317,200 | 0.019 | 6,080 | 317,200 | 0.019 | 6,080 | 79 | % | 317,200 | 0.019 | 6,080 | |||||||||||||||||||||||||||||||||||||||||
|
Yanacocha Open Pits(8)
|
51.35 | % | 7,800 | 0.035 | 270 | 123,700 | 0.036 | 4,480 | 131,500 | 0.036 | 4,750 | 69 | % | 207,500 | 0.030 | 6,150 | ||||||||||||||||||||||||||||||||||||||||
|
Yanacocha In-Process(5)
|
51.35 | % | 26,400 | 0.025 | 660 | 0 | 0 | 26,400 | 0.025 | 660 | 74 | % | 20,800 | 0.026 | 530 | |||||||||||||||||||||||||||||||||||||||||
|
Total
Yanacocha, Peru
|
34,200 | 0.027 | 930 | 123,700 | 0.036 | 4,480 | 157,900 | 0.034 | 5,410 | 69 | % | 228,300 | 0.029 | 6,680 | ||||||||||||||||||||||||||||||||||||||||||
|
Kori Kollo, Bolivia(9)
|
88 | % | 0 | 0 | 0 | 0 | 0 | 0 | 11,500 | 0.017 | 190 | |||||||||||||||||||||||||||||||||||||||||||||
|
La Zanja, Peru(10)
|
46.94 | % | 0 | 0 | 18,800 | 0.018 | 340 | 18,800 | 0.018 | 340 | 67 | % | 0 | 0 | ||||||||||||||||||||||||||||||||||||||||||
|
TOTAL
SOUTH AMERICA
|
34,200 | 0.027 | 930 | 459,700 | 0.024 | 10,900 | 493,900 | 0.024 | 11,830 | 74 | % | 557,000 | 0.023 | 12,950 | ||||||||||||||||||||||||||||||||||||||||||
|
ASIA
PACIFIC
|
||||||||||||||||||||||||||||||||||||||||||||||||||||||||
|
Batu Hijau Open Pit(11)
|
52.44 | % | 201,100 | 0.015 | 2,970 | 167,700 | 0.005 | 810 | 368,800 | 0.010 | 3,780 | 76 | % | 348,800 | 0.011 | 3,680 | ||||||||||||||||||||||||||||||||||||||||
|
Batu Hijau Stockpiles(6)(11)
|
52.44 | % | 0 | 0 | 193,800 | 0.004 | 720 | 193,800 | 0.004 | 720 | 70 | % | 131,400 | 0.003 | 410 | |||||||||||||||||||||||||||||||||||||||||
|
Total
Batu Hijau, Indonesia
|
52.44 | % | 201,100 | 0.015 | 2,970 | 361,500 | 0.004 | 1,530 | 562,600 | 0.008 | 4,500 | 75 | % | 480,200 | 0.009 | 4,090 | ||||||||||||||||||||||||||||||||||||||||
|
Boddington, Western Australia(12)
|
100.00 | % | 184,600 | 0.025 | 4,640 | 781,800 | 0.021 | 16,320 | 966,400 | 0.022 | 20,960 | 82 | % | 583,200 | 0.023 | 13,370 | ||||||||||||||||||||||||||||||||||||||||
|
Jundee,
Western Australia
|
100 | % | 4,100 | 0.065 | 260 | 3,300 | 0.273 | 910 | 7,400 | 0.159 | 1,170 | 90 | % | 6,300 | 0.202 | 1,270 | ||||||||||||||||||||||||||||||||||||||||
|
Kalgoorlie
Open Pit and Underground
|
50 | % | 21,200 | 0.061 | 1,280 | 39,600 | 0.062 | 2,470 | 60,800 | 0.062 | 3,750 | 85 | % | 63,700 | 0.062 | 3,970 | ||||||||||||||||||||||||||||||||||||||||
|
Kalgoorlie
Stockpiles(6)
|
50 | % | 14,300 | 0.031 | 440 | 0 | 0 | 14,300 | 0.031 | 440 | 78 | % | 14,400 | 0.031 | 450 | |||||||||||||||||||||||||||||||||||||||||
|
Total
Kalgoorlie, Western Australia
|
50 | % | 35,500 | 0.049 | 1,720 | 39,600 | 0.062 | 2,470 | 75,100 | 0.056 | 4,190 | 84 | % | 78,100 | 0.056 | 4,420 | ||||||||||||||||||||||||||||||||||||||||
|
Tanami,
Northern Territories
|
100 | % | 5,200 | 0.160 | 830 | 7,900 | 0.102 | 810 | 13,100 | 0.125 | 1,640 | 96 | % | 11,500 | 0.129 | 1,480 | ||||||||||||||||||||||||||||||||||||||||
|
Waihi,
New Zealand
|
100 | % | 0 | 0 | 4,000 | 0.101 | 410 | 4,000 | 0.101 | 410 | 90 | % | 2,900 | 0.124 | 360 | |||||||||||||||||||||||||||||||||||||||||
|
TOTAL
ASIA PACIFIC
|
430,500 | 0.024 | 10,420 | 1,198,100 | 0.019 | 22,450 | 1,628,600 | 0.020 | 32,870 | 82 | % | 1,162,200 | 0.022 | 24,990 | ||||||||||||||||||||||||||||||||||||||||||
|
AFRICA
|
||||||||||||||||||||||||||||||||||||||||||||||||||||||||
|
Ahafo Open Pits(13)
|
100 | % | 0 | 0 | 128,700 | 0.068 | 8,810 | 128,700 | 0.068 | 8,810 | 87 | % | ||||||||||||||||||||||||||||||||||||||||||||
|
Ahafo Stockpiles(6)
|
100 | % | 9,300 | 0.034 | 320 | 0 | 0 | 9,300 | 0.034 | 320 | 87 | % | ||||||||||||||||||||||||||||||||||||||||||||
|
Total
Ahafo, Ghana
|
100 | % | 9,300 | 0.034 | 320 | 128,700 | 0.068 | 8,810 | 138,000 | 0.066 | 9,130 | 87 | % | 125,100 | 0.075 | 9,380 | ||||||||||||||||||||||||||||||||||||||||
|
Akyem, Ghana(14)
|
100 | % | 0 | 0 | 147,200 | 0.052 | 7,660 | 147,200 | 0.052 | 7,660 | 89 | % | 147,200 | 0.052 | 7,660 | |||||||||||||||||||||||||||||||||||||||||
|
TOTAL
AFRICA
|
9,300 | 0.034 | 320 | 275,900 | 0.060 | 16,470 | 285,200 | 0.059 | 16,790 | 88 | % | 272,300 | 0.063 | 17,040 | ||||||||||||||||||||||||||||||||||||||||||
|
TOTAL
NEWMONT WORLDWIDE
|
620,700 | 0.032 | 20,130 | 2,551,000 | 0.028 | 71,650 | 3,171,700 | 0.029 | 91,780 | 80 | % | 2,706,900 | 0.031 | 84,960 | ||||||||||||||||||||||||||||||||||||||||||
|
(1)
|
Reserves
are calculated at a gold price of US$800, A$1000, or NZ$1,200 per ounce
unless otherwise noted. 2008 reserves were calculated at a gold price
of US$725, A$850, or NZ$1,000 per ounce unless
otherwise noted. Tonnage amounts have been rounded to the
nearest 100,000 unless they are less than 50,000, and gold ounces have
been rounded to the nearest 10,000.
|
|
(2)
|
Includes
undeveloped reserves at the Emigrant deposits for combined total
undeveloped reserves of 1.2 million ounces.
|
|
(3)
|
Also
contains reserves of 4.6 million ounces of silver with a metallurgical
recovery of 88%.
|
|
(4)
|
Reserve
estimates provided by Barrick, the operator of the Turquoise Ridge Joint
Venture.
|
|
(5)
|
In-process
material is the material on leach pads at the end of each year from which
gold remains to be recovered. In-process material reserves are
reported separately where tonnage or contained ounces are greater than 5%
of the total site-reported reserves and contained ounces are greater than
100,000.
|
|
(6)
|
Stockpiles
are comprised primarily of material that has been set aside to allow
processing of higher grade material in the mills. Stockpiles
increase or decrease depending on current mine plans. Stockpile
reserves are reported separately where tonnage or contained ounces are
greater than 5% of the total site-reported reserves and contained ounces
are greater than 100,000.
|
|
(7)
|
Deposit
is currently undeveloped.
|
|
(8)
|
Reserves
include the currently undeveloped deposit at Tapado Oeste (formerly called
Corimayo), which contains undeveloped reserves of 1.2 million equity
ounces.
|
|
(9)
|
Newmont
divested its interest in Kori Kollo in July 2009.
|
|
(10)
|
Reserves
estimates were provided by Buenaventura, the operator of the La Zanja
project.
|
|
(11)
|
Percentage
reflects Newmont's economic interest at December 31, 2009. In
November and December 2009 our economic interest increased from 45% to
52.44% as a result of transactions with a noncontrolling partner,
partially offset by divestiture required under the Contract of
Work.
|
|
(12)
|
Newmont
acquired the remaining 33.33% of Boddington from AngloGold in June
2009.
|
|
(13)
|
Includes
undeveloped reserves at Amoma, Yamfo South, Yamfo Central, Techire West,
Subenso South, Subenso North, Yamfo Northeast, and Susuan totaling 3.7
million ounces.
|
|
(14)
|
Deposit
is undeveloped.
|
| Page 4 of 7 |
|
Equity Gold
Mineralized Material Not in Reserves(1)(2)
|
||||||||||||||||||||||||||||||||||||
|
December
31, 2009
|
||||||||||||||||||||||||||||||||||||
|
Deposits/Districts
|
Measured
Material
|
Indicated
Material
|
Measured
+ Indicated Material
|
Inferred
Material
|
||||||||||||||||||||||||||||||||
|
Newmont
|
Tonnage
|
Grade
|
Tonnage
|
Grade
|
Tonnage
|
Grade
|
Tonnage
|
Grade
|
||||||||||||||||||||||||||||
|
Share
|
(000
tons)
|
(oz/ton)
|
(000
tons)
|
(oz/ton)
|
(000
tons)
|
(oz/ton)
|
(000
tons)
|
(oz/ton)
|
||||||||||||||||||||||||||||
|
NORTH
AMERICA
|
||||||||||||||||||||||||||||||||||||
|
Carlin
Trend Open Pit, Nevada
|
100 | % | 2,600 | 0.027 | 26,200 | 0.020 | 28,800 | 0.021 | 10,400 | 0.034 | ||||||||||||||||||||||||||
|
Carlin
Trend Underground, Nevada
|
100 | % | 700 | 0.189 | 110 | 0.153 | 810 | 0.18 | 7,400 | 0.289 | ||||||||||||||||||||||||||
|
Lone
Tree Complex, Nevada
|
100 | % | 0 | 4,200 | 0.022 | 4,200 | 0.022 | 0 | ||||||||||||||||||||||||||||
|
Midas,
Nevada
|
100 | % | 0 | 0.205 | 100 | 0.188 | 100 | 0.193 | 100 | 0.248 | ||||||||||||||||||||||||||
|
Phoenix,
Nevada
|
100 | % | 0 | 0.000 | 158,400 | 0.013 | 158,400 | 0.013 | 35,400 | 0.015 | ||||||||||||||||||||||||||
|
Twin
Creeks, Nevada
|
100 | % | 3,400 | 0.097 | 31,600 | 0.045 | 35,000 | 0.050 | 11,300 | 0.018 | ||||||||||||||||||||||||||
|
Turquoise
Ridge (3),
Nevada
|
25 | % | 300 | 0.412 | 300 | 0.452 | 600 | 0.431 | 1,300 | 0.456 | ||||||||||||||||||||||||||
|
Nevada
Stockpiles
(4), Nevada
|
100 | % | 10,700 | 0.060 | 10,700 | 0.060 | 2,300 | 0.043 | ||||||||||||||||||||||||||||
|
Total
Nevada
|
17,700 | 0.074 | 220,910 | 0.020 | 238,610 | 0.024 | 68,200 | 0.058 | ||||||||||||||||||||||||||||
|
La
Herradura, Mexico
|
44 | % | 6,500 | 0.017 | 7,800 | 0.016 | 14,300 | 0.016 | 20,500 | 0.019 | ||||||||||||||||||||||||||
|
TOTAL
NORTH AMERICA
|
24,200 | 0.058 | 228,710 | 0.019 | 252,910 | 0.023 | 88,700 | 0.049 | ||||||||||||||||||||||||||||
|
SOUTH
AMERICA
|
||||||||||||||||||||||||||||||||||||
|
Conga,
Peru
|
51.35 | % | 0 | 58,000 | 0.013 | 58,000 | 0.013 | 79,000 | 0.011 | |||||||||||||||||||||||||||
|
Yanacocha,
Peru
|
51.35 | % | 1,300 | 0.017 | 157,800 | 0.020 | 159,100 | 0.020 | 25,800 | 0.019 | ||||||||||||||||||||||||||
|
La
Zanja(5),
Peru
|
46.94 | % | 0 | 0 | 0.000 | 0 | 0.000 | 4,000 | 0.016 | |||||||||||||||||||||||||||
|
TOTAL
SOUTH AMERICA
|
1,300 | 0.017 | 215,800 | 0.018 | 217,100 | 0.018 | 108,800 | 0.013 | ||||||||||||||||||||||||||||
|
ASIA
PACIFIC
|
||||||||||||||||||||||||||||||||||||
|
Batu
Hijau (6),
Indonesia
|
52.44 | % | 25,400 | 0.017 | 148,400 | 0.007 | 173,800 | 0.008 | 81,300 | 0.002 | ||||||||||||||||||||||||||
|
Boddington, Western Australia(7)
|
100 | % | 20,600 | 0.010 | 344,200 | 0.015 | 364,800 | 0.014 | 292,900 | 0.016 | ||||||||||||||||||||||||||
|
Jundee,
Western Australia
|
100 | % | 0 | 200 | 0.045 | 200 | 0.045 | 3,800 | 0.068 | |||||||||||||||||||||||||||
|
Kalgoorlie,
Western Australia
|
50 | % | 2,300 | 0.059 | 4,100 | 0.054 | 6,400 | 0.056 | 1,600 | 0.136 | ||||||||||||||||||||||||||
|
Tanami,
Northern Territory
|
100 | % | 300 | 0.099 | 1,100 | 0.082 | 1,400 | 0.086 | 8,100 | 0.152 | ||||||||||||||||||||||||||
|
Waihi,
New Zealand
|
100 | % | 0 | 1,200 | 0.206 | 1,200 | 0.206 | 300 | 0.146 | |||||||||||||||||||||||||||
|
TOTAL
ASIA PACIFIC
|
48,600 | 0.016 | 499,200 | 0.013 | 547,800 | 0.013 | 388,000 | 0.017 | ||||||||||||||||||||||||||||
|
AFRICA
|
||||||||||||||||||||||||||||||||||||
|
Ahafo,
Ghana
|
100 | % | 0 | 97,800 | 0.050 | 97,800 | 0.050 | 26,200 | 0.104 | |||||||||||||||||||||||||||
|
Akyem,
Ghana
|
100 | % | 0 | 11,600 | 0.048 | 11,600 | 0.048 | 4,600 | 0.047 | |||||||||||||||||||||||||||
|
TOTAL
AFRICA
|
0 | 109,400 | 0.050 | 109,400 | 0.050 | 30,800 | 0.095 | |||||||||||||||||||||||||||||
|
TOTAL
NEWMONT WORLDWIDE
|
74,100 | 0.030 | 1,053,110 | 0.019 | 1,127,210 | 0.020 | 616,300 | 0.025 | ||||||||||||||||||||||||||||
|
(1)
|
Mineralized
material is reported exclusive of reserves.
|
|
(2)
|
Mineralized
Material calculated at a gold price of US$950, A$1,200, or NZ$1,400 per
ounce unless otherwise noted. 2008 Mineralized material was
calculated at a gold price of US$850, A$1,000, or NZ$1,175 per ounce.
Tonnage amounts have been rounded to the nearest
100,000.
|
|
(3)
|
Mineralized
material estimates were provided by Barrick, the operator of the Turquoise
Ridge Joint Venture.
|
|
(4)
|
Stockpiles
are comprised primarily of material that has been set aside to allow
processing of higher grade material in the mills. Stockpiles
increase or decrease depending on current mine plans.
|
|
(5)
|
Mineralized
material estimates were provided by Buenaventura, the operator of the La
Zanja Project.
|
|
(6)
|
Percentage
reflects Newmont's economic interest at December 31, 2009. In
November and December 2009 our economic interest increased from 45% to
52.44% as a result of transactions with a noncontrolling partner,
partially offset by divestiture required under the Contract of
Work.
|
|
(7)
|
Newmont
acquired the remaining 33.33% of Boddington from AngloGold in June
2009.
|
| Page 5 of 7 |
|
Equity Copper Reserves(1)
|
||||||||||||||||||||||||||||||||||||||||||||||||||||||||
|
December
31, 2009
|
||||||||||||||||||||||||||||||||||||||||||||||||||||||||
|
December
31, 2008
|
||||||||||||||||||||||||||||||||||||||||||||||||||||||||
|
Proven
Reserves
|
Probable
Reserves
|
Proven
+ Probable Reserves
|
Proven
+ Probable Reserve
|
|||||||||||||||||||||||||||||||||||||||||||||||||||||
|
Deposits/Districts
|
Newmont
|
Tonnage
|
Grade
|
Copper
|
Tonnage
|
Grade
|
Copper
|
Tonnage
|
Grade
|
Copper
|
Metallurgical
|
Tonnage
|
Grade
|
Copper
|
||||||||||||||||||||||||||||||||||||||||||
|
share
|
(000
tons)
|
(Cu%)
|
(million
pounds)
|
(000
tons)
|
(Cu%)
|
(million
pounds)
|
(000
tons)
|
(Cu%)
|
(million
pounds)
|
Recovery
|
(000
tons)
|
(Cu%)
|
(million
pounds)
|
|||||||||||||||||||||||||||||||||||||||||||
|
NORTH
AMERICA
|
||||||||||||||||||||||||||||||||||||||||||||||||||||||||
|
Phoenix,
Nevada
|
100 | % | 0 | 0 | 287,500 | 0.16 | % | 900 | 287,500 | 0.16 | % | 900 | 61 | % | 302,000 | 0.15 | % | 890 | ||||||||||||||||||||||||||||||||||||||
|
TOTAL
NORTH AMERICA
|
0 | 0 | 287,500 | 0.16 | % | 900 | 287,500 | 0.16 | % | 900 | 61 | % | 302,000 | 0.15 | % | 890 | ||||||||||||||||||||||||||||||||||||||||
| SOUTH AMERICA | ||||||||||||||||||||||||||||||||||||||||||||||||||||||||
|
Conga, Peru(2)
|
51.35 | % | 0 | 0 | 317,200 | 0.26 | % | 1,660 | 317,200 | 0.26 | % | 1,660 | 85 | % | 317,200 | 0.26 | % | 1,660 | ||||||||||||||||||||||||||||||||||||||
| TOTAL SOUTH AMERICA | 0 | 0 | 317,200 | 0.26 | % | 1,660 | 317,200 | 0.26 | % | 1,660 | 85 | % | 317,200 | 0.26 | % | 1,660 | ||||||||||||||||||||||||||||||||||||||||
|
ASIA
PACIFIC
|
||||||||||||||||||||||||||||||||||||||||||||||||||||||||
|
Batu Hijau(3)
|
52.44 | % | 201,100 | 0.51 | % | 2,070 | 167,700 | 0.32 | % | 1,060 | 368,800 | 0.42 | % | 3,130 | 77 | % | 348,800 | 0.44 | % | 3,060 | ||||||||||||||||||||||||||||||||||||
|
Batu Hijau,
Stockpiles(3)(4)
|
52.44 | % | 0 | 0 | 193,800 | 0.36 | % | 1,390 | 193,800 | 0.36 | % | 1,390 | 66 | % | 131,400 | 0.34 | % | 890 | ||||||||||||||||||||||||||||||||||||||
|
Batu
Hijau, Indonesia
|
52.44 | % | 201,100 | 0.51 | % | 2,070 | 361,500 | 0.34 | % | 2,450 | 562,600 | 0.40 | % | 4,520 | 74 | % | 480,200 | 0.41 | % | 3,950 | ||||||||||||||||||||||||||||||||||||
|
Boddington, Western
Australia (5)
|
100.00 | % | 184,600 | 0.11 | % | 400 | 781,800 | 0.10 | % | 1,640 | 966,400 | 0.11 | % | 2,040 | 84 | % | 583,200 | 0.11 | % | 1,280 | ||||||||||||||||||||||||||||||||||||
|
TOTAL
ASIA PACIFIC
|
385,700 | 0.32 | % | 2,470 | 1,143,300 | 0.18 | % | 4,090 | 1,529,000 | 0.21 | % | 6,560 | 77 | % | 1,063,400 | 0.25 | % | 5,230 | ||||||||||||||||||||||||||||||||||||||
|
TOTAL
NEWMONT WORLDWIDE
|
385,700 | 0.32 | % | 2,470 | 1,748,000 | 0.19 | % | 6,650 | 2,133,700 | 0.21 | % | 9,120 | 77 | % | 1,682,600 | 0.23 | % | 7,780 | ||||||||||||||||||||||||||||||||||||||
|
(1)
|
Reserves
are calculated at US$2.00 or A$2.40 per pound copper price unless
otherwise noted. 2008 reserves were also calculated at US$2.00
or A$2.40 per pound copper price unless otherwise
noted. Tonnage amounts have been rounded to the nearest 100,000
and pounds have been rounded to the nearest 10 million.
|
|
(2)
|
Deposit
is undeveloped.
|
|
(3)
|
Percentage
reflects Newmont's economic interest at December 31, 2009. In
November and December 2009 our economic interest increased from 45% to
52.44% as a result of transactions with a noncontrolling partner,
partially offset by divestiture required under the Contract of
Work.
|
|
(4)
|
Stockpiles
are comprised primarily of material that has been set aside to allow
processing of higher grade material. Stockpiles increase or
decrease depending on current mine plans. Stockpiles are
reported separately where tonnage or contained metal are greater than 5%
of the total site reported reserves.
|
|
(5)
|
Newmont
acquired the remaining 33.33% of Boddington from AngloGold in June
2009.
|
|
Equity Copper
Mineralized Material Not in Reserves(1)(2)
|
||||||||||||||||||||||||||||||||||||
|
December
31, 2009
|
||||||||||||||||||||||||||||||||||||
|
Deposits/Districts
|
Measured
Material
|
Indicated
Material
|
Measured
+ Indicated Material
|
Inferred
Material
|
||||||||||||||||||||||||||||||||
|
Newmont
|
Tonnage
|
Grade
|
Tonnage
|
Grade
|
Tonnage
|
Grade
|
Tonnage
|
Grade
|
||||||||||||||||||||||||||||
|
Share
|
(000
tons)
|
(Cu%)
|
(000
tons)
|
(Cu%)
|
(000
tons)
|
(Cu%)
|
(000
tons)
|
(Cu%)
|
||||||||||||||||||||||||||||
|
NORTH
AMERICA
|
||||||||||||||||||||||||||||||||||||
|
Phoenix,
Nevada
|
100 | % | 0 | 0.00 | % | 199,687 | 0.18 | % | 199,687 | 0.18 | % | 91,815 | 0.23 | % | ||||||||||||||||||||||
|
TOTAL
NORTH AMERICA
|
199,687 | 0.18 | % | 199,687 | 0.18 | % | 91,815 | 0.23 | % | |||||||||||||||||||||||||||
|
SOUTH
AMERICA
|
||||||||||||||||||||||||||||||||||||
|
Conga,
Peru
|
51.35 | % | 0 | 0.00 | % | 58,000 | 0.18 | % | 58,000 | 0.18 | % | 79,000 | 0.17 | % | ||||||||||||||||||||||
|
TOTAL
SOUTH AMERICA
|
58,000 | 0.18 | % | 58,000 | 0.18 | % | 79,000 | 0.17 | % | |||||||||||||||||||||||||||
|
ASIA
PACIFIC
|
||||||||||||||||||||||||||||||||||||
|
Batu Hijau, Indonesia (3)
|
52.44 | % | 25,400 | 0.42 | % | 148,400 | 0.31 | % | 173,800 | 0.32 | % | 81,300 | 0.22 | % | ||||||||||||||||||||||
|
Boddington, Western Australia (4)
|
100.00 | % | 20,600 | 0.08 | % | 344,200 | 0.10 | % | 364,800 | 0.09 | % | 292,900 | 0.10 | % | ||||||||||||||||||||||
|
TOTAL
ASIA PACIFIC
|
46,000 | 0.27 | % | 492,600 | 0.16 | % | 538,600 | 0.17 | % | 374,200 | 0.13 | % | ||||||||||||||||||||||||
|
TOTAL
NEWMONT WORLDWIDE
|
46,000 | 0.27 | % | 750,287 | 0.17 | % | 796,287 | 0.17 | % | 545,015 | 0.15 | % | ||||||||||||||||||||||||
|
(1)
|
Mineralized
material is reported exclusive of reserves.
|
|
(2)
|
Mineralized
material calculated at a copper price of US$2.50 or A$3.00 per pound
unless otherwise noted. 2008 mineralized material was also
calculated at a copper price of US$2.50 or A$3.00 per
pound. Tonnage amounts have been rounded to the nearest
100,000.
|
|
(3)
|
Percentage
reflects Newmont's economic interest at December 31, 2009. In
November and December 2009 our economic interest increased from 45% to
52.44% as a result of transactions with a noncontrolling partner,
partially offset by divestiture required under the Contract of
Work.
|
|
(4)
|
Newmont
acquired the remaining 33.33% of Boddington from AngloGold in June
2009.
|
| Page 6 of 7 |
To
view more detailed financial disclosure, including regional mine statistics,
Results of Consolidated Operations, Liquidity and Capital Resources,
Management’s Discussion & Analysis, relevant Risk Factors, and a complete
outline of the 2009 Operating and Financial guidance by region, please see the
Company’s Annual Report on Form 10-K, filed with the Securities and Exchange
Commission on February 25, 2010, available at www.newmont.com.
The Company’s
fourth quarter and year-end earnings conference call and web cast presentation
will be held on Thursday, February 25, 2010 beginning at 10:00 a.m. Eastern Time
(8:00 a.m. Mountain Time). To participate:
|
Dial-In
Number
|
800.779.3178
|
|
Intl
Dial-In Number
|
415.228.4957
|
|
Leader
|
John
Seaberg
|
|
Passcode
|
Newmont
|
|
Replay
Number
|
866.451.8896
|
|
Intl
Replay Number
|
203.369.1202
|
|
Replay
Passcode
|
2010
|
The conference call
also will be simultaneously carried on our web site at www.newmont.com under
Investor Relations/Presentations and will be archived there for a limited
time.
|
Investor
Contacts
|
||||
|
John
Seaberg
|
303.837.5743
|
john.seaberg@newmont.com
|
||
|
Media
Contacts
|
||||
|
Omar
Jabara
|
303.837.5114
|
omar.jabara@newmont.com
|
Cautionary
Statement:
This news release contains
“forward-looking statements” within the meaning of Section 27A of the Securities
Act of 1933, as amended, and Section 21E of the Securities Exchange Act of 1934,
as amended, which are intended to be covered by the safe harbor created by such
sections and other applicable laws. Such forward-looking statements
include, without limitation: (i) estimates of future mineral production and
sales; (ii) estimates of future costs applicable to sales, other expenses and
taxes, for specific operations and on a consolidated basis; (iii) estimates of
future capital expenditures, construction, production or closure activities;
(iv) statements regarding future exploration expenditures, results and reserves;
(v) statements regarding fluctuations in capital and currency markets; (vi)
statements regarding potential cost savings, productivity, operating
performance, and cost structure; (vii) expectations regarding the ramp-up, mine
life, production and costs applicable to sales and exploration potential of
Boddington and the Company’s other projects; and (viii) expectations regarding
the impacts of operating, technical or geotechnical issues in connection with
the Company’s projects or operations. Where the Company expresses or
implies an expectation or belief as to future events or results, such
expectation or belief is expressed in good faith and believed to have a
reasonable basis. However, forward-looking statements are subject to
risks, uncertainties and other factors, which could cause actual results to
differ materially from future results expressed, projected or implied by such
forward-looking statements. Such risks include, but are not limited to,
gold and other metals price volatility, currency fluctuations, increased
production costs and variances in ore grade or recovery rates from those assumed
in mining plans, political and operational risks in the countries in which we
operate, and governmental regulation and judicial outcomes. For a more
detailed discussion of such risks and other factors, see the Company’s 2009
Annual Report on Form 10-K, filed on February 25, 2010, with the Securities and
Exchange Commission, as well as the Company’s other SEC filings. The
Company does not undertake any obligation to release publicly revisions to any
“forward-looking statement,” to reflect events or circumstances after the date
of this news release, or to reflect the occurrence of unanticipated events,
except as may be required under applicable securities laws.
| Page 7 of 7 |