Attached files
|
UNITED
STATES
SECURITIES
AND EXCHANGE COMMISSION
|
WASHINGTON,
D.C. 20549
|
FORM
10-K
|
|
[X]
ANNUAL REPORT PURSUANT TO SECTION 13 OR 15 (d) OF THE SECURITIES EXCHANGE
ACT OF 1934
|
For the
fiscal year ended December 31, 2009
[ ] TRANSITION
REPORT PURSUANT TO SECTION 13 OR 15(d) OF THE SECURITIES EXCHANGE ACT OF
1934
For the
transition period from ________ to _________
Commission
file number 1-11430
MINERALS
TECHNOLOGIES INC.
(Exact
name of registrant as specified in its charter)
|
Delaware
(State
or other jurisdiction of
incorporation
or organization)
|
25-1190717
(I.R.S.
Employer
Identification
Number)
|
|
|
The
Chrysler Building
405
Lexington Avenue
New
York, New York
(Address
of principal executive office)
|
10174-0002
(Zip
Code)
|
(212)
878-1800
(Registrant's
telephone number, including area code)
Securities
registered pursuant to Section 12(b) of the Act:
|
Title
of each class
|
Name
of each exchange
on
which registered
|
|
Common
Stock, $.10 par value
|
New
York Stock Exchange
|
|
Securities
registered pursuant to Section 12(g) of the
Act:
|
|
None
Indicate
by check mark if the Registrant is a well-known seasoned issuer, as defined in
Rule 405 of the Securities Act.
Yes
[X] No [ ]
Indicate
by check mark if Registrant is not required to file reports pursuant to Section
13 or 15(d) of the Act.
Yes
[ ] No [X]
Indicate
by check mark whether the Registrant (1) has filed all reports required to be
filed by Section 13 or 15(d) of the Securities Exchange Act of 1934 during the
preceding 12 months (or for such shorter period that the Registrant was required
to file such reports), and (2) has been subject to such filing requirements for
the past 90 days.
Yes
[X] No [ ]
Indicate
by check mark whether the registrant has submitted electronically and posted on
its corporate Web site, if any, every Interactive Data File required to be
submitted and posted pursuant to Rule 405 of Regulation S-T (§232.405 of this
chapter) during the preceding 12 months (or for such shorter period that the
registrant was required to submit and post such files).
Yes
[ ] No [ ]
Indicate
by check mark if disclosure of delinquent filers pursuant to Item 405 of
Regulation S-K is not contained herein, and will not be contained, to the best
of the Registrant's knowledge, in definitive proxy or information statements
incorporated by reference in Part III of this Form 10-K or any amendment to this
Form 10-K. [ ].
Indicate
by check mark whether the Registrant is a large accelerated filer, an
accelerated filer, a non-accelerated filer or a smaller reporting company. See
the definitions of "large accelerated filer," "accelerated filer," and "smaller
reporting company" in Rule 12b-2 of the Exchange Act.
|
Large
Accelerated Filer [ ]
|
Accelerated
Filer [X]
|
Non-
accelerated Filer [ ]
|
Smaller
Reporting Company [ ]
|
|
(Do
not check if smaller reporting
company)
|
|||
Indicate
by check mark whether the Registrant is a shell company (as defined in Rule
12b-2 of the Act).
Yes
[ ] No [X]
The
aggregate market value of the voting stock held by non-affiliates of the
Registrant, based upon the closing price at which the stock was sold as of June
30, 2009, was approximately $486 million. Solely for the purposes of
this calculation, shares of common stock held by officers, directors and
beneficial owners of 10% or more of the outstanding common stock have been
excluded in that such persons may be deemed to be affiliates. This
determination of affiliate status is not necessarily a conclusive determination
for other purposes.
As
of February 5, 2010, the Registrant had outstanding 18,758,165 shares of common
stock, all of one class.
DOCUMENTS
INCORPORATED BY REFERENCE
|
Proxy
Statement dated April 5, 2010
|
Part
III
|
||
|
MINERALS
TECHNOLOGIES INC.
2009
FORM 10-K ANNUAL REPORT
|
||
|
Page
|
||
|
PART
I
|
||
|
Item
1.
|
3
|
|
|
Item
1A.
|
8
|
|
|
Item
1B.
|
10
|
|
|
Item
2.
|
10
|
|
|
Item
3.
|
12
|
|
|
Item
4.
|
13
|
|
|
PART
II
|
||
|
Item
5.
|
13
|
|
|
Item
6.
|
17
|
|
|
Item
7.
|
18
|
|
|
Item
7A.
|
34
|
|
|
Item
8.
|
34
|
|
|
Item
9.
|
34
|
|
|
Item
9A.
|
34
|
|
|
Item
9B.
|
34
|
|
|
PART
III
|
||
|
Item
10.
|
35
|
|
|
Item
11.
|
36
|
|
|
Item
12.
|
36
|
|
|
Item
13.
|
36
|
|
|
Item
14.
|
36
|
|
|
PART
IV
|
||
|
Item
15.
|
36
|
|
|
40
|
||
PART
I
Item
1. Business
Minerals
Technologies Inc. (the "Company") is a resource- and technology-based company
that develops, produces and markets worldwide a broad range of specialty
mineral, mineral-based and synthetic mineral products and supporting systems and
services. The Company has two reportable segments: Specialty Minerals
and Refractories. The Specialty Minerals segment produces and sells
the synthetic mineral product precipitated calcium carbonate ("PCC") and
processed mineral product quicklime ("lime"), and mines mineral ores then
processes and sells natural mineral products, primarily limestone and
talc. This segment's products are used principally in the paper,
building materials, paint and coatings, glass, ceramic, polymer, food,
automotive and pharmaceutical industries. The Refractories segment
produces and markets monolithic and shaped refractory materials and specialty
products, services and application and measurement equipment, and calcium metal
and metallurgical wire products. Refractories segment products are primarily
used in high-temperature applications in the steel, non-ferrous metal and glass
industries.
The
Company maintains a research and development focus. The Company's
research and development capability for developing and introducing
technologically advanced new products has enabled the Company to anticipate and
satisfy changing customer requirements, creating market opportunities through
new product development and product application innovations.
Specialty
Minerals Segment
PCC
Products and Markets
The
Company's PCC product line net sales were $534.7 million, $605.7 million and
$602.6 million for the years ended December 31, 2009, 2008 and 2007,
respectively. The Company's sales of PCC have been, and are expected
to continue to be, made primarily to the printing and writing papers segment of
the paper industry. The Company also produces PCC for sale to
companies in the polymer, food and pharmaceutical industries. See Item 7,
"Management's Discussion and Analysis of Financial Condition and Results of
Operations."
PCC
Products - Paper
|
|
In
the paper industry, the Company's PCC is
used:
|
|
·
|
As
a filler in the production of coated and uncoated wood-free printing and
writing papers, such as office papers;
|
|
·
|
As
a filler for coated and uncoated groundwood (wood-containing) paper such
as magazine and catalog papers; and
|
|
·
|
As
a coating pigment for both wood-free and groundwood
papers.
|
The
Company's Paper PCC product line net sales were $484.6 million, $547.2 million
and $542.0 million for the years ended December 31, 2009, 2008 and 2007,
respectively.
Approximately
50% of the Company's sales consist of PCC sold to papermakers from "satellite"
PCC plants. A satellite PCC plant is a PCC manufacturing facility
located near a paper mill, thereby eliminating costs of transporting PCC from
remote production sites to the paper mill. The Company believes the
competitive advantages offered by improved economics and superior optical
characteristics of paper produced with PCC manufactured by the Company's
satellite PCC plants resulted in substantial growth in the number of the
Company's satellite PCC plants since the first such plant was built in
1986. For information with respect to the locations of the Company's
PCC plants as of December 31, 2009, see Item 2, "Properties,"
below.
The
Company currently manufactures several customized PCC product forms using
proprietary processes. Each product form is designed to provide
optimum balance of paper properties including brightness, opacity, bulk,
strength and improved printability. The Company's research and
development and technical service staffs focus on expanding sales from its
existing and potential new satellite PCC plants as well as developing new
technologies for new applications. These technologies include, among
others, acid-tolerant ("AT®") PCC,
which allows PCC to be introduced to the large wood-containing segment of the
printing and writing paper market, and OPACARB® PCC,
a family of products for paper coating.
The
Company owns, staffs, operates and maintains all of its satellite PCC
facilities, and owns or licenses the related technology. Generally,
the Company and its paper mill customers enter into long-term evergreen
agreements, initially ten years in length, pursuant to which the Company
supplies substantially all of the customer's precipitated calcium carbonate
filler requirements. The Company is generally permitted to sell to
third-parties PCC produced at a satellite plant in excess of the host paper
mill's requirement.
The
Company also sells a range of PCC products to paper manufacturers from
production sites not associated with paper mills. These merchant facilities are
located at Adams, Massachusetts; Lifford, England; and Walsum,
Germany.
PCC
Markets - Paper
Uncoated Wood-Free Printing and
Writing Papers – North America. Beginning in the mid-1980's,
as a result of a concentrated research and development effort, the Company's
satellite PCC plants facilitated the conversion of a substantial percentage of
North American uncoated wood-free printing and writing paper producers to
lower-cost alkaline papermaking technology. The Company estimates
that during 2009, more than 90% of North American uncoated wood-free paper was
produced employing alkaline technology. Presently, the Company owns
and operates 19 commercial satellite PCC plants located at paper mills that
produce uncoated wood-free printing and writing papers in North
America.
Uncoated Wood-Free Printing and
Writing Papers – Outside North America. The Company estimates
the amount of uncoated wood-free printing and writing papers produced outside of
North America at facilities that can be served by satellite and merchant PCC
plants is more than twice as large (measured in tons of paper produced) as the
North American uncoated wood-free paper market currently served by the
Company. The Company believes that the superior brightness, opacity
and bulking characteristics offered by its PCC products allow it to compete with
suppliers of ground limestone and other filler products outside of North
America. Presently, the Company owns and operates 20 commercial
satellite PCC plants located at paper mills that produce uncoated wood-free
printing and writing papers outside of North America.
Uncoated Groundwood
Paper. The uncoated groundwood paper market, including
newsprint, represents approximately 30% of worldwide paper
production. Paper mills producing wood-containing paper still
generally employ acid papermaking technology. The conversion to
alkaline technology by these mills has been hampered by the tendency of
wood-containing papers to darken in an alkaline environment. The
Company has developed proprietary application technology for the manufacture of
high-quality groundwood paper in an acidic environment using PCC (AT®
PCC). Furthermore, as groundwood or wood-containing paper mills use
larger quantities of recycled fiber, there is a trend toward the use of neutral
papermaking technology in this segment for which the Company presently supplies
traditional PCC chemistries. The Company now supplies PCC at about 12
groundwood paper mills around the world and licenses its technology to a ground
calcium carbonate producer to help accelerate the conversion from acid to
alkaline papermaking.
Coated Paper. The
Company continues to pursue satellite PCC opportunities in coated paper markets
where our products provide unique performance and/or cost reduction benefits to
papermakers and printers. Our Opacarb product line is designed to create value
to the papermaker and can be used alone or in combination with other coating
pigments. PCC coating products are produced at 10 of the Company's PCC plants
worldwide.
Specialty
PCC Products and Markets
The
Company also produces and sells a full range of dry PCC products on a merchant
basis for non-paper applications. The Company's Specialty PCC product
line net sales were $50.1 million, $58.5 million and $60.6 million for the years
ended December 31, 2009, 2008 and 2007, respectively. The Company sells
surface-treated and untreated grades of PCC to the polymer industry for use in
automotive and construction applications, and to the adhesives and printing inks
industries. The Company's PCC is also used by the food and
pharmaceutical industries as a source of bio-available calcium in tablets and
food applications, as a buffering agent in tablets, and as a mild abrasive in
toothpaste. The Company produces PCC for specialty applications from
production sites at Adams, Massachusetts and Lifford, England.
Processed
Minerals - Products and Markets
The
Company mines and processes natural mineral products, primarily limestone and
talc. The Company also manufactures lime, a limestone-based product.
The Company's net sales of processed mineral products were $93.7 million, $110.7
million and $114.0 million for the years ended December 31, 2009, 2008 and 2007,
respectively. Net sales of talc products were $32.3 million, $35.9 million and
$37.3 million for the years ended December 31, 2009, 2008 and 2007,
respectively. Net sales of ground calcium carbonate ("GCC") products, which are
principally lime and limestone, were $61.4 million, $74.8 million and $76.7
million for the years ended December 31, 2009, 2008 and 2007, respectively. See
Item 7, "Management's Discussion and Analysis of Financial Condition and Results
of Operations."
The
Company mines and processes GCC products at its reserves in the eastern and
western parts of the United States. GCC is used and sold in the construction,
automotive and consumer markets.
Lime
produced at the Company's Adams, Massachusetts, and Lifford, United Kingdom,
facilities is used primarily as a raw material for the manufacture of PCC at
these sites and at some satellite PCC plants, and is sold commercially to
various chemical and other industries.
The
Company mines, beneficiates and processes talc at its Barretts site, located
near Dillon, Montana. Talc is sold worldwide in finely ground form for ceramic
applications and in North America for paint and coatings and polymer
applications. Because of the
exceptional
chemical purity of the Barretts ore, a significant portion of worldwide
automotive catalytic converter ceramic substrates contain the Company's Barretts
talc.
The
Company's natural mineral products are supported by the Company's limestone
reserves located in the western and eastern parts of the United States, and talc
reserves located in Montana. The Company estimates these reserves, at
current usage levels, to be in excess of 30 years at its limestone production
facilities and in excess of 20 years at its talc production
facility.
Refractories
Segment
Refractory
Products and Markets
Refractories
Products
The
Company offers a broad range of monolithic and pre-cast refractory products and
related systems and services. The Company's Refractory segment net
sales were $278.9 million, $395.8 million and $361.1 million for the years ended
December 31, 2009, 2008 and 2007, respectively. See Item 7,
"Management's Discussion and Analysis of Financial Condition and Results of
Operations."
Refractory
product sales are often supported by Company-supplied proprietary application
equipment and on-site technical service support. The Company's
proprietary application equipment is used to apply refractory materials to the
walls of steel-making furnaces and other high temperature vessels to maintain
and extend their useful life. Net sales of refractory products, including those
for non-ferrous applications, were $225.4 million, $320.8 million and $290.5
million for the years ended December 31, 2009, 2008 and 2007. The Company's
proprietary application system, such as its MINSCAN®,
allow for remote-controlled application of the Company's refractory products in
steel-making furnaces, as well as in steel ladles and blast
furnaces. Since the steel-making industry is characterized by intense
price competition, which results in a continuing emphasis on increased
productivity, these application systems and the technologically advanced
refractory materials developed in the Company's research laboratories have been
well accepted by the Company's customers. These products allow steel
makers to improve their performance through, among other things, the application
of monolithic refractories to furnace linings while the furnace is at operating
temperature, thereby eliminating the need for furnace cool-down periods and
steel-production interruption. The result is a lower overall cost for
steel produced by steel makers.
The
Company's experienced technical service staff and advanced application equipment
provide customers assurance that they will achieve their desired productivity
objectives. The Company's technicians are also able to conduct laser
measurement of refractory wear, sometimes in conjunction with robotic
application tools, to improve refractory performance at many customer
locations. The Company believes that these services, together with
its refractory product offerings, provide it with a strategic marketing
advantage.
Over
the past several years the Refractories segment has continued to reformulate its
products and application technology to maintain its competitive advantage in the
market place. Some of the new products the Company has introduced in the past
few years include:
|
·
|
HOTCRETE®:
High durability shotcrete products for applications at high temperatures
in ferrous applications such as steel ladles;
|
|
·
|
FASTFIRE®:
High durability castable and shotcrete products in the non-ferrous and
ferrous industries with the added benefit of rapid dry-out
capabilities;
|
|
·
|
OPTIFORM®:
A system of products and equipment for the rapid continuous casting of
refractories for applications such as steel ladle safety
linings;
|
|
·
|
ENDURATEQ®:
A high durability refractory shape for glass contact applications such as
plungers and orifice rings; and
|
|
·
|
DECTEQ™:
A system for the automatic control of electrical power feeding electrodes
used in electric arc steel making
furnaces.
|
Refractories
Markets
The
principal market for the Company's refractory products is the steel
industry. Management believes that certain trends in the steel
industry will provide growth opportunities for the Company. These
trends include growth and quality improvements in select geographic regions
(e.g., China, Eastern Europe and India) the development of improved
manufacturing processes such as thin-slab casting, the trend in North America to
shift production from integrated mills to electric arc furnaces (mini-mills) and
the ever-increasing need for improved productivity and longer lasting
refractories.
The
Company sells its refractory products in the following markets:
Steel Furnace. The
Company sells gunnable monolithic refractory products and application systems to
users of basic oxygen furnaces and electric furnaces for application on furnace
walls to prolong the life of furnace linings.
Other Iron and
Steel. The Company sells monolithic refractory materials and
pre-cast refractory shapes for iron and steel ladles, vacuum degassers,
continuous casting tundishes, blast furnaces and reheating
furnaces. The Company offers a full line of materials to satisfy most
continuous casting refractory applications. This full line consists
of gunnable materials, refractory shapes and permanent linings.
Industrial Refractory
Systems. The Company sells refractory shapes and linings to
non-steel refractories consuming industries including glass, cement, aluminum
and petrochemicals, power generation and other non-steel industries. The Company
also produces a specialized line of carbon composites and pyrolitic graphite
primarily sold under the PYROID®
trademark, primarily to the aerospace and electronics industries.
Metallurgical
Products and Markets
The
Company produces a number of other technologically advanced products for the
steel industry, including calcium metal, metallurgical wire products and a
number of metal treatment specialty products. Net sales of metallurgical
products were $53.5 million, $75.0 million and $70.6 million for the years ended
December 31, 2009, 2008 and 2007. The Company manufactures calcium metal at its
Canaan, Connecticut, facility and purchases calcium in international
markets. Calcium metal is used in the manufacture of the Company's
PFERROCAL®
solid-core calcium wire, and is also sold for use in the manufacture of
batteries and magnets. The Company sells metallurgical wire products
and associated wire-injection equipment for use in the production of
high-quality steel. These metallurgical wire products are injected
into molten steel to improve castability and reduce
imperfections. The steel produced is used for high-pressure pipeline
and other premium-grade steel applications.
Marketing
and Sales
The
Company relies principally on its worldwide direct sales force to market its
products. The direct sales force is augmented by technical service
teams that are familiar with the industries to which the Company markets its
products, and by several regional distributors. The Company's sales
force works closely with the Company's technical service staff to solve
technical and other issues faced by the Company's customers. The Company's
technical service staff assists paper producers in ongoing evaluations of the
use of PCC for paper coating and filling applications. In the Refractory
segment, the Company's technical service personnel advise on the use of
refractory materials, and, in many cases pursuant to service agreements, apply
the refractory materials to the customers' furnaces and other vessels. Continued
use of skilled technical service teams is an important component of the
Company's business strategy.
The
Company works closely with its customers to ensure that their requirements are
satisfied, and it often trains and supports customer personnel in the use of the
Company's products. The Company oversees domestic marketing and sales activities
from Bethlehem, Pennsylvania, and from regional sales offices in the eastern and
western United States. The Company's international marketing and sales efforts
are directed from regional centers located in Brussels, Belgium; Sao Jose Dos
Campos, Brazil; and Shanghai, China. The Company believes its processed minerals
are at regional locations that satisfy the stringent delivery requirements of
the industries they serve. The Company also believes that its worldwide network
of sales personnel and manufacturing sites facilitates the continued
international expansion.
Raw
Materials
The
Company depends in part on having an adequate supply of raw materials for its
manufacturing operations, particularly lime and carbon dioxide for the PCC
product line, magnesia and alumina for its Refractory operations, and on having
adequate access to ore reserves at its mining operations.
The
Company uses lime in the production of PCC and is a significant purchaser of
lime worldwide. Generally, lime is purchased under long-term supply
contracts from unaffiliated suppliers located in close geographic proximity to
the Company's PCC plants.
The
principal raw materials used in the Company's monolithic refractory products are
refractory-grade magnesia and various forms of aluminasilicates. The
Company also purchases calcium metal, calcium silicide, graphite, calcium
carbide and various alloys for use in the production of metallurgical wire
products and uses lime and aluminum in the production of calcium
metal. The Company purchases a significant portion of its magnesia
requirements from sources in China. The price and availability of
bulk raw materials from China are subject to fluctuations that could affect the
Company's sales to its customers. In addition, the volatility of transportation
costs have also affected the delivered cost of raw materials imported from China
to North America and Europe.
Competition
The
Company is continually engaged in efforts to develop new products and
technologies and refine existing products and technologies in order to remain
competitive and to position itself as a market leader.
With
respect to its PCC products, the Company competes for sales to the paper
industry with other minerals, such as GCC and kaolin, based in large part upon
technological know-how, patents and processes that allow the Company to deliver
PCC that it believes imparts gloss, brightness, opacity and other properties to
paper on an economical basis. The Company is the leading manufacturer
and supplier of PCC to the paper industry.
The
Company competes in sales of its limestone and talc based primarily upon
quality, price, and geographic location.
With
respect to the Company's refractory products, competitive conditions vary by
geographic region. Competition is based upon the performance
characteristics of the product (including strength, consistency and ease of
application), price, and the availability of technical support.
Research
and Development
Many
of the Company's product lines are technologically advanced. Our expertise in
inorganic chemistry, crystallography and structural analysis, fine particle
technology and other aspects of materials science apply to and support all of
our product lines. The Company's business strategy for growth in sales and
profitability depends, to a large extent, on the continued success of its
research and development activities. Among the significant achievements of the
Company's research and development efforts have been: the satellite PCC plant
concept; PCC crystal morphologies for paper coating; AT® PCC
for wood-containing papers; the development of FASTFIRE® and
OPTIFORM®
shotcrete refractory products; LACAM®
laser-based refractory measurement systems; the MINSCAN® and
HOTCRETE®
application systems and EMforce® for
the Processed Minerals and Specialty PCC product lines.
The
Company will continue to develop its filler-fiber composite material, which
could increase filler levels in uncoated freesheet paper to upwards of 30%. This
product remains in development. The Company is in commercialization discussions
with a company in Europe and also conducting large-scale trials in Asia. The
Company will also continue to reformulate its refractory materials to be more
competitive, and will also continue development of unique calcium carbonates for
use in novel biopolymers.
For
the years ended December 31, 2009, 2008 and 2007, the Company spent
approximately $19.9 million, $23.1 million and $26.3 million, respectively, on
research and development. The Company's research and development spending for
2009 was approximately 2.2% of net sales.
The
Company maintains its primary research facilities in Bethlehem and Easton,
Pennsylvania. It also has research and development facilities in
China, Finland, Germany, Ireland, Japan and Turkey. Approximately 93
employees worldwide are engaged in research and development. In
addition, the Company has access to some of the world's most advanced
papermaking and paper coating pilot facilities.
Patents
and Trademarks
The
Company owns or has the right to use approximately 309 patents and approximately
797 trademarks related to its business. The Company believes that its
rights under its existing patents, patent applications and trademarks are of
value to its operations, but no one patent, application or trademark is material
to the conduct of the Company's business as a whole.
Insurance
The
Company maintains liability and property insurance and insurance for business
interruption in the event of damage to its production facilities and certain
other insurance covering risks associated with its business. The
Company believes such insurance is adequate for the operation of its
business. There is no assurance that in the future the Company will
be able to maintain the coverage currently in place or that the premiums will
not increase substantially.
Employees
At
December 31, 2009, the Company employed 2,173 persons, of whom 1,072 were
employed outside of the United States.
Environmental,
Health and Safety Matters
The
Company’s operations are subject to federal, state, local and foreign laws and
regulations relating to the environment and health and
safety. Certain of the Company’s operations involve and have involved
the use and release of substances that have been and are classified as toxic or
hazardous within the meaning of these laws and
regulations. Environmental operating permits are, or may be, required
for certain of the Company’s operations and such permits are subject to
modification, renewal and revocation. The Company regularly
monitors and reviews its operations, procedures and policies for compliance with
these laws and regulations. The Company believes its operations are
in substantial compliance with these laws and regulations and that there are no
violations that would have a material effect on the Company. Despite
these compliance efforts, some risk of environmental and other damage is
inherent in the Company’s operations, as it is with other companies engaged in
similar businesses, and there can be no assurance that material violations will
not occur in the future. The cost of compliance with these laws and
regulations is not expected to have a material adverse effect on the
Company.
Laws
and regulations are subject to change. See Item 1A, Risk Factors, for
information regarding the possible effects that compliance with new
environmental laws and regulations, including those relating to climate change,
may have on our businesses and operating results.
The
Company obtained indemnification for certain potential health and safety
liabilities under agreements entered into between the Company and Pfizer Inc
("Pfizer") or Quigley Company, Inc., a wholly-owned subsidiary of Pfizer, in
connection with the initial public offering of the Company in
1992. See "Certain Relationships and Related Transactions" in Item
13.
Available
Information
The
Company maintains an internet website located at
http://www.mineralstech.com. Its reports on Forms 10-K, 10-Q and 8-K,
and amendments to those reports, as well as its Proxy Statement and filings
under Section 16 of the Securities Exchange Act of 1934 are available free of
charge through the Investor Relations page of its website, as soon as reasonably
practicable after they are filed with the Securities and Exchange Commission
("SEC"). Investors may access these reports through the Company's
website by navigating to "Investor Relations" and then to "SEC
Filings."
Financial
information concerning our business segments and the geographical areas in which
we operate appears in the Notes to the Consolidated Financial
Statements.
Item
1A. Risk Factors
The
disclosure and analysis set forth in this report contains certain
forward-looking statements, particularly statements relating to future actions,
future performance or results of current and anticipated products, sales
efforts, expenditures, and financial results. From time to time, the
Company also provides forward-looking statements in other publicly-released
materials, both written and oral. Forward-looking statements provide
current expectations and forecasts of future events such as new products,
revenues and financial performance, and are not limited to describing historical
or current facts. They can be identified by the use of words such as
"expects," "plans," "anticipates," and other words and phrases of similar
meaning.
Forward-looking
statements are necessarily based on assumptions, estimates and limited
information available at the time they are made. A broad variety of
risks and uncertainties, both known and unknown, as well as the inaccuracy of
assumptions and estimates, can affect the realization of the expectations or
forecasts in these statements. Consequently, no forward-looking
statement can be guaranteed. Actual future results may vary
materially.
The
Company undertakes no obligation to update any forward-looking
statements. Investors should refer to the Company's subsequent
filings under the Securities Exchange Act of 1934 for further
disclosures.
As
permitted by the Private Securities Litigation Reform Act of 1995, the Company
is providing the following cautionary statements which identify factors that
could cause the Company's actual results to differ materially from historical
and expected results.
|
·
|
Adverse
General Economic, Business, and Industry Conditions
|
|
The
Company’s business and operating results have been and may in the future
be adversely affected by the current US recession and other global
economic conditions, including declining consumer and business confidence,
volatile raw material prices, instability in credit markets, high
unemployment, fluctuating interest rates and exchange rates, and other
challenges that could affect the global economy. The Company’s customers
and potential customers may experience deterioration of their businesses,
cash flow shortages, and difficulty obtaining financing. As a result,
existing or potential customers may reduce or delay their growth and
investments and their plans to purchase products, and may not be able to
fulfill their obligations in a timely fashion. Further, suppliers could
experience similar conditions, which could impact their ability to fulfill
their obligations to the Company. Adversity within capital markets may
impact future return on pension assets, thus resulting in greater future
pension costs that impact the company’s results. Accordingly, a
continued adverse economic climate in the U.S. or abroad could result in
decreases in the Company’s net revenue and
profitability.
|
|
|
·
|
Growth
Rate
|
|
Sales
and income growth of the Company depends upon a number of uncertain
events, including the outcome of the Company's strategies of increasing
its penetration into geographic markets such as Asia and Europe;
increasing its penetration into product markets such as the market for
papercoating pigments and the market for groundwood paper pigments;
increasing sales to existing PCC customers by increasing the amount of PCC
used per ton of paper produced; developing, introducing and selling new
products such as filler-fiber composite materials for the paper industry;
and acquisitions. Difficulties, delays or failure of any of
these strategies could affect the future growth rate of the
Company.
|
|
·
|
Contract
Renewals
|
|
Generally,
the Company's sales of PCC are pursuant to long-term evergreen agreements,
initially ten years in length, with paper mills where the Company operates
satellite PCC plants. The terms of many of these agreements
have been extended, often in connection with an expansion of the satellite
plant. However, failure of a number of the Company's customers
to renew or extend existing agreements on terms as favorable to the
Company as those currently in effect could have a substantial adverse
effect on the Company's results of operations, and could also result in
impairment of the assets associated with the PCC plant.
|
|
|
·
|
Consolidation
in Customer Industries, Principally Paper and Steel
|
|
Several
consolidations in the paper industry have taken place in recent
years. These consolidations could result in partial or total
closure of some paper mills where the Company operates PCC
satellites. Such closures would reduce the Company's sales of
PCC, except to the extent that they resulted in shifting paper production
and associated purchases of PCC to another location served by the Company.
Similarly, consolidations have occurred in the steel
industry. Such consolidations in the two major industries we
serve concentrate purchasing power in the hands of a smaller number of
papermakers and steel manufacturers, enabling them to increase pressure on
suppliers, such as the Company. This increased pressure could
have an adverse effect on the Company's results of operations in the
future.
|
|
|
·
|
Regulation
and Litigation; Environmental Exposures
|
|
The
Company’s operations are subject to international, federal, state and
local governmental environmental, health and safety, tax and other laws
and regulations, and potentially to claims for various legal,
environmental and tax matters. The Company is currently a party
in various litigation matters. While the Company carries
liability insurance, which it believes to be appropriate to its
businesses, and has provided reserves for such matters, which it believes
to be adequate, an unanticipated liability, arising out of such a
litigation matter or a tax or environmental proceeding could have a
material adverse effect on the Company’s financial condition or results of
operations.
In
addition, future events, such as changes to or modifications of
interpretations of existing laws and regulations, or enforcement polices,
or further investigation or evaluation of the potential environmental
impacts of operations or health hazards of certain products, may give rise
to additional compliance and other costs that could have a material
adverse effect on the Company. State, national, and
international governments and agencies have been evaluating
climate-related legislation and regulation that would restrict emissions
of greenhouse gases in areas in which we conduct business, and some such
legislation and regulation have already been enacted or
adopted. Enactment of climate-related legislation or adoption
of regulation that restrict emissions of greenhouse gases in areas in
which we conduct business could have an adverse effect on our operations
or demand for our products. Our manufacturing processes,
particularly the manufacturing process for PCC, use a significant amount
of energy and, should energy prices increase as a result of such
legislation or regulation, we may not be able to pass these increased
costs on to purchasers of our products. We cannot predict if or
when currently proposed or additional laws and regulations regarding
climate change or other environmental or health and safety concerns will
be enacted or adopted.
|
|
|
·
|
New
Products
|
|
The
Company is engaged in a continuous effort to develop new products and
processes in all of its product lines. Difficulties, delays or
failures in the development, testing, production, marketing or sale of
such new products could cause actual results of operations to differ
materially from our expected results.
|
|
|
·
|
Competition;
Protection of Intellectual Property
|
|
The
Company's ability to compete is based in part upon proprietary knowledge,
both patented and unpatented. The Company's ability to achieve
anticipated results depends in part on its ability to defend its
intellectual property against inappropriate disclosure as well as against
infringement. In addition, development by the Company's
competitors of new products or technologies that are more effective or
less expensive than those the Company offers could have a material adverse
effect on the Company's financial condition or results of
operations.
|
|
|
·
|
Risks
of Doing Business Abroad
|
|
As
the Company expands its operations overseas, it faces increased risks of
doing business abroad, including inflation, fluctuation in interest rates
and currency exchange rates, changes in applicable laws and regulatory
requirements, export and import restrictions, tariffs, nationalization,
expropriation, limits on repatriation of funds, civil unrest, terrorism,
unstable governments and legal systems, and other
factors. Adverse developments in any of these areas could cause
actual results to differ materially from historical and expected
results.
|
|
·
|
Availability
and Cost of Raw Materials
|
|
The
Company depends in part on having an adequate supply of raw materials for
its manufacturing operations, particularly lime and carbon dioxide for the
PCC product line, and magnesia and alumina for its Refractory operations
and on having adequate access to ore reserves of appropriate quality at
its mining operations. Unanticipated changes in the costs or
availability of such raw materials, or in the Company's ability to have
access to its ore reserves, could adversely affect the Company's results
of operations.
|
|
|
·
|
Cyclical
Nature of Customers' Businesses
|
|
The
majority of the Company's sales are to customers in industries which have
historically been cyclical paper, steel and construction. The
Company's exposure to variations in its customers' businesses has been
reduced by the diversification of its portfolio of products and services;
and by its geographic expansion. Also, the Company has
structured most of its long-term satellite PCC contracts to provide a
degree of protection against declines in the quantity of product
purchased, since the price per ton of PCC generally rises as the number of
tons purchased declines. In addition, many of the Company's
product lines lower its customers' costs of production or increase their
productivity, which should encourage them to use its products. In
addition, our Processed Minerals and Specialty PCC product lines are
affected by the domestic building and construction markets. The
residential component of this market has experienced a significant
slowdown which could have an adverse impact on future growth. A
sustained economic downturn in one or more of the industries or geographic
regions that the Company serves, or in the worldwide economy, could cause
actual results of operations to differ materially from historical and
expected results.
|
Item
1B. Unresolved Staff
Comments
None.
Item
2. Properties
Set
forth below is the location of, and the main customer served by, each of the
Company's 53 satellite PCC plants as of December 31, 2009. Generally,
the land on which each satellite PCC plant is located is leased at a nominal
amount by the Company from the host paper mill pursuant to a lease, the term of
which generally runs concurrently with the term of the PCC production and sale
agreement between the Company and the host paper mill.
|
Location
|
Principal Customer
|
|
United
States
|
|
|
Alabama,
Courtland
|
International
Paper Company
|
|
Alabama,
Jackson
|
Boise
Inc.
|
|
Alabama,
Selma
|
International
Paper Company
|
|
Arkansas,
Ashdown
|
Domtar
Inc.
|
|
Florida,
Pensacola
|
Georgia-Pacific
Corporation (Koch Industries)
|
|
Kentucky,
Wickliffe
|
NewPage
Corporation
|
|
Louisiana,
Port Hudson
|
Georgia-Pacific
Corporation (Koch Industries)
|
|
Maine,
Jay
|
Verso
Paper Holdings LLC
|
|
Maine,
Madison
|
Madison
Paper Industries
|
|
Maine,
Millinocket 3
|
Katahdin
Paper Company LLC
|
|
Michigan,
Quinnesec
|
Verso
Paper Holdings LLC
|
|
Minnesota,
Cloquet
|
Sappi
Ltd.
|
|
Minnesota,
International Falls
|
Boise
Inc.
|
|
New
York, Ticonderoga
|
International
Paper Company
|
|
North
Carolina, Plymouth2
|
Domtar
Inc.
|
|
Ohio,
Chillicothe
|
P.H.
Glatfelter Co.
|
|
Ohio,
West Carrollton
|
Appleton
Papers Inc.
|
|
South
Carolina, Eastover
|
International
Paper Company
|
|
Virginia,
Franklin2
|
International
Paper Company
|
|
Washington,
Camas
|
Georgia-Pacific
Corporation (Koch Industries)
|
|
Washington,
Longview
|
North
Pacific Paper Corporation
|
|
Washington,
Wallula
|
Boise
Inc.
|
|
Wisconsin,
Kimberly
|
Appleton
Coated
|
|
Wisconsin,
Park Falls
|
Flambeau
River Papers LLC
|
|
Wisconsin,
Wisconsin Rapids
|
New
Page Corporation
|
|
Location
|
Principal Customer
|
|
International
|
|
|
Brazil,
Guaiba
|
Aracruz
Celulose S.A.
|
|
Brazil,
Jacarei
|
Ahlstrom-VCP
Industria de Papeis Especialis Ltda.
|
|
Brazil,
Luiz Antonio
|
International
Paper do Brasil Ltda.
|
|
Brazil,
Mucuri
|
Suzano
Papel e Celulose S. A.
|
|
Brazil,
Suzano
|
Suzano
Papel e Celulose S. A.
|
|
Canada,
St. Jerome, Quebec
|
Cascades
Fine Papers Group Inc.
|
|
Canada,
Windsor, Quebec
|
Domtar
Inc.
|
|
China,
Dagang 1
|
Gold
East Paper (Jiangsu) Company Ltd.
|
|
China,
Zhenjiang 1
|
Gold
East Paper (Jiangsu) Company Ltd.
|
|
China,
Suzhou1
|
Gold
HuaSheng Paper Company Ltd.
|
|
Finland,
Äänekoski
|
M-real
Corporation
|
|
Finland,
Anjalankoski
|
Myllykoski
Paper Oy
|
|
Finland,
Tervakoski
|
Trierenberg
Holding
|
|
France,
Alizay
|
M-real
Corporation
|
|
France,
Docelles
|
UPM
Corporation
|
|
France,
Saillat Sur Vienne
|
International
Paper Company
|
|
Germany,
Schongau
|
UPM
Corporation
|
|
India,
Ballarshah1
|
Ballarpur
Industries Ltd.
|
|
Indonesia,
Perawang1
|
PT
Indah Kiat Pulp and Paper Corporation
|
|
Japan,
Shiraoi1
|
Nippon
Paper Group Inc.
|
|
Malaysia,
Sipitang
|
Ballarpur
Industries Ltd.
|
|
Mexico,
Chihuahua
|
Copamex,
S.A. de C.V.
|
|
Poland,
Kwidzyn
|
International
Paper – Kwidzyn, S.A
|
|
Portugal,
Figueira da Foz1
|
Soporcel
- Sociedade Portuguesa de Papel, S.A.
|
|
Slovakia,
Ruzomberok
|
Mondi
Business Paper SCP
|
|
South
Africa, Merebank1
|
Mondi
Paper Company Ltd.
|
|
Thailand,
Namphong
|
Phoenix
Pulp & Paper Public Co. Ltd.
|
|
Thailand,
Tha Toom1
|
Advance
Agro Public Co. Ltd.
|
1 These
plants are owned through joint ventures.
2 The
Company expects to cease production at these facilities in the second quarter of
2010.
3 This
facility was idle in 2009.
The
Company also owned at December 31, 2009, 8 plants engaged in the mining,
processing and/or production of lime, limestone, precipitated calcium carbonate
and talc, and owned or leased 19 manufacturing facilities worldwide within the
Refractories segment. The Company's corporate headquarters, sales
offices, research laboratories, plants and other facilities are owned by the
Company except as otherwise noted. Set forth below is certain
information relating to the Company's plants and office and research
facilities:
|
Location
|
Facility
|
Product Line
|
|
United
States
|
||
|
Arizona,
Pima County
|
Plant;
Quarry1
|
Limestone
|
|
California,
Lucerne Valley
|
Plant;
Quarry
|
Limestone
|
|
Connecticut,
Canaan
|
Plant;
Quarry
|
Limestone,
Metallurgical Wire/Calcium
|
|
Indiana,
Portage
|
Plant
|
Refractories/Shapes
|
|
Louisiana,
Baton Rouge
|
Plant
|
Monolithic
Refractories
|
|
Massachusetts,
Adams
|
Plant;
Quarry
|
Limestone,
Lime, PCC
|
|
Montana,
Dillon
|
Plant;
Quarry
|
Talc
|
|
New
Jersey, Old Bridge
|
Plant
|
Monolithic
Refractories
|
|
New
York, New York
|
Headquarters2
|
All
Company Products
|
|
Ohio,
Bryan
|
Plant
|
Monolithic
Refractories
|
|
Ohio,
Dover
|
Plant
|
Monolithic
Refractories/Shapes
|
|
Pennsylvania,
Bethlehem
|
Administrative
Office; Research laboratories; Sales Offices
|
PCC,
Lime, Limestone, Talc
|
|
Pennsylvania,
Easton
|
Administrative
Office; Research laboratories; Plant; Sales Offices
|
All
Company Products
|
|
Pennsylvania,
Slippery Rock
|
Plant;
Sales Offices
|
Monolithic
Refractories/Shapes
|
|
Texas,
Bay City
|
Plant
|
Talc
|
|
International
|
||
|
Australia,
Carlingford
|
Sales
Office2
|
Monolithic
Refractories
|
|
Belgium,
Brussels
|
Sales
Office2/Administrative
Office
|
Monolithic
Refractories/PCC
|
|
Location
|
Facility
|
Product Line
|
|
Brazil,
Sao Jose dos Campos
|
Sales
Office2/Administrative
Office
|
PCC/Monolithic
Refractories
|
|
China,
Shanghai
|
Administrative
Office/Sales Office
|
PCC/Monolithic
Refractories
|
|
China,
Suzhou
|
Plant/Sales
Office/Research laboratories
|
Monolithic
Refractories/PCC
|
|
Finland,
Kaarina
|
Research
Laboratory2
|
PCC
|
|
Germany,
Duisburg
|
Plant/Sales
Office/Research laboratories
|
Laser
Scanning Instrumentation/ Probes/Monolithic
Refractories
|
|
Germany,
Walsum
|
Plant
|
PCC
|
|
Holland,
Hengelo
|
Plant/Sales
Office
|
Metallurgical
Wire
|
|
India,
Mumbai
|
Sales
Office
|
Monolithic
Refractories/Metallurgical
Wire
|
|
Ireland,
Cork
|
Plant;
Administrative Office2/
Research
laboratories
|
Monolithic
Refractories
|
|
Italy,
Brescia
|
Sales
Office; Plant
|
Monolithic
Refractories/Shapes
|
|
Japan,
Gamagori
|
Plant/Research
laboratories
|
Monolithic
Refractories/Shapes, Calcium
|
|
Japan,
Tokyo
|
Sales
Office
|
Monolithic
Refractories
|
|
Singapore
|
Sales
Office2
|
PCC
|
|
Spain,
Santander
|
Plant/Sales
Office2
|
Monolithic
Refractories
|
|
South
Africa, Pietermaritzburg
|
Plant/Sales
Office
|
Monolithic
Refractories
|
|
South
Korea, Seoul
|
Sales
Office2
|
Monolithic
Refractories
|
|
South
Korea, Yangsan
|
Plant3
|
Monolithic
Refractories
|
|
Turkey,
Gebzea
|
Plant/Research
Laboratories
|
Monolithic
Refractories/Shapes/ Application Equipment
|
|
Turkey,
Istanbul
|
Administrative
Office/Sales Office
|
Monolithic
Refractories
|
|
Turkey,
Kutahya
|
Plant
|
Monolithic
Refractories/Shapes
|
|
United
Kingdom, Lifford
|
Plant
|
PCC,
Lime
|
|
United
Kingdom, Rotherham
|
Plant/Sales
Office
|
Monolithic
Refractories/Shapes
|
|
1
|
This
plant is leased to another company.
|
|
2
|
Leased
by the Company. The facilities in Cork, Ireland, are operated
pursuant to a 99-year lease, the term of which commenced in
1963. The Company's headquarters in New York, New York, are
held under a lease which expires in 2010. The Company entered
into a new lease agreement for its corporate headquarters in New York, New
York which expires in 2021.
|
|
3
|
This
plant is owned through a joint
venture.
|
The
Company believes that its facilities, which are of varying ages and are of
different construction types, have been satisfactorily maintained, are in good
condition, are suitable for the Company's operations and generally provide
sufficient capacity to meet the Company's production
requirements. Based on past loss experience, the Company believes it
is adequately insured with respect to these assets and for liabilities likely to
arise from its operations.
Item
3. Legal Proceedings
Certain
of the Company's subsidiaries are among numerous defendants in a number of cases
seeking damages for exposure to silica or to asbestos-containing
materials. The Company currently has 305 pending silica cases and 26
pending asbestos cases. To date, 1,160 silica cases and 4 asbestos
cases have been dismissed. One silica case was dismissed in the fourth quarter
of 2009. Most of these claims do not provide adequate information to assess
their merits, the likelihood that the Company will be found liable, or the
magnitude of such liability, if any. Additional claims of this nature
may be made against the Company or its subsidiaries. At this time
management anticipates that the amount of the Company's liability, if any, and
the cost of defending such claims, will not have a material effect on its
financial position or results of operations.
The
Company has not settled any silica or asbestos lawsuits to date. We
are unable to state an amount or range of amounts claimed in any of the lawsuits
because state court pleading practices do not require identifying the amount of
the claimed damage. The aggregate cost to the Company for the legal
defense of these cases since inception was approximately $0.1 million, the
majority of which has been reimbursed by Pfizer Inc pursuant to the terms of
certain agreements entered into in connection with the Company's initial public
offering in 1992. Our experience has been that the Company is not
liable to plaintiffs in any of these lawsuits and the Company does not expect to
pay any settlements or jury verdicts in these lawsuits.
Environmental
Matters
On
April 9, 2003, the Connecticut Department of Environmental Protection ("DEP")
issued an administrative consent order relating to our Canaan, Connecticut,
plant where both our Refractories segment and Specialty Minerals segment have
operations. We agreed to the order, which includes provisions requiring
investigation and remediation of contamination associated with historic use of
polychlorinated biphenyls ("PCBs") at a portion of the site. The following is
the present status of the remediation efforts:
|
•
|
Building
Decontamination. We have completed the investigation of building
contamination and submitted a report characterizing the contamination. We
are awaiting review and approval of this report by the regulators. Based
on the results of this investigation, we believe that the contamination
may be adequately addressed by means of encapsulation through painting of
exposed surfaces, pursuant to the Environmental Protection Agency's
("EPA") regulations and have accrued such liabilities as discussed below.
However, this conclusion remains uncertain pending completion of the
phased remediation decision process required by the
regulations.
|
|
•
|
Groundwater. We
have completed investigations of potential groundwater contamination and
have submitted a report on the investigations finding that there is no PCB
contamination, but some oil contamination of the
groundwater. We expect the regulators to require confirmatory
long term groundwater monitoring at the site.
|
|
•
|
Soil. We have completed
the investigation of soil contamination and submitted a report
characterizing contamination to the regulators. Based on the results of
this investigation, we believe that the contamination may be left in place
and monitored, pursuant to a site-specific risk assessment, which is
underway. However, this conclusion is subject to completion of a phased
remediation decision process required by applicable regulations.
|
We
believe that the most likely form of remediation will be to leave existing
contamination in place, encapsulate it, and monitor the effectiveness of the
encapsulation.
We
estimate that the cost of the likely remediation above would approximate
$400,000, and that amount has been recorded as a liability on our books and
records.
The
Company is evaluating options for upgrading the wastewater treatment facilities
at its Adams, Massachusetts, plant. This work has been undertaken pursuant to an
administrative Consent Order originally issued by the Massachusetts Department
of Environmental Protection on June 18, 2002. This Order was amended on June 1,
2009. The amended order requires the installation of a groundwater
containment system by mid-year 2010. The amendment also includes the
investigation by January 1, 2022 of options for ensuring that the facility’s
wastewater treatment ponds will not result in unpermitted discharge to
groundwater. Additional requirements of the amendment include the
submittal by July 1, 2022 of a plan for closure of a historic lime solids
disposal area. Preliminary engineering reviews completed in 2005 indicate that
the estimated cost of wastewater treatment upgrades to operate this facility
beyond 2024 may be between $6 million and $8 million. The Company estimates that
the remaining remediation costs would approximate $400,000, which has been
accrued as of December 31, 2009.
The
Company and its subsidiaries are not party to any other material pending legal
proceedings, other than routine litigation incidental to their
businesses.
Item
4. Submission of Matters to a Vote of
Security Holders
No
matters were submitted to a vote of security holders during the fourth quarter
of 2009.
PART
II
Item
5. Market for Registrant's Common
Equity, Related Stockholder Matters and Issuer Purchases of
Securities
The
Company's common stock is traded on the New York Stock Exchange under the symbol
"MTX."
Information
on market prices and dividends is set forth below:
|
2009 Quarters
|
First
|
Second
|
Third
|
Fourth
|
|||||||
|
Market
Price Range Per Share of Common Stock
|
|||||||||||
|
High
|
$
|
42.10
|
$
|
42.82
|
$
|
50.87
|
$
|
56.39
|
|||
|
Low
|
26.76
|
31.41
|
35.87
|
45.85
|
|||||||
|
Close
|
32.05
|
36.78
|
47.52
|
54.47
|
|||||||
|
Dividends
paid per common
share
|
$
|
0.05
|
$
|
0.05
|
$
|
0.05
|
$
|
0.05
|
|||
|
2008 Quarters
|
First
|
Second
|
Third
|
Fourth
|
|||||||
|
Market
Price Range Per Share of Common Stock
|
|||||||||||
|
High
|
$
|
64.74
|
$
|
72.42
|
$
|
68.38
|
$
|
59.36
|
|||
|
Low
|
52.29
|
62.80
|
60.73
|
37.89
|
|||||||
|
Close
|
61.72
|
64.65
|
61.62
|
40.90
|
|||||||
|
Dividends
paid per common
share
|
$
|
0.05
|
$
|
0.05
|
$
|
0.05
|
$
|
0.05
|
|||
Equity
Compensation Plan Information
|
Plan
Category
|
Number
of securities to be issued upon exercise of outstanding
options
|
Weighted
average exercise price of outstanding options
|
Number
of securities remaining available for future issuance
|
|||||
|
Equity
compensation plans approved by security holders
|
787,530
|
$
|
52.54
|
1,034,125
|
||||
|
Equity
compensation plans not approved by security holders
|
--
|
--
|
--
|
|||||
|
Total
|
787,530
|
$
|
52.54
|
1,034,125
|
||||
Issuer
Purchases of Equity Securities
|
Period
|
Total
Number of Shares Purchased
|
Average
Price Paid Per Share
|
Total
Number of Shares Purchased as Part of the Publicly Announced
Program
|
Dollar
Value of Shares That May Yet be Purchased Under the
Program
|
|||||
|
September
28 - October 25
|
--
|
$
|
--
|
615,674
|
$
|
37,167,023
|
|||
|
October
26 - November 22
|
--
|
$
|
--
|
615,674
|
$
|
37,167,023
|
|||
|
November
23 - December 31
|
--
|
$
|
--
|
615,674
|
$
|
0
|
|||
|
Total
|
--
|
$
|
--
|
||||||
On
October 26, 2005, the Company's Board of Directors authorized the Company's
management, at its discretion, to repurchase up to $75 million in additional
shares over the next three-year period. As of December 31, 2008, the Company
repurchased 1,307,598 shares under this program at an average price of
approximately $57.36 per share. This program was completed in February
2008.
On
October 24, 2007, the Company's Board of Directors authorized the Company's
management to repurchase, at its discretion, up to $75 million of additional
shares over the next two-year period. As of December 31, 2009, 615,674 shares
have been purchased under this program at an average price of approximately
$61.45 per share. This program has expired as of December 31, 2009,
and $37.2 million of the authorized $75 million were not repurchased by the
Company.
On
February 22, 2010, the Company’s Board of Directors authorized the Company’s
management to repurchase, at its discretion, up to $75 million of additional
shares over the next two-year period.
On
January 27, 2010, the Company's Board of Directors declared a regular quarterly
dividend on its common stock of $0.05 per share. No dividend will be payable
unless declared by the Board and unless funds are legally available for payment
thereof.
On
February 5, 2010, the last reported sales price on the NYSE was $47.46 per
share. As of February 5, 2010, there were approximately 188 holders
of record of the common stock.
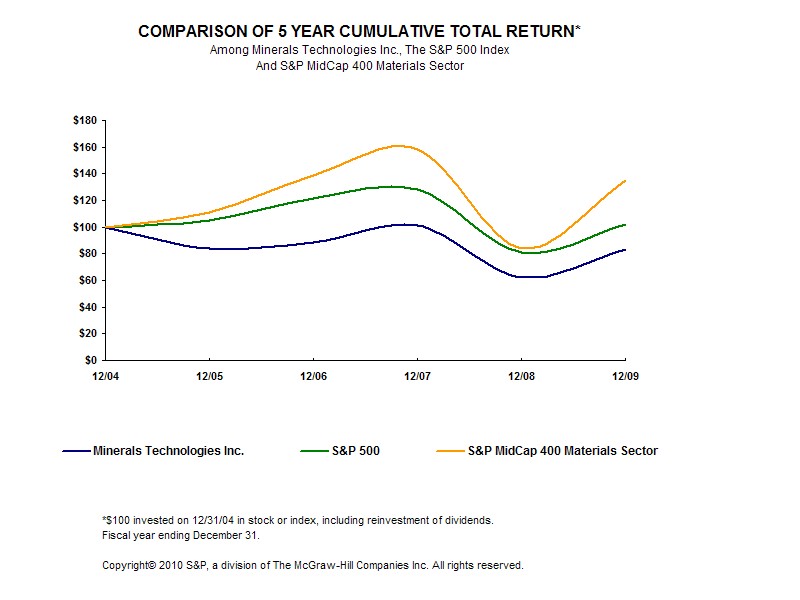
The graph
below matches the cumulative 5-year total return of holders of Minerals
Technologies Inc.'s common stock with the cumulative total returns of the
S&P 500 index and the S&P MidCap 400 Materials Sector index. The graph
assumes that the value of the investment in the company's common stock and in
each of the indexes (including reinvestment of dividends) was $100 on 12/31/2004
and tracks it through 12/31/2009.
|
12/04
|
12/05
|
12/06
|
12/07
|
12/08
|
12/09
|
||
|
Minerals
Technologies Inc.
|
100.00
|
84.07
|
88.76
|
101.39
|
62.13
|
83.15
|
|
|
S&P
500
|
100.00
|
104.91
|
121.48
|
128.16
|
80.74
|
102.11
|
|
|
S&P
MidCap 400 Materials Sector
|
100.00
|
110.68
|
138.49
|
158.15
|
83.98
|
134.88
|
|
The
stock price performance included in this graph is not necessarily indicative of
future stock price performance.
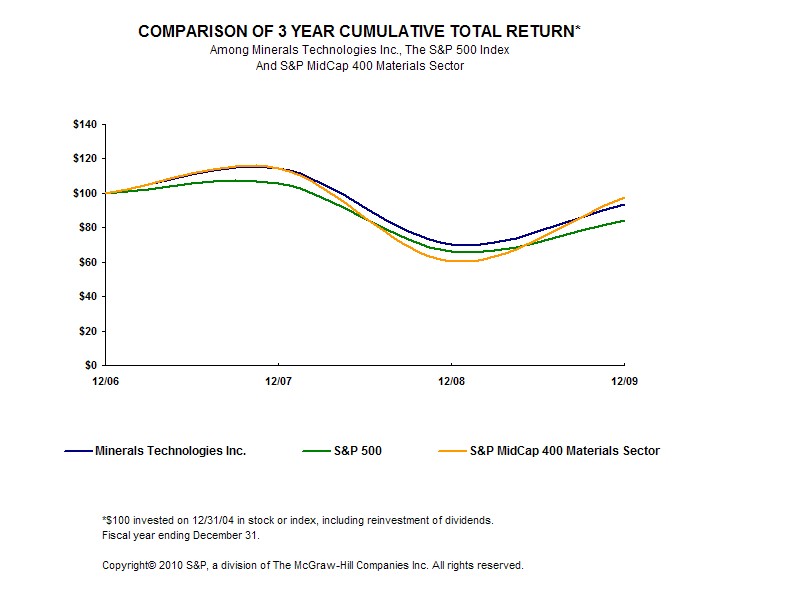
The
following graph compares the cumulative 3-year total return provided
shareholders of Minerals Technologies Inc.’s common stock relative to the
cumulative total returns of the S & P 500 index and the S&P MidCap 400
Materials Sector index. An investment of $100 (with reinvestment of all
dividends) is assumed to have been made in our common stock and in each of the
indices on 12/31/2006 and its relative performance is tracked through
12/31/09.
|
12/06
|
12/07
|
12/08
|
12/09
|
||
|
Minerals
Technologies Inc.
|
100.00
|
114.23
|
70.00
|
93.69
|
|
|
S&P
500
|
100.00
|
105.49
|
66.46
|
84.05
|
|
|
S&P
MidCap 400 Materials Sector
|
100.00
|
114.19
|
60.64
|
97.39
|
|
The
stock price performance included in this graph is not necessarily indicative of
future stock price performance.
It
Item 6. Selected Financial
Data
|
Dollars
in Millions, Except Per Share Data
|
|||||||||||||||
|
Income
Statement Data:
|
2009
|
2008
|
2007
|
2006
|
2005
|
||||||||||
|
Net
sales
|
$
|
907.3
|
$
|
1,112.2
|
$
|
1,077.7
|
$
|
1,023.5
|
$
|
956.8
|
|||||
|
Cost
of goods sold
|
751.5
|
891.7
|
845.1
|
798.7
|
744.0
|
||||||||||
|
Production
margin
|
155.8
|
220.5
|
232.6
|
224.8
|
212.8
|
||||||||||
|
Marketing
and administrative expenses
|
91.1
|
101.8
|
104.6
|
104.6
|
98.1
|
||||||||||
|
Research
and development expenses
|
19.9
|
23.1
|
26.3
|
27.8
|
27.0
|
||||||||||
|
Impairment
of assets
|
39.8
|
0.2
|
94.1
|
--
|
0.3
|
||||||||||
|
Restructuring
and other costs
|
22.0
|
13.4
|
16.0
|
--
|
--
|
||||||||||
|
Income
(loss) from operations
|
(17.0
|
)
|
82.0
|
(8.5
|
)
|
92.4
|
87.4
|
||||||||
|
Non-operating
income (deductions), net
|
(6.1
|
)
|
0.3
|
(3.0
|
)
|
(5.9
|
)
|
(3.9
|
)
|
||||||
|
Income
(loss) from continuing operations before
provision
for taxes on income
|
(23.1
|
)
|
82.3
|
(11.5
|
)
|
86.5
|
83.5
|
||||||||
|
Provision
(benefit) for taxes on income (loss)
|
(5.4
|
)
|
24.1
|
11.3
|
27.0
|
25.1
|
|||||||||
|
Income
(loss) from continuing operations
|
(17.7
|
)
|
58.2
|
(22.8
|
)
|
59.5
|
58.4
|
||||||||
|
Income
(loss) from discontinued operations, net of tax
|
(3.2
|
)
|
10.3
|
(37.8
|
)
|
(6.1
|
)
|
(3.4
|
)
|
||||||
|
Consolidated
net income (loss)
|
(20.9
|
)
|
68.5
|
(60.6
|
)
|
53.4
|
55.0
|
||||||||
|
Less:
Net income attributable to
|
|||||||||||||||
|
non-controlling
interests
|
(2.9
|
)
|
(3.2
|
)
|
(2.9
|
)
|
(3.4
|
)
|
(1.7
|
)
|
|||||
|
Net
income (loss) attributable to Minerals
|
|||||||||||||||
|
Technologies
Inc. (MTI)
|
$
|
(23.8
|
)
|
$
|
65.3
|
$
|
(63.5
|
)
|
$
|
50.0
|
$
|
53.3
|
|||
|
Earnings
Per Share
|
|||||||||||||||
|
Basic:
|
|||||||||||||||
|
Earnings
(loss) from continuing operations
|
|||||||||||||||
|
attributable
to MTI…………………………………..
|
$
|
(1.10
|
)
|
$
|
2.91
|
$
|
(1.34
|
)
|
$
|
2.86
|
$
|
2.78
|
|||
|
Earnings
(loss) from discontinued operations
|
|||||||||||||||
|
attributable
to MTI…………………………………..
|
(0.17
|
)
|
0.54
|
(1.97
|
)
|
(0.31
|
)
|
(0.16
|
)
|
||||||
|
Basic
earnings (loss) per share attributable to MTI
|
$
|
(1.27
|
)
|
$
|
3.45
|
$
|
(3.31
|
)
|
$
|
2.55
|
$
|
2.62
|
|||
|
Diluted:
|
|||||||||||||||
|
Earnings
(loss) from continuing operations
|
|||||||||||||||
|
attributable
to MTI…………………………………..
|
$
|
(1.10)
|
$
|
2.90
|
$
|
(1.34
|
)
|
$
|
2.84
|
$
|
2.75
|
||||
|
Earnings
(loss) from discontinued operations
|
|||||||||||||||
|
attributable
to MTI…………………………………..
|
(0.17)
|
0.54
|
(1.97
|
)
|
(0.31
|
)
|
(0.16
|
)
|
|||||||
|
Diluted
earnings (loss) per share attributable to MTI
|
$
|
(1.27)
|
$
|
3.44
|
$
|
(3.31
|
)
|
$
|
2.53
|
$
|
2.59
|
||||
|
Weighted
average number of common shares outstanding:
|
|||||||||||||||
|
Basic
|
18,724
|
18,893
|
19,190
|
19,600
|
20,345
|
||||||||||
|
Diluted
|
18,724
|
18,983
|
19,190
|
19,738
|
20,567
|
||||||||||
|
Dividends
declared per common share
|
$
|
0.20
|
$
|
0.20
|
$
|
0.20
|
$
|
0.20
|
$
|
0.20
|
|||||
|
Balance
Sheet Data:
|
|||||||||||||||
|
Working
capital
|
$
|
447.8
|
$
|
380.7
|
$
|
306.2
|
$
|
199.7
|
$
|
145.9
|
|||||
|
Total
assets
|
1,072.1
|
1,067.6
|
1,128.9
|
1,193.1
|
1,156.3
|
||||||||||
|
Long-term
debt
|
92.6
|
97.2
|
111.0
|
113.4
|
40.3
|
||||||||||
|
Total
debt
|
104.1
|
116.2
|
127.7
|
203.1
|
156.9
|
||||||||||
|
Total
shareholders' equity
|
747.7
|
734.8
|
773.3
|
770.9
|
788.6
|
Item
7. Management's Discussion and
Analysis of Financial Condition and Results of Operations
Income
and Expense Items as a Percentage of Net Sales
|
Year
Ended December 31,
|
2009
|
2008
|
2007
|
|||||
|
Net
sales
|
100.0
|
%
|
100.0
|
%
|
100.0
|
%
|
||
|
Cost
of goods
sold
|
82.8
|
80.2
|
78.4
|
|||||
|
Production
margin
|
17.2
|
19.8
|
21.6
|
|||||
|
Marketing
and administrative
expenses
|
10.1
|
9.1
|
9.7
|
|||||
|
Research
and development
expenses
|
2.2
|
2.1
|
2.4
|
|||||
|
Impairment
of
assets
|
4.4
|
--
|
8.8
|
|||||
|
Restructuring
charges
|
2.4
|
1.2
|
1.5
|
|||||
|
Income
(loss) from
operations
|
(1.9
|
)
|
7.4
|
(0.8
|
)
|
|||
|
Income
(loss) from continuing operations before
|
||||||||
|
provision(benefit)
for
taxes
|
(2.6
|
)
|
7.4
|
(1.1
|
)
|
|||
|
Provision
(benefit) for taxes on
income
|
(0.6
|
)
|
2.2
|
1.0
|
||||
|
Non-controlling
interests
|
0.3
|
0.3
|
0.3
|
|||||
|
Income
(loss) from continuing operations
|
(2.3
|
)
|
4.9
|
(2.4
|
)
|
|||
|
Income
(loss) from discontinued operations
|
(0.3
|
)
|
1.0
|
(3.5
|
)
|
|||
|
Net
income
(loss)
|
(2.6
|
)%
|
5.9
|
%
|
(5.9
|
)%
|
||
Executive
Summary
As
a result of the severe economic downturn and worldwide recession that
accelerated in the fourth quarter of 2008 and continued through most of 2009,
the Company’s results were significantly affected by weakness in the primary end
markets we serve – paper, steel, construction, and automotive. These
economic conditions caused a significant decrease in the demand for our
products, as volumes declined in all businesses. Beginning in the
fourth quarter of 2008, the Company responded quickly to the downturn in
economic activity by establishing additional procedures to generate and conserve
its cash and reduce costs by curtailing production through shortened work
schedules, continuing its intensive expense control initiatives, and suspending
its stock buyback program. In the second quarter of 2009, as a result of the
continuation of the severe downturn in the worldwide steel industry, the Company
initiated a restructuring program to improve efficiencies through the
consolidation and rationalization of certain manufacturing operations and
through a further reduction of overhead costs. As a result, the
Company recorded an impairment of assets charge of $37.5 million, restructuring
charges of $10.2 million related to this realignment and pension settlement
charges of $9.4 million in the second half of 2009. Volume declines
as compared with prior year, however, more than offset the benefits derived from
our announced restructuring programs and overall expense reduction
initiatives.
As
part of the restructuring program, the Company will consolidate its Old Bridge,
New Jersey, operation into Bryan, Ohio, and Baton Rouge, Louisiana, in order to
improve operational efficiencies and reduce logistics for key raw
materials, resulting in an impairment of assets charge of $4.3
million; rationalize its North American specialty shapes product line resulting
in an impairment of assets charge of $1.5 million; rationalize some of its
European operations resulting in an impairment of assets charge of $2.2 million;
record further impairment charges of $10.0 million related to its Asian
refractory operations and actively seek a regional alliance to aid in marketing
its high value product. In addition, we recognized impairment charges for
refractory application equipment in North America of $3.7 million and Europe of
$3.3 million due to customer underutilized assets under depressed volume
conditions; an impairment of $6.5 million related to the Company's PCC facility
in Millinocket, Maine, which has been idle since September 2008 and where the
start-up of the satellite facility became unlikely. The Company will
also reduce its current workforce by approximately 200 employees related to the
plant consolidations as well as the streamlining of corporate and divisional
management structures to operate more efficiently through the current economic
environment. This realignment allowed the Company to better position itself
strategically for improved profitability as the economy recovers.
In
October 2009, Domtar Corporation announced its intention to cease production of
paper grades requiring PCC at its Plymouth, North Carolina, paper mill and
International Paper announced the closure of its Franklin, Virginia,
mill. The Company has satellite PCC facilities at these paper mills
and we expect these satellites to cease production in the second quarter of
2010. As a result, an impairment of assets charge of $2.0 million was
recorded in the fourth quarter. We expect that these events will have a negative
impact on our operating performance in 2010. Combined sales for these
facilities in 2009 were $11.5 million.
Worldwide
net sales for 2009 were $ 907.3 million, a decline of 18% from 2008 sales of
$1.112 billion. Foreign exchange had an unfavorable impact on sales of
approximately $29 million, or 3 percentage points of the decline. Loss from
operations was $17.1 million in 2009 as compared with income from operations of
$82.0 million in the prior year. Included in the operating loss in 2009 were
restructuring charges of $22.0 million and impairment charges of $39.8 million,
respectively. Included in the operating income of the prior year were
restructuring costs of $13.4 million and an impairment of assets charge of $0.2
million.
Loss
from continuing operations was $17.8 million as compared with income of $58.2
million in the prior year due to the aforementioned restructuring charges as
well as the impact of the downturn in the economy. Loss from discontinued
operations was $3.2 million in 2009 as compared with income from discontinued
operations of $10.3 million in the previous year. In 2009, an impairment of
assets charge was recorded in discontinued operations to reflect the lower
market value of the Mt. Vernon, Indiana, facility. In 2008, the
Company recorded gains of $13.7 million from the sale of four idle facilities
previously written down. Net loss for the year was $23.8 million as compared
with net income of $65.3 million in the prior year.
The
Company's balance sheet as of December 31, 2009 continues to be very strong.
Cash, cash equivalents and short-term investments at December 31, 2009 were more
than $319 million. In addition, we have available lines of credit of $186
million, our debt to equity ratio was very low at 12%, and our current ratio was
3.9. Our cash flows from operations were in excess of $160 million in
2009.
The
Company, and each of its reporting segments, achieved a dramatically improved
performance in the second half of 2009 versus the first half of 2009 as the
industries we serve continued to contract in the first half but began to
stabilize and even increase slightly in the second half. In addition
to an increase in volumes from improved market conditions in the second half,
the Company also began to realize the benefits of the restructuring program
initiated in the second quarter of 2009. The Company's production margin
increased from $66 million in the first half of 2009 to $90 million in the
second half, an improvement of 37%. Sales increased $74 million in
the second half, an improvement of 18%, due to higher volumes. The
Specialty Minerals Segment production margin improved from $50 million in the
first half to $64 million in the second half, an increase of 27% on a 13%
increase in sales. The Refractories segment production margin improved from $16
million in the first half to $27 million in the second half, an increase of 70%
as sales increased $37 million or 30%.
Although
there have been signs of economic recovery beginning in the third quarter of
2009 and continuing into the fourth quarter, there remains uncertainty as to the
long-term sustainability of this market upturn and of the health of the overall
economy. The Company feels, however, that due to our strong balance
sheet, cash flow, and benefits derived as a result of the restructuring
initiatives undertaken in 2007 and 2008, coupled with the realignment of our
operations in the second quarter of 2009, the Company is well positioned to
achieve sustainable profitable growth as and when the economy
recovers.
We
face some significant risks and challenges in the future:
|
·
|
Our
global business could continue to be adversely affected by decreases in
economic activity.
· North
American and European steel production in 2009 was approximately 31% below
production levels in 2008.
· In
the paper industry, production levels for printing and writing papers
within North America and Europe, our two largest markets, were down 18% as
compared with prior year.
· Housing
starts in 2009 were at a rate of approximately 550 thousand units, down
38% from prior year. Housing starts were at a peak rate of 2.1
million units in 2005. In the automotive industry, North
American car and truck production was down 32% in 2009 as compared with
2008.
|
|
·
|
The
availability of credit in the financial markets could adversely affect the
ability of our customers and/or our suppliers to obtain
financing.
|
|
·
|
The
industries we serve, primarily paper, steel, construction and automotive,
have been adversely affected by the global economic
climate. Some of our customers may experience further
consolidations and shutdowns or may face increased liquidity issues, which
could deteriorate the aging of our accounts receivable, increase our bad
debt exposure and possibly trigger impairment of assets or realignment of
our businesses.
|
|
·
|
Consolidations
in the paper and steel industries concentrate purchasing power in the
hands of fewer customers, increasing pricing pressure on suppliers such as
Minerals Technologies Inc.
|
|
·
|
Most
of our Paper PCC sales are subject to long-term contracts that may be
terminated pursuant to their terms, or may be renewed on terms less
favorable to us.
|
|
·
|
Our
filler-fiber composite technology continues in development through
customer trials, but has yet to be proven on a long-term commercial
scale.
|
|
·
|
We
are subject to volatility in pricing and supply availability of our key
raw materials used in our Paper PCC product line and Refractory product
line. Our ability to recover increased costs is uncertain and may become
more difficult in this economic environment.
|
|
·
|
We
continue to rely on China for a significant portion of our supply of
magnesium oxide in the Refractories segment which may be subject to
uncertainty in availability and cost.
|
|
·
|
Fluctuations
in energy costs have an impact on all of our
businesses.
|
|
·
|
Changes
in the fair market value of our pension assets, rates of return on assets,
and discount rates could have a significant impact on our net periodic
pension costs as well as our funding requirements.
|
|
·
|
As
we expand our operations abroad we face the inherent risks of doing
business in many foreign countries, including foreign exchange risk,
import and export restrictions, and security concerns.
|
|
·
|
The
Company’s operations, particularly in the mining and environmental areas
(discharges, emissions and greenhouse gases), are subject to regulation by
federal, state and foreign authorities and may be subject to, and
presumably will be required to comply with, additional laws, regulations
and guidelines which may be adopted in the
future.
|
The
Company will continue to focus on innovation and new product development and
other opportunities for continued growth as follows:
|
·
|
Development
of the filler-fiber composite program, which continues to undergo
large-scale paper machine trials, to increase the fill-rate for uncoated
freesheet paper.
|
|
·
|
Increasing
our sales of PCC for paper by further penetration of the markets for paper
filling at both freesheet and groundwood mills, particularly in emerging
markets.
|
|
·
|
Further
growth of the Company's PCC coating product line using the satellite
model.
|
|
·
|
Leverage
the Company's expertise in crystal engineering, especially in helping
papermakers customize PCC morphologies for specific paper
applications.
|
|
·
|
Development
of unique calcium carbonates used in the manufacture of novel biopolymers,
a new market opportunity.
|
|
·
|
Rapid
deployment of value-added formulations of refractory materials that not
only reduce costs but improve performance.
|
|
·
|
Continuing
our penetration in emerging markets.
|
|
·
|
Further
growth of PCC produced for paper filling applications by working with
industry partners to develop new methods to increase the ratio of PCC for
fiber substitutions.
|
|
·
|
Further
proliferation of operational excellence principles into all aspects of the
organization, including system infrastructure and lean
principles.
|
|
·
|
Explore
selective acquisitions to fit our core competencies in minerals and fine
particle technology.
|
However,
there can be no assurance that we will achieve success in implementing any one
or more of these opportunities.
Results
of Operations
Sales
(Dollars
in millions)
|
Net
Sales
|
2009
|
%
of
Total
Sales
|
Growth
|
2008
|
%
of Total Sales
|
Growth
|
2007
|
%
of Total Sales
|
|||||||||||||||
|
U.S.
|
$
|
478.4
|
52.7
|
%
|
(18)
|
%
|
$
|
586.5
|
52.8
|
%
|
1
|
%
|
$
|
581.9
|
54.0
|
%
|
|||||||
|
International
|
428.9
|
47.3
|
%
|
(18)
|
%
|
525.7
|
47.2
|
%
|
6
|
%
|
495.8
|
46.0
|
%
|
||||||||||
|
Net
sales
|
$
|
907.3
|
100.0
|
%
|
(18)
|
%
|
$
|
1,112.2
|
100.0
|
%
|
3
|
%
|
$
|
1,077.7
|
100.0
|
%
|
|||||||
|
Paper
PCC
|
$
|
484.6
|
53.4
|
%
|
(11)
|
%
|
$
|
547.2
|
49.2
|
%
|
1
|
%
|
$
|
542.0
|
50.3
|
%
|
|||||||
|
Specialty
PCC
|
50.1
|
5.6
|
%
|
(14)
|
%
|
58.5
|
5.3
|
%
|
(3)
|
%
|
60.6
|
5.6
|
%
|
||||||||||
|
PCC
Products
|
$
|
534.7
|
59.0
|
%
|
(12)
|
%
|
$
|
605.7
|
54.5
|
%
|
1
|
%
|
$
|
602.6
|
55.9
|
%
|
|||||||
|
Talc
|
$
|
32.3
|
3.5
|
%
|
(10)
|
%
|
$
|
35.9
|
3.2
|
%
|
(4)
|
%
|
$
|
37.3
|
3.5
|
%
|
|||||||
|
GCC
|
61.4
|
6.8
|
%
|
(18)
|
%
|
74.8
|
6.7
|
%
|
(2)
|
%
|
76.7
|
7.1
|
%
|
||||||||||
|
Processed
Minerals Products
|
$
|
93.7
|
10.3
|
%
|
(15)
|
%
|
$
|
110.7
|
9.9
|
%
|
(3)
|
%
|
$
|
114.0
|
10.6
|
%
|
|||||||
|
Specialty
Minerals Segment
|
$
|
628.4
|
69.3
|
%
|
(12)
|
%
|
$
|
716.4
|
64.4
|
%
|
--
|
%
|
$
|
716.6
|
66.5
|
%
|
|||||||
|
Refractory
Products
|
$
|
225.4
|
24.8
|
%
|
(30)
|
%
|
$
|
320.8
|
28.9
|
%
|
10
|
%
|
$
|
290.5
|
27.0
|
%
|
|||||||
|
Metallurgical
Products
|
53.5
|
5.9
|
%
|
(29)
|
%
|
75.0
|
6.7
|
%
|
6
|
%
|
70.6
|
6.5
|
%
|
||||||||||
|
Refractories
Segment
|
$
|
278.9
|
30.7
|
%
|
(30)
|
%
|
$
|
395.8
|
35.6
|
%
|
10
|
%
|
$
|
361.1
|
33.5
|
%
|
|||||||
|
Net
sales
|
$
|
907.3
|
100.0
|
%
|
(18)
|
%
|
$
|
1,112.2
|
100.0
|
%
|
3
|
%
|
$
|
1,077.7
|
100.0
|
%
|
Worldwide
net sales in 2009 decreased 18% from the previous year to $907.3
million. Foreign exchange had an unfavorable impact on sales of $28.6
million or 3 percentage points of the decline. Sales in the Specialty
Minerals segment, which includes the PCC and Processed Minerals product lines,
decreased 12% to $628.4 million from $716.4 million for the same period in
2008. Sales in the Refractories segment declined 30% from the
previous year to $278.9 million. In 2008, worldwide net sales
increased 3% to $1.112 billion from $1.078 billion in the prior
year. In 2008, Specialty Minerals segment sales remained flat and
Refractories segment sales increased approximately 10% from 2007.
In
2009, worldwide net sales of PCC, which is primarily used in the manufacturing
process of the paper industry, decreased 12% to $534.7 million from $605.7
million in the prior year. Foreign exchange had an unfavorable impact on sales
of approximately $21.2 million or 4 percentage points of the decline. Worldwide
net sales of Paper PCC decreased 11% to $484.6 million from $547.2 million in
the prior year. Total Paper PCC volumes declined 11% from prior year levels with
volume declines in all regions except Latin America. Volume declines
of approximately $65.0 million were partially offset by approximately $19.0
million in contractual price increases. Approximately $17.0 million,
or 3% of the decline, was due to the effects of foreign exchange. Sales of
Specialty PCC declined 14% to $50.1 million from $58.5 million in 2008. This
decrease was primarily attributable to lower volumes of
approximately
$6.0 million and an unfavorable impact of foreign exchange of $4.2 million,
partially offset by price increases of $1.9 million.
In
2008, worldwide net sales of PCC increased 1% to $605.7 million from $602.6
million in the prior year. Net sales of Paper PCC increased 1% to $547.2 million
while Paper PCC volumes declined 4% from 2007 levels. This decline in
volumes was offset by increased selling prices from the pass through of raw
material cost increases and to foreign currency. Sales of Specialty PCC declined
3% in 2007 to $58.5 million from $60.6 million in the prior year. This decline
was primarily attributable to lower volumes.
Net
sales of Processed Minerals products in 2009 decreased 15% to $93.7 million from
$110.7 million in 2008. GCC products and talc products decreased 18% and 10% to
$61.4 million and $32.3 million, respectively. The decrease in the Processed
Minerals product line was attributable to further weakness in the residential
and commercial construction markets as well as the automotive market. As a
result, volumes have declined 17% from the prior year.
Net
sales of Processed Minerals products in 2008 decreased 3% to $110.7 million from
$114.0 million in 2007. This decrease was primarily attributable to weakness in
the residential construction and automotive markets.
Net
sales in the Refractories segment in 2009 decreased 30% to $278.9 million from
$395.8 million in the prior year. Foreign exchange had an unfavorable impact on
sales of $7.3 million, or 2 percentage points of the decline. This
segment has been affected negatively by the significant downturn in the global
steel production which accelerated in the fourth quarter of 2008 and continued
through the first three quarters of 2009. The markets showed some
signs of stabilization in the fourth quarter of 2009. Sales of
refractory products and systems to steel and other industrial applications
decreased 30% to $225.4 million, from $320.8 million. Volumes
declined approximately 32% as compared with prior year. Sales of
metallurgical products within the Refractories segment decreased 29% to $53.5
million from $75.0 million in the prior year on volume declines of
25%.
Net
sales in the Refractories segment in 2008 increased 10% to $395.8 million from
$361.1 million in the prior year. This segment was positively affected by
increased selling prices necessitated by significant raw material increases,
which more than offset volume declines, and to the favorable effects of foreign
currency of $9.4 million or 3 percentage points of growth. Sales of
refractory products and systems to steel and other industrial applications
increased 10% to $320.8 million in 2008 from $290.5 million in the prior
year. Volumes declined 7% for the full year but were down 27% during
the fourth quarter of 2008. Sales of metallurgical products within
the Refractories segment increased 6% to $75.0 million from $70.6 million in
2007. This increase was primarily attributable to slightly higher
volumes and favorable product mix, particularly in North America.
Net
sales in the United States decreased approximately 18% to $478.4 million in 2009
and represented approximately 52.7% of consolidated net sales. International
sales decreased approximately 18% to $428.9 million, due to lower worldwide
volumes and the effects of foreign currency.
Operating
Costs and Expenses
(Dollars
in millions)
|
2009
|
Growth
|
2008
|
Growth
|
2007
|
|||||||||||||||
|
Cost
of goods
sold
|
$
|
751.5
|
(16%)
|
%
|
$
|
891.7
|
6
|
%
|
$
|
845.1
|
|||||||||
|
Marketing
and
administrative
|
$
|
91.1
|
(11%)
|
%
|
$
|
101.8
|
(3)
|
%
|
$
|
104.6
|
|||||||||
|
Research
and
development
|
$
|
19.9
|
(14%)
|
%
|
$
|
23.1
|
(13)
|
%
|
$
|
26.3
|
|||||||||
|
Impairment
of
assets
|
$
|
39.8
|
*
|
%
|
$
|
0.2
|
*
|
%
|
$
|
94.1
|
|||||||||
|
Restructuring
charges
|
$
|
22.0
|
64%
|
%
|
$
|
13.4
|
(17)
|
%
|
$
|
16.0
|
* Percentage not
meaningful
Cost
of goods sold in 2009 was 82.8% of sales compared with 80.2% in the prior
year. Our cost of goods sold declined 16% as compared with 18% lower
sales resulting in a 29% decrease in production margin. This reduction was
attributable to lower volumes in all product lines related to the weak market
conditions experienced in 2009. This was partially offset by expense
savings through cost reduction initiatives and the benefits derived from our
restructuring programs. In the Specialty Minerals segment, production
margin decreased 12%, or $14.9 million from the prior year. This is
attributable to lower volumes of $26 million in both the PCC and Processed
Minerals product lines, as a result of market conditions as well as permanent
and temporary shutdowns in the Paper PCC product line. This was
partially offset by manufacturing and expense cost savings of $6 million and the
benefits derived from our restructuring programs of approximately $4
million. In the Refractories segment, production margin declined 54%,
or $49.7 million from 2008. This was attributable to volume decreases
of $53 million. This was partially offset by cost and expense savings
of $3 million and the benefits derived from our restructuring programs of $5
million.
Cost
of goods sold in 2008 was 80.2% of sales compared with 78.4% in the prior
year. Our cost of goods sold grew 6%, compared with 3% sales growth
resulting in a 5% decrease in production margin. In the Specialty Minerals
segment, the production margin decreased 9% as compared with a relatively flat
sales growth. This segment had been affected by increased raw materials and
energy costs of $24 million, lower volumes in the Processed Minerals and the
Paper PCC product lines of $20 million and price concessions in the Paper PCC
product line of $5 million. This was partially offset by the recovery
of raw material costs through price increases of
$16
million, the benefits of the restructuring program of $17 million and
manufacturing cost savings initiatives of $6 million In the Refractories
segment, the production margin increased 1% as compared with 10% sales growth.
This segment has been affected by increased raw material costs of $34 million
and lower volumes of $2 million, partially offset by price increases of $31
million and the benefits of the restructuring program of $3
million.
Marketing
and administrative costs declined 11% to $91.1 million in 2009, compared to
$101.8 million in the prior year, and represented 10.1% of net sales as compared
with 9.1% in the prior year. This reduction was due to the benefits of the
restructuring program and other cost saving initiatives. In 2008, marketing and
administrative expenses were 3% lower than in the prior year.
Research
and development expenses decreased 14% in 2009 to $19.9 million and represented
2.2% of net sales. This decline was attributable to the reduction of Paper PCC
trial costs through lower pricing, timing of trial activity, and to operating
efficiencies achieved through our cost savings initiatives. In 2008, research
and development expense also decreased 13% to $23.1 million and represented 2.1%
of net sales.
The
Company recorded restructuring charges of $22.0 million and impairment of assets
charges of $39.8 million in 2009. Approximately $9.4 million of the
restructuring charge relates to a pension settlement loss in our defined benefit
plan in the United States. The remainder of the charge relates to
provisions for severance and other employee benefits as part of our
restructuring program initiated in the second quarter of 2009 as well as
additional charges for our restructuring programs initiated in 2007 and
2008.
Restructuring
and other costs (2007 program):
In
the third quarter of 2007, the Company initiated a plan to realign its business
operations to improve profitability and increase shareholder
value. The realignment consisted of exiting certain businesses and
consolidating some product lines to better position the Company for future
success by focusing on the Company's core strengths. Major components
of this realignment included exiting certain product lines which are reflected
in discontinued operations, modification of the PCC coating product line from a
merchant business model to a satellite business model, consolidation of certain
manufacturing facilities and the write down of other underutilized assets
worldwide. In addition, as part of this program, the Company
initiated a plan to reduce its workforce by approximately 7 percent to better
control operating expenses and improve efficiencies.
This
realignment resulted in impairment of assets charges from continuing operations
in 2007 as follows:
(millions of dollars)
|
Paper
PCC
|
$
|
65.3
|
|||
|
Specialty
PCC
|
12.7
|
||||
|
Total
PCC
|
78.0
|
||||
|
Processed
Minerals
|
1.3
|
||||
|
|
Specialty
Minerals Segment
|
79.3
|
|||
|
Refractories
Segment
|
14.8
|
||||
|
$
|
94.1
|
||||
The
Company realized, beginning in the fourth quarter of 2007, annualized pre-tax
depreciation savings of approximately $10 million related to the writedown of
fixed assets, which, were included in income from continuing
operations.
The
Company also incurred impairment of assets charges from discontinued operations
of approximately $46.9 million and realized, beginning in the fourth
quarter of 2007, annualized pre-tax depreciation savings of approximately $3.2
million related to the writedown of fixed assets.
Restructuring
costs incurred in 2009, 2008 and 2007 relating to the 2007 restructuring program
were as follows:
| (millions of dollars) |
2009
|
2008
|
2007
|
|||
|
Severance
and other employee
benefits
|
$
|
--
|
$
|
2.2
|
$
|
13.5
|
|
Contract
termination
costs
|
--
|
--
|
1.8
|
|||
|
Pension
settlement
costs
|
--
|
6.8
|
--
|
|||
|
Other
exit
costs
|
--
|
0.5
|
0.7
|
|||
|
$
|
--
|
$
|
9.5
|
$
|
16.0
|
The
Company expected incremental savings in 2009 of $2 million from this program
over 2008, of which $1.8 million were realized. The total savings was
approximately $12.8 million from this program, of which we realized savings of
$11 million in 2008 and $1.8 million of additional savings in
2009. This program has been completed. Approximately $1.6
million and $12.9 million in severance payments were paid in 2009 and 2008,
respectively. A restructuring liability of $1.7 million remains at
December 31, 2009. Such amounts will be funded from operating cash
flows.
The
Company also incurred restructuring costs from discontinued operations of
approximately $2.3 million relating to the 2007 restructuring program. The
Company realized approximately $2.0 million in pre-tax cost savings in 2008 as a
result of lower compensation and related expenses from this
program.
Restructuring
and other costs (2008 program):
In
the fourth quarter of 2008, as a result of the worldwide economic downturn and
the resulting impact on the Company's sales and operating profits, the Company
initiated an additional restructuring program by reducing its workforce by
approximately 14% through a combination of permanent reductions and temporary
layoffs. The Company recorded a charge of $3.9 million in the fourth quarter of
2008 associated with this program. Additional charges were recorded in 2009
associated with this program.
Restructuring
costs incurred in 2009 and 2008 relating to the 2008 restructuring program were
as follows:
| (millions of dollars) |
2009
|
2008
|
||
|
Severance
and other employee
benefits
|
$
|
0.9
|
$
|
3.9
|
|
Other
exit
costs
|
0.1
|
--
|
||
|
$
|
1.0
|
$
|
3.9
|
The
Company expected annualized savings of between $6 million to $8 million as it
relates to this program in 2009. The Company realized compensation
and related expense savings of approximately $9.1 million in
2009. Approximately $4.2 million in severance payments were paid in
2009. A restructuring liability of $0.1 million remains at December
31, 2009 and will be funded from cash flow from operations. This
program has been completed.
Restructuring
and other costs (2009 program):
In
the second quarter of 2009, as a result of the continuation of the severe
downturn in the worldwide steel industry, the Company initiated a restructuring
program, primarily in the Refractories segment, to improve efficiencies through
consolidation of manufacturing operations and reduction of costs. This
realignment resulted in impairment of asset charges and restructuring charges in
the second quarter of 2009 of $37.5 million and $8.9 million,
respectively.
Restructuring
costs incurred in 2009 related to the 2009 restructuring program were as
follows:
|
(millions
of dollars)
|
2009
|
|||
|
Severance
and other employee
benefits
|
$
|
10.1
|
||
|
Contract
termination
costs
|
0.4
|
|||
|
Pension
settlement
costs
|
9.4
|
|||
|
Other
exit
costs
|
0.2
|
|||
|
$
|
20.1
|
|||
As
a result of the workforce reduction associated with the restructuring program
and the related distribution of benefits, included in restructuring costs for
2009 are non-cash pension settlement costs of $9.4 million for some of our
pension plans in the U.S.
The restructuring program reduced the
workforce by approximately 200 employees worldwide. This reduction in
force related to plant consolidations as well as a streamlining of corporate and
divisional management structures to operate more efficiently. The
Company expects to realize annualized pre-tax cost savings of approximately $16
million to $20 million upon completion of the program, of which $10 million
relates to lower compensation and related expenses and $5 million relates to
annualized pre-tax depreciation savings on the write-down of fixed assets. The
Company realized compensation and related expense savings of approximately $6.5
million in 2009, which was as expected. Approximately $5.1 million in severance
payments were paid in 2009. The Company expects to pay the remaining $5.1
million liability by the second half of 2010. The payments will be
funded from operating cash flows.
The
Company recorded an impairment of assets charge of $37.5 million in the second
quarter of 2009 as a result of this realignment. Major components of
this realignment, which is primarily in the Refractories segment, are as
follows:
Americas
Refractories
|
·
|
The
Company will consolidate its refractory operations at Old Bridge, New
Jersey, into its facilities in Bryan, Ohio, and Baton Rouge, Louisiana,
thereby improving operating efficiencies and reducing logistics for key
raw materials. The Company recorded an impairment charge of
$4.3 million for this facility.
|
|
·
|
The
Company will rationalize its North American specialty shapes product line
and recorded an impairment charge of $1.5 million.
|
|
·
|
The
Company also recorded an impairment of assets charge of $3.7 million for
refractory application equipment as a result of underutilized assets at
customer locations under depressed volume
conditions.
|
Asia
Refractories
|
·
|
The
Company recorded impairment charges of $10.0 million for its Asian
refractory operations as a result of continued difficulties in market
penetration from its Chinese and other Asian manufacturing facilities. To
take advantage of its strong technological capability in refractories, the
Company will consolidate its Asian operations and actively seek a regional
alliance to aid in the marketing of its high value
products.
|
Europe
Refractories
|
·
|
The
Company rationalized some of its European operations and recorded an
impairment of assets charge of $2.2 million.
|
|
·
|
The
Company also recorded an impairment of assets charge of $3.3 million for
refractory application equipment as a result of underutilized assets at
customer locations experiencing depressed volume conditions.
|
|
·
|
The
Company recorded an impairment of assets charge of $6.0 million for
certain intangible assets from its 2006 acquisition of a business in
Turkey.
|
North
America Paper PCC
|
·
|
In
the Paper PCC business, the Company recorded an impairment of asset charge
of $6.5 million relating to its satellite PCC facility in Millinocket,
Maine. This facility has been idle since September 2008 when
the host paper company indefinitely shut one of its paper machines due to
rising operational costs. The potential for the startup of our satellite
at this facility is unlikely.
|
Other
Assets
|
·
|
In
addition, the Company recorded impairment charges of $5.6 million to
recognize the lower market value of its Mt. Vernon, Indiana, operation,
which had been held for sale since October of 2007 and was included in
discontinued operations. This business was sold in the fourth
quarter of 2009.
|
The
remaining carrying value of the impaired assets was determined by estimating
marketplace participant views of the discounted cash flows of the asset groups
and, in the case of tangible assets, by estimating the market value of the
assets, which due to the specialized and limited use nature of our equipment, is
primarily driven by the value of the real estate. As the estimated
discounted cash flows were determined to be negative under multiple scenarios,
the highest and best use of the tangible asset groups was determined to be a
sale of the underlying real estate. The fair value of the significant real
estate holdings was based on independent appraisals.
The
Company realized, beginning in the third quarter of 2009, annualized pre-tax
depreciation savings of approximately $5 million related to the write-down of
fixed assets, of which approximately $2.4 million was recognized in depreciation
savings in 2009.
In
the fourth quarter of 2009, the Company recorded an impairment of assets charge
of $2.0 million and contract termination costs of $0.9 million for its satellite
facility at Franklin, Virginia due to the announced closure of the host mill at
that location.
|
Income
(Loss) from Operations
(Dollars
in millions)
|
2009
|
Growth
|
2008
|
Growth
|
2007
|
||||||||||||
|
Income
(loss) from
operations
|
$
|
(17.0)
|
*
|
%
|
$
|
82.0
|
*
|
%
|
$
|
(8.5)
|
|||||||
* Percentage not
meaningful
The
Company recorded a loss from operations in 2009 of $17.0 million as compared
with income from operations of $82.0 million in the prior year. Included in the
2009 income from operations were restructuring charges of $22.0 million and an
impairment of assets charge of $39.8 million.
The
Specialty Minerals segment recorded income from operations in 2009 of $34.2
million, a 40% decline from $57.0 million in the prior year. Included in income
from operations was an impairment of assets charge of $8.5 million and
restructuring and other exit costs of $11.5 million.
The
Refractories segment recorded a loss from operations of $48.8 million in 2009 as
compared with income from operations of $26.3 million in the prior year.
Included in income from operations were restructuring charges of $10.5 million
and an impairment of assets charge of $31.3 million.
In
2008, the Specialty Minerals segment recorded income from operations of $57.0
million as compared with a loss of $20 million in 2007. The Refractories segment
recorded operating income in 2008 of $26.3 million as compared with $11.5
million in the previous year.
|
Non-Operating
Income (Deductions)
(Dollars
in millions)
|
2009
|
Growth
|
2008
|
Growth
|
2007
|
||||||||||||
|
Non-operating
income (deductions), net
|
$
|
(6.1)
|
*
|
%
|
$
|
0.3
|
*
|
%
|
$
|
(3.0)
|
|||||||
* Percentage not
meaningful
The
Company recorded non-operating loss of $6.1 million in 2009 as compared with
non-operating income of $0.3 million in the prior year. Included in
net non-operating deductions in 2009 were foreign currency translation losses of
$2.3 million recognized upon the Company’s liquidation of its plant in Gomez
Palacio, Mexico. The remaining increase in non-operating deductions
as compared with prior year is primarily related to foreign exchange losses in
the current year as compared to foreign exchange gains in the prior
year.
The
Company recorded non-operating income of $0.3 million in 2008 as compared with
non-operating deductions of $3.0 million in the prior year. This
increase was primarily attributable to lower interest expense due to lower
interest rates and debt levels, higher interest income generated in connection
with increased cash on hand and foreign exchange gains.
|
Provision
(Benefit) for Taxes on Income
(Dollars
in millions)
|
2009
|
Growth
|
2008
|
Growth
|
2007
|
||||||||||||
|
Provision
for taxes on
income
|
$
|
(5.4)
|
*
|
%
|
$
|
24.1
|
114
|
%
|
$
|
11.3
|
|||||||
* Percentage not
meaningful
The
Company recorded a benefit for taxes on income in 2009 of $5.4 million as
compared to a provision for taxes of $24.1 million. The effective
rate in 2009 was 23.3% as compared with 29.3% in 2008. This decrease
primarily relates to the increase in the tax benefit of depletion as a
percentage of the decreased earnings. The tax benefit on the
restructuring and impairments charge was $14.7 million, or, an effective tax
benefit of 22.9% on such charge.
The
factors having the most significant impact on our effective tax rates for the
three periods are percentage depletion, restructuring and impairments, and the
rate differential related to foreign earnings indefinitely
invested.
Percentage depletion
allowances (tax deductions for depletion that may exceed our tax basis in our
mineral reserves) are available to us under the income tax laws of the United
States for operations conducted in the United States. The tax
benefits from percentage depletion were $3.2 million in 2009, $3.4 million in
2008, and $3.6 million in 2007. The decrease in 2009 compared to 2008 primarily
is due to a decrease in mining sales.
In
December of 2009, Mexico amended the tax law to require the recapture of certain
tax benefits previously recognized from filing a Mexican consolidated tax
return. The effect on the Company of this new law was to recognize an additional
$1.5 million in income tax expense.
We
operate in various countries around the world that have tax laws, tax incentives
and tax rates that are significantly different than those of the United States.
Many of these differences combine to move our overall effective tax rate higher
or lower than the United States statutory rate depending on the mix of income
relative to income earned in the United States. The effects of foreign earnings
and the related foreign rate differentials resulted in an increase in income tax
expense of $ 1.0 million in 2009 and a decrease of income tax expense of $3.7
million and $1.7 million in 2008 and 2007, respectively. The difference between
2007 and 2008 relates primarily to a 2007 restructuring of
operations. The decrease of income tax benefits in 2009 as compared
to 2008 results from the restructuring losses in foreign jurisdictions and the
income tax rate differential in the foreign jurisdictions.
During
2009, tax expense increased by $6.2 million due to the establishment of
valuation allowances. The valuation allowances were established
primarily as a result of the restructuring as it is more likely than not that
the deferred tax assets would not be recognized as they relate to the
restructured entities.
|
Income
(Loss) from Continuing Operations
(Dollars
in millions)
|
2009
|
Growth
|
2008
|
Growth
|
2007
|
||||||||||||
|
Income
(loss) from continuing operations
|
$
|
(17.7)
|
*
|
%
|
$
|
58.2
|
*
|
%
|
$
|
(22.8)
|
|||||||
* Percentage not
meaningful
The
Company recognized losses from continuing operations of $17.7 million in 2009 as
compared with income of $58.2 million in 2008.
|
Income
(loss) from Discontinued Operations
(Dollars
in millions)
|
2009
|
Growth
|
2008
|
Growth
|
2007
|
||||||||||||
|
Income
(loss) from discontinued operations
|
$
|
(3.2)
|
*
|
%
|
$
|
10.3
|
*
|
%
|
$
|
(37.8)
|
|||||||
* Percentage not
meaningful
In
2009, the Company recognized a loss from discontinued operations of $3.2 million
as compared with income from discontinued operations in the prior year of $10.3
million. Included in the loss from discontinued operations for 2009
was impairment of assets charge of $5.6 million, net of tax. The
Company recorded this impairment charge to reflect the lower market value of its
Mt. Vernon, Indiana, facility which was sold in the fourth quarter of
2009. Proceeds approximated the net book value.
Included
in the 2008 income from discontinued operations was a pre-tax gain on sale of
idle facilities previously written down of $13.9 million. In 2007, the loss from
discontinued operations included pre-tax impairment of asset charges of $46.9
million and restructuring and other exit costs of $2.3 million.
|
Noncontrolling
Interests
(Dollars
in millions)
|
2009
|
Growth
|
2008
|
Growth
|
2007
|
||||||||||||
|
Noncontrolling
interests
|
$
|
2.9
|
(10)
|
%
|
$
|
3.2
|
10
|
%
|
$
|
2.9
|
|||||||
The
decrease in the income attributable to non-controlling interests is due to lower
profitability in our joint ventures.
|
Net
Income (Loss) attributable to Minerals Technologies Inc.
(MTI)
(Dollars
in millions)
|
2009
|
Growth
|
2008
|
Growth
|
2007
|
||||||||||||
|
Net
income (loss) attributable to MTI
|
$
|
(23.8)
|
*
|
%
|
$
|
65.3
|
*
|
%
|
$
|
(63.5)
|
|||||||
* Percentage not
meaningful
The
Company recorded a net loss of $23.8 million in 2009 as compared with net income
of $65.3 million in 2008. The loss in 2009 was attributable to
impairment of assets and restructuring charges.
The
Company recorded a net loss of $63.5 million in 2007.
Outlook
Looking
forward, we remain cautious about the state of the global economy and the impact
it will have on our product lines. Although we saw some market stabilization in
the third and fourth quarters of 2009, there remains uncertainty as to the
sustainability of the upturn and timing of market recovery. We
continue to experience weakness in all of the industries we serve -- paper,
steel, construction and automotive. Steel production in North America and Europe
experienced declines of more than 25% as compared with prior year and the paper
industry continues to consolidate and rationalize capacity.
However,
as a result of the realigning and restructuring of our operations in 2007 and
2008, coupled with the realignment of our operations in the second quarter of
2009, we strengthened the basic foundation of our businesses. Therefore, we are
in a better position to sustain profitability as the economy
recovers.
In
2010, we plan to focus on the following growth strategies:
|
·
|
Continue
development and potential commercial introduction of filler-fiber
composite technology for the paper industry to increase the fill-rates of
uncoated freesheet paper.
|
|
·
|
Increase
market penetration of PCC for paper filling at both freesheet and
groundwood mills, particularly in emerging markets.
|
|
·
|
Further
expansion of the Company's PCC coating product line using the satellite
model.
|
|
·
|
Emphasize
higher value specialty products and application systems to increase market
penetration in the Refractories
segment.
|
|
·
|
Expand
regionally into emerging markets, particularly to China and Eastern
Europe.
|
|
·
|
Development
of unique calcium carbonates used in the manufacture of biopolymers, a new
market opportunity.
|
|
·
|
Continue
to improve our cost competitiveness in all product
lines.
|
|
·
|
Explore
selective acquisitions to fit our core competencies in minerals and fine
particle technology.
|
However,
there can be no assurances that we will achieve success in implementing any one
or more of these strategies.
As
we continue to expand our operations overseas, we face the inherent risks of
doing business abroad, including inflation, fluctuations in interest rates and
currency exchange rates, changes in applicable laws and regulatory requirements,
export and import restrictions, tariffs, nationalization, expropriation, limits
on repatriation of funds, civil unrest, terrorism, unstable governments and
legal systems and other factors. Some of our operations are located
in areas that have experienced political or economic instability, including
Indonesia, Brazil, Thailand, China and South Africa. In addition, our
performance depends to some extent on that of the industries we serve,
particularly the paper manufacturing, steel manufacturing, and construction
industries.
Our
sales of PCC are predominantly pursuant to long-term evergreen contracts,
initially about ten years in length, with paper companies at whose mills we
operate satellite PCC plants. The terms of many of these agreements
have been extended, generally in connection with an expansion of the satellite
PCC plant. Failure of a number of our customers to renew existing
agreements on terms as favorable to us as those currently in effect could cause
our future sales growth rate to differ materially from our historical growth
rate and, if not renewed, could also result in impairment of the assets
associated with the PCC plant.
Liquidity
and Capital Resources
Cash
flows provided from operations in 2009 were used principally to fund $26.6
million of capital expenditures and to repay short term and long-term debt of
$12.2 million. Cash provided from operating activities totaled $160.8 million in
2009 as compared with $134.2 million in 2008. The increase in cash from
operating activities was primarily due to a decrease in working capital as
compared to the prior year. This decrease primarily relates to lower inventory
levels as compared with December 2008. Included in cash flow from operations was
pension plan funding of approximately $7.8 million, $3.2 million and $24.1
million for the years ended December 31, 2009, 2008 and 2007,
respectively.
Working
capital is defined as trade accounts receivable, trade accounts payable and
inventories. Working capital decreased approximately 28% from
December 2008. Our total days of working capital decreased to 59 days
in 2009 from 88 days in 2008. This decrease was primarily
attributable to reductions in raw materials inventories, primarily in the
Refractories segment. In 2008, the Company had accelerated purchases
of higher priced raw materials from China to avoid potential supply
interruptions. The Company’s days of inventory on hand decreased to 38 days in
2009 from 65 days in 2008. This decrease was partially offset by a
slight increase in our accounts receivable. However, our days of
sales outstanding decreased to 59 days in 2009 from 63 days in
2008. Our accounts receivable balances increased in December 2009
when compared with December 2008 primarily due to higher sales levels in the
fourth quarter of 2009 as compared with the fourth quarter of 2008.
As
a result of the market decline, the Company reallocated its asset portfolio in
its pension plan to fixed income securities to prevent potential further
declines in pension assets. During 2009, the Company began a program of
systematically moving funds back into equities. The Company had
approximately 51% of its pension assets in fixed income securities as of
December 31, 2009. The Company intends to rebalance its investment portfolio to
adhere to its long-term investment strategy over the next twelve months as the
markets continue to stabilize. The Company's pension plans are over
85% funded, and presently there are no minimum funding requirements
necessary.
On
October 26, 2005, our Company's Board of Directors authorized the Company's
management, at its discretion, to repurchase up to $75 million in additional
shares over the next three-year period. The Company completed this program in
February 2008 and repurchased 1,307,598 shares under this program at an average
price of approximately $57.36 per share.
On
October 24, 2007, the Company's Board of Directors authorized the Company's
management to repurchase, at its discretion, up to $75 million of additional
shares over the next two-year period. As of December 31, 2008, 615,674 shares
have been repurchased under this program at an average price of a proximately
$61.45 per share. This program has expired and approximately $37.2
million of the $75 million authorized have not been repurchased.
On
February 22, 2010, our Company’s Board of Directors authorized the Company’s
management to repurchase, at its discretion, up to $75 million of additional
shares over the next two-year period.
On
January 27, 2010, our Board of Directors declared a regular quarterly dividend
on our common stock of $0.05 per share. No dividend will be payable unless
declared by the Board and unless funds are legally available for
payment.
The
following table summarizes our contractual obligations as of December 31,
2009:
Contractual
Obligations
|
Payments
Due by Period
|
|||||||||||||||||
|
(millions
of dollars)
|
Total
|
Less
Than 1 Year
|
1-3
Years
|
3-5
Years
|
After
5
Years
|
||||||||||||
|
Debt
|
$
|
97.2
|
$
|
4.6
|
$
|
8.0
|
$
|
84.6
|
$
|
--
|
|||||||
|
Operating
lease
obligations
|
24.9
|
6.2
|
6.1
|
3.9
|
8.7
|
||||||||||||
|
|
Total
contractual obligations
|
$
|
122.1
|
$
|
10.8
|
$
|
14.1
|
$
|
88.5
|
$
|
8.7
|
||||||
We
have $191.2 million in uncommitted short-term bank credit lines, of which $5.3
million was in use at December 31, 2009. The credit lines are primarily in the
US, with approximately $21 million or 11% outside the US. The credit
lines are generally one year in term at competitive market rates at large
well-established institutions. The Company typically uses its
available credit lines to fund working capital requirements or local capital
spending needs. At the present time, we have no indication that the
financial institutions would be unable to commit to these lines of credit should
the need arise. We anticipate that capital expenditures for 2010 should be
between $50 million to $75 million, principally related to the construction of
PCC plants and other opportunities that meet our strategic growth objectives. We
expect to meet our other long-term financing requirements from internally
generated funds, uncommitted bank credit lines and, where appropriate, project
financing of certain satellite plants. The aggregate maturities of
long-term debt are as follows: 2010 - $4.6 million; 2011 - $-- million; 2012 -
$8.0 million; 2013 - $76.4 million; 2014 - $8.2 million; thereafter - $--
million.
The
Company's debt to capital ratio is 12%, which is well below the financial
covenant ratio in its debt agreements.
The
Company has contingent obligations associated with unrecognized tax benefits,
including interest and penalties, of approximately $8.5 million.
Critical
Accounting Policies
Our
discussion and analysis of our financial condition and results of operations are
based upon our consolidated financial statements, which have been prepared in
accordance with U.S. generally accepted accounting principles. The
preparation of these financial statements requires us to make estimates and
judgments that affect the reported amounts of assets, liabilities, revenues and
expenses, and related disclosure of contingent assets and
liabilities.
On
an ongoing basis, we evaluate our estimates and assumptions, including those
related to revenue recognition, allowance for doubtful accounts, valuation of
inventories, valuation of long-term assets, goodwill and other intangible
assets, pension plan assumptions, income taxes, asset retirement obligations,
income tax valuation allowances, stock-based compensation, and litigation and
environmental liabilities. We base our estimates on historical experience and on
other assumptions that we believe to be reasonable under the circumstances, the
results of which form the basis for making judgments about the carrying values
of assets and liabilities that cannot readily be determined from other
sources. There can be no assurance that actual results will not
differ from those estimates.
We
believe the following critical accounting policies require us to make
significant judgments and estimates in the preparation of our consolidated
financial statements:
|
·
|
Revenue
recognition: Revenue from sale of products is recognized at the
time the goods are shipped and title passes to the customer. In most of
our PCC contracts, the price per ton is based upon the total number of
tons sold to the customer during the year. Under those
contracts, the price billed to the customer for shipments during the year
is based on periodic estimates of the total annual volume that will be
sold to the customer. Revenues are adjusted at the end of each
year to reflect the actual volume sold. There were no
significant revenue adjustments in the fourth quarter of 2009 and 2008,
respectively. We have consignment arrangements with certain
customers in our Refractories segment. Revenues for these
transactions are recorded when the consigned products are consumed by the
customer. Revenues from sales of equipment are recorded upon
completion of installation and receipt of customer
acceptance. Revenues from services are recorded when the
services are performed.
|
|
·
|
Allowance
for doubtful accounts: Substantially all of our accounts
receivable are due from companies in the paper, construction and steel
industries. Accounts receivable are reduced by an allowance for
amounts that may become uncollectible in the future. Such
allowance is established through a charge to the provision for bad debt
expenses. We recorded bad debt expenses (recoveries) of $1.2
million, $0.2 million and $(0.1) million in 2009, 2008 and 2007,
respectively. In addition to specific allowances established
for bankrupt customers, we also analyze the collection history and
financial condition of our other customers considering current industry
conditions and determine whether an allowance needs to be established or
adjusted.
|
|
·
·
|
Property,
plant and equipment, goodwill, intangible and other long-lived
assets: Property, plant and equipment are depreciated over
their useful lives. Useful lives are based on management’s
estimates of the period that the assets can generate revenue, which does
not necessarily coincide with the remaining term of a customer’s
contractual obligation to purchase products made using those
assets. Our sales of PCC are predominately pursuant to
long-term evergreen contracts, initially ten years in length, with paper
mills at which we operate satellite PCC plants. The terms of
many of these agreements have been extended, often in connection with an
expansion of the satellite PCC plant. Failure of a PCC customer
to renew an agreement or continue to purchase PCC from our facility could
result in an impairment of assets or accelerated depreciation at such
facility.
Valuation
of long-lived assets, goodwill and other intangible assets: We assess the
possible impairment of long-lived assets and identifiable amortizable
intangibles whenever events or changes in circumstances indicate that the
carrying value may not be recoverable. Goodwill is reviewed for impairment
at least annually. Factors we consider important that could trigger an
impairment review include the
following:
|
|
•
|
Significant
under-performance relative to historical or projected future operating
results;
|
|
•
|
Significant
changes in the manner of use of the acquired assets or the strategy for
the overall business;
|
|
•
|
Significant
negative industry or economic trends;
|
|
•
|
Market
capitalization below invested
capital.
|
|
The
Company conducts its goodwill impairment testing for each Reporting Unit
as of the beginning of the fourth quarter with the assistance of valuation
specialists. There is a two-step process for testing of goodwill
impairment and measuring the magnitude of any impairment. Step One
involves a) developing the fair value of total invested capital of each
Reporting Unit in which goodwill is assigned; and b) comparing the fair
value of total invested capital for each Reporting Unit to its carrying
amount, to determine if there is goodwill impairment. Should the carrying
amount for a Reporting Unit exceed its fair value, then the Step One test
is failed, and the magnitude of any goodwill impairment is determined
under Step Two. The amount of impairment loss is determined in Step Two by
comparing the implied fair value of Reporting Unit goodwill with the
carrying amount of goodwill.
|
|
|
The
Company has three reporting units, PCC, Processed Minerals and
Refractories. We identify our reporting units by assessing whether the
components of our operating segments constitute businesses for which
discrete financial information is available and management regularly
reviews the operating results of those components.
The
Company performed its annual goodwill impairment test for all reporting
units in the fourth quarter of 2009. The fair value of each reporting unit
materially exceeded the carrying value of each reporting
unit.
The
Refractories reporting unit incurred an operating loss during the second
quarter due to low sales volumes associated with weak steel industry
market conditions and high raw material costs consumed from inventory,
which were purchased in the summer of 2008 during the peak of the demand
cycle for Chinese sourced materials. We have implemented a restructuring
program for this reporting unit designed to improve profitability in 2010
and beyond by rationalizing certain manufacturing facilities to reach
break-even levels during low volume cycles and improve profitability at
higher volumes. In our valuation of the Refractories reporting unit, we
assumed minimal sales improvement for the remainder of 2009. Our sales
growth volume assumptions over the next five years range from 5% to 8%
from the very low levels experienced in 2009, utilizing several volume
assumptions and sensitivity analyses. In our assumptions, by 2014, we only
expect sales volumes to achieve on average 90% of annualized sales volume
levels achieved in the third quarter of 2008. As a result of some
forecasted volume improvement from present levels, coupled with cost and
expense savings associated with the restructuring program, the fair value
was significantly in excess of the carrying value and resulted in no
impairment of goodwill.
|
The
goodwill balance for each reporting unit as of December 31, 2009 was as
follows:
|
($
in millions)
|
December
31,
2009
|
||
|
PCC
|
$
|
9.5
|
|
|
Processed
Minerals
|
4.6
|
||
|
Refractories
|
54.0
|
||
|
Total
|
$
|
68.1
|
The
Invested Capital and Estimated Fair Value (FV), excluding cash, for the
Refractories reporting unit as of October 1, 2009 were as follows:
|
($
in millions)
|
Invested
Capital
|
Est.
FV
|
|||
|
Refractories
|
$
|
199.0
|
$
|
235.4
|
The
Invested Capital, excluding cash, for the PCC and Processed Minerals Reporting
Units as of October 1, 2009 were as follows:
|
($
in millions)
|
Invested
Capital
|
|
|
PCC
|
$
|
255.1
|
|
Processed
Minerals
|
$
|
104.1
|
The
fair value of the PCC and Processed Minerals product lines were
materially in excess of the carrying value.
The
Company had approximately $296 million in cash and short term investments as of
October 1, 2009, which would increase both the Invested Capital and Estimated
Fair Values by the same amounts.
|
We
estimate fair value of our reporting units by applying information
available at the time of the valuation to industry accepted models using
an income approach and market approach. The income approach incorporates
the discounted cash flow method and focuses on the expected cash flow of
the Reporting Unit. The market approach utilizes two methodologies, the
Guideline Company Method and the Similar Transactions Method. The
Guideline Company Method focuses on comparing the Reporting Units' risk
profile and growth prospects to selected similar publicly traded
companies. The Similar Transactions Method considers prices paid in recent
transactions in the Reporting Unit's industry or related industries. We
believe the income and market approaches are equally relevant to the
determination of reporting unit fair value and therefore assigned equal
weighting to each method.
The
key assumptions we used in the income approach included revenue growth
rates and profit margins based upon forecasts derived from available
industry market data, a terminal growth rate and estimated
weighted-average cost of capital based on market participants for which
the discount rates were determined. For the Refractories reporting unit,
we assumed that revenues would decline approximately 30% for the full year
2009 compared to 2008. The rate of sales decline would reduce in the
fourth quarter of 2009 when compared with the fourth quarter of 2008,
which was the beginning of the effects of the recession in our markets.
Our compound annual sales growth assumption from 2008 to 2014 is negative
1%. Revenue growth was 10%, 4% and 6% for the years ended December 31,
2008, 2007 and 2006, respectively. Our gross profit margin is forecast at
between 25% and 26% over the next five years and had ranged between 27%
and 30% over the last three years. The terminal growth rates were
projected at 3% after five years, which reflects our estimate of long term
market and gross domestic product growth. We utilized discount rates of
12% and 13% in the valuation and, in addition, incorporated a company
specific risk premium.
For
the PCC and Processed Minerals reporting units, we assumed that revenues
would decline approximately 15% for the full year 2009 compared to 2008.
The rate of sales decline would reduce in the fourth quarter of 2009 when
compared with the fourth quarter of 2008, which was the beginning of the
effects of the recession in our markets. Our compound annual sales growth
assumptions from 2008 to 2014 are less than 5% for both the PCC and
Processed Minerals product lines. Revenue growth was 0%, 6% and
7% for the years ended December 31, 2008, 2007 and 2006, respectively. Our
gross profit margin is forecast at between 21% and 28% over the next five
years and had ranged between 27% and 31% over the last three years. The
terminal growth rates were projected at 3% after five years, which
reflects our estimate of long term market and gross domestic product
growth. We utilized discount rates of 12% and 14% in the valuation and, in
addition, incorporated a company specific risk premium.
The
key assumptions we used in the market approach represent multiples of
Sales and EBITDA and were derived from comparable publicly traded
companies with similar operating characteristics as the reporting units.
The market multiples used in our assumptions ranged from 0.7 to 1.1 times
2010 forecasted Sales and ranged from 6.0 to 8.5 times 2010 forecasted
EBITDA.
|
|
|
The
impairment testing involves the use of accounting estimates and
assumptions. Actual results different from such estimates and assumptions
could materially impact our financial condition or operating
performance.
|
|
·
|
Accounting
for income taxes: As part of the process of preparing our consolidated
financial statements, we are required to estimate our income taxes in each
of the jurisdictions in which we operate. This process involves
estimating current tax expense together with assessing temporary
differences resulting from differing treatments of items for tax and
accounting purposes. These differences result in deferred tax
assets and liabilities, which are included in the consolidated balance
sheet. We must then assess the likelihood that our deferred tax
assets will be recovered from future taxable income, and to the extent we
believe that recovery is not likely, we must establish a valuation
allowance. To the extent we establish a valuation allowance or
increase this allowance in a period, we must include an expense within the
tax provision in the Consolidated Statements of Operations.
Deferred
income tax assets represent amounts available to reduce income taxes
payable on taxable income in future years. Such assets arise because of
temporary differences between the financial reporting and tax bases of
assets and liabilities, as well as from net operating loss. We evaluate
the recoverability of these future tax deductions by assessing the
adequacy of future expected taxable income from all sources, including
reversal of taxable temporary differences and forecasted operating
earnings. These sources of income inherently rely heavily on estimates. We
use our historical experience and business forecasts to provide insight.
Amounts recorded for deferred tax assets, net of valuation allowances,
were $28.5 million and $13.1 million at December 31, 2009 and 2008,
respectively. Such year-end 2009 amounts are expected to be fully
recoverable within the applicable statutory expiration periods. To the
extent we do not consider it more likely than not that a deferred tax
asset will be recovered, a valuation allowance is
established.
|
|
The
application of income tax law is inherently complex. Laws and regulations
in this area are voluminous and are often ambiguous. As such, we are
required to make many subjective assumptions and judgments regarding our
income tax exposures. Interpretations of and guidance surrounding income
tax laws and regulations change over time. As such, changes in our
subjective assumptions and judgments can materially affect amounts
recognized in the consolidated balance sheets and statements of
operations. See Note 5 to the condensed consolidated financial statements,
"Income Taxes," for additional detail on our uncertain tax
positions.
|
|
|
·
|
Pension
Benefits: We sponsor pension and other retirement plans in various forms
covering the majority of employees who meet eligibility
requirements. Several statistical and actuarial models which
attempt to estimate future events are used in calculating the expense and
liability related to the plans. These models include
assumptions about the discount rate, expected return on plan assets and
rate of future compensation increases as determined by us, within certain
guidelines. Our assumptions reflect our historical experience
and management's best judgment regarding future
expectations. In addition, our actuarial consultants also use
subjective factors such as withdrawal and mortality rates to estimate
these assumptions. The actuarial assumptions used by us may
differ materially from actual results due to changing market and economic
conditions, higher or lower withdrawal rates or longer or shorter life
spans of participants, among other things. Differences from
these assumptions may result in a significant impact to the amount of
pension expense/liability recorded by us
follows:
|
A
one percentage point change in our major assumptions would have the following
effects.
Effect
on Expense
|
(millions
of dollars)
|
Discount
Rate
|
Salary
Scale
|
Return
on Asset
|
||||||||
|
1%
increase
|
$
|
(2.7)
|
$
|
0.4
|
$
|
(1.2)
|
|||||
|
1%
decrease
|
$
|
3.1
|
$
|
(0.4)
|
$
|
1.2
|
Effect on
Projected Benefit Obligation
|
(millions
of dollars)
|
Discount
Rate
|
Salary
Scale
|
|||||
|
1%
increase
|
$
|
(20.0)
|
$
|
2.0
|
|||
|
1%
decrease
|
$
|
24.8
|
$
|
(1.8)
|
The
investment strategy for pension plan assets is to maintain a broadly diversified
portfolio designed to achieve our target of an average long-term rate of return
of 7.15%. While we believe we can achieve a long-term average rate of return of
7.15%, we can not be certain that the portfolio will perform to our
expectations. From inception through October 31, 2008, assets were strategically
allocated among equity, debt and other investments to achieve a diversification
level that dampens fluctuations in investment returns. The Company's long-term
investment strategy had an investment portfolio mix of approximately 65% in
equity securities and 35% in fixed income securities. The Company's 16-year
average rate of return on assets through December 31, 2008 was over 9% on its
investment assets despite the significant losses realized in 2008. During the
fourth quarter of 2008, the Company adopted a capital conservation strategy as a
result of the severe market volatility experienced in the latter part of 2008.
As part of this strategy, the Company temporarily invested its pension
assets
in fixed
income securities due to the uncertainty in the markets but has not changed its
long-term investment strategy. As of the end of the year, the Company had
approximately 51% of its pension assets in fixed income securities. During the
first half of 2009, we analyzed data provided by investment consultants who
indicated the likely returns from a move to equities at that time were not
significantly better than the expected returns from the capital conservation
strategy and that such a change involved significantly more risk. During the
third quarter 2009, we began a program of systematically moving funds back into
equities. The Company intends to rebalance its investment portfolio and
re-evaluate to its long-term investment strategy over the next twelve months as
the markets continue to stabilize.
|
·
|
Asset
Retirement Obligations: We currently record the obligation for estimated
asset retirement costs at a fair value in the period incurred. Factors
such as expected costs and expected timing of settlement can affect the
fair value of the obligations. A revision to the estimated costs or
expected timing of settlement could result in an increase or decrease in
the total obligation which would change the amount of amortization and
accretion expense recognized in earnings over time.
A
one-percent increase or decrease in the discount rate would change the
total obligation by approximately $0.1 million.
A
one-percent increase or decrease in the inflation rate would change the
total obligation by approximately $0.3 million.
|
|
·
|
The
Company uses the Black-Scholes option pricing model to determine the fair
value of stock options on their date of grant. This model is
based upon assumptions relating to the volatility of the stock price, the
life of the option, risk-free interest rate and dividend yield. Of these,
stock price volatility and option life require greater levels of judgment
and are therefore critical accounting estimates.
We
used a stock price volatility assumption based upon the historical and
implied volatility of the Company's stock. We believe this is a
good indicator of future, actual and implied volatilities. For
stock options granted in the period ended December 31, 2009, the Company
used a volatility assumption of 28.01%.
The
expected life calculation was based upon the observed and expected time to
post-vesting forfeiture and exercise. For stock options granted during the
fiscal year ended December 31, 2009, the Company used a 6.3 year life
assumption.
The
Company believes the above critical estimates are based upon outcomes most
likely to occur, however, were we to simultaneously increase or decrease
the option life by one year and the volatility by 100 basis points,
recognized compensation expense would have changed approximately $0.1
million in either direction for the year ended December 31,
2009.
|
For
a detailed discussion on the application of these and other accounting policies,
see "Summary of Significant Accounting Policies" in the "Notes to the
Consolidated Financial Statements" in Item 15 of this report, beginning on page
F-6. This discussion and analysis should be read in conjunction with
the consolidated financial statements and related notes included elsewhere in
this report.
Prospective
Information and Factors That May Affect Future Results
The
SEC encourages companies to disclose forward-looking information so that
investors can better understand companies' future prospects and make informed
investment decisions. This report may contain forward-looking
statements that set our anticipated results based on management's plans and
assumptions. Words such as "expects," "plans," "anticipates," and
words and terms of similar substance, used in connection with any discussion of
future operating or financial performance identify these forward-looking
statements.
We
cannot guarantee that the outcomes suggested in any forward-looking statement
will be realized, although we believe we have been prudent in our plans and
assumptions. Achievement of future results is subject to risks,
uncertainties and the accuracy of assumptions. Should known or
unknown risks or uncertainties materialize, or should underlying assumptions
prove inaccurate, actual results could vary materially from those anticipated,
estimated or projected. Investors should bear this in mind as they
consider forward-looking statements and should refer to the discussion of
certain risks, uncertainties and assumptions in Item 1A, "Risk
Factors."
Inflation
Historically,
inflation has not had a material adverse effect on us. However, in recent years
both business segments have been affected by rapidly rising raw material and
energy costs. The Company and its customers will typically negotiate reasonable
price adjustments in order to recover a portion of these rapidly escalating
costs. As the contracts pursuant to which we construct and operate
our satellite PCC plants generally adjust pricing to reflect increases in costs
resulting from inflation, there is a time lag before such price adjustments can
be implemented.
Cyclical
Nature of Customers' Businesses
The
bulk of our sales are to customers in the paper manufacturing, steel
manufacturing and construction industries, which have historically been
cyclical. The pricing structure of some of our long-term PCC contracts makes our
PCC business less sensitive to declines in the quantity of product
purchased. However, we cannot predict the economic outlook in the
countries in which we do business, nor in the key industries we
serve.
Recently
Issued Accounting Standards
In
January 2010, the FASB issued guidance that requires new disclosures, and
clarifies existing disclosure requirements, about fair value measurements. The
clarifications and the requirement to separately disclose transfers of
instruments between level 1 and level 2 of the fair value hierarchy are
effective for interim reporting periods beginning after December 15, 2009;
however, the requirement to provide purchases, sales, issuances and settlements
in the level 3 rollforward on a gross basis is effective for fiscal years
beginning after December 15, 2010. Early adoption of the guidance is
permitted.
In
October 2009, the FASB amended the accounting and disclosure requirements for
revenue recognition. These amendments, effective for fiscal years
beginning on or after June 15, 2010, modify the criteria for recognizing revenue
in multiple element arrangements and the scope of what constitutes a
non-software deliverable. The implementation of this guidance is not expected to
have a material impact on our consolidated financial statements.
In
July 2009, the FASB implemented the FASB Accounting Standards Codification
(the “Codification”) as the single source of authoritative U.S. generally
accepted accounting principles. The Codification simplifies the classification
of accounting standards into one online database under a common referencing
system, organized into eight areas, ranging from industry-specific to general
financial statement matters. Use of the Codification is effective for interim
and annual periods ending after September 15, 2009. The Company began to
use the Codification on the effective date, and it had no impact on the
Company’s Consolidated Financial Statements. However, throughout this Annual
Report, all references to prior FASB, AICPA and EITF accounting pronouncements
have been removed, and all non-SEC accounting guidance is referred to in terms
of the applicable subject matter.
In
May 2009, new guidance was issued on subsequent events. The standard
provided guidance on management’s assessment of subsequent
events. This standard is effective prospectively for interim and
annual periods ending after June 15, 2009. This implementation of
this standard did not have a material impact on our consolidated financial
results.
In
December 2008, a standard was issued which will require more detailed
disclosures about employers’ pension plan assets. The new disclosure requirement
will require additional information regarding investment strategies, major
categories of plan assets, concentrations of risk within plan assets and
valuation techniques used to measure the fair value of plan assets. This new
standard amends disclosure requirements for periods ending after December 15,
2009. The Company adopted this pronouncement as of December 31,
2009.
In
March 2008, a statement was issued which amends the disclosure requirements for
derivative instruments and hedging activities. It requires companies with
derivative instruments to provide enhanced disclosures that would enable
financial statement users to understand how derivative instruments affect a
company’s financial position, financial performance and cash
flows. This statement is effective for fiscal years beginning on or
after November 15, 2008, with early adoption encouraged. The Company adopted
this pronouncement as of January 1, 2009.
In
February 2008, a statement was issued which excludes fair value measurements for
purposes of lease classification. In addition, the effective date of
fair value measurement requirements for certain non-financial assets and
non-financial liabilities was deferred to fiscal years beginning after November
15, 2008.
In
December 2007, a statement was issued that changed the requirements for an
acquirer's recognition and measurement of the assets acquired and the
liabilities assumed in a business combination. This statement is effective for
annual periods beginning after December 15, 2008 and should be applied
prospectively for all business combinations entered into after the date of
adoption.
In
December 2007, a statement was issued on noncontrolling interests in
consolidated financial statements. The provisions of this statement require (i)
that noncontrolling (minority) interests be reported as a component of
shareholders' equity, (ii) that net income attributable to the parent and to the
noncontrolling interest be separately identified in the consolidated statement
of operations, (iii) that changes in a parent's ownership interest while the
parent retains its controlling interest be accounted for as equity transactions,
(iv) that any retained noncontrolling equity investment upon the deconsolidation
of a subsidiary be initially measured at fair value, and (v) that sufficient
disclosures are provided that clearly identify and distinguish between the
interests of the parent and the interests of the noncontrolling owners. This
statement is effective for annual periods beginning after December 15, 2008 and
should be applied prospectively. However, the presentation and disclosure
requirements of the statement shall be applied retrospectively for all periods
presented. The adoption of the provisions of this statement has not materially
impacted the Company's consolidated financial position and results of
operations.
Item
7A. Quantitative and Qualitative Disclosures
about Market Risk
Market
risk represents the risk of loss that may have an impact on our financial
position, results of operations or cash flows due to adverse changes in market
prices and foreign currency and interest rates. We are exposed to market risk
because of changes in foreign currency exchange rates as measured against the
U.S. dollar. We do not anticipate that near-term changes in exchange
rates will have a material impact on our future earnings or cash
flows. However, there can be no assurance that a sudden and
significant change in the value of foreign currencies would not have a material
adverse effect on our financial condition and results of
operations. Approximately 52% of our bank debt bears interest at
variable rates; therefore our results of operations would only be affected by
interest rate changes to such bank debt outstanding. An immediate 10%
change in interest rates would not have a material effect on our results of
operations over the next fiscal year.
We
do not enter into derivatives or other financial instruments for trading or
speculative purposes. When appropriate, we enter into derivative
financial instruments, such as forward exchange contracts and interest rate
swaps, to mitigate the impact of foreign exchange rate movements and interest
rate movements on our operating results. The counterparties are major
financial institutions. Such forward exchange contracts and interest
rate swaps would not subject us to additional risk from exchange rate or
interest rate movements because gains and losses on these contracts would offset
losses and gains on the assets, liabilities, and transactions being
hedged. We had open forward exchange contracts to purchase
approximately $4.6 million and $6.4 million of foreign currencies as of December
31, 2009 and 2008, respectively. These contracts mature between
January and July of 2010. The fair value of these instruments at December 31,
2009 and December 31, 2008 was a liability of $0.1 million and $0.4 million,
respectively.
In
2008, the Company entered into forward contracts to purchase 30 million Euros as
a hedge of its net investment in Europe. These contracts mature in October 2013.
The fair value of these instruments at December 31, 2009 was a liability of $0.6
million. The fair value of these instruments at December 31, 2008 was an asset
of $2.1 million.
Item
8. Financial Statements and
Supplementary Data
The
financial information required by Item 8 is contained in Item 15 of Part IV of
this report.
Item
9. Changes in and Disagreements
with Accountants on Accounting and Financial Disclosure
None.
Item
9A. Controls and
Procedures
Disclosure
Controls and Procedures
As
of the end of the period covered by this report, and under the supervision and
with participation of the Company’s management, including the Chief Executive
Officer and the Chief Financial Officer, the Company carried out an evaluation
of the effectiveness of the design and operation of the Company’s disclosure
controls and procedures, pursuant to Exchange Act Rule
13a-15(b). Based upon that evaluation, the Chief Executive Officer
and Chief Financial Officer concluded that the Company’s disclosure controls and
procedures were effective as of December 31, 2009.
Pursuant
to Section 404 of the Sarbanes-Oxley Act of 2002, we have included a report of
management's assessment of the design and operating effectiveness of our
internal controls as part of this report. Management's report is included in our
consolidated financial statements beginning on page F-1 of this report under the
caption entitled "Management's Report on Internal Control Over Financial
Reporting."
The
Company is in the process of implementing a global enterprise resource planning
("ERP") system to manage our business operations. As of December 31,
2009, all of our domestic locations were using the new systems. The worldwide
implementation is expected to be completed over the next few years and involves
changes in systems that include internal controls. Although the transition has
proceeded to date without material adverse effects, the possibility exists that
the migration to the new ERP system could adversely affect the Company's
disclosure controls and procedures or our results of operations in future
periods. We are reviewing each system as it is being implemented and the
controls affected by the implementation of the new systems, and are making
appropriate changes to affected internal controls as we implement the new
systems. We believe that the controls as modified are appropriate and
functioning effectively.
Changes
in Internal Control Over Financial Reporting
There
was no change in the Company's internal control over financial reporting during
the most recent fiscal quarter that has materially affected, or is reasonably
likely to materially affect, the Company's internal control over financial
reporting.
Item
9B. Other Information
None.
PART
III
Item
10. Directors, Executive Officers
and Corporate Governance
Set
forth below are the names and ages of all Executive Officers of the Registrant
indicating all positions and offices with the Registrant held by each such
person, and each such person's principal occupations or employment during the
past five years.
|
Name
|
Age
|
Position
|
|
|
Joseph
C.
Muscari
|
63
|
Chairman
of the Board and Chief Executive Officer
|
|
|
D.
Randy
Harrison
|
58
|
Senior
Vice President, Organization and Human Resources
|
|
|
D.J.
Monagle,
III
|
47
|
Senior
Vice President and Managing Director, Paper PCC
|
|
|
John
A.
Sorel
|
62
|
Senior
Vice President, Finance, and Chief Financial Officer
|
|
|
William
J.S.
Wilkins
|
53
|
Senior
Vice President and Managing Director, Minteq
International
|
|
|
Michael
A.
Cipolla
|
52
|
Vice
President, Corporate Controller and Chief Accounting
Officer
|
|
|
Douglas
T.
Dietrich
|
40
|
Vice
President, Corporate Development and Treasury
|
|
|
William
A.
Kromberg
|
64
|
Vice
President, Taxes
|
|
|
Douglas
W.
Mayger
|
52
|
Vice
President and Managing Director, Performance Minerals
|
|
|
Thomas
J.
Meek
|
52
|
Vice
President, General Counsel and
Secretary
|
Joseph
C. Muscari was elected Chairman of the Board and Chief Executive Officer
effective March 1, 2007. Prior to that, he was Executive Vice President and
Chief Financial Officer of Alcoa Inc. He has served as a member of the Board of
Directors since 2005.
D.
Randy Harrison was elected Senior Vice President, Organization and Human
Resources effective January 1, 2008. Prior to that, he had been Vice
President and Managing Director, Performance Minerals since January
2002.
D.J.
Monagle, III was elected Senior Vice President and Managing Director, Paper PCC,
effective October 1, 2008. In November 2007, he was appointed Vice
President and Managing Director - Performance Minerals. He joined the Company in
January of 2003 and held positions of increasing responsibility including Vice
President, Americas, Paper PCC and Global Marketing Director, Paper
PCC.
John
A. Sorel was elected Senior Vice President, Finance and Chief Financial Officer
in November 2002. He was elected Senior Vice President, Corporate
Development and Finance on January 1, 2002 and prior to 2002 he held positions
of increasing authority with the Company, most recently Vice President and
Managing Director, Paper PCC.
William
J.S. Wilkins was elected Senior Vice President and Managing Director, Minteq
International in November 2007. He joined the Company in June 2007 as
Vice President, Global Supply Chain and Logistics. Prior to that, he had founded
Management Services, a consulting firm. Before starting his consultancy, he was
President and Chief Executive Officer of Sermatech International Inc.; Vice
President and Chief Financial Officer of the Teleflex Aerospace Group; and head
of finance and administration at Howmet Castings, a business unit of Alcoa,
which he joined in 1994.
Michael
A. Cipolla was elected Vice President, Corporate Controller and Chief Accounting
Officer in July 2003. Prior to that, he served as Corporate
Controller and Chief Accounting Officer of the Company since
1998. From 1992 to 1998 he served as Assistant Corporate
Controller.
Douglas
T. Dietrich was elected Vice President, Corporate Development and Treasury
effective August 2007. He had been Vice President, Alcoa Wheel Products since
2006 and President, Latin America Extrusions and Global Rod and Bar Products
since 2002.
William
A. Kromberg has served as Vice President, Taxes of the Company since
1993.
Douglas
W. Mayger was elected Vice President and Managing Director, Performance Minerals
which encompasses the Processed Minerals product line and the Specialty PCC
product line, effective October 1, 2008. Prior to that, he was General Manager-
Carbonates West, Performance Minerals and Business Manager - Western Region.
Before joining the Company as plant manager in Lucerne Valley in 2002, he served
as Vice President of Operations for Aggregate Industries.
Thomas
J. Meek was elected Vice President, General Counsel and Secretary of the Company
effective September 1, 2009. Prior to that, he served as Deputy
General Counsel at Alcoa. Before joining Alcoa in 1999, Mr. Meek
worked with Koch Industries, Inc. of Wichita, Kansas, where he held numerous
supervisory positions. His last position there was Interim General
Counsel. From 1985 to 1990, Mr. Meek was an Associate/Partner in the
Wichita, Kansas law firm of McDonald, Tinker, Skaer, Quinn & Herrington,
P.A.
The
information concerning the Company's Board of Directors required by this item is
incorporated herein by reference to the Company's Proxy Statement, under the
captions "Committees of the Board of Directors" and “Item 1- Election of
Directors.”
The
information regarding compliance with Section 16(a) of the Securities Exchange
Act of 1934 required by this Item is incorporated herein by reference to the
Company's Proxy Statement, under the caption "Section 16(a) Beneficial Ownership
Reporting Compliance."
The
Board has established a code of ethics for the Chief Executive Officer, the
Chief Financial Officer, and the Chief Accounting Officer entitled "Code of
Ethics for the Senior Financial Officers," which is available on our website,
www.mineralstech.com, under the links entitled "Corporate Responsibility,
Corporate Governance and Policies and Charters."
Item
11. Executive Compensation
The
information appearing in the Company's Proxy Statement under the captions
“Compensation Discussion and Analysis,” “Report of the Compensation Committee”
and "Compensation of Executive Officers and Directors" is
incorporated herein by reference.
Item
12. Security Ownership of Certain
Beneficial Owners and Management and Related Stockholder Matters
The
information appearing in the Company's Proxy Statement under the caption
"Security Ownership of Certain Beneficial Owners and Management as of January
31, 2010" is incorporated herein by reference.
Item
13. Certain Relationships and
Related Transactions, and Director Independence
The
information appearing in the Company's Proxy Statement under the caption
"Certain Relationships and Related Transactions" is incorporated herein by
reference.
Under
the terms of certain agreements entered into in connection with the Company's
initial public offering in 1992, Pfizer Inc ("Pfizer") and its wholly-owned
subsidiary Quigley Company, Inc. ("Quigley") agreed to indemnify the company
against certain liabilities being retained by Pfizer and its subsidiaries
including, but not limited to, pending lawsuits and claims, and any lawsuits or
claims brought at any time in the future alleging damages or injury from the
use, handling of or exposure to any product sold by Pfizer's specialty minerals
business prior to the closing of the initial public offering. During 2008,
agreement was reached with Pfizer providing for reimbursement by Pfizer of past
costs of defense, and direct payment of such costs going forward, for cases
alleging damages from exposure to product sold prior to the formation of the
Company and Pfizer reimbursed the Company in the amount of $0.1 million for past
defense costs.
Pfizer
and Quigley also agreed to indemnify the Company against any liability arising
from claims for remediation, as defined in the Agreement, of on-site
environmental conditions relating to activities prior to the closing of the
initial public offering. Further, Pfizer and Quigley agreed to indemnify the
Company for 50% of the liabilities in excess of $1 million up to $10 million in
liabilities that may have arisen or accrued within ten years after the closing
of the initial public offering with respect to such remediation of on-site
conditions. The Company is responsible for the first $1 million of such
liabilities, 50% of all such liabilities in excess of $1 million up to $10
million, and all such liabilities in excess of $10 million. The Company had
asserted to Pfizer and Quigley a number of indemnification claims pursuant to
this agreement during the ten-year period following the closing of the initial
public offering. On January 30, 2006, Pfizer and the Company agreed to settle
those claims, along with certain other potential environmental liabilities of
Pfizer, in consideration of a payment by Pfizer of $4.5 million. Such payment
was recorded as additional paid-in capital, net of its related tax
effect.
The
Board has established Corporate Governance principles which include guidelines
for determining Director independence, which is available on our website,
www.mineralstech.com, under the links entitled "Corporate Responsibility,
Corporate Governance and Policies and Charters." The information
appearing in the Company’s Proxy Statement under the caption “Corporate
Governance – Director Independence” is incorporated herein by
reference.
Item
14. Principal Accountant Fees and
Services
The
information appearing in the Company's Proxy Statement under the caption
"Principal Accountant Fees and Services" is incorporated herein by
reference.
PART
IV
Item
15. Exhibits and Financial Statement
Schedules
(a) The
following documents are filed as part of this report:
|
1.
|
Financial
Statements. The following Consolidated Financial Statements of Mineral
Technologies Inc. and subsidiary companies and Reports of Independent
Registered Public Accounting Firm are set forth on pages F-2 to
F-35.
|
||
|
Consolidated
Balance Sheets as of December 31, 2009 and 2008
|
|||
|
Consolidated
Statements of Operations for the years ended December 31, 2009, 2008 and
2007
|
|||
|
Consolidated
Statements of Cash Flows for the years ended December 31, 2009, 2008 and
2007
|
||||||
|
Consolidated
Statements of Shareholders' Equity for the years ended December 31, 2009,
2008 and 2007
|
||||||
|
Notes
to the Consolidated Financial Statements
|
||||||
|
Reports
of Independent Registered Public Accounting Firm
|
||||||
|
Management's
Report on Internal Control Over Financial Reporting
|
||||||
|
2.
|
Financial
Statement Schedule. The following financial statement schedule is filed as
part of this report:
|
|||||
|
Page
|
||||||
|
Schedule
II -
|
Valuation
and Qualifying Accounts
|
S-1
|
||||
|
All
other schedules for which provision is made in the applicable accounting
regulations of the SEC are not required under the related instructions or
are inapplicable and, therefore, have been omitted.
|
||||||
|
3.
|
Exhibits.
The following exhibits are filed as part of, or incorporated by reference
into, this report.
|
|||||
|
3.1
|
-
|
Restated
Certificate of Incorporation of the Company (1)
|
||||
|
3.2
|
-
|
By-Laws
of the Company as amended and restated effective May 25, 2005
(2)
|
||||
|
3.3
|
-
|
Certificate
of Designations authorizing issuance and establishing designations,
preferences and rights of Series A Junior Preferred Stock of the Company
(1)
|
||||
|
4.1
|
-
|
Specimen
Certificate of Common Stock (1)
|
||||
|
10.1
|
-
|
Asset
Purchase Agreement, dated as of September 28, 1992, by and between
Specialty Refractories Inc. and Quigley Company Inc. (3)
|
||||
|
10.1(a)
|
-
|
Agreement
dated October 22, 1992 between Specialty Refractories Inc. and Quigley
Company Inc., amending Exhibit 10.1 (4)
|
||||
|
10.1(b)
|
-
|
Letter
Agreement dated October 29, 1992 between Specialty Refractories Inc. and
Quigley Company Inc., amending Exhibit 10.1 (4)
|
||||
|
10.2
|
-
|
Reorganization
Agreement, dated as of September 28, 1992, by and between the Company and
Pfizer Inc (3)
|
||||
|
10.3
|
-
|
Asset
Contribution Agreement, dated as of September 28, 1992, by and between
Pfizer Inc and Specialty Minerals Inc. (3)
|
||||
|
10.4
|
-
|
Asset
Contribution Agreement, dated as of September 28, 1992, by and between
Pfizer Inc and Barretts Minerals Inc. (3)
|
||||
|
10.4(a)
|
-
|
Agreement
dated October 22, 1992 between Pfizer Inc, Barretts Minerals Inc. and
Specialty Minerals Inc., amending Exhibits 10.3 and 10.4
(4)
|
||||
|
10.5
|
-
|
Employment
Agreement, dated November 27, 2006, between the Company and Joseph C.
Muscari (5) (+)
|
||||
|
10.6
|
-
|
Form
of Employment Agreement between the Company and each of Michael A.
Cipolla, Douglas T. Dietrich, D. Randy Harrison, William A. Kromberg,
Douglas W. Mayger, Thomas J. Meek, D.J. Monagle, III, John A. Sorel, and
William J.S. Wilkins (6) (+)
|
||||
|
10.6(a)
|
-
|
Form
of amendment to Employment Agreement between the Company and each of
Joseph C. Muscari, Michael A. Cipolla, Douglas T. Dietrich, D. Randy
Harrison, William A. Kromberg, Douglas W. Mayger, Thomas J. Meek, D.J.
Monagle, III, John A. Sorel, and William J.S. Wilkins (*)
(+)
|
||||
|
10.7
|
-
|
Form
of Severance Agreement between the Company and each of Joseph C. Muscari,
Michael A. Cipolla, Douglas T. Dietrich, D. Randy Harrison, William A.
Kromberg, Douglas W. Mayger, Thomas J. Meek, D.J. Monagle, III, John A.
Sorel, and William J.S. Wilkins (7) (+)
|
||||
|
10.7(a)
|
-
|
Form
of amendment to Severance Agreement between the Company and each of Joseph
C. Muscari, Michael A. Cipolla, Douglas T. Dietrich, D. Randy Harrison,
William A. Kromberg, Douglas W. Mayger, Thomas J. Meek, D.J. Monagle, III,
John A. Sorel, and William J.S. Wilkins (*) (+)
|
||||
|
10.8
|
-
|
Form
of Indemnification Agreement between the Company and each of Joseph C.
Muscari, Michael A. Cipolla, Douglas T. Dietrich, D. Randy Harrison,
William A. Kromberg, Douglas W. Mayger, Thomas J. Meek, D.J. Monagle, III,
John A. Sorel, and William J.S. Wilkins (8) (+)
|
||||
|
10.9
|
-
|
Company
Employee Protection Plan, as amended August 27, 1999 (9)
(+)
|
||||
|
10.10
|
-
|
Company
Nonfunded Deferred Compensation and Unit Award Plan for Non-Employee
Directors, as amended and restated effective January 1, 2008 (10)
(+)
|
||||
|
10.11
|
-
|
2001
Stock Award and Incentive Plan of the Company, as amended and restated as
of March 18, 2009 (11) (+)
|
||||
|
10.12
|
-
|
Company
Retirement Plan, as amended and restated effective as of January 1, 2006
(12) (+)
|
||||
|
10.12(a)
|
-
|
First
Amendment to the Company Retirement Plan, effective as of January 1, 2008
(13) (+)
|
||||
|
10.12(b)
|
-
|
Second
Amendment to the Company Retirement Plan, dated December 22, 2008 (*)
(+)
|
||||
|
10.12(c)
|
-
|
Third
Amendment to the Company Retirement Plan, dated October 9, 2009 (*)
(+)
|
||||
|
10.12(d)
|
-
|
Fourth
Amendment to the Company Retirement Plan, dated December 11, 2009 (*)
(+)
|
||||
|
10.12(e)
|
-
|
Fifth
Amendment to the Company Retirement Plan, dated December 18, 2009 (*)
(+)
|
|
|
10.13
|
-
|
Company
Supplemental Retirement Plan, amended and restated effective December 31,
2008 (*) (+)
|
|
|
10.14
|
-
|
Company
Savings and Investment Plan, as amended and restated as of September 14,
2007 (14) (+)
|
|
|
10.14(a)
|
-
|
First
Amendment to the Company Savings and Investment Plan, dated December 22,
2008 (*) (+)
|
|
|
10.14(b)
|
-
|
Second
Amendment to the Company Savings and Investment Plan, dated December 18,
2009 (*) (+)
|
|
|
10.15
|
-
|
Company
Supplemental Savings Plan, amended and restated effective December 31,
2008 (*) (+)
|
|
|
10.16
|
-
|
Company
Health and Welfare Plan, effective as of April 1, 2003 and amended and
restated as of January 1, 2006 (15)(+)
|
|
|
10.16(a)
|
-
|
Amendment
to the Company Health and Welfare Plan, dated May 19, 2009 (*)
(+)
|
|
|
10.17
|
-
|
Grantor
Trust Agreement, as amended and restated as of December 23, 2005, between
the Company and The Bank of New York, as Trustee
(16)(+)
|
|
|
10.18
|
-
|
Note
Purchase Agreement, dated as of October 5, 2006, among the Company,
Metropolitan Life Insurance Company and MetLife Insurance Company of
Connecticut with respect to the Company's issuance of $75,000,000 in
aggregate principal amount of senior unsecured notes due October 5, 2013
(17)
|
|
|
10.19
|
-
|
Indenture,
dated July 22, 1963, between the Cork Harbour Commissioners and Roofchrome
Limited (3)
|
|
|
21.1
|
-
|
Subsidiaries
of the Company (*)
|
|
|
23.1
|
-
|
Consent
of Independent Registered Public Accounting Firm (*)
|
|
|
24.0
|
-
|
Power
of Attorney (*)
|
|
|
31.1
|
-
|
Rule
13a-14(a)/15d-14(a) Certification executed by the Company's principal
executive officer (*)
|
|
|
31.2
|
-
|
Rule
13a-14(a)/15d-14(a) Certification executed by the Company's principal
financial officer (*)
|
|
|
32
|
-
|
Section
1350 Certification (*)
|
|
|
(1)
|
Incorporated
by reference to the exhibit so designated filed with the Company's Annual
Report on Form 10-K for the year ended December 31,
2003.
|
||
|
(2)
|
Incorporated
by reference to the exhibit so designated filed with the Company's Current
Report on Form 8-K filed on May 27, 2005.
|
||
|
(3)
|
Incorporated
by reference to the exhibit so designated filed with the Company's
Registration Statement on Form S-1 (Registration No. 33-51292), originally
filed on August 25, 1992.
|
||
|
(4)
|
Incorporated
by reference to the exhibit so designated filed with the Company's
Registration Statement on Form S-1 (Registration No. 33-59510), originally
filed on March 15, 1993.
|
||
|
(5)
|
Incorporated
by reference to exhibit 10.1 filed with the Company's Current Report on
Form 8-K/A filed on December 1, 2006.
|
||
|
(6)
|
Incorporated
by reference to exhibit 10.5 filed with the Company's Annual Report on
Form 10-K for the year ended December 31, 2006.
|
||
|
(7)
|
Incorporated
by reference to exhibit 10.6 filed with the Company's Annual Report on
Form 10-K for the year ended December 31, 2005.
|
||
|
(8)
|
Incorporated
by reference to exhibit 10.1 filed with the Company's Current Report on
Form 8-K filed on May 8, 2009.
|
||
|
(9)
|
Incorporated
by reference to exhibit 10.7 filed with the Company's Annual Report on
Form 10-K for the year ended December 31, 2004.
|
||
|
(10)
|
Incorporated
by reference to exhibit 10.8 filed with the Company's Quarterly Report on
Form 10-Q for the quarter ended March 30, 2008.
|
||
|
(11)
|
Incorporated
by reference to exhibit 10.1 filed with the Company's Current Report on
Form 8-K filed on May 11, 2009.
|
||
|
(12)
|
Incorporated
by reference to exhibit 10.14 filed with the Company's Annual Report on
Form 10-K for the year ended December 31, 2006.
|
||
|
(13)
|
Incorporated
by reference to exhibit 10.10 filed with the Company's Annual Report on
Form 10-K for the year ended December 31, 2007.
|
||
|
(14)
|
Incorporated
by reference to exhibit 10.12 filed with the Company's Annual Report on
Form 10-K for the year ended December 31, 2007.
|
||
|
(15)
|
Incorporated
by reference to exhibit 10.14 filed with the Company's Annual Report on
Form 10-K for the year ended December 31, 2006.
|
||
|
(16)
|
Incorporated
by reference to exhibit 10.15 filed with the Company's Annual Report on
Form 10-K for the year ended December 31,
2005.
|
||
|
(17)
|
Incorporated
by reference to the exhibit 10.1 filed with the Company's Current Report
on Form 8-K filed on October 11, 2006.
|
|
|
(*)
|
Filed
herewith.
|
|
(+)
|
Management
contract or compensatory plan or arrangement required to be filed pursuant
to Item 601 of Regulation S-K.
|
Pursuant
to the requirements of Section 13 or 15(d) of the Securities Exchange Act of
1934, the Registrant has duly caused this report to be signed on its behalf by
the undersigned, thereunto duly authorized.
|
By:
|
/s/Joseph
C. Muscari
|
|
Joseph
C. Muscari
|
|
|
Chairman
of the Board
and
Chief Executive Officer
|
February
25, 2010
Pursuant
to the requirements of the Securities Exchange Act of 1934, this report has been
signed below by the following persons on behalf of the Registrant in the
capacities and on the dates indicated:
|
SIGNATURE
|
TITLE
|
DATE
|
||
|
/s/
Joseph C. Muscari
|
Chairman
of the Board and Chief Executive Officer
|
February
25, 2010
|
||
|
Joseph
C. Muscari
|
(principal
executive officer)
|
|||
|
/s/
John A. Sorel
|
Senior
Vice President-Finance and
|
February
25, 2010
|
||
|
John
A. Sorel
|
Chief
Financial Officer (principal financial officer)
|
|||
|
/s/
Michael A. Cipolla
|
Vice
President - Controller and
|
February
25, 2010
|
||
|
Michael
A. Cipolla
|
Chief
Accounting Officer (principal accounting officer)
|
|||
|
SIGNATURE
|
TITLE
|
DATE
|
|
|
*
|
Director
|
February
25, 2010
|
|
|
Paula
H. J. Cholmondeley
|
|||
|
*
|
Director
|
February
25, 2010
|
|
|
Robert
L. Clark
|
|||
|
*
|
Director
|
February
25, 2010
|
|
|
Duane
R. Dunham
|
|||
|
*
|
Director
|
February
25, 2010
|
|
|
Steven
J. Golub
|
|||
|
*
|
Director
|
February
25, 2010
|
|
|
Michael
F. Pasquale
|
|||
|
*
|
Director
|
February
25, 2010
|
|
|
John
T. Reid
|
|||
|
*
|
Director
|
February
25, 2010
|
|
|
William
C. Stivers
|
|||
|
* By:
/s/ Thomas J. Meek
|
|||
|
Thomas
J. Meek
|
|||
|
Attorney-in-Fact
|
MINERALS
TECHNOLOGIES INC. AND SUBSIDIARY COMPANIES
_______________________________________
INDEX
TO CONSOLIDATED FINANCIAL STATEMENTS
|
Audited
Financial Statements:
|
Page
|
|||
|
|
Consolidated
Balance Sheets as of December 31, 2009 and 2008
|
F-2
|
||
|
Consolidated
Statements of Operations for the years ended December 31, 2009, 2008 and
2007
|
F-3
|
|||
|
Consolidated
Statements of Cash Flows for the years ended December 31, 2009, 2008 and
2007
|
F-4
|
|||
|
Consolidated
Statements of Shareholders' Equity for the years ended December 31, 2009,
2008 and 2007
|
F-5
|
|||
|
Notes
to Consolidated Financial
Statements
|
F-6
|
|||
|
Reports
of Independent Registered Public Accounting
Firm
|
F-34
|
|||
|
Management's
Report on Internal Control Over Financial
Reporting
|
F-36
|
|||
MINERALS
TECHNOLOGIES INC. AND SUBSIDIARY COMPANIES
CONSOLIDATED
BALANCE SHEET
(thousands
of dollars)
|
Assets
|
December
31,
|
||||||||||||
|
2009
|
2008
|
||||||||||||
|
Current
assets:
|
|||||||||||||
|
Cash
and cash equivalents
|
$
|
310,946
|
$
|
181,876
|
|||||||||
|
Short-term
investments, at cost which approximates market
|
8,940
|
9,258
|
|||||||||||
|
Accounts
receivable, less allowance for doubtful accounts:
|
|||||||||||||
|
2009
- $2,890; 2008 - $2,600
|
173,665
|
163,475
|
|||||||||||
|
Inventories
|
82,483
|
133,983
|
|||||||||||
|
Prepaid
expenses and other current assets
|
24,679
|
23,281
|
|||||||||||
|
Assets
held for disposal
|
--
|
19,674
|
|||||||||||
|
Total
current assets
|
600,713
|
531,547
|
|||||||||||
|
Property,
plant and equipment, less accumulated depreciation and
depletion
|
359,378
|
429,593
|
|||||||||||
|
Goodwill
|
68,101
|
66,414
|
|||||||||||
|
Prepaid
pension
costs
|
--
|
483
|
|||||||||||
|
Other
assets and deferred
charges
|
43,946
|
39,583
|
|||||||||||
|
Total
assets
|
$
|
1,072,138
|
$
|
1,067,620
|
|||||||||
|
Liabilities
and Shareholders' Equity
|
|||||||||||||
|
Current
liabilities:
|
|||||||||||||
|
Short-term
debt
|
$
|
6,892
|
$
|
14,984
|
|||||||||
|
Current
maturities of long-term debt
|
4,600
|
4,000
|
|||||||||||
|
Accounts
payable
|
74,513
|
67,393
|
|||||||||||
|
Accrued
compensation and related
items
|
28,302
|
27,100
|
|||||||||||
|
Restructuring
liabilities
|
8,282
|
6,840
|
|||||||||||
|
Other
current liabilities
|
30,325
|
29,802
|
|||||||||||
|
Liabilities
of assets held for disposal
|
--
|
734
|
|||||||||||
|
Total
current liabilities
|
152,914
|
150,853
|
|||||||||||
|
Long-term
debt
|
92,621
|
97,221
|
|||||||||||
|
Accrued
pension and postretirement
benefits
|
45,020
|
51,922
|
|||||||||||
|
Other
non-current
liabilities
|
33,840
|
32,793
|
|||||||||||
|
Total
liabilities
|
324,395
|
332,789
|
|||||||||||
|
Commitments
and contingent liabilities (Notes 19 and 20)
|
|||||||||||||
|
Shareholders'
equity:
|
|||||||||||||
|
Preferred
stock, without par value; 1,000,000 shares authorized; none
issued
|
--
|
--
|
|||||||||||
|
Common
stock at par, $0.10 par value; 100,000,000 shares
authorized;
|
|||||||||||||
|
issued
28,881,689 shares in 2009 and 28,832,875 shares in 2008
|
2,888
|
2,883
|
|||||||||||
|
Additional
paid-in
capital
|
318,256
|
312,972
|
|||||||||||
|
Retained
earnings
|
836,062
|
863,601
|
|||||||||||
|
Accumulated
other comprehensive income
(loss)
|
3,193
|
(31,634
|
)
|
||||||||||
|
Less
common stock held in treasury, at cost; 10,141,073
|
|||||||||||||
|
shares
in 2009 and 2008
|
(436,238
|
)
|
(436,238
|
)
|
|||||||||
|
Total
MTI shareholders' equity
|
724,161
|
711,584
|
|||||||||||
|
Non-controlling
interest
|
23,582
|
23,247
|
|||||||||||
|
Total
shareholders’ equity
|
747,743
|
734,831
|
|||||||||||
|
Total
liabilities and shareholders' equity
|
$
|
1,072,138
|
$
|
1,067,620
|
|||||||||
See Notes
to Consolidated Financial Statements, which are an integral part of these
statements.
MINERALS
TECHNOLOGIES INC. AND SUBSIDIARY COMPANIES
CONSOLIDATED
STATEMENTS OF OPERATION
(thousands
of dollars, except per share data)
|
Year
Ended December 31,
|
||||||||||||||
|
|
2009
|
2008
|
2007
|
|||||||||||
|
Net
sales
|
$
|
907,321
|
$
|
1,112,212
|
$
|
1,077,721
|
||||||||
|
Cost
of goods sold
|
751,503
|
891,738
|
845,136
|
|||||||||||
|
Production
margin
|
155,818
|
220,474
|
232,585
|
|||||||||||
|
Marketing
and administrative expenses
|
91,075
|
101,857
|
104,649
|
|||||||||||
|
Research
and development expenses
|
19,941
|
23,052
|
26,348
|
|||||||||||
|
Impairment
of assets
|
39,831
|
209
|
94,070
|
|||||||||||
|
Restructuring
and other costs
|
22,024
|
13,365
|
16,017
|
|||||||||||
|
Income
(loss) from operations
|
(17,053
|
)
|
81,991
|
(8,499
|
)
|
|||||||||
|
|
Interest
income
|
2,874
|
4,905
|
3,083
|
||||||||||
|
Interest
expense
|
(3,490
|
)
|
(5,181
|
)
|
(8,701
|
)
|
||||||||
|
Foreign
exchange gains (losses)
|
(2,452
|
)
|
1,694
|
513
|
||||||||||
|
Other
income (deductions)
|
(3,019
|
)
|
(1,142
|
)
|
2,105
|
|||||||||
|
Non-operating
income (deductions), net
|
(6,087
|
)
|
276
|
(3,000
|
)
|
|||||||||
|
Income
(loss) from continuing operation before provision
(benefit)
|
||||||||||||||
|
for
taxes on income
|
(23,140
|
)
|
82,267
|
(11,499
|
)
|
|||||||||
|
Provision
(benefit) for taxes on income
|
(5,387
|
)
|
24,079
|
11,266
|
||||||||||
|
Income
(loss) from continuing operations, net of tax
|
(17,753
|
)
|
58,188
|
(22,765
|
)
|
|||||||||
|
Income
(loss) from discontinued operations, net of tax
|
(3,151
|
)
|
10,282
|
(37,845
|
)
|
|||||||||
|
Consolidated
net income (loss)
|
(20,904
|
)
|
68,470
|
(60,610
|
)
|
|||||||||
|
Less:
Net income attributable to non-controlling interests
|
(2,892
|
)
|
(3,183
|
)
|
(2,904
|
)
|
||||||||
|
Net
income (loss) attributable to Minerals Technologies Inc.
(MTI)
|
$
|
(23,796
|
)
|
$
|
65,287
|
$
|
(63,514
|
)
|
||||||
|
Earnings
per share:
|
||||||||||||||
|
Basic:
|
||||||||||||||
|
Income
(loss) from continuing operations attributable to MTI
|
$
|
(1.10
|
)
|
$
|
2.91
|
$
|
(1.34
|
)
|
||||||
|
Income
(loss) from discontinued operations attributable to MTI
|
(0.17
|
)
|
0.54
|
(1.97
|
)
|
|||||||||
|
|
Basic
earnings (loss) per share attributable to MTI
|
$
|
(1.27
|
)
|
$
|
3.45
|
$
|
(3.31
|
)
|
|||||
|
Diluted:
|
||||||||||||||
|
Income
(loss) from continuing operations attributable to MTI
|
$
|
(1.10
|
)
|
$
|
2.90
|
$
|
(1.34
|
)
|
||||||
|
Income
(loss) from discontinued operations attributable to MTI
|
(0.17
|
)
|
0.54
|
(1.97
|
)
|
|||||||||
|
|
Diluted
earnings (loss) per share attributable to MTI
|
$
|
(1.27
|
)
|
$
|
3.44
|
$
|
(3.31
|
)
|
|||||
See Notes
to Consolidated Financial Statements, which are an integral part of these
statements.
MINERALS
TECHNOLOGIES INC. AND SUBSIDIARY COMPANIES
CONSOLIDATED
STATEMENTS OF CASH FLOWS
(thousands
of dollars)
|
Year
Ended December 31,
|
||||||||||||
|
2009
|
2008
|
2007
|
||||||||||
|
Operating
Activities
|
||||||||||||
|
Consolidated
net income (loss)
|
$
|
(20,904
|
)
|
$
|
68,470
|
$
|
(60,610
|
)
|
||||
|
Income
(loss) from discontinued operations
|
(3,151
|
)
|
10,282
|
(37,845
|
)
|
|||||||
|
Income
(loss) from continuing operations
|
(17,753
|
)
|
58,188
|
(22,765
|
)
|
|||||||
|
Adjustments
to reconcile income (loss) from continuing operations
to
net cash provided by operating activities:
|
||||||||||||
|
Depreciation,
depletion and amortization
|
72,401
|
80,146
|
84,565
|
|||||||||
|
Impairment
of assets
|
39,831
|
209
|
94,070
|
|||||||||
|
Pension
settlement loss and amortization
|
18,833
|
11,293
|
5,604
|
|||||||||
|
Loss
on disposal of property, plant and equipment
|
793
|
989
|
1,639
|
|||||||||
|
Deferred
income taxes
|
(23,989
|
)
|
(3,001
|
)
|
(15,148
|
)
|
||||||
|
Provisions
for bad debts
|
1,271
|
159
|
(49
|
)
|
||||||||
|
Stock-based
compensation
|
5,780
|
4,952
|
4,196
|
|||||||||
|
Other
|
--
|
--
|
(175
|
)
|
||||||||
|
Changes
in operating assets and liabilities, net of effects of
acquisitions:
|
||||||||||||
|
|
Accounts
receivable
|
(7,680
|
)
|
9,060
|
15,281
|
|||||||
|
Inventories
|
58,835
|
(35,595
|
)
|
15,223
|
||||||||
|
Prepaid
expenses and other current assets
|
8,558
|
254
|
(923
|
)
|
||||||||
|
Pension
plan funding
|
(8,642
|
)
|
(3,180
|
)
|
(24,050
|
)
|
||||||
|
Accounts
payable
|
5,455
|
3,959
|
4,049
|
|||||||||
|
Restructuring
liabilities
|
1,442
|
(7,639
|
)
|
14,479
|
||||||||
|
Income
taxes payable
|
2,090
|
4,333
|
3,956
|
|||||||||
|
Tax
benefits related to stock incentive programs
|
42
|
1,696
|
2,649
|
|||||||||
|
Other
|
(778
|
)
|
4,296
|
(1,377
|
)
|
|||||||
|
Net
cash provided by continuing operations
|
156,489
|
130,119
|
181,224
|
|||||||||
|
Net
cash provided by (used in) discontinued operations
|
4,340
|
4,092
|
(1,533
|
)
|
||||||||
|
Net
cash provided by operations
|
160,829
|
134,211
|
179,691
|
|||||||||
|
Investing
Activities
|
||||||||||||
|
Purchases
of property, plant and equipment
|
(26,591
|
)
|
(31,027
|
)
|
(46,072
|
)
|
||||||
|
Purchases
of short-term investments
|
(7,144
|
)
|
(10,007
|
)
|
(14,798
|
)
|
||||||
|
Proceeds
from sales of short-term investments
|
10,052
|
6,654
|
14,147
|
|||||||||
|
Proceeds
from disposal of property, plant and equipment
|
838
|
609
|
354
|
|||||||||
|
Proceeds
from insurance settlement
|
--
|
--
|
3,000
|
|||||||||
|
Net
cash used in investing activities - continuing operations
|
(22,845
|
)
|
(33,771
|
)
|
(43,369
|
)
|
||||||
|
Net
cash provided by (used in) investing activities - discontinued
operations
|
4,428
|
14,978
|
(3,376
|
)
|
||||||||
|
Net
cash used in investing activities
|
(18,417
|
)
|
(18,793
|
)
|
(46,745
|
)
|
||||||
|
Financing
Activities
|
||||||||||||
|
Proceeds
from issuance of long-term debt
|
--
|
--
|
7,741
|
|||||||||
|
Repayment
of long-term debt
|
(4,000
|
)
|
(17,114
|
)
|
(5,411
|
)
|
||||||
|
Net
proceeds from issuance (repayment) of short-term debt
|
(8,249
|
)
|
4,840
|
(78,206
|
)
|
|||||||
|
Purchase
of common shares for treasury
|
--
|
(45,281
|
)
|
(25,339
|
)
|
|||||||
|
Cash
dividends paid
|
(3,743
|
)
|
(3,782
|
)
|
(3,845
|
)
|
||||||
|
Proceeds
from issuance of stock under option plan
|
172
|
11,538
|
17,953
|
|||||||||
|
Excess
tax benefits related to stock incentive programs
|
12
|
610
|
889
|
|||||||||
|
Net
cash used in financing activities
|
(15,808
|
)
|
(49,189
|
)
|
(86,218
|
)
|
||||||
|
Effect
of exchange rate changes on cash and cash equivalents
|
2,466
|
(13,338
|
)
|
14,328
|
||||||||
|
Net
increase in cash and cash equivalents
|
129,070
|
52,891
|
61,056
|
|||||||||
|
Cash
and cash equivalents at beginning of year
|
181,876
|
128,985
|
67,929
|
|||||||||
|
Cash
and cash equivalents at end of year
|
$
|
310,946
|
$
|
181,876
|
$
|
128,985
|
||||||
|
Non-cash
Investing and Financing Activities:
|
||||||||||||
|
Treasury
stock purchases settled after year-end
|
$
|
--
|
$
|
--
|
$
|
2,552
|
||||||
See Notes
to Consolidated Financial Statements, which are an integral part of these
statements.
MINERALS
TECHNOLOGIES INC. AND SUBSIDIARY COMPANIES
CONSOLIDATED
STATEMENTS OF SHAREHOLDERS' EQUITY
(in
thousands)
|
Equity
Attributable to MTI
|
|||||||||||||||||||||||||||
|
Common
Stock
|
Additional
Paid-in
Capital
|
Retained
Earnings
|
Accumulated
Other
Comprehensive
Income
(Loss)
|
Treasury
Stock
|
Non-controlling
Interests
|
Total
|
|||||||||||||||||||||
|
Balance
as of January 1, 2007
|
$
|
2,810
|
$
|
269,101
|
$
|
867,512
|
$
|
(21,248
|
)
|
$
|
(365,618
|
)
|
$
|
18,258
|
$
|
770,815
|
|||||||||||
|
Comprehensive
Income:
|
|||||||||||||||||||||||||||
|
Net
income (loss)
|
--
|
--
|
(63,514
|
)
|
--
|
--
|
2,904
|
(60,610
|
)
|
||||||||||||||||||
|
Currency
translation adjustment
|
--
|
--
|
--
|
48,488
|
--
|
1,627
|
50,115
|
||||||||||||||||||||
|
Unamortized
gains and prior service cost
|
--
|
--
|
--
|
18,106
|
--
|
--
|
18,106
|
||||||||||||||||||||
|
Cash
flow hedge:
|
|||||||||||||||||||||||||||
|
Net
derivative losses arising during the year
|
--
|
--
|
--
|
(43
|
)
|
--
|
--
|
(43
|
)
|
||||||||||||||||||
|
Reclassification
adjustment
|
--
|
--
|
--
|
62
|
--
|
--
|
62
|
||||||||||||||||||||
|
Total
comprehensive income (loss)
|
--
|
--
|
(63,514
|
)
|
66,613
|
--
|
4,531
|
7,630
|
|||||||||||||||||||
|
Dividends
declared
|
--
|
--
|
(3,845
|
)
|
--
|
--
|
--
|
(3,845
|
)
|
||||||||||||||||||
|
Dividends
to non-controlling interests.
|
--
|
--
|
--
|
--
|
--
|
(670
|
)
|
(670
|
)
|
||||||||||||||||||
|
Opening
retained earnings adjustment due
|
|||||||||||||||||||||||||||
|
to
adoption of FIN 48
|
--
|
--
|
1,943
|
--
|
--
|
--
|
1,943
|
||||||||||||||||||||
|
Employee
benefit transactions
|
44
|
17,909
|
--
|
--
|
--
|
--
|
17,953
|
||||||||||||||||||||
|
Income
tax benefit arising from employee
|
--
|
--
|
--
|
--
|
--
|
--
|
--
|
||||||||||||||||||||
|
stock
option plans
|
--
|
3,161
|
--
|
--
|
--
|
--
|
3,161
|
||||||||||||||||||||
|
Amortization
of restricted stock
|
--
|
1,813
|
--
|
--
|
--
|
--
|
1,813
|
||||||||||||||||||||
|
Stock
option expenses
|
--
|
2,383
|
--
|
--
|
--
|
--
|
2,383
|
||||||||||||||||||||
|
Purchase
of common stock for treasury
|
--
|
--
|
--
|
--
|
(27,891
|
)
|
--
|
(27,891
|
)
|
||||||||||||||||||
|
Balance
as of December 31, 2007
|
$
|
2,854
|
$
|
294,367
|
$
|
802,096
|
$
|
45,365
|
$
|
(393,509
|
)
|
$
|
22,119
|
$
|
773,292
|
||||||||||||
|
Comprehensive
Income (loss):
|
|||||||||||||||||||||||||||
|
Net
income
|
--
|
--
|
65,287
|
--
|
--
|
3,183
|
68,470
|
||||||||||||||||||||
|
Currency
translation adjustment
|
--
|
--
|
--
|
(49,417
|
)
|
--
|
(1,400
|
)
|
(50,817
|
)
|
|||||||||||||||||
|
Unamortized
losses and prior service cost
|
--
|
--
|
--
|
(28,751
|
)
|
--
|
--
|
(28,751
|
)
|
||||||||||||||||||
|
Cash
flow hedge:
|
|||||||||||||||||||||||||||
|
Net
derivative gains arising during the year
|
--
|
--
|
--
|
1,126
|
--
|
--
|
1,126
|
||||||||||||||||||||
|
Reclassification
adjustment
|
--
|
--
|
--
|
43
|
--
|
--
|
43
|
||||||||||||||||||||
|
Total
comprehensive income (loss)
|
--
|
--
|
65,287
|
(76,999
|
)
|
--
|
1,783
|
(9,929
|
)
|
||||||||||||||||||
|
Dividends
declared
|
--
|
--
|
(3,782
|
)
|
--
|
--
|
--
|
(3,782
|
)
|
||||||||||||||||||
|
Dividends
to non-controlling interests
|
--
|
--
|
--
|
|
--
|
--
|
(655
|
)
|
(655
|
)
|
|||||||||||||||||
|
Employee
benefit transactions
|
29
|
11,509
|
--
|
--
|
--
|
--
|
11,538
|
||||||||||||||||||||
|
Income
tax benefit arising from employee
|
|||||||||||||||||||||||||||
|
stock
option plans
|
--
|
2,143
|
--
|
--
|
--
|
--
|
2,143
|
||||||||||||||||||||
|
Amortization
of restricted stock
|
--
|
2,994
|
--
|
--
|
--
|
--
|
2,994
|
||||||||||||||||||||
|
Stock
option expenses
|
--
|
1,959
|
--
|
--
|
--
|
--
|
1,959
|
||||||||||||||||||||
|
Purchase
of common stock for treasury
|
--
|
--
|
--
|
--
|
(42,729
|
)
|
--
|
(42,729
|
)
|
||||||||||||||||||
|
Balance
as of December 31, 2008
|
$
|
2,883
|
$
|
312,972
|
$
|
863,601
|
$
|
(31,634
|
)
|
$
|
(436,238
|
)
|
$
|
23,247
|
$
|
734,831
|
|||||||||||
|
Comprehensive
Income (loss):
|
|||||||||||||||||||||||||||
|
Net
income (loss)
|
--
|
--
|
(23,796
|
)
|
--
|
--
|
2,892
|
(20,904
|
)
|
||||||||||||||||||
|
Currency
translation adjustment
|
--
|
--
|
--
|
23,479
|
--
|
873
|
24,352
|
||||||||||||||||||||
|
Unamortized
gains and prior service cost
|
--
|
--
|
--
|
12,789
|
--
|
--
|
12,789
|
||||||||||||||||||||
|
Cash
flow hedge:
|
|||||||||||||||||||||||||||
|
Net
derivative losses arising during the year
|
--
|
--
|
--
|
(1,548
|
)
|
--
|
--
|
(1,548
|
)
|
||||||||||||||||||
|
Reclassification
adjustment
|
--
|
--
|
--
|
107
|
--
|
--
|
107
|
||||||||||||||||||||
|
Total
comprehensive income (loss)
|
--
|
--
|
(23,796
|
34,827
|
--
|
3,765
|
14,796
|
||||||||||||||||||||
|
Dividends
declared
|
(3,743
|
)
|
(3,743
|
)
|
|||||||||||||||||||||||
|
Dividends
to non-controlling interests
|
--
|
--
|
--
|
--
|
--
|
(3,430
|
)
|
(3,430
|
)
|
||||||||||||||||||
|
Employee
benefit transactions
|
5
|
322
|
--
|
--
|
--
|
--
|
327
|
||||||||||||||||||||
|
Income
tax benefit arising from employee
|
|||||||||||||||||||||||||||
|
stock
option plans
|
--
|
56
|
--
|
--
|
--
|
--
|
56
|
||||||||||||||||||||
|
Amortization
of restricted stock
|
--
|
2,750
|
--
|
--
|
--
|
--
|
2,750
|
||||||||||||||||||||
|
Stock
option expenses
|
--
|
2,156
|
--
|
--
|
--
|
--
|
2,156
|
||||||||||||||||||||
|
Purchase
of common stock for treasury
|
--
|
--
|
--
|
--
|
--
|
--
|
--
|
||||||||||||||||||||
|
Balance
as of December 31, 2009
|
$
|
2,888
|
$
|
318,256
|
$
|
836,062
|
$
|
3,193
|
$
|
(436,238
|
)
|
$
|
23,582
|
$
|
747,743
|
||||||||||||
See Notes to Consolidated Financial
Statements, which are an integral part of these
statements.
F-5
MINERALS
TECHNOLOGIES INC. AND SUBSIDIARY COMPANIES
NOTES
OF CONSOLIDATED FINANCIAL STATEMENTS
Note
1. Summary of Significant Accounting Policies
Basis of
Presentation
The
accompanying consolidated financial statements include the accounts of Minerals
Technologies Inc. (the "Company") and its wholly and majority-owned
subsidiaries. All intercompany balances and transactions have been eliminated in
consolidation.
Certain
reclassifications were made to prior year amounts to conform with the current
year presentation.
Use of Estimates
The
Company employs accounting policies that are in accordance with U.S. generally
accepted accounting principles and require management to make estimates and
assumptions relating to the reporting of assets and liabilities and the
disclosure of contingent assets and liabilities at the date of the consolidated
financial statements and the reported amounts of revenue and expenses during the
reported period. Significant estimates include those related to allowance for
doubtful accounts, valuation of inventories, valuation of long-lived assets,
goodwill and other intangible assets, pension plan assumptions, income tax,
valuation allowances, and litigation and environmental liabilities. Actual
results could differ from those estimates.
Business
The
Company is a resource- and technology-based company that develops, produces and
markets on a worldwide basis a broad range of specialty mineral, mineral-based
products and related systems and technologies. The Company's products are used
in the manufacturing processes of the paper and steel industries, as well as by
the building materials, polymers, ceramics, paints and coatings, and other
manufacturing industries.
Cash Equivalents and Short-term
Investments
The
Company considers all highly liquid investments with original maturities of
three months or less to be cash equivalents. Short-term investments consist of
financial instruments with original maturities beyond three months, but less
than twelve months. Short-term investments amounted to $8.9 million and $9.3
million at December 31, 2009 and 2008, respectively.
Trade Accounts
Receivable
Trade
accounts receivables are recorded at the invoiced amount and do not bear
interest. The allowance for doubtful accounts is the Company's best estimate of
the amount of probable credit losses in the Company's existing accounts
receivable. The Company determines the allowance based on historical write-off
experience and specific allowances for bankrupt customers. The Company also
analyzes the collection history and financial condition of its other customers,
considering current industry conditions and determines whether an allowance
needs to be established. The Company reviews its allowance for doubtful accounts
monthly. Past due balances over 90 days based on payment terms are reviewed
individually for collectibility. Account balances are charged off
against the allowance after all means of collection have been exhausted and the
potential for recovery is considered remote. The Company does not have any
off-balance-sheet credit exposure related to its customers.
Inventories
Inventories
are valued at the lower of cost or market. Cost is determined by the first-in,
first-out (FIFO) method.
Additionally,
items such as idle facility expense, excessive spoilage, freight handling costs
and re-handling costs are recognized as current period charges. The allocation
of fixed production overheads to the costs of conversion are based upon the
normal capacity of the production facility. Fixed overhead costs associated with
idle capacity are expensed as incurred.
Property, Plant and
Equipment
Property,
plant and equipment are recorded at cost. Significant improvements are
capitalized, while maintenance and repair expenditures are charged to operations
as incurred. The Company capitalizes interest cost as a component of
construction in progress. In general, the straight-line method of depreciation
is used for financial reporting purposes. The annual rates of depreciation are
3% - 6.67% for buildings, 6.67% - 12.5% for machinery and equipment, 8% - 12.5%
for furniture and fixtures and 12.5% - 25% for computer equipment and
software-related assets. The estimated useful lives of our PCC production
facilities and machinery and equipment pertaining to our natural stone mining
and processing plants and our chemical plants are 15 years.
Property,
plant and equipment are depreciated over their useful lives. Useful lives are
based on management's estimates of the period that the assets can generate
revenue, which does not necessarily coincide with the remaining term of a
customer's contractual obligation to purchase products made using those assets.
The Company's sales of PCC are predominantly pursuant to long-term evergreen
contracts, initially ten years in length, with paper mills at which the Company
operates satellite PCC plants. The terms of many of these agreements have been
extended, often in connection with an expansion of
F-6
MINERALS
TECHNOLOGIES INC. AND SUBSIDIARY COMPANIES
NOTES
OF CONSOLIDATED FINANCIAL STATEMENTS
the
satellite PCC plant. Failure of a PCC customer to renew an agreement or continue
to purchase PCC from a Company facility could result in an impairment of assets
charge or accelerated depreciation at such facility.
Depletion
of mineral reserves is determined on a unit-of-extraction basis for financial
reporting purposes, based upon proven and probable reserves, and on a percentage
depletion basis of tax purposes.
Stripping Costs Incurred During
Production
Stripping
costs are those costs incurred for the removal of waste materials for the
purpose of accessing ore body that will be produced
commercially. Stripping costs incurred during the production phase of
a mine are variable costs that are included in the costs of inventory produced
during the period that the stripping costs are incurred.
Accounting for the Impairment of
Long-Lived Assets
Long-lived
assets are reviewed for impairment whenever events or changes in circumstances
indicate that the carrying amount of an asset may not be recoverable. If events
or changes in circumstances indicate that the carrying amount of an asset may
not be recoverable, the Company estimates the undiscounted future cash flows
(excluding interest), resulting from the use of the asset and its ultimate
disposition. If the sum of the undiscounted cash flows (excluding
interest) is less than the carrying value, the Company recognizes an impairment
loss, measured as the amount by which the carrying value exceeds the fair value
of the asset, determined principally using discounted cash flows.
Goodwill and Other Intangible
Assets
Goodwill
represents the excess of purchase price and related costs over the value
assigned to the net tangible and identifiable intangible assets of businesses
acquired. Goodwill and other intangible assets with indefinite lives are not
amortized, but instead tested for impairment at least
annually. Intangible assets with estimable useful lives are amortized
over their respective estimated lives to the estimated residual values, and
reviewed for impairment.
The
Company evaluates the recoverability of goodwill using a two-step impairment
test approach at the reporting unit level. In the first step, the fair value for
the reporting unit is compared to its book value including goodwill. In the case
that the fair value of the reporting unit is less than book value, a second step
is performed which compares the fair value of the reporting unit's goodwill to
the book value of the goodwill. The fair value for the goodwill is determined
based on the difference between the fair values of the reporting unit and the
net fair values of the identifiable assets and liabilities of such reporting
unit. If the fair value of the goodwill is less than the book value, the
difference is recognized as an impairment.
Accounting for Asset Retirement
Obligations
The
Company provides for obligations associated with the retirement of long-lived
assets and the associated asset retirement costs. The fair value of a liability
for an asset retirement obligation is recognized in the period in which it is
incurred if a reasonable estimate of fair value can be made. The associated
asset retirement costs are capitalized as part of the carrying amount of the
long-lived asset. The Company also provides for legal obligations to perform
asset retirement activities where timing or methods of settlement are
conditional on future events.
Fair Value of Financial
Instruments
The
recorded amounts of cash and cash equivalents, receivables, short-term
borrowings, accounts payable, accrued interest, and variable-rate long-term debt
approximate fair value because of the short maturity of those instruments or the
variable nature of underlying interest rates. Short-term investments are
recorded at cost, which approximates fair market value.
Derivative Financial
Instruments
The
Company records derivative financial instruments which are used to hedge certain
foreign exchange risk at fair value on the balance sheet. See Note 12
for a full description of the Company's hedging activities and related
accounting policies.
Revenue
Recognition
Revenue
from sale of products is recognized at the time the goods are shipped and title
passes to the customer. In most of the Company's PCC contracts, the price per
ton is based upon the total number of tons sold to the customer during the year.
Under those contracts the price billed to the customer for shipments during the
year is based on periodic estimates of the total annual volume that will be sold
to such customer. Revenues are adjusted at the end of each year to reflect the
actual volume sold. The Company also has consignment arrangements with certain
customers in our Refractories segment. Revenues for these transactions are
recorded when the consigned products are consumed by the customer.
Revenues
from sales of equipment are recorded upon completion of installation and receipt
of customer acceptance. Revenues from services are recorded when the services
have been performed.
F-7
MINERALS
TECHNOLOGIES INC. AND SUBSIDIARY COMPANIES
NOTES
OF CONSOLIDATED FINANCIAL STATEMENTS
Foreign
Currency
The
assets and liabilities of the Company's international subsidiaries are
translated into U.S. dollars using exchange rates at the respective balance
sheet date. The resulting translation adjustments are recorded in accumulated
other comprehensive income (loss) in shareholders' equity. Income statement
items are generally translated at monthly average exchange rates prevailing
during the period. International subsidiaries operating in highly inflationary
economies translate non-monetary assets at historical rates, while net monetary
assets are translated at current rates, with the resulting translation
adjustments included in net income. At December 31, 2009, the Company had no
international subsidiaries operating in highly inflationary
economies.
Income Taxes
Deferred
tax assets and liabilities are recognized for the estimated future tax
consequences attributable to differences between the financial statement
carrying amounts of existing assets and liabilities and their respective tax
bases. Deferred tax assets and liabilities are measured using enacted tax rates
in effect for the year in which those temporary differences are expected to be
recovered or settled. The effect on deferred tax assets and liabilities of a
change in tax rates is recognized in income in the period that includes the
enactment date.
The
Company operates in multiple taxing jurisdictions, both within the U.S. and
outside the U.S. In certain situations, a taxing authority may challenge
positions that the Company has adopted in its income tax filings. The Company
regularly assesses its tax position for such transactions and includes reserves
for those differences in position. The reserves are utilized or reversed once
the statute of limitations has expired or the matter is otherwise
resolved.
The
application of income tax law is inherently complex. Laws and regulations in
this area are voluminous and are often ambiguous. As such, we are required to
make many subjective assumptions and judgments regarding our income tax
exposures. Interpretations of and guidance surrounding income tax laws and
regulations change over time. As such, changes in our subjective assumptions and
judgments can materially affect amounts recognized in the consolidated balance
sheets and statements of operations. The Company's accounting policy is to
recognize interest and penalties as part of its provision for income taxes. See
Note 5 to the consolidated financial statements, "Income Taxes," for additional
detail on our uncertain tax positions.
The
accompanying financial statements generally do not include a provision for U.S.
income taxes on international subsidiaries' unremitted earnings, which are
expected to be permanently reinvested overseas.
Research and Development
Expenses
Research
and development expenses are expensed as incurred.
Accounting
for Stock-Based Compensation
The
Company recognizes compensation expense for share-based awards based upon the
grant date fair value over the vesting period.
Pension and Post-retirement
Benefits
The
Company has defined benefit pension plans covering the majority of its
employees. The benefits are generally based on years of service and an
employee's modified career earnings.
The
Company also provides post-retirement healthcare benefits for the majority of
its retirees and employees in the United States. The Company measures the costs
of its obligation based on its best estimate. The net periodic costs are
recognized as employees render the services necessary to earn the
post-retirement benefits.
Environmental
Expenditures
that relate to current operations are expensed or capitalized as appropriate.
Expenditures that relate to an existing condition caused by past operations and
which do not contribute to current or future revenue generation are expensed.
Liabilities are recorded when it is probable the Company will be obligated to
pay amounts for environmental site evaluation, remediation or related costs, and
such amounts can be reasonably estimated.
Earnings Per
Share
Basic
earnings per share have been computed based upon the weighted average number of
common shares outstanding during the period.
Diluted
earnings per share have been computed based upon the weighted average number of
common shares outstanding during the period assuming the issuance of common
shares for all potentially dilutive common shares outstanding.
F-8
MINERALS
TECHNOLOGIES INC. AND SUBSIDIARY COMPANIES
NOTES
OF CONSOLIDATED FINANCIAL STATEMENTS
Subsequent
events
The
Company has evaluated for subsequent events through February 25, 2010, which is
the date of issuance of its financial statements.
Noncontrolling
Interests
In
2009, the Company adopted the provisions of a standard issued on Noncontrolling
Interests. The income statement has been revised to separately
present consolidated net income, which now includes the amounts attributable to
the Company plus noncontrolling interests and net income attributable solely to
the Company. Additionally, noncontrolling interests are considered a
component of equity for all periods presented. Prior year
presentations have been restated to conform with the new
statement. All income attributable to noncontrolling
interests for the periods presented was from continuing operations
and there were no changes in MTI’s ownership interest.
Note
2. Stock-Based Compensation
The
Company has a 2001 Stock Award and Incentive Plan (the "Plan"), which provides
for grants of incentive and non-qualified stock options, restricted stock, stock
appreciation rights, stock awards or performance unit awards. The Plan is
administered by the Compensation Committee of the Board of Directors. Stock
options granted under the Plan generally have a ten year term. The exercise
price for stock options are at prices at or above the fair market value of the
common stock on the date of the grant, and each award of stock options will vest
ratably over a specified period, generally three years.
Stock-based
compensation expense is recognized in the consolidated financial statements for
stock options based on the grant date fair value.
Net
income (loss) for years ended 2009, 2008 and 2007 include $2.2 million, $2.0
million and $2.4 million pretax compensation costs, respectively, related to
stock option expense as a component of marketing and administrative
expenses. All stock option expense is recognized in the consolidated
statements of operations. The related tax benefit included in the statement of
operations on the non-qualified stock options is $0.9 million, $0.7 million and
$0.6 million for 2009, 2008 and 2007, respectively.
The
benefits of tax deductions in excess of the tax benefit from compensation costs
that were recognized or would have been recognized are classified as financing
inflows on the consolidated statement of cash flows.
Stock
Options
The
fair value of options granted is estimated on the date of grant using the
Black-Scholes valuation model. Compensation expense is recognized
only for those options expected to vest, with forfeitures estimated at the date
of grant based on the Company's historical experience and future expectations.
The forfeiture rate assumption used for the period ended December 31, 2009 was
approximately 8.8%.
The
weighted average grant date fair value for stock options granted during the
years ended December 31, 2009, 2008 and 2007 was $11.86, $19.11 and $21.61,
respectively. The weighted average grant date fair value for stock options
vested during 2009, 2008 and 2007 was $20.15, $21.12 and $20.83,
respectively. The total intrinsic value of stock options exercised
during the years ended December 31, 2009, 2008 and 2007 was $0.1 million, $5.9
million and $9.4 million, respectively.
The
fair value for stock awards was estimated at the date of grant using the
Black-Scholes option valuation model with the following weighted average
assumptions for the years ended December 31, 2009, 2008 and 2007:
|
2009
|
2008
|
2007
|
|||||||||
|
Expected
life
(years)
|
6.3
|
6.3
|
6.5
|
||||||||
|
Interest
rate
|
1.87
|
%
|
2.50
|
%
|
4.50
|
%
|
|||||
|
Volatility
|
28.01
|
%
|
25.20
|
%
|
25.10
|
%
|
|||||
|
Expected
dividend
yield
|
0.50
|
%
|
0.34
|
%
|
0.26
|
%
|
|||||
The
expected term of the options represents the estimated period of time until
exercise and is based on historical experience of similar awards, based upon
contractual terms, vesting schedules, and expectations of future employee
behavior. The expected stock-price volatility is based upon the
historical and implied volatility of the Company's stock. The
interest rate is based upon the implied yield on U.S. Treasury bills with an
equivalent remaining term. Estimated dividend yield is based upon
historical dividends paid by the Company.
F-9
MINERALS
TECHNOLOGIES INC. AND SUBSIDIARY COMPANIES
NOTES
OF CONSOLIDATED FINANCIAL STATEMENTS
The
following table summarizes stock option activity for the year ended December 31,
2009:
|
Shares
|
Weighted
Average Exercise Price Per Share
|
Weighted
Average Remaining Contractual Life (Years)
|
Aggregate Intrinsic Value
(in
thousands)
|
|||||||||
|
Balance
January 1, 2009
|
661,781
|
$
|
55.14
|
|||||||||
|
Granted
|
179,200
|
39.84
|
||||||||||
|
Exercised
|
(7,532
|
)
|
35.63
|
|||||||||
|
Canceled
|
(45,919
|
)
|
43.14
|
|||||||||
|
Balance
December 31, 2009
|
787,530
|
52.54
|
5.87
|
$
|
3,778
|
|||||||
|
Exercisable,
December 31, 2009
|
466,013
|
$
|
54.33
|
2.72
|
$
|
2,321
|
The
aggregate intrinsic value above is calculated before applicable income taxes,
based on the Company's closing stock price of $54.47 as of the last business day
of the period ended December 31, 2009 had all options been exercised on that
date. The weighted average intrinsic value of the options exercised during 2009,
2008 and 2007 was $18.50, $22.47 and $21.70 per share,
respectively. As of December 31, 2009, total unrecognized stock-based
compensation expense related to nonvested stock options was approximately $2.3
million, which is expected to be recognized over a weighted average period of
approximately three years.
The
Company issues new shares of common stock upon the exercise of stock
options.
Non-vested
stock option activity for the year ended December 31, 2009 is as
follows:
|
Shares
|
Weighted
Average Exercise Price Per Share
|
|||||
|
Nonvested
options outstanding at December 31, 2008
|
225,190
|
$
|
62.38
|
|||
|
Options
granted
|
179,200
|
39.84
|
||||
|
Options
vested
|
(80,707
|
)
|
61.76
|
|||
|
Options
forfeited
|
(2,166
|
)
|
64.86
|
|||
|
Nonvested
options outstanding, December 31, 2009
|
321,517
|
$
|
49.96
|
The
following table summarizes additional information concerning options outstanding
at December 31, 2009:
|
Options
Outstanding
|
Options
Exercisable
|
|||||||||||||||
|
Range
of
Exercise
Prices
|
Number
Outstanding at 12/31/09
|
Weighted
Average Remaining Contractual Term (Years)
|
Weighted
Average Exercise Price
|
Number
Exercisable
at
12/31/09
|
Weighted
Average Exercise Price
|
|||||||||||
|
$
|
34.825
|
-
|
$
|
44.360
|
195,748
|
8.4
|
$
|
39.43
|
16,548
|
$
|
34.94
|
|||||
|
$
|
46.625
|
-
|
$
|
54.225
|
307,149
|
3.7
|
$
|
51.73
|
307,149
|
$
|
51.73
|
|||||
|
$
|
55.870
|
-
|
$
|
69.315
|
284,633
|
6.4
|
$
|
62.45
|
142,316
|
$
|
62.19
|
|||||
|
$
|
34.825
|
-
|
$
|
69.315
|
787,530
|
5.9
|
$
|
52.54
|
466,013
|
$
|
54.33
|
|||||
Restricted
Stock
The
Company has granted certain corporate officers rights to receive shares of the
Company's common stock under the Company's 2001 Stock Award and Incentive Plan
(the "Plan"). The rights will be deferred for a specified number of
years of service, subject to restrictions on transfer and other conditions.
Compensation expense for these shares is recognized over the vesting period. The
Company granted 101,400 shares, 68,600 shares and 87,650 shares for the periods
ended December 31, 2009, 2008 and 2007, respectively. The fair value was
determined based on the market value of unrestricted shares. As of December 31,
2009, there was unrecognized stock-based compensation related to restricted
stock of $4.6 million, which will be recognized over approximately the next
three years. The compensation expense amortized with respect to all units was
approximately $4.2 million, $3.6 million and $2.8 million for the periods ended
December 31, 2009, 2008 and 2007, respectively. In addition, the Company
recorded reversals of $0.6 million, $0.1 million and $1.0 million for periods
ended December 31, 2009, 2008 and 2007, respectively, related to restricted
stock forfeitures. Such costs and reversals are included in marketing and
administrative expenses. There were 41,020 restricted stock shares that vested
as of December 31, 2009.
F-10
MINERALS
TECHNOLOGIES INC. AND SUBSIDIARY COMPANIES
NOTES
OF CONSOLIDATED FINANCIAL STATEMENTS
The
following table summarizes the restricted stock activity for the
Plan:
|
Shares
|
Weighted
Average Grant Date Fair Value
|
||||||||
|
Unvested
balance at December 31, 2008
|
161,294
|
$
|
61.63
|
||||||
|
Granted
|
101,400
|
$
|
39.65
|
||||||
|
Vested
|
(41,020
|
)
|
$
|
60.35
|
|||||
|
Canceled
|
(32,956
|
)
|
$
|
61.30
|
|||||
|
Unvested
balance at December 31, 2009
|
188,718
|
$
|
50.16
|
Note
3. Earnings Per Share (EPS)
|
(thousand
of dollars, except per share amounts)
|
2009
|
2008
|
2007
|
|||||||||
|
Basic
EPS
|
||||||||||||
|
Income
(loss) from continuing operations attributable to MTI
|
$
|
(20,645
|
)
|
$
|
55,005
|
$
|
(25,669
|
)
|
||||
|
Income
(loss) from discontinued operations attributable to MTI
|
(3,151
|
)
|
10,282
|
(37,845
|
)
|
|||||||
|
Net
income (loss) attributable to MTI
|
$
|
(23,796
|
)
|
$
|
65,287
|
$
|
(63,514
|
)
|
||||
|
Weighted
average shares outstanding
|
18,724
|
18,893
|
19,190
|
|||||||||
|
Basic
earnings (loss) per share from continuing operations attributable to
MTI
|
$
|
(1.10
|
)
|
$
|
2.91
|
$
|
(1.34
|
)
|
||||
|
Basic
earnings (loss) per share from discontinued operations attributable to
MTI
|
(0.17
|
)
|
0.54
|
(1.97
|
)
|
|||||||
|
Basic
earnings (loss) per share attributable to MTI
|
$
|
(1.27
|
)
|
$
|
3.45
|
$
|
(3.31
|
)
|
||||
|
Diluted
EPS
|
2009
|
2008
|
2007
|
|||||||||
|
Income
(loss) from continuing operations attributable to MTI
|
$
|
(20,645
|
)
|
$
|
55,005
|
$
|
(25,669
|
)
|
||||
|
Income
(loss) from discontinued operations attributable to MTI
|
(3,151
|
)
|
10,282
|
(37,845
|
)
|
|||||||
|
Net
income (loss) attributable to MTI
|
$
|
(23,796
|
)
|
$
|
65,287
|
$
|
(63,514
|
)
|
||||
|
Weighted
average shares outstanding
|
18,724
|
18,893
|
19,190
|
|||||||||
|
Dilutive
effect of stock options
|
--
|
90
|
--
|
|||||||||
|
Weighted
average shares outstanding, adjusted
|
18,724
|
18,983
|
19,190
|
|||||||||
|
Diluted
earnings (loss) per share from continuing operations
|
$
|
(1.10
|
)
|
$
|
2.90
|
$
|
(1.34
|
)
|
||||
|
Diluted
earnings (loss) per share from discontinued operations
|
(0.17
|
)
|
0.54
|
(1.97
|
)
|
|||||||
|
Diluted
earnings (loss) per share
|
$
|
(1.27
|
)
|
$
|
3.44
|
$
|
(3.31
|
)
|
||||
Options
to purchase 322,933 shares, 603,828 shares and 154,133 shares of common stock
for the years ended December 31, 2009, December 31, 2008 and December 31, 2007,
respectively, were not included in the computation of diluted earnings per share
because they were anti-dilutive, as the exercise prices of the options were
greater than the average market price of the common shares. Additionally, the
weighted average diluted common shares outstanding for the year ended December
31, 2009 and December 31, 2007 excludes the dilutive effect of stock options and
restricted stock, as inclusion of these would be
anti-dilutive. Approximately, 55,000 and 214,000 common share
equivalents were not included in the computation of diluted earnings per share
for the periods ended December 31, 2009 and December 31, 2007, respectively, as
they would be anti-dilutive.
Note
4. Discontinued Operations
In
the third quarter of 2007, as a result of a change in management and
deteriorating financial performance, the Company conducted an in-depth review of
all of its operations and developed a new strategic focus. The Company initiated
a plan to realign its business operations to improve profitability and increase
shareholder value by exiting certain businesses and consolidating some product
lines. As a part of this restructuring, during the fourth quarter of 2007,
the Company classified its Synsil operations and its plants at Mount Vernon,
Indiana and Wellsville, Ohio as discontinued operations. These operations were
part of the Company's Specialty Minerals segment. During 2008, the Company sold
its idle Synsil facilities in Chester, South Carolina and Woodville, Ohio, and
Cleburne, Texas. This resulted in a pre-tax gain of $13.7 million ($8.6 million
after tax). During the second quarter of 2009, the Company recorded impairment
of asset charges of $5.6 million, net of tax, to recognize the lower market
value of its Mt. Vernon, Indiana facility. On October 26, 2009,
the Company completed the sale of this facility for the approximate amount of
the net book value of the assets.
F-11
MINERALS
TECHNOLOGIES INC. AND SUBSIDIARY COMPANIES
NOTES
OF CONSOLIDATED FINANCIAL STATEMENTS
The
consolidated financial statements for all prior periods presented have been
reclassified to reflect these businesses in discontinued
operations.
The
following table details selected financial information for the discontinued
operation in the consolidated statements of operations. The amounts exclude
general corporate overhead and interest expense which were previously allocated
to the entities comprising discontinued operations.
|
Thousands
of Dollars
|
2009
|
2008
|
2007
|
|||||||||||
|
Net
sales
|
$
|
15,600
|
$
|
23,148
|
$
|
30,187
|
||||||||
|
Production
margin
|
1,148
|
3,278
|
(5,238
|
)
|
||||||||||
|
Expenses
|
582
|
850
|
4,129
|
|||||||||||
|
Impairment
of
assets
|
5,778
|
--
|
46,878
|
|||||||||||
|
Restructuring
and other
costs
|
--
|
74
|
2,317
|
|||||||||||
|
Gain
on sale of
assets
|
239
|
13,897
|
--
|
|||||||||||
|
Income
(loss) from
operations
|
$
|
(4,973)
|
$
|
16,251
|
$
|
(58,562
|
)
|
|||||||
|
Other
income
|
--
|
--
|
82
|
|||||||||||
|
Foreign
currency translation
|
||||||||||||||
|
loss
from liquidation of investment
|
--
|
--
|
||||||||||||
|
Provision
(benefit) for taxes on
income
|
(1,822)
|
5,969
|
(20,635
|
)
|
||||||||||
|
Income
(loss) from discontinued operations, net of tax
|
$
|
(3,151)
|
$
|
10,282
|
$
|
(37,845
|
)
|
|||||||
The
major classes of assets and liabilities held for disposals in the consolidated
balance sheets are as follows:
|
Thousands
of Dollars
|
2009
|
2008
|
|||||
|
Assets:
|
|||||||
|
|
Accounts
receivable
|
$
|
--
|
$
|
1,229
|
||
|
Inventories
|
--
|
7,198
|
|||||
|
Property,
plant and equipment, net
|
--
|
9,802
|
|||||
|
Goodwill
|
--
|
815
|
|||||
|
Other
assets
|
--
|
630
|
|||||
|
Assets
held for disposal
|
$
|
--
|
$
|
19,674
|
|||
|
Liabilities:
|
|||||||
|
Accounts
payable
|
$
|
--
|
$
|
610
|
|||
|
Accrued
liabilities
|
--
|
124
|
|||||
|
Liabilities
of assets held for disposal
|
$
|
--
|
$
|
734
|
|||
Note
5. Income Taxes
Income
(loss) from continuing operations before provision (benefit) for taxes and
discontinued operations by domestic and foreign source is as
follows:
|
Thousands
of Dollars
|
2009
|
2008
|
2007
|
||||||||
|
Domestic
|
$
|
(29,766
|
)
|
$
|
36,512
|
$
|
8,243
|
||||
|
Foreign
|
6,626
|
45,755
|
(19,742
|
)
|
|||||||
|
Income
(loss) from continuing operations before provision (benefit)
for income taxes
|
$
|
(23,140)
|
$
|
82,267
|
$
|
(11,499
|
)
|
||||
F-12
MINERALS
TECHNOLOGIES INC. AND SUBSIDIARY COMPANIES
NOTES
OF CONSOLIDATED FINANCIAL STATEMENTS
The
provision (benefit) for taxes on income consists of the following:
|
Thousands
of Dollars
|
2009
|
2008
|
2007
|
||||||||||
|
Domestic
|
|||||||||||||
|
Taxes
currently payable
|
|||||||||||||
|
Federal
|
$
|
7,628
|
$
|
10,199
|
$
|
11,257
|
|||||||
|
State
and local
|
68
|
2,090
|
1,362
|
||||||||||
|
Deferred
income taxes
|
(23,722
|
)
|
(724
|
)
|
(9,955
|
)
|
|||||||
|
|
Domestic
tax provision (benefit)
|
(16,026
|
)
|
11,565
|
2,664
|
||||||||
|
Foreign
|
|||||||||||||
|
Taxes
currently payable
|
10,906
|
14,791
|
13,795
|
||||||||||
|
Deferred
income taxes
|
(267
|
)
|
(2,277
|
)
|
(5,193
|
)
|
|||||||
|
Foreign
tax provision (benefit)
|
10,639
|
12,514
|
8,602
|
||||||||||
|
|
Total
tax provision (benefit)
|
$
|
(5,387)
|
$
|
24,079
|
$
|
11,266
|
||||||
The
provision for taxes on income shown in the previous table is classified based on
the location of the taxing authority, regardless of the location in which the
taxable income is generated.
The
major elements contributing to the difference between the U.S. federal statutory
tax rate and the consolidated effective tax rate are as follows:
|
Percentages
|
2009
|
2008
|
2007
|
|||||||||
|
U.S.
statutory tax rate
|
(35.0)
|
%
|
35.0
|
%
|
(35.0)
|
%
|
||||||
|
Depletion
|
(13.9)
|
(4.2)
|
(31.3)
|
|||||||||
|
Difference
between tax provided on foreign earnings
|
||||||||||||
|
and
the U.S. statutory rate
|
4.3
|
(4.6)
|
(15.0)
|
|||||||||
|
Change
in Mexican law
|
6.4
|
|||||||||||
|
State
and local taxes, net of Federal tax benefit
|
(12.1)
|
1.3
|
6.2
|
|||||||||
|
Tax
credits and foreign dividends
|
(1.4)
|
(0.5)
|
6.1
|
|||||||||
|
Increase
in valuation allowance
|
27.0
|
0.3
|
149.9
|
|||||||||
|
Impact
of uncertain tax positions
|
0.1
|
0.9
|
8.2
|
|||||||||
|
Other
|
1.3
|
1.1
|
8.9
|
|||||||||
|
Consolidated
effective tax rate
|
(23.3)
|
%
|
29.3
|
%
|
98.0
|
%
|
||||||
The
Company believes that its accrued liabilities are sufficient to cover its U.S.
and foreign tax contingencies. The tax effects of temporary
differences that give rise to significant portions of the deferred tax assets
and deferred tax liabilities are presented below:
|
Thousands
of Dollars
|
2009
|
2008
|
|||||
|
Deferred
tax assets:
|
|||||||
|
State
and local taxes
|
$
|
1,827
|
$
|
2,073
|
|||
|
Accrued
expenses
|
10,926
|
12,450
|
|||||
|
Net
operating loss carry forwards
|
10,397
|
4,073
|
|||||
|
Pension
and post-retirement benefits costs
|
19,791
|
24,022
|
|||||
|
Other
|
21,176
|
17,813
|
|||||
|
Valuation
allowance.
|
(6,477
|
)
|
(225
|
)
|
|||
|
Total
deferred tax assets
|
$
|
57,640
|
$
|
60,206
|
In
2009, there was a decrease in deterred tax assets of $6.2 million due to the
establishment of valuation allowances primarily in China, Japan, Mexico, and the
United Kingdom. These allowances were established as a result of
restructuring activities as it is more likely than not that the deterred tax
assets associated with the restructuring would not be recognized as they relate
to these entities.
F-13
MINERALS
TECHNOLOGIES INC. AND SUBSIDIARY COMPANIES
NOTES
OF CONSOLIDATED FINANCIAL STATEMENTS
|
Thousands
of Dollars
|
2009
|
2008
|
|||||
|
Deferred
tax liabilities:
|
|||||||
|
Plant
and equipment, principally due to differences in depreciation
|
$
|
13,534
|
$
|
33,049
|
|||
|
Intangible
assets
|
9,218
|
9,476
|
|||||
|
Restricted
stock expense
|
2,264
|
1,470
|
|||||
|
Foreign
Exchange gains
|
1,419
|
1,693
|
|||||
|
Mexican
tax recapture
|
1,476
|
--
|
|||||
|
Other
|
1,228
|
1,380
|
|||||
|
Total
deferred tax liabilities
|
29,139
|
47,068
|
|||||
|
Net
deferred tax (assets) liabilities
|
$
|
(28,501
|
)
|
$
|
(13,138
|
)
|
The
current and long-term portion of net deferred tax (assets) liabilities is as
follows:
|
Thousands
of Dollars
|
2009
|
2008
|
|||||
|
Net
deferred tax assets,
current
|
$
|
(6,745
|
)
|
$
|
(5,065
|
)
|
|
|
Net
deferred assets, long
term
|
(21,756
|
)
|
(8,073
|
)
|
|||
|
$
|
(28,501
|
)
|
$
|
(13,138
|
)
|
The
current portion of the net deferred tax assets is included in prepaid expenses
and other current assets.
The
Company has $5.3 million of deferred tax assets arising from tax loss carry
forwards which will be realized through future operations. Carry forwards of
approximately $0.7 million expire over the next 15 years, and $4.6 million can
be utilized over an indefinite period.
On
December 31, 2009, the Company had $8.5 million of total unrecognized tax
benefits. Included in this amount were a total of $6.2 million of unrecognized
income tax benefits that, if recognized, would affect the Company's effective
tax rate. While it is expected that the amount of unrecognized tax benefits will
change in the next 12 months, we do not expect the change to have a significant
impact on the results of operations or the financial position of the
Company.
The
following table summarizes the activity related to our unrecognized tax
benefits:
|
(Thousands
of Dollars)
|
2009
|
2008
|
||||
|
Balance
as of January 1,
|
$
|
10,948
|
$
|
10,395
|
||
|
Increases
related to current year positions
|
723
|
2,973
|
||||
|
Increases
(decreases) related to new judgements
|
(877
|
)
|
398
|
|||
|
Decreases
related to audit settlements and statute expirations
|
(2,315
|
)
|
(2,204
|
)
|
||
|
Other
|
17
|
(614
|
)
|
|||
|
Balance
as of December 31,
|
$
|
8,496
|
$
|
10,948
|
The
Company's accounting policy is to recognize interest and penalties accrued,
relating to unrecognized income tax benefits as part of its provision for income
taxes. The Company had a net reversal of $0.1 million of interest and penalties
during 2009 and have a total accrued balance on December 31, 2009 of $2.4
million.
The
Company operates in multiple taxing jurisdictions, both within and outside the
U.S. In certain situations, a taxing authority may challenge positions that the
Company has adopted in its income tax filings. The Company, with a few
exceptions (none of which are material), is no longer subject to U.S. federal,
state, local, and European income tax examinations by tax authorities for years
prior to 2003.
Net
cash paid for income taxes were $14.1 million, $19.6 million and $16.8 million
for the years ended December 31, 2009, 2008 and 2007, respectively.
Note
6. Foreign Operations
The
Company has not provided for U.S. federal and foreign withholding taxes on
$184.9 million of foreign subsidiaries' undistributed earnings as of December
31, 2009 because such earnings are intended to be permanently reinvested
overseas. To the extent the parent company has received foreign earnings as
dividends, the foreign taxes paid on those earnings have generated tax credits,
which have substantially offset related U.S. income
taxes. However, in the event that the entire
$184.9
F-14
MINERALS
TECHNOLOGIES INC. AND SUBSIDIARY COMPANIES
NOTES
OF CONSOLIDATED FINANCIAL STATEMENTS
million
of foreign earnings were to be repatriated, incremental taxes may be incurred.
We do not believe this amount would be more than $22.4 million.
Net
foreign currency exchange gains (losses), included in non-operating deductions
in the Consolidated Statements of Income, were $(2,452,000), $1,694,000 and
$513,000 for the years ended December 31, 2009, 2008 and 2007,
respectively.
Note
7. Inventories
The
following is a summary of inventories by major category:
|
Thousands
of Dollars
|
2009
|
2008
|
|||||
|
Raw
materials
|
$
|
32,838
|
$
|
67,498
|
|||
|
Work
in process
|
6,065
|
10,191
|
|||||
|
Finished
goods
|
24,412
|
35,027
|
|||||
|
Packaging
and supplies
|
19,168
|
21,267
|
|||||
|
Total
inventories
|
$
|
82,483
|
$
|
133,983
|
Note
8. Property, Plant and Equipment
The
major categories of property, plant and equipment and accumulated depreciation
and depletion are presented below:
|
Thousands
of Dollars
|
2009
|
2008
|
|||||
|
Land
|
$
|
25,572
|
$
|
25,182
|
|||
|
Quarries/mining
properties
|
39,596
|
39,596
|
|||||
|
Buildings
|
141,997
|
167,912
|
|||||
|
Machinery
and equipment
|
905,104
|
959,291
|
|||||
|
Construction
in progress
|
16,874
|
12,960
|
|||||
|
Furniture
and fixtures and other
|
94,567
|
119,290
|
|||||
|
1,223,710
|
1,324,231
|
||||||
|
Less:
Accumulated depreciation and depletion
|
(864,332
|
)
|
(894,638
|
)
|
|||
|
Property,
plant and equipment, net
|
$
|
359,378
|
$
|
429,593
|
Depreciation
and depletion expense for the years ended December 31, 2009, 2008 and 2007 was
$69.0 million, $76.2 million and $80.4 million, respectively.
Note
9. Restructuring Costs
2007
Restructuring Program
In
the third quarter of 2007, as a result of a change in management and
deteriorating financial performance, the Company conducted an in-depth review of
all its operations and developed a new strategic focus. The Company initiated a
plan to realign its business operations to improve profitability and increase
shareholder value by exiting certain businesses and consolidating some product
lines. As part of this program, the Company reduced its workforce by
approximately 7 percent to better control operating expenses and to improve
efficiencies and recorded a pre-tax charge of $16.0 million for restructuring
and other exit costs during the second half of 2007. This charge consists of
severance and other employee benefit costs of $13.5 million, contract
termination costs of $1.8 million and other exit costs of $0.7 million.
Additional restructuring costs of $9.5 million were recorded in 2008 related to
this program, including a pension settlement loss of approximately $6.8 million
related to the distribution of benefits to terminated employees. The
restructuring resulted in a total workforce reduction of approximately 250,
which has been completed as of December 31, 2009.
A
reconciliation of the restructuring liability for this program, as of December
31, 2009, is as follows:
|
(millions
of dollars)
|
Balance
as of
December
31, 2008
|
Additional
Provisions
|
Cash
Expenditures
|
Balance
as of
December
31,2009
|
||||||||||
|
Severance
and other employee benefits
|
$
|
1.7
|
$
|
--
|
$
|
(1.6
|
)
|
$
|
0.1
|
|||||
|
Contract
termination costs
|
1.6
|
--
|
--
|
1.6
|
||||||||||
|
$
|
3.3
|
$
|
--
|
$
|
(1.6
|
)
|
$
|
1.7
|
||||||
F-15
MINERALS
TECHNOLOGIES INC. AND SUBSIDIARY COMPANIES
NOTES
OF CONSOLIDATED FINANCIAL STATEMENTS
Approximately
$1.6 million and $12.9 million in severance payments were paid in 2009 and 2008,
respectively. A restructuring liability of $1.7 million remains at
December 31, 2009. Such amounts will be funded from operating cash
flows and we expect the program to be completed in 2010.
2008
Restructuring Program
In
the fourth quarter of 2008, as a result of the worldwide economic downturn and
the resulting impact on our sales and operating profits, the Company initiated
an additional restructuring program by reducing its workforce by approximately
14% through a combination of permanent reductions and temporary layoffs. The
Company recorded a charge of $3.9 million associated with this program.
Additional restructuring costs of $1.0 million were recorded in 2009 related to
this program.
A
reconciliation of the restructuring liability for this program, as of December
31, 2009, is as follows:
|
(millions
of dollars)
|
Balance
as of
December
31, 2008
|
Additional
Provisions
|
Cash
Expenditures
|
Balance
as of
December
31, 2009
|
||||||||||
|
Severance
and other employee benefits
|
$
|
3.5
|
$
|
0.9
|
$
|
(4.3
|
)
|
$
|
0.1
|
|||||
|
Other
exit costs
|
--
|
0.1
|
(0.1
|
)
|
--
|
|||||||||
|
$
|
3.5
|
$
|
1.0
|
$
|
(4.4
|
)
|
$
|
0.1
|
||||||
Approximately
$4.2 million in severance payments was paid in 2009. The remaining
liability of $0.1 million will be paid from cash flow from operations and the
program is expected to be completed in 2010.
2009
Restructuring Program
In
the second quarter of 2009, the Company initiated a program to improve
efficiencies through the consolidation of manufacturing operations and reduction
of costs.
The
restructuring program reduced the current workforce by approximately 200
employees worldwide. This reduction in force relates to plant
consolidations as well as a streamlining of the corporate and divisional
management structures to operate more efficiently.
The
Company recorded $21.1 million in restructuring charges as associated with this
program. Included in the restructuring costs was a pension settlement charge of
$9.4 million as a result of the workforce reduction associated with this
program.
A
reconciliation of the restructuring liability for this program, as of December
31, 2009, is as follows:
|
(millions
of dollars)
|
Balance
as of
December
31, 2008
|
Additional
Provisions
|
Cash
Expenditures
|
Balance
as of
December
31, 2009
|
||||||||||
|
Severance
and other employee benefits
|
$
|
--
|
$
|
10.1
|
$
|
(5.0
|
)
|
$
|
5.1
|
|||||
|
Contract
termination costs
|
--
|
1.3
|
--
|
1.3
|
||||||||||
|
Other
exit costs
|
--
|
0.2
|
(0.1
|
)
|
0.1
|
|||||||||
|
$
|
--
|
$
|
11.6
|
$
|
(5.1
|
)
|
$
|
6.5
|
||||||
The
liability of $6.5 million will be paid from cash flows from operations, and the
program is expected to be completed by the second half of 2010.
Note
10. Accounting for Impairment of Long-Lived Assets
The
Company reviews long-lived assets for impairment whenever events or changes in
circumstances indicate that the carrying amount of an asset may not be
recoverable. In such instances, the Company estimates the undiscounted future
cash flows (excluding interest) resulting from the use of the asset and its
ultimate disposition. If the sum of the undiscounted cash flows
(excluding interest) is less than the carrying value, the Company recognizes an
impairment loss, measured as the amount by which the carrying value exceeds the
fair value of the asset.
In
the second quarter of 2009, the Company initiated a restructuring program to
improve efficiencies through the consolidation of operations and rationalization
of certain product lines, and through the reduction of costs. As part of this
program, the Company will consolidate its Old Bridge, New Jersey operation into
Bryan, Ohio and Baton Rouge, Louisiana, in order to improve operational
efficiencies and reduce logistics for key raw materials, which resulted in an
impairment of
F-16
MINERALS
TECHNOLOGIES INC. AND SUBSIDIARY COMPANIES
NOTES
OF CONSOLIDATED FINANCIAL STATEMENTS
assets
charge of $4.3 million; rationalize its North American specialty shapes product
line resulting in an impairment of assets charge of $1.5 million; rationalize
some of its European operations resulting in an impairment of assets charge of
$2.2 million; record further impairment charges of $10.0 million related to its
Asian refractory operations as a result of continued difficulties in market
penetration as well as consolidate its Asian operations and actively seek a
regional alliance to aid in marketing its high value products; recognize
impairment charges for refractory application equipment in North America of $3.7
million and Europe of $3.3 million due to customer underutilized assets under
depressed volume conditions; an impairment of $6.5 million related to the
Company's PCC facility in Millinocket, Maine, which has been idle since
September 2008 and where the start-up of the satellite facility became unlikely.
As a result of this realignment, the Company recorded an impairment of assets
charge of $37.5 million.
In
the fourth quarter of 2009, the Company recorded an impairment of assets charge
of $2.0 million for its satellite facility in Franklin, Virginia, due to the
announced closure of the host mill at that location.
The
following table reflects the major components of the impairment of assets charge
recorded in 2009:
Impairment of assets:
|
(millions
of dollars)
|
2009
|
Remaining
Carrying Value of Impaired Assets
|
|||||
|
Americas
Refractories
|
$
|
9.5
|
$
|
0.3
|
|||
|
European
Refractories
|
11.8
|
0.8
|
|||||
|
Asian
Refractories
|
10.0
|
11.6
|
|||||
|
North
America Paper PCC
|
8.5
|
--
|
|||||
|
Total
impairment
|
$
|
39.8
|
$
|
12.7
|
|||
Included
in the impairment of assets charge for Europe Refractories was a $6.0 million
charge for certain intangible assets from its 2006 acquisition of a business in
Turkey.
The
remaining carrying value of the impaired assets was determined by estimating
marketplace participant views of the discounted cash flows of the asset groups
and, in the case of tangible assets, by estimating the market value of the
assets, which due to the specialized and limited use nature of our equipment, is
primarily driven by the value of the real estate. As the estimated
discounted cash flows were determined to be negative under multiple scenarios,
the highest and best use of the tangible asset groups was determined to be a
sale of the underlying real estate. The fair value of the significant real
estate holdings was based on independent appraisals.
The
Company expects to realize annualized pre-tax depreciation savings of
approximately $5 million related to the write-down of fixed assets. The Company
recognized approximately $2.4 million in depreciation savings in 2009 associated
with this program.
During
the fourth quarter of 2008, the Company recorded a writedown of impaired assets
of $0.2 million for the closure of its satellite facility at Dryden,
Canada.
In
2007, as a result of a change in management and deteriorating financial
performance, the Company initiated a plan to realign its business operations to
improve profitability and increase shareholder value. The realignment
consisted of exiting certain businesses and consolidating some product lines to
better position for future success by focusing on the Company's core
strengths. Major components of this realignment included exiting the
Synsil® Products product line resulting in an impairment charge of $42.1
million; sale of its two plants in the Midwest that process imported ore in the
Processed Minerals product line resulting in an impairment charge of
$4.7 million; modification of its PCC coating product line from a merchant
business model to a satellite business model resulting in an impairment charge
of $53.7 million; consolidation of facilities in the Specialty PCC operations in
the United States resulting in an impairment charge of $12.7 million, slower
than anticipated market penetration at our refractories facility in China
resulting in an impairment of assets charge of $12.8 million and the write down
of other underutilized assets worldwide. The Company recorded a
charge of $140.9 million, of which $46.8 million was reclassified to
discontinued operations, as part of the program.
The
impairment charge relates to all product lines. The following table reflects the
components of the impairment of assets charge included in continuing
operations:
F-17
MINERALS
TECHNOLOGIES INC. AND SUBSIDIARY COMPANIES
NOTES
OF CONSOLIDATED FINANCIAL STATEMENTS
Impairment
of assets:
|
(millions
of dollars)
|
2007
|
Remaining
Carrying Value of Impaired Assets
|
|||||
|
Paper
PCC
|
$
|
65.3
|
$
|
0.7
|
|||
|
Specialty
PCC
|
12.7
|
0.5
|
|||||
|
Total
PCC
|
78.0
|
1.2
|
|||||
|
Processed
Minerals
|
1.3
|
--
|
|||||
|
Specialty
Minerals Segment
|
$
|
79.3
|
$
|
1.2
|
|||
|
Refractories
Segment
|
14.8
|
6.0
|
|||||
|
$
|
94.1
|
$
|
7.2
|
||||
Note
11. Goodwill and Other Intangible Assets
The
carrying amount of goodwill was $68.1 million and $66.4 million as of December
31, 2009 and December 31, 2008, respectively. The net change in goodwill since
December 31, 2008 was primarily attributable to the effect of foreign
exchange.
Acquired
intangible assets included in other assets and deferred charges subject to
amortization as of December 31, 2009 and December 31, 2008 were as
follows:
|
December
31, 2009
|
December
31, 2008
|
||||||||||||||
|
(Millions
of Dollars)
|
Gross
Carrying
Amount
|
Accumulated
Amortization
|
Gross
Carrying
Amount
|
Accumulated
Amortization
|
|||||||||||
|
Patents
and
trademarks
|
$
|
6.2
|
$
|
3.1
|
$
|
7.4
|
$
|
3.2
|
|||||||
|
Customer
lists
|
2.7
|
1.1
|
9.2
|
1.9
|
|||||||||||
|
Other
|
--
|
--
|
0.4
|
0.2
|
|||||||||||
|
$
|
8.9
|
$
|
4.2
|
$
|
17.0
|
$
|
5.3
|
||||||||
In
the second quarter of 2009, the Company recorded a $6.0 million impairment
charge for customer list intangible assets from its 2006 acquisition in
Turkey.
The
weighted average amortization period for acquired intangible assets subject to
amortization is approximately 15 years. Amortization expense was approximately
$0.9 million, $1.4 million and $1.5 million for the years ended December 31,
2009, 2008 and 2007, respectively. The estimated amortization expense
is $0.6 million for each of the next five years through 2014.
Included
in other assets and deferred charges is an additional intangible asset of
approximately $2.8 million which represents the non-current unamortized amount
paid to a customer in connection with contract extensions at eight satellite PCC
facilities. In addition, a current portion of $1.2 million is included in
prepaid expenses and other current assets. Such amounts will be amortized as a
reduction of sales over the remaining lives of the customer contracts.
Approximately $1.5 million, $1.8 million and $1.8 million was amortized in 2009,
2008 and 2007, respectively. Estimated amortization as a reduction of sales is
as follows: 2010 - $1.2 million; 2011 - $0.9 million; 2012 - $0.6 million; 2013
- $0.6 million; 2014 - $0.5 million; with smaller reductions thereafter over the
remaining lives of the contracts.
Note
12. Derivative Financial Instruments and Hedging
Activities
The
Company is exposed to foreign currency exchange rate fluctuations. As part of
its risk management strategy, the Company uses forward exchange contracts (FEC)
to manage its exposure to foreign currency risk on certain raw material
purchases. The Company's objective is to offset gains and losses resulting from
these exposures with gains and losses on the derivative contracts used to hedge
them. The Company has not entered into derivative instruments for any purpose
other than to hedge certain expected cash flows. The Company does not speculate
using derivative instruments.
By
using derivative financial instruments to hedge exposures to changes in interest
rates and foreign currencies, the Company exposes itself to credit risk and
market risk. Credit risk is the risk that the counterparty will fail to perform
under the terms of the derivative contract. When the fair value of a derivative
contract is positive, the counterparty owes the Company, which creates credit
risk for the Company. When the fair value of a derivative contract is negative,
the Company owes the counterparty, and therefore, it does not face any credit
risk. The Company minimizes the credit risk in derivative instruments by
entering into transactions with major financial institutions.
F-18
MINERALS
TECHNOLOGIES INC. AND SUBSIDIARY COMPANIES
NOTES
OF CONSOLIDATED FINANCIAL STATEMENTS
Market
risk is the adverse effect on the value of a financial instrument that results
from a change in interest rates, currency exchange rates, or commodity prices.
The market risk associated with interest rate and forward exchange contracts is
managed by establishing and monitoring parameters that limit the types and
degree of market risk that may be undertaken.
Based
on established criteria, the Company designated its derivatives as cash flow
hedges. The Company uses FEC's designated as cash flow hedges to protect against
foreign currency exchange rate risks inherent in its forecasted inventory
purchases. The Company had 13 open foreign exchange contracts as of December 31,
2009.
For
derivative instruments that are designated and qualify as cash flow hedges, the
effective portion of the gain or loss on the derivative instrument is initially
recorded in accumulated other comprehensive income (loss) as a separate
component of shareholders' equity and subsequently reclassified into earnings in
the period during which the hedged transaction is recognized in earnings. The
gains and losses associated with these forward exchange contracts are recognized
into cost of sales. Gains and losses and hedge ineffectiveness associated with
these derivatives were not significant.
Note
13. Short-term Investments
The
composition of the Company's short-term investments are as follows:
|
(in
thousands of dollars)
|
2009
|
2008
|
||||
|
Short-term
Investments -
|
||||||
|
Available
for Sale Securities:
|
||||||
|
Short-term
bank
deposits
|
$
|
8,940
|
$
|
9,258
|
||
There
were no unrealized holding gains and losses on the short-term bank deposits held
at December 31, 2009.
Note
14: Fair Value of Financial Instruments
Fair
value is an exchange price that would be received for an asset or paid to
transfer a liability (exit price) in an orderly transaction between market
participants at the measurement date. The Company utilizes market data or
assumptions that market participants would use in pricing the asset or
liability. The Company follows a three-tier fair value hierarchy, which
prioritizes the inputs used in measuring fair value. These tiers include: Level
1, defined as observable inputs such as quoted prices in active markets; Level
2, defined as inputs other than quoted prices in active markets that are either
directly or indirectly observable; and Level 3, defined as unobservable inputs
about which little or no market data exists, therefore requiring an entity to
develop its own assumptions.
Assets
and liabilities measured at fair value are based on one or more of three
valuation techniques. The three valuation techniques are as
follows:
|
•
|
Market
approach - prices and other relevant information generated by market
transactions involving identical or comparable assets or
liabilities.
|
|
•
|
Cost
approach - amount that would be required to replace the service capacity
of an asset or replacement cost.
|
|
•
|
Income
approach - techniques to convert future amounts to a single present amount
based on market expectations, including present value techniques,
option-pricing and other models.
|
The
Company primarily applies the income approach for foreign exchange derivatives
for recurring fair value measurements and attempts to utilize valuation
techniques that maximize the use of observable inputs and minimize the use of
unobservable inputs.
As
of December 31, 2009, the Company held certain financial assets and
liabilities that were required to be measured at fair value on a recurring
basis. These consisted of the Company's derivative instruments related to
foreign exchange rates. The fair values of foreign exchange rate derivatives are
determined based on inputs that are readily available in public markets or can
be derived from information available in publicly quoted markets and are
categorized as Level 2. The Company does not have any financial assets or
liabilities measured at fair value on a recurring basis categorized as Level 1
or Level 3, and there were no transfers in or out of Level 3 during the year
ended December 31, 2009. There were also no changes to the Company's valuation
techniques used to measure asset and liability fair values on a recurring
basis.
The
following table sets forth by level within the fair value hierarchy the
Company's financial assets and liabilities accounted for at fair value on a
recurring basis as of December 31, 2009. Assets and liabilities are classified
in their entirety
F-19
MINERALS
TECHNOLOGIES INC. AND SUBSIDIARY COMPANIES
NOTES
OF CONSOLIDATED FINANCIAL STATEMENTS
based on
the lowest level of input that is significant to the fair value measurement. The
Company's assessment of the significance of a particular input to the fair value
measurement requires judgment, and may affect the valuation of fair value assets
and liabilities and their placement within the fair value hierarchy
levels.
|
Assets
(Liabilities) at Fair Value as of December 31,
2009
|
||||||||||
|
Quoted
Prices
In
Active Markets for
Identical
Assets
|
Significant
Other
Observable
Inputs
|
Significant
Unobservable
Inputs
|
||||||||
|
(Level
1)
|
(Level
2)
|
(Level
3)
|
||||||||
|
Forward
exchange contracts
|
$
|
--
|
$
|
(778
|
)
|
$
|
--
|
|||
|
Total
|
$
|
--
|
$
|
(778
|
)
|
$
|
--
|
|||
Note
15. Financial Instruments and Concentrations of Credit
Risk
The
following methods and assumptions were used to estimate the fair value of each
class of financial instrument:
Cash and cash equivalents,
short-term investments, accounts receivable and payable: The carrying
amounts approximate fair value because of the short maturities of these
instruments.
Short-term debt and other
liabilities: The carrying amounts of short-term debt and other
liabilities approximate fair value because of the short maturities of these
instruments.
Long-term debt: The fair
value of the long-term debt of the Company is estimated based on the quoted
market prices for that debt or similar debt and approximates the carrying
amount.
Forward exchange contracts:
The fair value of forward exchange contracts (used for hedging purposes) is
based on information derived from active markets. If appropriate, the Company
would enter into forward exchange contracts to mitigate the impact of foreign
exchange rate movements on the Company's operating results. It does not engage
in speculation. Such foreign exchange contracts would offset losses and gains on
the assets, liabilities and transactions being hedged. At December 31, 2009, the
Company had open foreign exchange contracts with a financial institution to
purchase approximately $4.6 million of foreign currencies. These contracts range
in maturity from January, 2010 to July, 2010. The fair value of these
instruments was a liability of $0.1 and $0.4 million, respectively, at both
December 31, 2009 and December 31, 2008.
Additionally,
the Company entered into forward contracts to purchase 30 million Euros as a
hedge of its net investment in Europe. These contracts mature in
October 2013. The fair value of these instruments at December 31,
2009 was a liability of $0.6 million. The fair value of these
instruments at December 31, 2008 was an asset of $2.1 million.
Credit risk: Substantially
all of the Company's accounts receivables are due from companies in the paper,
construction and steel industries. Credit risk results from the possibility that
a loss may occur from the failure of another party to perform according to the
terms of the contracts. The Company regularly monitors its credit risk exposures
and takes steps to mitigate the likelihood of these exposures resulting in
actual loss. The Company's extension of credit is based on an evaluation of the
customer's financial condition and collateral is generally not
required.
The
Company's bad debt expense (recoveries) for the years ended December 31, 2009,
2008 and 2007 was $1.3 million, $0.2 million and $(0.1) million,
respectively.
F-20
MINERALS
TECHNOLOGIES INC. AND SUBSIDIARY COMPANIES
NOTES
OF CONSOLIDATED FINANCIAL STATEMENTS
Note
16. Long-Term Debt and Commitments
The
following is a summary of long term debt:
|
(thousands
of
dollars)
|
Dec.
31,
2009
|
|
Dec.
31,
2008
|
||
|
5.53%
Series 2006A Senior Notes
|
|||||
|
Due
October 5, 2013
|
$ 50,000
|
$ 50,000
|
|||
|
Floating
Rate Series 2006A Senior Notes
|
|||||
|
Due
October 5, 2013
|
25,000
|
25,000
|
|||
|
Variable/Fixed
Rate Industrial
|
|||||
|
Development
Revenue Bonds Due 2009
|
--
|
4,000
|
|||
|
Economic
Development Authority Refunding
|
|||||
|
Revenue
Bonds Series 1999 Due 2010
|
4,600
|
4,600
|
|||
|
Variable/Fixed
Rate Industrial
|
|||||
|
Development
Revenue Bonds Due August 1, 2012
|
8,000
|
8,000
|
|||
|
Variable/Fixed
Rate Industrial
|
|||||
|
Development
Revenue Bonds Series 1999 Due November 1, 2014
|
8,200
|
8,200
|
|||
|
Installment
obligations
|
|||||
|
Due
2013
|
1,421
|
1,421
|
|||
|
Total
|
97,221
|
101,221
|
|||
|
Less:
Current maturities
|
4,600
|
4,000
|
|||
|
Long-term
debt
|
$ 92,621
|
$ 97,221
|
|||
The
Variable/Fixed Rate Industrial Development Revenue Bonds due 2009 were
tax-exempt 15-year instruments issued to finance the expansion of a PCC plant in
Selma, Alabama. The bonds were dated November 1, 1994, and provided for an
optional put by the holder (during the Variable Rate Period) and a mandatory
call by the issuer. The bonds bear interest at either a variable rate or fixed
rate at the option of the Company. Interest was payable semi-annually under the
fixed rate option and monthly under the variable rate option. The Company
selected the variable rate option on these borrowings and the average interest
rates were approximately 0.70% and 2.53% for the years ended December 31, 2009
and 2008, respectively. This obligation was repaid in November
2009.
The
Economic Development Authority Refunding Revenue Bonds due 2010 were issued on
February 23, 1999 to refinance the bonds issued in connection with the
construction of a PCC plant in Eastover, South Carolina. The bonds
bear interest at either a variable rate or fixed rate, at the option of the
Company. Interest is payable semi-annually under the fixed rate
option and monthly under the variable rate option. The Company selected the
variable rate option on these borrowings and the average interest rates were
approximately 0.70% and 2.53% for the years ended December 31, 2009 and 2008,
respectively.
The
Variable/Fixed Rate Industrial Development Revenue Bonds due August 1, 2012 are
tax-exempt 15-year instruments that were issued on August 1, 1997 to finance the
construction of a PCC plant in Courtland, Alabama. The bonds bear
interest at either a variable rate or fixed rate, at the option of the
Company. Interest is payable semi-annually under the fixed rate
option and monthly under the variable rate option. The Company
selected the variable rate option on these borrowings and the average interest
rates were approximately 0.70% and 2.63% for the years ended December 31, 2009
and 2008, respectively.
The
Variable/Fixed Rate Industrial Development Revenue Bonds due November 1, 2014
are tax-exempt 15-year instruments and were issued on November 30, 1999 to
refinance the bonds issued in connection with the construction of a PCC plant in
Jackson, Alabama. The bonds bear interest at either a variable rate
or fixed rate at the option of the Company. Interest is payable
semi-annually under the fixed rate option and monthly under the variable rate
option. The Company selected the variable rate option on these
borrowings and the average interest rates were approximately 0.70% and 2.53% for
the years ended December 31, 2009 and 2008, respectively.
On
May 31, 2003, the Company acquired land and limestone ore reserves from the
Cushenbury Mine Trust for approximately $17.5 million. Approximately $6.1
million was paid at the closing and $11.4 million was financed through an
installment obligation. The interest rate on this obligation is approximately
4.25%. The remaining principal payment of $1.4 million will be made in
2013.
On
October 5, 2006, the Company, through private placement, entered into a Note
Purchase Agreement and issued $75 million aggregate principal amount unsecured
senior notes. These notes consist of two tranches: $50 million aggregate
principal amount 5.53% Series 2006A Senior Notes (Tranche 1 Notes); and $25
million aggregate principal amount Floating
F-21
MINERALS
TECHNOLOGIES INC. AND SUBSIDIARY COMPANIES
NOTES
OF CONSOLIDATED FINANCIAL STATEMENTS
Rate
Series 2006A Senior Notes (Tranche 2 Notes). Tranche 1 Notes bear interest of
5.53% per annum, payable semi-annually. Tranche 2 Notes bear floating rate
interest, payable quarterly. The average interest rate on Tranche 2 for the
years ended December 31, 2009 and December 31, 2008 was 1.36% and 4.09%,
respectively. The principal payment for both tranches is due on October 5,
2013.
The
aggregate maturities of long-term debt are as follows: 2010 - $4.6 million; 2011
- $--- million; 2012 - $8.0 million; 2013 - $76.4; 2014 - $8.2 million;
thereafter - $---- million.
The
Company had available approximately $191.2 million in uncommitted, short-term
bank credit lines, of which $5.3 million was in use at December 31,
2009.
Short-term
borrowings as of December 31, 2009 and 2008 were $6.9 million and $15.0 million,
respectively. The weighted average interest rate on short-term borrowings
outstanding as of December 31, 2009 and 2008 was 3.39% and 6.15%,
respectively.
During
2009, 2008 and 2007, respectively, the Company incurred interest costs of $3.7
million, $5.3 million and $9.2 million including $0.2 million, $0.1 million and
$0.5 million, respectively, which were capitalized. Interest paid approximated
the incurred interest cost.
Note
17. Benefit Plans
Pension Plans and Other
Postretirement Benefit Plans
The
Company and its subsidiaries have pension plans covering the majority of
eligible employees on a contributory or non-contributory basis.
Benefits
under defined benefit plans are generally based on years of service and an
employee's career earnings. Employees generally become fully vested after five
years.
The
Company provides postretirement health care and life insurance benefits for the
majority of its U.S. retired employees. Employees are generally eligible for
benefits upon retirement and completion of a specified number of years of
creditable service. The Company does not pre-fund these benefits and has the
right to modify or terminate the plan in the future.
The
funded status of the Company's pension plans and other postretirement benefit
plans at December 31, 2009 and 2008 is as follows:
Obligations and Funded
Status
|
Pension
Benefits
|
Post-retirement
Benefits
|
||||||||||||||
|
Millions
of Dollars
|
2009
|
2008
|
2009
|
2008
|
|||||||||||
|
Change
in benefit obligation
|
|||||||||||||||
|
Benefit
obligation at beginning of
year
|
$
|
184.7
|
$
|
194.8
|
$
|
41.9
|
$
|
40.0
|
|||||||
|
Service
cost
|
7.1
|
7.1
|
1.1
|
2.1
|
|||||||||||
|
Interest
cost
|
11.3
|
11.1
|
1.5
|
2.4
|
|||||||||||
|
Actuarial
(gain)
loss
|
23.6
|
5.4
|
(1.4
|
)
|
(0.3
|
)
|
|||||||||
|
Benefits
paid
|
(3.8
|
)
|
(3.6
|
)
|
(1.3
|
)
|
(2.3
|
)
|
|||||||
|
Plan
amendments
|
--
|
--
|
(29.0
|
)
|
--
|
||||||||||
|
Settlements
|
(16.3
|
)
|
(19.6
|
)
|
--
|
--
|
|||||||||
|
Foreign
exchange
impact
|
3.5
|
(10.9
|
)
|
--
|
--
|
||||||||||
|
Other
|
0.1
|
0.4
|
0.4
|
--
|
|||||||||||
|
Benefit
obligation at end of
year
|
$
|
210.2
|
$
|
184.7
|
$
|
13.2
|
$
|
41.9
|
|||||||
F-22
MINERALS
TECHNOLOGIES INC. AND SUBSIDIARY COMPANIES
NOTES
OF CONSOLIDATED FINANCIAL STATEMENTS
|
Pension
Benefits
|
Post-retirement
Benefits
|
||||||||||||||
|
Millions
of Dollars
|
2009
|
2008
|
2009
|
2008
|
|||||||||||
|
Change
in plan assets
|
|||||||||||||||
|
Fair
value of plan assets beginning of year
|
$
|
173.5
|
$
|
244.5
|
$
|
$
|
--
|
||||||||
|
Actual
return on plan
assets
|
12.2
|
(40.1
|
)
|
--
|
|||||||||||
|
Employer
contributions
|
7.8
|
3.2
|
0.9
|
2.3
|
|||||||||||
|
Plan
participants'
contributions
|
0.4
|
--
|
0.4
|
--
|
|||||||||||
|
Benefits
paid
|
(3.8
|
)
|
(3.6
|
)
|
(1.3
|
)
|
(2.3
|
)
|
|||||||
|
Settlements
|
(16.6
|
)
|
(19.6
|
)
|
--
|
--
|
|||||||||
|
Foreign
exchange
impact
|
3.2
|
(10.9
|
)
|
--
|
|||||||||||
|
Fair
value of plan assets at end of
year
|
$
|
176.7
|
$
|
173.5
|
$
|
--
|
$
|
--
|
|||||||
|
Funded
status
|
$
|
(33.5
|
)
|
$
|
(11.2
|
)
|
$
|
(13.2
|
)
|
$
|
(41.9
|
)
|
|||
Amounts
recognized in the consolidated balance sheet consist of:
|
Pension
Benefits
|
Post-retirement
Benefits
|
||||||||||||||
|
Millions
of Dollars
|
2009
|
2008
|
2009
|
2008
|
|||||||||||
|
Non-current
asset
|
$
|
--
|
$
|
0.5
|
$
|
--
|
$
|
--
|
|||||||
|
Current
liability
|
(0.4
|
)
|
(0.2
|
)
|
(1.3
|
)
|
(1.5
|
)
|
|||||||
|
Non-current
liability
|
(33.1
|
)
|
(11.5
|
)
|
(11.9
|
)
|
(40.4
|
)
|
|||||||
|
Recognized
asset
(liability)
|
$
|
(33.5
|
)
|
$
|
(11.2
|
)
|
$
|
(13.2
|
)
|
$
|
(41.9
|
)
|
|||
The
current portion of pension liabilities is included in accrued compensation and
related items.
Amounts
recognized in accumulated other comprehensive income consist of:
|
Pension
Benefits
|
Post-retirement
Benefits
|
||||||||||||||
|
Millions
of Dollars
|
2009
|
2008
|
2009
|
2008
|
|||||||||||
|
Net
actuarial
loss
|
$
|
62.2
|
$
|
55.2
|
$
|
2.2
|
$
|
3.3
|
|||||||
|
Prior
service
cost
|
4.7
|
5.4
|
(15.4
|
)
|
1.1
|
||||||||||
|
Amount
recognized end of
year
|
$
|
66.9
|
$
|
60.6
|
$
|
(13.2
|
)
|
$
|
4.4
|
||||||
The
accumulated benefit obligation for all defined benefit pension plans was $188.4
million and $168.4 million at December 31, 2009 and 2008,
respectively.
Changes
in the Plan assets and benefit obligations recognized in other comprehensive
income:
|
(Millions of
Dollars)
|
Pension
Benefits
|
Post
Retirement Benefits
|
|||||
|
Current
year actuarial gain
(loss)
|
$
|
(10.6
|
)
|
$
|
18.4
|
||
|
Amortization
of actuarial (gain)
loss
|
4.5
|
0.1
|
|||||
|
Amortization
of prior service credit loss
|
1.3
|
(0.9
|
)
|
||||
|
Total
recognized in other comprehensive income
|
$
|
(4.8
|
)
|
$
|
17.6
|
||
The
components of net periodic benefit costs are as follows:
|
Pension
Benefits
|
Post-retirement
Benefits
|
||||||||||||||||||||||
|
Millions
of Dollars
|
2009
|
2008
|
2007
|
2009
|
2008
|
2007
|
|||||||||||||||||
|
Service
cost
|
$
|
7.1
|
$
|
7.1
|
$
|
8.8
|
$
|
1.1
|
$
|
2.1
|
$
|
2.6
|
|||||||||||
|
Interest
cost
|
11.3
|
11.1
|
11.4
|
1.5
|
2.4
|
2.4
|
|||||||||||||||||
|
Expected
return on plan assets
|
(12.5
|
)
|
(17.5
|
)
|
(18.8
|
)
|
--
|
--
|
--
|
||||||||||||||
|
Amortization
of prior service cost
|
2.1
|
1.5
|
1.5
|
(1.6
|
)
|
0.6
|
0.5
|
||||||||||||||||
|
Recognized
net actuarial
loss
|
7.3
|
2.3
|
2.8
|
0.2
|
0.2
|
0.8
|
|||||||||||||||||
|
Settlement
/curtailment
loss
|
9.4
|
7.1
|
0.1
|
--
|
--
|
--
|
|||||||||||||||||
|
Net
periodic benefit
cost
|
$
|
24.7
|
$
|
11.6
|
$
|
5.8
|
$
|
1.2
|
$
|
5.3
|
$
|
6.3
|
|||||||||||
F-23
MINERALS
TECHNOLOGIES INC. AND SUBSIDIARY COMPANIES
NOTES
OF CONSOLIDATED FINANCIAL STATEMENTS
Unrecognized
prior service cost is amortized over the average remaining service period of
each active employee.
In
2009, as a result of the workforce reduction associated with the restructuring
program and associated distribution of benefits, the Company recorded a pre-tax
pension settlement charge of $9.4 million relating to lump-sum distributions to
employees.
In
2008, the Company recorded a pre-tax pension settlement charge of $7.1 million
relating to employees that received lump-sum distributions in connection with
the restructuring program initiated in 2007. Approximately $0.3 million of this
charge was included in discontinued operations.
The
Company's funding policy for U.S. plans generally is to contribute annually into
trust funds at a rate that provides for future plan benefits and maintains
appropriate funded percentages. Annual contributions to the U.S.
qualified plans are at least sufficient to satisfy regulatory funding standards
and are not more than the maximum amount deductible for income tax purposes. The
funding policies for the international plans conform to local governmental and
tax requirements. The plans' assets are invested primarily in stocks and
bonds.
The
2010 estimated amortization of amounts in other comprehensive income are as
follows:
|
(Millions of
Dollars)
|
Pension
Benefits
|
Post
Retirement Benefits
|
|||||
|
Amortization
of prior service cost
|
$
|
1.5
|
$
|
(3.1
|
)
|
||
|
Amortization
of net loss
|
8.2
|
0.2
|
|||||
|
Total
costs to be recognized
|
$
|
9.7
|
$
|
(2.9
|
)
|
||
Additional
Information
The
weighted average assumptions used to determine net periodic benefit cost in the
accounting for the pension benefit plans and other benefit plans for the years
ended December 31, 2009, 2008 and 2007 are as follows:
|
2009
|
2008
|
2007
|
|||||||||
|
Discount
rate
|
6.00
|
%
|
6.30
|
%
|
5.75
|
%
|
|||||
|
Expected
return on plan assets
|
7.15
|
%
|
8.00
|
%
|
8.50
|
%
|
|||||
|
Rate
of compensation increase
|
3.20
|
%
|
3.50
|
%
|
3.50
|
%
|
The
weighted average assumptions used to determine benefit obligations for the
pension benefit plans and other benefit plans at December 31, 2009, 2008 and
2007 are as follows:
|
2009
|
2008
|
2007
|
|||||||||
|
Discount
rate
|
5.7
|
%
|
6.20
|
%
|
6.25
|
%
|
|||||
|
Rate
of compensation increase
|
3.2
|
%
|
3.50
|
%
|
3.50
|
%
|
For
2009, 2008 and 2007, the discount rate was based on a Citigroup yield curve of
high quality corporate bonds with cash flows matching our plans' expected
benefit payments. The expected return on plan assets is based on our asset
allocation mix and our historical return, taking into account current and
expected market conditions. The actual return (loss) on pension assets was
approximately 7% in 2009, (19%) in 2008 and 4% in 2007.
The
Company maintains a self-funded health insurance plan for its
retirees. This plan provided that the maximum health care cost trend
rate would be 5%. Effective June 2009, the Company amended its plan
to change the eligibility requirement for retirees and revised its plan so that
increases in expected health care costs would be borne by the
retiree.
Plan
Assets
The
Company's pension plan weighted average asset allocation percentages at December
31, 2009 and 2008 by asset category are as follows:
|
Asset
Category
|
2009
|
2008
|
||||||||
|
Equity
securities
|
46.2
|
%
|
11.7
|
%
|
||||||
|
Fixed
income securities
|
50.9
|
%
|
85.7
|
%
|
||||||
|
Real
estate
|
0.1
|
%
|
0.1
|
%
|
||||||
|
Other
|
2.8
|
%
|
2.5
|
%
|
||||||
|
Total
|
100.0
|
%
|
100.0
|
%
|
||||||
F-24
MINERALS
TECHNOLOGIES INC. AND SUBSIDIARY COMPANIES
NOTES
OF CONSOLIDATED FINANCIAL STATEMENTS
The
Company's pension plan fair values at December 31, 2009 and 2008 by asset
category are as follows:
Million
of Dollars
|
Asset
Category
|
2009
|
2008
|
||||||||
|
Equity
securities
|
$
|
81.6
|
$
|
20.3
|
||||||
|
Fixed
income securities
|
89.9
|
148.7
|
||||||||
|
Real
estate
|
0.2
|
0.2
|
||||||||
|
Other
|
5.0
|
4.3
|
||||||||
|
Total
|
$
|
176.7
|
$
|
173.5
|
||||||
During
2008, due to the economic crisis, the assets for all of the U.S. pension plans
were moved to fixed income securities. During 2009, the Company began
a program of systematically moving funds back into equities. The
Company intends to rebalance its investment portfolio to adhere to its long-term
investment strategy over the next twelve months.
The
following table presents domestic and foreign pension plan assets information at
December 31, 2009, 2008 and 2007 (the measurement date of pension plan
assets):
|
U.S.
Plans
|
International
Plans
|
||||||||||||||||||||||
|
Millions
of Dollars
|
2009
|
2008
|
2007
|
2009
|
2008
|
2007
|
|||||||||||||||||
|
Fair
value of plan assets
|
$
|
126.4
|
$
|
132.8
|
$
|
188.7
|
$
|
50.3
|
$
|
40.7
|
$
|
55.8
|
|||||||||||
The
following table summarizes our defined benefit pension plan assets measured at
fair value as of December 31, 2009:
|
Millions
of Dollars
|
Pension
Assets at Fair Value as of December 31, 2009
|
||||||||||||||
|
Asset
Class
|
Quoted
Prices
In
Active Markets for
Identical
Assets
|
Significant
Other
Observable
Inputs
|
Significant
Unobservable
Inputs
|
Total
|
|||||||||||
|
(Level
1)
|
(Level
2)
|
(Level
3)
|
|||||||||||||
|
Equity
Securities
|
|||||||||||||||
|
US
equities
|
$
|
57.4
|
--
|
--
|
$
|
57.4
|
|||||||||
|
Non-US
equities
|
24.2
|
--
|
--
|
24.2
|
|||||||||||
|
Fixed
Income Securities
|
|||||||||||||||
|
Government
treasuries
|
--
|
33.1
|
--
|
33.1
|
|||||||||||
|
Corporate
debt
instruments
|
29.5
|
27.3
|
--
|
56.8
|
|||||||||||
|
Real
estate and otherReal estate
and other
|
|||||||||||||||
|
Real
estate
|
--
|
--
|
0.2
|
0.2
|
|||||||||||
|
Other
|
--
|
--
|
5.0
|
5.0
|
|||||||||||
|
Total
Assets
|
$
|
111.1
|
$
|
60.4
|
$
|
5.2
|
$
|
176.7
|
|||||||
U.S. equities—This class
included actively and passively managed common equity securities comprised
primarily of large-capitalization stocks with value, core and growth
strategies.
Non-U.S. equities—This class
included actively managed common equity securities comprised primarily of
international large-capitalization stocks.
Fixed income—This class included debt
instruments issued by the US Treasury, and corporate debt
instruments.
Contributions
The
Company expects to contribute $5 million to its pension plans and $1.5 million
to its other postretirement benefit plan in 2010.
MINERALS
TECHNOLOGIES INC. AND SUBSIDIARY COMPANIES
NOTES
OF CONSOLIDATED FINANCIAL STATEMENTS
Estimated Future Benefit
Payments
The
following benefit payments, which reflect expected future service, as
appropriate, are expected to be paid:
|
Millions
of Dollars
|
Pension
Benefits
|
Other
Benefits
|
|||
|
2010
|
$
|
10.5
|
$
|
1.3
|
|
|
2011
|
$
|
11.2
|
$
|
1.3
|
|
|
2012
|
$
|
11.9
|
$
|
1.1
|
|
|
2013
|
$
|
14.0
|
$
|
1.0
|
|
|
2014
|
$
|
15.2
|
$
|
1.0
|
|
|
2015-2019
|
$
|
87.8
|
$
|
4.6
|
Investment
Strategies
The
investment strategy for pension plan assets is to maintain a broadly diversified
portfolio designed to achieve our target of an average long-term rate of return
of 7.15%. While we believe we can achieve a long-term average rate of return of
7.15%, we can not be certain that the portfolio will perform to our
expectations. From inception through October 31, 2008, assets were strategically
allocated among equity, debt and other investments to achieve a diversification
level that dampens fluctuations in investment returns. The Company's long-term
investment strategy has an investment portfolio mix of approximately 65% in
equity securities and 35% in fixed income securities. The Company's 16-year
average rate of return on assets through December 31, 2008 was over 9% on its
investment assets despite the significant losses realized in 2008. During the
fourth quarter of 2008, the Company adopted a capital conservation strategy as a
result of the severe market volatility experienced in the latter part of 2008
and into 2009. As part of this strategy, the Company temporarily invested its
pension assets in fixed income securities due to the uncertainty in the markets
but has not changed its long-term investment strategy. During the first half of
2009, we analyzed data provided by investment consultants which indicated the
likely returns from a move to equities at that time were not significantly
better than the expected returns from the capital conservation strategy and that
such a change involved significantly more risk. During the third quarter 2009,
we have begun a program of systematically moving funds back into equities. The
Company intends to rebalance its investment portfolio to adhere to its long-term
investment strategy over the next twelve months as the markets continue to
stabilize. As of the end of the year, the Company had approximately
51% of its pension assets in fixed income securities.
Savings and Investment
Plans
The
Company maintains a voluntary Savings and Investment Plan for most non-union
employees in the U.S. Within prescribed limits, the Company bases its
contribution to the Plan on employee contributions. The Company's contributions
amounted to $2.7 million, $3.2 million and $3.4 million for the years ended
December 31, 2009, 2008 and 2007, respectively.
Notes
18. Leases
The
Company has several non-cancelable operating leases, primarily for office space
and equipment. Rent expense amounted to approximately $6.7 million, $7.1 million
and $7.0 million for the years ended December 31, 2009, 2008 and 2007,
respectively. Total future minimum rental commitments under all non-cancelable
leases for each of the years 2010 through 2014 and in aggregate thereafter are
approximately $6.2 million, $3.6 million, $2.6 million, $2.2 million, $1.6
million, respectively, and $8.7 million thereafter. Total future minimum rentals
to be received under non-cancelable subleases were approximately $2.0 million at
December 31, 2009.
Total
future minimum payments to be received under direct financing leases for each of
the years 2010 through 2014 and the aggregate thereafter are approximately: $6.0
million, $2.9 million, $1.9 million, $1.0 million, $0.7 million and $1.0 million
thereafter.
Note
19. Litigation
Certain
of the Company's subsidiaries are among numerous defendants in a number of cases
seeking damages for exposure to silica or to asbestos containing
materials. The Company currently has 305 pending silica cases and 26
pending asbestos cases. To date, 1,160 silica cases and 4 asbestos
cases have been dismissed. One silica case was dismissed in the fourth quarter
of 2009. Most of these claims do not provide adequate information to assess
their merits, the likelihood that the Company will be found liable, or the
magnitude of such liability, if any. Additional claims of this nature
may be made against the Company or its subsidiaries. At this time
management anticipates that the amount of the Company's liability, if any, and
the cost of defending such claims, will not have a material effect on its
financial position or results of operations.
The Company has not settled any
silica or asbestos lawsuits to date. We are unable to state an amount
or range of amounts claimed in any of the lawsuits because state court pleading
practices do not require identifying the amount of the
F-26
MINERALS
TECHNOLOGIES INC. AND SUBSIDIARY COMPANIES
NOTES
OF CONSOLIDATED FINANCIAL STATEMENTS
claimed
damage. The aggregate cost to the Company for the legal defense of
these cases since inception was approximately $0.1 million, the majority of
which has been reimbursed by Pfizer Inc. pursuant to the terms of certain
agreements entered into in connection with the Company's initial public offering
in 1992. Our experience has been that the Company is not liable to
plaintiffs in any of these lawsuits and the Company does not expect to pay any
settlements or jury verdicts in these lawsuits.
Environmental
Matters
On
April 9, 2003, the Connecticut Department of Environmental Protection ("DEP")
issued an administrative consent order relating to our Canaan, Connecticut,
plant where both our Refractories segment and Specialty Minerals segment have
operations. We agreed to the order, which includes provisions requiring
investigation and remediation of contamination associated with historic use of
polychlorinated biphenyls ("PCBs") at a portion of the site. The following is
the present status of the remediation efforts:
|
•
|
Building
Decontamination. We have completed the investigation of building
contamination and submitted a report characterizing the contamination. We
are awaiting review and approval of this report by the regulators. Based
on the results of this investigation, we believe that the contamination
may be adequately addressed by means of encapsulation through painting of
exposed surfaces, pursuant to the Environmental Protection Agency's
("EPA") regulations and have accrued such liabilities as discussed below.
However, this conclusion remains uncertain pending completion of the
phased remediation decision process required by the
regulations.
|
|
•
|
Groundwater. We
have completed investigations of potential groundwater contamination and
have submitted a report on the investigations finding that there is no PCB
contamination, but some oil contamination of the
groundwater. We expect the regulators to require confirmatory
long term groundwater monitoring at the site.
|
|
•
|
Soil. We have completed
the investigation of soil contamination and submitted a report
characterizing contamination to the regulators. Based on the results of
this investigation, we believe that the contamination may be left in place
and monitored, pursuant to a site-specific risk assessment, which is
underway. However, this conclusion is subject to completion of a phased
remediation decision process required by applicable
regulations.
|
We
believe that the most likely form of remediation will be to leave existing
contamination in place, encapsulate it, and monitor the effectiveness of the
encapsulation. We estimate that the cost of the likely remediation above would
approximate $400,000, and that amount has been recorded as a liability on our
books and records.
The
Company is evaluating options for upgrading the wastewater treatment facilities
at its Adams, Massachusetts, plant. This work has been undertaken pursuant to an
administrative Consent Order originally issued by the Massachusetts Department
of Environmental Protection on June 18, 2002. This Order was amended on June 1,
2009. The amended order requires the installation of a groundwater
containment system by mid-year 2010. The amendment also includes the
investigation by January 1, 2022 of options for ensuring that the facility’s
wastewater treatment ponds will not result in unpermitted discharge to
groundwater. Additional requirements of the amendment include the
submittal by July 1, 2022 of a plan for closure of a historic lime solids
disposal area. Preliminary engineering reviews completed in 2005 indicate that
the estimated cost of wastewater treatment upgrades to operate this facility
beyond 2024 may be between $6 million and $8 million. The Company estimates that
the remaining remediation costs would approximate $400,000, which has been
accrued as of December 31, 2009.
The
Company and its subsidiaries are not party to any other material pending legal
proceedings, other than routine litigation incidental to their
businesses.
F-27
MINERALS
TECHNOLOGIES INC. AND SUBSIDIARY COMPANIES
NOTES
OF CONSOLIDATED FINANCIAL STATEMENTS
Note
20. Stockholders' Equity
Capital
Stock
The
Company's authorized capital stock consists of 100 million shares of common
stock, par value $0.10 per share, of which 18,740,616 shares and 18,691,802
shares were outstanding at December 31, 2009 and 2008, respectively, and
1,000,000 shares of preferred stock, none of which were issued and
outstanding.
Cash
Dividends
Cash
dividends of $3.7 million or $0.20 per common share were paid during 2009. In
January 2010, a cash dividend of approximately $0.9 million or $0.05 per share,
was declared, payable in the first quarter of 2010.
Preferred
Stock Purchase Rights
In
1999, the Company adopted a Preferred Stock Purchase Rights Plan, pursuant to
which, each share of the Company’s common stock carried with it one preferred
stock purchase right. These rights would become exercisable upon
certain conditions. The Rights Plan, and the associated rights,
expired in accordance with their terms on September 13, 2009.
Stock
and Incentive Plan
The
Company has adopted a Stock Award and Incentive Plan (the "Plan"), which
provides for grants of incentive and non-qualified stock options, stock
appreciation rights, stock awards or performance unit awards. The Plan is
administered by the Compensation Committee of the Board of Directors. Stock
options granted under the Plan have a term not in excess of ten years. The
exercise price for stock options will not be less than the fair market value of
the common stock on the date of the grant, and each award of stock options will
vest ratably over a specified period, generally three years.
The
following table summarizes stock option and restricted stock activity for the
Plan:
|
Stock
Options
|
Restricted
Stock
|
||||||||||||||||||
|
Shares
Available for Grant
|
Shares
|
Weighted
Average Exercise Price Per Share ($)
|
Shares
|
Weighted
Average Exercise Price Per Share ($)
|
|||||||||||||||
|
Balance
January 1, 2007
|
729,111
|
1,152,069
|
$
|
46.44
|
134,800
|
$
|
55.61
|
||||||||||||
|
Granted
|
(233,750
|
)
|
146,100
|
61.19
|
87,650
|
61.27
|
|||||||||||||
|
Exercised/vested
|
--
|
(433,965
|
)
|
43.01
|
(33,363
|
)
|
55.42
|
||||||||||||
|
Canceled
|
80,043
|
(24,489
|
)
|
55.67
|
(55,554
|
)
|
56.56
|
||||||||||||
|
Balance
December 31, 2007
|
575,404
|
839,715
|
50.51
|
133,533
|
58.98
|
||||||||||||||
|
Granted
|
(180,900
|
)
|
112,300
|
64.47
|
68,600
|
64.06
|
|||||||||||||
|
Exercised/vested
|
--
|
(261,460
|
)
|
43.97
|
(28,267
|
)
|
56.45
|
||||||||||||
|
Canceled
|
41,346
|
(28,774
|
)
|
57.90
|
(12,572
|
)
|
58.30
|
||||||||||||
|
Balance
December 31, 2008
|
435,850
|
661,781
|
55.14
|
161,294
|
61.63
|
||||||||||||||
|
Granted
|
(280,600
|
)
|
179,200
|
39.84
|
101,400
|
39.65
|
|||||||||||||
|
Authorized
|
800,000
|
--
|
--
|
--
|
--
|
||||||||||||||
|
Exercised/vested
|
--
|
(7,532
|
)
|
35.63
|
(41,020
|
)
|
60.35
|
||||||||||||
|
Canceled
|
78,875
|
(45,919
|
)
|
43.14
|
(32,956
|
)
|
61.30
|
||||||||||||
|
Balance
December 31, 2009
|
1,034,125
|
787,530
|
$
|
52.54
|
188,718
|
$
|
50.16
|
||||||||||||
Note
21. Comprehensive Income
Comprehensive
income includes changes in the fair value of certain financial derivative
instruments that qualify for hedge accounting to the extent they are effective,
the recognition of deferred pension costs, and cumulative foreign currency
translation adjustments.
MINERALS
TECHNOLOGIES INC. AND SUBSIDIARY COMPANIES
NOTES
OF CONSOLIDATED FINANCIAL STATEMENTS
The
following table reflects the accumulated balances of other comprehensive income
(loss):
|
Millions
of Dollars
|
Currency
Translation Adjustment
|
Unrecognized
Pension
Costs
|
Net
Gain (Loss) On Cash Flow Hedges
|
Accumulated
Other Comprehensive Income (Loss)
|
||||||||||||
|
Balance
at January 1, 2007
|
$
|
33.2
|
$
|
(54.3
|
)
|
$
|
(0.1
|
)
|
$
|
(21.2
|
)
|
|||||
|
Current
year net change
|
48.5
|
18.1
|
--
|
66.6
|
||||||||||||
|
Balance
at December 31, 2007
|
81.7
|
(36.2
|
)
|
(0.1
|
)
|
45.4
|
||||||||||
|
Current
year net change
|
(49.4
|
)
|
(28.8
|
)
|
1.2
|
(77.0
|
)
|
|||||||||
|
Balance
at December 31, 2008
|
32.3
|
(65.0
|
)
|
1.1
|
(31.6
|
)
|
||||||||||
|
Current
year net change
|
23.4
|
12.8
|
(1.4
|
)
|
34.8
|
|||||||||||
|
Balance
at December 31, 2009
|
$
|
55.7
|
$
|
(52.2
|
)
|
$
|
(0.3
|
)
|
$
|
3.2
|
The
income tax expense (benefit) associated with items included in other
comprehensive income (loss) was approximately $10.0 million, $(18.0) million and
$11.2 million for the years ended December 31, 2009, 2008 and 2007,
respectively.
Note
22. Accounting for Asset Retirement Obligations
The
Company records asset retirement obligations in which the Company will be
required to retire tangible long-lived assets. These are primarily related to
its PCC satellite facilities and mining operations. The Company has also
recorded the provisions related to conditional asset retirement obligations at
its facilities. The Company has recorded asset retirement obligations at all of
its facilities except where there are no contractual or legal obligations. The
associated asset retirement costs are capitalized as part of the carrying amount
of the long-lived asset.
The
following is a reconciliation of asset retirement obligations as of December 31,
2009 and 2008:
Millions
of Dollars
|
2009
|
2008
|
||||||
|
Asset
retirement liability, beginning of period
|
$
|
13.0
|
$
|
12.9
|
|||
|
Accretion
expense
|
0.7
|
0.7
|
|||||
|
Payments
|
--
|
(0.2
|
)
|
||||
|
Foreign
currency
translation
|
0.3
|
(0.4
|
)
|
||||
|
Asset
retirement liability, end of
period
|
$
|
14.0
|
$
|
13.0
|
The
current portion of the liability of approximately $0.4 million is included in
other current liabilities. The long-term portion of the liability of
approximately $13.6 million is included in other noncurrent
liabilities.
Accretion
expense is included in cost of goods sold in the Company's Consolidated
Statements of Operations.
Note
23. Non-Operating Income and Deductions
|
(Millions
of dollars)
|
Year
Ended December 31,
|
|||||||||||||
|
2009
|
2008
|
2007
|
||||||||||||
|
Interest
income
|
$
|
2.9
|
$
|
4.9
|
$
|
3.1
|
||||||||
|
Interest
expense
|
(3.5
|
)
|
(5.2
|
)
|
(8.7
|
)
|
||||||||
|
Gain
on insurance settlement
|
--
|
--
|
3.0
|
|||||||||||
|
Currency
translation loss
|
(2.3
|
)
|
--
|
--
|
||||||||||
|
Foreign
exchange gains (losses)
|
(2.4
|
)
|
1.7
|
0.5
|
||||||||||
|
Other
income (deductions)
|
(0.8
|
)
|
(1.1
|
)
|
(0.9
|
)
|
||||||||
|
Non-operating
income (deductions), net
|
$
|
(6.1
|
)
|
$
|
0.3
|
$
|
(3.0
|
)
|
||||||
During
the second quarter of 2009, the Company recognized foreign currency translation
losses of $2.3 million upon liquidation of the Company’s operations at Gomez
Palacio, Mexico.
During
the fourth quarter of 2007, the Company recognized a business interruption
insurance recovery gain of $3.0 million related to Hurricane Ivan in
2004.
F-29
MINERALS
TECHNOLOGIES INC. AND SUBSIDIARY COMPANIES
NOTES
OF CONSOLIDATED FINANCIAL STATEMENTS
Note
24. Transaction with Former Parent Company
Under
the terms of certain agreements entered into in connection with the Company's
initial public offering in 1992, Pfizer Inc ("Pfizer") agreed to indemnify the
Company against any liability arising from claims for remediation, as defined in
the agreements, of on-site environmental conditions relating to activities prior
to the closing of the initial public offering. The Company had asserted to
Pfizer a number of indemnification claims pursuant to those agreements during
the ten-year period following the closing of the initial public offering. Since
the initial public offering, the Company has incurred and expensed approximately
$6 million of environmental claims under these agreements. On January 20, 2006,
Pfizer and the Company agreed to settle those claims, along with certain other
potential environmental liabilities of Pfizer, in consideration of a payment by
Pfizer of $4.5 million. Such payment was recorded as additional paid-in-capital,
net of its related tax effect. During 2008, agreement was reached with Pfizer
providing for reimbursement by Pfizer of past costs of defense, and direct
payment of such costs going forward, for cases alleging damages from exposure to
product sold prior to the formation of the Company. During the fourth quarter of
2008, Pfizer reimbursed the Company in the amount of $0.1 million for past
defense costs.
Note
25. Segment and Related Information
Operating
segments are defined as components of an enterprise about which separate
financial information is available that is evaluated regularly by the chief
operating decision maker in deciding how to allocate resources and in assessing
performance. The Company's operating segments are strategic business units that
offer different products and serve different markets. They are managed
separately and require different technology and marketing
strategies.
The
Company has two reportable segments: Specialty Minerals and Refractories. The
Specialty Minerals segment produces and sells precipitated calcium carbonate and
lime, and mines, processes and sells the natural mineral products limestone and
talc. This segment's products are used principally in the paper, building
materials, paints and coatings, glass, ceramic, polymers, food, automotive, and
pharmaceutical industries. The Refractories segment produces and markets
monolithic and shaped refractory products and systems used primarily by the
steel, cement and glass industries as well as metallurgical products used
primarily in the steel industry.
The
accounting policies of the segments are the same as those described in the
summary of significant accounting policies. The Company evaluates performance
based on the operating income of the respective business units. Depreciation
expense related to corporate assets is allocated to the business segments and is
included in their income from operations. However, such corporate depreciable
assets are not included in the segment assets. Intersegment sales and transfers
are not significant.
Segment
information for the years ended December 31, 2009, 2008 and 2007 was as
follows:
| (Millions of Dollars) |
2009
|
||||||||||
|
Specialty
Minerals
|
Refractories
|
Total
|
|||||||||
|
Net
sales
|
$
|
628.4
|
$
|
278.9
|
$
|
907.3
|
|||||
|
Income
(loss) from operations
|
34.2
|
(48.8
|
)
|
(14.6
|
)
|
||||||
|
Impairment
of assets
|
8.5
|
31.3
|
39.8
|
||||||||
|
Restructuring
and other charges
|
11.5
|
10.5
|
22.0
|
||||||||
|
Depreciation,
depletion and amortization
|
58.5
|
13.9
|
72.4
|
||||||||
|
Segment
assets
|
631.7
|
326.2
|
957.9
|
||||||||
|
Capital
expenditures
|
19.1
|
5.6
|
24.7
|
||||||||
|
2008
|
|||||||||||
|
(Millions
of Dollars)
|
Specialty
Minerals
|
Refractories
|
Total
|
||||||||
|
Net
sales
|
$
|
716.4
|
$
|
395.8
|
$
|
1,112.2
|
|||||
|
Income
from operations
|
57.0
|
26.3
|
83.3
|
||||||||
|
Impairment
of assets
|
0.2
|
--
|
0.2
|
||||||||
|
Restructuring
and other charges
|
7.7
|
5.7
|
13.4
|
||||||||
|
Depreciation,
depletion and amortization
|
64.3
|
15.8
|
80.1
|
||||||||
|
Segment
assets
|
632.4
|
396.1
|
1,028.5
|
||||||||
|
Capital
expenditures
|
18.2
|
11.5
|
29.7
|
||||||||
MINERALS
TECHNOLOGIES INC. AND SUBSIDIARY COMPANIES
NOTES
OF CONSOLIDATED FINANCIAL STATEMENTS
|
2007
|
|||||||||||
|
(Millions
of Dollars)
|
Specialty
Minerals
|
Refractories
|
Total
|
||||||||
|
Net
sales
|
$
|
716.6
|
$
|
361.1
|
$
|
1,077.7
|
|||||
|
Income
(loss) from operations
|
(20.0
|
)
|
11.5
|
(8.5
|
)
|
||||||
|
Impairment
of assets
|
79.3
|
14.8
|
94.1
|
||||||||
|
Restructuring
and other charges
|
11.3
|
4.7
|
16.0
|
||||||||
|
Depreciation,
depletion and amortization
|
68.1
|
16.5
|
84.6
|
||||||||
|
Segment
assets
|
698.8
|
395.6
|
1,094.4
|
||||||||
|
Capital
expenditures
|
32.9
|
11.9
|
44.8
|
||||||||
A
reconciliation of the totals reported for the operating segments to the
applicable line items in the consolidated financial statements is as
follows:
|
(Millions
of Dollars)
|
||||||||||||
|
Income
(loss) from continuing operations before
|
||||||||||||
|
|
provision
(benefit) for taxes:
|
2009
|
2008
|
2007
|
||||||||
|
Income
(loss) from operations for reportable segments
|
$
|
(14.6
|
)
|
$
|
83.3
|
$
|
(8.5
|
)
|
||||
|
Unallocated
corporate expenses
|
(2.5
|
)
|
(1.3
|
)
|
--
|
|||||||
|
Interest
income
|
2.9
|
4.9
|
3.1
|
|||||||||
|
Interest
expense
|
(3.5
|
)
|
(5.2
|
)
|
(8.7
|
)
|
||||||
|
Other
income (deductions)
|
(5.4
|
)
|
0.6
|
2.6
|
||||||||
|
|
Income
(loss) from continuing operations before provision (benefit) for
taxes
|
$
|
(23.1
|
)
|
$
|
82.3
|
$
|
(11.5
|
)
|
|||
|
Total
assets
|
2009
|
2008
|
2007
|
|||||||||
|
Total
segment assets
|
$
|
957.9
|
$
|
1,028.5
|
$
|
1,094.4
|
||||||
|
Corporate
assets
|
114.2
|
39.1
|
34.5
|
|||||||||
|
|
||||||||||||
|
|
Consolidated
total assets
|
$
|
1,072.1
|
$
|
1,067.6
|
$
|
1,128.9
|
|||||
|
Capital
expenditures
|
2009
|
2008
|
2007
|
|||||||||
|
Total
segment capital expenditures
|
$
|
24.7
|
$
|
29.7
|
$
|
44.8
|
||||||
|
Corporate
capital expenditures
|
1.9
|
1.3
|
1.3
|
|||||||||
|
|
Consolidated
total capital expenditures
|
$
|
26.6
|
$
|
31.0
|
$
|
46.1
|
|||||
The
carrying amount of goodwill by reportable segment as of December 31, 2009 and
December 31, 2008 was as follows:
|
Goodwill
|
||||||||
|
(Millions
of Dollars)
|
December
31,
2009
|
December
31, 2008
|
||||||
|
Specialty
Minerals
|
$
|
14.1
|
$
|
13.4
|
||||
|
Refractories
|
54.0
|
53.0
|
||||||
|
|
Total
|
$
|
68.1
|
$
|
66.4
|
|||
The
net change in goodwill since December 31, 2008 is primarily attributable to the
effect of foreign exchange.
Financial
information relating to the Company's operations by geographic area was as
follows:
|
(Millions
of Dollars)
|
||||||||||||
|
Net
Sales
|
2009
|
2008
|
2007
|
|||||||||
|
United
States
|
$
|
478.4
|
$
|
586.5
|
$
|
581.9
|
||||||
|
Canada/Latin
America
|
60.2
|
83.8
|
83.3
|
|||||||||
|
Europe/Africa
|
283.9
|
352.7
|
337.4
|
|||||||||
|
Asia
|
84.8
|
89.2
|
75.1
|
|||||||||
|
Total
International
|
428.9
|
525.7
|
495.8
|
|||||||||
|
|
||||||||||||
|
|
Consolidated
total net sales
|
$
|
907.3
|
$
|
1,112.2
|
$
|
1,077.7
|
|||||
MINERALS
TECHNOLOGIES INC. AND SUBSIDIARY COMPANIES
NOTES
OF CONSOLIDATED FINANCIAL STATEMENTS
Net
sales and long-lived assets are attributed to countries and geographic areas
based on the location of the legal entity. No individual foreign country
represents more than 10% of consolidated net sales or consolidated long-lived
assets.
|
(Millions
of Dollars)
|
||||||||||||
|
Long-lived
assets
|
2009
|
2008
|
2007
|
|||||||||
|
United
States
|
$
|
253.5
|
$
|
296.9
|
$
|
322.4
|
||||||
|
Canada/Latin
America
|
13.5
|
13.3
|
20.1
|
|||||||||
|
Europe/Africa
|
105.7
|
130.4
|
172.1
|
|||||||||
|
Asia
|
59.5
|
67.1
|
62.0
|
|||||||||
|
Total
International
|
178.7
|
210.8
|
254.2
|
|||||||||
|
|
||||||||||||
|
|
Consolidated
total long-lived assets
|
$
|
432.2
|
$
|
507.7
|
$
|
576.6
|
|||||
The
Company's sales by product category are as follows:
|
Millions
of Dollars
|
2009
|
2008
|
2007
|
|||||||
|
Paper
PCC
|
$
|
484.6
|
$
|
547.2
|
$
|
542.0
|
||||
|
Specialty
PCC
|
50.1
|
58.5
|
60.6
|
|||||||
|
Talc
|
32.3
|
35.9
|
37.3
|
|||||||
|
GCC
|
61.4
|
74.8
|
76.7
|
|||||||
|
Refractory
Products
|
225.4
|
320.8
|
290.5
|
|||||||
|
Metallurgical
Products
|
53.5
|
75.0
|
70.6
|
|||||||
|
Net
sales
|
$
|
907.3
|
$
|
1,112.2
|
$
|
1,077.7
|
Note
26. Quarterly Financial Data (unaudited)
The
financial information for all periods presented has been reclassified to reflect
discontinued operations. See Note 4 to the Consolidated Financial Statements for
further information.
Millions
of Dollars, Except Per Share Amounts
|
2009
Quarters
|
First
|
Second
|
Third
|
Fourth
|
||||||||||||||||
|
Net
Sales by Major Product Line
|
||||||||||||||||||||
|
PCC
|
$
|
123.1
|
$
|
127.7
|
$
|
137.5
|
$
|
146.4
|
||||||||||||
|
Processed
Minerals
|
20.5
|
24.3
|
25.0
|
23.9
|
||||||||||||||||
|
Specialty
Minerals Segment
|
143.6
|
152.0
|
162.5
|
170.3
|
||||||||||||||||
|
Refractories
Segment
|
64.7
|
56.6
|
71.8
|
85.8
|
||||||||||||||||
|
Net
sales
|
208.3
|
208.6
|
234.3
|
256.1
|
||||||||||||||||
|
Gross
profit
|
33.2
|
32.4
|
44.0
|
46.2
|
||||||||||||||||
|
Income
(loss) from
operations
|
7.3
|
(41.6
|
)
|
12.8
|
4.5
|
|||||||||||||||
|
Income
(loss) continuing operations, net of tax
|
5.1
|
(36.5
|
)
|
9.5
|
4.1
|
|||||||||||||||
|
Income
(loss) from discontinued operations, net of
tax
|
(0.1
|
)
|
(3.5
|
)
|
0.3
|
0.1
|
||||||||||||||
|
Noncontrolling
Interests
|
(0.8
|
)
|
(0.9
|
)
|
(0.9
|
)
|
(0.2
|
)
|
||||||||||||
|
Net
income (loss) attributable to MTI
|
$
|
4.2
|
$
|
(40.9
|
)
|
$
|
8.9
|
$
|
4.0
|
|||||||||||
|
Earnings
(loss) per share:
|
||||||||||||||||||||
|
Basic:
|
||||||||||||||||||||
|
Earnings
(loss) per share
|
||||||||||||||||||||
|
from
continuing operations attributable to MTI
|
$
|
0.23
|
$
|
(1.99
|
)
|
$
|
0.46
|
$
|
0.20
|
|||||||||||
|
Earnings
(loss) per share
|
||||||||||||||||||||
|
discontinued
operations attributable to MTI
|
(0.01
|
)
|
(0.19
|
)
|
0.01
|
0.01
|
||||||||||||||
|
Basic
earnings (loss) per share attributable to MTI
|
$
|
0.22
|
$
|
(2.18
|
)
|
$
|
0.47
|
$
|
0.22
|
|||||||||||
F-32
MINERALS
TECHNOLOGIES INC. AND SUBSIDIARY COMPANIES
NOTES
OF CONSOLIDATED FINANCIAL STATEMENTS
|
2009
Quarters
|
First
|
Second
|
Third
|
Fourth
|
|||||||||||||||
|
Diluted:
|
|||||||||||||||||||
|
Earnings
(loss) per share
|
|||||||||||||||||||
|
from
continuing operations
|
$
|
0.23
|
$
|
(1.99
|
)
|
$
|
0.46
|
$
|
0.21
|
||||||||||
|
Earnings
(loss) per share
|
|||||||||||||||||||
|
from
discontinued operations
|
(0.01
|
)
|
(0.19
|
)
|
0.01
|
0.01
|
|||||||||||||
|
Diluted
earnings (loss) per share
|
$
|
0.22
|
$
|
(2.18
|
)
|
$
|
0.47
|
$
|
0.22
|
||||||||||
|
Market
price range per share of common stock:
|
|||||||||||||||||
|
High
|
$
|
42.10
|
$
|
42.82
|
$
|
50.87
|
$
|
56.39
|
|||||||||
|
Low
|
$
|
26.76
|
$
|
31.41
|
$
|
35.87
|
$
|
45.85
|
|||||||||
|
Close
|
$
|
32.05
|
$
|
36.78
|
$
|
47.52
|
$
|
54.47
|
|||||||||
|
Dividends
paid per common share
|
$
|
0.05
|
$
|
0.05
|
$
|
0.05
|
$
|
0.05
|
|||||||||
|
2008
Quarters
|
First
|
Second
|
Third
|
Fourth
|
||||||||||||||||
|
Net
Sales by Major Product Line
|
||||||||||||||||||||
|
PCC
|
$
|
153.2
|
$
|
158.0
|
$
|
157.2
|
$
|
137.3
|
||||||||||||
|
Processed
Minerals
|
27.6
|
31.1
|
29.5
|
22.5
|
||||||||||||||||
|
Specialty
Minerals Segment
|
180.8
|
189.1
|
186.7
|
159.8
|
||||||||||||||||
|
Refractories
Segment
|
96.7
|
110.7
|
108.2
|
80.2
|
||||||||||||||||
|
Net
sales
|
277.5
|
299.8
|
294.9
|
240.0
|
||||||||||||||||
|
Gross
profit
|
60.7
|
62.3
|
59.4
|
38.0
|
||||||||||||||||
|
Income
from
operations
|
27.1
|
28.8
|
23.0
|
3.1
|
||||||||||||||||
|
Income
from continuing operations, net of tax
|
17.7
|
19.4
|
16.9
|
4.2
|
||||||||||||||||
|
Income
from discontinued operations, net of tax..
|
0.4
|
4.6
|
2.9
|
2.3
|
||||||||||||||||
|
Noncontrolling
interests
|
(0.9
|
)
|
(0.7
|
)
|
(0.8
|
)
|
(0.8
|
)
|
||||||||||||
|
Net
income attributable to MTI
|
$
|
17.2
|
$
|
23.3
|
$
|
19.0
|
$
|
5.7
|
||||||||||||
|
Earnings
per share:
|
||||||||||||||||||||
|
Basic:
|
||||||||||||||||||||
|
Earnings
per share
|
||||||||||||||||||||
|
from
continuing operations attributable to MTI
|
$
|
0.88
|
$
|
0.99
|
$
|
0.85
|
$
|
0.19
|
||||||||||||
|
Earnings
per share
|
||||||||||||||||||||
|
from
discontinued operations attributable to MTI
|
0.02
|
0.24
|
0.16
|
0.12
|
||||||||||||||||
|
Basic
earnings per share attributable to MTI
|
$
|
0.90
|
$
|
1.23
|
$
|
1.01
|
$
|
0.31
|
||||||||||||
|
Diluted:
|
||||||||||||||||||
|
Earnings
per share
|
||||||||||||||||||
|
from
continuing operations attributable to MTI
|
$
|
0.88
|
$
|
0.98
|
$
|
0.85
|
$
|
0.19
|
||||||||||
|
Earnings
per share
|
||||||||||||||||||
|
from
discontinued operations attributable to MTI
|
0.02
|
0.24
|
0.15
|
0.12
|
||||||||||||||
|
Diluted
earnings per share attributable to MTI
|
$
|
0.90
|
$
|
1.22
|
$
|
1.00
|
$
|
0.31
|
||||||||||
|
Market
price range per share of common stock:
|
||||||||||||||||||
|
High
|
$
|
64.74
|
$
|
72.42
|
$
|
68.38
|
$
|
59.36
|
||||||||||
|
Low
|
$
|
52.29
|
$
|
62.80
|
$
|
60.73
|
$
|
37.89
|
||||||||||
|
Close
|
$
|
61.72
|
$
|
64.65
|
$
|
61.62
|
$
|
40.90
|
||||||||||
|
Dividends
paid per common
share
|
$
|
0.05
|
$
|
0.05
|
$
|
0.05
|
$
|
0.05
|
||||||||||
Report of Independent
Registered Public Accounting Firm
The Board
of Directors and Shareholders
Minerals
Technologies Inc.:
We have
audited the accompanying consolidated balance sheets of Minerals Technologies
Inc. and subsidiary companies as of December 31, 2009 and 2008, and the related
consolidated statements of operations, shareholders' equity, and cash flows for
each of the years in the three-year period ended December 31, 2009. In
connection with our audits of the consolidated financial statements, we also
have audited the related financial statement schedule. These
consolidated financial statements and financial statement schedule are the
responsibility of the Company's management. Our responsibility is to express an
opinion on these consolidated financial statements and financial statement
schedule based on our audits.
We
conducted our audits in accordance with the standards of the
Public Company Accounting Oversight Board (United
States). Those standards require that we plan and perform the
audit to obtain reasonable assurance about whether the financial statements are
free of material misstatement. An audit includes examining, on a test
basis, evidence supporting the amounts and disclosures in the financial
statements. An audit also includes assessing the accounting principles used and
significant estimates made by management, as well as evaluating the overall
financial statement presentation. We believe that our audits provide
a reasonable basis for our opinion.
In our
opinion, the consolidated financial statements referred to above present fairly,
in all material respects, the financial position of Minerals Technologies Inc.
and subsidiary companies as of December 31, 2009 and 2008, and the results of
their operations and their cash flows for each of the years in the three-year
period ended December 31, 2009, in conformity with U.S. generally accepted
accounting
principles. Also in our opinion, the related financial
statement schedule, when considered in relation to the consolidated financial
statements taken as a whole, presents fairly, in all material respects, the
information set forth therein.
We also
have audited, in accordance with the standards of the Public Company Accounting
Oversight Board (United States), Mineral Technologies Inc. and subsidiary
companies' internal control over financial reporting as of December 31, 2009,
based on criteria
established in Internal Control -
Integrated Framework issued by the Committee of
Sponsoring Organizations of the Treadway Commission (COSO), and our
report dated February 25, 2010 expressed an unqualified opinion on the
effectiveness of the Company's internal control over financial
reporting.
/s/ KPMG
LLP
New York,
New York
February
25, 2010
Report of Independent
Registered Public Accounting Firm
The Board
of Directors and Shareholders
Minerals
Technologies Inc.:
We have
audited Minerals Technologies Inc. and subsidiary companies' internal control
over financial reporting as of December 31, 2009, based on criteria established
in Internal Control - Integrated Framework issued by the Committee of Sponsoring
Organizations of the Treadway Commission (COSO). Minerals Technologies Inc.
and subsidiary companies' management is responsible for maintaining effective
internal control over financial reporting and for its assessment of the
effectiveness of internal control over financial reporting, included in the
accompanying Management's Report on Internal Control Over Financial Reporting.
Our responsibility is to express an opinion on the Company's internal control
over financial reporting based on our audit.
We
conducted our audit in accordance with the standards of the Public Company
Accounting Oversight Board (United States). Those standards require that we plan
and perform the audit to obtain reasonable assurance about whether effective
internal control over financial reporting was maintained in all material
respects. Our audit included obtaining an understanding of internal control over
financial reporting, assessing the risk that a material weakness exists, and
testing and evaluating the design and operating effectiveness of internal
control based on the assessed risk. Our audit also included performing such
other procedures as we considered necessary in the circumstances. We believe
that our audit provides a reasonable basis for our opinion.
A
company's internal control over financial reporting is a process designed to
provide reasonable assurance regarding the reliability of financial reporting
and the preparation of financial statements for external purposes in accordance
with generally accepted accounting principles. A company's internal
control over financial reporting includes those policies and procedures that (1)
pertain to the maintenance of records that, in reasonable detail, accurately and
fairly reflect the transactions and dispositions of the assets of the company;
(2) provide reasonable assurance that transactions are recorded as necessary to
permit preparation of financial statements in accordance with generally accepted
accounting principles, and that receipts and expenditures of the company are
being made only in accordance with authorizations of management and directors of
the company; and (3) provide reasonable assurance regarding prevention or timely
detection of unauthorized acquisition, use, or disposition of the company's
assets that could have a material effect on the financial
statements.
Because
of its inherent limitations, internal control over financial reporting may not
prevent or detect misstatements. Also, projections of any evaluation
of effectiveness to future periods are subject to the risk that controls may
become inadequate because of changes in conditions, or that the degree of
compliance with the policies or procedures may deteriorate.
In our
opinion, Minerals Technologies Inc. and subsidiary companies maintained, in all
material respects, effective internal control over financial reporting as of
December 31, 2009, based on criteria established in Internal Control -
Integrated Framework issued by the Committee of Sponsoring Organizations of the
Treadway Commission (COSO).
We also
have audited, in accordance with the standards of the Public Company Accounting
Oversight Board (United States), the consolidated balance sheets of Minerals
Technologies Inc. and subsidiary companies as of December 31, 2009 and 2008, and
the related consolidated statements of operations, shareholders' equity, and
cash flows and related financial statement schedule for each of the years in the
three-year period ended December 31, 2009, and our report dated February 25,
2010 expressed an
unqualified opinion on those consolidated financial statements and financial
statement schedule.
/s/ KPMG
LLP
New York,
New York
February
25, 2010
Management's
Report On Internal Control Over Financial Reporting
Management
of Minerals Technologies Inc. is responsible for the preparation, integrity and
fair presentation of its published consolidated financial statements. The
financial statements have been prepared in accordance with U.S. generally
accepted accounting principles and, as such, include amounts based on judgements
and estimates made by management. The Company also prepared the other
information included in the annual report and is responsible for its accuracy
and consistency with the consolidated financial statements.
Management
is also responsible for establishing and maintaining effective internal control
over financial reporting. The Company's internal control over financial
reporting includes those policies and procedures that pertain to the Company's
ability to record, process, summarize and report reliable financial data. The
Company maintains a system of internal control over financial reporting, which
is designed to provide reasonable assurance to the Company's management and
board of directors regarding the preparation of reliable published financial
statements and safeguarding of the Company's assets. The system includes a
documented organizational structure and division of responsibility, established
policies and procedures, including a code of conduct to foster a strong ethical
climate, which are communicated throughout the Company, and the careful
selection, training and development of our people.
The
Board of Directors, acting through its Audit Committee, is responsible for the
oversight of the Company's accounting policies, financial reporting and internal
control. The Audit Committee of the Board of Directors is comprised entirely of
outside directors who are independent of management. The Audit Committee is
responsible for the appointment and compensation of the independent registered
public accounting firm. It meets periodically with management, the independent
registered public accounting firm and the internal auditors to ensure that they
are carrying out their responsibilities. The Audit Committee is also responsible
for performing an oversight role by reviewing and monitoring the financial,
accounting and auditing procedures of the Company in addition to reviewing the
Company's financial reports. The independent registered public accounting firm
and the internal auditors have full and unlimited access to the Audit Committee,
with or without management, to discuss the adequacy of internal control over
financial reporting, and any other matters which they believe should be brought
to the attention of the Audit Committee.
Management
recognizes that there are inherent limitations in the effectiveness of any
system of internal control over financial reporting, including the possibility
of human error and the circumvention or overriding of internal control.
Accordingly, even effective internal control over financial reporting can
provide only reasonable assurance with respect to financial statement
preparation and may not prevent or detect misstatements. Further, because of
changes in conditions, the effectiveness of internal control over financial
reporting may vary over time.
The
Company assessed its internal control system as of December 31, 2009 in relation
to criteria for effective internal control over financial reporting described in
"Internal Control - Integrated Framework" issued by the Committee of Sponsoring
Organizations of the Treadway Commission. Based on its assessment, the Company
has determined that, as of December 31, 2009, its system of internal control
over financial reporting was effective.
The
consolidated financial statements have been audited by the independent
registered public accounting firm, which was given unrestricted access to all
financial records and related data, including minutes of all meetings of
stockholders, the Board of Directors and committees of the Board. Reports of the
independent registered public accounting firm, which includes the independent
registered public accounting firm's attestation of the effectiveness of the
Company's internal control over financial reporting are also presented within
this document.
|
/s/
|
Joseph
C. Muscari
Chairman
of the Board
and
Chief Executive Officer
|
/s/
|
John
A. Sorel
Senior
Vice President, Finance
and
Chief Financial Officer
|
|
/s/
|
Michael
A. Cipolla
Vice
President, Corporate Controller
and
Chief Accounting Officer
|
February
25, 2010
MINERALS
TECHNOLOGIES INC. & SUBSIDIARY COMPANIES
SCHEDULE
II-VALUATION AND QUALIFYING ACCOUNTS
(thousands
of dollars)
|
Description
|
Balance
at Beginning of Period
|
Additions
Charged to Costs, Provisions and` Expenses
(b)
|
Deductions
(a)
|
Balance
at End of Period
|
||||||||||||
|
Year
ended December 31, 2009
|
||||||||||||||||
|
Valuation
and qualifying accounts deducted from
|
||||||||||||||||
|
assets
to which they apply:
|
||||||||||||||||
|
Allowance
for doubtful accounts
|
$
|
2,600
|
$
|
1,211
|
$
|
(921
|
)
|
$
|
2,890
|
|||||||
|
Year
ended December 31, 2008
|
||||||||||||||||
|
Valuation
and qualifying accounts deducted from
|
||||||||||||||||
|
assets
to which they apply:
|
||||||||||||||||
|
Allowance
for doubtful accounts
|
$
|
3,223
|
$
|
159
|
$
|
782
|
$
|
2,600
|
||||||||
|
Year
ended December 31, 2007
|
||||||||||||||||
|
Valuation
and qualifying accounts deducted from
|
||||||||||||||||
|
assets
to which they apply:
|
||||||||||||||||
|
Allowance
for doubtful accounts
|
$
|
4,550
|
$
|
(49)
|
$
|
(1,278)
|
$
|
3,223
|
||||||||
|
(a)
|
Includes
impact of translation of foreign currencies.
|
|
(b)
|
Provision
for bad debts, net of recoveries of $1.2 million, $0.2 million and $--
million in 2009, 2008 and 2007,
respectively.
|
| EXHIBIT INDEX | ||||||
|
|
The
following exhibits are filed as part of this report.
|
|||||
|
10.6(a)
|
-
|
|||||
|
10.7(a)
|
-
|
|||||
|
10.12(b)
|
-
|
|||||
|
10.12(c)
|
-
|
|||||
|
10.12(d)
|
-
|
|||||
|
10.12(e)
|
-
|
||
|
10.13
|
-
|
||
|
10.14(a)
|
-
|
||
|
10.14(b)
|
-
|
||
|
10.15
|
-
|
||
|
10.16(a)
|
-
|
||
|
21.1
|
-
|
||
|
23.1
|
-
|
||
|
24.0
|
-
|
||
|
31.1
|
-
|
||
|
31.2
|
-
|
||
|
32
|
-
|
||
|
(*)
|
Filed
herewith.
|
||
|
(+)
|
Management
contract or compensatory plan or arrangement required to be filed pursuant
to Item 601 of Regulation S-K.
|