Attached files
| file | filename |
|---|---|
| 8-K - FORM 8-K - HUDSON CITY BANCORP INC | y82856e8vk.htm |
Exhibit 99.1


| Forward-Looking Statement This presentation may contain forward-looking statements within the meaning of the Private Securities Litigation Reform Act of 1995. These forward-looking statements include, but are not limited to, statements about (i) Hudson City Bancorp, Inc.'s "Hudson City" or "HCBK") plans, objectives, expectations and intentions and other statements contained in this presentation that are not historical facts; and (ii) other statements identified by words such as "may", "believe", "expect", "anticipate", "should", "plan", "estimate", "predict", "continue", "potential", or words of similar meaning. Factors that could cause actual results to differ materially from those expressed in the forward- looking statements are discussed in Hudson City's 2008 Annual Report on Form 10-K and the September 30, 2009 Form 10-Q both filed with the Securities and Exchange Commission and are available at the SEC's Internet site (http://www.sec.gov) or through our Internet site (http://www.hcbk.com). Any or all of the forward-looking statements in this presentation and in any other public statements made by Hudson City may turn out to be wrong. They can be affected by inaccurate assumptions Hudson City might make or by known or unknown risks and uncertainties. Consequently, no forward-looking statement can be guaranteed, Hudson City does not intend to update any of the forward-looking statements after the date of this presentation or to conform these statements to actual events. |

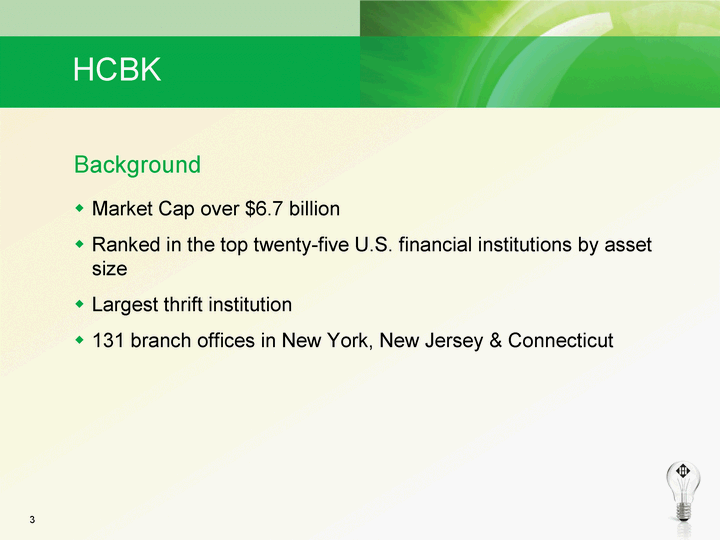
| Background Market Cap over $6.7 billion Ranked in the top twenty-five U.S. financial institutions by asset size Largest thrift institution 131 branch offices in New York, New Jersey & Connecticut HCBK |

| Simple, Consistent Operating Model Originate and purchase single family mortgage loans A jumbo originator and purchaser Retain all loans originated and purchased Outstanding credit quality Multiple mortgage loan distribution channels Retail (our own agents and extensive branch network) Retail (mortgage brokers and bankers) Wholesale (geographic diversity) Fund lending and investing activities with retail deposits and borrowings Industry-leading operating efficiency ratio of 18.84 (4Q 2009) Effective customer service and attractive pricing HCBK |

| financial strength |

| financial strength |

| Borrowing Philosophy Borrow using reverse repurchase agreement and FHLB advances Existing borrowings primarily have 10-year final maturities with quarterly call options to attempt to partially hedge duration of our long-term mortgage loans Modifying current portfolio during this low rate environment to extend maturity and repurchase options by using one-time calls to mitigate the bunching of calls Intend to use only fixed-maturity borrowings as necessary Funding needs have been met with deposit growth in 2009 financial strength |

| Securities Investments Liquidity position enhanced by $26.4 billion of securities with total unrealized profit of $592 million as of December 31, 2009 Invest only in government or government-sponsored enterprise mortgage-backed and fixed-income securities No other than temporary impairment charges taken on the portfolio $8.60 billion of these securities are available to be sold or could be used as collateral for borrowings Invest primarily in variable-rate mortgage-backed securities and short-term investment securities with an overall weighted-average duration of 1.71 years Used to offset duration of longer-term mortgage loans financial strength |

| Investment Portfolio Composition / Strategy financial strength As of December 31, 2009 As of December 31, 2009 As of December 31, 2009 As of December 31, 2009 Amortized Cost Fair Value Gain (Loss) Rate Available for Sale Available for Sale Available for Sale Available for Sale Available for Sale MBS MBS MBS MBS $10,752,424 $11,116,531 $364,107 4.97% Agency Bonds/Equity Agency Bonds/Equity Agency Bonds/Equity Agency Bonds/Equity 1,111,469 1,095,240 (16,229) 4.59% Total Total 11,863,893 12,211,771 347,878 4.93% Held to Maturity Held to Maturity Held to Maturity Held to Maturity Held to Maturity MBS MBS MBS MBS 9,963,554 10,324,831 361,277 5.20% Agency Bonds/Equity Agency Bonds/Equity Agency Bonds/Equity Agency Bonds/Equity 4,187,704 4,071,005 (116,699) 4.32% Total Total 14,151,258 14,395,836 244,578 4.94% Total Securities Total Securities Total Securities Total Securities Total Securities MBS MBS MBS MBS 20,715,978 21,441,362 725,384 5.08% Agency Bonds/Equity Agency Bonds/Equity Agency Bonds/Equity Agency Bonds/Equity 5,299,173 5,166,245 (132,928) 4.38% Total Total 26,015,151 26,607,607 592,456 4.94% (in thousands) |

| Mortgage Loans Growth in portfolio primarily through originations and purchases of 1-4 family first mortgages Originated $6.06 billion and purchased $3.16 billion during 2009 Require a minimum of 20% down payment on all mortgages Historically the average down payment on the portfolio at time of origination was 40% and remains so through the 4Q 2009 financial strength as of December 31, 2009 |

| What We Haven't Done... Subprime Mortgage Option ARM Loans Brokered CDs Participate in TARP (Troubled Asset Relief Program) financial strength |

| financial strength |

| Loan Geographic Exposure financial strength as of December 31, 2009 Total NY metro area equals 74% |

| December 31, 2009 December 31, 2009 December 31, 2009 December 31, 2009 Loan Balance # of Accounts % of Total Loans % of Total Assets Non-Performing Loans: Non-Performing Loans: 1-4 Family First Mortgages 1-4 Family First Mortgages 613,640,809 1,595 1.93% Other Loans Other Loans 14,054,698 41 0.05% Total Non-Performing Loans Total Non-Performing Loans 627,695,507 1,636 1.98% 1.07% Total Loans: 1-4 Family First Mortgages 31,361,832,277 31,361,832,277 75,515 98.68% Other Loans 418,089,043 418,089,043 10,918 1.32% Total Loans 31,779,921,320 31,779,921,320 86,433 100.00% 52.7% financial strength |

| financial strength Home Price Index for Major U.S. Markets 1-Year Change New York Metro (includes North Jersey) New York Metro (includes North Jersey) -7.1% Las Vegas -24.5% Phoenix -14.2% Tampa -13.2% Detroit -13.0% Miami -13.1% November 2008-2009 Source: Standard & Poor's - S&P/Case-Shiller Home Price Index |

| hudsoncitysavingsbank.com F I N A N C I A L S T R E N G T H Deposits 12 new branches since January 2008 $9.42 billion added since January 2008 Internet deposits of $224 million since December 2008 $188 million average deposits per branch |

| financial strength |

| Attractive Branch Network Our branches have an average of $188 million in deposits per branch We have approximately 726,000 customer deposit accounts, for an average of $33,900 per account 131 total branches, 95 in New Jersey, 27 in New York and 9 in Connecticut 5 proposed branches in various stages of development We have branches located in 10 of the Top 50 Counties in the U.S. in terms of Median Household Income |

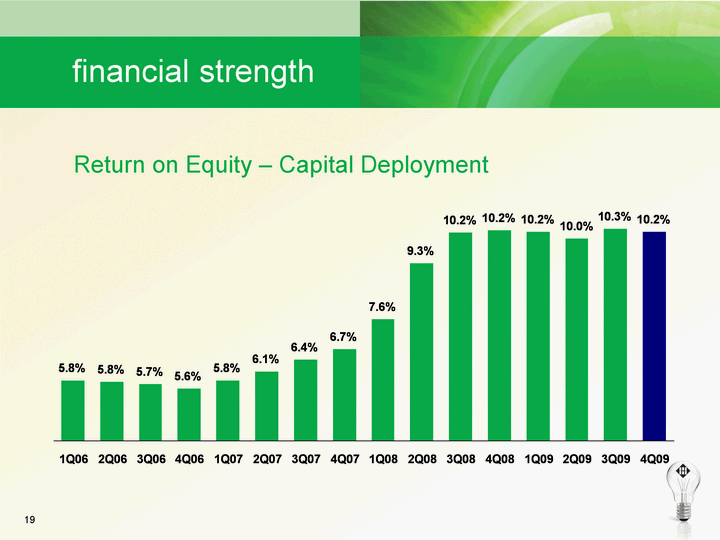
| Return on Equity - Capital Deployment financial strength |

| *Source: SNL Financial Industry-Leading Operational Efficiency Hudson City ranked #1 in efficiency ratio among the 50 largest banks and thrifts by assets at December 31, 2009* Efficiency Ratio at December 31 financial strength |

| Expense Discipline For the fourth quarter of 2009 Hudson City's efficiency ratio was 18.84%, the annualized ratio of non-interest expense to average assets was 0.42% Hudson City is an industry leader for both of these ratios Efficient operations means we need to pay only $0.19 to generate $1.00 of earnings This type of efficiency allows us to pay competitive rates on both deposits and loans financial strength |

| Efficiency + Conservative Credit Underwriting Competitive Pricing + Profit Winning Formula = financial strength |

| Shelf Registration Hudson City filed an automatic shelf registration statement with the SEC in December 2009 Will provide Hudson City with access to the capital markets in an expedited manner No specific time table for offering Creates flexibility to quickly respond to strategic opportunities and regulatory guidance Could use the future capital for organic growth and acquisition financial strength |

| F I N A N C I A L S T R E N G T H |

| results |

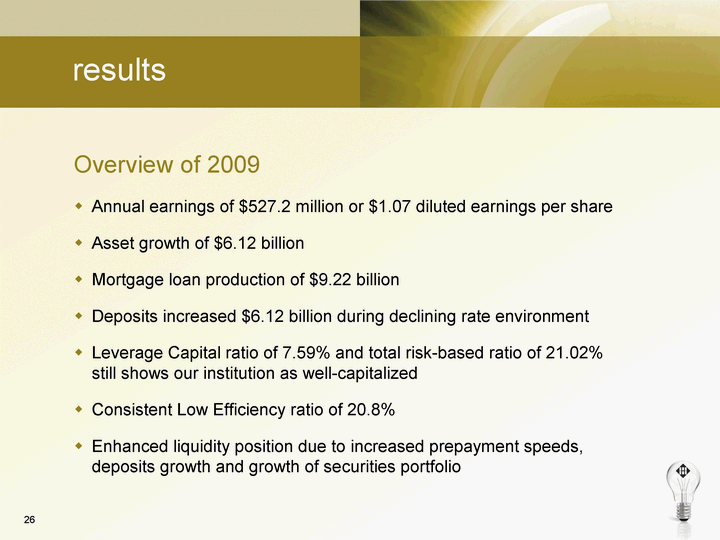
| Overview of 2009 Annual earnings of $527.2 million or $1.07 diluted earnings per share Asset growth of $6.12 billion Mortgage loan production of $9.22 billion Deposits increased $6.12 billion during declining rate environment Leverage Capital ratio of 7.59% and total risk-based ratio of 21.02% still shows our institution as well-capitalized Consistent Low Efficiency ratio of 20.8% Enhanced liquidity position due to increased prepayment speeds, deposits growth and growth of securities portfolio results |

| Annual Comparison results 2009 2008 Net Change Interest income $2,941,786 $2,653,225 $288,561 Interest expense 1,698,308 1,711,248 (12,940) Net interest income 1,243,478 941,977 301,501 Non-interest income 33,584 8,485 25,099 Non-interest expense 265,596 198,076 67,520 Provision 137,500 19,500 118,000 Income before taxes 873,966 732,886 141,080 Tax expense 346,722 287,328 59,394 Net income $527,244 $445,558 $81,686 Interest rate spread 1.92% 1.57% 0.35% Net interest margin 2.21% 1.96% 0.25% Efficiency ratio 20.80% 20.84% (0.04)% ($ in thousands) |

| Annual Comparison as of December 31 results 2009 2008 Net Change Net income $ 527,244 $ 445,558 + 81,686 After: Provision for Loan Losses $137,500 $19,500 +118,000 FDIC Assessment 35,094 4,320 +30,774 FDIC Special Assessment 21,098 0 +21,098 Tax expense $346,722 $287,328 +59,394 $540,414 $311,148 +229,266 Interest rate spread 1.92% 1.57% 0.35% Net interest margin 2.21% 1.96% 0.25% Efficiency ratio 20.80% 20.84% (0.04)% ($ in thousands) |

| Allowance and Provision Process Have followed a systematic disciplined methodology in determining the Allowance for Loan Losses Perform re-appraisals on loans by the time they are 180 days past due, charging-off loans when required Consider the housing market and economic factors before making provision determination This process led us to a $45.0 million provision and $19.8 million in charge-offs for 4Q09 results |

| Provision for Loan Losses and Net Charge-offs results (in thousands) |

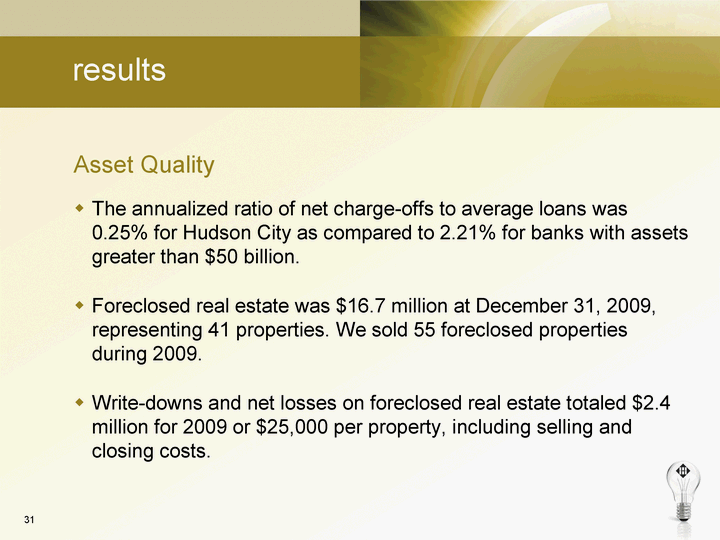
| Asset Quality The annualized ratio of net charge-offs to average loans was 0.25% for Hudson City as compared to 2.21% for banks with assets greater than $50 billion. Foreclosed real estate was $16.7 million at December 31, 2009, representing 41 properties. We sold 55 foreclosed properties during 2009. Write-downs and net losses on foreclosed real estate totaled $2.4 million for 2009 or $25,000 per property, including selling and closing costs. results |

| Earnings Per Share results |

| Dividends Dividend of $0.15 in 4Q2009 versus $0.14 in 4Q2008 We paid a dividend every quarter since going public (42 quarters), increasing it 31 times and never decreasing the dividend 2-for-1 stock split / dividend paid in 2002 3.2-for-1stock split / dividend paid in 2005 (2nd Step) results |

| Dividends results |

