Attached files
Table of Contents
UNITED STATES
SECURITIES AND EXCHANGE COMMISSION
WASHINGTON, D.C. 20549
FORM 10-K
| x | ANNUAL REPORT PURSUANT TO SECTION 13 OR 15(d) OF THE SECURITIES EXCHANGE ACT OF 1934 |
For the fiscal year ended December 27, 2009
OR
| ¨ | TRANSITION REPORT PURSUANT TO SECTION 13 OR 15(d) OF THE SECURITIES EXCHANGE ACT OF 1934 |
For the transition period from to
Commission File Number 001-15181
Fairchild Semiconductor International, Inc.
(Exact name of Registrant as specified in its charter)
| Delaware | 04-3363001 | |
| (State or other jurisdiction of incorporation or organization) |
(I.R.S. Employer Identification No.) | |
| 82 Running Hill Road, South Portland, ME | 04106 | |
| (Address of principal executive offices) | (Zip Code) | |
Registrant’s telephone number, including area code: (207) 775-8100
Securities registered pursuant to Section 12(b) of the Act:
Common Stock, par value $.01 per share
(Title of each class)
New York Stock Exchange
(Name of each exchange on which registered)
Securities registered pursuant to Section 12(g) of the Act: None
Indicate by check mark if the registrant is a well-known seasoned issuer, as defined in Rule 405 of the Securities Act. Yes x No ¨
Indicate by check mark if the registrant is not required to file reports pursuant to Section 13 or 15(d) of the Act. Yes ¨ No x
Indicate by check mark whether the registrant (1) has filed all reports required to be filed by Section 13 or 15(d) of the Securities Exchange Act of 1934 during the preceding 12 months (or for such shorter period that the registrant was required to file such reports), and (2) has been subject to such filing requirements for the past 90 days. Yes x No ¨
Indicate by check mark whether the registrant has submitted electronically and posted on its corporate Web site, if any, every Interactive Data File required to be submitted and posted pursuant to Rule 405 of Regulation S-T (§232.405 of this chapter) during the preceding 12 months (or for such shorter period that the registrant was required to submit and post such files). Yes ¨ No ¨
Indicate by check mark if disclosure of delinquent filers pursuant to Item 405 of Regulation S-K is not contained herein, and will not be contained, to the best of registrant’s knowledge in definitive proxy or information statements incorporated by reference in Part III of this Form 10-K or any amendment to this Form 10-K. x
Indicate by check mark whether the registrant is a large accelerated filer, an accelerated filer, a non-accelerated filer, or a smaller reporting company (as defined in Rule 12b-2 of the Exchange Act).
| Large accelerated filer x | Accelerated filer ¨ | Non-accelerated filer ¨ | Smaller reporting company ¨ |
Indicate by check mark whether the registrant is a shell company (as defined in Rule 12b-2 of the Exchange Act). Yes ¨ No x
The aggregate market value of the voting stock held by non-affiliates of the registrant as of June 28, 2009 was $894,510,978.
The number of shares outstanding of the Registrant’s Common Stock as of February 24, 2010 was 124,314,106.
DOCUMENTS INCORPORATED BY REFERENCE
Portions of the definitive Proxy Statement for the Annual Meeting of Stockholders to be held on May 5, 2010 are incorporated by reference into Part III.
Table of Contents
2
Table of Contents
PART I
| ITEM 1. | BUSINESS |
Except as otherwise indicated in this Annual Report on Form 10-K, the terms “we,” “our,” the “company,” “Fairchild” and “Fairchild International” refer to Fairchild Semiconductor International, Inc. and its consolidated subsidiaries, including Fairchild Semiconductor Corporation, our principal operating subsidiary. We refer to individual subsidiaries where appropriate.
The company’s fiscal year ends on the last Sunday in December. The company’s results for the years ended December 27, 2009, December 28, 2008 and December 30, 2007 each consist of 52 weeks.
General
We are focused on developing, manufacturing and selling power analog, power discrete and certain non-power semiconductor solutions to a wide range of end market customers. In 2009, 73% of our sales were from power discrete and power analog semiconductor products used directly in applications such as power conversion, regulation, distribution and management. We are a leading supplier of power analog products, power discrete products and energy-efficient solutions, according to iSuppli. Our products are used in a wide variety of electronic applications, including sophisticated computers and internet hardware; communications; networking and storage equipment; industrial power supply and instrumentation equipment; consumer electronics such as digital cameras, displays, audio/video devices and household appliances; and automotive applications. We believe that our focus on the power market, our diverse end market exposure, and our strong penetration into the growing Asian region provide us with excellent opportunities to expand our business.
With a history dating back approximately 50 years, the original Fairchild was one of the founders of the semiconductor industry. Established in 1959 as a provider of memory and logic semiconductors, the Fairchild Semiconductor business was acquired by Schlumberger Limited in 1979 and by National Semiconductor Corporation in 1987. In March 1997, as part of its recapitalization, much of the Fairchild Semiconductor business was sold to a new, independent company—Fairchild Semiconductor Corporation.
Products and Technology
Our products are used in consumer, communications, computer, industrial and automotive applications and are organized into the following three principal product groups that are reportable segments: (1) Mobile, Computing, Consumer and Communication (MCCC), (2) Power Conversion, Industrial and Automotive (PCIA) and (3) Standard Discrete and Standard Linear (SDT).
We continually invest in the latest wafer fabrication power semiconductor technology and successfully qualified a number of new processes including PowerTrench® 6, PowerTrench® 7, advanced insulated gate bipolar transistor (IGBT), as well as advanced high power metal oxide semiconductor field effect transistors (MOSFET) fabrication technologies. Our new South Portland, Maine 8-inch wafer fabrication line is focused on process technologies specifically tailored to the high performance analog market. The process flows are modular in nature and thus provide a wide range of capabilities including low voltage control and power switching. Additional passive devices and programmable elements may be combined with these active devices to create innovative, highly integrated analog solutions.
Mobile, Computing, Consumer and Communication (MCCC)
We design, manufacture and market high-performance analog and mixed signal integrated circuits for computing, consumer and communication applications. These products are manufactured using leading-edge bipolar (Bi), complementary metal oxide semiconductors (CMOS), BiCMOS and bipolar/cmos/dmos (BCDMOS) technologies. Analog and mixed signal products represent a potential long-term opportunity for us.
3
Table of Contents
We offer analog and mixed signal devices in a number of proprietary part types. The development of proprietary parts is largely driven by evolving end-system requirements and needs for higher integration, which in turn are driven by trends toward smaller components having higher performance levels. Major competitors include Analog Devices, Linear Technology, Maxim, Intersil Corporation, National Semiconductor, ST Microelectronics, Micrel, ON Semiconductor and Texas Instruments.
Analog products monitor, interpret and control continuously variable functions such as light, color, sound and energy. Frequently, they form the interface with the digital world. We provide a wide range of analog products that perform such tasks as interface, voltage regulation, and system management. Analog voltage regulator circuits are used to provide constant voltages as well as to step up or step down voltage levels on a circuit board. These products are used in a variety of computing, communications and consumer applications.
In addition to the power analog and interface products we also offer signal path products. These include analog and digital switches, video encoders and decoders, video filters and high performance amplifiers. The analog switch functions are typically found in cellular handsets and other ultra portable applications. The video products provide a single chip solution to video filtering and amplification. Video filtering applications include set top boxes and digital television.
We believe our analog and mixed signal product portfolio is further enhanced by a broad offering of packaging solutions that we have developed. These solutions include surface mount, tiny packages, chip scale packages and leadless carriers.
We also design, manufacture and market power semiconductor solutions for computing, communications, mobile, consumer and industrial applications. Power semiconductor solutions include power discrete components (power MOSFETs), analog integrated circuits and fully integrated multi-chip and monolithic power solutions.
Power MOSFETs are used in applications to switch, shape or transfer electricity under varying power requirements. We are a market leader of Power MOSFETs. These products are used in a variety of high-growth applications including computers, communications, consumer and industrial supplies, across the voltage spectrum. We produce advanced low power MOSFETs under our PowerTrench® brands. MOSFETs enable computers, handsets, power supplies and other products to operate under harsh conditions while providing efficient operation.
Fully integrated multi-chip and monolithic power solutions are devices that integrate analog and power discrete functions into a single module, offering further improvements in power consumption and critical space savings.
In 2007, we introduced to the market PowerTrench® 5 MOSFET silicon technology. In 2008, we introduced our latest PowerTrench® 6 and PowerTrench® 7 MOSFET silicon technologies. These technologies provide cost effective leading-edge efficiency improvements in power conversion applications, and are used today in the latest generation computing and communications systems by our customers.
Logic Products. We design, develop, manufacture and market high-performance standard logic devices utilizing three wafer fabrication processes: CMOS, BiCMOS and bipolar. Within each of these production processes, we manufacture products that possess advanced performance characteristics, as well as mature products that provide high performance at low cost to customers.
Logic products perform a variety of functions in a system, mostly in the interface between larger application-specific integrated circuits, microprocessors, memory components or connectors. Products are typically categorized into mature segments and advanced logic segments. Mature products are generally more than five years old, while advanced products tend to be newer. Since market adoption rates of new standard logic families have historically spanned several years, we continue to generate significant revenues from our mature
4
Table of Contents
products. Customers are typically slow to move from an older product to a newer one. Further, for any given product, standard logic customers use several different generations of logic products in their designs. As a result, typical life cycles for logic families are often between 20 and 25 years. Major competitors include Texas Instruments, Toshiba and NXP.
Power Conversion, Industrial and Automotive (PCIA)
We design, manufacture and market power discrete semiconductors, analog and mixed signal integrated circuits for power conversion, industrial and automotive applications. Discrete devices are individual diodes or transistors that perform power switching, power conditioning and signal amplification functions in electronic circuits. More than 85% of Fairchild’s discrete products are power discrete, which handle greater than one watt of power and are used extensively in power applications. Driving the long-term growth of discrete products is the increasing need to power the latest electronic equipment as well as the need to conserve energy. Fairchild has an expanded series of SPM™ products. This key product is a multi-chip module containing up to 23 die in a single package, including diodes, power MOSFETs, and power controllers used in high power, high voltage consumer white goods and industrial applications. We manufacture discrete products using DMOS and Bipolar technologies. Major competitors include Power Integrations, STMicroelectronics, International Rectifier, NXP, Infineon, ON Semiconductor, and Vishay.
Power MOSFETs. Power MOSFETs are used in applications to switch, shape or transfer electricity under varying power requirements. These products are used in a variety of high-growth applications including computers, communications, automotive and industrial supplies, across the voltage spectrum. We produce advanced low power MOSFETs under our SupreMOS, SuperFET, PowerTrench®, and QFET™ brands. MOSFETs enable computers, automobiles, handsets, power supplies and other products to operate under harsh conditions while providing efficient operation.
Insulated Gate Bipolar Transistors. IGBTs are high-voltage power discrete devices. They are used in switching applications for motor control, power supplies and automotive ignition systems, which require lower switching frequencies or higher voltages than a power MOSFET can provide. We are a leading supplier of IGBTs. We feature the switch mode power supply (SMPS) IGBT for power supplies, offering fast, cost-effective operation. We also manufacture modules for home appliances such as air conditioners and refrigerators; applications that are growing with the worldwide need to conserve energy.
Smart Power Modules (SPM). We design and develop a line of proprietary power modules or SPMs targeted to a wide range of end applications including home appliances, room air conditioners, TVs, power supplies and industrial motors. These innovative products provide customers with a fully integrated power management solution designed to increase power efficiency and product functionality.
Rectifiers. Rectifier products work with IGBTs and MOSFETs in many applications to provide signal conditioning. Our premier product is the Stealth™ rectifier, providing industry leading performance and efficiencies in power supply and motor applications.
Functional Power Switches. FPS™ power switch products, including Green FPS™, are a series of proprietary, multi-chip or monolithic devices with integrated MOSFETs, which provide complete off-line (AC-DC) power converter designs for use in power supplies and battery chargers. Green FPS™ products are referred to as “green” because of their environmentally friendly low power consumption. Analog voltage regulator circuits are used to provide constant voltages as well as to step up or step down voltage levels on a circuit board. These products are used in a variety of computing, communications, industrial and consumer applications.
Optoelectronic Products. Optoelectronics covers a wide range of semiconductor devices that emit and sense both visible and infrared light. We participate in the optocouplers and infrared device segments of the
5
Table of Contents
optoelectronics market. Our focus in optoelectronics is aligned with our power management business, as these products are used extensively in power supply and AC to DC power conversion applications. A major competitor for this business is Lite-On.
Optocouplers—Optocouplers incorporate infrared emitter and detector combinations in a single package. These products are used to transmit signals between two electronic circuits while maintaining electrical isolation between them. Major applications for these devices include power supplies, solar inverters, motor controls and power modules & industrial control system.
Infrared Products—These devices emit and detect infrared energy instead of visible energy. This product line offers a wide variety of products including plastic emitters and detectors, metal can emitters and detectors, slotted switches and reflective switches. In addition, custom products address specific types of customer applications. Typical applications for infrared products include object detection (for example, objects on a conveyor belt and hook switch on a phone), media sensing (in printers and copiers), motor control and light control for mobile applications.
Standard Linear and Standard Discrete (SDT)
SDT combines the management of mature and multiple market products and is comprised of the two product groups discussed below.
Standard Diode & Transistor Products (SDT). These devices cover a wide range of semiconductor products including: MOSFET, junction field effect transistor (JFET), high power bipolar, discrete small signal transistors, TVS, Zeners, rectifiers, Schottky and diodes. Our parts can be found in almost every circuit with our portfolio focus geared towards meeting the needs of power switching, power conditioning, protection, and signal amplification functions in electronic circuits of computing, industrial, and consumer markets. Major competitors include International Rectifier, Diodes Incorporated, NXP, ST Microelectronics, ON Semiconductor and Vishay.
Standard Linear Products. We design, manufacture and market analog integrated circuits for computing, consumer, communications, ultra-portable and industrial applications. These products are manufactured using leading-edge bipolar, CMOS and BiCMOS technologies.
Standard Linear solutions can range from bipolar regulators, shunt regulators, low drop out regulators, standard op-amp/comparators, low voltage op-amp, audio amplifiers and others. Analog voltage regulator circuits are used to provide constant voltages as well as to step up or step down voltage levels on a circuit board. Op-amps/comparators are designed specifically to operate from a single power supply over a wide range of voltages. We also offer low-voltage op-amp that provide a combination of low power, rail-to-rail performance, low voltage operation, and tiny package options which is well suited for use in personal electronics equipment. Audio amp products provide good audio performance in tiny packages which are optimized for notebook and portable applications such as PDAs and cell phones.
There is continued growth for analog solutions as digital solutions require a bridge between real world signals and digital signals. Our product portfolio is further enhanced by a broad offering of packaging solutions that we have developed. These solutions include surface mount, tiny packages and leadless carriers. Major competitors include National Semiconductor, ST Microelectronics, ON Semiconductor and Texas Instruments.
Sales, Marketing and Distribution
For the year ended December 27, 2009, we derived approximately 64%, 29% and 7% of our net sales from distributors, original equipment manufacturers (OEMs), and electronic design and manufacturing services (EMS) customers, respectively, through our regional sales organizations. We operate regional sales organizations in Europe, with principal offices in Fuerstenfeldbruck, Germany; the Americas, with principal offices in Dallas,
6
Table of Contents
Texas; the Asia/Pacific region (which for these purposes excludes Japan and South Korea), with principal offices in Singapore; Japan, with principal offices in Tokyo; and South Korea, with principal offices in Seoul. A discussion of revenue by geographic region for each of the last three years can be found in Item 8, Note 16 of this report. Each of the regional sales organizations is supported by logistics organizations, which manage independently operated warehouses. Product orders flow to our manufacturing facilities, where products are made. Products are then shipped either directly to customers or indirectly to customers through warehouses that are owned and operated by us or by a third party provider.
We have dedicated direct sales organizations operating in Europe, the Americas, the Asia/Pacific region, Japan and Korea that serve our major original equipment manufacturer and electronic design and manufacturing services customers. We also have a large network of distributors and independent manufacturer’s representatives to distribute and sell our products around the world. We believe that maintaining a small, highly focused, direct sales force selling products for all of our businesses, combined with an extensive network of distributors and manufacturer’s representatives, is the most efficient way to serve our multi-market customer base. Our dedicated marketing organization consists of a central marketing group that coordinates marketing, advertising, and media activities for all products within the company. Additionally, product line marketing specifically focuses on tactical and strategic marketing for their product and application focus, and marketing personnel located in each of the sales regions provides regional direction and support for products and end applications as applicable for their region.
Typically, distributors handle a wide variety of products and fill orders for many customers. Some of our sales to distributors are made under agreements allowing for market price fluctuations and the right of return on unsold merchandise, subject to time and volume limitations. Many of these distribution agreements contain a standard stock rotation provision allowing for minimum levels of inventory returns. In our experience, these inventory returns can usually be resold, although often at a discount. Manufacturer’s representatives generally do not offer products that compete directly with our products, but may carry complementary items manufactured by others. Manufacturer’s representatives, who are compensated on a commission basis, do not maintain a product inventory; instead, their customers place larger quantity orders directly with us and are referred to distributors for smaller orders.
Research and Development
Our expenditures for research and development for 2009, 2008 and 2007 were $99.7 million, $112.9 million and $109.8 million, respectively. These expenditures represented 8.4%, 7.2% and 6.6% of sales for 2009, 2008 and 2007, respectively. Advanced silicon processing technology is a key determinant in the improvement of semiconductor products. Each new generation of process technology has resulted in products with higher speed, higher power density and greater performance, produced at lower cost. We expect infrastructure investments made in recent years to enable us to continue to achieve high volume, high reliability and low-cost production using leading edge process technology for our classes of products. Our R&D efforts continue to be focused in part on new and innovative packaging solutions that make use of new assembly methods and new high performance packaging materials, as well as in exclusive and patent protected transistor structure development. We are also using our R&D resources to characterize and apply new materials in both our packaging and semiconductor device processing efforts.
Each of our product groups maintains independent product, process and package research and development organizations, which work closely with our manufacturing groups to bring new technologies to market. These groups are located throughout the world in our factories and research centers. We work closely with our major customers in many research and development situations in order to increase the likelihood that our products will be designed directly into customers’ products and achieve rapid and lasting market acceptance.
7
Table of Contents
Manufacturing
We operate seven manufacturing facilities, four of which are “front-end” wafer fabrication plants in the United States (U.S.) and South Korea, and three of which are “back-end” assembly and test facilities in Asia. Information about our property, plant and equipment by geographic region for each of the last three years can be found in Item 8, Note 16 of this report.
Our products are manufactured and designed using a broad range of manufacturing processes and certain proprietary design methods. We use all of the prevalent function-oriented process technologies for wafer fabrication, including CMOS, Bipolar, BiCMOS, DMOS and RF. We use primarily mature through-hole and advanced surface mount technologies in our assembly and test operations. In 2003, we announced our lead-free packaging initiative, replacing lead with tin which is considered to be environmentally friendly. Since January 1, 2006 all standard product IDs are sold with lead-free plating except for some specific automotive devices in Dpak & TO263 exclusively for one automotive customer.
The table below provides information about our manufacturing facilities and products.
Manufacturing Facilities
| Location |
Products | |
| Front-End Facilities: |
||
| Mountaintop, Pennsylvania |
Discrete Power Semiconductors | |
| South Portland, Maine |
Analog Switches, USB, Interface SerDes, Converters, Logic Gates, Buffers, Counters, Opto Detectors, Ground Fault Interrupters | |
| West Jordan, Utah |
Discrete Power Semiconductors | |
| Bucheon, South Korea |
Discrete Power Semiconductors, Standard Analog Integrated Circuits | |
| Back-End Facilities: |
||
| Penang, Malaysia |
Power Management ICs (AC-DC, Isolated DC-DC, Non-isolated DC-DC, Power Drivers, Supervisory/ Monitor ICs, Voltage Regulators, Pulse width Modulation, Rectifiers) Power Semiconductors (Integrated Power Solutions, MOSFETs, Transistors) Automotive Products (Automotive ICs and Drivers, Discrete Power Semiconductors) Signal Path Products ( Logic, Switching and interface solution, Video filter, Class -G audio amplifier) | |
| Cebu, Philippines |
Power Management ICs (Isolated DC-DC) Power Semiconductors (Diodes & Rectifiers, IGBTs, Integrated Power Solutions, MOSFETs, Transistors) Logic Products Automotive products (Discrete Power) | |
| Suzhou, China |
Power Semiconductors (Diodes & Rectifiers, IGBTs, Integrated Power Solutions (SPM), MOSFETs, Transistors) Power Management ICs (AC-DC: PWM (Combo) Controllers) Automotive Products (Automotive Modules, Discrete Power Semiconductors, Intelligent Power Semiconductors) | |
8
Table of Contents
Our Mountaintop, Pennsylvania location is scheduled for closure in June 2011. Most of the products currently manufactured in Pennsylvania will be transferred to other internal sites.
We subcontract a minority portion of our wafer fabrication needs, primarily to Taiwan Semiconductor Manufacturing Company, Advanced Semiconductor Manufacturing Corporation, Central Semiconductor Manufacturing Corporation, Jilin Magic Semiconductor, Macronix International Co. Ltd., and Phenitec Semiconductor. In order to maximize our production capacity, some of our back-end assembly and testing operations are also subcontracted. Primary back-end subcontractors include Amkor, ASE, AUK, GEM Services, Hana Semiconductor, Liteon, Tak Cheong Electronics, Greatek, Etrend, AIC and UTAC Thai Ltd.
Our manufacturing processes use many raw materials, including silicon wafers, gold, copper and aluminum wire, Alloy 42/Cu lead frames, mold compound, ceramic and other substrate material and some chemicals and gases. We obtain our raw materials and supplies from a large number of sources on a just-in-time basis. Although supplies for the raw materials used by us are currently adequate, shortages could occur in various essential materials due to interruption of supply or increased demand in the industry.
Backlog
Backlog at December 27, 2009 was approximately $586 million, up from approximately $289 million at December 28, 2008. We define backlog as firm orders or customer-provided forecasts with a customer requested delivery date within 26 weeks. In periods of depressed demand, customers tend to rely on shorter lead times available from suppliers, including us. In periods of increased demand, there is a tendency towards longer lead times that has the effect of increasing backlog and, in some instances; we may not have manufacturing capacity sufficient to fulfill all orders. We are currently in a period of increased demand. Additionally, backlog is impacted by our manufacturing lead times, which have increased by approximately nine weeks on average from December 28, 2008 to December 27, 2009. As is customary in the semiconductor industry, we allow orders to be canceled or deliveries delayed by customers within agreed upon parameters. Accordingly, our backlog at any time should not be used as an indication of future revenues.
Seasonality
Overall, our sales are closely linked to semiconductor and related electronics industry supply chain and channel inventory trends.
Competition
Markets for our products are highly competitive. Although only a few companies compete with us in all of our product lines, we face significant competition within each of our product lines from major international semiconductor companies. Some of our competitors may have substantially greater financial and other resources with which to pursue engineering, manufacturing, marketing and distribution of their products. Competitors include manufacturers of standard semiconductors, application-specific integrated circuits and fully customized integrated circuits.
We compete in different product lines to various degrees on the basis of price, technical performance, product features, product system compatibility, customized design, availability, quality and sales and technical support. Our ability to compete successfully depends on elements both within and outside of our control, including successful and timely development of new products and manufacturing processes, product performance and quality, manufacturing yields and product availability, capacity availability, customer service, pricing, industry trends and general economic trends.
9
Table of Contents
Trademarks and Patents
As of December 27, 2009 we held 990 issued U.S. patents and 1,216 issued non-U.S. patents with expiration dates ranging from 2010 through 2028. We also have trademarks that are used in the conduct of our business to distinguish genuine Fairchild products. We believe that while our patents may provide some advantage, our competitive position is largely determined by such factors as system and application knowledge, ability and experience of our personnel, the range and number of new products being developed by us, our market brand recognition, ongoing sales and marketing efforts, customer service, technical support and our manufacturing capabilities.
It is generally our policy to seek patent protection for significant inventions that may be patented, though we may elect, in certain cases, not to seek patent protection even for significant inventions, if other protection, such as maintaining the invention as a trade secret, is considered more advantageous. Also, the laws of countries in which we design, manufacture and market our products may afford little or no effective protection of our proprietary technology.
Environmental Matters
Our operations are subject to environmental laws and regulations in the countries in which we operate that regulate, among other things, air and water emissions and discharges at or from our manufacturing facilities; the generation, storage, treatment, transportation and disposal of hazardous materials by our company; the investigation and remediation of environmental contamination; and the release of hazardous materials into the environment at or from properties operated by our company and at other sites. As with other companies engaged in like businesses, the nature of our operations exposes our company to the risk of liabilities and claims, regardless of fault, with respect to such matters, including personal injury claims and civil and criminal fines.
Our facilities in South Portland, Maine, and, to a lesser extent, West Jordan, Utah, have ongoing remediation projects to respond to releases of hazardous materials that occurred prior to our separation from National Semiconductor. National Semiconductor has agreed to indemnify Fairchild for the future costs of these projects and other environmental liabilities that existed at the time of our acquisition of those facilities from National Semiconductor in 1997. The terms of the indemnification are without time limit and without maximum amount. The costs incurred to respond to these conditions were not material to the consolidated financial statements for any period presented.
Our facility in Mountaintop, Pennsylvania has an ongoing remediation project to respond to releases of hazardous materials that occurred prior to our acquisition of that facility from Intersil Corporation in 2001. Intersil has agreed to indemnify us for specific environmental issues. The terms of the indemnification are without time limit and without maximum amount.
A property we previously owned in Mountain View, California is listed on the National Priorities List under the Comprehensive Environmental Response, Compensation, and Liability Act. We acquired that property as part of the acquisition of The Raytheon Company’s semiconductor business in 1997. Under the terms of the acquisition agreement, Raytheon retained responsibility for, and has agreed to indemnify us with respect to, remediation costs or other liabilities related to pre-acquisition contamination. We sold the Mountain View property in 1999. The purchaser received an environmental indemnity from us similar in scope to the one we received from Raytheon. The purchaser and subsequent owners of the property can hold us liable under our indemnity for any claims, liabilities or damages they may incur as a result of the historical contamination, including any remediation costs or other liabilities. We are unable to estimate the potential amounts of future payments; however, we do not expect any future payments to have a material impact on our earnings or financial condition.
Although we believe that our Bucheon, South Korea operations, which we acquired from Samsung Electronics in 1999, have no significant environmental liabilities, Samsung Electronics agreed to indemnify us for remediation costs and other liabilities related to historical contamination, up to $150 million, arising out of
10
Table of Contents
the business we acquired from Samsung Electronics, including the Bucheon facilities. We are unable to estimate the potential amounts of future payments, if any; however, we do not expect any future payments to have a material impact on our earnings or financial condition.
We believe that our operations are in substantial compliance with applicable environmental laws and regulations. Our costs to comply with environmental regulations were immaterial for 2009, 2008 and 2007. Future laws or regulations and changes in existing environmental laws or regulations, however, may subject our operations to different, additional or more stringent standards. While historically the cost of compliance with environmental laws has not had a material adverse effect on our results of operations, business or financial condition, we cannot predict with certainty our future costs of compliance because of changing standards and requirements.
Employees
Our worldwide workforce consisted of 8,563 full and part-time employees as of December 27, 2009. We believe that our relations with our employees are satisfactory.
At December 27, 2009, 114 of our employees were covered by a collective bargaining agreement. These employees are members of the Communication Workers of America/International Union of Electronic, Electrical, Salaried Machine and Furniture Workers, AFL-CIO, Local 88177. The current agreement with the union ends June 1, 2011 and provides for guaranteed wage and benefit levels as well as employment security for union members. If a work stoppage were to occur, it could impact our ability to operate. Also, our profitability could be adversely affected if increased costs associated with any future contracts are not recoverable through productivity improvements or price increases. We believe that relations with our unionized employees are satisfactory.
Our wholly owned Korean subsidiary, which we refer to as Fairchild Korea, sponsors a Korean Labor Council consisting of seven representatives from the non-management workforce and seven members of the management workforce. The Labor Council, under Korean law, is recognized as a representative of the workforce for the purposes of consultation and cooperation. The Labor Council has no right to take a work action or to strike and is not party to any labor or collective bargaining agreements with Fairchild Korea. We believe that relations with Fairchild Korea employees and the Labor Council are satisfactory.
Executive Officers
The following table provides information about the executive officers of our company. There is no family relationship among any of the named executive officers.
| Name |
Age | Title | ||
| Mark S. Thompson |
53 | Chairman of the Board of Directors, President and Chief Executive Officer | ||
| Mark S. Frey |
56 | Executive Vice President, Chief Financial Officer and Treasurer | ||
| Allan Lam |
50 | Executive Vice President, Worldwide Sales and Marketing | ||
| Robert J. Conrad |
50 | Executive Vice President and General Manager, Mobile, Computing, Communications and Consumer Products Group | ||
| Justin Chiang |
47 | Executive Vice President and General Manager, Power Conversion, Industrial and Automotive Products Group | ||
| Daniel A. Chandler |
53 | Senior Vice President, Quality Assurance and Operational Excellence | ||
| Robin Goodwin |
49 | Executive Vice President, Manufacturing and Supply Chain | ||
| Paul D. Delva |
47 | Senior Vice President, General Counsel and Corporate Secretary | ||
| Kevin B. London |
52 | Senior Vice President, Human Resources and Administration | ||
| Robin A. Sawyer |
42 | Vice President, Corporate Controller |
11
Table of Contents
Mark S. Thompson, Chairman of the Board of Directors, President and Chief Executive Officer (CEO). Mr. Thompson joined Fairchild Semiconductor in November 2004 as Executive Vice President, Manufacturing and Technology group. He became President and Chief Executive Officer in May 2005 and was elected Chairman of the Board in May 2008. He has over 24 years of high technology experience. Prior to joining the company, Mr. Thompson had been Chief Executive Officer of Big Bear Networks since August 2001. He was previously Vice President and General Manager of Tyco Electronics, Power Components Division and, prior to its acquisition by Tyco, was Vice President of Raychem Corporation’s Electronics OEM division. Mr. Thompson is a director of American Science and Engineering, Inc. and Cooper Industries, Ltd.
Mark S. Frey, Executive Vice President, Chief Financial Officer (CFO) and Treasurer. Mr. Frey joined Fairchild Semiconductor in March 2006. Prior to joining the company, Mr. Frey had been the Vice President, Finance and Corporate Controller for Lam Research Corporation since 1999. He was previously the Vice President of Finance for Raychem Corporation’s Electronics OEM division and he previously held financial positions with Activision and Memorex.
Allan Lam, Executive Vice President, Worldwide Sales and Marketing. Mr. Lam joined Fairchild Semiconductor in August 2005 as Senior Vice President and General Manager, Standard Products Group. He assumed his current position in July 2007. He was previously employed by Vishay Intertechnology and Temic Semiconductor since 1996, most recently as Vice President of Sales, Asia, and before that as Area Vice President of Sales, Asia-Pacific and Vice President, Standard Products Unit. He previously held management positions in quality, marketing, sales, and engineering with BBS Electronics, Cinergi Technology & Devices, SGS-Thomson Microelectronics and National Semiconductor.
Robert J. Conrad, Executive Vice President and General Manager, Mobile, Computing, Communications and Consumer Products Group. Mr. Conrad joined Fairchild Semiconductor in September 2003 as Senior Vice President and General Manager of the Analog Products Group. He became Executive Vice President in May 2006, and assumed his current position in December 2007. Mr. Conrad has over 26 years of semiconductor industry experience. His experience prior to joining Fairchild includes twelve years at Texas Instruments in a variety of engineering and business management roles, six years at Analog Devices where he was Vice President and General Manager of the DSP Division, and most recently as CEO and President of Trebia Networks, a private fabless semiconductor company, since April 2001.
Justin Chiang, Executive Vice President and General Manager, Power Conversion, Industrial and Automotive Products Group. Mr. Chiang joined Fairchild Semiconductor in May 2005 as Vice President of System Power in the Analog Products Group, and was promoted to Senior Vice President and General Manager, Power Conversion, Industrial and Automotive Product Group in December 2007 and to his current position in December 2008. He has over 17 years of experience in the electronic and semiconductor industry. Prior to joining the company, Mr. Chiang was the General Manager of Tyco Electronics, Power Components Division from 2003 to 2005. He was previously Director of Tyco Electronics, Silicon Products Group, Circuit Protection Division from 2000 to 2003 and prior to that he held a variety of technical and senior management positions with Raychem Corporation from 1994.
Daniel A. Chandler, Senior Vice President, Quality Assurance and Operational Excellence. Mr. Chandler joined Fairchild in February of 2006 and is responsible for Global Quality and Operational Excellence, and management of the Standard Linear and Standard Discrete Group. He has 24 years of experience working in electronics related industries. Before joining Fairchild, Mr. Chandler was Corporate Director of Engineering Excellence at Tyco Electronics. Prior to that, he was the Director of Marketing and Business Development for the Circuit Protection Division at Tyco. Mr. Chandler also held various positions at Raychem Corporation including Director of Product Development, Interconnect Division and later for the Circuit Protection Division.
Robin Goodwin, Executive Vice President, Manufacturing and Supply Chain. Mr. Goodwin joined Fairchild Semiconductor as part of its founding in 1997, as the Director of Finance. He transitioned to supply chain management in 2001 and assumed the leadership position in developing Fairchild’s first global planning
12
Table of Contents
organization. He became Senior Vice President, Supply Chain Management in November 2005, and was promoted to his current position in May 2008. He has 25 years in the high technology industry in a combination of financial and supply chain management roles. Mr. Goodwin’s experience spans across OEMs, EMS and component suppliers.
Paul D. Delva, Senior Vice President, General Counsel and Corporate Secretary. Mr. Delva joined Fairchild Semiconductor in 1999. He served as the company’s assistant general counsel following the company’s initial public offering in 1999. Mr. Delva was promoted to Vice President and General Counsel in April 2003 and became Corporate Secretary in May 2005. He became Senior Vice President in August 2005. He has advised Fairchild on all its acquisitions and securities offerings, as well as on general corporate matters since the company’s founding in 1997. Prior to joining Fairchild, he was an associate in the corporate department at Dechert, Price & Rhoads (now Dechert LLP).
Kevin B. London, Senior Vice President, Human Resources and Administration. Mr. London became Vice President of Human Resources in July 2002 and was promoted to Senior Vice President in August 2005. He has over 29 years experience in the semiconductor industry. Prior to becoming Vice President, he held various Human Resource management positions in the company.
Robin A. Sawyer, Vice President, Corporate Controller. Ms. Sawyer has served as the company’s Vice President and Corporate Controller since November 2002. She was previously Manager of Financial Planning and Analysis since joining the company in August 2000. Prior to joining the company, Ms. Sawyer was employed by Cornerstone Brands, Inc. from 1998 to 2000 as Director of Financial Planning and Reporting. Prior to that Ms. Sawyer was employed by Baker, Newman and Noyes, LLC and its predecessor firm, Ernst & Young, and is a Certified Public Accountant. Ms. Sawyer is a director of Camden National Corporation.
Available Information
We file annual, quarterly and special reports, proxy statements and other information with the Securities and Exchange Commission (SEC). You may read and copy any reports, statements and other information we file at the SEC’s Public Reference Room at 100F Fifth Street, N.E., Washington, D.C. 20549. Please call (800) SEC-0330 for further information on the Public Reference Room. The SEC maintains an Internet web site that contains reports, proxy and information statements and other information regarding issuers that file electronically with the SEC. Our filings are also available to the public at the web site maintained by the SEC, http://www.sec.gov.
The address for our company website is http://www.fairchildsemi.com. We make available, free of charge, through our investor relations web site, our reports on Forms 10-K, 10-Q and 8-K, amendments to those reports, and other SEC filings, as soon as reasonably practicable after they are filed with the SEC. The address for our investor relations web site is http://investor.fairchildsemi.com (click on “SEC filings”).
We also make available, free of charge, through our corporate governance website, our corporate charter, bylaws, Corporate Governance Guidelines, charters of the committees of our board of directors, code of business conduct and ethics and other information and materials, including information about how to contact our board of directors, its committees and their members. To find this information and materials, visit our corporate governance website at http://governance.fairchildsemi.com.
13
Table of Contents
| ITEM 1A. | RISK FACTORS |
A description of the risk factors associated with our business is set forth below. The risks described below are not the only ones facing us. Additional risks not currently known to us or that we currently believe are immaterial also may impair our business operations and financial condition.
The price of our common stock has fluctuated widely in the past and may fluctuate widely in the future.
Our common stock, which is traded on The New York Stock Exchange, has experienced and may continue to experience significant price and volume fluctuations that could adversely affect its market price without regard to our operating performance. In addition, we believe that factors such as quarterly fluctuations in financial results, earnings below analysts’ estimates and financial performance and other activities of other publicly traded companies in the semiconductor industry could cause the price of our common stock to fluctuate substantially. In addition, our common stock, the stock market in general and the market for shares of semiconductor industry-related stocks in particular have experienced extreme price fluctuations which have often been unrelated to the operating performance of the affected companies. Any similar fluctuations in the future could adversely affect the market price of our common stock.
We maintain a backlog of customer orders that is subject to cancellation, reduction or delay in delivery schedules, which may result in lower than expected revenues.
We manufacture products primarily pursuant to purchase orders for current delivery or to forecast, rather than pursuant to long-term supply contracts. The semiconductor industry is occasionally subject to double booking and rapid changes in customer outlooks or unexpected build ups of inventory in the supply channel as a result of shifts in end market demand and macro economic conditions. Accordingly, many of these purchase orders or forecasts may be revised or canceled without penalty. As a result, we must commit resources to the production of products without binding purchase commitments from customers. Even in cases where our standard terms and conditions of sale or other contractual arrangements do not permit a customer to cancel an order without penalty, we may from time to time accept cancellations to maintain customer relationships or because of industry practice, custom or other factors. Our inability to sell products after we devote significant resources to them could have a material adverse effect on both our levels of inventory and revenues. While we currently believe our inventory levels are appropriate for the current economic environment, continued global economic uncertainty may result in lower than expected demand. Lower demand may further impact our customers’ target inventory levels as they manage their business through this period. We continue to carefully manage our inventory and anticipate that demand may improve throughout 2010; however our current business forecasting is still hampered by poor forward visibility and the risk that our backlog may deteriorate as a result of customer cancellations.
Downturns in the highly cyclical semiconductor industry or changes in end user market demands could reduce the profitability and overall value of our business, which could cause the trading price of our stock to decline or have other adverse effects on our financial position.
The semiconductor industry is highly cyclical, and the value of our business may decline during the “down” portion of these cycles. As we have experienced in the past, uncertainty in global economic conditions may continue to negatively affect us and the rest of the semiconductor industry, by causing us to experience backlog cancellations and reduced demand for our products. We may experience renewed, possibly severe and prolonged, downturns in the future as a result of such cyclicality. Even as demand increases following such downturns, our profitability may not increase because of price competition that historically accompanies recoveries in demand. In addition, we may experience significant changes in our profitability as a result of variations in sales, changes in product mix, changes in end user markets and the costs associated with the introduction of new products, and our efforts to reduce excess inventories that may have built up as a result of any of these factors. The markets for our products depend on continued demand for consumer electronics such as personal computers, cellular
14
Table of Contents
telephones and digital cameras, and automotive, household and industrial goods. These end user markets may experience changes in demand, such as decreases we experienced as a result of deteriorating global economic conditions that could adversely affect our prospects.
Our failure to execute on our cost reduction initiatives and the impact of such initiatives could adversely affect our business.
We have recently taken aggressive cost reduction actions in order to stay ahead of the economic environment. These actions include plans to streamline and consolidate wafer manufacturing by closing our wafer manufacturing facility in Pennsylvania and closing our four-inch manufacturing line in South Korea. Additionally, we initiated an insourcing program to replace higher-cost outside subcontractors with internal manufacturing, we lowered our materials costs, implemented workforce reductions, and reduced employee benefits. We expect these actions will simplify operations, improve productivity and reduce costs.
We cannot guarantee that any of these actions will be successfully implemented, or will sufficiently help in reducing costs. Because our restructuring activities involve changes to many aspects of our business, the cost reductions could adversely impact productivity and sales to an extent we have not anticipated. Even if we fully execute and implement these activities and they generate the anticipated cost savings, there may be other unforeseeable and unintended factors or consequences that could adversely impact our profitability and business.
We may not be able to develop new products to satisfy changing customer demands or we may develop the wrong products.
Our failure to develop new technologies, or react to changes in existing technologies, could materially delay development of new products and lead to decreased revenues and a loss of market share to our competitors. The semiconductor industry is characterized by rapidly changing technologies and industry standards, together with frequent new product introductions. Our financial performance depends on our ability to identify important new technology advances and to design, develop, manufacture, assemble, test, market and support new products and enhancements on a timely and cost-effective basis. While new products often command higher prices and higher profit margins, we may not successfully identify new product opportunities and develop and bring new products to market or succeed in selling them for use in new customer applications in a timely and cost-effective manner. Products or technologies developed by other companies may render our products or technologies obsolete or noncompetitive. Many of our competitors are larger, older and more established companies with greater engineering and research and development resources than us. If we fail to identify a fundamental shift in technologies or in our product markets such failure could have material adverse effects on our competitive position within the industry. In addition, to remain competitive, we must continue our efforts to reduce die sizes, develop new packages and improve manufacturing yields. We cannot assure you that we can accomplish these goals.
If some original equipment manufacturers do not design our products into their equipment, our revenue may be adversely affected.
The success of our products often depends on whether OEMs, or their contract manufacturers, choose to incorporate or “design in” our products, or identify our products, with those from a limited number of other vendors, as approved for use in particular OEM applications. Without “design wins,” we may only be able to sell our products to customers as a second source, if at all. If an OEM designs another supplier’s product into one of its applications, it is more difficult for us to achieve future design wins for that application because changing suppliers involves significant cost, time, effort and risk for the customer. Even if a customer designs in our products, we are not guaranteed to receive future sales from that customer. We may be unable to achieve these “design wins” because of competition or a product’s functionality, size, electrical characteristics or other aspect of its design or price. Additionally, we may be unable to service expected demand from the customer. In addition, achieving a design win with a customer does not ensure that we will receive significant revenue from that customer and we may be unable to convert design into actual sales.
15
Table of Contents
We depend on demand from the consumer, original equipment manufacturer, contract manufacturing, industrial, automotive and other markets we serve for the end market applications which incorporate our products. Reduced consumer or corporate spending due to increased energy prices or other economic factors could affect our revenues.
If we provide revenue and gross margin guidance, it is based on our projections of consumer and corporate spending. If our projections of these expenditures are wrong, our revenues and gross margins could be adversely affected. For example, beginning in the third quarter and continuing into the fourth quarter of 2008, we observed progressively weakening order rates which we attributed to uncertainty and deterioration of global economic conditions. While order rates began to recover in the first half of 2009 and continued to improve in the second half of 2009, our current business forecasting remains hampered by poor forward visibility, as our OEM and distributor customers remain cautious in their booking activity.
Our failure to protect our intellectual property rights could adversely affect our future performance and growth.
Failure to protect our intellectual property rights may result in the loss of valuable technologies. We rely on patent, trade secret, trademark and copyright law to protect such technologies. These laws are subject to legislative and regulatory change or through changes in court interpretations of those laws and regulations. For example, there have been recent developments in the laws and regulations governing the issuance and assertion of patents in the U.S., including modifications to the rules governing patent prosecution. There have also been court rulings on the issues of willfulness, obviousness and injunctions, that may affect our ability to obtain patents and/or enforce our patents against others. Some of our technologies are not covered by any patent or patent application. With respect to our intellectual property generally, we cannot assure you that:
| • | the patents owned by us or numerous other patents which third parties license to us will not be invalidated, circumvented, challenged or licensed to other companies; or |
| • | any of our pending or future patent applications will be issued within the scope of the claims sought by us, if at all. |
In addition, effective patent, trademark, copyright and trade secret protection may be unavailable, limited or not applied for in some countries. We cannot assure that we will be able to effectively enforce our intellectual property rights in every country in which our products are sold or manufactured.
We also seek to protect our proprietary technologies, including technologies that may not be patented or patentable, in part by confidentiality agreements and, if applicable, inventors’ rights agreements with our collaborators, advisors, employees and consultants. We cannot assure you that these agreements will not be breached, that we will have adequate remedies for any breach or that such persons or institutions will not assert rights to intellectual property arising out of such research. We have non-exclusive licenses to some of our technology from National Semiconductor, Infineon, Samsung Electronics and other companies. These companies may license such technologies to others, including our competitors or may compete with us directly. In addition, National Semiconductor and Infineon have limited royalty-free, worldwide license rights to some of our technologies. If necessary or desirable, we may seek licenses under patents or intellectual property rights claimed by others. However, we cannot assure you that we will obtain such licenses or that the terms of any offered licenses will be acceptable to us. The failure to obtain a license from a third party for technologies we use could cause us to incur substantial liabilities and to suspend the manufacture or shipment of products or our use of processes requiring the technologies.
Our failure to obtain or maintain the right to use some technologies may negatively affect our financial results.
Our future success and competitive position depend in part upon our ability to obtain or maintain proprietary technologies used in our principal products. From time to time we are required to defend against claims by competitors and others of intellectual property infringement. Claims of intellectual property infringement and
16
Table of Contents
litigation regarding patent and other intellectual property rights are commonplace in the semiconductor industry. From time to time, we may be notified of claims that we may be infringing patents issued to other companies. Such claims may relate both to products and manufacturing processes. We may engage in license negotiations regarding these claims from time to time. Even though we maintain procedures to avoid infringing others’ rights as part of our product and process development efforts, it is impossible to be aware of every possible patent which our products may infringe, and we cannot assure you that we will be successful in our efforts to avoid infringement claims. Furthermore, even if we conclude our products do not infringe another’s patents, others may not agree. We have been and are involved in lawsuits, and could become subject to other lawsuits, in which it is alleged that we have infringed upon the patent or other intellectual property rights of other companies. For example, since October 2004, we have been in litigation with Power Integrations, Inc. See Item 3, Legal Proceedings. Our involvement in this litigation and future intellectual property litigation, or the costs of avoiding or settling litigation by purchasing licenses rights or by other means, could result in significant expense to our company, adversely affecting sales of the challenged products or technologies and diverting the efforts and attention of our technical and management personnel, whether or not such litigation is resolved in our favor. We may decide to settle patent infringement claims or litigation by purchasing license rights from the claimant, even if we believe we are not infringing, in order to reduce the expense of continuing the dispute or because we are not sufficiently confident that we would eventually prevail. In the event of an adverse outcome as a defendant in any such litigation, we may be required to:
| • | pay substantial damages; |
| • | indemnify our customers for damages they might suffer if the products they purchase from us violate the intellectual property rights of others; |
| • | stop our manufacture, use, sale or importation of infringing products; |
| • | expend significant resources to develop or acquire non-infringing technologies; |
| • | discontinue manufacturing processes; or |
| • | obtain licenses to the intellectual property we are found to have infringed. |
We cannot assure you that we would be successful in such development or acquisition or that such licenses would be available under reasonable terms. Any such development, acquisition or license could require the expenditure of substantial time and other resources.
We may not be able to consummate future acquisitions or successfully integrate acquisitions into our business.
We have made numerous acquisitions of various sizes since we became an independent company in 1997 and we plan to pursue additional acquisitions of related businesses. The costs of acquiring and integrating related businesses, or our failure to integrate them successfully into our existing businesses, could result in our company incurring unanticipated expenses and losses. In addition, we may not be able to identify or finance additional acquisitions or realize any anticipated benefits from acquisitions we do complete.
We are constantly evaluating acquisition opportunities and consolidation possibilities and are frequently conducting due diligence or holding preliminary discussions with respect to possible acquisition transactions, some of which could be significant.
If we acquire another business, the process of integrating an acquired business into our existing operations may result in unforeseen operating difficulties and may require us to use significant financial resources on the acquisition that may otherwise be needed for the ongoing development or expansion of existing operations. Some of the risks associated with acquisitions include:
| • | unexpected losses of key employees, customers or suppliers of the acquired company; |
| • | conforming the acquired company’s standards, processes, procedures and controls with our operations; |
17
Table of Contents
| • | coordinating new product and process development; |
| • | hiring additional management and other critical personnel; |
| • | inability to realize anticipated synergies; |
| • | negotiating with labor unions; and |
| • | increasing the scope, geographic diversity and complexity of our operations. |
In addition, we may encounter unforeseen obstacles or costs in the integration of other businesses we acquire.
Possible future acquisitions could result in the incurrence of additional debt, contingent liabilities and amortization expenses related to intangible assets, all of which could have a material adverse effect on our financial condition and operating results.
We may face risks associated with dispositions of assets and businesses.
From time to time we may dispose of assets and businesses in an effort to grow our more profitable product lines. When we do so, we face certain risks associated with these exit activities, including but not limited the risk that we will disrupt service to our customers, the risk of inadvertently losing other business not related to the exit activities, the risk that we will be unable to effectively continue, terminate, modify and manage supplier and vendor relationships, and the risk that we may be subject to consequential claims from customers or vendors as a result of eliminating, or transferring the of production of affected products or the renegotiation of commitments related to those products.
We depend on suppliers for timely deliveries of raw materials of acceptable quality. Production time and product costs could increase if we were to lose a primary supplier or if we experience a significant increase in the prices of our raw materials. Product performance could be affected and quality issues could develop as a result of a significant degradation in the quality of raw materials we use in our products.
Our manufacturing processes use many raw materials, including silicon wafers, gold, copper lead frames, mold compound, ceramic packages and various chemicals and gases. Our manufacturing operations depend upon our ability to obtain adequate supplies of raw materials on a timely basis. Our results of operations could be adversely affected if we were unable to obtain adequate supplies of raw materials in a timely manner or if the costs of raw materials increased significantly. If the prices of these raw materials rise significantly we may be unable to pass on our increased operating expenses to our customers, which would result in decreased profit margins for the products in which they are used. Results could also be adversely affected if there is a significant degradation in the quality of raw materials used in our products, or if the raw materials give rise to compatibility or performance issues in our products, any of which could lead to an increase in customer returns or product warranty claims. Although we maintain rigorous quality control systems, errors or defects may arise from a supplied raw material and be beyond our detection or control. For example, some phosphorus-containing mold compound received from one supplier and incorporated into our products in the past resulted in a number of claims for damages from customers. We purchase some of our raw materials such as silicon wafers, lead frames, mold compound, ceramic packages and chemicals and gases from a limited number of suppliers on a just-in-time basis. From time to time, suppliers may extend lead times, limit supplies or increase prices due to capacity constraints or other factors. We subcontract a minority of our wafer fabrication needs, primarily to Advanced Semiconductor Manufacturing Corporation, Central Semiconductor Manufacturing Corporation, Jilin Magic Semiconductor, Macronix International Co. Ltd., Phenitec Semiconductor and Taiwan Semiconductor Manufacturing Company. In order to maximize our production capacity, some of our back-end assembly and testing operations are also subcontracted. Primary back-end subcontractors include Amkor, ASE, AUK, GEM Services, Hana Semiconductor, Liteon, Tak Cheong Electronics, Greatek, Etrend, AIC and UTAC Thai Ltd. Our operations and ability to satisfy customer obligations could be adversely affected if our relationships with these subcontractors were disrupted or terminated.
18
Table of Contents
Delays in expanding capacity at existing facilities, implementing new production techniques, or incurring problems associated with technical equipment malfunctions, all could adversely affect our manufacturing efficiencies.
Our manufacturing efficiency is an important factor in our profitability, and we cannot assure you that we will be able to maintain our manufacturing efficiency or increase manufacturing efficiency to the same extent as our competitors. Our manufacturing processes are highly complex, require advanced and costly equipment and are continuously being modified in an effort to improve yields and product performance. Impurities or other difficulties in the manufacturing process can lower yields. We are constantly looking for ways to expand capacity or improve efficiency at our manufacturing facilities. As is common in the semiconductor industry, we have from time to time experienced difficulty in completing transitions to new manufacturing processes at existing facilities. As a consequence, we have suffered delays in product deliveries or reduced yields in the past and may experience such delays again in the future.
We may experience delays or problems in bringing new manufacturing capacity to full production. Such delays, as well as possible problems in achieving acceptable yields, or product delivery delays relating to existing or planned new capacity could result from, among other things, capacity constraints, construction delays, upgrading or expanding existing facilities or changing our process technologies, any of which could result in a loss of future revenues. Our operating results could also be adversely affected by the increase in fixed costs and operating expenses related to increases in production capacity if revenues do not increase proportionately.
Slightly less than two-thirds of our sales are made to distributors who can terminate their relationships with us with little or no notice. The termination of a distributor could reduce sales and result in inventory returns.
Distributors accounted for 64% of our net sales for the year ended December 27, 2009. Our top five distributors worldwide accounted for 17% of our net sales for the year ended December 27, 2009. As a general rule, we do not have long-term agreements with our distributors, and they may terminate their relationships with us with little or no advance notice. Distributors generally offer competing products. The loss of one or more of our distributors, or the decision by one or more of them to reduce the number of our products they offer or to carry the product lines of our competitors, could have a material adverse effect on our business, financial condition and results of operations. The termination of a significant distributor, whether at our or the distributor’s initiative, or a disruption in the operations of one or more of our distributors, could reduce our net sales in a given quarter and could result in an increase in inventory returns.
The semiconductor business is very competitive, especially in the markets we serve, and increased competition could reduce the value of an investment in our company.
We participate in the standard component or “multi-market” segment of the semiconductor industry. While the semiconductor industry is generally highly competitive, the “multi-market” segment is particularly so. Our competitors offer equivalent or similar versions of many of our products, and customers may switch from our products to our competitors’ products on the basis of price, delivery terms, product performance, quality, reliability and customer service or a combination of any of these factors. Competition is especially intense in the multi-market semiconductor segment because it is relatively easy for customers to switch between suppliers of more standardized, multi-market products like ours. In the past we have experienced decreases in prices during “down” cycles in the semiconductor industry, and this may occur again as a result of the recent downturn in global economic conditions. Even in strong markets, price pressures may emerge as competitors attempt to gain a greater market share by lowering prices. We compete in a global market and our competitors are companies of various sizes in various countries around the world. Many of our competitors are larger than us and have greater financial resources available to them. As such, they tend to have a greater ability to pursue acquisition candidates and can better withstand adverse economic or market conditions. Additionally, companies with whom we do not currently compete may introduce new products that may cause them to compete with us in the future.
19
Table of Contents
We may not be able to attract or retain the technical or management employees necessary to remain competitive in our industry.
Our continued success depends on our ability to attract and retain skilled personnel, including technical, marketing, management and staff personnel. In the semiconductor industry, the competition for qualified personnel, particularly experienced design engineers and other technical employees, is intense, particularly in the “up” portions of our business cycle, when competitors may try to recruit our most valuable technical employees. While we devote a great deal of our attention to designing compensation programs aimed at accomplishing this goal, we modified many of our compensation programs in fiscal 2009 in response to the global economic crisis. As a result of these modifications, total compensation for many employees was reduced and many were required to take on additional responsibilities to compensate for headcount reductions. While some of the compensation programs have been restored for fiscal 2010, there can be no assurance that we will be able to retain our current personnel or recruit the key personnel we require.
If we must reduce our use of equity awards to compensate our employees, our competitiveness in the employee marketplace could be adversely affected. Our results of operations could vary as a result of the methods, estimates and judgments we use to value our stock-based compensation.
Like most technology companies, we have a history of using broad-based employee stock programs to recruit and retain our workforce in a competitive employment marketplace. Our success will depend in part upon the continued use of stock options, restricted stock units, deferred stock units and performance-based equity awards as a compensation tool. We plan to seek stockholder approval for increases in the number of shares available for grant under the Fairchild Semiconductor 2007 Stock Plan as well as other amendments that may be adopted from time to time which require stockholder approval. If these proposals do not receive stockholder approval, we may not be able to grant stock options and other equity awards to employees at the same levels as in the past, which could adversely affect our ability to attract, retain and motivate qualified personnel, and we may need to increase cash compensation in order to attract, retain and motivate employees, which could adversely affect our results of operations. Additionally, in 2009 we did not grant any stock options to our employees relying instead on grants of restricted stock units, deferred stock units and performance based equity awards. While we believe that our compensation policies remained competitive with our peers, we cannot provide any assurance that we have not, and will not continue in the future to lose opportunities to recruit and retain key employees as a result of these changes.
The calculation of stock-based compensation expense under the Compensation – Stock Compensation Topic of the FASB ASC requires us to use valuation methodologies and a number of estimates, assumptions and conclusions regarding matters such as the expected volatility of our share price, the expected life of our options, the expected dividend rate with respect to our common stock, expected forfeitures and the exercise behavior of our employees. There are no means, under applicable accounting principles, to compare and adjust this expense if and when we learn of additional information that may affect the estimates that we previously made, with the exception of changes in expected forfeitures of stock-based awards. Certain factors may arise over time that lead us to change our estimates and assumptions with respect to future stock-based compensation, resulting in variability in our stock-based compensation expense over time. Changes in forecasted stock-based compensation expense could impact our gross margin percentage, research and development expenses, marketing, general and administrative expenses and our tax rate.
We may face product warranty or product liability claims that are disproportionately higher than the value of the products involved.
Our products are typically sold at prices that are significantly lower than the cost of the equipment or other goods in which they are incorporated. For example, our products that are incorporated into a personal computer may be sold for several dollars, whereas the personal computer might be sold by the computer maker for several hundred dollars. Although we maintain rigorous quality control systems, we manufacture and sell approximately 16 billion individual semiconductor devices per year to customers around the world, and in the ordinary course of
20
Table of Contents
our business we receive warranty claims for some of these products that are defective or that do not perform to published specifications. Since a defect or failure in our product could give rise to failures in the goods that incorporate them (and consequential claims for damages against our customers from their customers), we may face claims for damages that are disproportionate to the revenues and profits we receive from the products involved. We attempt, through our standard terms and conditions of sale and other customer contracts, to limit our liability by agreeing only to replace the defective goods or refund the purchase price. Nevertheless, we have received claims for other charges, such as for labor and other costs of replacing defective parts or repairing the products into which the defective products are incorporated, lost profits and other damages. In addition, our ability to reduce such liabilities, whether by contracts or otherwise, may be limited by the laws or the customary business practices of the countries where we do business. And, even in cases where we do not believe we have legal liability for such claims, we may choose to pay for them to retain a customer’s business or goodwill or to settle claims to avoid protracted litigation. Our results of operations and business could be adversely affected as a result of a significant quality or performance issue in our products, if we are required or choose to pay for the damages that result. For example, from 2001 to 2008 we received claims from a number of customers seeking damages resulting from certain products manufactured with a phosphorus-containing mold compound, and we were named in lawsuits relating to these mold compound claims.
Our international operations subject our company to risks not faced by domestic competitors.
Through our subsidiaries we maintain significant operations and facilities in the Philippines, Malaysia, China, South Korea and Singapore. We have sales offices and customers around the world. Approximately 76% of our revenues in fiscal year 2009 were from Asia. The following are some of the risks inherent in doing business on an international level:
| • | economic and political instability; |
| • | foreign currency fluctuations; |
| • | transportation delays; |
| • | trade restrictions; |
| • | changes in laws and regulations relating to, amongst other things, import and export tariffs, taxation, environmental regulations, land use rights and property, |
| • | work stoppages; and |
| • | the laws of, including tax laws, and the policies of the U.S. toward, countries in which we manufacture our products. |
We acquired significant operations and revenues when we acquired a business from Samsung Electronics and, as a result, are subject to risks inherent in doing business in Korea, including political risk, labor risk and currency risk.
As a result of the acquisition of the power device business from Samsung Electronics in 1999, we have significant operations and sales in South Korea and are subject to risks associated with doing business there. Korea accounted for 13% of our revenue for the year ended December 27, 2009.
Relations between South Korea and North Korea have been tense over most of South Korea’s history, and more recent concerns over North Korea’s nuclear capability, and relations between the U.S. and North Korea, have created a global security issue that may adversely affect Korean business and economic conditions. We cannot assure you as to whether or when this situation will be resolved or change abruptly as a result of current or future events. An adverse change in economic or political conditions in South Korea or in its relations with North Korea could have a material adverse effect on our Korean subsidiary and our company. In addition to other risks disclosed relating to international operations, some businesses in South Korea are subject to labor unrest.
21
Table of Contents
Our Korean sales are increasingly denominated primarily in U.S. dollars while a significant portion of our Korean operations’ costs of goods sold and operating expenses are denominated in South Korean won. Although we have taken steps to fix the costs subject to currency fluctuations and to balance won revenues and won costs as much as possible, a significant change in this balance, coupled with a significant change in the value of the won relative to the dollar, could have a material adverse effect on our financial performance and results of operations (see Item 7A, Quantitative and Qualitative Disclosures about Market Risk).
A change in foreign tax laws or a difference in the construction of current foreign tax laws by relevant foreign authorities could result in us not recognizing any anticipated benefits.
Some of our foreign subsidiaries have been granted preferential income tax or other tax holidays as an incentive for locating in those jurisdictions. A change in the foreign tax laws or in the construction of the foreign tax laws governing these tax holidays, or our failure to comply with the terms and conditions governing the tax holidays, could result in us not recognizing the anticipated benefits we derive from them, which would decrease our profitability in those jurisdictions. We continue to monitor the tax holidays, the income tax laws governing the tax holidays, and our compliance with the terms and conditions of the tax holidays, to ensure that the current and future tax impacts on our subsidiaries in these countries are anticipated and refined.
We have significantly expanded our manufacturing operations in China and, as a result, will be increasingly subject to risks inherent in doing business in China, which may adversely affect our financial performance.
We expect a significant portion of our production from our Suzhou, China facility will be exported out of China, however, we are hopeful that a significant portion of our future revenue will result from the Chinese markets in which our products are sold, and from demand in China for goods that include our products. Our ability to operate in China may be adversely affected by changes in that country’s laws and regulations, including those relating to taxation, import and export tariffs, environmental regulations, land use rights, property and other matters. In addition, our results of operations in China are subject to the economic and political situation there. We believe that our operations in China are in compliance with all applicable legal and regulatory requirements. However, there can be no assurance that China’s central or local governments will not impose new, stricter regulations or interpretations of existing regulations that would require additional expenditures. Changes in the political environment or government policies could result in revisions to laws or regulations or their interpretation and enforcement, increased taxation, restrictions on imports, import duties or currency revaluations. In addition, a significant destabilization of relations between China and the U.S. could result in restrictions or prohibitions on our operations or the sale of our products in China. The legal system of China relating to foreign trade is relatively new and continues to evolve. There can be no certainty as to the application of its laws and regulations in particular instances. Enforcement of existing laws or agreements may be sporadic and implementation and interpretation of laws inconsistent. Moreover, there is a high degree of fragmentation among regulatory authorities resulting in uncertainties as to which authorities have jurisdiction over particular parties or transactions.
We are subject to many environmental laws and regulations that could affect our operations or result in significant expenses.
Increasingly stringent environmental regulations restrict the amount and types of pollutants that can be released from our operations into the environment. While the cost of compliance with environmental laws has not had a material adverse effect on our results of operations historically, compliance with these and any future regulations could require significant capital investments in pollution control equipment or changes in the way we make our products. In addition, because we use hazardous and other regulated materials in our manufacturing processes, we are subject to risks of liabilities and claims, regardless of fault, resulting from our use, transportation, emission, discharge, storage, recycling or disposal of hazardous materials, including personal injury claims and civil and criminal fines, any of which could be material to our cash flow or earnings. For example:
22
Table of Contents
| • | we currently are remediating contamination at some of our operating plant sites; |
| • | we have been identified as a potentially responsible party at a number of Superfund sites where we (or our predecessors) disposed of wastes in the past; and |
| • | significant regulatory and public attention on the impact of semiconductor operations on the environment may result in more stringent regulations, further increasing our costs. |
Although most of our known environmental liabilities are covered by indemnification agreements with Raytheon Company, National Semiconductor, Samsung Electronics and Intersil Corporation, these indemnities are limited to conditions that occurred prior to the consummation of the transactions through which we acquired facilities from those companies. Moreover, we cannot assure you that their indemnity obligations to us for the covered liabilities will be available, or, if available, adequate to protect us.
We are a leveraged company with a ratio of debt to equity at December 27, 2009 of approximately 0.5 to 1, which could adversely affect our financial health and limit our ability to grow and compete.
At December 27, 2009, we had total debt of $472.2 million and the ratio of this debt to equity was approximately 0.5 to 1. As of December 27, 2009, our senior credit facility includes $472.2 million in term loans and the $100 million revolving line of credit. Adjusted for outstanding letters of credit, we had up to $98.0 million available under the revolving loan portion of the senior credit facility. In addition, there is a $150 million uncommitted incremental term loan feature. Despite reducing some of our long-term debt, we continue to carry substantial indebtedness which could have significant consequences on our operations. For example, it could:
| • | require us to dedicate a portion of our cash flow from operations to payments on our indebtedness, thereby reducing the availability of our cash flow to fund working capital, capital expenditures, research and development efforts and other general corporate purposes; |
| • | increase the amount of our interest expense, because certain of our borrowings (namely borrowings under our senior credit facility) are at variable rates of interest, which, if interest rates increase, could result in higher interest expense; |
| • | increase our vulnerability to general adverse economic and industry conditions; |
| • | limit our flexibility in planning for, or reacting to, changes in our business and the industry in which we operate; |
| • | restrict us from making strategic acquisitions, introducing new technologies or exploiting business opportunities; |
| • | make it more difficult for us to satisfy our obligations with respect to the instruments governing our indebtedness; |
| • | place us at a competitive disadvantage compared to our competitors that have less indebtedness; or |
| • | limit, along with the financial and other restrictive covenants in our debt instruments, among other things, our ability to borrow additional funds, dispose of assets, repurchase stock or pay cash dividends. Failing to comply with those covenants could result in an event of default which, if not cured or waived, could have a material adverse effect on our business, financial condition and results of operations. |
Despite current indebtedness levels, we may still be able to incur substantially more indebtedness. Incurring more indebtedness could exacerbate the risks described above.
We may be able to incur substantial additional indebtedness in the future. Although the terms of the credit agreement relating to the senior credit facility contain restrictions on the incurrence of additional indebtedness, these restrictions are subject to a number of qualifications and exceptions and, under certain circumstances,
23
Table of Contents
additional indebtedness incurred in compliance with these restrictions or upon further amendment of the credit facility could be substantial. As of December 27, 2009, the senior credit facility permits borrowings of up to $100 million in revolving loans under the line of credit and up to $150 million under the uncommitted incremental term loan feature, in addition to the outstanding $ 472.2 million term loans that are currently outstanding under that facility. As of December 27, 2009, adjusted for outstanding letters of credit, we had up to $98.0 million available under the revolving loan portion of the senior credit facility. If new debt is added to our subsidiaries’ current debt levels, the substantial risks described above would intensify.
We may not be able to generate the necessary amount of cash to service our indebtedness, which may require us to refinance our indebtedness or default on our scheduled debt payments. Our ability to generate cash depends on many factors beyond our control.
Our historical financial results have been, and we anticipate that our future financial results will be subject to substantial fluctuations, many of which are the result of the recent downturn in the global economy. While we currently have sufficient cash flow to satisfy all of our current obligations, we cannot assure you that our business will continue to generate sufficient cash flow from operations to enable us to pay our indebtedness or to fund our other liquidity needs in the future. Further, we can make no assurances that our currently anticipated cost savings and operating improvements will be realized on schedule or at all, or that future borrowings will be available to us under our senior credit facility in an amount sufficient to satisfy our liquidity needs. In addition, because our senior credit facility has a variable interest rate, our cost of borrowing will increase if market interest rates increase. If we are unable to meet our expenses and debt obligations, we may need to refinance all or a portion of our indebtedness on or before maturity, sell assets or raise equity. We cannot assure you that we would be able to renew or refinance any of our indebtedness, sell assets or raise equity on commercially reasonable terms or at all, which could cause us to default on our obligations and impair our liquidity. Restrictions imposed by the credit agreement relating to our senior credit facility restrict or prohibit our ability to engage in or enter into some business operating and financing arrangements, which could adversely affect our ability to take advantage of potentially profitable business opportunities.
The operating and financial restrictions and covenants in the credit agreement relating to our senior credit facility may limit our ability to finance our future operations or capital needs or engage in other business activities that may be in our interests. The credit agreement imposes significant operating and financial restrictions on us that affect our ability to incur additional indebtedness or create liens on our assets, pay dividends, sell assets, engage in mergers or acquisitions, make investments or engage in other business activities. These restrictions could place us at a disadvantage relative to our competitors many of which are not subject to such limitations.
In addition, the senior credit facility also requires us to maintain specified financial ratios. Our ability to meet those financial ratios can be affected by events beyond our control, and we cannot assure you that we will meet those ratios. As of December 27, 2009, we were in compliance with these ratios. A breach of any of these covenants, ratios or restrictions could result in an event of default under the senior credit facility. Upon the occurrence of an event of default under the senior credit facility, the lenders could elect to declare all amounts outstanding under the senior credit facility, together with accrued interest, to be immediately due and payable. If we were unable to repay those amounts, the lenders could proceed against our assets, including any collateral granted to them to secure the indebtedness. If the lenders under the senior credit facility accelerate the payment of the indebtedness, we cannot assure you that our assets would be sufficient to repay in full that indebtedness and our other indebtedness.
We have investments in auction rate securities that subject us to market risk which could adversely affect our liquidity and financial results.
As of December 27, 2009, we owned auction rate securities with a par value of $51.3 million and market value of $33.4 million. We originally purchased these securities believing them to be safe, short-term and highly liquid investments. However, as a result of the systemic failure of the auction rate securities market, these
24
Table of Contents
securities are no longer liquid. While we continue to accrue and receive interest on these securities at the contractual rate, there can be no assurance that there will ever be an active market for our auction rate securities. Uncertainties in the credit and capital markets could lead to further downgrades of our auction rate securities and additional impairments. Additionally, auction failures have limited our ability to fully recover the par value of our investment in the short term and even if we hold the securities to maturity, the long-term value of the auction rate securities may potentially be impacted by issuer defaults. We do not anticipate that the lack of liquidity or future downgrades and impairments will materially impact our ability to fund out working capital needs, capital expenditures or other business requirements.
| ITEM 1B. | UNRESOLVED STAFF COMMENTS |
We have no unresolved comments from the Securities and Exchange Commission as of February 25, 2010.
25
Table of Contents
| ITEM 2. | PROPERTIES |
We maintain manufacturing and office facilities around the world including the U.S., Asia and Europe. The following table provides information about these facilities at December 27, 2009.
| Location |
Owned | Leased | Use |
Business Segment | ||||
| Bucheon, South Korea |
X | Manufacturing, office facilities and design center. |
PCIA and SDT | |||||
| Cebu, Philippines |
X | X | Manufacturing, warehouse and office facilities. |
MCCC, PCIA and SDT | ||||
| Fuerstenfeldbruck, Germany |
X | Office facilities. |
— | |||||
| Hwasung City, South Korea |
X | Warehouse space. |
— | |||||
| Kowloon, Hong Kong |
X | Office facilities. |
— | |||||
| Colorado Springs, Colorado |
X | Office facilities and design center. |
MCCC | |||||
| Mountaintop, Pennsylvania |
X | Manufacturing and office facilities. |
MCCC and PCIA | |||||
| Oulu, Finland |
X | Office facilities and design center. |
MCCC | |||||
| Penang, Malaysia |
X | X | Manufacturing, warehouse and office facilities. |
MCCC, PCIA and SDT | ||||
| San Jose, California |
X | Office facilities and design center. |
MCCC and PCIA | |||||
| Seoul, South Korea |
X | Office facilities. |
— | |||||
| Shanghai, China |
X | Office facilities. |
— | |||||
| Singapore |
X | Office facilities. |
— | |||||
| South Portland, Maine |
X | Corporate headquarters. |
— | |||||
| South Portland, Maine |
X | X | Manufacturing, office facilities and design center. |
MCCC, PCIA and SDT | ||||
| Suzhou, China |
X | Manufacturing, warehouse and office facilities. |
MCCC, PCIA and SDT | |||||
| Taipei, Taiwan |
X | Office facilities, warehouse and design center. |
PCIA | |||||
| Tokyo, Japan |
X | Office facilities. |
— | |||||
| West Jordan, Utah |
X | Manufacturing and office facilities. |
MCCC | |||||
| Wooton-Bassett, England |
X | Office facilities. |
— |
Leases affecting the Penang, Suzhou and Cebu facilities are generally in the form of long-term ground leases, while we own improvements on the land. In some cases we have the option to renew the lease term, while in others we have the option to purchase the leased premises. We also have the ability to cancel these leases at any time. In addition to the facilities listed above we maintain smaller sales offices in leased spaces around the world.
We believe that our facilities around the world, whether owned or leased, are well maintained and are generally suitable and adequate to carry on the company’s business. Our manufacturing facilities contain sufficient productive capacity to meet our needs for the foreseeable future.
26
Table of Contents
| ITEM 3. | LEGAL PROCEEDINGS |
There are three outstanding proceedings with Power Integrations.
POWI 1: On October 20, 2004, we and our wholly owned subsidiary, Fairchild Semiconductor Corporation, were sued by Power Integrations, Inc. in the U.S. District Court for the District of Delaware. Power Integrations alleged that certain of our pulse width modulation (PWM) integrated circuit products infringed four Power Integrations U.S. patents, and sought a permanent injunction preventing us from manufacturing, selling or offering the products for sale in the U.S., or from importing the products into the U.S., as well as money damages for past infringement.
The trial in the case was divided into three phases. The first phase, held in October 2006, was on infringement, the willfulness of any infringement, and damages. On October 10, 2006, a jury returned a verdict finding that thirty-three of our PWM products infringe one or more of seven claims asserted in the four patents. The jury also found that we willfully infringed the patents, and assessed damages against us in the amount of approximately $34 million. The second phase of the trial, held in September 2007 before a different jury, focused on the validity of the Power Integrations patents. On September 21, 2007 a jury returned a verdict in the second phase, finding that the four Power Integrations patents asserted against us are valid. The third phase of the trial began on September 21, 2007, and covered the enforceability of the patents. On September 24, 2008, the court ruled that the patents are enforceable.
On December 12, 2008 the judge overseeing the case reduced the jury’s October 10, 2006 damages award from approximately $34 million to approximately $6.1 million, and ordered a new trial on the issue of whether we willfully infringed Power Integrations’ asserted patents. The court also issued a permanent injunction on a limited number of our products enjoining us from making, selling or offering to sell the products in the U.S., or from importing the products into the U.S. The injunction took effect on May 13, 2009. We voluntarily stopped U.S. sales and importation of those products in 2007 and have been offering replacement products since 2006.
On June 22, 2009, the new trial on willfulness was held. The court has not issued a final ruling in the case. If the court in the new willfulness trial finds that our infringement was willful, the court will have discretion to increase the $6.1 million damages award by up to three times the amount of the award. Additionally, the court has awarded Power Integrations pre-judgment interest and may also require us to pay Power Integrations’ attorney’s fees.
The final damages award and injunction are subject to appeal and, regardless of the outcome of the willfulness trial, we expect to challenge several aspects of the litigation on appeal. When we appeal, we likely will be required to post a bond or provide other security in an amount equal to the final damages award for the duration of the appeal process.
POWI 2: On May 23, 2008, Power Integrations filed another lawsuit against us, Fairchild Semiconductor Corporation and our wholly owned subsidiary System General Corporation in the U.S. District Court for the District of Delaware, alleging infringement of three patents. Of the three patents claimed in this lawsuit, two are patents that were asserted against us and Fairchild Semiconductor Corporation in the October 2004 lawsuit described above. As mentioned below, the majority of the claims asserted in the first lawsuit from these two patents have now received final rejections from the patent office, and the third patent has also received preliminary rejections. We believe we have strong defenses against Power Integrations’ claims and intend to vigorously defend this second lawsuit.
On October 14, 2008, Fairchild Semiconductor Corporation and System General Corporation filed a patent infringement lawsuit against Power Integrations in the U.S. District Court for the District of Delaware, alleging that certain PWM integrated circuit products infringe one or more claims of three U.S. patents owned by System General. The lawsuit seeks monetary damages and an injunction preventing the manufacture, use, sale, offer for sale or importation of Power Integrations products found to infringe the asserted patents.
27
Table of Contents
Both lawsuits have been consolidated and will be heard together in Delaware District Court. The trial is currently scheduled for October 2010.
POWI 3: On November 4, 2009, Power Integrations, Inc. filed a complaint for patent infringement against us and two of our subsidiaries in the United States District Court for the Northern District of California alleging that several of our products infringe three of Power Integrations’ patents. We intend to put on a vigorous defense against these claims.
Reexaminations: Parallel to the proceedings in Federal Court, we have also petitioned the U.S. Patent and Trademark Office (USPTO) for reexamination of all unexpired patents claims asserted in POWI 1 and POWI 2 (those being all asserted claims from three of the four patents asserted in POWI 1 (the fourth patent has expired) and all of the patents asserted in POWI 2). Of the 24 claims at issue in the three patents from POWI 1, 22 have been finally rejected by the USPTO. In POWI 2, all claims from the third patent which was asserted against us (from the patent which was not previously asserted in POWI 1) have been initially rejected by the USPTO.
Patent Litigation with Infineon. On November 25, 2008, the company and Fairchild Semiconductor Corporation were sued by Infineon Technologies AG, Infineon Technologies Austria AG, and Infineon Technologies North America Corporation in the U.S. District Court for the District of Delaware. On December 28, 2009, the company settled all claims arising out of this case and entered into a broad cross-license with Infineon related to semiconductor technology.
Other Legal Claims. From time to time we are involved in legal proceedings in the ordinary course of business. We believe that there is no such ordinary-course litigation pending that could have, individually or in the aggregate, a material adverse effect on our business, financial condition, results of operations or cash flows.
We have analyzed the potential litigation outcomes from our current litigation in accordance with the Contingency Topic of the FASB ASC. While the exact amount of these losses is not known, we have recorded net reserves for potential litigation outcomes in the consolidated statement of operations, based upon our assessments of the potential liability using an analysis of the claims and historical experience in defending and/or resolving these claims. As of December 27, 2009, our balance for potential litigation outcomes was $6.7 million.
| ITEM 4. | SUBMISSION OF MATTERS TO A VOTE OF SECURITY HOLDERS |
There were no matters submitted to a vote of security holders during the period beginning September 28, 2009 and ending on December 27, 2009.
28
Table of Contents
PART II
| ITEM 5. | MARKET FOR REGISTRANT’S COMMON EQUITY, RELATED STOCKHOLDER MATTERS AND ISSUER PURCHASES OF EQUITY SECURITIES |
Our common stock trades on the New York Stock Exchange under the trading symbol “FCS”. The following table sets forth, for the periods indicated, the high and low intraday sales prices per share of Fairchild Semiconductor International, Inc. Common Stock, as quoted on the NYSE.
| High | Low | |||||
| 2009 |
||||||
| Fourth Quarter (from September 28, 2009 to December 27, 2009) |
$ | 10.77 | $ | 7.10 | ||
| Third Quarter (from June 29, 2009 to September 27, 2009) |
$ | 11.48 | $ | 6.53 | ||
| Second Quarter (from March 30, 2009 to June 28, 2009) |
$ | 8.46 | $ | 3.65 | ||
| First Quarter (from December 29, 2008 to March 29, 2009) |
$ | 6.19 | $ | 2.83 | ||
| 2008 |
||||||
| Fourth Quarter (from September 29, 2008 to December 28, 2008) |
$ | 9.15 | $ | 2.73 | ||
| Third Quarter (from June 30, 2008 to September 28, 2008) |
$ | 14.15 | $ | 9.05 | ||
| Second Quarter (from March 31, 2008 to June 29, 2008) |
$ | 15.29 | $ | 11.62 | ||
| First Quarter (from December 31, 2007 to March 30, 2008) |
$ | 14.52 | $ | 10.31 | ||
As of February 24, 2010 there were approximately 178 holders of record of our Common Stock. We have not paid dividends on our common stock in any of the years presented above and have no present intention of doing so. Certain agreements, pursuant to which we have borrowed funds, contain provisions that limit the amount of dividends and stock repurchases that we may make. See Item 7, Liquidity and Capital Resources and Note 6 to our Consolidated Financial Statements contained in Item 8 of this report, for further information about restrictions to our ability to pay dividends.
Securities Authorized for Issuance Under Equity Compensation Programs
The following table provides information about the number of stock options, deferred stock units (DSUs), restricted stock units (RSUs) and performance units (PUs) outstanding and authorized for issuance under all equity compensation plans of the company on December 27, 2009. The notes under the table provide important additional information.
| Number of Shares of Common Stock Issuable Upon the Exercise of Outstanding Options, DSUs, RSUs and PUs (1) |
Weighted-Average Exercise Price of Outstanding Options (2) |
Number of Shares Remaining Available for Future Issuance (Excluding Shares Underlying Outstanding Options, DSUs, RSUs and PUs) (3) | |||||
| Equity compensation plans approved by stockholders (4) |
17,767,283 | $ | 18.13 | 5,195,433 | |||
| Equity compensation plans not approved by stockholders (5) |
280,000 | 17.00 | — | ||||
| Total |
18,047,283 | $ | 18.11 | 5,195,433 | |||
| (1) | Other than as described here, the company had no warrants or rights outstanding or available for issuance under any equity compensation plan at December 27, 2009. |
| (2) | Does not include shares subject to DSUs, RSUs or PUs, which do not have an exercise price. |
| (3) | Represents 208,177 shares under the 2000 Executive Stock Option Plan (2000 Executive Plan) and 4,987,256 shares under the Fairchild Semiconductor 2007 Stock Plan (2007 Stock Plan). There were no shares remaining available for future issuance under the Fairchild Semiconductor Stock Plan (Stock Plan) on December 27, 2009. |
29
Table of Contents
| (4) | Shares issuable include 1,364,761 options under the 2000 Executive Plan, 8,392,918 options, 76,500 DSUs, 257,353 RSUs, and 52,835 PUs under the Stock Plan and 1,091,849 options, 144,596 DSUs, 4,750,172 RSUs, and 1,636,299 PUs under the 2007 Stock Plan. |
| (5) | Represents 200,000 options granted in December 2004 to Mr. Thompson, and 75,000 options and 5,000 RSUs granted to Mr. Frey, in March 2006, as recruitment-related grants. These equity awards were made under the NYSE exemption for employment inducement awards. The equity awards are covered by separate award agreements. The options vest in equal installments over the four-year period following their grant date, have an eight-year term and have an exercise price per share equal to the fair market value of the company’s common stock on the grant date. The RSUs vest in equal installments over the four-year period following their grant date. |
The material terms of the 2000 Executive Plan, the Stock Plan and the 2007 Stock Plan are described in Note 8 to the company’s Consolidated Financial Statements contained in Item 8 of this report, and the three plans are included as exhibits to this report.
Unregistered Sales of Equity Securities and Use of Proceeds
There were no sales of unregistered equity securities in the fourth quarter of 2009. The company also did not make any purchases of its own common stock during the fourth quarter of 2009.
Stockholder Return Performance
The following graph compares the change in total stockholder return on the company’s common stock against the total return of the Standard & Poor’s 500 Index and the Philadelphia Stock Exchange Semiconductor Index from December 23, 2004, the last day our common stock was traded on the New York Stock Exchange before the beginning of our fifth preceding fiscal year, to December 24, 2009, the last trading day in our fiscal year ended December 27, 2009. Total return to stockholders is measured by dividing the per-share price change for the period by the share price at the beginning of the period. The graph assumes that investments of $100 were made on December 23, 2004 in our common stock and in each of the indexes.
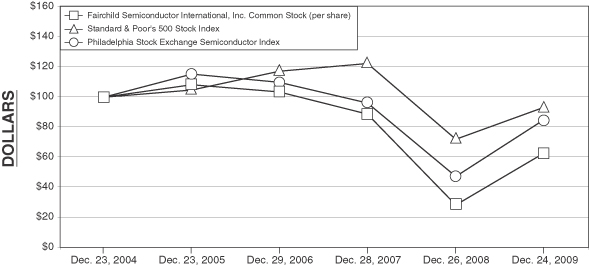
30
Table of Contents
| ITEM 6. | SELECTED FINANCIAL DATA |
The following table sets forth our selected historical consolidated financial data. The historical consolidated financial data as of December 27, 2009 and December 28, 2008 and for the years ended December 27, 2009, December 28, 2008, and December 30, 2007 are derived from our audited Consolidated Financial Statements, contained in Item 8 of this report. The historical consolidated financial data as of December 30, 2007, December 31, 2006 and December 25, 2005 and for the years ended December 31, 2006 and December 25, 2005 are derived from our audited Consolidated Financial Statements, which are not included in this report. This information should be read in conjunction with our audited Consolidated Financial Statements and Management’s Discussion and Analysis of Financial Condition and Results of Operations.
Adjusted net income and loss, adjusted gross margin, and free cash flow are also included in the table below and are non-GAAP financial measures and should not be considered a replacement for GAAP results. We present the adjusted results because we use them as additional measures of our operating performance, and believe the adjusted financial information is useful to investors because it illuminates underlying operational trends by excluding significant non-recurring or otherwise unusual transactions not related to our base business. Our criteria for determining adjusted results may differ from methods used by other companies and should not be considered as alternatives to net income or loss, gross margin, or other measures of consolidated operations and cash flow data prepared in accordance with US GAAP as indicators of our operating performance or as alternatives to cash flow as a measure of liquidity.
Our results for the years ended December 27, 2009, December 28, 2008, December 30, 2007 and December 25, 2005 each consist of 52 weeks, while results for the year ended December 31, 2006 consists of 53 weeks.
| Year Ended | ||||||||||||||||||||
| December 27, 2009 |
December 28, 2008 |
December 30, 2007 |
December 31, 2006 |
December 25, 2005 |
||||||||||||||||
| (In millions, except per share data) | ||||||||||||||||||||
| Consolidated Statements of Operations Data: |
||||||||||||||||||||
| Total revenue |
$ | 1,187.5 | $ | 1,574.2 | $ | 1,670.2 | $ | 1,651.1 | $ | 1,425.1 | ||||||||||
| Total gross margin |
290.3 | 455.4 | 490.5 | 496.8 | 314.3 | |||||||||||||||
| % of total revenue |
24.4 | % | 28.9 | % | 29.4 | % | 30.1 | % | 22.1 | % | ||||||||||
| Net income (loss) |
(60.2 | ) | (167.4 | ) | 64.0 | 83.4 | (241.2 | ) | ||||||||||||
| Net income (loss) per common share: |
||||||||||||||||||||
| Basic |
$ | (0.49 | ) | $ | (1.35 | ) | $ | 0.52 | $ | 0.68 | $ | (2.01 | ) | |||||||
| Diluted |
$ | (0.49 | ) | $ | (1.35 | ) | $ | 0.51 | $ | 0.67 | $ | (2.01 | ) | |||||||
| Consolidated Balance Sheet Data (End of Period): |
||||||||||||||||||||
| Inventories |
$ | 189.5 | $ | 231.0 | $ | 243.5 | $ | 238.9 | $ | 200.5 | ||||||||||
| Total assets |
1,762.4 | 1,849.8 | 2,132.6 | 2,045.6 | 1,928.3 | |||||||||||||||
| Current portion of long-term debt |
5.3 | 5.3 | 203.7 | 2.8 | 5.6 | |||||||||||||||
| Long-term debt, less current portion |
466.9 | 529.9 | 385.9 | 589.7 | 641.0 | |||||||||||||||
| Stockholders’ equity |
1,026.6 | 1,057.1 | 1,218.5 | 1,132.2 | 1,008.5 | |||||||||||||||
| Other Financial Data: |
||||||||||||||||||||
| Research and development |
$ | 99.7 | $ | 112.9 | $ | 109.8 | $ | 107.5 | $ | 77.6 | ||||||||||
| Depreciation and other amortization |
160.4 | 114.5 | 103.5 | 93.3 | 126.3 | |||||||||||||||
| Amortization of acquisition-related intangibles |
22.3 | 22.1 | 23.5 | 23.5 | 23.9 | |||||||||||||||
| Net interest expense |
18.0 | 22.3 | 19.6 | 19.5 | 28.1 | |||||||||||||||
| Capital expenditures |
59.8 | 168.7 | 140.4 | 111.8 | 97.4 | |||||||||||||||
| Adjusted net income |
1.2 | 86.4 | 113.7 | 111.7 | 20.9 | |||||||||||||||
| Adjusted gross margin |
299.5 | 455.4 | 494.2 | 496.8 | 315.1 | |||||||||||||||
| % of total revenue |
25.2 | % | 28.9 | % | 29.6 | % | 30.1 | % | 22.1 | % | ||||||||||
| Free cash flow |
128.6 | 16.7 | 50.2 | 73.1 | 53.3 | |||||||||||||||
We did not pay cash dividends on our common stock in any of the years presented above.
31
Table of Contents
| Year Ended | ||||||||||||||||||||
| December 27, 2009 |
December 28, 2008 |
December 30, 2007 |
December 31, 2006 |
December 25, 2005 |
||||||||||||||||
| Reconciliation of Net Income to Adjusted Net Income |
||||||||||||||||||||
| Net Income (Loss) |
$ | (60.2 | ) | $ | (167.4 | ) | $ | 64.0 | $ | 83.4 | $ | (241.2 | ) | |||||||
| Adjustments to reconcile net income (loss) to adjusted net income: |
||||||||||||||||||||
| Restructuring and impairments, net |
27.9 | 29.2 | 10.8 | 3.2 | 16.9 | |||||||||||||||
| Purchased in-process research and development |
— | — | 3.9 | — | — | |||||||||||||||
| Recovery of equity investment |
— | — | — | — | (0.7 | ) | ||||||||||||||
| Impairment (gain) on equity investment |
2.1 | — | — | — | — | |||||||||||||||
| Litigation settlement received, net |
— | (20.3 | ) | |||||||||||||||||
| Gain associated with debt buyback |
(2.0 | ) | — | — | — | — | ||||||||||||||
| Accelerated depreciation on assets related to fab closure |
8.8 | — | — | — | — | |||||||||||||||
| Inventory write-off associated with fab closure |
0.4 | — | — | — | — | |||||||||||||||
| Accelerated depreciation on assets to be abandoned |
— | — | — | — | 5.0 | |||||||||||||||
| Charge (release) for litigation |
6.0 | (3.3 | ) | 9.5 | 8.2 | 6.9 | ||||||||||||||
| (Gain) loss on sale of product line, net |
— | — | 0.4 | (6.0 | ) | — | ||||||||||||||
| Impairment of investments |
— | 19.0 | — | — | — | |||||||||||||||
| Costs associated with the redemption of 10 1/2% Notes |
— | — | — | — | 23.9 | |||||||||||||||
| Costs associated with the redemption of convertible debt |
— | 0.4 | — | — | — | |||||||||||||||
| Goodwill impairment charge |
— | 203.3 | — | — | — | |||||||||||||||
| Amortization of acquisition-related intangibles |
22.3 | 22.1 | 23.5 | 23.5 | 23.9 | |||||||||||||||
| System General purchase accounting charges |
— | — | 3.7 | — | — | |||||||||||||||
| Reserve for deferred tax assets |
— | — | — | — | 195.3 | |||||||||||||||
| Repatriation tax effect |
— | — | — | — | 14.5 | |||||||||||||||
| Less associated tax effects of the above and other acquistion-related intangibles |
(4.1 | ) | (14.4 | ) | (3.0 | ) | 2.9 | (3.3 | ) | |||||||||||
| Tax benefits from finalized tax filings and positions |
— | (2.5 | ) | 0.9 | (3.5 | ) | — | |||||||||||||
| Adjusted Net Income (Loss) |
$ | 1.2 | $ | 86.4 | $ | 113.7 | $ | 111.7 | $ | 20.9 | ||||||||||
32
Table of Contents
| Year Ended | |||||||||||||||
| December 27, 2009 |
December 28, 2008 |
December 30, 2007 |
December 31, 2006 |
December 25, 2005 | |||||||||||
| Reconciliation of Gross Margin to Adjusted Gross Margin |
|||||||||||||||
| Gross margin |
$ | 290.3 | $ | 455.4 | $ | 490.5 | $ | 496.8 | $ | 314.3 | |||||
| Adjustments to reconcile gross margin to adjusted gross margin: |
|||||||||||||||
| Accelerated depreciation on assets related to fab closure |
8.8 | — | — | — | — | ||||||||||
| Inventory write-off associated with fab closure |
0.4 | — | — | — | — | ||||||||||
| Accelerated depreciation on assets to be abandoned |
— | — | — | — | 0.8 | ||||||||||
| System General purchase accounting charges |
— | — | 3.7 | — | — | ||||||||||
| Adjusted gross margin |
$ | 299.5 | $ | 455.4 | $ | 494.2 | $ | 496.8 | $ | 315.1 | |||||
| Year Ended | |||||||||||||||
| December 27, 2009 |
December 28, 2008 |
December 30, 2007 |
December 31, 2006 |
December 25, 2005 | |||||||||||
| Reconciliation of Free Cash Flow to Operating Cash Flow |
|||||||||||||||
| Cash provided by (used in) operating activities |
$ | 188.4 | $ | 185.4 | $ | 190.6 | $ | 184.9 | $ | 150.7 | |||||
| Capital Expeditures |
59.8 | 168.7 | 140.4 | 111.8 | 97.4 | ||||||||||
| Free Cash Flow |
$ | 128.6 | $ | 16.7 | $ | 50.2 | $ | 73.1 | $ | 53.3 | |||||
33
Table of Contents
| ITEM 7. | MANAGEMENT’S DISCUSSION AND ANALYSIS OF FINANCIAL CONDITION AND RESULTS OF OPERATIONS |
Introduction
This discussion and analysis of financial condition and results of operations is intended to provide investors with an understanding of our past performance, financial condition and prospects. We will discuss and provide our analysis of the following:
| • | Overview |
| • | Results of Operations |
| • | Liquidity and Capital Resources |
| • | Liquidity and Capital Resources of Fairchild International, Excluding Subsidiaries |
| • | Critical Accounting Policies and Estimates |
| • | Forward Looking Statements |
| • | New Policy on Business Outlook Disclosure |
| • | Status of First Quarter Business |
| • | Recently Issued Financial Accounting Standards |
Overview
Entering 2009, the semiconductor industry faced difficult and uncertain times as a result of the global recession. While the recession presented great challenges, it also presented opportunity as we were required to make tough decisions to adjust our costs and manufacturing capabilities to market conditions. We used this down cycle as a catalyst to accelerate our transition to a leaner, more focused and more profitable company.
Throughout 2009, we took aggressive cost reduction actions in order to stay ahead of the economic environment. We significantly reduced our staffing levels with an emphasis on overhead costs, refocused spending on research and development and reduced capital spending. We expect our structural improvements and fixed cost reductions to enable us to deliver strong earnings leverage on future sales increases. These actions include plans to streamline and consolidate wafer manufacturing by closing our eight-inch wafer manufacturing facility in Pennsylvania and closing our four-inch manufacturing line in South Korea. Most of the products currently manufactured in Pennsylvania will be transferred to other internal sites. Manufacturing performed in the Korean four-inch line will be transferred to five and six-inch wafer fabs in Korea. We expect that these changes will simplify operations, improve productivity and reduce costs. As a result of increased demand, we have extended the closure date of these sites through the middle of 2011. However, we expect the favorable financial impact of higher sales will more than offset the delayed costs savings.
While the current business environment is continuing to improve, we continue to proactively take actions to keep inventory as lean as possible while maintaining customer service. We prefer to maintain maximum flexibility by adjusting internal inventories in response to higher demand before adding more inventory to our distribution channels. We continue to manage our production output to maintain channel inventories within our target range of 8 to 9 weeks. We reduced internal inventories by $41.5 million and reduced distributor inventory by approximately $99.0 million in 2009.
Effective the first quarter of 2009, we realigned our operating segments and management structure and, accordingly, our segment reporting. The realignment corresponds with the way we manage the business and was designed to reduce costs and facilitate greater customer intimacy by moving from a product oriented structure to an application based structure. The majority of our activities have been realigned into two focus areas; Mobile,
34
Table of Contents
Computing, Consumer and Communications (MCCC) which focuses on handset, computing and multimedia applications, and Power Conversion, Industrial and Automotive (PCIA) which focuses on power supply and motor control solutions. Each of these segments has a relatively small set of leading customers, common technology requirements, and similar design cycles. The Standard Discrete and Standard Linear (SDT) business will continue to be managed separately as a third segment. All segment reporting within management’s discussion and analysis has been restated to reflect this change.
In addition, as a result of a company-wide simplification effort, the allocation of selling, general and administrative (SG&A) expenses to the reporting segments was changed beginning in the first quarter of 2009. Starting in fiscal year 2009, we only include dedicated, direct SG&A spending by the segments in the calculation of their operating income. All other corporate level SG&A spending is now included in the corporate category. Prior periods have been restated to reflect this change.
MCCC’s main focus is to supply the mobile, computing, consumer and communication end market segments with innovative power and signal path solutions including our low voltage MOSFETs, Power Management IC’s, Mixed Signal Analog and Logic products. We seek to deliver exceptional product performance by optimizing silicon processes and application specific design to satisfy specific requirements for our customers. This enables us to deliver solutions with greater energy efficiency and smaller footprint than is commonly available. We expect a steady acceleration of new product sales especially for solutions targeted to the handset and ultraportable market.
PCIA’s focus is to capitalize on the growing demand for greater energy efficiency in power supplies, battery chargers and automobiles. We are a leader in power factor correction, low standby power consumption designs and innovative switching techniques that enable greater efficiency under load. Improving the efficiency of our customers’ products is vital to meeting new energy efficiency regulations. Effectively managing the power conversion and initial voltage regulation in power supplies is one of the greatest opportunities we have to improve overall system efficiency. We believe the growing global focus on energy efficiency will continue to drive growth in this product line.
SDT products are core building block components for many electronic applications. This segment is moving to a more simplified and focused operating model to make the selling and support of these products easier and more profitable. The right operational structure and part portfolio will enable SDT to capture market share and increase profits.
Our results for the years ended December 27, 2009, December 28, 2008 and December 30, 2007 each consist of 52 weeks.
35
Table of Contents
Results of Operations
The following table summarizes certain information relating to our operating results as derived from our audited consolidated financial statements as well as certain unaudited non-GAAP financial measures.
| Year Ended | ||||||||||||||||||||
| December 27, 2009 |
December 28, 2008 |
December 30, 2007 |
||||||||||||||||||
| (Dollars in millions) | ||||||||||||||||||||
| Total revenues |
$ | 1,187.5 | 100 | % | $ | 1,574.2 | 100 | % | $ | 1,670.2 | 100 | % | ||||||||
| Gross margin |
290.3 | 24 | % | 455.4 | 29 | % | 490.5 | 29 | % | |||||||||||
| Operating Expenses: |
||||||||||||||||||||
| Research and development |
99.7 | 8 | % | 112.9 | 7 | % | 109.8 | 7 | % | |||||||||||
| Selling, general and administrative |
179.3 | 15 | % | 217.7 | 14 | % | 230.3 | 14 | % | |||||||||||
| Amortization of acquisition-related intangibles |
22.3 | 2 | % | 22.1 | 1 | % | 23.5 | 1 | % | |||||||||||
| Restructuring and impairments |
27.9 | 2 | % | 29.2 | 2 | % | 10.8 | 1 | % | |||||||||||
| Charge (release) for litigation |
6.0 | 1 | % | (3.3 | ) | 0 | % | 9.5 | 1 | % | ||||||||||
| (Gain) loss on sale of product line, net |
— | 0 | % | — | 0 | % | 0.4 | 0 | % | |||||||||||
| Purchased in-process research and development |
— | 0 | % | — | 0 | % | 3.9 | 0 | % | |||||||||||
| Goodwill impairment charge |
— | 0 | % | 203.3 | 13 | % | — | 0 | % | |||||||||||
| Total operating expenses |
335.2 | 28 | % | 581.9 | 37 | % | 388.2 | 23 | % | |||||||||||
| Operating income (loss) |
(44.9 | ) | -4 | % | (126.5 | ) | -8 | % | 102.3 | 6 | % | |||||||||
| Impairment of investments |
— | 0 | % | 19.0 | 1 | % | — | 0 | % | |||||||||||
| Other expense, net |
18.4 | 2 | % | 23.1 | 1 | % | 20.2 | 1 | % | |||||||||||
| Income (loss) before income taxes |
(63.3 | ) | -5 | % | (168.6 | ) | -11 | % | 82.1 | 5 | % | |||||||||
| Provision for income taxes |
(3.1 | ) | 0 | % | (1.2 | ) | 0 | % | 18.1 | 1 | % | |||||||||
| Net income (loss) |
$ | (60.2 | ) | -5 | % | $ | (167.4 | ) | -11 | % | $ | 64.0 | 4 | % | ||||||
| Unaudited NonGAAP Measures |
||||||||||||||||||||
| Adjusted net income |
$ | 1.2 | $ | 86.4 | $ | 113.7 | ||||||||||||||
| Adjusted Gross margin |
299.5 | 25 | % | 455.4 | 29 | % | 494.2 | 30 | % | |||||||||||
| Free Cash Flow |
128.6 | 16.7 | 50.2 | |||||||||||||||||
Year Ended December 27, 2009 Compared to Year Ended December 28, 2008
Total Revenues. Total revenues for 2009 decreased $386.7 million, or 24.6%, as compared to 2008. The decline in revenue was primarily driven by a decrease in unit volumes due to reduced market demand as a result of the global recession.
Geographic revenue information is based on the customer location within the indicated geographic region. The following table presents, as a percentage of sales, geographic sales for the Americas, Europe, China, Taiwan, Korea and Other Asia/Pacific (which for our geographic reporting purposes includes Japan and Singapore) for 2009 and 2008. The decrease in the percentage of revenue in Taiwan resulted from a reduction in demand for desktop and notebook computers. The percentage of revenue in China increased as a result of new design wins and stronger demand for our smart power module products and high performance MOSFETS. This increase in demand was driven by a government sponsored household appliance subsidy program for the rural Chinese population.
36
Table of Contents
| Year Ended | ||||||
| December 27, 2009 |
December 28, 2008 |
|||||
| United States |
8 | % | 8 | % | ||
| Other Americas |
4 | 3 | ||||
| Europe |
12 | 13 | ||||
| China |
36 | 31 | ||||
| Taiwan |
16 | 20 | ||||
| Korea |
13 | 13 | ||||
| Other Asia/Pacific |
11 | 12 | ||||
| Total |
100 | % | 100 | % | ||
Gross Margin. Gross margin dollars decreased approximately 36.3% in 2009 as compared to 2008 due to decreased revenue, lower unit volumes and higher manufacturing unit costs as a result of lower factory utilization. This lower factory utilization was a result of lower demand as well as efforts to reduce internal and distribution inventory. In addition, gross margin in 2009 was impacted by accelerated depreciation due to the closure of the Mountaintop facility.
Adjusted Gross Margin. Adjusted gross margin is a non-GAAP financial measure. Adjusted gross margin dollars decreased approximately 34.2% in 2009 as compared to 2008 due the reasons listed above. However, adjusted gross margin in 2009 does not included the impact of accelerated depreciation due to the closure of the Mountaintop facility. See reconciliation of gross margin to adjusted gross margin in Item 6.
Operating Expenses. Research and development (R&D) and sales, general and administrative (SG&A) expenses decreased in 2009, as compared to 2008. R&D and SG&A expenses decreased due to cost reduction efforts implemented in 2008 and the first half of 2009. Our employee base was reduced, discretionary spending was cut and a number of temporary benefit reductions were implemented. Several of these benefit reductions were reinstated in the third quarter of 2009. In addition, equity and variable compensation expense was reduced in 2009.
Restructuring and Impairments. During 2009, we recorded restructuring and impairment charges, net of releases, of $27.9 million. The charges included $15.4 million in employee separation costs, $1.6 million in asset impairment costs, $4.0 million in facility closure costs and $0.1 million in reserve releases, all associated with the 2009 Infrastructure Realignment Program. In addition during 2009, we recorded $7.0 million in employee separation costs, $0.7 million lease impairment costs and $0.6 million in reserve releases associated with the 2008 Infrastructure Realignment Program as well as $.01 million in reserve releases associated with the 2007 Infrastructure Realignment Program.
The closure of the Mountaintop, Pennsylvania manufacturing facility and the four-inch manufacturing line in Bucheon, South Korea was announced in the first quarter of 2009 and the charges associated with those programs are included in the 2009 Infrastructure Realignment Program. The 2009 Infrastructure Realignment Program also includes charges for a smaller worldwide cost reduction plan to further right-size our company and remain financially healthy.
The 2009 worldwide restructuring action, excluding facility closures, impacted 270 employees. We achieved annual savings associated with these employee separation costs of $13.8 million by the end of 2009. We previously announced that the consolidation of the South Korea fabrication processes and the closure of the Mountaintop facility would be completed by June 2010. However, as a result of increased demand for the products manufactured at these facilities, we now expect to complete these actions during the second quarter of 2011. We do not anticipate that this extension will have any significant impact on the cash and non-cash charges we originally planned or upon the annualized rate of cost savings that we expect to achieve once these closures are complete. Once the closures are complete we expect to achieve annualized cost savings ranging from $20 to $25 million.
37
Table of Contents
During 2008, we recorded restructuring and impairment charges, net of releases, totaling $29.2 million. The charges included $14.0 million in employee separation costs, $1.9 million lease impairment costs for the streamlining of warehouse operations, $12.2 million in asset impairment costs, $0.1 million in office closure costs and $0.3 million in reserve releases, all associated with the 2008 Infrastructure Realignment Program. In addition, we recorded $1.3 million in employee separation costs associated with the 2007 Infrastructure Realignment Program.
The majority of charges in 2008 related to several asset impairments for non-industry standard packaging capacity and simplification of our supply chain planning systems. We also adjusted the workforce mix in our Maine fab as we converted to a more automated and technologically advanced eight-inch wafer production process. In addition, we reduced headcount in certain sales and marketing activities to further streamline selling, general and administration costs.
We have substantially completed payment of the remaining employee severance accruals related to the 2008 Infrastructure Realignment Program. This action impacted approximately 1,051 manufacturing and non-manufacturing personnel. We achieved annualized cost savings associated with the employee separation costs of approximately $30.7 million. Payouts associated with the 2008 lease impairment will be made on a regular basis and will be complete by the fourth quarter of 2011.
Charge (Release) for Litigation. In 2009, we paid $6.0 million to settle patent litigation with Infineon. In 2008, we reduced our reserves for potential litigation outcomes by $3.3 million due to a court ruling that reduced the damages awarded in the ongoing Power Integrations lawsuit (see Item 8, Note 14 of this report for additional information).
Goodwill Impairment Charge. In 2008, after completing step one of the impairment test, we determined that the estimated fair value of our PCIA and SPG reporting units was less than the net book value of those reporting units which required us to complete the second step of the impairment test. Upon completion of step two of the analysis, we wrote off the entire goodwill balance for PCIA and what was then our SPG segment. This resulted in a $203.3 million impairment loss as of December 28, 2008. The goodwill impairment charge is non-cash in nature and does not affect our liquidity, cash flows from operating activities or debt covenants and will not have a material impact on future operations (See Critical Accounting Polices and Estimates and Item 8, Note 2 and Note 5 of this report for additional information).
Impairment of Investments. As of December 28, 2008, we concluded that the impairment of our auction rate securities was other-than-temporary and recognized a loss of $19.0 million (see Critical Accounting Policies and Estimates and Item 8, Note 2 and Note 3 for further information).
Other Expense, net. The following table presents a summary of Other expense, net for 2009 and 2008, respectively.
| Year Ended | ||||||||
| December 27, 2009 |
December 28, 2008 |
|||||||
| (In millions) | ||||||||
| Interest expense |
$ | 21.4 | $ | 34.0 | ||||
| Interest income |
(3.4 | ) | (11.7 | ) | ||||
| Other (income) expense, net |
0.4 | 0.8 | ||||||
| Other expense, net |
$ | 18.4 | $ | 23.1 | ||||
Interest expense. Interest expense in 2009 decreased $12.6 million as compared to 2008, primarily due to lower interest rates on outstanding debt and lower debt balances.
Interest income. Interest income in 2009 decreased $8.3 million as compared to 2008, as a result of lower rates of return.
38
Table of Contents
Income Taxes. Income tax benefit in 2009 was $3.1 million on loss before taxes of $63.3 million, as compared to income tax benefit of $1.2 million on loss before taxes of $168.6 million for 2008. The effective tax rate for 2009 was 4.9% compared to 0.7% for 2008. The change in effective tax rate is primarily due to shifts of income and loss among jurisdictions with differing tax rates, foreign currency revaluations, discrete tax expenses and benefits as a result of finalization of certain tax filings, the impact of goodwill impairment in multiple jurisdictions in 2008 as well as a net tax benefit of $1.6 million recorded in the fourth quarter of 2009 relating to a partial release of the valuation allowance on the Malaysian cumulative reinvestment allowance and manufacturing incentives deferred tax asset. In 2009, the valuation allowance on our deferred tax assets increased by $13.9 million
In accordance with the Income Taxes Topic in the FASB Accounting Standards Codification (ASC), deferred taxes have not been provided on undistributed earnings of foreign subsidiaries which are reinvested indefinitely. Certain non-U.S. earnings, which have been taxed in the U.S. but earned offshore, have and continue to be part of our repatriation plan. As of December 27, 2009, we have recorded a deferred tax liability of $0.1 million, with no impact to the consolidated statement of operations as we have a full valuation allowance against our net U.S. deferred tax assets.
Free Cash Flow. Free cash flow is a non-GAAP financial measure. To determine free cash flow, we subtract capital expenditures from GAAP cash provided by operating activities. Free Cash flow increased approximately $112 million in 2009 as a result of reduced capital expenditures and a net reduction in working capital. See Free Cash Flow reconciliation in Item 6.
Reportable Segments. The following table represents comparative disclosures of revenue and gross margin of our reportable segments.
| Year Ended | ||||||||||||||||||||||||||
| December 27, 2009 | December 28, 2008 | |||||||||||||||||||||||||
| Revenue | % of Total |
Gross Margin % |
Operating Income (loss) |
Revenue | % of Total |
Gross Margin % |
Operating Income (loss) |
|||||||||||||||||||
| (Dollars in millions) | ||||||||||||||||||||||||||
| MCCC |
$ | 525.7 | 44.3 | % | 29.1 | % | $ | 74.2 | $ | 748.9 | 47.6 | % | 33.9 | % | $ | 171.0 | ||||||||||
| PCIA |
533.5 | 44.9 | % | 25.6 | % | 71.6 | 657.5 | 41.8 | % | 28.7 | % | 107.6 | ||||||||||||||
| SPG |
128.3 | 10.8 | % | 12.1 | % | 9.8 | 167.8 | 10.7 | % | 10.5 | % | 9.4 | ||||||||||||||
| Corporate (1) |
— | 0.0 | % | 0.0 | % | (200.5 | ) | — | 0.0 | % | 0.0 | % | (414.5 | ) | ||||||||||||
| Total |
$ | 1,187.5 | 100.0 | % | 24.4 | % | $ | (44.9 | ) | $ | 1,574.2 | 100.0 | % | 28.9 | % | $ | (126.5 | ) | ||||||||
| (1) | In 2009, Corporate includes $17.5 million of stock-based compensation expense, $27.9 million of restructuring and impairments expense, $6.0 million litigation charge, $8.8 million of accelerated depreciation related to the Mountaintop closure, and $140.3 of SG&A expenses. In 2008, Corporate includes $19.1 million of stock-based compensation expense, $29.2 million of restructuring and impairments expense, a release of $3.3 million for potential litigation outcomes, a goodwill impairment charge of $203.3 million (see Item 8, Note 5) and $166.2 million of SG&A expenses. |
MCCC. MCCC revenues decreased approximately 30% in 2009 as compared to 2008. During 2009, decreases in unit volumes contributed approximately 19% of the revenue decrease due to overall market decline for semiconductors, specifically in the MOSFET markets, as well as a reduction in distribution channel inventory. Demand for power analog products has remained stable despite market conditions due to market share gains and less inventory drain for mobile products. The remaining decrease in revenue of 11% was driven by changes in product mix and decreases in pricing. Gross margin dollars declined due to decreased revenue as a result of lower overall market demand as well as higher manufacturing unit costs due to lower factory utilization.
39
Table of Contents
MCCC had operating income of $74.2 million in 2009, as compared to $171.0 million in 2008. The decrease in operating income was due to lower gross margin as discussed above. This was partially offset by decreased SG&A expenses due to reductions in our employee base, discretionary spending, and variable compensation as well as other temporary benefit reductions. Several of these benefit reductions were reinstated in the third quarter of 2009 as a result of improved market conditions. R&D expenses increased slightly due to a reallocation of R&D resources.
PCIA. PCIA revenues decreased approximately 19% in 2009 as compared to 2008. The decline in revenue was driven primarily by decreases in unit volumes as a result of weaker demand for high voltage and power conversion products as well as general weakening in the automotive industry in North America and Europe. Unit volumes were also impacted by a reduction in distribution channel inventory. In addition, changes in mix and decreases in average selling prices due to continued pricing pressure contributed approximately 5% to the decline in revenue. Gross margin dollars declined due to lower revenue and unit volumes and higher manufacturing unit costs as the result of lower factory utilization partially offset by a favorable currency translation impact.
PCIA had operating income of $71.6 million in 2009, as compared to $107.6 million in 2008. The decrease in operating income was due to lower gross margin as discussed above. This was partially offset by decreased R&D and SG&A expenses due to reductions in our employee base, discretionary spending, and variable compensation as well as other temporary benefit reductions. Several of these benefit reductions were reinstated in the third quarter of 2009 as a result of improved market conditions. In addition, there was a favorable impact from the weakening of the Korean Won.
SDT. SDT revenues decreased approximately 24% in 2009 as compared to 2008. The decline in revenue was primarily driven by decreases in unit volumes due to reduced demand as a result of the worldwide economic downturn. Gross margin dollars declined due to lower revenue and unit volumes, increased competition and higher manufacturing unit costs as the result of lower factory utilization. However, gross margin percent improved year over year as a result of the mix out of lower margin products and material cost reductions on major packages.
SDT had operating income of $9.8 million in 2009, compared to $9.4 million in 2008. The slight increase in operating income was due improved gross margin as well as reduced R&D and SG&A expenses. R&D and SG&A expenses decreased due to reductions in our employee base, discretionary spending, and variable compensation as well as other temporary benefit reductions. Several of these benefit reductions were reinstated in the third quarter of 2009 as a result of improved market conditions. R&D expense also decreased as a result of a reallocation of R&D resources.
Year Ended December 28, 2008 Compared to Year Ended December 30, 2007
Total Revenues. Total revenues for 2008 decreased $96.0 million, or 5.7%, as compared to 2007, primarily due to a significant reduction in demand in the fourth quarter driven by a broad-based weakness in virtually all end markets and regions.
Geographic revenue information is based on the customer location within the indicated geographic region. The following table presents, as a percentage of sales, geographic sales for the Americas, Europe, China, Taiwan, Korea and Other Asia/Pacific (which for our geographic reporting purposes includes Japan and Singapore) for 2008 and 2007.
40
Table of Contents
| Year Ended | ||||||
| December 28, 2008 |
December 30, 2007 |
|||||
| United States |
8 | % | 9 | % | ||
| Other Americas |
3 | 3 | ||||
| Europe |
13 | 12 | ||||
| China |
31 | 29 | ||||
| Taiwan |
20 | 21 | ||||
| Korea |
13 | 13 | ||||
| Other Asia/Pacific |
12 | 13 | ||||
| Total |
100 | % | 100 | % | ||
Gross Margin. Gross margin dollars decreased approximately 7% in 2008 as compared to 2007 due to decreased revenue and lower factory utilization which was partially offset by a decrease in equity compensation as well as favorable currency and commodity prices.
Adjusted Gross Margin. Adjusted gross margin dollars decreased approximately 8% in 2008 as compared to 2007 due to the reasons listed above as well as the exclusion of System General purchase accounting charges from 2007 gross margins. See Item 6 for a reconciliation of gross margin to adjusted gross margin.
Operating Expenses. Research and development (R&D) expenses increased in 2008, as compared to 2007. R&D increased due to spending for new product development and investments in manufacturing cost reduction programs. Selling, general and administrative (SG&A) expenses decreased in 2008, as compared to 2007, due to continued cost discipline and reduced equity compensation.
The decrease in amortization of acquisition-related intangibles during 2008 is due to certain intangibles becoming fully amortized. The decrease was partially offset by an increase of approximately $0.5 million in amortization expense due to a full first quarter of expense related to the System General acquisition in 2008 as compared to a partial quarter of expense in the first quarter of 2007 (see Item 8, Note 17 for additional information).
Restructuring and Impairments. During 2008, we recorded restructuring and impairment charges, net of releases, totaling $29.2 million. The charges included $14.0 million in employee separation costs, $1.9 million lease impairment costs for the streamlining of warehouse operations, $12.2 million in asset impairment costs, $0.1 million in office closure costs and $0.3 million in reserve releases, all associated with the 2008 Infrastructure Realignment Program. In addition, we recorded $1.3 million in employee separation costs associated with the 2007 Infrastructure Realignment Program.
Employee severance related accruals associated with the 2008 Infrastructure Realignment Program are expected to be substantially complete by the first quarter of 2009. This action impacts approximately 831 manufacturing and non-manufacturing personnel. We expect annualized cost savings associated with the employee separation costs of approximately $26.0 million by the end of the first quarter of 2009. In addition, we achieved annualized depreciation cost savings of approximately $1.6 million related to the asset impairment charges effective the third quarter of 2008. We achieved annualized cost savings associated with the lease impairment of approximately $0.5 million effective during the third quarter of 2008.
During 2007, we recorded restructuring and impairment charges, net of releases, totaling $10.8 million. The charges included $6.8 million in employee separation costs, $0.2 million in contract cancellation costs, $3.1 million in asset impairment costs and $0.2 million in reserve releases, all associated with the 2007 Infrastructure Realignment Program. In addition, we recorded an additional $0.9 million in employee separation costs associated with the 2006 Infrastructure Realignment Program.
41
Table of Contents
The 2007 Infrastructure Realignment Program is partially complete and is expected to be substantially complete by the first quarter of 2009. This action impacts approximately 105 manufacturing and non-manufacturing personnel. We achieved annualized cost savings associated with the employee separation costs of approximately $9.2 million during 2008. We also achieved annualized depreciation cost savings of $0.8 million related to the asset impairment charges.
Charge (Release) for Potential Litigation Outcomes, net. In 2008, we reduced our reserves for potential litigation outcomes by $3.3 million due to a court ruling that reduced the damages awarded in the ongoing Power Integrations lawsuit. In 2007, we recorded a net charge of $9.5 million for potential litigation outcomes. The charges were based on our analysis of the claims and our historical experience in defending and/or resolving these claims (see Item 8, Note 14 of this report for additional information). A further explanation of our litigation with Power Integrations litigation is included in Item 3.
Goodwill Impairment Charge. We performed our annual goodwill impairment test as of December 28, 2008. After completing step one of the impairment test, we determined that the estimated fair value of our PCIA and SPG reporting units was less then the net book value of those reporting units which required us to complete the second step of the impairment test. Upon completion of step two of the analysis, we wrote off the entire goodwill balance for PCIA and SPG. This resulted in a $203.3 million impairment loss as of December 28, 2008. The goodwill impairment charge is non-cash in nature and does not affect our liquidity, cash flows from operating activities or debt covenants and will not have a material impact on future operations (See Critical Accounting Polices and Estimates and Item 8, Note 2 and Note 5 of this report for additional information).
Loss on Sale of Product Line, net. In 2007, we sold selected assets of the Radio Frequency (RF) product line to ANADIGICS, Inc. as these RF assets did not fit with our strategic direction. As a result of the sale, we recorded a net loss of $0.4 million during the third quarter of 2007.
Purchased In-Process Research and Development (IPR&D). In 2007, we recorded $3.9 million of IPR&D as a result of the acquisition of System General (see Item 8, Note 17 of this report for additional information).
Impairment of Investments. As of December 28, 2008, we concluded that the impairment of our auction rate securities was other-than-temporary and recognized a loss of $19.0 million (see Critical Accounting Policies and Estimates and Item 8, Note 2 and Note 3 for further information).
Other Expense, net. The following table presents a summary of Other expense, net for 2008 and 2007, respectively.
| Year Ended | ||||||||
| December 28, 2008 |
December 30, 2007 |
|||||||
| (In millions) | ||||||||
| Interest expense |
$ | 34.0 | $ | 38.5 | ||||
| Interest income |
(11.7 | ) | (18.9 | ) | ||||
| Other (income) expense, net |
0.8 | 0.6 | ||||||
| Other expense, net |
$ | 23.1 | $ | 20.2 | ||||
Interest expense. Interest expense in 2008 decreased $4.5 million as compared to 2007, primarily due to lower interest rates on outstanding debt and lower debt balances.
Interest income. Interest income in 2008 decreased $7.2 million as compared to 2007, as a result of lower invested balances in cash and cash equivalents and lower rates of return.
42
Table of Contents
Income Taxes. Income taxes for 2008 were a benefit of $1.2 million on loss before taxes of $168.6 million, as compared to income taxes of $18.1 million on income before taxes of $82.1 million for 2007. The effective tax rate for 2008 was 0.7% compared to 22.0% for 2007. The change in effective tax rate is primarily due to shifts of income among jurisdictions with differing tax rates, foreign currency revaluations, the impact of goodwill impairment in multiple jurisdictions as well as a net tax benefit of $1.7 million recorded in the second quarter of 2008 relating to adjustments to prior year estimates. The net benefit included additional withholding tax expense associated with historical license fees cross-charged to a foreign jurisdiction which imposes a withholding tax on outbound payments, offset by the release of excess state tax accruals primarily relating to the repatriation of prior year’s foreign earnings. In 2008, the valuation allowance on our deferred tax assets was increased to $195.2 million primarily driven by the recording of a full valuation allowance in the third quarter of 2008 of $22.9 million relating to our Malaysian manufacturing incentives. The $22.9 million represents a cumulative incentive covering both current and prior accounting periods. The deferred tax asset and related valuation allowance were previously recorded on a net basis but should have been presented on a gross basis in our notes to the consolidated financial statements. The gross up of these items did not impact our financial position or our results of operations and has been determined to be immaterial. Offsetting this increase to the valuation allowance on our deferred tax assets was the utilization of certain tax assets in the U.S. during 2008.
In accordance with the Income Taxes Topic in the FASB ASC, deferred taxes have not been provided on undistributed earnings of foreign subsidiaries which are reinvested indefinitely. Certain non-U.S. earnings, which have been taxed in the U.S. but earned offshore, have and continue to be part of our repatriation plan. After further analysis of our APB 23 position regarding the February 2007 acquisition of System General in Taiwan, a decision was made not to be permanently reinvested in Taiwan as the local laws provide incentives to companies to declare and distribute annual dividends. In addition, with the closing of one of our foreign operations, which ultimately will result in the repatriating of undistributed earnings, a decision was made not to be permanently reinvested at that site.
Free Cash Flow. Free Cash flow decreased approximately $34 million in 2008 as a result of increased capital expenditures. The increase in capital expenditures was due to an insourcing program designed to reduce package costs and an 8 inch wafer fab conversion at the Maine manufacturing facility. See Item 6 for a reconciliation of free cash flow to cash provided by operating activities.
Reportable Segments. The following table represents comparative disclosures of revenue and gross margin of our reportable segments.
| Year Ended | ||||||||||||||||||||||||||
| December 28, 2008 | December 30, 2007 | |||||||||||||||||||||||||
| Revenue | % of Total |
Gross Margin % |
Operating Income (loss) |
Revenue | % of Total |
Gross Margin % |
Operating Income (loss) |
|||||||||||||||||||
| (Dollars in millions) | ||||||||||||||||||||||||||
| MCCC |
$ | 748.9 | 47.6 | % | 33.9 | % | $ | 171.0 | $ | 769.1 | 46.0 | % | 34.3 | % | $ | 179.0 | ||||||||||
| PCIA |
657.5 | 41.8 | % | 28.7 | % | 107.6 | 714.7 | 42.8 | % | 29.2 | % | 124.8 | ||||||||||||||
| SPG |
167.8 | 10.7 | % | 10.5 | % | 9.4 | 186.4 | 11.2 | % | 12.6 | % | 15.5 | ||||||||||||||
| Corporate (1) |
— | 0.0 | % | 0.0 | % | (414.5 | ) | — | 0.0 | % | 0.0 | % | (217.0 | ) | ||||||||||||
| Total |
$ | 1,574.2 | 100.0 | % | 28.9 | % | $ | (126.5 | ) | $ | 1,670.2 | 100.0 | % | 29.4 | % | $ | 102.3 | |||||||||
| (1) | In 2008, Corporate includes $19.1 million of stock-based compensation expense, $29.2 million of restructuring and impairments expense, a release of $3.3 million for potential litigation outcomes, a goodwill impairment charge of $203.3 million (see Item 8, Note 5) and $166.2 million of SG&A expenses. In 2007, Corporate includes $24.8 million of stock-based compensation expense, $10.8 million of restructuring and impairment expense, $9.5 million in charges for potential litigation outcomes, net (see Item 8, Note 14), a net loss of $0.4 million on the sale of a product line, $0.3 million of other expense and $171.2 million of SG&A expenses. |
43
Table of Contents
MCCC. MCCC revenues decreased approximately 3% in 2008 as compared to 2007. The overall decrease in revenue was primarily driven by price and product mix decreases in average selling prices offset by increases in unit volumes. Gross margin declined primarily due to decreased revenue.
MCCC had operating income of $171.0 million in 2008, as compared to $179.0 million in 2007. The decrease in operating income was due to lower gross margin, offset by lower R&D expenses and lower SG&A expenses due to decreased variable compensation and continued cost discipline. Amortization of acquisition-related intangibles decreased due to certain intangibles becoming fully amortized.
PCIA. PCIA revenues decreased approximately 8% in 2008 as compared to 2007. The overall decrease in revenue was driven by decreases in unit volumes which were partially offset by increases in average selling prices due to the introduction of higher margin new products and changes in product mix. The revenue decline in 2008 was primarily driven by increased competition and reduced demand in our high voltage and power conversion products, offset by increases in demand for mobile charger products. Automotive revenue remained relatively flat year over year. Gross margin decreased in 2008 due to lower revenue and unit volumes. Included in gross margin in 2007 was a purchase accounting charge related to the System General acquisition of $3.7 million. The charge was an incremental expense for the recognition of the step-up of inventory to fair market value at the acquisition date (see Item 8, Note 17 for further information).
PCIA had operating income of $107.6 million in 2008, as compared to $124.8 million in 2007. The decrease in operating income was due to reduced gross profit, slightly offset by reduced net operating expenses. SG&A decreased due to cost reduction initiatives, continued cost discipline and reduced variable compensation. R&D increased due to new product development as well as the result of a full first quarter of expense related to the acquisition of System General in 2008 as compared to a partial quarter of expense in the first quarter of 2007. Amortization of acquisition-related intangibles decreased due to certain intangibles becoming fully amortized; this was offset slightly by an increase due to a full first quarter of expense related to the System General acquisition as compared to a partial quarter of expense in the first quarter of 2007.
SDT. SDT revenues decreased approximately 10% in 2008 as compared to 2007. The overall decrease in revenue was primarily driven by decreases in unit volumes driven by weak demand and price competition. Generally, we anticipate that SDT as a percentage of total revenue will continue to decrease, as we expect to experience faster growth in our MCCC and PCIA segments. While we anticipate revenue will continue to decline as a percentage of our total revenue, our strategy is to manage SDT selectively by focusing more on penetrating higher value growth areas, while maintaining or increasing our margins in this business. The decrease in gross margins is due to lower revenues as the result of lower unit volumes and lower factory utilization.
SDT had operating income of $9.4 million in 2008, compared to $15.5 million in 2007. The decrease in operating income was mainly due to reduced gross profit as well as higher R&D spending. R&D increased due to investments in manufacturing cost reduction programs and new product introductions. The decrease in amortization of acquisition-related intangibles was due to certain intangibles becoming fully amortized.
Liquidity and Capital Resources
Our main sources of liquidity are our cash flows from operations, cash and cash equivalents and revolving credit facility.
Our senior credit facility consists of a $472.2 million term loan facility and a $100.0 million revolving line of credit (Revolving Credit Facility). The senior credit facility imposes various restrictions upon us that could limit our ability to respond to market conditions, to provide for unanticipated capital investments or to take advantage of business opportunities. It also includes restrictive covenants that limit our ability to consolidate, merge or enter into acquisitions, create liens, pay dividends or make similar restricted payments, sell assets, invest in capital expenditures and incur indebtedness. The senior credit facility also limits our ability to modify
44
Table of Contents
our certificate of incorporation and bylaws, or enter into shareholder agreements, voting trusts or similar arrangements. In addition, the affirmative covenants in the senior credit facility also require our financial performance to comply with certain financial measures, as defined by the credit agreement. These financial covenants require us to maintain a minimum interest coverage ratio of 2.5 to 1.0, a maximum net leverage ratio of 4.0 to 1.0 and to maintain four quarter trailing EBITDA (earnings before interest, taxes, depreciation and amortization) less capital expenditures of at least $30.0 million. It defines the interest coverage ratio as the ratio of annualized interest expense to the cumulative four quarter trailing EBITDA and defines the maximum net leverage ratio as the ratio of debt, less up to $100 million (to the extent our unrestricted cash on hand exceeds $200 million), to the cumulative four quarter trailing EBITDA. EBITDA, as defined by the senior credit facility excludes restructuring, non-cash equity compensation and other adjustments as defined by the credit agreement.
At December 27, 2009, we were in compliance with these covenants. Based on our current models, we expect to remain in compliance with our senior credit facility covenants. This expectation is subject to various risks and uncertainties discussed more thoroughly in Item 1A, and include, among others, the risk that our assumptions and expectations about business conditions, expenses and cash flows for the remainder of the year may be inaccurate.
The variable interest rate on the term loan and Revolving Credit Facility is at LIBOR (London Interbank Offered Rate) plus 1.50%. Both the term loan and Revolving Credit Facility have a step down feature based on senior leverage ratios. The $150 million incremental term loan feature has an interest rate of LIBOR plus 2.50%.
While our senior credit facility places restrictions on the payment of dividends, it does not restrict the subsidiaries of Fairchild Semiconductor Corporation, except to a limited extent, from paying dividends or making advances to Fairchild Semiconductor Corporation. As a result, we believe that funds generated from operations, together with existing cash and funds from our senior credit facility will be sufficient to meet our debt obligations, operating requirements, capital expenditures and research and development funding needs over the next twelve months. In 2009, we incurred capital expenditures of $59.8 million.
Under our senior credit facility, we have revolving borrowing capacity of $100.0 million for working capital and general corporate purposes, including acquisitions. At December 27, 2009, the revolver was undrawn and, after adjusting for outstanding letters of credit, we had $98.0 million available under the revolving credit facility. We had additional outstanding letters of credit of $1.1 million that do not fall under the senior credit facility. We also had $6.6 million of undrawn credit facilities at certain of our foreign subsidiaries. These outstanding amounts do not impact available borrowings under the senior credit facility.
We frequently evaluate opportunities to sell additional equity or debt securities, obtain credit facilities from lenders or restructure our long-term debt to further strengthen our financial position. During the second quarter of 2009, we amended (the “Amendment”) our senior credit facility to enable us to voluntarily prepay and retire a portion of our term loan facility to take advantage of potentially favorable conditions in the credit markets that may occur from time to time. The Amendment permits us to prepay up to $100 million (net of interest and fees) of term loans for a 12 month period following the effective date of the Amendment subject to certain minimum liquidity and customary financial conditions. During the second quarter of 2009, pursuant to the terms of the Amendment, we completed a tender offer to buyback a portion of our term loan below par. As a result of this debt buyback we reduced our debt by $14.7 million, paying $13.8 million in cash and recognizing a $0.8 million gain, net of fees on the transaction. Additionally during the fourth quarter 2009, we completed three additional tender offers, as allowed under the previously executed amendment. As a result of this additional debt buyback, we further reduced debt by $23.7 million, paying $22.1 million in cash and recognizing a $1.2 million gain, net of the write-off of associated deferred financing fees and other fees on the transaction. As of December 27, 2009, Standard and Poor’s rates our corporate unsecured debt at BB-. The sale of additional equity securities could result in additional dilution to our stockholders. Additional borrowing or equity investment may be required to fund future acquisitions.
45
Table of Contents
On October 31, 2001, we issued $200 million aggregate principal amount of 5.0% Convertible Senior Subordinated Notes (Notes) due November 1, 2008. Interest on the Notes was paid semi-annually on May 1 and November 1 of each year. On May 16, 2008 we initiated the call of our Notes. The redemption amount was paid on June 9, 2008 using proceeds from the incremental term loan and cash on hand.
As of December 27, 2009, we had $10.4 million of unrecognized tax benefits recorded in non-current deferred income taxes, compared to approximately $9.7 million at December 28, 2008. The timing of the expected cash outflow relating to the balance is not reliably determinable at this time.
As of December 27, 2009, our cash, cash equivalents and short-term and long-term securities were $451.7 million, an increase of $64.8 million from December 28, 2008. Included in long-term securities as of December 27, 2009 and December 28, 2008 are $33.4 million and $32.3 million of auction rate securities, respectively. The auction rate security market has failed and is currently inactive. However, the company continues to accrue and receive interest on these securities based on a contractual rate.
During 2009, our cash provided by operating activities was $188.4 million compared to $185.4 million in 2008. The following table presents a summary of net cash provided by operating activities during 2009 and 2008, respectively.
| Year Ended | ||||||||
| December 27, 2009 |
December 28, 2008 |
|||||||
| (In millions) | ||||||||
| Net income (loss) |
$ | (60.2 | ) | $ | (167.4 | ) | ||
| Depreciation and amortization |
160.4 | 136.6 | ||||||
| Non-cash stock-based compensation |
17.5 | 19.1 | ||||||
| Non-cash impariment of investments |
— | 19.0 | ||||||
| Non-cash goodwill impairment |
— | 203.3 | ||||||
| Deferred income taxes, net |
(8.6 | ) | (11.2 | ) | ||||
| Other, net |
3.4 | 14.5 | ||||||
| Change in other working capital accounts |
75.9 | (28.5 | ) | |||||
| Net cash provided by operating activities |
$ | 188.4 | $ | 185.4 | ||||
Cash provided by operating activities in 2009 was flat when compared to 2008, increasing $3.0 million from 185.4 in 2008. Decreases in net income, net of goodwill impairment in 2008, was offset by increased depreciation and amortization expenses and favorable changes in our working capital accounts.
Cash used in investing activities during 2009 totaled $62.6 million compared to $172.4 million in 2008. The decrease in the use of cash is primarily the result of lower capital expenditures in 2009. Our capital expenditures during 2009 were $59.8 million compared to $168.7 million in 2008.
Cash used in financing activities totaled $61.5 million in 2009 as compared to $70.5 million in 2008. The decrease in the use of cash was primarily due to the use of $21.7 million of cash to purchase treasury stock in 2008 offset by $9.0 million in proceeds received from the exercise of stock options in 2008. In 2009, no treasury stock was purchased and the proceeds from the exercise of stock options was immaterial.
46
Table of Contents
The table below summarizes our significant contractual obligations as of December 27, 2009 and the effect such obligations are expected to have on our liquidity and cash flows in future periods.
| Contractual Obligations (1) |
Total | Less than 1 year |
1-3 years |
4-5 years |
After 5 years | ||||||||||
| (In millions) | |||||||||||||||
| Debt Obligations (2) |
$ | 472.2 | $ | 5.3 | $ | 10.6 | $ | 456.3 | |||||||
| Operating Lease Obligations (3) |
31.6 | 11.8 | 12.6 | 4.4 | 2.8 | ||||||||||
| Letters of Credit |
3.1 | 3.1 | |||||||||||||
| Capital Purchase Obligations (4) |
24.4 | 24.4 | |||||||||||||
| Other Purchase Obligations and Commitments (5) |
31.4 | 27.8 | 2.3 | 1.1 | 0.2 | ||||||||||
| Royalty Obligations |
6.0 | 0.8 | 1.5 | 1.5 | 2.2 | ||||||||||
| Executive Compensation Agreements |
2.6 | 0.1 | 0.2 | 0.2 | 2.1 | ||||||||||
| Total (6) |
$ | 571.3 | $ | 73.3 | $ | 27.2 | $ | 463.5 | $ | 7.3 | |||||
| (1) | In addition to the above, we have an obligation under Korean law to pay lump-sum payments to employees upon termination of their employment (see Item 8, Note 9 for further detail). This retirement liability was $13.8 million as of December 27, 2009. |
| (2) | We also have obligations for variable interest payments in conjunction with the senior credit facility (see Item 8, Note 6 for additional information). |
| (3) | Represents future minimum lease payments under noncancelable operating leases. |
| (4) | Capital purchase obligations represent commitments for purchase of plant and equipment. They are not recorded as liabilities on our balance sheet as of December 27, 2009, as we have not yet received the related goods or taken title to the property. |
| (5) | For the purposes of this table, contractual obligations for purchase of goods or services are defined as agreements that are enforceable and legally binding and that specify all significant terms, including: fixed or minimum quantities to be purchased; fixed, minimum or variable price provisions; and the approximate timing of the transaction. Our purchase orders are based on our current manufacturing needs and are fulfilled by our vendors within short time horizons. |
| (6) | We had $10.4 million of unrecognized tax benefits at December 27, 2009. The timing of the expected cash outflow relating to the remaining balance is not reliably determinable at this time. In addition, the total does not include contractual obligations recorded on the balance sheet as current liabilities other than debt obligations, or certain purchase obligations as discussed below. |
It is customary practice in the semiconductor industry to enter into guaranteed purchase commitments or “take or pay” arrangements for purchases of certain equipment and raw materials. Obligations under these arrangements are included in (5) above.
We also enter into contracts for outsourced services; however, the obligations under these contracts were not significant at December 27, 2009 and the contracts generally contain clauses allowing for cancellation without significant penalty.
The expected timing of payment of the obligations discussed above is estimated based on current information. Timing of payments and actual amounts paid may be different depending on the time of receipt of goods or services or changes to agreed-upon amounts for some obligations.
Liquidity and Capital Resources of Fairchild International, Excluding Subsidiaries
Fairchild Semiconductor International, Inc. is a holding company, the principal asset of which is the stock of its sole subsidiary, Fairchild Semiconductor Corporation. Fairchild Semiconductor International, Inc. on a stand-alone basis had no cash flow from operations and has no cash requirements for the next twelve months.
47
Table of Contents
Critical Accounting Policies and Estimates
The discussion and analysis of our financial condition and results of operations are based upon our consolidated financial statements, which have been prepared in accordance with accounting principles generally accepted in the U.S. The preparation of these financial statements requires us to make estimates and judgments that affect the reported amounts of assets, liabilities, revenues and expenses, and related disclosure of contingent assets and liabilities. The U.S. Securities and Exchange Commission has defined critical accounting policies as those that are both most important to the portrayal of our financial condition and results and which require our most difficult, complex or subjective judgments or estimates. Based on this definition, we believe our critical accounting policies include the policies of revenue recognition, sales reserves, inventory valuation, fair value of financial instruments, impairment of long-lived assets, income taxes and loss contingencies. For all financial statement periods presented, there have been no material modifications to the application of these critical accounting policies.
On an ongoing basis, we evaluate the judgments and estimates underlying all of our accounting policies, including those related to revenue recognition, sales reserves, inventory valuation, impairment of long-lived assets, income taxes and loss contingencies. These estimates and the underlying assumptions affect the amounts of assets and liabilities reported, disclosures, and reported amounts of revenues and expenses. These estimates and assumptions are based on our best estimates and judgment. We evaluate our estimates and assumptions using historical experience and other factors, including the current economic environment, which we believe to be reasonable under the circumstances. We adjust such estimates and assumptions when facts and circumstances dictate. Illiquid credit markets, volatile equity, foreign currency, and energy markets, and declines in consumer spending have combined to increase the uncertainty inherent in such estimates and assumptions. As future events and their effects cannot be determined with precision, actual results could differ significantly from these estimates. Changes in those estimates resulting from continuing changes in the economic environment will be reflected in the financial statements in future periods.
Revenue Recognition and Sales Reserves. No revenue is recognized unless there is persuasive evidence of an arrangement, the price to the buyer is fixed or determinable, delivery has occurred and collectibility of the sales price is reasonably assured. Revenue from the sale of semiconductor products is recognized when title and risk of loss transfers to the customer, which is generally when the product is received by the customer. In some cases, title and risk of loss do not pass to the customer when the product is received by them. In these cases, we recognize revenue at the time when title and risk of loss is transferred, assuming all other revenue recognition criteria have been satisfied. These cases include several inventory locations where we manage consigned inventory for our customers, some of which is at customer facilities. In such cases, revenue is not recognized when products are received at these locations; rather, revenue is recognized when customers take the inventory from the location for their use. Shipping costs billed to our customers are included within revenue with associated costs classified in cost of goods sold.
Approximately 64% of our revenue is generated through sales to distributors. Distributor payments are due under agreed terms and are not contingent upon resale or any other matter other than the passage of time. We have agreements with some distributors and customers for various programs, including prompt payment discounts, pricing protection, scrap allowances and stock rotation. Sales to these distributors and customers, as well as the existence of sales incentive programs, are in accordance with terms set forth in written agreements with these distributors and customers. In general, credits allowed under these programs are capped based upon individual distributor agreements. We record charges associated with these programs as a reduction of revenue based upon historical activity and our expectation of future activity. We also have volume based incentives with certain distributors to encourage stronger resales of our products. Reserves are recorded as a reduction to revenue as they are earned by the distributor. Our policy is to use both a three to six month rolling historical experience rate as well as a prospective view of products in the distributor channel for distributors who participate in an incentive program in order to estimate the necessary allowance to be recorded. In addition, the products sold by us are subject to a limited product quality warranty. We accrue for estimated incurred but unidentified quality issues based upon historical activity and known quality issues if a loss is probable and can be reasonably
48
Table of Contents
estimated. The standard limited warranty period is one year. Quality returns are accounted for as a reduction of revenue. Historically, we have not experienced material differences between our estimated sales reserves and actual results.
Inventory Valuation. In determining the net realizable value of our inventories, we review the valuations of inventory considered excessively old, and therefore subject to, obsolescence and inventory in excess of customer backlog and historical rate of demand. We also value inventory at the lower of cost or market. Once established, write-downs of inventory are considered permanent adjustments to the cost basis of inventory.
Fair Value of Financial Instruments. Securities and derivatives are financial instruments that are recorded at fair value on a recurring basis. The Fair Value Measurements and Disclosures Topic of the FASB ASC, defines fair value as the exchange price that would be received for an asset or paid to transfer a liability in the principal or most advantageous market in an orderly transaction between market participants at the measurement date. On January 1, 2008, we partially adopted the fair value measurements and disclosures provisions. We deferred adoption of the fair value measurements and disclosure provisions for nonfinancial assets and liabilities including intangible assets, reporting units measured at fair value in the first step of a goodwill impairment test, and asset retirement obligations. We fully adopted the fair value measurements and disclosure provisions for nonfinancial assets and liabilities on the first day of fiscal year 2009.
In accordance with the requirements of the Fair Value Measurements and Disclosures Topic of the FASB ASC, we group our financial assets and liabilities measured at fair value on a recurring basis in three levels, based on the markets in which the assets and liabilities are traded and the reliability of the assumptions used to determine fair value. These levels are:
| • | Level 1—Valuation is based upon quoted market price for identical instruments traded in active markets. |
| • | Level 2—Valuation is based on quoted market prices for similar instruments in active markets, quoted prices for identical or similar instruments in markets that are not active, and model-based valuation techniques for which all significant assumptions are observable in the market. |
| • | Level 3—Valuation is generated from model-based techniques that use significant assumptions not observable in the market. Valuation techniques include use of discounted cash flow models and similar techniques. |
It is our policy to maximize the use of observable inputs and minimize the use of unobservable inputs when developing fair value measurements. When available, we use quoted market prices to measure fair value. If market prices are not available, fair value measurements are based on models that use primarily market based parameters including interest rate yield curves, option volatilities, and currency rates. In certain cases where market rate assumptions are not available, we are required to make judgments about assumptions market participants would use to estimate the fair value of a financial instrument. The only financial instruments we hold which are not classified as either Level 1 or Level 2 are auction rate securities. There has been insufficient demand for these types of investments and as a result the investments are not currently liquid. Since observable market prices and parameters are not currently available, judgment is necessary to estimate fair value. Changes in the underlying assumptions used, including discount rates and estimates of future cash flows could significantly affect the results of current or future values. For the years ended December 27, 2009 and December 28, 2008 we performed a discounted cash flow (DCF) calculation to determine the estimated fair value of the auction rate securities. The assumptions used in preparing the DCF model included estimates for the amount and timing of future interest and principal payments and the rate of return required by investors to own these securities in the current environment. In making these assumptions, relevant factors that were considered included: the formula applicable to each security which defines the interest rate paid to investors in the event of a failed auction; forward projections of the interest rate benchmarks specified in such formulas; the likely timing of principal repayments; the probability of full repayment considering guarantees by third parties and additional credit enhancements provided through other means. The estimate of the rate of return required by investors to own
49
Table of Contents
these securities also considers the current reduced liquidity for auction rate securities. The inputs for our DCF were based upon input from third parties as well as our own estimates. The primary unobservable input to the valuation was the maturity assumption which ranged from six to twelve years depending on the individual auction rate security. The maturity assumptions were based on the terms of the underlying instrument and the potential for restructuring the auction rate security. The results of these fair value calculations are imprecise and may not be realized in an actual sale. Changes in market conditions may also reduce the availability of other quoted prices or observable data. If this were to occur, we would need to use valuation techniques requiring more judgment to estimate the appropriate fair value measurement.
At December 27, 2009 approximately 2% of total assets, or $37.3 million, consisted of financial instruments recorded at fair value on a recurring basis. Approximately 90% of these assets were classified as Level 3 assets. All Level 3 assets consist of auction rate securities. Approximately, 0.3% of total liabilities or $2.0 million consisted of financial liabilities recorded at fair value.
In the valuation of our derivative instruments, we consider our credit risk and the credit risk of our counterparties. Based on our current credit standing and the credit standing of our counterparties credit risk has not had a material impact in the valuation of our derivatives.
See Item 8, Notes 3 and 15 for a complete discussion on our use of fair valuation of financial instruments, our related measurement techniques, and its impact to our financial statements.
Impairment of Long-Lived Assets. We assess the impairment of long-lived assets, including goodwill, on an ongoing basis and whenever events or changes in circumstances indicate that the carrying value may not be recoverable.
Goodwill is subject to an annual impairment test, or more frequently, if indicators of potential impairment arise. Goodwill was reviewed for impairment in the first quarter of 2009 as a result of the segment change. There was no impairment noted. Our annual impairment review is based on a combination of the income approach, which estimates the fair value of our reporting units based on a discounted cash flow approach, and the market approach which estimates the fair value of our reporting units based on comparable market multiples. The comparable companies utilized in our evaluation are primarily the major competitors listed in Item 1 of this report. As part of the market multiple analysis, a control premium is also factored in. The control premiums utilized in 2009 and 2008 ranged from 35% to 45% based on the reporting unit. The discount rates utilized in the 2009 and 2008 discounted cash flows ranged from approximately 12% to 15%, reflecting market based estimates of capital costs and discount rates adjusted for a market participants view with respect to execution, concentration, and other risks associated with the projected cash flows of the individual segments. The average fair value is reconciled to our market capitalization at the end of each year with an appropriate control premium.
The determination of the fair value of the reporting units requires us to make significant estimates and assumptions. These estimates and assumptions primarily include but are not limited to; the selection of appropriate peer group companies, control premiums appropriate for acquisitions in the industries in which we compete, the discount rate, terminal growth rates, forecasts of revenue and expense growth rates, changes in working capital, depreciation and amortization, and capital expenditures. Due to the inherent uncertainty involved in making these estimates, actual financial results could differ from those estimates. Changes in assumptions concerning future financial results or other underlying assumptions would have a significant impact on either the fair value of the reporting unit or the amount of the goodwill impairment charge. We use judgment in assessing whether assets may have become impaired between annual impairment tests. Indicators such as unexpected adverse business conditions, economic factors, unanticipated technological change or competitive activities, loss of key personnel and acts by governments and courts, may signal that an asset has become impaired.
50
Table of Contents
In 2009, there was no goodwill impairment and the fair values of the reporting units were substantially in excess of book values. In 2008, after completing step one of the impairment test, we determined that the estimated fair value of our PCIA and SPG reporting units was less than the carrying value of those reporting units. The fair value of MCCC exceeded the book value by 14% so step two was not necessary. The fair value for PCIA was 63% less than the carrying value. The fair value for SPG was 66% less than the carrying value. This required us to complete the second step of the impairment test for both of these reporting units. To measure the amount of impairment, we determined the implied fair value of goodwill in the same manner as if we had acquired those reporting units. Specifically, we must allocate the fair value of the reporting unit to all of the assets of that unit, including unrecognized intangible assets, in a hypothetical calculation that would yield the implied fair value of goodwill. The impairment loss is measured as the difference between the book value of the goodwill and the implied fair value of the goodwill computed in step two. Upon completion of step two of the analysis, we wrote off the entire goodwill balance for PCIA and SPG. This resulted in an impairment loss of $203.3 million as of December 28, 2008. See Item 8, Note 5 for more details on goodwill.
For all other long-lived assets, our impairment review process is based upon an estimate of future undiscounted cash flows. Factors we consider that could trigger an impairment review include the following:
| • | significant underperformance relative to expected historical or projected future operating results, |
| • | significant changes in the manner of our use of the acquired assets or the strategy for our overall business, |
| • | significant negative industry or economic trends, and |
| • | significant technological changes, which would render equipment and manufacturing processes obsolete. |
Recoverability of assets that will continue to be used in our operations is measured by comparing the carrying value to the future net undiscounted cash flows expected to be generated by the asset or asset group. Future undiscounted cash flows include estimates of future revenues, driven by market growth rates, and estimated future costs. There were no trigger events in 2009 that caused us to evaluate our other long lived assets for impairment.
Income Taxes. Income taxes are accounted for under the asset and liability method. Under this method, deferred tax assets and liabilities are recognized for the future tax consequences attributable to differences between the financial statement carrying amounts of existing assets and liabilities and their respective tax bases. Deferred tax assets and liabilities are measured using enacted tax rates expected to apply to taxable income in the years in which those temporary differences are expected to be recovered or settled. The effect on deferred tax assets and liabilities of a change in tax rates is recognized in income in the period that includes the enactment date. Deferred taxes are not provided for the undistributed earnings of our foreign subsidiaries that are considered to be indefinitely reinvested outside of the U.S. We plan to repatriate certain non-U.S. earnings which have been taxed in the U.S. but earned offshore as well as any non-U.S. earnings that are not considered to be indefinitely invested outside the U.S.
We make judgments regarding the realizability of our deferred tax assets. In accordance with the Income Tax topic of the ASC, the carrying value of the net deferred tax assets is based on the belief that it is more likely than not that we will generate sufficient future taxable income in certain jurisdictions to realize these deferred tax assets after consideration of all available positive and negative evidence. Future realization of the tax benefit of existing deductible temporary differences or carryforwards ultimately depends on the existence of sufficient taxable income of the appropriate character within the carryback and carryforward period available under the tax law. Future reversals of existing taxable temporary differences, projections of future taxable income excluding reversing temporary differences and carryforwards, taxable income in prior carryback years, and prudent and feasible tax planning strategies that would, if necessary, be implemented to preserve the deferred tax asset may be considered to identify possible sources of taxable income.
51
Table of Contents
Valuation allowances have been established for U.S. deferred tax assets, which we believe do not meet the “more likely than not” criteria established by the Income Tax topic of the ASC. In 2005, we established a full valuation allowance against our net U.S. deferred tax assets excluding certain deferred tax liabilities related to indefinite-lived goodwill. We recorded a valuation allowance in 2005 and continue to carry the valuation allowance in 2009 as our trend of positive evidence does not currently support such a release. In 2008, a deferred tax asset and full valuation allowance was recorded in the amount of $24.8 million relating to our Malaysian cumulative reinvestment allowance and manufacturing incentives. In 2009, the deferred tax asset increased to $27.9 million. Based on an update of the jurisdictional financial history and current forecast in 2009, it is management’s belief that we did meet the standard of “more likely than not” that is required for measuring the likelihood of a realization of net deferred tax assets which was reflected in a partial release of the valuation allowance in the amount of $1.6 million. The 2009 ending valuation allowance was $26.3 million. We will continue to evaluate book and taxable income trends, and their impact on the amount and timing of valuation allowance adjustments.
If we are able to utilize all or a portion of the deferred tax assets for which a valuation allowance has been established, the related portion of the valuation allowance is released to income from continuing operations, additional paid-in capital or to other comprehensive income.
The calculation of our tax liabilities includes addressing uncertainties in the application of complex tax regulations in a multitude of jurisdictions. The Income Tax topic of the ASC clarifies the accounting for uncertainty in income taxes recognized in an enterprise’s financial statements. The topic prescribes a recognition threshold and measurement attribute for the financial statement recognition and measurement of a tax position taken or expected to be taken in a tax return.
We recognize liabilities for anticipated tax audit issues in the U.S. and other tax jurisdictions based on our recognition threshold and measurement attribute of whether it is more likely than not that the positions we have taken in tax filings will be sustained upon tax audit, and the extent to which, additional taxes would be due. If payment of these amounts ultimately proves to be unnecessary, the reversal of the liabilities would result in tax benefits being recognized in the period in which it is determined the liabilities are no longer necessary. If the estimate of tax liabilities proves to be less than the ultimate assessment, a further charge to expense would result.
Loss Contingencies. The outcomes of legal proceedings and claims brought against us are subject to significant uncertainty. The Contingency topic of the ASC requires that an estimated loss from a loss contingency such as a legal proceeding or claim should be accrued by a charge to income if it is probable that an asset has been impaired or a liability has been incurred and the amount of the loss can be reasonably estimated. Disclosure of a contingency is required if there is at least a reasonable possibility that a loss has been incurred. In determining whether a loss should be accrued we evaluate, among other factors, the degree of probability of an unfavorable outcome and the ability to make a reasonable estimate of the amount of loss. We regularly evaluate current information available to us to determine whether such accruals should be adjusted. Changes in our evaluation could materially impact our financial position or our results of operations.
Forward Looking Statements
This annual report, including but not limited to the section entitled “Status of First Quarter Business”, contains “forward-looking statements” as that term is defined in Section 21E of the Securities Exchange Act of 1934. Forward-looking statements can be identified by the use of forward-looking terminology such as “we believe,” “we expect,” “we intend,” “may,” “will,” “should,” “seeks,” “approximately,” “plans,” “estimates,” “anticipates,” or “hopeful,” or the negative of those terms or other comparable terms, or by discussions of our strategy, plans or future performance. For Example, the Outlook section below contains numerous forward-looking statements. All forward-looking statements in this report are made based on management’s current expectations and estimates, which involve risks and uncertainties, including those described below and more specifically in the Risk Factors section. Among these factors are the following: current economic uncertainty,
52
Table of Contents
including disruptions in the credit markets, as well as future economic conditions; changes in demand for our products; changes in inventories at our customers and distributors; changes in regional or global economic or political conditions (including as a result of terrorist attacks and responses to them); technological and product development risks, including the risks of failing to maintain the right to use some technologies or failing to adequately protect our own intellectual property against misappropriation or infringement; availability of manufacturing capacity; the risk of production delays; the inability to attract and retain key management and other employees; risks related to warranty and product liability claims; risks inherent in doing business internationally; changes in tax regulations or the migration of profits from low tax jurisdictions to higher tax jurisdictions; availability and cost of raw materials; competitors’ actions; loss of key customers, including but not limited to distributors; order cancellations or reduced bookings; changes in manufacturing yields or output; and significant litigation. Factors that may affect our operating results are described in the Risk Factors section in the quarterly and annual reports we file with the Securities and Exchange Commission. Such risks and uncertainties could cause actual results to be materially different from those in the forward-looking statements. Readers are cautioned not to place undue reliance on the forward-looking statements.
New Policy on Business Outlook Disclosure
We changed our policy on business outlook disclosure effective January 29, 2009 until further notice. Financial information relating to any current quarter should be considered to be speaking as of the date of the press release or other announcement only. Following the date of the press release or other announcement, the information should be considered to be historical and not subject to update. We undertake no obligation to update any such information, although we may choose to do so by press release, SEC filing or other public announcement. Consistent with this policy change, Fairchild Semiconductor representatives will no longer comment about the business outlook of our financial results or expectations for the quarter in question.
Status of First Quarter Business
Our scheduled backlog for first quarter shipments as of January 21, 2010 was approximately $369 million which is roughly $33 million higher than this point a quarter ago. Included in this amount is approximately $20 million of backlog that we booked in the first three and a half weeks of the first quarter. We expect that both distributor sell through and OEM demand will continue to track above seasonal levels in Q1. Given the solid order rates this quarter and our starting backlog position, we expect first quarter sales to be roughly $370 million while further improvements in product mix help drive adjusted gross margin to a range of 31 to 32%. We expect R&D and SG&A spending to be approximately $78 million in Q1. Interest expense for the first quarter is expected to be roughly $3 million while our adjusted tax rate should be in the range of 15 to 20%. We remain disciplined in our capital investment plans with spending forecast to be between 6 to 7% of sales in 2010. We anticipate recording approximately $2 million in charges and $2 million of accelerated depreciation in the first quarter associated with previously announced fab closure actions.
Recently Issued Financial Accounting Standards
On January 1, 2008, we partially adopted FASB Statement of Financial Accounting Standards (SFAS) 157, Fair Value Measurements. In accordance with FASB Staff Position (FSP) 157-2, Effective Date of FASB Statement 157, we deferred the adoption of SFAS 157 for nonfinancial assets and liabilities including intangible assets, reporting units measured at fair value in the first step of a goodwill impairment test, and asset retirement obligations. We fully adopted SFAS 157 on the first day of fiscal year 2009. The adoption of this standard did not have an impact on our consolidated financial position and results of operations.
In April 2009, the FASB issued three related Staff Positions; FSP 157-4, Determining Fair Value When the Volume and Level of Activity for the Asset or Liability Have Significantly Decreased and Identifying Transactions that Are Not Orderly, FSP SFAS 115-2 and SFAS 124-2, Recognition and Presentation of Other-Than-Temporary Impairments and FSP SFAS 107-1 and APB 28-1, Interim Disclosures About Fair Value of
53
Table of Contents
Financial Instruments. These staff positions clarify the guidance in SFAS 157 for fair value measurements in inactive markets, modify the recognition and measurement of other-than-temporary impairments of debt securities and require the disclosure of the fair values of financial instruments in interim periods. These staff positions were adopted for the second quarter ending June 28, 2009.
In May 2009, the FASB issued SFAS 165, Subsequent Events. The objective of this standard is to establish general standards of accounting for and disclosure of events that occur after the balance sheet date but before the financial statements are issued or available to be issued. This statement is effective for interim or annual financial periods ending after June 15, 2009. The adoption of SFAS 165 did not have an impact on our consolidated financial position and results of operations.
In June 2009, the FASB issued SFAS 166, Accounting for Transfers of Financial Assets – An Amendment of FASB Statement 140. The SFAS amends SFAS 140, Accounting for Transfers and Servicing of Financial Assets and Extinguishments of Liabilities, to eliminate the concept of a qualified special-purpose entity and related guidance, creates more stringent conditions for reporting a transfer of a portion of a financial asset as a sale, clarifies other sale-accounting criteria, and changes the initial measurement of a transferor’s interest in transferred financial assets. This statement is effective as of the beginning of the first annual reporting period that begins after November 15, 2009. The adoption of SFAS 166 is not expected to have a material effect on our consolidated financial position and results of operations.
In June 2009, the FASB issued SFAS 167, Amendments to FASB Interpretation 46(R). The SFAS amends FIN46(R), Consolidation of Variable Interest Entities, to require former qualified special-purpose entities to be evaluated for consolidation and also changes the approach to determining a variable interest entity’s (VIE) primary beneficiary and requires companies to more frequently reassess whether they must consolidate VIEs. This statement is effective as of the beginning of the first annual reporting period that begins after November 15, 2009. The adoption of SFAS 167 is not expected to have a material effect on our consolidated financial position and results of operations.
In September 2009, the FASB issued Accounting Standards Update No. 2009-05 (ASU 2009-05), Measuring Liabilities at Fair Value. This ASU amends ASC 820, Fair Value Measurements and Disclosures Topic to provide further guidance on how to measure the fair value of a liability. This statement is effective as of the beginning of the first reporting period beginning after issuance. The adoption of ASU 2009-05 is not expected to have a material effect on our consolidated financial position and results of operations.
| ITEM 7A. | QUANTITATIVE AND QUALITATIVE DISCLOSURES ABOUT MARKET RISK |
We are exposed to financial market risks, including changes in interest rates and foreign currency exchange rates. To mitigate these risks, we utilize derivative financial instruments. We do not use derivative financial instruments for speculative or trading purposes. All of the potential changes noted below are based on sensitivity analyses performed on our financial position at December 27, 2009. Actual results may differ materially.
We use currency forward and combination option contracts to hedge a portion of our forecasted foreign exchange denominated revenues and expenses. Gains and losses on these foreign currency exposures would generally be offset by corresponding losses and gains on the related hedging instruments, resulting in negligible net exposure to us. A majority of our revenue, expense and capital purchasing activities are transacted in U.S. dollars. However, we do conduct these activities by way of transactions denominated in other currencies, primarily the Korean won, Malaysian ringgit, Philippine peso, Chinese yuan, Japanese yen, Taiwanese dollar, British pound and the Euro. To protect against reductions in value and the volatility of future cash flows caused by changes in foreign exchange rates, we have established hedging programs. We utilize currency option contracts and forward contracts in these hedging programs. Our hedging programs reduce, but do not always entirely eliminate, the short-term impact of foreign currency exchange rate movements. For example, during the twelve months ended December 27, 2009, an adverse change (defined as a 20% unfavorable move in every
54
Table of Contents
currency where we have exposure) in the exchange rates of all currencies over the course of the year would have resulted in an adverse impact on income before taxes of approximately $11.5 million.
We have interest rate exposure with respect to the senior credit facility due to the variable LIBOR pricing for both the term loan and the Revolving Credit Facility. We entered into an interest rate swap to reduce our variable interest rate exposure on $150 million of the outstanding term loan. For example, a 50 basis point increase in interest rates would result in increased annual interest expense of $0.5 million for the Revolving Credit Facility, assuming all borrowing capability was utilized. For the year ended 2009, a 50 basis point increase in interest rates would result in increased annual interest expense of $1.6 million for the remaining balance of the $322.2 million term loan, excluding $150 million fixed with an interest rate swap. Going forward after the interest rate swap’s maturity on December 31, 2009, a 50 basis point increase in interest rates would result in increased annual interest expense of $2.4 million. The increased annual interest expense due to a 50 basis point increase in LIBOR rates would be offset by an increase in interest income of $2.3 million on the cash and investment balances at 2009 year-end. At December 27, 2009, the revolver was undrawn and after adjusting for outstanding letters of credit we had up to $98.0 million available under this senior credit facility.
55
Table of Contents
| ITEM 8. | CONSOLIDATED FINANCIAL STATEMENTS AND SUPPLEMENTARY DATA |
FAIRCHILD SEMICONDUCTOR INTERNATIONAL, INC. AND SUBSIDIARIES
INDEX TO CONSOLIDATED FINANCIAL STATEMENTS
| Page | ||
| 57 | ||
| 59 | ||
| 60 | ||
| 61 | ||
| 62 | ||
| 63 | ||
| 64 |
56
Table of Contents
REPORT OF INDEPENDENT REGISTERED PUBLIC ACCOUNTING FIRM
The Board of Directors and Stockholders
Fairchild Semiconductor International, Inc.:
We have audited the accompanying consolidated balance sheets of Fairchild Semiconductor International, Inc. and subsidiaries (the Company) as of December 27, 2009 and December 28, 2008, and the related consolidated statements of operations, comprehensive income (loss), cash flows and stockholders’ equity for each of the years in the three-year period ended December 27, 2009. In connection with our audits of the consolidated financial statements, we also have audited the financial statement schedule listed in Item 15(b) of the 2009 Form 10-K. We also have audited Fairchild Semiconductor International, Inc.’s internal control over financial reporting as of December 27, 2009, based on criteria established in Internal Control—Integrated Framework issued by the Committee of Sponsoring Organizations of the Treadway Commission (COSO). Fairchild Semiconductor International, Inc.’s management is responsible for these consolidated financial statements and financial statement schedule, for maintaining effective internal control over financial reporting, and for its assessment of the effectiveness of internal control over financial reporting, included in the accompanying Management Report on Internal Control over Financial Reporting. Our responsibility is to express an opinion on these consolidated financial statements and financial statement schedule, and an opinion on the Company’s internal control over financial reporting based on our audits.
We conducted our audits in accordance with the standards of the Public Company Accounting Oversight Board (United States). Those standards require that we plan and perform the audits to obtain reasonable assurance about whether the financial statements are free of material misstatement and whether effective internal control over financial reporting was maintained in all material respects. Our audits of the consolidated financial statements included examining, on a test basis, evidence supporting the amounts and disclosures in the financial statements, assessing the accounting principles used and significant estimates made by management, and evaluating the overall financial statement presentation. Our audit of internal control over financial reporting included obtaining an understanding of internal control over financial reporting, assessing the risk that a material weakness exists, and testing and evaluating the design and operating effectiveness of internal control based on the assessed risk. Our audits also included performing such other procedures as we considered necessary in the circumstances. We believe that our audits provide a reasonable basis for our opinions.
A company’s internal control over financial reporting is a process designed to provide reasonable assurance regarding the reliability of financial reporting and the preparation of financial statements for external purposes in accordance with generally accepted accounting principles. A company’s internal control over financial reporting includes those policies and procedures that (1) pertain to the maintenance of records that, in reasonable detail, accurately and fairly reflect the transactions and dispositions of the assets of the company; (2) provide reasonable assurance that transactions are recorded as necessary to permit preparation of financial statements in accordance with generally accepted accounting principles, and that receipts and expenditures of the company are being made only in accordance with authorizations of management and directors of the company; and (3) provide reasonable assurance regarding prevention or timely detection of unauthorized acquisition, use, or disposition of the company’s assets that could have a material effect on the financial statements.
Because of its inherent limitations, internal control over financial reporting may not prevent or detect misstatements. Also, projections of any evaluation of effectiveness to future periods are subject to the risk that controls may become inadequate because of changes in conditions, or that the degree of compliance with the policies or procedures may deteriorate.
In our opinion, the consolidated financial statements referred to above present fairly, in all material respects, the financial position of Fairchild Semiconductor International, Inc. and subsidiaries as of December 27, 2009 and December 28, 2008, and the results of their operations and their cash flows for each of the years in the three-year period ended December 27, 2009, in conformity with U.S. generally accepted accounting principles. Also, in
57
Table of Contents
our opinion, the related financial statement schedule, when considered in relation to the basic consolidated financial statements taken as a whole, presents fairly, in all material respects, the information set forth therein. Also in our opinion, Fairchild Semiconductor International, Inc. maintained, in all material respects, effective internal control over financial reporting as of December 27, 2009, based on criteria established in Internal Control—Integrated Framework issued by the Committee of Sponsoring Organizations of the Treadway Commission.
/s/ KPMG LLP
Boston, Massachusetts
February 25, 2010
58
Table of Contents
FAIRCHILD SEMICONDUCTOR INTERNATIONAL, INC. AND SUBSIDIARIES
CONSOLIDATED BALANCE SHEETS
(In millions, except share data)
| December 27, 2009 |
December 28, 2008 |
|||||||
| ASSETS |
||||||||
| Current assets: |
||||||||
| Cash and cash equivalents |
$ | 415.8 | $ | 351.5 | ||||
| Short-term marketable securities |
0.1 | 0.8 | ||||||
| Accounts receivable, net of allowances of $32.8 and $36.1 at December 27, 2009 and December 28, 2008, respectively |
134.0 | 155.6 | ||||||
| Inventories |
189.5 | 231.0 | ||||||
| Deferred income taxes, net of allowances |
13.5 | 11.7 | ||||||
| Other current assets |
28.3 | 28.3 | ||||||
| Total current assets |
781.2 | 778.9 | ||||||
| Property, plant and equipment, net |
653.2 | 731.6 | ||||||
| Deferred income taxes, net of allowances |
12.0 | 7.3 | ||||||
| Intangible assets, net |
81.1 | 102.1 | ||||||
| Goodwill |
161.3 | 161.7 | ||||||
| Long-term securities |
35.8 | 34.6 | ||||||
| Other assets |
37.8 | 33.6 | ||||||
| Total assets |
$ | 1,762.4 | $ | 1,849.8 | ||||
| LIABILITIES, TEMPORARY EQUITY AND STOCKHOLDERS’ EQUITY |
||||||||
| Current liabilities: |
||||||||
| Current portion of long-term debt |
$ | 5.3 | $ | 5.3 | ||||
| Accounts payable |
119.6 | 94.4 | ||||||
| Accrued expenses and other current liabilities |
70.6 | 94.4 | ||||||
| Total current liabilities |
195.5 | 194.1 | ||||||
| Long-term debt, less current portion |
466.9 | 529.9 | ||||||
| Deferred income taxes |
30.9 | 33.0 | ||||||
| Other liabilities |
40.2 | 32.9 | ||||||
| Total liabilities |
733.5 | 789.9 | ||||||
| Commitments and contingencies (Note 14) |
||||||||
| Temporary equity—deferred stock units |
2.3 | 2.8 | ||||||
| Stockholders’ equity: |
||||||||
| Common stock, $.01 par value, voting; 340,000,000 shares authorized; 127,432,252 and 126,686,758 shares issued and 124,044,315 and 123,298,821 shares outstanding at December 27, 2009 and December 28, 2008, respectively |
1.3 | 1.3 | ||||||
| Additional paid-in capital |
1,406.6 | 1,389.0 | ||||||
| Accumulated deficit |
(340.7 | ) | (284.0 | ) | ||||
| Accumulated other comprehensive loss |
(1.9 | ) | (10.5 | ) | ||||
| Less treasury stock (at cost) |
(38.7 | ) | (38.7 | ) | ||||
| Total stockholders’ equity |
1,026.6 | 1,057.1 | ||||||
| Total liabilities, temporary equity and stockholders’ equity |
$ | 1,762.4 | $ | 1,849.8 | ||||
See accompanying notes to consolidated financial statements.
59
Table of Contents
FAIRCHILD SEMICONDUCTOR INTERNATIONAL, INC. AND SUBSIDIARIES
CONSOLIDATED STATEMENTS OF OPERATIONS
(In millions, except per share data)
| Year Ended | |||||||||||
| December 27, | December 28, | December 30, | |||||||||
| 2009 | 2008 | 2007 | |||||||||
| Total revenue |
$ | 1,187.5 | $ | 1,574.2 | $ | 1,670.2 | |||||
| Cost of sales |
897.2 | 1,118.8 | 1,179.7 | ||||||||
| Gross margin |
290.3 | 455.4 | 490.5 | ||||||||
| Operating expenses: |
|||||||||||
| Research and development |
99.7 | 112.9 | 109.8 | ||||||||
| Selling, general and administrative |
179.3 | 217.7 | 230.3 | ||||||||
| Amortization of acquisition-related intangibles |
22.3 | 22.1 | 23.5 | ||||||||
| Restructuring and impairments |
27.9 | 29.2 | 10.8 | ||||||||
| Charge (release) for litigation |
6.0 | (3.3 | ) | 9.5 | |||||||
| Loss on sale of product line, net |
— | — | 0.4 | ||||||||
| Purchased in-process research and development |
— | — | 3.9 | ||||||||
| Goodwill impairment charge |
— | 203.3 | — | ||||||||
| Total operating expenses |
335.2 | 581.9 | 388.2 | ||||||||
| Operating income (loss) |
(44.9 | ) | (126.5 | ) | 102.3 | ||||||
| Impairment of investments |
— | 19.0 | — | ||||||||
| Other expense, net |
18.4 | 23.1 | 20.2 | ||||||||
| Income (loss) before income taxes |
(63.3 | ) | (168.6 | ) | 82.1 | ||||||
| Provision (benefit) for income taxes |
(3.1 | ) | (1.2 | ) | 18.1 | ||||||
| Net income (loss) |
$ | (60.2 | ) | $ | (167.4 | ) | $ | 64.0 | |||
| Net income (loss) per common share: |
|||||||||||
| Basic |
$ | (0.49 | ) | $ | (1.35 | ) | $ | 0.52 | |||
| Diluted |
$ | (0.49 | ) | $ | (1.35 | ) | $ | 0.51 | |||
| Weighted average common shares: |
|||||||||||
| Basic |
123.8 | 124.3 | 124.1 | ||||||||
| Diluted |
123.8 | 124.3 | 126.3 | ||||||||
See accompanying notes to consolidated financial statements.
60
Table of Contents
FAIRCHILD SEMICONDUCTOR INTERNATIONAL, INC. AND SUBSIDIARIES
CONSOLIDATED STATEMENTS OF COMPREHENSIVE INCOME (LOSS)
(In millions)
| Year Ended | ||||||||||||
| December 27, 2009 |
December 28, 2008 |
December 30, 2007 |
||||||||||
| Net income (loss) |
$ | (60.2 | ) | $ | (167.4 | ) | $ | 64.0 | ||||
| Other comprehensive income (loss), net of tax: |
||||||||||||
| Net change associated with hedging transactions |
0.8 | (10.5 | ) | (5.0 | ) | |||||||
| Net amount reclassified to earnings for hedging |
8.7 | 5.2 | 0.5 | |||||||||
| Net change associated with fair value of marketable securities |
0.4 | (13.5 | ) | (2.4 | ) | |||||||
| Net amount reclassified to earnings for marketable securities |
— | 16.2 | — | |||||||||
| Net change associated with pension transactions |
2.2 | 2.1 | (4.1 | ) | ||||||||
| Comprehensive income (loss) |
$ | (48.1 | ) | $ | (167.9 | ) | $ | 53.0 | ||||
See accompanying notes to consolidated financial statements.
61
Table of Contents
FAIRCHILD SEMICONDUCTOR INTERNATIONAL, INC. AND SUBSIDIARIES
CONSOLIDATED STATEMENTS OF CASH FLOWS
(In millions)
| Year Ended | ||||||||||||
| December 27, 2009 |
December 28, 2008 |
December 30, 2007 |
||||||||||
| Cash flows from operating activities: |
||||||||||||
| Net income (loss) |
$ | (60.2 | ) | $ | (167.4 | ) | $ | 64.0 | ||||
| Adjustments to reconcile net income (loss) to cash provided by operating activities: |
||||||||||||
| Depreciation and amortization |
160.4 | 136.6 | 127.0 | |||||||||
| Non-cash stock-based compensation expense |
17.5 | 19.1 | 24.8 | |||||||||
| Non-cash restructuring and impairments expense |
1.6 | 12.2 | 3.1 | |||||||||
| Non-cash write-off of deferred financing fees |
0.3 | 0.4 | — | |||||||||
| Non-cash interest income |
(0.5 | ) | — | — | ||||||||
| Non-cash financing expense |
1.5 | 1.6 | 1.8 | |||||||||
| Non-cash goodwill impairment |
— | 203.3 | — | |||||||||
| Non-cash impairment of investments |
— | 19.0 | — | |||||||||
| Non-cash write-off of equity investment |
2.3 | — | — | |||||||||
| Purchased in-process research and development |
— | — | 3.9 | |||||||||
| Loss on disposal of property, plant and equipment |
0.6 | 0.3 | 1.7 | |||||||||
| Deferred income taxes, net |
(8.6 | ) | (11.2 | ) | (6.1 | ) | ||||||
| Loss on sale of product line |
— | — | 0.4 | |||||||||
| Gain on debt buyback |
(2.2 | ) | — | — | ||||||||
| Gain on sale of equity investment |
(0.2 | ) | — | — | ||||||||
| Changes in operating assets and liabilities, net of effects of acquisitions: |
||||||||||||
| Accounts receivable |
21.6 | 23.4 | (8.5 | ) | ||||||||
| Inventories |
42.2 | 12.4 | 4.0 | |||||||||
| Other current assets |
1.5 | 14.3 | (14.1 | ) | ||||||||
| Accounts payable |
28.2 | (47.8 | ) | 35.9 | ||||||||
| Accrued expenses and other current liabilities |
(17.7 | ) | (22.2 | ) | (70.3 | ) | ||||||
| Other assets and liabilities, net |
0.1 | (8.6 | ) | 23.0 | ||||||||
| Net cash provided by operating activities |
188.4 | 185.4 | 190.6 | |||||||||
| Cash flows from investing activities: |
||||||||||||
| Purchase of marketable securities |
(0.5 | ) | (3.8 | ) | (165.7 | ) | ||||||
| Sale of marketable securities |
0.9 | 5.1 | 172.7 | |||||||||
| Maturity of marketable securities |
0.2 | 0.2 | 0.1 | |||||||||
| Capital expenditures |
(59.8 | ) | (168.7 | ) | (140.4 | ) | ||||||
| Proceeds from sale of property, plant and equipment |
— | 0.5 | 0.5 | |||||||||
| Purchase of molds and tooling |
(1.9 | ) | (5.7 | ) | (1.7 | ) | ||||||
| Acquisitions and divestitures, net of cash acquired |
(1.5 | ) | — | (178.3 | ) | |||||||
| Net cash used in investing activities |
(62.6 | ) | (172.4 | ) | (312.8 | ) | ||||||
| Cash flows from financing activities: |
||||||||||||
| Repayment of long-term debt |
(60.6 | ) | (204.4 | ) | (2.8 | ) | ||||||
| Issuance of long-term debt |
— | 150.0 | — | |||||||||
| Proceeds from issuance of common stock and from exercise of stock options, net |
— | 9.0 | 37.1 | |||||||||
| Purchase of treasury stock |
— | (21.7 | ) | (28.3 | ) | |||||||
| Debt financing/paydown costs |
(0.9 | ) | (3.4 | ) | — | |||||||
| Net cash provided by (used in) financing activities |
(61.5 | ) | (70.5 | ) | 6.0 | |||||||
| Net change in cash and cash equivalents |
64.3 | (57.5 | ) | (116.2 | ) | |||||||
| Cash and cash equivalents at beginning of period |
351.5 | 409.0 | 525.2 | |||||||||
| Cash and cash equivalents at end of period |
$ | 415.8 | $ | 351.5 | $ | 409.0 | ||||||
| Supplemental Cash Flow Information: |
||||||||||||
| Cash paid during the period for: |
||||||||||||
| Income taxes |
$ | 16.3 | $ | 17.5 | $ | 27.7 | ||||||
| Interest |
$ | 19.6 | $ | 30.5 | $ | 30.4 | ||||||
See accompanying notes to consolidated financial statements.
62
Table of Contents
FAIRCHILD SEMICONDUCTOR INTERNATIONAL, INC. AND SUBSIDIARIES
CONSOLIDATED STATEMENTS OF STOCKHOLDERS’ EQUITY
(In millions)
| Common Stock | Additional Paid-in Capital |
Accumulated Deficit |
Accumulated Other Comprehensive Income (Loss) |
Treasury Stock |
Total | |||||||||||||||||||||||||||||
| Number of Shares |
At Par Value |
Securities | Hedging Transactions |
Pensions | ||||||||||||||||||||||||||||||
| Balances at December 31, 2006 |
122.7 | $ | 1.2 | $ | 1,319.1 | $ | (182.5 | ) | $ | (0.1 | ) | $ | — | $ | 1.10 | $ | (6.6 | ) | $ | 1,132.2 | ||||||||||||||
| Net income |
— | — | — | 64.0 | — | — | — | — | 64.0 | |||||||||||||||||||||||||
| Adjustment for adoption of FIN 48 |
— | — | — | 1.9 | — | — | — | — | 1.9 | |||||||||||||||||||||||||
| Exercise or settlement of plan awards and shares issued under stock purchase plan |
3.1 | 0.1 | 29.0 | — | — | — | — | 8.0 | 37.1 | |||||||||||||||||||||||||
| Stock-based compensation expense |
— | — | 24.8 | — | — | — | — | — | 24.8 | |||||||||||||||||||||||||
| Purchase of treasury stock |
(1.7 | ) | — | — | — | — | — | — | (28.3 | ) | (28.3 | ) | ||||||||||||||||||||||
| Cash flow hedges |
— | — | — | — | — | (4.5 | ) | — | — | (4.5 | ) | |||||||||||||||||||||||
| Unrealized holding loss on marketable securities and investments |
— | — | — | — | (2.4 | ) | — | — | — | (2.4 | ) | |||||||||||||||||||||||
| Pension transactions |
— | — | — | — | — | — | (4.1 | ) | — | (4.1 | ) | |||||||||||||||||||||||
| Temporary equity reclassification, deferred stock units |
— | — | (1.2 | ) | — | — | — | — | — | (1.2 | ) | |||||||||||||||||||||||
| Other |
— | — | — | — | — | — | — | (1.0 | ) | (1.0 | ) | |||||||||||||||||||||||
| Balances at December 30, 2007 |
124.1 | 1.3 | 1,371.7 | (116.6 | ) | (2.5 | ) | (4.5 | ) | (3.0 | ) | (27.9 | ) | 1,218.5 | ||||||||||||||||||||
| Net loss |
— | — | — | (167.4 | ) | — | — | — | — | (167.4 | ) | |||||||||||||||||||||||
| Exercise or settlement of plan awards and shares issued under stock purchase plan |
1.6 | — | (1.9 | ) | — | — | — | — | 10.9 | 9.0 | ||||||||||||||||||||||||
| Stock-based compensation expense |
— | — | 18.8 | — | — | — | — | — | 18.8 | |||||||||||||||||||||||||
| Purchase of treasury stock |
(2.4 | ) | — | — | — | — | — | — | (21.7 | ) | (21.7 | ) | ||||||||||||||||||||||
| Cash flow hedges |
— | — | — | — | — | (5.3 | ) | — | — | (5.3 | ) | |||||||||||||||||||||||
| Unrealized holding gain on marketable securities |
— | — | — | — | 0.2 | — | — | — | 0.2 | |||||||||||||||||||||||||
| Loss on long-term securities |
— | — | — | — | 2.5 | — | — | — | 2.5 | |||||||||||||||||||||||||
| Pension transactions |
— | — | — | — | — | — | 2.1 | — | 2.1 | |||||||||||||||||||||||||
| Temporary equity reclassification, deferred stock units |
— | — | 0.4 | — | — | — | — | — | 0.4 | |||||||||||||||||||||||||
| Balances at December 28, 2008 |
123.3 | 1.3 | 1,389.0 | (284.0 | ) | 0.2 | (9.8 | ) | (0.9 | ) | (38.7 | ) | 1,057.1 | |||||||||||||||||||||
| Net loss |
— | — | — | (60.2 | ) | — | — | — | — | (60.2 | ) | |||||||||||||||||||||||
| Exercise or settlement of plan awards and shares issued under stock purchase plan |
0.7 | — | — | — | — | — | — | — | — | |||||||||||||||||||||||||
| Stock-based compensation expense |
— | — | 17.1 | — | — | — | — | — | 17.1 | |||||||||||||||||||||||||
| Cash flow hedges |
— | — | — | — | — | 9.5 | — | — | 9.5 | |||||||||||||||||||||||||
| Cumulative effect adjustment—non credit component of previously recognized other-then-temp impairment |
3.5 | (3.5 | ) | — | ||||||||||||||||||||||||||||||
| Unrealized holding loss on marketable securities |
— | — | — | — | 0.4 | — | — | — | 0.4 | |||||||||||||||||||||||||
| Pension transactions |
— | — | — | — | — | — | 2.2 | — | 2.2 | |||||||||||||||||||||||||
| Temporary equity reclassification, deferred stock units |
— | — | 0.5 | — | — | — | — | — | 0.5 | |||||||||||||||||||||||||
| Balances at December 27, 2009 |
124.0 | $ | 1.3 | $ | 1,406.6 | $ | (340.7 | ) | $ | (2.9 | ) | $ | (0.3 | ) | $ | 1.3 | $ | (38.7 | ) | $ | 1,026.6 | |||||||||||||
See accompanying notes to consolidated financial statements.
63
Table of Contents
FAIRCHILD SEMICONDUCTOR INTERNATIONAL, INC. AND SUBSIDIARIES
NOTES TO CONSOLIDATED FINANCIAL STATEMENTS
NOTE 1—BACKGROUND AND BASIS OF PRESENTATION
Background
Fairchild Semiconductor International, Inc. (“Fairchild International” or the “company”) designs, develops, manufactures and markets power analog, power discrete and certain non-power semiconductor solutions through its wholly-owned subsidiary Fairchild Semiconductor Corporation (“Fairchild”). The company is focused primarily on power analog and discrete products used directly in power applications such as voltage conversion, power regulation, power distribution, and power and battery management. The company’s products are building block components for virtually all electronic devices, from sophisticated computers and internet hardware to telecommunications equipment to household appliances. Because of their basic functionality, these products provide customers with greater design flexibility and improve the performance of more complex devices or systems. Given such characteristics, the company’s products have a wide range of applications and are sold to customers in the personal computer, industrial, communications, consumer electronics and automotive markets.
The company is headquartered in South Portland, Maine and has manufacturing operations in South Portland, Maine, West Jordan, Utah, Mountaintop, Pennsylvania, Cebu, the Philippines, Penang, Malaysia, Bucheon, South Korea, and Suzhou, China. The company sells its products to customers worldwide.
The accompanying financial statements of the company have been prepared in conformity with accounting principles generally accepted in the United States of America (U.S.). Certain amounts for prior periods have been reclassified to conform to current presentation.
NOTE 2—SUMMARY OF SIGNIFICANT ACCOUNTING POLICIES
Fiscal Year
The company’s fiscal year ends on the last Sunday in December. The company’s results for the years ended December 27, 2009, December 28, 2008 and December 30, 2007 each consist of 52 weeks.
Principles of Consolidation
The consolidated financial statements include the accounts and operations of the company and its wholly-owned subsidiaries. Significant intercompany accounts and transactions have been eliminated.
Use of Estimates in Preparation of Financial Statements
The preparation of financial statements in conformity with accounting principles generally accepted in the U.S. requires management to make estimates and assumptions about future events. These estimates and the underlying assumptions affect the amounts of assets and liabilities reported, disclosures about contingent assets and liabilities, and reported amounts of revenues and expenses. Such estimates include the valuation of accounts receivable, inventories, goodwill, investments, intangible assets, and other long-lived assets, legal contingencies, and assumptions used in the calculation of income taxes and customer incentives, among others. These estimates and assumptions are based on management’s best estimates and judgment. Management evaluates its estimates and assumptions on an ongoing basis using historical experience and other factors, including the current economic environment, which management believes to be reasonable under the circumstances. The company adjusts such estimates and assumptions when facts and circumstances dictate. Illiquid credit markets, volatile equity, and foreign currency markets, and declines in consumer spending have combined to increase the uncertainty inherent in such estimates and assumptions. As future events and their effects cannot be determined with precision, actual results could differ significantly from these estimates. Changes in those estimates resulting from continuing changes in the economic environment will be reflected in the financial statements in future periods.
64
Table of Contents
During fiscal year 2009, the company recorded approximately $1.8 million of adjustments to previously recorded estimates which increased the benefit for income taxes. During fiscal year 2008, the company recorded approximately $3.6 million of adjustments to previously recorded estimates which increased gross margin by approximately $0.8 million, reduced selling, general and administrative expense by approximately $1.1 million and reduced the provision for income taxes by approximately $1.7 million. The effect of these adjustments is deemed immaterial.
Revenue Recognition
Revenue is not recognized unless there is persuasive evidence of an arrangement, the price to the buyer is fixed or determinable, delivery has occurred and collectability of the sales price is reasonably assured. Revenue from the sale of semiconductor products is recognized when title and risk of loss transfers to the customer, which is generally when the product is received by the customer. Shipping costs billed to customers are included within revenue. Associated costs are classified in cost of goods sold.
Approximately 64% of the company’s revenues are received from distributors. Distributor payments are due under agreed terms and are not contingent upon resale or any other matter other than the passage of time. The company has agreements with some distributors and customers for various programs, including prompt payment discounts, pricing protection, scrap allowances and stock rotation. Sales to these distributors and customers, as well as the existence of sales incentive programs, are in accordance with terms set forth in written agreements with these distributors and customers. In general, credits allowed under these programs are capped based upon individual distributor agreements. The company records charges associated with these programs as a reduction of revenue at the time of sale based upon historical activity. The company’s policy is to use both a three to six month rolling historical experience rate as well as a prospective view of products in the distributor channel for distributors who participate in an incentive program in order to estimate the necessary allowance to be recorded. In addition, under the company’s standard terms and conditions of sale, the products sold by the company are subject to a limited product quality warranty. The standard limited warranty period is one year. The company may, and often does, receive warranty claims outside the scope of the company’s standard terms and conditions. The company accrues for the estimated cost of incurred but unidentified quality issues based upon historical activity and known quality issues if a loss is probable and can be reasonably estimated. Quality returns are accounted for as a reduction of revenue.
In some cases, title and risk of loss do not pass to the customer when the product is received by them. In these cases, the company recognizes revenue at the time when title and risk of loss is transferred, assuming all other revenue recognition criteria have been satisfied. These cases include several inventory locations where the company manages consigned inventory for the company’s customers, including some for which the inventory is at customer facilities. In such cases, revenue is not recognized when products are received at these locations; rather, revenue is recognized when customers take the inventory from the location for their use.
Advertising
Advertising expenditures are charged to expense as incurred. Advertising expenses for the years ended December 27, 2009, December 28, 2008 and December 30, 2007 were not material to the consolidated financial statements.
Research and Development Costs
The company’s research and development expenditures are charged to expense as incurred.
Fair Value Measurements
On the first day of fiscal year 2009, the company fully adopted the fair value measurements and disclosure provisions for nonfinancial assets and liabilities, which were previously deferred. Non financial assets and liabilities include intangible assets, reporting units measured at fair value in the first step of a goodwill
65
Table of Contents
impairment test, and asset retirement obligations. The fair value and disclosure provisions for financial assets and liabilities measured at fair value on a recurring basis were adopted on the first day of fiscal year 2008.
The Fair Value Measurements and Disclosures Topic of the FASB Accounting Standards Codification (ASC) defines fair value as the exchange price that would be received for an asset or paid to transfer a liability in the principal or most advantageous market in an orderly transaction between market participants at the measurement date. In accordance with this ASC topic, the company groups its assets and liabilities measured at fair value on a recurring basis in three levels, based on the markets in which the assets and liabilities are traded and the reliability of the assumptions used to determine fair value. These levels are:
| • | Level 1—Valuation is based upon quoted market price for identical instruments traded in active markets. |
| • | Level 2—Valuation is based on quoted market prices for similar instruments in active markets, quoted prices for identical or similar instruments in markets that are not active, and model-based valuation techniques for which all significant assumptions are observable in the market. |
| • | Level 3—Valuation is generated from model-based techniques that use significant assumptions not observable in the market. Valuation techniques include use of discounted cash flow models and similar techniques. |
It is the company’s policy to maximize the use of observable inputs and minimize the use of unobservable inputs when developing fair value measurements. When available, the company uses quoted market prices to measure fair value. If market prices are not available, the fair value measurement is based on models that use primarily market based parameters including interest rate yield curves, option volatilities, and currency rates. In certain cases where market rate assumptions are not available, the company is required to make judgments about assumptions market participants would use to estimate the fair value of a financial instrument. Changes in the underlying assumptions used, including discount rates and estimates of future cash flows could significantly affect the results of current or future values. The results may not be realized in an actual sale or immediate settlement of an asset or liability. See Note 3 and Note 15 for further discussion of the fair value of the company’s financial instruments.
The carrying values of cash and cash equivalents, accounts receivable and payable, and accrued liabilities approximate fair value due to the short-term maturities of these assets and liabilities.
Cash, Cash Equivalents and Other Securities
The company invests excess cash in marketable securities consisting primarily of money markets, commercial paper, corporate notes and bonds, and U.S. government securities. While the company still holds auction rate securities, the company no longer actively invests in them.
The company considers all highly liquid investments with a maturity of three months or less when purchased to be cash equivalents. Highly liquid investments with maturities greater than three months and less than one year are classified as short-term marketable securities. All other investments with maturities that exceed one year are classified as long-term securities. At December 27, 2009 and December 28, 2008, all of the company’s securities are classified as available-for-sale. In accordance with the Investments – Debt and Equity Securities Topic of the FASB ASC, available-for-sale securities are carried at fair value with unrealized gains and losses included as a component of other comprehensive income (OCI) within stockholders’ equity, net of any related tax effect, if such gains and losses are considered temporary. Realized gains and losses on these investments are included in interest income and expense. Declines in value judged by management to be other-than-temporary are included in impairment of investments in the statement of operations. For the purpose of computing realized gains and losses, cost is identified on a specific identification basis. For further discussion of the fair value of the company’s securities see Note 3.
66
Table of Contents
Cash, cash equivalents and other securities as of December 27, 2009 and December 28, 2008 are as follows:
| December 27, | December 28, | |||||
| 2009 | 2008 | |||||
| (In millions) | ||||||
| Cash and cash equivalents |
$ | 415.8 | $ | 351.5 | ||
| Short-term marketable securities |
0.1 | 0.8 | ||||
| Long-term securities |
35.8 | 34.6 | ||||
| Total cash, cash equivalents and other securities |
$ | 451.7 | $ | 386.9 | ||
Foreign Currency Hedging
The company utilizes various derivative financial instruments to manage market risks associated with the fluctuations in foreign currency exchange rates. It is the company’s policy to use derivative financial instruments to protect against market risk arising from the normal course of business. The criteria the company uses for designating an instrument as a hedge is the instrument’s effectiveness in risk reduction. To receive hedge accounting treatment, hedges must be highly effective at offsetting the impact of the hedged transaction.
All derivatives, whether designated as hedging relationships or not, are recorded at fair value and are included in either other current assets or other current liabilities on the balance sheet.
The company utilizes cash flow hedges to hedge certain foreign currency forecasted revenue and expense streams. For derivatives designated as cash flow hedges, the effective portions of changes in fair value of the derivative are recorded in OCI and are recognized in the income statement when the hedged item affects earnings, and within the same income statement line as the impact of the hedged transaction. Ineffective portions of changes in the fair value of cash flow hedges are recognized in earnings. Effectiveness is assessed at the hedge’s inception and on an ongoing basis. If the hedge fails to meet the requirements for using hedge accounting treatment or the hedged transaction is no longer likely to occur by the end of the originally specified time period or within an additional two-month period of time thereafter, the changes in fair value of the hedge would be included in earnings. The maturities of the cash flow hedges are twelve months or less. Derivative instruments that are not designated as hedged transactions are used to offset the foreign currency impact of balance sheet translation. These derivatives have one month maturities and the initial fair value, if any, and any subsequent gains or losses on the change in the fair value are reported in earnings within the same income statement line as the impact of the related transactions.
Interest Rate Hedging
Effective December 29, 2006, the company entered into an interest rate swap agreement to hedge interest rate exposure for $150 million notional amount of its floating rate debt. The swap effectively fixes the interest rate for the $150 million portion of the term loan at 4.99% for three years and expires on December 31, 2009. This hedge of interest rate risk was designated and documented at inception as a cash flow hedge and is evaluated for effectiveness quarterly. Effectiveness of this hedge is calculated by comparing the fair value of the derivative to a hypothetical derivative that would be a perfect hedge of floating rate debt. On a quarterly basis, the fair value of the swap is determined based on quoted market prices and, assuming effectiveness, the differences between the fair value and the book value of the swap is recognized in OCI, a component of shareholders’ equity. Any ineffectiveness of the swap is required to be recognized in earnings as a component of interest expense.
Concentration of Credit Risk
The company is subject to concentrations of credit risk in their investments, derivatives, and trade accounts receivable. The company maintains cash, cash equivalents and other securities with high credit quality financial institutions based upon the company’s analysis of that financial institution’s relative credit standing. The
67
Table of Contents
company’s investment policy is designed to limit exposure to any one institution. The company also is exposed to credit-related losses in the event of non-performance by counterparties to hedging instruments. The counterparties to all derivative transactions are major financial institutions with investment grade credit ratings. However, this does not eliminate the company’s exposure to credit risk with these institutions. This credit risk is generally limited to the unrealized gains in such contracts should any of these counterparties fail to perform as contracted. The company considers the risk of counterparty default to be minimal.
The company sells its products to distributors and original equipment manufacturers involved in a variety of industries including computing, consumer, communications, automotive and industrial. The company has adopted credit policies and standards to accommodate industry growth and inherent risk. The company performs continuing credit evaluations of its customers’ financial condition and requires collateral as deemed necessary. Reserves are provided for estimated amounts of accounts receivable that may not be collected.
Inventories
Inventories are stated at the lower of actual cost on a first-in, first-out basis, or market.
Property, Plant and Equipment
Property, plant and equipment are recorded at cost and are generally depreciated based upon the following estimated useful lives: buildings and improvements, ten to thirty years, machinery and equipment and software, three to ten years. Depreciation is principally provided under the straight-line method.
Investments
The company has certain strategic investments that are typically accounted for on a cost basis as they are less than 20% owned, and the company does not exercise significant influence over the operating and financial policies of the investee. Under the cost method, investments are held at historical cost, less impairments. The company periodically assesses the need to record impairment losses on investments and records such losses when the impairment of an investment is determined to be other-than-temporary in nature. A variety of factors are considered when determining if a decline in fair value below book value is other-than-temporary, including, among others, the financial condition and prospects of the investee.
During the second quarter of 2008, the company sold its interest in one of its strategic investments for an immaterial gain.
During the second quarter of 2009, the company sold its interest in one of its strategic investments resulting in a $0.2 million gain. In addition, as a result of overall equity market valuation changes the company performed an impairment analysis on its only remaining strategic investment in the second quarter of 2009. A discounted cash flow model was used to value the investment as well as a comparison to a publicly traded peer company. The company determined that the investment was impaired and wrote off $2.3 million, leaving a value of $0.7 million.
The total cost basis for strategic investments, which are included in other assets on the balance sheet, was $0.7 million and $3.5 million, net of write offs, as of December 27, 2009 and December 28, 2008, respectively.
Other Assets
Other assets include deferred financing costs, which represent costs incurred related to the issuance of the company’s long-term debt. The costs are being amortized using the straight-line method, which approximates the effective interest method, over the related term of the borrowings, which ranges from five to seven years, and are included in interest expense. Also included in other assets are mold and tooling costs. Molds and tools are amortized over their expected useful lives, generally one to three years.
68
Table of Contents
Goodwill, Intangible Assets, and Long-Lived Assets
Goodwill is recorded when the consideration paid for acquisitions exceeds the fair value of net tangible and intangible assets acquired. Goodwill and other intangible assets with indefinite useful lives are not amortized, but rather are tested at least annually for impairment. Intangible assets with estimable lives are amortized over one to fifteen years.
Goodwill and intangible assets with indefinite lives are tested annually for impairment or more frequently if there is an indication that impairment may have occurred. The company’s goodwill impairment review is based on a combination of the income approach, which estimates the fair value of the company’s reporting units based on a discounted cash flow approach, and the market approach which estimates the fair value of the company’s reporting units based on comparable market multiples. This fair value is then reconciled to the company’s market capitalization at year end with an appropriate control premium. The determination of the fair value of the reporting units requires the company to make significant estimates and assumptions. These estimates and assumptions primarily include but are not limited to; the selection of appropriate peer group companies, control premiums appropriate for acquisitions in the industries in which the company competes, the discount rate, terminal growth rates, forecasts of revenue and expense growth rates, changes in working capital, depreciation and amortization, and capital expenditures. Due to the inherent uncertainty involved in making these estimates, actual financial results could differ from those estimates. Changes in assumptions concerning future financial results or other underlying assumptions would have a significant impact on either the fair value of the reporting unit or the amount of the goodwill impairment charge. The company uses its judgment in assessing whether assets may have become impaired between annual impairment tests. Indicators such as unexpected adverse business conditions, economic factors, unanticipated technological change or competitive activities, loss of key personnel and acts by governments and courts, may signal that an asset has become impaired. See Note 5 for the results of goodwill testing.
Intangible assets with estimable lives and other long-lived assets are reviewed for impairment whenever events or changes in circumstances indicate that the carrying amount of an asset or asset group may not be recoverable. Recoverability of intangible assets with estimable lives and other long-lived assets is measured by a comparison of the carrying amount of an asset or asset group to future net undiscounted pretax cash flows expected to be generated by the asset or asset group. If these comparisons indicate that an asset or asset group is not recoverable, the impairment loss recognized is the amount by which the carrying amount of the asset or asset group exceeds the related estimated fair value. Estimated fair value is based on either discounted future pretax operating cash flows or appraised values, depending on the nature of the asset or asset group. The company determines the discount rate for this analysis based on the expected internal rate of return for the related business and does not allocate interest charges to the asset or asset group being measured. Considerable judgment is required to estimate discounted future operating cash flows.
Currencies
The company’s functional currency for all operations worldwide is the U.S. dollar. Accordingly, gains and losses from translation of foreign currency financial statements are included in current results. In addition, conversion of foreign currency cash and foreign currency transactions are included in current results. Realized foreign currency gains (losses) were $(0.8) million, $7.9 million and $0.2 million for the years ended December 27, 2009, December 28, 2008 and December 30, 2007, respectively.
Income Taxes
Income taxes are accounted for under the asset and liability method. Under this method, deferred tax assets and liabilities are recognized for the future tax consequences attributable to differences between the financial statement carrying amounts of existing assets and liabilities and their respective tax bases. Deferred tax assets and liabilities are measured using enacted tax rates expected to apply to taxable income in the years in which those temporary differences are expected to be recovered or settled. The effect on deferred tax assets and
69
Table of Contents
liabilities of a change in tax rates is recognized in income in the period that includes the enactment date. The realizability of deferred tax assets must also be assessed. The ultimate realization of deferred tax assets is dependent upon the generation of future taxable income during the periods in which the associated temporary differences become deductible. A valuation allowance must be established for deferred tax assets which the company does not believe will more likely than not be realized in the future. Deferred taxes are not provided for the undistributed earnings of the company’s foreign subsidiaries that are considered to be indefinitely reinvested outside of the U.S. in accordance with the Income Tax Topic of the ASC. The company plans to repatriate certain non-U.S. earnings which have been taxed in the U.S. but earned offshore as well as any non-U.S. earnings which are not considered to be indefinitely reinvested outside the U.S.
The Income Tax Topic of the ASC prescribes a recognition threshold and measurement attribute for the financial statement recognition and measurement of a tax position taken or expected to be taken in a tax return. This topic also provides guidance on derecognition, classification, interest and penalties, accounting in the interim periods, disclosure, and transition. The company adopted the current standard on January 1, 2007. Penalties and interest relating to uncertain tax positions are recognized as a component of income tax expense. To the extent penalties and interest are not assessed with respect to uncertain tax positions, amounts accrued will be reduced and reflected as a reduction of the overall income tax provision.
Computation of Net Income (Loss) Per Share
Basic net income (loss) per share is computed using the weighted-average number of common shares outstanding during the period. Diluted net income (loss) per share is computed using the weighted-average number of common shares outstanding during the period, plus the dilutive effect of potential future issuances of common stock relating to potentially dilutive securities. Potentially dilutive common equivalent securities consist of stock options, deferred stock units (DSUs), restricted stock units (RSUs) and performance units (PUs). In calculating diluted earnings per share, the dilutive effect of stock options is computed using the average market price for the respective period. Certain potential shares of the company’s outstanding stock options were excluded because they were anti-dilutive, but could be dilutive in the future. The following table sets forth the computation of basic and diluted earnings per share.
| Year Ended | |||||||||||
| December 27, | December 28, | December 30, | |||||||||
| 2009 | 2008 | 2007 | |||||||||
| (In millions, except per share data) | |||||||||||
| Basic: |
|||||||||||
| Net income (loss) |
$ | (60.2 | ) | $ | (167.4 | ) | $ | 64.0 | |||
| Weighted average shares outstanding |
123.8 | 124.3 | 124.1 | ||||||||
| Net income (loss) per share |
$ | (0.49 | ) | $ | (1.35 | ) | $ | 0.52 | |||
| Diluted: |
|||||||||||
| Net income (loss) |
$ | (60.2 | ) | $ | (167.4 | ) | $ | 64.0 | |||
| Basic weighted average shares outstanding |
123.8 | 124.3 | 124.1 | ||||||||
| Assumed exercise of common stock equivalents |
— | — | 2.2 | ||||||||
| Diluted weighted-average common and common equivalent shares |
123.8 | 124.3 | 126.3 | ||||||||
| Net income (loss) per share |
$ | (0.49 | ) | $ | (1.35 | ) | $ | 0.51 | |||
| Anti-dilutive common stock equivalents, non-vested stock, |
|||||||||||
| DSUs, RSUs, and PUs |
18.1 | 20.7 | 14.5 | ||||||||
70
Table of Contents
In addition, the computation of diluted earnings per share for 2008 and 2007 did not include the assumed conversion of the 5% Convertible Senior Subordinated Notes (Notes) because the effect would have been anti-dilutive. The annual interest expense on the Notes was $11.0 million and the potential amount of common shares to be converted was 6.7 million. The Notes did not impact 2009 as they were redeemed in the second quarter of 2008. (See Note 6 for further discussion of the redemption of the Notes.)
NOTE 3—SECURITIES
In accordance with the requirements of the Fair Value Measurements and Disclosures Topic of the FASB ASC, the company groups its financial assets and liabilities measured at fair value on a recurring basis in three levels, based on the markets in which the assets and liabilities are traded and the reliability of the assumptions used to determine fair value. (See Note 2 for further discussion of the fair value hierarchy.)
Level 1 securities include those traded on an active exchange as well as U.S. Treasury, and other U.S. government and agency-backed securities that are traded by dealers or brokers in active over-the-counter markets. The company has no securities classified as Level 2. The securities classified as Level 3 are auction rate securities.
The fair value of securities are based on quoted market prices at the date of measurement, except for auction rate securities. The auction rate security market is no longer active and as a result there is no observable market data for these assets. Fair value estimates are based on judgments regarding current economic conditions, liquidity discounts and interest rate risks. These estimates involve significant uncertainties and judgments and cannot be determined with precision. As a result such calculated fair value estimates may not be realizable in a current sale or immediate settlement of the instrument. In addition changes in the underlying assumptions used in the fair value measurement technique, including discount rates, liquidity risks, and estimates of future cash flows could significantly affect these fair value estimates.
For the year ended December 30, 2007, the fair values of auction rate securities were based on market prices provided by the company’s brokers. The brokers calculated the fair value of the securities on an individual basis by applying a valuation methodology based on a present value of future cash flows model. For the years ended December 27, 2009 and December 28, 2008, the company performed its own discounted cash flow (DCF) calculation to determine the estimated fair value of these investments. The assumptions used in preparing the DCF model included estimates for the amount and timing of future interest and principal payments and the rate of return required by investors to own these securities in the current environment. In making these assumptions, relevant factors that were considered included: the formula applicable to each security which defines the interest rate paid to investors in the event of a failed auction; forward projections of the interest rate benchmarks specified in such formulas; the likely timing of principal repayments; the probability of full repayment considering guarantees by third parties and additional credit enhancements provided through other means. The estimate of the rate of return required by investors to own these securities also considers the current reduced liquidity for auction rate securities. The inputs for the company’s DCF were based upon input from third parties as well as the company’s own estimates. The primary unobservable input to the valuation was the maturity assumption which ranged from six to twelve years depending on the individual auction rate security. The maturity assumptions were based on the terms of the underlying instrument and the potential for restructuring the auction rate security.
Unrealized losses of $2.5 million relating to these auction rate securities had been recorded in accumulated other comprehensive income (AOCI) as of December 30, 2007. In the fourth quarter of 2008, the company concluded that the impairment of its auction rate securities was other-than-temporary and recognized a loss of $19.0 million in the income statement. However, the company does not intend to sell or believe it is more likely than not that the company would be required to sell the securities before a recovery of the amortized cost basis of the investment.
71
Table of Contents
In the second quarter of 2009, based on the new requirements of the Investments – Debt and Equity Securities Topic of the FASB ASC, the company analyzed the $19.0 million other-than-temporary loss that was recognized in the income statement in the fourth quarter of 2008 to determine the noncredit component. The noncredit component of the loss is primarily driven by changes in interest rates. The noncredit component was calculated by separating the discount rate used in calculating the fair value estimates for the auction rate securities in the fourth quarter of 2008 into its credit risk and noncredit components. The fair value of each auction rate security was then revalued using the noncredit component of the discount rate. The calculated fair value was compared to the par value of each issue to determine the unrealized loss related to the noncredit component. The remaining unrealized loss was determined to be the credit loss component. It was determined that $15.5 million of the loss was attributable to credit loss, while $3.5 million was attributable to noncredit risk, or interest rates and was reclassified from retained earnings into AOCI. There is no portion of other-than-temporary impairment related to credit loss currently included in AOCI. As of December 27, 2009 a net unrealized loss of $2.9 million has been recorded in AOCI for these securities.
The following table presents a rollforward of the amount related to credit losses recognized in earnings during the year ended December 27, 2009.
| Credit Losses Recognized in Earnings |
||||
| (In millions) | ||||
| Balance at beginning of period |
$ | 15.5 | ||
| Accretion of impairments included in net loss |
(0.5 | ) | ||
| Balance at end of period |
$ | 15.0 | ||
The following table presents the balances of securities measured at fair value on a recurring basis as of December 27, 2009.
| Fair Value Measurements | ||||||||||||
| Total | Quoted Prices in Active Markets for Identical Assets (Level 1) |
Significant Other Observable Inputs (Level 2) |
Significant Unobservable Inputs (Level 3) | |||||||||
| (In millions) | ||||||||||||
| Marketable securities |
$ | 2.4 | $ | 2.4 | $ | — | $ | — | ||||
| Auction rate securities |
33.4 | — | — | 33.4 | ||||||||
| $ | 35.8 | $ | 2.4 | $ | — | $ | 33.4 | |||||
The following table presents the balances of securities measured at fair value on a recurring basis as of December 28, 2008.
| Fair Value Measurements | ||||||||||||
| Total | Quoted Prices in Active Markets for Identical Assets (Level 1) |
Significant Other Observable Inputs (Level 2) |
Significant Unobservable Inputs (Level 3) | |||||||||
| (In millions) | ||||||||||||
| Marketable securities |
$ | 3.1 | $ | 3.1 | $ | — | $ | — | ||||
| Auction rate securities |
32.3 | — | — | 32.3 | ||||||||
| $ | 35.4 | $ | 3.1 | $ | — | $ | 32.3 | |||||
72
Table of Contents
The following table summarizes the changes in level 3 securities measured at fair value on a recurring basis for the year ended December 27, 2009.
| Auction Rate Securities | |||
| (In millions) | |||
| Balance at beginning of period |
$ | 32.3 | |
| Total realized and unrealized gains or (losses) included in OCI |
0.6 | ||
| Accretion of impairments included in net loss |
0.5 | ||
| Purchases, issuances and settlements |
— | ||
| Balance at end of period |
$ | 33.4 | |
Securities are categorized as available-for-sale and are summarized as follows as of December 27, 2009:
| Amortized Cost |
Gross Unrealized Gains |
Gross Unrealized Losses |
Market Value | |||||||||
| (In millions) | ||||||||||||
| Short-term available for sale securities: |
||||||||||||
| U.S. Treasury securities and obligations of U.S. government agencies |
$ | 0.1 | $ | — | $ | — | $ | 0.1 | ||||
| Corporate debt securities |
— | — | — | — | ||||||||
| Total marketable securities |
$ | 0.1 | $ | — | $ | — | $ | 0.1 | ||||
| Amortized Cost |
Gross Unrealized Gains |
Gross Unrealized Losses |
Market Value | ||||||||||
| (In millions) | |||||||||||||
| Long-term available for sale securities: |
|||||||||||||
| U.S. Treasury securities and obligations of U.S. government agencies |
$ | 1.9 | $ | 0.2 | $ | — | $ | 2.1 | |||||
| Corporate debt securities |
0.3 | — | — | 0.3 | |||||||||
| Auction rate securities |
36.3 | — | (2.9 | ) | 33.4 | ||||||||
| Total securities |
$ | 38.5 | $ | 0.2 | $ | (2.9 | ) | $ | 35.8 | ||||
Securities are categorized as available-for-sale and are summarized as follows as of December 28, 2008:
| Amortized Cost |
Gross Unrealized Gains |
Gross Unrealized Losses |
Market Value | |||||||||
| (In millions) | ||||||||||||
| Short-term available for sale securities: |
||||||||||||
| U.S. Treasury securities and obligations of U.S. government agencies |
$ | 0.2 | $ | — | $ | — | $ | 0.2 | ||||
| Corporate debt securities |
0.6 | — | — | 0.6 | ||||||||
| Total marketable securities |
$ | 0.8 | $ | — | $ | — | $ | 0.8 | ||||
| Amortized Cost |
Gross Unrealized Gains |
Gross Unrealized Losses |
Market Value | |||||||||
| (In millions) | ||||||||||||
| Long-term available for sale securities: |
||||||||||||
| U.S. Treasury securities and obligations of U.S. government agencies |
$ | 1.7 | $ | 0.3 | $ | — | $ | 2.0 | ||||
| Corporate debt securities |
0.3 | — | — | 0.3 | ||||||||
| Auction rate securities |
32.3 | — | — | 32.3 | ||||||||
| Total securities |
$ | 34.3 | $ | 0.3 | $ | — | $ | 34.6 | ||||
73
Table of Contents
In aggregate, the auction rate securities were in a net unrealized loss position as of December 27, 2009. These securities have been in an unrealized loss position for less than 6 months. The unrealized loss is attributable to a decrease in market value primarily driven by a change in credit rating of one issue within the auction rate security portfolio. However, the company does not intend to sell or believe it is more likely than not that the company would be required to sell the securities before a recovery of the amortized cost basis of the investment. In addition, as a result of the continued performance of the issue and its’ insurance guarantee, the company considers this decrease in fair value to be temporary in nature. There were no investments in a material unrealized loss position as of December 28, 2008.
The following table presents the amortized cost and estimated fair market value of available-for-sale securities by contractual maturity as of December 27, 2009.
| Amortized Cost |
Market Value | |||||
| (In millions) | ||||||
| Due in one year or less |
$ | 0.1 | $ | 0.1 | ||
| Due after one year through three years |
0.4 | 0.4 | ||||
| Due after three years through ten years |
1.2 | 1.3 | ||||
| Due after ten years |
36.9 | 34.0 | ||||
| $ | 38.6 | $ | 35.8 | |||
As of December 27, 2009, $33.4 million of securities with contractual maturities due after ten years are auction rate securities. The company’s auction rate securities are composed of approximately $21.8 million of securities that are structured obligations of special purpose reinsurance entities associated with life insurance companies and $11.6 million of corporate debt securities issued by a special purpose financial services corporation that offers credit risk protection through writing credit derivatives. The company continues to accrue and receive interest on these securities based on a contractual rate.
Proceeds from sales of available-for-sale securities totaled $0.9 million, $5.1 million and $172.7 million in 2009, 2008 and 2007, respectively. For the year ending 2007, the proceeds are primarily composed of sales of auction rate securities.
NOTE 4—FINANCIAL STATEMENT DETAILS
| December 27, 2009 |
December 28, 2008 | |||||
| (In millions) | ||||||
| Inventories, net |
||||||
| Raw materials |
$ | 29.4 | $ | 43.0 | ||
| Work in process |
96.4 | 108.4 | ||||
| Finished goods |
63.7 | 79.6 | ||||
| $ | 189.5 | $ | 231.0 | |||
| December 27, 2009 |
December 28, 2008 | |||||
| (In millions) | ||||||
| Property, plant and equipment |
||||||
| Land and improvements |
$ | 24.1 | $ | 24.1 | ||
| Buildings and improvements |
332.3 | 325.7 | ||||
| Machinery and equipment |
1,615.3 | 1,591.6 | ||||
| Construction in progress |
46.7 | 67.6 | ||||
| Total property, plant and equipment |
2,018.4 | 2,009.0 | ||||
| Less accumulated depreciation |
1,365.2 | 1,277.4 | ||||
| $ | 653.2 | $ | 731.6 | |||
74
Table of Contents
| December 27, 2009 |
December 28, 2008 | |||||
| (In millions) | ||||||
| Accrued expenses and other current liabilities |
||||||
| Payroll and employee related accruals |
$ | 34.8 | $ | 35.9 | ||
| Accrued interest |
2.6 | 7.9 | ||||
| Taxes payable |
5.0 | 8.5 | ||||
| Restructuring and impairments |
10.2 | 13.2 | ||||
| Other |
18.0 | 28.9 | ||||
| $ | 70.6 | $ | 94.4 | |||
| Year Ended | ||||||||||||
| December 27, | December 28, | December 30, | ||||||||||
| 2009 | 2008 | 2007 | ||||||||||
| (in millions) | ||||||||||||
| Other expense, net |
||||||||||||
| Interest expense |
$ | 21.4 | $ | 34.0 | $ | 38.5 | ||||||
| Interest income |
(3.4 | ) | (11.7 | ) | (18.9 | ) | ||||||
| Other (income) expense, net |
0.4 | 0.8 | 0.6 | |||||||||
| Other expense, net |
$ | 18.4 | $ | 23.1 | $ | 20.2 | ||||||
NOTE 5—GOODWILL AND INTANGIBLE ASSETS
In order to complete the two-step goodwill impairment test, the company identifies its reporting units and determines the carrying value of each reporting unit by assigning the assets and liabilities, including the existing goodwill and intangible assets, to those reporting units. In accordance with the provisions of the Intangibles – Goodwill and Other Topic of the ASC, the company designates reporting units for purposes of assessing goodwill impairment. A reporting unit is defined as the lowest level of an entity that is a business and that can be distinguished, physically and operationally and for internal reporting purposes, from the other activities, operations, and assets of the entity. Goodwill is assigned to reporting units of the company that are expected to benefit from the synergies of the acquisition. The company has determined that it has three reporting units for purposes of goodwill impairment testing: Mobile, Computing, Consumer and Communications (MCCC), Power Conversion, Industrial and Automotive (PCIA) and Standard Linear and Standard Discrete (SDT).
The company’s impairment review is based on a combination of the income approach, which estimates the fair value of the company’s reporting units based on a discounted cash flow approach, and the market approach which estimates the fair value of the company’s reporting units based on comparable market multiples. The average fair value is then reconciled to the company’s market capitalization with an appropriate control premium. The discount rates utilized in the discounted cash flows ranged from approximately 12% to 15%, reflecting market based estimates of capital costs and discount rates adjusted for a market participants view with respect to execution, concentration, and other risks associated with the projected cash flows of the individual segments. The peer companies used in the market approach are primarily the major competitors of each segment. The company’s valuation methodology requires management to make judgments and assumptions based on historical experience and projections of future operating performance. If these assumptions differ materially from future results, the company may record impairment charges in the future. The company’s policy is to perform its annual impairment testing for all reporting units in the fourth quarter of each fiscal year. The company performed its annual impairment test as of December 27, 2009 and December 28, 2008 for the past two fiscal years.
As of December 27, 2009, the company concluded that goodwill was not impaired. This conclusion would not have changed even if the segments had not been realigned in the first quarter.
75
Table of Contents
After completing step one of the impairment test as of December 28, 2008, the company determined that the estimated fair value of its PCIA and SPG reporting units was less than the carrying value of those reporting units, requiring the completion of the second step of the impairment test. To measure the amount of impairment, the Intangibles – Goodwill and Other Topic of the ASC prescribes that the company determine the implied fair value of goodwill in the same manner as if the company had acquired those reporting units. Specifically, the company must allocate the fair value of the reporting unit to all of the assets of that unit, including unrecognized intangible assets, in a hypothetical calculation that would yield the implied fair value of goodwill. The impairment loss is measured as the difference between the book value of the goodwill and the implied fair value of the goodwill computed in step two. Upon completion of step two of the analysis, the company wrote off the entire goodwill balance for PCIA and what was then our SPG reporting unit (for further information see Note 16). This resulted in an impairment loss of $203.3 million as of December 28, 2008.
The goodwill impairment charge is non-cash in nature and did not affect the company’s liquidity, cash flows from operating activities or debt covenants and did not have a material impact on operations.
Given the economic conditions at the end of fiscal year 2008, the company performed an impairment review of other long lived assets in addition to the annual goodwill impairment test. The company determined that there was no impairment of other long lived assets as of December 28, 2008. There were no events to trigger an impairment review as of December 27, 2009.
Effective December 29, 2008 (first day of fiscal year 2009), the company realigned its operating segments and management structure and, accordingly, its segment reporting. Two product lines previously included in the Standard Products Group (SPG) were transferred into our Mobile, Computing, Consumer and Communications (MCCC) and Power Conversion, Industrial and Automotive (PCIA) groups. The realignment of the company’s segment reporting did not impact the carrying amount of goodwill by segment. As a result of this realignment, goodwill was reviewed for impairment in the first quarter of 2009 as well. There was no impairment noted.
The following table presents the carrying amount of goodwill by reporting unit.
| MCCC | PCIA | SDT | Total | |||||||||||||
| (In millions) | ||||||||||||||||
| Balance as of December 28, 2008 |
||||||||||||||||
| Goodwill |
$ | 161.7 | $ | 148.8 | $ | 54.5 | $ | 365.0 | ||||||||
| Accumulated Impairment Losses |
$ | — | (148.8 | ) | (54.5 | ) | (203.3 | ) | ||||||||
| $ | 161.7 | $ | — | $ | — | $ | 161.7 | |||||||||
| Tax purchase price adjustment |
(0.4 | ) | — | — | (0.4 | ) | ||||||||||
| Balance as of December 27, 2009 |
||||||||||||||||
| Goodwill |
161.3 | 148.8 | 54.5 | 364.6 | ||||||||||||
| Accumulated Impairment Losses |
— | (148.8 | ) | (54.5 | ) | (203.3 | ) | |||||||||
| $ | 161.3 | $ | — | $ | — | $ | 161.3 | |||||||||
During the third quarter of 2009, a tax adjustment of $0.4 million was recorded related to purchase accounting entries for the acquisition of System General Corporation.
76
Table of Contents
The following table presents a summary of acquired intangible assets.
| As of December 27, 2009 | As of December 28, 2008 | |||||||||||||||
| Period of Amortization |
Gross Carrying Amount |
Accumulated Amortization |
Gross Carrying Amount |
Accumulated Amortization |
||||||||||||
| (In millions) | ||||||||||||||||
| Identifiable intangible assets: |
||||||||||||||||
| Developed technology |
2-15 years | $ | 238.9 | $ | (180.3 | ) | $ | 237.6 | $ | (161.7 | ) | |||||
| Customer base |
8-10 years | 81.6 | (63.3 | ) | 81.6 | (60.7 | ) | |||||||||
| Core technology |
10 years | 3.9 | (1.1 | ) | 3.9 | (0.7 | ) | |||||||||
| Covenant not to compete |
5 years | 30.4 | (30.4 | ) | 30.4 | (30.4 | ) | |||||||||
| Assembled workforce |
5 years | 1.0 | (0.7 | ) | 1.0 | (0.5 | ) | |||||||||
| Process technology |
5 years | 1.6 | (0.9 | ) | 1.6 | (0.6 | ) | |||||||||
| Patents |
4 years | 5.9 | (5.5 | ) | 5.9 | (5.3 | ) | |||||||||
| Trademarks and tradenames |
1 year | 25.2 | (25.2 | ) | 25.2 | (25.2 | ) | |||||||||
| Subtotal |
388.5 | (307.4 | ) | 387.2 | (285.1 | ) | ||||||||||
| Goodwill |
161.3 | — | 161.7 | — | ||||||||||||
| Total |
$ | 549.8 | $ | (307.4 | ) | $ | 548.9 | $ | (285.1 | ) | ||||||
Amortization expense for intangible assets was $22.3 million, $22.1 million and $23.5 million for 2009, 2008 and 2007, respectively.
The estimated amortization expense for intangible assets for each of the five succeeding fiscal years is as follows:
| Estimated Amortization Expense: |
(In millions) | ||
| Fiscal 2010 |
$ | 22.3 | |
| Fiscal 2011 |
18.0 | ||
| Fiscal 2012 |
15.7 | ||
| Fiscal 2013 |
13.2 | ||
| Fiscal 2014 |
5.5 | ||
NOTE 6 — LONG-TERM DEBT
Long-term debt consists of the following at:
| December 27, | December 28, | |||||||
| 2009 | 2008 | |||||||
| (In millions) | ||||||||
| Revolving Credit Facility borrowings |
$ | — | $ | 19.4 | ||||
| Term Loans |
472.2 | 515.8 | ||||||
| Total debt |
472.2 | 535.2 | ||||||
| Current portion of long-term debt |
(5.3 | ) | (5.3 | ) | ||||
| Long-term debt, less current portion |
$ | 466.9 | $ | 529.9 | ||||
Senior Credit Facility
The senior credit facility consists of an original term loan of $375 million, a revolving line of credit (Revolving Credit Facility) of $100 million and an incremental term loan feature of $300 million. At December 27, 2009, the company had $472.2 million outstanding on the senior credit facility. The entire amount consists of outstanding term loans, which are due June 26, 2013. There is no amount outstanding on the revolving
77
Table of Contents
credit facility. The company does have outstanding letters of credit under the Revolving Credit Facility totaling $2.0 million. These outstanding letters of credit reduce the amount available under the Revolving Credit Facility to $98.0 million. The company pays a commitment fee of 0.375% per annum on the unutilized commitments under the Revolving Credit Facility.
On May 16, 2008, the company borrowed $150 million under the incremental term loan feature. These funds along with $50 million of cash on hand were used to pay down the company’s $200 million 5.0% Convertible Senior Subordinated Notes (Notes) due November 1, 2008. The company initiated the call of the Notes in conjunction with the incremental borrowing and redeemed the Notes on June 9, 2008. The company incurred cash charges of $3.4 million related to the incremental borrowing which was deferred and will be amortized over the term of the debt. At December 27, 2009, the remaining $150 million of the incremental term loan feature remains uncommitted.
On May 13, 2009, the company entered into a First Amendment and Waiver (the “Amendment”) to its senior credit agreement dated June 26, 2006 between the company and Deutsche Bank Trust Company Americas (as administrative agent and a lender) and the other lenders named therein. The Amendment enables the company to voluntarily prepay and retire a portion of its term loan facility to take advantage of potentially favorable conditions in the credit markets that may occur from time to time. The Amendment permits the company to prepay up to $100 million (net of interest and fees) of term loans for a 12 month period following the effective date of the Amendment subject to certain minimum liquidity and customary financial conditions. During the second quarter of 2009, the company completed a tender offer, as allowed under the previously executed amendment, to buyback a portion of its term loan below par. As a result of this debt buyback the company reduced debt by $14.7 million, paying $13.8 million in cash and recognizing $0.8 million gain, net of fees, on the transaction. Additionally, during the fourth quarter of 2009, the company completed three additional tender offers to buyback portions of the term loan below par. As a result of these additional debt buybacks, the company further reduced debt by $23.7 million, paying $22.1 million in cash and recognizing a $1.2 million gain, net of the write-off of associated deferred financing fees and other fees on the transaction.
The original term loan and the Revolving Credit Facility have variable interest rates of London Interbank Offered Rate (LIBOR) plus 1.50%. Both the term loan and Revolving Credit Facility have step down features based on senior leverage ratios. Both are currently at LIBOR plus 1.50%. The incremental term loan has a variable interest rate of LIBOR plus 2.50%. Borrowings under the senior credit facility are secured by a pledge of common stock of the company and certain subsidiaries.
The payment of principal and interest on the senior credit facility is fully and unconditionally guaranteed by Fairchild International. Fairchild International is the parent company of Fairchild and currently conducts no business and has no significant assets other than the capital stock of Fairchild. Fairchild has twenty direct subsidiaries and fifteen indirect subsidiaries, of which six subsidiaries, Fairchild Semiconductor Corporation of California (“Fairchild California”), KOTA Microcircuits, Inc., QT Optoelectronics, Inc., QT Optoelectronics, Fairchild Energy, LLC and ROCTOV, LLC are guarantors on the senior credit facility. The guarantees of the guarantor subsidiaries as well as that of Fairchild International are joint and several. The remaining direct and indirect subsidiaries are foreign-based and do not guarantee the senior credit facility.
The senior credit facility imposes various restrictions upon us that could limit the company’s ability to respond to market conditions, to provide for unanticipated capital investments or to take advantage of business opportunities. It also includes restrictive covenants that limit the company’s ability to consolidate, merge or enter into acquisitions, create liens, pay dividends or make similar restricted payments, sell assets, invest in capital expenditures and incur indebtedness. The senior credit facility also limits the company’s ability to modify the company certificate of incorporation and bylaws, or enter into shareholder agreements, voting trusts or similar arrangements. In addition, the affirmative covenants in the senior credit facility also require the company’s financial performance to comply with certain financial measures, as defined by the credit agreement. These financial covenants require us to maintain a minimum interest coverage ratio of 2.5 to 1.0, a maximum net
78
Table of Contents
leverage ratio of 4.0 to 1.0 and to maintain four quarter trailing EBITDA (earnings before interest, taxes, depreciation and amortization) less capital expenditures of at least $30.0 million. It defines the interest coverage ratio as the ratio of annualized interest expense to the cumulative four quarter trailing EBITDA and defines the maximum net leverage ratio as the ratio of debt, less up to $100 million (to the extent the company unrestricted cash on hand exceeds $200 million), to the cumulative four quarter trailing EBITDA. EBITDA, as defined by the senior credit facility excludes restructuring, non-cash equity compensation and other adjustments as defined by the credit agreement. At December 27, 2009, the company was in compliance with these covenants.
Convertible Senior Subordinated Notes
On May 16, 2008, the company initiated the call of the Notes due November 1, 2008. The redemption amount was paid on June 9, 2008 using proceeds from the incremental term loan and cash on hand.
Aggregate maturities of long-term debt for each of the next five years and thereafter are as follows:
| (In millions) | |||
| 2010 |
$ | 5.3 | |
| 2011 |
5.3 | ||
| 2012 |
5.3 | ||
| 2013 |
456.3 | ||
| 2014 |
— | ||
| $ | 472.2 | ||
At December 27, 2009, the company also has approximately $6.6 million of undrawn credit facilities at certain of its foreign subsidiaries.
NOTE 7—INCOME TAXES
Total income tax provision (benefit) was allocated as follows:
| Year Ended | |||||||||||
| December 27, | December 28, | December 30, | |||||||||
| 2009 | 2008 | 2007 | |||||||||
| (In millions) | |||||||||||
| Income tax provision (benefit) attributable to income (loss) before income taxes |
$ | (3.1 | ) | $ | (1.2 | ) | $ | 18.1 | |||
| Other comprehensive income |
— | — | — | ||||||||
| $ | (3.1 | ) | $ | (1.2 | ) | $ | 18.1 | ||||
Income (loss) before income taxes for the years ended December 27, 2009, December 28, 2008 and December 30, 2007 consisted of the following:
| Year Ended | |||||||||||
| December 27, 2009 |
December 28, 2008 |
December 30, 2007 | |||||||||
| (In millions) | |||||||||||
| Income (loss) before income taxes: |
|||||||||||
| U.S. |
$ | (18.0 | ) | $ | (103.7 | ) | $ | 76.8 | |||
| Foreign |
(45.3 | ) | (64.9 | ) | 5.3 | ||||||
| $ | (63.3 | ) | $ | (168.6 | ) | $ | 82.1 | ||||
79
Table of Contents
Income tax provision (benefit) for the years ended December 27, 2009, December 28, 2008 and December 30, 2007 consisted of the following:
| Year Ended | ||||||||||||
| December 27, 2009 |
December 28, 2008 |
December 30, 2007 |
||||||||||
| (In millions) | ||||||||||||
| Income tax provision (benefit): |
||||||||||||
| Current: |
||||||||||||
| U.S. federal |
$ | 0.1 | $ | — | $ | — | ||||||
| U.S. state and local |
$ | 0.1 | $ | (2.2 | ) | $ | (0.3 | ) | ||||
| Foreign |
5.3 | 12.8 | 20.4 | |||||||||
| 5.5 | 10.6 | 20.1 | ||||||||||
| Deferred: |
||||||||||||
| U.S. federal |
1.8 | (10.6 | ) | 3.5 | ||||||||
| U.S. state and local |
0.3 | (1.0 | ) | 0.3 | ||||||||
| Foreign |
(10.7 | ) | (0.2 | ) | (5.8 | ) | ||||||
| (8.6 | ) | (11.8 | ) | (2.0 | ) | |||||||
| Total income tax provision (benefit): |
||||||||||||
| U.S. federal |
1.9 | (10.6 | ) | 3.5 | ||||||||
| U.S. state and local |
0.4 | (3.2 | ) | — | ||||||||
| Foreign |
(5.4 | ) | 12.6 | 14.6 | ||||||||
| $ | (3.1 | ) | $ | (1.2 | ) | $ | 18.1 | |||||
The reconciliation between the income tax rate computed by applying the U.S. federal statutory rate and the reported worldwide effective tax rate on net income (loss) before income taxes is as follows:
| Year Ended | |||||||||
| December 27, | December 28, | December 30, | |||||||
| 2009 | 2008 | 2007 | |||||||
| U.S. federal statutory rate |
35.0 | % | 35.0 | % | 35.0 | % | |||
| U.S. state and local taxes, net of federal benefit |
4.4 | 1.1 | 3.7 | ||||||
| Foreign tax rate differential |
(16.6 | ) | (22.9 | ) | 18.0 | ||||
| Tax credits |
3.9 | 1.7 | (1.0 | ) | |||||
| Foreign withholding taxes |
(0.8 | ) | (0.8 | ) | — | ||||
| Goodwill impairment |
— | (12.5 | ) | — | |||||
| Non-deductible expenses |
(2.3 | ) | (2.2 | ) | 0.9 | ||||
| Change in valuation allowance |
(18.6 | ) | 1.3 | (34.6 | ) | ||||
| 4.9 | % | 0.7 | % | 22.0 | % | ||||
In conjunction with the acquisition of the power device business in 1999, the Korean government granted a ten-year tax holiday to Fairchild Korea Semiconductor Ltd. The original exemption was 100% for the first seven years of the holiday and 50% for the remaining three years of the holiday. In 2000, the tax holiday was extended such that the exemption amounts were increased to 78% in the eighth year and a 28% exemption was added to the eleventh year. The first year of the tax holiday in which Fairchild Korea Semiconductor Ltd. started providing for taxes was 2006. The tax rates for the remaining years of the Korean tax holiday are 13.75% for 2007 and 2008 and 17.52% for 2009. Taxes exempted include income taxes, dividend withholding taxes, acquisition tax, registration tax, property tax and aggregate land tax. Beginning in 2010, the tax rates for Korea will revert to the enacted statutory rate, which is 22% for 2010.
As one of the incentives for locating in the Suzhou Industrial Park, the Chinese government granted a ten year preferential income tax holiday to Fairchild Semiconductor (Suzhou) Co., Ltd. The holiday provides 100%
80
Table of Contents
exemption for the first five years of the holiday and 7.5% reduced rate from years six to ten commencing in the first year in which Fairchild Semiconductor (Suzhou) Co. Ltd. is profitable. In 2005, no provision for income taxes for Fairchild Semiconductor (Suzhou) Co., Ltd. was provided. In 2006 and 2007, a current provision for income taxes was provided for at the 7.5% rate. Although the unified enterprise income tax law passed in March 2007, changing the Chinese statutory rate to 25% effective 2008, the new law grandfathered enterprises currently receiving tax incentives for a maximum period of five years. In 2008, a current provision for income taxes was provided for at 9.0%. In 2009, a current provision for income taxes was provided for at 20%. Fairchild Semiconductor (Suzhou) Co., Ltd. will continue to receive its tax incentives with a transition over the next three years to the enacted statutory rate of 25%.
There was no material benefit in 2009 from tax holidays due to losses. The tax holidays reduced net loss by $7.3 million, or $0.06 per basic and diluted common share for the year ended December 28, 2008, increased net income by $5.4 million or $0.04 per basic and diluted common share for the year ended December 30, 2007.
The tax effects of temporary differences in the recognition of income and expense for tax and financial reporting purposes that give rise to significant portions of the deferred tax assets and the deferred tax liabilities at December 27, 2009 and December 28, 2008 are presented below:
| December 27, | December 28, | |||||||
| 2009 | 2008 | |||||||
| (In millions) | ||||||||
| Deferred tax assets: |
||||||||
| Net operating loss carryforwards |
$ | 60.2 | $ | 49.2 | ||||
| Reserves and accruals |
40.8 | 35.9 | ||||||
| Capitalized research expenses and intangibles |
24.3 | 36.1 | ||||||
| Tax credit and capital allowance carryovers |
94.6 | 83.8 | ||||||
| Unrealized loss on hedging transactions |
1.2 | 3.7 | ||||||
| Total gross deferred tax assets |
221.1 | 208.7 | ||||||
| Valuation allowance |
(209.1 | ) | (195.2 | ) | ||||
| Net deferred tax assets |
12.0 | 13.5 | ||||||
| Deferred tax liabilities: |
||||||||
| Plant and equipment |
(11.8 | ) | (23.0 | ) | ||||
| Capital allowance |
(5.6 | ) | (4.5 | ) | ||||
| Total deferred tax liabilities |
(17.4 | ) | (27.5 | ) | ||||
| Net deferred tax liabilities |
$ | (5.4 | ) | $ | (14.0 | ) | ||
Net deferred tax assets (liabilities) by jurisdiction are as follows:
| December 27, | December 28, | |||||||
| 2009 | 2008 | |||||||
| (In millions) | ||||||||
| U.S. |
$ | (20.4 | ) | $ | (18.4 | ) | ||
| Europe |
(0.2 | ) | (0.1 | ) | ||||
| Japan |
1.4 | 1.1 | ||||||
| China |
4.4 | 3.2 | ||||||
| Hong Kong |
2.3 | 3.0 | ||||||
| Malaysia |
(3.9 | ) | (4.3 | ) | ||||
| Singapore |
(0.1 | ) | (0.2 | ) | ||||
| Korea |
15.2 | 10.0 | ||||||
| Taiwan |
(4.2 | ) | (8.2 | ) | ||||
| Foreign - other |
0.1 | (0.1 | ) | |||||
| Net deferred tax liabilities |
$ | (5.4 | ) | $ | (14.0 | ) | ||
81
Table of Contents
Deferred tax assets and liabilities are classified in the consolidated balance sheet based on the classification of the related asset or liability. The deferred tax valuation allowance for the year ended December 27, 2009 and December 28, 2008 was $209.1 million and $195.2 million, respectively.
Gross carryforwards as of December 27, 2009 and December 28, 2008, respectively, for U.S. net operating losses (NOL) totaled $149.2 million and $128.0 million, for foreign tax credits totaled $50.9 million and $48.3 million, and for research and development credits totaled $7.7 million and $5.2 million. The net operating losses expire in 2023 through 2029. The foreign tax credits expire in 2010 through 2019. The research and development credits expire in varying amounts in 2010 through 2029. The company has unused Malaysian capital allowances totaling approximately $22.5 million and $17.1 million as of December 27, 2009 and December 28, 2008, respectively, which can be used to offset future years’ taxable income of those Malaysian subsidiaries.
The company’s ability to utilize its U.S. net operating loss and credit carryforwards may be limited in the future if the company experiences an ownership change, as defined in the Internal Revenue Code. An ownership change occurs when the ownership percentage of 5% or more stockholders changes by more than 50% over a three year period. In August 1999, the company experienced an ownership change as a result of its initial public offering. This ownership change did not result in a material limitation on the utilization of the loss and credit carryforwards. As of December 27, 2009, the company has not undergone a second ownership change.
Significant management judgment is required in determining the company’s provision for income taxes and in determining whether deferred tax assets will be realized. When it is more likely than not that all or some portion of specific deferred tax assets will not be realized, a valuation allowance must be established for the amount of the deferred tax assets that are determined not likely to be realizable. Realization is based on the company’s ability to generate sufficient future taxable income. A valuation allowance is determined in accordance with the Income Taxes Topic of the ASC , which requires an assessment of both positive and negative evidence when determining whether it is more likely than not that deferred tax assets are recoverable. Such assessment is required on a jurisdiction-by-jurisdiction basis. In 2005, a full valuation allowance on net U.S. deferred tax assets was recorded. The company continues to maintain a full valuation allowance on its net U.S. deferred tax assets until sufficient positive evidence exists to support reversal of the valuation allowance. Until such time that some or all of the valuation allowance is reversed, future income tax expense (benefit) in the U.S., excluding any tax expense generated by the company’s indefinite life intangibles, will be offset by adjustments to the valuation allowance to effectively eliminate any income tax expense or benefit in the U.S. Income taxes will continue to be recorded for other tax jurisdictions subject to the need for valuation allowances in those jurisdictions.
In 2008, a goodwill impairment charge was recorded. A portion of this impairment was allocable to goodwill that is tax deductible in the U.S. Since the recording of the valuation allowance in 2005, deferred tax expense totaling $11.5 million has been recorded relating to this goodwill. With the impairment, this expense has been reversed in 2008 and a deferred tax asset has been recorded to account for the tax basis in excess of book basis. A valuation allowance has been recorded against this deferred tax asset consistent with the overall valuation allowance maintained on all U.S. deferred tax assets.
As of December 27, 2009, the company’s valuation allowance for U.S. deferred tax assets totaled $178.0 million, which consists of the beginning of the year allowance of $168.0 million, a 2009 charge of $12.4 million to income from continuing operations and a benefit of $2.4 million to OCI. The valuation allowance reduces the carrying value of temporary differences generated by capital losses, capitalized research and development expenses, foreign tax credits, reserves and accruals, and NOL carryforwards, which would require sufficient future capital gains and future ordinary income in order to realize the tax benefits. If the company is ultimately able to utilize all or a portion of the deferred tax assets for which a valuation allowance has been established, then the related portion of the valuation allowance will be released to income from continuing operations, additional paid in capital or OCI.
82
Table of Contents
In 2008, a deferred tax asset and full valuation allowance was recorded in the amount of $24.8 million related to the company’s Malaysian cumulative reinvestment allowance and manufacturing incentives. As of December 27, 2009, the valuation allowance was $26.3 million which represented an increase of $3.1 million offset by a partial release of the allowance of $1.6 million because it is management’s assessment that this amount will be realizable. As of December 27, 2009 the company’s valuation allowance for Taiwan deferred tax assets totaled $4.2 million relating to the company’s Taiwanese R&D investment tax credits. In addition, as of December 27, 2009 the company’s valuation allowance for Taiwan’s subsidiary’s deferred tax assets totaled $0.7 million related to foreign tax credits and NOL carryforwards.
Deferred income taxes have not been provided for the undistributed earnings of the company’s foreign subsidiaries that are reinvested indefinitely. Deferred income taxes have been provided for the undistributed earnings of the company’s foreign subsidiaries that are part of the repatriation plan, which were immaterial at December 27, 2009. In addition, certain non-U.S. earnings, which have been taxed in the U.S. but earned offshore have and will continue to be part of the company’s repatriation plan. At December 27, 2009, the undistributed earnings of the company’s subsidiaries approximated $329.5 million. The amount of taxes attributable to these undistributed earnings is not practicably determinable.
The Income Tax Topic of the ASC prescribes a recognition threshold and measurement attribute for the financial statement recognition and measurement of a tax position taken or expected to be taken in a tax return. This statement also provides guidance on derecognition, classification, interest and penalties, accounting in the interim periods, disclosure, and transition. The company adopted the current standard on January 1, 2007. The unrecognized tax benefits at December 27, 2009 and December 28, 2008 total $66.9 million and $64.1 million respectively. Of the total unrecognized tax benefits at December 27, 2009 and December 28, 2008, $10.4 million and $9.7 million, respectively, would impact the effective tax rate, if recognized. The remaining unrecognized tax benefits would not impact the effective tax rate, if recognized, as the company has a full valuation allowance against its U.S. deferred taxes.
A reconciliation of the beginning and ending amount of unrecognized tax benefits is as follows (in millions):
| Balance at December 28, 2008 |
$ | 64.1 | ||
| Increases related to prior year tax positions |
2.7 | |||
| Decreases related to prior year tax positions |
(0.9 | ) | ||
| Increases related to current year tax positions |
1.7 | |||
| Settlements |
— | |||
| Lapse of statute |
(0.7 | ) | ||
| Balance at December 27, 2009 |
$ | 66.9 | ||
The company’s major tax jurisdictions are the U.S. and Korea. For the U.S., the company has open tax years dating back to 1999 due to the carryforward of tax attributes. In Korea, the company has five open tax years dating back to 2004.
As of December 27, 2009, the company had accrued for penalties and interest relating to uncertain tax positions totaling $1.8 million, consisting of the beginning of the year total of $1.6 million and an increase of $0.2 million during the year which was recognized as a component of income tax expense. To the extent penalties and interest are not assessed with respect to uncertain tax positions, amounts accrued will be reduced and reflected as a reduction of the overall income tax provision.
83
Table of Contents
NOTE 8—STOCK-BASED COMPENSATION
The Stock Compensation Topic of the ASC requires all share-based payments to employees, including grants of employee stock options, to be recognized in the income statement based on their fair values at the date of grant.
On December 26, 2005 (first day of fiscal 2006), the company adopted the current standard using the modified prospective method. Under this transition method, stock-based compensation cost recognized during 2009, 2008 and 2007 includes: (a) compensation cost for all share-based awards granted prior to but not yet vested as of December 25, 2005, based on the grant-date fair value estimated in accordance with the previous guidance under the Statement of Financial Accounting Standard (SFAS) 123, and (b) compensation cost for all share-based awards granted subsequent to December 25, 2005, based on the grant-date fair value estimated in accordance with the previous guidance under SFAS 123(R). The guidance under SFAS 123 and SFAS 123 (R) are now included in the Stock Compensation Topic of the ASC.
The company grants equity awards under the Fairchild Semiconductor 2007 Stock Plan. The company also maintains the 2000 Executive Stock Option Plan and the Fairchild Semiconductor Stock Plan. The company suspended its employee stock purchase plan in the fourth quarter of 2008. Fairchild Semiconductor 2007 Stock Plan replaced the Fairchild Semiconductor Stock Plan when the company’s stockholders approved the new plan on May 2, 2007. On that date the shares that remained available for grant under the Fairchild Semiconductor Stock Plan were assumed by the new plan and no further awards were granted under the Fairchild Semiconductor Stock Plan after that date. In addition, the company has occasionally granted equity awards outside its equity compensation plans when necessary.
Fairchild Semiconductor 2007 Stock Plan. Under this plan, officers, employees, non-employee directors, and certain consultants may be granted stock options, stock appreciation rights, restricted stock including restricted stock units (RSUs), performance units (PUs), deferred stock units (DSUs), and other stock-based awards. The plan has been approved by stockholders. The maximum number of shares of common stock that may be delivered under the plan is equal to 10,593,619 shares, plus shares available for issuance as of May 2, 2007, under the Fairchild Semiconductor Stock Plan and shares subject to outstanding awards under the Fairchild Semiconductor Stock Plan as of May 2, 2007, that cease for any reason to be subject to such awards. The maximum life of any option is ten years from the date of grant for incentive stock options and non-qualified stock options. Actual terms for outstanding non-qualified stock options are eight years, although options may be granted under the plan with up to ten year terms. Options granted under the plan are exercisable at the determination of the compensation committee, generally vesting ratably over four years. PUs are contingently granted depending on the achievement of certain predetermined performance goals. DSUs, RSUs and PUs entitle participants to receive one share of common stock for each DSU, RSU or PU awarded. For RSUs and PUs, the settlement date is the vesting date. For DSUs, the settlement date is selected by the participant at the time of the grant. Grants of PUs generally vest under the plan over a period of three years, and DSUs and RSUs generally vest over a period of three or four years.
Fairchild Semiconductor Stock Plan. The Fairchild Semiconductor Stock Plan authorizes shares of common stock to be issued upon the exercise of equity awards granted under the plan. The plan has been approved by stockholders. The plan was frozen when the Fairchild Semiconductor 2007 Stock Plan was approved on May 2, 2007, and awards are no longer granted under this plan. Under this plan, executives, key employees, non-employee directors and certain consultants were granted non-qualified stock options and RSUs, PUs, and DSUs. Options generally vest over four years with maximum terms ranging from eight to ten years. DSUs, RSUs and PUs entitle participants to receive one share of common stock for each DSU, RSU or PU awarded. For RSUs and PUs, the settlement date is the vesting date. For DSUs, the settlement date is selected by the participant at the time of the grant. Grants of PUs generally vest under the plan over a period of three years, and DSUs and RSUs generally vest over a period of three or four years.
84
Table of Contents
The 2000 Executive Stock Option Plan. The 2000 Executive Stock Option Plan authorizes up to 1,671,669 shares of common stock to be issued upon the exercise of options under the plan. The plan has been approved by stockholders. Individuals receiving options under the plan may not receive in any one year options to purchase more than 1,500,000 shares of common stock. Options generally vest over four years with a maximum term of ten years.
Employee Stock Purchase Plan (ESPP). The company began offering the Fairchild Semiconductor International, Inc. Employee Stock Purchase Plan on April 1, 2000. The ESPP has been approved by stockholders. The ESPP authorizes the issuance of up to 4,000,000 shares of common stock in quarterly offerings to eligible employees at a price that is equal to 85 percent of the lower of the common stock’s market price at the beginning or the end of a quarterly calendar period. A participating employee may withdraw from a quarterly offering any time before the purchase date at the end of the quarter, and obtain a refund of the amounts withheld through the employee’s payroll deductions. The company suspended the ESPP in the fourth quarter of 2008.
Equity Awards Made Outside Stockholder-Approved Plans. The company has granted equity awards representing a total of 820,000 shares outside its equity compensation plans. As of December 27, 2009, equity awards representing 280,000 shares remain outstanding, including 275,000 options and 5,000 RSUs.
On May 6, 2009, the company’s shareholders approved a proposal to allow for a stock option exchange program, designed to provide eligible employees an opportunity to exchange certain outstanding underwater stock options for a lesser amount of new RSUs. Stock options eligible for exchange were those with an exercise price per share greater than $14.37 that were granted on or before June 9, 2008. The company’s executive officers and members of the company’s board of directors were not eligible to participate in the stock option exchange program.
On June 9, 2009, the company commenced the option exchange program, which expired on July 7, 2009. A total of 6.1 million eligible options were tendered by employees, representing 74% of the total stock options eligible for the exchange. On July 7, 2009, the company granted an aggregate of 0.4 million new RSUs in exchange for the eligible stock options surrendered. The fair value of the new RSUs was $7.00, which was the closing price of the company’s common stock on July 7, 2009. The RSUs were granted under the Fairchild Semiconductor 2007 Stock Plan. With the assistance of a third party actuarial firm, the company determined the incremental value of the RSUs to be $0.5 million. The remaining compensation expense associated with the exchanged options and the new incremental expense will be amortized over the 4 year vesting period of the new RSUs.
The following table presents a summary of the company’s stock options for the year ended December 27, 2009.
| Year Ended | |||||||||||
| December 27, 2009 | |||||||||||
| Shares | Weighted Average Exercise Price |
Weighted Average Remaining Contractual Life |
Aggregate Intrinsic Value | ||||||||
| (000’s) | (In years) | (In millions) | |||||||||
| Outstanding at beginning of period |
20,030 | $ | 19.30 | ||||||||
| Granted |
9 | 4.39 | |||||||||
| Exercised |
(7 | ) | 1.18 | ||||||||
| Exchanged |
(6,112 | ) | 21.97 | ||||||||
| Forfeited |
(250 | ) | 15.40 | ||||||||
| Expired |
(2,545 | ) | 18.46 | ||||||||
| Outstanding at end of period |
11,125 | $ | 18.11 | 2.6 | $ | 0.3 | |||||
| Exercisable at end of period |
10,022 | $ | 18.65 | 2.2 | $ | 0.1 | |||||
85
Table of Contents
The weighted average grant-date fair value for options granted during the years ended December 27, 2009, December 28, 2008 and December 30, 2007 was $2.31, $4.82 and $7.80, respectively.
The following table presents a summary of the company’s DSUs for the year ended December 27, 2009.
| Year Ended | ||||||
| December 27, 2009 | ||||||
| Shares | Weighted Average Grant-date Fair Value | |||||
| (000’s) | ||||||
| Outstanding at beginning of period |
228 | $ | 17.10 | |||
| Granted |
60 | 5.72 | ||||
| Vested and released |
(60 | ) | 19.19 | |||
| Forfeited |
(7 | ) | 15.15 | |||
| Outstanding at end of period |
221 | $ | 13.53 | |||
The weighted average grant-date fair value for DSUs granted during the years ended December 28, 2008 and December 30, 2007 was $12.80 and $17.89, respectively. The total grant-date fair value for DSUs vested during the years ended December 27, 2009, December 28, 2008, and December 30, 2007 was $1.1 million, $2.3 million and $1.3 million, respectively. The number, weighted-average exercise price, aggregate intrinsic value and weighted average remaining contractual term for DSUs vested and outstanding is 116,333 units, zero (as these are zero strike price awards), $1.2 million and 1.6 years, respectively.
The company’s plan documents governing DSUs contain contingent cash settlement provisions upon a change of control. Accordingly, the company presents previously recorded expense associated with unvested and unsettled DSUs under the balance sheet caption “Temporary equity-deferred stock units” as required by Securities and Exchange Commission (SEC) Accounting Series Release 268 and the Distinguishing Liabilities from Equity Topic in the ASC.
The following table presents a summary of the company’s RSUs for the year ended December 27, 2009.
| Year Ended | ||||||
| December 27, 2009 | ||||||
| Shares | Weighted Average Grant-date Fair Value | |||||
| (000’s) | ||||||
| Nonvested at beginning of period |
1,387 | $ | 12.49 | |||
| Granted |
4,327 | 4.40 | ||||
| Vested |
(420 | ) | 12.94 | |||
| Forfeited |
(282 | ) | 6.75 | |||
| Nonvested at end of period |
5,012 | $ | 5.80 | |||
The weighted average grant-date fair value for RSUs granted during the years ended December 28, 2008 and December 30, 2007 was $9.32 and $17.66, respectively. The total grant-date fair value for RSUs vested during the year ended December 27, 2009, December 28, 2008, and December 30, 2007 was $ 5.4 million, $4.2 million and $1.5 million, respectively.
86
Table of Contents
The following table presents a summary of the company’s PUs for the year ended December 27, 2009.
| Year Ended | ||||||
| December 27, 2009 | ||||||
| Shares | Weighted Average Grant-date Fair Value | |||||
| (000’s) | ||||||
| Nonvested at beginning of period |
382 | $ | 18.16 | |||
| Granted |
1,676 | 4.10 | ||||
| Vested |
(260 | ) | 18.27 | |||
| Forfeited |
(109 | ) | 5.01 | |||
| Nonvested at end of period |
1,689 | $ | 4.66 | |||
The weighted average grant-date fair value for PUs granted during the years ended December 28, 2008 and December 30, 2007 was $5.25 and $17.80, respectively. The total grant-date fair value for PUs vested during the year ended December 27, 2009, December 28, 2008 and December 30, 2007 was $4.8 million, $6.1 million and $5.0 million, respectively.
The following table summarizes the total intrinsic value for stock options exercised and DSUs, RSUs and PUs vested (i.e. the difference between the market price at exercise and the price paid by employees to exercise the award) for 2009, 2008 and 2007, respectively.
| Year Ended | |||||||||
| December 27, 2009 |
December 28, 2008 |
December 30, 2007 | |||||||
| (In millions) | |||||||||
| Options |
$ | — | $ | 0.5 | $ | 10.7 | |||
| DSUs |
$ | 0.4 | $ | 1.6 | $ | 1.4 | |||
| RSUs |
$ | 2.5 | $ | 2.6 | $ | 1.4 | |||
| PUs |
$ | 1.3 | $ | 3.8 | $ | 4.8 | |||
The company’s practice is to issue shares of common stock upon exercise or settlement of options, DSUs, RSUs and PUs from previously unissued shares and to issue shares in connection with the ESPP from treasury shares, which are shares the company purchases in the open market. The ESPP plan was suspended in the fourth quarter of 2008 and was still suspended during 2009. As a result the company does not expect to repurchase shares in 2010 to satisfy ESPP participation. For the year ended December 27, 2009, an immaterial amount of cash was received from exercises of stock-based awards.
Valuation and Expense Information
The following table summarizes stock-based compensation expense by financial statement line, for the years ended December 27, 2009, December 28, 2008 and December 30, 2007.
| Year Ended | |||||||||
| December 27, 2009 |
December 28, 2008 |
December 30, 2007 | |||||||
| (In millions) | |||||||||
| Cost of Sales |
$ | 5.8 | $ | 4.5 | $ | 5.3 | |||
| Research and Development |
3.8 | 4.1 | 4.1 | ||||||
| Selling, General and Administrative |
7.9 | 10.5 | 15.4 | ||||||
| $ | 17.5 | $ | 19.1 | $ | 24.8 | ||||
87
Table of Contents
The company also capitalized $0.7 million and $(0.1) million of stock-based compensation into inventory for the years ended December 27, 2009, and both December 28, 2008 and December 30, 2007, respectively. In addition, due to the valuation allowance for U.S. deferred income tax assets recorded by the company, no tax benefit on U.S. based stock compensation expense was recognized in the years ended December 27, 2009, December 28, 2008 and December 30, 2007. The income tax benefit from foreign tax jurisdictions was approximately $0.1 million, and $0.2 million for the years ended December 28, 2008 and December 30, 2007, respectively. No material income tax benefit was recognized by foreign tax jurisdictions for the year ended December 27, 2009.
The following table summarizes total compensation cost related to unvested awards not yet recognized and the weighted average period over which it is expected to be recognized at December 27, 2009.
| December 27, 2009 | |||||
| Unrecognized Compensation Cost for Unvested Awards |
Weighted Average Remaining Recognition Period | ||||
| (In millions) | (In years) | ||||
| Options |
$ | 3.3 | 1.9 | ||
| DSUs |
$ | 0.1 | 1.4 | ||
| RSUs |
$ | 17.4 | 2.8 | ||
| PUs |
$ | 1.4 | 1.9 | ||
The fair value of each option grant for the company’s plans is estimated on the date of the grant using the Black-Scholes option pricing model with the following weighted average assumptions. The fair value of each DSU, RSU and PU is equal to the closing market price of the company’s common stock on the date of grant.
| Year Ended | |||||||||
| December 27, 2009 |
December 28, 2008 |
December 30, 2007 |
|||||||
| Expected volatility |
58.6 | % | 43.9 | % | 41.8 | % | |||
| Dividend yield |
— | — | — | ||||||
| Risk-free interest rate |
1.9 | % | 2.7 | % | 4.7 | % | |||
| Expected life, in years |
5.3 | 5.2 | 5.0 | ||||||
| Forfeiture rate |
8.1 | % | 7.6 | % | 6.7 | % | |||
Expected volatility. The company utilizes an average of implied volatility and the most recent historical volatility commensurate with expected life. Effective for fiscal year 2007, the company modified its volatility assumption to include an implied volatility factor. The company determined during the annual review of its volatility assumption that it would be appropriate to include implied volatility. The change in assumption was immaterial to stock-based compensation expense during 2007.
Dividend yield. The company does not pay a dividend, therefore this input is not applicable.
Risk-free interest rate. The company estimated the risk-free interest rate based on zero-coupon U.S. Treasury securities for a period that is commensurate with the expected life assumption.
Expected life. The company has evaluated expected life based on history and exercise patterns across its demographic population. The company believes that this historical data is the best estimate of the expected life of a new option, and that generally all groups of the company’s employees exhibit similar exercise behavior. Effective for fiscal year 2007, the company performed an annual review of the expected life assumption and determined that an expected life of 5.0 years is more indicative of actual exercise behavior than the previous 3.9 years. Accordingly, all grants for 2007 were assigned an expected life of 5.0 years. The change in assumption was immaterial to stock-based compensation expense during 2007. There was no material change to the expected life assumption during 2008 and 2009.
88
Table of Contents
Forfeiture rate. The amount of stock-based compensation recognized is based on the value of the portion of the awards that are ultimately expected to vest. Forfeitures are estimated at the time of grant and revised, if necessary, in subsequent periods if actual forfeitures differ from those estimates. The term “forfeitures” is distinguished from “cancellations” or “expirations” and represents only the unvested portion of the surrendered option. The company has applied an annual forfeiture rate of 8.1%, 8.2%, 2.9% and 5.5% to all unvested options, RSUs, DSUs and PUs, respectively, during 2009. This analysis is re-evaluated at least annually and the forfeiture rate is adjusted as necessary.
Prior to December 26, 2005 the company expensed all options and awards over the service period for each separately vesting tranche. The company switched to a straight-line attribution method on December 26, 2005 for all grants that include only a service condition. Due to the performance criteria, the company’s performance units will be expensed over the service period for each separately vesting tranche. The expense associated with the unvested portion of the pre-adoption grants will continue to be expensed over the service period for each separately vesting tranche.
NOTE 9—RETIREMENT PLANS
The company sponsors the Fairchild Personal Savings and Retirement Plan (the “Retirement Plan”), a contributory savings plan which qualifies under section 401(k) of the Internal Revenue Code. The Retirement Plan covers substantially all employees in the U.S. As of January 1, 2007, the company provided a discretionary matching contribution equal to 100% of employee elective deferrals on the first 3% of pay that is contributed to the Retirement Plan and 50% of the next 2% of pay contributed. The company’s matching contribution was suspended in the first quarter of 2009 due to economic conditions and reinstated in the fourth quarter of 2009. The company also maintains a non-qualified Benefit Restoration Plan, under which certain eligible employees who have otherwise exceeded annual IRS limitations for elective deferrals can continue to contribute to their retirement savings. The company matched employee elective deferrals to the Benefit Restoration Plan on the same basis as the Retirement Plan. The company’s matching contribution for this plan was suspended for the same period of time as the 401(k) plan. Total expense recognized under these plans was $2.2 million, $4.6 million and $5.6 million for 2009, 2008 and 2007, respectively.
Employees in Korea who have been with the company for over one year are entitled by Korean law to receive lump-sum payments upon termination of their employment. The payments are based on current rates of pay and length of service through the date of termination. It is the company’s policy to accrue for this estimated liability as of each balance sheet date. As of December 27, 2009 and December 28, 2008, $9.2 million and $9.3 million were included within other liabilities and $4.6 million and $4.7 million were included in current liabilities, respectively. Amounts recognized as expense were $6.4 million, $9.5 million and $10.1 million, for 2009, 2008 and 2007, respectively.
Employees in Malaysia participate in a defined contribution plan. The company has funded accruals for this plan in accordance with statutory regulations in Malaysia. Amounts recognized as expense for contributions made by the company under this plan were $1.6 million, $2.0 million and $1.8 million for 2009, 2008 and 2007, respectively.
Employees in Hong Kong participate in a defined contribution plan. The company has funded accruals for this plan in accordance with statutory regulations in Hong Kong. Amounts recognized as expense for contributions made by the company under this plan were $0.4 million and $1.6 million for 2009 and 2008, respectively, and was not material for 2007.
Employees in the United Kingdom, Italy, Germany, Finland, China, the Philippines, Japan and Taiwan are also covered by a variety of defined benefit or defined contribution pension plans that are administered consistent with local statutes and practices. The expense under each of the respective plans for 2009, 2008 and 2007 was not material to the consolidated financial statements.
89
Table of Contents
In accordance with the Compensation – Retirement Benefits Topic of the ASC the company recognizes the over-funded or under-funded status of its defined postretirement plans as an asset or liability in its statement of financial position. The company currently has defined benefit pension plans in Germany, Japan, the Philippines, and Taiwan. The net funded status for the company’s foreign defined benefit plans was $0.4 million and $1.9 million at December 27, 2009 and December 28, 2008, respectively, and was recognized as a liability in the consolidated statements of financial position. The company measures plan assets and benefit obligations as of the date of the fiscal year-end.
NOTE 10—LEASE COMMITMENTS
Rental expense related to certain facilities and equipment of the company’s plants was $19.6 million, $22.8 million and $24.0 million, for 2009, 2008 and 2007, respectively.
Certain facility and land leases contain renewal provisions. Future minimum lease payments under non-cancelable operating leases as of December 27, 2009 are as follows:
| Year ending December, |
(In millions) | ||
| 2010 |
$ | 11.8 | |
| 2011 |
8.5 | ||
| 2012 |
4.1 | ||
| 2013 |
2.7 | ||
| 2014 |
1.7 | ||
| Thereafter |
2.8 | ||
| $ | 31.6 | ||
NOTE 11—STOCKHOLDERS’ EQUITY
Preferred Stock
Under the company’s restated certificate of incorporation, the company’s Board of Directors has the authority to issue up to 100,000 shares of $0.01 par value preferred stock, but only in connection with the adoption of a stockholder rights plan. At December 27, 2009 and December 28, 2008, no shares were issued.
Common Stock
The company has authorized 340,000,000 shares of Common Stock at a par value of $.01 per share. The holders of Common Stock are entitled to cumulative voting rights in the election of directors and to one vote per share on all other matters submitted to a vote of the stockholders.
The company accounts for treasury stock acquisitions using the cost method. At December 27, 2009 and December 28, 2008, there were approximately 3.4 million treasury shares held by the company.
NOTE 12—RESTRUCTURING AND IMPAIRMENTS
The company assesses the need to record restructuring and impairment charges in accordance with the following Topics in the ASC; Exit and Disposal Cost Obligations, Compensation—Retirement Benefits, Compensation—Non Retirement Postemployment Benefits, and Property Plant and Equipment.
2007 Infrastructure Realignment Program
During 2007, the company recorded restructuring and impairment charges, net of releases, totaling $10.8 million. The charges included $6.8 million in employee separation costs, $0.2 million in contract cancellation costs, $3.1 million in asset impairment costs and $0.2 million in reserve releases, all associated with the 2007 Infrastructure Realignment Program. In addition, there were $0.9 million in employee separation costs recorded during 2007 associated with the 2006 Infrastructure Realignment Program.
90
Table of Contents
2008 Infrastructure Realignment Program
During 2008, the company recorded restructuring and impairment charges, net of releases, totaling $29.2 million. The charges included $14.0 million in employee separation costs, $1.9 million lease impairment costs, $12.2 million in asset impairment costs, $0.1 million in office closure costs and $0.3 million in reserve releases, all associated with the 2008 Infrastructure Realignment Program. In addition, there were $1.3 million in employee separation costs recorded during 2008 associated with the 2007 Infrastructure Realignment Program.
The 2008 Infrastructure Realignment Program includes costs related to several asset impairments for non-industry standard packaging capacity and simplification of our supply chain planning systems. The company also adjusted the workforce mix in our Maine fab as the company converted to a more automated and technologically advanced eight-inch wafer production process. In addition, headcount was reduced in certain sales and marketing activities to further streamline selling, general and administration costs.
2009 Infrastructure Realignment Program
During 2009, the company recorded restructuring and impairment charges, net of releases, totaling $27.9 million. The charges included $15.4 million in employee separation costs, $1.6 million in asset impairment costs, $4.0 million in facility closure costs and $0.1 million in reserve releases, all associated with the 2009 Infrastructure Realignment Program. In addition during 2009, the company recorded $7.0 million in employee separation costs, $0.7 million lease impairment costs and $0.6 million in reserve releases associated with the 2008 Infrastructure Realignment Program as well as $.01 million in reserve releases associated with the 2007 Infrastructure Realignment Program.
The 2009 Infrastructure Realignment Program includes costs associated with the closure of the Mountaintop, Pennsylvania manufacturing facility and the four-inch manufacturing line in Bucheon, South Korea, both of which were announced in the first quarter of 2009. The 2009 Program also includes charges for a smaller worldwide cost reduction plan to further right-size our company and remain financially healthy.
The following tables summarize the previously mentioned restructuring and impairment charges for 2007 through 2009 (in millions).
| Accrual Balance at 12/31/2006 |
New Charges |
Cash Paid |
Reserve Release |
Non-Cash Items |
Accrual Balance at 12/30/2007 | ||||||||||||||||
| 2005 Infrastructure Realignment Program: |
|||||||||||||||||||||
| Employee Separation Costs |
$ | 0.1 | $ | — | $ | (0.1 | ) | $ | — | $ | — | $ | — | ||||||||
| 2006 Infrastructure Realignment Program: |
|||||||||||||||||||||
| Employee Separation Costs |
0.9 | 0.9 | (1.8 | ) | — | — | — | ||||||||||||||
| 2007 Infrastructure Realignment Program: |
|||||||||||||||||||||
| Employee Separation Costs |
— | 6.8 | (3.4 | ) | (0.2 | ) | — | 3.2 | |||||||||||||
| Asset Impairment, Other |
— | 3.3 | (0.2 | ) | — | (3.1 | ) | — | |||||||||||||
| $ | 1.0 | $ | 11.0 | $ | (5.5 | ) | $ | (0.2 | ) | $ | (3.1 | ) | $ | 3.2 | |||||||
| Accrual Balance at 12/30/2007 |
New Charges |
Cash Paid |
Reserve Release |
Non-Cash Items |
Accrual Balance at 12/28/2008 | ||||||||||||||||
| 2007 Infrastructure Realignment Program: |
|||||||||||||||||||||
| Employee Separation Costs |
$ | 3.2 | $ | 1.3 | $ | (3.8 | ) | $ | (0.3 | ) | $ | — | $ | 0.4 | |||||||
| 2008 Infrastructure Realignment Program: |
|||||||||||||||||||||
| Employee Separation Costs |
— | 14.0 | (2.7 | ) | — | — | 11.3 | ||||||||||||||
| Asset Impairment, Other |
— | 12.2 | — | — | (12.2 | ) | — | ||||||||||||||
| Lease Impairment Costs |
— | 1.9 | (0.4 | ) | — | — | 1.5 | ||||||||||||||
| Office Closure Costs |
— | 0.1 | (0.1 | ) | — | — | — | ||||||||||||||
| $ | 3.2 | $ | 29.5 | $ | (7.0 | ) | $ | (0.3 | ) | $ | (12.2 | ) | $ | 13.2 | |||||||
91
Table of Contents
| Accrual Balance at 12/28/2008 |
New Charges |
Cash Paid |
Reserve Release |
Non-Cash Items |
Accrual Balance at 12/27/2009 | ||||||||||||||||
| 2007 Infrastructure Realignment Program: |
|||||||||||||||||||||
| Employee Separation Costs |
$ | 0.4 | $ | — | $ | (0.2 | ) | $ | (0.1 | ) | $ | — | $ | 0.1 | |||||||
| 2008 Infrastructure Realignment Program: |
|||||||||||||||||||||
| Employee Separation Costs |
11.3 | 7.0 | (17.3 | ) | (0.6 | ) | — | 0.4 | |||||||||||||
| Lease Impairment Costs |
1.5 | 0.7 | (0.6 | ) | — | — | 1.6 | ||||||||||||||
| 2009 Infrastructure Realignment Program: |
|||||||||||||||||||||
| Employee Separation Costs |
— | 15.4 | (7.2 | ) | (0.1 | ) | — | 8.1 | |||||||||||||
| Asset Impairment |
— | 1.6 | — | — | (1.6 | ) | — | ||||||||||||||
| Fab Closure Costs |
— | 4.0 | (4.0 | ) | — | — | — | ||||||||||||||
| $ | 13.2 | $ | 28.7 | $ | (29.3 | ) | $ | (0.8 | ) | $ | (1.6 | ) | $ | 10.2 | |||||||
The company has substantially completed payment of the remaining employee severance accruals related to the 2008 Infrastructure Realignment Program. Payouts associated with the 2008 lease impairment will be made on a regular basis and will be complete by the fourth quarter of 2011. The company previously announced that the consolidation of the South Korea fabrication processes and the closure of the Mountaintop facility would be completed by June 2010. However, as a result of increased demand for the products manufactured at these facilities, the company now expects to complete these actions during the second quarter of 2011. The company does not anticipate that this extension will have any significant impact on the cash and non-cash charges the company originally planned or upon the annualized rate of cost savings that the company expects to achieve once these closures are complete.
NOTE 13—RELATED PARTY TRANSACTIONS
On September 8, 2004, the company entered into a trust agreement with a third party, as Trustee, to secure the funding of post-retirement health insurance benefits previously granted under the employment agreements executed in 2000 with three former executive officers who retired from the company in 2005. The company contributed $2.25 million to the trust upon its creation. Each former executive is entitled to health care benefits for himself and his eligible dependents until the later of his or his spouse’s death. The trust will be used to pay health insurance premiums and reimbursable related expenses to satisfy these obligations. Upon a change in control, the company or its successor is obligated to contribute additional funds to the trust, if and to the extent necessary to provide all remaining health care benefits required under the employment agreements. The trust will terminate when the company’s obligation to provide the health care benefits ends, at which time any remaining trust assets will be returned to the company.
NOTE 14—COMMITMENTS AND CONTINGENCIES
The company has future commitments to purchase chemicals for certain wafer fabrication facilities. In the event the company was to end the agreements, the company would be required to pay future minimum payments of approximately $8.5 million.
The company’s facilities in South Portland, Maine and West Jordan, Utah have ongoing environmental remediation projects to respond to certain releases of hazardous substances that occurred prior to the leveraged recapitalization of the company from National Semiconductor. Pursuant to the Asset Purchase Agreement with National Semiconductor, National Semiconductor has agreed to indemnify the company for the future costs of these projects. The terms of the indemnification are without time limit and without maximum amount. The costs incurred to respond to these conditions were not material to the consolidated financial statements for any period presented. The carrying value of the liability at December 27, 2009 was $0.1 million.
92
Table of Contents
The company’s former Mountain View, California, facility is located on a contaminated site under the Comprehensive Environmental Response, Compensation and Liability Act. Under the terms of the Acquisition Agreement with Raytheon Company, Raytheon Company has assumed responsibility for all remediation costs or other liabilities related to historical contamination. The purchaser of the Mountain View, California property received an environmental indemnity from the company similar in scope to the one the company received from Raytheon. The purchaser and subsequent owners of the property can hold the company liable under the company’s indemnity for any claims, liabilities or damages it incurs as a result of the historical contamination, including any remediation costs or other liabilities related to the contamination. The company is unable to estimate the potential amounts of future payments; however, any future payments are not expected to have a material impact on the company’s earnings or financial condition.
Pursuant to the 1999 asset agreement to purchase the power device business of Samsung Electronics Co., Ltd., Samsung agreed to indemnify the company for remediation costs and other liabilities related to historical contamination, up to $150 million. The company is unable to estimate the potential amounts of future payments, if any; however, any future payments are not expected to have a material impact on the company’s earnings or financial condition.
The company’s facility in Mountaintop, Pennsylvania has an ongoing remediation project to respond to releases of hazardous materials that occurred prior to acquisition of the site from Intersil Corporation. Under the Asset Purchase Agreement with Intersil, Intersil indemnified the company for specific environmental issues. The terms of the indemnification are without time limit and without maximum amount.
Patent Litigation with Power Integrations, Inc. There are three outstanding proceedings with Power Integrations.
POWI 1: On October 20, 2004, the company and our wholly owned subsidiary, Fairchild Semiconductor Corporation, were sued by Power Integrations, Inc. in the U.S. District Court for the District of Delaware. Power Integrations alleged that certain of the company’s pulse width modulation (PWM) integrated circuit products infringed four Power Integrations U.S. patents, and sought a permanent injunction preventing the company from manufacturing, selling or offering the products for sale in the U.S., or from importing the products into the U.S., as well as money damages for past infringement.
The trial in the case was divided into three phases. The first phase, held in October 2006, was on infringement, the willfulness of any infringement, and damages. On October 10, 2006, a jury returned a verdict finding that thirty-three of the company’s PWM products infringe one or more of seven claims asserted in the four patents. The jury also found that the company willfully infringed the patents, and assessed damages against us in the amount of approximately $34 million. The second phase of the trial, held in September 2007 before a different jury, focused on the validity of the Power Integrations patents. On September 21, 2007 a jury returned a verdict in the second phase, finding that the four Power Integrations patents asserted against us are valid. The third phase of the trial began on September 21, 2007, and covered the enforceability of the patents. On September 24, 2008, the court ruled that the patents are enforceable.
On December 12, 2008 the judge overseeing the case reduced the jury’s October 10, 2006 damages award from approximately $34 million to approximately $6.1 million, and ordered a new trial on the issue of whether the company willfully infringed Power Integrations’ asserted patents. The court also issued a permanent injunction on a limited number of the company’s products enjoining the company from making, selling or offering to sell the products in the U.S., or from importing the products into the U.S. The injunction took effect on May 13, 2009. The company voluntarily stopped U.S. sales and importation of those products in 2007 and have been offering replacement products since 2006.
On June 22, 2009, the new trial on willfulness was held. The court has not issued a final ruling in the case. If the court in the new willfulness trial finds that our infringement was willful, the court will have discretion to
93
Table of Contents
increase the $6.1 million damages award by up to three times the amount of the award. Additionally, the court has awarded Power Integrations pre-judgment interest and may also require us to pay Power Integrations’ attorney’s fees.
The final damages award and injunction are subject to appeal and, regardless of the outcome of the willfulness trial, the company expects to challenge several aspects of the litigation on appeal. When the company appeals, the company likely will be required to post a bond or provide other security in an amount equal to the final damages award for the duration of the appeal process.
POWI 2: On May 23, 2008, Power Integrations filed another lawsuit against the company, Fairchild Semiconductor Corporation and our wholly owned subsidiary System General Corporation in the U.S. District Court for the District of Delaware, alleging infringement of three patents. Of the three patents claimed in this lawsuit, two are patents that were asserted against the company and Fairchild Semiconductor Corporation in the October 2004 lawsuit described above. As mentioned below, the majority of the claims asserted in the first lawsuit from these two patents have now received final rejections from the patent office, and the third patent has also received preliminary rejections. The company believes that it has strong defenses against Power Integrations’ claims and intends to vigorously defend this second lawsuit.
On October 14, 2008, Fairchild Semiconductor Corporation and System General Corporation filed a patent infringement lawsuit against Power Integrations in the U.S. District Court for the District of Delaware, alleging that certain PWM integrated circuit products infringe one or more claims of three U.S. patents owned by System General. The lawsuit seeks monetary damages and an injunction preventing the manufacture, use, sale, offer for sale or importation of Power Integrations products found to infringe the asserted patents.
Both lawsuits have been consolidated and will be heard together in Delaware District Court. The trial is currently scheduled for October 2010.
POWI 3: On November 4, 2009, Power Integrations, Inc. filed a complaint for patent infringement against the company and two of the company’s subsidiaries in the United States District Court for the Northern District of California alleging that several of our products infringe three of Power Integrations’ patents. The company intends to put on a vigorous defense against these claims.
Reexaminations: Parallel to the proceedings in Federal Court, the company has also petitioned the U.S. Patent and Trademark Office (USPTO) for reexamination of all unexpired patents claims asserted in POWI 1 and POWI 2 (those being all asserted claims from three of the four patents asserted in POWI 1 (the fourth patent has expired) and all of the patents asserted in POWI 2). Of the 24 claims at issue in the three patents from POWI 1, 22 have been finally rejected by the USPTO. In POWI 2, all claims from the third patent which was asserted against us (from the patent which was not previously asserted in POWI 1) have been initially rejected by the USPTO.
Patent Litigation with Infineon. On November 25, 2008, the company and Fairchild Semiconductor Corporation were sued by Infineon Technologies AG, Infineon Technologies Austria AG, and Infineon Technologies North America Corporation in the U.S. District Court for the District of Delaware. On December 28, 2009, we settled all claims arising out of this case and entered into a broad cross-license with Infineon related to semiconductor technology.
Other Legal Claims. From time to time the company is involved in legal proceedings in the ordinary course of business. The company believes that there is no such ordinary-course litigation pending that could have, individually or in the aggregate, a material adverse effect on our business, financial condition, results of operations or cash flows. Legal costs are expensed as incurred.
94
Table of Contents
The company has analyzed the potential litigation outcomes from our current litigation in accordance with the Contingency Topic of the FASB ASC. While the exact amount of these losses is not known, the company has recorded net reserves for potential litigation outcomes in the consolidated statement of operations, based upon our assessments of the potential liability using an analysis of the claims and historical experience in defending and/or resolving these claims. As of December 27, 2009, our balance for potential litigation outcomes was $6.7 million.
NOTE 15—FINANCIAL INSTRUMENTS
Derivative Financial Instruments
The company uses derivative instruments to manage exposures to changes in foreign currency exchange rates and interest rates. In accordance with the requirements of the Derivatives and Hedging Topic of the FASB ASC, the fair value of these hedges is recorded on the balance sheet. All of the company’s derivatives are traded in over-the-counter markets where quoted market prices are not readily available. For those derivatives, the company measures fair value using prices obtained from the counterparties with whom the company has traded. The counterparties price the derivatives based on models that use primarily market observable inputs, such as yield curves and option volatilities. Accordingly, the company classifies these derivatives as Level 2. (See Note 2 for further discussion of the fair value hierarchy under the Derivatives and Hedging Topic of the ASC.)
The following table presents the balances of assets and liabilities measured at fair value on a recurring basis as of December 27, 2009.
| Fair Value Measurements | ||||||||||||||
| Total | Quoted Prices in Active Markets for Identical Liabilities (Level 1) |
Significant Other Observable Inputs (Level 2) |
Significant Unobservable Inputs (Level 3) | |||||||||||
| (In millions) | ||||||||||||||
| Foreign Currency Derivatives |
||||||||||||||
| Assets |
$ | 1.5 | $ | — | $ | 1.5 | $ | — | ||||||
| Liabilities |
(0.2 | ) | — | (0.2 | ) | — | ||||||||
| Interest Rate Swap |
(1.8 | ) | — | (1.8 | ) | — | ||||||||
| $ | (0.5 | ) | $ | — | $ | (0.5 | ) | $ | — | |||||
The following table presents the balances of liabilities measured at fair value on a recurring basis as of December 28, 2008.
| Fair Value Measurements | ||||||||||||||
| Total | Quoted Prices in Active Markets for Identical Liabilities (Level 1) |
Significant Other Observable Inputs (Level 2) |
Significant Unobservable Inputs (Level 3) | |||||||||||
| (In millions) | ||||||||||||||
| Foreign Currency Derivatives |
$ | (4.1 | ) | $ | — | $ | (4.1 | ) | $ | — | ||||
| Interest Rate Swap |
(6.0 | ) | — | (6.0 | ) | — | ||||||||
| $ | (10.1 | ) | $ | — | $ | (10.1 | ) | $ | — | |||||
Foreign Currency Derivatives. The company uses currency forward and combination option contracts to hedge a portion of its forecasted foreign exchange denominated revenues and expenses. The company monitors its foreign currency exposures to maximize the overall effectiveness of its foreign currency hedge positions.
95
Table of Contents
Currencies hedged include the euro, Japanese yen, Philippine peso, Malaysian ringgit, Korean won and Chinese yuan. The company’s objectives for holding derivatives are to minimize the risks using the most effective methods to eliminate or reduce the impacts of these exposures. The maturities of the cash flow hedges are 12 months or less.
Changes in the fair value of derivative instruments related to time value are included in the assessment of hedge effectiveness. Hedge ineffectiveness, determined in accordance the Derivatives and Hedging Topic of the FASB ASC, did not have a material impact on earnings for the years ended December 27, 2009, December 28, 2008 and December 30, 2007. No cash flow hedges were derecognized or discontinued in 2009, 2008 and 2007.
Derivative gains and losses included in AOCI are reclassified into earnings at the time the forecasted transaction is recognized. The company estimates that $1.3 million of net unrealized derivative gains included in AOCI will be reclassified into earnings within the next twelve months.
The company also uses currency forward and combination option contracts to offset the foreign currency impact of balance sheet translation. These derivatives have one month terms and the initial fair value, if any, and the subsequent gains or losses on the change in fair value are reported in earnings within the same income statement line as the impact of the foreign currency translation.
Interest Rate Derivatives. The company’s variable-rate debt exposes the company to variability in interest payments due to changes in interest rates. The company uses a forward interest rate swap to mitigate the interest rate risk on a portion of its variable-rate borrowings in order to manage fluctuations in cash flows resulting from changes in interest rates on variable-rate debt. The swap expired on December 31, 2009.
Effectiveness of this hedge is calculated by comparing the fair value of the derivative to a hypothetical derivative that would be a perfect hedge of floating rate debt. The value of the hedge at inception was zero and ineffectiveness was immaterial as of December 27, 2009.
Derivative gains and losses included in AOCI are reclassified into earnings at the time the forecasted transaction is recognized. There are currently $1.8 million of unrealized losses included in AOCI. The amounts are subsequently reclassified into interest expense as a yield adjustment in the same period in which the related interest on the floating-rate debt obligations affect earnings.
The table below shows the notional principal and the location and amounts of the derivative fair values in the statement of operations and the consolidated balance sheet as of and for the periods ended December 27, 2009 and December 28, 2008. Pursuant to the Derivatives and Hedging Topic of the FASB ASC, the company nets the fair value of all derivative financial instruments with counterparties for which a master netting arrangement is utilized. The notional principal amounts for these instruments provide one measure of the transaction volume outstanding as of year-end and do not represent the amount of the company’s exposure to credit or market loss. The estimates of fair value are based on applicable and commonly used pricing models using prevailing financial market information as of December 27, 2009 and December 28, 2008. Although the following table reflects the notional principal and fair value of amounts of derivative financial instruments, it does not reflect the gains or losses associated with the exposures and transactions that these financial instruments are intended to hedge. The amounts ultimately realized upon settlement of these financial instruments, together with the gains and losses on the underlying exposures will depend on actual market conditions during the remaining life of the instruments.
96
Table of Contents
The following tables present derivatives designated as hedging instruments under the Derivatives and Hedging Topic of the FASB ASC.
| As of and for the Year Ended December 27, 2009 | |||||||||||||||||||||||
| Balance Sheet Classification |
Notional Amount |
Fair Value |
Amount of Gain (Loss) Recognized In AOCI |
Income Statement Classification of Gain (Loss) |
Amount of Gain (Loss) Recognized In Income |
Amount of Gain (Loss) Reclassified from AOCI |
|||||||||||||||||
| (In millions) | |||||||||||||||||||||||
| Derivatives in Cash Flow Hedges Related to Existing Assets and Liabilites |
|||||||||||||||||||||||
| Interest rate contract |
Current liabilities |
$ | 150.0 | $ | (1.8 | ) | $ | (1.8 | ) | Interest expense |
$ | (6.2 | ) | $ | (6.2 | ) | |||||||
| Derivatives in Cash Flow Hedges Related to Forecasted Transactions |
|||||||||||||||||||||||
| Foreign exchange contracts |
|||||||||||||||||||||||
| Derivatives for forecasted revenues |
Current liabilities |
$ | 21.2 | $ | (0.2 | ) | $ | (0.2 | ) | Revenue | $ | — | $ | — | |||||||||
| Derivatives for forecasted expenses |
Current assets |
63.4 | 1.5 | 1.5 | Expenses | — | — | ||||||||||||||||
| Derivatives for forecasted expenses |
Current liabilities |
14.5 | — | — | |||||||||||||||||||
| Total of derivatives in a net liability position |
$ | 99.1 | $ | 1.3 | $ | 1.3 | $ | — | $ | — | |||||||||||||
| Positions no longer open at quarter end |
$ | — | Revenue | $ | 1.0 | $ | 1.0 | ||||||||||||||||
| Positions no longer open at quarter end |
— | Expenses | (3.5 | ) | (3.5 | ) | |||||||||||||||||
| Total of positions no longer open at quarter end |
$ | — | $ | (2.5 | ) | $ | (2.5 | ) | |||||||||||||||
| As of and for the Year Ended December 28, 2008 | |||||||||||||||||||||||
| Balance Sheet Classification |
Notional Amount |
Fair Value |
Amount of Gain (Loss) Recognized In AOCI |
Income Statement Classification of Gain (Loss) |
Amount of Gain (Loss) Recognized In Income |
Amount of Gain (Loss) Reclassified from AOCI |
|||||||||||||||||
| (In millions) | |||||||||||||||||||||||
| Derivatives in Cash Flow Hedges Related to Existing Assets and Liabilites |
|||||||||||||||||||||||
| Interest rate contract |
Current liabilities |
$ | 150.0 | $ | (6.0 | ) | $ | (6.0 | ) | Interest expense |
$ | (2.2 | ) | $ | (2.2 | ) | |||||||
| Derivatives in Cash Flow Hedges Related to Forecasted Transactions |
|||||||||||||||||||||||
| Foreign exchange contracts |
|||||||||||||||||||||||
| Derivatives for forecasted revenues |
Current liabilities |
$ | 40.0 | $ | 0.5 | $ | 0.5 | Revenue | $ | (0.1 | ) | $ | — | ||||||||||
| Derivatives for forecasted expenses |
Current liabilities |
92.0 | (4.6 | ) | (4.6 | ) | Expenses | (0.1 | ) | — | |||||||||||||
| Total of derivatives in a net liability position |
$ | 132.0 | $ | (4.1 | ) | $ | (4.1 | ) | $ | (0.2 | ) | $ | — | ||||||||||
| Positions no longer open at quarter end |
$ | — | Revenue | $ | (2.1 | ) | $ | (2.1 | ) | ||||||||||||||
| Positions no longer open at quarter end |
— | Expenses | (8.6 | ) | (8.6 | ) | |||||||||||||||||
| Total of positions no longer open at quarter end |
$ | — | $ | (10.7 | ) | $ | (10.7 | ) | |||||||||||||||
97
Table of Contents
| Gain (Loss) Recognized in OCI for Derivative Instruments (1) | |||||||
| Year Ended | |||||||
| December 27, 2009 | December 28, 2008 | ||||||
| Interest rate contract |
$ | 4.2 | $ | (2.5 | ) | ||
| Foreign exchange contracts |
5.3 | (2.8 | ) | ||||
| $ | 9.5 | $ | (5.3 | ) | |||
| (1) | This amount is inclusive of both realized and unrealized gains and losses recognized in OCI. |
The following tables present derivatives not designated as hedging instruments under Derivatives and Hedging Topic of the FASB ASC.
| As of and for the Year Ended December 27, 2009 |
||||||||||||||
| Balance Sheet |
Notional Amount |
Fair Value | Income Statement Classification of Gain (Loss) |
Amount of Gain (Loss) Recognized In Income |
||||||||||
| (In millions) | ||||||||||||||
| Derivatives in Cash Flow Hedges Related to Existing Assets and Liabilites |
||||||||||||||
| Foreign Exchange Contracts |
||||||||||||||
| Derivatives related to existing assets |
Current liabilities | $ | 8.2 | $ | — | Revenue | $ | — | ||||||
| Derivatives related to existing liabilities |
Current liabilities | 6.8 | — | Expenses | — | |||||||||
| Total of derivatives in a net liability position |
$ | 15.0 | $ | — | $ | — | ||||||||
| Positions no longer open at year end |
Revenue | $ | 0.6 | |||||||||||
| Positions no longer open at year end |
Expenses | (0.8 | ) | |||||||||||
| Total of positions no longer open at year end |
$ | (0.2 | ) | |||||||||||
| As of and for the Year Ended December 28, 2008 | |||||||||||||||
| Balance Sheet Classification |
Notional Amount |
Fair Value |
Income Statement Classification of Gain (Loss) |
Amount of Gain (Loss) Recognized In Income |
|||||||||||
| (In millions) | |||||||||||||||
| Derivatives in Cash Flow Hedges Related to Existing Assets and Liabilities |
|||||||||||||||
| Foreign Exchange Contracts |
|||||||||||||||
| Derivatives related to existing assets |
Current liabilities | $ | 10.9 | $ | 0.3 | Revenue | $ | 0.3 | |||||||
| Derivatives related to existing liabilities |
Current liabilities | 14.4 | (0.2 | ) | Expenses | (0.2 | ) | ||||||||
| Total of derivatives in a net liability position |
$ | 25.3 | $ | 0.1 | $ | 0.1 | |||||||||
| Positions no longer open at year end |
Revenue | $ | (1.5 | ) | |||||||||||
| Positions no longer open at year end |
Expenses | (5.5 | ) | ||||||||||||
| Total of positions no longer open at year end |
$ | (7.0 | ) | ||||||||||||
Fair Value of Non Derivative Financial Instruments
Long term debt is carried at amortized cost. However, the company is required to estimate the fair value of long term debt under the Financial Instruments Topic of the ASC. The fair value of the term loan is determined utilizing current trading prices obtained from indicative market data on the term debt. The fair value of the revolving loan is assumed to be par as it is variable rate debt.
98
Table of Contents
A summary table of estimated fair values of other financial instruments is as follows:
| December 27, 2009 | December 28, 2008 | |||||||||||
| Carrying Amount |
Estimated Fair Value |
Carrying Amount |
Estimated Fair Value | |||||||||
| (In millions) | ||||||||||||
| Long-Term Debt: |
||||||||||||
| Term Loan |
$ | 472.2 | $ | 449.2 | $ | 515.8 | $ | 355.2 | ||||
| Revolving Credit Facility borrowings |
— | — | 19.4 | 19.4 | ||||||||
NOTE 16—OPERATING SEGMENT AND GEOGRAPHIC INFORMATION
Effective December 29, 2008 (first day of fiscal year 2009), the company realigned its operating segments and management structure and, accordingly, its segment reporting. Two product lines previously included in the Standard Products Group (SPG) were transferred into our Mobile, Computing, Consumer and Communications (MCCC) and Power Conversion, Industrial and Automotive (PCIA) groups. The realignment corresponds with the way the company manages the business and was designed to reduce costs and facilitate greater customer intimacy by moving from a product oriented structure to an application based structure. The majority of the company’s activities have now been realigned into two focus areas; MCCC, which focuses on handset, computing and multimedia applications, and PCIA, which focuses on power supply and motor control solutions. Each of these segments has a relatively small set of leading customers, common technology requirements and similar design cycles. The Standard Discrete and Standard Linear (SDT) business will continue to be managed separately as a third segment. All segment reporting within management’s discussion and analysis has been restated to reflect this change.
In addition to the operating segments mentioned above, the company also operates global operations, sales and marketing, information systems, finance and administration groups that are led by vice presidents who report to the Chief Executive Officer. As a result of a company-wide simplification effort, the allocation of selling, general and administrative (SG&A) expenses to the reporting segments was changed beginning in the first quarter of 2009. Starting in fiscal year 2009, the company only includes dedicated, direct SG&A spending by the segments in the calculation of their operating income. All other corporate level SG&A spending is now included in the corporate category. Prior periods have been restated to reflect this change. The company does not allocate income taxes or interest expense to its operating segments as the operating segments are principally evaluated on operating profit before interest and taxes.
The company does not specifically identify and allocate all assets by operating segment. It is the company’s policy to fully allocate depreciation and amortization to its operating segments. Operating segments do not sell products to each other, and accordingly, there are no inter-segment revenues to be reported. The accounting policies for segment reporting are the same as for the company as a whole.
99
Table of Contents
The following table presents selected statement of operations information on reportable segments for 2009, 2008 and 2007.
| Year Ended | ||||||||||||
| December 27, 2009 |
December 28, 2008 |
December 30, 2007 |
||||||||||
| (In millions) | ||||||||||||
| Revenue and Operating Income (Loss): |
||||||||||||
| MCCC |
||||||||||||
| Total revenue |
$ | 525.7 | $ | 748.9 | $ | 769.1 | ||||||
| Operating income |
74.2 | 171.0 | 179.0 | |||||||||
| PCIA |
||||||||||||
| Total revenue |
533.5 | 657.5 | 714.7 | |||||||||
| Operating income |
71.6 | 107.6 | 124.8 | |||||||||
| SDT |
||||||||||||
| Total revenue |
128.3 | 167.8 | 186.4 | |||||||||
| Operating income |
9.8 | 9.4 | 15.5 | |||||||||
| Corporate |
||||||||||||
| Restructuring and impairments expense |
(27.9 | ) | (29.2 | ) | (10.8 | ) | ||||||
| Stock-based compensation expense |
(17.5 | ) | (19.1 | ) | (24.8 | ) | ||||||
| Goodwill impairment charge |
— | (203.3 | ) | — | ||||||||
| Selling, general and administrative expense |
(140.3 | ) | (166.2 | ) | (171.2 | ) | ||||||
| Other (1) |
(14.8 | ) | 3.3 | (10.2 | ) | |||||||
| Total Consolidated |
||||||||||||
| Total revenue |
$ | 1,187.5 | $ | 1,574.2 | $ | 1,670.2 | ||||||
| Operating income (loss) |
$ | (44.9 | ) | $ | (126.5 | ) | $ | 102.3 | ||||
| (1) | In 2009, Other includes a $6.0 million charge for litigation settlement and $8.8 million in accelerated depreciation related to the closure of the Mountaintop facility. In 2008, Other includes a release of $3.3 million for potential litigation outcomes (See Note 14). In 2007, Other includes $9.5 million in charges for potential litigation outcomes, net (See Note 14), a net loss of $0.4 million on the sale of a product line and $0.3 million of other expense. |
Depreciation and amortization by reportable operating segment were as follows:
| Year Ended | |||||||||
| December 27, 2009 |
December 28, 2008 |
December 30, 2007 | |||||||
| (In millions) | |||||||||
| MCCC |
$ | 70.6 | $ | 61.4 | $ | 58.4 | |||
| PCIA |
77.4 | 63.8 | 58.1 | ||||||
| SPG |
12.4 | 11.4 | 10.5 | ||||||
| Total |
$ | 160.4 | $ | 136.6 | $ | 127.0 | |||
100
Table of Contents
Geographic revenue information is based on the customer location within the indicated geographic region. Revenue by geographic region was as follows:
| Year Ended | |||||||||
| December 27, 2009 |
December 28, 2008 |
December 30, 2007 | |||||||
| (In millions) | |||||||||
| Total Revenue: |
|||||||||
| U.S. |
$ | 95.0 | $ | 125.9 | $ | 150.3 | |||
| Other Americas |
47.5 | 47.2 | 50.1 | ||||||
| Europe |
142.5 | 204.7 | 200.4 | ||||||
| China |
427.5 | 488.0 | 484.5 | ||||||
| Taiwan |
190.0 | 314.8 | 350.7 | ||||||
| Korea |
154.4 | 204.7 | 217.1 | ||||||
| Other Asia/Pacific |
130.6 | 188.9 | 217.1 | ||||||
| Total |
$ | 1,187.5 | $ | 1,574.2 | $ | 1,670.2 | |||
Other Asia/Pacific includes Japan, Singapore, and Malaysia.
Geographic property, plant and equipment balances as of December 27, 2009 and December 28, 2008 are based on the physical locations within the indicated geographic areas and are as follows:
| December 27, 2009 |
December 28, 2008 | |||||
| (In millions) | ||||||
| Property, Plant & Equipment, Net: |
||||||
| U.S. |
$ | 257.0 | $ | 279.5 | ||
| Korea |
128.8 | 152.9 | ||||
| Philippines |
58.4 | 61.1 | ||||
| Malaysia |
85.8 | 99.2 | ||||
| China |
111.4 | 124.2 | ||||
| All Others |
11.8 | 14.7 | ||||
| Total |
$ | 653.2 | $ | 731.6 | ||
NOTE 17—ACQUISITIONS AND DIVESTURES
On March 3, 2009, the company purchased certain assets for approximately $1.5 million in cash. The acquisition was made to augment the company’s analog signal path design resources and intellectual property portfolio. The transaction was accounted for as an asset purchase with the purchase price allocated mainly to developed technology, which is being amortized over the estimated useful life of 5 years.
On January 2, 2007, the company launched a tender offer in Taiwan to acquire 100% of the outstanding shares of Taipei-based System General. System General is a leading supplier of analog power management semiconductors for AC/DC offline power conversion in computers, LCD monitors, printers, chargers, and consumer products. At the closing of the tender offer on February 5, 2007, 65,459,517 shares of System General stock were acquired, representing approximately 95.6% of System General’s outstanding shares. The company acquired the remaining System General shares effective August 3, 2007. The total amount paid in cash for the 100% interest, net of cash acquired, was approximately $179.8 million.
As of August 3, 2007, the operating results of System General are included in the accompanying consolidated financial statements based on 100% ownership of System General. From February 5, 2007 to August 3, 2007, the operating results of System General were included in the accompanying consolidated
101
Table of Contents
financial statements based on the 95.6% ownership interest. In connection with the acquisition, the company recorded a charge of $3.9 million for in-process research and development during 2007. The company also acquired goodwill of approximately $135.1 million with the remainder of the purchase price in excess of the fair value of net tangible assets allocated to various other intangible assets. The purchase price allocation as of December 30, 2007 was based on the company’s estimate of the fair value of identifiable intangible and net tangible assets acquired. The final purchase price allocation was completed in 2008.
No proforma results of operations are presented because System General does not constitute a significant subsidiary.
On September 5, 2007, the company announced the sale of selected assets of the Radio Frequency product line to ANADIGICS, Inc. for approximately $1.5 million, net of cash expended for transaction fees. As a result of the sale, the company recorded a net loss of $0.4 million during the third quarter of 2007.
NOTE 18—UNAUDITED QUARTERLY FINANCIAL INFORMATION
The following is a summary of unaudited quarterly financial information for 2009 and 2008 (in millions, except per share amounts):
| 2009 | |||||||||||||||
| First | Second | Third | Fourth | ||||||||||||
| Total revenue |
$ | 223.3 | $ | 277.9 | $ | 331.8 | $ | 354.5 | |||||||
| Gross margin |
34.0 | 64.6 | 86.3 | 105.4 | |||||||||||
| Net income (loss) |
(51.1 | ) | (24.9 | ) | 2.7 | 13.1 | |||||||||
| Basic income (loss) per common share |
$ | (0.41 | ) | $ | (0.20 | ) | $ | 0.02 | $ | 0.11 | |||||
| Diluted income (loss) per common share |
$ | (0.41 | ) | $ | (0.20 | ) | $ | 0.02 | $ | 0.10 | |||||
| 2008 | |||||||||||||||
| First | Second | Third | Fourth | ||||||||||||
| Total revenue |
$ | 406.3 | $ | 418.7 | $ | 428.3 | $ | 320.9 | |||||||
| Gross margin |
122.5 | 119.6 | 128.2 | 85.1 | |||||||||||
| Net income (loss) |
17.1 | 6.9 | 26.7 | (218.1 | ) | ||||||||||
| Basic income (loss) per common share |
$ | 0.14 | $ | 0.06 | $ | 0.21 | $ | (1.76 | ) | ||||||
| Diluted income (loss) per common share |
$ | 0.14 | $ | 0.05 | $ | 0.21 | $ | (1.76 | ) | ||||||
NOTE 19—SUBSEQUENT EVENTS
The company has evaluated subsequent events through February 25, 2010, which represents the date the financial statements were issued. The company did not identify any subsequent events that required disclosure.
102
Table of Contents
| ITEM 9. | CHANGES IN AND DISAGREEMENTS WITH ACCOUNTANTS ON ACCOUNTING AND FINANCIAL DISCLOSURE |
Not applicable.
| ITEM 9A. | CONTROLS AND PROCEDURES |
Disclosure Controls and Procedures
Our management, with participation of our Chief Executive Officer and Chief Financial Officer, evaluated the effectiveness of our disclosure controls and procedures (as defined in Rules 13a-15(e) and 15d-15(e) under the Securities Exchange Act of 1934, as amended (the “Exchange Act”)) as of December 27, 2009, the end of the period covered by this report. Based on their evaluation, our Chief Executive Officer and Chief Financial Officer concluded that our disclosure controls and procedures are effective as of December 27, 2009 at a reasonable assurance level.
Management Report on Internal Control over Financial Reporting
Management, including the Chief Executive Officer and Chief Financial Officer, is responsible for establishing and maintaining adequate internal control over financial reporting (as defined in Exchange Act Rule 13a-15(f)) to provide reasonable assurance regarding the reliability of our financial reporting and the preparation of financial statements for external purposes in accordance with generally accepted accounting principles.
Fairchild Semiconductor’s management assessed the effectiveness of the company’s internal control over financial reporting as of December 27, 2009. In making this assessment, management used the criteria set forth in Internal Control—Integrated Framework issued by the Committee of Sponsoring Organizations of the Treadway Commission (COSO). Based on that assessment, management believes that, as of December 27, 2009, the company’s internal control over financial reporting was effective.
KPMG LLP, our independent registered public accounting firm, has audited the effectiveness of Fairchild’s internal control over financial reporting as of December 27, 2009, and has issued a report which is included herein.
Changes in Internal Control over Financial Reporting
There were no changes in the company’s internal controls over financial reporting during our quarter ended December 27, 2009 that have materially affected, or are reasonably likely to materially affect, the company’s internal control over financial reporting.
| ITEM 9B. | OTHER INFORMATION |
Not Applicable.
103
Table of Contents
PART III
| ITEM 10. | DIRECTORS, EXECUTIVE OFFICERS AND CORPORATE GOVERNANCE |
Code of Business Conduct and Ethics
We have adopted a Code of Business Conduct and Ethics for our senior officers which we believe satisfies the standards promulgated by the Securities and Exchange Commission and the New York Stock Exchange. Our code applies to all directors, officers and employees, including our chief executive officer, our chief financial officer and our principal accounting officer and controller. Our current Code of Business Conduct and Ethics was filed as an exhibit to our current report on Form 8-K on January 31, 2006. Our Code of Business Conduct and Ethics is posted on our website, and can be accessed by visiting our investor relations web site at http://investor.fairchildsemi.com and clicking on “Corporate Governance.”
The information regarding directors set forth under the caption “Proposal 1 — Election of Directors” appearing in our definitive proxy statement for the Annual Meeting of Stockholders to be held on May 5, 2010, which will be filed with the Securities and Exchange Commission not later than 120 days after December 27, 2009 (the “2010 Proxy Statement”), is incorporated by reference.
The information regarding executive officers set forth under the caption “Executive Officers” in Item 1 of this Annual Report on Form 10-K is incorporated by reference.
The information set forth under the caption “Section 16(a) Beneficial Ownership Reporting Compliance” in the 2010 Proxy Statement is incorporated by reference.
The information regarding our Audit Committee, and its members, as set forth under the heading “Corporate Governance, Board Meetings and Committees” in the 2010 Proxy Statement is incorporated by reference.
| ITEM 11. | EXECUTIVE COMPENSATION |
The information set forth under the captions “Compensation Discussion and Analysis,” “Executive Compensation” and “Director Compensation” in the 2010 Proxy Statement is incorporated by reference.
The information regarding our Compensation Committee, and its members, as set forth under the heading “Corporate Governance, Board Meetings and Committees” in the 2010 Proxy Statement is incorporated by reference.
| ITEM 12. | SECURITY OWNERSHIP OF CERTAIN BENEFICIAL OWNERS AND MANAGEMENT AND RELATED STOCKHOLDER MATTERS |
The information set forth under the caption “Stock Ownership by 5% Stockholders, Directors and Certain Executive Officers” in the 2010 Proxy Statement is incorporated by reference.
The information regarding our equity compensation plans as set forth under the caption “Securities Authorized for Issuance Under Equity Compensation Programs” in Item 5 of this annual report on Form 10-K is incorporated by reference.
| ITEM 13. | CERTAIN RELATIONSHIPS AND RELATED TRANSACTIONS, AND DIRECTOR INDEPENDENCE |
The information set forth under the captions “Transactions with Related Persons” and “Policies and Procedures for Approval of Related Party Transactions” in the 2010 Proxy Statement is incorporated by reference.
104
Table of Contents
The information regarding director independence set forth under the caption “Corporate Governance, Board Meetings and Committees” in the 2010 Proxy Statement is incorporated by reference.
| ITEM 14. | PRINCIPAL ACCOUNTANT’S FEES AND SERVICES |
The information set forth under the caption “Independent Registered Public Accounting Firm” included under the proposal entitled “Proposal 5 – Ratify Appointment of KPMG LLP as Independent Registered Public Accounting Firm of the Company for 2010” in the 2010 Proxy Statement is incorporated by reference.
| ITEM 15. | EXHIBITS AND FINANCIAL STATEMENT SCHEDULES |
| (a) | (1) Financial Statements. Financial Statements included in this annual report are listed under Item 8. |
| (2) | Financial Statement Schedules. Financial Statement schedules included in this report are listed under Item 15(b). |
| (3) | List of Exhibits. See the Exhibit Index beginning on page 107 of this annual report. |
| (b) | Financial Statement Schedules. |
| Schedule | II — Valuation and Qualifying Accounts |
105
Table of Contents
Schedule II — Valuation and Qualifying Accounts.
All other schedules are omitted because of the absence of the conditions under which they are required or because the information required by such omitted schedules are set forth in the financial statements or the notes thereto.
| Description |
Price Protection |
Product Returns |
Other Returns and Allowances |
Deferred Tax Valuation Allowance |
Total | |||||||||||||||
| (In millions) | ||||||||||||||||||||
| Balances at December 31, 2006 |
$ | 23.1 | $ | 13.2 | $ | 4.1 | $ | 195.6 | $ | 236.0 | ||||||||||
| Charged to costs and expenses, or revenues |
70.6 | 26.3 | 5.9 | (29.1 | ) | 73.7 | ||||||||||||||
| Deductions |
(69.3 | ) | (29.4 | ) | (7.0 | ) | — | (105.7 | ) | |||||||||||
| Charged to other accounts |
— | — | — | — | — | |||||||||||||||
| Balances at December 30, 2007 |
24.4 | 10.1 | 3.0 | 166.5 | 204.0 | |||||||||||||||
| Charged to costs and expenses, or revenues |
27.0 | 17.7 | 7.1 | — | 51.8 | |||||||||||||||
| Deductions |
(28.9 | ) | (17.3 | ) | (7.2 | ) | 3.6 | (49.8 | ) | |||||||||||
| Charged to other accounts |
0.1 | 0.1 | — | 25.1 | 25.3 | |||||||||||||||
| Balances at December 28, 2008 |
22.6 | 10.6 | 2.9 | 195.2 | 231.3 | |||||||||||||||
| Charged to costs and expenses, or revenues |
54.6 | 27.3 | 5.6 | 16.4 | 103.9 | |||||||||||||||
| Deductions |
(59.9 | ) | (26.6 | ) | (4.3 | ) | — | (90.9 | ) | |||||||||||
| Charged to other accounts |
(0.0 | ) | (0.0 | ) | (0.0 | ) | (2.5 | ) | (2.5 | ) | ||||||||||
| Balances at December 27, 2009 |
$ | 17.3 | $ | 11.3 | $ | 4.2 | $ | 209.1 | $ | 241.9 | ||||||||||
106
Table of Contents
| Exhibit No. |
Description | |
| 3.01 | Second Restated Certificate of Incorporation. (5) | |
| 3.02 | Bylaws, as amended through December 5, 2007. (16) | |
| 4.01 | The relevant portions of the Second Restated Certificate of Incorporation. (included in Exhibit 3.05) | |
| 10.01 | Credit Agreement, dated as of June 26, 2006. (13) | |
| 10.02* | Executive Severance Policy. (14) | |
| 10.03* | Form of Executive Severance Policy Designation and Agreement (Non-California Employees). (17) | |
| 10.04* | Form of Executive Severance Policy Designation and Agreement (California Employees). (17) | |
| 10.05 | Technology Licensing and Transfer Agreement, dated March 11, 1997, between National Semiconductor Corporation and Fairchild Semiconductor Corporation. (3) | |
| 10.06 | Environmental Side Letter, dated March 11, 1997, between National Semiconductor Corporation and Fairchild Semiconductor Corporation. (1) | |
| 10.07* | Fairchild Benefit Restoration Plan. (1) | |
| 10.08* | Fairchild Incentive Plan. (1) | |
| 10.09* | Fairchild Semiconductor International, Inc. 2000 Executive Stock Option Plan. (4) | |
| 10.10 | Incremental Term Loan Commitment Agreement dated as of May 16, 2008. (19) | |
| 10.11* | Fairchild Semiconductor International, Inc. Employees Stock Purchase Plan. | |
| 10.12* | Non-Qualified Stock Option Agreement, dated December 1, 2004, between Fairchild Semiconductor International, Inc. and Mark S. Thompson. (7) | |
| 10.13* | Non-Qualified Stock Option Agreement under the Fairchild Semiconductor Stock Plan dated July 15, 2005, between Fairchild Semiconductor International, Inc. and Mark S. Thompson. (9) | |
| 10.14* | Fairchild Semiconductor Stock Plan. (11) | |
| 10.15* | Form of Non-Qualified Stock Option Agreement under the Fairchild Semiconductor Stock Plan. (6) | |
| 10.16* | Form of Deferred Stock Unit Agreement under the Fairchild Semiconductor Stock Plan. (6) | |
| 10.17* | Form of Deferred Stock Unit Agreement for non-employee directors under the Fairchild Semiconductor Stock Plan. (8) | |
| 10.18* | Form of Performance Unit Award Agreement under the Fairchild Semiconductor Stock Plan. (9) | |
| 10.19* | Form of Restricted Stock Unit Award Agreement under the Fairchild Semiconductor Stock Plan. (12) | |
| 10.20* | Restricted Stock Unit Award Agreement under the Fairchild Semiconductor Stock Plan dated February 10, 2006, between Fairchild Semiconductor International, Inc. and Mark
S. Thompson. (12) | |
| 10.21* | Restricted Stock Unit Award Agreement under the Fairchild Semiconductor Stock Plan dated February 27, 2006, between Fairchild Semiconductor International, Inc. and Mark S. Frey. (12) | |
| 10.22* | Employment Agreement, dated as of December 9, 2009 between Mark S. Thompson, Fairchild Semiconductor International, Inc. and Fairchild Semiconductor Corporation. | |
| 10.23 | Intellectual Property License Agreement, dated April 13, 1999, between Samsung Electronics Co. Ltd. and Fairchild Korea Semiconductor Ltd. (2) | |
| 10.24 | Intellectual Property Assignment and License Agreement, dated December 29, 1997, between Raytheon Semiconductor, Inc. and Raytheon Company. (20) | |
| 10.25* | Fairchild Semiconductor 2007 Stock Plan. (18) | |
| 10.26* | Form of Restricted Stock Unit Award Agreement under the Fairchild Semiconductor 2007 Stock Plan. (15) | |
| 10.27* | Form of Performance Unit Award Agreement under the Fairchild Semiconductor 2007 Stock Plan. (15) | |
| 10.28* | Form of Non-Qualified Stock Option Agreement under the Fairchild Semiconductor 2007 Stock Plan. (15) |
107
Table of Contents
| Exhibit No. |
Description | |
| 10.29* | Form of Deferred Stock Unit Agreement for non-employee directors under the Fairchild Semiconductor 2007 Stock Plan. (15) | |
| 10.30* | Service Agreement dated as of May 18, 2005, between Fairchild Semiconductor Pte., Ltd. and Allan Lam. (17) | |
| 14.01 | Code of Business Conduct and Ethics. (10) | |
| 21.01 | List of Subsidiaries. | |
| 23.01 | Consent of KPMG LLP. | |
| 31.01 | Section 302 Certification of the Chief Executive Officer. | |
| 31.02 | Section 302 Certification of the Chief Financial Officer. | |
| 32.01 | Certification, pursuant to 18 U.S.C. 1350, as adopted pursuant to Section 906 of the Sarbanes-Oxley Act of 2002, by Mark S. Thompson. | |
| 32.02 | Certification, pursuant to 18 U.S.C. 1350, as adopted pursuant to Section 906 of the Sarbanes-Oxley Act of 2002, by Mark S. Frey. |
* Management contracts or compensation plans or arrangements in which directors or executive officers are eligible to participate.
| (1) | Incorporated by reference from Fairchild Semiconductor Corporation’s Registration Statement on Form S-4, filed May 12, 1997 (File No. 333-26897). |
| (2) | Incorporated by reference from Amendment No. 1 to Fairchild Semiconductor International, Inc.’s Registration Statement on Form S-1, filed June 30, 1999 (File No. 333-78557). |
| (3) | Incorporated by reference from Amendment No. 3 to Fairchild Semiconductor Corporation’s Registration Statement on Form S-4, filed July 9, 1997 (File No. 333-28697). |
| (4) | Incorporated by reference from Fairchild Semiconductor International, Inc.’s Quarterly Report on Form 10-Q for the quarter ended July 2, 2000, filed August 16, 2000. |
| (5) | Incorporated by reference from Fairchild Semiconductor International, Inc.’s Quarterly Report on Form 10-Q for the quarter ended March 28, 2004, filed May 7, 2004. |
| (6) | Incorporated by reference from Fairchild Semiconductor International Inc.’s Registration Statement on Form S-8, filed October 7, 2004 (File No. 333-119595). |
| (7) | Incorporated by reference from Fairchild Semiconductor International, Inc.’s current report on Form 8-K, filed December 3, 2004. |
| (8) | Incorporated by reference from Fairchild Semiconductor International, Inc.’s Quarterly Report on Form 10-Q for the quarter ended June 26, 2005, filed August 5, 2005. |
| (9) | Incorporated by reference from Fairchild Semiconductor International, Inc.’s Quarterly Report on Form 10-Q for the quarter ended September 25, 2005, filed November 4, 2005. |
| (10) | Incorporated by reference from Fairchild Semiconductor International, Inc.’s current report on Form 8-K, filed January 31, 2006. |
| (11) | Incorporated by reference from Fairchild Semiconductor International, Inc.’s current report on Form 8-K, filed May 5, 2006. |
| (12) | Incorporated by reference from Fairchild Semiconductor International, Inc.’s Quarterly Report on Form 10-Q for the quarter ended April 2, 2006, filed May 12, 2006. |
| (13) | Incorporated by reference from Fairchild Semiconductor International, Inc.’s Quarterly Report on Form 10-Q for the quarter ended July 2, 2006, filed August 9, 2006. |
| (14) | Incorporated by reference from Fairchild Semiconductor International, Inc.’s Annual Report on Form 10-K for the fiscal year ended December 31, 2006, filed March 1, 2007. |
| (15) | Incorporated by reference from Fairchild Semiconductor International, Inc.’s Quarterly Report on Form 10-Q for the quarter ended July 1, 2007, filed August 9, 2007. |
| (16) | Incorporated by reference from Fairchild Semiconductor International, Inc.’s current report on Form 8-K, filed December 11, 2007. |
| (17) | Incorporated by reference from Fairchild Semiconductor International, Inc.’s Annual Report on Form 10-K for the fiscal year ended December 30, 2007, filed February 28, 2008. |
| (18) | Incorporated by reference from Fairchild Semiconductor International, Inc.’s current report on Form 8-K, filed on May 9, 2008. |
| (19) | Incorporated by reference from Fairchild Semiconductor International, Inc.’s Quarterly Report on Form 10-Q for the quarter ended June 29, 2008, filed on August 8, 2008. |
| (20) | Incorporated by reference from Fairchild Semiconductor International, Inc.’s Current Report on Form 8-K, dated December 31, 1997, filed January 13, 1998. |
108
Table of Contents
Pursuant to the requirements of Section 13 or 15 (d) of the Securities Exchange Act of 1934, the Registrant has duly caused this report to be signed on its behalf by the undersigned, thereunto duly authorized.
| FAIRCHILD SEMICONDUCTOR INTERNATIONAL, INC. |
| /S/ MARK S. THOMPSON |
| Mark S. Thompson |
| President and Chief Executive Officer |
Date: February 25, 2010
Pursuant to the requirements of the Securities Exchange Act of 1934, this report has been signed below by the following persons on behalf of the Registrant and in the capacities and on the dates indicated.
| Signature |
Title |
Date | ||
| /S/ MARK S. THOMPSON Mark S. Thompson |
Chairman of the Board of Directors, President and Chief Executive Officer (principal executive officer) |
February 25, 2010 | ||
| /S/ MARK S. FREY Mark S. Frey |
Executive Vice President, Chief Financial Officer and Treasurer (principal financial officer) |
February 25, 2010 | ||
| /S/ ROBIN A. SAWYER Robin A. Sawyer |
Vice President, Corporate Controller (principal accounting officer) |
February 25, 2010 | ||
| /S/ RONALD W. SHELLY Ronald W. Shelly |
Director |
February 25, 2010 | ||
| /S/ CHARLES P. CARINALLI Charles P. Carinalli |
Director |
February 25, 2010 | ||
| /S/ THOMAS L. MAGNANTI Thomas L. Magnanti |
Director |
February 25, 2010 | ||
| /S/ BRYAN R. ROUB Bryan R. Roub |
Director |
February 25, 2010 | ||
| /S/ KEVIN J. MCGARITY Kevin J. McGarity |
Director |
February 25, 2010 | ||
| /S/ ANTHONY LEAR Anthony Lear |
Director |
February 25, 2010 | ||
| /S/ RANDY W. CARSON Randy W. Carson |
Director |
February 25, 2010 | ||
109
Table of Contents
EXHIBIT INDEX
| Exhibit No. |
Description | |
| 3.02 | Bylaws, as amended through February 25, 2010. | |
| 10.22 | Employment Agreement dated December 9, 2009 between Mark S. Thompson and Fairchild Semiconductor International, Inc. and Fairchild Semiconductor Corporation. | |
| 21.01 | List of Subsidiaries. | |
| 23.01 | Consent of KPMG LLP. | |
| 31.01 | Section 302 Certification of the Chief Executive Officer. | |
| 31.02 | Section 302 Certification of the Chief Financial Officer. | |
| 32.01 | Certification, pursuant to 18 U.S.C. 1350, as adopted pursuant to Section 906 of the Sarbanes-Oxley Act of 2002, by Mark S. Thompson. | |
| 32.02 | Certification, pursuant to 18 U.S.C. 1350, as adopted pursuant to Section 906 of the Sarbanes-Oxley Act of 2002, by Mark S. Frey. |