Attached files
| file | filename |
|---|---|
| 8-K - FORM 8-K - BANCFIRST CORP /OK/ | d8k.htm |
 Exhibit 99.1 |
 BancFirst Corporation Super Community Bank Total Assets: $4.4 billion Total Equity: $430 million 1,500+ Employees Largest State Chartered Bank in Oklahoma Symbol BANF on NASDAQ Global Select |
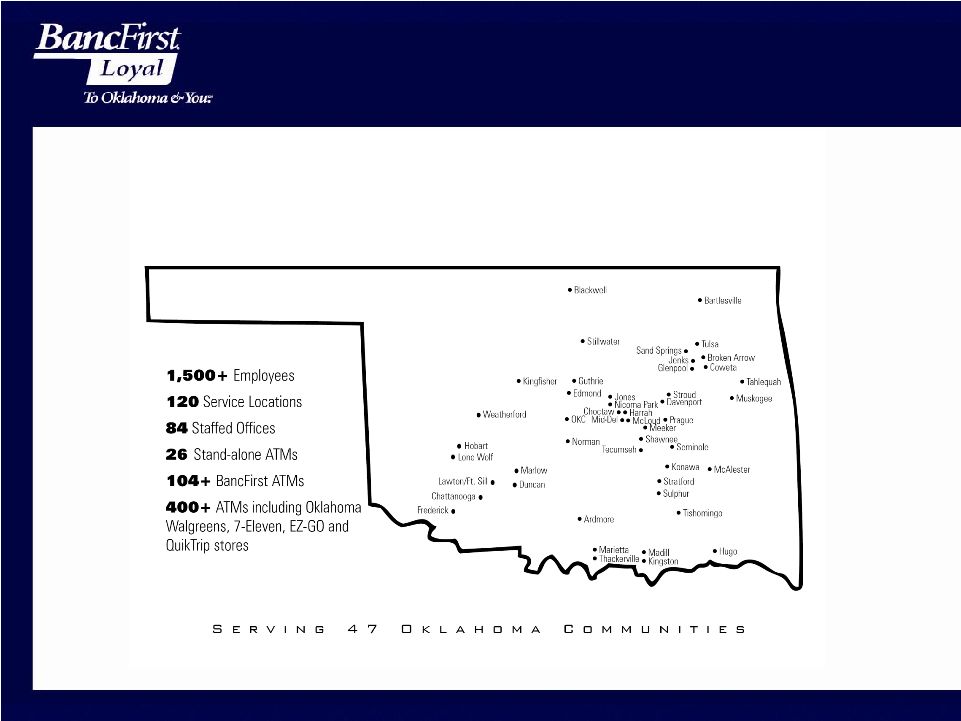 Locations |
 Mergers and Acquisitions Community Profile Population of 5,000 or more residents Institution of Higher Learning Diversified Employment Base Reasonable Market Share Compatible Culture |
 Oklahoma Companies • Largest Employers EMPLOYER EMPLOYEES – State of OK 37,000 – Wal-Mart 30,000 – Tinker AFB 27,000 – Fort Sill 21,400 – USPS 16,500 – OU 13,000 – OSU 12,000 – American Airlines 7,500 – Tulsa Public Schools 7,000 – Chickasaw Nation 6,000 – Cherokee Nation 5,900 – Choctaw Nation 5,000 – OKC Schools 5,000 • Largest Public Companies COMPANY MARKET CAP ($B) – Devon Energy $31.0 – Chesapeake 17.1 – Williams Co 13.1 – Continental Resources 6.8 – Helmerich & Payne 4.7 – Magellan Midstream 4.7 – ONEOK Inc 4.5 – OGE Energy 3.6 – BOK Financial 3.2 – Unit Corp 2.3 – Arena Resources 1.6 – SandRidge 1.6 |
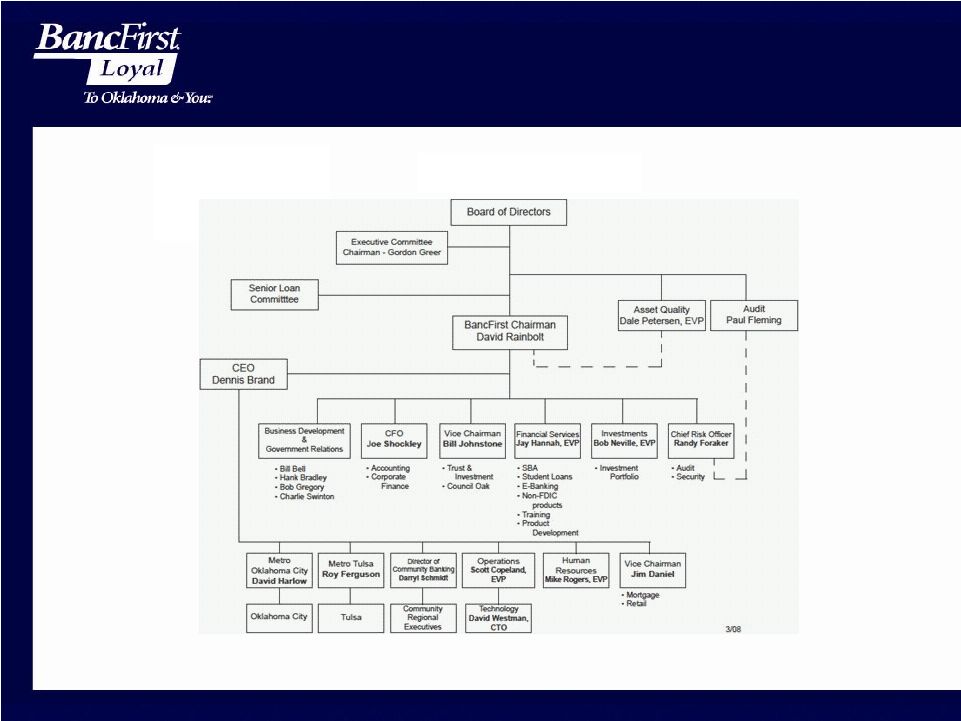 Corporate Management |
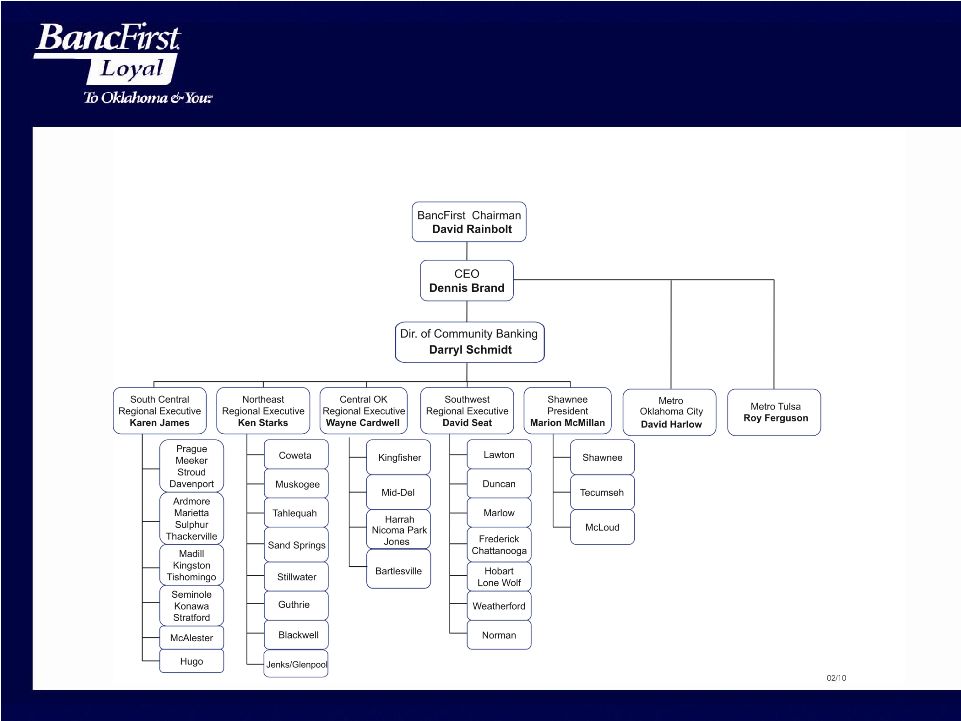 Decentralized Bank Management Company Overview |
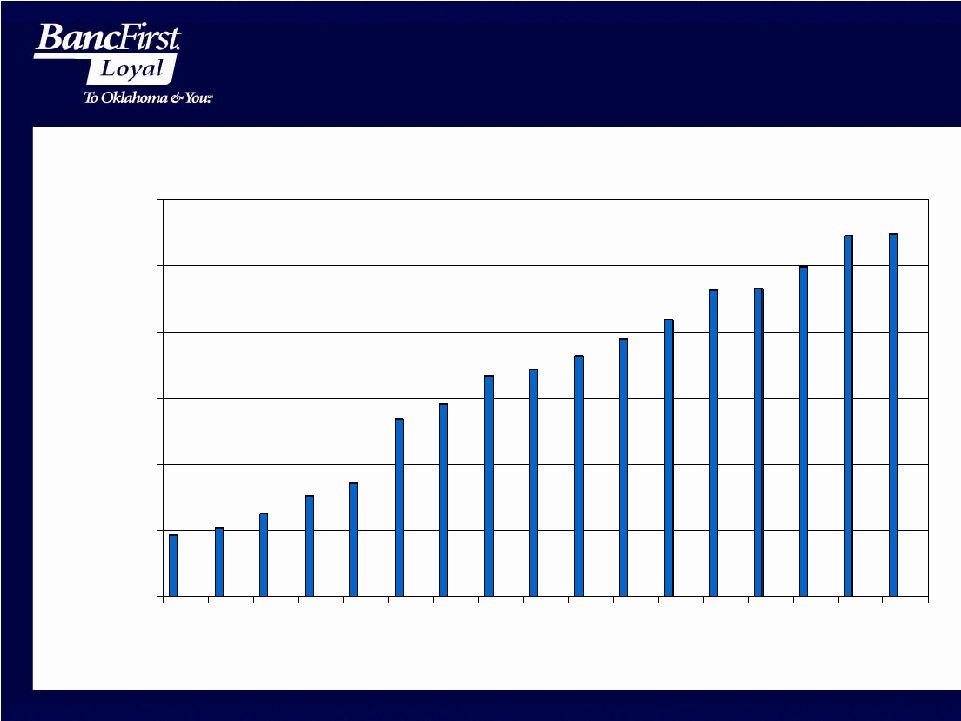
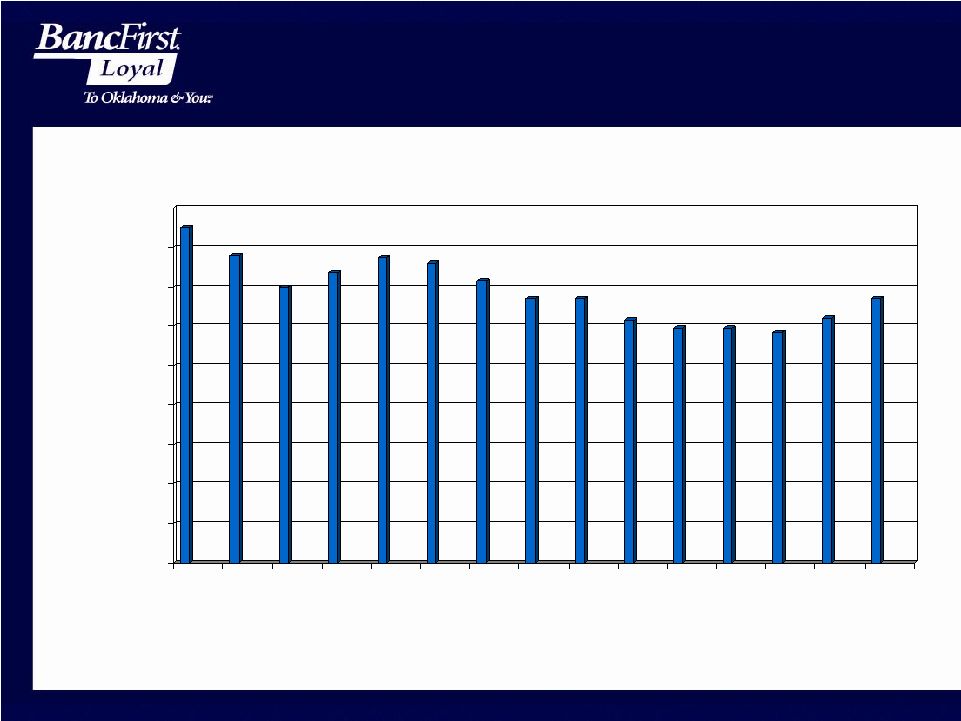
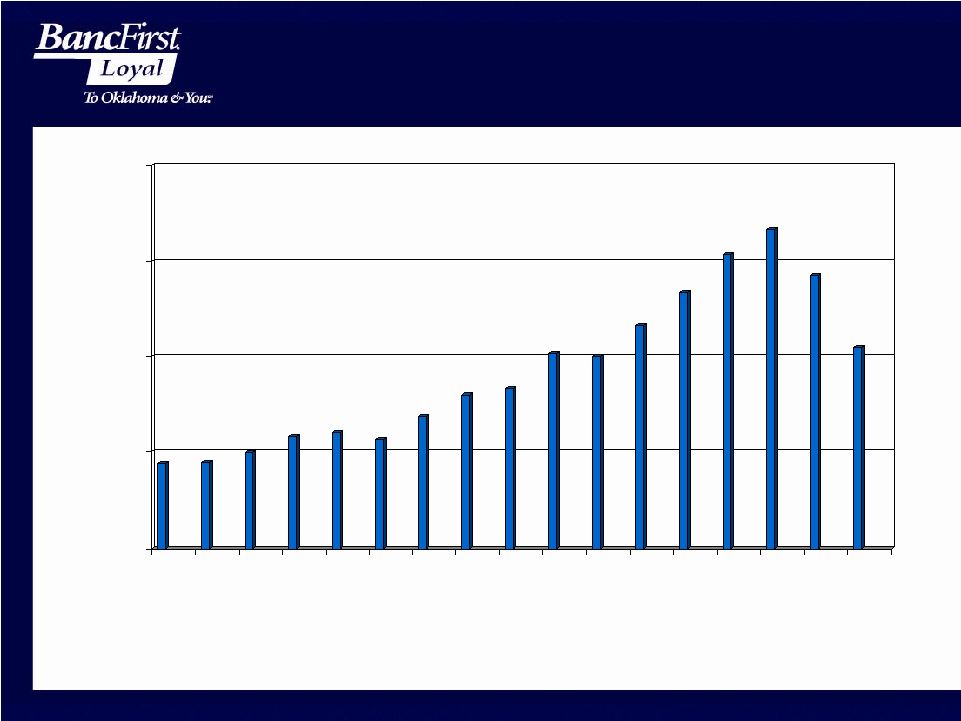
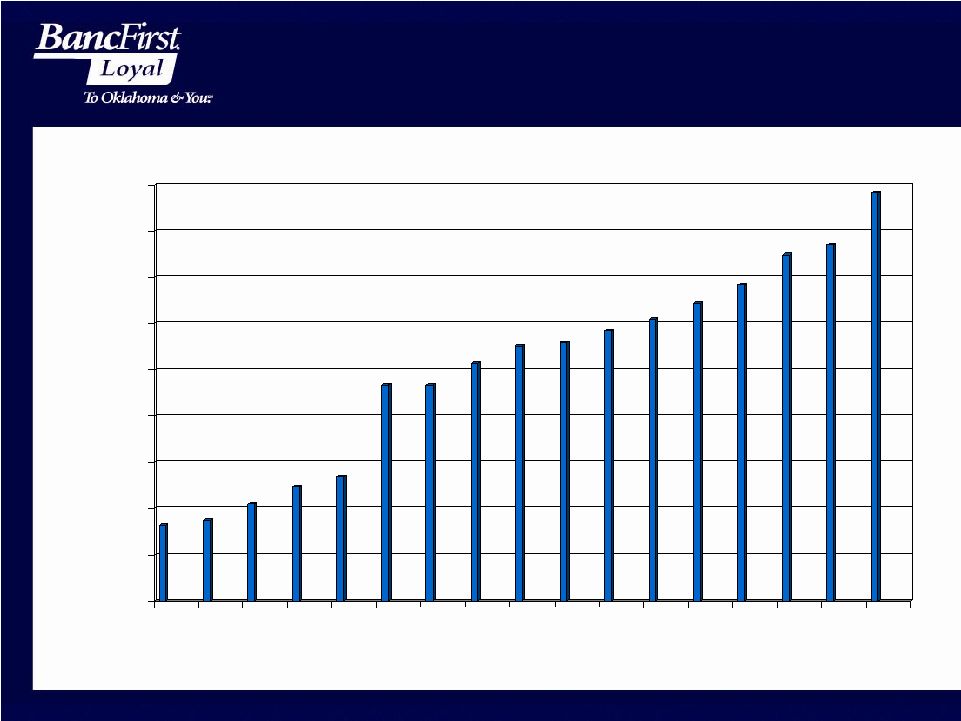 $823 $873 $1,048 $1,236 $1,346 $2,336 $2,336 $2,570 $2,757 $2,797 $2,921 $3,047 $3,223 $3,419 $3,743 $3,851 $4,416 $0 $500 $1,000 $1,500 $2,000 $2,500 $3,000 $3,500 $4,000 $4,500 1993 1995 1997 1999 2001 2003 2005 2007 2009 Total Assets (in millions) |
 $466 $522 $625 $764 $858 $1,339 $1,455 $1,666 $1,717 $1,815 $1,947 $2,094 $2,317 $2,326 $2,487 $2,724 $2,739 $0 $500 $1,000 $1,500 $2,000 $2,500 $3,000 1993 1995 1997 1999 2001 2003 2005 2007 2009 Total Loans (in millions) |
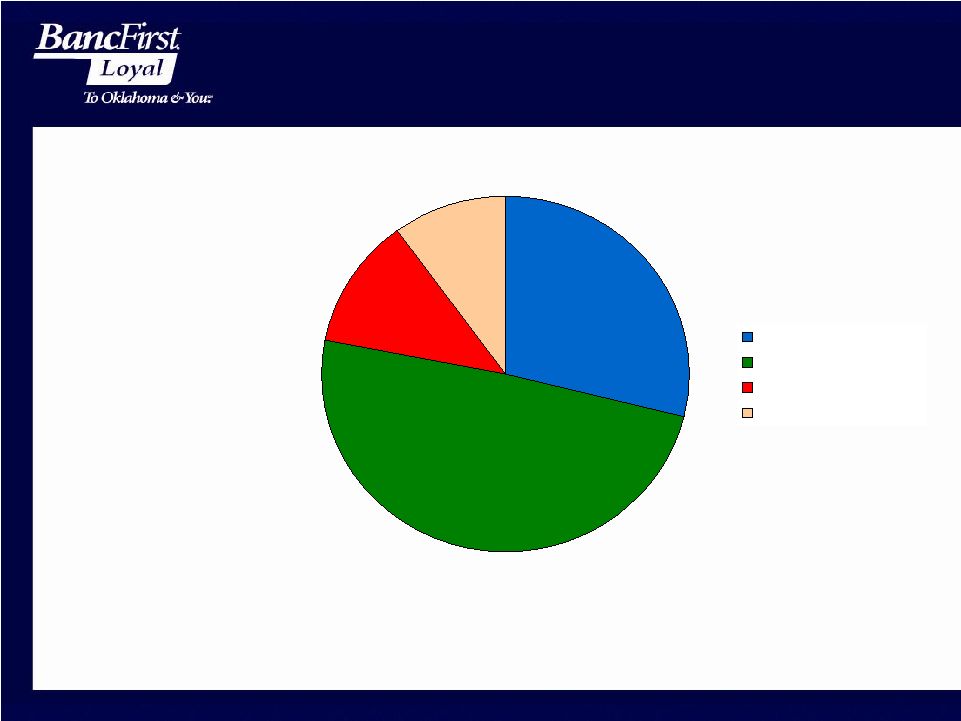
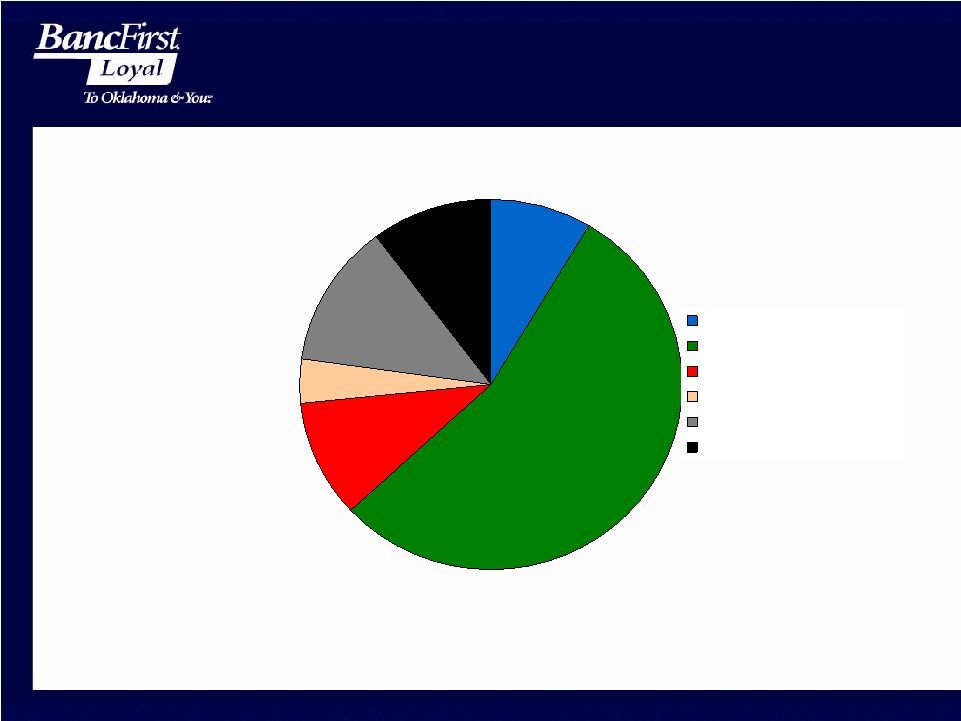
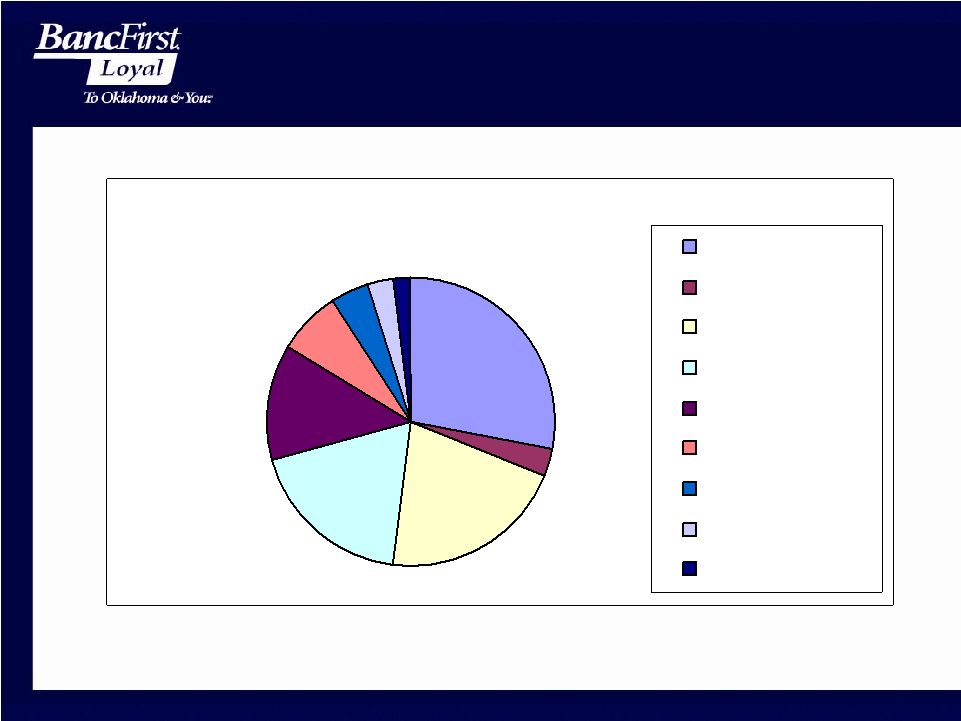 Loan Portfolio Composition Source: BancFirst Corporation 12/31/09 8-K Composition 28% 3% 21% 19% 13% 7% 4% 3% 2% RE Comm Energy RE 1-4 Family Commercial Consumer RE Constr RE Other Agriculture Other |
 Lending Concentrations • Maximum In-House Limit: $30 million • 25 Largest Relationships – 1
relationship $32.6 million (approved overage) – 1
relationship $25-30 million – 7
relationships $20-25 million – 4 relationships $15-20 million – 12 relationships $10-15 million Distribution: Amount Energy Commercial Real Estate Stock/Notes > $30MM 1 $25-30MM 1 $20-25MM 1
1 3 2 $15-20MM 4 $10-15MM 3 3 6 |
 Specialized Lending SBA # 1 SBA Lender in Oklahoma for the last 17 years $293 million in loans generated over the past decade Most experienced lending staff in Oklahoma Home Mortgage Student Lending Oklahoma’s largest guaranteed student lender Portfolio of over 50,000 loans equaling approximately $181 million Funding loans on 40 plus Oklahoma campuses |
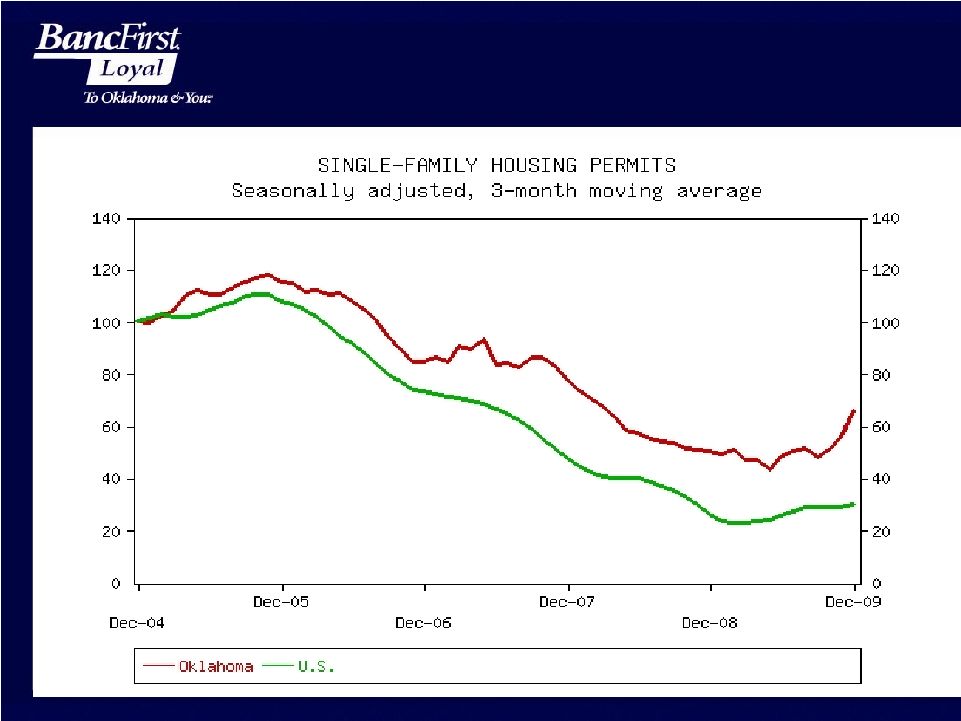 Oklahoma vs US Single-Family Housing Permits |
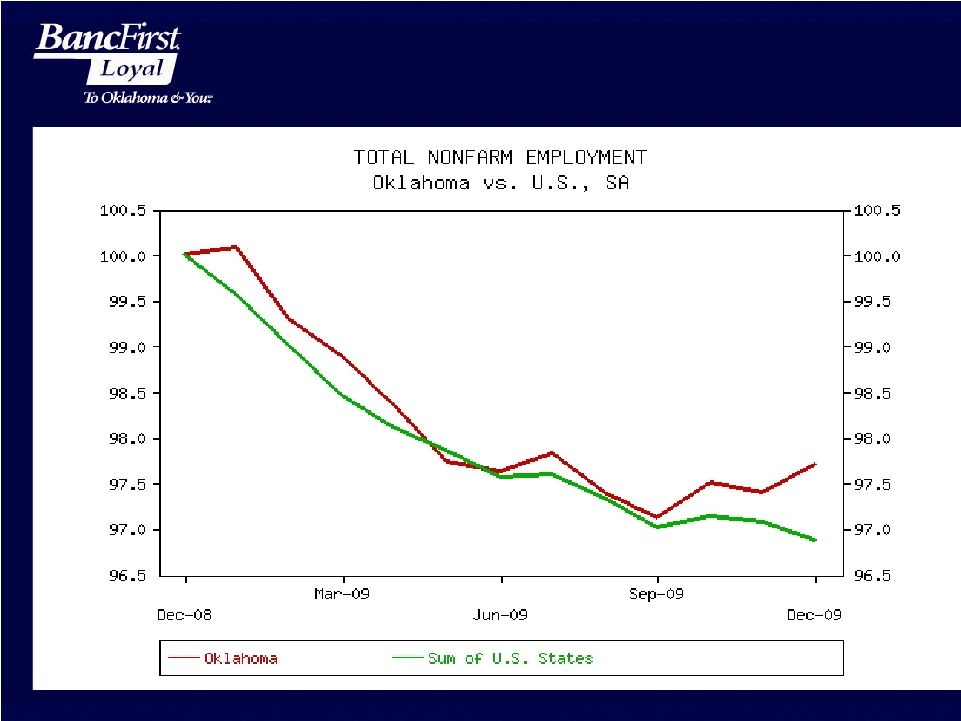 Oklahoma vs US Non-farm Employment |
 -0.05% 0.05% 0.15% 0.25% 0.35% 0.45% 0.55% 0.65% 0.75% 0.85% 1993 1995 1997 1999 2001 2003 2005 2007 2009 BancFirst Peer Net Charge-offs/ Average Loans |
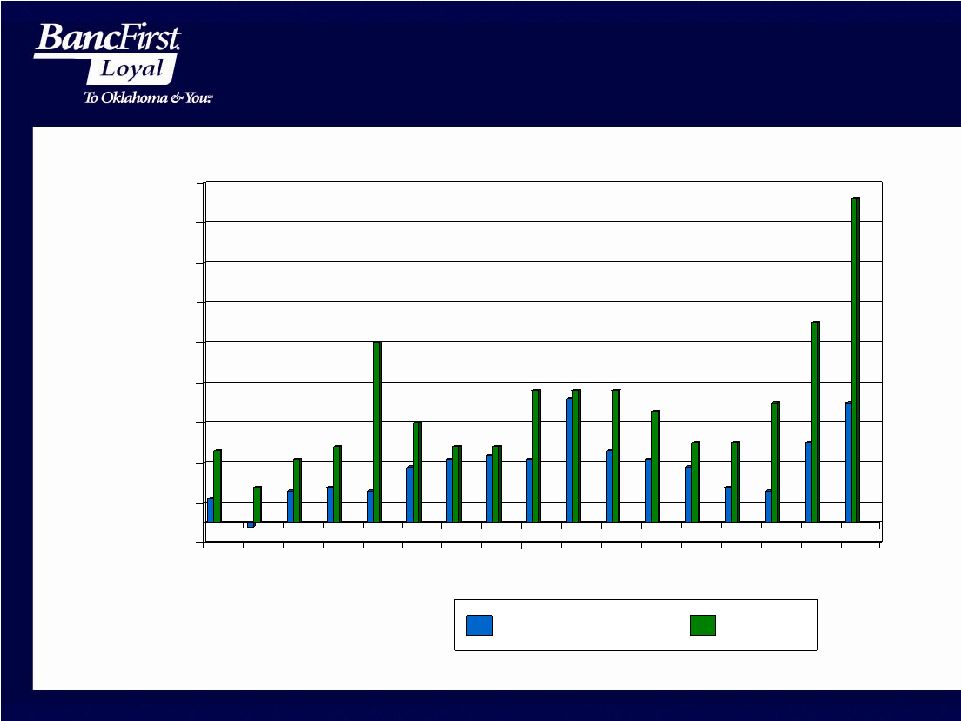
 FDIC Insured Institutions: Net Charge-Offs to Loans & Leases 0.00 0.50 1.00 1.50 2.00 2003 2004 2005 2006 2007 2008 2009 US Oklahoma BancFirst |
 0.00% 0.50% 1.00% 1.50% 2.00% 2.50% 3.00% 3.50% 4.00% 2006 2007 2008 2009 US Oklahoma BancFirst Source: Federal Deposit Insurance Corporation FDIC Insured
Institutions: Nonaccrual loans to Loans and Leases |
 1.70% 1.56% 1.40% 1.47% 1.55% 1.52% 1.43% 1.34% 1.34% 1.23% 1.19% 1.19% 1.17% 1.24% 1.34% 0.00% 0.20% 0.40% 0.60% 0.80% 1.00% 1.20% 1.40% 1.60% 1.80% 1995 1996 1997 1998 1999 2000 2001 2002 2003 2004 2005 2006 2007 2008 2009 Loan Loss Reserve as % of Loans |
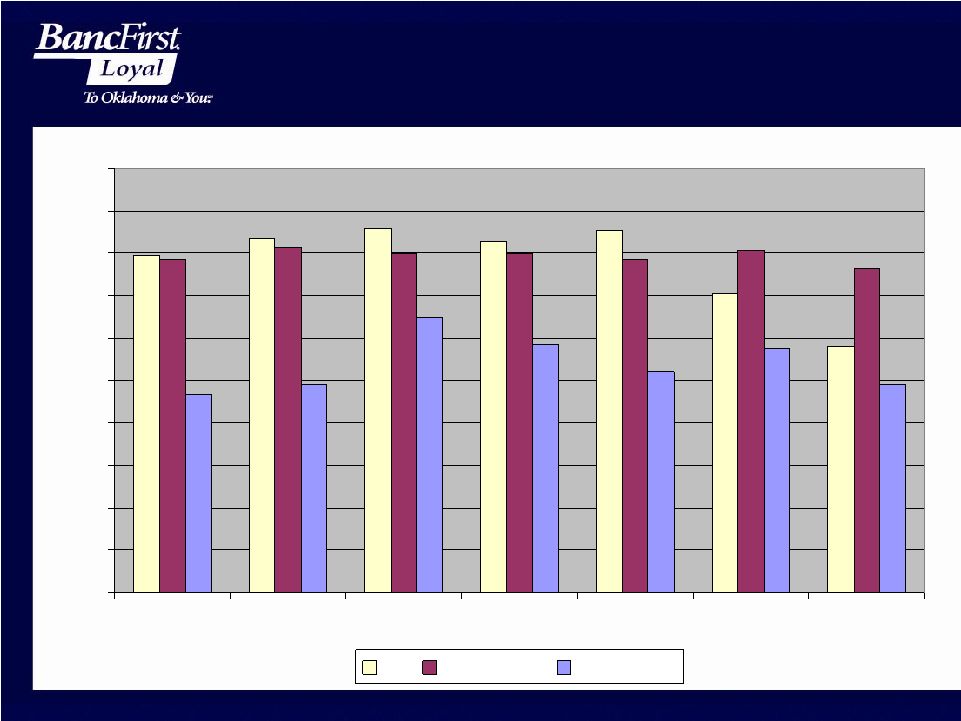
 29% 12% 10% 49% Demand Deposit Transaction/Savings CD < $100,000 CD > $100,000 Deposit Mix • No brokered deposits As of 12/31/2009 |
 BancFirst Deposit Market Share Location Amount ($MM) Market Share Rank • Statewide $3,177 5.51% 3 • OKC MSA 1,115 5.64 4 • Tulsa MSA 410 2.58 8 • Lawton 192 22.98 1 • Shawnee 148 25.49 2 • Ardmore 154 21.36 2 • Duncan 146 21.75 2 • Stillwater 144 12.59 2 As of 6/30/2007 |
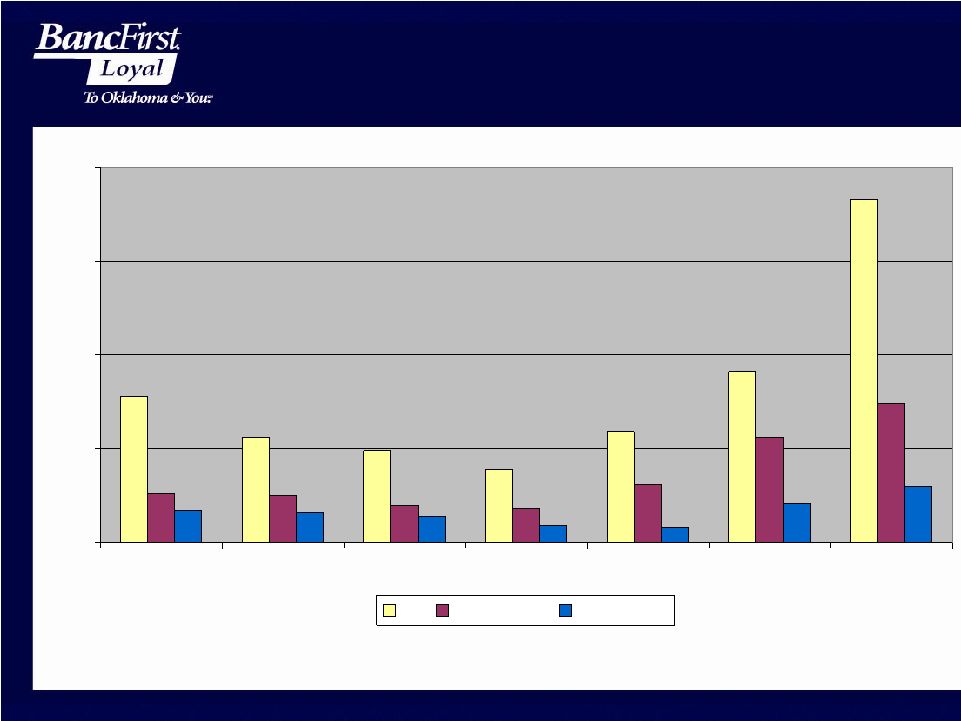
 50% 55% 60% 65% 70% 75% 80% 85% 90% 95% 100% 2003 2004 2005 2006 2007 2008 2009 US Oklahoma BancFirst Source: Federal Deposit Insurance Corporation FDIC Insured
Institutions: Average Loans to Deposits |
 Capital Ratios December 31, 2009 12/31/2009 12/31/2008 12/31/2009 12/31/2008 BancFirst BancFirst BancFirst BancFirst Well (Bank) (Bank) Corp Corp Total Capital/Risk Assets 14.18% 12.99% 14.96% 13.78% > 10.00% Tier 1 Capital/Risk Assets 12.93% 11.82% 13.73% 12.61% > 6.00% Leverage Ratio 8.71% 9.39% 9.23% 10.02% > 5.00% (Tier 1 Capital/TA) Tang. Com. Eq./TA 8.65% 9.31% 8.56% 9.24% > 3.00% |
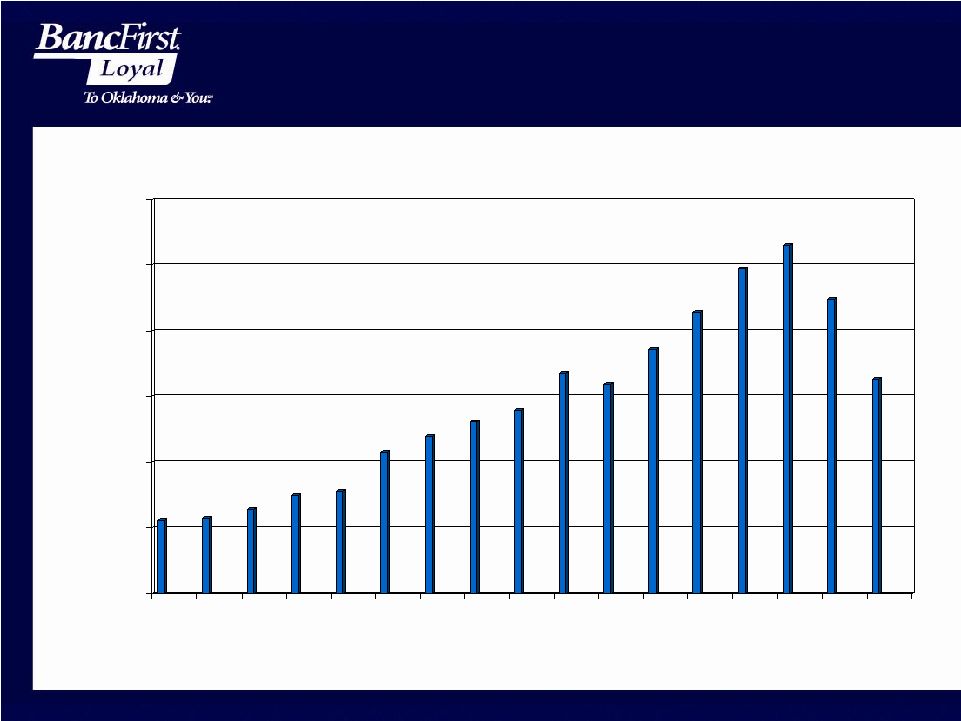 Net Income $11.1 $11.5 $12.9 $15.1 $15.7 $21.6 $23.9 $26.2 $28.0 $33.6 $31.9 $37.2 $42.8 $49.4 $53.1 $44.8 $32.6 $0 $10 $20 $30 $40 $50 $60 1993 1995 1997 1999 2001 2003 2005 2007 2009 |
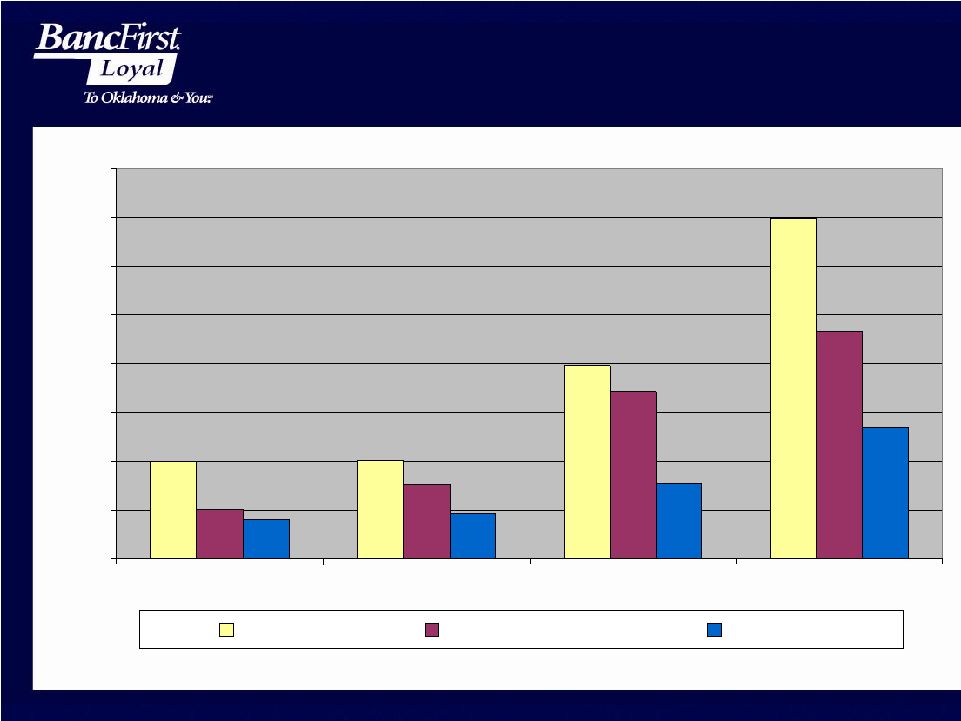
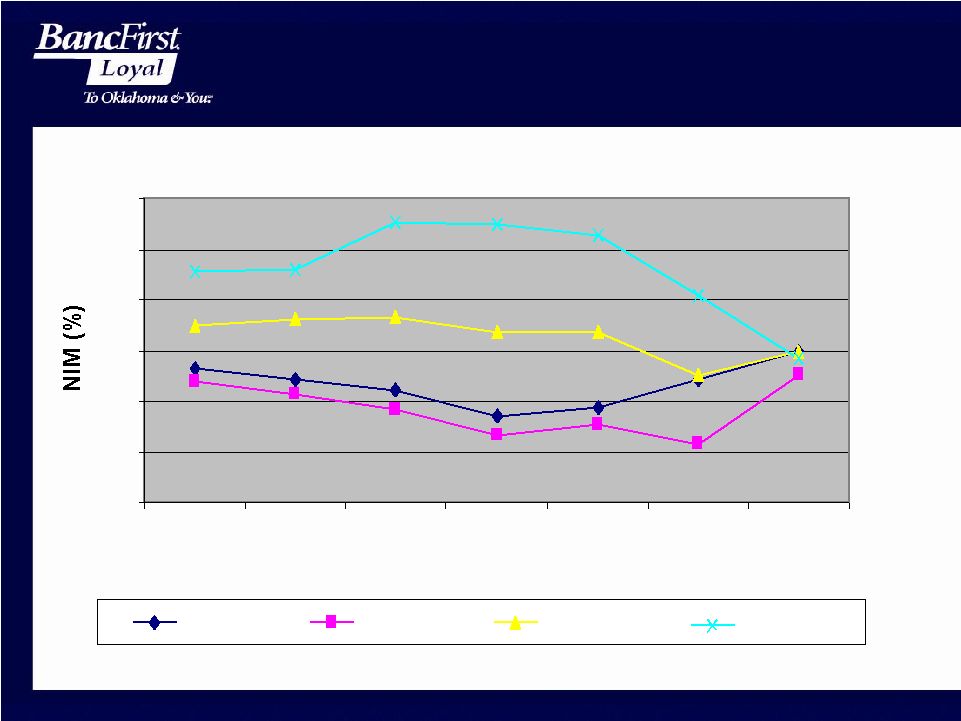 Net Interest Margin Comparison 2.00 2.50 3.00 3.50 4.00 4.50 5.00 2003 2004 2005 2006 2007 2008 2009 Date All Banks Over $5B Under $5B BancFirst |
 9% 55% 10% 4% 12% 10% Trust Revenue Service Charges Insurance Commissions Premium on sale of loans Cash Management Other Noninterest Income As of 12/312009 |
 Financial Services Cash Management Services Council Oak Investment Corp. - Management Buyout - Mezzanine Capital/Financing - Acquisition/Generational Transfers Brokerage and Investment Services Full Service Trust Department Wilcox Jones & McGrath - Full service insurance agency |
 Net Income Per
Share • Net Income Per Share Adjusted for Stock Split (Fully Diluted) $0.89 $0.90 $1.01 $1.17 $1.21 $1.14 $1.38 $1.60 $1.67 $2.03 $2.00 $2.33 $2.68 $3.07 $3.33 $2.85 $2.09 $0.00 $1.00 $2.00 $3.00 $4.00 1993 1995 1997 1999 2001 2003 2005 2007 2009 |
 America’s Best Banks Bank Director Magazine BancFirst was the 18th top performing bank of the largest publicly traded banks and thrifts nationwide in 2009 Based on profitability, capitalization and asset quality metrics Fourth consecutive year ranked in top 20 Only Oklahoma bank in top quartile Source: Bank Director Magazine |
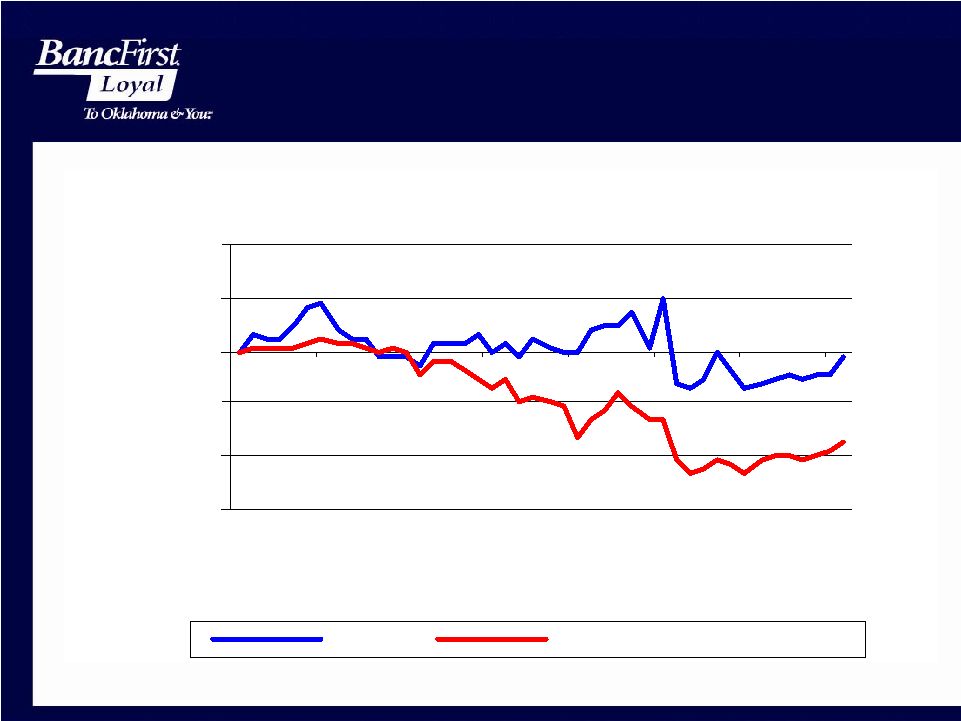 Stock Performance vs
Regional Banks -75.00% -50.00% -25.00% 0.00% 25.00% 50.00% Jun-06 Dec-06 Jun-07 Dec-07 Jun-08 Dec-08 Jun-09 Dec-09 BANF KBW Regional Bank Index |
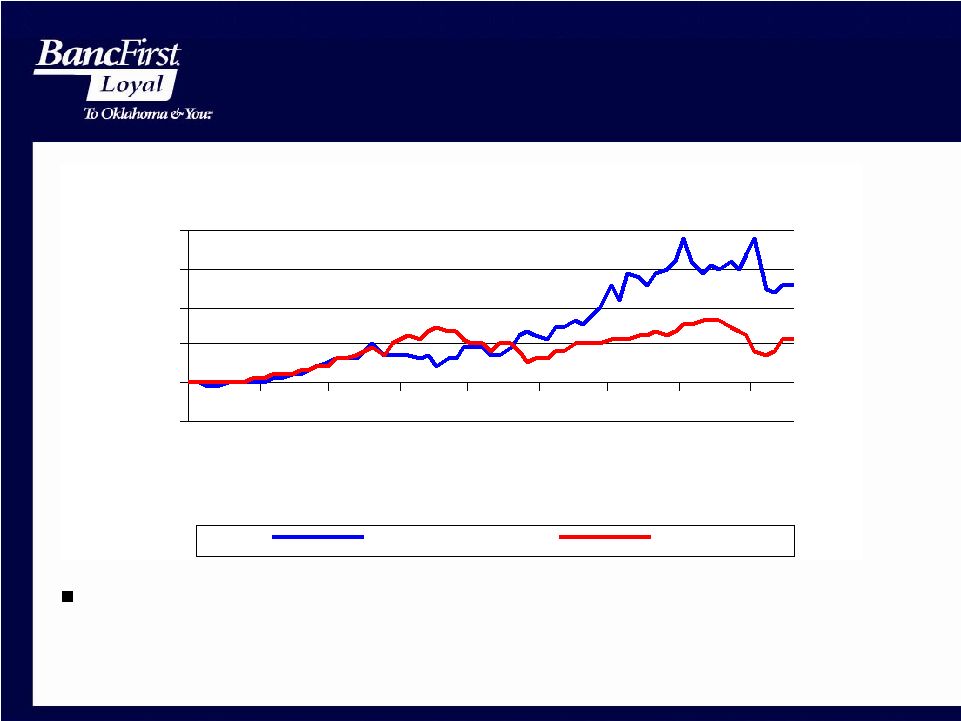 Stock Performance vs
the General Market since IPO Average increase in common stock price since IPO has been 11.7% vs. S&P 500 of 7.7%. -200% 0% 200% 400% 600% 800% 1993 1995 1997 1999 2001 2003 2004 2006 2008 BANF S&P 500 |
 Summary Strong Capital Exceptional Liquidity Consistent Management No TARP No FHLB Borrowings Opportunities Expand Market Share – Oklahoma Enter New Markets – Contiguous States Stock Buyback |
 Forward-Looking Statements This presentation contains forward-looking statements within the meaning of Section 27A of the Securities Act of 1933 and Section 21E of the Securities Exchange Act of 1934 with respect to earnings and other financial information, corporate objectives, and other business matters. Forward-looking statements include estimates and give our current expectations or forecasts of future events. These forward-looking statements are subject to numerous assumptions, risks and uncertainties. Actual results may differ materially. These risks and other factors are described more fully in the Company’s Annual Report on Form 10-K for 2008 and other filings with the Securities and Exchange Commission. |
 |