Attached files
UNITED
STATES
SECURITIES
AND EXCHANGE COMMISSION
Washington,
D. C. 20549
FORM
10-K
( X ) ANNUAL
REPORT PURSUANT TO SECTION 13 OR 15(d) OF THE
SECURITIES
EXCHANGE ACT OF 1934
For the
fiscal year ended December 31, 2009
( ) TRANSITION
REPORT PURSUANT TO SECTION 13 OR 15(d) OF THE
SECURITIES
EXCHANGE ACT OF 1934
For the
transition period from ________________ to ________________
Commission
File Number 1-7349
Ball
Corporation
State of
Indiana 35-0160610
10 Longs
Peak Drive, P.O. Box 5000
Broomfield,
Colorado 80021-2510
Registrant’s
telephone number, including area code: (303) 469-3131
Securities
registered pursuant to Section 12(b) of the Act:
|
Name
of each exchange
|
||
|
Title
of each class
|
on
which registered
|
|
|
Common
Stock, without par value
|
New
York Stock Exchange
|
|
|
Chicago
Stock Exchange
|
Securities
registered pursuant to Section 12(g) of the Act: NONE
Indicate
by check mark if the registrant is a well-known seasoned issuer, as defined in
Rule 405 of the Securities
Act. YES [X] NO [ ]
Indicate
by check mark if the registrant is not required to file reports pursuant to
Section 13 or Section 15(d) of the
Act. YES [ ] NO [X]
Indicate
by check mark whether the registrant (1) has filed all reports required to
be filed by Section 13 or 15(d) of the Securities Exchange Act of 1934
during the preceding 12 months (or for such shorter period that the registrant
was required to file such reports), and (2) has been subject to such filing
requirements for the past 90 days. YES
[X] NO
[ ]
Indicate by check mark whether the registrant has submitted electronically and posted on its corporate Website, if any, every Interactive Data File required to be submitted and posted pursuant to Rule 405 of Regulation S-T during the preceding 12 months. YES [ ] NO [ X]
Indicate by check mark if disclosure of delinquent filers pursuant to Item 405 of Regulation S-K is not contained herein, and will not be contained, to the best of registrant's knowledge, in definitive proxy or information statements incorporated by reference in Part III of this Form 10-K or any amendment to this Form 10-K. [ ]
Indicate
by check mark whether the registrant is a large accelerated filer, an
accelerated filer, or a non-accelerated filer. See definition of “accelerated
filer and large accelerated filer” in Rule 12b-2 of the Exchange
Act.
|
Large
accelerated filer [X]
|
Accelerated
filer [ ]
|
Non-accelerated
filer [ ]
|
Indicate
by check mark whether the registrant is a shell company (as defined in
Rule 12b-2 of the
Act). YES [ ] NO [X]
The
aggregate market value of voting stock held by non-affiliates of the registrant
was $4.04 billion based upon the closing market price and common shares
outstanding as of June 28, 2009.
Number of
shares outstanding as of the latest practicable date.
|
Class
|
Outstanding
at January 31, 2010
|
|||
|
Common
Stock, without par value
|
94,084,299
|
DOCUMENTS
INCORPORATED BY REFERENCE
|
1.
|
Proxy
statement to be filed with the Commission within 120 days after
December 31, 2009, to the extent indicated in
Part III.
|
Ball
Corporation and Subsidiaries
ANNUAL
REPORT ON FORM 10-K
For the
year ended December 31, 2009
INDEX
|
Page
Number
|
||
|
PART
I.
|
||
|
Item
1.
|
Business
|
1
|
|
Item
1A.
|
Risk
Factors
|
8
|
|
Item
1B.
|
Unresolved
Staff Comments
|
12
|
|
Item
2.
|
Properties
|
12
|
|
Item
3.
|
Legal
Proceedings
|
14
|
|
Item
4.
|
Submission
of Matters to a Vote of Security Holders
|
15
|
|
PART
II.
|
||
|
Item
5.
|
Market
for the Registrant’s Common Stock and Related Stockholder
Matters
|
16
|
|
Item
6.
|
Selected
Financial Data
|
18
|
|
Item
7.
|
Management’s
Discussion and Analysis of Financial Condition and Results of
Operations
|
19
|
|
Forward-Looking
Statements
|
31
|
|
|
Item
7A.
|
Quantitative
and Qualitative Disclosures About Market Risk
|
32
|
|
Item
8.
|
Financial
Statements and Supplementary Data
|
34
|
|
Report
of Independent Registered Public Accounting Firm
|
34
|
|
|
Consolidated
Statements of Earnings for the Years Ended December 31, 2009, 2008
and 2007
|
35
|
|
|
Consolidated
Balance Sheets at December 31, 2009, and December 31,
2008
|
36
|
|
|
Consolidated
Statements of Cash Flows for the Years Ended December 31,
2009, 2008 and 2007
|
37
|
|
|
Consolidated
Statements of Shareholders’ Equity and Comprehensive Earnings for the
Years Ended December 31, 2009, 2008 and 2007
|
38
|
|
|
Notes
to Consolidated Financial Statements
|
39
|
|
|
Item
9.
|
Changes
in and Disagreements with Accountants on Accounting and
Financial Disclosure
|
88
|
|
Item
9A.
|
Controls
and Procedures
|
88
|
|
Item
9B.
|
Other
Information
|
88
|
|
PART
III.
|
||
|
Item
10.
|
Directors,
Executive Officers and Corporate Governance of the
Registrant
|
89
|
|
Item
11.
|
Executive
Compensation
|
90
|
|
Item
12.
|
Security
Ownership of Certain Beneficial Owners and Management
|
90
|
|
Item
13.
|
Certain
Relationships and Related Transactions
|
91
|
|
Item
14.
|
Principal
Accountant Fees and Services
|
91
|
|
PART
IV.
|
||
|
Item
15.
|
Exhibits,
Financial Statement Schedules
|
91
|
|
Signatures
|
92
|
|
|
Index
to Exhibits
|
94
|
PART I
Item
1. Business
Ball
Corporation (Ball, we, the company or our) is one of the world’s leading
suppliers of metal and plastic packaging to the beverage, food and household
products industries. Our packaging products are produced for a variety of end
uses and are manufactured in plants around the world. We also supply
aerospace and other technologies and services to governmental and commercial
customers within our aerospace and technologies segment (Ball Aerospace). In
2009 our total consolidated net sales were $7.35 billion. Our packaging
businesses are responsible for 91 percent of our net sales, with the remaining 9
percent contributed by our aerospace business.
Our
largest product lines are aluminum and steel beverage containers, which
accounted for 63 percent of our 2009 total net sales and 77 percent of
our 2009 total earnings before interest and taxes. We also produce steel food
containers, steel aerosol containers, polyethylene terepthalate (PET) and
polypropylene plastic bottles for beverages and foods, steel paint cans and
decorative steel tins.
We sell
our packaging products primarily to major beverage, food and household products
companies with which we have developed long-term customer relationships. This is
evidenced by our high customer retention and our large number of long-term
supply contracts. We sell a majority of our packaging products to relatively few
major companies in North America, Europe, the People’s Republic of China (PRC)
and Argentina, as do our equity joint ventures in Brazil, the U.S. and the
PRC.
Ball
Aerospace is a leader in the design, development and manufacture of innovative
aerospace systems. It produces spacecraft, instruments and sensors, radio
frequency and microwave technologies, data exploitation solutions and a variety
of advanced aerospace technologies and products that enable deep space
missions.
Our
corporate strategy is to grow our worldwide beverage container business and our
aerospace business, to continue to leverage and develop the metal food and
household products packaging, Americas, segment, to improve the performance of
the plastic packaging, Americas, segment, and to utilize free cash flow and
earnings growth to increase shareholder value.
We are
headquartered in Broomfield, Colorado. Our stock is traded on the New York Stock
Exchange and the Chicago Stock Exchange under the ticker symbol
BLL.
Our
Financial Strategy
Ball
Corporation maintains a clear and disciplined financial strategy focused on
improving shareholder returns through:
● Delivering
long-term earnings per share growth of 10 percent to 15
percent
● Focusing
on free cash flow generation
● Increasing
Economic Value Added (EVA®)
The cash
generated by our businesses is used primarily: (1) to finance the company’s operations, (2)
to fund stock buy-back programs and dividend payments, (3) to fund strategic
capital investments and (4) to service the company’s debt. We will,
when we believe it will benefit the company and our shareholders, make strategic
acquisitions or divest parts of our business.
The
compensation of a majority of our employees is tied directly to the company’s
performance through our EVA® incentive programs. When the company performs well,
our employees are paid more. If the company does not perform well, our employees
get paid less or no incentive compensation.
Page 1 of
97
Our
Reporting Segments
Ball
Corporation reports its financial performance in five reportable segments
organized along a combination of product lines, after aggregating operating
segments that have similar economic characteristics: (1) metal beverage
packaging, Americas and Asia; (2) metal beverage packaging, Europe;
(3) metal food and household products packaging, Americas; (4) plastic
packaging, Americas; and (5) aerospace and technologies. We also have
investments in companies in the U.S., the PRC and Brazil, which are accounted
for using the equity method of accounting and, accordingly, those results are
not included in segment sales or earnings.
Profitability
is sensitive to selling prices, production volumes, labor, transportation,
utility and warehousing costs, as well as the availability and price of raw
materials, such as aluminum sheet, tinplate steel, plastic resin and other
direct materials. These raw materials are generally available from several
sources, and we have secured what we consider to be adequate supplies and are
not experiencing any shortages. There has been significant consolidation of raw
material suppliers in both North America and in Europe. Raw materials and energy
sources, such as natural gas and electricity, may from time to time be in short
supply or unavailable due to external factors. We cannot predict the timing or
effects, if any, of such occurrences on future operations.
A
substantial part of Ball’s packaging sales are made directly to companies in
packaged beverage and food businesses, including MillerCoors LLC, Anheuser-Busch
InBev n.v./s.a. and bottlers of Pepsi-Cola and Coca-Cola branded beverages and
their affiliates that utilize consolidated purchasing groups.
Metal
Beverage Packaging, Americas and Asia, Segment
Metal
beverage packaging, Americas and Asia, is Ball’s largest segment, accounting for
39 percent of consolidated net sales in 2009. Metal beverage containers are
primarily sold under multi-year supply contracts to fillers of carbonated soft
drinks, beer, energy drinks and other beverages.
Americas
According
to publicly available information and company estimates, the combined U.S. and
Canadian metal beverage container markets represent more than
100 billion units. Five companies manufacture substantially all of the
metal beverage containers in the U.S. and Canada. Two of these producers and
three other independent producers also manufacture metal beverage containers in
Mexico. Ball produced in excess of 31 billion recyclable beverage
containers in the U.S. and Canada in 2009 – about 31 percent of the total
market. Sales volumes of metal beverage containers in North America tend to be
highest during the period from April through September. All of the beverage cans
produced by Ball in the U.S. and Canada are made of aluminum, as are all
beverage cans produced by our competitors in the U.S., Canada and Mexico. In
2009 we were able to recover substantially all aluminum-related cost increases
levied by producers through either financial or contractual means. In North
America, four aluminum suppliers provide virtually all of our requirements. Some
of those aluminum suppliers have experienced significant financial and liquidity
constraints in recent years.
We
believe we have limited our exposure related to changes in the costs of aluminum
ingot as a result of the inclusion of provisions in most aluminum container
sales contracts to pass through aluminum ingot price changes, as well as the use
of derivative instruments.
Beverage
containers are sold based on quality, service, innovation and price in a highly
competitive market, which is relatively capital intensive and is characterized
by plants that run more or less continuously in order to operate profitably. In
addition, the aluminum beverage container competes aggressively with other
packaging materials. The glass bottle has shown resilience in the packaged beer
industry, while the PET container has grown significantly in the carbonated soft
drink and water industries over the past quarter century. In Canada, metal
beverage containers have captured significantly lower percentages of packaged
beverage industry volumes than in the U.S., particularly in the packaged beer
industry.
Two-piece
aluminum beverage containers are produced at 17 manufacturing facilities in the
U.S. and one in Canada. Can ends are produced within four of the U.S.
facilities, as well as in two facilities that manufacture only can ends. Through
Rocky Mountain Metal Container, LLC, a 50-percent-owned joint venture, which is
accounted for as an equity investment, Ball and MillerCoors, LLC, operate
beverage container and can end manufacturing facilities in Golden,
Colorado.
Page 2 of
97
On
October 1, 2009, the company acquired three of Anheuser-Busch InBev
n.v./s.a.’s (AB InBev) metal beverage container manufacturing plants and one of
its beverage can end manufacturing plants, all of which are located in the U.S.,
for $574.7 million in cash. The acquired plants produce about
10 billion aluminum containers and 10 billion beverage can ends annually,
more than two-thirds of which are produced for leading soft drink companies and
the rest for AB InBev. With the shipments from the acquired plants, Ball
estimates its annual shipments will grow to approximately 40 percent of
total U.S. and Canadian shipments.
We
participate in a 50-percent-owned joint venture in Brazil, Latapack-Ball
Embalagens, Ltda., that manufactures aluminum beverage cans and ends and is
accounted for as an equity investment. The Brazilian joint venture recently
expanded capacity at its existing metal beverage container manufacturing
facility near Jacarei and completed the construction of a new plant near Rio de
Janeiro.
In order
to more closely balance capacity and demand within our business, during 2008 and
2009 Ball completed the closure of three metal beverage packaging plants in
North America:
|
●
|
We
closed a metal beverage packaging plant in Kent, Washington, in the third
quarter of 2008. The plant had two 12-ounce aluminum beverage container
manufacturing lines that produced approximately 1.1 billion
containers annually.
|
|
●
|
We
announced on October 30, 2008, the closure of our metal beverage container
plants in Kansas City, Missouri, and Guayama, Puerto Rico. The Kansas City
plant, which primarily manufactured specialty beverage cans, was closed in
the first quarter of 2009 with manufacturing volumes absorbed by other
North American beverage container plants. The Puerto Rico facility, which
manufactured 12-ounce beverage cans, was closed at the end of
2008.
|
Where
growth is projected in certain markets or for certain products, Ball is
undertaking selected capacity increases in its existing facilities and may
establish or obtain additional manufacturing capacity to the extent required by
the growth of any of the markets we serve.
Asia
The
beverage can market in the PRC is approximately 13 billion containers, of
which Ball’s operations represent an estimated 22 percent, with an
additional 13 percent manufactured by two joint ventures in which we
participate. Our percentage of the industry makes us one of the largest
manufacturers of beverage containers in the PRC. Six other manufacturers make up
the remainder of the market. Our operations include the manufacture of aluminum
cans and ends in three plants in the PRC, as well as in our two joint ventures.
Capacity grew rapidly in the PRC in the late 1990s, resulting in a supply/demand
imbalance. The rapid growth slowed in the early 2000s, and a number of can
makers, including Ball, responded by rationalizing capacity. Growth has resumed
over the past several years, and we expect the PRC market to continue to grow
over time. We also manufacture and sell high-density plastic containers in two
PRC plants primarily servicing the motor oil industry.
On
November 9, 2009, we announced our agreement to acquire Guangdong Jianlibao
Group Co., Ltd’s (Jianlibao) 65-percent interest in a joint venture metal
beverage can and end plant in Sanshui, PRC. We have owned 35 percent of the
joint venture plant since 1992. We will acquire the plant and related assets for
approximately $90 million in cash and assumed debt and will also enter into
a long-term supply agreement with Jianlibao. The transaction is expected to
close in 2010, subject to customary regulatory approvals.
Metal
Beverage Packaging, Europe, Segment
The
European beverage can market, excluding Russia, is approximately 47 billion
cans and Ball Packaging Europe is the second largest metal beverage container
producer with an estimated 32 percent of the European shipments. While
current economic conditions have slowed growth in the near term, the European
market is expected to grow, and is highly regional in terms of sales growth
rates and packaging mix. Growth in central and eastern Europe has been
particularly strong in past years but has been impacted by the global economic
environment, causing the company to delay completion of its new plant in Lublin,
Poland. Western European markets, including the United Kingdom and France,
continue to maintain historical volumes and growth characteristics.
Page 3 of
97
Sales
volumes of metal beverage containers in Europe tend to be highest during the
period from May through August with a smaller increase in demand during the
winter holiday season for the United Kingdom. As in North America, the metal
beverage container competes aggressively with other packaging materials used by
the European beer and carbonated soft drink industries. The glass bottle is
heavily utilized in the packaged beer industry, while the PET container is
utilized in the carbonated soft drink, beer, juice and mineral water
industries.
The metal
beverage packaging, Europe, segment, which accounted for 24 percent of Ball’s
consolidated net sales in 2009, supplies two-piece beverage cans and can ends
for producers of beer, carbonated soft drinks, mineral water, fruit juices,
energy drinks and other beverages. The European operations consist of 12 plants
– 10 beverage can plants and two beverage can end plants – of which four are
located in Germany, three in the United Kingdom, two in France and one each in
the Netherlands, Poland and Serbia. In addition, Ball Packaging Europe is
currently renting additional space on the premises of a supplier in Haslach,
Germany in order to produce the Ball Resealable End (BRE). The European plants produced approximately
16 billion cans in 2009, with approximately 57 percent of those being
produced from aluminum and 43 percent from steel. Six of the can plants use
aluminum and four use steel.
European
raw material supply contracts are generally for a period of one year, although
Ball Packaging Europe has negotiated some longer term agreements. In Europe
three steel suppliers and four aluminum suppliers provide approximately 95
percent of our requirements. Aluminum is traded primarily in U.S. dollars, while
the functional currencies of Ball Packaging Europe and its subsidiaries are
non-U.S. dollars. The company generally tries to minimize the resulting foreign
exchange rate risk with supply contracts in local currencies and the use of
derivative contracts. In addition, purchase and sales contracts include fixed
price, floating and pass-through pricing arrangements.
Metal
Food & Household Products Packaging, Americas, Segment
The metal
food and household products packaging, Americas, segment, accounted for
19 percent of consolidated net sales in 2009. The two major product lines
in this segment are steel food and aerosol containers. Ball produces two-piece
and three-piece steel food containers and ends for packaging vegetables, fruit,
soups, meat, seafood, nutritional products, pet food and other products. The
segment also manufactures and sells aerosol cans, paint cans and custom and
specialty containers. We are the largest manufacturer of aerosol cans in North
America. There are a total of 14 plants in the U.S. and Canada that produce
these products. In addition, the company manufactures and sells aerosol cans in
two plants in Argentina.
Sales
volumes of metal food containers in North America tend to be highest from May
through October as a result of seasonal fruit, vegetable and salmon packs. We
estimate our 2009 shipments of more than 5.1 billion steel food containers
to be approximately 18 percent of total U.S. and Canadian metal food
container shipments. We estimate our aerosol business accounts for approximately
45 percent of total annual U.S. and Canadian steel aerosol
shipments.
Competitors
in the metal food container product line include two national and a small number
of regional suppliers and self manufacturers. Several producers in Mexico also
manufacture steel food containers. Competition in the U.S. steel aerosol can
market primarily includes two national suppliers and a regional supplier in the
Midwest. Steel containers also compete with other packaging materials in the
food and household products industry including glass, aluminum, plastic, paper
and the stand-up pouch. As a result, demand for this product line is dependent
on product innovation and cost reduction. Service, quality and price are among
the other key competitive factors. In North America, two steel suppliers provide
nearly 70 percent of our tinplate steel. We believe we have limited our
exposure related to changes in the costs of steel tinplate as a result of the
inclusion of provisions in certain steel container sales contracts to pass
through steel cost changes and the existence of certain other steel container
sales contracts that incorporate annually negotiated metal costs. In 2009 we
were able to pass through the majority of steel cost increases levied by
producers.
Cost
containment is crucial to maintaining profitability in the food and aerosol
container manufacturing industries and Ball is focused on doing so. Toward that
end, during 2008 and 2009, Ball closed its aerosol container manufacturing
plants in Tallapoosa, Georgia, and Commerce, California. The two plant closures
result in a net reduction in manufacturing capacity of 10 production lines,
including the relocation of two high-speed aerosol lines to other existing Ball
facilities, and allow us to supply customers from a consolidated asset
base.
Page 4 of
97
Plastic
Packaging, Americas, Segment
Demand
for containers made of PET and polypropylene has slowed in the beverage and food
markets due to current economic conditions. While PET and polypropylene
beverage containers compete against metal, glass and cardboard, the
historical increase in the sales of PET containers has come primarily at the
expense of glass containers and through new market introductions.
Competition
in the PET plastic container industry is intense and includes several national
and regional suppliers and self manufacturers. In the smaller polypropylene
container industry, Ball is one of three major competitors. Service, quality,
innovation and price are important competitive factors with price being by
far the most important. The ability to produce customized, differentiated
plastic containers is also a key competitive factor. We believe we have limited
our exposure related to changes in the costs of plastic resin as a result of the
inclusion of resin cost pass-through provisions in substantially all plastic
container sales contracts.
Plastic
packaging, Americas, accounted for 9 percent of Ball’s consolidated net
sales in 2009. We estimate our 2009 shipments of 5 billion plastic bottles
to be approximately 8 percent of total U.S. PET container shipments.
In addition, this segment shipped approximately 625 million polypropylene
food and specialty containers during 2009. The company operates five plastic
container manufacturing facilities in the U.S.
Most of
Ball’s PET containers are sold under long-term contracts to suppliers of bottled
water and carbonated soft drinks, including bottlers of Pepsi-Cola branded
beverages and their affiliates that utilize consolidated purchasing groups. Most
of our polypropylene containers are also sold under long-term contracts,
primarily to food packaging companies. We are also manufacturing plastic
containers for the single-serve juice and wine markets. Our line of Heat-Tek®
PET plastic bottles for hot-filled beverages, such as sports drinks and juices,
includes sizes from 8 ounces to 64 ounces.
Ball’s
emphasis in this segment is on customized, differentiated containers. This
includes unique barrier plastics such as Gamma®, Gamma-Clear®, AmazonHM® and KHS
Corpoplast GmbH Plasmax® barrier bottles. We are continuing to limit
investment in the carbonated soft drink and bottled water business, which is a
commodity business, where the return on investment has been
unacceptable.
On
October 23, 2009, we sold our plastic pail assets to BWAY Corporation
for approximately $32 million. The transaction involved the sale of a
plastic pail manufacturing plant in Newnan, Georgia, which Ball acquired in 2006
as part of its purchase of U.S. Can Corporation, as well as associated
contracts. The plant produces injection molded plastic pails and drums for
products such as building materials and pool chemicals. The associated after-tax
loss was insignificant.
To reduce
costs and gain efficiencies, during 2008 and 2009, Ball closed three facilities
in Baldwinsville, New York, Watertown, Wisconsin, and Brampton, Ontario. The
three plants’ operations have been consolidated into our other plastic packaging
manufacturing facilities in the United States.
Aerospace
and Technologies Segment
Ball’s
aerospace and technologies segment, which accounted for 9 percent of
consolidated net sales in 2009, includes national defense, antenna and video
technologies, civil and operational space and systems engineering solutions
businesses. The segment develops spacecraft, sensors and instruments, radio
frequency systems and other advanced technologies for the civil, commercial and
national security aerospace markets. The majority of the aerospace and
technologies business involves work under contracts, generally from one to five
years in duration, as a prime contractor or subcontractor for the U.S.
Department of Defense (DoD), the National Aeronautics and Space Administration
(NASA) and other U.S. government agencies. Contracts funded by the various
agencies of the federal government represented 94 percent of segment sales in
2009.
Geopolitical
events, shifting executive and legislative branch priorities, as well as funding
shortfalls combined with increased competition for new business, have resulted
in a decline in opportunities in areas matching our aerospace and technologies
segment’s core capabilities in space hardware. Although we have seen declines in
our space hardware opportunities, our traditional strength, we have seen growth
in opportunities related to our information services and tactical components.
The businesses include hardware, software and services sold primarily to U.S.
customers, with emphasis on space science and exploration, environmental and
Earth sciences, and defense and intelligence applications. Major contractual
activities frequently involve the design, manufacture and testing of satellites,
remote sensors and ground station control hardware and software, as well as
related services such as launch vehicle integration and satellite
operations.
Page 5 of
97
Other
hardware activities include target identification, warning and attitude control
systems and components; cryogenic systems for reactant storage, and associated
sensor cooling devices; star trackers, which are general-purpose stellar
attitude sensors; and fast-steering mirrors. Additionally, the aerospace and
technologies segment provides diversified technical services and products to
government agencies, prime contractors and commercial organizations for a broad
range of information warfare, electronic warfare, avionics, intelligence,
training and space systems needs.
Backlog
in the aerospace and technologies segment was $518 million and
$597 million at December 31, 2009 and 2008, respectively, and consists
of the aggregate contract value of firm orders, excluding amounts previously
recognized as revenue. The 2009 backlog includes $344 million expected
to be recognized in revenues during 2010, with the remainder expected to be
recognized in revenues thereafter. Unfunded amounts included in backlog for
certain firm government orders, which are subject to annual funding, were
$261 million and $309 million at December 31, 2009 and 2008,
respectively. Year-over-year comparisons of backlog are not necessarily
indicative of the trend of future operations.
On
February 15, 2008, the segment completed the sale of its shares in Ball
Solutions Group Pty Ltd (BSG) to QinetiQ Pty Ltd for approximately $10.5
million, including cash sold of $1.8 million. BSG was previously a wholly owned
Australian subsidiary that provided services to the Australian department of
defense and related government agencies. After an adjustment for working capital
items, the sale resulted in a pretax gain of $7.1 million.
Ball’s
aerospace and technologies segment has contracts with the U.S. government or its
contractors that have standard termination provisions. The government retains
the right to terminate contracts at its convenience. However, if contracts are
terminated in this manner, Ball is entitled to reimbursement for allowable costs
and profits on authorized work performed through the date of termination. U.S.
government contracts are also subject to reduction or modification in the event
of changes in government requirements or budgetary constraints.
Patents
In the
opinion of the company, none of its active patents is essential to the
successful operation of its business as a whole.
Research
and Development
Research
and development (R&D) efforts in the North American packaging segments, as
well as in the European metal beverage container business, are primarily
directed toward packaging innovation, specifically the development of new
features, sizes, shapes and types of containers, as well as new uses for
existing containers. Other R&D efforts in these segments seek to improve
manufacturing efficiencies. Our North American packaging R&D activities are
primarily conducted in the Ball Technology & Innovation Center (BTIC)
located in Westminster, Colorado. The European R&D activities are primarily
conducted in a technical center located in Bonn, Germany.
In our
aerospace business, we continue to focus our R&D activities on the design,
development and manufacture of innovative aerospace systems. This includes the
production of spacecraft, instruments and sensors, radio frequency and microwave
technologies, data exploitation solutions and a variety of advanced aerospace
technologies and products that enable deep space missions. Our aerospace R&D
activities are conducted in various locations in the U.S.
Additional
information regarding company research and development activity is contained in
Note 1 to the consolidated financial statements within Item 8 of this
report, as well as included in Item 2, “Properties.”
Sustainability
and the Environment
Throughout
our company’s history, we have focused on sustainability and the environment in
all aspects of our businesses and recently have formalized our initiatives. We
continue to make progress on the sustainability goals stated in the
sustainability report we issued in June 2008. We have committed to formally
report on the status of our sustainability efforts in 2010.
Key
issues for our company include reducing our use of electricity and natural gas,
reducing waste and increasing recycling at our facilities, analyzing and
reducing our water consumption, reducing our existing volatile organic compounds
and further improving safety performance in our facilities.
The 2008
recycling rate in the United States for aluminum cans was 54 percent, the
highest recycling rate for any beverage container. Other 2008 U.S. recycling
rates were 65 percent for steel cans, 27 percent for PET bottles and
11 percent for polypropylene bottles. According to the most recently
published data, the aluminum can sheet we buy contains an average of
44 percent post consumer recycled content and the average post consumer
recycled content for steel cans is 28 percent.
Page 6 of
97
Recycling
rates vary throughout Europe but average around 60 percent for aluminum and
steel containers, which exceeds the European Union’s goal of 50 percent
recycling for metals. Due in part to the intrinsic value of aluminum and steel,
metal packaging recycling rates in Europe compare favorably to those of other
packaging materials. Ball’s European operations help establish and financially
support recycling initiatives in growing markets, such as Poland and Serbia, to
educate consumers about the benefits of recycling aluminum and steel cans and to
increase recycling rates. We have initiated a similar program in China to
educate consumers in that market regarding the benefits of
recycling.
Compliance
with federal, state and local laws relating to protection of the environment has
not had a material adverse effect upon the capital expenditures, earnings or
competitive position of the company. As more fully described under Item 3,
“Legal Proceedings,” the U.S. Environmental Protection Agency and various state
environmental agencies have designated the company as a potentially responsible
party, along with numerous other companies, for the cleanup of several
hazardous waste sites. However, the company’s information at this time indicates
that these matters will not have a material adverse effect upon the liquidity,
results of operations or financial condition of the company.
Legislation
that would prohibit, tax or restrict the sale or use of certain types of
containers, or would require diversion of solid wastes, including packaging
materials, from disposal in landfills, has been or may be introduced anywhere we
operate. While container legislation has been adopted in some jurisdictions,
similar legislation has been defeated in public referenda and legislative bodies
in numerous others. The company anticipates that continuing efforts will be made
to consider and adopt such legislation in many jurisdictions in the future. If
such legislation were widely adopted, it could potentially have a material
adverse effect on the business of the company, including its liquidity, results
of operations or financial condition, as well as on the container manufacturing
industry generally, in view of the company’s substantial global sales and
investment in metal and PET container manufacturing. However, the packages we
produce are widely used and perform well in U.S. states, Canadian provinces and
European countries that have deposit systems.
Employee
Relations
At the
end of 2009, the company and its subsidiaries employed approximately
10,500 employees in the U.S. and 4,000 in other countries. An
additional 1,100 people were employed in unconsolidated joint ventures in
which Ball participates.
Approximately
40 percent of Ball's North American packaging plant employees are unionized and
most of our European plant employees are union workers. Collective bargaining
agreements with various unions in the U.S. have terms of three to five years and
those in Europe have terms of one to two years. The agreements expire at regular
intervals and are customarily renewed in the ordinary course after bargaining
between union and company representatives. The company believes that its
employee relations are good and that its safety, training, education,
diversity and retention practices assist in enhancing employee satisfaction
levels.
Where
to Find More Information
Ball
Corporation is subject to the reporting and other information requirements of
the Securities Exchange Act of 1934, as amended (Exchange Act). Reports and
other information filed with the Securities and Exchange Commission (SEC)
pursuant to the Exchange Act may be inspected and copied at the public reference
facility maintained by the SEC in Washington, D.C. The SEC maintains a website
at www.sec.gov containing our reports, proxy materials and other items. The
company also maintains a website at www.ball.com on which
it provides a link to access Ball’s SEC reports free of charge.
The
company has established written Ball Corporation Corporate Governance
Guidelines; a Ball Corporation Executive Officers and Board of Directors
Business Ethics Statement (Ethics Statement); a Business Ethics booklet; and
Ball Corporation Audit Committee, Nominating/Corporate Governance Committee,
Human Resources Committee and Finance Committee charters. These documents are
set forth on the company’s website at www.ball.com on the
“Corporate” page, under the section “Investors,” under the subsection “Financial
Information,” and under the link “Corporate Governance.” A copy may also be
obtained upon request from the company’s corporate secretary.
The
company intends to post on its website the nature of any amendments to the
company’s codes of ethics that apply to executive officers and directors,
including the chief executive officer, chief financial officer and controller,
and the nature of any waiver or implied waiver from any code of ethics granted
by the company to any executive officer or director. These postings will appear
on the company’s website at www.ball.com under
the “Corporate” page, section “Investors,” under the subsection “Financial
Information,” and under the link “Corporate Governance.”
Page 7 of
97
Item
1A. Risk Factors
Any of
the following risks could materially and adversely affect our business,
financial condition or results of operations.
There
can be no assurance that the acquisition of certain AB InBev plants, or any
other acquisition, will be successfully integrated into the acquiring company
(see Note 3 to the consolidated financial statements within Item 8 of
this report for details of the acquisition).
While we
have what we believe to be well designed integration plans, if we cannot
successfully integrate the acquired operations with those of Ball, we may
experience material negative consequences to our business, financial condition
or results of operations. The integration of companies that have previously been
operated separately involves a number of risks, including, but not limited
to:
|
●
|
demands
on management related to the increase in our size after the
acquisition;
|
|
●
|
the
diversion of management’s attention from the management of existing
operations to the integration of the acquired
operations;
|
|
●
|
difficulties
in the assimilation and retention of
employees;
|
|
●
|
difficulties
in the integration of departments, systems, including accounting systems,
technologies, books and records and procedures, as well as in maintaining
uniform standards, controls (including internal accounting controls),
procedures and policies;
|
|
●
|
expenses
related to any undisclosed or potential liabilities;
and
|
|
●
|
retention
of major customers and suppliers.
|
We may
not be able to achieve potential synergies or maintain the levels of revenue,
earnings or operating efficiency that each business had achieved or might
achieve separately. The successful integration of the acquired operations will
depend on our ability to manage those operations, realize revenue opportunities
and, to some degree, eliminate redundant and excess costs.
The
loss of a key customer, or a reduction in its requirements, could have a
significant negative impact on our sales.
We sell a
majority of our packaging products to relatively few major beverage, packaged
food and household product companies, some of which operate in North America,
South America, Europe and Asia.
Although
the majority of our customer contracts are long-term, these contracts are
terminable under certain circumstances, such as our failure to meet quality,
volume or market pricing requirements. Because we depend on relatively few major
customers, our business, financial condition or results of operations could be
adversely affected by the loss of any of these customers, a reduction in the
purchasing levels of these customers, a strike or work stoppage by a significant
number of these customers' employees or an adverse change in the terms of the
supply agreements with these customers.
The
primary customers for our aerospace segment are U.S. government agencies or
their prime contractors. Our contracts with these customers are subject to
several risks, including funding cuts and delays, technical uncertainties,
budget changes, competitive activity and changes in scope.
We
face competitive risks from many sources that may negatively impact our
profitability.
Competition
within the packaging industry is intense. Increases in productivity, combined
with existing or potential surplus capacity in the industry, have maintained
competitive pricing pressures. The principal methods of competition in the
general packaging industry are price, service and quality. Some of our
competitors may have greater financial, technical and marketing resources. Our
current or potential competitors may offer products at a lower price or products
that are deemed superior to ours. The global economic environment may result in
reductions in demand for our products, which, in turn, could increase these
competitive pressures.
We
are subject to competition from alternative products, which could result in
lower profits and reduced cash flows.
Our metal
packaging products are subject to significant competition from substitute
products, particularly plastic carbonated soft drink bottles made from PET,
single serve beer bottles and other food and beverage containers made of glass,
cardboard or other materials. Competition from plastic carbonated soft drink
bottles is particularly intense in the United States, the United Kingdom and the
PRC. Certain of our aerospace products are also subject to competition from
alternative solutions. There can be no assurance that our products will
successfully compete against alternative products, which could result in a
reduction in our profits or cash flow.
Page 8 of
97
We
have a narrow product range, and our business would suffer if usage of our
products decreased.
For the
12 months ended December 31, 2009, 63 percent of our consolidated net
sales were from the sale of metal beverage cans, and we expect to derive a
significant portion of our future revenues and cash flows from the sale of metal
beverage cans. Our business would suffer if the use of metal beverage cans
decreased. Accordingly, broad acceptance by consumers of aluminum and steel cans
for a wide variety of beverages is critical to our future success. If demand for
glass and PET bottles increases relative to cans, or the demand for aluminum and
steel cans does not develop as expected, our business, financial condition or
results of operations could be materially adversely affected.
Changes
in laws and governmental regulations may adversely affect our business and
operations.
We and
our customers and suppliers are subject to various federal, state and provincial
laws and regulations. Each of our, and their, plants is subject to federal,
state, provincial and local licensing and regulation by health, environmental,
workplace safety and other agencies. Requirements of governmental authorities
with respect to manufacturing, product content and safety, climate change,
workplace safety and health, and environmental and other standards could
adversely affect our ability to manufacture or sell our products. In addition,
we face risks arising from compliance with and enforcement of increasingly
numerous and complex federal, state and provincial laws and
regulations.
Our
operations in the U.S. are subject to the Fair Labor Standards Act, which
governs such matters as minimum wages, overtime and other working conditions,
family leave mandates and similar state laws that govern these and other
employment law matters. The U.S. federal government has proposed sweeping
changes to laws affecting the health care of all Americans, including our
employees, as well as new or changing laws or regulations relating to union
organizing rights and activities that may impact our operations and increase our
cost of labor. Significant environmental legislation and regulatory changes are
also being considered. The compliance costs associated with current and proposed
laws and evolving regulations could be substantial, and any failure or alleged
failure to comply with these laws or regulations could lead to litigation, all
of which could adversely affect our financial condition or results of
operations.
Our
business, financial condition and results of operations are subject to risks
resulting from increased international operations.
We
derived approximately 30 percent of our consolidated net sales from outside
of the U.S. for the year ended December 31, 2009. This sizeable scope of
international operations may lead to more volatile financial results and make it
more difficult for us to manage our business. Reasons for this include, but are
not limited to, the following:
|
●
|
political
and economic instability in foreign
markets;
|
|
●
|
foreign
governments' restrictive trade
policies;
|
|
●
|
the
imposition of duties, taxes or government
royalties;
|
|
●
|
foreign
exchange rate risks;
|
|
●
|
difficulties
in enforcement of contractual obligations and intellectual property
rights; and
|
|
●
|
the
geographic, language and cultural differences between personnel in
different areas of the world.
|
Any of
these factors, some of which are also present in the U.S., could materially
adversely affect our business, financial condition or results of
operations.
We
are exposed to exchange rate fluctuations.
Our
reporting currency is the U.S. dollar. Historically, Ball's foreign operations,
including assets and liabilities and revenues and expenses, have been
denominated in various currencies other than the U.S. dollar, and we expect that
our foreign operations will continue to be so denominated. As a result, the U.S.
dollar value of Ball's foreign operations has varied, and will continue to vary,
with exchange rate fluctuations. Ball has been, and is presently, primarily
exposed to fluctuations in the exchange rate of the euro, British pound,
Canadian dollar, Polish zloty, Chinese renminbi, Brazilian real, Argentine peso
and Serbian dinar.
A
decrease in the value of any of these currencies, especially the euro, British
pound, Polish zloty, Chinese renminbi and Canadian dollar, relative to the U.S.
dollar, could reduce our profits from foreign operations and the value of the
net assets of our foreign operations when reported in U.S. dollars in our
financial statements. This could have a material adverse effect on our business,
financial condition or results of operations as reported in U.S. dollars. In
addition, fluctuations in currencies relative to currencies in which the
earnings are generated may make it more difficult to perform period-to-period
comparisons of our reported results of operations.
Page 9 of
97
We manage
our exposure to foreign currency fluctuations, particularly our exposure to
fluctuations in the euro to U.S. dollar exchange rate, in order to attempt to
mitigate the effect of foreign cash flow and earnings volatility associated with
foreign exchange rate changes. We primarily use forward contracts and options to
manage our foreign currency exposures and, as a result, we experience gains and
losses on these derivative positions offset, in part, by the impact of currency
fluctuations on existing assets and liabilities. Our inability to properly
manage our exposure to currency fluctuations could materially impact our
results.
Our
business, operating results and financial condition are subject to particular
risks in certain regions of the world.
We may
experience an operating loss in one or more regions of the world for one or more
periods, which could have a material adverse effect on our business, operating
results or financial condition. Moreover, overcapacity, which often leads to
lower prices, exists in a number of the regions in which we operate and may
persist even if demand grows. Our ability to manage such operational
fluctuations and to maintain adequate long-term strategies in the face of such
developments will be critical to our continued growth and
profitability.
If
we fail to retain key management and personnel, we may be unable to implement
our key objectives.
We
believe that our future success depends, in part, on our experienced management
team. Losing the services of key members of our management team could make it
difficult for us to manage our business and meet our objectives.
Decreases
in our ability to apply new technology and know-how may affect our
competitiveness.
Our
success depends partially on our ability to improve production processes and
services. We must also introduce new products and services to meet changing
customer needs. If we are unable to implement better production processes or to
develop new products, we may not be able to remain competitive with other
manufacturers. As a result, our business, financial condition or results of
operations could be adversely affected.
Adverse
weather and climate changes may result in lower sales.
We
manufacture packaging products primarily for beverages and foods. Unseasonably
cool weather can reduce demand for certain beverages packaged in our containers.
In addition, poor weather conditions or changes in climate that reduce crop
yields of fruits and vegetables can adversely affect demand for our food
containers. Climate change could have various effects on the demand for our
products in different regions around the world.
We
are vulnerable to fluctuations in the supply and price of raw
materials.
We
purchase aluminum, steel, plastic resin and other raw materials and packaging
supplies from several sources. While all such materials are available from
independent suppliers, raw materials are subject to fluctuations in price and
availability attributable to a number of factors, including general economic
conditions, commodity price fluctuations (particularly aluminum on the London
Metal Exchange), the demand by other industries for the same raw materials and
the availability of complementary and substitute materials. Although we enter
into commodities purchase agreements from time to time and use derivative
instruments to manage our risk, we cannot ensure that our current suppliers of
raw materials will be able to supply us with sufficient quantities at reasonable
prices. Economic and financial factors could impact our suppliers, thereby
causing supply shortages. Increases in raw material costs could have a material
adverse effect on our business, financial condition or results of operations. In
North America and Europe, some contracts do not allow us to pass along increased
raw material costs and we use derivative agreements to manage this risk. Our
hedging procedures may be insufficient and our results could be materially
impacted if costs of materials increase. Due to the fixed price contracts and
derivative activities, while increasing raw material costs may not impact our
near-term profitability, increased prices could decrease our sales volume over
time.
Prolonged
work stoppages at plants with union employees could jeopardize our financial
position.
As of
December 31, 2009, approximately 40 percent of our North American packaging
plant employees and most of our packaging plant employees in Europe were covered
by collective bargaining agreements. These collective bargaining agreements have
staggered expirations during the next several years. Although we consider our
employee relations to be generally good, a prolonged work stoppage or strike at
any facility with union employees could have a material adverse effect on our
business, financial condition or results of operations. In addition, we cannot
ensure that upon the expiration of existing collective bargaining agreements,
new agreements will be reached without union action or that any such new
agreements will be on terms satisfactory to us. Potential legislation has been
discussed in the United States, which may, if enacted, facilitate the ability of
unions to unionize workers and to establish collective bargaining agreements
with employers, including the company.
Page 10
of 97
Our
aerospace and technologies segment is subject to certain risks specific to that
business, including those outlined below.
In our
aerospace business, existing U.S. government contracts are subject to continued
appropriations by Congress and may be terminated or delayed if future funding is
not made available.
Our
backlog includes both cost-type and fixed-price contracts. Cost-type contracts
generally have lower profit margins than fixed-price contracts. Our earnings and
margins may vary depending on the types of government contracts undertaken, the
nature of the work performed under those contracts, the costs incurred in
performing the work, the achievement of other performance objectives and their
impact on our ability to receive fees.
Our
business is subject to substantial environmental remediation and compliance
costs.
Our
operations are subject to federal, state and local laws and regulations relating
to environmental hazards, such as emissions to air, discharges to water, the
handling and disposal of hazardous and solid wastes and the cleanup of hazardous
substances. The U.S. Environmental Protection Agency has designated us, along
with numerous other companies, as a potentially responsible party for the
cleanup of several hazardous waste sites. Based on available information, we do
not believe that any costs incurred in connection with such sites will have a
material adverse effect on our financial condition, results of operations,
capital expenditures or competitive position. There is increased focus on the
regulation of greenhouse gas emissions and other environmental issues
worldwide.
Net
earnings and net worth could be materially affected by an impairment of
goodwill.
We have a
significant amount of goodwill recorded on the consolidated balance sheet as of
December 31, 2009. We are required annually to test the recoverability of
goodwill. The recoverability test of goodwill is based on the current fair value
of our identified reporting units. Fair value measurement requires assumptions
and estimates of many critical factors, including revenue and market growth,
operating cash flows and discount rates. If general market conditions
deteriorate in portions of our business, we could experience a significant
decline in the fair value of reporting units. This decline could lead to an
impairment of all or a significant portion of the goodwill balance, which could
materially affect our net earnings and net worth.
If
the investments in Ball's pension plans do not perform as expected, we may have
to contribute additional amounts to the plans, which would otherwise be
available to cover operating expenses.
Ball
maintains defined benefit pension plans covering substantially all of its North
American and United Kingdom employees, which we fund based on certain actuarial
assumptions. The plans’ assets consist primarily of common stocks, fixed income
securities and, in the U.S., alternative investments. Market declines, longevity
increases or legislative changes, such as the Pension Protection Act in the
U.S., could result in a prospective decrease in our available cash flow and net
earnings over time, and the recognition of an increase in our pension
obligations could result in a reduction to our shareholders'
equity.
Restricted access to capital markets
could adversely affect our short-term liquidity and prevent us
from fulfilling our obligations under the notes issued pursuant to our bond
indentures.
On
December 31, 2009, we had total debt of $2.6 billion and unused
committed credit lines in excess of $600 million. A reduction of financial
liquidity could have important consequences, including the
following:
|
●
|
restrict
our ability to fund working capital, capital expenditures, research and
development expenditures and other business
activities;
|
|
●
|
increase
our vulnerability to general adverse economic and industry conditions,
including the credit risks stemming from the economic
environment;
|
|
●
|
limit
our flexibility in planning for, or reacting to, changes in our businesses
and the industries in which we
operate;
|
|
●
|
restrict
us from making strategic acquisitions or exploiting business
opportunities; and
|
|
●
|
limit,
along with the financial and other restrictive covenants in our debt,
among other things, our ability to borrow additional funds, dispose of
assets, pay cash dividends or refinance debt
maturities.
|
In
addition, more than one third of our debt bears interest at variable rates. If
market interest rates increase, variable-rate debt will create higher debt
service requirements, which would adversely affect our cash flow. While we
sometimes enter into agreements limiting our exposure, any such agreements may
not offer complete protection from this risk.
Page 11
of 97
Changes
in U.S. generally accepted accounting principles (U.S. GAAP) and Securities and
Exchange Commission (SEC) rules and regulations, could materially impact our
reported results.
U.S. GAAP
and SEC accounting and reporting changes are common and have become more
frequent and significant over the past few years. These changes could have
significant effects on our reported results when compared to prior periods and
may even require us to retrospectively adjust prior periods. Additionally,
material changes to the presentation of transactions in the consolidated
financial statements could impact key ratios that analysts and credit rating
agencies use to rate Ball. The material changes in net earnings and/or
presentation of transactions could impact our credit rating and ultimately our
ability to access the credit markets in an efficient manner.
The
global credit, financial and economic environment could have a negative impact
on our results of operations, financial position or cash flows.
The
global credit, financial and economic environment could have significant
negative effects on our operations, including, but not limited to, the
following:
|
●
|
the
creditworthiness of customers, suppliers and counterparties could
deteriorate resulting in a financial loss or a disruption in our supply of
raw materials;
|
|
●
|
volatile
market performance could affect the fair value of our pension assets,
potentially requiring us to make significant additional contributions to
our defined benefit plans to maintain prescribed funding
levels;
|
|
●
|
a
significant weakening of our financial position or operating results could
result in noncompliance with our debt covenants;
and
|
|
●
|
reduced
cash flow from our operations could adversely affect our ability to
execute our long-term strategy to increase liquidity, reduce debt,
repurchase our stock and invest in our
businesses.
|
|
Item
1B.
|
Unresolved
Staff Comments
|
There
were no matters required to be reported under this item.
|
Item
2.
|
Properties
|
The
company’s properties described below are well maintained, are considered
adequate and are being utilized for their intended purposes.
Ball’s
corporate headquarters and the aerospace and technologies segment offices are
located in Broomfield, Colorado. The Colorado-based operations of the aerospace
and technologies segment occupy a variety of company-owned and leased facilities
in Broomfield, Boulder and Westminster, which together aggregate
1.3 million square feet of office, laboratory, research and
development, engineering and test and manufacturing space. Other aerospace and
technologies operations carry on business in smaller company-owned and leased
facilities in Georgia, New Mexico, Ohio, Virginia and Washington,
D.C.
The
offices of the company’s various North American packaging operations are located
in Westminster, Colorado, and the offices for the European packaging
operations are located in Ratingen, Germany. Also located in Westminster
is the Ball Technology and Innovation Center, which serves as a research
and development facility for our various North American packaging operations.
The European Technical Center, which serves as a research and development
facility for the European beverage can manufacturing operations, is located in
Bonn, Germany.
Information
regarding the approximate size of the manufacturing locations for significant
packaging operations, which are owned or leased by the company, is set forth
below. Facilities in the process of being constructed or shut down have been
excluded from the list. Where certain locations include multiple facilities, the
total approximate size for the location is noted. In addition to the facilities
listed, the company leases other warehousing space.
Page 12
of 97
|
Approximate
|
|
|
Floor
Space in
|
|
|
Plant
Location
|
Square
Feet
|
|
Metal
beverage packaging, Americas and Asia, manufacturing
facilities:
|
|
|
Americas
|
|
|
Fairfield,
California
|
358,000
|
|
Torrance,
California
|
382,000
|
|
Golden,
Colorado
|
509,000
|
|
Gainesville,
Florida
|
88,000
|
|
Tampa,
Florida
|
238,000
|
|
Rome,
Georgia
|
386,000
|
|
Kapolei,
Hawaii
|
132,000
|
|
Monticello,
Indiana
|
356,000
|
|
Saratoga
Springs, New York
|
290,000
|
|
Wallkill,
New York
|
317,000
|
|
Reidsville,
North Carolina
|
447,000
|
|
Columbus,
Ohio
|
298,000
|
|
Findlay,
Ohio (a)
|
733,000
|
|
Whitby,
Ontario
|
205,000
|
|
Conroe,
Texas
|
275,000
|
|
Fort
Worth, Texas
|
322,000
|
|
Bristol,
Virginia
|
245,000
|
|
Williamsburg,
Virginia
|
400,000
|
|
Fort
Atkinson, Wisconsin
|
250,000
|
|
Milwaukee,
Wisconsin (including leased warehouse space) (a)
|
502,000
|
|
Asia
|
|
|
Beijing,
PRC
|
267,000
|
|
Hubei
(Wuhan), PRC
|
237,000
|
|
Shenzhen,
PRC
|
331,000
|
|
Taicang,
PRC (leased)
|
81,000
|
|
Tianjin,
PRC
|
47,000
|
|
Metal
beverage packaging, Europe, manufacturing facilities:
|
|
|
Bierne,
France
|
263,000
|
|
La
Ciotat, France
|
393,000
|
|
Braunschweig,
Germany
|
258,000
|
|
Hassloch,
Germany
|
283,000
|
|
Hermsdorf,
Germany
|
290,000
|
|
Weissenthurm,
Germany
|
331,000
|
|
Oss,
Netherlands
|
231,000
|
|
Radomsko,
Poland
|
311,000
|
|
Belgrade,
Serbia
|
352,000
|
|
Deeside,
United Kingdom
|
115,000
|
|
Rugby,
United Kingdom
|
175,000
|
|
Wrexham,
United Kingdom
|
222,000
|
| (a) Includes both metal beverage container and metal food container manufacturing operations. |
Page 13
of 97
|
Approximate
|
|
|
Floor
Space in
|
|
|
Plant
Location
|
Square
Feet
|
|
Metal
food and household products packaging, Americas, manufacturing
facilities:
|
|
|
North America
|
|
|
Springdale,
Arkansas
|
366,000
|
|
Richmond,
British Columbia
|
198,000
|
|
Oakdale,
California
|
573,000
|
|
Danville,
Illinois
|
118,000
|
|
Elgin,
Illinois (including leased warehouse space)
|
637,000
|
|
Baltimore,
Maryland (including leased warehouse space)
|
241,000
|
|
Columbus,
Ohio
|
305,000
|
|
Findlay,
Ohio (a)
|
733,000
|
|
Hubbard,
Ohio
|
175,000
|
|
Horsham,
Pennsylvania
|
162,000
|
|
Chestnut
Hill, Tennessee
|
347,000
|
|
Weirton,
West Virginia (leased)
|
332,000
|
|
DeForest,
Wisconsin
|
400,000
|
|
Milwaukee,
Wisconsin (including leased warehouse space)
(a)
|
502,000
|
|
South America
|
|
|
Buenos
Aires, Argentina (leased)
|
34,000
|
|
San
Luis, Argentina
|
32,000
|
|
Plastic
packaging, Americas, manufacturing facilities (all North
America):
|
|
|
Chino,
California (leased)
|
729,000
|
|
Batavia,
Illinois
|
404,000
|
|
Ames,
Iowa (including leased warehouse space)
|
830,000
|
|
Delran,
New Jersey (including leased warehouse space)
|
892,000
|
|
Bellevue,
Ohio
|
390,000
|
|
|
(a)
|
Includes
both metal beverage container and metal food container manufacturing
operations.
|
In
addition to the consolidated manufacturing facilities, the company has ownership
interests of 50 percent or less in packaging affiliates located primarily
in the U.S., PRC and Brazil, which affiliates own or lease manufacturing
facilities in each of those countries.
|
Item
3.
|
Legal
Proceedings
|
We are
subject to numerous lawsuits, claims or proceedings arising out of the ordinary
course of our business, including actions related to product liability; personal
injury; the use and performance of our products; warranty matters; patent,
trademark or other intellectual property infringement; contractual liability;
the conduct of our business; tax reporting in foreign jurisdictions; workplace
safety; and environmental and other matters. We also have been identified as a
potentially responsible party at several waste disposal sites under U.S. federal
and related state environmental statutes and regulations and may have joint and
several liability for any investigation and remediation costs incurred with
respect to such sites. Some of these lawsuits, claims and proceedings involve
substantial amounts, as described below, and some of our environmental
proceedings involve potential monetary costs or sanctions that may exceed
$100,000. We have denied liability with respect to many of these lawsuits,
claims and proceedings and are vigorously defending such lawsuits, claims and
proceedings. We carry various forms of commercial, property and casualty, and
other forms of insurance; however, such insurance may not be applicable or adequate to cover the
costs associated with a judgment against us with respect to these lawsuits,
claims and proceedings. We do not believe that these lawsuits, claims and
proceedings are material individually or in the aggregate. While we believe we
have also established adequate accruals for our expected future liability with
respect to pending lawsuits, claims and proceedings, where the nature and extent
of any such liability can be reasonably estimated based upon then presently
available information, there can be no assurance that the final resolution of
any existing or future lawsuits, claims or proceedings will not have a material
adverse effect on our liquidity, results of operations or financial condition of
the company.
Page 14
of 97
On or
about February 19, 2010, the company’s Canadian subsidiary, Ball Packaging
Products Canada Corp. (Ball Canada), was advised by the Ontario Ministry of the
Environment (the Ministry) that the Ministry would post, for public comment, a
proposed Order under the Environmental Protection Act. The proposed Order would
require Ball Canada to remediate areas which were allegedly contaminated by its
predecessor company, Marathon Paper Mills of Canada Limited, and certain
successors (Marathon). Those companies operated a paper mill on the north shore
of Lake Superior for many years until it was sold to James River Company in
1983. Ball Canada is investigating whether the allegations in the proposed Order
are correct and, if so, whether or not it has any liability or any recourse
against other parties, including any former or subsequent owners or other
parties associated with the paper mill. Subject to the results of such
investigation, the company does not believe this matter will have a material
adverse effect upon the liquidity, results of operations or financial condition
of the company.
As
previously reported, the company is investigating potential violations of the
Foreign Corrupt Practices Act in Argentina, which came to our attention on or
about October 15, 2007. The Department of Justice and the SEC were also
made aware of this matter, on or about the same date. The Department of Justice
has informed us that it has completed its investigation and will not bring
charges; the SEC’s investigation continues. Based on our investigation to date,
we do not believe this matter involved senior management or management or other
employees who have significant roles in internal control over financial
reporting.
As
previously reported, on October 6, 2005, Ball Metal Beverage Container
Corp. (BMBCC), a wholly owned subsidiary of the company, was served with an
amended complaint filed by Crown Packaging Technology, Inc. et. al.
(Crown), in the U.S. District Court for the Southern District of Ohio,
Western Division at Dayton, Ohio. The complaint alleges that the manufacture,
sale and use of certain ends by BMBCC and its customers infringes certain claims
of Crown’s U.S. patents. The complaint seeks unspecified monetary damages, fees,
and declaratory and injunctive relief. BMBCC has formally denied the allegations
of the complaint. On September 8, 2009, the District Court granted Ball’s
motion for summary judgment holding that the asserted patent claims were invalid
for failure to comply with the written description requirement and because they
were anticipated by prior art. On October 7, 2009, Crown filed its Notice
of Appeal seeking to overturn the Trial Court’s decision. Briefing is currently
stayed pending the outcome in the appeal of a case in which the written
description requirement is under en banc review. Once the
decision in that case is issued, briefing will begin. Based on the information
available to the company at the present time, the company does not believe that
this matter will have a material adverse effect upon the liquidity, results of
operations or financial condition of the company.
As
previously reported, the U.S. Environmental Protection Agency (USEPA) considers
the company a Potentially Responsible Party (PRP) with respect to the Lowry
Landfill site located east of Denver, Colorado. On June 12, 1992, the
company was served with a lawsuit filed by the City and County of Denver
(Denver) and Waste Management of Colorado, Inc., seeking contributions from the
company and approximately 38 other companies. The company filed its answer
denying the allegations of the complaint. On July 8, 1992, the company was
served with a third-party complaint filed by S.W. Shattuck Chemical Company,
Inc., seeking contribution from the company and other companies for the costs
associated with cleaning up the Lowry Landfill. The company denied the
allegations of the complaints.
In July
1992 the company entered into a settlement and indemnification agreement with
Chemical Waste Management, Inc., and Waste Management of Colorado, Inc.
(collectively Waste Management) and Denver pursuant to which Waste Management
and Denver dismissed their lawsuit against the company, and Waste Management
agreed to defend, indemnify and hold harmless the company from claims and
lawsuits brought by governmental agencies and other parties relating to actions
seeking contributions or remedial costs from the company for the cleanup of the
site. Waste Management, Inc., has agreed to guarantee the obligations of Waste
Management. Waste Management and Denver may seek additional payments from the
company if the response costs related to the site exceed $319 million. In
2003 Waste Management, Inc., indicated that the cost of the site might exceed
$319 million in 2030, approximately three years before the projected
completion of the project. The company might also be responsible for payments
(based on 1992 dollars) for any additional wastes that may have been disposed of
by the company at the site but which are identified after the execution of the
settlement agreement. While remediating the site, contaminants were encountered,
which could add an additional cleanup cost of approximately $10 million.
This additional cleanup cost could, in turn, add approximately $1 million
to total site costs for the PRP group.
At this
time, there are no Lowry Landfill actions in which the company is actively
involved. Based on the information available to the company at this time, the
company does not believe that this matter will have a material adverse effect
upon the liquidity, results of operations or financial condition of the
company.
|
Item
4.
|
Submission
of Matters to a Vote of Security
Holders
|
There
were no matters submitted to the security holders during the fourth quarter of
2009.
Page 15
of 97
Part
II
|
Item
5.
|
Market
for the Registrant’s Common Stock and Related Stockholder
Matters
|
Ball
Corporation common stock (BLL) is traded on the New York Stock Exchange and the
Chicago Stock Exchange. There were 5,563 common shareholders of record on
January 31, 2010.
Common
Stock Repurchases
The
following table summarizes the company’s repurchases of its common stock during
the quarter ended December 31, 2009.
|
Purchases
of Securities
|
||||||||||||||||
|
Total Number
of Shares
Purchased (a)
|
Average
Price
Paid
per Share
|
Total
Number of
Shares
Purchased as
Part
of Publicly
Announced
Plans or Programs
|
Maximum
Number
of
Shares that May
Yet
Be Purchased
Under
the Plans
or Programs
(b)
|
|||||||||||||
|
September 28
to October 25, 2009
|
10,559 | $ | 50.04 | 10,559 | 6,930,737 | |||||||||||
|
October 26
to November 22, 2009
|
143,786 | $ | 50.06 | 143,786 | 6,786,951 | |||||||||||
|
November 23
to December 31, 2009
|
113,126 | $ | 49.93 | 113,126 | 6,673,825 | |||||||||||
|
Total
|
267,471 | $ | 50.01 | 267,471 | ||||||||||||
|
(a)
|
Includes
open market purchases (on a trade-date basis) and/or shares retained by
the company to settle employee withholding tax
liabilities.
|
|
(b)
|
The
company has an ongoing repurchase program for which shares are authorized
for repurchase from time to time by Ball’s board of directors. On
January 23, 2008, Ball's board of directors authorized the repurchase
by the company of up to a total of 12 million shares of its common stock.
This repurchase authorization replaced all previous
authorizations.
|
Quarterly
Stock Prices and Dividends
Quarterly
prices for the company's common stock, as reported on the New York Stock
Exchange composite tape, and quarterly dividends in 2009 and 2008 (on a calendar
quarter basis) were:
|
2009
|
2008
|
|||||||||||||||||||||||||||||||
|
4th
|
3rd
|
2nd
|
1st
|
4th
|
3rd
|
2nd
|
1st
|
|||||||||||||||||||||||||
|
Quarter
|
Quarter
|
Quarter
|
Quarter
|
Quarter
|
Quarter
|
Quarter
|
Quarter
|
|||||||||||||||||||||||||
|
High
|
$ | 52.46 | $ | 52.17 | $ | 45.49 | $ | 44.45 | $ | 42.49 | $ | 53.44 | $ | 56.20 | $ | 47.02 | ||||||||||||||||
|
Low
|
48.16 | 44.64 | 37.30 | 36.50 | 27.37 | 38.37 | 45.79 | 40.23 | ||||||||||||||||||||||||
|
Dividends
per share
|
0.10 | 0.10 | 0.10 | 0.10 | 0.10 | 0.10 | 0.10 | 0.10 | ||||||||||||||||||||||||
Page 16
of 97
Shareholder
Return Performance
The line
graph below compares the annual percentage change in Ball Corporation’s
cumulative total shareholder return on its common stock with the cumulative
total return of the Dow Jones Containers & Packaging Index and the S&P
Composite 500 Stock Index for the five-year period ended December 31,
2009. It assumes $100 was invested on December 31, 2004, and that all
dividends were reinvested. The Dow Jones Containers & Packaging Index total
return has been weighted by market capitalization.
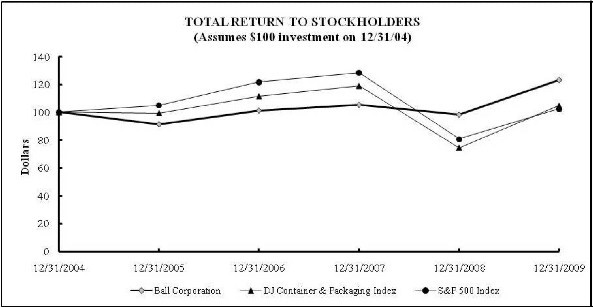
|
Total
Return Analysis
|
12/31/2004
|
12/31/2005
|
12/31/2006
|
12/31/2007
|
12/31/2008
|
12/31/2009
|
|
Ball
Corporation
|
100.00
|
91.22
|
101.13
|
105.22
|
98.13
|
123.11
|
|
DJ
Containers & Packaging Index
|
100.00
|
99.37
|
111.38
|
118.87
|
74.53
|
104.68
|
|
S&P
500 Index
|
100.00
|
104.91
|
121.48
|
128.16
|
80.74
|
102.11
|
|
Copyright©
2010 Standard & Poor's, a division of The McGraw-Hill Companies Inc.
All rights reserved.
(www.researchdatagroup.com/S&P.htm)
|
||||||
|
Copyright©
2010 Dow Jones & Company. All rights
reserved.
|
||||||
Page 17
of 97
|
Item
6.
|
Selected
Financial Data
|
Five-Year
Review of Selected Financial Data
Ball
Corporation and Subsidiaries
|
($
in millions, except per share amounts)
|
2009
|
2008
|
2007
|
2006
|
2005
|
|||||||||||||||
|
Net
sales
|
$ | 7,345.3 | $ | 7,561.5 | $ | 7,475.3 | $ | 6,621.5 | $ | 5,751.2 | ||||||||||
|
Legal
settlement (1)
|
– | – | (85.6 | ) | – | – | ||||||||||||||
|
Total
net sales
|
$ | 7,345.3 | $ | 7,561.5 | $ | 7,389.7 | $ | 6,621.5 | $ | 5,751.2 | ||||||||||
|
Net
earnings attributable to Ball Corporation (1)
|
$ | 387.9 | $ | 319.5 | $ | 281.3 | $ | 329.6 | $ | 272.1 | ||||||||||
|
Return
on average common shareholders’ equity
|
29.1 | % | 26.3 | % | 22.4 | % | 32.7 | % | 27.9 | % | ||||||||||
|
Basic
earnings per share (1)
|
$ | 4.14 | $ | 3.33 | $ | 2.78 | $ | 3.19 | $ | 2.52 | ||||||||||
|
Weighted
average common shares outstanding (000s)
|
93,786 | 95,857 | 101,186 | 103,338 | 107,758 | |||||||||||||||
|
Diluted
earnings per share (1)
|
$ | 4.08 | $ | 3.29 | $ | 2.74 | $ | 3.14 | $ | 2.48 | ||||||||||
|
Diluted
weighted average common shares outstanding (000s)
|
94,989 | 97,019 | 102,760 | 104,951 | 109,732 | |||||||||||||||
|
Property,
plant and equipment additions (2)
|
$ | 187.1 | $ | 306.9 | $ | 308.5 | $ | 279.6 | $ | 291.7 | ||||||||||
|
Depreciation
and amortization
|
$ | 285.2 | $ | 297.4 | $ | 281.0 | $ | 252.6 | $ | 213.5 | ||||||||||
|
Total
assets
|
$ | 6,488.3 | $ | 6,368.7 | $ | 6,020.6 | $ | 5,840.9 | $ | 4,361.5 | ||||||||||
|
Total
interest bearing debt and capital lease obligations
|
$ | 2,596.2 | $ | 2,410.1 | $ | 2,358.6 | $ | 2,451.7 | $ | 1,589.7 | ||||||||||
|
Ball
Corporation common shareholders’ equity
|
$ | 1,581.3 | $ | 1,085.8 | $ | 1,342.5 | $ | 1,165.4 | $ | 853.4 | ||||||||||
|
Market
capitalization (3)
|
$ | 4,860.9 | $ | 3,898.3 | $ | 4,510.1 | $ | 4,540.4 | $ | 4,138.8 | ||||||||||
|
Net
debt to market capitalization (3)
|
49.1 | % | 58.6 | % | 48.9 | % | 50.7 | % | 36.9 | % | ||||||||||
|
Cash
dividends per share
|
$ | 0.40 | $ | 0.40 | $ | 0.40 | $ | 0.40 | $ | 0.40 | ||||||||||
|
Book
value per share
|
$ | 16.82 | $ | 11.58 | $ | 13.39 | $ | 11.19 | $ | 8.19 | ||||||||||
|
Market
value per share
|
$ | 51.70 | $ | 41.59 | $ | 45.00 | $ | 43.60 | $ | 39.72 | ||||||||||
|
Annual
return (loss) to common shareholders (4)
|
25.5 | % | (6.7 | )% | 4.0 | % | 10.9 | % | (8.8 | )% | ||||||||||
|
Working
capital
|
$ | 494.7 | $ | 302.9 | $ | 329.8 | $ | 307.0 | $ | 67.9 | ||||||||||
|
Current
ratio
|
1.35 | 1.16 | 1.22 | 1.21 | 1.06 | |||||||||||||||
|
(1)
|
Includes
business consolidation activities and other items affecting comparability
between years. Additional details about the 2009, 2008 and 2007 items are
available in Notes 3, 4, 5, 6, and 7 to the consolidated financial
statements within Item 8 of this
report.
|
|
(2)
|
Amounts
in 2007 and 2006 do not include the offsets of $48.6 million and
$61.3 million, respectively, of insurance proceeds received to
replace fire-damaged assets in our Hassloch, Germany,
plant.
|
|
(3)
|
Market
capitalization is defined as the number of common shares outstanding at
year end, multiplied by the year-end closing price of Ball common stock.
Net debt is total debt less cash and cash
equivalents.
|
|
(4)
|
Change
in stock price plus dividends paid, assuming reinvestment of all dividends
paid.
|
Page 18
of 97
|
Item
7.
|
Management’s
Discussion and Analysis of Financial Condition and Results of
Operations
|
Management’s
discussion and analysis should be read in conjunction with the consolidated
financial statements and accompanying notes included in Item 8 of this
report, which include additional information about our accounting policies,
practices and the transactions underlying our financial results. The preparation
of our consolidated financial statements in conformity with accounting
principles generally accepted in the United States of America (U.S. GAAP)
requires us to makes estimates and assumptions that affect the reported amounts
in our consolidated financial statements and the accompanying notes including
various claims and contingencies related to lawsuits, taxes, environmental and
other matters arising during the normal course of business. We apply our best
judgment, our knowledge of existing facts and circumstances and actions that we
may undertake in the future in determining the estimates that affect our
consolidated financial statements. We evaluate our estimates on an ongoing basis
using our historical experience, as well as other factors we believe appropriate
under the circumstances, such as current economic conditions, and adjust or
revise our estimates as circumstances change. As future events and their effects
cannot be determined with precision, actual results may differ from these
estimates. Ball Corporation and its subsidiaries are referred to collectively as
“Ball” or “the company” or “we” or “our” in the following discussion and
analysis.
OVERVIEW
Business
Overview
Ball
Corporation is one of the world’s leading suppliers of metal and plastic
packaging to the beverage, food and household products industries. Our packaging
products are produced for a variety of end uses and are manufactured
in plants around the world. We also provide aerospace and other
technologies and services to governmental and commercial customers.
We sell
our packaging products primarily to major beverage, food and household products
companies with which we have developed long-term customer relationships. This is
evidenced by our high customer retention and our large number of long-term
supply contracts. While we have a diversified customer base, we sell a majority
of our packaging products to relatively few major companies in North America,
Europe, the People’s Republic of China (PRC) and Argentina, as do our equity
joint ventures in Brazil, the U.S. and the PRC. We also purchase raw materials
from relatively few suppliers. Because of our customer and supplier
concentration, our business, financial condition and results of operations could
be adversely affected by the loss, insolvency or bankruptcy of a major customer
or supplier or a change in a supply agreement with a major customer or supplier,
although our contracts and long-term relationships generally mitigate the risk
of customer loss. We are also subject to exposure from inflation and the rising
costs of raw materials, as well as other inputs into our direct costs. We reduce
our risk to these exposures either by fixing our material costs through
derivative contracts or by including provisions in our sales contracts to
recover the increases from our customers.
Industry
Trends and Corporate Strategy
In the
rigid packaging industry, sales and earnings can be improved by reducing costs,
increasing prices, developing new products and expanding volumes. Over the past
two years, we have closed a number of packaging facilities in support of our
ongoing objective of matching our supply with market demand. We have also
identified and implemented plans to improve our return on invested capital
through the redeployment of assets within our operations.
As part
of our packaging strategy, we are focused on developing and marketing new and
existing products that meet the needs of our customers and the ultimate
consumer. These innovations include new shapes, sizes, opening features and
other functional benefits of both metal and plastic packaging. This packaging
development activity helps us maintain and expand our supply positions with
major beverage, food and household products customers.
While the
North American beverage container manufacturing industry is relatively mature,
the European, PRC and Brazilian beverage can markets are growing and are
expected to continue to grow in the medium to long term. While we are able to
capitalize on this growth by increasing capacity in some of our European can
manufacturing facilities by speeding up certain lines and by expansion, we have
put on hold various projects, including the completion of the construction of a
plant in Poland, due to the current world-wide economic environment. However, we
continue to believe that Central and Eastern Europe will be an area of growth
once the economy recovers. Our Brazilian joint venture has completed the
construction of a metal beverage container plant near Rio de Janeiro and has
added further can capacity in the existing Jacarei can plant. These Brazilian
expansion efforts are owned by Ball’s unconsolidated 50-percent-owned joint
venture, Latapack-Ball Embalagens, Ltda., and the expansion was funded by cash
flows from operations and incurrence of debt by the joint venture.
Page 19
of 97
Ball’s
consolidated earnings are exposed to foreign exchange rate fluctuations and we
attempt to mitigate this exposure through the use of derivative financial
instruments, as discussed in “Quantitative and Qualitative Disclosures About
Market Risk” within Item 7A of this report.
The
primary customers for the products and services provided by our aerospace and
technologies segment are U.S. government agencies or their prime contractors. It
is possible that federal budget reductions and priorities, or changes in agency
budgets, could limit future funding and new contract awards or delay or prolong
contract performance. We expect that the delay of certain program awards, as
well as federal budget considerations, will have an unfavorable impact on this
segment in 2010, and we are continuing to take steps to adjust our resources
accordingly.
We
recognize sales under long-term contracts in the aerospace and technologies
segment using the cost-to-cost, percentage of completion method of accounting.
Our present contract mix consists of approximately two-thirds cost-type
contracts, which are billed at our costs plus an agreed upon and/or earned
profit component, and approximately 20 percent fixed-price contracts. The
remainder represents time and material contracts, which typically provide for
the sale of engineering labor at fixed hourly rates. Failure to be awarded
certain key contracts could further adversely affect segment performance in 2010
compared to 2009.
Throughout
the period of contract performance, we regularly reevaluate and, if necessary,
revise our estimates of Ball Aerospace and Technologies Corp.’s total contract
revenue, total contract cost and progress toward completion. Because of contract
payment schedules, limitations on funding and other contract terms, our sales
and accounts receivable for this segment include amounts that have been earned
but not yet billed.
Management
Performance Measures
Management
uses various measures to evaluate company performance such as earnings before
interest and taxes (EBIT); earnings before interest, taxes, depreciation and
amortization (EBITDA); diluted earnings per share; cash flow from operating
activities; free cash flow (generally defined by the company as cash flow from
operating activities less additions to property, plant and equipment); and
economic value added (net operating earnings after tax, as defined by the
company, less a capital charge on net operating assets employed). These
financial measures may be adjusted at times for items that affect comparability
between periods such as business consolidation costs and gains or losses on
dispositions. Nonfinancial measures in the packaging segments include production
efficiency and spoilage rates; quality control figures; environmental, health
and safety statistics; production and sales volumes; asset utilization rates;
and measures of sustainability. Additional measures used to evaluate financial
performance in the aerospace and technologies segment include contract revenue
realization, award and incentive fees realized, proposal win rates and backlog
(including awarded, contracted and funded backlog).
We
recognize that attracting, developing and retaining highly talented employees
are essential to the success of Ball and, because of that, we strive to pay
employees competitively and encourage their ownership of the company’s common
stock as part of a diversified portfolio. For most management employees, a
meaningful portion of compensation is at risk as an incentive, dependent upon
economic value added operating performance. For more senior positions, more
compensation is at risk through economic value added performance and various
long-term and stock compensation plans. Through our employee stock purchase plan
and 401(k) plan, which matches employee contributions with Ball common stock,
employees, regardless of organizational level, have opportunities to own Ball
stock.
Page 20
of 97
RESULTS
OF OPERATIONS
Consolidated
Sales and Earnings
The
company has five reportable segments organized along a combination of product
lines, after aggregating operating segments that have similar economic
characteristics: (1) metal beverage packaging, Americas and Asia;
(2) metal beverage packaging, Europe; (3) metal food and household
products packaging, Americas; (4) plastic packaging, Americas; and
(5) aerospace and technologies. We also have investments in companies in
the U.S., the PRC and Brazil, which are accounted for using the equity method of
accounting and, accordingly, those results are not included in segment sales or
earnings.
Metal
Beverage Packaging, Americas and Asia
|
($
in millions)
|
2009
|
2008
|
2007
|
|||||||||
|
Net
sales
|
$ | 2,888.8 | $ | 2,989.5 | $ | 3,098.1 | ||||||
|
Legal
settlement (a)
|
– | – | (85.6 | ) | ||||||||
|
Total
net sales
|
$ | 2,888.8 | $ | 2,989.5 | $ | 3,012.5 | ||||||
|
Segment
earnings
|
$ | 296.0 | $ | 284.1 | $ | 326.4 | ||||||
|
Legal
settlement (a)
|
– | – | (85.6 | ) | ||||||||
|
Business
consolidation costs (a)
|
(6.8 | ) | (40.6 | ) | – | |||||||
|
Total
segment earnings
|
$ | 289.2 | $ | 243.5 | $ | 240.8 | ||||||
|
(a)
|
Further
details of these items are included in Notes 5 and 6 to the consolidated
financial statements within Item 8 of this
report.
|
The metal
beverage packaging, Americas and Asia, segment consists of operations located in
the U.S., Canada, Puerto Rico (through fiscal year 2008) and the PRC, which
manufacture metal container products used in beverage packaging as well as
non-beverage plastic containers manufactured and sold mainly in the PRC. This
segment accounted for 39 percent of consolidated net sales in 2009
(40 percent in 2008 and 41 percent in 2007, including the impact of
the $85.6 million legal settlement discussed below).
Net sales
were 3 percent lower in 2009 than in 2008, primarily as a result of the
impact of lower aluminum prices partially offset by a 2 percent increase in
sales volumes. The higher sales volumes in 2009 were the result of incremental
volumes from the four plants purchased from Anheuser-Busch InBev n.v./s.a. (AB
InBev) on October 1 (discussed further below), partially offset by lower
sales volumes and plant closures in the existing business. Excluding the effect
of the legal settlement, sales were 4 percent lower in 2008 than in 2007,
primarily as a result of 2008 decreases in North American sales volumes of
approximately 5 percent. The decrease was due primarily to lower unit volume
sales to carbonated soft drink customers, consistent with the industry, and lost
beer sales volumes on the discontinuance of a contract that did not provide
sufficient profitability. This decrease was partially offset by sales volume
increases in the PRC of 14 percent during 2008.
Based on
publicly available information, we estimate that our shipments of metal beverage
containers in 2009 were approximately 31 percent of total U.S. and Canadian
shipments and 22 percent of total PRC shipments. We continue to focus efforts on
the growing custom beverage can business, which includes cans of different
shapes, diameters and fill volumes, and cans with added functional attributes
for new products and product line extensions.
In 2007 a
customer asserted various claims against the company, primarily related to the
pricing of the aluminum component of the containers supplied by a subsidiary,
and on October 4, 2007, the dispute was settled in mediation. The customer
received $85.6 million ($51.8 million after tax) to settle the dispute, and Ball
retained all of the customer’s beverage can and end supply through 2015. Ball
made a one-time payment of $70.3 million ($42.5 million after tax) in
January 2008 with the remainder of the settlement to be recovered over the
life of the supply contract.
Excluding
the business consolidation charges, segment earnings in 2009 were higher than in
2008 due to $12 million of earnings contribution from the four acquired
plants, approximately $21 million of savings associated with the plant
closures discussed below and $3 million of margin growth in Asia. Partially
offsetting these favorable impacts were lower carbonated soft drink and beer can
sales volumes (excluding the newly acquired plants) and $25 million related
to higher cost inventories in the first half of 2009. Excluding the business
consolidation charge in 2008 and the legal settlement in 2007, earnings in 2008
were lower than in 2007 by 13 percent, primarily due to raw material
inventory gains of $52 million realized in 2007, which did not recur in
2008. Earnings in 2008 were also negatively impacted by lower North American
sales volumes, which were partially offset by the higher sales volumes in the
PRC.
Page 21
of 97
On
October 1, 2009, the company acquired three of Anheuser-Busch InBev
n.v./s.a.’s (AB InBev) metal beverage can manufacturing plants and one of its
beverage can end manufacturing plants, all of which are located in the U.S., for
$574.7 million in cash. The acquired plants produce approximately
10 billion aluminum beverage containers and 10 billion beverage can ends
annually, more than two-thirds of which are produced for leading soft drink
companies and the rest for AB InBev. The plants’ operations were included in
Ball’s results beginning October 1, 2009, which amounted to
$160 million of net sales and $12 million of segment earnings from
that date through December 31, 2009. The facilities acquired employ
approximately 635 people. The acquired plants will enhance the segment’s
ability to better serve its customers.
On
November 9, 2009, the company announced its agreement to acquire Guangdong
Jianlibao Group Co., Ltd’s (Jianlibao) 65-percent interest in a joint venture
metal beverage can and end plant in Sanshui, PRC. Ball has owned 35 percent
of the joint venture plant since 1992. Ball will acquire the plant and related
net assets for approximately $90 million in cash and assumed debt and will
also enter into a long-term supply agreement with Jianlibao. The transaction is
expected to close in 2010, subject to customary regulatory
approvals.
We are
actively pursuing improved profitability through better asset utilization and
cost optimization throughout the segment. We are also committed to improving
margins on this portion of our business through better commercial terms. We
continue to focus efforts on the custom beverage can business, specifically on
cans of different shapes, diameters and fill volumes and by developing cans with
added functional attributes (such as resealability) and through product line
extensions.
As part
of our efforts to improve profitability, we undertook various actions in 2009
and 2008 including the reduction of headcount in our metal beverage packaging
business and the closures of our Guayama, Puerto Rico; Kansas City, Missouri;
and Kent, Washington, metal beverage container plants.
Metal
Beverage Packaging, Europe
|
($
in millions)
|
2009
|
2008
|
2007
|
|||||||||
|
Net
sales
|
$ | 1,739.5 | $ | 1,868.7 | $ | 1,653.6 | ||||||
|
Segment
earnings
|
214.8 | 230.9 | 228.9 | |||||||||
The metal
beverage packaging, Europe, segment includes metal beverage packaging products
manufactured in Europe. Ball Packaging Europe, which represents an
estimated 32 percent of total European metal beverage container shipments
in 2009 (excluding Russia), has manufacturing plants located in Germany, the
United Kingdom, France, the Netherlands, Poland and Serbia, and is the
second largest metal beverage container business in Europe.
This
segment accounted for 24 percent of consolidated net sales in 2009 (25
percent in 2008 and 22 percent in 2007). Segment sales in 2009 as compared
to 2008 were 7 percent lower due to the translation impact of the euro
to the U.S. dollar, partially offset by better commercial terms. Sales volumes
in 2009 were essentially flat compared to those in the prior year. Segment sales
in 2008 were 13 percent higher than in 2007, due largely to higher sales volumes
of approximately 8 percent, consistent with overall market growth, higher sales
prices and foreign currency gains of 8 percent on the strength of the euro.
These positive impacts were offset by certain small unfavorable cost changes,
including product mix changes towards smaller containers.
While
2009 sales volumes were consistent with the prior year, the adverse effects of
foreign currency translation, both within Europe and on the conversion of the
euro to the U.S. dollar, reduced segment earnings by $8 million. Also
contributing to lower segment earnings were higher cost inventory carried into
2009 and a change in sales mix, partially offset by better commercial terms in
some of our contracts. Earnings in 2008 were positively impacted by an increase
in net margins of approximately $55 million due to the combined impact of the
increased sales volumes and price recovery initiatives, which exceeded the
negative impact from product mix, as well as approximately $20 million related
to a stronger euro. These improvements were partially offset by approximately
$36 million of higher other costs including a negative foreign exchange impact
from the conversion of the British pound to the euro and $35 million for
business interruption recoveries in 2007 that were not repeated in 2008 (for
further details see below).
Page 22
of 97
In
April 2006, a fire in the metal beverage can plant in Hassloch, Germany,
damaged a significant portion of the building and machinery and equipment. In
2007 the company recorded €37.6 million ($48.6 million) for insurance
proceeds, which were based on replacement cost, and €27.2 million
($35.1 million) in cost of sales for insurance recoveries related to
business interruption costs.
Metal
Food and Household Products Packaging, Americas
|
($
in millions)
|
2009
|
2008
|
2007
|
|||||||||
|
Net
sales
|
$ | 1,392.9 | $ | 1,221.4 | $ | 1,183.4 | ||||||
|
Segment
earnings
|
$ | 130.8 | $ | 68.1 | $ | 36.2 | ||||||
|
Business
consolidation costs (a)
|
(2.6 | ) | 1.6 | (44.2 | ) | |||||||
|
Total
segment earnings
|
$ | 128.2 | $ | 69.7 | $ | (8.0 | ) | |||||
|
(a)
|
Further
details of these items are included in Note 6 to the consolidated
financial statements within Item 8 of this
report.
|
The metal
food and household products packaging, Americas, segment consists of operations
located in the U.S., Canada and Argentina and includes the manufacture and sale
of metal food cans, aerosol cans, paint cans, general line cans and decorative
specialty cans. Segment sales were 19 percent of consolidated net sales in
2009 (16 percent in both 2008 and 2007). Segment sales in 2009 increased
14 percent over 2008 due to higher selling prices driven by higher raw
material costs beginning in 2009, which were partially offset by an
11 percent decrease in sales volume caused by the effects of the economic
recession and Ball’s decision to not pursue low margin business. We estimate our
2009 shipments accounted for approximately 18 percent and 45 percent of total
annual U.S. and Canadian steel food container and steel aerosol container
shipments, respectively. Segment sales in 2008 increased 3 percent compared to
2007 mostly due to higher selling prices offset by an approximate 3 percent
decrease in sales volumes primarily as a result of decisions by management to
discontinue low margin business, which led to the announced closure of our
Commerce, California, and Tallapoosa, Georgia, facilities in 2007.
Excluding
the business consolidation activities for each period, earnings in 2009 were
92 percent higher than in 2008 due primarily to the increased sales prices
mentioned above coupled with $44 million of lower cost inventory carried
into 2009 and $22 million of improvements in manufacturing performance,
partially offset by the lower sales volumes and a settlement gain of
$7 million in 2008 not recurring in 2009. The 88 percent higher
earnings in 2008 compared to 2007 were largely related to improved pricing,
better manufacturing performance and the $7 million settlement gain,
partially offset by the negative impact of 3 percent lower sales volumes in
2008.
As part
of our efforts to improve profitability in this segment and to better align
supply with customer demand, we announced plans in October 2007 to close
aerosol manufacturing plants in Tallapoosa, Georgia, and Commerce, California.
The Commerce plant was closed in 2008, and the Tallapoosa plant was closed in
the first quarter of 2009. The cash costs of these actions are expected to be
offset by proceeds on asset dispositions and tax recoveries.
Plastic
Packaging, Americas
|
($
in millions)
|
2009
|
2008
|
2007
|
|||||||||
|
Net
sales
|
$ | 634.9 | $ | 735.4 | $ | 752.4 | ||||||
|
Segment
earnings
|
$ | 16.3 | $ | 15.8 | $ | 26.3 | ||||||
|
Business
consolidation costs (a)
|
(23.8 | ) | (8.3 | ) | (0.4 | ) | ||||||
|
Gain
on disposition (a)
|
4.3 | – | – | |||||||||
|
Total
segment earnings
|
$ | (3.2 | ) | $ | 7.5 | $ | 25.9 | |||||
|
(a)
|
Further
details of these items are included in Notes 4 and 6 to the consolidated
financial statements within Item 8 of this
report.
|
Page 23
of 97
The
plastic packaging, Americas, segment consists of operations located in the U.S.
(and Canada through most of the third quarter of 2008), which manufacture PET
and polypropylene plastic container products used mainly in beverage and food
packaging, as well as polypropylene containers for household product
applications.
On
October 23, 2009, the company announced the sale of its plastic pail assets
to BWAY Corporation for approximately $32 million. The transaction involved
the sale of a plastic pail manufacturing plant in Newnan, Georgia, which Ball
acquired in 2006 as part of its purchase of U.S. Can Corporation, and associated
contracts. The plant produces injection molded plastic pails and drums for
products such as building materials and pool chemicals. The associated after-tax
loss was insignificant.
This
segment accounted for 9 percent of consolidated net sales in 2009
(9 percent in 2008 and 10 percent in 2007). Segment sales in 2009 were
down 14 percent from sales in 2008 despite an increase in conversion sales
prices. An 11 percent decline in bottle sales volumes and a 15 percent
reduction in preform sales volumes were the primary reasons for lower sales
compared to 2008. Other factors contributing to lower 2009 sales included resin
price reductions and the previously mentioned disposition of the plastic pail
assets. Segment sales in 2008 decreased 2 percent compared to 2007 due to a
decrease of approximately 9 percent in sales volumes offset by higher
raw material cost increases passed through to customers during 2008. The volume
losses over the three-year period included decreases in carbonated soft drink
and water bottle sales due, in part, to lower convenience store sales by our
customers. The volume losses were partially offset by higher sales in specialty
business markets, which include custom hot-fill, alcohol, food and juice drinks.
Reduced preform sales also contributed to the sales decreases over the three
years due, in part, to the bankruptcy filing of a preform customer in the second
quarter of 2008.
Excluding
business consolidation charges and the pretax gain on sale of the plastic pail
assets, segment earnings in 2009 were slightly higher than in 2008, primarily
due to higher selling prices and improved operating performance, including
benefits from a plant closure in the third quarter of 2008 and plant closures in
the third quarter of 2009, offset by lower sales volumes. Segment earnings in
2008 were lower than in 2007 by approximately 40 percent primarily due to the
previously mentioned volume losses and a $1.8 million charge due to a
customer bankruptcy filing during the second quarter of 2008. In view of
the low PET margins, we continue to focus our efforts on price and margin
recovery initiatives, as well as PET development efforts in the custom
hot-fill, beer, wine, flavored alcoholic beverage and specialty container
markets. In the polypropylene plastic container arena, development efforts are
primarily focused on custom packaging markets.
We
estimate our 2009 shipments of PET plastic bottles to be
approximately 8 percent of total U.S. and Canadian PET container
shipments. In addition, the plastic packaging, Americas, segment shipped
approximately 625 million polypropylene food and specialty containers
during 2009.
To
improve cost performance and gain efficiencies, in the third quarter of 2009 we
closed PET plastic packaging manufacturing plants in Watertown, Wisconsin, and
Baldwinsville, New York. A plastic packaging manufacturing plant in Brampton,
Ontario, was closed in the third quarter of 2008.
Aerospace
and Technologies
|
($
in millions)
|
2009
|
2008
|
2007
|
|||||||||
|
Net
sales
|
$ | 689.2 | $ | 746.5 | $ | 787.8 | ||||||
|
Segment
earnings
|
$ | 61.4 | $ | 76.2 | $ | 64.6 | ||||||
|
Gain
on disposition (a)
|
– | 7.1 | – | |||||||||
|
Total
segment earnings
|
$ | 61.4 | $ | 83.3 | $ | 64.6 | ||||||
|
(a)
|
Further
details of this item are included in Note 4 to the consolidated financial
statements within Item 8 of this
report.
|
Aerospace
and technologies segment sales represented 9 percent of consolidated net
sales in 2009 (10 percent in 2008 and 11 percent in
2007). Segment sales in 2009 were 8 percent lower than in 2008,
driven by the delivery of several large spacecraft. Segment sales in 2008 were 5
percent lower as compared to 2007 as a result of a combination of large programs
nearing completion, program terminations, delays in program awards and
government funding constraints. The reductions were partially offset by new
program starts and increased scope on previously awarded
contracts.
Page 24
of 97
Some of
the segment’s high-profile contracts include: the James Webb Space Telescope, a
successor to the Hubble Space Telescope; the Space-Based Space Surveillance
System, which will detect and track space objects such as satellites and orbital
debris; NPOESS, the next-generation satellite weather monitoring system; and a
number of antennas for the Joint Strike Fighter. During 2009, we shipped several
large instruments/spacecraft including Kepler (January ship, March launch),
WorldView 2 (August ship, October launch), WISE (August ship, December
launch) and participated in the latest Hubble servicing mission in May. This
segment is also supporting the replacement of the current space shuttle
program.
Excluding
the gain on the sale of an Australian subsidiary (BSG) in 2008, earnings in 2009
were down 19 percent compared to 2008, primarily attributable to the
winding down of several large programs and overall reduced program activity.
Excluding the sale of BSG, segment earnings in 2008 were up 18 percent in
comparison to 2007. Earnings improved in 2008 as the sales volume decline
described above was more than offset by improved margins on contracts due to
improvements in program execution, risk retirement on several fixed price
programs, as well as a reduction of unreimbursable pension and benefit
expenses.
On
February 15, 2008, Ball completed the sale of its shares in BSG to QinetiQ
Pty Ltd for approximately $10.5 million, including cash sold of
$1.8 million. The subsidiary provided services to the Australian department
of defense and related government agencies. After an adjustment for working
capital items, the sale resulted in a pretax gain of $7.1 million.
Sales to
the U.S. government, either directly as a prime contractor or indirectly as a
subcontractor, represented 94 percent of segment sales in 2009,
91 percent in 2008 and 84 percent in 2007. Contracted backlog for the
aerospace and technologies segment at December 31, 2009 and 2008, was
$518 million and $597 million, respectively.
Additional
Segment Information
For
additional information regarding the company’s segments, see the summary of
business segment information in Note 2 accompanying the consolidated
financial statements within Item 8 of this report. The charges recorded for
business consolidation activities were based on estimates by Ball management and
were developed from information available at the time. If actual outcomes vary
from the estimates, the differences will be reflected in current period earnings
in the consolidated statement of earnings and identified as business
consolidation gains and losses. Additional details about our business
consolidation activities and associated costs are provided in Note 6
accompanying the consolidated financial statements within Item 8 of this
report.
Undistributed
Corporate Expenses, Net
Included
in undistributed corporate expenses for 2009 was a $34.8 million gain
($30.7 million after tax) on the sale of a portion of our investment in
DigitalGlobe, a provider of commercial high resolution earth imagery products
and services, in conjunction with DigitalGlobe’s initial public offering. The
sale generated proceeds of $37.0 million in the second quarter of 2009.
Also included in 2009 was a charge of $11.1 million ($6.7 million
after tax) for transaction costs associated with the AB InBev acquisition,
which, in accordance with recent changes to the guidance related to accounting
for business combinations, are required to be expensed as incurred. The
transaction costs are included in the business consolidation and other
activities line of the consolidated statement of earnings. Undistributed
corporate expenses in 2008 included $11.5 million for mark-to-market losses
related to aluminum derivative instruments that were largely recovered in 2009
through customer contract arrangements.
Selling,
General and Administrative Expenses
Selling,
general and administrative (SG&A) expenses were $328.6 million,
$288.2 million and $323.7 million for 2009, 2008 and 2007,
respectively. The increases in SG&A expenses in 2009 compared to 2008 were
the result of approximately $31 million of higher employee compensation
costs, including incentive compensation costs, and higher stock-based
compensation costs, including mark-to-market adjustments for the company’s
deferred compensation stock plans; $13 million of gains in 2008 not
recurring in 2009, including a $7 million claim settlement and
$7 million of death benefit insurance proceeds; and $8 million of
unfavorable foreign currency exchange impacts. These were offset by net
favorable decreased costs of $12 million, including lower receivables
securitization fees, legal expenses and research and development
costs.
The
decreases in SG&A expenses in 2008 compared to 2007 were due to
approximately $8 million of lower general and administrative costs as a
result of the sale in February 2008 of BSG, lower aerospace research and
development costs and bid and proposal costs of $4 million, life insurance death
benefits of $7 million, the settlement of a claim for $7 million, the
favorable net year-over-year change in foreign currency hedges and exchange
impacts of $13 million, and other miscellaneous net cost
reductions.
Page 25
of 97
Interest
and Taxes
Consolidated
interest expense was $117.2 million in 2009, $137.7 million in 2008
and $149.4 million in 2007. The lower expense in 2009 was primarily due to
lower interest rates on floating rate debt, partially offset by additional
interest associated with the issuance of $700 million of new senior notes
in August 2009. The reduced expense in 2008 compared to 2007 was primarily due
to lower interest rates on floating rate debt, as U.S. and European Central
Banks cut interest rates amid the global financial crisis.
Based on current
estimates, the 2010 effective income tax rate is expected to be approximately
33 percent. Ball’s consolidated effective income tax rate for 2009
was 30.3 percent compared to 32.6 percent in 2008 and
26.3 percent in 2007. The lower tax rate in 2009 as compared to 2008 was
primarily due to a $4 million net increase in tax benefits as a result of a
foreign tax settlement, legislative changes and a release of a valuation
allowance for a net operating loss carryforward; a $6 million tax benefit
from the sale of shares in a stock investment and other assets due to a higher
tax basis and a favorable change of $11 million in the provision for uncertain
tax positions due to tax settlements in several foreign jurisdictions. These
benefits were offset somewhat by an increase due to the change in our earnings
mix to higher taxed jurisdictions, lower research and development tax credits
and a decrease in the benefit of lower tax rates in foreign tax jurisdictions
coupled with increased withholding taxes.
The lower
tax rate in 2007 as compared to 2008 was primarily the result of earnings mix
(higher foreign earnings taxed at lower rates) and net tax benefit adjustments
of $17 million recorded in 2007. Additionally, the inability to fully use
Canadian net operating losses on plant closures in 2008 contributed to a higher
effective tax rate. The 2008 rate was partially reduced by a $4.5 million tax
benefit recognized during the third quarter of 2008 for an enacted tax law
change in the United Kingdom, which was offset by the impact of nondeductible
losses in the cash surrender value of certain company-owned life insurance
plans. The $17 million net reduction in the 2007 tax provision was primarily a
result of enacted income tax rate reductions in Germany and the United Kingdom
and a tax loss related to the company’s Canadian operations, which were offset
by an increase in the tax provision for uncertain tax positions in 2007 to
adjust for the final settlement negotiations concluded with the Internal Revenue
Service (IRS) related to a company-owned life insurance plan (discussed
below).
During
2007 the company concluded final settlement negotiations with the IRS on the
deductibility of interest expense on incurred loans from a company-owned life
insurance plan. An additional accrual of $7.0 million was made in the third
quarter of 2007 to adjust the accrued liability to the final settlement of $18.4
million, including interest, for the years 2000 through 2006.
This settlement included agreement on the prospective treatment of interest
deductibility on the policy loans, which has not had a significant impact on
earnings per share, cash flow or liquidity. Further details are available in
Note 16 to the consolidated financial statements within Item 8 of this
report.
Results
of Equity Affiliates
Equity in
the earnings of affiliates is primarily attributable to our 50 percent
ownership in packaging investments in the U.S. and Brazil. Earnings were
$13.8 million in 2009, $14.5 million in 2008 and $12.9 million in
2007.
CRITICAL
AND SIGNIFICANT ACCOUNTING POLICIES AND NEW ACCOUNTING
PRONOUNCEMENTS
For
information regarding the company’s critical and significant accounting
policies, as well as recent accounting pronouncements, see Note 1 to the
consolidated financial statements within Item 8 of this
report.
FINANCIAL
CONDITION, LIQUIDITY AND CAPITAL RESOURCES
Cash
Flows and Capital Expenditures
Liquidity
Our
primary sources of liquidity are cash provided by operating activities and
external committed borrowings. We believe that cash flows from operations and
cash provided by short-term and committed revolver borrowings, when necessary,
will be sufficient to meet our ongoing operating requirements, scheduled
principal and interest payments on debt, dividend payments and anticipated
capital expenditures. We had in excess of $600 million of available funds under
committed multi-currency revolving credit facilities at December 31,
2009.
Page 26
of 97
Cash flows provided by
operations were $559.7 million in 2009 compared to $627.6 million in
2008 and $673 million in 2007. Lower operating cash flows in 2009 compared
to 2008 were the result of working capital increases and higher pension funding
and income tax payments during the year. The reduction in 2008 as
compared to 2007 was primarily due to the payment of approximately $70 million
in January 2008 of a legal settlement to a customer. This reduction was
partially offset by the net impact of increases in net earnings and
depreciation, lower tax payments, lower pension contributions and a net increase
in working capital during the year.
Financial
Instrument Collateral
In our
worldwide beverage can business, we use financial derivative contracts as
discussed in “Quantitative and Qualitative Disclosures About Market Risk” within
Item 7A of this report to manage certain future aluminum price volatility for
our customers. As these derivative contracts are matched to customer sales
contracts, they have little or no economic impact on our earnings. Our
agreements with our financial counterparties require us to post collateral in
certain circumstances when the negative mark-to-market value of the contracts
exceeds specified levels. Additionally,
Ball has similar collateral posting arrangements with certain customers on these
derivative contracts. The cash flows of the collateral postings are shown within
the investing section of our consolidated statements of cash flows. At
December 31, 2009, Ball had $14.2 million of cash posted as
collateral, which was offset by cash collateral receipts from customers of
$14.2 million. At December 31, 2008, Ball had $229.5 million of cash
posted as collateral and had received $124.0 million of cash from customers for
a net amount of $105.5 million.
Management
Performance Measures
The
following financial measurements are on a non-U.S. GAAP basis and should be
considered in connection with the consolidated financial statements within
Item 8 of this report. Non-U.S. GAAP measures should not be considered in
isolation and should not be considered superior to, or a substitute for,
financial measures calculated in accordance with U.S. GAAP. A presentation
of earnings in accordance with U.S. GAAP is available in Item 8 of this
report.
Free Cash
Flow
Management
internally uses a free cash flow measure: (1) to evaluate the company’s
operating results, (2) to plan stock buyback levels, (3) to evaluate
strategic investments and (4) to evaluate the company’s ability to incur and
service debt. Free cash flow is not a defined term under U.S. generally accepted
accounting principles, and it should not be inferred that the entire free cash
flow amount is available for discretionary expenditures. The company defines
free cash flow as cash flow from operating activities less additions to
property, plant and equipment (capital spending). Free cash flow is typically
derived directly from the company’s cash flow statements; however, it may be
adjusted for items that affect comparability between periods. In 2007 we
adjusted free cash flow to reflect our decision to contribute an additional
$44.5 million ($27.3 million after tax) to our pension plans and to include the
property insurance proceeds used to fund the replacement of the fire-damaged
assets in our Hassloch, Germany, plant.
Based on
the above definition, our consolidated free cash flow is summarized as
follows:
|
($
in millions)
|
2009
|
2008
|
2007
|
|||||||||
|
Cash
flows from operating activities
|
$ | 559.7 | $ | 627.6 | $ | 673.0 | ||||||
|
Capital
spending
|
(187.1 | ) | (306.9 | ) | (308.5 | ) | ||||||
|
Proceeds
for replacement of fire-damaged assets
|
– | – | 48.6 | |||||||||
|
Incremental
pension funding, net of tax
|
– | – | 27.3 | |||||||||
|
Free
cash flow
|
$ | 372.6 | $ | 320.7 | $ | 440.4 | ||||||
There
were no reconciling items to cash flows from investing or financing activities
as reported in the consolidated statements of cash flows within Item 8 of
this report.
Based on
information currently available, we estimate cash flows from operating
activities for 2010 to be approximately $735 million, capital spending to
be approximately $235 million and free cash flow to be in the
$500 million range. These estimates do not reflect that, under new
accounting guidance effective January 1, 2010, our accounts receivable
securitization program will likely be recorded on our consolidated balance sheet
and the related activity shown in our consolidated cash flow statement as a
financing activity rather than as an operating activity. In 2010 we intend to
allocate our operating cash flow to reducing our debt and growing our cash
balances while increasing our stock repurchases and covering our capital
spending programs.
Page 27
of 97
EBIT and
EBITDA
Management
internally uses adjusted earnings before interest and taxes (adjusted EBIT) and
adjusted earnings before interest, taxes, depreciation and amortization
(adjusted EBITDA) to evaluate the company's performance. EBIT and EBITDA are
typically derived directly from the company’s consolidated statement of
earnings; however, they may be adjusted for items that affect comparability
between periods. Management also uses interest coverage and net debt to adjusted
EBITDA ratios as metrics to monitor our credit quality.
Based on
the above definitions, our calculation of adjusted EBIT, adjusted EBITDA,
interest coverage ratio and net debt to adjusted EBITDA ratio are summarized
below:
|
($
in millions, except ratios)
|
2009
|
2008
|
2007
|
|||||||||
|
Net
earnings
|
$ | 388.4 | $ | 319.9 | $ | 281.7 | ||||||
|
Add
interest expense
|
117.2 | 137.7 | 149.4 | |||||||||
|
Add
tax provision
|
162.8 | 147.4 | 95.7 | |||||||||
|
Less
equity in results of affiliates
|
(13.8 | ) | (14.5 | ) | (12.9 | ) | ||||||
|
Earnings
before interest and taxes (EBIT)
|
654.6 | 590.5 | 513.9 | |||||||||
|
Add
business consolidation and other activities
|
44.5 | 52.1 | 44.6 | |||||||||
|
Less
gain on dispositions
|
(39.1 | ) | (7.1 | ) | – | |||||||
|
Add
legal settlement
|
– | – | 85.6 | |||||||||
|
Adjusted
EBIT
|
660.0 | 635.5 | 644.1 | |||||||||
|
Add
depreciation and amortization
|
285.2 | 297.4 | 281.0 | |||||||||
|
Adjusted
EBITDA
|
$ | 945.2 | $ | 932.9 | $ | 925.1 | ||||||
|
Interest
expense
|
$ | 117.2 | $ | 137.7 | $ | 149.4 | ||||||
|
Total
debt at December 31
|
$ | 2,596.2 | $ | 2,410.1 | $ | 2,358.6 | ||||||
|
Less
cash
|
(210.6 | ) | (127.4 | ) | (151.6 | ) | ||||||
|
Net
Debt
|
$ | 2,385.6 | $ | 2,282.7 | $ | 2,207.0 | ||||||
|
Adjusted
EBIT/Interest coverage
|
5.6 | x | 4.6 | x | 4.3 | x | ||||||
|
Net
Debt/Adjusted EBITDA
|
2.5 | x | 2.4 | x | 2.4 | x | ||||||
Debt
Facilities and Refinancing
Interest-bearing
debt at December 31, 2009, increased $186.1 million to
$2.6 billion from $2.4 billion at December 31, 2008. The
relatively small debt increase from 2008 was achieved despite our issuance of
$700 million of new senior notes on August 20, 2009.
At
December 31, 2009, $663 million was available under our multi-currency
revolving credit facilities. These committed credit facilities are available
until October 2011. We also had $305 million of short-term uncommitted
credit facilities available at the end of the year, on which $63.5 million
was outstanding.
Given our
free cash flow projections and unused credit facilities that are available until
October 2011, our liquidity is strong and is expected to meet our ongoing
operating cash flow and debt service requirements. While the recent financial
and economic conditions have raised concerns about credit risk with
counterparties to derivative transactions, the company mitigates its exposure by
spreading the risk among various counterparties and limiting exposure to any one
party. We also monitor the credit ratings of our suppliers, customers, lenders
and counterparties on a regular basis.
The
financial and economic environment has exacerbated liquidity and credit risks
with some of our customers and suppliers. In October 2008, we advanced
interest-bearing funding of $22 million in support of one of our key
suppliers, which advance is secured by accounts receivable and inventory. At
December 31, 2009, the amount advanced was included in accounts receivable
in our consolidated balance sheet included within Item 8 of this
report.
Page 28
of 97
We were
in compliance with all loan agreements at December 31, 2009, and all prior
years presented, and have met all debt payment obligations. The U.S. note
agreements, bank credit agreement and industrial development revenue bond
agreements contain certain restrictions relating to dividends, investments,
financial ratios, guarantees and the incurrence of additional indebtedness.
Additional details about our debt and receivables sales agreements are available
in Notes 15 and 8, respectively, accompanying the consolidated financial
statements within Item 8 of this report.
Accounts
Receivable Securitization
We have a
receivables sales agreement that provides for the ongoing, revolving sale of a
designated pool of trade accounts receivable of Ball’s North American
packaging operations up to $250 million. The agreement qualifies as
off-balance sheet financing under accounting guidance in effect through
December 31, 2009. Net funds received from the sale of the accounts
receivable totaled $250 million at both December 31, 2009 and 2008 and are
reflected as a reduction of accounts receivable in the consolidated balance
sheets. Under new accounting guidance that will be effective as of
January 1, 2010, it is likely that the sold accounts receivable will remain
on our consolidated balance sheet, resulting in a corresponding increase in
debt. This will create a one-time reduction in cash flows from operating
activities in 2010 and an offsetting one-time increase in cash flows from
financing activities.
Other
Liquidity Items
Cash
payments required for long-term debt maturities, rental payments under
noncancellable operating leases, purchase obligations and other commitments in
effect at December 31, 2009, are summarized in the following
table:
|
Payments
Due By Period (a)
|
||||||||||||||||||||
|
($
in millions)
|
Total
|
Less
than
1
Year
|
1-3
Years
|
3-5
Years
|
More
than
5 Years
|
|||||||||||||||
|
Long-term
debt
|
$ | 2,547.3 | $ | 248.8 | $ | 1,142.4 | $ | 0.6 | $ | 1,155.5 | ||||||||||
|
Interest
payments on long-term debt (b)
|
771.3 | 125.3 | 232.9 | 161.1 | 252.0 | |||||||||||||||
|
Operating
leases
|
152.4 | 43.1 | 56.6 | 30.2 | 22.5 | |||||||||||||||
|
Purchase
obligations (c)
|
4,198.1 | 1,969.8 | 1,943.2 | 262.1 | 23.0 | |||||||||||||||
|
Total
payments on contractual obligations
|
$ | 7,669.1 | $ | 2,387.0 | $ | 3,375.1 | $ | 454.0 | $ | 1,453.0 | ||||||||||
|
(a)
|
Amounts
reported in local currencies have been translated at the year-end 2009
exchange rates.
|
|
(b)
|
For
variable rate facilities, amounts are based on interest rates in effect at
year end and do not contemplate the effects of hedging
instruments.
|
|
(c)
|
The
company’s purchase obligations include contracted amounts for aluminum,
steel, plastic resin and other direct materials. Also included are
commitments for purchases of natural gas and electricity, aerospace and
technologies contracts and other less significant items. In cases where
variable prices and/or usage are involved, management’s best estimates
have been used. Depending on the circumstances, early termination of the
contracts may or may not result in penalties and, therefore, actual
payments could vary significantly.
|
Contributions
to the company’s defined benefit pension plans, not including the unfunded
German plans, are expected to be in the range of $55 million in 2010.
This estimate may change based on changes in the Pension Protection Act and
actual plan asset performance, among other factors. Benefit payments related to
these plans are expected to be $78 million, $80 million,
$83 million, $87 million and $91 million for the years ending
December 31, 2010 through 2014, respectively, and a total of $520 million
for the years 2015 through 2019. Payments to participants in the unfunded German
plans are expected to be approximately $24 million to $25 million in
each of the years 2010 through 2014 and a total of $113 million for the
years 2015 through 2019.
For the
U.S. pension plans in 2010, we intend to maintain our current return on asset
assumption of 8.25 percent and to change our discount rate assumption to
6.00 percent (from 6.25 percent in 2009). Based on these assumptions,
U.S. pension expense for 2010 is anticipated to increase approximately $5
million compared to 2009 expense of $48.1 million, most of which will be
included in cost of sales. Pension expense in Europe and Canada combined is
expected to be higher than the 2009 expense of $25.8 million by approximately
$2 million. A reduction of the expected return on pension assets assumption
by one quarter of a percentage point would result in an estimated $2.7 million
increase in the 2010 pension expense, while a quarter of a percentage point
reduction in the discount rate applied to the pension liability would result in
an estimated $3.2 million of additional pension expense in 2010. Additional
information regarding the company’s pension plans is provided in Note 17
accompanying the consolidated financial statements within Item 8 of this
report.
Page 29
of 97
Annual
cash dividends paid on common stock were 40 cents per share in 2009, 2008
and 2007. Total dividends paid were $37.4 million in 2009,
$37.5 million in 2008 and $40.6 million in 2007.
Share
Repurchases
Our share
repurchases, net of issuances, totaled $5.1 million in 2009,
$299.6 million in 2008 and $211.3 million in 2007. The net repurchases
in 2008 included a $31 million settlement on January 7, 2008, of a forward
contract entered into in December 2007 for the repurchase of 675,000 shares.
Additionally, in 2007 net repurchases included a $51.9 million settlement
on January 5, 2007, of a forward contract entered into in
December 2006 for the repurchase of 1,200,000 shares.
On
December 12, 2007, in a privately negotiated transaction, Ball entered into
an accelerated share repurchase agreement to purchase $100 million of its
common shares using cash on hand and available borrowings. We advanced the
$100 million on January 7, 2008, and received 2,038,657 shares,
which represented 90 percent of the total shares as calculated using the
previous day’s closing price. The agreement was settled on July 11, 2008, and
the company received an additional 138,521 shares.
Subsequent
Event
On
February 17, 2010, in a privately negotiated transaction, Ball entered into
an accelerated share repurchase agreement to buy $125 million of its common
shares using cash on hand and available borrowings. The company advanced the
$125 million on February 22, 2010, and received approximately
2.2 million shares, which represented 90 percent of the total
shares as calculated using the previous day’s closing price. The remaining
shares and average price per share will be determined at the conclusion of the
contract, which is expected to occur no later than August 2010.
Contingencies
From time
to time, the company is subject to routine litigation incident to its
businesses. Additionally, the U.S. Environmental Protection Agency has
designated Ball as a potentially responsible party, along with numerous other
companies, for the cleanup of several hazardous waste sites. Our information at
this time does not indicate that the matters identified will have a material
adverse effect upon the liquidity, results of operations or financial condition
of the company.
Page 30
of 97
Forward-Looking
Statements
The
company has made or implied certain forward-looking statements in this report
which are made as of the end of the time frame covered by this report. These
forward-looking statements represent the company’s goals, and results could vary
materially from those expressed or implied. From time to time we also provide
oral or written forward-looking statements in other materials we release to the
public. As time passes, the relevance and accuracy of forward-looking statements
may change. Some factors that could cause the company’s actual results or
outcomes to differ materially from those discussed in the forward-looking
statements include, but are not limited to: fluctuation in customer and consumer
growth, demand and preferences; loss of one or more major customers or changes
to contracts with one or more customers; insufficient production capacity;
changes in senior management; the current global recession and its effects on
liquidity, credit risk, asset values and the economy; overcapacity in foreign
and domestic metal and plastic container industry production facilities and its
impact on pricing; failure to achieve anticipated productivity improvements or
production cost reductions, including those associated with capital
expenditures; changes in climate and weather; fruit, vegetable and fishing
yields; power and natural resource costs; difficulty in obtaining supplies and
energy, such as gas and electric power; availability and cost of raw materials,
as well as the recent significant increases in resin, steel, aluminum and energy
costs, and the ability or inability to include or pass on to customers changes
in raw material costs; changes in the pricing of the company’s products and
services; competition in pricing and the possible decrease in, or loss of, sales
resulting therefrom; insufficient or reduced cash flow; transportation costs;
the number and timing of the purchases of the company’s common shares;
regulatory action or federal and state legislation including mandated corporate
governance and financial reporting laws; the effects of other restrictive
packaging legislation, such as recycling laws; interest rates affecting our
debt; labor strikes; increases and trends in various employee benefits and labor
costs, including pension, medical and health care costs; rates of return
projected and earned on assets and discount rates used to measure future
obligations and expenses of the company’s defined benefit retirement plans;
boycotts; antitrust, intellectual property, consumer and other litigation;
maintenance and capital expenditures; goodwill impairment; changes in generally
accepted accounting principles or their interpretation; accounting changes;
local economic conditions; the authorization, funding, availability and returns
of contracts for the aerospace and technologies segment and the nature and
continuation of those contracts and related services provided thereunder;
delays, extensions and technical uncertainties, as well as schedules of
performance associated with such segment contracts; regional and global
pandemics; international business and market risks, such as the devaluation or
revaluation of certain currencies; international business risks (including
foreign exchange rates) in Europe and particularly in developing countries such
as the PRC and Brazil; changes in the foreign exchange rates of the U.S. dollar
against the European euro, British pound, Polish zloty, Serbian dinar, Hong Kong
dollar, Canadian dollar, Chinese renminbi, Brazilian real and Argentine peso,
and in the foreign exchange rate of the European euro against the British pound,
Polish zloty, Serbian
dinar and Indian rupee; terrorist activity or war that disrupts the company’s
production or supply; regulatory action or laws including tax, environmental,
health and workplace safety, including in respect of climate change, or
chemicals or substances used in raw materials or in the manufacturing process,
particularly publicity concerning Bisphenol-A, or BPA, a chemical used in the
manufacture of epoxy coatings applied to many types of containers (including
certain of those produced by the company); technological developments and
innovations; successful or unsuccessful acquisitions, joint ventures or
divestitures and the integration activities associated therewith, including the
recent acquisition and related integration of four metal beverage can and end
plants; changes to unaudited results due to statutory audits of our financial
statements or management’s evaluation of the company’s internal control over
financial reporting; and loss contingencies related to income and other tax
matters, including those arising from audits performed by U.S. and foreign tax
authorities. If the company is unable to achieve its goals, then the company’s
actual performance could vary materially from those goals expressed or implied
in the forward-looking statements. The company currently does not intend to
publicly update forward-looking statements except as it deems necessary in
quarterly or annual earnings reports. You are advised, however, to consult any
further disclosures we make on related subjects in our 10-K, 10-Q and 8-K
reports to the SEC.
Page 31
of 97
|
Item
7A.
|
Quantitative
and Qualitative Disclosures About Market
Risk
|
Financial
Instruments and Risk Management
In the
ordinary course of business, we employ established risk management policies and
procedures, which seek to reduce our exposure to fluctuations in commodity
prices, interest rates, foreign currencies and prices of the company’s common
stock in respect of common share repurchases, although there can be no assurance
that these policies and procedures will be successful. Although the instruments
utilized involve varying degrees of credit, market and interest risk, the
counterparties to the agreements are expected to perform fully under the terms
of the agreements. The company monitors counterparty credit risk, including that
of its lenders, on a regular basis, but we cannot be certain that all risks will
be discerned or that our risk management policies and procedures will always be
effective.
We have
estimated our market risk exposure using sensitivity analysis. Market risk
exposure has been defined as the changes in fair value of derivative
instruments, financial instruments and commodity positions. To test the
sensitivity of our market risk exposure, we have estimated the changes in fair
value of market risk sensitive instruments assuming a hypothetical
10 percent adverse change in market prices or rates. The results of the
sensitivity analyses are summarized below.
Commodity
Price Risk
We manage
our North American commodity price risk in connection with market price
fluctuations of aluminum ingot primarily by entering into container sales
contracts that include aluminum ingot-based pricing terms that generally reflect
price fluctuations under our commercial supply contracts for aluminum sheet
purchases. The terms include fixed, floating or pass-through aluminum ingot
component pricing. This matched pricing affects most of our North American metal
beverage packaging net sales. We also, at times, use certain derivative
instruments such as option and forward contracts as cash flow hedges of
commodity price risk where there is not a pass-through arrangement in the sales
contract to match underlying purchase volumes and pricing with sales volumes
and pricing.
Most of
the plastic packaging, Americas, sales contracts include provisions to fully
pass through resin cost changes. As a result, we believe we have minimal
exposure related to changes in the cost of plastic resin. Most metal food and
household products packaging, Americas, sales contracts either include
provisions permitting us to pass through some or all steel cost changes we
incur, or they incorporate annually negotiated steel costs. In 2009 and in 2008,
we were able to pass through to our customers the majority of the steel cost
increases. We anticipate at this time that we will be able to pass through the
majority of the steel price increases that occur in 2010.
In Europe
and the PRC, the company manages the aluminum and steel raw material commodity
price risks through annual and long-term contracts for the purchase of the
materials, as well as certain sales of containers that reduce the company's
exposure to fluctuations in commodity prices within the current year. These
contracts include fixed price, floating and/or pass-through pricing
arrangements. We also use forward and option contracts as cash flow hedges to
manage future aluminum price risk and foreign exchange exposures to match
underlying purchase volumes and pricing with sales volumes and pricing for those
sales contracts where there is not a pass-through arrangement to minimize
the company’s exposure to significant price changes.
Considering
the effects of derivative instruments, the company’s ability to pass through
certain raw material costs through contractual provisions, the market’s ability
to accept price increases and the company’s commodity price exposures under its
contract terms, a hypothetical 10 percent adverse change in the company’s
steel, aluminum and resin prices could result in an estimated $3.5 million
after-tax reduction in net earnings over a one-year period. Additionally, if
foreign currency exchange rates were to change adversely by 10 percent, we
estimate there could be a $12.3 million after-tax reduction in net
earnings over a one-year period for foreign currency exposures on raw materials.
Actual results may vary based on actual changes in market prices and
rates.
The
company is also exposed to fluctuations in prices for natural gas and
electricity, as well as the cost of diesel fuel as a component of freight cost.
A hypothetical 10 percent increase in our natural gas and electricity
prices could result in an estimated $5.0 million after-tax reduction of net
earnings over a one-year period. A hypothetical 10 percent increase in
diesel fuel prices could result in an estimated $2.3 million after-tax
reduction of net earnings over the same period. Actual results may vary based on
actual changes in market prices and rates.
Page 32
of 97
Interest
Rate Risk
Our
objective in managing our exposure to interest rate changes is to minimize the
impact of such changes on earnings and cash flows and to lower our overall
borrowing costs. To achieve these objectives, we use a variety of interest rate
swaps, collars and options to manage our mix of floating and fixed-rate debt.
Interest rate instruments held by the company at December 31, 2009, included
pay-fixed interest rate swaps and interest rate collars. Pay-fixed swaps
effectively convert variable rate obligations to fixed rate instruments. Collars
create an upper and lower threshold within which interest rates will
fluctuate.
Based on
our interest rate exposure at December 31, 2009, assumed floating rate debt
levels throughout the next 12 months and the effects of derivative
instruments, a 100-basis point increase in interest rates could result in an
estimated $5.1 million after-tax reduction in net earnings over a one-year
period. Actual results may vary based on actual changes in market prices and
rates and the timing of these changes.
Foreign
Currency Exchange Rate Risk
Our
objective in managing exposure to foreign currency fluctuations is to protect
foreign cash flows and earnings from changes associated with foreign currency
exchange rate changes through the use of various derivative contracts. In
addition, we manage foreign earnings translation volatility through the use of
various foreign currency option strategies, and the change in the fair value of
those options is recorded in the company’s earnings. Our foreign currency
translation risk results from the European euro, British pound, Canadian dollar,
Polish zloty, Chinese renminbi, Hong Kong dollar, Brazilian real, Argentine peso
and Serbian dinar. We face currency exposures in our global operations as a
result of purchasing raw materials in U.S. dollars and, to a lesser extent, in
other currencies. Sales contracts are negotiated with customers to reflect cost
changes and, where there is not a foreign exchange pass-through arrangement, the
company uses forward and option contracts to manage foreign currency exposures.
We additionally use various option strategies to manage the earnings translation
of the company’s European operations into U.S. dollars.
Considering
the company’s derivative financial instruments outstanding at December 31,
2009, and the currency exposures, a hypothetical 10 percent reduction (U.S.
dollar strengthening) in foreign currency exchange rates compared to the U.S.
dollar could result in an estimated $27.5 million after-tax reduction in
net earnings over a one-year period. This amount includes the $12.3 million
currency exposure discussed above in the “Commodity Price Risk” section. This
hypothetical adverse change in foreign currency exchange rates would also reduce
our forecasted average debt balance by $57.3 million. Actual changes in
market prices or rates may differ from hypothetical changes.
Equity
Price Risk
The
company’s deferred compensation stock program is subject to variable accounting
and, accordingly, is marked to market using the company’s closing stock price at
the end of a reporting period. Based on current share levels in the program,
each $1 change in the company’s stock price has an effect of $0.8 million
on pretax earnings. As a way to partially reduce cash flow and earnings
volatility, as well as stock price changes associated with our deferred
compensation stock program, from time to time the company sells equity put
options on its common stock. Mark-to-market accounting applies to these equity
put options. Approximately $3.2 million of income was included in 2009
earnings to record the variance between the historical fair value and the
current market value of outstanding equity put options. All of the outstanding
options expired without value during August 2009.
Page 33
of 97
|
Item
8.
|
Financial
Statements and Supplementary Data
|
Report
of Independent Registered Public Accounting Firm
To the
Board of Directors and Shareholders of Ball Corporation:
In our
opinion, the consolidated financial statements listed in the index appearing
under 15(a)(1) present fairly, in all material respects, the financial
position of Ball Corporation and its subsidiaries at December 31, 2009 and
2008, and the results of their operations and their cash flows for each of the
three years in the period ended December 31, 2009 in conformity with
accounting principles generally accepted in the United States of America. Also
in our opinion, the Company maintained, in all material respects, effective
internal control over financial reporting as of December 31, 2009, based on
criteria established in Internal Control - Integrated
Framework issued by the Committee of Sponsoring Organizations of the
Treadway Commission (COSO). The Company's management is responsible for these
financial statements, for maintaining effective internal control over financial
reporting and for its assessment of the effectiveness of internal control over
financial reporting, included in Management’s Report on Internal Control Over
Financial Reporting appearing under Item 9A. Our responsibility is to
express opinions on these financial statements and on the Company's internal
control over financial reporting based on our integrated audits. We conducted
our audits in accordance with the standards of the Public Company Accounting
Oversight Board (United States). Those standards require that we plan and
perform the audits to obtain reasonable assurance about whether the financial
statements are free of material misstatement and whether effective internal
control over financial reporting was maintained in all material respects. Our
audits of the financial statements included examining, on a test basis, evidence
supporting the amounts and disclosures in the financial statements, assessing
the accounting principles used and significant estimates made by management, and
evaluating the overall financial statement presentation. Our audit of internal
control over financial reporting included obtaining an understanding of internal
control over financial reporting, assessing the risk that a material weakness
exists, and testing and evaluating the design and operating effectiveness of
internal control based on the assessed risk. Our audits also included performing
such other procedures as we considered necessary in the circumstances. We
believe that our audits provide a reasonable basis for our
opinions.
As
discussed in Note 12 to the consolidated financial statements, the Company
changed the timing of its annual goodwill impairment test in 2009.
A
company’s internal control over financial reporting is a process designed to
provide reasonable assurance regarding the reliability of financial reporting
and the preparation of financial statements for external purposes in accordance
with generally accepted accounting principles. A company’s internal control over
financial reporting includes those policies and procedures that (i) pertain
to the maintenance of records that, in reasonable detail, accurately and fairly
reflect the transactions and dispositions of the assets of the company;
(ii) provide reasonable assurance that transactions are recorded as
necessary to permit preparation of financial statements in accordance with
generally accepted accounting principles, and that receipts and expenditures of
the company are being made only in accordance with authorizations of management
and directors of the company; and (iii) provide reasonable assurance
regarding prevention or timely detection of unauthorized acquisition, use, or
disposition of the company’s assets that could have a material effect on the
financial statements.
Because
of its inherent limitations, internal control over financial reporting may not
prevent or detect misstatements. Also, projections of any evaluation of
effectiveness to future periods are subject to the risk that controls may become
inadequate because of changes in conditions, or that the degree of compliance
with the policies or procedures may deteriorate.
As
described in Management's Report on Internal
Control Over Financial Reporting, management has excluded four Anheuser-Busch
InBev's n.v./s.a. manufacturing plants (AB InBev plants) from its
assessment of internal control over financial reporting as of December 31, 2009
because they were acquired by the Company in a purchase business combination in
2009. We have also excluded the AB InBev plants from our audit of internal
control over financial reporting. The AB InBev plants had combined
assets and combined net sales representing 8.9 percent and 2.2 percent,
respectively, of the related consolidated financial statement amounts as of and
for the year ended December 31, 2009.
/s/ PricewaterhouseCoopers
LLP
PricewaterhouseCoopers
LLP
Denver,
Colorado
February
25, 2010
Page 34
of 97
Consolidated
Statements of Earnings
Ball
Corporation and Subsidiaries
|
Years
ended December 31,
|
||||||||||||
|
($
in millions, except per share amounts)
|
2009
|
2008
|
2007
|
|||||||||
|
Net
sales
|
$ | 7,345.3 | $ | 7,561.5 | $ | 7,475.3 | ||||||
|
Legal
settlement (Note 5)
|
– | – | (85.6 | ) | ||||||||
|
Total
net sales
|
7,345.3 | 7,561.5 | 7,389.7 | |||||||||
|
Costs
and expenses
|
||||||||||||
|
Cost
of sales (excluding depreciation)
|
6,071.5 | 6,340.4 | 6,226.5 | |||||||||
|
Depreciation
and amortization (Notes 2, 11 and 13)
|
285.2 | 297.4 | 281.0 | |||||||||
|
Selling,
general and administrative
|
328.6 | 288.2 | 323.7 | |||||||||
|
Business
consolidation and other activities (Note 6)
|
44.5 | 52.1 | 44.6 | |||||||||
|
Gain
on dispositions (Note 4)
|
(39.1 | ) | (7.1 | ) | – | |||||||
| 6,690.7 | 6,971.0 | 6,875.8 | ||||||||||
|
Earnings
before interest and taxes
|
654.6 | 590.5 | 513.9 | |||||||||
|
Interest
expense (Note 15)
|
(117.2 | ) | (137.7 | ) | (149.4 | ) | ||||||
|
Earnings
before taxes
|
537.4 | 452.8 | 364.5 | |||||||||
|
Tax
provision (Note 16)
|
(162.8 | ) | (147.4 | ) | (95.7 | ) | ||||||
|
Equity
in results of affiliates
|
13.8 | 14.5 | 12.9 | |||||||||
|
Net
earnings
|
$ | 388.4 | $ | 319.9 | $ | 281.7 | ||||||
|
Less
earnings attributable to noncontrolling interests
|
(0.5 | ) | (0.4 | ) | (0.4 | ) | ||||||
|
Net
earnings attributable to Ball Corporation
|
$ | 387.9 | $ | 319.5 | $ | 281.3 | ||||||
|
Earnings per share (Note
20):
|
||||||||||||
|
Basic
|
$ | 4.14 | $ | 3.33 | $ | 2.78 | ||||||
|
Diluted
|
$ | 4.08 | $ | 3.29 | $ | 2.74 | ||||||
|
Weighted average shares
outstanding (000s) (Note 20):
|
||||||||||||
|
Basic
|
93,786 | 95,857 | 101,186 | |||||||||
|
Diluted
|
94,989 | 97,019 | 102,760 | |||||||||
|
Cash
dividends declared and paid, per share
|
$ | 0.40 | $ | 0.40 | $ | 0.40 | ||||||
|
|
The
accompanying notes are an integral part of the consolidated financial
statements.
|
Page 35
of 97
Consolidated
Balance Sheets
Ball
Corporation and Subsidiaries
|
December
31,
|
||||||||
|
($
in millions)
|
2009
|
2008
|
||||||
|
Assets
|
||||||||
|
Current
assets
|
||||||||
|
Cash
and cash equivalents
|
$ | 210.6 | $ | 127.4 | ||||
|
Receivables,
net (Note 8)
|
548.2 | 507.9 | ||||||
|
Inventories,
net (Note 10)
|
944.2 | 974.2 | ||||||
|
Cash
collateral – receivable (Note 9)
|
14.2 | 229.5 | ||||||
|
Current
derivative contracts (Note 21)
|
100.1 | 197.0 | ||||||
|
Deferred
taxes and other current assets (Note 16)
|
106.0 | 129.3 | ||||||
|
Total
current assets
|
1,923.3 | 2,165.3 | ||||||
|
Property,
plant and equipment, net (Note 11)
|
1,949.0 | 1,866.9 | ||||||
|
Goodwill
(Notes 3 and 12)
|
2,114.8 | 1,825.5 | ||||||
|
Noncurrent
derivative contracts (Note 21)
|
80.6 | 139.0 | ||||||
|
Intangibles
and other assets, net (Notes 13 and 16)
|
420.6 | 372.0 | ||||||
|
Total
Assets
|
$ | 6,488.3 | $ | 6,368.7 | ||||
|
Liabilities
and Shareholders’ Equity
|
||||||||
|
Current
liabilities
|
||||||||
|
Short-term
debt and current portion of long-term debt (Note 15)
|
$ | 312.3 | $ | 303.0 | ||||
|
Accounts
payable
|
623.1 | 763.7 | ||||||
|
Accrued
employee costs
|
214.7 | 232.7 | ||||||
|
Cash
collateral – liability (Note 9)
|
14.2 | 124.0 | ||||||
|
Current
derivative contracts (Note 21)
|
83.2 | 268.4 | ||||||
|
Other
current liabilities
|
181.1 | 170.6 | ||||||
|
Total
current liabilities
|
1,428.6 | 1,862.4 | ||||||
|
Long-term
debt (Note 15)
|
2,283.9 | 2,107.1 | ||||||
|
Employee
benefit obligations (Note 17)
|
1,013.2 | 981.4 | ||||||
|
Noncurrent
derivative contracts (Note 21)
|
48.0 | 189.7 | ||||||
|
Deferred
taxes and other liabilities (Note 16)
|
131.6 | 140.8 | ||||||
|
Total
liabilities
|
4,905.3 | 5,281.4 | ||||||
|
Contingencies
(Note 25)
|
||||||||
|
Shareholders’
equity (Note 18)
|
||||||||
|
Common
stock (161,513,274 shares issued – 2009; 160,916,672 shares issued –
2008)
|
830.8 | 788.0 | ||||||
|
Retained
earnings
|
2,397.1 | 2,047.1 | ||||||
|
Accumulated
other comprehensive earnings (loss)
|
(63.8 | ) | (182.5 | ) | ||||
|
Treasury
stock, at cost (67,492,705 shares – 2009; 67,184,722 shares –
2008)
|
(1,582.8 | ) | (1,566.8 | ) | ||||
|
Total
Ball Corporation shareholders’ equity
|
1,581.3 | 1,085.8 | ||||||
|
Noncontrolling
interests
|
1.7 | 1.5 | ||||||
|
Total
shareholders’ equity
|
1,583.0 | 1,087.3 | ||||||
|
Total
Liabilities and Shareholders’ Equity
|
$ | 6,488.3 | $ | 6,368.7 | ||||
|
|
The
accompanying notes are an integral part of the consolidated financial
statements.
|
Page 36
of 97
Consolidated
Statements of Cash Flows
Ball
Corporation and Subsidiaries
|
Years
ended December 31,
|
||||||||||||
|
($
in millions)
|
2009
|
2008
|
2007
|
|||||||||
|
Cash
Flows from Operating Activities
|
||||||||||||
|
Net
earnings
|
$ | 388.4 | $ | 319.9 | $ | 281.7 | ||||||
|
Adjustments
to reconcile net earnings to cash provided by operating
activities:
|
||||||||||||
|
Depreciation
and amortization
|
285.2 | 297.4 | 281.0 | |||||||||
|
Gain
on dispositions (Note 4)
|
(39.1 | ) | (7.1 | ) | – | |||||||
|
Legal
settlement (Note 5)
|
– | (70.3 | ) | 85.6 | ||||||||
|
Business
consolidation and other activities, net of cash payments (Note
6)
|
29.8 | 47.9 | 42.3 | |||||||||
|
Deferred
taxes
|
(24.3 | ) | 19.6 | (21.0 | ) | |||||||
|
Other,
net
|
14.5 | 25.3 | (31.3 | ) | ||||||||
|
Working
capital changes, excluding effects of acquisitions:
|
||||||||||||
|
Receivables
|
36.3 | 37.0 | 26.9 | |||||||||
|
Inventories
|
95.7 | 2.4 | (41.0 | ) | ||||||||
|
Other
current assets
|
54.2 | (112.3 | ) | (0.7 | ) | |||||||
|
Accounts
payable
|
(163.8 | ) | 15.7 | 27.4 | ||||||||
|
Accrued
employee costs
|
(16.2 | ) | (17.2 | ) | 32.7 | |||||||
|
Other
current liabilities
|
(119.3 | ) | 69.6 | (44.8 | ) | |||||||
|
Income
taxes payable and current deferred tax assets, net
|
3.6 | 3.3 | 32.2 | |||||||||
|
Other,
net
|
14.7 | (3.6 | ) | 2.0 | ||||||||
|
Cash
provided by operating activities
|
559.7 | 627.6 | 673.0 | |||||||||
|
Cash
Flows from Investing Activities
|
||||||||||||
|
Additions
to property, plant and equipment
|
(187.1 | ) | (306.9 | ) | (308.5 | ) | ||||||
|
Cash
collateral, net (Note 9)
|
105.3 | (105.5 | ) | – | ||||||||
|
Business
acquisitions, net of cash acquired (Note 3)
|
(574.7 | ) | (2.3 | ) | – | |||||||
|
Proceeds
from dispositions, net of cash sold (Note 4)
|
69.0 | 8.7 | – | |||||||||
|
Property
insurance proceeds (Note 7)
|
– | – | 48.6 | |||||||||
|
Other,
net
|
6.1 | (12.0 | ) | (5.9 | ) | |||||||
|
Cash
used in investing activities
|
(581.4 | ) | (418.0 | ) | (265.8 | ) | ||||||
|
Cash
Flows from Financing Activities
|
||||||||||||
|
Long-term
borrowings
|
1,336.7 | 753.7 | 299.1 | |||||||||
|
Repayments
of long-term borrowings
|
(1,096.8 | ) | (734.5 | ) | (373.3 | ) | ||||||
|
Change
in short-term borrowings
|
(92.0 | ) | 108.1 | (95.8 | ) | |||||||
|
Proceeds
from issuances of common stock
|
31.9 | 27.2 | 46.5 | |||||||||
|
Acquisitions
of treasury stock
|
(37.0 | ) | (326.8 | ) | (257.8 | ) | ||||||
|
Common
dividends
|
(37.4 | ) | (37.5 | ) | (40.6 | ) | ||||||
|
Other,
net
|
(4.6 | ) | 4.3 | 9.5 | ||||||||
|
Cash
provided by (used in) financing activities
|
100.8 | (205.5 | ) | (412.4 | ) | |||||||
|
Effect
of exchange rate changes on cash
|
4.1 | (28.3 | ) | 5.3 | ||||||||
|
Change
in cash and cash equivalents
|
83.2 | (24.2 | ) | 0.1 | ||||||||
|
Cash
and Cash Equivalents – Beginning of Year
|
127.4 | 151.6 | 151.5 | |||||||||
|
Cash
and Cash Equivalents – End of Year
|
$ | 210.6 | $ | 127.4 | $ | 151.6 | ||||||
The
accompanying notes are an integral part of the consolidated financial
statements.
Page 37
of 97
Consolidated
Statements of Shareholders’ Equity and Comprehensive Earnings
Ball
Corporation and Subsidiaries
|
($
in millions, except share amounts)
|
Years
ended December 31,
|
|||||||||||
|
2009
|
2008
|
2007
|
||||||||||
|
Number of Common Shares Issued
(000s)
|
||||||||||||
|
Balance,
beginning of year
|
160,917 | 160,679 | 160,027 | |||||||||
|
Shares
issued for stock options and other stock plans, net of
shares exchanged
|
596 | 238 | 652 | |||||||||
|
Balance,
end of year
|
161,513 | 160,917 | 160,679 | |||||||||
|
Number of Treasury Shares
(000s)
|
||||||||||||
|
Balance,
beginning of year
|
(67,185 | ) | (60,454 | ) | (55,890 | ) | ||||||
|
Shares
purchased, net of shares reissued (a)(b)
|
(308 | ) | (6,731 | ) | (4,564 | ) | ||||||
|
Balance,
end of year
|
(67,493 | ) | (67,185 | ) | (60,454 | ) | ||||||
|
Common
Stock
|
||||||||||||
|
Balance,
beginning of year
|
$ | 788.0 | $ | 760.3 | $ | 703.4 | ||||||
|
Shares
issued for stock options and other stock plans, net of
shares exchanged (cash and noncash)
|
37.3 | 23.4 | 47.4 | |||||||||
|
Tax
benefit from option exercises
|
5.5 | 4.3 | 9.5 | |||||||||
|
Balance,
end of year
|
$ | 830.8 | $ | 788.0 | $ | 760.3 | ||||||
|
Retained
Earnings
|
||||||||||||
|
Balance,
beginning of year
|
$ | 2,047.1 | $ | 1,765.0 | $ | 1,535.3 | ||||||
|
Net
earnings attributable to Ball Corporation
|
387.9 | 319.5 | 281.3 | |||||||||
|
Common
dividends, net of tax benefits
|
(37.9 | ) | (37.4 | ) | (40.2 | ) | ||||||
|
Adoption
of new accounting standard (Note 16)
|
– | – | (11.4 | ) | ||||||||
|
Balance,
end of year
|
$ | 2,397.1 | $ | 2,047.1 | $ | 1,765.0 | ||||||
|
Accumulated Other Comprehensive
Earnings (Loss) (Note 18)
|
||||||||||||
|
Balance,
beginning of year
|
$ | (182.5 | ) | $ | 106.9 | $ | (29.5 | ) | ||||
|
Foreign
currency translation adjustment
|
6.6 | (48.2 | ) | 90.0 | ||||||||
|
Pension
and other postretirement items, net of tax
|
(22.6 | ) | (147.8 | ) | 57.9 | |||||||
|
Effective
financial derivatives, net of tax
|
127.7 | (93.4 | ) | (11.5 | ) | |||||||
|
Mark-to-market
gain on available for sale securities, net of tax
|
7.0 | – | – | |||||||||
|
Net
other comprehensive earnings (loss) adjustments
|
118.7 | (289.4 | ) | 136.4 | ||||||||
|
Accumulated
other comprehensive earnings (loss)
|
$ | (63.8 | ) | $ | (182.5 | ) | $ | 106.9 | ||||
|
Treasury
Stock
|
||||||||||||
|
Balance,
beginning of year
|
$ | (1,566.8 | ) | $ | (1,289.7 | ) | $ | (1,043.8 | ) | |||
|
Shares
purchased, net of shares reissued (a)(b)
|
(16.0 | ) | (277.1 | ) | (214.9 | ) | ||||||
|
Diversification
of deferred compensation stock plan
|
– | – | (31.0 | ) | ||||||||
|
Balance,
end of year
|
$ | (1,582.8 | ) | $ | (1,566.8 | ) | $ | (1,289.7 | ) | |||
|
Comprehensive
Earnings
|
||||||||||||
|
Net
earnings attributable to Ball Corporation
|
$ | 387.9 | $ | 319.5 | $ | 281.3 | ||||||
|
Net
other comprehensive earnings adjustments (see details
above)
|
118.7 | (289.4 | ) | 136.4 | ||||||||
|
Comprehensive
earnings
|
$ | 506.6 | $ | 30.1 | $ | 417.7 | ||||||
|
(a)
|
Amount
in 2007 included 675,000 shares for amounts repurchased under forward
contracts not cash settled until after December 31. The contract was
settled for $31 million in
January 2008.
|
|
(b)
|
Includes
467,974 shares, 450,944 shares and 588,662 shares reissued in
2009, 2008 and 2007, respectively. The total amounts related to these
share reissuances were $20.9 million, $19.4 million and
$26.5 million in each of these three years,
respectively.
|
|
|
The
accompanying notes are an integral part of the consolidated financial
statements.
|
Page 38
of 97
Ball
Corporation and Subsidiaries
Notes
to Consolidated Financial Statements
|
1.
|
Critical
and Significant Accounting Policies
|
The
preparation of the company’s consolidated financial statements in conformity
with accounting principles generally accepted in the United States of America
(U.S. GAAP) requires Ball’s management to make estimates and assumptions that
affect the reported amounts in our consolidated financial statements and the
accompanying notes including various claims and contingencies related to
lawsuits, taxes, environmental and other matters arising during the normal
course of business. These estimates are based on management’s best judgment,
knowledge of existing facts and circumstances and actions that may be undertaken
in the future. Ball’s management evaluates the estimates on an ongoing basis
using the company’s historical experience, as well as other factors believed to
be appropriate under the circumstances, such as current economic conditions, and
adjusts or revises the estimates as circumstances change. As future events and
their effects cannot be determined with precision, actual results may differ
from these estimates. The financial statements reflect all adjustments
necessary, in the opinion of management, for the fair presentation of
results.
Critical
Accounting Policies
The
company considers certain accounting policies to be critical, as their
application requires management’s judgment about the effects of matters that are
inherently uncertain. Following is a discussion of the accounting policies the
company considers critical to our consolidated financial
statements.
Revenue
Recognition in the Aerospace and Technologies Segment
Sales
under long-term contracts in the aerospace and technologies segment are
primarily recognized under the cost-to-cost, percentage-of-completion method.
This business segment sells using three types of long-term sales contracts
(1) cost-type sales contracts, which represent approximately
two-thirds of segment net sales; (2) fixed price sales contracts,
which represent 20 percent of segment net sales; and (3) time and material
contracts, which account for the remainder. A cost-type sales contract is an
agreement to perform the contract for cost plus an agreed upon profit component,
fixed price sales contracts are completed for a fixed price and time and
material contracts involve the sale of engineering labor at fixed rates per
hour. Cost-type sales contracts can have different types of fee arrangements,
including fixed fee, cost, milestone and performance incentive fees, award fees
or a combination thereof.
During
initial periods of sales contract performance, our estimates of base, incentive
and other fees are established at a conservative estimate of profit over the
period of contract performance. Throughout the period of contract performance,
the company regularly reevaluates and, if necessary, revises estimates of total
contract revenue, total contract cost and extent of progress toward completion.
Provision for estimated contract losses, if any, is made in the period that such
losses are determined to be probable. Because of sales contract payment
schedules, limitations on funding and contract terms, our sales and accounts
receivable generally include amounts that have been earned but not yet billed.
As a prime U.S. government contractor or subcontractor, the aerospace and
technologies segment is subject to a high degree of regulation, financial review
and oversight by the U.S. government.
Acquisitions
The
company records acquisitions using the purchase method of accounting. Under this
method, the acquiring company allocates the purchase price to the assets
acquired, including intangible assets that can be identified and named, and
liabilities assumed based on their estimated fair values at the date of
acquisition. The purchase price in excess of the fair value of the net assets
and liabilities is recorded as goodwill. If the assets acquired are greater than
the purchase price paid then a bargain purchase has occurred and the company
will recognize the gain immediately in earnings. Among other sources of relevant
information, the company uses independent appraisals and actuarial or other
valuations to assist in determining the estimated fair values of the assets and
liabilities. Transaction costs associated with acquisitions are expensed as
incurred.
For
acquisitions where the company already owns an equity investment in the target
company, the company will recognize in earnings, upon the completion of the
acquisition, a gain or loss related to the equity investment. This gain or loss
is calculated based on the fair value of the equity investment on the date of
acquisition as compared to the carrying value of the investment.
Page 39
of 97
Ball
Corporation and Subsidiaries
Notes
to Consolidated Financial Statements
|
1.
|
Critical
and Significant Accounting Policies (continued)
|
Recoverability
of Goodwill and Intangible Assets
On an
annual basis and at interim periods when circumstances require, the company
tests the recoverability of its goodwill and indefinite-lived intangible assets.
The company’s indefinite-lived intangible assets are not significant to the
consolidated financial statements. The goodwill testing utilizes a two-step
impairment analysis, whereby the company compares the carrying value of each
identified reporting unit to its fair value. If the carrying value of the
reporting unit is greater than its fair value, the second step is performed,
where the implied fair value of goodwill is compared to its carrying value. The
company recognizes an impairment charge for the amount by which the carrying
amount of goodwill exceeds its fair value. The fair values of the reporting
units are estimated using the net present value of discounted cash flows,
excluding any financing costs or dividends, generated by each reporting unit.
The company’s discounted cash flows are based upon reasonable and appropriate
assumptions, which are weighted for their likely probability of occurrence,
about the underlying business activities of the company’s reporting
units.
For this
evaluation, our reporting units are consistent with our reportable segments
identified in Note 2 except that assets within metal beverage packaging,
Americas, are tested separately from those in metal beverage, Asia. These
reporting units have been identified based on the level at which discrete
financial information is reviewed by the segment management. When a business
within a reporting unit is disposed of, goodwill is allocated to the gain or
loss on disposition using the relative fair value methodology. The company’s
methodology of valuing goodwill has not changed from the prior year. However,
the annual testing date was changed during 2009 to the beginning of the
company’s fourth quarter. See Note 12 for more details regarding this change in
accounting policy.
The
company amortizes the cost of other finite-lived intangible assets over their
estimated useful lives. Amortizable intangible assets are tested for impairment,
when deemed necessary, based on undiscounted cash flows and, if impaired, are
written down to fair value based on either discounted cash flows or appraised
values.
Defined
Benefit Pension Plans and Other Employee Benefits
The
company has defined benefit plans that cover the majority of its employees. The
company also has postretirement plans that provide certain medical benefits and
life insurance for retirees and eligible dependents. The relevant accounting
guidance requires that management make certain assumptions relating to the
long-term rate of return on plan assets, discount rates used to measure future
obligations and expenses, salary scale inflation rates, health care cost trend
rates, mortality and other assumptions. The company believes that the accounting
estimates related to our pension and postretirement plans are critical
accounting estimates, because they are highly susceptible to change from period
to period based on the performance of plan assets, actuarial valuations, market
conditions and contracted benefit changes. The selection of assumptions is based
on historical trends and known economic and market conditions at the time of
valuation. However, actual results may differ substantially from the estimates
that were based on the critical assumptions.
The
company recognizes the funded status of each defined benefit pension plan and
other postretirement benefit plan on the consolidated balance sheet. Each
overfunded plan is recognized as an asset, and each underfunded plan is
recognized as a liability. Pension plan liabilities are revalued annually based
on updated assumptions and information about the individuals covered by the
plan. For pension plans, accumulated gains and losses in excess of a
10 percent corridor, the prior service cost and the transition asset are
amortized on a straight-line basis from the date recognized over the average
remaining service period of active participants. For other postemployment
benefits, the 10 percent corridor is not used. The majority of costs
related to defined benefit and other postretirement plans are included in cost
of sales; the remainder is included in selling, general and administrative
expenses.
In
addition to defined benefit and postretirement plans, the company maintains
reserves for employee medical claims, up to our insurance stop-loss limit, and
workers’ compensation claims. These are regularly evaluated and revised, as
needed, based on a variety of information, including historical experience,
actuarial estimates and current employee statistics.
Page 40
of 97
Ball
Corporation and Subsidiaries
Notes
to Consolidated Financial Statements
|
1.
|
Critical
and Significant Accounting Policies (continued)
|
Income
Taxes
Deferred
tax assets, including operating loss, capital loss and tax credit carry
forwards, are reduced by a valuation allowance when, in the opinion of
management, it is more likely than not that any portion of these tax attributes
will not be realized. In addition, from time to time, management must assess the
need to accrue or disclose a possible loss contingency for proposed adjustments
from various federal, state and foreign tax authorities who regularly audit the
company in the normal course of business. In making these assessments,
management must often analyze complex tax laws of multiple jurisdictions,
including many foreign jurisdictions.
Deferred
income taxes reflect the future tax consequences of differences between the tax
bases of assets and liabilities and their financial reporting amounts at each
balance sheet date, based upon enacted income tax laws and tax rates. Income tax
expense or benefit is provided based on earnings reported in the financial
statements. The provision for income tax expense or benefit differs from the
amounts of income taxes currently payable because certain items of income and
expense included in the consolidated financial statements are recognized in
different time periods by taxing authorities.
The
accounting guidance prescribes a recognition threshold and measurement attribute
for the financial statement recognition and measurement of a tax position taken
or expected to be taken in a tax return. The company records the related
interest expense and penalties, if any, as tax expense in the tax provision,
consistent with the practice prior to adoption.
Business
Consolidation Costs
The
company estimates its liabilities for business consolidation activities by
accumulating detailed estimates of costs and asset sale proceeds, if any, for
each business consolidation initiative. This includes the estimated costs of
employee severance, pension and related benefits; impairment of property and
equipment and other assets, including estimates of net realizable value;
accelerated depreciation; termination payments for contracts and leases;
contractual obligations; and any other qualifying costs related to the exit
plan. These estimated costs are grouped by specific projects within the overall
exit plan and are then monitored on a monthly basis. Such disclosures represent
management’s best estimates, but require assumptions about the plans that may
change over time. Changes in estimates for individual locations and other
matters are evaluated periodically to determine if a change in estimate
is required for the overall restructuring plan. Subsequent changes to the
original estimates are included in current period earnings and identified as
business consolidation gains or losses.
Derivative
Financial Instruments
The
company uses derivative financial instruments for the purpose of hedging
exposures to fluctuations in interest rates, foreign currency exchange rates,
raw materials purchasing, inflation rates and common share repurchases. The
company’s derivative instruments are recorded in the consolidated balance sheets
at fair value. For a derivative designated as a cash flow hedge, the effective
portion of the derivative's gain or loss is initially reported as a component of
accumulated other comprehensive earnings and subsequently reclassified into
earnings when the forecasted transaction affects earnings. The ineffective
portion of the gain or loss associated with all hedges is reported in earnings
immediately. Derivatives that do not qualify for hedge accounting are marked to
market with gains and losses also reported immediately in earnings. In the
statements of cash flows, derivative activities are classified based on the
items being hedged. The accounting for our cash collateral calls related to our
derivative activities are classified as investing activities as discussed in
Note 9.
Realized
gains and losses from hedges are classified in the consolidated statements of
earnings consistent with the accounting treatment of the items being hedged.
Upon the early dedesignation of an effective derivative contract, the gains or
losses are deferred in accumulated other comprehensive earnings until the
originally hedged item affects earnings. Any gains or losses incurred after the
dedesignation date are reported in earnings immediately.
Page 41
of 97
Ball
Corporation and Subsidiaries
Notes
to Consolidated Financial Statements
|
1.
|
Critical
and Significant Accounting Policies (continued)
|
Significant
Accounting Policies
Principles
of Consolidation and Basis of Presentation
The
consolidated financial statements include the accounts of Ball Corporation and
its controlled subsidiaries (collectively, Ball, the company, we or our). Equity
investments in which the company exercises significant influence but
does not control and is not the primary beneficiary are accounted for using
the equity method of accounting. Investments in which the company does not
exercise significant influence over the investee are accounted for using the
cost method of accounting. Intercompany transactions are
eliminated.
Reclassifications
Certain
prior year amounts have been reclassified in order to conform to the current
year presentation.
Cash
and Cash Equivalents
Cash and
cash equivalents include cash on hand and highly liquid investments with
original maturities of three months or less.
Inventories
Inventories
are stated at the lower of cost or market using the first-in, first-out (FIFO)
cost method of accounting.
Depreciation
and Amortization
Property,
plant and equipment are carried at the cost of acquisition or construction and
depreciated over the estimated useful lives of the assets. Depreciation and
amortization are provided using the straight-line method in amounts sufficient
to amortize the cost of the assets over their estimated useful lives (buildings
and improvements – 10 to 40 years; machinery and equipment – 3 to
15 years; other intangible assets – 13 years, weighted
average).
Deferred
financing costs are amortized over the life of the related loan facility and are
reported as part of interest expense. When debt is repaid prior to its maturity
date, the write-off of the remaining unamortized deferred financing costs, or
pro rata portion thereof, is also reported as interest expense.
Under
certain business consolidation activities, accelerated depreciation may be
required over the remaining useful life for designated assets to be scrapped or
abandoned. The accelerated depreciation related to plant closures is disclosed
as part of the business consolidation costs in the appropriate
period.
Environmental
Reserves
The
company estimates the liability related to environmental matters based on, among
other factors, the degree of probability of an unfavorable outcome and the
ability to make a reasonable estimate of the amount of loss. The company records
the best estimate of a loss when the loss is considered probable. As additional
information becomes available, the company assesses the potential liability
related to pending matters and revises the estimates.
Revenue
Recognition in the Packaging Segments
The
company recognizes sales of products in the packaging segments when the four
basic criteria of revenue recognition are met. The four basic criteria are met
when delivery has occurred and title has transferred, there is persuasive
evidence of an agreement or arrangement, the price is fixed and determinable and
collection is reasonably assured.
Page 42
of 97
Ball
Corporation and Subsidiaries
Notes
to Consolidated Financial Statements
|
1.
|
Critical
and Significant Accounting Policies (continued)
|
Fair
Value Measurements
Effective
January 1, 2008, the company adopted accounting guidance establishing a
framework for assets and liabilities measured at fair value on a recurring basis
included in the company’s consolidated balance sheet. Effective January 1,
2009, similar accounting guidance was adopted for assets and liabilities
measured at fair value on a nonrecurring basis. As defined in the guidance, fair
value is the price that would be received to sell an asset or be paid to
transfer a liability in an orderly transaction between market participants at
the measurement date (exit price).
The
guidance establishes a fair value hierarchy that prioritizes the inputs used to
measure fair value using the following definitions (from highest to lowest
priority):
|
●
|
Level 1–Unadjusted
quoted prices in active markets that are accessible at the measurement
date for identical, unrestricted assets or
liabilities.
|
|
●
|
Level 2–Observable
inputs other than quoted prices included within Level 1 that are
observable for the asset or liability, either directly or indirectly,
including quoted prices for similar assets and liabilities in active
markets; quoted prices for identical or similar assets and liabilities in
markets that are not active; or other inputs that are observable or can be
corroborated by observable market data by correlation or other
means.
|
|
●
|
Level 3–Prices
or valuation techniques requiring inputs that are both significant to the
fair value measurement and
unobservable.
|
Stock-Based
Compensation
Ball has
a variety of restricted stock and stock option plans. The compensation cost
associated with restricted stock grants has been calculated using the fair value
at the date of grant (closing stock price) and amortized over the restriction
period. Stock-based compensation is primarily reported as part of selling,
general and administrative expenses in the consolidated statements of earnings.
For the valuation of stock options, Ball has elected to use the Black-Scholes
valuation model. The company’s deferred compensation stock program is subject to
variable accounting and, accordingly, is marked to the closing price of the
company’s common stock at the end of each reporting period. Tax benefits
associated with option exercises are reported in financing activities in the
consolidated statements of cash flows. Further details regarding the expense
calculated under the fair value based method are provided in
Note 19.
Research
and Development
Research
and development costs are expensed as incurred in connection with the company’s
internal programs for the development of products and processes. Costs incurred
in connection with these programs, the majority of which are included in cost of
sales, amounted to $25.6 million, $32.9 million and $27.4 million
for the years ended December 31, 2009, 2008 and 2007,
respectively.
Foreign
Currency Translation
Assets
and liabilities of foreign operations are translated using period-end exchange
rates, and revenues and expenses are translated using average exchange rates
during each period. Translation gains and losses are reported in accumulated
other comprehensive earnings as a component of shareholders’
equity.
Page 43
of 97
Ball
Corporation and Subsidiaries
Notes
to Consolidated Financial Statements
|
1.
|
Critical
and Significant Accounting Policies (continued)
|
Accounting
Pronouncements
On
July 1, 2009, Ball adopted on a prospective basis the Financial Accounting
Standards Board’s (FASB) accounting standards codification, which establishes
the exclusive authoritative reference for U.S. GAAP for use in financial
statements, except for SEC rules and interpretive releases, which are also
authoritative U.S. GAAP for SEC registrants. Although the codification made no
changes to U.S. GAAP itself, it superseded all previously existing non-SEC
accounting and reporting standards.
Recently
Adopted Accounting Guidance
Effective
January 1, 2009, Ball adopted on a prospective basis new accounting
guidance issued by the FASB that establishes a framework for measuring fair
value of all nonfinancial assets and liabilities measured on a nonrecurring
basis, and expands disclosures about fair value measurements. Although it does
not require any new fair value measurements, the guidance emphasizes that fair
value is a market-based measurement, not an entity-specific measurement, and
should be determined based on the assumptions that market participants would use
in pricing the asset or liability. Details regarding the adoption of this
guidance and its effects on the company’s consolidated financial statements are
available in Note 21, “Financial Instruments and Risk
Management.”
In
September 2009, additional guidance was issued by the FASB concerning fair value
measurements, specifically guidelines for measuring the fair value of certain
“alternative investments” and disclosure, by major category of investment, about
the attributes of those investments, such as restrictions on the investor’s
ability to redeem its investments, unfunded commitments and investment
strategies of the investees. This accounting guidance was effective on a
prospective basis beginning in the fourth quarter of 2009. The adoption of this
guidance had no impact on our consolidated financial statements or on the
pension asset disclosures presented in Note 17.
Effective
January 1, 2009, Ball adopted new guidance which amends accounting and reporting
standards for the noncontrolling interest in a subsidiary, requiring that such
interests be reported as a discrete component of shareholders’ equity and net
earnings allocable to the noncontrolling interests be presented separately from
net earnings attributable to the company’s shareholders in the consolidated
statements of earnings. The adoption of this guidance, under which prior periods
were retrospectively adjusted to conform to the current presentation, did not
have a significant impact on the consolidated financial statements of the
company. The
noncontrolling interest component of shareholders’ equity includes the net
earnings attributable to the noncontrolling interests, as well as dividends
paid.
Also
effective January 1, 2009, Ball adopted new accounting guidance that requires
that objectives for using derivative instruments be disclosed in terms of
underlying risk and accounting designation, as well as information about
credit-risk-related contingent features. It also requires more transparent
disclosure of where fair values, as well as gains and losses of derivative
instruments, are reflected in the financial statements. Details regarding the
adoption of this guidance and its effects on the company’s consolidated
financial statements are available in Note 21, “Financial Instruments and
Risk Management.”
Also
effective January 1, 2009, the company adopted guidance related to business
combinations and has applied the new guidance to the acquisition of four
manufacturing plants from Anheuser-Busch InBev n.v./s.a. on October 1,
2009. The new guidance will also be applied to the announced acquisition of the
remaining 65-percent interest in Guangdong Jianlibao Group Co., Ltd. expected to
be finalized during the first half of 2010. See Note 3 for details of both
acquisitions.
In May
2009, the FASB established general standards of accounting for and disclosure of
events that occur after the balance sheet date but prior to the issuance of
financial statements. All events occurring on and through the date of this
filing were evaluated and considered as to whether any occurrence should affect
the consolidated financial statements. The results of the evaluation had no
impact on our consolidated financial statements.
Page 44
of 97
Ball
Corporation and Subsidiaries
Notes
to Consolidated Financial Statements
|
1.
|
Critical
and Significant Accounting Policies (continued)
|
Effective
December 31, 2009, Ball adopted new FASB guidance which amended the
reporting of postretirement benefit plan assets. The new guidance now requires
disclosure of how investment allocation decisions are made, including the
factors that are pertinent to an understanding of investment policies and
strategies, the major categories of plan assets, significant concentrations of
risk within plan assets, inputs and valuation techniques to measure fair value
and the effect of significant unobservable inputs on changes in plan assets for
the period. See Note 17 for further details on the new
disclosures.
New
Accounting Guidance
In June
2009, the FASB issued accounting guidance that modifies the way entities account
for securitizations and special-purpose entities. The company has preliminarily
reviewed the guidance and determined that the company’s existing accounts
receivable securitization program will likely be recorded on the balance sheet
effective January 1, 2010. This will result in an increase in accounts
receivable and an increase in short-term debt. It will also create a one-time
reduction in cash flows from operating activities in 2010 and an offsetting
one-time increase in cash flows from financing activities.
Also in
June 2009, the FASB issued additional guidance regarding variable interest
entities (VIE). The new guidance requires a company to perform an analysis to
determine whether its variable interest or interests give it a controlling
financial interest in a VIE and whether it is the primary beneficiary of a VIE.
It also amends existing guidance to require ongoing reassessments of whether a
company is the primary beneficiary of a VIE. The accounting guidance was
effective for Ball as of January 1, 2010, and is not expected to have a
significant impact on the company’s consolidated financial
statements.
In
October 2009, the FASB issued additional guidance pertaining to revenue
recognition on multiple-deliverable arrangements. This amended guidance
establishes a selling price hierarchy for determining the selling price of a
deliverable, requiring that the company determine its best estimate of selling
price in a manner that is consistent with that used to determine the price to
sell the deliverable on a stand-alone basis. Additional expanded disclosures are
also required by this new guidance. This accounting guidance is to be applied
prospectively for revenue arrangements entered into or materially modified in
fiscal years beginning on or after June 15, 2010. The company is in the process
of evaluating the impact this guidance may have on the consolidated financial
statements.
In
January 2010, the FASB issued additional guidance regarding fair value
measurements, specifically requiring the disclosure of transfers in and out of
Level 1 and 2 (previously only required for Level 3 assets and
liabilities) and more specific detailed disclosure of the activity in
Level 3 fair value measurements (on a gross basis rather than a net basis).
The new guidance also clarifies existing disclosure regarding the level of
disaggregation of asset and liability classes, as well as the valuation
techniques and inputs used to measure fair value for Level 2 and
Level 3 fair value measurements. The disclosure requirement for transfers
in and out of Level 1 and 2 will be effective for Ball in its first 2010
quarterly report on Form 10-Q, and the reporting of Level 3 activity
on a gross basis will be effective for Ball as of January 1, 2011. The
adoption of the new accounting guidance is not expected to have a significant
impact on the company’s consolidated financial
statements.
Page 45
of 97
Ball
Corporation and Subsidiaries
Notes
to Consolidated Financial Statements
|
2.
|
Business
Segment Information
|
Ball’s
operations are organized and reviewed by management along its product lines and
presented in five reportable segments.
Metal
beverage packaging, Americas and Asia: Consists of operations in the
U.S., Canada, Puerto Rico (through the end of 2008) and the PRC, which
manufacture and sell metal beverage containers in North America and the PRC, as
well as non-beverage plastic containers in the PRC. The Americas and Asia
operations have been aggregated based on similar economic
characteristics.
Metal
beverage packaging, Europe: Consists of operations in
several countries in Europe, which manufacture and sell metal beverage
containers.
Metal
food & household products packaging, Americas: Consists of operations in
the U.S., Canada and Argentina, which manufacture and sell metal food cans,
aerosol cans, paint cans and decorative specialty cans.
Plastic
packaging, Americas:
Consists of operations in the U.S. and Canada (through the third quarter
of 2008), which manufacture and sell polyethylene terephthalate (PET) and
polypropylene containers, primarily for use in beverage and food packaging.
Through October 23, 2009, this segment also included the manufacture and
sale of plastic containers used for industrial and household products. See
Note 4 for further details on the disposition.
Aerospace
and technologies: Consists of the manufacture
and sale of aerospace and other related products and the providing of services
used primarily in the defense, civil space and commercial space
industries.
The
accounting policies of the segments are the same as those in the consolidated
financial statements. Ball also has investments in companies in the U.S., PRC
and Brazil, which are accounted for under the equity method of accounting and,
accordingly, those results are not included in segment sales or
earnings.
Major
Customers
Sales to
MillerCoors LLC were approximately 10 percent of consolidated sales for the
year ended December 31, 2009, and sales to SABMiller plc were approximately
11 percent of consolidated net sales for the year ended December 31, 2007. There
were no major customers (defined as 10 percent or more of consolidated net
sales) for the year ended December 31, 2008.
Summary
of Net Sales by Geographic Area
|
($
in millions)
|
U.S.
|
Foreign
(a)
|
Consolidated
|
|||||||||
|
2009
|
$ | 5,184.4 | $ | 2,160.9 | $ | 7,345.3 | ||||||
|
2008
|
5,223.8 | 2,337.7 | 7,561.5 | |||||||||
|
2007
|
5,268.4 | 2,121.3 | 7,389.7 | |||||||||
Summary
of Net Long-Lived Assets by Geographic Area (b)
|
($
in millions)
|
U.S.
|
Germany
(c)
|
Other
(d)
|
Consolidated
|
||||||||||||
|
2009
|
$ | 2,473.8 | $ | 1,405.3 | $ | 685.9 | $ | 4,565.0 | ||||||||
|
2008
|
2,160.6 | 1,391.1 | 651.7 | 4,203.4 | ||||||||||||
|
(a)
|
Includes
the company’s net sales in the PRC, Canada, Argentina and certain European
countries (none of which was individually significant), intercompany
eliminations and other.
|
|
(b)
|
Net
long-lived assets primarily consist of property, plant and equipment;
goodwill; and other intangible
assets.
|
|
(c)
|
For
reporting purposes, Ball Packaging Europe’s goodwill and intangible assets
have been allocated to Germany. The total amounts allocated were
$1,069.0 million and $1,061.1 million at December 31, 2009
and 2008, respectively.
|
|
(d)
|
Includes
the company’s net long-lived assets in the PRC, Canada and certain
European countries, not including Germany (none of which was individually
significant), intercompany eliminations and
other.
|
Page 46
of 97
Ball
Corporation and Subsidiaries
Notes
to Consolidated Financial Statements
|
2.
|
Business
Segment Information (continued)
|
Summary
of Business by Segment
|
($
in millions)
|
2009
|
2008
|
2007
|
|||||||||
|
Net
Sales
|
||||||||||||
|
Metal
beverage packaging, Americas & Asia
|
$ | 2,888.8 | $ | 2,989.5 | $ | 3,098.1 | ||||||
|
Legal
settlement (Note 5)
|
– | – | (85.6 | ) | ||||||||
|
Total
metal beverage packaging, Americas & Asia
|
2,888.8 | 2,989.5 | 3,012.5 | |||||||||
|
Metal
beverage packaging, Europe
|
1,739.5 | 1,868.7 | 1,653.6 | |||||||||
|
Metal
food & household products packaging, Americas
|
1,392.9 | 1,221.4 | 1,183.4 | |||||||||
|
Plastic
packaging, Americas
|
634.9 | 735.4 | 752.4 | |||||||||
|
Aerospace
& technologies
|
689.2 | 746.5 | 787.8 | |||||||||
|
Net
sales
|
$ | 7,345.3 | $ | 7,561.5 | $ | 7,389.7 | ||||||
|
Net
Earnings
|
||||||||||||
|
Metal
beverage packaging, Americas & Asia
|
$ | 296.0 | $ | 284.1 | $ | 326.4 | ||||||
|
Legal
settlement (Note 5)
|
– | – | (85.6 | ) | ||||||||
|
Business
consolidation costs (Note 6)
|
(6.8 | ) | (40.6 | ) | – | |||||||
|
Total
metal beverage packaging, Americas & Asia
|
289.2 | 243.5 | 240.8 | |||||||||
|
Metal
beverage packaging, Europe
|
214.8 | 230.9 | 228.9 | |||||||||
|
Metal
food & household products packaging, Americas
|
130.8 | 68.1 | 36.2 | |||||||||
|
Business
consolidation costs (Note 6)
|
(2.6 | ) | 1.6 | (44.2 | ) | |||||||
|
Total
metal food & household products
packaging, Americas
|
128.2 | 69.7 | (8.0 | ) | ||||||||
|
Plastic
packaging, Americas
|
16.3 | 15.8 | 26.3 | |||||||||
|
Business
consolidation costs (Note 6)
|
(23.8 | ) | (8.3 | ) | (0.4 | ) | ||||||
|
Gain
on disposition (Note 4)
|
4.3 | – | – | |||||||||
|
Total
plastic packaging, Americas
|
(3.2 | ) | 7.5 | 25.9 | ||||||||
|
Aerospace
& technologies
|
61.4 | 76.2 | 64.6 | |||||||||
|
Gain
on disposition (Note 4)
|
– | 7.1 | – | |||||||||
|
Total
aerospace & technologies
|
61.4 | 83.3 | 64.6 | |||||||||
|
Segment
earnings before interest and taxes
|
690.4 | 634.9 | 552.2 | |||||||||
|
Undistributed
corporate expenses, net
|
(59.3 | ) | (39.6 | ) | (38.3 | ) | ||||||
|
Gain
on disposition (Note 4)
|
34.8 | – | – | |||||||||
|
Business
consolidation and other costs (Note 6)
|
(11.3 | ) | (4.8 | ) | – | |||||||
|
Total
undistributed corporate expenses, net
|
(35.8 | ) | (44.4 | ) | (38.3 | ) | ||||||
|
Earnings
before interest and taxes
|
654.6 | 590.5 | 513.9 | |||||||||
|
Interest
expense
|
(117.2 | ) | (137.7 | ) | (149.4 | ) | ||||||
|
Tax
provision
|
(162.8 | ) | (147.4 | ) | (95.7 | ) | ||||||
|
Equity
in results of affiliates
|
13.8 | 14.5 | 12.9 | |||||||||
|
Net
earnings
|
388.4 | 319.9 | 281.7 | |||||||||
|
Earnings
attributable to noncontrolling interests
|
(0.5 | ) | (0.4 | ) | (0.4 | ) | ||||||
|
Net
earnings attributable to Ball Corporation
|
$ | 387.9 | $ | 319.5 | $ | 281.3 | ||||||
Page 47
of 97
Ball
Corporation and Subsidiaries
Notes
to Consolidated Financial Statements
|
2.
|
Business
Segment Information (continued)
|
Summary
of Business by Segment (continued)
|
($
in millions)
|
2009
|
2008
|
2007
|
|||||||||
|
Depreciation
and Amortization
|
||||||||||||
|
Metal
beverage packaging, Americas & Asia
|
$ | 83.5 | $ | 84.5 | $ | 81.3 | ||||||
|
Metal
beverage packaging, Europe
|
93.7 | 97.2 | 84.0 | |||||||||
|
Metal
food & household products packaging, Americas
|
41.3 | 43.8 | 42.8 | |||||||||
|
Plastic
packaging, Americas
|
43.1 | 48.8 | 51.6 | |||||||||
|
Aerospace
& technologies
|
20.2 | 19.5 | 17.9 | |||||||||
|
Segment
depreciation and amortization
|
281.8 | 293.8 | 277.6 | |||||||||
|
Corporate
|
3.4 | 3.6 | 3.4 | |||||||||
|
Depreciation
and amortization
|
$ | 285.2 | $ | 297.4 | $ | 281.0 | ||||||
|
Property,
Plant and Equipment Additions
|
||||||||||||
|
Metal
beverage packaging, Americas & Asia
|
$ | 45.7 | $ | 86.1 | $ | 91.7 | ||||||
|
Metal
beverage packaging, Europe
|
69.4 | 139.8 | 146.4 | |||||||||
|
Metal
food & household products packaging, Americas
|
22.7 | 34.5 | 23.0 | |||||||||
|
Plastic
packaging, Americas
|
29.4 | 21.1 | 20.2 | |||||||||
|
Aerospace
& technologies
|
17.0 | 20.6 | 23.0 | |||||||||
|
Segment
property, plant and equipment additions
|
184.2 | 302.1 | 304.3 | |||||||||
|
Corporate
|
2.9 | 4.8 | 4.2 | |||||||||
|
Property,
plant and equipment additions
|
$ | 187.1 | $ | 306.9 | $ | 308.5 | ||||||
|
December
31,
|
||||||||
|
($
in millions)
|
2009
|
2008
|
||||||
|
Total
Assets
|
||||||||
|
Metal
beverage packaging, Americas & Asia
|
$ | 2,111.8 | $ | 1,873.0 | ||||
|
Metal
beverage packaging, Europe
|
2,357.9 | 2,434.5 | ||||||
|
Metal
food & household products packaging, Americas
|
932.9 | 972.9 | ||||||
|
Plastic
packaging, Americas
|
425.8 | 502.6 | ||||||
|
Aerospace
& technologies
|
268.2 | 280.2 | ||||||
|
Segment
assets
|
6,096.6 | 6,063.2 | ||||||
|
Corporate
assets, net of eliminations
|
391.7 | 305.5 | ||||||
|
Total
assets
|
$ | 6,488.3 | $ | 6,368.7 | ||||
|
Investments
in Affiliates
|
||||||||
|
Metal
beverage packaging, Americas & Asia
|
$ | 10.2 | $ | 12.5 | ||||
|
Metal
beverage packaging, Europe
|
0.2 | 0.2 | ||||||
|
Corporate
|
75.8 | 71.2 | ||||||
|
Investments
in affiliates
|
$ | 86.2 | $ | 83.9 | ||||
Page 48
of 97
Ball
Corporation and Subsidiaries
Notes
to Consolidated Financial Statements
|
3.
|
Acquisitions
|
Anheuser-Busch
InBev n.a./s.a.
On
October 1, 2009, the company acquired three of Anheuser-Busch InBev
n.v./s.a.’s (AB InBev) beverage can manufacturing plants and one of its beverage
can end manufacturing plants, all of which are located in the U.S., for
$574.7 million in cash. The additional plants will enhance Ball’s ability
to better serve its customers. The facilities acquired employ approximately
635 people.
The
plants’ operations were included in Ball’s results beginning October 1,
2009, which amounted to approximately $160 million of net sales and
$12 million of operating earnings from that date through
December 31, 2009. In addition, a pretax charge of $11.1 million
($6.8 million after tax) was recorded during the year for transaction costs
associated with the acquisition, which, in accordance with recent changes to the
guidance related to accounting for business combinations, are required to be
expensed as incurred. The transaction costs are included in the business
consolidation and other activities line of the consolidated statement of
earnings.
Management’s
fair market valuation of acquired assets and liabilities has been completed and
is summarized in the table below:
|
($
in millions)
|
||||
|
Inventories
|
$ | 63.3 | ||
|
Property,
plant and equipment
|
191.5 | |||
|
Goodwill
|
279.3 | |||
|
Other
intangible assets
|
42.5 | |||
|
Current
liabilities
|
(1.9 | ) | ||
|
Net
assets acquired
|
$ | 574.7 | ||
AB
InBev’s customer relationships were identified as a valuable intangible asset by
management and assigned a fair value of $42.5 million. This intangible
asset is being amortized on a weighted-average basis over 10 years in accordance
with management’s estimates. Goodwill related to the assets is deductible for
tax purposes over 15 years and is included in the metal beverage packaging,
Americas and Asia, segment.
The
following unaudited pro forma consolidated results of operations have been
prepared as if the acquisition had occurred as of January 1 in each of the
periods presented. The pro forma results are not necessarily indicative of the
actual results that would have occurred had the acquisition been in effect for
the periods presented, nor are they necessarily indicative of the results that
may be obtained in the future.
|
Year
Ended December 31,
|
||||||||
|
($
in millions)
|
2009
|
2008
|
||||||
|
Net
sales
|
$ | 8,017.3 | $ | 8,233.5 | ||||
|
Net
earnings
|
397.5 | 329.0 | ||||||
|
Basic
earnings per share
|
4.24 | 3.43 | ||||||
|
Diluted
earnings per share
|
4.18 | 3.39 | ||||||
Pro forma
adjustments primarily include the after-tax effect of increased interest expense
related to incremental borrowings used to finance the acquisition. The
adjustments also include the after-tax effects of amortization of the customer
relationship intangible asset and decreased depreciation expense on plant and
equipment based on extended useful lives partially offset by increased fair
values.
Page 49
of 97
Ball
Corporation and Subsidiaries
Notes
to Consolidated Financial Statements
|
3.
|
Acquisitions
(continued)
|
Guangdong
Jianlibao Group Co., Ltd
On
November 9, 2009, the company announced its agreement to acquire Guangdong
Jianlibao Group Co., Ltd’s (Jianlibao) 65-percent interest in a joint venture
metal beverage can and end plant in Sanshui, PRC. Ball has owned 35 percent
of the joint venture plant since 1992. Ball will acquire the plant and related
assets for approximately $90 million in cash and assumed debt and will also
enter into a long-term supply agreement with Jianlibao. The transaction is
expected to close during 2010, subject to customary regulatory approvals.
Transaction costs expensed in 2009 amounted to $0.7 million
($0.4 million after tax).
|
4.
|
Dispositions
of Businesses and Investments
|
On
October 23, 2009, Ball completed the sale of its plastic pail assets to BWAY
Corporation for $32.0 million, subject to customary post-closing adjustments.
The transaction involved the sale of a plastic pail manufacturing plant (and
associated contracts) in Newnan, Georgia, which Ball acquired in 2006 as part of
its purchase of U.S. Can Corporation and was included in the plastics packaging,
Americas, segment. The plant produces injection molded plastic pails and drums
for products such as building materials and pool chemicals. The company recorded a
pretax gain of $4.3 million ($0.3 million loss after tax) on the
transaction.
On May
19, 2009, the company sold seventy-five percent of its investment in
DigitalGlobe Inc. (DigitalGlobe), a provider of commercial high resolution earth
imagery products and services, in conjunction with its initial public offering.
The sale generated proceeds of $37.0 million and a non-operating pretax gain of
$34.8 million ($30.7 million after tax). The remaining investment in
DigitalGlobe, classified as an other long-term asset, has been accounted for as
a marketable equity investment and, as such, is marked to market, with the
unrealized gain being held in accumulated other comprehensive earnings (loss).
(See Note 18.)
On
February 15, 2008, Ball Aerospace & Technologies Corp. (BATC) completed the
sale of its shares in Ball Solutions Group Pty Ltd (BSG) for $8.7 million, net
of cash sold. BSG was previously a wholly owned Australian subsidiary of BATC
that provided services to the Australian department of defense and related
government agencies. The sale resulted in a pretax gain of $7.1 million ($4.4
million after tax).
|
5.
|
Legal
Settlement
|
During
the second quarter of 2007, a U.S. customer asserted various claims against a
wholly owned subsidiary of the company, primarily related to the pricing of the
aluminum component of the containers supplied by the subsidiary, and on
October 4, 2007, the dispute was settled in mediation. The customer received
$85.6 million ($51.8 million after tax) on settlement of the dispute,
and Ball retained all of the customer’s beverage can and end supply through
2015. The customer received a one-time payment of approximately $70.3 million
($42.5 million after tax) in January 2008 with the remainder of the
settlement to be recovered over the life of the contract through
2015.
|
6.
|
Business
Consolidation and Other Costs
|
Following
is a summary of business consolidation activities included in the consolidated
statements of earnings for the years ended December 31:
|
($
in millions)
|
2009
|
2008
|
2007
|
|||||||||
|
Metal
beverage packaging, Americas & Asia
|
$ | (6.8 | ) | $ | (40.6 | ) | $ | – | ||||
|
Metal
food & household products packaging, Americas
|
(2.6 | ) | 1.6 | (44.2 | ) | |||||||
|
Plastic
packaging, Americas
|
(23.8 | ) | (8.3 | ) | (0.4 | ) | ||||||
|
Corporate
other costs
|
(11.3 | ) | (4.8 | ) | – | |||||||
| $ | (44.5 | ) | $ | (52.1 | ) | $ | (44.6 | ) | ||||
Page 50
of 97
Ball
Corporation and Subsidiaries
Notes
to Consolidated Financial Statements
|
6.
|
Business
Consolidation and Other Costs (continued)
|
2009
Metal
Beverage Packaging, Americas and Asia
During
the fourth quarter, income of $4.2 million ($2.5 million after tax) was
recorded to reflect the reversal of previously recorded employee benefit charges
taken primarily related to the closures of the Puerto Rico and Kansas City
plants, which were announced in the fourth quarter of 2008. The reversal was due
to the original estimates of group insurance and other employee-related costs
being higher than actual experience rates. These gains were partially offset by
other charges recognized in the fourth quarter totaling $1.0 million ($0.6
million after tax) primarily for fixed asset disposals where original
adjustments to net realizable value were insufficient.
A charge
of $0.7 million ($0.4 million after tax) was also recorded in the
fourth quarter for acquisition costs required to be expensed related to the
acquisition in the PRC of the remaining outstanding shares of Jianlibao. (See
Note 3.)
During
the third quarter, a charge of $1 million ($0.6 million after tax) was
recorded, primarily for additional costs of winding down the Puerto Rico and
Kansas City plants, the closures of which were announced in the fourth quarter
of 2008.
In the
second quarter of 2009, a charge of $3.3 million ($2 million after tax) was
taken for severance and other employee benefits related to a reduction of
personnel in the plants and headquarters of the Americas portion of this
segment. Most of the costs were paid by the end of 2009.
In the
first quarter of 2009, a charge of $5 million ($3.1 million after tax) was taken
related to accelerated depreciation for operations that ceased in the quarter at
the Kansas City plant.
Metal
Food & Household Products Packaging, Americas
In the
fourth quarter, Ball recorded a charge of $2.6 million ($1.6 million
after tax) primarily for higher than originally estimated employee benefit and
lease termination costs related to previously announced plant
closures.
Plastic
Packaging, Americas
The
fourth quarter included income of $1.1 million ($0.7 million after
tax) to reflect updated employee benefit cost estimates related to plant
closures, as well as expense of $0.4 million ($0.2 million after tax)
for additional costs related to another previously announced plant closure. In
the second and third quarters of 2009, charges of $11.9 million
($7.2 million) and $12.6 million ($8.2 million after tax),
respectively, were recorded related primarily to the closure of plastic
packaging manufacturing plants in Brampton, Ontario;
Baldwinsville, New York; and Watertown, Wisconsin. Manufacturing
operations have ceased in all three locations. The third quarter charge included
$4.2 million for accelerated depreciation and $8.4 million for lease
termination costs. The second quarter charge included $3 million of
severance and other employee benefit costs, accelerated depreciation of $5.7
million, $2.2 million primarily for the write down of assets to net realizable
value and $1 million of other business consolidation charges.
The remaining reserves consist of lease
payments (net of subleases), which will continue to be paid in future years over
the lease terms.
Corporate
Other Costs
Charges
of $11.3 million ($6.9 million after tax) were recorded in 2009
primarily for transaction costs required to be expensed for the acquisition of
three metal beverage can plants and one beverage can end plant from AB InBev.
(See Note 3.)
Page 51
of 97
Ball
Corporation and Subsidiaries
Notes
to Consolidated Financial Statements
|
6.
|
Business
Consolidation and Other Costs (continued)
|
2008
Metal
Beverage Packaging, Americas & Asia
On
October 30, 2008, the company announced the closure of two North American metal
beverage can plants. A plant in Kansas City, Missouri, which primarily
manufactured specialty beverage cans, was closed by the end of the first quarter
of 2009 with manufacturing volumes absorbed by other North American beverage can
plants. A plant in Puerto Rico, which manufactured 12-ounce beverage cans, was
closed at the end of 2008. A pretax charge of $40.7 million ($25.2 million
after tax) was recorded in the fourth quarter of 2008. The charge included
$17 million for employee severance, pension and other employment benefit
costs; and $9 million of accelerated depreciation and $14 million for the write
down to net realizable value of certain fixed assets and related spare parts.
The carrying value of fixed assets remaining for sale in connection with the
plant closures was $5.3 million at December 31, 2009.
On April
23, 2008, the company announced plans to close a U.S. metal beverage packaging
plant in Kent, Washington. A pretax charge of $11.2 million ($6.8 million after
tax) was recorded during the second and third quarters and included
$9.2 million for employee severance, pension and other employee benefit
costs and $2 million primarily related to accelerated depreciation and the
write down to net realizable value of certain fixed assets, related spare parts
and tooling inventory. The plant was shut down during the third quarter, and the
land and building was sold in the fourth quarter for a gain of $4.1 million
($2.5 million after tax). All remaining costs, excluding pension costs of
$5.2 million, were paid during 2009.
A gain of
$7.2 million ($4.4 million after tax) was recorded in the second quarter for the
recovery of previously expensed costs in a prior metal beverage business
consolidation charge. This reflects a decision made in the second quarter to
continue to operate existing end-making equipment and not install a new beverage
can end module that would have been part of a multi-year project. The remaining
reserves are expected to be utilized in 2010 as the multi-year U.S. end
modernization project is completed.
Metal
Food & Household Products Packaging, Americas
During
2008 the company recorded a net pretax gain of $1.6 million ($0.9 million after
tax) for business consolidation activities. In addition to costs recorded in the
fourth quarter of 2007, during the third quarter of 2008, a charge of $4.5
million ($2.8 million after tax) was recorded for lease cancellation costs on
final shutdown of the Commerce, California, facility. In the fourth quarter, a
$6.1 million ($3.7 million after tax) gain was recorded primarily related to
management’s decision in the fourth quarter to remain in the custom and
decorative tinplate can business based on market conditions. All remaining
reserves related to Commerce and Tallapoosa, Georgia (see 2007 discussion
below), excluding lease cancellation costs, were utilized during 2009. The
carrying value of fixed assets remaining for sale in connection with the plant
closures was insignificant at December 31, 2009.
Plastic
Packaging, Americas
In the
second quarter, the company announced plans to close a plastic packaging plant
in Brampton, Ontario. The plant manufactured polypropylene bottles for
foods and will be consolidated into the company’s other plastic packaging
manufacturing facilities in North America. A charge of $8.3 million ($7.8
million after tax) was recorded during the second and third quarters. The charge
included $1.9 million for severance costs, $2.5 million for lease cancellation
costs and $3.9 million for accelerated depreciation and the write down of
fixed assets to net realizable value. The plant was shut down during the third
quarter of 2008.
Corporate
Other Costs
During
2008 pretax charges of $4.8 million ($2.9 million after tax) were recorded for
estimated environmental costs related to previously closed and sold
facilities.
Page 52
of 97
Ball
Corporation and Subsidiaries
Notes
to Consolidated Financial Statements
|
6.
|
Business
Consolidation and Other Costs (continued)
|
2007
Metal
Food & Household Products Packaging, Americas
In
October 2007 the company announced plans to close aerosol and general line can
manufacturing facilities in Commerce, California, and Tallapoosa, Georgia, and
to exit the custom and decorative tinplate can business located in Baltimore,
Maryland. A pretax charge of $41.9 million ($25.4 million after tax)
was recorded in the fourth quarter in connection with the closure of the aerosol
plants, including $10.7 million for severance costs, $23 million for
the write down of fixed assets to net realizable value, $2.4 million for
excess inventory and $5.8 million for other associated costs. The company’s
management has subsequently decided to remain in the custom and decorative
tinplate can business.
The
company also recorded a $2.3 million pretax pension annuity expense
($1.4 million after tax) related to a previously closed food can plant. The
pension settlement payment was made in December 2007.
Plastic
Packaging, Americas
In the
fourth quarter of 2007, Ball recorded a pretax charge of $0.4 million
($0.2 million after tax) for severance costs related to the termination of
approximately 50 employees in response to lost sales. All costs were
incurred and paid by the end of 2008.
Summary
Following
is a summary of reserve activity by segment related to business consolidation
activities for the year ended December 31, 2009:
|
($
in millions)
|
Metal
Beverage
Packaging,
Americas
&
Asia
|
Metal
Food
&
Household Products
Packaging,
Americas
|
Plastic
Packaging,
Americas
|
Corporate
Other Costs |
Total
|
|||||||||||||||
|
Balance
at December 31, 2008
|
$ | 28.2 | $ | 11.1 | $ | 2.9 | $ | 4.8 | $ | 47.0 | ||||||||||
|
Charges,
net
|
6.8 | 2.6 | 23.8 | 11.3 | 44.5 | |||||||||||||||
|
Cash
payments
|
(18.7 | ) | (7.3 | ) | (2.6 | ) | (12.2 | ) | (40.8 | ) | ||||||||||
|
Fixed
asset disposals and transfer activity
|
(5.9 | ) | 0.9 | (14.7 | ) | (3.1 | ) | (22.8 | ) | |||||||||||
|
Balance
at December 31, 2009
|
$ | 10.4 | $ | 7.3 | $ | 9.4 | $ | 0.8 | $ | 27.9 | ||||||||||
|
7.
|
Property
Insurance Proceeds
|
On
April 1, 2006, a fire in the Hassloch, Germany, metal beverage can plant in
the company’s metal beverage packaging, Europe, segment damaged a significant
portion of the plant’s building and machinery and equipment. The property
insurance proceeds recorded for the year ended December 31, 2007, which
were based on replacement cost, were €37.6 million ($48.6 million).
Additionally, €27.2 million ($35.1 million) was recorded in cost of
sales in 2007 for insurance recoveries related to business interruption
costs.
Page 53
of 97
Ball
Corporation and Subsidiaries
Notes
to Consolidated Financial Statements
|
8.
|
Receivables
|
|
December
31,
|
||||||||
|
($
in millions)
|
2009
|
2008
|
||||||
|
Trade
accounts receivable, net
|
$ | 453.2 | $ | 435.7 | ||||
|
Other
receivables
|
95.0 | 72.2 | ||||||
| $ | 548.2 | $ | 507.9 | |||||
Trade
accounts receivable are shown net of an allowance for doubtful accounts of
$14.7 million at December 31, 2009, and $12.8 million at
December 31, 2008. Other receivables primarily include a note due from a
supplier, property and sales tax receivables, certain vendor rebate receivables
and other miscellaneous receivables.
A
receivables sales agreement provides for the ongoing, revolving sale of a
designated pool of trade accounts receivable of Ball’s North American packaging
operations up to $250 million. Under accounting guidance in effect through
December 31, 2009, the agreement qualifies as off-balance sheet financing.
Net funds received from the sale of the accounts receivable totaled
$250 million at December 31, 2009 and 2008, and are reflected as a
reduction of accounts receivable in the consolidated balance sheets. Fees
incurred in connection with the sale of accounts receivable, which are reported
as part of selling, general and administrative expenses, totaled
$3.2 million in 2009, $8.5 million in 2008 and $11.4 million in
2007.
Net
accounts receivable under long-term contracts, due primarily from agencies of
the U.S. government and their prime contractors, were $125.1 million and
$136 million for the years ended December 31, 2009 and 2008,
respectively, and included $50.4 million and $55 million,
respectively, representing the recognized sales value of performance that had
not been billed and was not yet billable to customers. The average length of the
long-term contracts is approximately three years, and the average
length remaining on those contracts at December 31, 2009, was
15 months. Approximately $0.6 million of unbilled receivables at
December 31, 2009, is expected to be collected after one year and is
related to customary fees and cost withholdings that will be paid upon milestone
or contract completions, as well as final overhead rate
settlements.
|
9.
|
Collateral
Calls
|
The
company’s agreements with its financial counterparties require Ball to post
collateral in certain circumstances when the negative mark-to-market value of
the contracts exceeds specified levels. Additionally, Ball has similar
collateral posting arrangements with certain customers on these derivative
contracts. The cash flows of the margin calls are shown within the investing
section of the company’s consolidated statements of cash flows. As of
December 31, 2009, the aggregate fair value of all derivative instruments
with credit-risk-related contingent features that were in a net liability
position was $98.8 million collateralized by $14.2 million, which was
offset by cash collateral receipts from customers of $14.2 million. At
December 31, 2008, Ball had $229.5 million of cash posted as
collateral and had received $124.0 million of cash from customers for a net
amount of $105.5 million. If the company’s public credit rating were
downgraded, there would be a net increase of $10.9 million to our net cash
collateral postings as of December 31, 2009.
|
10.
|
Inventories
|
|
December
31,
|
||||||||
|
($
in millions)
|
2009
|
2008
|
||||||
|
Raw
materials and supplies
|
$ | 462.5 | $ | 461.4 | ||||
|
Work
in process and finished goods
|
481.7 | 512.8 | ||||||
| $ | 944.2 | $ | 974.2 | |||||
Page 54
of 97
Ball
Corporation and Subsidiaries
Notes
to Consolidated Financial Statements
|
11.
|
Property,
Plant and Equipment
|
|
December
31,
|
||||||||
|
($
in millions)
|
2009
|
2008
|
||||||
|
Land
|
$ | 92.6 | $ | 89.0 | ||||
|
Buildings
|
883.0 | 798.5 | ||||||
|
Machinery
and equipment
|
3,167.3 | 2,992.9 | ||||||
|
Construction
in progress
|
135.6 | 151.2 | ||||||
| 4,278.5 | 4,031.6 | |||||||
|
Accumulated
depreciation
|
(2,329.5 | ) | (2,164.7 | ) | ||||
| $ | 1,949.0 | $ | 1,866.9 | |||||
Property,
plant and equipment are stated at historical cost. Depreciation expense amounted
to $267.8 million, $279.8 million and $263.8 million for the
years ended December 31, 2009, 2008 and 2007, respectively.
|
12.
|
Goodwill
|
|
($
in millions)
|
Metal
Beverage
Packaging,
Americas
&
Asia
|
Metal
Beverage
Packaging,
Europe
|
Metal
Food
&
Household Products
Packaging,
Americas
|
Plastic
Packaging,
Americas
|
Total
|
|||||||||||||||
|
Balance
at December 31, 2007
|
$ | 279.4 | $ | 1,115.3 | $ | 354.3 | $ | 114.1 | $ | 1,863.1 | ||||||||||
|
Transfers
of Ball’s PRC operations
|
30.6 | (30.6 | ) | – | – | – | ||||||||||||||
|
Effects
of foreign currency exchange rates and other
|
– | (36.4 | ) | (0.7 | ) | (0.5 | ) | (37.6 | ) | |||||||||||
|
Balance
at December 31, 2008
|
310.0 | 1,048.3 | 353.6 | 113.6 | 1,825.5 | |||||||||||||||
|
Acquisition
of AB InBev plants
|
279.3 | – | – | – | 279.3 | |||||||||||||||
|
Sale
of plastics pail business
|
– | – | – | (7.5 | ) | (7.5 | ) | |||||||||||||
|
Effects
of foreign currency exchange rates and other
|
(0.5 | ) | 17.6 | – | 0.4 | 17.5 | ||||||||||||||
|
Balance
at December 31, 2009
|
$ | 588.8 | $ | 1,065.9 | $ | 353.6 | $ | 106.5 | $ | 2,114.8 | ||||||||||
There has
been no impairment on the company’s goodwill since January 1,
2002.
Since
January 1, 2002, the company has tested the recoverability of goodwill
annually during the first quarter of each year. The testing was completed at the
appropriate time, and no impairments resulted from this review. During the
fourth quarter of 2009, Ball adopted a new accounting policy whereby our annual
impairment test of goodwill is performed in the fourth quarter instead of the
first quarter. The change in the company’s annual goodwill impairment testing
date was made to coincide with the timing of the annual strategic planning
process. As a result of the change, Ball performed the annual impairment tests
again in the fourth quarter. No impairments resulted from the fourth quarter
test.
Page 55
of 97
Ball
Corporation and Subsidiaries
Notes
to Consolidated Financial Statements
|
13.
|
Intangibles
and Other Assets
|
|
December
31,
|
||||||||
|
($
in millions)
|
2009
|
2008
|
||||||
|
Intangibles
and Other Assets:
|
||||||||
|
Investments
in affiliates
|
$ | 86.2 | $ | 83.9 | ||||
|
Intangible
assets (net of accumulated amortization of $126.2
and $108.2
at December 31, 2009 and 2008, respectively)
|
126.7 | 104.4 | ||||||
|
Company-owned
life insurance
|
111.0 | 78.4 | ||||||
|
Deferred
tax asset
|
29.0 | 26.0 | ||||||
|
Other
|
67.7 | 79.3 | ||||||
| $ | 420.6 | $ | 372.0 | |||||
Total
amortization expense of other intangible assets amounted to $17.4 million,
$17.6 million and $17.2 million for the years ended December 31,
2009, 2008 and 2007, respectively. Based on intangible assets and foreign
currency exchange rates as of December 31, 2009, total annual intangible asset
amortization expense is expected to be between $10 million and
$14 million for each of the years 2010 through 2014.
|
14.
|
Leases
|
The
company leases warehousing and manufacturing space and certain equipment in the
packaging segments and office and technical space in the aerospace and
technologies segment. During 2005 and 2003, we entered into leases that qualify
as operating leases for book purposes and capital leases for tax purposes. Under
these lease arrangements, Ball has the option to purchase the leased equipment
at the end of the lease term, or if we elect not to do so, to compensate the
lessors for the difference between the guaranteed minimum residual values
totaling $16.3 million and the fair market value of the assets, if less.
Certain of the company’s leases in effect at December 31, 2009, include
renewal options and/or escalation clauses for adjusting lease expense based on
various factors.
Total
noncancellable operating leases in effect at December 31, 2009, require rental
payments of $43.1 million, $32.8 million, $23.8 million,
$16.3 million and $13.9 million for the years 2010 through 2014,
respectively, and $22.5 million combined for all years thereafter. Lease
expense for all operating leases was $78.8 million, $84.2 million and
$85.3 million in 2009, 2008 and 2007, respectively.
Page 56
of 97
Ball
Corporation and Subsidiaries
Notes
to Consolidated Financial Statements
|
15.
|
Debt
and Interest Costs
|
Short-term
debt at December 31, 2009, includes current portion of long-term debt and
$63.5 million outstanding under uncommitted bank facilities totaling
$305 million. At December 31, 2008, $155.6 million was
outstanding under uncommitted bank facilities totaling $332 million. The
weighted average interest rate of the outstanding short-term facilities was
3.2 percent at December 31, 2009, and 5.7 percent at
December 31, 2008.
Long-term
debt and interest rates in effect at December 31 consisted of the
following:
|
2009
|
2008
|
|||||||||||||||
|
(in
millions)
|
In
Local
Currency
|
In
U.S. $
|
In
Local
Currency
|
In
U.S. $
|
||||||||||||
|
Notes
Payable
|
||||||||||||||||
|
6.875%
Senior Notes, due December 2012 (excluding premium of $1.3 in 2009 and
$1.8 in 2008)
|
$ | 509.0 | $ | 509.0 | $ | 509.0 | $ | 509.0 | ||||||||
|
6.625%
Senior Notes, due March 2018 (excluding discount of $0.6 in 2009 and
$0.7 in 2008)
|
$ | 450.0 | 450.0 | $ | 450.0 | 450.0 | ||||||||||
|
7.125%
Senior Notes, due September 2016 (excluding discount of $7.2 in
2009)
|
$ | 375.0 | 375.0 | $ | – | – | ||||||||||
|
7.375%
Senior Notes, due September 2019 (excluding discount of $8.1 in
2009)
|
$ | 325.0 | 325.0 | $ | – | – | ||||||||||
|
Senior
Credit Facilities, due October 2011
|
||||||||||||||||
|
Term
A Loan, British sterling denominated (2009 – 1.26%; 2008 –
3.21%)
|
₤ | 63.8 | 101.5 | ₤ | 74.4 | 109.5 | ||||||||||
|
Term
B Loan, euro denominated (2009 – 1.23%; 2008 – 3.77%)
|
€ | 227.5 | 326.1 | € | 306.3 | 431.6 | ||||||||||
|
Term
C Loan, Canadian dollar denominated (2009 – 1.24%; 2008 –
2.47%)
|
C$ | 114.0 | 108.6 | C$ | 120.4 | 98.5 | ||||||||||
|
Term
D Loan, U.S. dollar denominated (2009 – 0.98%; 2008 –
1.21%)
|
$ | 300.0 | 300.0 | $ | 437.5 | 437.5 | ||||||||||
|
U.S.
dollar multi-currency revolver borrowings (2009 – 0.98%;
2008 – 1.63%)
|
$ | 2.3 | 2.3 | $ | 2.3 | 2.3 | ||||||||||
|
Euro
multi-currency revolver borrowings (2008 – 4.09%)
|
€ | – | – | € | 128.2 | 180.8 | ||||||||||
|
British
sterling multi-currency revolver borrowings (2009 – 1.26%;
2008 – 2.95%)
|
₤ | 20.9 | 33.3 | ₤ | 10.5 | 15.5 | ||||||||||
|
Industrial
Development Revenue Bonds
|
||||||||||||||||
|
Floating
rates due through 2015 (2009 – 0.63% to 0.67%; 2008 – 1.2% to
1.3%)
|
$ | 9.4 | 9.4 | $ | 9.4 | 9.4 | ||||||||||
|
Other
(including discounts and premiums)
|
Various
|
(7.5 | ) |
Various
|
10.4 | |||||||||||
| 2,532.7 | 2,254.5 | |||||||||||||||
|
Less:
Current portion of long-term debt
|
(248.8 | ) | (147.4 | ) | ||||||||||||
| $ | 2,283.9 | $ | 2,107.1 | |||||||||||||
On
August 20, 2009, Ball issued, at a price of 97.975 percent, $375 million of
new 7.125 percent senior notes (effective yield to maturity of 7.5 percent)
due in September 2016. Also on that date, Ball issued, at a price of
97.414 percent, $325 million of 7.375 percent senior notes
(effective yield to maturity of 7.75 percent) due in September 2019.
The majority of the proceeds from these financings was used to acquire certain
assets from AB InBev on October 1, 2009. (See Note 3.) The remainder
was used for general corporate purposes.
Page 57
of 97
Ball
Corporation and Subsidiaries
Notes
to Consolidated Financial Statements
|
15.
|
Debt
and Interest Costs (continued)
|
As
permitted, the company’s long-term debt is not carried in the company’s
consolidated financial statements at fair value. The fair value of the long-term
debt was estimated at $2.54 billion as of December 31, 2009, which
approximated its carrying value of $2.53 billion. The fair value was
$2.18 billion on December 31, 2008, as compared to its then carrying value
of $2.25 billion. The fair value reflects the market rates at
December 31 of each year for debt with similar credit ratings to the
company’s ratings. Rates currently available to the company for loans with
similar terms and maturities are used to estimate the fair value of long-term
debt based on discounted cash flows.
The
senior credit facilities bear interest at variable rates and also include
(1) a multi-currency, long-term revolving credit facility that provides the
company with up to approximately $700 million and (2) a Canadian
long-term revolving credit facility that provides the company with up to the
equivalent of $35 million. Both revolving credit facilities expire in
October 2011. At December 31, 2009, taking into account outstanding
letters of credit, approximately $663 million was available under these
revolving credit facilities.
Long-term
debt obligations outstanding at December 31, 2009, have maturities of
$248.8 million, $633.0 million, $509.4 million, $0.3 million
and $0.3 million for the years ending December 31, 2010 through 2014,
respectively, and $1,155.5 million thereafter. Ball provides letters of
credit in the ordinary course of business to secure liabilities recorded in
connection with industrial development revenue bonds and certain self-insurance
arrangements. Letters of credit outstanding at December 31, 2009 and 2008, were
$36.4 million and $34.9 million, respectively, including industrial
development bonds of $9.4 million at the end of both periods.
The notes
payable and senior credit facilities are guaranteed on a full, unconditional and
joint and several basis by certain of the company’s wholly owned domestic
subsidiaries. Certain foreign denominated tranches of the senior credit
facilities are similarly guaranteed by certain of the company’s wholly owned
foreign subsidiaries. Note 23 contains further details as well as
condensed, consolidating financial information for the company, segregating the
guarantor subsidiaries and non-guarantor subsidiaries.
The
company was in compliance with all loan agreements at December 31, 2009, 2008
and 2007, and has met all debt payment obligations. The U.S. note
agreements, bank credit agreement and industrial development revenue bond
agreements contain certain restrictions relating to dividend payments, share
repurchases, investments, financial ratios, guarantees and the incurrence of
additional indebtedness.
A summary
of total interest cost paid and accrued follows:
|
($
in millions)
|
2009
|
2008
|
2007
|
|||||||||
|
Interest
costs
|
$ | 120.8 | $ | 144.9 | $ | 155.8 | ||||||
|
Amounts
capitalized
|
(3.6 | ) | (7.2 | ) | (6.4 | ) | ||||||
|
Interest
expense
|
$ | 117.2 | $ | 137.7 | $ | 149.4 | ||||||
|
Interest
paid during the year
|
$ | 103.1 | $ | 132.4 | $ | 153.9 | ||||||
Page 58
of 97
Ball
Corporation and Subsidiaries
Notes
to Consolidated Financial Statements
|
16.
|
Taxes
on Income
|
The
amount of earnings before income taxes is:
|
($
in millions)
|
2009
|
2008
|
2007
|
|||||||||
|
U.S.
|
$ | 315.3 | $ | 243.7 | $ | 155.0 | ||||||
|
Foreign
|
222.1 | 209.1 | 209.5 | |||||||||
| $ | 537.4 | $ | 452.8 | $ | 364.5 | |||||||
The
provision for income tax expense is:
|
($
in millions)
|
2009
|
2008
|
2007
|
|||||||||
|
Current
|
||||||||||||
|
U.S.
|
$ | 85.8 | $ | 48.6 | $ | 18.0 | ||||||
|
State
and local
|
17.2 | 12.2 | 7.0 | |||||||||
|
Foreign
|
86.7 | 58.3 | 80.2 | |||||||||
|
Uncertain
tax positions
|
(2.6 | ) | 8.7 | 11.5 | ||||||||
|
Total
current
|
187.1 | 127.8 | 116.7 | |||||||||
|
Deferred
|
||||||||||||
|
U.S.
|
1.6 | 31.2 | 5.8 | |||||||||
|
State
and local
|
(0.8 | ) | 3.6 | (0.9 | ) | |||||||
|
Foreign
|
(25.1 | ) | (15.2 | ) | (25.9 | ) | ||||||
|
Total
deferred
|
(24.3 | ) | 19.6 | (21.0 | ) | |||||||
|
Provision
for income taxes
|
$ | 162.8 | $ | 147.4 | $ | 95.7 | ||||||
The
income tax provision recorded within the consolidated statements of earnings
differs from the provision determined by applying the U.S. statutory tax rate to
pretax earnings as a result of the following:
|
($
in millions)
|
2009
|
2008
|
2007
|
|||||||||
|
Statutory
U.S. federal income tax
|
$ | 188.1 | $ | 158.5 | $ | 127.6 | ||||||
|
Increase
(decrease) due to:
|
||||||||||||
|
Foreign
tax rate differences
|
(14.3 | ) | (26.2 | ) | (9.9 | ) | ||||||
|
Company-owned
life insurance
|
(5.4 | ) | 2.5 | (3.9 | ) | |||||||
|
Research
and development tax credits
|
(1.0 | ) | (5.0 | ) | (4.5 | ) | ||||||
|
Manufacturing
deduction
|
(4.4 | ) | (3.6 | ) | (3.3 | ) | ||||||
|
Net
change in valuation allowance on foreign losses
|
(4.5 | ) | 4.1 | – | ||||||||
|
State
and local taxes, net
|
10.9 | 10.2 | 3.9 | |||||||||
|
Uncertain
tax positions, including interest
|
(2.6 | ) | 8.7 | 11.5 | ||||||||
|
Statutory
rate reduction and legislative changes
|
– | (4.5 | ) | (10.4 | ) | |||||||
|
Basis
differences for asset sales
|
(5.9 | ) | – | – | ||||||||
|
Foreign
subsidiary stock loss
|
– | – | (17.2 | ) | ||||||||
|
Acquired
tax attribute adjustment
|
(4.6 | ) | – | – | ||||||||
|
Withholding
and other foreign taxes, net
|
7.8 | 2.0 | 3.6 | |||||||||
|
Other,
net
|
(1.3 | ) | 0.7 | (1.7 | ) | |||||||
|
Provision
for taxes
|
$ | 162.8 | $ | 147.4 | $ | 95.7 | ||||||
|
Effective
tax rate expressed as a percentage
of pretax earnings
|
30.3 | % | 32.6 | % | 26.3 | % | ||||||
Page 59
of 97
Ball
Corporation and Subsidiaries
Notes
to Consolidated Financial Statements
|
16.
|
Taxes
on Income (continued)
|
The 2009
effective rate of 30.3 percent was lower than in 2008 primarily due to tax
benefits related to a higher tax basis in the sale of certain assets, the
release of a valuation allowance on net operating losses in the Netherlands and
a net release for uncertain tax positions primarily related to tax settlements
in several foreign jurisdictions. These reductions were somewhat offset by an
overall increase in the effective tax rate due to an increase in earnings mix in
the U.S., which is the company’s highest tax rate jurisdiction, a reduction in
research and development tax credits and an increased effective tax rate in
China due to a phase in of increased tax rates and increased withholding
taxes.
The
higher effective rate in 2008 of 32.6 percent as compared to 2007 was due
to increased tax expense as a result of nondeductible losses in the cash
surrender value of certain company-owned life insurance plans and the inability
to fully use Canadian net operating losses on plant closures. An increase in
uncertain tax positions was somewhat offset by a tax benefit due to legislative
changes in the United Kingdom.
In 2005
Ball Packaging Europe’s Serbian subsidiary was granted a tax holiday. Under the
terms of the holiday, the earnings of this subsidiary are exempt from income
taxation for a period of 10 years beginning in the first year the Serbian
subsidiary has taxable earnings. As of December 31, 2009, the 10-year
period had commenced and six years remain. In 1995 Ball Packaging Europe’s
Polish subsidiary was granted a tax holiday. Under the terms of the holiday, an
exemption was granted on manufacturing earnings for up to €39.5 million of
income tax. The tax exemption was fully utilized as of December 31,
2007.
Net
income tax payments were $200.4 million, $120.3 million and
$63.6 million for 2009, 2008 and 2007, respectively.
The
significant components of deferred tax assets and liabilities at December 31
were:
|
($
in millions)
|
2009
|
2008
|
||||||
|
Deferred
tax assets:
|
||||||||
|
Deferred
compensation
|
$ | 85.0 | $ | 76.0 | ||||
|
Accrued
employee benefits
|
123.2 | 95.5 | ||||||
|
Plant
closure costs
|
17.0 | 33.5 | ||||||
|
Accrued
pensions
|
114.5 | 116.5 | ||||||
|
Inventory
and other reserves
|
23.6 | 24.1 | ||||||
|
Net
operating losses and other tax attributes
|
39.5 | 48.4 | ||||||
|
Unrealized
losses on foreign exchange and derivative transactions
|
5.6 | 42.7 | ||||||
|
Other
|
18.9 | 17.1 | ||||||
|
Total
deferred tax assets
|
427.3 | 453.8 | ||||||
|
Valuation
allowance
|
(31.0 | ) | (24.0 | ) | ||||
|
Net
deferred tax assets
|
396.3 | 429.8 | ||||||
|
Deferred
tax liabilities:
|
||||||||
|
Depreciation
|
(247.0 | ) | (266.1 | ) | ||||
|
Goodwill
and other intangible assets
|
(89.6 | ) | (85.2 | ) | ||||
|
Unrealized
gains on derivative transactions
|
(13.1 | ) | – | |||||
|
LIFO
inventory reserves
|
(6.0 | ) | (13.5 | ) | ||||
|
Unrealized
gains on equity securities
|
(4.5 | ) | – | |||||
|
Other
|
(19.4 | ) | (20.3 | ) | ||||
|
Total
deferred tax liabilities
|
(379.6 | ) | (385.1 | ) | ||||
|
Net
deferred tax asset
|
$ | 16.7 | $ | 44.7 | ||||
Page 60
of 97
Ball
Corporation and Subsidiaries
Notes
to Consolidated Financial Statements
|
16.
|
Taxes
on Income (continued)
|
At
December 31, 2009 and 2008, the net deferred tax asset (liability) was included
in the consolidated balance sheets as follows:
|
($
in millions)
|
2009
|
2008
|
||||||
|
Deferred
taxes and other current assets
|
$ | 61.8 | $ | 91.1 | ||||
|
Intangibles
and other assets, net
|
29.0 | 26.0 | ||||||
|
Other
current liabilities
|
(10.9 | ) | – | |||||
|
Deferred
taxes and other liabilities
|
(63.2 | ) | (72.4 | ) | ||||
|
Net
deferred tax asset
|
$ | 16.7 | $ | 44.7 | ||||
At
December 31, 2009, Ball Packaging Europe and its subsidiaries had net
operating loss carryforwards, with no expiration date, of $29.7 million
with a related tax benefit of $7.9 million. Ball’s Canadian subsidiaries
had net operating loss carryforwards, with no expiration date, of
$61.5 million with a related tax benefit of $19.3 million. Due to the
uncertainty of ultimate realization, these European and Canadian benefits have
been fully offset by valuation allowances. At December 31, 2009, the
company had alternative minimum tax credit carryforwards of $5.1 million and
foreign tax credit carryforwards of $5.8 million; however, due to the
uncertainty of realization of the entire foreign tax credit, a valuation
allowance of $3.8 million has been applied to reduce the carrying value to
$2.0 million.
A
rollforward of the unrecognized tax benefits related to uncertain income tax
positions at December 31 follows:
|
($
in millions)
|
2009
|
2008
|
2007
|
|||||||||
|
Balance
at January 1
|
$ | 48.8 | $ | 41.1 | $ | 45.8 | ||||||
|
Additions
based on tax positions related to the current year
|
9.4 | 5.6 | 3.9 | |||||||||
|
Additions
for tax positions of prior years
|
5.6 | 3.1 | 7.6 | |||||||||
|
Reductions
for settlements
|
(9.2 | ) | – | – | ||||||||
| Transfer to other current liabilities for settlement | – | – | (18.4 | ) | ||||||||
|
Reductions
due to lapse of statute of limitations
|
(8.4 | ) | – | – | ||||||||
|
Effect
of foreign currency exchange rates
|
(0.3 | ) | (1.0 | ) | 2.2 | |||||||
|
Balance
at December 31
|
$ | 45.9 | $ | 48.8 | $ | 41.1 | ||||||
|
Balance
sheet classification:
|
||||||||||||
|
Other
current liabilities
|
$ | 4.2 | $ | 4.2 | $ | 4.2 | ||||||
|
Deferred
taxes and other liabilities
|
41.7 | 44.6 | 36.9 | |||||||||
|
Total
|
$ | 45.9 | $ | 48.8 | $ | 41.1 | ||||||
The
annual provisions for income taxes included a tax benefit of $2.6 million in
2009 and tax expense of $8.7 million and $11.5 million in 2008 and
2007, respectively.
Page 61
of 97
Ball
Corporation and Subsidiaries
Notes
to Consolidated Financial Statements
|
16.
|
Taxes
on Income (continued)
|
The
amount of unrecognized tax benefits at December 31, 2009, that, if
recognized, would reduce tax expense is $45.9 million. At this time there
are no positions where the unrecognized tax benefit is expected to increase or
decrease significantly within the next 12 months. U.S. federal and state
income tax returns filed for the years 2005 to 2008 are open for audit. The
income tax returns filed in Europe for the years 2004 through 2008 are also open
for audit. The company’s significant filings in Europe are in Germany, France,
the Netherlands, Poland, Serbia and the United Kingdom.
The
company recognizes the accrual of interest and penalties related to unrecognized
tax benefits in income tax expense. Ball recognized $3.5 million,
$3.1 million and $2.7 million of additional income tax expense in
2009, 2008 and 2007, respectively, for potential interest on these items. The accrual for uncertain
tax positions at December 31, 2009, includes $8.5 million representing
potential interest expense. No penalties have been accrued.
Management’s
intention is to indefinitely reinvest undistributed foreign earnings of Ball’s
controlled foreign corporations and, as a result, no U.S. income or foreign
withholding tax provision has been made. It is not practicable to estimate the
additional taxes that may become payable upon the eventual remittance of these
foreign earnings.
|
17.
|
Employee
Benefit Obligations
|
|
December
31,
|
||||||||
|
($
in millions)
|
2009
|
2008
|
||||||
|
Total
defined benefit pension liability
|
$ | 603.7 | $ | 622.3 | ||||
|
Less
current portion
|
(26.1 | ) | (26.3 | ) | ||||
|
Long-term
defined benefit pension liability
|
577.6 | 596.0 | ||||||
|
Retiree
medical and other postemployment benefits
|
193.0 | 178.4 | ||||||
|
Deferred
compensation plans
|
199.9 | 176.3 | ||||||
|
Other
|
42.7 | 30.7 | ||||||
| $ | 1,013.2 | $ | 981.4 | |||||
Certain
management employees may elect to defer the payment of all or a portion of their
annual incentive compensation into the company’s deferred compensation plan
and/or the company’s deferred compensation stock plan. The employee becomes a
general unsecured creditor of the company with respect to amounts deferred.
Amounts deferred into the deferred compensation stock plan receive a
20 percent company match with a maximum match of $20,000 per year. Amounts
deferred into the stock plan are represented in the participant's account as
stock units, with each unit having a value equivalent to one share of Ball’s
common stock. Participants in the stock plan are allowed to reallocate a
prescribed number of units to other notional investment funds subject to
specified time constraints.
The
company’s pension plans cover substantially all U.S., Canadian and European
employees meeting certain eligibility requirements. The defined benefit plans
for salaried employees, as well as those for hourly employees in Germany and the
United Kingdom, provide pension benefits based on employee compensation and
years of service. Plans for North American hourly employees provide benefits
based on fixed rates for each year of service. While the German plans are not
funded, the company maintains book reserves, and annual additions to the
reserves are generally tax deductible. With the exception of the German plans,
our policy is to fund the plans in amounts at least sufficient to satisfy
statutory funding requirements taking into consideration what is currently
deductible under existing tax laws and regulations.
Page 62
of 97
Ball
Corporation and Subsidiaries
Notes
to Consolidated Financial Statements
|
17.
|
Employment
Benefit Obligations (continued)
|
Defined
Benefit Pension Plans
An
analysis of the change in benefit accruals for 2009 and 2008
follows:
|
2009
|
2008
|
|||||||||||||||||||||||
|
($
in millions)
|
U.S.
|
Foreign
|
Total
|
U.S.
|
Foreign
|
Total
|
||||||||||||||||||
|
Change
in projected benefit obligation:
|
||||||||||||||||||||||||
|
Benefit
obligation at prior year end
|
$ | 888.2 | $ | 520.4 | $ | 1,408.6 | $ | 839.9 | $ | 624.7 | $ | 1,464.6 | ||||||||||||
|
Service
cost
|
42.5 | 5.8 | 48.3 | 42.8 | 8.0 | 50.8 | ||||||||||||||||||
|
Interest
cost
|
53.6 | 30.7 | 84.3 | 51.0 | 33.1 | 84.1 | ||||||||||||||||||
|
Benefits
paid
|
(58.7 | ) | (36.2 | ) | (94.9 | ) | (59.9 | ) | (37.6 | ) | (97.5 | ) | ||||||||||||
|
Net
actuarial gain
|
48.0 | 55.9 | 103.9 | 2.1 | (29.2 | ) | (27.1 | ) | ||||||||||||||||
|
Special
termination benefits
|
– | – | – | 7.7 | – | 7.7 | ||||||||||||||||||
|
Effect
of exchange rates
|
– | 32.9 | 32.9 | – | (79.8 | ) | (79.8 | ) | ||||||||||||||||
|
Plan
amendments and other
|
4.1 | 0.6 | 4.7 | 4.6 | 1.2 | 5.8 | ||||||||||||||||||
|
Benefit
obligation at year end
|
977.7 | 610.1 | 1,587.8 | 888.2 | 520.4 | 1,408.6 | ||||||||||||||||||
|
Change
in plan assets:
|
||||||||||||||||||||||||
|
Fair
value of assets at prior year end
|
612.5 | 178.4 | 790.9 | 795.5 | 273.2 | 1,068.7 | ||||||||||||||||||
|
Actual
return on plan assets
|
115.4 | 30.7 | 146.1 | (160.4 | ) | (37.0 | ) | (197.4 | ) | |||||||||||||||
|
Employer
contributions
|
88.0 | 8.2 | 96.2 | 37.3 | 9.8 | 47.1 | ||||||||||||||||||
|
Contributions to unfunded German
plans (a)
|
– | 24.3 | 24.3 | – | 26.0 | 26.0 | ||||||||||||||||||
|
Benefits
paid
|
(58.7 | ) | (36.2 | ) | (94.9 | ) | (59.9 | ) | (37.6 | ) | (97.5 | ) | ||||||||||||
|
Effect
of exchange rates
|
– | 22.8 | 22.8 | – | (56.8 | ) | (56.8 | ) | ||||||||||||||||
|
Other
|
(1.5 | ) | 0.5 | (1.0 | ) | – | 0.8 | 0.8 | ||||||||||||||||
|
Fair
value of assets at end of year
|
755.7 | 228.7 | 984.4 | 612.5 | 178.4 | 790.9 | ||||||||||||||||||
|
Funded
status
|
$ | (222.0 | ) | $ | (381.4 | )(a) | $ | (603.4 | ) | $ | (275.7 | ) | $ | (342.0 | )(a) | $ | (617.7 | ) | ||||||
|
(a)
|
The
German plans are unfunded and the liability is included in the company’s
consolidated balance sheets. Benefits are paid directly by the company to
the participants. The German plans represented $330.8 million and
$302.7 million of the total unfunded status at December 31, 2009
and 2008, respectively.
|
Amounts
recognized in the consolidated balance sheets for the funded status at
December 31 consisted of:
|
2009
|
2008
|
|||||||||||||||||||||||
|
($
in millions)
|
U.S.
|
Foreign
|
Total
|
U.S.
|
Foreign
|
Total
|
||||||||||||||||||
|
Prepaid
pension cost
|
$ | – | $ | 0.3 | $ | 0.3 | $ | – | $ | 4.6 | $ | 4.6 | ||||||||||||
|
Defined
benefit pension liabilities
|
(222.0 | ) | (381.7 | ) | (603.7 | ) | (275.7 | ) | (346.6 | ) | (622.3 | ) | ||||||||||||
| $ | (222.0 | ) | $ | (381.4 | ) | $ | (603.4 | ) | $ | (275.7 | ) | $ | (342.0 | ) | $ | (617.7 | ) | |||||||
Amounts
recognized in accumulated other comprehensive earnings (loss) at
December 31 consisted of:
|
2009
|
2008
|
|||||||||||||||||||||||
|
($
in millions)
|
U.S.
|
Foreign
|
Total
|
U.S.
|
Foreign
|
Total
|
||||||||||||||||||
|
Net
loss
|
$ | 379.0 | $ | 65.0 | $ | 444.0 | $ | 396.0 | $ | 21.0 | $ | 417.0 | ||||||||||||
|
Net
prior service credit
|
7.1 | (3.5 | ) | 3.6 | 2.4 | (3.6 | ) | (1.2 | ) | |||||||||||||||
|
Tax
effect and foreign exchange rates
|
(152.4 | ) | (31.4 | ) | (183.8 | ) | (157.3 | ) | (11.8 | ) | (169.1 | ) | ||||||||||||
| $ | 233.7 | $ | 30.1 | $ | 263.8 | $ | 241.1 | $ | 5.6 | $ | 246.7 | |||||||||||||
Page 63
of 97
Ball
Corporation and Subsidiaries
Notes
to Consolidated Financial Statements
|
17.
|
Employee
Benefit Obligations (continued)
|
The
accumulated benefit obligation for all U.S. defined benefit pension plans was
$956 million and $873.1 million at December 31, 2009 and 2008,
respectively. The accumulated benefit obligation for all foreign defined benefit
pension plans was $550.8 million and $479.8 million at
December 31, 2009 and 2008, respectively. Following is the information for
defined benefit plans with an accumulated benefit obligation in excess of plan
assets at December 31:
|
2009
|
2008
|
|||||||||||||||||||||||
|
($
in millions)
|
U.S.
|
Foreign
|
Total
|
U.S.
|
Foreign
|
Total
|
||||||||||||||||||
|
Projected
benefit obligation
|
$ | 977.7 | $ | 422.6 | $ | 1,400.3 | $ | 888.2 | $ | 476.8 | $ | 1,365.0 | ||||||||||||
|
Accumulated
benefit obligation
|
956.0 | 409.7 | 1,365.7 | 873.1 | 436.3 | 1,309.4 | ||||||||||||||||||
|
Fair
value of plan assets
|
755.7 | 81.9 | (a) | 837.6 | 612.5 | 130.2 | (a) | 742.7 | ||||||||||||||||
|
(a)
|
The
German plans are unfunded and, therefore, there is no fair value of plan
assets associated with them. The unfunded status of those plans was
$330.8 million and $302.7 million at December 31, 2009 and
2008, respectively.
|
Components
of net periodic benefit cost were:
|
2009
|
2008
|
2007
|
||||||||||||||||||||||||||||||||||
|
($
in millions)
|
U.S.
|
Foreign
|
Total
|
U.S.
|
Foreign
|
Total
|
U.S.
|
Foreign
|
Total
|
|||||||||||||||||||||||||||
|
Service
cost
|
$ | 42.5 | $ | 5.8 | $ | 48.3 | $ | 42.8 | $ | 8.0 | $ | 50.8 | $ | 40.9 | $ | 8.9 | $ | 49.8 | ||||||||||||||||||
|
Interest
cost
|
53.6 | 30.7 | 84.3 | 51.0 | 33.1 | 84.1 | 47.1 | 30.5 | 77.6 | |||||||||||||||||||||||||||
|
Expected
return on plan assets
|
(63.9 | ) | (14.1 | ) | (78.0 | ) | (64.0 | ) | (18.0 | ) | (82.0 | ) | (54.5 | ) | (18.5 | ) | (73.0 | ) | ||||||||||||||||||
|
Amortization
of prior service cost
|
0.8 | (0.3 | ) | 0.5 | 1.0 | (0.5 | ) | 0.5 | 0.9 | (0.5 | ) | 0.4 | ||||||||||||||||||||||||
|
Recognized
net actuarial loss
|
12.4 | 3.7 | 16.1 | 10.3 | 3.6 | 13.9 | 13.5 | 5.0 | 18.5 | |||||||||||||||||||||||||||
|
Curtailment
loss, including special termination benefits
|
1.2 | – | 1.2 | 11.1 | – | 11.1 | 0.8 | 2.1 | 2.9 | |||||||||||||||||||||||||||
|
Subtotal
|
46.6 | 25.8 | 72.4 | 52.2 | 26.2 | 78.4 | 48.7 | 27.5 | 76.2 | |||||||||||||||||||||||||||
|
Non-company
sponsored plans
|
1.5 | – | 1.5 | 1.6 | – | 1.6 | 1.3 | 0.1 | 1.4 | |||||||||||||||||||||||||||
|
Net
periodic benefit cost
|
$ | 48.1 | $ | 25.8 | $ | 73.9 | $ | 53.8 | $ | 26.2 | $ | 80.0 | $ | 50.0 | $ | 27.6 | $ | 77.6 | ||||||||||||||||||
The
estimated net loss and prior service cost for the defined benefit pension plans
that will be amortized from accumulated other comprehensive loss into net
periodic benefit cost during 2010 are $21.9 million and $1 million,
respectively.
Contributions
to the company’s defined benefit pension plans, not including the unfunded
German plans, are expected to be in the range of $55 million in 2010.
This estimate may change based on changes in the Pension Protection Act and
actual plan asset performance, among other factors. Benefit payments related to
these plans are expected to be $78 million, $80 million,
$83 million, $87 million and $91 million for the years ending
December 31, 2010 through 2014, respectively, and a total of $520 million
for the years 2015 through 2019. Payments to participants in the unfunded German
plans are expected to be approximately $24 million to $25 million in each
of the years 2010 through 2014 and a total of $113 million for the years
2015 through 2019.
Page 64
of 97
Ball
Corporation and Subsidiaries
Notes
to Consolidated Financial Statements
|
17.
|
Employee
Benefit Obligations (continued)
|
Weighted
average assumptions used to determine benefit obligations for the North American
plans at December 31 were:
|
U.S.
|
Canada
|
||||||||||
|
2009
|
2008
|
2007
|
2009
|
2008
|
2007
|
||||||
|
Discount
rate
|
6.00%
|
6.25%
|
6.25%
|
5.00%
|
7.00%
|
5.75%
|
|||||
|
Rate
of compensation increase
|
4.80%
|
4.80%
|
4.80%
|
3.50%
|
3.50%
|
3.50%
|
|||||
Weighted
average assumptions used to determine benefit obligations for the European plans
at December 31 were:
|
United
Kingdom
|
Germany
|
||||||||||
|
2009
|
2008
|
2007
|
2009
|
2008
|
2007
|
||||||
|
Discount
rate
|
5.75%
|
6.10%
|
5.70%
|
5.00%
|
5.75%
|
5.50%
|
|||||
|
Rate
of compensation increase
|
4.25%
|
3.80%
|
4.00%
|
2.75%
|
2.75%
|
2.75%
|
|||||
|
Pension
increase (a)
|
3.40%/2.50%
|
2.50%
|
3.10%
|
1.75%
|
1.75%
|
1.75%
|
|||||
|
(a)
|
For
the United Kingdom, the first percentage in 2009 applies to benefits
earned between January 1, 1995, and June 30, 2008, and the
second percentage applies to benefits earned after June 30,
2008.
|
The discount and
compensation increase rates used above to determine the benefit obligations at
December 31, 2009, will be used to determine net periodic benefit cost for
2010. A reduction of the expected return on pension assets assumption by
one quarter of a percentage point would result in an approximate $2.7 million
increase in the 2010 pension expense, while a quarter of a percentage point
reduction in the discount rate applied to the pension liability would result in
an estimated $3.2 million of additional pension expense in
2010.
Weighted
average assumptions used to determine net periodic benefit cost for the North
American plans for the years ended December 31 were:
|
U.S.
|
Canada
|
||||||||||
|
2009
|
2008
|
2007
|
2009
|
2008
|
2007
|
||||||
|
Discount
rate
|
6.25%
|
6.25%
|
6.00%
|
7.00%
|
5.75%
|
5.00%
|
|||||
|
Rate
of compensation increase
|
4.80%
|
4.80%
|
4.80%
|
3.50%
|
3.50%
|
3.50%
|
|||||
|
Expected
long-term rate of return on assets
|
8.25%
|
8.25%
|
8.25%
|
7.26%
|
6.76%
|
6.82%
|
|||||
Weighted
average assumptions used to determine net periodic benefit cost for the European
plans for the years ended December 31 were:
|
United
Kingdom
|
Germany
|
||||||||||
|
2009
|
2008
|
2007
|
2009
|
2008
|
2007
|
||||||
|
Discount
rate
|
6.10%
|
5.70%
|
5.00%
|
5.75%
|
5.50%
|
4.50%
|
|||||
|
Rate
of compensation increase
|
3.80%
|
4.00%
|
4.00%
|
2.75%
|
2.75%
|
2.75%
|
|||||
|
Pension
increase (a)
|
2.90%/2.50%
|
3.10%
|
2.75%
|
1.75%
|
1.75%
|
1.75%
|
|||||
|
Expected
long-term rate of return on assets
|
7.00%
|
7.25%
|
7.25%
|
N/A
|
N/A
|
N/A
|
|||||
|
(a)
|
For
the United Kingdom, the first percentage in 2009 applies to benefits
earned between January 1, 1995, and June 30, 2008, and the
second percentage applies to benefits earned after June 30,
2008.
|
Current
financial accounting standards require that the discount rates used to calculate
the actuarial present value of pension and other postretirement benefit
obligations reflect the time value of money as of the measurement date of
the benefit obligation and reflect the rates of return currently available on
high quality fixed income securities whose cash flows (via coupons and
maturities) match the timing and amount of future benefit payments of the plan.
In addition, changes in the discount rate assumption should reflect changes in
the general level of interest rates.
Page 65
of 97
Ball
Corporation and Subsidiaries
Notes
to Consolidated Financial Statements
|
17.
|
Employee
Benefit Obligations (continued)
|
In
selecting the U.S. discount rate for December 31, 2009, several benchmarks
were considered, including Moody's long-term corporate bond yield for Aa
bonds and the Citigroup Pension Liability Index. In addition, the expected cash
flows from the plans were modeled relative to the Citigroup Pension Discount
Curve and matched to cash flows from a portfolio of bonds rated Aa or
better. When determining the appropriate discount rate, the company
contemplated the impact of lump sum payment options under its U.S. plans when
considering the appropriate yield curve. In Canada the markets for locally
denominated high-quality, longer term corporate bonds are relatively thin. As a
result, the approach taken in Canada was to use yield curve spot rates to
discount the respective benefit cash flows and to compute the underlying
constant bond yield equivalent. The Canadian discount rate at December 31,
2009, was selected based on a review of the expected benefit payments for each
of the Canadian defined benefit plans over the next 60 years and then
discounting the resulting cash flows to the measurement date using the AA
corporate bond spot rates to determine the equivalent level discount rate. In
the United Kingdom and Germany, the company and its actuarial consultants
considered the applicable iBoxx 15+ year AA corporate bond yields for the
respective markets and determined a rate consistent with those expectations. In
all countries, the discount rates selected for December 31, 2009, were
based on the range of values obtained from cash flow specific methods,
together with the changes in the general level of interest rates reflected by
the benchmarks.
The
assumption related to the expected long-term rate of return on plan assets
reflects the average rate of earnings expected on the funds invested to provide
for the benefits over the life of the plans. The assumption was based upon
Ball’s pension plan asset allocations, investment strategies and the views of
investment managers and other large pension plan sponsors. Some reliance was
placed on historical asset returns of our plans. An asset-return model was used
to project future asset returns using simulation and asset class correlation.
The analysis included expected future risk premiums, forward-looking return
expectations derived from the yield on long-term bonds and the price earnings
ratios of major stock market indexes, expected inflation and real risk-free
interest rate assumptions and the fund’s expected asset allocation.
The
expected long-term rates of return on assets were calculated by applying the
expected rate of return to a market related value of plan assets at the
beginning of the year, adjusted for the weighted average expected contributions
and benefit payments. The market related value of plan assets used to calculate
expected return was $968.1 million for 2009, $1,052.4 million for 2008
and $853 million for 2007.
Included
in other comprehensive earnings, net of the related tax effect, were increases
in pension and other postretirement item obligations of $22.6 million and
$147.8 million in 2009 and 2008, respectively, and a decrease in pension and
other postretirement item obligations of $57.9 million in
2007.
For
pension plans, accumulated gains and losses in excess of a 10 percent
corridor and the prior service cost are amortized over the average remaining
service period of active participants.
Defined
Benefit Pension Plan Assets
Policies
and Allocation Information
Investment
policies and strategies for the plan assets in the U.S., Canada and the United
Kingdom are established by pension investment committees of the company and
its relevant subsidiaries and include the following common themes: (1) to
provide for long-term growth of principal income without undue exposure to risk,
(2) to minimize contributions to the plans, (3) to minimize and stabilize
pension expense and (4) to achieve a rate of return above the market average for
each asset class over the long term. The pension investment committees are
required to regularly, but no less frequently than once annually, review asset
mix and asset performance, as well as the performance of the investment
managers. Based on their reviews, which are generally conducted quarterly,
investment policies and strategies are revised as appropriate.
Page 66
of 97
Ball
Corporation and Subsidiaries
Notes
to Consolidated Financial Statements
|
17.
|
Employee
Benefit Obligations (continued)
|
Target
asset allocations in the U.S. and Canada are set using a minimum and maximum
range for each asset category as a percent of the total funds’ market value.
Assets contributed to the United Kingdom plans are invested using established
percentages. Following are the target asset allocations established as of
December 31, 2009:
|
U.S.
|
Canada
(c)
|
United
Kingdom
|
||||||||||
|
Cash
and cash equivalents
|
0-10 | % | 0-10 | % | – | |||||||
|
Equity
securities
|
30-75 | % (a) | 20-40 | % (d) | 56-62 | % (e) | ||||||
|
Fixed
income securities
|
25-70 | % (b) | 65-75 | % | 38-44 | % | ||||||
|
Alternative
investments
|
0-35 | % | – | – | ||||||||
|
a)
|
Equity
securities may consist of: (1) up to 25 percent large cap
equities, (2) up to 10 percent mid cap equities, (3) up to
10 percent small cap equities, (4) up to 35 percent foreign
equities and (5) up to 35 percent special equities. Holdings in
Ball Corporation common stock or Ball bonds cannot exceed 5 percent
of the trust’s assets.
|
|
(b)
|
Debt
securities may include up to 10 percent high yield non-investment
grade bonds, up to 10 percent bank loans and up to 15 percent
international bonds.
|
|
(c)
|
Does
not include assets held in immunized portfolios designated for closed
plants. These portfolios must consist of at least 85 percent fixed
income securities and up to 15 percent cash and short-term
investments. They can consist of up to 100 percent Canadian federal
or provincial securities. The immunized portfolio assets represented
approximately 45 percent of the total Canadian assets at
December 31, 2009.
|
|
(d)
|
May
include between 10 percent and 20 percent non-Canadian equity
securities.
|
|
(e)
|
Equity
securities must consist of United Kingdom securities and up to
44 percent foreign
securities.
|
The
actual weighted average asset allocations for Ball’s defined benefit pension
plans, which individually are within the established targets for each country,
were as follows at December 31:
|
2009
|
2008
|
|||||||
|
Cash
and cash equivalents
|
3 | % | 1 | % | ||||
|
Equity
securities
|
40 | % | 43 | % | ||||
|
Fixed
income securities
|
47 | % | 47 | % | ||||
|
Alternative
investments
|
10 | % | 9 | % | ||||
| 100 | % | 100 | % | |||||
Fair
Value Measurements of Pension Plan Assets
Following
is a description of the valuation methodologies used for pension assets measured
at fair value:
Cash and cash equivalents:
Cash and cash equivalents consist of cash on deposit with brokers and short-term
U.S. Treasury money market funds and are net of receivables and payables for
securities traded at the period end but not yet settled. All cash and cash
equivalents are stated at cost, which approximates fair value.
Corporate equity securities:
Valued at the closing price reported on the active market on which the
individual security is traded.
U.S. government and agency
securities: Valued at closing price reported in the active market in
which the individual security is traded. Other U.S. governmental and agency
securities are valued using the pricing of similar agency issues, live trading
feeds from several vendors and/or benchmark yields.
Corporate bonds and notes:
Valued using market inputs including benchmark yields, reported trades,
broker/dealer quotes, issuer spreads, two-sided markets, benchmark securities,
bids, offers and reference data including market research publications. Inputs
may be prioritized differently at certain times based on market
conditions.
Mutual funds: Valued at the
net asset value (NAV) of shares held by the plans at year end. The NAV is
calculated based on the underlying shares and investments held by the
fund.
Page 67
of 97
Ball
Corporation and Subsidiaries
Notes
to Consolidated Financial Statements
|
17.
|
Employee
Benefit Obligations (continued)
|
Limited partnerships and
other: Certain of the partnership investments receive fair market
valuations on a quarterly basis. Certain other partnerships invest in
market-traded securities, both on a long and short basis. These investments are
valued using quoted market prices. For the partnership that invests in timber
properties, a detailed valuation is performed by an independent appraisal firm
every three years. In the interim years, the investment manager updates the
independently prepared valuation for property value changes, timber growth,
harvesting, etc.
The
preceding methods described may produce a fair value calculation that may not be
indicative of net realizable value or reflective of future fair
values. Furthermore, although the Plan believes its valuation methods are
appropriate and consistent with other market participants, the use of different
methodologies or assumptions to determine the fair value of certain financial
instruments could result in a different fair value measurement at the reporting
date.
The
company’s assessment of the significance of a particular input to the fair value
measurement requires judgment and may affect the valuation of the fair value of
assets and liabilities and their placement within the fair value hierarchy
levels. The levels assigned to the defined benefit plan assets as of
December 31, 2009, are summarized in the tables below:
|
($
in millions)
|
Level
1
|
Level
2
|
Level
3
|
Total
|
||||||||||||
|
U.S.
pension assets, at fair value:
|
||||||||||||||||
|
Cash
and cash equivalents
|
$ | – | $ | 48.7 | $ | – | $ | 48.7 | ||||||||
|
Corporate
equity securities
|
121.5 | – | – | 121.5 | ||||||||||||
|
U.S.
government and agency securities
|
50.4 | 95.8 | – | 146.2 | ||||||||||||
|
Corporate
bonds and notes
|
– | 211.2 | – | 211.2 | ||||||||||||
|
Mutual
funds
|
– | 192.2 | – | 192.2 | ||||||||||||
|
Limited
partnerships and other
|
– | 1.7 | 34.2 | 35.9 | ||||||||||||
|
Total
assets
|
$ | 172.9 | $ | 548.6 | $ | 34.2 | $ | 755.7 | ||||||||
The
following is a reconciliation of the Level 3 assets for the year ended
December 31, 2009:
|
Balance
at December 31, 2008
|
$ | 34.7 | ||
|
Actual
return on plan assets relating to assets still held at the
reporting date
|
(0.6 | ) | ||
|
Purchases,
sales and settlements
|
0.1 | |||
|
Balance
at December 31, 2009
|
$ | 34.2 |
|
Level
2
|
||||
|
Canadian
pension assets, at fair value:
|
||||
|
Equity
mutual funds
|
$ | 15.8 | ||
|
Fixed
income mutual funds
|
35.9 | |||
|
Fixed
income securities
|
43.5 | |||
|
Total
assets
|
$ | 95.2 | ||
|
Level
2
|
||||
|
U.K.
pension assets, at fair value:
|
||||
|
U.K.
equity mutual funds
|
$ | 46.3 | ||
|
Foreign
equity mutual funds
|
34.2 | |||
|
U.K.
fixed income mutual funds
|
53.0 | |||
|
Net
assets
|
$ | 133.5 | ||
Page 68
of 97
Ball
Corporation and Subsidiaries
Notes
to Consolidated Financial Statements
|
17.
|
Employee
Benefit Obligations (continued)
|
Other
Postemployment Benefits
The
company sponsors defined benefit and defined contribution postretirement health
care and life insurance plans for substantially all U.S. and Canadian employees.
Employees may also qualify for long-term disability, medical and life insurance
continuation and other postemployment benefits upon termination of active
employment prior to retirement. All of the Ball-sponsored postretirement health
care and life insurance plans are unfunded and, with the exception of life
insurance benefits, are self-insured.
In
Canada, the company provides supplemental medical and other benefits in
conjunction with Canadian provincial health care plans. Most U.S. salaried
employees who retired prior to 1993 are covered by noncontributory defined
benefit medical plans with capped lifetime benefits. Ball provides a fixed
subsidy toward each retiree’s future purchase of medical insurance for U.S.
salaried and substantially all nonunion hourly employees retiring after January
1, 1993. Life insurance benefits are noncontributory. Ball has no commitments to
increase benefits provided by any of the postemployment benefit
plans.
An
analysis of the change in other postretirement benefit accruals for 2009 and
2008 follows:
|
($
in millions)
|
2009
|
2008
|
||||||
|
Change
in benefit obligation:
|
||||||||
|
Benefit
obligation at prior year end
|
$ | 177.7 | $ | 178.0 | ||||
|
Service
cost
|
3.0 | 3.2 | ||||||
|
Interest
cost
|
10.8 | 10.5 | ||||||
|
Benefits
paid
|
(12.8 | ) | (9.5 | ) | ||||
|
Net
actuarial loss (gain)
|
8.5 | (0.3 | ) | |||||
|
Business
acquisition
|
1.6 | – | ||||||
|
Effect
of exchange rates and other
|
3.0 | (4.2 | ) | |||||
|
Benefit
obligation at year end
|
191.8 | 177.7 | ||||||
|
Change
in plan assets:
|
||||||||
|
Fair
value of assets at prior year end
|
– | – | ||||||
|
Benefits
paid
|
(12.9 | ) | (10.2 | ) | ||||
|
Employer
contributions
|
12.8 | 9.5 | ||||||
|
Medicare
Part D subsidy
|
0.1 | 0.7 | ||||||
|
Fair
value of assets at end of year
|
– | – | ||||||
|
Funded
status
|
$ | (191.8 | ) | $ | (177.7 | ) | ||
Components
of net periodic benefit cost were:
|
($
in millions)
|
2009
|
2008
|
2007
|
|||||||||
|
Service
cost
|
$ | 3.0 | $ | 3.2 | $ | 3.1 | ||||||
|
Interest
cost
|
10.8 | 10.5 | 10.2 | |||||||||
|
Amortization
of prior service cost
|
0.4 | 0.3 | 0.4 | |||||||||
|
Recognized
net actuarial gain
|
0.4 | 0.4 | 0.6 | |||||||||
|
Net
periodic benefit cost
|
$ | 14.6 | $ | 14.4 | $ | 14.3 | ||||||
The
estimated net loss and prior service cost for the other postretirement plans
that will be amortized from accumulated other comprehensive loss into net
periodic benefit cost during 2010 are $1.1 million and $0.4 million,
respectively.
The
assumptions used for the determination of benefit obligations and net periodic
benefit cost were the same as those used for the U.S. and Canadian defined
benefit pension plans. For other postretirement benefits, accumulated gains and
losses, the prior service cost and the transition asset are amortized over the
average remaining service period of active participants.
Page 69
of 97
Ball
Corporation and Subsidiaries
Notes
to Consolidated Financial Statements
|
17.
|
Employee
Benefit Obligations (continued)
|
For the
U.S. health care plans at December 31, 2009, a 9 percent health care
cost trend rate was used for pre-65 and post-65 benefits, and trend rates were
assumed to decrease to 5 percent in 2014 and remain at that level
thereafter. For the Canadian plans, a 8.5 percent health care cost trend
rate was used, which was assumed to decrease to 5 percent by 2017 and
remain at that level in subsequent years.
Health
care cost trend rates can have an effect on the amounts reported for the health
care plan. A one-percentage point change in assumed health care cost trend rates
would increase or decrease the total of service and interest cost by
$0.4 million and the postretirement benefit obligation by approximately
$5.7 million to $6.5 million.
Other
Benefit Plans
The
company matches U.S. salaried employee contributions to the 401(k) plan with
shares of Ball common stock up to 100 percent of the first
3 percent of a participant’s salary plus 50 percent of the next
2 percent. The expense associated with the company match amounted to
$21.8 million, $20.7 million and $20.8 million for 2009, 2008 and
2007, respectively.
In
addition, substantially all employees within the company’s aerospace and
technologies segment who participate in Ball’s 401(k) plan receive a
performance-based matching cash contribution of up to 4 percent of base
salary. The company recognized $8.4 million and $8.7 million of
additional compensation expense related to this program for the years 2008 and
2007, respectively. There was no matching contribution for 2009.
In 2009
the company’s 401(k) plan matching contributions could not exceed $9,800 per
employee and the limit on employee contributions was $16,500 per
employee.
|
18.
|
Shareholders’
Equity
|
At
December 31, 2009, the company had 550 million shares of common stock and
15 million shares of preferred stock authorized, both without par value.
Preferred stock includes 550,000 authorized but unissued shares designated as
Series A Junior Participating Preferred Stock.
Under the
company's shareholder Rights Agreement dated July 26, 2006, as amended, one
preferred stock purchase right (Right) is attached to each outstanding share of
Ball Corporation common stock. Subject to adjustment, each Right entitles the
registered holder to purchase from the company one one-thousandth of a share of
Series A Junior Participating Preferred Stock at an exercise price of $185 per
Right. Subject to certain limited exceptions for passive investors, if a person
or group acquires 10 percent or more of the company's outstanding common
stock (or upon occurrence of certain other events), the Rights (other than those
held by the acquiring person) become exercisable and generally entitle the
holder to purchase shares of Ball Corporation common stock at a 50 percent
discount. The Rights, which expire in 2016, are redeemable by the company at a
redemption price of $0.001 cent per Right and trade with the common stock.
Exercise of such Rights would cause substantial dilution to a person or group
attempting to acquire control of the company without the approval of Ball’s
board of directors. The Rights would not interfere with any merger or other
business combinations approved by the board of directors.
The
company’s share repurchases, net of issuances, totaled $5.1 million in
2009, $299.6 million in 2008 and $211.3 million in 2007. The net
repurchases in 2008 included a $31 million settlement on January 7, 2008,
of a forward contract entered into in December 2007 for the repurchase of
675,000 shares. Additionally, in 2007 net repurchases included a
$51.9 million settlement on January 5, 2007, of a forward
contract entered into in December 2006 for the repurchase of
1,200,000 shares.
On
December 12, 2007, in a privately negotiated transaction, Ball entered into
an accelerated share repurchase agreement to buy $100 million of its common
shares using cash on hand and available borrowings. The company advanced the
$100 million on January 7, 2008, and received 2,038,657 shares,
which represented 90 percent of the total shares as calculated using the
previous day’s closing price. The agreement was settled on July 11, 2008, and
the company received an additional 138,521 shares.
In
connection with the employee stock purchase plan, the company contributes
20 percent of up to $500 of each participating employee’s monthly payroll
deduction toward the purchase of Ball Corporation common stock. Company
contributions for this plan were $3 million in 2009 and $3.2 million each
in 2008 and 2007.
Page 70
of 97
Ball
Corporation and Subsidiaries
Notes
to Consolidated Financial Statements
|
18.
|
Shareholders’
Equity (continued)
|
Accumulated
Other Comprehensive Earnings (Loss)
The
activity related to accumulated other comprehensive earnings (loss) was as
follows:
|
($
in millions)
|
Foreign
Currency
Translation
|
Pension
and
Other
Postretirement
Items,
Net
of Tax
|
Effective
Derivatives,
Net
of Tax
|
Gain
on
Available
for
Sale
Securities,
Net
of Tax
|
Accumulated
Other
Comprehensive
Earnings
(Loss)
|
|||||||||||||||
|
December
31, 2006
|
$ | 131.8 | $ | (161.9 | ) | $ | 0.6 | $ | – | $ | (29.5 | ) | ||||||||
|
2007
change
|
90.0 | 57.9 | (11.5 | ) | – | 136.4 | ||||||||||||||
|
December
31, 2007
|
221.8 | (104.0 | ) | (10.9 | ) | – | 106.9 | |||||||||||||
|
2008
change
|
(48.2 | ) | (147.8 | ) | (93.4 | ) | – | (289.4 | ) | |||||||||||
|
December
31, 2008
|
173.6 | (251.8 | ) | (104.3 | ) | – | (182.5 | ) | ||||||||||||
|
2009
change
|
6.6 | (22.6 | ) | 127.7 | (a) | 7.0 | 118.7 | |||||||||||||
|
December
31, 2009
|
$ | 180.2 | $ | (274.4 | ) | $ | 23.4 | $ | 7.0 | $ | (63.8 | ) | ||||||||
|
|
(a)
|
The
change in accumulated other comprehensive earnings (loss) for effective
derivatives was as follows for the year ended December 31,
2009:
|
|
Losses
reclassified into earnings (Note 21):
|
||||
|
Commodity
contracts
|
$ | 96.4 | ||
|
Interest
rate and foreign currency contracts
|
7.4 | |||
| 103.8 | ||||
|
Change
in fair value of cash flow hedges:
|
||||
|
Commodity
contracts
|
93.0 | |||
|
Interest
rate and foreign currency contracts
|
(6.2 | ) | ||
|
Foreign
currency and tax impacts
|
(62.9 | ) | ||
| $ | 127.7 | |||
Management’s
intention is to indefinitely reinvest foreign earnings. Therefore, no taxes have
been provided on the foreign currency translation component for any period. The
change in the pension and other postretirement items is presented net of related
tax benefits of $15.2 million and $93.9 million for 2009 and 2008,
respectively, and related tax expense of $31.3 million for 2007. The change
in the effective financial derivatives is presented net of related tax expense
of $58.9 million in 2009 and related tax benefits of $42.5 million and
$3.2 million for 2008 and 2007, respectively.
Page 71
of 97
Ball
Corporation and Subsidiaries
Notes
to Consolidated Financial Statements
|
19.
|
Stock-Based
Compensation Programs
|
The
company has shareholder-approved stock option plans under which options to
purchase shares of Ball common stock have been granted to officers and employees
at the market value of the stock at the date of grant. Payment must be made at
the time of exercise in cash or with shares of stock owned by the option holder,
which are valued at fair market value on the date exercised. In general, options
are exercisable in four equal installments commencing one year from the date of
grant and terminating 10 years from the date of grant. A summary of stock option
activity for the year ended December 31, 2009, follows:
|
Outstanding
Options
|
Nonvested
Options
|
|||||||||||||||
|
Number
of
Shares
|
Weighted
Average
Exercise
Price
|
Number
of
Shares
|
Weighted
Average
Grant
Date
Fair Value
|
|||||||||||||
|
Beginning
of year
|
5,227,647 | $ | 35.72 | 1,927,197 | $ | 11.78 | ||||||||||
|
Granted
|
1,236,300 | 40.08 | 1,236,300 | 10.65 | ||||||||||||
|
Vested
|
(615,704 | ) | 11.54 | |||||||||||||
|
Exercised
|
(572,233 | ) | 21.34 | |||||||||||||
|
Canceled/forfeited
|
(77,526 | ) | 46.23 | (77,526 | ) | 11.52 | ||||||||||
|
End
of period
|
5,814,188 | 37.92 | 2,470,267 | 11.28 | ||||||||||||
|
Vested
and exercisable, end of period
|
3,343,921 | 33.05 | ||||||||||||||
|
Reserved
for future grants
|
2,244,508 | |||||||||||||||
The
options granted in January 2009 included 740,584 stock-settled stock
appreciation rights, which have the same terms as the stock options. The
weighted average remaining contractual term for all options outstanding at
December 31, 2009, was 6.1 years and the aggregate intrinsic value
(difference in exercise price and closing price at that date) was
$80.1 million. The weighted average remaining contractual term for options
vested and exercisable at December 31, 2009, was 4.5 years and the
aggregate intrinsic value was $62.4 million. The company received
$12.2 million from options exercised during 2009. The intrinsic value
associated with these exercises was $15 million, and the associated tax
benefit reported as other financing activities in the consolidated statement of
cash flows was $5.5 million. The total fair value of options vested during 2009,
2008 and 2007 was $7.1 million, $6 million and $5 million,
respectively.
These
options cannot be traded in any equity market. However, based on the
Black-Scholes option pricing model, options granted in 2009, 2008 and 2007 have
estimated weighted average fair values at the date of grant of $10.65 per share,
$12.82 per share and $11.22 per share, respectively. The actual value an
employee may realize will depend on the excess of the stock price over the
exercise price on the date the option is exercised. Consequently, there is
no assurance that the value realized by an employee will be at or near the
value estimated. The fair values were estimated using the following weighted
average assumptions:
|
2009
Grants
|
2008
Grants
|
2007
Grants
|
|||
|
Expected
dividend yield
|
1.0%
|
0.80%
|
0.81%
|
||
|
Expected
stock price volatility
|
29.83%
|
24.48%
|
17.94%
|
||
|
Risk-free
interest rate
|
1.74%
|
2.99%
|
4.55%
|
||
|
Expected
life of options
|
5.25
years
|
5.25
years
|
4.75
years
|
In
addition to stock options, the company issues to officers and certain employees
restricted shares and restricted stock units, which vest over various periods.
Other than the performance-contingent grants discussed below, such restricted
shares and restricted stock units generally vest in equal installments over five
years. Compensation cost is recorded based upon the fair value of the
shares at the grant date.
Page 72
of 97
Ball
Corporation and Subsidiaries
Notes
to Consolidated Financial Statements
|
19.
|
Stock-Based
Compensation Programs (continued)
|
To
encourage certain senior management employees and outside directors to invest in
Ball stock, Ball adopted a deposit share program in March 2001 (subsequently
amended and restated in April 2004) that matches purchased shares with
restricted shares. In general, restrictions on the matching shares lapse at the
end of four years from date of grant, or earlier in stages if established share
ownership guidelines are met, assuming the relevant qualifying purchased shares
are not sold or transferred prior to that time. Grants under the plan are
accounted for as equity awards and compensation expense is recorded based upon
the closing market price of the shares at the grant date. The company recorded
$1.6 million, $3.8 million and $6.5 million of expense in
connection with this program in 2009, 2008 and 2007, respectively. No awards
have been made since April 2007.
The
company’s board of directors grants performance-contingent restricted stock
units to key employees, which will cliff-vest if the company’s return on average
invested capital during either a 36-month or 33-month performance period is
equal to or exceeds the company’s cost of capital. If the performance goals are
not met, the shares will be forfeited. Current assumptions are that the
performance targets will be met and, accordingly, grants under the plan are
being accounted for as equity awards and compensation expense is recorded based
upon the closing market price of the shares at the grant date. On a quarterly
basis, the company reassesses the probability of the goals being met and adjusts
compensation expense as appropriate. No such adjustment was considered necessary
at the end of 2009 for any grants. Restricted stock units granted under this
program included 193,450 units in January 2009, 246,650 units in
April 2008 and 170,000 units in April 2007. The expense associated with the
performance-contingent grants totaled $9.9 million, $6.2 million and
$2.2 million in 2009, 2008 and 2007, respectively.
For the
years ended December 31, 2009, 2008 and 2007, the company recognized in
selling, general and administrative expenses pretax expense of
$26.5 million ($16 million after tax), $20.5 million
($12.4 million after tax) and $15.9 million ($9.6 million after tax),
respectively, for share-based compensation arrangements. These amounts
represented $0.17 per both basic and diluted share in 2009, $0.13 per both
basic and diluted share in 2008; and $0.10 per basic share and $0.09 per
diluted share in 2007. At December 31, 2009, there was $36.2 million
of total unrecognized compensation cost related to nonvested share-based
compensation arrangements. This cost is expected to be recognized in earnings
over a weighted average period of 2.2 years.
|
20.
|
Earnings
Per Share
|
|
Years
ended December 31,
|
||||||||||||
|
($
in millions, except per share amounts; shares in
thousands)
|
2009
|
2008
|
2007
|
|||||||||
|
Diluted
Earnings per Share:
|
||||||||||||
|
Net
earnings attributable to Ball Corporation
|
$ | 387.9 | $ | 319.5 | $ | 281.3 | ||||||
|
Weighted
average common shares
|
93,786 | 95,857 | 101,186 | |||||||||
|
Effect
of dilutive securities
|
1,203 | 1,162 | 1,574 | |||||||||
|
Weighted
average shares applicable to diluted
earnings per share
|
94,989 | 97,019 | 102,760 | |||||||||
|
Diluted
earnings per share
|
$ | 4.08 | $ | 3.29 | $ | 2.74 | ||||||
Certain
options were excluded from the diluted earnings per share calculation because
they were anti-dilutive (i.e., the sum of the proceeds, including the
unrecognized compensation, exceeded the average closing stock price for the
period). The options excluded totaled 2,863,914 in 2009; 2,484,579 in 2008; and
1,396,325 in 2007.
Information
needed to compute basic earnings per share is provided in the consolidated
statements of earnings.
Page 73
of 97
Ball
Corporation and Subsidiaries
Notes
to Consolidated Financial Statements
|
21.
|
Financial
Instruments and Risk Management
|
Policies
and Procedures
In the
ordinary course of business, Ball employs established risk management policies
and procedures, which seek to reduce Ball’s exposure to fluctuations in
commodity prices, interest rates, foreign currencies and prices of the company’s
common stock in regard to common share repurchases, although there can be no
assurance that these policies and procedures will be successful. Although the
instruments utilized involve varying degrees of credit, market and interest
risk, the counterparties to the agreements are expected to perform fully under
the terms of the agreements. The company monitors counterparty credit risk,
including lenders, on a regular basis, but Ball cannot be certain that all risks
will be discerned or that its risk management policies and procedures will
always be effective.
Commodity
Price Risk
Ball’s
metal beverage container operations in North America, Europe and Asia manage
commodity price risk in connection with market price fluctuations of aluminum
ingot through two different methods. First, the company enters into container
sales contracts that include aluminum ingot-based pricing terms that generally
reflect price fluctuations under our commercial supply contracts for aluminum
sheet purchases. The terms include fixed, floating or pass-through aluminum
ingot component pricing. This matched pricing affects most of Ball’s North
American metal beverage packaging net sales. Second, Ball uses certain
derivative instruments such as option and forward contracts as cash flow hedges
of commodity price risk where there is not a pass-through arrangement in the
sales contract to match underlying purchase volumes and pricing with sales
volumes and pricing.
Most of
the plastic packaging, Americas, sales contracts include provisions to fully
pass through resin cost changes. As a result, Ball has minimal exposure related
to changes in the cost of plastic resin. Most metal food and household products
packaging, Americas, sales contracts either include provisions permitting Ball
to pass through some or all steel cost changes incurred, or they incorporate
annually negotiated steel costs. In 2009 and 2008, Ball was able to pass through
to customers the majority of steel cost increases. Ball anticipates at this time
that it will be able to pass through the majority of the steel price increases
that occur over the next 12 months.
The company had aluminum contracts limiting its aluminum exposure with notional amounts of approximately $1.1 billion and $1.4 billion at December 31, 2009 and 2008, respectively. The aluminum contracts include derivative instruments that are undesignated and receive mark-to-market accounting, as well as cash flow hedges that offset sales contracts of various terms and lengths. Cash flow hedges relate to forecasted transactions that expire within the next four years. Included in shareholders’ equity at December 31, 2009, within accumulated other comprehensive earnings is a net after-tax gain of $27.2 million associated with these contracts. However, a net loss of $2.9 million is expected to be recognized in the consolidated statement of earnings during the next 12 months, which will be passed through to customers by higher revenue from sales contracts resulting in no earnings impact to Ball.
During
the fourth quarter of 2008, Ball recorded a pretax charge of $11.5 million for
mark-to-market losses related to aluminum derivative instruments, which were no
longer deemed highly effective for hedge accounting purposes. These losses were
largely recovered in 2009 through customer contracts.
Page 74
of 97
Ball
Corporation and Subsidiaries
Notes
to Consolidated Financial Statements
|
21.
|
Financial
Instruments and Risk Management (continued)
|
Interest
Rate Risk
Ball’s
objective in managing exposure to interest rate changes is to minimize the
impact of interest rate changes on earnings and cash flows and to lower our
overall borrowing costs. To achieve these objectives, Ball uses a variety of
interest rate swaps, collars and options to manage our mix of floating and
fixed-rate debt. Interest rate instruments held by the company at
December 31, 2009, included pay-fixed interest rate swaps and interest rate
collars. Pay-fixed swaps effectively convert variable rate obligations to fixed
rate instruments. Collars create an upper and lower threshold within which
interest rates will fluctuate.
At
December 31, 2009, the company had outstanding interest rate swap
agreements in Europe with notional amounts of €135 million
($193.5 million) paying fixed rates expiring within the next three years.
An approximate $5.2 million net after-tax loss associated with these
contracts is included in accumulated other comprehensive earnings at
December 31, 2009, of which $4.6 million is expected to be recognized
in the consolidated statement of earnings during the next 12 months. At
December 31, 2009, the company had outstanding interest rate collars in the
U.S. totaling $50 million that expired at the end of January 2010.
Ball additionally has $100 million of forward rate agreements expiring in
February 2010. The value of these contracts in accumulated other
comprehensive earnings at December 31, 2009, was insignificant.
Approximately $2.1 million of net gain related to the termination or
dedesignation of hedges is included in accumulated other comprehensive earnings
at December 31, 2009. The amount recognized in 2009 earnings related to the
dedesignation of hedges was insignificant.
Ball also
uses inflation option contracts in Europe to limit the impacts from spikes in
inflation against certain multi-year contracts. At December 31, 2009, the
company had inflation options in Europe with notional amounts of
€115 million ($164.8 million). These options are undesignated for
hedge accounting purposes and receive mark-to-market accounting. The fair value
at December 31, 2009, was €1 million and the option contracts expire within
the next three years.
The fair
value of derivatives generally reflects the estimated amounts that we would pay
or receive upon termination of the contracts at December 31, taking into
account any unrealized gains and losses on open contracts. The unrealized pretax
loss on interest rate derivative contracts was $7.3 million and
$10.6 million at December 31, 2009 and 2008,
respectively.
Foreign
Currency Exchange Rate Risk
Ball’s
objective in managing exposure to foreign currency fluctuations is to protect
foreign cash flows and earnings from changes associated with foreign currency
exchange rate changes through the use of various derivative contracts. In
addition, at times Ball manages foreign earnings translation volatility through
the use of foreign currency option strategies, and the change in the fair value
of those options is recorded in the company’s net earnings. Ball’s foreign
currency translation risk results from the European euro, British pound,
Canadian dollar, Polish zloty, Chinese renminbi, Hong Kong dollar, Brazilian
real, Argentine peso and Serbian dinar. Ball faces currency exposures in our
global operations as a result of purchasing raw materials in U.S. dollars and,
to a lesser extent, in other currencies. Sales contracts are negotiated with
customers to reflect cost changes and, where there is not a foreign exchange
pass-through arrangement, the company uses forward and option contracts to
manage foreign currency exposures. Such contracts outstanding at December 31,
2009, expire within 12 months, and the amounts included in accumulated other
comprehensive earnings related to these contracts were not
significant.
Page 75
of 97
Ball
Corporation and Subsidiaries
Notes
to Consolidated Financial Statements
|
21.
|
Financial
Instruments and Risk Management (continued)
|
|
Fair
Value Measurements
|
Ball has
classified all applicable financial derivative assets and liabilities as Level 2
within the fair value hierarchy as of December 31, 2009 and 2008, and
presented those values in the table below. The company’s assessment of the
significance of a particular input to the fair value measurement requires
judgment and may affect the valuation of fair value assets and liabilities and
their placement within the fair value hierarchy levels. The fair value of debt
is discussed in Note 15 to the consolidated financial statements.
The
company uses closing spot and forward market prices as published by the London
Metal Exchange, the New York Mercantile Exchange, Reuters and Bloomberg to
determine the fair value of its aluminum, currency, energy, inflation and
interest rate spot and forward contracts. Option contracts are valued using
a Black-Scholes model with observable market inputs for aluminum, currency and
interest rates. We do not obtain multiple quotes to determine the value for our
financial instruments, as we value each of our financial instruments either
internally using a single valuation technique or from a reliable observable
market source. The company also does not adjust the value of its financial
instruments except in determining the fair value of a trade that settles in the
future by discounting the value to its present value using 12-month LIBOR as the
discount factor. Ball performs validations of our internally derived fair values
reported for our financial instruments on a quarterly basis utilizing
counterparty valuation statements. The company additionally evaluates
counterparty creditworthiness and, as of December 31, 2009, has not
identified any circumstances requiring that the reported values of our financial
instruments be adjusted.
At
December 31, 2009, the company’s investment in shares of DigitalGlobe (as
discussed in Note 4) was measured using Level 1 inputs, and net receivables
totaling $11.2 million related to the European scrap metal program were
classified as Level 2 within the fair value hierarchy.
|
Fair
Value of Derivative Instruments as of December 31,
2009
|
||||||||||||
|
($
in millions)
|
Derivatives
Designated
As
Hedging
Instruments
|
Derivatives
Not
Designated
As
Hedging
Instruments
|
Total
|
|||||||||
|
Assets:
|
||||||||||||
|
Commodity
contracts
|
$ | 36.2 | $ | 51.7 | $ | 87.9 | ||||||
|
Foreign
currency contracts
|
0.1 | 12.1 | 12.2 | |||||||||
|
Total
current derivative contracts
|
$ | 36.3 | $ | 63.8 | $ | 100.1 | ||||||
|
Noncurrent
commodity contracts
|
$ | 40.1 | $ | 39.1 | $ | 79.2 | ||||||
|
Other
contracts
|
− | 1.4 | 1.4 | |||||||||
|
Total
noncurrent derivative contracts
|
$ | 40.1 | $ | 40.5 | $ | 80.6 | ||||||
|
Liabilities:
|
||||||||||||
|
Commodity
contracts
|
$ | 27.5 | $ | 51.9 | $ | 79.4 | ||||||
|
Foreign
currency contracts
|
0.6 | 3.2 | 3.8 | |||||||||
|
Total
current derivative contracts
|
$ | 28.1 | $ | 55.1 | $ | 83.2 | ||||||
|
Noncurrent
commodity contracts
|
$ | 1.9 | $ | 38.9 | $ | 40.8 | ||||||
|
Interest
rate contracts
|
7.2 | − | 7.2 | |||||||||
|
Total
noncurrent derivative contracts
|
$ | 9.1 | $ | 38.9 | $ | 48.0 | ||||||
Page 76
of 97
Ball
Corporation and Subsidiaries
Notes
to Consolidated Financial Statements
|
21.
|
Financial
Instruments and Risk Management (continued)
|
The
following table provides the effects of derivative instruments in the
consolidated statement of earnings and on accumulated other comprehensive
earnings (loss) for the year ended December 31, 2009:
|
($
in millions)
|
Cash
Flow Hedge–
Reclassified
Amount
From
Other
Comprehensive
Earnings
(Loss) –
Gain
(Loss)
|
Gain
(Loss) on
Derivatives
Not
Designated
As
Hedge
Instruments
|
||||||
|
Commodity
contracts (a)
|
$ | (96.4 | ) | $ | (5.1 | ) | ||
|
Interest
rate contracts (b)
|
(8.1 | ) | – | |||||
|
Inflation option contracts
(c)
|
– | (0.1 | ) | |||||
|
Equity
contracts (d)
|
– | 3.2 | ||||||
|
Foreign
currency contracts (e)
|
0.7 | 6.5 | ||||||
|
Total:
|
$ | (103.8 | ) | $ | 4.5 | |||
|
(a)
|
Gains
and losses on commodity contracts are primarily recorded in cost of sales
in the consolidated statement of earnings. Virtually all these expenses
were passed through to our customers, resulting in no significant impact
to earnings.
|
|
(b)
|
Losses
on interest contracts are recorded in interest expense in the consolidated
statement of earnings.
|
|
(c)
|
Gains
and losses on inflation options are recorded in cost of sales in the
consolidated statement of earnings.
|
|
(d)
|
Gains
and losses on equity put option contracts are recorded in selling, general
and administrative expenses in the consolidated statement of
earnings.
|
|
(e)
|
Gains
and losses on foreign currency contracts to hedge sales of product are
recorded in cost of sales (amounting to a $2.6 million loss for the year,
excluding any ineffectiveness). Gains and losses on foreign currency
hedges used for translation between segments are reflected in selling,
general and administrative expenses in the consolidated statement of
earnings and amounted to a $9.8 million gain for the
year.
|
Gains and
losses resulting from ineffective cash flow hedges are not significant and are
included above in the gain or loss on derivatives not designated as hedge
instruments.
Page 77
of 97
Ball
Corporation and Subsidiaries
Notes
to Consolidated Financial Statements
|
22.
|
Quarterly
Results of Operations (Unaudited)
|
The
company’s fiscal years end on December 31 and the fiscal quarters generally
end on the Sunday nearest the calendar quarter end.
|
($
in millions, except per share amounts)
|
First
Quarter
|
Second
Quarter
|
Third
Quarter
|
Fourth
Quarter
|
Total
|
|||||||||||||||
|
2009
|
||||||||||||||||||||
|
Net
sales
|
$ | 1,585.6 | $ | 1,926.2 | $ | 1,969.1 | $ | 1,864.4 | $ | 7,345.3 | ||||||||||
|
Gross
profit (a)
|
215.3 | 272.2 | 298.0 | 238.4 | 1,023.9 | |||||||||||||||
|
Earnings
before taxes
|
$ | 100.4 | $ | 176.7 | $ | 150.6 | $ | 109.7 | $ | 537.4 | ||||||||||
|
Net
earnings
|
$ | 69.6 | $ | 133.5 | $ | 103.8 | $ | 81.5 | $ | 388.4 | ||||||||||
|
Net
earnings attributable to Ball Corporation
|
$ | 69.5 | $ | 133.3 | $ | 103.7 | $ | 81.4 | $ | 387.9 | ||||||||||
|
Basic
earnings per share (b)
|
$ | 0.74 | $ | 1.42 | $ | 1.10 | $ | 0.87 | $ | 4.14 | ||||||||||
|
Diluted
earnings per share (b)
|
$ | 0.73 | $ | 1.40 | $ | 1.09 | $ | 0.85 | $ | 4.08 | ||||||||||
|
2008
|
||||||||||||||||||||
|
Net
sales
|
$ | 1,740.2 | $ | 2,080.3 | $ | 2,008.2 | $ | 1,732.8 | $ | 7,561.5 | ||||||||||
|
Gross
profit (a)
|
236.6 | 275.3 | 264.0 | 184.9 | 960.8 | |||||||||||||||
|
Earnings
before taxes
|
$ | 117.2 | $ | 140.9 | $ | 144.7 | $ | 50.0 | $ | 452.8 | ||||||||||
|
Net
earnings
|
$ | 83.9 | $ | 100.1 | $ | 102.0 | $ | 33.9 | $ | 319.9 | ||||||||||
|
Net
earnings attributable to Ball Corporation
|
$ | 83.8 | $ | 100.0 | $ | 101.9 | $ | 33.8 | $ | 319.5 | ||||||||||
|
Basic
earnings per share (b)
|
$ | 0.86 | $ | 1.03 | $ | 1.07 | $ | 0.36 | $ | 3.33 | ||||||||||
|
Diluted
earnings per share (b)
|
$ | 0.85 | $ | 1.02 | $ | 1.05 | $ | 0.36 | $ | 3.29 | ||||||||||
|
(a)
|
Gross
profit is shown after depreciation related to cost of sales of
$249.9 million and $260.3 million for the years ended
December 31, 2009 and 2008,
respectively.
|
|
(b)
|
Earnings
per share calculations for each quarter are based on the weighted average
shares outstanding for that period. As a result, the sum of the quarterly
amounts may not equal the annual earnings per share
amount.
|
In the
fourth quarter of 2009, the company identified that ending inventory was not
properly valued in its metal beverage packaging, Americas and Asia, segment. As
a result, a cumulative $15.9 million pretax out-of-period adjustment was
recorded in cost of sales in the fourth quarter of 2009, which should have
impacted the prior three quarters of 2009 and the fourth quarter of 2008. Had
the inventory been properly valued, pretax earnings would have been higher by
$15.9 million ($9.7 million after tax or $0.11 per diluted share) in the
fourth quarter of 2009 and 2009 full-year pretax earnings would have been higher
by $7.1 million ($4.3 million after tax or $0.05 per diluted share).
Pretax earnings for the fourth quarter and full year of 2008 would have been
lower by $7.1 million ($4.3 million after tax or $0.04 per diluted share).
Pretax earnings in the first and second quarters of 2009 would have been lower
by $2.2 million ($1.3 million after tax or $0.01 per diluted share) and
$13.9 million ($8.5 million after tax and $0.09 per diluted share),
respectively. The third quarter 2009 pretax earnings would have been higher by
$7.3 million ($4.4 million after tax and $0.04 per diluted share).
Management has assessed the impact of these adjustments and does not believe
these amounts are quantitatively or qualitatively material, individually or in
the aggregate, to any previously issued financial statements or to full-year
results of operations for 2009 or 2008.
Page 78
of 97
Ball
Corporation and Subsidiaries
Notes
to Consolidated Financial Statements
|
22.
|
Quarterly
Results of Operations (Unaudited) (continued)
|
The
unaudited quarterly results of operations included business consolidation and
other costs and other significant items that affected the company’s operating
performance. A summary of the items in 2009 and 2008 follows (all amounts are
shown after tax):
|
($
in millions, except per share amounts)
|
First
Quarter
|
Second
Quarter
|
Third
Quarter
|
Fourth
Quarter
|
Total
|
|||||||||||||||
|
2009
|
||||||||||||||||||||
|
Gain
(loss) on dispositions (Note 4)
|
$ | – | $ | 30.7 | $ | – | $ | (0.3 | ) | $ | 30.4 | |||||||||
|
Business
consolidation and other activities (Note 6)
|
(3.1 | ) | (9.8 | ) | (8.8 | ) | 1.3 | (20.4 | ) | |||||||||||
|
Business
acquisition costs (Note 3)
|
– | (1.8 | ) | (5.5 | ) | 0.1 | (7.2 | ) | ||||||||||||
|
|
$ | (3.1 | ) | $ | 19.1 | $ | (14.3 | ) | $ | 1.1 | $ | 2.8 | ||||||||
|
Basic
earnings per share
|
$ | (0.03 | ) | $ | 0.20 | $ | (0.15 | ) | $ | 0.01 | $ | 0.03 | ||||||||
|
Diluted
earnings per share
|
$ | (0.03 | ) | $ | 0.20 | $ | (0.15 | ) | $ | 0.01 | $ | 0.03 | ||||||||
|
2008
|
||||||||||||||||||||
|
Gain
on sale of investment (Note 5)
|
$ | 4.4 | $ | – | $ | – | $ | – | $ | 4.4 | ||||||||||
|
Business
consolidation and other activities (Note 6)
|
– | (8.1 | ) | (7.2 | ) | (19.6 | ) | (34.9 | ) | |||||||||||
|
|
$ | 4.4 | $ | (8.1 | ) | $ | (7.2 | ) | $ | (19.6 | ) | $ | (30.5 | ) | ||||||
|
Basic
earnings per share
|
$ | 0.05 | $ | (0.08 | ) | $ | (0.08 | ) | $ | (0.20 | ) | $ | (0.32 | ) | ||||||
|
Diluted
earnings per share
|
$ | 0.05 | $ | (0.08 | ) | $ | (0.08 | ) | $ | (0.20 | ) | $ | (0.32 | ) | ||||||
Page 79
of 97
Ball
Corporation and Subsidiaries
Notes
to Consolidated Financial Statements
|
23.
|
Subsidiary
Guarantees of Debt
|
As
discussed in Note 15, the company’s notes payable and senior credit
facilities are guaranteed on a full, unconditional and joint and several basis
by certain of the company’s domestic wholly owned subsidiaries. Certain foreign
denominated tranches of the senior credit facilities are similarly guaranteed by
certain of the company’s wholly owned foreign subsidiaries. The senior credit
facilities are secured by: (1) a pledge of 100 percent of the stock owned
by the company in its material direct and indirect majority-owned domestic
subsidiaries and (2) a pledge of the company’s stock, owned directly or
indirectly, of certain foreign subsidiaries, which equals 65 percent of the
stock of each such foreign subsidiary. The following is condensed, consolidating
financial information (in millions of dollars) for the company, segregating the
guarantor subsidiaries and non-guarantor subsidiaries, as of December 31, 2009
and 2008, and for the years ended December 31, 2009, 2008 and 2007.
Separate financial statements for the guarantor subsidiaries and the
non-guarantor subsidiaries are not presented, because management has determined
that such financial statements would not be material to investors.
|
CONDENSED,
CONSOLIDATING STATEMENT OF EARNINGS
|
||||||||||||||||||||
|
For
the Year Ended December 31, 2009
|
||||||||||||||||||||
|
Ball
|
Guarantor
|
Non-Guarantor
|
Eliminating
|
Consolidated
|
||||||||||||||||
|
($
in millions)
|
Corporation
|
Subsidiaries
|
Subsidiaries
|
Adjustments
|
Total
|
|||||||||||||||
|
Net
sales
|
$ | – | $ | 5,184.3 | $ | 2,161.0 | $ | – | $ | 7,345.3 | ||||||||||
|
Costs
and expenses
|
||||||||||||||||||||
|
Cost
of sales (excluding depreciation)
|
– | 4,366.6 | 1,704.9 | – | 6,071.5 | |||||||||||||||
|
Depreciation
and amortization
|
3.4 | 173.4 | 108.4 | – | 285.2 | |||||||||||||||
|
Selling,
general and administrative
|
54.5 | 187.8 | 86.3 | – | 328.6 | |||||||||||||||
|
Business
consolidation and other costs
|
10.3 | 29.7 | 4.5 | – | 44.5 | |||||||||||||||
|
Gain
on dispositions
|
– | (39.1 | ) | – | – | (39.1 | ) | |||||||||||||
|
Equity
in results of subsidiaries
|
(429.6 | ) | – | – | 429.6 | – | ||||||||||||||
|
Intercompany
license fees
|
(46.9 | ) | 43.3 | 3.6 | – | – | ||||||||||||||
| (408.3 | ) | 4,761.7 | 1,907.7 | 429.6 | 6,690.7 | |||||||||||||||
|
Earnings
(loss) before interest and taxes
|
408.3 | 422.6 | 253.3 | (429.6 | ) | 654.6 | ||||||||||||||
|
Interest
expense
|
(48.8 | ) | (42.1 | ) | (26.3 | ) | – | (117.2 | ) | |||||||||||
|
Earnings
(loss) before taxes
|
359.5 | 380.5 | 227.0 | (429.6 | ) | 537.4 | ||||||||||||||
|
Tax
provision
|
28.4 | (138.9 | ) | (52.3 | ) | – | (162.8 | ) | ||||||||||||
|
Equity
in results of affiliates
|
– | 0.7 | 13.1 | – | 13.8 | |||||||||||||||
|
Net
earnings (loss)
|
387.9 | 242.3 | 187.8 | (429.6 | ) | 388.4 | ||||||||||||||
|
Less
earnings attributable to noncontrolling interests
|
– | – | (0.5 | ) | – | (0.5 | ) | |||||||||||||
|
Net
earnings (loss) attributable to Ball Corporation
|
$ | 387.9 | $ | 242.3 | $ | 187.3 | $ | (429.6 | ) | $ | 387.9 | |||||||||
Page 80
of 97
Ball
Corporation and Subsidiaries
Notes
to Consolidated Financial Statements
|
23.
|
Subsidiary
Guarantees of Debt (continued)
|
|
CONDENSED,
CONSOLIDATING STATEMENT OF EARNINGS
|
||||||||||||||||||||
|
For
the Year Ended December 31, 2008
|
||||||||||||||||||||
|
Ball
|
Guarantor
|
Non-Guarantor
|
Eliminating
|
Consolidated
|
||||||||||||||||
|
($
in millions)
|
Corporation
|
Subsidiaries
|
Subsidiaries
|
Adjustments
|
Total
|
|||||||||||||||
|
Net
sales
|
$ | – | $ | 5,330.7 | $ | 2,338.4 | $ | (107.6 | ) | $ | 7,561.5 | |||||||||
|
Costs
and expenses
|
||||||||||||||||||||
|
Cost
of sales (excluding depreciation)
|
– | 4,577.8 | 1,870.2 | (107.6 | ) | 6,340.4 | ||||||||||||||
|
Depreciation
and amortization
|
3.6 | 181.5 | 112.3 | – | 297.4 | |||||||||||||||
|
Selling,
general and administrative
|
30.2 | 176.7 | 81.3 | – | 288.2 | |||||||||||||||
|
Business
consolidation and other costs
|
0.8 | 42.6 | 8.7 | – | 52.1 | |||||||||||||||
|
Gain
on sale of investment
|
– | (7.1 | ) | – | – | (7.1 | ) | |||||||||||||
|
Equity
in results of subsidiaries
|
(320.5 | ) | – | – | 320.5 | – | ||||||||||||||
|
Intercompany
license fees
|
(72.8 | ) | 69.7 | 3.1 | – | – | ||||||||||||||
| (358.7 | ) | 5,041.2 | 2,075.6 | 212.9 | 6,971.0 | |||||||||||||||
|
Earnings
(loss) before interest and taxes
|
358.7 | 289.5 | 262.8 | (320.5 | ) | 590.5 | ||||||||||||||
|
Interest
expense
|
(37.5 | ) | (50.8 | ) | (49.4 | ) | – | (137.7 | ) | |||||||||||
|
Earnings
(loss) before taxes
|
321.2 | 238.7 | 213.4 | (320.5 | ) | 452.8 | ||||||||||||||
|
Tax
provision
|
(1.7 | ) | (96.8 | ) | (48.9 | ) | – | (147.4 | ) | |||||||||||
|
Equity
in results of affiliates
|
– | 0.6 | 13.9 | – | 14.5 | |||||||||||||||
|
Net
earnings (loss)
|
319.5 | 142.5 | 178.4 | (320.5 | ) | 319.9 | ||||||||||||||
|
Less
earnings attributable to noncontrolling interests
|
– | – | (0.4 | ) | – | (0.4 | ) | |||||||||||||
|
Net
earnings (loss) attributable to Ball Corporation
|
$ | 319.5 | $ | 142.5 | $ | 178.0 | $ | (320.5 | ) | $ | 319.5 | |||||||||
|
CONDENSED,
CONSOLIDATING STATEMENT OF EARNINGS
|
||||||||||||||||||||
|
For
the Year Ended December 31, 2007
|
||||||||||||||||||||
|
Ball
|
Guarantor
|
Non-Guarantor
|
Eliminating
|
Consolidated
|
||||||||||||||||
|
($
in millions)
|
Corporation
|
Subsidiaries
|
Subsidiaries
|
Adjustments
|
Total
|
|||||||||||||||
|
Net
sales
|
$ | – | $ | 5,499.1 | $ | 2,101.4 | $ | (125.2 | ) | $ | 7,475.3 | |||||||||
|
Legal
settlement
|
– | (85.6 | ) | – | – | (85.6 | ) | |||||||||||||
|
Total
net sales
|
– | 5,413.5 | 2,101.4 | (125.2 | ) | 7,389.7 | ||||||||||||||
|
Costs
and expenses
|
||||||||||||||||||||
|
Cost
of sales (excluding depreciation)
|
– | 4,709.1 | 1,642.6 | (125.2 | ) | 6,226.5 | ||||||||||||||
|
Depreciation
and amortization
|
3.4 | 179.0 | 98.6 | – | 281.0 | |||||||||||||||
|
Selling,
general and administrative
|
71.3 | 168.7 | 83.7 | – | 323.7 | |||||||||||||||
|
Business
consolidation and other costs
|
– | 41.9 | 2.7 | – | 44.6 | |||||||||||||||
|
Equity
in results of subsidiaries
|
(298.7 | ) | – | – | 298.7 | – | ||||||||||||||
|
Intercompany
license fees
|
(71.0 | ) | 69.5 | 1.5 | – | – | ||||||||||||||
| (295.0 | ) | 5,168.2 | 1,829.1 | 173.5 | 6,875.8 | |||||||||||||||
|
Earnings
(loss) before interest and taxes
|
295.0 | 245.3 | 272.3 | (298.7 | ) | 513.9 | ||||||||||||||
|
Interest
expense
|
(34.3 | ) | (53.4 | ) | (61.7 | ) | – | (149.4 | ) | |||||||||||
|
Earnings
(loss) before taxes
|
260.7 | 191.9 | 210.6 | (298.7 | ) | 364.5 | ||||||||||||||
|
Tax
provision
|
20.6 | (58.3 | ) | (58.0 | ) | – | (95.7 | ) | ||||||||||||
|
Equity
in results of affiliates
|
– | 1.7 | 11.2 | – | 12.9 | |||||||||||||||
|
Net
earnings (loss)
|
281.3 | 135.3 | 163.8 | (298.7 | ) | 281.7 | ||||||||||||||
|
Less
earnings attributable to noncontrolling interests
|
– | – | (0.4 | ) | – | (0.4 | ) | |||||||||||||
|
Net
earnings (loss) attributable to Ball Corporation
|
$ | 281.3 | $ | 135.3 | $ | 163.4 | $ | (298.7 | ) | $ | 281.3 | |||||||||
Page 81
of 97
Ball
Corporation and Subsidiaries
Notes
to Consolidated Financial Statements
|
23.
|
Subsidiary
Guarantees of Debt (continued)
|
|
CONDENSED,
CONSOLIDATING BALANCE SHEET
|
||||||||||||||||||||
|
December
31, 2009
|
||||||||||||||||||||
|
Ball
|
Guarantor
|
Non-Guarantor
|
Eliminating
|
Consolidated
|
||||||||||||||||
|
($
in millions)
|
Corporation
|
Subsidiaries
|
Subsidiaries
|
Adjustments
|
Total
|
|||||||||||||||
|
ASSETS
|
||||||||||||||||||||
|
Current
assets
|
||||||||||||||||||||
|
Cash
and cash equivalents
|
$ | 111.3 | $ | 0.1 | $ | 99.2 | $ | – | $ | 210.6 | ||||||||||
|
Receivables,
net
|
(0.1 | ) | 154.2 | 394.1 | – | 548.2 | ||||||||||||||
|
Inventories,
net
|
– | 669.0 | 275.2 | – | 944.2 | |||||||||||||||
|
Cash
collateral – receivable
|
– | 14.2 | – | – | 14.2 | |||||||||||||||
|
Current
derivative contracts
|
11.8 | 49.5 | 38.8 | – | 100.1 | |||||||||||||||
|
Current
deferred taxes and other current assets
|
9.7 | 76.4 | 19.9 | – | 106.0 | |||||||||||||||
|
Total
current assets
|
132.7 | 963.4 | 827.2 | – | 1,923.3 | |||||||||||||||
|
Property,
plant and equipment, net
|
22.2 | 1,113.7 | 813.1 | – | 1,949.0 | |||||||||||||||
|
Investment
in subsidiaries
|
2,816.2 | 289.7 | 81.0 | (3,186.9 | ) | – | ||||||||||||||
|
Goodwill
|
– | 1,016.5 | 1,098.3 | – | 2,114.8 | |||||||||||||||
|
Noncurrent
derivative contracts
|
– | 32.4 | 48.2 | – | 80.6 | |||||||||||||||
|
Intangibles
and other assets, net
|
126.2 | 162.7 | 131.7 | – | 420.6 | |||||||||||||||
|
Total
Assets
|
$ | 3,097.3 | $ | 3,578.4 | $ | 2,999.5 | $ | (3,186.9 | ) | $ | 6,488.3 | |||||||||
|
LIABILITIES
AND SHAREHOLDERS’ EQUITY
|
||||||||||||||||||||
|
Current
liabilities
|
||||||||||||||||||||
|
Short-term
debt and current portion of long-term debt
|
$ | 75.0 | $ | 1.8 | $ | 235.5 | $ | – | $ | 312.3 | ||||||||||
|
Accounts
payable
|
21.4 | 357.7 | 244.0 | – | 623.1 | |||||||||||||||
|
Accrued
employee costs
|
17.2 | 141.4 | 56.1 | – | 214.7 | |||||||||||||||
|
Cash
collateral – liability
|
– | 14.2 | – | – | 14.2 | |||||||||||||||
|
Current
derivative contracts
|
0.3 | 59.3 | 23.6 | – | 83.2 | |||||||||||||||
|
Other
current liabilities
|
22.9 | 92.7 | 65.5 | – | 181.1 | |||||||||||||||
|
Total
current liabilities
|
136.8 | 667.1 | 624.7 | – | 1,428.6 | |||||||||||||||
|
Long-term
debt
|
1,874.8 | 5.8 | 403.3 | – | 2,283.9 | |||||||||||||||
|
Intercompany
borrowings
|
(645.0 | ) | 438.2 | 206.8 | – | – | ||||||||||||||
|
Employee
benefit obligations
|
180.8 | 433.0 | 399.4 | – | 1,013.2 | |||||||||||||||
|
Noncurrent
derivative contracts
|
– | 32.4 | 15.6 | – | 48.0 | |||||||||||||||
|
Deferred
taxes and other liabilities
|
(31.4 | ) | 61.0 | 102.0 | – | 131.6 | ||||||||||||||
|
Total
liabilities
|
1,516.0 | 1,637.5 | 1,751.8 | – | 4,905.3 | |||||||||||||||
|
Shareholders’
equity
|
||||||||||||||||||||
|
Convertible
preferred stock
|
– | – | 4.8 | (4.8 | ) | – | ||||||||||||||
|
Preferred
shareholders’ equity
|
– | – | 4.8 | (4.8 | ) | – | ||||||||||||||
|
Common
stock
|
830.8 | 819.5 | 487.0 | (1,306.5 | ) | 830.8 | ||||||||||||||
|
Retained
earnings
|
2,397.1 | 1,325.8 | 602.1 | (1,927.9 | ) | 2,397.1 | ||||||||||||||
|
Accumulated
other comprehensive earnings (loss)
|
(63.8 | ) | (204.4 | ) | 152.1 | 52.3 | (63.8 | ) | ||||||||||||
|
Treasury
stock, at cost
|
(1,582.8 | ) | – | – | – | (1,582.8 | ) | |||||||||||||
|
Common
shareholders’ equity
|
1,581.3 | 1,940.9 | 1,241.2 | (3,182.1 | ) | 1,581.3 | ||||||||||||||
|
Total
Ball Corporation shareholders’ equity
|
1,581.3 | 1,940.9 | 1,246.0 | (3,186.9 | ) | 1,581.3 | ||||||||||||||
|
Noncontrolling
interests
|
– | – | 1.7 | – | 1.7 | |||||||||||||||
|
Total
shareholders’ equity
|
1,581.3 | 1,940.9 | 1,247.7 | (3,186.9 | ) | 1,583.0 | ||||||||||||||
|
Total
Liabilities and Shareholders’
Equity
|
$ | 3,097.3 | $ | 3,578.4 | $ | 2,999.5 | $ | (3,186.9 | ) | $ | 6,488.3 | |||||||||
Page 82
of 97
Ball
Corporation and Subsidiaries
Notes
to Consolidated Financial Statements
|
23.
|
Subsidiary
Guarantees of Debt (continued)
|
|
CONDENSED,
CONSOLIDATING BALANCE SHEET
|
||||||||||||||||||||
|
December
31, 2008
|
||||||||||||||||||||
|
Ball
|
Guarantor
|
Non-Guarantor
|
Eliminating
|
Consolidated
|
||||||||||||||||
|
($
in millions)
|
Corporation
|
Subsidiaries
|
Subsidiaries
|
Adjustments
|
Total
|
|||||||||||||||
|
ASSETS
|
||||||||||||||||||||
|
Current
assets
|
||||||||||||||||||||
|
Cash
and cash equivalents
|
$ | 90.2 | $ | (0.1 | ) | $ | 37.3 | $ | – | $ | 127.4 | |||||||||
|
Receivables,
net
|
0.5 | 145.7 | 361.7 | – | 507.9 | |||||||||||||||
|
Inventories,
net
|
– | 677.5 | 296.7 | – | 974.2 | |||||||||||||||
|
Cash
collateral – receivable
|
– | 123.2 | 106.3 | – | 229.5 | |||||||||||||||
|
Current
derivative contracts
|
4.8 | 176.6 | 15.6 | – | 197.0 | |||||||||||||||
|
Current
deferred taxes and other current assets
|
(1.1 | ) | 79.7 | 50.7 | – | 129.3 | ||||||||||||||
|
Total
current assets
|
94.4 | 1,202.6 | 868.3 | – | 2,165.3 | |||||||||||||||
|
Property,
plant and equipment, net
|
23.2 | 1,012.8 | 830.9 | – | 1,866.9 | |||||||||||||||
|
Investment
in subsidiaries
|
2,286.1 | 289.7 | 81.0 | (2,656.8 | ) | – | ||||||||||||||
|
Goodwill
|
– | 740.2 | 1,085.3 | – | 1,825.5 | |||||||||||||||
|
Noncurrent
derivative contracts
|
0.2 | 131.5 | 7.3 | – | 139.0 | |||||||||||||||
|
Intangibles
and other assets, net
|
150.3 | 102.6 | 119.1 | – | 372.0 | |||||||||||||||
|
Total
Assets
|
$ | 2,554.2 | $ | 3,479.4 | $ | 2,991.9 | $ | (2,656.8 | ) | $ | 6,368.7 | |||||||||
|
LIABILITIES
AND SHAREHOLDERS’ EQUITY
|
||||||||||||||||||||
|
Current
liabilities
|
||||||||||||||||||||
|
Short-term
debt and current portion of long-term debt
|
$ | 62.5 | $ | 1.8 | $ | 238.7 | $ | – | $ | 303.0 | ||||||||||
|
Accounts
payable
|
50.8 | 422.7 | 290.2 | – | 763.7 | |||||||||||||||
|
Accrued
employee costs
|
3.7 | 175.0 | 54.0 | – | 232.7 | |||||||||||||||
|
Cash
collateral – liability
|
– | 124.0 | – | – | 124.0 | |||||||||||||||
|
Current
derivative contracts
|
2.9 | 162.9 | 102.6 | – | 268.4 | |||||||||||||||
|
Other
current liabilities
|
48.6 | 96.2 | 25.8 | – | 170.6 | |||||||||||||||
|
Total
current liabilities
|
168.5 | 982.6 | 711.3 | – | 1,862.4 | |||||||||||||||
|
Long-term
debt
|
1,340.5 | 7.7 | 758.9 | – | 2,107.1 | |||||||||||||||
|
Intercompany
borrowings
|
(245.3 | ) | 217.7 | 27.6 | – | – | ||||||||||||||
|
Employee
benefit obligations
|
193.8 | 430.0 | 357.6 | – | 981.4 | |||||||||||||||
|
Noncurrent
derivative contracts
|
0.3 | 131.7 | 57.7 | – | 189.7 | |||||||||||||||
|
Deferred
taxes and other liabilities
|
10.6 | 15.7 | 114.5 | – | 140.8 | |||||||||||||||
|
Total
liabilities
|
1,468.4 | 1,785.4 | 2,027.6 | – | 5,281.4 | |||||||||||||||
|
Shareholders’
equity
|
||||||||||||||||||||
|
Convertible
preferred stock
|
– | – | 4.8 | (4.8 | ) | – | ||||||||||||||
|
Preferred
shareholders’ equity
|
– | – | 4.8 | (4.8 | ) | – | ||||||||||||||
|
Common
stock
|
788.0 | 820.9 | 485.5 | (1,306.4 | ) | 788.0 | ||||||||||||||
|
Retained
earnings
|
2,047.1 | 1,084.7 | 413.7 | (1,498.4 | ) | 2,047.1 | ||||||||||||||
|
Accumulated
other comprehensive earnings (loss)
|
(182.5 | ) | (211.6 | ) | 58.8 | 152.8 | (182.5 | ) | ||||||||||||
|
Treasury
stock, at cost
|
(1,566.8 | ) | – | – | – | (1,566.8 | ) | |||||||||||||
|
Common
shareholders’ equity
|
1,085.8 | 1,694.0 | 958.0 | (2,652.0 | ) | 1,085.8 | ||||||||||||||
|
Total
Ball Corporation shareholders’ equity
|
1,085.8 | 1,694.0 | 962.8 | (2,656.8 | ) | 1,085.8 | ||||||||||||||
|
Noncontrolling
interests
|
– | – | 1.5 | – | 1.5 | |||||||||||||||
|
Total
shareholders’ equity
|
1,085.8 | 1,694.0 | 964.3 | (2,656.8 | ) | 1,087.3 | ||||||||||||||
|
Total
Liabilities and Shareholders’ Equity
|
$ | 2,554.2 | $ | 3,479.4 | $ | 2,991.9 | $ | (2,656.8 | ) | $ | 6,368.7 | |||||||||
Page 83
of 97
Ball
Corporation and Subsidiaries
Notes
to Consolidated Financial Statements
|
23.
|
Subsidiary
Guarantees of Debt (continued)
|
|
CONDENSED,
CONSOLIDATING STATEMENT OF CASH FLOWS
|
||||||||||||||||||||
|
For
the Year Ended December 31, 2009
|
||||||||||||||||||||
|
Ball
|
Guarantor
|
Non-Guarantor
|
Eliminating
|
Consolidated
|
||||||||||||||||
|
($
in millions)
|
Corporation
|
Subsidiaries
|
Subsidiaries
|
Adjustments
|
Total
|
|||||||||||||||
|
Cash
flows from operating activities
|
||||||||||||||||||||
|
Net
earnings (loss)
|
$ | 387.9 | $ | 242.3 | $ | 187.8 | $ | (429.6 | ) | $ | 388.4 | |||||||||
|
Adjustments
to reconcile net earnings to cash provided by operating
activities:
|
||||||||||||||||||||
|
Depreciation
and amortization
|
3.4 | 173.4 | 108.4 | – | 285.2 | |||||||||||||||
|
Gain
on dispositions
|
– | (39.1 | ) | – | – | (39.1 | ) | |||||||||||||
|
Business
consolidation and other activities, net of cash payments
|
0.3 | 25.6 | 3.9 | – | 29.8 | |||||||||||||||
|
Deferred
taxes
|
(12.3 | ) | 13.1 | (25.1 | ) | – | (24.3 | ) | ||||||||||||
|
Equity
earnings of subsidiaries
|
(429.6 | ) | – | – | 429.6 | – | ||||||||||||||
|
Other,
net
|
27.7 | (14.9 | ) | 1.7 | – | 14.5 | ||||||||||||||
|
Working
capital changes, net
|
(65.3 | ) | (15.6 | ) | (13.9 | ) | – | (94.8 | ) | |||||||||||
|
Cash
provided by (used in) operating activities
|
(87.9 | ) | 384.8 | 262.8 | – | 559.7 | ||||||||||||||
|
Cash
flows from investing activities
|
||||||||||||||||||||
|
Additions
to property, plant and equipment
|
(2.9 | ) | (108.0 | ) | (76.2 | ) | – | (187.1 | ) | |||||||||||
|
Cash
collateral, net
|
– | (0.9 | ) | 106.2 | – | 105.3 | ||||||||||||||
|
Business
acquisition
|
– | (574.7 | ) | – | – | (574.7 | ) | |||||||||||||
|
Proceeds
from dispositions
|
– | 69.0 | – | – | 69.0 | |||||||||||||||
|
Investments
in and advances to affiliates
|
(383.7 | ) | 222.1 | 161.6 | – | – | ||||||||||||||
|
Other,
net
|
(3.8 | ) | 9.8 | 0.1 | – | 6.1 | ||||||||||||||
|
Cash
provided by (used in) investing activities
|
(390.4 | ) | (382.7 | ) | 191.7 | – | (581.4 | ) | ||||||||||||
|
Cash
flows from financing activities
|
||||||||||||||||||||
|
Long-term
borrowings
|
1,111.6 | – | 225.1 | – | 1,336.7 | |||||||||||||||
|
Repayments
of long-term borrowings
|
(565.1 | ) | (1.9 | ) | (529.8 | ) | – | (1,096.8 | ) | |||||||||||
|
Change
in short-term borrowings
|
– | – | (92.0 | ) | – | (92.0 | ) | |||||||||||||
|
Proceeds
from issuances of common stock
|
31.9 | – | – | – | 31.9 | |||||||||||||||
|
Acquisitions
of treasury stock
|
(37.0 | ) | – | – | – | (37.0 | ) | |||||||||||||
|
Common
dividends
|
(37.4 | ) | – | – | – | (37.4 | ) | |||||||||||||
|
Other,
net
|
(4.6 | ) | – | – | – | (4.6 | ) | |||||||||||||
|
Cash
provided by (used in) financing activities
|
499.4 | (1.9 | ) | (396.7 | ) | – | 100.8 | |||||||||||||
|
Effect
of exchange rate changes on cash
|
– | – | 4.1 | – | 4.1 | |||||||||||||||
|
Change
in cash and cash equivalents
|
21.1 | 0.2 | 61.9 | – | 83.2 | |||||||||||||||
|
Cash
and cash equivalents – beginning
of year
|
90.2 | (0.1 | ) | 37.3 | – | 127.4 | ||||||||||||||
|
Cash
and cash equivalents – end of
year
|
$ | 111.3 | $ | 0.1 | $ | 99.2 | $ | – | $ | 210.6 | ||||||||||
Page 84
of 97
Ball
Corporation and Subsidiaries
Notes
to Consolidated Financial Statements
|
23.
|
Subsidiary
Guarantees of Debt (continued)
|
|
CONDENSED,
CONSOLIDATING STATEMENT OF CASH FLOWS
|
||||||||||||||||||||
|
For
the Year Ended December 31, 2008
|
||||||||||||||||||||
|
Ball
|
Guarantor
|
Non-Guarantor
|
Eliminating
|
Consolidated
|
||||||||||||||||
|
($
in millions)
|
Corporation
|
Subsidiaries
|
Subsidiaries
|
Adjustments
|
Total
|
|||||||||||||||
|
Cash
flows from operating activities
|
||||||||||||||||||||
|
Net
earnings (loss)
|
$ | 319.5 | $ | 142.5 | $ | 178.4 | $ | (320.5 | ) | $ | 319.9 | |||||||||
|
Adjustments
to reconcile net earnings to cash provided by operating
activities:
|
||||||||||||||||||||
|
Depreciation
and amortization
|
3.6 | 181.5 | 112.3 | – | 297.4 | |||||||||||||||
|
Gain
on sale of subsidiary
|
– | (7.1 | ) | – | – | (7.1 | ) | |||||||||||||
|
Legal
settlement
|
– | (70.3 | ) | – | – | (70.3 | ) | |||||||||||||
|
Business
consolidation and other activities, net of cash payments
|
0.8 | 39.5 | 7.6 | – | 47.9 | |||||||||||||||
|
Deferred
taxes
|
27.8 | 7.0 | (15.2 | ) | – | 19.6 | ||||||||||||||
|
Equity
earnings of subsidiaries
|
(320.5 | ) | – | – | 320.5 | – | ||||||||||||||
|
Other,
net
|
31.0 | 10.4 | (16.1 | ) | – | 25.3 | ||||||||||||||
|
Working
capital changes, net
|
(50.3 | ) | 72.0 | (26.8 | ) | – | (5.1 | ) | ||||||||||||
|
Cash
provided by operating activities
|
11.9 | 375.5 | 240.2 | – | 627.6 | |||||||||||||||
|
Cash
flows from investing activities
|
||||||||||||||||||||
|
Additions
to property, plant and equipment
|
(4.8 | ) | (156.8 | ) | (145.3 | ) | – | (306.9 | ) | |||||||||||
|
Cash
collateral, net
|
– | – | (105.5 | ) | – | (105.5 | ) | |||||||||||||
|
Business
acquisitions
|
– | – | (2.3 | ) | – | (2.3 | ) | |||||||||||||
|
Investments
in and advances to affiliates
|
446.5 | (201.8 | ) | (244.7 | ) | – | – | |||||||||||||
|
Proceeds
from sale of subsidiary
|
– | 8.7 | – | – | 8.7 | |||||||||||||||
|
Other,
net
|
(7.6 | ) | (21.6 | ) | 17.2 | – | (12.0 | ) | ||||||||||||
|
Cash
provided by (used in) investing activities
|
434.1 | (371.5 | ) | (480.6 | ) | – | (418.0 | ) | ||||||||||||
|
Cash
flows from financing activities
|
||||||||||||||||||||
|
Long-term
borrowings
|
558.6 | – | 195.1 | – | 753.7 | |||||||||||||||
|
Repayments
of long-term borrowings
|
(649.8 | ) | (6.0 | ) | (78.7 | ) | – | (734.5 | ) | |||||||||||
|
Change
in short-term borrowings
|
(1.9 | ) | – | 110.0 | – | 108.1 | ||||||||||||||
|
Proceeds
from issuances of common stock
|
27.2 | – | – | – | 27.2 | |||||||||||||||
|
Acquisitions
of treasury stock
|
(326.8 | ) | – | – | – | (326.8 | ) | |||||||||||||
|
Common
dividends
|
(37.5 | ) | – | – | – | (37.5 | ) | |||||||||||||
|
Other,
net
|
4.3 | – | – | – | 4.3 | |||||||||||||||
|
Cash
provided by (used in) financing activities
|
(425.9 | ) | (6.0 | ) | 226.4 | – | (205.5 | ) | ||||||||||||
|
Effect
of exchange rate changes on cash
|
– | – | (28.3 | ) | – | (28.3 | ) | |||||||||||||
|
Change
in cash and cash equivalents
|
20.1 | (2.0 | ) | (42.3 | ) | – | (24.2 | ) | ||||||||||||
|
Cash
and cash equivalents – beginning
of year
|
70.1 | 1.9 | 79.6 | – | 151.6 | |||||||||||||||
|
Cash
and cash equivalents – end of
year
|
$ | 90.2 | $ | (0.1 | ) | $ | 37.3 | $ | – | $ | 127.4 | |||||||||
Page 85
of 97
Ball
Corporation and Subsidiaries
Notes
to Consolidated Financial Statements
|
23.
|
Subsidiary
Guarantees of Debt (continued)
|
|
CONDENSED,
CONSOLIDATING STATEMENT OF CASH FLOWS
|
||||||||||||||||||||
|
For
the Year Ended December 31, 2007
|
||||||||||||||||||||
|
Ball
|
Guarantor
|
Non-Guarantor
|
Eliminating
|
Consolidated
|
||||||||||||||||
|
($
in millions)
|
Corporation
|
Subsidiaries
|
Subsidiaries
|
Adjustments
|
Total
|
|||||||||||||||
|
Cash
flows from operating activities
|
||||||||||||||||||||
|
Net
earnings (loss)
|
$ | 281.3 | $ | 135.3 | $ | 163.8 | $ | (298.7 | ) | $ | 281.7 | |||||||||
|
Adjustments
to reconcile net earnings to cash provided by operating
activities:
|
||||||||||||||||||||
|
Depreciation
and amortization
|
3.4 | 179.0 | 98.6 | – | 281.0 | |||||||||||||||
|
Legal
settlement
|
– | 85.6 | – | – | 85.6 | |||||||||||||||
|
Business
consolidation and other activities, net of cash payments
|
– | 41.9 | 0.4 | – | 42.3 | |||||||||||||||
|
Deferred
taxes
|
(8.3 | ) | 13.2 | (25.9 | ) | – | (21.0 | ) | ||||||||||||
|
Equity
earnings of subsidiaries
|
(298.7 | ) | – | – | 298.7 | – | ||||||||||||||
|
Other,
net
|
0.8 | (13.3 | ) | (18.8 | ) | – | (31.3 | ) | ||||||||||||
|
Working
capital changes, net
|
164.8 | (103.6 | ) | (26.5 | ) | – | 34.7 | |||||||||||||
|
Cash
provided by operating activities
|
143.3 | 338.1 | 191.6 | – | 673.0 | |||||||||||||||
|
Cash
flows from investing activities
|
||||||||||||||||||||
|
Additions
to property, plant and equipment
|
(4.2 | ) | (150.8 | ) | (153.5 | ) | – | (308.5 | ) | |||||||||||
|
Investments
in and advances to affiliates
|
91.6 | (173.8 | ) | 82.2 | – | – | ||||||||||||||
|
Property
insurance proceeds
|
– | – | 48.6 | – | 48.6 | |||||||||||||||
|
Other,
net
|
(7.4 | ) | (1.3 | ) | 2.8 | – | (5.9 | ) | ||||||||||||
|
Cash
provided by (used in) investing activities
|
80.0 | (325.9 | ) | (19.9 | ) | – | (265.8 | ) | ||||||||||||
|
Cash
flows from financing activities
|
||||||||||||||||||||
|
Long-term
borrowings
|
275.0 | 0.1 | 24.0 | – | 299.1 | |||||||||||||||
|
Repayments
of long-term borrowings
|
(302.5 | ) | (12.7 | ) | (58.1 | ) | – | (373.3 | ) | |||||||||||
|
Change
in short-term borrowings
|
6.4 | – | (102.2 | ) | – | (95.8 | ) | |||||||||||||
|
Proceeds
from issuances of common stock
|
46.5 | – | – | – | 46.5 | |||||||||||||||
|
Acquisitions
of treasury stock
|
(257.8 | ) | – | – | – | (257.8 | ) | |||||||||||||
|
Common
dividends
|
(40.6 | ) | – | – | – | (40.6 | ) | |||||||||||||
|
Other,
net
|
9.5 | – | – | – | 9.5 | |||||||||||||||
|
Cash
used in financing activities
|
(263.5 | ) | (12.6 | ) | (136.3 | ) | – | (412.4 | ) | |||||||||||
|
Effect
of exchange rate changes on cash
|
– | – | 5.3 | – | 5.3 | |||||||||||||||
|
Change
in cash and cash equivalents
|
(40.2 | ) | (0.4 | ) | 40.7 | – | 0.1 | |||||||||||||
|
Cash
and cash equivalents – beginning
of year
|
110.3 | 2.3 | 38.9 | – | 151.5 | |||||||||||||||
|
Cash
and cash equivalents – end of
year
|
$ | 70.1 | $ | 1.9 | $ | 79.6 | $ | – | $ | 151.6 | ||||||||||
|
24.
|
Subsequent
Event (Unaudited)
|
On
February 17, 2010, in a privately negotiated transaction, Ball entered into
an accelerated share repurchase agreement to buy $125 million of its common
shares using cash on hand and available borrowings. The company advanced the
$125 million on February 22, 2010, and received approximately
2.2 million shares, which represented 90 percent of the total
shares as calculated using the previous day’s closing price. The remaining
shares and average price per share will be determined at the conclusion of the
contract, which is expected to occur no later than August 2010.
Page 86
of 97
Ball
Corporation and Subsidiaries
Notes
to Consolidated Financial Statements
|
25.
|
Contingencies
|
From time
to time, the company is subject to routine litigation incident to its
businesses. Additionally, the U.S. Environmental Protection Agency has
designated Ball as a potentially responsible party, along with numerous other
companies, for the cleanup of several hazardous waste sites. Our information at
this time does not indicate that the matters identified will have a material
adverse effect upon the liquidity, results of operations or financial condition
of the company.
|
26.
|
Indemnifications
and Guarantees
|
During
the normal course of business, the company or its appropriate consolidated
direct or indirect subsidiaries have made certain indemnities, commitments and
guarantees under which the specified entity may be required to make payments in
relation to certain transactions. These indemnities, commitments and guarantees
include indemnities to the customers of the subsidiaries in connection with the
sales of their packaging and aerospace products and services; guarantees to
suppliers of direct or indirect subsidiaries of the company guaranteeing the
performance of the respective entity under a purchase agreement, construction
contract or other commitment; guarantees in respect of certain foreign
subsidiaries’ pension plans; indemnities for liabilities associated with the
infringement of third party patents, trademarks or copyrights under various
types of agreements; indemnities to various lessors in connection with facility,
equipment, furniture and other personal property leases for certain claims
arising from such leases; indemnities to governmental agencies in connection
with the issuance of a permit or license to the company or a subsidiary;
indemnities pursuant to agreements relating to certain joint ventures;
indemnities in connection with the sale of businesses or substantially all of
the assets and specified liabilities of businesses; and indemnities to
directors, officers and employees of the company to the extent permitted under
the laws of the State of Indiana and the United States of America. The duration
of these indemnities, commitments and guarantees varies, and in certain cases,
is indefinite. In addition, the majority of these indemnities, commitments and
guarantees do not provide for any limitation on the maximum potential future
payments the company could be obligated to make. As such, the company is unable
to reasonably estimate its potential exposure under these items.
The
company has not recorded any liability for these indemnities, commitments and
guarantees in the accompanying unaudited condensed consolidated balance sheets.
The company does, however, accrue for payments under promissory notes and other
evidences of incurred indebtedness and for losses for any known contingent
liability, including those that may arise from indemnifications, commitments and
guarantees, when future payment is both reasonably determinable and probable.
Finally, the company carries specific and general liability insurance policies
and has obtained indemnities, commitments and guarantees from third party
purchasers, sellers and other contracting parties, which the company believes
would, in certain circumstances, provide recourse to any claims arising from
these indemnifications, commitments and guarantees.
The
company’s senior notes and senior credit facilities are guaranteed on a full,
unconditional and joint and several basis by certain of the company’s wholly
owned domestic subsidiaries. Foreign tranches of the senior credit facilities
are similarly guaranteed by certain of the company’s wholly owned foreign
subsidiaries. These guarantees are required in support of the notes and credit
facilities referred to above, are co-terminous with the terms of the respective
note indentures and credit agreements and would require performance upon certain
events of default referred to in the respective guarantees. The maximum
potential amounts that could be required to be paid under the guarantees are
essentially equal to the then outstanding principal and interest under the
respective notes and credit agreement, or under the applicable tranche. The
company is not in default under the above notes or credit
facilities.
Ball
Capital Corp. II is a separate, wholly owned corporate entity created for the
purchase of accounts receivable from certain of the company’s wholly owned
subsidiaries. Ball Capital Corp. II’s assets will be available first to satisfy
the claims of its creditors. The company has been designated as the servicer
pursuant to an agreement whereby Ball Capital Corp. II may sell and assign the
accounts receivable to a commercial lender or lenders. As the servicer, the
company is responsible for the servicing, administration and collection of the
receivables and is primarily liable for the performance of such obligations.
(See Note 8.) The company, the relevant subsidiaries and Ball Capital Corp.
II are not in default under the above credit arrangement.
Page 87
of 97
|
Item
9.
|
Changes
in and Disagreements with Accountants on Accounting and Financial
Disclosure
|
There
were no matters required to be reported under this item.
|
Item
9A.
|
Controls
and Procedures
|
Evaluation
of Disclosure Controls and Procedures
We have
established disclosure controls and procedures to seek to ensure that material
information relating to the company, including its consolidated subsidiaries, is
made known to the officers who certify the company’s financial reports and to
other members of senior management and the board of directors. Based on their
evaluation as of December 31, 2009, the chief executive officer and chief
financial officer of the company have concluded that the company’s disclosure
controls and procedures (as defined in Rules 13a-15(e) and 15d-15(e) under the
Securities Exchange Act of 1934) were effective.
Management’s Report on Internal
Control Over Financial Reporting
Our
management is responsible for establishing and maintaining adequate internal
control over financial reporting, as such term is defined in Exchange Act
Rule 13a-15(f). Under the supervision and with the participation of our
management, including our chief executive officer and chief financial officer,
we conducted an evaluation of the effectiveness of our internal control over
financial reporting based on the framework in “Internal Control – Integrated
Framework” issued
by the Committee of Sponsoring Organizations of the Treadway Commission. Based
on our evaluation under the framework in “Internal Control – Integrated
Framework,” our management concluded that our internal control over financial
reporting was effective as of December 31, 2009.
As
permitted by Securities and Exchange Commission guidance, management has
excluded the operations related to four manufacturing plants acquired from
Anheuser-Busch InBev n.v./s.a. (AB InBev) on October 1, 2009, from its
assessment of internal control over financial reporting as of December 31,
2009. (Additional details regarding the acquisition are available in Note 3
to the consolidated financial statements within Item 8 of this report.) The AB
InBev operations represented approximately 2 percent of Ball’s 2009
consolidated net sales and 9 percent of Ball’s consolidated total assets at
December 31, 2009. The controls for these acquired operations are required
to be evaluated and tested by the end of 2010.
The
effectiveness of our internal control over financial reporting as of
December 31, 2009, has been audited by PricewaterhouseCoopers LLP, an
independent registered public accounting firm, as stated in their report, which
is included in Item 8, “Financial Statements and Supplementary
Data.”
Changes
in Internal Control
There
were no changes in our internal control over financial reporting during the
quarter ended December 31, 2009, that have materially affected, or are
reasonably likely to materially affect, our internal control over financial
reporting.
|
Item
9B.
|
Other
Information
|
There
were no matters required to be reported under this item.
Page 88
of 97
|
|
Part
III
|
|
Item
10.
|
Directors,
Executive Officers and Corporate Governance of the
Registrant
|
The
executive officers of the company as of January 1, 2010, were as
follows:
|
1.
|
R.
David Hoover, 64, Chairman and Chief Executive Officer as of
January 1, 2010;
Chairman, President and Chief Executive Officer from April 2002 to
December 31, 2009; and a director since 1996. Mr. Hoover was
President and Chief Executive Officer from January 2001 until April
2002 and Vice Chairman, President and Chief Operating Officer from
April 2000 to January 2001; Vice Chairman, President and Chief
Financial Officer from January 2000 to April 2000; Vice Chairman and Chief
Financial Officer, 1998-2000; Executive Vice President and Chief Financial
Officer, 1997-1998; Executive Vice President, Chief Financial Officer and
Treasurer, 1996-1997; Executive Vice President and Chief Financial
Officer, 1995-1996; Senior Vice President and Chief Financial Officer,
1992-1995; Vice President and Treasurer, 1988-1992; Assistant Treasurer,
1987-1988; Vice President, Finance and Administration, Technical Products,
1985-1987; Vice President, Finance and Administration, Management Services
Division, 1983-1985.
|
|
2.
|
John
A. Hayes, 44, President and Chief Operating Officer as of January 1,
2010; Executive Vice President and Chief Operating Officer from
January 2008 to December 31, 2009; Senior Vice President, Ball
Corporation, and President, Ball Packaging Europe, April 25, 2007, to
January 2008; Vice President, Ball Corporation, and President, Ball
Packaging Europe, March 2006 to April 25, 2007; Vice President,
Ball Corporation, and Executive Vice President of Ball’s European
packaging business, July 2005 to March 2006; Vice President,
Corporate Strategy, Marketing and Development, January 2003 to
July 2005; Vice President, Corporate Planning and Development,
April 2000 to January 2003; Senior Director, Corporate Planning
and Development, February 1999 to April
2000.
|
|
3.
|
Raymond
J. Seabrook, 58, Executive Vice President and Chief Operating Officer,
Global Packaging Operations, as of January 1, 2010; Executive
Vice President and Chief Financial Officer from April 2006 to
December 31, 2009; Senior Vice President and Chief Financial Officer,
April 2000 to April 2006; Senior Vice President, Finance, April 1998
to April 2000; Vice President, Planning and Control, 1996-1998; Vice
President and Treasurer, 1992-1996; Senior Vice President and Chief
Financial Officer, Ball Packaging Products Canada, Inc.,
1988-1992.
|
|
4.
|
Scott
C. Morrison, 47, Senior Vice President, Chief Financial Officer and
Treasurer as of January 1, 2010; Vice President and Treasurer
from April 2002 to December 31, 2009; and Treasurer,
September 2000 to
April 2002.
|
|
5.
|
John
R. Friedery, 53, Senior Vice President since January 1, 2010;
President, Metal Beverage Packaging, Americas and Asia, January 2008
to December 31, 2009; Senior Vice President and Chief Operating
Officer, North American Packaging, January 2004 to January 2008;
President, Metal Beverage Container, 2000 to January 2004; Senior
Vice President, Manufacturing, 1998-2000; Vice President, Manufacturing,
1996-1998; Plant Manager, 1993-1996; Assistant Plant Manager, 1992-1993;
Administrative Manager, 1991-1992; General Supervisor, 1989-1991;
Production Supervisor, 1988-1989.
|
|
6.
|
Charles
E. Baker, 52, Vice President, General Counsel and Assistant Corporate
Secretary since April 2004; Associate General Counsel, 1999 to
April 2004; Senior Director, Business Development, 1995-1999;
Director, Corporate Compliance, 1994-1997; Director, Business Development,
1993-1995.
|
|
7.
|
Harold
L. Sohn, 63, Senior Vice President, Corporate Relations, since
April 25, 2007; Vice President, Corporate Relations, 1993 to
April 25, 2007; Director, Industry Affairs, Packaging Products,
1988-1993.
|
|
8.
|
David
A. Westerlund, 59, Executive Vice President, Administration since
April 2006 and Corporate Secretary since December 2002; Senior
Vice President, Administration, April 1998 to April 2006; Vice
President, Administration, 1997-1998; Vice President, Human Resources,
1994-1997; Senior Director, Corporate Human Resources, July 1994-December
1994; Vice President, Human Resources and Administration, Ball Glass
Container Corporation, 1988-1994; Vice President, Human Resources,
Ball-InCon Glass Packaging Corp.,
1987-1988.
|
|
9.
|
Shawn
M. Barker, 42, Vice President and Controller as of January 1, 2010;
Vice President, Operations Accounting, September 2006 to
December 31, 2009; Corporate Director, Financial Planning and
Analysis, April 2004 to September 2006; Manager, Planning and Analysis,
February 2003 to
April 2004.
|
Page 89
of 97
|
10.
|
Douglas
K. Bradford, 52, Vice President, Financial Reporting and Tax as of
January 1, 2010, Vice President and Controller from April 2003
to December 31, 2009; Controller since April 2002; Assistant
Controller, May 1998 to April 2002; Senior Director, Tax
Administration, January 1995 to May 1998; Director,
Tax Administration, July 1989 to
January 1995.
|
|
11.
|
Lisa
A. Pauley, 48, Vice President, Administration and Compliance since April
2007; Senior Director, Administration and Compliance, 2004 to April 2007;
Vice President, Finance and Administration for BATC, 2002 to 2004; Vice
President, Administrative Services for BATC, 2000 to 2002; various other
positions within the company, 1981
to 2000.
|
|
12.
|
Leroy
J. Williams, Jr., 44, Vice President, Information Technology and Services,
since April 2007; Vice President, Information Systems, 2005 to April 2007;
Executive Director, Colorado Department of Labor & Employment,
February 2005 to April 2005; Secretary of Technology and Chief Information
Officer, January 2003 to January 2005; Chief Information Officer, Colorado
Department of Personnel and Administration, October 2001 to December 2002;
Director B2B Solutions, Qwest Communications, November 1995 to July
2001.
|
Other
information required by Item 10 appearing under the caption “Director Nominees
and Continuing Directors” and “Section 16(a) Beneficial Ownership Reporting
Compliance,” of the company’s proxy statement to be filed pursuant to Regulation
14A within 120 days after December 31, 2009, is incorporated herein by
reference.
|
Item
11.
|
Executive
Compensation
|
The
information required by Item 11 appearing under the caption “Executive
Compensation” in the company’s proxy statement, to be filed pursuant to
Regulation 14A within 120 days after December 31, 2009, is incorporated herein
by reference. Additionally, the Ball Corporation 2000 Deferred Compensation
Company Stock Plan, the Ball Corporation 2005 Deferred Compensation Company
Stock Plan, the Ball Corporation Deposit Share Program and the Ball Corporation
Directors Deposit Share Program were created to encourage key executives and
other participants to acquire a larger equity ownership interest in the company
and to increase their interest in the company’s stock performance. Non-employee
directors may also be a participant in the 2000 Deferred Compensation Company
Stock Plan and the 2005 Deferred Compensation Company Stock Plan.
|
Item
12.
|
Security
Ownership of Certain Beneficial Owners and
Management
|
The
information required by Item 12 appearing under the caption “Voting Securities
and Principal Shareholders,” in the company’s proxy statement to be filed
pursuant to Regulation 14A within 120 days after December 31, 2009, is
incorporated herein by reference.
Securities
authorized for issuance under equity compensation plans are summarized
below:
|
Equity
Compensation Plan Information
|
|||||
|
Plan category
|
Number
of Securities to
be
Issued Upon Exercise
of
Outstanding Options,
Warrants
and Rights
(a)
|
Weighted-average
Exercise
Price of
Outstanding
Options,
Warrants
and Rights
(b)
|
Number
of Securities
Remaining
Available for
Future
Issuance Under
Equity
Compensation Plans
(Excluding
Securities
Reflected
in Column (a))
(c)
|
||
|
Equity
compensation plans approved by security holders
|
5,814,188
|
$
37.92
|
2,244,508
|
||
|
Equity
compensation plans not approved by security holders
|
–
|
–
|
–
|
||
|
Total
|
5,814,188
|
$
37.92
|
2,244,508
|
||
Page 90
of 97
|
Item
13.
|
Certain
Relationships and Related
Transactions
|
The
information required by Item 13 appearing under the caption "Ratification of the
Appointment of Independent Registered Public Accounting Firm," in the company’s
proxy statement to be filed pursuant to Regulation 14A within 120 days
after December 31, 2009, is incorporated herein by reference.
|
Item
14.
|
Principal
Accountant Fees and Services
|
The
information required by Item 14 appearing under the caption "Certain Committees
of the Board," in the company’s proxy statement to be filed pursuant to
Regulation 14A within 120 days after December 31, 2009,
is incorporated herein by reference.
Part
IV
|
Item
15.
|
Exhibits,
Financial Statement Schedules
|
|
(a)
|
(1)
Financial
Statements:
|
|
The
following documents are included in Part II, Item 8:
|
|
|
Report
of independent registered public accounting firm
|
|
|
Consolidated
statements of earnings – Years ended December 31, 2009, 2008 and
2007
|
|
|
Consolidated
balance sheets – December 31, 2009 and 2008
|
|
|
Consolidated
statements of cash flows – Years ended December 31, 2009, 2008 and
2007
|
|
|
Consolidated
statements of shareholders’ equity and comprehensive earnings – Years
ended December 31, 2009, 2008 and 2007
|
|
|
Notes
to consolidated financial statements
|
|
|
(2)
Financial
Statement Schedules:
|
|
|
Financial statement schedules have
been omitted, as they are either not applicable, are considered
insignificant or the
required information is included in
the consolidated financial statements or notes thereto.
|
|
|
(3)
Exhibits:
|
|
|
See the
Index to Exhibits, which appears at the end of this document and is
incorporated by reference herein.
|
Page 91
of 97
SIGNATURES
Pursuant
to the requirements of Section 13 or 15(d) of the Securities Exchange Act of
1934, the registrant has duly caused this report to be signed on its behalf by
the undersigned, thereunto duly authorized.
|
BALL
CORPORATION
|
||
|
(Registrant)
|
||
|
By:
|
/s/
R. David Hoover
|
|
|
R.
David Hoover
|
||
|
Chairman
and Chief Executive Officer
|
||
|
February
25, 2010
|
||
Pursuant
to the requirements of the Securities Exchange Act of 1934, this report has been
signed below by the following persons on behalf of the registrant and in the
capacities and on the dates indicated.
|
(1)
|
Principal
Executive Officer:
|
||
|
/s/
R. David Hoover
|
Chairman
and Chief Executive Officer
|
||
|
R.
David Hoover
|
February
25, 2010
|
||
|
(2)
|
Principal
Financial and Accounting Officer:
|
||
|
/s/
Scott C. Morrison
|
Senior
Vice President, Chief Financial Officer and Treasurer
|
||
|
Scott
C. Morrison
|
February
25, 2010
|
||
|
(3)
|
Controller:
|
||
|
/s/
Shawn M. Barker
|
Vice
President and Controller
|
||
|
Shawn
M. Barker
|
February
25, 2010
|
||
|
(4)
|
A
Majority of the Board of Directors:
|
||
|
/s/
Robert W. Alspaugh
|
*
|
Director
|
|
|
Robert
W. Alspaugh
|
February 25,
2010
|
||
|
/s/
Hanno C. Fiedler
|
*
|
Director
|
|
|
Hanno
C. Fiedler
|
February
25, 2010
|
||
|
/s/
John A. Hayes
|
*
|
Director
|
|
|
John
A. Hayes
|
February
25, 2010
|
||
|
/s/
R. David Hoover
|
*
|
Chairman
of the Board and Director
|
|
|
R.
David Hoover
|
February
25, 2010
|
||
|
/s/
John F. Lehman
|
*
|
Director
|
|
|
John
F. Lehman
|
February
25, 2010
|
||
|
/s/
Georgia R. Nelson
|
*
|
Director
|
|
|
Georgia
R. Nelson
|
February
25, 2010
|
||
|
/s/
Jan Nicholson
|
*
|
Director
|
|
|
Jan
Nicholson
|
February
25, 2010
|
||
|
/s/
George M. Smart
|
*
|
Director
|
|
|
George
M. Smart
|
February
25, 2010
|
||
|
/s/
Theodore M. Solso
|
*
|
Director
|
|
|
Theodore
M. Solso
|
February
25, 2010
|
||
Page 92
of 97
|
/s/
Stuart A. Taylor II
|
*
|
Director
|
|
|
Stuart
A. Taylor II
|
February
25, 2010
|
||
|
/s/
Erik H. van der Kaay
|
*
|
Director
|
|
|
Erik
H. van der Kaay
|
February
25, 2010
|
|
|
*
|
By
R. David Hoover as Attorney-in-Fact pursuant to a Limited Power of
Attorney executed by the directors listed above, which Power of Attorney
has been filed with the Securities and Exchange
Commission.
|
|
BALL
CORPORATION
|
||
|
(Registrant)
|
||
|
By:
|
/s/
R. David Hoover
|
|
|
R.
David Hoover
|
||
|
As
Attorney-in-Fact
|
||
|
February
25, 2010
|
||
Page 93
of 97
Ball
Corporation and Subsidiaries
Annual
Report on Form 10-K
For
the year ended December 31, 2009
Index
to Exhibits
|
Exhibit
Number
|
Description
of Exhibit
|
|
2.1
|
Share
Sale and Transfer Agreement dated August 29/30, 2002, among
Schmalbach-Lubeca Holding GmbH, AV Packaging GmbH, Ball Pan-European
Holdings, Inc. and Ball Corporation (filed by incorporation by reference
to Ball Corporation’s Quarterly Report on Form 10-Q for the quarter
ended September 29, 2002) filed November 14,
2002.
|
|
2.2
|
Amendment
Agreement, dated December 18, 2002, among Schmalbach-Lubeca Holding
GmbH, AV Packaging GmbH, Ball Pan-European Holdings, Inc., Ball
Corporation and Ball (Germany) Acquisition GmbH, amending the Share Sale
and Transfer Agreement, dated August 29/30, 2002, among
Schmalbach-Lubeca Holding GmbH, AV Packaging GmbH, Ball Pan-European
Holdings, Inc. and Ball Corporation (filed by incorporation by reference
to the Current Report on Form 8-K, dated December 19, 2002)
filed December 31, 2002.
|
|
3.i
|
Amended
Articles of Incorporation as of June 24, 2005 (filed by incorporation
by reference to the Quarterly Report on Form 10-Q dated July 3,
2005) filed August 9, 2005.
|
|
3.ii
|
Bylaws
of Ball Corporation as amended January 1, 2009. (Filed
herewith.)
|
|
4.1(a)
|
Registration
Rights Agreement, dated as of December 19, 2002, by and among Ball
Corporation, Lehman Brothers, Inc., Deutsche Bank Securities Inc., Banc of
America Securities LLC, Banc One Capital Markets, Inc., BNP Paribas
Securities Corp., Dresdner Kleinwort Wasserstein-Grantchester, Inc.,
McDonald Investments Inc., Sun Trust Capital Markets, Inc. and Wells Fargo
Brokerage Services, LLC and certain subsidiary guarantors of Ball
Corporation (filed by incorporation by reference to Exhibit 4.1 of the
Current Report on Form 8-K, dated December 19, 2002) filed
December 31, 2002.
|
|
4.1(b)
|
Senior
Note Indenture dated as of December 19, 2002, by and among Ball
Corporation, certain subsidiary guarantors of Ball Corporation and The
Bank of New York, as Trustee (filed by incorporation by reference to the
Current Report on Form 8-K dated December 19, 2002) filed
December 31, 2002.
|
|
4.1(c)
|
Senior
Note Indenture dated as of March 27, 2006, by and among Ball Corporation
and The Bank of New York Trust Company N.A. (filed by incorporation by
reference to the Current Report on Form 8-K dated March 27,
2006) filed March 30, 2006. First Supplemental Indenture dated
March 27, 2006, among Ball Corporation, the guarantors named therein
and The Bank of New York Trust Company, N.A. (filed by incorporation by
reference to Exhibit 4.2 of the Current Report on Form 8-K,
dated March 27, 2006) filed March 30, 2006.
|
|
4.1(d)
|
Second
Supplemental Indenture dated August 20, 2009, among Ball Corporation,
the guarantors named therein and The Bank of New York Mellon Trust
Company, N.A. (formerly known as The Bank of New York Trust Company,
N.A.) (filed by incorporation by reference to Exhibit 4.2 of the
Current Report on Form 8-K, dated August 26, 2009) filed
August 26, 2009.
|
|
4.1(e)
|
Third
Supplemental Indenture dated August 20, 2009, among Ball Corporation,
the guarantors named therein and The Bank of New York Mellon Trust
Company, N.A. (formerly known as The Bank of New York Trust Company,
N.A.) (filed by incorporation by reference to Exhibit 4.3 of the
Current Report on Form 8-K dated August 26, 2009) filed on
August 26, 2009.
|
|
4.1(f)
|
Underwriting
Agreement dated August 11, 2009, among Ball Corporation the
subsidiary guarantors and Goldman, Sachs & Co., as representative of
several underwriters named therein (filed by incorporation by reference to
Exhibit 1.1 of the Current Report on Form 8-K dated
August 14, 2009) filed on August 14,
2009.
|
Page 94
of 97
|
Exhibit
Number
|
Description
of Exhibit
|
|
4.1(g)
|
Rights
Agreement dated as of July 26, 2006, between Ball Corporation and
Computershare Investor Services, LLC (filed by incorporation by reference
to the Current Report on Form 8-K dated August 7, 2006) filed August 7,
2006. First Amendment to the Rights Agreement dated January 23, 2008,
(filed by incorporation by reference to the Current Report on Form 8-K
dated January 23, 2008) filed January 24, 2008.
|
|
10.1
|
Ball
Corporation Deferred Incentive Compensation Plan (filed by incorporation
by reference to the Annual Report on Form 10-K for the year ended
December 31, 1987) filed March 25, 1988.
|
|
10.2
|
Ball
Corporation 1986 Deferred Compensation Plan, as amended July 1, 1994
(filed by incorporation by reference to the Quarterly Report on
Form 10-Q for the quarter ended July 3, 1994) filed
August 17, 1994.
|
|
10.3
|
Ball
Corporation 1988 Deferred Compensation Plan, as amended July 1, 1994
(filed by incorporation by reference to the Quarterly Report on
Form 10-Q for the quarter ended July 3, 1994) filed
August 17, 1994.
|
|
10.4
|
Ball
Corporation 1989 Deferred Compensation Plan, as amended July 1, 1994
(filed by incorporation by reference to the Quarterly Report on
Form 10-Q for the quarter ended July 3, 1994) filed
August 17, 1994.
|
|
10.5
|
Amended
and Restated Form of Severance Benefit Agreement that exists between the
company and its executive officers, effective as of August 1, 1994,
and as amended on January 24, 1996 (filed by incorporation by
reference to the Quarterly Report on Form 10-Q for the quarter ended
March 22, 1996) filed May 15, 1996.
|
|
10.6
|
Ball
Corporation 1986 Deferred Compensation Plan for Directors, as amended
October 27, 1987 (filed by incorporation by reference to the Annual
Report on Form 10-K for the year ended December 31, 1990) filed
April 1, 1991.
|
|
10.7
|
1991
Restricted Stock Plan for Nonemployee Directors of Ball Corporation (filed
by incorporation by reference to the Form S-8 Registration Statement,
No. 33-40199) filed April 26, 1991.
|
|
10.8
|
Ball
Corporation Economic Value Added Incentive Compensation Plan dated
January 1, 1994 (filed by incorporation by reference to the Annual
Report on Form 10-K for the year ended December 31, 1994) filed
March 29, 1995.
|
|
10.9
|
Ball
Corporation 1997 Stock Incentive Plan (filed by incorporation by reference
to the Form S-8 Registration Statement, No. 333-26361) filed
May 1, 1997.
|
|
10.10
|
1993
Stock Option Plan (filed by incorporation by reference to the
Form S-8 Registration Statement, No. 33-61986) filed
April 30, 1993.
|
|
10.11
|
Ball
Corporation Supplemental Executive Retirement Plan (filed by incorporation
by reference to the Quarterly Report on Form 10-Q for the quarter
ended October 2, 1994) filed November 15,
1994.
|
|
10.12
|
Ball
Corporation Long-Term Cash Incentive Plan, dated October 25, 1994,
amended and restated effective January 1, 2003 (filed by
incorporation by reference to the Annual Report on Form 10-K for the
year ended December 31, 2003) filed March 12,
2004.
|
|
10.13
|
Amended
and Restated Form of Severance Agreement (Change of Control Agreement)
that exists between the company and its executive officers dated
December 17, 2009. (Filed herewith.)
|
|
10.14
|
Ball
Corporation 2000 Deferred Compensation Company Stock Plan (filed by
incorporation by reference to the Annual Report on Form 10-K for the
year ended December 31, 2001) filed March 28,
2002.
|
|
10.15
|
Ball
Corporation Deposit Share Program, as amended (filed by incorporation by
reference to the Quarterly Report on Form 10-Q for the quarter ended
July 4, 2004) filed August 11,
2004.
|
Page 95
of 97
|
Exhibit
Number
|
Description
of Exhibit
|
|
10.16
|
Ball
Corporation Directors Deposit Share Program, as amended. This plan is
referred to in Item 11, the Executive Compensation section of this
Form 10-K (filed by incorporation by reference to the Quarterly
Report on Form 10-Q for the quarter ended July 4, 2004) filed
August 11, 2004.
|
|
10.17
|
Ball
Corporation 2005 Deferred Compensation Plan, effective January 1,
2005 (filed by incorporation by reference to the Current Report on
Form 8-K dated December 23, 2005) filed December 23,
2005.
|
|
10.18
|
Ball
Corporation 2005 Deferred Compensation Company Stock Plan, effective
January 1, 2005 (filed by incorporation by reference to the Current
Report on Form 8-K dated December 23, 2005) filed
December 23, 2005.
|
|
10.19
|
Ball
Corporation 2005 Deferred Compensation Plan for Directors, effective
January 1, 2005 (filed by incorporation by reference to the Current
Report on Form 8-K dated December 23, 2005) filed
December 23, 2005.
|
|
10.20
|
Credit
agreement dated October 13, 2005, among Ball Corporation, Ball
European Holdings S.ar.l., Ball Packaging Products Canada Corp. and each
Other Subsidiary Borrower, Deutsche Bank AG, New York Branch, as a Lender,
Administrative Agent and Collateral Agent and The Bank of Nova Scotia, as
the Canadian Administrative Agent (filed by incorporation by reference to
the Current Report on Form 8-K dated October 17, 2005) filed
October 17, 2005. First Amendment to Credit Agreement by and between
Ball Corporation, Ball European Holdings S.a.r.l., as lenders and Deutsche
Bank AG, New York Branch, as Administrative Agent for the lenders with
Deutsche Bank Securities Inc. and J.P. Morgan Securities Inc., as joint
lead arrangers for the Term D Loans (filed by incorporation by
reference to the Current Report on Form 8-K dated March 27,
2006) filed March 30, 2006.
|
|
10.21
|
Subsidiary
Guaranty Agreement dated as of October 13, 2005, among certain
Domestic subsidiaries listed therein as Guarantors, and Deutsche Bank AG,
New York Branch, as Administrative Agent (filed by incorporation by
reference to the Current Report on Form 8-K dated October 17, 2005)
filed October 17, 2005.
|
|
11
|
Statement
re: Computation of Earnings per Share (filed by incorporation by reference
to the notes to the consolidated financial statements in Item 8,
“Financial Statements and Supplementary Data”).
|
|
12
|
Statement
re: Computation of Ratio of Earnings to Fixed Charges. (Filed
herewith.)
|
|
14
|
Ball
Corporation Executive Officers and Board of Directors Business Ethics
Statement (filed by incorporation by reference to the Annual Report on
Form 10-K for the year ended December 31, 2005) filed
February 22, 2006.
|
|
18.1
|
Letter
re: Change in Accounting Principles regarding change in pension plan
valuation measurement date (filed by incorporation by reference to the
Annual Report on Form 10-K for the year ended December 31, 2002)
filed March 27, 2003.
|
|
18.2
|
Letter
re: Change in Accounting Principles regarding the change in accounting for
certain inventories (filed by incorporation by reference to the Annual
Report on Form 10-K for the year ended December 31, 2006) filed
February 22, 2007.
|
|
18.3
|
Letter
re: Change in Accounting Principles regarding the change in testing date
for potential impairment of goodwill. (Filed herewith.)
|
|
21
|
List
of Subsidiaries of Ball Corporation. (Filed herewith.)
|
|
23
|
Consent
of Independent Registered Public Accounting Firm. (Filed
herewith.)
|
|
24
|
Limited
Power of Attorney. (Filed
herewith.)
|
Page 96
of 97
|
Exhibit
Number
|
Description
of Exhibit
|
|
31
|
Certifications
pursuant to Rule 13a-14(a) or Rule 15d-14(a), by R. David Hoover, Chairman
of the Board and Chief Executive Officer of Ball Corporation, and by Scott
C. Morrison, Senior
Vice President, Chief Financial Officer and Treasurer of Ball
Corporation. (Filed herewith.)
|
|
32
|
Certifications
pursuant to Rule 13a-14(b) or Rule 15d-14(b) and Section 1350 of Chapter
63 of Title 18 of the United States Code, by R. David Hoover,
Chairman of the Board and Chief Executive Officer of Ball Corporation, and
by Scott C. Morrison, Senior
Vice President, Chief Financial Officer and Treasurer of Ball
Corporation. (Furnished herewith.)
|
|
99.1
|
Specimen
Certificate of Common Stock (filed by incorporation by reference to the
Annual Report on Form 10-K for the year ended December 31, 1979)
filed March 24, 1980.
|
|
99.2
|
Cautionary
statement for purposes of the "safe harbor" provisions of the Private
Securities Litigation Reform Act of 1995, as amended. (Filed
herewith.)
|
Page 97 of 97