Attached files
| file | filename |
|---|---|
| EX-21 - EXHIBIT 21 TO ATC 2009 FORM 10-K - ATC Technology CORP | exhibit21.htm |
| EX-23 - EXHIBIT 23 TO ATC 2009 FORM 10-K - ATC Technology CORP | exhibit23.htm |
| EX-31.2 - EXHIBIT 31.2 TO ATC 2009 FORM 10-K - ATC Technology CORP | exhibit31_2.htm |
| EX-32.1 - EXHIBIT 32.1 TO ATC 2009 FORM 10-K - ATC Technology CORP | exhibit32_1.htm |
| EX-31.1 - EXHIBIT 31.1 TO ATC 2009 FORM 10-K - ATC Technology CORP | exhibit31_1.htm |
| EX-32.2 - EXHIBIT 32.2 TO ATC 2009 FORM 10-K - ATC Technology CORP | exhibit32_2.htm |
| EX-10.12 - EXHIBIT 10.12 TO ATC 2009 FORM 10-K - ATC Technology CORP | exhibit10_12.htm |
| EX-10.21 - EXHIBIT 10.21 TO ATC 2009 FORM 10-K - ATC Technology CORP | exhibit10_21.htm |
| EX-10.24 - EXHIBIT 10.24 TO ATC 2009 FORM 10-K - ATC Technology CORP | exhibit10_24.htm |
| EX-10.23 - EXHIBIT 10.23 TO ATC 2009 FORM 10-K - ATC Technology CORP | exhibit10_23.htm |
| EX-10.22 - EXHIBIT 10.22 TO ATC 2009 FORM 10-K - ATC Technology CORP | exhibit10_22.htm |
UNITED
STATES
SECURITIES
AND EXCHANGE COMMISSION
Washington,
D.C. 20549
__________________
FORM 10-K
(Mark
One)
|
x
|
ANNUAL
REPORT PURSUANT TO SECTION 13 OR 15(d) OF THE SECURITIES EXCHANGE ACT OF
1934
|
For
the fiscal year ended December 31, 2009
OR
|
o
|
TRANSITION REPORT
PURSUANT TO SECTION 13 OR 15(d) OF THE SECURITIES EXCHANGE ACT OF
1934
|
Commission
file number 0-21803
__________________

ATC
Technology Corporation
(Exact
name of registrant as specified in its charter)
|
DELAWARE
|
95-4486486
|
|
(State
or other jurisdiction of
incorporation or organization)
|
(I.R.S.
Employer Identification No.)
|
|
1400
Opus Place, Suite 600, Downers Grove, IL
|
60515
|
|
(Address
of principal executive offices)
|
(Zip
Code)
|
Registrant's
telephone number, including area code: (630) 271-8100
Securities
registered pursuant to Section 12(b) of the Act:
|
Title
of Each Class
|
Name
of Each Exchange on Which Listed
|
|
|
Common
Stock, $.01 par value
|
Nasdaq
Global Select Market
|
Securities
registered pursuant to Section 12(g) of the Act: None
Indicate
by check mark if the registrant is a well-known seasoned issuer, as defined in
Rule 405 of the Securities Act.
Yes o No x
Indicate
by check mark if the registrant is not required to file reports pursuant to
Section 13 or Section 15(d) of the
Act. Yes o No x
Indicate
by check mark whether the registrant (1) has filed all reports required to be
filed by Section 13 or 15(d) of the Securities Exchange Act of 1934 during the
preceding 12 months (or for such shorter period that the registrant was required
to file such reports), and (2) has been subject to such filing requirements for
the past 90 days. Yes x No o
Indicate
by check mark whether the registrant has submitted electronically and posted on
its corporate Web site, if any, every Interactive Data File required to be
submitted and posted pursuant to Rule 405 of Regulation S-T (§232.405 of this
chapter) during the preceding 12 months (or for such shorter period that the
registrant was required to submit and post such
files). Yes o No o
Indicate
by check mark if disclosure of delinquent filers pursuant to Item 405 of
Regulation S-K is not contained herein, and will not be contained, to the best
of registrant's knowledge, in definitive proxy or information statements
incorporated by reference in Part III of this Form 10-K or any amendment to
this Form 10-K. o
Indicate
by check mark whether the registrant is a large accelerated filer, an
accelerated filer, a non-accelerated filer, or a smaller reporting
company. See definitions of “large accelerated filer,” “accelerated
filer,” and “smaller reporting company” in Rule 12b-2 of the Exchange Act.
(Check one):
Large
accelerated filer o Accelerated
filer x Non-accelerated
filer o Smaller
reporting company o
(Do not
check if a smaller reporting company)
Indicate
by check mark whether the registrant is a shell company (as defined in Rule
12b-2 of the Exchange
Act). Yes o No x
The
aggregate market value of the voting stock held by non-affiliates of the
registrant (based on the closing price of such stock, as reported by the Nasdaq
National Market, on June 30, 2009) was $282 million. The Company does not have
any non-voting stock outstanding.
The
Registrant had 20,055,373 shares of Common Stock outstanding as of February 16,
2010.
DOCUMENTS
INCORPORATED BY REFERENCE:
Portions
of the registrant’s proxy statement in connection with its annual meeting of
shareholders to be held in 2010, are incorporated by reference in Items 10, 11,
12, 13 and 14 of Part III of this Form 10-K.
ANNUAL
REPORT ON FORM 10-K
FOR
THE FISCAL YEAR ENDED DECEMBER 31, 2009
|
Page
|
||
SPECIAL
NOTE REGARDING FORWARD-LOOKING STATEMENTS
This
Annual Report contains forward-looking statements (as such term is defined in
Section 27A of the Securities Act of 1933 and Section 21E of the
Securities Exchange Act of 1934) and information relating to us that are based
on the current beliefs of our management as well as assumptions made by and
information currently available to management, including statements related to
the markets for our products and services, general trends in our operations or
financial results, plans, expectations, estimates and beliefs. In
addition, when used in this Annual Report, the words "may," "could," "should,"
"anticipate," "believe," "estimate," "expect," "intend," "plan," "predict" and
similar expressions and their variants, as they relate to us or our management,
may identify forward-looking statements. These statements reflect our
judgment as of the date of this Annual Report with respect to future events, the
outcome of which is subject to risks, which may have a significant impact on our
business, operating results or financial condition. Readers are
cautioned that these forward-looking statements are inherently
uncertain. Should one or more of these risks or uncertainties
materialize, or should underlying assumptions prove incorrect, actual results or
outcomes may vary materially from those described herein. We
undertake no obligation to update forward-looking statements. The
risks identified in Item 1A. “Risk Factors,” among others, may impact
forward-looking statements contained in this Annual Report.
PART
I
Overview
ATC
Technology Corporation, through its subsidiaries, provides outsourced supply
chain logistics services and engineering solutions to the consumer electronics
industries and light-, medium- and heavy-duty vehicle
aftermarket. Through our Logistics business, we offer value-added
supply chain services primarily to the wireless, high-end consumer electronics,
broadband and cable, and light vehicle automotive electronics markets. These
services include fulfillment, returns management, reverse logistics, packaging,
test and repair, and other related services. Through our Drivetrain
business, we provide customized remanufacturing services focused on complex
light-, medium- and heavy-duty vehicle drivetrain products, consisting
principally of automatic transmissions and to a lesser extent engines, that are
primarily sold through the service, repair and parts organizations of our
customers. We generally provide services under contractual
relationships with customers that distribute high-value, complex
products.
We
believe our service offerings are differentiated from those of our competitors
by the degree of customization we provide coupled with our focus on quality and
the consistency of our performance. We have developed business
processes, technical capabilities and information technology systems that allow
us to design flexible and scaleable solutions that help our customers reduce
their costs, improve their supply chain efficiency and enhance their
profitability. We manage, monitor and communicate detailed
information about our processes and our customers’ shipments, returns, products
and inventory on a real-time basis. This information is readily
accessible to our customers, easy-to-use, and customized to fit their needs. We
also use this information to analyze and improve the performance of our
businesses and to help us achieve our exacting quality and service
benchmarks.
ATC
Technology Corporation was incorporated in Delaware in 1994 and became a
publicly traded company in 1996. Prior to June 2008, we were known as
Aftermarket Technology Corp.
Our
Logistics Business
Our
Logistics business provides a number of value-added services that generate
operational efficiencies for our customers through the outsourcing of certain
supply chain functions. Specifically, our Logistics business provides
value-added warehousing, packaging and distribution, reverse logistics, turnkey
order fulfillment, electronic equipment testing, refurbishment and repair, and
transportation management services. Except for component parts to
support our repair services and certain product accessories and packaging
materials to support our packaging services, we generally do not take ownership
of inventory. As a result, our working capital needs are relatively
less than other logistics service providers who take ownership of
inventory. Our principal customers are in the wireless carrier,
wireless original equipment manufacturer (OEM), consumer electronics and
automotive industries and include AT&T and TomTom. Our Logistics
business segment sales accounted for 71.2%, 66.6%, 55.5%, 52.9% and 36.5% of our
2009, 2008, 2007, 2006 and 2005 net sales, respectively.
We
determine our logistics processes in close consultation with our
customers. Our information technology systems allow rapid integration
with our customers’ systems and, in conjunction with our customized processes,
help us to meet demanding logistics and repair requirements. By
improving our customers’ inventory turns and speed of repair and refurbishments,
as well as enabling our customers to realize value from returned products, we
believe we help our customers increase their profitability, reduce their capital
investments and enhance their opportunities for growth. We customize
our products and services to meet the specific individual needs of customers
instead of offering one standard suite of products and services.
Our
Logistics customers market and distribute complex and serialized consumer
electronics such as wireless devices, navigation devices, broadband and cable
devices, and light vehicle audio systems and instrument clusters. As
part of our service offering, we provide bulk and direct fulfillment of wireless
devices and certain broadband and cable devices for AT&T and its
partners. We deliver products both to AT&T retail locations and
directly to individuals and provide inventory tracking and management, process
warranty-service exchanges and perform test and repair
services. Growth in our Logistics business has been the result of
growth in our customers’ business as well as through the addition of new
services for those customers. For example, we now provide forward
fulfillment, packaging, returns management, test and repair services and
transportation management services for AT&T and
TomTom. Additionally, we provide various subsets of our full suite of
logistics service offerings for our other customers. We generally
provide our services to each customer pursuant to a contract with detailed
statements of work. These contracts typically may be terminated by
the customer on 180 days notice or less. The statements of work for
forward and reverse logistics services and test and repair programs with
AT&T run through 2010.
Our Drivetrain
Business
Our
Drivetrain business remanufactures drivetrain products, which we distribute
primarily to original equipment service organizations and their outlets (i.e., the service and repair
organizations of automotive OEMs) as well as to certain distributors in the
independent aftermarket. Our Drivetrain products consist principally
of remanufactured automatic transmissions and remanufactured engines and also
include remanufactured torque converters and valve bodies. Our
principal Drivetrain customers are Ford, Chrysler and Allison. Honda
was a significant Drivetrain customer prior to the end of our automatic
transmission remanufacturing program with them, which was substantially
completed by the end of 2009. Drivetrain business net sales accounted
for 28.8%, 33.4%, 44.5%, 47.1% and 63.5% of our 2009, 2008, 2007, 2006 and 2005
net sales, respectively.
During
the later part of 2008, our Drivetrain customers and the supporting supply base
experienced unprecedented distress due to the significant adverse changes in the
North American vehicle industry caused by the economic slowdown. In
conjunction with these adverse changes, we took actions to restructure our North
American Drivetrain operations, including the 2009 closure and consolidation of
operations at our Springfield, Missouri facility into our Drivetrain facility in
Oklahoma City, Oklahoma. In connection with this restructuring, we
recorded pre-tax charges of $9.7 million during the fourth quarter of 2008 and
$5.1 million during 2009.
These
events also caused us to reassess the carrying value of goodwill of our North
American Drivetrain business, and as a result we recorded an impairment charge
of $79.1 million during the fourth quarter of 2008. During 2009, we
received notice of the impending loss of our automatic transmission
remanufacturing program with Honda, as a result of which we recorded an
additional goodwill impairment charge of $37.0 million during the second quarter
of 2009.
See Item
7. “Management’s Discussion and Analysis of Financial Condition and Results of
Operations” and Item 8. “Consolidated Financial Statements and Supplementary
Data –Note 2, Note 5 and Note 19.”
Remanufactured
products are used in the repair of vehicles by dealers and other service outlets
during both the warranty and post-warranty periods following the sale of a
vehicle. Remanufacturing is a process through which used components
known as “cores” are returned to a central facility where they are disassembled
and the parts are inspected, cleaned, refurbished and tested. We then
combine the reusable parts with new parts to create remanufactured components
that are of comparable quality to new components. We remanufacture
some of the most complex components of a vehicle, such as the transmission and
engine. Generally, our customers and their designated suppliers
provide parts and cores to us and the customer retains title to the
core. However, our medium- and heavy-duty remanufacturing program
with Allison requires us to purchase the cores from them. In cases
where we do not take ownership of the cores, our working capital requirements
are reduced. We believe remanufactured products are generally lower
in cost than new replacement components and frequently facilitate a faster, more
reliable repair when compared to components that are rebuilt at service
outlets. In addition, remanufactured components efficiently reuse
existing parts and are less damaging to the environment.
We
generally sell our products to each customer pursuant to a supply arrangement
that typically may be terminated by the customer on 90 days notice or
less. Our contracts for transmission remanufacturing with Ford and
Chrysler expired at the end of 2009 and 2008, respectively, and are on a
month-to-month basis while we negotiate renewals. Our contract with
Allison runs through 2012.
Our
facilities that remanufacture transmissions for OEMs have QS-9000 or ISO-9000
certification, a complete quality management system developed for manufacturers
who subscribe to the ISO-9002 quality standards. The system is designed to
help suppliers, such as us, develop a quality system that emphasizes defect
prevention and continuous improvement in manufacturing processes.
Industry
Background
Logistics
Industry
Logistics
can generally be defined as the management and transportation of materials and
inventory throughout the supply chain as well as the provision of value-added
services such as assembly, packaging, programming, testing and repair. The
logistics industry has expanded rapidly over the last 15 years due to
dramatic improvements in technology, increased demand in customer service
requirements, and the significant value proposition provided to companies by
third-party logistics (3PL) providers. As more companies focus on
core competencies, many companies have decided to outsource the management of
all or part of their supply chain as a means to reduce costs, increase asset and
labor flexibility, and improve customer service. As a result, 3PL
providers have become extensively involved in the full range of customer supply
chain functions. The operational efficiencies of a 3PL provider enable
companies to reduce investments in facilities, information technology, inventory
and personnel. Third-party services include turnkey supply chain services,
such as order fulfillment, product labeling and packaging, inventory and
warehouse management, product return, refurbishment and repair, electronics
equipment testing, reverse logistics and the physical movement of
goods.
We
compete in the value-added warehousing market, a subset of the 3PL market, which
we believe is fragmented with no dominant industry player and growing
rapidly. According to Armstrong & Associates, Inc.’s 2009 North
American 3PL Market Overview report, this market size was estimated to be $29.4
billion of gross revenues in 2008.
Automotive
Aftermarket
Demand
for replacement or repair of drivetrain products is a function of numerous
factors, such as the number of vehicles in operation, the average age of
vehicles and the average number of miles driven per vehicle. Within
this overall market, factors that influence demand for our remanufactured
products, when compared to repair services, include product complexity, OEM
warranty policies governing repair-versus-replace decisions made by their
dealers, and the length of warranty periods. We supply our products
to the automotive aftermarket, which consists of parts and services for vehicles
after their original purchase.
Remanufacturing
Process
In our
remanufacturing process, we generally obtain used transmission and engine cores
from our customers or their designated suppliers. We then sort the cores
by vehicle make and model and either place them into immediate production or
store them until needed. In the remanufacturing process, we evaluate the
cores, disassemble them into their component parts, and inspect, clean,
refurbish and test the components that can be incorporated into the
remanufactured product. We replace components that we determine to be not
reusable or repairable with other remanufactured or new components. We
conduct inspection and testing at various stages of the remanufacturing process,
and we test each finished assembly on equipment designed to simulate performance
under operating conditions. After testing, we generally package completed
products for immediate delivery.
Our
Competitive Strengths
We
believe we offer products and solutions that improve our customers’ profits and
operations as a result of our competitive strengths, which include the
following:
Customized
Service Offering
We are
recognized by our customers for our high level of service and our flexibility in
providing product and service solutions. This approach involves our
team of specialists who work with the customer to understand the specific
deliverables required by that customer, understand communication points within
the supply chain, design solutions, establish operational and business metrics,
eliminate waste, and improve efficiencies. We offer a broad array of
products and services to our logistics customers, which enables us to work with
the customer to customize our products and services to meet the specific
individual needs of the customer instead of offering one standard suite of
products and services. We believe our “One-Size-Fits-One” approach
helps us attract and retain customers. For instance, for AT&T,
our supply chain management services include product and warranty returns, order
entry processing, testing and repair, warehousing, picking, kitting, customized
packaging, transportation management, and shipping and delivery of wireless
and/or broadband devices. Our integrated logistics services also include
inventory management and private labeling.
High
Quality Through Engineering and Technical Know-How
Our
remanufactured products are of consistently high quality due to the precision
manufacturing techniques, technical upgrades, and rigorous inspection and
testing procedures employed in our remanufacturing processes. We
partner with our customers to design processes that help ensure that our
remanufacturing of complex products such as automatic transmissions, valve
bodies, torque converters, engines and automotive electronics replicates OEM
quality and test procedures. Our remanufacturing process is completed by
testing products using state-of-the-art equipment such as sophisticated test
stands that enable us to replicate OEM test procedures. We are
committed to upholding the quality of our customers’ products and hold QS-9000
Certification, ISO-9000 Certification and Ford’s Q1 Certification. We
monitor our procedures and processes, which allows us to identify and to quickly
correct situations that could impact our product quality. We have a
team of engineers dedicated to enhancing and adding new products, sharing
innovative solutions and reducing our customers’ expenses.
Information
Technology Capabilities
We use
information technology to help meet customers’ needs in product security and
confidentiality, product qualification and identification, inventory management,
and interactive electronic communication. We also provide customers
with solutions for their supply chain management, reverse logistics, product
tracking, and product history needs, while maintaining service and quality
levels. Our use of information technology allows us to provide
flexible, accurate, customized logistics solutions to help meet customer
requirements while providing full visibility across the supply
chain. Our solutions can reduce customer-required investment in
information technology, and can improve the efficiency of our customers’
inventory and supply chains by providing enhanced traceability and visibility of
inventory, resulting in market-leading performance metrics and improved customer
profitability. In addition, our information technology systems allow
for rapid integration with our customers’ systems, enhancing the quality of our
services.
Strong,
Experienced Management Team
Our
executive and operations management team has extensive
experience. Our President and Chief Executive Officer, Todd Peters,
has over 20 years of financial, acquisition and integration, and automotive
operations experience. Our Chairman of the Board, Edward Stewart, has
served on the Company’s Board of Directors for five years and has 37 years of
operations experience in the manufacturing and financial services
industries. Our Vice President and Chief Financial Officer, John
Pinkerton, has over 30 years of financial and strategic planning leadership
experience. The President of our Logistics business, Antony Francis,
has nearly 40 years of financial and logistics operations experience, and the
head of our Drivetrain business, Michael Lepore, has over 30 years of operations
experience in the automotive industry.
Our
Growth Strategies
Our
strategy is to be a valued partner that provides logistics, return and repair
services, and remanufacturing for customers that distribute high-value, complex
products in various markets. We will grow by leveraging our strong
customer relationships while we develop new customers and products.
Growth
Within Our Logistics Business
We
believe we are well positioned to capitalize on growth in the 3PL services
market, particularly with existing and new customers in the consumer
electronics, broadband and cable, and vehicle industries, by offering
customized, reliable and cost effective solutions for customers with complex
logistics requirements involving high-value products. In 2009, we
were awarded new logistics business that we expect to generate $79 million of
annualized revenue.
We intend
to increase penetration of our existing Logistics business customer base by
broadening our offering of Logistics products and services and by marketing our
core competencies as solutions to meet our customers’ needs. Under our
“One-Size-Fits-One” philosophy, we will continue to leverage our broad range of
services to target new customers that provide serialized products across a
variety of industries and provide them with customized products and services to
meet their specific needs instead of offering one standard suite of products and
services. We also intend to leverage our core competencies in
logistics and electronics refurbishment by working with our existing and new
customers to identify products and services where we can add value in
satisfaction of our customers’ specific needs. We intend to further
expand our penetration of the market for logistics services and electronics
repair through the addition of other wireless carriers, wireless OEMs, and
broadband and cable providers to our customer base and through penetration of
and into other vertical markets, including electronics and
computers. We have also identified and targeted several new market
segments including additional classes of consumer electronics.
Growth
Within Our Drivetrain Business
Our
business and product development teams are working to identify new products and
processes that enable us to compete for additional business with our customers
by helping them to increase their penetration of the drivetrain repair market
and/or reduce their total warranty costs. For example, we are working
with certain of our customers to (i) develop and implement products and
strategies designed to enable them to penetrate, or increase their penetration
of, the post-warranty replacement market for automotive transmissions and (ii)
introduce or expand the use of remanufactured transmissions as a transmission
repair alternative in warranty applications.
Additional
Corporate Initiatives
Leverage Operating Efficiency and
Productivity Gains. We regularly evaluate our operating
efficiency and productivity in order to increase our profitability and cash
flows. Over the last several years, we have completed numerous lean
manufacturing, Six Sigma and continuous improvement projects that have resulted
in significant cost savings and increased capacity utilization. Our
“Lean and Continuous Improvement” program has helped us achieve margin
improvements and further enhancement of quality. We believe there are
additional opportunities to further improve our cost base and increase
earnings.
Selectively Pursue
Acquisitions. From time to time we evaluate potential
acquisitions of complementary businesses that we believe will broaden our
product offerings, diversify our customer base or provide us access to new
markets. We have established criteria by which we evaluate potential
acquisitions, which we use to identify and pursue only those that we believe
will enhance long-term stockholder value. We have made various
acquisitions in the past and, to the extent suitable acquisition candidates,
acquisition terms and financing are available, we may pursue acquisitions in the
future.
Competition
In our
Logistics business, we primarily compete in a fragmented market as a niche
participant offering a specialized value-added service requiring stringent
service requirements. Based on our performance levels, we believe we are
well positioned to compete in this market. However, some of our
competitors in this segment such as Caterpillar Logistics and UPS Logistics are
larger and have greater financial and other resources.
In our
Drivetrain business, we primarily compete in the market for remanufactured
transmissions sold to the automotive aftermarket through the OEM dealer
networks. This market, narrowly defined, is one in which the majority of
industry supply comes from a limited number of participants. Competition
is based primarily on product quality, service, delivery, technical support and
price.
Employees
As of
December 31, 2009, we had an aggregate workforce of approximately 3,300
individuals, including full-time employees and temporary workers. We
believe our employee and labor relations are good. We have not experienced
any work stoppages to date and currently none of our employees is represented by
a labor union.
Environmental
We are
subject to various evolving federal, state, local and foreign environmental laws
and regulations governing, among other things, emissions to air, discharge to
waters and the generation, handling, storage, transportation, treatment and
disposal of a variety of hazardous and non-hazardous substances and
wastes. These laws and regulations provide for substantial fines and
criminal sanctions for violations and impose liability for the costs of cleaning
up, and damages resulting from, past spills, disposals or other releases of
hazardous substances.
In
connection with the acquisition of our subsidiaries, some of which have been
subsequently divested or relocated, we conducted certain investigations of these
companies’ facilities and their compliance with applicable environmental
laws. The investigations, which included Phase I assessments by
independent consultants of all manufacturing and various distribution
facilities, found that a number of these facilities have had or may have had
releases of hazardous materials that may require remediation and also may be
subject to potential liabilities for contamination from off-site disposal of
substances or wastes. These assessments also found that reporting and
other regulatory requirements, including waste management procedures, were not
or may not have been satisfied. Although there can be no assurance,
we believe that, based in part on the investigations conducted, in part on
certain remediation completed prior to or since the acquisitions, and in part on
the indemnification provisions of the agreements entered into in connection with
our acquisitions, we will not incur any material liabilities relating to these
matters.
In
connection with the October 2000 sale of our former Distribution Group
business, we agreed to indemnify the buyer against environmental liability at
Distribution Group facilities that had been closed prior to the Distribution
Group sale, including former facilities in Azusa, California, Mexicali, Mexico
and Dayton, Ohio. We also agreed to indemnify the buyer against any
other environmental liability of the Distribution Group relating to periods
prior to the closing of the Distribution Group sale. Our
indemnification obligations to the buyer are subject to an $850,000 deductible
($100,000 in the case of the closed facilities) and a $12.0 million cap
(except with respect to the closed facilities).
Segment
Reporting
We have
two reportable segments: the Logistics segment and the Drivetrain
segment. See Item 7. “Management’s Discussion and Analysis of
Financial Condition and Results of Operations” and Item 8. “Consolidated
Financial Statements and Supplementary Data – Note 18.”
Available Information
Our
internet website is www.goATC.com. We
make available free of charge on our website our annual reports on Form 10-K,
quarterly reports on Form 10-Q, current reports on Form 8-K and any other
filings we make with the Securities and Exchange Commission as soon as
reasonably practicable. This information may also be obtained by
calling the Securities and Exchange Commission at 1-800-SEC-0330. The
Securities and Exchange Commission also maintains an internet website at www.sec.gov that
contains reports and other information regarding issuers like us that file
electronically with the Commission. We will provide a copy of any of the
foregoing documents to stockholders without charge upon written request to us at
1400 Opus Place, Suite 600, Downers Grove, Illinois 60515, attention:
Corporate Secretary. The contents of our website are not part of this
Annual Report.
We
believe that the following are the material risks currently facing our
business. Additional risks we are not presently aware of, or that we
currently believe are immaterial, may also impair our business
operations. Any of these risks could have a material adverse effect
on our financial condition, results of operations or stock
price. Readers should also refer to the other information included in
this Annual Report, including our consolidated financial statements and related
notes thereto.
We
rely on a few major customers for a significant majority of our business and the
loss of any of those customers, or significant changes in prices or other terms
with any of our major customers, could reduce our net income and operating
results.
A few
customers account for a significant majority of our net sales each
year. In 2009, we had three customers that individually accounted for
10% or more of our net sales: AT&T (48%), TomTom (11%) and Ford
(10%). If we lose any of these customers, or if any of them reduces
or cancels a significant order or program, our net sales and operating results
could decrease significantly.
Most of
our contracts or arrangements with our customers have a term of three years or
less and are terminable by the customer subject to a notice period that ranges
from 30 days or less to 180 days. In addition, we periodically
renegotiate prices and other terms with our customers, and have historically
experienced price reductions in connection with contract
renewals. Furthermore, the current economic climate may lead our
customers to more aggressively pursue cost reduction initiatives, which could
adversely affect the prices we charge for our products and
services. Because of the periodic expiration of our customer
contracts, the short termination periods of those contracts and periodic price
negotiations, we cannot give any assurances of continued business with any of
our customers or the stability of prices for our products and services and,
therefore, our revenue streams.
Our
contract with AT&T expires at the end of 2010 and no assurance can be given
that we will be successful in negotiating a new contract.
From time
to time one or more of our customers could experience severe financial
difficulty, which could lead to such customers no longer utilizing our products
and services, resulting in a potentially material decline in our
revenue. Furthermore, the bankruptcy of any such customer could
adversely affect our ability to collect the related accounts
receivable.
Loss of a
significant customer could also result in us incurring asset impairment charges
and restructuring costs associated with the loss of the customer.
During
2009 we received notice of the impending loss of our automatic transmission
remanufacturing program with Honda, which accounted for 7% and 10% of our net
sales in 2009 and 2008, respectively. The program was substantially
completed by the end of 2009. In connection with the loss of this
business, our Drivetrain segment recorded a goodwill impairment charge of $37
million during the second quarter of 2009.
Our
Logistics business is dependent on the strength of AT&T.
AT&T,
which accounted for 68% of our Logistics segment net sales for 2009, operates in
a highly competitive technology market. The number of wireless
devices sold by AT&T, whether to new subscribers or as replacements to
existing subscribers, is dependent on its ability to keep pace with
technological advancements and to provide service programs and prices that are
attractive to current and potential customers. Our net sales to
AT&T are substantially related to the number of wireless devices sold by
AT&T. Consequently, any material decrease in wireless devices
sold by AT&T would have a material adverse effect on our operating
results.
Our
Drivetrain business is dependent on our business with Ford.
Ford
accounted for 35% of our Drivetrain segment net sales for
2009. Consequently, any material decrease in our business with Ford
will materially and adversely affect Drivetrain net sales. Our
contract with Ford has expired and is currently on a month-to-month basis while
we negotiate a new contract. No assurance can be given that we will
be successful in negotiating a new contract.
Current
economic conditions could impact the market for our customers’ products, which
would in turn adversely affect our results of operations.
Current
economic conditions could cause consumers to reduce their purchases of
discretionary items that are sold by our customers, such as cellular devices and
GPS units, which would in turn reduce the demand for our Logistics
services. These conditions also could lead to automobile owners
deferring the repair of their out-of-warranty vehicles, which would reduce the
demand for our Drivetrain products. Such a reduction in demand could
have a material adverse effect on our results of operations.
Our
financial results are affected by our customers' policies, which are outside our
control.
Our
financial results are also affected by the policies of our
customers. Changes to our key customers’ policies that could
materially affect our business include:
|
|
•
|
our
customers’ product return policies becoming more
restrictive;
|
|
|
•
|
reductions
in the amount of inventory our customers elect to
retain;
|
|
|
•
|
guidelines
that affect dealer decisions to rebuild transmissions at the dealer rather
than install remanufactured
transmissions;
|
|
|
•
|
a
decision not to use remanufactured units for warranty
replacements;
|
|
|
•
|
shortened
warranty periods that could reduce the demand for our products;
and
|
|
|
•
|
pricing
strategies.
|
Substantial
competition could reduce our market share and significantly harm our financial
performance.
Our
industry segments are highly competitive. We may not be successful in
competing against other companies, some of which are larger than us and have
greater financial and other resources available to them than we
do. Increased competition could require us to reduce prices or take
other actions that may have a material adverse effect on our operating
results.
Shortages
of component parts or cores could adversely affect our business.
The test
and repair portion of our Logistics business relies on component parts supplied
by various third parties, and our Drivetrain business relies on component parts
and used transmissions and engines (known as cores) supplied by our customers or
various third parties. From time to time we could experience
shortages of any of these components or cores due to demand, material shortages
or the economic condition of the supplier. Any shortage of parts or
cores would prevent us from completing orders on a timely basis, which could
have a material adverse effect on our business.
Our
Drivetrain financial results are affected by transmission failures, which are
outside our control.
Financial
results in our Drivetrain segment are affected by transmission failures, and a
drop in the number of failures could adversely affect sales or profitability or
lead to variability of operating results. Generally, if transmissions
last longer, there will be less demand for our remanufactured
transmissions. Transmission failures could drop due to a number of
factors outside our control, including:
|
|
•
|
transmission
designs that result in greater
reliability;
|
|
|
•
|
consumers
driving fewer miles per year due to high gasoline
prices;
|
|
|
|
|
•
|
consumers
delaying repairs; and
|
|
|
•
|
mild
weather.
|
We
may incur material liabilities under various federal, state, local and foreign
environmental laws.
We are
subject to various evolving federal, state, local and foreign environmental laws
and regulations governing, among other things, emissions to air, discharge to
waters and the generation, handling, storage, transportation, treatment and
disposal of a variety of hazardous and non-hazardous substances and
wastes. These laws and regulations provide for substantial fines and
criminal sanctions for violations and impose liability for the costs of cleaning
up, and the damages resulting from, past spills, disposals or other releases of
hazardous substances. We have periodically conducted environmental
investigations, some of which have revealed various environmental matters and
conditions that could expose us to liability or which have required us to
undertake compliance-related improvements or remedial activities. Any
liability we may have under environmental laws could materially affect our
business.
Our
stock price is volatile, and investors may not be able to recover their
investment if our stock price declines.
The
trading price of our common stock has been volatile and can be expected to be
affected by factors such as:
|
|
•
|
quarterly
variations in our results of operations, which may be impacted by, among
other things, price renegotiations with, business outlook changes of, or
loss of, our customers;
|
|
|
•
|
quarterly
variations in the results of operations or stock prices of comparable
companies;
|
|
|
•
|
announcements
of new products or services offered by us or our
competitors;
|
|
|
•
|
changes
in earnings estimates or buy/sell recommendations by financial
analysts;
|
|
|
•
|
the
stock price performance of our customers;
and
|
|
|
•
|
general
market conditions or market conditions specific to particular
industries.
|
Our
future operating results may fluctuate significantly.
We may
experience significant variations in our future quarterly results of
operations. These fluctuations may result from many factors,
including the condition of our industry in general and shifts in demand and
pricing for our products. Our operating results are also highly
dependent on our level of gross profit as a percentage of net
sales. Our gross profit percentage fluctuates due to numerous
factors, some of which may be outside of our control. These factors
include:
|
|
•
|
pricing
strategies;
|
|
|
•
|
changes
to our customers’ product return or warranty
policies;
|
|
|
•
|
changes
in product costs from vendors;
|
|
|
•
|
the
risk of some of the items in our inventory becoming
obsolete;
|
|
|
•
|
the
availability and quality of component parts and
cores;
|
|
|
•
|
the
relative mix of products and services sold during the period;
and
|
|
|
•
|
general
market and competitive conditions.
|
Results
of operations in any period, therefore, should not be considered indicative of
the results to be expected for any future period.
Our
success depends on our ability to retain our senior management and to attract
and retain key personnel.
Our
success depends to a significant extent on the efforts and abilities of our
senior management team. We have various programs in place to
motivate, reward and retain our management team, including bonus and stock
incentive plans. However, the loss of one or more of these persons
could have a material adverse effect on our business. Our success and
plans for future growth will also depend on our ability to hire, train and
retain skilled workers in all areas of our business.
We
cannot predict the impact of unionization efforts on our business.
From time
to time, labor unions have indicated their interest in organizing a portion of
our workforce. Given that some of our customers are in the highly
unionized automotive industry, our business is likely to continue to attract the
attention of union organizers. While these efforts have not been
successful to date except in the case of our former Mahwah, New Jersey facility
(which we closed in 2003), we cannot give any assurance that we will not
experience additional union activity in the future. Any union
organization activity, if successful, could result in increased labor costs and,
even if unsuccessful, could result in a temporary disruption of our production
capabilities and a distraction to our management.
We
may be subject to risks associated with future acquisitions.
An
element of our long-term growth strategy is the acquisition and integration of
complementary businesses in order to broaden product and service offerings,
capture market share and improve profitability. We will not be able
to acquire other businesses if we cannot identify suitable acquisition
opportunities, obtain financing on acceptable terms or reach mutually agreeable
terms with acquisition candidates. The negotiation of potential
acquisitions as well as the integration of an acquired business could require us
to incur significant costs and cause diversion of our management's time and
resources. Future acquisitions by us could result in:
|
|
•
|
dilutive
issuances of equity securities;
|
|
|
•
|
reductions
in our operating results;
|
|
|
•
|
incurrence
of debt and contingent liabilities;
|
|
|
•
|
future
impairment of goodwill and other intangibles;
and
|
|
|
•
|
other
acquisition-related expenses.
|
Some or
all of these items could have a material adverse effect on our
business. The businesses we may acquire in the future might not
achieve sales and profitability that justify our investment. In
addition, to the extent that consolidation becomes more prevalent in our
industry, the prices for suitable acquisition candidates may increase to
unacceptable levels and limit our growth.
We may
encounter difficulties in integrating any businesses we acquire with our
operations. The success of these transactions depends on our ability
to:
|
|
•
|
retain
key management members and technical personnel of acquired
companies;
|
|
|
•
|
successfully
merge corporate cultures and operational and financial systems;
and
|
|
|
•
|
realize
cost reduction and sales synergies.
|
Furthermore,
we may not realize the benefits we anticipated when we entered into these
transactions. In addition, after we have completed an acquisition,
our management must be able to assume significantly greater responsibilities,
and this in turn may cause them to divert their attention from our existing
operations. Any of the foregoing could have a material adverse effect
on our business and results of operations.
Our
level of indebtedness and the terms of our indebtedness could adversely affect
our business and liquidity position.
As of
February 16, 2010, we had no debt outstanding. However, our
indebtedness could increase substantially from time to time in the future for
various reasons, including fluctuations in operating results, capital
expenditures and possible acquisitions. Our consolidated indebtedness
level could materially affect our business because:
|
|
•
|
a
portion of our cash flow from operations must be dedicated to interest
payments on our indebtedness and is not available for other purposes,
which amount would increase if prevailing interest rates
rise;
|
|
|
•
|
it
may materially impair our ability to obtain financing in the
future;
|
|
|
•
|
it
may reduce our flexibility to respond to changing business and economic
conditions or take advantage of business opportunities that may
arise;
|
|
|
•
|
of
a prolonged recession and/or unforeseen regulatory changes;
and
|
|
|
•
|
our
ability to pay dividends is
limited.
|
In
addition, our credit facility requires us to meet specified financial ratios and
limits our ability to enter into various transactions. If we default
on any of our indebtedness, or if we are unable to replace our credit facility
when it expires in March 2011 or are otherwise unable to obtain necessary
liquidity, our business could be adversely affected.
Our
certificate of incorporation contains provisions that may hinder or prevent a
change in control of our company.
Provisions
of our certificate of incorporation could make it more difficult for a third
party to obtain control of us, even if such a change in control might benefit
our stockholders. Our Board of Directors can issue preferred stock
without stockholder approval. The rights of common stockholders could
be adversely affected by the rights of holders of preferred stock that we issue
in the future. These provisions could discourage a third party from
trying to obtain control of us. Such provisions may also impede a
transaction in which our stockholders could receive a premium over then-current
market prices and our stockholders' ability to approve transactions that they
consider in their best interests.
None.
We
conduct our business from the following facilities:
|
Location
|
Approx.
Sq.
Feet
|
Lease
Expiration
Date
|
Products
Produced/Services Provided
|
|||
|
Oklahoma
City, OK
|
100,000
|
2019
|
transmissions,
transfer cases and assorted components(1)
|
|||
|
Oklahoma
City, OK(2)
|
200,000
|
owned
|
transmissions
and assorted components(1)
|
|||
|
Oklahoma
City, OK
|
94,000
|
2010
|
returned
material reclamation and disposition, core management(3)(4)
|
|||
|
Carrollton
(Dallas), TX
|
39,000
|
2010
|
radios,
telematics and instrument and display clusters(3)
|
|||
|
Ft.
Worth, TX
|
414,000
|
2013
|
wireless
device and accessory distribution, electronics packaging and related
services(3)
|
|||
|
Ft.
Worth, TX
|
375,000
|
2013
|
wireless
device and electronics test and repair, returns processing, accessory
packaging(3)
|
|||
|
Ft.
Worth, TX
|
181,000
|
2012
|
wireless
device and accessory packaging, distribution and related services(3)
|
|||
|
Grantham,
England
|
120,000
|
owned
|
engines
and related components(1)
|
___________
|
(1)
|
This
facility is used by the Drivetrain
segment.
|
|
(2)
|
This
property is subject to a mortgage securing our bank credit
facility.
|
|
(3)
|
This
facility is used by the Logistics
segment.
|
|
(4)
|
This
facility will be closed in 2010 and a portion of its operations will be
consolidated into another facility.
|
We also
lease assorted warehouses and space for our corporate offices and computer
services center. We believe that our current facilities are adequate
for the current level of our activities. In the event we were to require
additional facilities, we believe that we could procure acceptable
facilities.
From time
to time, we have been, and currently are, involved in various legal
proceedings. Management believes that all of our litigation is
routine in nature and incidental to the conduct of our business, and that none
of our litigation, if determined adversely to us, would have a material adverse
effect, individually or in the aggregate, on us.
No
matters were submitted to a vote of our stockholders during the quarter ended
December 31, 2009.
PART
II
Market
Information and Holders
Our
common stock is traded on the Nasdaq Global Select Market under the symbol
"ATAC". As of February 16, 2010, there were 123 record holders of our
common stock. The following table sets forth for the periods
indicated the range of high and low sale prices of the common stock as reported
by Nasdaq:
|
High
|
Low
|
||||
|
2009
|
|||||
|
First quarter
|
$ | 15.75 | $ | 8.57 | |
|
Second quarter
|
20.00 | 10.60 | |||
|
Third quarter
|
23.00 | 13.55 | |||
|
Fourth quarter
|
24.79 | 18.82 | |||
|
2008
|
|||||
|
First quarter
|
$ | 27.97 | $ | 18.27 | |
|
Second quarter
|
26.78 | 19.57 | |||
|
Third quarter
|
27.05 | 21.80 | |||
|
Fourth quarter
|
24.20 | 12.02 | |||
On
February 16, 2010, the last sale price of our common stock, as reported by
Nasdaq, was $23.21 per share.
Stock
Repurchases
During
the three months ended December 31, 2009, certain employees delivered to us
2,807 shares of our outstanding common stock in payment of $66,064 of minimum
withholding tax obligations arising from the vesting of restricted stock
previously awarded under our stock incentive plans. Per the stock
incentive plans, the shares delivered to us were valued at $23.54 per share, the
average closing price of our common stock on the vesting dates of the restricted
stock.
Following
is a summary of treasury stock acquisitions during the three months ended
December 31, 2009:
|
Period
|
Total
number
of Shares Purchased
|
Average
Price
Paid
per Share
|
Total
Number of Shares Purchased as Part of Publicly Announced Plans or
Programs
|
Maximum
Number (or Approximate Dollar
Value)
of Shares that May Yet Be Purchased Under
the
Plan(1)
|
|||||
|
October
1-31, 2009
|
− | $ | − | − | − | ||||
|
November
1-30, 2009
|
− | $ | − | − | − | ||||
|
December
1-31, 2009
|
2,807 | $ | 23.54 | 2,807 | − | ||||
___________
|
(1)
|
Excludes
amounts that could be used to repurchase shares acquired under our stock
incentive plans to satisfy withholding tax obligations
of employees and non-employee directors upon the vesting of restricted stock. |
Dividends
We have
never paid cash dividends on our common stock. Because we currently
intend to retain any earnings to provide funds for the operation and expansion
of our business and for the servicing and repayment of indebtedness, we do not
intend to pay cash dividends on the common stock in the foreseeable
future. Furthermore, as a holding company with no independent
operations, the ability of ATC Technology Corporation to pay cash dividends is
dependent upon the receipt of dividends or other payments from our
subsidiaries. The agreement for our bank credit facility contains
certain covenants that, among other things, restrict our ability to pay
dividends. See Item 7. "Management's Discussion and Analysis of
Financial Condition and Results of Operations – Liquidity and Capital
Resources." Any determination to pay cash dividends on the common
stock in the future will be at the sole discretion of our Board of
Directors.
Performance
Graph
The
following graph shows the total return to our stockholders compared to two peer
groups and the Nasdaq Market Index over the period from January 1, 2005 to
December 31, 2009. Each line on the graph assumes that $100 was
invested in our common stock and the respective indices at the closing price on
January 1, 2005. The graph then presents the value of these
investments, assuming reinvestment of dividends, through the close of trading on
December 31, 2009.
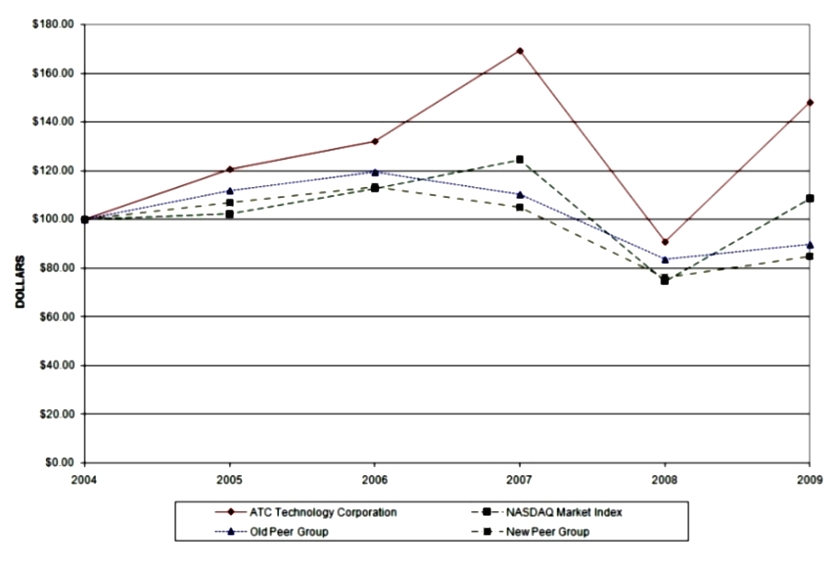
|
1/1/05
|
12/31/05
|
12/31/06
|
12/30/07
|
12/29/08
|
12/31/09
|
||||||
|
ATC
Technology Corporation
|
100.00 | 120.75 | 132.17 | 169.32 | 90.87 | 148.14 | |||||
|
Old
Peer Group
|
100.00 | 111.83 | 119.32 | 110.24 | 83.57 | 89.67 | |||||
|
New
Peer Group
|
100.00 | 106.82 | 113.38 | 104.95 | 76.19 | 84.81 | |||||
|
NASDAQ
Market Index
|
100.00 | 102.20 | 112.68 | 124.57 | 74.71 | 108.56 |
The old
peer group consists of Brightpoint, Inc. and UTI Worldwide Inc. (publicly-traded
companies engaged in third-party logistics businesses) and Genuine Parts Co. and
Standard Motor Products (publicly-traded companies engaged primarily in
businesses in the automotive aftermarket). The new peer group
consists of the same four companies as the old peer group plus ModusLink Global
Solutions, Inc. and TESSCO Technologies Inc. (publicly-traded companies engaged
in third-party logistics businesses). By increasing the number of
logistics companies in the peer group from two to four while maintaining the
number of automotive companies at two, the new peer group more closely matches
the relative size of our two business segments. Management believes
that the new peer group most closely represents the peer group for our
business.
The
cumulative total return shown on the stock performance graph indicates
historical results only and is not necessarily indicative of future
results.
ITEM 6. SELECTED
FINANCIAL DATA
The
selected financial data presented below with respect to the statements of
operations data for the years ended December 31, 2009, 2008 and 2007 and
the balance sheet data as of December 31, 2009 and 2008 are derived from
our Consolidated Financial Statements that have been audited by Ernst &
Young LLP, independent registered public accounting firm, and are included
elsewhere herein, and are qualified by reference to such financial statements
and notes related thereto. The selected financial data with respect
to the statements of operations data for the years ended December 31, 2006 and
2005 and the balance sheet data as of December 31, 2007, 2006 and 2005, are
derived from our Consolidated Financial Statements that have been audited by
Ernst & Young LLP, independent registered public accounting firm, but
are not included herein. The data provided should be read in
conjunction with the Consolidated Financial Statements and related notes,
Management’s Discussion and Analysis of Financial Condition and Results of
Operations, and other financial information included in this Annual
Report.
|
Year
Ended December 31,
|
|||||||||||||||||||
|
2009
|
2008
|
2007
|
2006
|
2005
|
|||||||||||||||
|
(In
thousands, except per share data)
|
|||||||||||||||||||
|
Statements
of Operations Data:
|
|||||||||||||||||||
|
Net
sales
|
$ | 485,017 | $ | 530,560 | $ | 529,171 | $ | 497,891 | $ | 419,618 | |||||||||
|
Cost
of sales
|
367,283 | 408,347 | 389,768 | 392,445 | 315,507 | ||||||||||||||
|
Exit,
disposal, certain severance and other charges
(credits)(1)
|
(572 | ) | 7,614 | 1,962 | − | − | |||||||||||||
|
Gross
profit
|
118,306 | 114,599 | 137,441 | 105,446 | 104,111 | ||||||||||||||
|
Selling,
general and administrative expense
|
49,080 | 56,965 | 61,001 | 48,936 | 47,755 | ||||||||||||||
|
Amortization
of intangible assets
|
50 | 149 | 243 | 190 | 125 | ||||||||||||||
|
Impairment
of goodwill(2)
|
36,991 | 79,146 | − | 14,592 | − | ||||||||||||||
|
Exit,
disposal, certain severance and other charges(1)
|
5,710 | 3,396 | 1,411 | 1,938 | 523 | ||||||||||||||
|
Operating
income (loss)
|
26,475 | (25,057 | ) | 74,786 | 39,790 | 55,708 | |||||||||||||
|
Interest
income
|
195 | 624 | 1,141 | 605 | 2,026 | ||||||||||||||
|
Interest
expense
|
(1,135 | ) | (696 | ) | (969 | ) | (4,297 | ) | (7,696 | ) | |||||||||
|
Other
income, net
|
27 | 17 | 116 | 262 | 542 | ||||||||||||||
|
Write-off
of debt issuance costs
|
− | − | − | (1,691 | ) | − | |||||||||||||
|
Income
tax (expense) benefit
|
(13,855 | ) | 2,423 | (27,952 | ) | (13,011 | ) | (16,827 | ) | ||||||||||
|
Income
(loss) from continuing operations
|
$ | 11,707 | $ | (22,689 | ) | $ | 47,122 | $ | 21,658 | $ | 33,753 | ||||||||
|
Income
(loss) from continuing operations per diluted
share(3)
|
$ | 0.59 | $ | (1.09 | ) | $ | 2.11 | $ | 0.98 | $ | 1.56 | ||||||||
|
Shares
used in computation of income (loss) from continuing
operations per
diluted share(3)
|
19,764 | 20,878 | 22,067 | 21,870 | 21,531 | ||||||||||||||
|
Other
Data:
|
|||||||||||||||||||
|
Capital
expenditures
|
$ | 8,638 | $ | 11,332 | $ | 19,374 | $ | 10,636 | $ | 17,241 | |||||||||
|
As
of December 31,
|
||||||||||||||
|
2009
|
2008
|
2007
|
2006
|
2005
|
||||||||||
|
(In
thousands)
|
||||||||||||||
|
Balance
Sheet Data:
|
||||||||||||||
|
Cash
and cash equivalents
|
$ | 73,803 | $ | 17,188 | $ | 40,149 | $ | 7,835 | $ | 45,472 | ||||
|
Working
capital, continuing operations
|
162,744 | 109,887 | 115,259 | 89,353 | 109,143 | |||||||||
|
Property,
plant and equipment, net
|
46,939 | 52,728 | 56,462 | 51,767 | 54,108 | |||||||||
|
Total
assets
|
292,065 | 282,342 | 389,374 | 345,677 | 407,780 | |||||||||
|
Current
and long-term debt outstanding
|
– | – | – | 17,800 | 90,779 | |||||||||
|
Long-term
liabilities, less current portion
|
4,857 | 17,249 | 35,389 | 46,194 | 107,077 | |||||||||
|
Total
stockholders' equity
|
223,926 | 204,702 | 280,513 | 232,330 | 221,230 | |||||||||
_______________
|
(1)
|
See
Item 8. “Consolidated Financial Statements and Supplementary Data – Note
19” for a description of exit, disposal, certain severance and other
charges.
|
|
(2)
|
See
Item 8. “Consolidated Financial Statements and Supplementary Data – Note 2
and Note 5” for a description of goodwill impairment
charges.
|
|
(3)
|
During
2009, we adopted the two-class method of calculating earnings per share
which requires us to allocate a portion of our income to participating
securities and retrospectively apply these provisions to all periods
presented. As a result, our previously reported income from continuing
operations per diluted share decreased by $0.02 and $0.01 for the years
ended December 31, 2007 and 2006, respectively. See Item 8.
“Consolidated Financial Statements and Supplementary Data – Note 2 and
Note 12” for a description of the computation of earnings per
share.
|
ITEM 7.
MANAGEMENT'S DISCUSSION AND ANALYSIS OF
FINANCIAL CONDITION
AND RESULTS OF OPERATIONS
The
following discussion should be read in conjunction with our consolidated
financial statements and notes thereto included elsewhere in this Annual
Report. See Item 8. “Consolidated Financial Statements and
Supplementary Data.”
Readers
are cautioned that the following discussion contains certain forward-looking
statements and should be read in conjunction with the “Special Note Regarding
Forward-Looking Statements” appearing at the beginning of this Annual
Report.
Our
Business
Our
Logistics segment, which generated 71.2% of our revenues in 2009, is a leader in
providing comprehensive forward logistics, reverse logistics, test and repair,
packaging, warehousing and distribution, and transportation management services
for high-tech industries including wireless, broadband and cable, personal
navigation devices, automotive electronics and other consumer
electronics.
Through
our service offerings, we provide our customers with solutions engineered to
deliver quality, efficiency and cost savings. We utilize our
extensive expertise in supply chain logistics and full-suite service offerings
to provide a closed-loop solution for our customers that decreases their time,
cost and capital requirements, and provides them flexibility by converting fixed
cost to variable cost. Our forward logistics processes encompass
direct-to-consumer and bulk fulfillment of both new and refurbished products,
coupled with warehouse and inventory management, labeling, kitting, pick-pack,
break-bulk, cross-dock and light assembly services. Our reverse
logistics processes include direct consumer and retailer returns management,
advance exchange, test and repair, and asset recovery and disposition.
Additional value-added services include testing and sorting, quality inspection,
transportation management and our recently added foreign trade zone (FTZ)
capabilities.
The
critical success factors that impact our Logistics business include our ability
to (i) increase penetration and add new services with existing customers, (ii)
expand our customer base, (iii) convert pipeline opportunities into new business
wins, (iv) provide superior quality, service and delivery, and (v) continuously
improve efficiency and reduce cost.
Our
Logistics business has grown from annual sales of $153 million in 2005 to $345
million in 2009, a compound annual growth rate of 22.5%. This growth
has been driven by the increased demand for our customers’ products and the
related advancements in electronic technologies, the addition of new services
with existing customers, and an expansion of our customer base.
Our
Drivetrain segment, which generated 28.8% of our revenues in 2009, provides
remanufacturing services predominately to the service and repair organization of
automotive OEMs. As with our Logistics business, through our service
offerings we provide our customers with solutions engineered to deliver quality,
efficiency and cost savings. Our Drivetrain customers utilize
remanufactured drivetrain components as a lower cost alternative to new products
in both warranty and post-warranty applications. As a result of
general improvements in the quality of new transmissions and engines, coupled
with declines in the population of in-warranty vehicles, our Drivetrain business
has experienced significant declines as sales have decreased from $266 million
in 2005 to $140 million in 2009. Furthermore, in the second quarter
of 2009, based upon a declining need for remanufactured transmissions as a
result of the improved quality relating to their newest generation of
transmissions, Honda, one of our largest Drivetrain customers, informed us of
their intention to in-source this function and terminate their automatic
transmission remanufacturing program with us, triggering a $37.0 million ($26.0
million net of tax) impairment charge to write down the remaining goodwill in
the Drivetrain business. As of December 31, 2009, this program with
Honda was substantially completed.
Our
Performance
2009 Consolidated
Summary. Overall, our 2009 results reflect solid execution in
a difficult economic environment. We successfully implemented our
restructuring initiatives in Drivetrain, we achieved cost reductions in
Logistics, we won and launched a meaningful program with a new customer in
Logistics, and we successfully focused on working capital management by driving
inventories down, which contributed to our strong liquidity. Our
consolidated sales were $485.0 million for the year ended December 31, 2009,
down 8.6% from 2008. Income from continuing operations for 2009
increased to $11.7 million from a loss of $22.7 million in 2008. Our
results for 2009 included charges of (i) $26.0 million (net of tax) for the
impairment of our Drivetrain segment’s goodwill, (ii) $3.2 million (net of tax)
for exit, disposal, certain severance and other charges primarily related to the
restructuring of our Drivetrain business, and (iii) $1.8 million for a valuation
allowance against certain deferred income taxes related to our Drivetrain
subsidiary located in the United Kingdom. The loss from 2008
reflected Drivetrain segment charges of $56.8 million (net of tax) for the
impairment of goodwill and $6.1 million (net of tax) related to our Drivetrain
restructuring efforts. Income from continuing operations per diluted
share was $0.59 for 2009 as compared to a loss from continuing operations of
$1.09 per share for 2008.
Logistics Segment Summary.
For the year ended December 31, 2009, net sales from our Logistics
business decreased $8.1 million, or 2.3%, to $345.3 million in 2009 from $353.4
million in 2008. The decrease in sales was primarily due to a
decrease in sales to TomTom in 2009 as compared to 2008 related to reductions in
their in-channel inventories, and revenue in 2008 from two programs that were
discontinued prior to 2009, partially offset by increased sales from new
programs, including a test and repair program with a leading handset OEM that
could become a 10% customer in 2010. Segment profit for Logistics
increased $7.8 million, or 13.9%, to $64.0 million in 2009 from $56.2 million in
2008. Benefits from our on-going lean and continuous improvement
program and other cost reduction initiatives, the contribution from new program
wins, and a favorable mix in services, all contributed to an increase in our
profitability in 2009 as compared to 2008.
Drivetrain Segment Summary.
Our Drivetrain segment experienced a challenging year as we
(i) completed restructuring activities, which included the closure and
consolidation of our Springfield, Missouri remanufacturing operations into our
Drivetrain operations located in Oklahoma City, Oklahoma, and (ii) wound down
our automatic transmission remanufacturing program with Honda, previously a
major customer in our Drivetrain segment. Drivetrain sales decreased
$37.4 million, or 21.1%, to $139.7 million for 2009 from
$177.1 million for 2008. The decrease was primarily due to (a)
reduced demand for Honda remanufactured transmissions largely related to lower
failure rates of their new transmissions, coupled with the wind-down of this
program, and (b) reduced demand for remanufactured drivetrain products across
our entire customer base due to (1) reductions in the size of in-warranty
vehicle fleets due to declining new car sales, (2) general improvements in
quality of new OEM transmissions, and (3) macroeconomic factors believed to have
resulted in a reduction in the number of miles driven and the deferral of
repairs. Our Drivetrain segment recorded an operating loss of $37.0
million in 2009 as compared to a loss of $81.3 million in 2008. Our
results for 2009 and 2008 include goodwill impairment charges of $37.0 million
and $79.1 million, respectively, and restructuring charges of $4.6 million and
$9.7 million, respectively.
Financing. During
2009 we generated $62.3 million of cash from operating activities - continuing
operations and invested $8.6 million in property, plant and
equipment. As of December 31, 2009, we had no amounts drawn on our
$150 million revolving bank credit facility, $73.8 million of cash and cash
equivalents on hand, and $148.7 million of borrowing capacity under the credit
facility.
Components
of Income and Expense
Net Sales. In our
Logistics segment, sales are primarily related to providing:
|
|
•
|
value-added
warehouse, packaging and distribution
services;
|
|
|
•
|
reverse
logistics;
|
|
|
•
|
turnkey
order fulfillment and information
services;
|
|
|
•
|
testing,
refurbishment and repair services;
|
|
|
•
|
transportation
management;
|
|
|
•
|
automotive
electronic components remanufacturing and distribution services;
and
|
|
|
•
|
returned
material reclamation, disposition and core management
services,
|
and are
recognized upon completion or performance of those services. In our Drivetrain
segment, we recognize sales primarily from the sale of remanufactured
transmissions at the time of shipment to the customer and, to a lesser extent,
upon the completion or performance of a service.
Cost of
Sales. Cost of sales represents the actual cost of purchased
components and other materials, direct labor, indirect labor and warehousing
costs and manufacturing overhead costs, including depreciation, utilized
directly in the production of products or performance of services for which
sales have been recognized.
Selling,
General and Administrative Expense. Selling, general and
administrative (SG&A) expenses generally are those costs not directly
related to the production process or the performance of a service that
generates sales and include all selling, marketing, product development and
customer service expenses as well as expenses related to general management,
finance and accounting, information services, human resources, legal, and
corporate overhead expense.
Amortization of Intangible
Assets. Expense for amortization of intangibles primarily
relates to the amortization of definite lived intangible assets.
Impairment of
Goodwill. These costs occur when we have determined that the
implied fair value of goodwill for a reporting unit is less than its carrying
value or when an individual reporting unit is disposed of. We test
our goodwill assets for impairment on an annual basis or when events or
circumstances would require an immediate review.
Exit, Disposal, Certain Severance
and Other Charges (Credits). We have periodically incurred
certain costs associated with restructuring and other initiatives that include
consolidation of operations or facilities, management reorganization and
delayering, rationalization of products, product lines or services, and asset
impairments. In management’s opinion these costs are generally
incremental to our ongoing operation and are separated on our statements of
operations in order to improve the clarity of our reported
operations. Examples of these costs include severance benefits for
terminated employees, lease termination and other facility exit costs, moving
and relocation costs, losses on the disposal or impairments of fixed assets,
write-down of certain inventories, and certain legal and other professional
fees. The components of these charges are computed based on actual
cash payouts, our estimate of the realizable value of the affected tangible and
intangible assets, and estimated exit costs including severance and other
employee benefits. These charges can vary significantly from period
to period and as a result, we may experience fluctuations in our reported net
income and earnings per share due to the timing of these actions. See
Item 8. “Consolidated Financial Statements and Supplementary Data - Note 19” for a
further discussion of these costs.
Critical
Accounting Policies and Estimates
Our
financial statements are based on the selection and application of significant
accounting policies, some of which require management to make estimates and
assumptions regarding matters that are inherently uncertain. We
believe that the following are some of the more critical judgmental areas in the
application of our accounting policies that currently affect our financial
condition and results of operations.
Allowance for Doubtful
Accounts. We
maintain allowances for doubtful accounts for estimated losses resulting from
the failure of our customers to make required payments. We evaluate
the adequacy of our allowance for doubtful accounts and make judgments and
estimates in determining the appropriate allowance at each reporting period
based on historical experience, credit evaluations, specific customer collection
issues and the length of time a receivable is past due. Since our accounts
receivable are often concentrated in a relatively small number of customers, a
significant change in the liquidity or financial position of any one of these
customers could have a material adverse effect on our financial
statements. Our write-offs were $0.6 million for the year ended
December 31, 2009, and $0.1 million for each of the years ended December 31,
2008 and 2007. As of December 31, 2009, we had $80.8 million of
accounts receivable, net of allowance for doubtful accounts of approximately
$47,000.
Inventory
Valuation. We adjust the value of our inventories for changes
in the estimated amount of excess and obsolete inventory. These
adjustments are based on management’s assumptions about market conditions and
future demand, which impact the expected usage rates used to estimate our
reserve for excess and obsolete inventory. Demand for our products
has fluctuated in the past and may do so in the future, which could result in an
increase in excess quantities on hand. If actual market conditions
are less favorable than those projected by management, causing usage rates to
vary from those estimated, inventory write-downs may be
required. Although no assurance can be given, these write-downs would
not be expected to have a material adverse effect on our financial
statements. For the years ended December 31, 2009, 2008 and
2007, we recorded charges for excess and obsolete inventory of approximately
$3.8 million, $10.4 million (including $7.3 million classified as exit,
disposal, certain severance and other charges) and $4.4 million (including $1.4
million classified as exit, disposal, certain severance and other
charges). During 2008, as part of the restructuring and consolidation
of our Drivetrain business and changes in the economic and financial condition
of the automotive industry, we revised our estimates of net realizable value for
inventory in our Drivetrain businesses, and recorded a charge of $7.3 million
for the write-down of raw materials inventory. As of December 31,
2009, we had inventory of $55.2 million, net of a reserve for excess and
obsolete inventory of $6.9 million.
Goodwill and Indefinite Lived
Intangible Assets. Our goodwill and indefinite lived intangible assets
are tested for impairment on an annual basis unless events or circumstances
would require an immediate review. Goodwill is tested for impairment
at a level of reporting referred to as a reporting unit, which generally is an
operating segment or a component of an operating segment. Certain components of
an operating segment with similar economic characteristics are aggregated and
deemed a single reporting unit. Goodwill amounts are generally
allocated to the reporting units based upon the amounts allocated at the time of
their respective acquisition, adjusted for significant transfers of business
between reporting units. The goodwill impairment test is a two-step
process which requires us to make estimates regarding the fair value of the
reporting unit. In estimating the fair value of our reporting units,
we utilize a valuation technique based on multiples of projected cash flow,
giving consideration to unusual items, cost reduction initiatives, new business
initiatives and other factors that generally would be considered in determining
value. Impairments are recorded (i) if the fair value is less than
the carrying value, or (ii) when an individual reporting unit is disposed
of. Actual results may differ from these estimates under different
assumptions or conditions. If we were to lose a key customer within a
particular operating segment or its sales were to decrease materially,
impairment adjustments that may be required could have a material adverse effect
on our financial statements.
During
the three months ended June 30, 2009, we received notice of the impending loss
of our automatic transmission remanufacturing program with Honda, then a major
customer in our Drivetrain segment. The resulting reduction in
estimated future revenues for the North American Drivetrain reporting unit was
determined to be an indicator of impairment, and as such, we performed an
interim step one test for the potential impairment of the goodwill related to
this reporting unit during the quarter ended June 30, 2009. In
estimating the fair value of the North American Drivetrain reporting unit, we
used a weighted average of the income approach and the market
approach. Under the income approach, the fair value of the reporting
unit is estimated based upon the present value of expected future cash
flows. The income approach is dependent on a number of factors
including probability weighted estimates of forecasted revenue and operating
costs, capital spending, working capital requirements, discount rates and other
variables. Under the market approach, we estimated the value of the
reporting unit by comparison to a group of businesses with similar
characteristics whose securities are actively traded in the public
markets. We used peer company multiples of earnings before interest,
taxes, depreciation and amortization (EBITDA) and revenues to develop a weighted
average estimate of fair value for the market approach. The resulting
estimate of fair value of the reporting unit did not exceed its carrying value,
requiring us to perform a step two measurement of the impairment
loss. In step two, the implied fair value of the goodwill is
estimated by subtracting the fair value of the reporting unit’s recorded
tangible and intangible assets and unrecorded intangible assets from the fair
value of the reporting unit. The impairment loss, if any, is the
amount by which the carrying amount of the goodwill exceeds its implied fair
value. As a result of the step two valuation, we concluded that the
implied fair value of goodwill for the North American Drivetrain reporting unit
was zero, and recorded a goodwill impairment charge of $37.0 million in our
Drivetrain segment during the three months ended June 30, 2009.
Our fair
value estimate of goodwill for the North American Drivetrain reporting unit as
of June 30, 2009 was based upon level three, of the three-level hierarchy
established in fair value accounting standards, as unobservable inputs in which
there is little or no market data, which required us to develop our own
assumptions as described above.
Our
annual impairment test, made as of October 1, 2009, indicated that the estimated
fair value of our Logistics reporting unit exceeded its carrying value by a
significant margin, which indicated that the goodwill was not
impaired. As of December 31, 2009, goodwill was recorded at a
carrying value of approximately $16.2 million and is entirely attributable to
our Logistics segment.
Deferred Income Taxes and Valuation
Allowances. Tax law requires items to be included in the tax return at
different times than when these items are reflected in the consolidated
financial statements. As a result, our annual tax rate reflected in
our consolidated financial statements is different than that reported in our tax
return. Some of these differences are permanent, such as expenses
that are not deductible in our tax return, and some differences reverse over
time, such as depreciation expense. These timing differences create
deferred tax assets and liabilities. Deferred tax assets and
liabilities are determined based on temporary differences between the financial
reporting and tax bases of assets and liabilities. The tax rates used
to determine deferred tax assets or liabilities are the enacted tax rates in
effect for the year in which the differences are expected to
reverse. Based on the evaluation of all available information, we
recognize future tax benefits, such as net operating loss carryforwards, to the
extent that realizing these benefits is considered more likely than
not.
We
evaluate our ability to realize the tax benefits associated with deferred tax
assets by analyzing our forecasted taxable income using both historical and
projected future operating results, the reversal of existing temporary
differences, taxable income in prior carry-back years (if permitted) and the
availability of tax planning strategies. A valuation allowance is
required to be established unless management determines that it is more likely
than not that we will ultimately realize the tax benefit associated with a
deferred tax asset. During 2009, our valuation allowance decreased
due to the decision to remove from gross deferred tax assets certain state net
operating loss carryforwards that had full valuation allowances recorded against
them in states where we no longer do business, which was partially offset by
recording new valuation allowances against certain (i) operating losses from our
Drivetrain subsidiary in the United Kingdom and (ii) state net operating losses
in connection with the goodwill impairment recorded in our Drivetrain
segment. Our valuation allowances, primarily related to tax benefits
associated with certain state and foreign loss carryforwards, were $5.3 million
and $6.3 million as of December 31, 2009 and 2008, respectively.
Warranty
Liability. We provide an allowance for the estimated cost of
product warranties at the time revenue is recognized. While we engage
in extensive product quality programs and processes, including inspection and
testing at various stages of the production process and the testing of each
finished assembly on equipment designed to simulate performance under operating
conditions, our warranty obligation is affected by the number of products sold,
historical and anticipated rates of warranty claims and costs per unit and
actual product failure rates. Additionally, we participate in the
tear-down and analysis of returned products with certain of our customers to
assess responsibility for product failures. For the years ended
December 31, 2009, 2008 and 2007, we (i) recorded charges for estimated warranty
costs for sales made in the respective year of approximately $0.8 million, $1.0
million and $1.6 million, respectively, and (ii) paid and/or settled warranty
claims of approximately $1.0 million, $0.7 million and $0.8 million,
respectively. Should actual product failure rates differ from our
estimates, revisions to the estimated warranty liability may be
required. Although no assurance can be given, these revisions would
not be expected to have a material adverse effect on our financial
statements.
Accounting for Stock-Based
Awards. Our stock option valuations are estimated by using the
Black-Scholes option pricing model, and restricted stock awards are measured at
the market value of our common stock on the date of issuance. Our
Black-Scholes option pricing model assumes no dividends and includes assumptions
for (i) expected volatility based on the historical volatility of our stock over
a term equal to the expected term of the option, (ii) risk-free interest rates
based on the implied yield on a U.S. Treasury constant maturity with a remaining
term equal to the expected term of the option, and (iii) expected term, which
represents the period of time that a stock option is expected to be outstanding
before being exercised or cancelled. During 2009 we awarded an
aggregate of 297,623 stock options and 142,549 shares of restricted stock to
non-employee directors, executive officers and certain
employees. Total estimated compensation expense of $3.7 million
related to awards granted during 2009 is being amortized over the requisite
service period. For all stock-based awards outstanding as of December
31, 2009, an estimated $3.3 million of unrecognized pre-tax compensation is
expected to be charged to expense over the remaining vesting period of the
awards, approximating a weighted-average period of 1.4 years.
See Item
8. “Consolidated Financial Statements and Supplementary Data – Note 2 and Note
10” for additional information related to our accounting for stock-based
awards.
Segment
Reporting
We have
two reportable segments: the Logistics segment and the Drivetrain
segment. Our Logistics segment provides value-added warehousing,
packaging and distribution, reverse logistics, turnkey order fulfillment,
electronic equipment testing, refurbishment and repair, and transportation
management services to customers in the wireless, consumer electronics and
automotive industries. The Logistics segment’s primary customers
include AT&T and TomTom. Our Drivetrain segment primarily sells
remanufactured transmissions to OEMs for use as replacement parts by their
domestic dealers during the warranty and/or post-warranty periods following the
sale of a vehicle. In addition, the Drivetrain segment sells select
remanufactured engines to certain OEMs in the U.S. and
Europe. Principal Drivetrain customers include Ford, Chrysler and
Allison. Honda was a significant Drivetrain customer prior to the end
of our automatic transmission remanufacturing program with them, which was
substantially completed by the end of 2009.
We
evaluate the performance of each business based upon operating income (segment
profit). Our reportable segments are each managed and measured
separately primarily due to the differing customers and distribution
channels.
Results
of Operations
The
following table sets forth financial statement data expressed in millions of
dollars and as a percentage of net sales.
|
Year
Ended December 31,
|
||||||||||||||||||||
|
2009
|
2008
|
2007
|
||||||||||||||||||
|
Net
sales
|
$ | 485.0 | 100.0 | % | $ | 530.6 | 100.0 | % | $ | 529.2 | 100.0 | % | ||||||||
|
Gross
profit(1)
|
118.3 | 24.4 | 114.6 | 21.6 | 137.4 | 26.0 | ||||||||||||||
|
SG&A
expense
|
49.1 | 10.1 | 57.0 | 10.7 | 61.0 | 11.5 | ||||||||||||||
|
Impairment
of
goodwill
|
37.0 | 7.6 | 79.1 | 14.9 | − | − | ||||||||||||||
|
Exit,
disposal, certain severance and other
charges(1)
|
5.1 | 1.1 | 11.0 | 2.1 | 3.4 | 0.6 | ||||||||||||||
|
Operating
income
(loss)
|
26.5 | 5.5 | (25.1 | ) | (4.7 | ) | 74.8 | 14.1 | ||||||||||||
|
Interest
income
|
0.2 | − | 0.6 | 0.1 | 1.1 | 0.2 | ||||||||||||||
|
Interest
expense
|
(1.1 | ) | (0.2 | ) | (0.7 | ) | (0.1 | ) | (1.0 | ) | (0.2 | ) | ||||||||
|
Income
(loss) from continuing operations
|
11.7 | 2.4 | (22.7 | ) | (4.3 | ) | 47.1 | 8.9 | ||||||||||||
___________
|
(1)
|
Includes
charges and credits, net in our Drivetrain segment classified as cost of
sales in the consolidated statements of operations as follows: (i) a
credit of $0.6 million and a charge of $7.6 million for restructuring
activities recorded in 2009 and 2008, respectively, and (ii) a charge of
$2.0 million primarily related to the wind-down of activities with certain
low-volume customers in 2007.
|
Year
Ended December 31, 2009 Compared to Year Ended December 31,
2008
Income
from continuing operations of $11.7 million for 2009 increased from a loss of
$22.7 million for 2008. Income from continuing operations per diluted
share was $0.59 for 2009 as compared to a loss from continuing operations of
$1.09 per share in 2008. Our results for 2009 included (i) a goodwill
impairment charge of $26.0 million (net of tax) in our Drivetrain segment, (ii)
net exit, disposal, certain severance and other charges of $3.2 million (net of
tax) primarily in the Drivetrain segment and (iii) a charge of $1.8 million for
a valuation allowance against certain deferred income taxes related to our
Drivetrain subsidiary located in the United Kingdom. Our results for
2008 included (a) a goodwill impairment charge of $56.8 million (net of tax) in
our Drivetrain segment, (b) restructuring charges of $6.1 million (net of tax)
primarily related to consolidation of our Drivetrain segment’s North American
operations, and (c) additional exit, disposal, certain severance and other
charges of $0.8 million (net of tax) primarily related to certain cost reduction
activities. Other factors that contributed to the improvement in
income from continuing operations in 2009 included:
|
|
•
|
benefits
from our Drivetrain segment consolidation and restructuring, our on-going
lean and continuous improvement program, and other cost reduction
initiatives;
|
|
|
•
|
the
contribution from new program wins in our Logistics segment;
and
|
|
|
•
|
a
favorable mix of services, including increased sales related to a customer
product launch and special projects completed during 2009 in our Logistics
segment;
|
partially
offset by:
|
|
•
|
reduced
demand for Honda remanufactured transmissions largely related to the lower
failure rates of their new transmissions coupled with the impact of the
wind-down of this program;
|
|
|
•
|
reduced
demand for remanufactured drivetrain products other than Honda due to a
variety of factors including (i) a reduction in the size of in-warranty
vehicle fleets due to declining new car sales, (ii) improved quality of
new OEM transmissions, and (iii) macroeconomic factors believed to have
resulted in a reduction in the number of miles driven and the deferral of
repairs;
|
|
|
•
|
revenue
in 2008 from two Logistics programs that were discontinued prior to
2009;
|
|
|
•
|
lower
sales to TomTom in 2009 as compared to 2008 related to reductions in their
in-channel inventories; and
|
|
|
•
|
scheduled
price concessions to certain customers, primarily in our Logistics
segment, granted in connection with previous contract
renewals.
|
Net
Sales
Net sales
decreased $45.6 million, or 8.6%, to $485.0 million for 2009 from $530.6 million
for 2008. This decrease was primarily due to:
|
|
•
|
reduced
demand for Honda remanufactured transmissions largely related to the lower
failure rates of their new transmissions, coupled with the impact of the
wind-down of this program;
|
|
|
•
|
reduced
demand for remanufactured drivetrain products other than Honda due to a
variety of factors including (i) a reduction in the size of in-warranty
vehicle fleets due to declining new car sales, (ii) improved quality of
new OEM transmissions, and (iii) macroeconomic factors believed to have
resulted in a reduction in the number of miles driven and the deferral of
repairs;
|
|
|
•
|
lower
sales to TomTom in 2009 as compared to 2008 related to reductions in their
in-channel inventories;
|
|
|
•
|
revenue
in 2008 from two Logistics programs that were discontinued prior to 2009;
and
|
|
|
•
|
scheduled
price concessions to certain customers, primarily in our Logistics
segment, granted in connection with previous contract
renewals;
|
partially
offset by increased sales from new program wins in our Logistics segment and to
a lesser extent in our Drivetrain segment.
Of our
net sales for 2009 and 2008, AT&T accounted for 48.4% and 42.8%, TomTom
accounted for 10.9% and 13.8%, Ford accounted for 10.2% and 11.0%, and Honda
accounted for 7.1% and 9.7%, respectively.
Gross
Profit
Gross
profit increased $3.7 million, or 3.2%, to $118.3 million for 2009 from $114.6
million for 2008. Reflected in gross profit are a net credit of $0.6
million and net costs of $7.6 million for 2009 and 2008, respectively, for
amounts classified as exit, disposal, certain severance and other charges
(credits) (as described below). Excluding these amounts, gross profit
decreased in 2009 due to the factors described above under “Net Sales,”
partially offset by benefits from our Drivetrain segment consolidation and
restructuring, our on-going lean and continuous improvement program, and other
cost reduction initiatives.
Selling,
General and Administrative Expense
SG&A
expense decreased $7.9 million, or 13.9%, to $49.1 million for 2009 from $57.0
million for 2008. The decrease was primarily the result of the
benefits from our Drivetrain segment consolidation and restructuring, our
on-going lean and continuous improvement program, and other cost reduction
initiatives. As a percentage of net sales, SG&A expense decreased
to 10.1% for 2009 from 10.7% for 2008.
Impairment
of Goodwill
During
the second quarter of 2009, we received notice of the impending loss of our
automatic transmission remanufacturing program with Honda, then a major customer
in our Drivetrain segment. This change in our North American
Drivetrain business triggered an interim test for the potential impairment of
goodwill related to our Drivetrain business. As a result, we
concluded that the fair value of our North American Drivetrain reporting unit no
longer supported the assigned goodwill and recorded a goodwill impairment charge
during the second quarter of 2009 of $37.0 million ($26.0 million net of
tax).
During
the fourth quarter of 2008, significant adverse changes in the business climate
in the North American vehicle industry occurred due to the economic slowdown,
placing unprecedented distress on our customers and the supporting supply
base. This change in the business climate triggered an interim test
for the potential impairment of goodwill related to our Drivetrain
business. As a result, we concluded that the fair value of this
reporting unit no longer supported the recorded goodwill, thus we recorded a
goodwill impairment charge in our Drivetrain segment during the fourth quarter
of 2008 of $79.1 million ($56.8 million net of tax).
As of
December 31, 2009, goodwill for our Drivetrain segment was zero.
Exit,
Disposal, Certain Severance and Other Charges (Credits)
During
the later part of 2008, our Drivetrain customers and the supporting supply base
experienced unprecedented distress due to the economic slowdown and adverse
changes in the North American vehicle industry. As a result, during
the fourth quarter of 2008 we began to take actions to restructure our
Drivetrain operations, including the closure and consolidation of our
Springfield, Missouri operations into our Drivetrain operations located in
Oklahoma City, Oklahoma.
In
connection with this restructuring, we recorded pre-tax charges of $5.1 million
($3.2 million net of tax) during 2009, consisting of (i) $3.7 million ($2.3
million net of tax) of costs to transfer production from the Springfield
facility to the Oklahoma City facility and other facility exit costs (including
$0.9 million of costs classified as cost of sales – products), and (ii) $1.4
million ($0.9 million net of tax) of severance and related costs for employees
terminated as part of the closure of the Springfield facility. This
consolidation and restructuring, which is expected to result in pre-tax annual
cost savings of $6 million, is complete and we do not expect to incur any
significant additional charges related to these actions.
Also
during 2009, we recorded (i) a net credit of $0.5 million ($0.3 million net of
tax) related to additional restructuring activities in the Drivetrain segment,
which included: (x) income of $2.6 million ($1.6 million net of tax) from an
adjustment to materials cost related to the wind-down of our relationship with a
customer (classified as cost of sales – products), (y) $1.1 million ($0.7
million net of tax) of costs related to a customer inventory reimbursement
obligation negotiated during 2009 (classified as cost of sales – products), and
(z) $1.0 million ($0.6 million net of tax) of costs primarily related to fixed
asset impairments and other costs related to cost reduction activities, and (ii)
a charge of $0.6 million ($0.4 million net of tax) of certain severance and
related costs associated with the separation of our former CFO.
During
2008, we recorded $11.0 million ($6.9 million net of tax) of exit, disposal,
certain severance and other charges, which consisted of:
|
|
•
|
$9.7
million ($6.1 million net of tax) related to the Drivetrain restructuring
activities initiated in 2008 comprised of (i) $7.3 million ($4.6 million
net of tax) for the write-down of raw materials inventory, including the
disposal of $6.6 million, due to the determination of excess quantities of
raw materials on hand as a result of the recent decline in volume and the
consolidation of facilities (classified as cost of sales), (ii) $1.9
million ($1.2 million net of tax) of severance and related costs, (iii)
$0.3 million ($0.2 million net of tax) of costs related to fixed asset
disposals (classified as cost of sales), and (iv) $0.2 million ($0.1
million net of tax) of other plant consolidation costs;
and
|
|
|
•
|
$1.3
million ($0.8 million net of tax) of costs primarily related to severance
and related benefits for certain cost reduction activities consisting of
$1.0 million in our Drivetrain segment and $0.3 million in our Logistics
segment.
|
As an
on-going part of our planning process, we continue to identify and evaluate
areas where cost efficiencies can be achieved through actions such as
consolidation of redundant facilities, outsourcing functions, or changing
processes or systems. Implementation of any of these could require us
to incur additional exit, disposal, certain severance and other charges, which
would be offset over time by the projected cost savings.
Operating
Income (Loss)
Operating
income (loss) increased to income of $26.5 million for 2009 from a loss of $25.1
million for 2008. This net increase was primarily due to the $42.1
million decrease in goodwill impairment charges between 2009 and 2008 described
above under “Impairment of Goodwill,” coupled with the factors described above
under “Exit, Disposal, Certain Severance and Other Charges (Credits),” and
“Gross Profit.”
Interest
Income
Interest
income decreased $0.4 million, or 66.7%, to $0.2 million for 2009 from $0.6
million for 2008. The decrease was primarily attributable to lower interest
rates in 2009 as compared to 2008.
Interest
Expense
Interest
expense increased $0.4 million, or 57.1%, to $1.1 million for 2009
from $0.7 million for 2008. This increase was primarily due to
the $70.0 million borrowing we made under our credit facility during 2009 to
increase our cash position and preserve our financial flexibility in light of
uncertainty in the capital markets. This borrowing was repaid during
the fourth quarter of 2009 and as of December 31, 2009 we had no
amounts outstanding under our credit facility.
Income Tax Expense (Benefit)
During
2009, our net tax expense of $13.9 million includes (i) a benefit of $11.0
million related to the goodwill impairment charge of $37.0 million recorded
during 2009, of which $2.9 million was nondeductible, and (ii) an expense of
$1.8 million for a valuation allowance against certain foreign deferred income
tax assets related to our Drivetrain subsidiary located in the United
Kingdom. During 2008, our net tax benefit of $2.4 million included
tax benefits of $22.3 million primarily related to the goodwill impairment
charge of $79.1 million, of which $17.8 million was
nondeductible. The normalized effective income tax rates (excluding
the impact of the goodwill impairment charges and valuation allowance of
deferred income tax assets) for each of 2009 and 2008 was approximately
36.9%.
Discontinued
Operations
During
the first quarter of 2008, we concluded that the potential return on the
investment for our NuVinci CVP project was not sufficient to continue
development activities. As a result, we sold certain tangible and
intangible assets related to the NuVinci project to Fallbrook Technologies Inc.
for a total of $6.1 million. The after-tax loss of $2.5 million from
discontinued operations that we recorded in 2008 was primarily related to the
discontinued NuVinci CVP project. On a pre-tax basis, the loss was
$4.3 million and consisted of $2.4 million of operating losses from NuVinci, and
a charge of $1.9 million related to the exit from this project, which consisted
of charges of (i) $1.0 million for termination benefits, (ii) $0.5 million for
certain inventory deemed unusable by Fallbrook, (iii) $0.2 million primarily
related to the write-off of capitalized patent development costs, and (iv) $0.2
million related to the disposal of certain fixed assets. There were
no similar costs recorded in 2009.
See Item
8. “Consolidated Financial Statements and Supplementary Data - Note 15” for a
further discussion of these charges.
Reportable
Segments
Logistics
Segment
The
following table presents net sales and segment profit expressed in millions of
dollars and as a percentage of net sales:
|
Year
Ended December 31,
|
|||||||||||
|
2009
|
2008
|
||||||||||
|
Net
sales
|
$ | 345.3 | 100.0 | % | $ | 353.4 | 100.0 | % | |||
|
Segment
profit
|
$ | 64.0 | 18.5 | % | $ | 56.2 | 15.9 | % | |||
Net Sales. Net
sales decreased $8.1 million, or 2.3%, to $345.3 million for 2009 from
$353.4 million for 2008. This decrease was primarily related
to:
|
|
•
|
lower
sales to TomTom in 2009 as compared to 2008 related to reductions in their
in-channel inventories;
|
|
|
•
|
revenue
in 2008 from two programs that were discontinued prior to 2009;
and
|
|
|
•
|
scheduled
price concessions granted to certain customers in connection with previous
contract renewals;
|
partially
offset by increased sales from new program wins.
Of our
segment net sales for 2009 and 2008, AT&T accounted for 67.9% and 64.2% and
TomTom accounted for 15.3% and 20.8%, respectively.
Exit, Disposal, Certain Severance
and Other Charges. During 2008, we recorded $0.3 million of
these costs for severance related to cost reduction activities and the
reorganization of certain functions within the segment’s information technology
group. These were no similar costs recorded in 2009.
Segment
Profit. Segment profit increased $7.8 million, or 13.9%,
to $64.0 million (18.5% of segment net sales) for 2009 from $56.2 million
(15.9% of segment net sales) for 2008. The increase was primarily the
result of benefits from our on-going lean and continuous improvement program and
other cost reduction initiatives, the factors described above under “Net Sales,”
and a favorable mix of services.
Drivetrain
Segment
The
following table presents net sales, impairment of goodwill, exit, disposal,
certain severance and other charges, and segment loss expressed in millions of
dollars and as a percentage of net sales:
|
Year
Ended December 31,
|
|||||||||||||
|
2009
|
2008
|
||||||||||||
|
Net
sales
|
$ | 139.7 | 100.0 | % | $ | 177.1 | 100.0 | % | |||||
|
Impairment
of goodwill
|
$ | 37.0 | 26.5 | % | $ | 79.1 | 44.7 | % | |||||
|
Exit,
disposal, certain severance and other charges
|
$ | 4.6 | 3.3 | % | $ | 10.7 | 6.0 | % | |||||
|
Segment
loss
|
$ | (37.0 | ) | − | $ | (81.3 | ) | − | |||||
Net Sales. Net
sales decreased $37.4 million, or 21.1%, to $139.7 million for 2009
from $177.1 million for 2008. The decrease was primarily due to
(i) reduced demand for Honda remanufactured transmissions largely related to the
lower failure rates of their new transmissions, coupled with the impact of the
wind-down of this program, and (ii) reduced demand for remanufactured drivetrain
products other than Honda due to a variety of factors including (x) a reduction
in the size of in-warranty vehicle fleets due to declining new car sales, (y)
improved quality of new OEM transmissions, and (z) macroeconomic factors
believed to have resulted in a reduction in the number of miles driven and the
deferral of repairs. This decrease in sales was partially offset by
revenues related to the beginning of the launch of remanufactured engines for
Chrysler.
Of our
segment net sales for 2009 and 2008, Ford accounted for 35.3% and 32.8% and
Honda accounted for 24.8% and 29.1%, respectively.
Impairment of Goodwill. Beginning
in the fourth quarter of 2008, our North American Drivetrain business
experienced significant adverse changes which caused goodwill impairment charges
of (i) $79.1 million ($56.8 million net of tax) during 2008, and (ii) $37.0
million ($26.0 million net of tax) during 2009. See above under
“Impairment of Goodwill.” As of December 31, 2009, goodwill for our
Drivetrain segment was zero.
Exit, Disposal, Certain Severance
and Other Charges. During the later part of 2008, our
Drivetrain customers and the supporting supply base experienced unprecedented
distress due to the economic slowdown and adverse changes in the North American
vehicle industry. As a result, during the fourth quarter of 2008 we
began to take actions to restructure our Drivetrain operations, which led to
exit, disposal, certain severance and other charges of $5.1 million and $9.7
million in 2009 and 2008, respectively.
We also
recorded a net credit of $0.5 million for additional restructuring activities in
2009, and a charge of $1.0 million related to certain cost reduction activities
in 2008.
See above
under “Exit, Disposal, Certain Severance and Other Charges
(Credits).”
Segment
Loss. Segment loss decreased $44.3 million, to a loss of $37.0
million for 2009 from a loss of $81.3 million for 2008. The decrease
was primarily due to the factors described above under “Impairment of Goodwill”
and “Exit, Disposal, Certain Severance and Other Charges.” Excluding these
costs, the decrease in segment profit in 2009 as compared to 2008 was primarily
the result of the negative operating leverage experienced as volumes declined
due to the factors described above under “Net Sales,” and costs associated with
the start-up of our remanufactured engines program for Chrysler, partially
offset by savings from our consolidation and restructuring
activities.
Year
Ended December 31, 2008 Compared to Year Ended December 31,
2007
Income
(loss) from continuing operations decreased to a loss of $22.7 million in 2008
from income of $47.1 million in 2007. In 2008 we reported a loss from
continuing operations of $1.09 per share as compared to income from continuing
operations per diluted share of $2.11 in 2007, as reported under the two-class
method of computing earnings per share ($2.13 as previously
reported). Our results for 2008 included (i) a goodwill impairment
charge of $56.8 million (net of tax) in our Drivetrain segment, which includes
an income tax benefit of $0.4 million from the revaluation of certain deferred
tax assets primarily related to tax deductible goodwill, and restructuring
charges of $6.1 million (net of tax) related to our Drivetrain segment’s North
American operations, which included the closure of our plant in Springfield,
Missouri and consolidation of its operations into our facility in Oklahoma City,
Oklahoma, and (ii) additional exit, disposal, certain severance and other
charges of $0.8 million (net of tax) primarily related to certain cost reduction
activities. Our results for 2007 included exit, disposal, certain
severance and other charges of $2.1 million (net of tax). Other
factors that contributed to the lower income (loss) from continuing operations
in 2008 as compared to 2007 included:
|
|
•
|
a
decrease in sales to GM primarily due to higher sales in 2007 from an
automotive electronics upgrade program that was substantially completed at
the end of the first quarter of
2008;
|
|
|
•
|
lower
volumes of Honda remanufactured transmissions for warranty applications
compared to higher volumes in 2007 believed to be attributable to an
extension of warranty coverage on certain
models;
|
|
|
•
|
scheduled
price concessions to certain customers in our Logistics and Drivetrain
segments granted in connection with previous contract
renewals;
|
|
|
•
|
lower
volumes of Ford remanufactured transmissions resulting from lower sales
over the last several years of new vehicles using transmissions we
remanufacture, resulting in a reduction in the population of Ford vehicles
in the zero-to-eight-year age category, which category we believe drives
the majority of demand for our Ford
products;
|
|
|
•
|
lower
volumes of Chrysler remanufactured transmissions due to Chrysler’s
decision not to use remanufactured transmissions for warranty
repairs generally for model years 2003 and later, resulting
in one less model year being in our warranty program each year (however,
certain transmission models we remanufacture or programs we have been
awarded were approved by Chrysler for use in its warranty program);
and
|
|
|
•
|
macroeconomic
factors believed to have resulted in a reduction in the number of miles
driven and the deferral of repairs, thus reducing overall demand for
remanufactured transmissions in our Drivetrain
segment;
|
partially
offset by:
|
|
•
|
the
launch and ramp-up of new logistics programs with TomTom and
AT&T;
|
|
|
•
|
increased
volumes in our base business programs with AT&T and other customers in
our Logistics segment; and
|
|
|
•
|
benefits
from our on-going lean and continuous improvement program and other cost
reduction initiatives and a reduction in cost for incentive compensation
programs.
|
Net
Sales
Net sales
increased $1.4 million, or 0.3%, to $530.6 million for 2008 from $529.2 million
for 2007. This increase was primarily due to:
|
|
•
|
the
launch and ramp-up of new logistics programs with TomTom and AT&T;
and
|
|
|
•
|
increased
volumes in our base business programs with AT&T and other customers in
our Logistics segment;
|
partially
offset by:
|
|
•
|
lower
volumes of Honda remanufactured transmissions for warranty applications
compared to higher volumes in 2007 believed to be attributable to an
extension of warranty coverage on certain
models;
|
|
|
•
|
a
decrease in sales to GM primarily due to higher sales in 2007 from an
automotive electronics upgrade program that was substantially completed at
the end of the first quarter of
2008;
|
|
|
•
|
lower
volumes of Ford remanufactured transmissions resulting from lower sales
over the last several years of new vehicles using transmissions we
remanufacture, resulting in a reduction in the population of Ford vehicles
in the zero-to-eight-year age category, which category we believe drives
the majority of demand for our Ford
products;
|
|
|
•
|
a
decline in Nokia revenues due to the termination of a test and repair
program in June 2007;
|
|
|
•
|
scheduled
price concessions to certain customers in our Logistics segment granted in
connection with previous contract
renewals;
|
|
|
•
|
lower
volumes of Chrysler remanufactured transmissions due to Chrysler’s
decision not to use remanufactured transmissions for warranty
repairs generally for model years 2003 and later, resulting
in one less model year being in our warranty program each year (however,
certain transmission models we remanufacture or programs we have been
awarded were approved by Chrysler for use in its warranty program);
and
|
|
|
•
|
macroeconomic
factors believed to have resulted in a reduction in the number of miles
driven and the deferral of repairs, thus reducing overall demand for
remanufactured transmissions in our Drivetrain
segment.
|
Of our
net sales for 2008 and 2007, AT&T accounted for 42.8% and 36.9%, TomTom
accounted for 13.8% and 3.1%, Ford accounted for 11.0% and 14.3%, and Honda
accounted for 9.7% and 15.7%, respectively.
Gross
Profit
Gross
profit decreased $22.8 million, or 16.6%, to $114.6 million for 2008
from $137.4 million for 2007. In addition, gross profit as a
percentage of net sales decreased to 21.6% for 2008 from 26.0% for
2007. The decrease was primarily the result of (i) $7.6 million of
exit, disposal, certain severance and other charges (described below) in 2008,
(ii) reduced operating leverage in our Drivetrain segment, (iii) a decrease in
sales to GM primarily due to higher sales in 2007 from an automotive electronics
upgrade program that was substantially completed at the end of the first quarter
of 2008, and (iv) scheduled price concessions to certain customers in our
Logistics and Drivetrain segments granted in connection with previous contract
renewals, partially offset by benefits from our on-going lean and continuous
improvement program and other cost reduction initiatives.
SG&A
Expense
SG&A
expense decreased $4.0 million, or 6.6%, to $57.0 million for 2008 from $61.0
million for 2007. The net decrease was primarily the result of
benefits from our on-going lean and continuous improvement program and other
cost reduction initiatives and a reduction in cost for incentive compensation
programs, partially offset by an increase in costs associated with revenue
growth in our Logistics segment. As a percentage of net sales,
SG&A expense decreased to 10.7% for 2008 from 11.5% for 2007.
Impairment
of Goodwill
During
the fourth quarter of 2008, significant adverse changes in the business climate
in the North American vehicle industry occurred due to the economic slowdown,
placing unprecedented distress on our customers and the supporting supply
base. This change in the business climate triggered an interim test
for the potential impairment of goodwill related to our Drivetrain
business. As a result, we concluded that the fair value of this
reporting unit no longer supported the recorded goodwill, thus we recorded a
goodwill impairment charge in our Drivetrain segment during the fourth quarter
of 2008 of $79.1 million ($56.8 million net of tax, which included an income tax
benefit of $0.4 million from the revaluation of certain deferred tax assets
primarily related to tax deductible goodwill).
Exit,
Disposal, Certain Severance and Other Charges
During
2008, we recorded $11.0 million ($6.9 million net of tax) of exit, disposal,
certain severance and other charges, which consisted of:
|
|
•
|
$9.7
million ($6.1 million net of tax) related to the restructuring activities
in our Drivetrain segment’s North American operations (including the
closure of our plant in Springfield, Missouri and consolidation of its
operations into our facility in Oklahoma City, Oklahoma), which consisted
of (i) $7.3 million ($4.6 million net of tax) for the write-down of raw
materials inventory, including the disposal of $6.6 million, due to the
determination of excess quantities of raw materials on hand as a result of
the decline in volume and the consolidation of facilities (classified as
cost of sales), (ii) $1.9 million ($1.2 million net of tax) of severance
and related costs, (iii) $0.3 million ($0.2 million net of tax) of costs
related to fixed asset disposals (classified as cost of sales), and (iv)
$0.2 million ($0.1 million net of tax) of other plant consolidation costs;
and
|
|
|
•
|
$1.3
million ($0.8 million net of tax) of costs primarily related to severance
and related benefits for certain cost reduction activities consisting of
$1.0 million in our Drivetrain segment and $0.3 million in our Logistics
segment.
|
During
2007, we recorded $3.4 million ($2.1 million net of tax) of exit, disposal,
certain severance and other charges, which consisted of (i) $1.4 million ($0.9
million net of tax) for the write-down of raw materials inventory related to the
wind-down of activities with certain low-volume customers (classified as cost of
sales), (ii) $0.7 million ($0.5 million net of tax) of severance and other costs
primarily related to certain management upgrades and cost reduction activities,
(iii) $0.7 million ($0.4 million net of tax) of certain legal and other
professional fees unrelated to our ongoing operations, and (iv) $0.6 million
($0.3 million net of tax) of costs primarily related to fixed asset disposals
related to the exit from a leased facility, a change in the estimated useful
life of certain fixed assets, and to a lesser extent the disposal of certain
fixed assets related to the wind-down of activities with certain low-volume
customers (classified as cost of sales).
Operating
Income (Loss)
Operating
income (loss) decreased to a loss of $25.1 million for 2008 from income of $74.8
million for 2007. This net decrease was primarily due to the $79.1
million goodwill impairment charge recorded in 2008, coupled with the factors
described above under “Exit, Disposal, Certain Severance and Other Charges” and
“Gross Profit.”
Interest
Income
Interest
income decreased $0.5 million, or 45.5%, to $0.6 million for 2008 from $1.1
million for 2007. The decrease was primarily attributable to lower cash balances
invested in cash and equivalents during 2008 as compared to 2007.
Interest
Expense
Interest
expense decreased $0.3 million, or 30.0%, to $0.7 million for 2008
from $1.0 million for 2007. This decrease was primarily due to
slightly lower debt outstanding in 2008 as compared to 2007. As of
December 31, 2008, there were no borrowings outstanding under our credit
facility.
Income
Tax Expense (Benefit)
Our
income tax benefit of $2.4 million for 2008 included tax benefits of $22.3
million primarily related to the goodwill impairment charge of $79.1 million, of
which $17.8 million is nondeductible. The normalized effective income
tax rate for 2008 was approximately 36.9%, as compared to 37.2% for
2007.
Discontinued
Operations
During
2008 and 2007 we recorded after-tax losses from discontinued operations of $2.5
million and $7.5 million, respectively.
During
the first quarter of 2008, we concluded that the potential return on the
investment for our NuVinci CVP project was not sufficient to continue
development activities. As a result, we sold certain tangible and
intangible assets related to the NuVinci project to Fallbrook Technologies Inc.
for a total of $6.1 million. The after-tax loss of $2.5 million from 2008 was
primarily related to the discontinued NuVinci CVP project. On a
pre-tax basis, the loss of $4.3 million consisted of $2.4 million of operating
losses from NuVinci and a charge of $1.9 million related to the exit from this
project, which consisted of charges of (i) $1.0 million for termination
benefits, (ii) $0.5 million for certain inventory deemed unusable by Fallbrook,
(iii) $0.2 million primarily related to the write-off of capitalized patent
development costs, and (iv) $0.2 million related to the disposal of certain
fixed assets.
For 2007,
the after-tax loss of $7.5 million consisted of (i) $7.1 million related to the
operating results of the NuVinci project, and (ii) $0.4 million related to the
run-out of warranty claims in our discontinued Independent Aftermarket
businesses.
See Item
8. “Consolidated Financial Statements and Supplementary Data - Note 15” for a
further discussion of these charges.
Reportable
Segments
Logistics
Segment
The
following table presents net sales and segment profit expressed in millions of
dollars and as a percentage of net sales:
|
Year
Ended December 31,
|
|||||||||||
|
2008
|
2007
|
||||||||||
|
Net
sales
|
$ | 353.4 | 100.0 | % | $ | 293.9 | 100.0 | % | |||
|
Segment
profit
|
$ | 56.2 | 15.9 | % | $ | 45.0 | 15.3 | % | |||
Net Sales. Net
sales increased $59.5 million, or 20.2%, to $353.4 million for 2008
from $293.9 million for 2007. This increase was primarily
related to:
|
|
•
|
the
launch and ramp-up of programs with TomTom and AT&T;
and
|
|
|
•
|
increased
volumes in our base business programs with AT&T and other
customers;
|
partially
offset by:
|
|
•
|
a
decline in sales to GM primarily due to higher sales in 2007 from an
automotive electronics upgrade program that was substantially completed at
the end of the first quarter of
2008;
|
|
|
•
|
a
decline in Nokia revenues due to the termination of a test and repair
program in June 2007; and
|
|
|
•
|
scheduled
price concessions granted to a customer in connection with previous
contract renewals.
|
Of our
segment net sales for 2008 and 2007, AT&T accounted for 64.2% and 66.4%,
TomTom accounted for 20.8% and 5.6% and GM accounted for 3.4% and
12.2%, respectively.
Exit, Disposal, Certain Severance
and Other Charges. During 2008, we recorded $0.3 million of
these costs for severance related to cost reduction activities and the
reorganization of certain functions within the segment’s information technology
group. These costs were nominal in 2007.
Segment
Profit. Segment profit increased $11.2 million, or 24.9%,
to $56.2 million (15.9% of segment net sales) for 2008 from $45.0 million
(15.3% of segment net sales) for 2007. The increase was primarily the
result of the factors described above under “Net Sales” and benefits from our
on-going lean and continuous improvement program and other cost reduction
initiatives, partially offset by scheduled price concessions granted to a
customer in connection with previous contract renewals.
Drivetrain
Segment
The
following table presents net sales, impairment of goodwill, exit, disposal,
certain severance and other charges, and segment (loss) profit expressed in
millions of dollars and as a percentage of net sales:
|
Year
Ended December 31,
|
||||||||||||
|
2008
|
2007
|
|||||||||||
|
Net
sales
|
$ | 177.1 | 100.0 | % | $ | 235.3 | 100.0 | % | ||||
|
Impairment
of goodwill
|
$ | 79.1 | 44.7 | % | $ | − | − | |||||
|
Exit,
disposal, certain severance and other charges
|
$ | 10.7 | 6.0 | % | $ | 3.4 | 1.4 | % | ||||
|
Segment
(loss) profit
|
$ | (81.3 | ) | − | $ | 29.7 | 12.6 | % | ||||
Net Sales. Net
sales decreased $58.2 million, or 24.7%, to $177.1 million for 2008
from $235.3 million for 2007. The decrease was primarily due
to:
|
|
•
|
lower
volumes of Honda remanufactured transmissions for warranty applications
compared to higher volumes in 2007 believed to be attributable to an
extension of warranty coverage on certain
models;
|
|
|
•
|
lower
volumes of Ford remanufactured transmissions resulting from lower sales
over the last several years of new vehicles using transmissions we
remanufacture, resulting in a reduction in the population of Ford vehicles
in the zero-to-eight-year age category, which category we believe drives
the majority of demand for our Ford
products;
|
|
|
•
|
lower
volumes of Chrysler remanufactured transmissions due to Chrysler’s
decision not to use remanufactured transmissions for warranty
repairs generally for model years 2003 and later, resulting
in one less model year being in our warranty program each year (however,
certain transmission models we remanufacture or programs we have been
awarded were approved by Chrysler for use in its warranty program);
and
|
|
|
•
|
macroeconomic
factors believed to have resulted in a reduction in the number of miles
driven and the deferral of repairs, thus reducing overall demand for
remanufactured transmissions.
|
Of our
segment net sales for 2008 and 2007, Ford accounted for 32.8% and 32.3% and
Honda accounted for 29.1% and 35.3%, respectively.
Impairment of
Goodwill. During the fourth quarter of 2008, significant
adverse changes in the business climate in the North American vehicle industry
occurred due to the economic slowdown, placing unprecedented distress on our
customers and the supporting supply base. This change in the business
climate triggered an interim test for the potential impairment of goodwill
related to our Drivetrain business. As a result, we concluded that the fair
value of this reporting unit no longer supported the assigned goodwill and
recorded a goodwill impairment charge during the fourth quarter of 2008 of $79.1
million ($56.8 million net of tax, which included an income tax benefit of $0.4
million from the revaluation of certain deferred tax assets primarily related to
tax deductible goodwill). There were no similar costs recorded in
2007.
Exit, Disposal, Certain Severance
and Other Charges. During 2008, we recorded $10.7 million of
these costs, which consisted of:
|
|
•
|
$9.7
million related to the restructuring activities in our North American
operations (including the closure of our plant in Springfield, Missouri
and consolidation of its operations into our facility in Oklahoma City,
Oklahoma), which consisted of (i) $7.3 million for the write-down of raw
materials inventories due to the determination of excess quantities of raw
materials on hand as a result of the recent decline in volume and the
consolidation of facilities, (ii) $1.9 million of severance and related
costs, (iii) $0.3 million of costs related to fixed asset disposals, and
(iv) $0.2 million of other plant consolidation costs;
and
|
|
|
•
|
$1.0
million of costs primarily related to severance and related benefits for
certain cost reduction activities.
|
During
2007, we recorded $3.4 million of these costs consisting of (i) $1.4 million for
the write-down of raw materials inventory related to the wind-down of activities
with certain low-volume customers, (ii) $0.7 million of certain legal and other
professional fees unrelated to ongoing operating activities of the segment,
(iii) $0.7 million of severance and other costs primarily related to certain
management upgrades and cost reduction activities, and (iv) $0.6 million
primarily related to fixed asset disposals related to the exit from a leased
facility, a change in the estimated useful life of certain fixed assets, and to
a lesser extent the disposal of certain fixed assets related to the wind-down of
activities with certain low-volume customers.
Segment (Loss)
Profit. Segment (loss) profit decreased to a loss of $81.3
million for 2008 from a profit of $29.7 million (12.6% of segment net
sales) for 2007. The decrease was primarily due to the factors
described above under “Impairment of Goodwill” and “Exit, Disposal, Certain
Severance and Other Charges.” Other factors which contributed to the
lower segment profit in 2008 as compared to 2007 were primarily the result of
the negative operating leverage experienced as volumes declined due to the
factors described above under “Net Sales.”
Liquidity
and Capital Resources
Cash Flow and Capital
Expenditures
We had
total cash and cash equivalents on hand of $73.8 million at December 31,
2009. Net cash provided by operating activities from continuing
operations was $62.3 million in 2009. During the period, we generated
$2.3 million of cash from our working capital accounts, which
included:
|
|
•
|
$8.5
million from reduced inventories primarily related to a reduction in
inventory in the Logistics segment;
and
|
|
|
•
|
$2.3
million from prepaid and other
assets;
|
partially
offset by,
|
|
•
|
$7.9
million for accounts receivable primarily due to an increase in revenues
from our Logistics segment during the fourth quarter of 2009 as compared
to the fourth quarter of 2008; and
|
|
|
•
|
$0.7
million for accounts payable and accrued
expenses.
|
Net cash
used in investing activities from continuing operations was $8.5 million for the
year, which consisted of $8.6 million of capital spending primarily related to
machinery and equipment for new business initiatives and capacity maintenance
efforts and $0.2 million of net purchases of available-for-sale securities for
our nonqualified deferred compensation plan, partially offset by $0.3 million of
proceeds from the sale of machinery and equipment. Net cash provided
by financing activities of $2.8 million was primarily related to cash proceeds
of $3.2 million and tax benefits of $0.3 million from the exercise of stock
options, partially offset by $0.6 million for treasury stock repurchases of our
common stock.
For 2010,
we estimate $13-$15 million for capital expenditures, consisting of
approximately $7-$8 million in support of new business and capacity expansion
initiatives in both our Logistics and Drivetrain segments and approximately
$6-$7 million in support of maintenance and cost reduction
initiatives.
For 2010,
we expect our effective tax rate to be 37.8%.
Financing
On March
21, 2006, we entered into a credit agreement and a related security agreement
with certain banks. This credit agreement provides for a $150.0 million
revolving credit facility available through March 2011. This
agreement also provides for the ability to increase the facility size by up to
$75.0 million in the aggregate, subject to certain conditions (including the
receipt from one or more lenders of the additional commitments that may be
requested) and achievement of certain financial ratios. Amounts
advanced under the credit facility are guaranteed by all of our domestic
subsidiaries and secured by substantially all of our assets and the assets of
our domestic subsidiaries.
At our
election, amounts advanced under the revolving credit facility will bear
interest at either (i) the Base Rate plus a specified margin or (ii) the LIBOR
rate plus a specified margin. The Base Rate is equal to the higher of
(a) the lender’s prime rate or (b) the federal funds rate plus
0.50%. The applicable margins for both Base Rate and LIBOR rate loans
are subject to quarterly adjustments based on our leverage ratio as of the end
of the four fiscal quarters then completed. At December 31, 2009, the
applicable margins for Base Rate and LIBOR rate loans were zero and 1.00%,
respectively.
As
specified in our credit agreement, the following table sets forth the rates
based upon our leverage ratio:
|
Applicable
Rate
|
|||||
|
Consolidated
Leverage Ratio
|
LIBOR
Margin and Letters of Credit
|
Commitment
Fee
|
Base
Rate Margin
|
||
|
Less
than 1.00:1
|
1.00%
|
0.20%
|
0.00%
|
||
|
Greater
or equal to 1.00:1 but less than 1.75:1
|
1.25%
|
0.25%
|
0.25%
|
||
|
Greater
or equal to 1.75:1 but less than 2.50:1
|
1.50%
|
0.30%
|
0.50%
|
||
|
Greater
or equal to 2.50:1
|
1.75%
|
0.35%
|
0.75%
|
||
We were
in compliance with all the credit facility’s debt covenants as of December 31,
2009.
During
2009, we borrowed $70.0 million under our credit facility in order to increase
our cash position and preserve our financial flexibility in light of uncertainty
in the capital markets. The proceeds were held in high-quality,
low-risk investments and were not expected to be used in the near
term. Given our cash position and the strength of our business, we
repaid the borrowing during the fourth quarter of 2009, and do not expect to
make any borrowings for a similar purpose in 2010. We expect to
replace our current credit facility, prior to its March 2011 expiration
date, with another credit facility with similar terms and
provisions.
As of
December 31, 2009, our liquidity included (i) borrowing capacity under the
credit facility of $148.7 million, net of $1.3 million for outstanding letters
of credit, and (ii) $73.8 million of cash on hand.
Two of
our customers (Chrysler and General Motors) filed for bankruptcy protection
under U.S. bankruptcy laws during 2009. As of December 31, 2009, we
had received substantially all the pre-bankruptcy net amounts owed to us from
Chrysler and GM.
Having
considered these and other matters, we believe that cash on hand, cash flow from
operations and existing borrowing capacity will be sufficient to fund ongoing
operations and budgeted capital expenditures. In pursuing future
acquisitions, we will continue to consider the effect any such acquisition costs
may have on liquidity. In order to consummate such acquisitions, we
may need to seek funds through additional borrowings or equity
financing.
Contractual
Obligations
The
following table summarizes our contractual obligations from continuing
operations expressed in millions of dollars as of December 31,
2009:
|
Total
|
Less
than
1
year
|
1
– 3 years
|
3
– 5 years
|
More
than
5
years
|
||||||||||
|
Debt
Obligations:
|
||||||||||||||
|
Letters
of credit
|
$ | 1.3 | $ | − | $ | 1.3 | $ | − | $ | − | ||||
|
Interest
on credit facility(1)
|
0.4 | 0.3 | 0.1 | – | – | |||||||||
|
Total
debt obligations
|
1.7 | 0.3 | 1.4 | – | – | |||||||||
|
Operating
lease obligations(2)
|
21.0 | 5.5 | 9.8 | 3.4 | 2.3 | |||||||||
|
Purchase
obligations(3)
|
13.5 | 13.5 | − | − | − | |||||||||
|
Liabilities
related to uncertain tax positions
|
0.5 | 0.5 | − | − | − | |||||||||
|
Nonqualified
deferred compensation(4)
|
5.6 | 4.0 | 0.2 | 0.1 | 1.3 | |||||||||
|
Deferred
compensation(5)
|
0.2 | 0.1 | 0.1 | − | − | |||||||||
|
Total
|
$ | 42.5 | $ | 23.9 | $ | 11.5 | $ | 3.5 | $ | 3.6 | ||||
|
_____________________
|
|
(1)
|
Represents
estimated interest expense related to the unused portion of our credit
facility as of December 31, 2009. Interest is determined
assuming the credit facility was terminated on March 31, 2011, its
expiration date. There were no borrowings outstanding under the
credit facility at December 31,
2009.
|
|
(2)
|
We
lease certain facilities and equipment under various operating lease
agreements, which expire on various dates through
2019. Facility leases that expire generally are expected to be
renewed or replaced by other leases. Obligations related to
lease renewals are not included in the table
above.
|
|
(3)
|
Primarily
consist of contractual arrangements in the form of purchase orders and
other commitments with suppliers where there is a fixed non-cancelable
payment schedule or minimum payments due with a reduced delivery
schedule.
|
|
(4)
|
Represents
amounts payable to certain of our employees and directors under a
nonqualified deferred compensation
plan.
|
|
(5)
|
Relates
to the 1997 acquisition of a former Drivetrain segment business, which
requires us to make certain payments to key employees of the seller on
various dates subsequent to the closing date. Through December
31, 2009, we had made $3.4 million of these payments (including $0.1
million paid in 2009).
|
Fair
Value
Our cash
and cash equivalents and short-term and long-term investments are measured at
fair value on a recurring basis. Our cash and cash equivalents as of
December 31, 2009 are primarily invested in highly liquid money market
funds. The short-term and long-term investments consist of mutual
fund securities that have been placed in a trust in which the use of the assets
is restricted to our nonqualified deferred compensation plan. The
fair value amounts for these financial instruments are based upon quoted prices
in active markets for identical assets and liabilities (level one of the fair
value hierarchy established by generally accepted accounting
principles).
The
carrying value as of December 31, 2009 of accounts receivable, inventories,
prepaid and other assets, refundable income taxes, accounts payable, accrued
expenses, and income taxes payable approximated fair value because of the
short-term nature of these instruments.
Off-Balance
Sheet Arrangements
We are
not engaged in any off-balance sheet arrangements that have a material current
effect or are reasonably likely to have a material future effect on our
financial condition or results of operations. However, we are subject
to various other commitments and contingencies as disclosed in Item 8.
"Consolidated Financial Statements and Supplementary Data – Note
17."
Impact
of New Accounting Standards
See Item
8. “Consolidated Financial Statements and Supplementary Data - Note 2” for a
discussion regarding new accounting standards.
Inflation
Although we are subject to the effects
of changing prices, the impact of inflation has not been a significant factor in
our results of operations for the periods presented. In some
circumstances, market conditions or customer expectations may prevent us from
increasing the prices of our products and services to offset the inflationary
pressures that may increase our costs in the future.
Seasonality
Our
Logistics segment can be subject to seasonal patterns that generally affect the
wireless device and consumer electronics industries with sales increasing in the
later half of the year to coincide with certain holiday seasons. The
following table presents quarterly net sales for our Logistics segment as a
percentage of annual net sales:
|
For
the three months ended
|
||||||||||||
|
Year
|
March
31,
|
June
30,
|
September
|
December
|
||||||||
|
2009
|
22.4 | % | 24.6 | % | 26.0 | % | 27.0 | % | ||||
|
2008
|
24.0 | % | 24.5 | % | 26.7 | % | 24.8 | % | ||||
|
2007
|
23.3 | % | 23.5 | % | 25.7 | % | 27.5 | % | ||||
Environmental
Matters
See Item 1. "Business–Environmental"
for a discussion of environmental matters relating to us.
ITEM 7A. QUANTITATIVE AND
QUALITATIVE DISCLOSURES ABOUT MARKET RISK
Derivative Financial
Instruments. We do not hold or issue derivative financial
instruments for trading purposes. We have used derivative financial
instruments to manage our exposure to fluctuations in interest
rates. Neither the aggregate value of these derivative financial
instruments nor the market risk posed by them has been material to our
business. At December 31, 2009, we were not using any derivative
financial instruments.
Interest Rate
Exposure. Based on our overall interest rate exposure during
the year ended December 31, 2009 and assuming similar interest rate
volatility in the future, a near-term (12 months) change in interest rates
would not materially affect our consolidated financial position, results of
operation or cash flows. As of December 31, 2009, we had no amounts
outstanding under our credit facility and therefore no interest rate
exposure.
Foreign Exchange
Exposure. Our revenue, expense and capital purchasing
activities are primarily transacted in U.S. dollars. We have one
foreign operation that exposes us to translation risk when the local currency
financial statements are translated to U.S. dollars. Since changes in
translation risk are reported as adjustments to stockholders' equity, a 10%
change in the foreign exchange rate would not have a material effect on our
financial position, results of operation or cash flows. For the year
ended December 31, 2009, a 10% change in the foreign exchange rate would
increase or decrease our consolidated net income by approximately
$81,000.
ITEM 8.
CONSOLIDATED FINANCIAL STATEMENTS AND SUPPLEMENTARY DATA
Contents
|
Report
of Independent Registered Public Accounting Firm
|
42
|
|
Report
of Independent Registered Public Accounting Firm on Internal Control Over
Financial Reporting
|
43
|
|
Consolidated
Balance Sheets as of December 31, 2009 and 2008
|
44
|
|
Consolidated
Statements of Operations for the years ended December 31, 2009, 2008 and
2007
|
45
|
|
Consolidated
Statements of Stockholders' Equity for the years ended December 31, 2009,
2008 and 2007
|
46
|
|
Consolidated
Statements of Cash Flows for the years ended December 31, 2009, 2008 and
2007
|
47
|
|
Notes
to Consolidated Financial Statements
|
48
|
The Board
of Directors and Stockholders of ATC Technology Corporation
We have
audited the accompanying consolidated balance sheets of ATC Technology
Corporation (the Company) as of December 31, 2009 and 2008, and the related
consolidated statements of operations, stockholders' equity, and cash flows for
each of the three years in the period ended
December 31, 2009. Our audits also included the financial
statement schedule listed in the Index at Item 15 (a). These
financial statements and schedule are the responsibility of the Company's
management. Our responsibility is to express an opinion on these
financial statements and schedule based on our audits.
We
conducted our audits in accordance with the standards of the Public Company
Accounting Oversight Board (United States). Those standards require
that we plan and perform the audit to obtain reasonable assurance about whether
the financial statements are free of material misstatement. An audit includes
examining, on a test basis, evidence supporting the amounts and disclosures in
the financial statements. An audit also includes assessing the
accounting principles used and significant estimates made by management, as well
as evaluating the overall financial statement presentation. We
believe that our audits provide a reasonable basis for our opinion.
In our
opinion, the financial statements referred to above present fairly, in all
material respects, the consolidated financial position of ATC Technology
Corporation at December 31, 2009 and 2008, and the consolidated results of
its operations and its cash flows for each of the three years in the period
ended December 31, 2009, in conformity with U.S. generally accepted
accounting principles. Also, in our opinion, the related financial
statement schedule, when considered in relation to the basic financial
statements taken as a whole, presents fairly in all material respects the
information set forth therein.
As
discussed in Note 2, the Company adopted the Financial Accounting Standards
Board Staff Position, Determining Whether Instruments Granted In Share-Based
Payment Transactions Are Participating Securities, as of January 1,
2009.
We also
have audited, in accordance with the standards of the Public Company Accounting
Oversight Board (United States), ATC Technology Corporation’s internal control
over financial reporting as of December 31, 2009, based on criteria established
in Internal Control—Integrated Framework issued by the Committee of Sponsoring
Organizations of the Treadway Commission and our report dated February 25, 2010
expressed an unqualified opinion thereon.
/s/ Ernst
& Young LLP
Chicago,
Illinois
February
25, 2010
Report
of Independent Registered Public Accounting Firm on Internal Control Over
Financial Reporting
The Board
of Directors and Stockholders of ATC Technology Corporation
We have
audited ATC Technology Corporation’s internal control over financial reporting
as of December 31, 2009, based on criteria established in Internal
Control–Integrated Framework issued by the Committee of Sponsoring Organizations
of the Treadway Commission (the COSO criteria). ATC Technology Corporation’s
management is responsible for maintaining effective internal control over
financial reporting, and for its assessment of the effectiveness of internal
control over financial reporting included in the accompanying Form 10-K. Our
responsibility is to express an opinion on the company’s internal control over
financial reporting based on our audit.
We
conducted our audit in accordance with the standards of the Public Company
Accounting Oversight Board (United States). Those standards require that we plan
and perform the audit to obtain reasonable assurance about whether effective
internal control over financial reporting was maintained in all material
respects. Our audit included obtaining an understanding of internal control over
financial reporting, assessing the risk that a material weakness exists, testing
and evaluating the design and operating effectiveness of internal control based
on the assessed risk, and performing such other procedures as we considered
necessary in the circumstances. We believe that our audit provides a reasonable
basis for our opinion.
A
company’s internal control over financial reporting is a process designed to
provide reasonable assurance regarding the reliability of financial reporting
and the preparation of financial statements for external purposes in accordance
with generally accepted accounting principles. A company’s internal control over
financial reporting includes those policies and procedures that (1) pertain to
the maintenance of records that, in reasonable detail, accurately and fairly
reflect the transactions and dispositions of the assets of the company; (2)
provide reasonable assurance that transactions are recorded as necessary to
permit preparation of financial statements in accordance with generally accepted
accounting principles, and that receipts and expenditures of the company are
being made only in accordance with authorizations of management and directors of
the company; and (3) provide reasonable assurance regarding prevention or timely
detection of unauthorized acquisition, use, or disposition of the company’s
assets that could have a material effect on the financial
statements.
Because
of its inherent limitations, internal control over financial reporting may not
prevent or detect misstatements. Also, projections of any evaluation of
effectiveness to future periods are subject to the risk that controls may become
inadequate because of changes in conditions, or that the degree of compliance
with the policies or procedures may deteriorate.
In our
opinion, ATC Technology Corporation maintained, in all material respects,
effective internal control over financial reporting as of December 31, 2009,
based on the COSO criteria.
We also
have audited, in accordance with the standards of the Public Company Accounting
Oversight Board (United States), the consolidated balance sheets of ATC
Technology Corporation as of December 31, 2009 and 2008, and the related
consolidated statements of operations, stockholders’ equity, and cash flows for
each of the three years in the period ended December 31, 2009, and our report
dated February 25, 2010 expressed an unqualified opinion thereon.
/s/ Ernst & Young LLP
Chicago, Illinois
February
25, 2010
|
CONSOLIDATED
BALANCE SHEETS
|
|||||||
|
(In
thousands, except share and per share data)
|
|||||||
|
December
31,
|
December
31,
|
||||||
|
2009
|
2008
|
||||||
|
Assets
|
|||||||
|
Current
Assets:
|
|||||||
|
Cash
and cash equivalents
|
$ | 73,803 | $ | 17,188 | |||
|
Short-term
investments
|
3,976 | 446 | |||||
|
Accounts
receivable, net
|
80,840 | 72,897 | |||||
|
Inventories
|
55,236 | 63,334 | |||||
|
Prepaid
and other assets
|
3,398 | 4,508 | |||||
|
Refundable
income taxes
|
495 | 2,509 | |||||
|
Deferred
income taxes
|
8,278 | 8,943 | |||||
|
Assets
of discontinued operations
|
- | 52 | |||||
|
Total
current assets
|
226,026 | 169,877 | |||||
|
Property,
plant and equipment, net
|
46,939 | 52,728 | |||||
|
Debt
issuance costs, net
|
193 | 350 | |||||
|
Goodwill
|
16,238 | 53,229 | |||||
|
Long-term
investments
|
1,689 | 4,680 | |||||
|
Other
assets
|
980 | 1,478 | |||||
|
Total
assets
|
$ | 292,065 | $ | 282,342 | |||
|
Liabilities
and Stockholders' Equity
|
|||||||
|
Current
Liabilities:
|
|||||||
|
Accounts
payable
|
$ | 34,272 | $ | 29,221 | |||
|
Accrued
expenses
|
22,426 | 25,863 | |||||
|
Income
taxes payable
|
2,496 | 4,290 | |||||
|
Deferred
compensation
|
4,088 | 564 | |||||
|
Liabilities
of discontinued operations
|
- | 453 | |||||
|
Total
current liabilities
|
63,282 | 60,391 | |||||
|
Deferred
compensation, less current portion
|
1,776 | 4,870 | |||||
|
Other
long-term liabilities
|
2,082 | 2,659 | |||||
|
Liabilities
related to uncertain tax positions
|
546 | 1,637 | |||||
|
Deferred
income taxes
|
453 | 8,083 | |||||
|
Stockholders'
Equity:
|
|||||||
|
Preferred
stock, $.01 par value; shares authorized - 2,000,000; none
issued
|
- | - | |||||
|
Common
stock, $.01 par value; shares authorized - 30,000,000;
|
|||||||
|
Issued
(including shares held in treasury) - 27,999,389 and
27,639,527
|
|||||||
|
as
of December 31, 2009 and 2008, respectively
|
280 | 276 | |||||
|
Additional
paid-in capital
|
243,907 | 236,994 | |||||
|
Retained
earnings
|
111,916 | 100,167 | |||||
|
Accumulated
other comprehensive income (loss)
|
176 | (969 | ) | ||||
|
Common
stock held in treasury, at cost - 7,930,699 and 7,868,354
shares
|
|||||||
|
as
of December 31, 2009 and 2008, respectively
|
(132,353 | ) | (131,766 | ) | |||
|
Total
stockholders' equity
|
223,926 | 204,702 | |||||
|
Total
liabilities and stockholders' equity
|
$ | 292,065 | $ | 282,342 | |||
|
See
accompanying notes.
|
|||||||
|
CONSOLIDATED
STATEMENTS OF OPERATIONS
|
|||||||||||
|
(In
thousands, except per share data)
|
|||||||||||
|
For
the years ended December 31,
|
|||||||||||
|
2009
|
2008
|
2007
|
|||||||||
|
Net
sales:
|
|||||||||||
|
Services
|
$ | 345,297 | $ | 353,416 | $ | 293,917 | |||||
|
Products
|
139,720 | 177,144 | 235,254 | ||||||||
|
Total
net sales
|
485,017 | 530,560 | 529,171 | ||||||||
|
Cost
of sales:
|
|||||||||||
|
Services
|
247,850 | 262,685 | 211,937 | ||||||||
|
Products
|
119,433 | 145,662 | 177,831 | ||||||||
|
Products
- exit, disposal, certain severance and other charges
(credits)
|
(572 | ) | 7,614 | 1,962 | |||||||
|
Total
cost of sales
|
366,711 | 415,961 | 391,730 | ||||||||
|
Gross
profit
|
118,306 | 114,599 | 137,441 | ||||||||
|
Selling,
general and administrative expense
|
49,080 | 56,965 | 61,001 | ||||||||
|
Amortization
of intangible assets
|
50 | 149 | 243 | ||||||||
|
Impairment
of goodwill
|
36,991 | 79,146 | - | ||||||||
|
Exit,
disposal, certain severance and other charges
|
5,710 | 3,396 | 1,411 | ||||||||
|
Operating
income (loss)
|
26,475 | (25,057 | ) | 74,786 | |||||||
|
Interest
income
|
195 | 624 | 1,141 | ||||||||
|
Other
income, net
|
27 | 17 | 116 | ||||||||
|
Interest
expense
|
(1,135 | ) | (696 | ) | (969 | ) | |||||
|
Income
(loss) from continuing operations before income taxes
|
25,562 | (25,112 | ) | 75,074 | |||||||
|
Income
tax expense (benefit)
|
13,855 | (2,423 | ) | 27,952 | |||||||
|
Income
(loss) from continuing operations
|
11,707 | (22,689 | ) | 47,122 | |||||||
|
Gain
(loss) from discontinued operations, net of income
taxes
|
42 | (2,480 | ) | (7,515 | ) | ||||||
|
Net
income (loss)
|
$ | 11,749 | $ | (25,169 | ) | $ | 39,607 | ||||
|
Per
common share - basic:
|
|||||||||||
|
Income
(loss) from continuing operations
|
$ | 0.59 | $ | (1.09 | ) | $ | 2.14 | ||||
|
Gain
(loss) from discontinued operations
|
$ | - | $ | (0.12 | ) | $ | (0.34 | ) | |||
|
Net
income (loss)
|
$ | 0.59 | $ | (1.21 | ) | $ | 1.80 | ||||
|
Per
common share - diluted:
|
|||||||||||
|
Income
(loss) from continuing operations
|
$ | 0.59 | $ | (1.09 | ) | $ | 2.11 | ||||
|
Gain
(loss) from discontinued operations
|
$ | - | $ | (0.12 | ) | $ | (0.34 | ) | |||
|
Net
income (loss)
|
$ | 0.59 | $ | (1.21 | ) | $ | 1.78 | ||||
|
See
accompanying notes.
|
|||||||||||
|
ATC
TECHNOLOGY CORPORATION
|
|||||||||||||||||||||||||
|
CONSOLIDATED
STATEMENTS OF STOCKHOLDERS' EQUITY
|
|||||||||||||||||||||||||
|
(In
thousands, except share data)
|
|||||||||||||||||||||||||
|
Accumulated
|
|||||||||||||||||||||||||
|
Additional
|
Other
|
Common
|
|||||||||||||||||||||||
|
Preferred
|
Common
|
Paid-In
|
Retained
|
Comprehensive
|
Stock
in
|
||||||||||||||||||||
|
Stock
|
Stock
|
Capital
|
Earnings
|
Income
(Loss)
|
Treasury
|
Total
|
|||||||||||||||||||
|
Balance
at January 1, 2007
|
$ | - | $ | 271 | $ | 223,288 | $ | 85,913 | $ | 3,537 | $ | (80,679 | ) | $ | 232,330 | ||||||||||
|
Net
income
|
- | - | - | 39,607 | - | - | 39,607 | ||||||||||||||||||
|
Translation
adjustments
|
- | - | - | - | 258 | - | 258 | ||||||||||||||||||
|
Unrealized
loss on available-for-sale securities,
net of income taxes |
- | - | - | - | (29 | ) | - | (29 | ) | ||||||||||||||||
|
Comprehensive
income
|
39,836 | ||||||||||||||||||||||||
|
Issuance
of 140,075 shares of common stock
from incentive stock awards |
- | 1 | (1 | ) | - | - | - | - | |||||||||||||||||
|
Issuance
of 230,160 shares of common stock
from exercise of stock options |
- | 3 | 3,763 | - | - | - | 3,766 | ||||||||||||||||||
|
Tax
benefit from stock-based award transactions
|
- | - | 1,136 | - | - | - | 1,136 | ||||||||||||||||||
|
Noncash
stock-based compensation
|
- | - | 4,126 | - | - | - | 4,126 | ||||||||||||||||||
|
Repurchase
of 17,362 shares of common stock
for treasury |
- | - | - | - | - | (497 | ) | (497 | ) | ||||||||||||||||
|
Adjustment
to uncertain tax positions upon
adoption of FIN 48 |
- | - | - | (184 | ) | - | - | (184 | ) | ||||||||||||||||
|
Balance
at December 31, 2007
|
- | 275 | 232,312 | 125,336 | 3,766 | (81,176 | ) | 280,513 | |||||||||||||||||
|
Net
loss
|
- | - | - | (25,169 | ) | - | - | (25,169 | ) | ||||||||||||||||
|
Translation
adjustments
|
- | - | - | - | (4,491 | ) | - | (4,491 | ) | ||||||||||||||||
|
Unrealized
loss on available-for-sale securities,
net of income taxes |
- | - | - | - | (244 | ) | - | (244 | ) | ||||||||||||||||
|
Comprehensive
loss
|
(29,904 | ) | |||||||||||||||||||||||
|
Issuance
of 140,417 shares of common stock
from incentive stock awards |
- | 1 | (1 | ) | - | - | - | - | |||||||||||||||||
|
Issuance
of 19,166 shares of common stock
from exercise of stock options |
- | - | 253 | - | - | - | 253 | ||||||||||||||||||
|
Tax
benefit from stock-based award transactions
|
- | - | 27 | - | - | - | 27 | ||||||||||||||||||
|
Noncash
stock-based compensation
|
- | - | 4,403 | - | - | - | 4,403 | ||||||||||||||||||
|
Repurchase
of 2,512,455 shares of common
stock for treasury |
- | - | - | - | - | (50,590 | ) | (50,590 | ) | ||||||||||||||||
|
Balance
at December 31, 2008
|
- | 276 | 236,994 | 100,167 | (969 | ) | (131,766 | ) | 204,702 | ||||||||||||||||
|
Net
income
|
- | - | - | 11,749 | - | - | 11,749 | ||||||||||||||||||
|
Translation
adjustments
|
- | - | - | - | 950 | - | 950 | ||||||||||||||||||
|
Unrealized
gain on available-for-sale securities,
net of income taxes |
- | - | - | - | 195 | - | 195 | ||||||||||||||||||
|
Comprehensive
income
|
12,894 | ||||||||||||||||||||||||
|
Issuance
of 142,549 shares of common stock
from incentive stock awards |
- | 1 | (1 | ) | - | - | - | - | |||||||||||||||||
|
Issuance
of 217,313 shares of common stock
from exercise of stock options |
- | 3 | 3,155 | - | - | - | 3,158 | ||||||||||||||||||
|
Tax
benefit from stock-based award transactions
|
- | - | 124 | - | - | - | 124 | ||||||||||||||||||
|
Noncash
stock-based compensation
|
- | - | 3,635 | - | - | - | 3,635 | ||||||||||||||||||
|
Repurchase
of 38,141 shares of common stock
for treasury |
- | - | - | - | - | (587 | ) | (587 | ) | ||||||||||||||||
|
Balance
at December 31, 2009
|
$ | - | $ | 280 | $ | 243,907 | $ | 111,916 | $ | 176 | $ | (132,353 | ) | $ | 223,926 | ||||||||||
|
See
accompanying notes.
|
|||||||||||||||||||||||||
|
CONSOLIDATED
STATEMENTS OF CASH FLOWS
|
|||||||||||
|
(In
thousands)
|
|||||||||||
|
For
the years ended December 31,
|
|||||||||||
|
2009
|
2008
|
2007
|
|||||||||
|
Operating
Activities:
|
|||||||||||
|
Net
income (loss)
|
$ | 11,749 | $ | (25,169 | ) | $ | 39,607 | ||||
|
Adjustments
to reconcile net income (loss) to net cash provided by
|
|||||||||||
|
operating
activities - continuing operations:
|
|||||||||||
|
Net
(gain) loss from discontinued operations
|
(42 | ) | 2,480 | 7,515 | |||||||
|
Impairment
of goodwill
|
36,991 | 79,146 | - | ||||||||
|
Write-down
of inventories and other assets
|
1,127 | 7,614 | 1,389 | ||||||||
|
Depreciation
and amortization
|
13,353 | 14,568 | 14,873 | ||||||||
|
Noncash
stock-based compensation
|
3,635 | 4,403 | 4,126 | ||||||||
|
Amortization
of debt issuance costs
|
157 | 157 | 157 | ||||||||
|
Adjustments
to provision for losses on accounts receivable
|
158 | 15 | (217 | ) | |||||||
|
(Gain)
loss on sale of equipment
|
(114 | ) | (32 | ) | 105 | ||||||
|
Deferred
income taxes
|
(6,953 | ) | (20,608 | ) | 4,291 | ||||||
|
Changes
in operating assets and liabilities,
|
|||||||||||
|
net
of businesses acquired or discontinued/sold:
|
|||||||||||
|
Accounts
receivable
|
(7,895 | ) | (2,919 | ) | 7,041 | ||||||
|
Inventories
|
8,516 | (8,364 | ) | (8,614 | ) | ||||||
|
Prepaid
and other assets
|
2,345 | (2,079 | ) | (229 | ) | ||||||
|
Accounts
payable and accrued expenses
|
(683 | ) | (10,330 | ) | 13,770 | ||||||
|
Net
cash provided by operating activities - continuing
operations
|
62,344 | 38,882 | 83,814 | ||||||||
|
Net
cash provided by (used in) operating activities - discontinued
operations
|
(337 | ) | 13 | (8,946 | ) | ||||||
|
Investing
Activities:
|
|||||||||||
|
Purchases
of property, plant and equipment
|
(8,638 | ) | (11,332 | ) | (19,374 | ) | |||||
|
Purchases
of available-for-sale securities
|
(574 | ) | (2,791 | ) | (4,301 | ) | |||||
|
Proceeds
from sales of available-for-sale securities
|
379 | 242 | 3,348 | ||||||||
|
Proceeds
from sale of property, plant and equipment
|
303 | 72 | 42 | ||||||||
|
Net
cash used in investing activities - continuing operations
|
(8,530 | ) | (13,809 | ) | (20,285 | ) | |||||
|
Net
cash provided by (used in) investing activities - discontinued
operations
|
- | 4,426 | (3,653 | ) | |||||||
|
Financing
Activities:
|
|||||||||||
|
Borrowings
on revolving credit facility
|
70,000 | 113,800 | 85,500 | ||||||||
|
Payments
on revolving credit facility
|
(70,000 | ) | (113,800 | ) | (103,300 | ) | |||||
|
Net
change in book overdraft
|
- | - | (5,059 | ) | |||||||
|
Proceeds
from exercise of stock options
|
3,158 | 253 | 3,766 | ||||||||
|
Tax
benefit from stock-based award transactions
|
346 | 130 | 996 | ||||||||
|
Repurchases
of common stock for treasury
|
(587 | ) | (50,590 | ) | (497 | ) | |||||
|
Payments
of deferred compensation related to acquired company
|
(118 | ) | (124 | ) | (130 | ) | |||||
|
Net
cash provided by (used in) financing activities
|
2,799 | (50,331 | ) | (18,724 | ) | ||||||
|
Effect
of exchange rate changes on cash and cash equivalents
|
339 | (2,142 | ) | 108 | |||||||
|
Increase
(decrease) in cash and cash equivalents
|
56,615 | (22,961 | ) | 32,314 | |||||||
|
Cash
and cash equivalents at beginning of year
|
17,188 | 40,149 | 7,835 | ||||||||
|
Cash
and cash equivalents at end of year
|
$ | 73,803 | $ | 17,188 | $ | 40,149 | |||||
|
Cash
paid during the year for:
|
|||||||||||
|
Interest
|
$ | 967 | $ | 562 | $ | 830 | |||||
|
Income
taxes, net
|
21,846 | 15,943 | 13,957 | ||||||||
|
See
accompanying notes.
|
|||||||||||
ATC
TECHNOLOGY CORPORATION
NOTES
TO CONSOLIDATED FINANCIAL STATEMENTS
(In
thousands, except share and per share data)
|
Note
1.
|
The
Company
|
ATC
Technology Corporation (the “Company”) has two reportable segments: the
Logistics segment and the Drivetrain segment. The Logistics segment
provides value-added warehousing, packaging and distribution, reverse logistics,
turnkey order fulfillment, electronic equipment testing, refurbishment and
repair, and transportation management services. The principal customers are
currently in the wireless, consumer electronics and automotive industries and
include AT&T and TomTom. The Company’s Drivetrain segment
primarily sells remanufactured transmissions to Ford, Allison, Chrysler, GM, and
certain foreign Original Equipment Manufacturers (“OEMs”), primarily for use as
replacement parts by their domestic dealers during the warranty and/or
post-warranty periods following the sale of a vehicle. In addition,
the Drivetrain segment sells select remanufactured engines to certain OEMs in
the U.S. and Europe. Established in 1994, the Company maintains
logistics operations and remanufacturing facilities in the United States and a
remanufacturing facility in the United Kingdom.
|
Note
2.
|
Summary
of Significant Accounting Policies
|
Principles
of Consolidation
The
accompanying consolidated financial statements include the accounts of the
Company and its subsidiaries. All significant intercompany balances
and transactions have been eliminated. The Company consolidates any
variable interest entities of which it is the primary beneficiary, as
defined.
Use
of Estimates
The
preparation of the financial statements in conformity with accounting principles
generally accepted in the United States requires management to make estimates
and assumptions that affect the amounts reported in the financial statements and
accompanying notes. Actual results could differ from those
estimates.
Cash
and Cash Equivalents
The
Company considers all highly liquid investments with original effective
maturities of three months or less to be cash equivalents.
Inventories
Inventories
are stated at the lower of cost (first-in, first-out method) or market and
consist primarily of (i) component electronic equipment repair parts and certain
product accessory and packaging materials for the Logistics segment and (ii) new
and used transmission parts, cores and finished goods for the Drivetrain
segment. Consideration is given to deterioration, obsolescence and
other factors in evaluating the estimated market value of inventory based upon
management’s judgment and available information, which includes assumptions
about market conditions, future demand and expected usage rates. Actual results
may vary from those estimated.
Property,
Plant and Equipment
Property,
plant and equipment are stated at cost less accumulated
depreciation. Depreciation is computed using straight-line methods
over the estimated useful lives of the assets for financial reporting purposes,
as follows: three to ten years for machinery and equipment, three to seven years
for autos and trucks, four to seven years for furniture and fixtures, up to 39
years for buildings, and the lesser of 10 years or the remaining term of the
related lease (including any periods covered by reasonably assured lease
renewals) for leasehold improvements. Depreciation expense was
$13,303, $14,419 and $14,630 for the years ended December 31, 2009, 2008
and 2007, respectively. Maintenance and repairs are charged to
expense as incurred.
Internal
Use Computer Software
The
Company capitalizes certain costs incurred in connection with developing or
obtaining internal-use software and web site development. Such
capitalized costs are included in property, plant and equipment as part of
machinery and equipment and are amortized over a period of not more than five
years.
Costs
that are incurred in the preliminary stage of an internal-use computer software
project are expensed as incurred. Once the Company’s capitalization
criteria have been met, (i) external direct costs of materials and services
consumed in developing or obtaining internal-use computer software and (ii)
certain payroll and payroll-related costs for employees who are directly
associated with, and who devote time to, the internal-use computer software
project, are capitalized.
Foreign
Currency Translation
The
functional currency for the Company’s foreign operations is the applicable local
currency. Accordingly, all balance sheet accounts have been
translated using the exchange rates in effect at the balance sheet date, and
income statement amounts have been translated using the average exchange rates
for the year. The translation adjustments resulting from the changes
in exchange rates have been reported separately as a component of stockholders'
equity. The effects of transaction gains and losses, which were
reported in income, were not material for the periods presented.
Debt
Issuance Costs
Debt
issuance costs incurred in connection with the Credit Facility (see Note 8 –
Credit Facility) are being amortized on a straight-line basis over the life of
the Credit Facility. As of December 31, 2009 and 2008, debt issuance
costs of $193 and $350, are reflected net of accumulated amortization of $593
and $436, respectively.
Goodwill
and Other Intangible Assets
The
Company tests its goodwill and other indefinite lived intangibles for impairment
annually as of the first day of the fourth quarter of each year unless events or
circumstances would require an immediate review. Goodwill is tested
for impairment at a level of reporting referred to as a reporting unit, which
generally is an operating segment or a component of an operating
segment. Certain components of an operating segment with similar
economic characteristics are aggregated and deemed a single reporting
unit. Goodwill amounts are generally allocated to the reporting units
based upon the amounts allocated at the time of their respective acquisition,
adjusted for significant transfers of business between reporting
units. The goodwill impairment test is a two-step process which
requires the Company to make estimates regarding the fair value of the reporting
unit. The first step of the goodwill impairment test, used to
identify potential impairment, compares the fair value of the reporting unit
with its carrying value, including goodwill. If the fair value of the
reporting unit exceeds its carrying amount, goodwill of the reporting unit is
considered not impaired, thus the second step of the impairment test is not
required. However, if the carrying amount of the reporting unit
exceeds its fair value, the second step of the goodwill impairment test is
performed to measure the amount of impairment loss (if any), which compares the
implied fair value of reporting unit goodwill with the carrying amount of that
goodwill. If the carrying amount of reporting unit goodwill exceeds
the implied fair value, an impairment loss is recognized in an amount equal to
that excess. In estimating the fair value of its reporting units, the
Company utilizes a valuation technique based on multiples of projected cash
flows, giving consideration to unusual items, cost reduction initiatives, new
business initiatives and other factors that generally would be considered in
determining value. Impairments are recorded (i) if the fair value is
less than the carrying value or (ii) when an individual reporting unit is
disposed of.
In May
2009, based upon reduced demand for their remanufactured transmissions, Honda, a
major customer in the Drivetrain segment, informed the Company of their decision
to in-source this function and terminate their automatic transmission
remanufacturing program with the Company. The resulting reduction in
estimated future revenues for the North American Drivetrain reporting unit was
determined to be an indicator of impairment. During the fourth
quarter of 2008, significant adverse changes in the business climate in the
North American vehicle industry occurred due to the economic slowdown, placing
unprecedented distress on the Company’s customers and supporting supply base.
These changes in the business climate and the resulting reduction in estimated
future revenues for the North American Drivetrain business were also determined
to be indicators of impairment. As the result of these two events,
the Company performed interim step one tests for the potential impairment of the
goodwill related to the North American Drivetrain reporting unit during the
second quarter of 2009 and the fourth quarter of 2008. In
estimating the fair value of this business as the result of these two events,
the Company used a weighted average of the income approach and the market
approach. Under the income approach, the fair value of the reporting
unit is estimated based upon the present value of expected future cash
flows. The income approach is dependent on a number of factors
including probability weighted estimates of forecasted revenue and operating
costs, capital spending, working capital requirements, discount rates and other
variables. Under the market approach, the Company estimated the value
of the reporting unit by comparison to a group of businesses with similar
characteristics whose securities are actively traded in the public
markets. The Company used peer company multiples of earnings before
interest, taxes, depreciation and amortization (EBITDA) and revenues to develop
a weighted average estimate of fair value for the market approach. In
both instances, the resulting estimate of fair value of the reporting unit did
not exceed its carrying value, requiring the Company to perform a step two
measurement of the impairment loss. In step two, the implied fair
value of the goodwill is estimated by subtracting the fair value of the
reporting unit’s recorded tangible and intangible assets and unrecorded
intangible assets from the estimated fair value of the reporting
unit. The impairment loss, if any, is the amount by which the
carrying amount of the goodwill exceeds its implied fair value. As a
result of the related step two valuations, the Company recorded goodwill
impairment charges for its Drivetrain segment of $36,991 during the three months
ended June 30, 2009, and $79,146 during the three months ended December 31,
2008.
The
Company’s fair value estimates of goodwill for the North American Drivetrain
reporting unit were based upon level three, of the three-level hierarchy
established in the fair value accounting standards prescribed by the Financial
Accounting Standards Board (FASB) as unobservable inputs in which there is
little or no market data, which required the Company to develop its own
assumptions as described above.
The
Company’s goodwill balance of $16,238 as of December 31, 2009 is entirely
related to the Logistics segment. The annual step one impairment
tests made by the Company as of October 1, 2009, indicated that the estimated
fair value of the Logistics reporting unit exceeded its carrying value by a
significant margin, which indicated that the goodwill was not
impaired.
Impairment
of Long-Lived and Intangible Assets
Long-lived
assets and identifiable intangibles are reviewed for impairment whenever events
or changes in circumstances indicate that the carrying amount of the related
asset may not be recoverable. Recoverability of assets to be held and
used is measured by a comparison of the carrying amount of the asset to future
undiscounted cash flows expected to be generated by the asset. If the
asset is determined to be impaired, the impairment recognized is measured by the
amount by which the carrying value of the asset exceeds its fair
value. For a discussion of impairments to property, plant and
equipment recorded by the Company, see Note 15 − Discontinued Operations
and Note 19 − Exit, Disposal, Certain Severance and Other Charges.
Asset
Retirement Obligations
The
Company records a liability equal to the fair value of the estimated future cost
to retire an asset, if the liability’s fair value can be reasonably estimated.
The Company’s asset retirement obligation (“ARO”) liabilities were
associated with estimated costs to restore certain leased facilities to a
condition specified in the lease agreement. The Company estimated the
fair value of these liabilities based on the condition of the property at the
time the estimate was made. In connection with the ARO liability the
Company recorded a related asset in an amount equal to the estimated fair value
of the liability. As part of the Company’s restructuring of its
Drivetrain operations, including the closure of its Springfield, Missouri
automatic transmission remanufacturing facility, its ARO liability and related
asset were reduced to zero (see Note 19 − Exit, Disposal, Certain Severance and
Other Charges).
Following
is an analysis of the ARO liability:
|
2009
|
2008
|
||||||
|
Asset
retirement obligations at beginning of year
|
$ | 381 | $ | 419 | |||
|
Liabilities
(reversed) incurred
|
(219 | ) | 22 | ||||
|
Payments
made
|
(169 | ) | (89 | ) | |||
|
Accretion
expense
|
7 | 29 | |||||
|
Asset
retirement obligations at end of year
|
$ | − | $ | 381 | |||
Concentration
of Credit Risk
Financial
instruments that potentially subject the Company to a significant concentration
of credit risk consist of accounts receivable from its customers including
AT&T, TomTom, Ford, Allison, Chrysler and GM, which are located throughout
the United States and, to a lesser extent, the United Kingdom. The
estimated fair value of these financial instruments approximate their carrying
values as of their respective balance sheet dates. The Company
performs ongoing credit evaluation of its customers and maintains sufficient
allowances for potential credit losses. The Company evaluates the
collectibility of its accounts receivable based on the length of time the
receivable is past due and the anticipated future write-off based on historic
experience. Accounts receivable balances are written off against
allowance for doubtful accounts after a final determination of uncollectibility
has been made. The credit risk associated with the Company's accounts
receivable is mitigated by its credit evaluation process, although collateral is
not required. The Company grants credit to certain customers who meet
pre-established credit requirements.
Accounts
receivable is recorded at the time of revenue recognition and is reflected net
of an allowance for doubtful accounts of $47 and $469 at December 31, 2009
and 2008, respectively.
Revenue
Recognition
The
Company recognizes revenues when its obligations to a customer are fulfilled
relative to a specific product or service offering and all of the following
conditions are satisfied: (i) persuasive evidence of an arrangement
exists; (ii) the price is fixed or determinable; (iii) collectibility is
reasonably assured; and (iv) delivery has occurred or services have been
rendered.
Revenue
from products are recognized when the risks and rewards of ownership have been
transferred to the customer, which is generally upon
shipment. Revenue from services are recognized as the services are
provided.
The
Company's Logistics business has contracts with multiple
elements. Multiple-element arrangements are assessed to determine
whether they can be separated into more than one unit of
accounting. The accounting standard for multiple-element arrangements
establishes the following criteria, all of which must be met, in order for a
deliverable to qualify as a separate unit of accounting: (i) the delivered
items have value to the client on a stand-alone basis; (ii) there is objective
and reliable evidence of the fair value of the undelivered items; and (iii) the
arrangement includes a general right of return relative to the delivered items,
and delivery or performance of the undelivered items is considered probable and
substantially in the control of the Company. The Company records the
arrangement consideration to the separate units of accounting based on each
unit’s relative fair value.
Warranty
Cost Recognition
The
Company accrues for estimated warranty costs as revenue is
recognized. The warranty period is typically three
years.
Costs
Associated with Exit or Disposal Activities
The
Company recognizes a liability for costs associated with exit or disposal
activities in the period in which the liability is incurred. The
Company classifies the costs associated with exit or disposal activities as a
part of exit, disposal, certain severance and other charges on its consolidated
statements of operations, within cost of sales and operating expenses. (See Note
19 - Exit,
Disposal, Certain Severance and Other Charges.)
Stock-Based
Compensation
The
Company awards (i) stock options and (ii) unvested shares of its common stock
(“Restricted Stock”) to its directors and employees. Stock option
valuations are estimated by using the Black-Scholes option pricing model and
Restricted Stock awards are measured at the market value of the Company’s common
stock on the date of issuance. For stock-based awards granted by the
Company with graded vesting provisions, the Company applies an accelerated
attribution method and separately amortizes each vesting tranche over the
respective vesting period.
Effective
January 1, 2006, the Company adopted the fair value recognition provisions of
accounting for share-based awards, using the modified prospective transition
method. Under the modified prospective method, (i) compensation
expense for share-based awards granted prior to January 1, 2006 are recognized
over the remaining service period using the compensation cost calculated for pro
forma disclosure purposes, and (ii) compensation expense for all share-based
awards granted subsequent to December 31, 2005 are based upon the estimated
grant date fair value and is recognized over the requisite service period of the
award.
During
the years ended December 31, 2009, 2008 and 2007, the consolidated statements of
operations reflect compensation cost related to stock-based payments, which
includes stock options and Restricted Stock, of $2,290 (net of income taxes of
$1,345), $2,774 (net of income taxes of $1,629), and $2,636 (net of income taxes
of $1,490), respectively. The Company classified the pre-tax
stock-based compensation cost of $3,635, $4,403 and $4,126 for 2009, 2008 and
2007, respectively, as part of selling, general and administrative expense in
its consolidated statements of operations.
The
following table summarizes the weighted-average assumptions used in estimating
the fair value of stock options granted assuming no expected dividends during
the time periods indicated:
|
For
the years ended December 31,
|
||||||||
|
2009
|
2008
|
2007
|
||||||
|
Expected
volatility
|
46.16 | % | 34.39 | % | 31.38 | % | ||
|
Risk-free
interest rates
|
2.27 | % | 2.67 | % | 4.87 | % | ||
|
Expected
term
|
4.7
years
|
3.9
years
|
3.9
years
|
|||||
Expected volatility: For all
periods presented, the expected volatility assumption is based on the historical
volatility of the Company’s stock over a term equal to the expected term of the
option granted.
Risk-free interest
rates: For all periods presented, the risk-free interest rate
is based on the implied yield on a U.S Treasury constant maturity with a
remaining term equal to the expected term of the option granted.
Expected term: The
Company’s expected term represents the period of time that the Company’s stock
option awards are expected to be outstanding before being exercised or
cancelled. For purposes of applying the Black-Scholes option-pricing
model, the Company has identified two groups of optionees with similar option
exercise and cancellation activity experience. The expected term of
stock option awards granted is derived from historical exercise and cancellation
experience for each of the two groups of optionees and represents the period of
time that stock option awards are expected to be outstanding before being
exercised or cancelled for each optionee group. On an annual basis,
based upon this historical exercise and cancellation experience, the Company
calculates a weighted average expected term for each of the two
groups.
Forfeitures rate:
Compensation expense recognized in the consolidated statements of
operations for each of the three years in the period ended December 31, 2009 is
based on awards ultimately expected to vest and it reflects estimated
forfeitures. Forfeitures are estimated at the time of grant and
revised, if necessary, in subsequent periods if actual forfeitures differ from
those estimates.
New
Accounting Standards
In
December 2007, the FASB issued the accounting standard (Business
Combinations), which significantly changes the accounting for business
combinations. Under this standard, an acquiring entity will be
required to recognize all the assets acquired and liabilities assumed in a
transaction at the acquisition-date fair value with limited
exceptions. This standard changes the accounting treatment for
certain specific items, including (i) acquisition costs are generally expensed
as incurred, (ii) noncontrolling interests (formerly known as “minority
interests”) are valued at fair value at the acquisition date, (iii) acquired
contingent liabilities are recorded at fair value at the acquisition date and
subsequently measured at either the higher of such amount or the amount
determined under existing guidance for non-acquired contingencies, (iv)
in-process research and development is recorded at fair value as an
indefinite-lived intangible asset at the acquisition date, (v) restructuring
costs associated with a business combination are generally expensed subsequent
to the acquisition date, and (vi) changes in deferred tax asset valuation
allowances and income tax uncertainties after acquisition date generally affect
income tax expense. This standard also includes a substantial number
of new disclosure requirements. This standard applies prospectively
to business combinations for which the acquisition date is on or after the
beginning of the first annual reporting period beginning on or after December
15, 2008, except for the accounting treatment for changes in deferred tax asset
valuation allowances and income tax uncertainties, which applies to acquisitions
prior to the effective date. Earlier adoption is
prohibited. The Company adopted this accounting standard effective
January 1, 2009. The adoption of this standard had no material effect
on the Company’s consolidated financial statements.
In June
2008, the FASB issued the staff position (Determining Whether Instruments
Granted in Share-Based Payment Transactions Are Participating Securities)
which provides that unvested share-based payment awards that contain
nonforfeitable rights to dividends (whether paid or unpaid) are participating
securities, and thus, should be included in the two-class method
of computing earnings per common share. This staff
position was effective for fiscal years beginning after December 15, 2008 and
interim periods within those years, with retrospective application
required. The Company adopted this staff position effective January
1, 2009. Under the two-class method, the Company’s net earnings
(considered undistributed earnings) are allocated to common stock and
participating securities (unvested Restricted Stock) as if all of the net
earnings for the period had been distributed. Basic earnings per
common share excludes dilution and is calculated by dividing net earnings
allocable to common shares by the weighted-average number of common shares
outstanding for the period. Diluted earnings per common share is
calculated by dividing net earnings allocable to common shares by the
weighted-average number of common shares as of the balance sheet date, as
adjusted for the potential dilutive effect of non-participating share-based
awards (Stock Options). The Company’s holders of unvested Restricted
Stock have no contractual obligation to fund the Company’s losses, and therefore
are not allocated any portion of its losses when computing earnings per
share. The retrospective application of the provisions of this new
standard had no impact due to the loss reported for the year ended December 31,
2008 and decreased our previously reported income per common share (basic and
diluted) by $0.02 for the year ended December 31, 2007. See Note 12
- Earnings Per
Share for additional discussion and application of this staff
position.
In May
2009, the FASB issued the accounting standard (Subsequent Events) which
established principles and requirements for subsequent events. In particular,
this Statement sets forth the period after the balance sheet date during which
management of a reporting entity shall evaluate events or transactions that may
occur for potential recognition or disclosure in the financial statements, the
circumstances under which an entity shall recognize events or transactions
occurring after the balance sheet date in its financial statements, and the
disclosures that an entity shall make about events or transactions that occur
after the balance sheet date. This standard was effective for interim or annual
financial statements issued after June 15, 2009. The Company adopted
this accounting standard in the second quarter of 2009. The adoption
of this standard did not have a material effect on the Company’s consolidated
financial statements.
In June
2009, the FASB issued the accounting standard (The FASB Accounting Standards
Codification™ and the Hierarchy of Generally Accepted Accounting Principles - a
replacement of FASB Statement No. 162) (the “Codification”), which
establishes the Codification as the single source of authoritative
nongovernmental U.S. generally accepted accounting principles (GAAP),
superseding various existing authoritative accounting
pronouncements. The Codification effectively eliminates the GAAP
hierarchy contained in the accounting standard (The Hierarchy of Generally Accepted Accounting
Principles) issued in May 2008, and establishes one level of
authoritative GAAP. This standard was effective for financial
statements issued for interim and annual periods ending after September 15,
2009. The Company adopted this accounting standard in the third
quarter of 2009. The Company’s adoption of this standard had no
effect on the Company’s consolidated financial statements, other than changes to
references to standards issued by the FASB within the consolidated financial
statements.
In
October 2009, the FASB issued an accounting standards update (Multiple-Deliverable Revenue
Arrangements - a consensus of the FASB Emerging Issues Task Force) which
provides amendments to the criteria for separating consideration in
multiple-deliverable arrangements. These amendments (i) establish a
selling price hierarchy for determining the selling price of a deliverable, (ii)
eliminate the residual method of allocation and require that arrangement
consideration be allocated at the inception of the arrangement to all
deliverables using the relative selling price method, and (iii) expand
disclosures related to a vendor’s multiple-deliverable revenue
arrangements. The amendments can be applied prospectively for revenue
arrangements entered into or materially modified in fiscal years beginning on or
after June 15, 2010 or applied retrospectively to all revenue arrangements for
all periods presented. Early adoption is permitted. If a
company elects early adoption and the period of adoption is not the beginning of
the fiscal year, the requirements must be applied retrospectively to the
beginning of the fiscal year. The Company is currently evaluating the
impact of adopting these amendments and does not anticipate that the initial
adoption of these amendments will have a material effect on its consolidated
financial statements.
Reclassifications
Certain
prior-year amounts have been reclassified to conform to the 2009
presentation.
Subsequent
Events Evaluation
The
Company has evaluated all subsequent events through February 25, 2010, the date
these financial statements were issued.
|
Note
3.
|
Inventories
|
Inventories
of continuing operations consist of the following:
|
December
31,
|
|||||
|
2009
|
2008
|
||||
|
Raw
materials, including core inventories
|
$ | 48,451 | $ | 57,621 | |
|
Work-in-process
|
597 | 760 | |||
|
Finished
goods
|
6,188 | 4,953 | |||
| $ | 55,236 | $ | 63,334 | ||
As of
December 31, 2009 and 2008, the raw materials inventory balances were net of
inventory reserves of $6,894 and $6,943, respectively.
|
Note
4.
|
Property,
Plant and Equipment
|
Property,
plant and equipment are summarized as follows:
|
December
31,
|
|||||||
|
2009
|
2008
|
||||||
|
Land
|
$ | 2,315 | $ | 2,261 | |||
|
Buildings
|
12,620 | 12,170 | |||||
|
Machinery
and equipment
|
111,942 | 110,958 | |||||
|
Autos
and trucks
|
1,277 | 2,162 | |||||
|
Furniture
and fixtures
|
2,736 | 3,127 | |||||
|
Leasehold
improvements
|
11,706 | 17,334 | |||||
|
Construction
in process
|
1,917 | 852 | |||||
| 144,513 | 148,864 | ||||||
|
Less: Accumulated
depreciation and amortization
|
(97,574 | ) | (96,136 | ) | |||
| $ | 46,939 | $ | 52,728 | ||||
As part
of the Company’s restructuring of its Drivetrain segment, obsolete property,
plant and equipment with an original cost totaling $13,391 and accumulated
depreciation of $12,121 were disposed of or impaired during the year ended
December 31, 2009. In addition, the Company disposed of certain other
property, plant, and equipment with an original cost totaling $1,090 and
accumulated depreciation of $1,024 during the year ended December 31,
2009. For the year ended December 31, 2009, property, plant and
equipment and accumulated depreciation increased by $1,492 and $1,280,
respectively, due to changes in the foreign exchange conversion rate between the
U.S. dollar and the British pound.
|
Note
5.
|
Goodwill
|
The
change in the carrying amount of goodwill of continuing operations by reportable
segment and a reconciliation to the consolidated financial statements is
summarized as follows:
|
Logistics
|
Drivetrain
|
Consolidated
|
|||||||||
|
Gross
balance at December 31, 2008:
|
|||||||||||
|
Goodwill
|
$ | 19,108 | $ | 127,859 | $ | 146,967 | |||||
|
Accumulated
impairment losses
|
(2,870 | ) | (90,868 | ) | (93,738 | ) | |||||
|
Net
balance at December 31, 2008
|
16,238 | 36,991 | 53,229 | ||||||||
|
Impairment
losses
|
− | (36,991 | ) | (36,991 | ) | ||||||
|
Net
balance at December 31, 2009
|
$ | 16,238 | $ | − | $ | 16,238 | |||||
|
Note
6.
|
Accrued
Expenses
|
Accrued
expenses of continuing operations are summarized as follows:
|
December
31,
|
|||||
|
2009
|
2008
|
||||
|
Payroll,
employee benefits and related costs
|
$ | 10,855 | $ | 13,682 | |
|
Customer
related allowances, discounts and other credits
|
4,139 | 4,388 | |||
|
Warranty
|
1,246 | 1,885 | |||
|
Exit,
disposal, certain severance and other charges
|
1,048 | 1,522 | |||
|
Liability
for insured losses
|
− | 1,100 | |||
|
Other
|
5,138 | 3,286 | |||
| $ | 22,426 | $ | 25,863 | ||
|
Note
7.
|
Warranty
Liability
|
The
Company offers various product warranties for transmissions and engines sold to
its customers in the Drivetrain segment. The specific terms and
conditions of the warranties vary depending upon the customer and the product
sold. Factors that affect the Company’s warranty liability include
number of products sold, historical and anticipated rates of warranty claims and
cost per claim. The Company accrues for estimated warranty costs as
sales are made and periodically assesses the adequacy of its recorded warranty
liability, included in accrued expenses, and adjusts the amount as
necessary.
Changes
to the Company’s warranty liability of continuing operations during the years
ended December 31, 2007, 2008 and 2009 are summarized as follows:
|
Balance
at December 31, 2006
|
$ | 1,985 | |
|
Warranties
issued
|
1,592 | ||
|
Claims
paid / settlements
|
(845 | ) | |
|
Changes
in liability for pre-existing warranties
|
(578 | ) | |
|
Balance
at December 31, 2007
|
2,154 | ||
|
Warranties
issued
|
951 | ||
|
Claims
paid / settlements
|
(666 | ) | |
|
Changes
in liability for pre-existing warranties
|
(554 | ) | |
|
Balance
at December 31, 2008
|
1,885 | ||
|
Warranties
issued
|
779 | ||
|
Claims
paid / settlements
|
(1,028 | ) | |
|
Changes
in liability for pre-existing warranties
|
(390 | ) | |
|
Balance
at December 31, 2009
|
$ | 1,246 |
|
Note
8.
|
Credit
Facility
|
On March
21, 2006, the Company executed a credit agreement and related security agreement
with certain banks that provide the Company with a $150,000 five-year senior
secured revolving credit facility (the “Credit Facility”). The Credit
Facility can be increased by up to $75,000 under certain circumstances and
subject to certain conditions (including the receipt from one or more lenders of
the additional commitments that may be requested).
Amounts
outstanding under the Credit Facility generally bear interest at LIBOR plus a
specified margin or the prime rate plus a specified margin, depending on the
type of borrowing being made. The applicable margin is based on the
Company’s ratio of debt to EBITDA from time to time. Currently, the
Company’s LIBOR margin is 1.0% and its prime rate margin is zero. Additionally,
the Company is required to pay quarterly in arrears a commitment fee based on
the average daily unused portion of the Credit Facility during such quarter,
currently at a rate 0.20% per annum. The Company must also pay fees
on outstanding letters of credit at a rate per annum equal to the applicable
LIBOR margin then in effect.
Amounts
advanced under the Credit Facility are guaranteed by all of the Company’s
domestic subsidiaries and secured by substantially all of the Company’s assets
and its domestic subsidiaries' assets. The credit and security
agreements contain several covenants, including ones that require the Company to
maintain specified levels of net worth, leverage and interest coverage and
others that may limit its ability to create liens, make investments, incur
indebtedness, make fundamental changes, make asset dispositions, make restricted
payments (including dividends) and engage in transactions with the Company’s
affiliates and affiliates of its subsidiaries. The Company was in
compliance with all debt covenants at December 31, 2009.
Amounts
outstanding under the Credit Facility are generally due and payable on the
March 31, 2011 expiration date of the credit agreement. The
Company can elect to prepay some or all of the outstanding balance from time to
time without penalty or capacity reduction.
On
February 10, 2009, the Company borrowed $70,000 in principal amount under the
Credit Facility in order to increase its cash position and to preserve financial
flexibility in light of uncertainty in the credit markets. This borrowing
was repaid during the fourth quarter of 2009.
As of
December 31, 2009 and 2008, the Company had no amounts outstanding under the
Credit Facility and had letters of credit issued against the Credit Facility of
$1,290 and $890, respectively. As of December 31, 2009, the borrowing
capacity of the Credit Facility was $148,710.
|
Note
9.
|
Income
Taxes
|
Income
tax expense (benefit) from continuing operations consists of the
following:
|
For
the years ended December 31,
|
|||||||||||
|
2009
|
2008
|
2007
|
|||||||||
|
Current:
|
|||||||||||
|
Federal
|
$ | 18,108 | $ | 16,083 | $ | 20,496 | |||||
|
State
|
2,437 | 2,729 | 2,796 | ||||||||
|
Foreign
|
– | (65 | ) | 317 | |||||||
|
Total
current
|
20,545 | 18,747 | 23,609 | ||||||||
|
Deferred:
|
|||||||||||
|
Federal
|
(7,972 | ) | (20,630 | ) | 4,615 | ||||||
|
State
|
(249 | ) | (1,465 | ) | (382 | ) | |||||
|
Foreign
|
1,531 | 925 | 110 | ||||||||
|
Total
deferred
|
(6,690 | ) | (21,170 | ) | 4,343 | ||||||
| $ | 13,855 | $ | (2,423 | ) | $ | 27,952 | |||||
Income
(loss) from continuing operations before income taxes is summarized as
follows:
|
For
the years ended December 31,
|
|||||||||||
|
2009
|
2008
|
2007
|
|||||||||
|
Domestic
|
$ | 27,071 | $ | (23,107 | ) | $ | 75,416 | ||||
|
Foreign
|
(1,509 | ) | (2,005 | ) | (342 | ) | |||||
|
Total
|
$ | 25,562 | $ | (25,112 | ) | $ | 75,074 | ||||
The
reconciliation of income tax expense (benefit) computed at the U.S. federal
statutory tax rates to income tax expense (benefit) from continuing operations
is as follows:
|
For
the years ended December 31,
|
|||||||||||||||||||||||
|
2009
|
2008
|
2007
|
|||||||||||||||||||||
|
Amount
|
Percent
|
Amount
|
Percent
|
Amount
|
Percent
|
||||||||||||||||||
|
Tax
at U.S. statutory rates
|
$ | 8,947 | 35.0 | % | $ | (8,790 | ) | 35.0 | % | $ | 26,276 | 35.0 | % | ||||||||||
|
State
income taxes, net of federal tax benefit
|
1,584 | 6.2 | 943 | (3.7 | ) | 1,587 | 2.1 | ||||||||||||||||
|
Foreign
income taxes
|
106 | 0.4 | 131 | (0.5 | ) | 17 | − | ||||||||||||||||
|
Increase
in state valuation allowance
|
159 | 0.6 | – | − | – | − | |||||||||||||||||
|
Increase
in foreign valuation allowance
|
2,129 | 8.3 | – | − | – | − | |||||||||||||||||
|
Nondeductible
expenses
|
67 | 0.3 | 119 | (0.5 | ) | 128 | 0.2 | ||||||||||||||||
|
Federal
and state credits
|
122 | 0.5 | (155 | ) | 0.6 | (500 | ) | (0.7 | ) | ||||||||||||||
|
Nondeductible
portion of goodwill
impairment
|
1,016 | 4.0 | 6,240 | (24.8 | ) | − | − | ||||||||||||||||
|
Other
|
(275 | ) | (1.1 | ) | (911 | ) | 3.6 | 444 | 0.6 | ||||||||||||||
| $ | 13,855 | 54.2 | % | $ | (2,423 | ) | 9.7 | % | $ | 27,952 | 37.2 | % | |||||||||||
Deferred
Income Taxes
Deferred
income taxes reflect the net tax effects of temporary differences between the
carrying amounts of assets and liabilities for financial reporting purposes and
the amounts used for income tax purposes. The Company evaluates its deferred tax
assets and liabilities at each reporting period in order to properly reflect
their tax effects at the currently enacted tax rates.
Significant
components of the Company's deferred tax assets and liabilities are as
follows:
|
December
31,
|
|||||||
|
2009
|
2008
|
||||||
|
Deferred
tax assets:
|
|||||||
|
Inventory
obsolescence
reserve
|
$ | 1,892 | $ | 1,997 | |||
|
Amortization
of intangible
assets
|
1,091 | – | |||||
|
Product
warranty
accruals
|
410 | 659 | |||||
|
Exit,
disposal, certain severance and other charges accruals
|
376 | 809 | |||||
|
Other
nondeductible
accruals
|
6,752 | 6,815 | |||||
|
Credit
carryforwards
|
408 | 376 | |||||
|
Net
operating loss
carryforwards
|
5,617 | 7,693 | |||||
| 16,546 | 18,349 | ||||||
|
Valuation
allowance
|
(5,296 | ) | (6,334 | ) | |||
|
Total
deferred tax assets
|
11,250 | 12,015 | |||||
|
Deferred
tax liabilities:
|
|||||||
|
Amortization
of intangible assets
|
– | 8,613 | |||||
|
Property,
plant and
equipment
|
3,425 | 2,542 | |||||
|
Total
deferred tax liabilities
|
3,425 | 11,155 | |||||
|
Net
deferred tax asset
|
$ | 7,825 | $ | 860 | |||
Tax
Attributes and Associated Valuation Allowances
The
Company provides for a valuation allowance against tax benefits associated with
certain state loss carryforwards as realization of these benefits is not deemed
likely due to limitations imposed by certain states on the Company’s ability to
utilize these benefits. The Company believes that, consistent with
GAAP, it is more likely than not that the tax benefits associated with the
balance of loss carryforwards and other deferred tax assets will not be realized
through future taxable earnings or alternative tax strategies. During
2009, the Company’s income tax valuation allowance related to state loss
carryforwards decreased by the net amount of $3,199, which included a decrease
of $4,521 primarily due to the expiration of certain state net operating loss
carryforwards that had full valuation allowances recorded against them,
partially offset by an increase in the valuation allowance related to new state
net operating loss carryforwards of $1,322, as management has determined
that it is more likely than not that the related deferred tax asset will not be
realized. As of December 31, 2009, the Company has a state loss
carryforward asset of $3,688 expiring in varying amounts from 2013 to
2029.
During
2009, through its subsidiary in the U.K., the Company generated foreign net
operating losses of $1,068. As of December 31, 2009, the Company had
a tax effected foreign loss carryforward asset of $1,674 which has an indefinite
carryforward period and is subject to a full valuation
allowance. In addition, the Company’s U.K. subsidiary has a
surplus Advance Corporate Tax (ACT) carryforward of approximately $355 available
as a direct offset to future U.K. tax liability. The Company’s
surplus ACT can be carried forward indefinitely but is subject to a full
valuation allowance. During 2009, the Company’s ACT increased by $32
because of a change in the foreign exchange rate.
A
valuation allowance has been established for the tax benefits associated with
foreign loss carryforwards and ACT as realization is not deemed likely due to
limitations imposed by the foreign jurisdiction on the Company’s ability to
utilize these benefits. The Company believes that, consistent with
GAAP, it is more likely than not that the tax benefits associated with the
balance of loss carryforwards and other deferred tax assets will not be realized
through future taxable earnings or alternative tax strategies. During
2009, the Company’s income tax valuation allowance related to foreign loss
carryforwards and other deferred tax assets increased by $2,161.
As of
December 31, 2009, there was approximately $685 of accumulated unremitted
earnings from the Company’s U.K. subsidiary with respect to which deferred tax
has not been provided because the undistributed earnings of the U.K. subsidiary
are indefinitely reinvested.
Uncertain
Tax Positions and Open Tax Years
On June
15, 2009, the Oklahoma Supreme Court denied the Company’s petition for
certiorari with respect to certain tax credits claimed on its state income tax
filings with the State of Oklahoma. As a result, $1,101 of
unrecognized tax benefits were derecognized with an offsetting derecognition of
current refundable income taxes with no net impact to net income for the
year. The total liabilities associated with unrecognized tax benefits
that, if recognized, would impact the effective tax rates were $546 and $1,637
as of December 31, 2009 and 2008, respectively.
A
reconciliation of the beginning and ending balance for liabilities associated
with unrecognized tax benefits is as follows:
|
2009
|
2008
|
|||||
|
Balance
at beginning of year
|
$ | 1,637 | $ | 1,608 | ||
|
Tax
positions related to the current year
|
10 | 29 | ||||
|
Settlements
with tax authorities
|
(1,101 | ) | – | |||
|
Balance
at end of year
|
$ | 546 | $ | 1,637 | ||
The last
year the IRS completed an examination of the Company’s tax returns was 2004, and
all years up through and including that year are closed by
examination. The Company’s 2006-2008 tax returns are currently under
examination by the IRS. The IRS examination is expected to be
concluded by June 30, 2010, which may have an impact on the Company’s uncertain
tax positions liability. The Company believes that it is reasonably
possible for its liability related to uncertain tax positions to change from a
range of zero to $546.
The
Company classifies interest expense related to income tax liabilities, when
applicable, as part of interest expense in its consolidated statements of
operations rather than income tax expense (benefit). The Company
classifies any income tax penalties as part of selling, general and
administrative expense in its consolidated statements of
operations.
The
Company’s primary state tax jurisdictions are Illinois, Missouri, Oklahoma and
Texas and its primary international jurisdiction is the United
Kingdom. The following table summarizes the open tax years for each
major jurisdiction:
|
Jurisdiction
|
Open
Tax Years
|
|
|
Federal
|
2006-2008
|
|
|
Illinois
|
2007-2008
|
|
|
Missouri
|
2006-2008
|
|
|
Oklahoma
|
2006-2008
|
|
|
Texas
|
2005-2008
|
|
|
United
Kingdom
|
2007-2008
|
|
Note
10.
|
Stock-Based
Awards
|
The
Company provides stock options and other incentive stock awards (“Stock Awards”)
to employees, non-employee directors and independent contractors under its
Amended and Restated 2006 Stock Incentive Plan (the “2006 Plan”), its 2004 Stock
Incentive Plan (the “2004 Plan”), its 2002 Stock Incentive Plan (the “2002
Plan”) and its 2000 Stock Incentive Plan (the “2000 Plan”). In addition, Stock
Awards are outstanding under the Company’s 1998 Stock Incentive Plan, which
expired on March 16, 2008, (the “1998 Plan”) and its 1996 Stock Incentive Plan,
which expired on July 29, 2004, (the “1996 Plan” and, collectively with the
2006, 2004, 2002, 2000 and 1998 Plans, the “Plans”), all of which have been
approved by the Company’s stockholders. The 2000 and 2002 Plans
provide for granting of non-qualified and incentive stock option awards while
the 2004 and 2006 Plans provide for the granting of non-qualified stock option
awards but not incentive options. Stock options under the Plans are
generally granted with an exercise price equal to the market price of the
Company’s common stock on the date of grant with vesting periods that have
ranged from six months to five years, as determined by the Board of Directors or
the Compensation and Nominating Committee of the Board of
Directors. Options under the Plans expire ten years from the date of
grant. The 2006, 2004, 2002 and 2000 Plans authorize the issuance of
2,000,000 (which was increased from 1,100,000 in June 2009), 1,000,000,
1,000,000 and 750,000 shares of the Company’s common stock,
respectively. Shares available for grant under the Plans in the
aggregate were 1,071,509, 493,728 and 842,169 as of December 31, 2009, 2008
and 2007, respectively.
Stock
Options
A summary
of the Plans’ stock option activities during the year ended December 31, 2009 is
presented below:
|
Shares
|
Weighted-
Average
Exercise
Price
|
Weighted-
Average
Remaining Contractual Term (in years)
|
Aggregate
Intrinsic Value
|
|||||||
|
Outstanding
at January 1, 2009
|
1,747,022 | $ | 21.87 | |||||||
|
Granted
at market price
|
297,623 | $ | 15.65 | |||||||
|
Exercised
|
(217,313 | ) | $ | 14.52 | ||||||
|
Forfeited
|
(24,850 | ) | $ | 25.30 | ||||||
|
Expired
|
(32,758 | ) | $ | 25.89 | ||||||
|
Outstanding
at December 31, 2009
|
1,769,724 | $ | 21.60 | 5.8 | $ | 7,096 | ||||
|
Vested
and expected to vest at December 31, 2009
|
1,736,926 | $ | 21.69 | 5.6 | $ | 6,857 | ||||
|
Exercisable
at December 31, 2009
|
1,227,251 | $ | 22.71 | 4.5 | $ | 4,243 | ||||
The
aggregate intrinsic value in the table above represents the difference between
the Company’s closing stock price on December 31, 2009 and the exercise price of
each stock option, multiplied by the number of in-the-money stock
options. This amount changes based upon the fair market value of the
Company’s common stock.
The total
intrinsic value of options exercised during the years ended December 31, 2009,
2008 and 2007 was $1,673, $160 and $3,119, respectively. The weighted
average fair value of stock options granted during the years ended December 31,
2009, 2008 and 2007 is estimated at $6.50, $6.74 and $8.79, respectively. The
Company estimates that as of December 31, 2009 it had $1,486 of total
unrecognized compensation cost related to stock options granted under the Plans,
which is expected to be recognized over the weighted-average period of 1.4
years.
The
following summarizes information about options outstanding as of
December 31, 2009:
|
Options
Outstanding
|
Options
Exercisable
|
||||||||||||
|
Range
of
Exercise
Prices
|
Shares
|
Weighted-
Average
Remaining
Contractual
Life
|
Weighted-
Average
Exercise
Prices
|
Shares
|
Weighted-
Average
Exercise
Prices
|
||||||||
| $ | 5.00 - $9.00 | 31,000 |
1.35 years
|
$ | 5.06 | 31,000 | $ | 5.06 | |||||
| $ | 9.01 - $15.00 | 185,166 |
3.48 years
|
$ | 12.94 | 185,166 | $ | 12.94 | |||||
| $ | 15.01 - $21.00 | 584,823 |
7.85 years
|
$ | 16.81 | 237,967 | $ | 17.75 | |||||
| $ | 21.01 - $27.00 | 499,531 |
6.52 years
|
$ | 23.42 | 342,314 | $ | 23.73 | |||||
| $ | 27.01 - $32.00 | 469,204 |
3.65 years
|
$ | 30.16 | 430,804 | $ | 30.12 | |||||
| 1,769,724 |
5.79 years
|
$ | 21.60 | 1,227,251 | $ | 22.71 | |||||||
Restricted
Stock
The
following summarizes the status of Restricted Stock as of December 31, 2009 and
changes during the year ended December 31, 2009:
|
|
Number
of Shares
|
Weighted
Average Grant-Date Fair Value
|
|||
|
Unvested
balance at January 1, 2009
|
241,526 | $ | 23.93 | ||
|
Granted
|
142,549 | $ | 16.10 | ||
|
Vested
|
(134,176 | ) | $ | 24.18 | |
|
Forfeited
|
(24,204 | ) | $ | 25.20 | |
|
Unvested
balance at December 31, 2009
|
225,695 | $ | 18.70 | ||
The
Company estimates that as of December 31, 2009 it had $1,825 of total
unrecognized compensation cost related to Restricted Stock granted under the
Plans, which is expected to be recognized over the weighted-average period of
1.3 years. The total fair value of shares that vested during the
years ended December 31, 2009, 2008 and 2007 was $2,070, $2,201 and $2,312,
respectively. The weighted
average grant-date fair value of Restricted Stock granted during 2008 and 2007
was $21.39 and $28.43, respectively.
|
Note
11.
|
Repurchases
of Common Stock
|
During
the years ended December 31, 2009 and 2008, certain officers and employees of
the Company delivered to the Company 38,141 and 22,784 shares of the Company’s
common stock in payment of $587 and $515, respectively, of minimum withholding
tax obligations arising from the vesting of Restricted Stock
awards. Per the stock incentive plans under which the stock awards
were granted, (i) the withholding tax obligation was based upon the fair market
value of the Company’s common stock on the vesting date and (ii) the shares
returned to the Company in satisfaction of the withholding tax obligation were
returned to their respective plan and are available for future
grant.
During
the year ended December 31, 2008, the Company purchased 2,489,671 shares of its
common stock at an aggregate cost of $50,075 including broker commissions and
transaction fees. Those purchases were related to a stock repurchase
plan authorized and completed during the year.
In
addition, 24,204 and 27,476 shares of the Company’s common stock were returned
to treasury, at no cost, due to the forfeiture of Restricted Stock awards during
2009 and 2008, respectively.
|
Note
12.
|
Earnings
Per Share
|
The
following table sets forth the computation of basic and diluted earnings per
share from continuing operations:
| For the years ended December 31, | |||||||||||
|
2009
|
2008
|
2007
|
|||||||||
|
Numerator:
|
|||||||||||
|
Income
(loss) from continuing operations
|
$ | 11,707 | $ | (22,689 | ) | $ | 47,122 | ||||
|
Income
allocated to participating securities
|
(133 | ) | − | (480 | ) | ||||||
|
Income
(loss) from continuing operations available to common
shareholders
|
$ | 11,574 | $ | (22,689 | ) | $ | 46,642 | ||||
|
Denominator:
|
|||||||||||
|
Weighted
average common shares outstanding
|
19,669,629 | 20,877,564 | 21,806,115 | ||||||||
|
Effect
of dilutive securities: stock options
|
94,110 | − | 260,466 | ||||||||
|
Denominator
for diluted earnings per common share
|
19,763,739 | 20,877,564 | 22,066,581 | ||||||||
|
Per
common share - basic
|
$ | 0.59 | $ | (1.09 | ) | $ | 2.14 | ||||
|
Per
common share - diluted
|
$ | 0.59 | $ | (1.09 | ) | $ | 2.11 | ||||
The
Company’s unvested Restricted Stock are considered participating securities,
which requires the Company to calculate earnings per share under the two-class
method. Per the two-class method, the Company’s reported income from
continuing operations is reduced by the amount allocated to participating
securities to arrive at income from continuing operations available to common
shareholders for purposes of calculating earnings per share. Earnings
per common share - basic for each
period is calculated by dividing income (loss) from continuing operations
available to common shareholders by the weighted average common shares
outstanding for that period. During loss years, no amounts are
allocated to participating securities, as the Company’s holders of unvested
Restricted Stock have no contractual obligation to fund the Company’s
losses. Earnings per common share - diluted for each
particular period is calculated using the more dilutive of the treasury stock or
the two-class method. The Company has determined the two-class method
to be the more dilutive method for all periods presented. As a
result, earnings per common share - diluted is
calculated by dividing income (loss) from continuing operations available to
common shareholders by the weighted-average number of common shares outstanding,
as adjusted for the potential dilutive effect of non-participating share-based
awards (stock options).
Due to
the loss reported in 2008, the 2008 share calculation excludes the antidilutive
effect of stock options and Restricted Stock which would have been 128,612, had
the Company not reported a loss.
|
Note
13.
|
Employee
Retirement Plans
|
The
Company’s defined contribution plan provides substantially all U.S. salaried and
hourly employees an opportunity to accumulate personal funds for their
retirement, subject to minimum duration of employment
requirements. As determined by the provision of the plan,
contributions are made on a before-tax basis and the Company matches a portion
of the employees' basic voluntary contributions. Company matching
contributions to defined contribution plans were approximately $1,475, $1,545
and $1,346 for the years ended December 31, 2009, 2008, and 2007,
respectively.
The
Company maintains a nonqualified deferred compensation plan for certain
employees and directors. Under the terms of this plan, funds are
withheld from the participant’s pre-tax earnings, a portion of which are matched
by the Company in certain circumstances, and are placed into a trust in which
the use of the trust assets by the Company is restricted to future distributions
to plan participants. On its consolidated balance sheets, the Company
classifies its investments related to planned distributions (i) for the next
twelve months in short-term investments and (ii) beyond twelve months in
long-term investments. Distributions, which are contractually
specified by the plan participants as either “in-service” or “post-separation,”
can be made in a lump sum payment or in annual installments over a period not to
exceed 15 years. The assets of the trust primarily consist of mutual
fund securities and are available to satisfy claims of the Company’s general
creditors in the event of its bankruptcy. The Company classifies
these average cost method investments as available-for-sale securities, with
unrealized holding gains and losses reported net of tax in accumulated other
comprehensive income (loss). At December 31, 2009 and 2008, the
trust’s assets were $5,665 and $5,126 and the corresponding compensation
liability, was $5,646 and $5,107, respectively.
The
following is a summary of the trust’s assets:
|
December
31,
|
|||||||
|
2009
|
2008
|
||||||
|
Cost
basis of investments
|
$ | 5,768 | $ | 5,612 | |||
|
Gross
unrealized holding gains
|
14 | − | |||||
|
Gross
unrealized holding losses
|
(117 | ) | (486 | ) | |||
|
Aggregate
fair value
|
$ | 5,665 | $ | 5,126 | |||
The
Company’s gross realized gains and losses from its available-for-sale securities
were zero and $114, respectively during 2009, and $64 and $184, respectively
during 2008, and were classified in other income, net.
In
addition, the Company’s subsidiary located in the U.K. provides a voluntary
retirement benefits plan for its employees. Company-matching
contributions to this plan were approximately $280, $333 and $370 for the years
ended December 31, 2009, 2008 and 2007, respectively.
|
Note
14.
|
Accumulated
Other Comprehensive Income (Loss)
|
The
balances included in accumulated other comprehensive income (loss) were as
follows:
|
December
31,
|
|||||||
|
2009
|
2008
|
||||||
|
Foreign
currency translation adjustments
|
$ | 240 | $ | (710 | ) | ||
|
Unrealized
loss on available-for-sale securities, net of income taxes
|
(64 | ) | (259 | ) | |||
|
Accumulated
other comprehensive income (loss)
|
$ | 176 | $ | (969 | ) | ||
|
Note
15.
|
Discontinued
Operations
|
During
2008, the Company discontinued its NuVinci CVP project. As a result,
the Company sold certain tangible and intangible assets related to NuVinci to
Fallbrook Technologies Inc. for a total of $6,103 ($4,151 paid in cash and an 8%
promissory note in the principal amount of $1,952 which was paid in full on
December 31, 2008). As part of this decision, the Company recorded
pre-tax charges of $1,911 during 2008 related to the exit from this project,
including charges of (i) $1,020 for termination benefits, (ii) $469 for certain
inventory deemed unusable by Fallbrook, (iii) $228 primarily related to the
write-off of capitalized patent development costs, and (iv) $194 related to the
disposal of certain fixed assets. Net sales for the NuVinci CVP
project were $752 and $1,535 for the years ended December 31, 2008 and 2007,
respectively.
During
2006, the Company discontinued its Independent Aftermarket engine and
transmission businesses. The engine business was sold and the
transmission business ceased operations with the exception of contractual
obligations for the warranty replacement for units sold prior to its
closure. The pre-tax income of $66 and $53 recorded during 2009 and
2008, respectively, and the pre-tax charge of $613 recorded in 2007, primarily
related to the run-out of warranty claims on sales made prior to the closure of
the Independent Aftermarket transmission business.
Details
of the gain (loss) recorded from discontinued operations are as
follows:
|
For
the years ended December 31,
|
|||||||||||
|
2009
|
2008
|
2007
|
|||||||||
|
NuVinci:
|
|||||||||||
|
Loss
from sale and exit
|
$ | − | $ | (1,911 | ) | $ | − | ||||
|
Operating
loss
|
− | (2,418 | ) | (11,689 | ) | ||||||
|
Loss
before income taxes
|
− | (4,329 | ) | (11,689 | ) | ||||||
|
Income
tax benefit
|
− | 1,818 | 4,548 | ||||||||
|
Loss
from NuVinci project, net of income taxes
|
− | (2,511 | ) | (7,141 | ) | ||||||
|
Independent Aftermarket:
|
|||||||||||
|
Income
(loss) before income taxes
|
66 | 53 | (613 | ) | |||||||
|
Income
tax (expense) benefit
|
(24 | ) | (22 | ) | 239 | ||||||
|
Gain
(loss) from Independent Aftermarket, net of income taxes
|
42 | 31 | (374 | ) | |||||||
|
Gain
(loss) from discontinued operations, net of income taxes
|
$ | 42 | $ | (2,480 | ) | $ | (7,515 | ) | |||
Details
of assets and liabilities of discontinued operations are as
follows:
|
December 31,
|
|||||
|
2009
|
2008
|
||||
|
Assets:
|
|||||
|
NuVinci:
|
|||||
|
Accounts
receivable
|
$ | − | $ | 52 | |
|
Total
assets of discontinued
operations
|
$ | − | $ | 52 | |
|
Liabilities:
|
|||||
|
NuVinci:
|
|||||
|
Current
liabilities
|
$ | − | $ | 363 | |
|
Independent Aftermarket:
|
|||||
|
Current
liabilities
|
− | 90 | |||
|
Total
liabilities of discontinued
operations
|
$ | − | $ | 453 | |
|
Note
16.
|
Fair
Value Measurements
|
The
Company records its financial assets and liabilities at fair
value. The accounting standard for fair value defines fair value as
the price that would be received to sell an asset or paid to transfer a
liability (an exit price) in an orderly transaction between market participants
at the measurement date, establishes a framework for measuring fair value,
establishes a hierarchy of fair value measurements based upon the observability
of inputs used to value assets and liabilities, requires consideration of
nonperformance risk, and expands disclosures about the methods used to measure
fair value.
The
accounting standard establishes a three-level hierarchy of measurements based
upon the reliability of observable and unobservable inputs used to arrive at
fair value. Observable inputs are independent market data, while
unobservable inputs reflect the Company’s assumptions about
valuation. The three levels of the hierarchy are defined as
follows:
|
|
•
|
Level
1: Observable inputs such as quoted prices in active markets for identical
assets and liabilities;
|
|
|
•
|
Level
2: Inputs other than quoted prices but are observable for the asset or
liability, either directly or indirectly. These include quoted
prices for similar assets or liabilities in active markets and
quoted prices for identical or similar assets or liabilities in markets
that are not active; and model-derived valuations in which all significant
inputs and significant value drivers are observable in active markets;
and
|
|
|
•
|
Level
3: Valuations derived from valuation techniques in which one or more
significant inputs or significant value drivers are
unobservable.
|
The
following table presents the Company’s fair value hierarchy for those financial
assets and liabilities measured at fair value on a recurring basis as of
December 31, 2009:
|
Level
1
|
Level
2
|
Level
3
|
||||||
|
Assets:
|
||||||||
|
Cash
and cash
equivalents
|
$ | 73,803 | $ | − | $ | − | ||
|
Short-term
and long-term investments
|
$ | 5,665 | $ | − | $ | − | ||
|
Liabilities:
|
||||||||
|
Deferred
compensation
|
$ | 5,646 | $ | − | $ | − | ||
The
Company’s cash and cash equivalents as of December 31, 2009 are primarily
invested in highly liquid money market funds. The short-term and
long-term investments and the deferred compensation liability are described in
Note 13 − Employee Retirement Plans.
The
carrying value of accounts receivable, inventories, prepaid and other assets,
refundable income taxes, accounts payable, accrued expenses, and income taxes
payable as of December 31, 2009 and 2008, approximate fair value because of the
short-term nature of these instruments.
|
Note
17.
|
Commitments
and Contingencies
|
The
Company leases certain facilities and equipment under various operating lease
agreements, which expire on various dates through 2019. Facility
leases that expire generally are expected to be renewed or replaced by other
leases. Future minimum rental commitments under non-cancelable
operating leases with terms in excess of one year are as follows:
|
For the years ended
December 31,
|
Operating
Leases
|
||
|
2010
|
$ | 5,470 | |
|
2011
|
5,041 | ||
|
2012
|
4,731 | ||
|
2013
|
2,754 | ||
|
2014
|
671 | ||
|
2015
and thereafter
|
2,364 | ||
|
Total
minimum lease payments
|
$ | 21,031 | |
Rent
expense for all operating leases approximated $10,545, $10,892 and $9,245 for
the years ended December 31, 2009, 2008 and 2007,
respectively.
From time
to time, the Company has been, and currently is, involved in various legal
claims arising in connection with its business. While the results of
these claims cannot be predicted with certainty, as of December 31, 2009, there
were no asserted claims against the Company that, in the opinion of management,
if adversely decided, would have a material effect on the Company’s consolidated
financial statements. The Company is subject to various evolving federal, state,
local and foreign environmental laws and regulations governing, among other
things, emissions to air, discharge to waters and the generation, handling,
storage, transportation, treatment and disposal of a variety of hazardous and
non-hazardous substances and wastes. These laws and regulations provide for
substantial fines and criminal sanctions for violations, and impose liability
for the costs of cleaning up, and damages resulting from, past spills, disposals
or other releases of hazardous substances.
In
connection with the acquisition of certain subsidiaries, some of which have been
subsequently divested or relocated, the Company conducted certain investigations
of these companies' facilities and their compliance with applicable
environmental laws. The investigations, which included Phase I assessments
by independent consultants of all manufacturing and various distribution
facilities, found that a number of these facilities have had or may have had
releases of hazardous materials that may require remediation and also may be
subject to potential liabilities for contamination from off-site disposal of
substances or wastes. These assessments also found that reporting and other
regulatory requirements, including waste management procedures, were not or may
not have been satisfied. Although there can be no assurance, the Company
believes that, based in part on the investigations conducted, in part on certain
remediation completed prior to or since the acquisitions, and in part on the
indemnification provisions of the agreements entered into in connection with the
Company's acquisitions, the Company will not incur any material liabilities
relating to these matters.
In
connection with the sale of the ATC Distribution Group, a former segment of the
Company’s business that was discontinued and sold during 2000 (the "DG Sale")
and is now owned by Transtar Industries, Inc., the Company agreed to certain
matters with the buyer that could result in contingent liability to the Company
in the future. These include the Company's indemnification of the
buyer against (i) environmental liability at former ATC Distribution Group
facilities that had been closed prior to the DG Sale, including former
manufacturing facilities in Azusa, California, Mexicali, Mexico and Dayton,
Ohio, (ii) any other environmental liability of the ATC Distribution Group
relating to periods prior to the DG Sale, subject to an $850
deductible ($100 in the case of the closed facilities) and a $12,000 cap (except
with respect to closed facilities) and (iii) any tax liability of the ATC
Distribution Group relating to periods prior to the DG Sale.
|
Note
18.
|
Segment
Information
|
Within
the Company, financial performance is measured by lines of
business. The Company has two reportable segments: the Logistics
segment and the Drivetrain segment. The Logistics segment provides
value-added warehousing, packaging and distribution, reverse
logistics, turnkey order fulfillment, electronic equipment testing,
refurbishment and repair, and transportation management services. The
principal customers are currently in the wireless, consumer electronics and
automotive industries and include AT&T and TomTom. The Drivetrain
segment primarily sells remanufactured transmissions to OEMs, primarily for use
as replacement parts by their domestic dealers during the warranty and/or
post-warranty periods following the sale of a vehicle. In addition,
the Drivetrain segment sells select remanufactured engines to certain OEMs in
the U.S. and Europe. The principal customers are Ford, Allison, and
Chrysler. (See Note 2 − Summary of Significant Accounting Policies −
Goodwill and Other Intangible Assets, for a discussion regarding the loss of the
Company’s remanufactured transmission business with Honda.) The reportable
segments are each managed and measured separately primarily due to the differing
customers and distribution channels.
The
Company evaluates performance based upon operating income. The
reportable segments’ accounting policies are the same as those of the
Company. In 2008, the Company allocated fixed corporate overhead
equally to each of the Company’s reportable segments. In 2009, as the
result of (i) growth in the Logistics segment and (ii) a reduction in volumes
for the Drivetrain segment, approximately 75% of the fixed corporate overhead is
being allocated to the Logistics segment and 25% to the Drivetrain segment,
while certain costs that are variable in nature are allocated to the segment for
whose benefit the costs are incurred. Internal information systems
costs are allocated based upon usage estimates.
Financial
information relating to the Company’s reportable segments and a reconciliation
to the consolidated financial statements are as follows as of and for the years
ended December 31:
|
Logistics
|
Drivetrain
|
Corporate
|
Discontinued
Assets
|
Consolidated
|
||||||||||||||
|
2009:
|
||||||||||||||||||
|
Net
sales from external customers
|
$ | 345,297 | $ | 139,720 | $ | − | $ | − | $ | 485,017 | ||||||||
|
Depreciation
and amortization expense
|
6,300 | 7,053 | − | − | 13,353 | |||||||||||||
|
Impairment
of goodwill
|
− | 36,991 | − | − | 36,991 | |||||||||||||
|
Exit,
disposal, certain severance and other charges (credits)
|
(5 | ) | 4,565 | 578 | − | 5,138 | ||||||||||||
|
Operating
income (loss)
|
64,031 | (36,978 | ) | (578 | ) | − | 26,475 | |||||||||||
|
Total
assets
|
127,494 | 85,594 | 78,977 | − | 292,065 | |||||||||||||
|
Goodwill
|
16,238 | − | − | − | 16,238 | |||||||||||||
|
Expenditures
of long-lived assets, net
|
4,447 | 4,031 | 160 | − | 8,638 | |||||||||||||
|
2008:
|
||||||||||||||||||
|
Net
sales from external customers
|
$ | 353,416 | $ | 177,144 | $ | − | $ | − | $ | 530,560 | ||||||||
|
Depreciation
and amortization expense
|
6,454 | 8,114 | − | − | 14,568 | |||||||||||||
|
Impairment
of goodwill
|
− | 79,146 | − | − | 79,146 | |||||||||||||
|
Exit,
disposal, certain severance and other charges
|
269 | 10,741 | − | − | 11,010 | |||||||||||||
|
Operating
income (loss)
|
56,234 | (81,291 | ) | − | − | (25,057 | ) | |||||||||||
|
Total
assets
|
124,959 | 129,952 | 27,379 | 52 | 282,342 | |||||||||||||
|
Goodwill
|
16,238 | 36,991 | − | − | 53,229 | |||||||||||||
|
Expenditures
of long-lived assets, net
|
7,747 | 2,942 | 643 | − | 11,332 | |||||||||||||
|
2007:
|
||||||||||||||||||
|
Net
sales from external customers
|
$ | 293,917 | $ | 235,254 | $ | − | $ | − | $ | 529,171 | ||||||||
|
Depreciation
and amortization expense
|
5,643 | 9,230 | − | − | 14,873 | |||||||||||||
|
Exit,
disposal, certain severance and other charges (credits)
|
(17 | ) | 3,390 | − | − | 3,373 | ||||||||||||
|
Operating
income
|
45,038 | 29,748 | − | − | 74,786 | |||||||||||||
|
Total
assets
|
96,688 | 232,641 | 52,431 | 7,614 | 389,374 | |||||||||||||
|
Goodwill
|
16,238 | 116,137 | − | − | 132,375 | |||||||||||||
|
Expenditures
of long-lived assets
|
9,848 | 9,388 | 138 | − | 19,374 | |||||||||||||
Geographic
information for revenues, determined by destination of sale and long-lived
assets, determined by the location of the Company’s facilities is as
follows:
|
As
of and for the
|
||||||||
|
Years
ended December 31,
|
||||||||
|
2009
|
2008
|
2007
|
||||||
|
Net sales:
|
||||||||
|
United
States
|
$ | 470,005 | $ | 508,380 | $ | 502,048 | ||
|
Europe
and
Canada
|
15,012 | 22,180 | 27,123 | |||||
|
Consolidated
net
sales
|
$ | 485,017 | $ | 530,560 | $ | 529,171 | ||
|
Long-lived assets:
|
||||||||
|
United
States
|
$ | 64,077 | $ | 110,101 | $ | 190,357 | ||
|
Europe
|
1,769 | 2,014 | 2,954 | |||||
|
Assets
of discontinued
operations
|
− | − | 5,206 | |||||
|
Consolidated
long-lived
assets
|
$ | 65,846 | $ | 112,115 | $ | 198,517 | ||
During
the year ended December 31, 2009, net sales from each of three customers
amounted to 10 percent or more of the Company’s net sales. For the
years ended December 31, 2009, 2008 and 2007, sales to AT&T (Logistics
segment) accounted for $234,621, $226,994 and $195,302, TomTom (Logistics
segment) accounted for $52,808, $73,420 and $16,440, and Ford (Drivetrain
segment) accounted for $49,359, $58,127 and $75,922, respectively.
|
Note
19.
|
Exit,
Disposal, Certain Severance and Other
Charges
|
The
Company has periodically incurred certain costs associated with restructuring
and other initiatives that include consolidation of operations or facilities,
management reorganization and delayering, rationalization of certain products,
product lines and services, and asset impairments. Examples of these
costs include severance benefits for terminated employees, lease termination and
other facility exit costs, moving and relocation costs, losses on the disposal
or impairments of fixed assets, write-down of certain inventories, and certain
legal and other professional fees.
In 2007,
the Company recorded charges of $3,390 in its Drivetrain segment consisting of
(i) $1,389 for the write-down of raw materials inventory related to the
wind-down of activities with certain low-volume customers (classified as cost of
sales – products), (ii) $753 of severance and other costs primarily related to
certain management upgrades and cost reduction activities, (iii) $675 of certain
legal and other professional fees unrelated to ongoing operating activities of
the segment, and (iv) $573 of costs primarily related to fixed asset disposals
related to the exit from a leased facility, a change in the estimated useful
life of certain fixed assets, and to a lesser extent the disposal of certain
fixed assets related to the wind-down of activities with certain low-volume
customers (classified as cost of sales – products).
Also in
2007, in the Logistics segment, the Company recorded a gain of $67 primarily
related to the recovery of an insurance claim originating in 2003, partially
offset by a charge of $50 related to a potential acquisition that the Company
ultimately decided not to pursue.
During
the first three quarters of 2008, the Company recorded charges of $1,342
consisting of (i) $850 of termination benefits primarily related to cost
reduction activities and the reorganization of certain management functions in
the Drivetrain segment, (ii) $231 of termination benefits primarily related to
cost reduction activities and the reorganization of certain functions within the
Logistics segment’s information technology group, (iii) $223 of certain legal and other
professional fees unrelated to ongoing operating activities of the Drivetrain
segment, and (iv) $38 of asset write-offs related to the wind-down of activities
with a customer in the Logistics segment.
During
the later part of 2008, the Company’s Drivetrain customers and the supporting
supply base experienced unprecedented distress due to the economic slowdown and
adverse changes in the North American vehicle industry. On December
9, 2008, the Company announced the restructuring of its Drivetrain operations,
including the closure of its Springfield, Missouri automatic transmission
remanufacturing facility and the consolidation of the Springfield operations
with the Drivetrain operations in Oklahoma City, Oklahoma (the “2008 Drivetrain
Restructuring”). The decision to consolidate these remanufacturing
plants was primarily driven by reduced customer volumes and the need for a
comprehensive restructuring of the Drivetrain business to align its capacity
with lower customer demand levels during a prolonged economic
downturn. As of June 30, 2009, all production had been transferred
from the Springfield facility to the Oklahoma City operations.
As a
result of the 2008 Drivetrain Restructuring activities, during the fourth
quarter of 2008, the Company recorded $9,668 of exit, disposal, certain
severance and other charges, which consisted of:
|
|
(i)
|
$7,310
for the write-down of raw materials inventory due to the determination of
excess quantities of raw materials on hand as a result of the decline in
volume and the consolidation of facilities (classified as cost of sales –
products), including the disposal of $6,598 of
inventory;
|
|
|
(ii)
|
$1,896
of severance costs primarily for employees terminated as part of the
closure of the Springfield
facility;
|
|
|
(iii)
|
$304
of costs related to fixed asset disposals (classified as cost of sales –
products); and
|
|
|
(iv)
|
$158
of other plant consolidation costs.
|
During
2009, the Company recorded $5,123 of costs relating to the 2008 Drivetrain
Restructuring, consisting of (i) $3,754 of costs to transfer production lines to
its Oklahoma City facility and exit the Springfield facility, including $946 of
costs classified as cost of sales – products, and (ii) $1,369 of severance costs
for employees terminated as part of the closure of the Springfield
facility.
The
following is an analysis of the reserves related to the 2008 Drivetrain
Restructuring, which was completed during 2009:
|
Termination
Benefits
|
Exit/Other
Costs
|
Loss
on
Write-Down
of
Assets
|
Total
|
||||||||||||
|
Total
amount of expense incurred to date and expected to be incurred
|
$ | 3,265 | $ | 3,182 | $ | 8,344 | $ | 14,791 | |||||||
|
Reserve
as of December 31, 2008
|
$ | 1,478 | $ | 30 | $ | 1,016 | $ | 2,524 | |||||||
|
Provision
|
1,369 | 3,024 | 730 | 5,123 | |||||||||||
|
Payments
|
(2,847 | ) | (3,054 | ) | − | (5,901 | ) | ||||||||
|
Asset
write-offs
|
− | − | (730 | ) | (730 | ) | |||||||||
|
Currency
translation adjustment
|
− | − | 71 | 71 | |||||||||||
|
Reserve
as of December 31, 2009
|
$ | − | $ | − | $ | 1,087 | $ | 1,087 | |||||||
The
balance in the loss on write-down of assets of $1,087 as of December 31, 2009 is
included in inventory reserves.
Also
during 2009, the Company recorded a net credit of $558 related to additional
restructuring activities in its Drivetrain segment consisting of (i) income of
$2,571 from an adjustment to materials cost related to the wind-down of its
relationship with a customer (classified as cost of sales – products), (ii)
$1,053 of costs related to a customer inventory reimbursement obligation
negotiated during the year (classified as cost of sales – products), (iii) $714
of costs to writedown certain fixed assets, and (iv) $246 of severance and other
costs related to additional cost reduction activities. These amounts
are not included in the table above, as these items were not related to the 2008
Drivetrain Restructuring.
In
addition, the Company recorded a charge of $578 for certain severance and other
costs associated with the separation of its former Chief Financial Officer due
to the streamlining
of the Company’s senior financial roles through the consolidation of the
principal financial officer and principal accounting officer
functions.
|
Note
20.
|
Selected
Quarterly Financial Data
(Unaudited)
|
|
Quarter
|
||||||||||||||
|
First
|
Second
|
Third
|
Fourth
|
|||||||||||
|
2009
|
||||||||||||||
|
Net
sales
|
$ | 113,476 | $ | 118,463 | $ | 127,737 | $ | 125,341 | ||||||
|
Gross
profit
|
27,151 | 29,133 | 33,955 | 28,067 | ||||||||||
|
Impairment
of goodwill
|
– | 36,991 | – | – | ||||||||||
|
Exit,
disposal, certain severance and other charges
|
3,162 | 2,127 | (994 | ) | 843 | |||||||||
|
Income
(loss) from continuing operations
|
7,184 | (16,598 | ) | 13,435 | 7,686 | |||||||||
|
Net
income (loss)
|
7,184 | (16,556 | ) | 13,435 | 7,686 | |||||||||
|
Income
(loss) from continuing operations per common share – basic
|
$ | 0.36 | $ | (0.85 | ) | $ | 0.67 | $ | 0.38 | |||||
|
Income
(loss) from continuing operations per common share –
diluted
|
$ | 0.36 | $ | (0.85 | ) | $ | 0.67 | $ | 0.38 | |||||
|
2008
|
||||||||||||||
|
Net
sales
|
$ | 129,542 | $ | 135,622 | $ | 138,919 | $ | 126,477 | ||||||
|
Gross
profit
|
32,260 | 29,057 | 31,348 | 21,934 | ||||||||||
|
Impairment
of goodwill
|
– | – | – | 79,146 | ||||||||||
|
Exit,
disposal, certain severance and other charges
|
966 | 152 | 214 | 9,678 | ||||||||||
|
Income
(loss) from continuing operations
|
11,085 | 8,960 | 10,164 | (52,898 | ) | |||||||||
|
Net
income (loss)
|
8,573 | 8,994 | 10,162 | (52,898 | ) | |||||||||
|
Income
(loss) from continuing operations per common share – basic
|
$ | 0.50 | $ | 0.42 | $ | 0.48 | $ | (2.66 | ) | |||||
|
Income
(loss) from continuing operations per common share –
diluted
|
$ | 0.50 | $ | 0.42 | $ | 0.48 | $ | (2.66 | ) | |||||
Due to
the loss reported in the second quarter of 2009 and the fourth quarter of 2008,
the applicable per share calculations above exclude the antidilutive effect of
stock options.
The 2009
quarterly per share amounts in the table above do not add up to the total income
per share for the year ending December 31, 2009, due to the loss reported in the
second quarter of 2009. In addition, due to (i) quarterly share count
changes caused in part by the Company’s repurchases of common stock made during
2008 and its effect on the weighted average number of common shares outstanding,
and (ii) the loss reported in the fourth quarter of 2008, the quarterly per
share amounts in the table above do not add up to the total loss per share for
the year ended December 31, 2008.
During
the first quarter of 2009, the Company recorded exit, disposal, certain
severance and other charges of $3,162 ($1,992 net of income taxes) related to
the 2008 Drivetrain Restructuring, including $380 of costs classified as cost of
sales – products in the consolidated statement of operations.
During
the second quarter of 2009, the Company recorded (i) a goodwill impairment
charge of $36,991 ($25,950 net of income taxes, which included $907 of income
tax expense primarily related to certain valuation allowances on applicable
state deferred tax assets) related to the Drivetrain segment’s North American
operation, and (ii) exit, disposal, certain severance and other charges of
$2,127 ($1,340 net of income taxes) related to the 2008 Drivetrain
Restructuring, including $566 of costs classified as cost of sales – products in
the consolidated statement of operations.
During
the third quarter of 2009, the Company recorded a net credit of $994 ($626 net
of income taxes) related to additional restructuring activities in its
Drivetrain segment consisting of (i) income of $2,571 from an adjustment to
materials cost related to the wind-down of its relationship with a customer
(classified as cost of sales – products), (ii) $1,053 of costs related to a
customer inventory reimbursement obligation negotiated during the quarter
(classified as cost of sales – products), and (iii) $524 of severance and other
costs related to additional cost reduction activities.
During
the fourth quarter of 2009, the Company recorded exit, disposal, certain
severance and other charges of $843 ($531 net of income taxes), primarily
related to certain severance and other costs associated with the separation of
its former Chief Financial Officer and costs related to additional restructuring
activities in its Drivetrain segment.
During
the fourth quarter of 2008, the Company recorded (i) a goodwill impairment
charge of $79,146 ($56,776 net of income taxes, which included an income tax
benefit of $412 from the revaluation of certain deferred tax assets primarily
related to tax deductible goodwill) related to the Drivetrain segment’s North
American operation, and (ii) exit, disposal, certain severance and other charges
of $9,668 ($6,091 net of income taxes) related to the 2008 Drivetrain
Restructuring, including $7,614 of costs primarily related to the write-down of
raw materials inventory, which are classified as cost of sales – products in the
consolidated statement of operations.
None.
(i) Disclosure
Controls and Procedures.
We have
performed an evaluation under the supervision and with the participation of our
management, including our Chief Executive Officer (CEO) and Chief Financial
Officer (CFO) of the effectiveness of our disclosure controls and procedures, as
defined in Rule 13a-15(e) under the Securities Exchange Act of 1934 (the
Exchange Act). Based on that evaluation, our management, including our CEO and
CFO, concluded that our disclosure controls and procedures were effective as of
December 31, 2009 to provide assurance that information required to be disclosed
by us in the reports filed or submitted by us under the Exchange Act is
recorded, processed, summarized and reported within the time periods specified
in the Securities and Exchange Commission’s rules and forms.
(ii) Internal
Control Over Financial Reporting.
(a) Management’s
annual report on internal control over financial reporting.
Our
management is responsible for establishing and maintaining adequate internal
control over financial reporting. Under the supervision and with the
participation of our management, including the CEO and the CFO, we conducted an
evaluation of the effectiveness of our internal control over financial reporting
based on the framework in Internal Control–Integrated
Framework issued by the Committee of Sponsoring Organizations of the
Treadway Commission. Based on our evaluation under the framework in
Internal Control–Integrated
Framework, management concluded that our internal control over financial
reporting was effective as of December 31, 2009.
(b) Attestation
report of the registered public accounting firm.
Ernst
& Young LLP, the independent registered public accounting firm that audited
the consolidated financial statements included in this Annual Report on Form
10-K, has issued an attestation report on our internal control over financial
reporting, which is included herein.
(c) Changes
in internal control over financial reporting.
There
were no changes in our internal control over financial reporting that occurred
during the fourth quarter of 2009 that have materially affected, or are
reasonably likely to materially affect, our internal control over financial
reporting.
None.
PART
III
Directors
and Executive Officers
The
following lists our directors and executive officers and their respective ages
and positions as of December 31, 2009:
|
Name
|
Age
|
Positions
|
|
Edward
Stewart
|
67
|
Chairman
of the Board
|
|
Robert
L. Evans
|
57
|
Director
|
|
Curtland
E. Fields
|
58
|
Director
|
|
Dr.
Michael J. Hartnett
|
64
|
Director
|
|
Michael
D. Jordan
|
63
|
Director
|
|
Todd
R. Peters
|
47
|
President
and Chief Executive Officer, Director
|
|
S.
Lawrence Prendergast
|
68
|
Director
|
|
John
M. Pinkerton
|
52
|
Vice
President and Chief Financial Officer
|
|
F.
Antony Francis
|
59
|
President,
ATC Logistics
|
|
John
J. Machota
|
57
|
Vice
President, Human Resources
|
|
Mary
T. Ryan
|
56
|
Vice
President, Communications and Investor Relations
|
|
Joseph
Salamunovich
|
50
|
Vice
President, General Counsel and
Secretary
|
The
remaining information called for by this item is incorporated by reference to
the information contained under the heading “Management and Corporate
Governance” in the definitive proxy statement for our 2010 Annual Meeting of
Stockholders to be held on June 9, 2010, which will be filed with the
Securities and Exchange Commission within 120 days after the end of our fiscal
year ended December 31, 2009 (the “2010 Proxy Statement”).
The
information called for by this item is incorporated by reference to the
information contained under the heading “Executive Compensation” in the 2010
Proxy Statement.
The
information called for by this item is incorporated by reference to the
information contained under the heading “Securities Ownership of Certain
Beneficial Owners and Management and Related Stockholder Matters” in the 2010
Proxy Statement.
The
information called for by this item is incorporated by reference to the
information contained under the headings “Certain Transactions,” “Management and
Corporate Governance—Independence of Directors,” and “Management and Corporate
Governance—Committees of the Board of Directors and Board Meetings” in the 2010
Proxy Statement.
The
information called for by this item is incorporated by reference to the
information contained under the heading “Audit Matters” in the 2010 Proxy
Statement.
PART
IV
|
(a)
|
Index
to Financial Statements, Financial Statement Schedules and
Exhibits:
|
|
1.
|
Financial
Statements Index
|
|||
|
See
Index to Financial Statements and Supplemental Data on page
41.
|
||||
|
2.
|
Financial
Statement Schedules Index
|
|||
|
II
– Valuation and Qualifying Accounts
|
S-1
|
|||
|
All
other schedules for which provision is made in the applicable accounting
regulation of the Securities and Exchange Commission
are not required under the related instructions or are inapplicable and therefore have been omitted. |
||||
|
3.
|
Exhibit
Index
|
|||
|
The
following exhibits are filed as part of this Annual Report on Form 10-K,
or are incorporated herein by reference:
|
||||
|
Exhibit
Number
|
Description
|
|
3.1
|
Restated
Certificate of Incorporation of Aftermarket Technology Corp (previously
filed as Exhibit 3.1 to the Company's Current Report on Form 8-K filed on
December 21, 2001 and incorporated herein by this
reference)
|
|
3.2
|
Certificate
of Ownership and Merger Merging Autocraft Remanufacturing Corp. into
Aftermarket Technology Corp. under the name ATC Technology Corporation
(previously filed as Exhibit 3.1 to the Company's Current Report on Form
8-K filed on June 3, 2008 and incorporated herein by this
reference)
|
|
3.3
|
Bylaws
of ATC Technology Corporation (previously filed as Exhibit 3.2 to the
Company's Annual Report on Form 10-K for the year ended
December 31, 2008 and incorporated herein by this
reference)
|
|
10.1†
|
Form
of Indemnification Agreement between the Company and directors and
executive officers (previously filed as Exhibit 10.46 to Amendment No. 1
the Company's Registration Statement on Form S-1 (File No. 333-35543)
filed on October 1, 1997 and incorporated herein by this
reference)
|
|
10.2†
|
ATC
Technology Corporation 1996 Stock Incentive Plan (previously filed as
Exhibit 10.10 to the Company's Annual Report on Form 10-K for the year
ended December 31, 1996 and incorporated herein by this
reference)
|
|
10.3†
|
Form
of Non-Qualified Stock Option Agreement under the ATC
Technology Corporation 1996 Stock Incentive Plan (previously filed
as Exhibit 10.37 to Amendment No. 1 to the Company's Registration
Statement on Form S-1 filed on October 25, 1996, Commission File
No. 333-5597, and incorporated herein by this
reference)
|
|
10.4†
|
ATC
Technology Corporation 1998 Stock Incentive Plan (previously filed as
Exhibit 10.55 to the Company's Annual Report on Form 10-K for
the year ended December 31, 1998 and incorporated herein by this
reference)
|
|
10.5†
|
ATC
Technology Corporation 2000 Stock Incentive Plan (previously filed as
Exhibit 10.57 to the Company's Annual Report on Form 10-K for
the year ended December 31, 2000 and incorporated herein by this
reference)
|
|
10.6†
|
ATC
Technology Corporation 2002 Stock Incentive Plan (previously filed as
Exhibit 10.31 to the Company's Annual Report on Form 10-K for
the year ended December 31, 2002 and incorporated herein by this
reference)
|
|
10.7†
|
ATC
Technology Corporation 2004 Stock Incentive Plan (previously filed as
Exhibit 10.1 to the Company's Current Report on Form 8-K filed on
December 14, 2004 and incorporated herein by this
reference)
|
|
10.8†
|
Standard
Terms and Conditions Governing Nonemployee Director Stock Options Granted
on or after May 12, 2004 under the ATC Technology Corporation 1998,
2000, 2002, and 2004 Stock Incentive Plans (previously filed
as Exhibit 10.2 to the Company's Current Report on Form 8-K filed on
December 14, 2004 and incorporated herein by this
reference)
|
|
10.9†
|
Standard
Terms and Conditions Governing Employee Non-Qualified Stock Options
Granted on or after May 12, 2004 under the ATC Technology Corporation
1998, 2000, 2002, and 2004 Stock Incentive Plans (previously filed
as Exhibit 10.3 to the Company's Current Report on Form 8-K filed on
December 14, 2004 and incorporated herein by this
reference)
|
|
10.10†
|
Standard
Terms and Conditions Governing Nonemployee Director Stock Options under
the ATC Technology Corporation 1998, 2000 and 2002 Stock Incentive
Plans
(previously filed as Exhibit 10.4 to the Company's Current Report on Form
8-K filed on December 14, 2004 and incorporated herein by this
reference)
|
|
10.11†
|
Standard
Terms and Conditions Governing Employee Non-Qualified Stock Options under
the ATC Technology Corporation 1998, 2000 and 2002 Stock Incentive
Plans
(previously filed as Exhibit 10.5 to the Company's Current Report on Form
8-K filed on December 14, 2004 and incorporated herein by this
reference)
|
|
10.13†
|
Standard Terms and
Conditions Governing Nonemployee Director Stock Options under the ATC
Technology Corporation 2006 Stock Incentive Plan (previously filed
as Exhibit 10.2 to the Company's Current Report on Form 8-K filed on June
6, 2006 and incorporated herein by this reference)
|
|
10.14†
|
Standard Terms and
Conditions Governing Employee Non-Qualified Stock Options under the ATC
Technology Corporation 2006 Stock Incentive Plan (previously filed
as Exhibit 10.3 to the Company's Current Report on Form 8-K filed on June
6, 2006 and incorporated herein by this reference)
|
|
10.15†
|
Form
of Restricted Stock Agreement for Nonemployee Directors under the ATC
Technology Corporation 1998, 2000, 2002, 2004 and 2006 Stock Incentive
Plans (previously filed as Exhibit 10.4 to the Company's Current
Report on Form 8-K filed on June 6, 2006 and incorporated herein by this
reference)
|
|
10.16†
|
Form
of Restricted Stock Agreement for Employee under the ATC
Technology Corporation 1998, 2000, 2002, 2004 and 2006 Stock Incentive
Plans (previously filed as Exhibit 10.5 to the Company's Current
Report on Form 8-K filed on June 6, 2006 and incorporated herein by this
reference)
|
|
10.17†
|
ATC
Technology Corporation Executive Nonqualified Excess Plan (previously
filed as Exhibit 10 to the Company's Current Report on Form 8-K filed on
June 6, 2005 and incorporated herein by this
reference)
|
|
10.18†
|
ATC
Technology Corporation Executive Nonqualified Excess Plan Adoption
Agreement (previously filed as Exhibit 10 to the Company's Current Report
on Form 8-K filed on September 18, 2006 and incorporated herein by
this reference)
|
|
10.19†
|
Executive
Employment Agreement, dated as of January 1, 2009, between the Company and
Todd R. Peters (previously filed as Exhibit 10.20 to the Company's Current
Report on Form 8-K filed on June 3, 2008 and incorporated herein by this
reference)
|
|
10.20†
|
Executive
Employment Agreement, dated as of December 8, 2008, between the Company
and Ashoka Achuthan (previously filed as Exhibit 10.32 to the Company's
Annual Report on Form 10-K for the year ended December 31, 2008 and
incorporated herein by this reference)
|
|
10.25
|
Credit
Agreement dated as of March 21, 2006 among the Company, Bank of America,
N.A., as Administrative Agent, and the other Lenders party thereto, Banc
of America Securities LLC, J.P. Morgan Securities Inc., JPMorgan Chase
Bank, N.A., Wells Fargo Bank, N.A. and Charter One Bank, N.A. (previously
filed as Exhibit 10.1 to the Company’s Quarterly Report on Form 10-Q for
the quarter ended March 31, 2006 and incorporated herein by
reference)
|
|
10.26
|
Guaranty
and Collateral Agreement dated as of March 21, 2006 made by the Company
and certain of its subsidiaries in favor of Bank of America, N.A., as
Administrative Agent (previously filed as Exhibit 10.2 to the Company’s
Quarterly Report on Form 10-Q for the quarter ended March 31, 2006 and
incorporated herein by reference)
|
|
14
|
Code
of Ethics (previously filed as Exhibit 14 to the Company's Annual
Report on Form 10-K for the year ended December 31, 2003 and
incorporated herein by this reference)
|
______________
† Compensation
plan or arrangements in which directors or executive officers are eligible to
participate.
* Filed
herewith.
(b) Refer
to (a) 3 above.
(c) Refer
to (a) 2 above.
SIGNATURES
Pursuant
to the requirements of Section 13 or 15(d) of the Securities Exchange Act of
1934, the registrant has duly caused this report to be signed on its behalf by
the undersigned, thereunto duly authorized.
| ATC TECHNOLOGY CORPORATION | ||
|
B
|
/s/
Todd R. Peters
|
|
|
Todd
R. Peters
President
and Chief Executive Officer
|
||
|
February
25, 2010
|
Pursuant
to the requirements of the Securities Exchange Act of 1934, this Annual Report
on Form 10-K has been signed by the following persons on behalf of the
registrant and in the capacities and on the dates indicated.
|
February
25, 2010
|
/s/
Todd R. Peters
|
|
|
Todd
R. Peters
President,
Chief Executive Officer
and
Director
(principal
executive officer)
|
||
|
February
25, 2010
|
/s/
John M. Pinkerton
|
|
|
John
M. Pinkerton
Vice
President and Chief Financial Officer
(principal
financial and accounting officer)
|
||
|
February
25, 2010
|
/s/
Edward Stewart
|
|
|
Edward
Stewart, Chairman of the Board
|
||
|
February
25, 2010
|
/s/
Robert L. Evans
|
|
|
Robert
L. Evans, Director
|
||
|
February
25, 2010
|
/s/
Curtland E. Fields
|
|
|
Curtland
E. Fields, Director
|
||
|
February
25, 2010
|
/s/
Michael J. Hartnett
|
|
|
Michael
J. Hartnett, Director
|
||
|
February
25, 2010
|
/s/
Michael D. Jordan
|
|
|
Michael
D. Jordan, Director
|
||
|
February
25, 2010
|
/s/
S. Lawrence Prendergast
|
|
|
S.
Lawrence Prendergast, Director
|
ATC
Technology Corporation
Schedule
II - Valuation and Qualifying Accounts
(In
Thousands)
|
Additions
|
|||||||||||||||||
|
Balance
at
Beginning
of
Period
|
Charge
(Income)
to
Costs
and
Expenses
|
Adjustments
to
Other
Accounts
|
Deductions
|
Balance
at
End
of Period
|
|||||||||||||
|
Year
ended December 31, 2007:
|
|||||||||||||||||
|
Reserve
and allowances deducted from asset accounts:
|
|||||||||||||||||
|
Allowance
for uncollectible accounts
|
$ | 871 | $ | (217 | ) | $ | − | $ | 71 | (1) | $ | 583 | |||||
|
Reserve
for excess and obsolete inventory
|
5,190 | 4,369 | 14 | (2) | 3,479 | 6,094 | |||||||||||
|
Valuation
allowance on deferred tax assets
|
12,243 | (62 | ) | − | 5,736 | (3) | 6,445 | ||||||||||
|
Year
ended December 31, 2008:
|
|||||||||||||||||
|
Reserve
and allowances deducted from asset accounts:
|
|||||||||||||||||
|
Allowance
for uncollectible accounts
|
583 | 15 | (20 | )(2) | 109 | (1) | 469 | ||||||||||
|
Reserve
for excess and obsolete inventory
|
6,094 | 10,422 | (236 | )(2) | 9,337 | 6,943 | |||||||||||
|
Valuation
allowance on deferred tax assets
|
6,445 | − | − | 111 | (3) | 6,334 | |||||||||||
|
Year
ended December 31, 2009:
|
|||||||||||||||||
|
Reserve
and allowances deducted from asset accounts:
|
|||||||||||||||||
|
Allowance
for uncollectible accounts
|
469 | 158 | 8 | (2) | 588 | (1) | 47 | ||||||||||
|
Reserve
for excess and obsolete inventory
|
6,943 | 3,795 | 153 | (2) | 3,997 | 6,894 | |||||||||||
|
Valuation
allowance on deferred tax assets
|
6,334 | 2,288 | − | 3,326 | (3) | 5,296 | |||||||||||
______________
|
(1)
|
Accounts
written off, net of recoveries.
|
|
(2)
|
Currency
translation adjustment.
|
|
(3)
|
Related
to the expiration of net operating loss
carryforwards.
|
S-1