Attached files
| file | filename |
|---|---|
| EX-21.1 - EXHIBIT 21.1 - RiskMetrics Group Inc | a2196648zex-21_1.htm |
| EX-32.1 - EXHIBIT 32.1 - RiskMetrics Group Inc | a2196648zex-32_1.htm |
| EX-31.2 - EXHIBIT 31.2 - RiskMetrics Group Inc | a2196648zex-31_2.htm |
| EX-23.1 - EXHIBIT 23.1 - RiskMetrics Group Inc | a2196648zex-23_1.htm |
| EX-32.2 - EXHIBIT 32.2 - RiskMetrics Group Inc | a2196648zex-32_2.htm |
| EX-31.1 - EXHIBIT 31.1 - RiskMetrics Group Inc | a2196648zex-31_1.htm |
UNITED STATES
SECURITIES AND EXCHANGE COMMISSION
Washington, D.C. 20549
FORM 10-K
Annual Report Pursuant to Section 13 or 15(d) of the Securities Exchange Act of 1934
For the fiscal year ended December 31, 2009
Commission file number: 001-33928
RiskMetrics Group, Inc.
(Exact name of registrant as specified in its charter)
| Delaware (State or other jurisdiction of incorporation or organization) |
20-8175809 (IRS Employer Identification No.) |
|
One Chase Manhattan Plaza, 44th Floor New York, New York (Address of principal executive offices) |
10005 (Zip Code) |
(212) 981-7475
(Registrant's telephone number, including area code)
Securities registered pursuant to Section 12(b) of the Act:
| Title of each class: | Name of Each Exchange on which Registered | |
|---|---|---|
| Common Stock $.01 par value | New York Stock Exchange |
Securities registered pursuant to Section 12(g) of the Act: None
Indicate by check mark if the registrant is a well-known seasoned issuer, as defined in Rule 405 of the Securities Act. Yes o No ý
Indicate by check mark if the registrant is not required to file reports pursuant to Section 13 or Section 15(d) of the Act. Yes o No ý
Indicate by check mark whether the registrant (1) has filed all reports required to be filed by Section 13 or 15(d) of the Securities Exchange Act of 1934 during the preceding 12 months (or for such shorter period that the registrant was required to file such reports) and (2) has been subject to such filing requirements for the past 90 days. Yes ý No o
Indicate by check mark whether the registrant has submitted electronically and posted on its corporate Web site, if any, every Interactive Data File required to be submitted and posted pursuant to Rule 405 of Regulation S-T (§ 232.405 of this chapter) during the preceding 12 months (or for such shorter period that the registrant was required to submit and post such files). Yes o No o
Indicate by check mark if disclosure of delinquent filers pursuant to Item 405 of Regulation S-K is not contained herein, and will not be contained, to the best of registrant's knowledge, in definitive proxy or information statements incorporated by reference in Part III of this Form 10-K or any amendment to this Form 10-K. o
Indicate by check mark whether registrant is a large accelerated filer, an accelerated filer, a non-accelerated filer, or a smaller reporting company. See the definitions of "large accelerated filer, accelerated filer" in Rule 12b-2 of the Exchange Act. (check one):
| Large accelerated filer o | Accelerated filer ý | Non-accelerated filer o (Do not check if a smaller reporting company) |
Smaller reporting company o |
Indicate by check mark whether the Registrant is a shell company (as defined in rule 12b-2 of the Act). Yes o No ý
The aggregate market value of the registrant's voting stock held by non-affiliates of the registrant, computed by reference to the closing sales price as quoted on June 30, 2009 was approximately $464,096,729.
The number of shares outstanding of each of the registrant's classes of common stock, as of February 18, 2010 was:
| Class | Outstanding | |
|---|---|---|
| Common stock $.01 par value | 63,265,668 |
DOCUMENTS INCORPORATED BY REFERENCE
Certain information required by Items 10, 11, 12, 13 and 14 of this Annual Report on Form 10-K is incorporated by reference from our definitive Proxy Statement for our 2010 Annual Meeting of Stockholders which will be filed not later than 120 days after the close of our year ended December 31, 2009.
Index to Form 10-K
Table of Contents
1
Unless the context otherwise indicates or requires, as used in this Annual Report on Form 10-K, references to "we," "us," "our" or the "company" refer to RiskMetrics Group, Inc and its subsidiaries. References to "RiskMetrics" refer only to our subsidiary, RiskMetrics Solutions, Inc. and its subsidiaries, references to "ISS" refer only to our subsidiary Institutional Shareholder Services Inc. and its subsidiaries.
In this annual report on Form 10-K, all dollar amounts are expressed in thousands, unless indicated otherwise. References to our "clients" include each business unit, division or wholly-owned subsidiary of a parent company which has entered into a separate customer contract with us.
THIS ANNUAL REPORT ON FORM 10-K CONTAINS FORWARD LOOKING STATEMENTS WITHIN THE MEANING OF THE PRIVATE SECURITIES LITIGATION REFORM ACT OF 1995 AND OTHER FEDERAL SECURITIES LAWS. THESE FORWARD LOOKING STATEMENTS ARE BASED ON OUR PRESENT INTENT, BELIEFS OR EXPECTATIONS, AND MAY NOT OCCUR. ACTUAL RESULTS MAY DIFFER MATERIALLY FROM THOSE CONTAINED IN OR IMPLIED BY OUR FORWARD LOOKING STATEMENTS AS A RESULT OF VARIOUS FACTORS. SEE ALSO "ITEM 1A. RISK FACTORS." EXCEPT AS REQUIRED BY LAW, WE UNDERTAKE NO OBLIGATION TO UPDATE OR RELEASE ANY FORWARD LOOKING STATEMENTS AS A RESULT OF NEW INFORMATION, FUTURE EVENTS OR OTHERWISE.
Our Company
RiskMetrics Group is a leading provider of risk management and corporate governance products and services to participants in the global financial markets. We enable clients to better understand and manage the risks associated with their financial holdings, to provide greater transparency to their internal and external constituencies, to satisfy regulatory and reporting requirements and to make more informed investment decisions. Our offerings address multiple asset classes, markets and geographies and are sold to a diverse client base including asset managers, hedge funds, pension funds, banks, insurance companies, financial advisors and corporations. As of December 31, 2009, we had approximately 3,500 clients located in 53 countries. Among our clients are 70 of the 100 largest investment managers, 43 of the 50 largest mutual fund companies and 42 of the 50 largest hedge funds, in each case measured by assets under management.
Our company consists of two industry leading businesses: RiskMetrics and ISS (Institutional Shareholder Services). Together, these businesses offer what we believe is the most comprehensive suite of risk management and corporate governance products and services available in our industry, covering the market, credit, portfolio, governance, accounting, legal and environmental risks associated with our clients' financial holdings.
RiskMetrics. The RiskMetrics segment is a leading global provider, as measured by revenues, of multi-asset, position-based risk and wealth management products and services. We provide our clients, which approximated 530 as of December 31, 2009, with comprehensive, interactive products and services that allow them to measure and quantify portfolio risk across security types, geographies and markets. Our flagship RiskManager mark-to-market risk system integrates consistently modeled market data with our widely adopted analytical models and robust processing capabilities to address our clients' risk reporting requirements. Our clients generally license RiskManager as a secure, interactive web-based application service or as a fully outsourced risk reporting service. In similar fashion, we provide clients with solutions based on credit-event risk (through our CreditManager application) as well as solutions for financial advisors at private banks (through our WealthBench application). The breadth, performance and scalability of our hosted systems are the result of over a decade of investment in research and development, which we believe provides us with a significant competitive advantage.
2
ISS. ISS is a leading provider, as measured by revenues, of corporate governance and specialized financial research and analysis services to institutional investors and corporations around the world. Through ISS, which we acquired on January 11, 2007, we provide our clients, which approximated 2,970 as of December 31, 2009, with a fully-outsourced proxy research, voting and vote reporting service to assist them with their proxy voting responsibilities. Through our web-based delivery platform, clients can access our in-depth research reports and proxy voting recommendations. We offer both global security coverage and a comprehensive proxy voting solution, from policy creation to comprehensive research, vote recommendations, reliable vote execution, post-vote disclosure and reporting and analytical tools. Our Financial Research and Analysis products also provide our clients with research reports and analytical tools covering many investment criteria that have become increasingly important to investors, including companies' environmental, social and governance ("ES&G") attributes and accounting and compensation practices. In 2009, ISS acquired Innovest Strategic Advisors ("Innovest") and KLD Research and Analytics, Inc. ("KLD") to further enhance our ES&G product offering.
We sell our products and services primarily on an annual subscription basis and generally receive upfront subscription payments from our clients. As of December 31, 2009, our annualized contract value ("ACV") was approximately $282.5 million. For the year ended December 31, 2009, we generated approximately 92.7% of our revenues from annual subscriptions to our products and services. Our historical renewal rate has ranged from the mid 80 to low 90 percent range. Our renewal rate for 2009 was 82.6% and is lower than historical levels due to the recent adverse financial environment which resulted in hedge fund liquidations, price pressure and declines in demand for discretionary financial research products. Our products and services are generally priced based on a client's access to our applications and services, including volume of data, research, voting and reports purchased. Our experience has been that, over time, our clients have often added users and purchased additional products and services from us, which has led to increases in our revenues per client. Refer to "Selected Consolidated Financial Data" for a further discussion regarding annualized contract value, recurring revenue and renewal rate.
We serve our global client base through a network of 20 offices in 12 countries. For the year ended December 31, 2009, approximately 41% of our revenues were generated from clients outside the Americas.
Company History and Acquisitions
At RiskMetrics Group, we help clients understand and manage a broad spectrum of risk across their financial portfolios. Originally founded upon a methodology to measure market risk in a portfolio, our business today is built upon a more global, multi-dimensional view that is unique in the market place. RiskMetrics Group offers investors and other financial market participants multiple views into the risk profile of a company, security or portfolio of financial assets, and the expertise to better understand them. We believe that effective risk mitigation and management hinges on the ability to fully understand it.
The RiskMetrics methodology was developed within JPMorgan in 1992 and was published publicly in 1994. In 1998, RiskMetrics was spun off and became an independent company providing risk management products and services.
On January 11, 2007, recognizing that our clients' view of risk needed to broaden beyond market and credit risk, we acquired ISS in order to increase the scale and scope of our product and service offerings. ISS was founded in 1985 with the goal of promoting good corporate governance practices in the private sector. It was the pioneer in the development of policy-based proxy voting recommendations and today is a leader in corporate governance with the broadest research coverage in the market.
On August 1, 2007, we completed the acquisition of the Center for Financial Research and Analysis ("CFRA"). CFRA was founded in 1994 and provides forensic accounting risk research, legal
3
and regulatory risk assessment, due diligence and educational products and services. Our acquisition of CFRA further increased the range of specialized financial research and analysis products and services that we are able to offer to our clients.
In January 2008, we completed our initial public offering of 14,000,000 shares of our common stock, which included 4,035,816 shares sold by selling stockholders. We did not receive any proceeds from the sale of the shares by the selling stockholders. In addition, we granted the underwriters an option to purchase a maximum of 2,100,000 additional shares of common stock from us to cover over-allotments, which was exercised in full in January 2008. Our net proceeds from the offering, including the exercise of the underwriters' allotment, were $193.9 million, after deducting underwriting discounts, commissions and offering expenses.
On October 3, 2008 we acquired all of the outstanding stock of Applied4 Technology Ltd. ("Applied4") for approximately $1.8 million in cash. Additional purchase price consideration of between approximately $1.6 million and $1.9 million may be paid for the acquisition of Applied4 if certain earning targets are achieved through 2011. Such earning targets and additional consideration have not been achieved as of December 31, 2009. The purpose of this acquisition was to broaden the performance attribution analytical tools we can offer our clients.
In 2008, we recorded a non-cash impairment charge for goodwill and intangible asset totaling $160.1 million as a result of the Company' annual goodwill and indefinite-lived intangible asset impairment review. The impairment charge included a $154.2 million write-down to ISS goodwill primarily as a result of the negative equity market conditions which caused a material decline in industry market multiples in the second half of 2008. In addition, the impairment charge also included a $5.9 million writedown to an ISS product tradename as a result of an integration plan for the tradename which reduced its expected life.
On March 2, 2009 we acquired all of the outstanding stock of Innovest for approximately $14.8 million in cash and on October 30, 2009 we acquired all of the outstanding stock of KLD for approximately $9.9 million in cash. Innovest and KLD are leading providers of sustainability research for the institutional investment community. The purpose of these acquisitions was to enhance the product offerings and services, including sustainability, research, data, compliance and index products, we offer our customers in the ES&G sectors.
Our Growth Strategy
We intend to continue to develop and sell products and services that enable investors to make more informed investment decisions, monitor and comply with exposure and risk limits, provide greater transparency to both internal audiences and external constituencies and meet regulatory and reporting requirements. Most of our clients are in the financial services industry. In 2008 and continuing into 2009, stock market volatility and lack of available credit led to the closure or consolidation of a number of our clients. These recent events impacted our financial results, including a decline in our historical renewal rate and new sales growth. We expect over the next year our new sales growth and renewal rate to improve as market conditions improve.
The major components of our growth strategy are as follows:
1) Increase Sales to Existing Clients.
We plan to broaden our relationships with our clients in the following ways:
- •
- Provide additional data, research and analytical products and services. We continue to expand RiskMetrics' coverage of asset classes and its library of analytical models in response to our clients' needs. This expansion has allowed us to sell more data, applications and services to our clients. Similarly, as ISS increases its global research coverage and develops new issue-specific
4
- •
- Offer more products and services. Our clients increasingly
rely on us for more fully-outsourced risk management services. A significant percentage of our new sales to existing clients have involved fully-outsourced offerings. We expect this trend to continue
and have invested in the scalable technology and data infrastructure necessary to support our outsourced products and services. In the year ended December 31, 2009, approximately half of our
new subscription ACV resulted from sales to existing customers. Further, our average contract value has significantly increased over the last five years.
- •
- Leverage our sales force. As of December 31, 2009, we had a global sales force of approximately 69 employees in 12 offices worldwide. We believe that our sales force will allow us to sell our expanded set of products and services to our worldwide client base. In particular, we expect to sell more products and services to our existing clients as we work with more business groups or units within their organizations as a result of our expanded suite of risk, governance and research products and services.
research products and services, we expect to continue to increase our product subscriptions through volume-based expansion of proxy research and voting services and by providing additional financial research and analytical products and services.
2) Expand our Client Base.
We plan to continue to pursue the following initiatives to further expand our client base:
- •
- Sell our portfolio risk reporting products and services to new
clients. Despite the growth of our RiskMetrics business, the market for outsourced risk reporting is relatively new and many financial
institutions continue to rely on in-house risk management products and services. We believe that, over time, many of these institutions will choose to integrate our fully-outsourced risk
reporting management and analysis systems to reduce costs and improve functionality.
- •
- Sell our Governance Services and Financial Research and Analysis offerings to new
clients. We believe that additional opportunities exist with respect to institutional investors who currently conduct proxy research and
vote their proxies in-house. Additionally, we believe there is an opportunity to increase our penetration among front office portfolio managers, whom we have not traditionally targeted, by
selling them our financial research and analysis products and services.
- •
- Expand our significant global presence. We believe that the international market for corporate governance products and services is growing, and that we will be able to capitalize on increased demand by leveraging our globally-recognized RiskMetrics Group brand, international presence and sales force.
For the year ended December 31, 2009, we added over $41 million in new ACV, of which approximately half was from new clients, a 42% decline from 2008 due to the recent economic down turn which resulted in customer consolidations, lack of credit and budget constraints of our customers.
3) Enhance and Extend our Products and Services.
We plan to continue to augment our suite of risk management and corporate governance products and services in the following ways:
- •
- Enhance our product capabilities. RiskMetrics has broadened its coverage of asset classes, enhanced its analytical models and launched major upgrades of its entire risk services product suite. Additionally, ISS has broadened its research coverage and introduced new governance and research products. We intend to continue to develop new products that enable our clients to
5
- •
- Extend our service offerings. We have continuously
upgraded the features, functionality and scalability of our infrastructure in order to offer our clients additional fully-outsourced risk reporting and electronic proxy voting services. We believe
that this continued investment will allow us to continue to improve our outsourcing capabilities. In January 2010, we launched ProxyExchange which is our new proxy voting platform that will provide
additional functionality and services to proxy voting clients.
- •
- Selectively pursue acquisitions. We intend to continue to selectively pursue acquisition opportunities to complement our product and service offerings.. In 2008, we supplemented our internal product and service development efforts with our acquisition of Applied4. As a result, we began to build a multi-asset class performance attribution system with the purpose of increasing the strategic value of our existing product platform to our clients. In 2009, we acquired Innovest and KLD to enhance the product offerings and services to offer our ES&G customers.
measure and manage many elements of risk by broadening the scope of our product and service offerings.
4) Continue to Develop our Distinct Corporate Culture.
Our ability to develop new products and services has been, and will continue to be, crucial to keeping pace with evolving financial markets. Consequently, we believe that our success will continue to depend on the strength of our intellectual capital, and that our employees and distinct corporate culture provide us with significant competitive advantages. We work hard to retain our employees by ensuring that they have a challenging, rewarding and fun work environment. We also encourage our employees to follow their instincts and develop new ideas, which have resulted in many of our most important analytical and technological developments. At the same time, we strive to engender a team spirit and sense of common purpose that we believe enables us to attract and retain talented employees.
Our talented employees share a unique sense of purpose. With little corporate hierarchy and few formal titles, we value substance over form and question every assumption. Every employee is an owner, as we see ownership as a key to providing the highest level of service to our clients, as well as attracting, developing and retaining the talent we seek in today's highly competitive labor market. This work environment and ownership create a culture of respect, empowerment, and shared purpose that is aggressively managed to ensure our long-term success.
Business Segments, Products and Services
We divide our business operations into two segments: RiskMetrics and ISS. The table below shows revenue by business segment for each of the past three years:
| |
For the years ended December 31, | ||||||||||
|---|---|---|---|---|---|---|---|---|---|---|---|
Revenue by Segment
|
2009 | 2008 | 2007 | ||||||||
RiskMetrics |
$ | 158,691 | $ | 154,626 | $ | 121,126 | |||||
Revenue Growth |
2.6 | % | 27.7 | % | |||||||
ISS(1)(2) |
$ | 144,670 | $ | 141,767 | $ | 119,175 | |||||
Revenue Growth |
2.0 | % | 19.0 | % | |||||||
- (1)
- ISS revenue in 2007 does not include $3.3 million in revenue generated by ISS from January 1, 2007 through January 11, 2007. In addition, ISS revenue in 2007 was impacted by the acquisition of CFRA on August 1, 2007.
6
- (2)
- ISS revenue growth in 2009 was impacted by the acquisitions of Innovest on March 2, 2009, and KLD on October 30, 2009.
Business segment revenue, segment income from operations and assets attributable to foreign and domestic operations are set forth in Note 18 of the Notes to the Consolidated Financial Statements, included herein.
RiskMetrics Segment
Overview
RiskMetrics is a leading provider of multi-asset, position-based risk and wealth management products and services to global asset managers, hedge funds, banks, insurance companies, pension funds and wealth managers. We provide our clients with access to customizable applications, interactive analytics and risk reports based on comprehensive and consistently-modeled market data that are fully-integrated with their holdings. We believe that our comprehensive approach to analyzing multi-asset portfolios and our ability to fully integrate with our clients' holdings enable us to provide products and services which are an integral and essential part of our clients' portfolio risk management systems. These products and services provide timely and actionable insights into the market and credit risks of clients' portfolios.
These products and services allow our clients to:
- •
- measure their trading, credit and counterparty risk;
- •
- monitor and comply with internal or external exposure and risk limits;
- •
- deploy and optimize their use of capital;
- •
- communicate risk in a transparent fashion to regulators, investors, clients and creditors;
- •
- meet regulatory requirements, address suitability criteria and implement best practices; and
- •
- create investment planning proposals for high net worth individuals.
All of our RiskMetrics products and services include integrated access to our extensive set of market-related data. Embedded within our RiskMetrics offerings are over 750,000 market data time series spanning global interest rates, foreign exchange rates, equity prices, implied volatilities, credit spreads, commodity prices and inflation rates. These data are systematically quality-controlled by our dedicated teams of analysts who examine the data for outliers, missing data points and other anomalies. These data are then transformed into a form suitable for use in risk management systems. We also collect and process international benchmark data for thousands of equity, fixed-income and commodity indices. These data are used by asset managers and pension plans who track standard or customized benchmarks as well as by clients to measure their risk and exposure relative to an index.
The pricing model for our RiskMetrics products and services is primarily subscription-based, typically for a period of one year. Depending upon the solution offering, our RiskMetrics products and services are available through a variety of delivery options, including hosted web-based applications, fully-outsourced managed services, local installation and on a component-by-component basis.
In order to further enhance our RiskMetrics product set we are currently working on new and enhanced product offerings which include, a multi-asset class performance attribution system, credit scoring models for non-financial Corporate entities and enhanced counter party risk models.
7
Our comprehensive suite of products and services covers a broad range of asset classes including equities, bonds, commodities, foreign exchange, futures, options, derivatives, structured products, interest-rate products and credit products and is designed to provide our clients with a transparent assessment of the risk in their portfolios in the following three areas: Market Risk, Credit Risk and Wealth Management.
Market Risk
Increasingly complex instruments, expanding asset classes, complex trading strategies and significant data requirements have created a complicated risk assessment task. Our approach is to combine all the analytics, technologies and data required into one comprehensive offering, accessible through a common portal. We provide our clients with comprehensive, interactive products and services that allow them to measure and quantify portfolio risk across security types, geographies and markets.
During 2009, our Market Risk offerings accounted for approximately 87% of RiskMetrics' revenue. Our Market Risk products and services consist of RiskManager and its related services, HedgePlatform and DataMetrics. Although we sometimes sell our data on a standalone basis, our data are usually embedded in our products and services.
RiskManager
RiskManager, our flagship market risk system, provides clients with a comprehensive solution for measuring risk in their portfolios and for running sensitivity and stress test analyses. Underlying RiskManager is a service-oriented architecture which is flexible, scalable and extensible. Because we host our products and deliver our services from a scalable common technology and data infrastructure, all of our clients benefit from advances in our RiskManager market risk system.
RiskManager incorporates three primary components: delivery mechanisms, a services platform and the core risk elements, as shown in the following diagram:
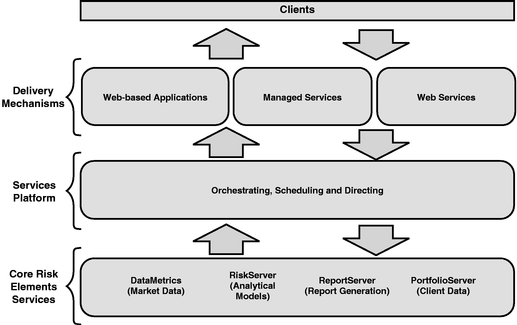
Delivery Mechanisms—Our delivery mechanisms enable our clients to access risk analyses and reports in one of three methods: as an interactive web-based application operated in a self-directed fashion, as a fully-outsourced or managed service offering in which RiskMetrics utilizes the system on behalf of the client, or as a web service in which a client's systems access our core risk elements by
8
connecting directly to our systems. Each of these methods involves varying degrees of interaction with the key components of our system. When accessed as a web-based application, clients have complete control over when and how often they upload positions and holdings into the system application. Clients can create their own ad hoc analysis, build dynamic "what-if" scenarios, design custom reports for immediate use, run intra-day pre-trade tests and schedule their own overnight data processing and report generation. As a fully-outsourced or managed service, we configure the services platform to create a customized risk reporting service for our clients. In doing so we take on the additional responsibility of uploading the client's positions and holdings from the client's internal systems, fund administrator, broker or custodian, schedule and direct the running of all risk analyses, and produce risk reports our clients use for their internal and external requirements.
Web service clients bypass our other delivery mechanisms and instead have their own systems connect directly to our core risk elements. Clients typically use our web services to seamlessly embed the functionality available in RiskManager directly into their own systems and interfaces.
Services Platform—Our proprietary platform is at the core of our scalable services-oriented architecture and allows us to manage many processes simultaneously. The platform orchestrates the flow of information between us and our clients as well as directs the internal operations of our risk elements. Our platform allows us to simultaneously process millions of positions for hundreds of clients per day. The platform is monitored 24 hours a day, seven days a week by a group of dedicated operations engineers to ensure peak performance of the entire system.
HedgePlatform
HedgePlatform is a reporting service allowing clients that invest in hedge funds, including funds of funds, pension funds and endowments, to measure, evaluate and monitor the risk of their hedge fund investments across multiple hedge fund strategies. We collect position-level information from hedge funds on a monthly basis and provide our clients with a risk report for each individual hedge fund in which they invest as well as an aggregate risk report for their overall portfolio of hedge funds. Our clients who use RiskManager to measure the risk of their own holdings can further integrate the positions collected via our HedgePlatform service to allow computation of risk across their entire portfolio but retains the proprietary nature of the underlying hedge fund holdings. HedgePlatform reports include statistics such as exposure (long, short, net and gross), sensitivities, scenario analysis, stress tests and VAR analysis.
DataMetrics
DataMetrics is a data service that allows clients to access the market data embedded in RiskManager for use in their own proprietary or other third-party systems. In addition to direct access to market data time series, DataMetrics can provide clients with customized data processing services.
Credit Risk
Our credit risk products and services allow our clients to consolidate multiple types of credit exposures across an institution. Our CreditManager product is a portfolio credit risk management system used primarily by banks to calculate economic capital, facilitate risk-based pricing, credit scores and measure risk concentrations. The application is designed to consolidate and compare risks and opportunities across multiple credit exposures including bonds, credit derivatives and traditional lending.
Wealth Management
WealthBench. WealthBench is an investment planning platform for private banks, financial advisors, brokerages and trust companies. WealthBench delivers fully-informed, tailored investment
9
planning proposals for high net worth individuals reflecting their needs, goals and risk tolerances while remaining consistent with firm-driven investment and risk-based policies. WealthBench incorporates robust analytics, market-consistent inputs and transparent methodologies.
ISS Segment
Overview
ISS is a leading provider of corporate governance and financial research and analysis services to institutional investors and corporations around the world. We facilitate the voting of proxies by institutional investors and provide in-depth research and analysis to help inform their voting decisions and assess issuer-specific risk. ISS' products and services consist of: Governance Services to institutional investors and Financial Research and Analysis services to institutional investors, corporations and professional service firms. The pricing model for ISS' products and services is primarily subscription-based and varies depending on the product or service purchased.
We provide proxy services to institutional investors globally. We are the largest proxy advisory firm that offers a fully-integrated, end-to-end proxy voting service, including policy creation, comprehensive research, vote recommendations, reliable vote execution and reporting and analytical tools. Although some of our Proxy Research and Voting clients purchase our proxy research on a stand-alone basis, the vast majority purchase a comprehensive research and voting product. In 2009, we issued proxy research and vote recommendations for more than 37,000 shareholder meetings across 108 countries and voted, on behalf of our clients, 7.6 million ballots representing over 1.3 trillion shares. We believe these amounts are substantially more than any of our competitors. During 2009, Governance Services accounted for approximately 64% of ISS revenues.
We also offer Financial Research and Analysis products and services designed to assess the overall financial health of companies by analyzing the investment implications of companies' accounting policies, legal and regulatory exposure, environmental, social and governance practices, mergers and acquisitions initiatives and compensation plans. Our product and service offerings are provided primarily to portfolio managers for investment analysis, to corporations to monitor compliance with corporate governance practices and to professional services organizations to support due diligence efforts. These offerings are either bundled with other services or sold on an individual basis and allow investors to add specialized, qualitative analysis to more traditional research used in the investment decision-making process. During 2009, Financial Research and Analysis accounted for approximately 36% of ISS revenues.
Governance Services
We categorize our Governance Services products and services into three distinct categories: Proxy Research and Voting, Global Proxy Distribution Services and Securities Class Action Services.
Proxy Research and Voting
Through our ProxyExchage platform, we provide our clients with vote recommendations, comprehensive analyses and online voting capabilities that enable users to make informed decisions about how to vote on all items with respect to each shareholder meeting agenda that we cover, execute their votes and monitor and track their votes for reporting purposes. Our Proxy Research and Voting staff currently operates out of numerous offices around the world, providing a global network of local expertise.
10
The following diagram illustrates our Proxy Research and Voting services and how they integrate into the flow of the proxy process:
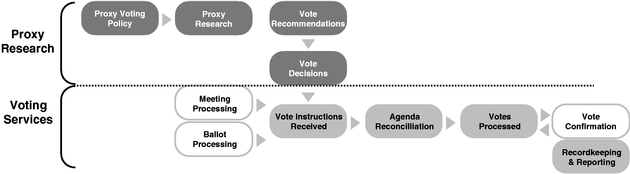
Proxy Research. We provide research coverage on over 6,400 U.S.-based companies and approximately 20,000 non-U.S. companies. Our standard global coverage includes Morgan Stanley EAFE stocks, FTSE All-Share and TSE 300 listings, selected Goldman Sachs/FTA securities; the first section of the Tokyo Stock Exchange, selected sponsored ADRs from a broad range of countries as well as securities in emerging markets. The size, breadth and experience of the research team allows ISS to maximize an in-depth understanding of local business practices, proxy voting requirements, language and culture across most developed corporate governance markets globally.
ISS' policy board works to ensure that ISS' voting policies are developed and applied within a framework of corporate governance best practices. ISS actively works with institutional clients and industry professionals around the world to gather input on its proxy voting policies. Each year, through an annual policy survey of our institutional clients and other forums, institutional investors are invited to share their ideas on corporate governance issues including board structure, executive compensation, mergers and acquisitions and corporate accountability to ensure that our standard voting policies are aligned with the views of our institutional clients.
Our Proxy Research and Voting recommendations are based on the application of ISS' voting policies to the particular voting items on an issuer's agenda. Our research and recommendations are produced based on benchmark, specialized and custom policies.
ISS develops separate benchmark policies for U.S. securities and non-U.S. securities. ISS' non-U.S. benchmark policies are adjusted to address in-country concerns. ISS' benchmark policies serve as an industry standard and best practice guide to corporate governance. In addition to our benchmark policies, we recognize that the philosophies and policies used to make proxy voting decisions range widely among different types of investors. Understanding the diverse needs of our clients, we are able to create policies that meet their requirements through a number of specialized policies such as SRI policies based on environmentally and socially responsible guidelines and our Taft-Hartley policy which is based on AFL-CIO guidelines. For many institutional investors with highly specialized or unique needs for proxy research and policy, we also offer custom proxy advisory services in which we work with our clients to develop and refine governance policy guidelines that match their particular views and are unique to them.
Proxy Voting. Our Proxy Voting services include notifying clients of upcoming shareholder meetings, receiving proxy ballots from third-party proxy distributors, generating consolidated proxy ballots and instructions across our clients' portfolios, executing and tabulating our clients' votes in accordance with their instructions, maintaining voting records and providing comprehensive vote reporting.
Our vote reporting lets our clients stay informed and empowered with accurate and timely information, including full vote audit trails and intra-day updates of all fund, meeting and agenda
11
information. In addition to daily audits and detailed vote reconciliation, we conduct automated end-of-day production checks to ensure all votes are executed accurately.
Our account representatives and voting operations professionals worldwide provide expert guidance and dedicated support to make sure all clients' votes are cast in accordance with their established proxy guidelines. In addition, we have a Straight Through Processing, or STP, arrangement with Broadridge Financial Solutions with respect to U.S. and global ballots. This STP arrangement allows for ballots to be received and proxy votes to be made electronically minimizing the manual aspects of the proxy voting process and limiting the risk of error inherent in manual processes. This STP arrangement and other arrangements with third party ballot distributors and custodians have allowed our number of ballots processed to increase from 2.0 million in 2000 to 7.0 million in 2009.
Vote Disclosure is a cost-effective proxy voting solution to help U.S. investment companies comply with the SEC disclosure rules and give shareholders easy access to institutional voting records. For users of this service, we collect, report and record the information required by the SEC in the Form N-PX and provide users with reports and a personalized easily navigable web site for public vote and proxy policy disclosure.
Global Proxy Distribution Services ("GPD")
Our GPD service offers a complete global proxy distribution solution to custodian banks for non-U.S. securities through a single independent platform. GPD provides for the efficient distribution and voting of proxies giving clients the ability to review and download detailed meeting information and individualized account information. GPD also provides online access to customized record-keeping and reporting across all custodians and sub-custodians.
Securities Class Action Services ("SCAS")
We deliver a complete class action monitoring and claims filing service to institutional investors who have potential recovery rights in class action lawsuits. We provide a comprehensive securities litigation database, including up-to-date case information and detailed historical class action data, and provide fully-outsourced notification, tracking and claims filing services to our institutional clients. Our arrangements with claims administrators and law firms around the world enable us to advise on new developments in global markets and streamline the filing process.
SCAS offers more detailed portfolio specific views of cases and settlements with an online report library that allows clients to keep track of the complete securities class action lifecycle from when a case is first identified until payment is disbursed. Securities class action data provided to our clients include class periods, settlement dates, status reports, award amounts, claim deadline dates, claims administrator details and pertinent related data.
Financial Research and Analysis
We provide specialized financial research and analysis products and services to asset managers, hedge funds, corporations and professional services firms across many dimensions of risk, governance, accounting, environmental, social and legal issues.
Our Financial Research and Analysis offerings fall into four general categories: CFRA Forensic Accounting Research, (ES&G), M&A Edge and Compensation Advisory Services.
CFRA Forensic Accounting Research
Through a rigorous and proprietary research process, our global team of analysts assesses the reported financial results of over 10,000 companies worldwide. We focus on providing our clients with timely and actionable risk analysis reports regarding earnings and cash flow quality and sustainability,
12
legal and regulatory risk and overall business health. Our clients rely on our continuous analysis and objective perspective.
CFRA's largest product is Accounting Lens, a leading forensic accounting risk research report offering for investors, providing early warning signals for companies showing signs of operational or financial distress. The reports consist of in-depth company research, educational and industry research, access to our proprietary earnings quality database and research analyst contact. In addition, CFRA's Legal Edge product is focused on identifying and analyzing hidden legal and regulatory risks. CFRA also provides customized research services for client-defined projects.
Environmental, Social and Governance Services
Our ES&G Research and Analytics products and services include screening and modeling tools that allow institutional investors to apply socially responsible guidelines to portfolios, understand the implications of restrictions on portfolios, and examine company-specific profiles. Our services also help clients manage portfolio risk by incorporating an in-depth set of quantitative and qualitative ES&G information, including a range of screening, research and Index solutions, into their investment decision making processes.
Our ES&G Analytics provides sector-based research reports on thousands of companies and numerous environmental issues. These reports are designed to summarize key issues and to facilitate discussions on social and environmental policies between institutional investor clients and global companies. Relative scoring data for each company enable investors to compare performance and capabilities across industry sectors to assess a company's progress towards best practices. In 2009, we acquired Innovest and KLD in order to expand our ES&G product offering.
M&A Edge
Our M&A Edge service provides an independent, in-depth analysis that focuses specifically on proposed merger and acquisition deals and proxy contests to inform institutional investors. This offering complements our traditional proxy research by providing the same foundational analysis and vote recommendation, but also delivers ongoing deal notes that keep users abreast of key events as the deal or contest evolves. Coverage continues as issues develop, from the date of announcement through the shareholder vote. The analysis covers key aspects of a transaction, including strategic rationale, corporate governance and shareholder rights issues.
Compensation and Corporate Advisory Services
We provide a set of turnkey products and services that enable compensation professionals and board committee members to optimize compensation plan design by modeling, analyzing and benchmarking executive compensation. Our Compensation and Corporate Advisory Services provide access to experienced and dedicated compensation plan analysts and support to our clients in modeling the cost of equity compensation plans and determining optimal compensation plan design. Alternatively, we provide a web-based compensation modeling tool, Compass, that measures the cost of equity-based incentive plans using a binomial option pricing model.
Our Clients
We have a global footprint, which allows us to support our highly-diversified client base across numerous geographies with in-depth analysis based on local knowledge. No client represented more than 1.2% of ACV and our top 20 clients represented less than 14% of ACV. Our client base is geographically diverse as well, with 41% of our revenues during the year ended December 31, 2009 generated from clients located outside of the Americas.
13
As of December 31, 2009, our ACV by client type was distributed approximately as follows: 57% asset management; 18% alternative investment managers (including hedge funds and fund of funds); 18% commercial and investment banking and trading (including prime brokers); and 7% corporate, professional services and other. As of December 31, 2009 our clients in the Americas, EMEA and Asia, comprised approximately 58%, 35% and 7% of RiskMetrics' ACV, respectively.
RiskMetrics
Approximately 530 clients worldwide rely on us for their portfolio risk management needs. Our RiskMetrics clients include leading asset managers, hedge funds, pension funds, commercial and investment banks, central banks, insurance companies, private banks and regulators. The following table summarizes RiskMetrics revenue on a percentage basis by geographic region, based on the country in which the customer is located:
| |
For the years ended December 31, | ||||||||||
|---|---|---|---|---|---|---|---|---|---|---|---|
RiskMetrics Revenue by Region
|
2009 | 2008 | 2007 | ||||||||
Americas |
44.5 | % | 45.6 | % | 46.7 | % | |||||
EMEA (Europe, Middle East and Africa) |
48.5 | % | 47.3 | % | 45.0 | % | |||||
Asia |
7.0 | % | 7.1 | % | 8.3 | % | |||||
Total |
100.0 | % | 100.0 | % | 100.0 | % | |||||
ISS
Approximately 2,970 organizations worldwide rely on ISS for their corporate governance, proxy voting and financial research and analysis needs. Clients of our financial research and analysis services generally include institutional investors, hedge funds, insurance underwriters and diversified financial institutions. We also provide our Financial Research and Analysis products and services to corporations and regulatory bodies worldwide. The following table summarizes ISS revenue on a percentage basis by geographic region, based on the country in which the customer is located:
| |
For the years ended December 31, | ||||||||||
|---|---|---|---|---|---|---|---|---|---|---|---|
ISS Revenue by Region
|
2009 | 2008 | 2007 | ||||||||
Americas |
75.8 | % | 78.0 | % | 77.6 | % | |||||
EMEA (Europe, Middle East and Africa) |
19.8 | % | 17.6 | % | 17.4 | % | |||||
Asia |
4.4 | % | 4.4 | % | 5.0 | % | |||||
Total |
100.0 | % | 100.0 | % | 100.0 | % | |||||
Our ISS business serves both institutional and corporate clients and we recognize that there is a potential for conflict of interest with respect to the provision of products and services to corporate issuers and the products and services we provide to our institutional investor clients. We have instituted multiple safeguards to mitigate any real or perceived conflicts of interests. We have formed a subsidiary that provides governance services to corporations. This subsidiary, ISS Corporate Services, Inc., has distinct resources and a firewall that prevents the flow of information from ISS Corporate Services to ISS. Every ISS Corporate Services contract indicates that the purchase of corporate services will not result in preferential treatment from ISS and does not influence ISS' proxy recommendations or other research coverage. Recommendations and research coverage are based solely on the application of ISS' published policies and by an issuer's actual governance policies and practices.
14
Our Industry and Market Opportunity
Industry
The recent adverse impact on the global financial markets which included illiquidity, market volatility, widening credit spreads, changes in interest rates, currency exchange fluctuations and new legal and compliance requirements, has had a negative impact on a number of our clients and has resulted in a decline on renewal rates and new sales growth. However, we believe there may be opportunities for the Company in the area of risk management in the event there is additional risk regulation. In general, regulation has been a key driver to our business growth in the past. In the event that the recent financial crisis results in further regulation, we believe that such regulation could be a driver for growth in our business by increasing the demand for our existing products and services.
As a result of increasing complexity of investment strategies, governments and regulatory authorities and investors are increasing the requirements on financial services firms and investment firms to track and report risk as part of their daily operations. To satisfy their risk management needs, firms across the financial services industry have significantly increased their expenditures on portfolio risk management technologies. Financial services firms have traditionally developed these products and services through in-house information technology, or IT, and research and development staffs. However, the increasing scale and specialization needed to support multi-asset class portfolios and complex securities and strategies have, in many cases, caused these firms to turn to more comprehensive products and services from dedicated providers who can furnish more effective solutions than internal development teams. In addition, an increasing number of firms are utilizing risk management solutions from external vendors in order to provide the third party independent risk reports often demanded by their clients.
Government regulation is also driving significant changes in governance practices. In the United States, proxy voting is both a legal requirement and a non-discretionary event for many institutional investors. Through its oversight of ERISA, the U.S. Department of Labor requires that pension funds treat their proxy, or right to vote, as an asset which must be exercised. At the same time, the SEC requires mutual funds to disclose to their customers how they voted the proxies of the securities they hold. In the United States, corporate governance-related regulation aimed at issuers, such as the Sarbanes-Oxley Act, further strengthens the focus among investors on governance and related issues. While the United States remains at the forefront of regulation-mandated corporate governance practices, the rest of the world is increasingly adopting more stringent corporate governance requirements.
The visibility of corporate governance and recognition of the risks associated with poor governance practices have increased significantly during the past several years. Corporate governance has shifted from a compliance function to a business imperative. Whether driven by high-profile corporate scandals or increasing shareholder activism, both investors and issuers are far more cognizant of the consequences of governance practices on their businesses or portfolio returns. Public companies that ignore best practices increasingly risk shareholder dissent and reputation risk. As institutional equity ownership grows, the power of institutional investors to effect change in their portfolio companies has grown in tandem. Along with the focus on corporate governance, investors are increasingly focusing on environmental and social issues in making investment and proxy voting decisions. This has increased the need for in-depth proxy research as a tool for investors engaging in socially responsible investing.
Market Opportunity
Our target market is a cross-section of global financial services firms that includes asset managers, hedge funds, commercial and investment banks, pension funds and insurance companies. We also target other market participants, such as third-party advisors, corporations, underwriters and central banks.
15
We believe that a number of key market trends are driving the growth of our business and increasing the value we can offer to our expanding client universe:
Growing Global Financial Markets and Investment Portfolio Complexity. The variety, complexity and geographic diversity of financial assets held by investors have expanded significantly, resulting in multi-asset class, multi-national portfolios often including derivatives and other structured products.
Increasing Demand for Transparency. RiskMetrics believes that the viability of the global financial community is founded upon transparency and trust. Investors increasingly need to document their risk profile on a regular basis for both internal audiences, such as risk committees, as well as external constituencies, such as limited partners and regulators. In order to satisfy these demands, comprehensive risk management has become an essential requirement. Furthermore, institutional investors have increasingly used their proxy voting power as a tool to motivate companies to demonstrate better accountability and transparency. We believe that as investors continue to demand greater transparency with respect to multiple dimensions of financial risk, demand for our comprehensive suite of risk management services will continue to grow.
Increasing Regulatory Requirements. Regulatory bodies around the world continue to drive change and create opportunities in the markets we serve. Portfolio risk reporting and measurement regulations, such as UCITS III, U.S. Department of Labor proxy voting requirements and corporate governance related regulations, including the Sarbanes-Oxley Act, have increased regulatory compliance requirements and have further emphasized the need for comprehensive risk management tools. We believe the increased focus on regulatory requirements around the world will drive further demand for our products and services.
Increasing Focus on Corporate Governance. During the past several years, there has been significant growth in the visibility of corporate governance and recognition of the risks associated with poor governance practices. Whether driven by high-profile corporate scandals or increasing shareholder activism, both investors and issuers are far more cognizant of the consequences of governance practices on their businesses or portfolio returns. Furthermore, investors are increasingly focusing on companies' environmental and social attributes when making investment and proxy voting decisions. We believe that these trends are driving the need for in-depth specialized research as a tool for investors engaging in socially responsible investing.
Increasing Demand for Outsourced Products and Services. Many financial services firms are increasingly utilizing outsourced solutions that enable them to focus on their core competencies and provide greater capabilities and are more cost effective than their in-house systems. As third-party alternatives have improved in quality, reliability, efficiency and scalability, even the largest firms are recognizing the value of outsourcing. In particular, an increasing number of firms are utilizing risk measurement and management solutions from external vendors. These vendors provide independent risk reporting products and services which are often requested by the financial services firms' clients. As a provider of market leading, fully-outsourced risk and governance services, we believe that we will continue to be able to capitalize on this trend.
Competition
The competitive landscape for multi-asset class risk management and corporate governance and financial research and analysis products and services is characterized by a limited number of external third-party competitors. ISS competes with firms such as Broadridge Financial Solutions (which provides proxy voting services), Glass, Lewis & Co. (which provides research, voting recommendation and voting execution services) and Proxy Governance, Inc. (which provides research, voting recommendation and voting execution services). In addition, RiskMetrics competes with firms such as JP Morgan's Measurisk, BlackRock Inc.'s BlackRock Solutions unit, DST Systems Inc., Fimalac S.A.'s
16
Algorithmics unit, Moody Corporation's KMV unit, MSCI Barra and SunGard Data Systems Inc. We also face competition from internal development at financial institutions and corporations. We compete in these markets primarily on the basis of brand recognition, market coverage, methodology and breadth of service offering.
Research and Development and Operations
Research and Development
RiskMetrics
The RiskMetrics research and development team is responsible for our risk research, data and analytics engineering, infrastructure and application development, testing, implementation and deployment. The team's years of collaborative innovation and research with our clients, which include many of the world's leading financial institutions, has resulted in an institutional knowledge which we believe would require substantial time and investment to replicate. We seek to maintain this competitive advantage through significant ongoing investment in research and development.
ISS
ISS has invested in systems, processes and controls to handle an increase in transactions processed. We have a technology infrastructure and a proven track record in automating and scaling operationally complex and time critical tasks. Our ISS development team has created integrated processing systems which have been developed in a scalable architecture linked to a centralized data warehouse. The ISS operations and research and development team also supports the recently launched ProxyExchange proxy voting platform that will provide additional functionality and services to our proxy voting clients. Our operations and research and development team are currently working on the implementation of the new proxy voting platform in order to prepare for the peak of the 2010 proxy season.
Research and development expenses amounted to $43,456, $41,593 and $31,142 for the years ended December 31, 2009, 2008 and 2007, respectively.
Operations
We maintain RiskMetrics' US operations teams in New York, Boston, Maryland, Oklahoma, and international operations in London, Singapore and Manila. Our operations group manages the internal technical infrastructure of RiskMetrics (including data centers, networks and telecommunications) and the daily operational elements of our hosted applications which run all analytics, data and client processes. Daily functions include processing our market data time series, securities reference data and benchmarks from our global data providers, loading and processing millions of client positions and monitoring and ensuring peak performance. Our primary operations are hosted at two redundant data centers in Watertown, Massachusetts and Asburn, Virginia, connected together via a secure network.
Many of ISS' clients outsource proxy voting and vote reporting to ISS. We have had success in meeting client requirements while also increasing our transactional volume through increased automation and by leveraging our operations center in Manila, Philippines. This operations center reduces the operational cost per transaction and has been a key component of our success.
Sales, Marketing and Client Support
We sell our products and services primarily through direct interaction with our clients. As of December 31, 2009, we had a sales force of approximately 69 employees in 12 offices around the world. Sales employees are compensated on a salary and commission basis.
17
Our account management staff is composed of approximately 128 employees in 13 offices worldwide. Account managers are assigned to our clients based on geographic location and client type. Our account management team works closely with our clients to optimize our clients' use of our products and services, and we believe that our account management team's product knowledge and local presence differentiates us from our competition.
Our marketing and communications team supports all of our business units with the aim of helping us increase sales, generate qualified sales leads, enhance our brand, increase our visibility, improve the client experience and educate the financial community about risk and governance. Key areas of focus include communications and industry outreach and event management. The team also proactively manages our relationship with the media, which frequently seeks our opinion on industry issues, particularly in the area of corporate governance.
Government Regulation
ISS is a registered investment advisor and must comply with the requirements of the Investment Advisers Act of 1940 and related SEC regulations. Such requirements relate to, among other things, disclosure obligations, recordkeeping and reporting requirements, marketing restrictions and general anti-fraud prohibitions.
Employees
Our employee base is comprised of talented people from diverse backgrounds. Some of our employees have extensive experience at prominent financial institutions and Fortune 500 companies. As of December 31, 2009, we had approximately 1,140 full-time employees in 12 countries. During the proxy season (March to July), ISS typically retains approximately more than 200 temporary employees. We believe that we maintain good working relationships with our employees. None of our employees are subject to a collective bargaining agreement.
Website Access to our Periodic SEC Reports
Our corporate headquarters are located at One Chase Manhattan Plaza, New York, New York 10005, and our telephone number is (212) 981-7145. We maintain an Investor Relations website on the Internet at www.riskmetrics.com. We make available free of charge, on or through this website, our annual, quarterly and current reports and any amendments to those reports as soon as reasonably practicable following the time they are electronically filed with or furnished to the SEC. To access these, just click on the "SEC Filings" link found on our Investor Relations homepage.
Information contained on our website is not incorporated by reference into this Annual Report on Form 10-K or any other document filed with the SEC.
The Company is exposed to the risk factors described below. You should carefully consider the following risk factors, as well as the other information in this Annual Report on Form 10-K, before deciding whether to invest in our common stock. If any of the events highlighted in the following risks actually occurs, our business, results of operations or financial condition would likely suffer. In such an event, the trading price of our common stock could decline and you could lose all or part of your investment.
18
Risks Relating to our Business
Our revenues and earnings depend substantially upon conditions in the financial services industry, and a significant or prolonged downturn in the financial services industry could decrease demand for our products and services.
Recently, general worldwide economic conditions have experienced deterioration due to credit conditions resulting from the recent financial crisis affecting the banking system and financial markets and other factors including slower economic growth, concerns about valuations and decreased consumer confidence. These conditions make it extremely difficult for our customers and us to accurately forecast and plan future business activities. We cannot predict the timing or duration of any economic slowdown or subsequent economic recovery. If the economy or markets in which we operate do not continue at their present levels or continue to deteriorate, we may record charges related to restructuring costs and further impairments to goodwill and long-lived assets, and our business, financial condition and results of operations will likely be materially and adversely affected.
Our revenues are principally derived from the provision of risk management and corporate governance products and services to the financial services industry. The vast majority of our business involves the sale of products and services to clients in the financial services industry including asset managers, banks, insurance companies, hedge funds, pension funds as well as professional organizations that serve the financial services industry. The global financial markets have been particularly adversely impacted by the market environment of the past two years that includes illiquidity, market volatility, widening credit spreads, changes in interest rates, currency exchange fluctuations and new legal and compliance requirements. These market conditions and the reduced business activity have had a negative impact on a number of our clients and could negatively impact our future revenues due to the potential for declining sales and renewal rates.
Similarly, we are exposed to other market trends in the financial services industry. Consolidation in the financial services industry could reduce our existing client base and the number of potential clients. This may negatively impact our ability to generate future growth and may reduce demand for our products and services, which could have a material adverse effect on our business, financial condition or results of operations.
Our investments in recorded goodwill and other intangible assets as a result of prior acquisitions, including goodwill and other intangible assets resulting from our ISS acquisitions could be impaired as a result of future business conditions, requiring us to record substantial write-downs that would reduce our operating income.
We have goodwill and intangible assets of $461.6 million recorded on our balance sheet as of December 31, 2009. During 2008 we recorded a $160.1 million impairment charge to goodwill and intangible assets primarily as a result of the negative equity market conditions which caused a material decline in industry market multiples in 2008 and a reduction in the useful life of an ISS tradename. We evaluate the recoverability of recorded goodwill amounts and intangible assets annually, or when evidence of potential impairment exists. The annual impairment test is based on several factors requiring judgment. Changes in fair market valuations and our operating performance or business conditions, in general, could result in additional future impairments of goodwill which could be material to our results of operations. In addition, if we are not successful in achieving anticipated operating efficiencies associated with acquisitions, our goodwill and intangible assets may become impaired.
19
We have incurred significant indebtedness which could affect our ability to finance our operations, pursue desirable business opportunities or successfully run our businesses in the future.
As of December 31, 2009 we have outstanding indebtedness of $288.4 million. The 2009 interest cost to service our debt was approximately $19.6 million. In addition, we are required to make quarterly principal payments of $0.7 million and re-pay the entire amount outstanding in December 2013. This indebtedness has created substantial demands upon our available cash to pay interest and future debt principal requirements. Our leverage and debt service obligations could have important consequences to you, including the following:
- •
- The terms of the indebtedness obligations that we have incurred contain numerous restrictive covenants which, among other
things, restrict our ability to pay dividends on or make other distributions or repurchase our capital stock or make other restricted payments, incur additional indebtedness or issue preferred stock,
make investments, enter into transactions with affiliates and sell assets or merge with or into other companies or otherwise dispose of all or substantially all of our assets. In addition, we are
required to satisfy and maintain specified financial ratios and tests. If we do not comply with these obligations, we may cause an event of default which, if not cured or waived, could require us to
repay the indebtedness immediately.
- •
- We may be vulnerable in the event of downturns and adverse changes in our businesses, in our industries, or in the economy
generally, due to our debt service.
- •
- We may have difficulty obtaining additional financing, if necessary, at favorable interest rates or at all, to meet our
requirements for working capital, capital expenditures, acquisitions, general corporate purposes or other purposes.
- •
- We are required to dedicate a substantial portion of our current cash flow to the payment of interest on our indebtedness, and future cash flow to principal indebtedness, which will reduce the amount of funds available for operations, capital expenditures and future acquisitions.
We require highly trained and skilled management and other key employees to maintain and expand our analytical models, proxy voting recommendations and other important aspects of our product and service offerings.
Our strategic direction and growth, as well as the development, maintenance and support of our products and services, are dependent upon the knowledge, experience and ability of our highly skilled, educated and trained employees. The members of our research and development and operations groups have, in many cases, advanced degrees and backgrounds in quantitative disciplines, including physics, engineering and economics, and use their experience and expertise to design product and service enhancements. In addition, the members of ISS' policy board use their experience and expertise in corporate governance and policy formation to ensure that ISS' voting policies are developed and applied within a framework of corporate governance best practices. Other ISS employees have extensive experience in the process and mechanics of voting proxies. The success of our business depends to a significant extent upon the continued service of our executive officers and other key management, research, sales and marketing, information technology and other technical personnel. In particular, Ethan Berman, our chief executive officer and a key participant in the formulation of our growth strategy to date, has been instrumental to our success. The loss of Mr. Berman could have a serious negative effect on the future development of our business, particularly if we are not able to implement an effective succession plan.
We believe that success in our business will continue to be based upon our intellectual capital. Consequently, we must hire and retain employees with the technical expertise and industry knowledge necessary to continue to develop our services and effectively manage our growing sales and marketing organization to ensure the growth of our operations. Despite the current market conditions, the market
20
for highly skilled employees remains very competitive and we compete for talent with some of the largest financial institutions and corporations in the world.
If we are unable to retain and recruit a sufficient number of these employees at all levels, our ability to maintain and grow our business could be negatively impacted.
We face competition that may cause price reductions or loss of market share.
We are subject to competitive conditions in all aspects of our business. We are one of the largest providers of outsourced multi-asset class market risk management and the largest provider of outsourced proxy research and voting services. The competitive landscape for multi-asset class risk management and corporate governance and financial research and analysis products and services is characterized by a limited number of competitors. ISS competes with firms such as Broadridge Financial Solutions (which provides proxy voting services), Glass, Lewis & Co. (which provides research, voting recommendation and voting execution services) and Proxy Governance, Inc. (which provides research, voting recommendation and voting execution services). ISS also competes with local niche proxy voting and research providers in certain international markets. In addition, RiskMetrics competes with firms such as JP Morgan's Measurisk, BlackRock Inc.'s BlackRock Solutions unit, DST Systems Inc, Fimalac S.A.'s Algorithmics unit, Moody Corporation's KMV unit, MSCI Barra and SunGard Data Systems Inc. We also face competition from:
- •
- the in-house operations of the businesses we seek as clients;
- •
- other general and specialized proxy reporting and business information services providers; and
- •
- other information and professional service providers.
Intense competition could harm us by causing, among other things, price reductions, reduced margins and loss of market share. We could further be required to reduce the fees we charge clients as a result of competitive pressure, which could result in lower revenues and profitability.
Our ability to compete, succeed and generate profits depends, in part, on our ability to obtain data from third-party vendors on commercially reasonable terms.
We currently obtain data for use in our products and services from a number of third-party vendors. Termination of one or more of our significant data agreements or exclusion from, or restricted use of a data provider's information could decrease the available information for us to use and offer our clients and may have a material adverse effect on our business, financial condition or results of operations. In addition, ISS relies on our data feed agreement with Broadridge Financial Solutions which allows for many ballots to be received and proxy votes to be made electronically, minimizing the manual aspects of the proxy voting process and limiting the risk of error inherent in manual processes. If our data feed agreement with Broadridge was terminated, we would have to incur significant expenses in order to input our clients' voting instructions directly into Broadridge's proprietary electronic voting systems and our business and results of operations would be materially adversely affected. Since we also compete with Broadridge in some markets with respect to providing certain aspects of proxy voting services, Broadridge may have an incentive not to renew our data feed agreement when its initial term expires or to offer renewal terms which we may deem unreasonable.
Some of our competitors could enter into exclusive contracts with our data suppliers. If our competitors enter into such exclusive contracts, we may be precluded from receiving certain data from these suppliers or restricted in our use of such data, which would give our competitors an advantage. Such exclusive contracts would hinder our ability to provide our clients with the data they prefer, which could lead to a decrease in our client base and could have a material adverse effect on our business, financial condition or results of operations.
21
In addition, some data suppliers may seek to increase licensing fees for providing their content to us. If we are unable to renegotiate acceptable licensing arrangements with these data suppliers or find alternative sources of equivalent content, we may be required to reduce our profit margins or experience a reduction in our market share.
Any perceived conflicts of interest resulting from providing products and services to institutional investors in addition to proxy voting recommendations, or providing products and services to corporations which are the subject of our proxy recommendations or other analytical products and services could harm our reputation and business.
ISS' institutional clients rely on us to provide them with informed vote recommendations, benchmark proxy voting guidelines and unbiased analyses of companies' environmental, social and governance attributes. The institutional clients of both our RiskMetrics and ISS businesses, particularly hedge funds and more active institutional investors, may have material economic and other interests in the corporations on which we provide proxy analyses and ratings or which are the subject of our financial research and analysis products and services. In some cases these institutional clients pay us a significant amount of money for RiskMetrics or ISS products and services and, accordingly, there may be a perception that we might advocate a particular position or provide research that supports a particular conclusion with respect to a corporation in order to satisfy the unique economic or other interests of a particular institutional client. As a result, institutional clients, competitors and other market participants could raise questions about our ability to provide unbiased services, which could harm our reputation.
Through our ISS Corporate Services subsidiary, we provide products and services to corporate clients who often use our services to learn about and improve their governance practices. Accordingly, there may be a perceived conflict of interest between the services we provide to institutional clients and the services, including our Compensation Advisory Services, provided to certain corporate clients. For example, when we provide corporate governance services to a corporate client and at the same time provide proxy vote recommendations to institutional clients regarding that corporation's proxy items, there may be a perception that we may treat that corporation more favorably due to its use of our services.
The safeguards that we have implemented may not be adequate to manage these apparent conflicts of interest, and clients or competitors may question the integrity of our services. In the event that we fail to adequately manage these perceived conflicts of interest, we could incur reputational damage, which could have a material adverse effect on our business, financial condition and operating results.
Our businesses rely heavily on electronic delivery systems and any failures, disruptions or slowdowns may adversely affect our ability to serve our clients.
Technological factors may affect our ability to deliver our products and services to our clients. We depend heavily on the capacity, reliability and security of our electronic delivery systems and the Internet. Access to our products and services and to data for our products and services, via the Internet involves security, availability, architectural compatibility and reliability risks. Our ability to effectively use the Internet may be impaired due to infrastructure failures, service outages at third-party Internet providers or increased government regulation. If failures, disruptions or slowdowns of our electronic delivery systems or the Internet occur, our ability to distribute our products and services effectively and to serve our clients may be adversely affected. If our products and services or the technology foundations upon which they are built and delivered, have design or implementation flaws, or otherwise malfunction and cause harm to clients or third parties, claims may be brought against us.
22
Changes in the legislative, regulatory and corporate environments in which our clients operate may adversely impact our financial results.
ISS' historical growth has been due, in large part, to increased regulatory requirements, highly visible corporate scandals, increased shareholder activism and corporate chief executive officers and boards of directors that are increasingly concerned about, and responsive to, shareholder concerns. To the extent that any of these trends change, the demand for our products and services could be reduced, and this could have a material adverse effect on our business, financial condition or results of operation. To the extent these regulations change or are not extended to other markets, our business, financial condition and results of operation could be materially adversely affected.
Changes in government regulations relating to our business could materially adversely affect our financial condition or results of operations.
The financial services industry is subject to extensive regulation at the federal and state levels, as well as by foreign governments. It is very difficult to predict the future impact of the legislative and regulatory requirements affecting our business and our clients' businesses. In particular, as a registered investment advisor, our ISS subsidiary is subject to the requirements and regulations of the Investment Advisers Act of 1940. The Investment Advisers Act relates to, among other things, fiduciary duties, recordkeeping and reporting requirements, disclosure requirements, limitations on agency and principal transactions between an advisor and advisory clients, as well as general anti-fraud prohibitions. We may also be adversely affected as a result of new or revised legislation or regulations imposed by the SEC, other U.S. or foreign governmental regulatory authorities or self-regulatory organizations that supervise the financial markets around the world. In addition, we may be adversely affected by changes in the interpretation or enforcement of existing laws and rules by these governmental authorities and self-regulatory organizations. It is impossible to determine the extent of the impact of any new laws, regulations or initiatives that may be proposed, or whether any of the proposals will become law. The introduction of any new laws or regulations could make compliance more difficult and expensive and affect the manner in which we conduct business.
Our products and services support the proxy voting and risk analysis processes of clients. Consequently, we may be exposed to potential liability claims brought by our clients or third parties as a result of the operational failure of our products and services.
Our products and services support the proxy voting and risk analysis processes of clients. If we were to fail to provide the services provided for in our client contracts, we could be required to provide credits to our clients and in some cases we may be subject to contractual penalties. Our client agreements generally have provisions designed to limit our exposure to potential liability claims brought by our clients or other third parties based on the operational failure of our products and services. However, these provisions could be invalidated by unfavorable judicial decisions or by federal, state, foreign or local laws. Any such claim, even if the outcome were to be ultimately favorable to us, could involve a significant commitment of management, personnel, financial and other resources.
Any failure to ensure and protect the confidentiality of client data could adversely affect our reputation and have a material adverse effect on our business, financial condition or results of operations.
Many of our products and services involve the exchange of information with our clients through a variety of media, including the Internet. We rely on a complex network of process and software controls to protect the confidentiality of client data, such as client portfolio data that may be provided to us or hosted on our systems. If we fail to maintain the adequacy of our internal controls, including any failure to implement required new or improved controls, or if we experience difficulties in implementation of our internal controls, client data could be misappropriated. Such internal control
23
inadequacies could damage our reputation, expose us to litigation and have a material adverse effect on our business, financial condition or results of operations.
Our revenues, expenses, assets and liabilities are subject to foreign currency exchange fluctuation risk.
We are subject to foreign currency exchange fluctuation risk. Exchange rate movements can impact the U.S. dollar reported value of our revenues, expenses, assets and liabilities denominated in non-U.S. dollar currencies or where the currency of such items is different than the functional currency of the entity where these items were recorded. We do not currently hedge the foreign exchange risk of assets and liabilities denominated in currencies other than the functional currency.
For all operations outside the United States where the Company has designated the local non-U.S. dollar currency as the functional currency, revenue and expenses are translated using average monthly exchange rates and assets and liabilities are translated into U.S. dollars using month-end exchange rates. For these operations, currency translation adjustments arising from a change in the rate of exchange between the functional currency and the U.S. dollar are accumulated in a separate component of shareholders' equity. In addition, transaction gains and losses arising from a change in exchange rates for transactions denominated in a currency other than the functional currency of the entity are reflected in operating expenses.
We generally invoice our clients in U.S. dollars; however, we invoice a portion of our clients in euros, pounds sterling, and a limited number of other non-U.S. dollar currencies. For the year ended December 31, 2009, approximately 20% of our operating revenues were invoiced in currencies other than U.S. dollar. Changes in foreign currency exchange rates (principally the strengthening of the US dollar) in 2009 compared to 2008 had a negative impact on consolidated revenue of $4.9 million.
We are exposed to additional foreign currency risk in certain of our operating costs. Although our expenses are generally in U.S. dollars, some of our operating expenses are incurred in non-U.S. dollar denominated currencies. Approximately 15% of our operating expenses (as a % of revenues) for the year ended December 31, 2009 were denominated in foreign currencies, the significant majority of which were denominated in pounds sterling, euros, Swiss franc, and a limited number of other non-U.S. dollar currencies. Changes in foreign currency exchange rates (principally the strengthening of the US dollar) in 2009 compared to 2008 had a positive impact on consolidated operating expenses of $4.0 million. Operating expenses are also impacted by intraperiod movements in currency exchange rates which result in foreign exchange gains and losses in cash collections and payments which are recorded as gains and losses in our consolidated statements of operations. Such movements in foreign exchange gains and losses favorably impacted 2009 operating expenses by an additional $2.6 million compared to 2008, resulting in a total favorable impact of $6.6 million to operating expenses. Future changes in foreign currency exchange rates could have a negative impact on our results of operations.
We have certain assets and liabilities denominated in currencies other than local functional amounts and when these balances were remeasured into their local functional currency, a loss resulted from the devaluation of the value of the functional currency. As a result of these positions, we have accumulated a $0.3 million unrealized translation gain as of December 31, 2009, which is reported within the stockholders equity section of our consolidated balance sheets.
To the extent that our international activities recorded in local currencies increase in the future, our exposure to fluctuations in currency exchange rates will correspondingly increase and could have a material adverse effect on our business, financial condition or results of operations.
24
We have engaged in hedging transactions and may engage in other hedging transactions which involve risks that could have a materially adverse effect on our financial condition or results of operations.
In February 2007, we entered into two interest rate swap agreements to reduce our interest rate risk and to manage interest expense, and we may engage in similar transactions in the future. As of December 31, 2009, the interest rate swaps had notional amounts of $251.4 million and a fair value liability of $15.0 million. Our interest rate swaps effectively changed a portion of our variable-rate debt obligations pursuant to our credit facilities to fixed-rate debt obligations. Developing an effective strategy for dealing with movements in interest rates is complex, and no strategy can completely insulate us from risks associated with such fluctuations. In addition, the counterparty to a derivative instrument could default on its obligation thereby exposing us to credit risk. Further, we may have to repay certain costs, such as transaction fees or brokerage costs, if a derivative instrument is terminated by us. Finally, our interest rate risk management activities could expose us to substantial losses if interest rates move materially differently from our expectations. As a result, our economic hedging activities may not effectively manage our interest rate sensitivity or have the desired beneficial impact on our financial condition or results of operations.
Operations outside the United States involve certain risks which may adversely affect our ability to grow our business outside the United States.
A significant portion of our business is conducted outside the United States. For the year ended December 31, 2009, approximately 41% of our revenues were generated from sales to clients outside of the Americas. In addition, as of December 31, 2009, approximately 38% of our combined employee base was located in our offices outside of the United States. As a result, we are subject to certain risks inherent in doing business in some jurisdictions outside the United States, including the following:
- •
- Challenges in establishing local
presence. In order to continue to expand our growth outside the United States, we must establish and maintain a local presence of sales,
distribution and customer service by establishing local offices throughout the world. If we do not successfully establish these offices and continue to attract and retain local employees, our ability
to expand outside the United States may be impaired.
- •
- Difficulty in maintaining products and services that are tailored to
the needs of local clients. In order to penetrate markets outside of the United States, we must provide a suite of products and services
that fit the needs of the local market. If we do not appropriately tailor our products and services to the local market, we may be unable to effectively grow sales of our products and services outside
of the United States.
- •
- Difficulty maintaining and monitoring effective and consistent internal
policies and procedures around the world. When we establish local offices and hire local employees, we must maintain consistent internal
policies and procedures across our offices. The various jurisdictions in which we establish offices from time to time may have differing rules and regulations affecting our operations. Consequently,
it may be difficult for us to maintain consistent employee policies and procedures across our organization. If we are unable to effectively maintain and monitor consistent policies and procedures
while simultaneously complying with applicable local rules and regulations, our ability to continue to grow our business and maintain our distinct corporate culture may be impaired.
- •
- Lack of local acceptance or knowledge of our products and services. Demand for our products and services are still nascent in many parts of the world. Many countries have not fully developed laws and regulations regarding risk management procedures or corporate governance and, in many cases, institutions in these countries have not developed widely accepted best practices regarding the same. There can be no assurances that demand for our products and services will develop in these countries.
25
These risks could affect our ability to continue to expand our business outside the United States, which may adversely affect our ability to increase our revenues and to service non-U.S. clients.
Potential Acquisitions May Disrupt the Corporation's Business and Dilute Stockholder Value
Acquisitions may require significant capital infusions, typically entail many risks, and could result in difficulties in assimilating and integrating the operations, personnel, technologies, products and information systems of acquired companies or businesses. We have in the past and may in the future experience delays in the timing and successful integration of an acquired company's technologies and product development. In addition, key personnel of an acquired company may decide not to work for us. The acquisition of another company or its products and technologies may also require us to enter into a geographic or business market in which we have little or no prior experience. These challenges could disrupt our ongoing business, distract our management and employees, harm our reputation and increase our expenses. These challenges are magnified as the size of the acquisition increases.
We cannot assure you that we will be able to consummate any pending or future acquisitions or that we will realize any anticipated benefits from these acquisitions. We may not be able to find suitable acquisition opportunities that are available at attractive valuations, if at all. Even if we do find suitable acquisition opportunities, we may not be able to consummate the acquisitions on commercially acceptable terms, and any decline in the price of our common stock may make it significantly more difficult and expensive to initiate or consummate additional acquisitions.
Risks Related to an Investment in our Common Shares
Our common share price is likely to be volatile.
The market price of our common shares may be volatile in response to a number of events, including:
- •
- our quarterly operating results;
- •
- sales of our common shares by principal shareholders;
- •
- small trading volumes and small public float;
- •
- changes in financial forecasts and recommendations by securities analysts or the termination of coverage by one or more
securities analysts;
- •
- general market conditions, economic conditions including the recent economic downturn; and
- •
- the other risks described in this section.
In addition, if the market for stocks in our industry, or the stock market in general, experiences a loss of investor confidence, the trading price of our common stock could decline for reasons unrelated to our business, financial condition or results of operations. If any of the foregoing occurs, it could cause our stock price to fall and may expose us to lawsuits that, even if unsuccessful, could be costly to defend and a distraction to management.
Future sales of shares of our common stock by our affiliates and other stockholders or by us may adversely affect the price and the future exercise of options may lower the price of shares of our common stock.
We cannot predict what effect, if any, future sales of shares of our common stock, or the availability of shares for future sale, may have on the trading price of our common stock. Future sales of shares of our common stock by our existing stockholders and other stockholders or by us, or the perception that such sales may occur, could adversely affect the market price of shares of our common stock and may make it more difficult for you to sell your shares of our common stock at a time and price that you determine appropriate.
26
Item 1B. Unresolved Staff Comments
As of the filing of this annual report on Form 10-K, there were no unresolved comments from the staff of the Securities and Exchange Commission.
Headquartered in New York City, we maintain a global presence with offices throughout the United States as well as in 11 other countries. Our New York City facility contains approximately 35,000 square feet and the lease relating to this facility expires in July 2012. ISS is headquartered in Rockville, Maryland. Our primary Rockville location, which is comprised of multiple leases, contains approximately 60,000 square feet and expires over a period ranging from July 2012 to July 2013. In 2008, we moved into a new 26,000 square feet leased property to serve as our London office, which expires in August 2012.
We also have smaller offices which support our operations locally in: Ann Arbor, Michigan; Beijing, China; Boston, Massachusetts; Brussels, Belgium; Chicago, Illinois; Frankfurt, Germany; Geneva, Switzerland; Edison, New Jersey; Leeds, England; Manila, Philippines; Melbourne, Australia; Norman, Oklahoma; Paris, France; San Francisco, California; Singapore; Tokyo, Japan; and Toronto, Canada.
In the ordinary course of business, we are involved in routine litigation incidental to our business. In the opinion of management, none of these matters presently pending are expected to have a material adverse effect on our overall financial position or results of operations.
Item 4. Submission of Matters to a Vote of Security Holders
There were no matters submitted to a vote of the company's security holders during the fourth quarter of 2009.
27
Item 5. Market for the Registrant's Common Equity, Related Stockholder Matters and Issuer Purchases of Equity Securities
a) Market Information
Our common stock is listed on the New York Stock Exchange under the symbol "RISK". Our stock was first publicly traded on January 25, 2008.
The graph below compares the cumulative total stockholder return on our common stock with the cumulative total return on the S&P's 500 Index and the NYSE Financial Sub-Industry Index from January 25, 2008 through December 31, 2009 assuming an investment of $100 at January 25, 2008 and the reinvestment of any dividends. The comparisons in the graphs below are based upon historical data and are not indicative of, nor intended to forecast, future performance of our common stock.

The following table shows the quarterly range of the closing high and low sale prices for our common stock as reported by the NYSE. Such prices do not include retail markups, markdowns or commissions.
| |
Common Stock | ||||||
|---|---|---|---|---|---|---|---|
| |
High | Low | |||||
Year Ended December 31, 2009 |
|||||||
First Quarter |
$ | 15.49 | $ | 10.11 | |||
Second Quarter |
$ | 18.61 | $ | 13.75 | |||
Third Quarter |
$ | 18.79 | $ | 13.86 | |||
Fourth Quarter |
$ | 16.04 | $ | 13.69 | |||
Year Ended December 31, 2008 |
|||||||
First Quarter |
$ | 24.45 | $ | 10.76 | |||
Second Quarter |
$ | 22.07 | $ | 16.00 | |||
Third Quarter |
$ | 26.43 | $ | 15.86 | |||
Fourth Quarter |
$ | 20.31 | $ | 10.06 | |||
28
b) Holders
As of February 18, 2010 there were approximately 85 stockholders of record and the closing price of RiskMetrics Group common stock was $18.94 per share as reported by the New York Stock Exchange.
c) Dividends
We have not paid or declared any cash dividends on our common stock during the period covered by the financial statements included in this Annual Report on Form 10-K. We have retained, and currently anticipate that we will continue to retain, all of our earnings for use in developing our business. In addition, our credit facility restricts our ability to declare and pay dividends.
d) Securities authorized for issuance under equity compensation plans
The following table sets forth information as of December 31, 2009 regarding our compensation plans and the Common Stock we may issue under the plans.
Equity Compensation Plan Information
Plan Category
|
Number of securities to be issued upon exercise of outstanding options or vesting of stock |
Weighted-average exercise price of outstanding options |
Number of securities remaining available for future issuance under equity compensation plans |
|||||||
|---|---|---|---|---|---|---|---|---|---|---|
Equity compensation plans approved by stockholders |
12,366,112 | $ | 8.03 | 5,746,113 | ||||||
Equity compensation plans not approved by stockholders |
— | — | — | |||||||
Total |
12,366,112 | $ | 8.03 | 5,746,113 | ||||||
e) Stock Repurchases
We do not have a publicly announced share repurchase plan. As of December 31, 2009 we had 243,154 shares of treasury stock.
f) Issuance of Securities and use of Proceeds from Sale of Registered Securities
On January 25, 2008, we granted 1,563,500 options to our employees immediately prior to the consummation of our initial public offering, including an aggregate of 1,031,500 options related to 2007 compensation for certain employees and an aggregate of 532,000 options to all full time employees, representing a one-time grant of 500 options to each of our employees.
On January 30, 2008, we completed our initial public offering of 16,100,000 shares of our common stock, which included 4,035,816 shares sold by our selling stockholders pursuant to our Registration Statement on Form S-1, as amended (Reg. No. 333-146167) that was declared effective on January 24, 2008. We did not receive any proceeds from the sale of the shares by the selling stockholders. Our net proceeds from the offering were $193.9 million, after deducting underwriting discounts, commissions and offering expenses.
In January 2008, we utilized a portion of proceeds from the initial public offering to prepay the entire outstanding indebtedness under the second lien loan credit facility which amounted to $125.0 million and a 1% prepayment penalty fee, or $1.25 million. The remainder of proceeds from the initial public offering have been and will continue to be utilized for general corporate purposes.
29
Item 6. Selected Consolidated Financial Data
Our selected consolidated financial and operating data for each of the years ended December 31, 2009, 2008, 2007, 2006 and 2005 are presented below. The information set forth below should be read in conjunction with the consolidated financial statements and notes thereto and "Management's Discussion and Analysis of Financial Condition and Results of Operations" included elsewhere in this Annual Report on Form 10-K.
Consolidated Statements of Operations Data
| |
Year ended December 31, | ||||||||||||||||
|---|---|---|---|---|---|---|---|---|---|---|---|---|---|---|---|---|---|
| |
2009(1) | 2008 | 2007(2) | 2006 | 2005 | ||||||||||||
| |
(Amounts in thousands, except share and per share data) |
||||||||||||||||
Revenues(3) |
$ | 303,361 | $ | 296,393 | $ | 240,301 | $ | 101,236 | $ | 93,637 | |||||||
Operating costs and expenses: |
|||||||||||||||||
Cost of revenues |
91,326 | 93,387 | 77,317 | 25,618 | 23,704 | ||||||||||||
Research and development |
43,456 | 41,593 | 31,142 | 21,202 | 16,099 | ||||||||||||
Selling and marketing |
29,521 | 33,202 | 35,420 | 14,977 | 12,257 | ||||||||||||
General and administrative |
39,603 | 37,422 | 29,654 | 12,852 | 11,492 | ||||||||||||
Depreciation and amortization of property and equipment |
8,349 | 8,779 | 7,419 | 4,081 | 3,551 | ||||||||||||
Amortization of intangible assets(4)(5) |
23,441 | 21,758 | 19,145 | 770 | 2,713 | ||||||||||||
Impairment of goodwill and intangible asset(6) |
— | 160,069 | — | — | 361 | ||||||||||||
Loss on disposal of property and equipment(7)(8) |
724 | 122 | 734 | 15 | 1,577 | ||||||||||||
Total operating costs and expenses(9) |
236,420 | 396,332 | 200,831 | 79,515 | 71,754 | ||||||||||||
Income (loss) from operations |
66,941 | (99,939 | ) | 39,470 | 21,721 | 21,883 | |||||||||||
Interest, dividend and investment income (expense), net: |
|||||||||||||||||
Interest, dividend and investment income |
570 | 2,567 | 1,564 | 2,549 | 1,438 | ||||||||||||
Interest expense |
(20,825 | ) | (26,234 | ) | (36,922 | ) | (49 | ) | — | ||||||||
Other expenses |
— | (2,613 | ) | — | — | — | |||||||||||
Interest, dividend and investment income (expense), net |
(20,255 | ) | (26,280 | ) | (35,358 | ) | 2,500 | 1,438 | |||||||||
Income (loss) before provision for income taxes |
46,686 | (126,219 | ) | 4,112 | 24,221 | 23,321 | |||||||||||
Provision for income taxes(10) |
15,560 | 10,700 | 1,711 | 8,200 | 7,640 | ||||||||||||
Net income (loss) |
$ | 31,126 | $ | (136,919 | ) | $ | 2,401 | $ | 16,021 | $ | 15,681 | ||||||
Net income (loss) per share: |
|||||||||||||||||
Basic |
$ | 0.50 | $ | (2.28 | ) | $ | 0.05 | $ | 0.38 | $ | 0.36 | ||||||
Diluted |
$ | 0.46 | $ | (2.28 | ) | $ | 0.04 | $ | 0.33 | $ | 0.32 | ||||||
Weighted average shares outstanding: |
|||||||||||||||||
Basic |
62,020,616 | 59,970,438 | 46,380,175 | 42,655,069 | 43,496,221 | ||||||||||||
Diluted |
67,943,069 | 59,970,438 | 54,364,746 | 47,963,666 | 48,412,751 | ||||||||||||
30
Consolidated Balance Sheet Data
| |
As of December 31, | |||||||||||||||
|---|---|---|---|---|---|---|---|---|---|---|---|---|---|---|---|---|
| |
2009(1) | 2008 | 2007(2) | 2006 | 2005 | |||||||||||
| |
(Amounts in thousands) |
|||||||||||||||
Cash and cash equivalents |
$ | 226,612 | $ | 170,799 | $ | 27,455 | $ | 37,313 | $ | 10,966 | ||||||
Short-term investments |
— | — | — | 68,071 | 69,296 | |||||||||||
Goodwill and intangibles, net |
461,606 | 456,953 | 635,105 | — | 770 | |||||||||||
Total assets |
762,140 | 705,013 | 743,183 | 136,947 | 115,293 | |||||||||||
Deferred revenue, including long-term portion |
116,778 | 110,889 | 101,279 | 58,842 | 53,744 | |||||||||||
Total debt, including current portion |
288,396 | 290,619 | 422,750 | — | — | |||||||||||
Stockholders' equity |
261,653 | 203,167 | 136,092 | 56,498 | 44,270 | |||||||||||
Other Financial and Operating Data
The financial and operating data below sets forth supplementary information that we believe is useful for investors in evaluating our underlying operations:
| |
Year ended December 31, | |||||||||||||||
|---|---|---|---|---|---|---|---|---|---|---|---|---|---|---|---|---|
| |
2009(1) | 2008 | 2007(2) | 2006 | 2005 | |||||||||||
| |
(Amounts in thousands, except for percentages) |
|||||||||||||||
Financial Data |
||||||||||||||||
Adjusted EBITDA(11) |
$ | 110,687 | $ | 101,147 | $ | 72,801 | $ | 30,223 | $ | 30,085 | ||||||
Net cash provided by operating activities |
77,207 | 84,848 | $ | 45,348 | $ | 36,082 | $ | 30,035 | ||||||||
Capital expenditures |
(7,107 | ) | (8,795 | ) | (11,091 | ) | (3,724 | ) | (6,217 | ) | ||||||
Free cash flow(12) |
$ | 70,100 | $ | 76,053 | $ | 34,257 | $ | 32,358 | $ | 23,818 | ||||||
Operating Data |
||||||||||||||||
Annualized contract value (at period end)(13) |
$ | 282,479 | $ | 285,997 | $ | 250,238 | $ | 101,686 | $ | 96,134 | ||||||
Recurring revenue as a percentage of total revenue(14) |
92.7 | % | 93.9 | % | 92.7 | % | 96.6 | % | 94.2 | % | ||||||
Notes to Selected Consolidated Financial Information and Other Data:
- (1)
- On
March 2, 2009 we acquired Innovest for approximately $14.8 million in cash and on October 30, 2009 we acquired KLD for approximately
$9.9 million in cash.
- (2)
- On
January 11, 2007, we acquired ISS for $542.8 million and incurred indebtedness of $425.0 million to complete the acquisition. In
addition, on August 1, 2007, we acquired CFRA for $63.0 million. As of December 31, 2009, $288.4 million of indebtedness remains outstanding.
- (3)
- In
March 2003, we acquired JPMorgan Advisory, Inc., an entity which primarily provided wealth management products and services to JPMorgan. In
connection with the acquisition, we entered into a three year online services agreement under which we agreed to provide to JPMorgan a customer-specific set of Wealth Management products and services
which were unrelated to our WealthBench product. This agreement was terminated as of April 30, 2006. Our results of operations reflect the revenues from the JPMorgan online services agreement
through April 30, 2006. For the years ended December 31, 2006 and 2005 we derived $4.3 million and $12.7 million of revenue, respectively, from the JPMorgan online services
agreement.
- (4)
- In
2005, we reduced the estimated useful lives of our technology intangible assets, which resulted in additional amortization expense of
$1.8 million.
- (5)
- In
2007, we acquired intangible assets from our acquisitions of ISS and CFRA. In 2009, we acquired intangible assets from our acquisitions of Innovest and
KLD.
- (6)
- In 2008, we recorded a non-cash impairment charge for goodwill and intangible assets totaling $160.1 million as a result of the Company's annual goodwill and intangible asset impairment review. The impairment charge includes a $154.2 million write-down to ISS goodwill as a result of significant declines in market valuations and earnings multiples. In addition, the impairment charge includes a $5.9 million write-down to an ISS product tradename as a result of an integration plan for the tradename which reduced its expected life.
31
- (7)
- During
2005, leases for two of our offices were terminated and we relocated into new space. As a result, we wrote off the remaining value of leasehold
improvements on that vacated space and we disposed of other furniture and equipment, which resulted in a loss of $1.6 million.
- (8)
- In
2007, we abandoned a software project and wrote off certain assets in our London office which resulted in a loss on disposal of property and equipment of
approximately $0.7 million. In 2009, we wrote of certain assets in the amount of $0.7 million, of which $0.4 million was from the abandonment of a software project due to a new
product launch.
- (9)
- For
the years ended December 31, 2009, 2008, 2007 and 2006, we recorded stock-based compensation of $9.0 million, $9.9 million,
$6.0 million and $3.6 million, respectively.
- (10)
- In
2005, we recognized a benefit of $1.1 million for remaining net operating loss tax carry forwards.
- (11)
- Adjusted EBITDA, as defined in our credit facilities, represents net income (loss) before interest expense, interest income, other income (expense), income tax expense (benefit), depreciation and amortization of property and equipment, amortization of intangible assets, non-cash stock-based compensation expense and extraordinary or non-recurring charges or expenses. It is a material metric used by our lenders in evaluating compliance with the maximum consolidated leverage ratio covenant in our credit facilities. The maximum consolidated leverage ratio covenant, as defined in our credit facilities, represents the ratio of total indebtedness as compared to Adjusted EBITDA, and cannot exceed a maximum ratio range which declines from 8.50 to 3.00 over the life of the credit facilities. Non-compliance with this covenant could result in us being required to immediately repay our outstanding indebtedness under our credit facilities. Adjusted EBITDA is also a metric used by management to measure operating performance and for planning, including preparation of annual budgets, analyzing investment decisions and evaluating profitability.
- •
- Adjusted EBITDA does not reflect our cash expenditures, or future requirements for capital expenditures or contractual
commitments;
- •
- Adjusted EBITDA does not include stock based compensation expense;
- •
- Adjusted EBITDA does not reflect changes in, or cash requirements for, our working capital needs;
- •
- Adjusted EBITDA does not reflect the significant interest expense, or the cash requirements necessary to service interest
or principal payments on our indebtedness;
- •
- Although depreciation and amortization are non-cash charges, the assets being depreciated and amortized often
will have to be replaced in the future, and Adjusted EBITDA does not reflect any cash requirements for such replacements; and
- •
- Other companies in our industry may calculate Adjusted EBITDA differently than we do, limiting its usefulness as a comparative measure.
We also present Adjusted EBITDA as a supplemental performance measure because we believe that this measure provides our board of directors, management and investors with additional information to measure our performance, provide comparisons from period to period by excluding potential differences caused by variations in capital structure (affecting interest expense), tax position (such as the impact on periods of changes in effective tax rates or net operating losses), the age and book depreciation of fixed assets (affecting relative depreciation expense), acquisitions (affecting amortization expense) and compensation plans (affecting stock-based compensation expense).
Adjusted EBITDA is not a measurement of our financial performance under U.S. GAAP and should not be considered as an alternative to net income, operating income or any other performance measures derived in accordance with U.S. GAAP or as an alternative to cash flow from operating activities as a measure of our profitability or liquidity.
We understand that, although Adjusted EBITDA is frequently used by securities analysts, lenders and others in their evaluation of companies, Adjusted EBITDA has limitations as an analytical tool, and you should not consider it in isolation, or as a substitute for an analysis of our results as reported under U.S. GAAP. Some of these limitations are:
32
The table below sets forth a reconciliation of Adjusted EBITDA to net income (loss) on our historical results:
| |
Year ended December 31, | |||||||||||||||
|---|---|---|---|---|---|---|---|---|---|---|---|---|---|---|---|---|
| |
2009 | 2008 | 2007 | 2006 | 2005 | |||||||||||
Net income (loss) |
$ | 31,126 | $ | (136,919 | ) | $ | 2,401 | $ | 16,021 | $ | 15,681 | |||||
Interest, other income (expense), net |
20,255 | 26,280 | 35,358 | (2,500 | ) | (1,438 | ) | |||||||||
Income tax expense |
15,560 | 10,700 | 1,711 | 8,200 | 7,640 | |||||||||||
Depreciation and amortization of property and equipment |
8,349 | 8,779 | 7,419 | 4,081 | 3,551 | |||||||||||
Amortization of intangible assets |
23,441 | 21,758 | 19,145 | 770 | 2,713 | |||||||||||
Stock-based compensation(a) |
9,015 | 9,893 | 6,033 | 3,636 | — | |||||||||||
Impairment of goodwill and intangible asset(b) |
— | 160,069 | — | — | 361 | |||||||||||
Non-recurring expenses(c) |
2,217 | 465 | — | — | — | |||||||||||
Loss on disposal of property and equipment(d) |
724 | 122 | 734 | 15 | 1,577 | |||||||||||
Adjusted EBITDA |
$ | 110,687 | $ | 101,147 | $ | 72,801 | $ | 30,223 | $ | 30,085 | ||||||
- (a)
- We
adopted the fair value method of accounting for stock-based compensation on January 1, 2006 utilizing the modified prospective transition method
and recorded stock-based compensation expense for all share-based payments granted or vested subsequent to December 31, 2005.
- (b)
- Represents
impairment of goodwill and intangible asset during the years ended December 31, 2005 and 2008. This is defined as a
non-recurring item within our credit facilities.
- (c)
- Represents
lease exit costs, employees' severance costs, and acquisitions costs.
- (d)
- Represents the write-off of property and equipment which is defined as a non-recurring item within our credit facilities.
- (12)
- We
define free cash flow as cash provided by operating activities less capital expenditures. Our management uses free cash flow, and we present it to
investors, because it is an important measure of the cash generation of our business and our ability to repay indebtedness and invest in our business. In 2008, we utilized substantially all of our
income tax net operating loss carryforwards which resulted in increased income tax payments in 2009.
- (13)
- We
define ACV as the aggregate value, on an annualized basis, of all recurring subscription contracts in effect on a reporting date. We included the value
of the JPMorgan online services agreement for purposes of calculating ACV, which amounted to $11.8 million for the year ended December 31, 2005. The contract terminated in April 2006 and
was therefore not included in ACV after April 2006. In 2009, we acquired $11.0 million of ACV from the acquisitions of Innovest and KLD.
- (14)
- We define recurring revenue as a percentage of total revenue as revenue from subscription contracts divided by total revenue during the applicable period.
Item 7. Management's Discussion and Analysis of Financial Condition and Results of Operations
Unless the context otherwise indicates or requires, as used in this Form 10-K, references to "we," "us," "our" or the "company" refer to RiskMetrics Group, Inc., and its subsidiaries. References to "RiskMetrics" refer only to our subsidiary, RiskMetrics Solutions, Inc. and its subsidiaries, references to "ISS" refer only to our subsidiary Institutional Shareholder Services, Inc. and its subsidiaries. In this Form 10-K, all dollar amounts are expressed in thousands, unless indicated otherwise. References to our "clients" include each business unit, division or wholly-owned subsidiary of a parent company which has entered into a separate customer contract with us.
The following discussion should be read in conjunction with our historical financial statements and the related notes included elsewhere in this Annual Report (the "Form 10-K"). This discussion contains forward-looking statements that are subject to known and unknown risks and uncertainties. Actual results and timing of events may differ significantly from those expressed or implied due to a number of factors, including those set forth in "Item 1A.—Risk Factors," and elsewhere in this annual report.
33
Overview
We are a leading provider of risk management and corporate governance products and services to participants in the global financial markets, as measured by revenues. Our products and services enable investors to measure and manage the market, credit, portfolio, governance, accounting, legal and environmental risks associated with their financial holdings. These offerings address multiple asset classes, markets and geographies to a broad group of market participants, including asset managers, hedge funds, pension funds, banks, insurance companies, financial advisors and corporations. Clients rely on us to better understand and manage risk of their financial holdings, to provide greater transparency to both their internal and external constituencies, to satisfy regulatory and reporting requirements and to make better investment decisions.
Our growth strategy is focused on the following:
- •
- increasing sales to existing clients by providing additional data, research, analytical products and processing services,
which we believe will be enhanced by leveraging our global sales force;
- •
- expanding our client base by further penetrating our markets, including expanding our global footprint and attracting new
clients, especially financial institutions which currently rely on internally developed risk management and proxy voting solutions; and
- •
- enhancing and extending our products and services, including the creation of new product and service offerings and by selectively pursuing acquisitions; while leveraging the economies of scale in our cost structure to grow revenues at a greater rate than operating expenses and thereby increase our operating margin.
We benefit from a number of favorable attributes of our business model. These attributes include:
Subscription-based revenue model: We sell our services primarily on an annual subscription basis and our recurring revenues accounted for approximately 92.7% of our total revenues during the year ended December 31, 2009. Our subscription model and historical renewal rates minimize volatility in our revenues and provide significant visibility for our future results. We consider our renewal rates to be fairly high but they are currently below historical levels as a result of the recent economic conditions and its impact on our customers in the financial services industry.
Leveragable cost structure: Because we provide our services from a common technology and data infrastructure, we benefit from economies of scale and we have generally been able to increase margins.
Favorable cash flow characteristics: Our subscription-based revenues and leveragable cost structure, combined with our working capital characteristics and low capital expenditure requirements, have historically allowed us to generate significant cash flow.
In evaluating our results, we focus on several key financial and operating data including ACV, renewal rates, sales to new customers, non-recurring revenues and Adjusted EBITDA (refer to definition below). Our ACV, which is described in detail below, is a leading indicator of our business and represents a large portion of our revenue in any given period. We track our revenue performance across geographies and product and service lines.
We expect to invest in our business to continue to grow our revenues. Compensation, data and technology infrastructure costs represent significant components of our operating expense structure. While we expect to increase our operating expenses over time to take advantage of market opportunities, we believe that the economies of scale in our operating model will allow us to grow our operating expenses at a lower rate than revenues and thereby increase our operating margins.
34
The vast majority of our business involves the sale of products and services to clients in the financial services industry, including asset managers, banks, insurance companies, hedge funds, pension funds as well as professional organizations that serve the financial services industry. The global financial markets have been adversely impacted by the current market environment that includes illiquidity, market volatility, widening credit spreads, changes in interest rates, currency exchange fluctuations and new legal and compliance requirements. These market conditions and the reduced business activity have had a negative impact on a number of our clients and could negatively impact our future revenues due to the potential for declining sales and renewal rates.
We do not believe that our liquidity has been affected by the recent events in the global financial markets. Refer to Liquidity and Capital Resources discussion.
Our Revenues
We generate a substantial majority of our revenues from annual subscriptions to our products and services, for which our clients generally pay us in advance. These contracts generally renew automatically on an annual basis. Our products and services are generally priced based on the access to our applications and services, including research, voting and reports purchased. We do not generally price our products and services based on our clients' assets under management ("AUM"). As a result, we are not directly subject to significant revenue fluctuations resulting from changes in our clients' AUM. Our experience has been that, over time, our clients have often added users and purchased additional products and services from us, which has led to increases in our revenues per client.
Revenues from subscription contracts are referred to as recurring revenues. Recurring revenues are generated through the renewal of existing contracts and the signing of new subscription contracts. For the year ended December 31, 2009, approximately 92.7% of our total revenues were generated from these subscription contracts. The subscription fees received from our clients are recorded as deferred revenues and recognized each month as our services are rendered. Our renewal rate, which was 82.6% for the year ended December 31, 2009, combined with our new subscription contracts, determine our ACV, which is a leading indicator of our recurring revenues. Our ACV as of December 31, 2009 was $282.5 million.
We also generate non-recurring revenue from sales of products and services without a subscription contract, which represented 7.3% of total revenues during the year ended December 31, 2009.
Annualized Contract Value ("ACV")
As a result of our subscription-based model and historically high renewal rates, at the end of any period, we generally have subscription contracts in place for a high percentage of our total revenues for the next 12 months. We monitor the contracted revenues from these agreements and refer to them as ACV. We define our ACV as the aggregate value on an annualized basis of all recurring subscription contracts in effect on a reporting date. Any revenues associated with subscription contracts that are entered into during a reporting period will be reflected in the ACV beginning at the end of that period. As a result, ACV at the end of any period is the ACV at the beginning of the period plus the annualized contract revenue associated with new subscription contracts signed during that period minus the annualized contract revenues associated with subscription contracts not renewed. ACV does not include any fees associated with any non-recurring revenues.
ACV is an important metric for our business. However, ACV may differ from our future reported revenues due to a number of factors, which include:
- •
- new subscription-based revenues;
- •
- additional one-time revenue;
35
- •
- changes in the contract value of our subscription contracts;
- •
- cancellations and non-renewals of subscription contracts; and
- •
- revenue recognition timing differences.
Our ACV for the RiskMetrics business and ISS business as of December 31, 2009, 2008 and 2007, as well as the percentage growth period over period is set forth, separately for each business, in the table below.
| |
As of December 31, | |||||||||
|---|---|---|---|---|---|---|---|---|---|---|
| |
2009 | 2008 | 2007 | |||||||
| |
(Amounts in thousands, except for percentages) |
|||||||||
RiskMetrics business annualized contract value |
$ | 158,517 | $ | 160,200 | $ | 131,716 | ||||
Percent (decline) increase |
(1.1 | )% | 21.6 | % | ||||||
ISS business annualized contract value(1)(2) |
$ | 123,962 | $ | 125,797 | $ | 118,522 | ||||
Percent (decline) increase |
(1.5 | )% | 6.1 | % | ||||||
- (1)
- ISS
ACV growth in 2007 was complemented by the acquisition of $15.9 million from CFRA on August 1, 2007.
- (2)
- Innovest was acquired on March 2, 2009 with $5.2 million of ACV and KLD was acquired on October 30, 2009 with $5.8 million of ACV, which is not included in ISS ACV as of December 31, 2008 or 2007. Innovest and KLD ACV does not include any contracts where fees are based on the clients' AUM, which at December 31, 2009 have approximately $1.3 million of annual revenue.
Current market conditions have led to foreign currency fluctuations, lower than average historical renewal rates and sales growth, which have caused ACV growth to decline.
Renewal Rate
Because non-renewals of subscription contracts decrease our ACV, which in turn decreases our revenues, a key operating metric is renewal rate. Our renewal rate for any period is defined as the amount of ACV that renews in a period divided by the amount of ACV with an expiration date during that period. If a client has a higher contract value upon renewal of its existing contract, the amount in excess of the prior period's contract is considered new contract revenue for purposes of this calculation.
The renewal rate for our RiskMetrics business and ISS business for the years ended December 31, 2009, 2008 and 2007 is set forth separately for each business in the table below.
| |
Year ended December 31, | |||||||||
|---|---|---|---|---|---|---|---|---|---|---|
| |
2009 | 2008 | 2007 | |||||||
RiskMetrics business renewal rate |
83.7 | % | 87.1 | % | 91.1 | % | ||||
ISS business renewal rate |
81.2 | % | 85.4 | % | 91.8 | % | ||||
The Risk renewal rate declined mainly due to higher non-renewals rates in the alternative investment segment as well as smaller decreases in the renewal rates in the asset management and bank segments. The ISS renewal rate declined primarily due to a decline in the proxy business renewal rate driven by budget constraints of clients, as well as lower renewal rates in Corporate Services and CFRA products.
36
Non-Recurring Revenues
Non-recurring revenues result from sales on a non-subscription basis. Non-recurring revenues for the RiskMetrics business and ISS business for the years ended December 31, 2009, 2008 and 2007 are set forth in the table below. Our non-subscription services include AUM fees, implementation, compensation advisory services and similar services and overages related to ISS' Proxy Research and Voting business. Revenues from implementation and AUM are recognized as the related subscription service is provided, some Compensation Advisory Services revenues are recognized over a three to four month period and other non-recurring revenues are recognized once the service is provided. To the extent that clients' actual usage of proxy voting services or proxy research reports exceeds contracted-for limits, the excess usage is considered to be an overage and clients are charged additional fees. Our clients' overages are typically an indication of larger proxy voting contract renewals.
| |
Year ended December 31, | |||||||||
|---|---|---|---|---|---|---|---|---|---|---|
| |
2009 | 2008 | 2007 | |||||||
RiskMetrics business percent non-recurring revenue |
1.6 | % | 1.6 | % | 2.4 | % | ||||
ISS business percent non-recurring revenue |
13.6 | % | 11.1 | % | 12.3 | % | ||||
Our Operating Costs and Expenses
Compensation expense represents a substantial majority of our expenses across all of our operating functions (57% of total operating expenses for the year ended December 31, 2009). Compensation expenses before stock-based compensation expense are comprised of base salary, bonuses, benefits, payroll taxes and sales commissions. While we expect compensation expense to increase over time, we believe that the economies of scale in our operating model will allow us to grow our compensation expenses at a lower rate than revenues.
Other significant operating expenses are data, proxy voting fees, occupancy, telecommunications and web hosting costs. Since we deliver our products and services using a common data and technology infrastructure, we expect these expenses to increase at less than the rate of revenue growth. Overall, our goal is to keep the rate of growth of these operating expenses below the rate of growth of our revenues. However, in order to take advantage of growth opportunities, we may invest in our business in order to support increased revenue growth. This might result in variability in our operating margin in the short term.
We allocate compensation expenses, including stock-based compensation expense, to our cost of revenues, sales and marketing, research and development and general and administrative expense categories based on the actual costs associated with each employee. Other costs associated with the employees, such as occupancy, travel and telecommunications, are included in the same cost categories as the corresponding employees. We allocate shared services to each segment based on revenue, usage or headcount. The following summarizes our significant operating expenses:
Costs of Revenues
Costs of revenues include costs related to production of proxy research and voting, web hosting, data, account management, implementation and systems operations and transactional foreign exchange gains and losses. Costs in this area consist primarily of staff compensation and related costs and payments to third party vendors, including third party web hosting and data providers.
Research and Development
Research and development expenses include costs related to product development, research technology, application design, technology infrastructure and analytics development. Costs in this area consist primarily of staff compensation costs and related expenses and consultant expenses.
37
Selling and Marketing
Selling and marketing expenses consist of costs related to our sales force, product management and marketing professionals. These costs include staff compensation costs and related expenses, including commissions and general marketing costs.
General and Administrative
General and administrative expenses consist of expenses for finance, administration, legal, accounting, human resources and information technology personnel. Costs in this area primarily consist of staff compensation and related expenses, legal costs, insurance costs, accounting fees and other professional services fees.
Depreciation and Amortization of Property and Equipment
Depreciation and amortization of property and equipment includes depreciation of internal-use software, computer and related equipment, furniture and fixtures and telecommunications equipment, which is recorded on a straight-line basis over the respective useful lives of the related assets. Depreciation and amortization of property and equipment also includes the amortization of leasehold improvements which are amortized over the shorter of the term of the lease or the assets' useful life.
Amortization of Intangible Assets
Amortization expense includes the amortization of finite life intangible assets such as acquired technology, customer relationships, trade names, license agreements, proprietary process and non-compete agreements, which are amortized over their estimated useful lives.
Critical Accounting Policies and Estimates
Our consolidated financial statements are prepared in conformity with accounting principles generally accepted in the United States. Our critical accounting policies, including the assumptions and judgments underlying them, require the application of significant judgment in the preparation of our financial statements, and as a result they are subject to a greater degree of uncertainty. In applying these policies, we use our judgment to determine the appropriate assumptions to be used in calculating estimates that affect the reported amounts of assets, liabilities, revenues and expenses. Estimates and assumptions are based on historical experience and on various other factors that are believed to be reasonable under the circumstances. Accordingly, actual results could differ from those estimates. Our critical accounting policies include the following:
Revenue Recognition
The majority of our revenues are generated from contracted annual subscriptions, for which we receive licensing fees from clients who utilize services. Depending on the service offering, the services are available through a variety of delivery options, including hosted web applications, fully—outsourced managed services, and local software installation. Revenues are recognized on a straight line basis over the term of the subscription period which is typically one year.
Revenue is recognized when all of the following conditions are met:
- •
- there is persuasive evidence of an arrangement;
- •
- the service has been provided to the customer;
- •
- the collection of the fees is reasonably assured; and
- •
- the amount of fees to be paid by the customer is fixed or determinable.
38
License fees associated with local software installations, for the RiskMetrics business, are recognized over the term of the license period, typically one year. The arrangement for local installation is a multiple-element arrangement that consists of software, post contract support (PCS) including unspecified upgrades and enhancements, and other service elements. Revenue is recognized ratably over the term of the license as there is no vendor-specific objective evidence of the fair value for PCS or the other service elements because they are not priced separately or sold separately to customers and there is no discernable pattern in which PCS and other services are expected to be performed.
The ISS business provides proxy advisory and voting services, corporate governance and financial research and analysis services to institutional investors and corporations. The majority of ISS's products and services are delivered through a web based platform and are typically provided through annual subscription agreements. Revenue is recognized ratably over the term of the subscription agreement. Many of ISS's subscription agreements are multiple element arrangements that provide for the delivery of more than one ISS product or service. Revenue is recognized on a straight-line basis over the term of the subscription as each of the services specified in these multiple element arrangements are performed continuously over the subscription term and there is no discernable pattern in which the services will be performed.
In situations where contracts include client acceptance provisions, we do not recognize revenue until such time as the client has confirmed its acceptance. Some of our subscription contracts include automatic renewal provisions under existing contract terms. Reserves for possible losses on subscription service, if any, are recognized when determined.
A portion of our revenues are derived from non-subscription services including implementation, Compensation Advisory Services and overages related to Proxy Research and Voting services. Revenues from implementation are recognized as the services are provided and other non-recurring revenues are recognized over the service period or upon delivery of the required service.
Goodwill and Intangibles
Goodwill, which consists of the excess of the purchase price over the fair value of identifiable net assets of businesses acquired, is evaluated for impairment using a two-step process that is performed at least annually on October 1 of each year, or whenever events or circumstances indicate that impairment may have occurred. The first step is a comparison of the fair value of the reporting unit with its carrying amount, including goodwill. If the fair value of the reporting unit exceeds its carrying value, goodwill of the reporting unit is not considered impaired and the second step is unnecessary. If the carrying value of the reporting unit exceeds its fair value, a second test is performed to measure the amount of impairment by comparing the carrying amount of the goodwill to a determination of the implied value of the goodwill. If the carrying amount of the goodwill is greater than the implied value, an impairment loss is recognized for the difference.
The implied value of goodwill is determined as of the test date by performing a purchase price allocation, as if the reporting unit had just been acquired, using currently estimated fair values of the individual assets and liabilities of the reporting unit, together with an estimate of the fair value of the reporting unit taken as a whole. The estimate of the fair value of the reporting unit is based upon information available regarding prices of similar groups of assets, or other valuation techniques including present value techniques based upon estimates of future cash flows.
Intangible assets, including acquired technology, customer relationships, certain trade names and non-compete agreements arising principally from acquisitions, are recorded at cost less accumulated amortization and are amortized using the straight line method over the estimated useful life. Intangible assets deemed to have indefinite useful lives are not amortized and are subject to an annual impairment tests or whenever events or circumstances indicate impairment may have occurred.
39
Impairment exists if the carrying value of the indefinite-lived intangible asset exceeds its fair value. For other intangible assets subject to amortization, impairment is recognized if the carrying amount is not recoverable and the carrying amount exceeds the fair value of the intangible asset.
As of December 31, 2009, we had goodwill and intangible assets of $461.6 million. During 2008, we recorded a non-cash impairment charge to goodwill and intangible assets totaling $160.1 million as a result of our annual goodwill and intangible asset impairment review. The impairment charge included a $154.2 million write-down to ISS goodwill primarily as a result of the negative equity market conditions which caused a material decline in industry market multiples in the second half of 2008. The fair value of the ISS reporting unit was determined using a combination of present value techniques, including a discounted cash flow, as well as fair values of comparable businesses. In addition, the 2008 impairment charge included a $5.9 million write-down to an ISS product tradename as a result of an integration plan for the tradename which reduced its expected life.
There are many assumptions and estimates that may directly impact the results of impairment testing, including market valuations of comparable companies, earnings multiples, estimate of future expected revenues, earnings and cash flows, and discount rates applied to such expected cash flows in order to estimate fair value. We have the ability to influence the outcome and ultimate results based on the assumptions and estimates we choose for testing. To mitigate undue influence, we set criteria that are reviewed and approved by various levels of management. The determination of whether or not goodwill or indefinite-lived acquired intangible assets have become impaired involves a significant level of judgment in the assumptions underlying the approach used to determine the value of our reporting unit. Changes in market valuations, earnings multiples and our strategy or market conditions could significantly impact these judgments and require adjustments to recorded amounts of intangible assets.
Stock-Based Compensation
All forms of share-based payments to employees, including employee stock options and employee stock purchase plans, are treated the same as any other form of compensation by recognizing the related cost in the statement of operations.
Stock-based compensation expense is measured at the grant date based on the fair value of the award, and the expense is recognized ratably over the award's vesting period. Prior to January 1, 2006 we recognized compensation for unvested awards under the graded vesting method and will continue to do so for such grants. For all grants made subsequent to December 31, 2005, we recognize compensation cost on a straight-line method over the vesting period.
We measure the fair value of stock options on the date of grant using a Black Scholes option-pricing model which requires the use of several estimates, including:
- •
- the volatility of our stock price;
- •
- the expected life of the option;
- •
- risk free interest rates; and
- •
- expected dividend yield.
Prior to the completion of our initial public offering in January 2008, we were not a publicly traded company, and as a result we had limited historical information on the price of our common stock. As a result, we could not solely rely on historical experience alone to develop assumptions for stock price volatility. As such, our stock price volatility also considered an estimated volatility with reference to a peer group of companies.
The expected life of options is based on internal studies of historical experience and projected exercise behavior. We estimate expected forfeitures of stock-based awards at the grant date and
40
recognize compensation cost only for those awards that are expected to vest. The forfeiture assumption is ultimately adjusted to the actual forfeiture rate. Estimated forfeitures are reassessed in each reporting period and may change based on new facts and circumstances. Therefore, changes in the forfeiture assumptions may impact the timing of the total amount of expense recognized over the vesting period. We utilize a risk-free interest rate, which is based on the yield of U.S. zero coupon securities with a maturity equal to the expected life of the options. We have not and do not expect to pay dividends on our common shares.
We recorded stock-based compensation expense of $9.0 million for the year ended December 31, 2009. The use of different assumptions in the Black-Scholes model would result in different amounts of stock-based compensation expense. Furthermore, if different assumptions are used in future periods, stock-based compensation expense could be materially impacted in the future.
Income Taxes
We record income taxes under the asset and liability method. Deferred tax assets and liabilities are recognized for the future tax consequences attributable to temporary differences between the financial statement carrying amounts of existing assets and liabilities and their respective tax bases. Deferred tax assets and liabilities are measured using enacted tax rates expected to apply to taxable income in the years in which the temporary differences are expected to be recovered or settled. To the extent needed, we record valuation allowances against deferred tax assets, if it determines it is not more likely than not that the assets will be utilized in the future.
The tax effects of an uncertain tax position taken or expected be taken in income tax returns are recognized only if it is "more likely-than-not" to be sustained on examination by the taxing authorities, based on its technical merits as of the reporting date. The tax benefits recognized in the financial statements from such a position are measured based on the largest benefit that has a greater than fifty percent likelihood of being realized upon ultimate settlement. We recognize the benefit of an uncertain tax position in the period when it is effectively settled. Evaluating the technical merits of a tax position and determining the benefit to be recognized involves a significant level of judgment in the assumptions underlying such evaluation. As of December 31, 2009, our unrecognized tax benefits totaled $1.9 million, and if such liability was reversed, it would favorably impact our effective tax rate.
Results of Operations
We operate in two segments, the "RiskMetrics business" and the "ISS business."
Factors Affecting the Comparability of Results
The financial results of CFRA, which was acquired on August 1, 2007, have been included in the results of our ISS business since the date of its acquisition. CFRA supplements the ISS business and supports the Financial Research and Analysis product and services offerings. The results of Innovest and KLD are not included in the results of our ISS business until the respective acquisition dates of March 2, 2009 and October 30, 2009. Innovest and KLD supplement the ISS business to support and expand the Environment, Social and Governance (ES&G) product and services offerings.
In 2008, we recorded a non-cash impairment charge to goodwill and intangible assets totaling $160.1 million as a result of our annual goodwill and intangible asset impairment review. The impairment charge includes a $154.2 million write-down to ISS goodwill primarily as a result of the negative equity market conditions which caused a material decline in industry market multiples in the second half of 2008. In addition, the impairment charge includes a $5.9 million write-down to an ISS product tradename as a result of an integration plan for the tradename which reduced its expected life. There was no impairment charge to goodwill or intangible assets for 2009.
41
In January 2008, we completed an initial public offering of 16,100,000 shares of common stock, which included 4,035,816 shares sold by selling stockholders and 2,100,000 shares sold by RiskMetrics Group to cover over-allotments, which was exercised in full in January 2008. We received net proceeds of $193.9 million from the offering. As such, weighted average common shares outstanding for the year ended December 31, 2008 includes 12,100,000 additional shares sold in the initial public offering. In addition, immediately prior to the completion of our initial public offering we granted each of our full-time employees an option to acquire 500 shares of our common stock, at an exercise price equal to the initial public offering price. Such grant resulted in stock-based compensation of $1.9 million being recorded for the year ended December 31, 2008.
In January 2008, we utilized a portion of proceeds from the initial public offering to prepay the entire outstanding indebtedness under the second lien loan, in the amount of $125.0 million. As a result of the prepayment we incurred $5.0 million in expenses during the year ended December 31, 2008, which were comprised of a $1.25 million debt prepayment penalty fee, a $2.4 million write-off of debt issuance costs and a $1.4 million loss on an interest rate swap settlement. Such costs have been included in interest, dividend, investment and other income (expense), net in the statement of operations for the year ended December 31, 2008.
Year ended December 31, 2009 compared to the year ended December 31, 2008
The following tables provide information with respect to our consolidated and segment operating results:
Consolidated RiskMetrics Group, Inc.
| |
Years Ended December 31, |
Increase (decrease) | ||||||||||||
|---|---|---|---|---|---|---|---|---|---|---|---|---|---|---|
| |
2009 | 2008 | $ | % | ||||||||||
| |
(Amounts in thousands, except percentages) |
|||||||||||||
Revenues |
$ | 303,361 | $ | 296,393 | $ | 6,968 | 2.4 | % | ||||||
Operating costs and expenses: |
||||||||||||||
Cost of revenues |
91,326 | 93,387 | (2,061 | ) | (2.2 | )% | ||||||||
Research and development |
43,456 | 41,593 | 1,863 | 4.5 | % | |||||||||
Selling and marketing |
29,521 | 33,202 | (3,681 | ) | (11.1 | )% | ||||||||
General and administrative(1) |
39,603 | 37,422 | 2,181 | 5.8 | % | |||||||||
Depreciation and amortization of property and equipment |
8,349 | 8,779 | (430 | ) | (4.9 | )% | ||||||||
Amortization of intangible assets |
23,441 | 21,758 | 1,683 | 7.7 | % | |||||||||
Impairment of goodwill and intangible asset |
— | 160,069 | (160,069 | ) | (100.0 | )% | ||||||||
Loss on disposal of property and equipment |
724 | 122 | 602 | * | % | |||||||||
Total operating costs and expenses(2) |
236,420 | 396,332 | (159,912 | ) | (40.3 | )% | ||||||||
Income (loss) from operations |
66,941 | (99,939 | ) | 166,880 | * | % | ||||||||
Interest, dividend and investment income (expense), net |
(20,255 | ) | (26,280 | ) | (6,025 | ) | (22.9 | )% | ||||||
Income (loss) before provision for income taxes |
46,686 | (126,219 | ) | 172,905 | * | % | ||||||||
Provision for income taxes |
15,560 | 10,700 | 4,860 | 45.4 | % | |||||||||
Net income (loss) |
$ | 31,126 | $ | (136,919 | ) | $ | 167,945 | * | % | |||||
- *
- Exceeds
100%
- (1)
- Includes
acquisition costs and lease exit costs of $2,217 and $465 for the years ended December 31, 2009 and 2008, respectively.
- (2)
- Includes stock-based compensation expenses of $9,015 and $9,893 for years ended December 31, 2009 and 2008, respectively.
42
RiskMetrics Business
| |
Years ended December 31, |
Increase (decrease) | ||||||||||||
|---|---|---|---|---|---|---|---|---|---|---|---|---|---|---|
| |
2009 | 2008 | $ | % | ||||||||||
| |
(Amounts in thousands, except percentages) |
|||||||||||||
Revenues |
$ | 158,691 | $ | 154,626 | $ | 4,065 | 2.6 | % | ||||||
Operating costs and expenses: |
||||||||||||||
Cost of revenues |
33,674 | 37,367 | (3,693 | ) | (9.9 | )% | ||||||||
Research and development |
29,016 | 27,235 | 1,781 | 6.5 | % | |||||||||
Selling and marketing |
14,989 | 17,408 | (2,419 | ) | (13.9 | )% | ||||||||
General and administrative |
20,003 | 19,162 | 841 | 4.4 | % | |||||||||
Depreciation and amortization of property and equipment |
4,437 | 4,624 | (187 | ) | (4.0 | )% | ||||||||
Amortization of intangible assets |
336 | 78 | 258 | * | % | |||||||||
Loss on disposal of property and equipment |
158 | — | 158 | 100 | % | |||||||||
Total operating costs and expenses(3) |
102,613 | 105,874 | (3,261 | ) | (3.1 | )% | ||||||||
Income from operations |
$ | 56,078 | $ | 48,752 | $ | 7,326 | 15.0 | % | ||||||
- *
- Exceeds
100%
- (3)
- Includes stock-based compensation expenses of $4,216 and $4,287 for years ended December 31, 2009 and 2008, respectively.
ISS Business
| |
Years ended December 31, |
Increase (decrease) | ||||||||||||
|---|---|---|---|---|---|---|---|---|---|---|---|---|---|---|
| |
2009 | 2008 | $ | % | ||||||||||
| |
(Amounts in thousands, except percentages) |
|||||||||||||
Revenues |
$ | 144,670 | $ | 141,767 | $ | 2,903 | 2.0 | % | ||||||
Operating costs and expenses: |
||||||||||||||
Cost of revenues |
57,652 | 56,020 | 1,632 | 2.9 | % | |||||||||
Research and development |
14,440 | 14,358 | 82 | 0.6 | % | |||||||||
Selling and marketing |
14,532 | 15,794 | (1,262 | ) | (8.0 | )% | ||||||||
General and administrative |
19,600 | 18,260 | 1,340 | 7.3 | % | |||||||||
Depreciation and amortization of property and equipment |
3,912 | 4,155 | (243 | ) | (5.8 | )% | ||||||||
Amortization of intangible assets |
23,105 | 21,680 | 1,425 | 6.6 | % | |||||||||
Impairment of goodwill and intangible asset |
— | 160,069 | (160,069 | ) | (100.0 | )% | ||||||||
Loss on disposal of property and equipment |
566 | 122 | 444 | * | % | |||||||||
Total operating costs and expenses(4) |
133,807 | 290,458 | (156,651 | ) | (53.9 | )% | ||||||||
Income (loss) from operations |
$ | 10,863 | $ | (148,691 | ) | $ | 159,554 | * | % | |||||
- *
- Exceeds
100%
- (4)
- Includes stock-based compensation expenses of $4,799 and $5,606 for years ended December 31, 2009 and 2008, respectively.
43
The following table provides information with respect to our revenues in certain geographic regions:
Consolidated RiskMetrics Group, Inc.
| |
Year ended December 31, 2009 |
Year ended December 31, 2008 |
|
|
|||||||||||||||
|---|---|---|---|---|---|---|---|---|---|---|---|---|---|---|---|---|---|---|---|
| |
Increase (decrease) | ||||||||||||||||||
| |
|
% of Total Revenue |
|
% of Total Revenue |
|||||||||||||||
Region
|
Revenue | Revenue | $ | % | |||||||||||||||
| |
(Amounts in thousands, except percentages) |
||||||||||||||||||
Americas |
$ | 180,300 | 59.4 | % | $ | 181,039 | 61.1 | % | $ | (739 | ) | (0.4 | )% | ||||||
Europe, Middle East and Africa |
105,701 | 34.8 | % | 98,028 | 33.1 | % | 7,673 | 7.8 | % | ||||||||||
Asia |
17,360 | 5.8 | % | 17,326 | 5.8 | % | 34 | 0.2 | % | ||||||||||
Total |
$ | 303,361 | 100.0 | % | $ | 296,393 | 100.0 | % | $ | 6,968 | 2.4 | % | |||||||
RiskMetrics Business
| |
Year ended December 31, 2009 |
Year ended December 31, 2008 |
|
|
|||||||||||||||
|---|---|---|---|---|---|---|---|---|---|---|---|---|---|---|---|---|---|---|---|
| |
Increase (decrease) | ||||||||||||||||||
| |
|
% of Total Revenue |
|
% of Total Revenue |
|||||||||||||||
Region
|
Revenue | Revenue | $ | % | |||||||||||||||
| |
(Amounts in thousands, except percentages) |
||||||||||||||||||
Americas |
$ | 70,646 | 44.5 | % | $ | 70,497 | 45.6 | % | $ | 149 | 0.2 | % | |||||||
Europe, Middle East and Africa |
76,992 | 48.5 | % | 73,105 | 47.3 | % | 3,887 | 5.3 | % | ||||||||||
Asia |
11,053 | 7.0 | % | 11,024 | 7.1 | % | 29 | 0.3 | % | ||||||||||
Total |
$ | 158,691 | 100.0 | % | $ | 154,626 | 100.0 | % | $ | 4,065 | 2.6 | % | |||||||
ISS Business
| |
Year ended December 31, 2009 |
Year ended December 31, 2008 |
|
|
|||||||||||||||
|---|---|---|---|---|---|---|---|---|---|---|---|---|---|---|---|---|---|---|---|
| |
Increase (decrease) | ||||||||||||||||||
| |
|
% of Total Revenue |
|
% of Total Revenue |
|||||||||||||||
Region
|
Revenue | Revenue | $ | % | |||||||||||||||
| |
(Amounts in thousands, except percentages) |
||||||||||||||||||
Americas |
$ | 109,654 | 75.8 | % | $ | 110,542 | 78.0 | % | $ | (888 | ) | (0.8 | )% | ||||||
Europe, Middle East and Africa |
28,709 | 19.8 | % | 24,923 | 17.6 | % | 3,786 | 15.2 | % | ||||||||||
Asia |
6,307 | 4.4 | % | 6,302 | 4.4 | % | 5 | 0.1 | % | ||||||||||
Total |
$ | 144,670 | 100.0 | % | $ | 141,767 | 100.0 | % | $ | 2,903 | 2.0 | % | |||||||
Set forth below is a discussion of our results for the year ended December 31, 2009 ("2009") compared to the year ended December 31, 2008 ("2008").
Revenues. Consolidated revenues for 2009 increased $7.0 million, or 2.4%, to $303.4 million from $296.4 million. The revenue increase was driven by a 2.6% increase in the RiskMetrics business and 2.0% increase in the ISS business. The 2009 acquisitions of Innovest in March and KLD in October contributed $6.7 million of revenue in 2009. In addition, revenue growth in 2009 compared to 2008 was negatively impacted by approximately $4.9 million due to unfavorable changes in foreign currency rates, primarily the strengthening of the US dollar exchange rate compared to the Euro and British Pound.
RiskMetrics revenues for 2009 increased $4.1 million, or 2.6%, to $158.7 million from $154.6 million. This was primarily due to 3.5% growth in RiskManager revenue due to demand for
44
regulatory reporting services primarily internationally, as EMEA revenue grew 5.3%, partially offset by increased non-renewals in the alternative investment market and negative currency effects.
ISS revenues for 2009 increased by $2.9 million, or 2.0%, to $144.7 million from $141.8 million. On a product level, total Governance Services (mainly Proxy Research and Voting Services) revenues of $92.4 million for 2009 decreased 2.2% from the prior year primarily due to a decrease in proxy research and voting revenues partially offset by an increase in Securities Class Action Service revenues. Financial Research and Analysis ("FR&A") revenues of $52.3 million for 2009 increased 10.9%, or $5.2 million, compared to prior year. The increase in FR&A revenue was primarily due to increased Corporate Advisory revenues and ES&G revenue, including the impact of acquisitions of Innovest and KLD, partially offset by a decline in CFRA revenue due to lower renewal rates.
Operating costs and expenses. Consolidated operating expenses for 2009 decreased 40.3% to $236.4 million from $396.3 million. The $159.9 million decrease in operating expenses was primarily due to a $160.1 million non-cash impairment charge for goodwill and an intangible asset in 2008. After excluding the $160.1 million impairment charge in 2008, operating expense growth in 2009 compared to 2008 was $0.2 million. The remaining $0.2 million increase in operating expenses was impacted by the following:
- •
- $4.6 million increase in compensation costs to $135.5 million due to increased salaries and benefits due
partially to the Innovest and KLD acquisitions, partially offset by a decline in commissions as a result of a decline in new sales and favorable changes in foreign exchange rates,
- •
- $1.4 million increase in technology costs due to increased web hosting, R&D consulting and maintenance,
- •
- $1.7 million increase in amortization expense due to intangibles acquired in connection with the Innovest and KLD
acquisitions,
- •
- $0.7 million loss on disposal of property and equipment in 2009 primarily as a result of the abandonment of an ISS software project due to a new product launch.
The above increases were partially offset by:
- •
- $3.0 million decrease in travel and entertainment due to lower travel and increased cost control,
- •
- $1.9 million decrease in professional fees, primarily due to reductions in accounting, Sarbanes-Oxley
Section 404 compliance costs and lower legal fees,
- •
- $1.0 million decrease in marketing costs, and
- •
- $2.6 million increase in foreign currency exchange transaction gains which amounted to a gain of $1.3 million in 2009 compared to a loss of $1.3 million in 2008.
RiskMetrics operating expenses for 2009 decreased 3.1% to $102.6 million from $105.9 million in the prior year primarily due to foreign currency exchange gains. As a percentage of revenues, RiskMetrics operating expenses decreased to 64.7% from 68.5%.
ISS operating expenses for 2009 decreased $156.7 million to $133.8 million from $290.5 million in the prior year primarily due to a $160.1 million non-cash impairment charge for goodwill and an intangible asset in 2008. After excluding the $160.1 million impairment charge in 2008, ISS operating expense growth in 2009 compared to 2008 was $3.4 million, or 2.6% primarily due to the acquisitions of Innovest and KLD.
Cost of revenues. Consolidated cost of revenues for 2009 decreased to $91.3 million, or 2.2%, from $93.4 million. The decrease in cost of revenues resulted primarily from increased foreign currency transaction gains of $2.6 million and decreases in travel and entertainment costs partially offset by increased compensation and web hosting costs. As a percentage of revenues, cost of revenues decreased to 30.1% from 31.5%.
45
RiskMetrics cost of revenues for 2009 decreased to $33.7 million, or 9.8%, from $37.4 million due to a $2.1 million increase in foreign currency transaction gains, reduced travel and entertainment costs of $1.2 million, partially offset by increased data and web hosting costs of $0.7 million. As a percentage of revenues, RiskMetrics cost of revenues decreased to 21.2% from 24.2%.
ISS cost of revenues for 2009 increased to $57.7 million, or 2.9% from $56.0 million. The increase was primarily due to increased compensation costs, including stock-based compensation of $2.8 million due in part to acquisitions partially offset by a $1.1 million decline in travel and entertainment costs. As a percentage of revenues, ISS cost of revenues increased to 39.9% from 39.5%.
Research and development expenses. Consolidated research and development expenses for 2009 increased to $43.5 million, or 4.5%, from $41.6 million primarily due to increased compensation costs of $2.8 million partially offset by a $0.4 million decline in stock based compensation and reduced travel and entertainment expenses. As a percentage of revenues, research and development expenses increased to 14.3% from 14.0%.
RiskMetrics research and development costs for 2009 increased to $29.0 million, or 6.5%, due primarily to increased compensation and consulting costs.
ISS research and development costs of $14.4 million remained consistent with prior year due to increased compensation costs offset by a corresponding decline in travel and entertainment expenses.
Selling and marketing expenses. Consolidated selling and marketing expenses for 2009 decreased to $29.5 million, or 11.1%, from $33.2 million. The $3.7 million decrease was primarily due to a $0.8 million decline in travel and entertainment expenses, a $1.0 million decrease in marketing costs and $0.5 million decline in commissions. As a percentage of revenues, selling and marketing expenses decreased to 9.7% from 11.2%.
RiskMetrics selling and marketing expenses for 2009 decreased to $15.0 million, or 13.9%, from $17.4 million. The decrease was primarily due to a $2.2 million decline in compensation costs as a result of a decline in commissions due to lower new sales.
ISS selling and marketing expenses for 2009 decreased to $14.5 million, or 8.0%, from $15.8 million. The decrease was primarily due to a $0.7 million decrease in marketing costs and $0.9 million decline in travel and entertainment expenses partially offset by increased compensation costs.
General and administrative expenses. Consolidated general and administrative expenses for 2009 increased to $39.6 million, or 5.8%, from $37.4 million. The $2.2 million increase in general and administrative costs was primarily due an increase of $1.8 million in employee severance, lease exit cots and professional fees related to the acquisitions of Innovest and KLD and increased compensation costs, including a $0.7 million increase in stock-based compensation expense partially offset by a $1.8 million decline in professional fees. As a percentage of revenues, general and administrative expenses increased to 13.1% from 12.6% due to transaction costs from acquisitions.
RiskMetrics general and administrative expenses for 2009 increased to $20.0 million, or 4.4%, from $19.2 million. The increase was primarily due to increased compensation costs, including stock-based compensation partially offset by a decline in professional fees for accounting and Sarbanes-Oxley Section 404 compliance costs.
ISS general and administrative expenses for 2009 increased to $19.6 million, or 7.3%, from $18.3 million. The $1.3 million increase was primarily due to $2.2 million of severance, lease exist costs and professional fees related to the KLD and Innovest acquisitions, partially offset by a decline in professional fees.
Depreciation and amortization of property and equipment. Depreciation and amortization of property and equipment for 2009 decreased $0.5 million to $8.3 million from $8.8 million due to a decline in capital expenditures.
46
Amortization of intangible assets. Amortization of intangible assets for 2009 increased $1.7 million to $23.4 million from $21.8 million primarily due to amortization of intangibles acquired in connection with the acquisitions of Innovest and KLD.
Loss on Disposal of Property and Equipment. Loss on disposal of property and equipment was $0.7 million in 2009 compared to $0.1 million in 2008. The loss recorded in 2009 was primarily due to a $0.4 million charge for the abandonment of an ISS software project due to a new product launch.
Interest, dividend and investment income (expense), net. Net interest, dividend and investment expense for 2009 decreased to $20.3 million from $26.3 million in 2008. The decrease in other expenses was mainly due to lower interest expense in 2009 and $5.0 million of debt repayment related costs incurred in 2008, which were comprised of a $1.25 million debt prepayment penalty fee, a $2.4 million write-off of debt issuance costs and a $1.4 million loss on an interest rate swap settlement.
Provision for income taxes. The provision for income taxes represents an effective tax rate of 33.3% for 2009 as compared to a negative effective rate of 8.5% for 2008. The Company recorded a $10.7 million provision for income taxes despite a pre-tax loss because the effective tax rate for 2008 does not include a tax benefit for the $154.2 million goodwill impairment as this impairment charge is not tax deductible. The effective rate also changed from 2008 partially due to increased tax credits and changes in unrecognized tax benefits.
Year ended December 31, 2008 compared to the year ended December 31, 2007
The following tables provide information with respect to our consolidated and segment operating results:
Consolidated RiskMetrics Group, Inc.
| |
Years Ended December 31, |
Increase (decrease) | ||||||||||||
|---|---|---|---|---|---|---|---|---|---|---|---|---|---|---|
| |
2008 | 2007 | $ | % | ||||||||||
| |
(Amounts in thousands, except percentages) |
|||||||||||||
Revenues |
$ | 296,393 | $ | 240,301 | 56,092 | 23.3 | % | |||||||
Operating costs and expenses: |
||||||||||||||
Cost of revenues |
93,387 | 77,317 | 16,070 | 20.8 | % | |||||||||
Research and development |
41,593 | 31,142 | 10,451 | 33.6 | % | |||||||||
Selling and marketing |
33,202 | 35,420 | (2,218 | ) | (6.3 | )% | ||||||||
General and administrative |
37,422 | 29,654 | 7,768 | 26.2 | % | |||||||||
Depreciation and amortization of property and equipment |
8,779 | 7,419 | 1,360 | 18.3 | % | |||||||||
Amortization of intangible assets |
21,758 | 19,145 | 2,613 | 13.6 | % | |||||||||
Impairment of goodwill and intangible asset |
160,069 | — | 160,069 | 100.0 | % | |||||||||
Loss on disposal of property and equipment |
122 | 734 | (612 | ) | (83.4 | )% | ||||||||
Total operating costs and expenses(1) |
396,332 | 200,831 | 195,501 | 97.3 | % | |||||||||
Income (loss) from operations |
(99,939 | ) | 39,470 | (139,409 | ) | * | % | |||||||
Interest, dividend and investment income (expense), net |
(26,280 | ) | (35,358 | ) | 9,078 | 25.7 | % | |||||||
Income (loss) before provision for income taxes |
(126,219 | ) | 4,112 | (130,331 | ) | * | % | |||||||
Provision for income taxes |
10,700 | 1,711 | 8,989 | * | % | |||||||||
Net income (loss) |
$ | (136,919 | ) | $ | 2,401 | $ | (139,320 | ) | * | % | ||||
- *
- Exceeds
100%
- (1)
- Includes stock-based compensation expenses of $9,893 and $6,033 for years ended December 31, 2008 and 2007, respectively.
47
RiskMetrics Business
| |
Years Ended December 31, |
Increase (decrease) | ||||||||||||
|---|---|---|---|---|---|---|---|---|---|---|---|---|---|---|
| |
2008 | 2007 | $ | % | ||||||||||
| |
(Amounts in thousands, except percentages) |
|||||||||||||
Revenues |
$ | 154,626 | $ | 121,126 | $ | 33,500 | 27.7 | % | ||||||
Operating costs and expenses: |
||||||||||||||
Cost of revenues |
37,367 | 30,103 | 7,264 | 24.1 | % | |||||||||
Research and development |
27,235 | 24,002 | 3,233 | 13.5 | % | |||||||||
Selling and marketing |
17,408 | 17,101 | 307 | 1.8 | % | |||||||||
General and administrative |
19,162 | 14,105 | 5,057 | 35.9 | % | |||||||||
Depreciation and amortization of property and equipment |
4,624 | 4,439 | 185 | 4.2 | % | |||||||||
Amortization of intangible assets |
78 | — | 78 | 100.0 | % | |||||||||
Loss on disposal of property and equipment |
— | 161 | (161 | ) | (100.0 | )% | ||||||||
Total operating costs and expenses(2) |
105,874 | 89,911 | 15,963 | 17.8 | % | |||||||||
Income from operations |
$ | 48,752 | $ | 31,215 | $ | 17,537 | 56.2 | % | ||||||
- (2)
- Includes stock-based compensation expenses of $4,287 and $3,383 for years ended December 31, 2008 and 2007, respectively.
ISS Business
| |
Years Ended December 31, |
Increase (decrease) | ||||||||||||
|---|---|---|---|---|---|---|---|---|---|---|---|---|---|---|
| |
2008 | 2007 | $ | % | ||||||||||
| |
(Amounts in thousands, except percentages) |
|||||||||||||
Revenues |
$ | 141,767 | $ | 119,175 | $ | 22,592 | 19.0 | % | ||||||
Operating costs and expenses: |
||||||||||||||
Cost of revenues |
56,020 | 47,214 | 8,806 | 18.7 | % | |||||||||
Research and development |
14,358 | 7,140 | 7,218 | * | % | |||||||||
Selling and marketing |
15,794 | 18,319 | (2,525 | ) | (13.8 | )% | ||||||||
General and administrative |
18,260 | 15,549 | 2,711 | 17.4 | % | |||||||||
Depreciation and amortization of property and equipment |
4,155 | 2,980 | 1,175 | 39.4 | % | |||||||||
Amortization of intangible assets |
21,680 | 19,145 | 2,535 | 13.2 | % | |||||||||
Impairment of goodwill and intangible asset |
160,069 | — | 160,069 | 100.0 | % | |||||||||
Loss on disposal of property and equipment |
122 | 573 | (451 | ) | (78.7 | )% | ||||||||
Total operating costs and expenses(3) |
290,458 | 110,920 | 179,538 | * | % | |||||||||
Income from operations |
$ | (148,691 | ) | $ | 8,255 | $ | (156,946 | ) | * | % | ||||
- *
- Exceeds
100%
- (3)
- Includes stock-based compensation expenses of $5,606 and $2,650 for year ended December 31, 2008 and 2007, respectively.
48
The following table provides information with respect to our revenues in certain geographic regions:
Consolidated RiskMetrics Group, Inc.
| |
Year ended December 31, 2008 |
Year ended December 31, 2007 |
|
|
|||||||||||||||
|---|---|---|---|---|---|---|---|---|---|---|---|---|---|---|---|---|---|---|---|
| |
Increase (decrease) | ||||||||||||||||||
| |
|
% of Total Revenue |
|
% of Total Revenue |
|||||||||||||||
Region
|
Revenue | Revenue | $ | % | |||||||||||||||
| |
(Amounts in thousands, except percentages) |
||||||||||||||||||
Americas |
$ | 181,039 | 61.1 | % | $ | 148,881 | 62.0 | % | $ | 32,158 | 21.6 | % | |||||||
Europe, Middle East and Africa |
98,028 | 33.1 | % | 75,430 | 31.4 | % | 22,598 | 30.0 | % | ||||||||||
Asia |
17,326 | 5.8 | % | 15,990 | 6.6 | % | 1,336 | 8.4 | % | ||||||||||
Total |
$ | 296,393 | 100.0 | % | $ | 240,301 | 100.0 | % | $ | 56,092 | 23.3 | % | |||||||
RiskMetrics Business
| |
Year ended December 31, 2008 |
Year ended December 31, 2007 |
|
|
|||||||||||||||
|---|---|---|---|---|---|---|---|---|---|---|---|---|---|---|---|---|---|---|---|
| |
Increase (decrease) | ||||||||||||||||||
| |
|
% of Total Revenue |
|
% of Total Revenue |
|||||||||||||||
Region
|
Revenue | Revenue | $ | % | |||||||||||||||
| |
(Amounts in thousands, except percentages) |
||||||||||||||||||
Americas |
$ | 70,497 | 45.6 | % | $ | 56,408 | 46.6 | % | $ | 14,089 | 25.0 | % | |||||||
Europe, Middle East and Africa |
73,105 | 47.3 | % | 54,666 | 45.1 | % | 18,439 | 33.7 | % | ||||||||||
Asia |
11,024 | 7.1 | % | 10,052 | 8.3 | % | 972 | 9.7 | % | ||||||||||
Total |
$ | 154,626 | 100.0 | % | $ | 121,126 | 100.0 | % | $ | 33,500 | 27.7 | % | |||||||
ISS Business
| |
Year ended December 31, 2008 |
Year ended December 31, 2007 |
|
|
|||||||||||||||
|---|---|---|---|---|---|---|---|---|---|---|---|---|---|---|---|---|---|---|---|
| |
Increase (decrease) | ||||||||||||||||||
| |
|
% of Total Revenue |
|
% of Total Revenue |
|||||||||||||||
Region
|
Revenue | Revenue | $ | % | |||||||||||||||
| |
(Amounts in thousands, except percentages) |
||||||||||||||||||
Americas |
$ | 110,542 | 78.0 | % | $ | 92,473 | 77.6 | % | $ | 18,069 | 19.5 | % | |||||||
Europe, Middle East and Africa |
24,923 | 17.6 | % | 20,764 | 17.4 | % | 4,159 | 20.0 | % | ||||||||||
Asia |
6,302 | 4.4 | % | 5,938 | 5.0 | % | 364 | 6.1 | % | ||||||||||
Total |
$ | 141,767 | 100.0 | % | $ | 119,175 | 100.0 | % | $ | 22,592 | 19.0 | % | |||||||
Set forth below is a discussion of our results for the year ended December 31, 2008 compared to the year ended December 31, 2007.
Revenues. Consolidated revenues for the year ended December 31, 2008 increased $56.1 million, or 23.3%, to $296.4 million from $240.3 million. Revenue growth was driven by a 27.7% increase in the RiskMetrics business and 19.0% increase in the ISS business. Revenue growth was also driven by a 21.6% increase in the Americas region and a 30.0% increase in the EMEA region driven by increased sales in both businesses in these regions.
49
RiskMetrics revenues for the year ended December 31, 2008 increased $33.5, or 27.7%, to $154.6 million from $121.1 million in the prior year. The $33.5 million increase in revenues was primarily due to a $30.9 million, or 29.6%, increase in revenues from our Market Risk products. The increase in revenues from Market Risk Products was due to a 34.4% increase in revenues from RiskManager due to strong sales of RiskManager to asset managers and hedge funds as they increased their outsourcing of risk reporting services. As a percentage of total RiskMetrics revenues, revenues from our Market Risk products and services increased to 87.4% from 86.0%. Revenue growth was also driven by a 25.0% increase in the Americas region and a 33.7% increase in the EMEA region driven by strong sales of RiskManager in these regions due to, among other things, increased investor demand and the need for financial services firms to comply with regulatory requirements.
ISS revenues for the year ended December 31, 2008 increased $22.6, or 19.0%, to $141.8 million from $119.2 million for the period from January 12, 2007 to December 31, 2007. During the period from January 1 to January 11, 2007, ISS recognized revenues of $3.3 million. Had these eleven days of revenue been included in the year ended December 31, 2007, revenue would have been $122.5 million, an increase of 15.7% as compared to the year ended December 31, 2008. The increase in revenues was primarily due to a $13.9 million increase in revenue from our Financial Research and Analysis products and services which increased from $34.8 million to $48.7 million, or 39.9%, due to a $9.5 million increase in CFRA revenue, which was acquired on August 1, 2007, and growth from our Corporate and Compensation Advisory Services, ES&G and M&A Edge products. Revenues from our Governance Services products increased 10.3% to $93.1 million from $86.8 million primarily due to increased revenue in proxy research services. Governance services revenue accounted for 65.7% of total revenue for the year ended December 31, 2008 compared to 70.8% in the prior year. Revenue growth was also driven by an approximate 20% increase in the both the Americas and EMEA region.
Operating costs and expenses. Consolidated operating expenses for the year ended December 31, 2008 increased $195.5 million, or 97.3% to $396.3 million from $200.8 million from the prior year. The $195.5 million increase in operating expenses was primarily due to a $160.1 million non-cash impairment charge for goodwill and an intangible asset. The remaining $35.4 million increase in operating expenses was due to increased compensation expenses of $15.8 million, increased stock-based compensation of $3.9 million, increased depreciation and amortization expense of $4.0 million as well as increased foreign currency expenses and increased travel, data, and occupancy costs to support revenue growth.
RiskMetrics operating expenses for the year ended December 31, 2008 increased $16.0 million, or 17.8% to $105.9 million from $89.9 million for the prior year. The increase was mainly due to increased compensation costs of $7.0 million related to higher headcount, bonus expenses and commission increases, increased data costs of $2.0 million, as well as increased foreign currency losses, web hosting costs, stock based compensation, accounting and insurance costs. As a percentage of revenues, operating expenses decreased to 68.5% from 74.2% due to increased economies of scale.
ISS operating expenses for the year ended December 31, 2008 increased $179.5 million to $290.5 million from $110.9 million from the period from January 12, 2007 to December 31, 2007. The increase in operating expenses was primarily due to a $160.1 million non-cash impairment charge for goodwill and intangible assets. The remaining $19.5 million increase in operating expenses was primarily due to an $8.8 million increase in compensation costs due to increased bonus expense and the full year inclusion of CFRA, increased depreciation and amortization expense of $3.7 million and increased stock based compensation expense of $3.0 million.
Cost of revenues. Consolidated cost of revenues for the year ended December 31, 2008 increased $16.1 million, or 20.8% to $93.4 million from $77.3 million from the prior year. The increase in cost of revenues resulted primarily from increased compensation and increased data costs. As a percentage of revenues, cost of revenues decreased to 31.5% from 32.2%.
50
RiskMetrics cost of revenues for the year ended December 31, 2008 increased $7.3 million, or 24.1% to $37.4 million from $30.1 million in the prior year. The increase was primarily due to increased compensation costs of $1.8 million, increased third- party data costs of $2.0 million, increased occupancy costs of $1.2 million, and increased telecommunication costs of $1.6 million. As a percentage of revenues, RiskMetrics cost of revenues decreased to 24.2% from 24.9% due to increased economics of scale.
ISS cost of revenues for the year ended December 31, 2008 increased $8.8 million, or 18.7% to $56.0 million from $47.2 million for the period from January 12, 2007 to December 31, 2007. The increase was primarily due to the full year inclusion of CFRA costs, increased compensation costs of $4.6 million and occupancy costs as well as increased stock-based compensation expense of $1.8 million. As a percentage of revenues, ISS cost of revenues decreased to 39.5% from 39.6%.
Research and development expenses. Consolidated research and development expenses for the year ended December 31, 2008 increased $10.5 million, or 33.6% to $41.6 million from $31.1 million from the prior year. As a percentage of revenues, research and development expenses increased to 14.0% from 12.9% primarily due to increased compensation costs, including increased stock-based compensation of $1.7 million and increased investment in research and development related to governance service products and platforms.
RiskMetrics research and development expenses for the year ended December 31, 2008 increased $3.2 million, or 13.5% to $27.2 million from $24.0 million from the prior year. The increase was primarily due to increased compensation costs of $1.1 million, increased occupancy cost of $1.0 million and increased stock based compensation expense of $0.4 million. As a percentage of revenues, research and development expenses decreased to 17.6% from 19.8%.
ISS research and development expenses for the year ended December 31, 2008 increased $7.2 million to $14.4 million from $7.1 million for the period from January 12, 2007 to December 31, 2007. The increase was primarily due to increased compensation costs of $4.2 million, occupancy costs and increased stock based compensation expense of $1.3 million. As a percentage of revenues, research and development expenses increased to 10.2% from 6.0% due to continued investment in enhancing the governance service products and platforms.
Selling and marketing expenses. Consolidated selling and marketing expenses for the year ended December 31, 2008 decreased $2.2 million, or 6.3% to $33.2 million from $35.4 million from the prior year. As a percentage of revenues, selling and marketing expenses decreased to 11.2% from 14.7% due to synergies achieved from the integration of the Company's global sales force and lower marketing expenses.
RiskMetrics selling and marketing expenses for the year ended December 31, 2008 increased 1.8% to $17.4 million from $17.1 million from the prior year. The increase was primarily due to increased commissions as a result of the increase in sales partially offset by a decline in marketing expenses.
ISS selling and marketing expenses for the year ended December 31, 2008 decreased $2.5 million, or 13.8% to $15.8 million from $18.3 million for the period from January 12, 2007 to December 31, 2007. The decrease was primarily due to a $2.1 million decline in compensation costs due to the global integration of the Company's sales forces as well as a decline in marketing expenses.
General and administrative expenses. Consolidated general and administrative expenses for the year ended December 31, 2008 increased $7.8 million, or 26.2% to $37.4 million from $29.7 million in the prior year. As a percentage of revenues, general and administrative expenses increased to 12.6% from 12.4% due to increased occupancy costs, increased compensation costs, stock based compensation expense and increased accounting, insurance and consulting costs as a result of being a public company.
51
RiskMetrics general and administrative expenses for the year ended December 31, 2008 increased $5.1 million, or 35.9% to $19.2 million from $14.1 million from the prior year. The increased was primarily due to increased stock based compensation expense, increased compensation costs and a $1.2 million increase in accounting, insurance and consulting costs as a result of being a public company.
ISS general and administrative expenses for the year ended December 31, 2008 increased $2.7 million, or 17.4% to $18.3 million from $15.5 million for the period from January 12, 2007 to December 31, 2007. The increase was primarily due to increased compensation costs and the full year inclusion of CFRA costs.
Depreciation and amortization of property and equipment. Depreciation and amortization of property and equipment for the year ended December 31, 2008 increased to $8.8 million from $7.4 million from the prior year. The increase was primarily due to an increase in capital expenditures for leasehold improvements and computer equipment to support the Company's increased headcount and facilities expansion.
Amortization of intangible assets. Amortization of intangible assets for year ended December 31, 2008 increased to $21.8 million from $19.1 million from the prior year primarily from our acquisition of CFRA on August 1, 2007 and purchase of an intangible asset in the fourth quarter of 2007.
Impairment of Goodwill and Intangible Asset. We recognized an impairment of goodwill and intangible asset charge in the amount of $160.1 million for the year ended December 31, 2008. The impairment charge includes a $154.2 million write-down to ISS goodwill primarily as a result of the negative equity market conditions which caused a material decline in industry market multiples in the second half of 2008. In addition, the impairment charge includes a $5.9 million write-down to an ISS product tradename as a result of an integration plan for the tradename which reduced its expected life.
Interest, dividend and investment income (expense), net. Net interest, dividend and investment expense for the year ended December 31, 2008 decreased to $26.3 million from $35.4 million from the prior year. This decrease in expense was due to decreased interest expense (net of amortization) and increased interest income as a result of reduced debt borrowings and increased cash balances during 2008. In January 2008, we utilized a portion of proceeds from the initial public offering to prepay the entire outstanding indebtedness under the second lien loan, in the amount of $125.0 million. As a result of the prepayment we incurred $5.0 million in expenses during the year ended December 31, 2008, which were comprised of a $1.25 million debt prepayment penalty fee, a $2.4 million write-off of debt issuance costs and a $1.4 million loss on an interest rate swap settlement.
Provision for income taxes. The provision for income taxes represents a negative effective tax rate of 8.5% for the year ended December 31, 2008 as compared to an effective rate of 41.6% for the comparable prior year period. The Company recorded a $10.7 million provision for income taxes despite a pre-tax loss because the effective tax rate for 2008 does not include a tax benefit for the $154.2 million goodwill impairment as this impairment charge is not tax deductible. The effective rate also changed partially due to a decrease in non-deductible stock-based compensation expense. Effective tax rates are subject to change based on the taxable income in all the jurisdictions in which we do business.
Liquidity and Capital Resources
At December 31, 2009, we had cash and cash equivalents of $226.6 million compared to $170.8 million at December 31, 2008. We believe our existing cash and cash equivalents, our cash flow from operating activities and borrowing capacity under our existing credit facilities will be sufficient to meet our anticipated cash needs for at least the next 12 months, during which time we expect to make approximately $6.0 million to $7.0 million of capital expenditures. Our future working capital
52
requirements will depend on many factors, including our revenue growth, debt service, accelerated debt pre-payments, future acquisitions of businesses and investments in our own business. To the extent our liquidity sources are insufficient to fund our future activities we may need to raise additional funding through a public or private equity or debt offering. No assurances can be given that additional financing will be available in the future or that if available, such financing will be on favorable terms.
Cash Flows
Cash flows from operating activities provided cash of $77.2 million in 2009, a decrease of $7.6 million from 2008. The decline in cash from operating activities was primarily due to an increase in income taxes paid in 2009 as the Company utilized substantially all available net operating losses in 2008 partially offset by increased net income before non-cash charges. Cash provided by operating activities for 2009 was $77.2 million primarily reflecting net income of $31.1 million, plus $31.8 million in depreciation and amortization (excluding amortization of debt issuance costs), $9.0 million in stock based compensation, a $6.5 million decrease in accounts receivable partially offset by a $4.2 million decline in deferred income taxes.
Cash provided by operating activities for 2008 was $84.8 million primarily reflecting net income, before a $160.1 million non-cash impairment charge, of $23.1 million, stock-based compensation of $9.9 million, depreciation and amortization (excluding amortization of debt issuance costs) of $30.5 million, a $10.0 million increase in accrued expenses, and a $11.2 million contribution from income taxes. Operating activities for 2007 provided cash of $45.3 million primarily reflecting net income of $2.4 million plus depreciation and amortization of $26.6 million, plus stock-based compensation of $6.0 million and $8.6 million from accounts receivable.
Investing activities in 2009 used cash of $31.9 million primarily due to the acquisitions of Innovest and KLD for $24.7 million, and $7.1 million for capital expenditures. Investing activities for 2008 used cash of $11.5 million, primarily due to capital expenditures of $8.8 million, the acquisition of Applied4 and a payment for an intangible asset. Investing activities for 2007 used cash of $468.5 million, primarily due to the acquisitions of ISS and CFRA, which included the net liquidation of investments that provided us $68.1 million of cash, as well as capital expenditures of $11.1 million.
Financing activities for 2009 provided cash of $8.1 million primarily from the exercise of stock options and related tax benefits of $10.3 million partially offset by $2.2 million in debt payments. Financing activities for 2008 provided cash of $74.4 million as a result of $197.4 million raised from our initial public offering and $5.9 million from stock option proceeds, $4.9 million of stock option tax benefits, partially offset by $132.1 million in debt payments and $1.6 million of equity offering expenses. Financing activities for 2007 provided cash of $413.6 million as a result of proceeds received from the incurrence of $440.0 million of indebtedness in connection with the ISS and CFRA acquisitions, partially offset by the repayment of $17.3 million in principal debt and $10.1 million in debt issuance costs.
Long Term Debt
The Company's debt is comprised of a term loan facility and a $25.0 million revolving credit facility. As of December 31, 2009, $288.4 million of debt remains outstanding under the first lien loan and no indebtedness is outstanding under the revolving credit facility.The maturity date of the first lien term loan is December 2013. The terms of the indebtedness include various covenant compliance requirements, including maintaining certain Adjusted EBITDA earning levels, as defined in our credit facilities. The Company has pledged substantially all of its assets as collateral against the debt. Amounts paid under the term loans may not be re-borrowed.
In February 2007, we entered into two interest-rate swap agreements to reduce interest rate risks and to manage interest expense. By entering into these agreements, we changed the fixed/variable
53
interest-rate mix of our debt portfolio. As of December 31, 2009, the interest rate swaps had notional amounts totaling $251.4 million and a fair value liability totaling $15.0 million. The agreements effectively convert our floating-rate debt into fixed-rate debt. This reduces our risk of incurring higher interest costs in periods of rising interest rates and increases our risk of paying higher interest costs in periods of decreasing interest rates. Our interest-rate swap agreements hedge a significant portion of the interest rate risk exposure under our indebtedness. The interest rate swap agreements increased our weighted average effective interest rate on the first lien term loan facility to 6.8% during the year ended December 31, 2009.
As of December 31, 2009, we were in compliance with our credit agreement and we are not aware of any future events or transactions that will impact such compliance.
Commitments
In addition to the indebtedness discussed above, we enter into routine operating lease obligations for our facilities and purchase obligations to operate our business. Our contractual commitments, including those related to our indebtedness, were comprised of the following as of December 31, 2009:
| |
Payments Due by Period | |||||||||||||||
|---|---|---|---|---|---|---|---|---|---|---|---|---|---|---|---|---|
Contractual Obligation
|
Total | Within 1 year | 1–3 years | 4–5 years | After 5 years | |||||||||||
Debt, including estimated interest |
$ | 365,629 | $ | 22,576 | $ | 44,548 | $ | 298,505 | $ | — | ||||||
Interest rate swaps |
14,982 | 9,815 | 5,167 | — | — | |||||||||||
Operating leases |
23,796 | 7,097 | 11,993 | 3,491 | 1,215 | |||||||||||
Data and web hosting agreements |
17,800 | 12,656 | 5,048 | 96 | — | |||||||||||
Deferred purchase price obligation(1) |
954 | 221 | 477 | 256 | — | |||||||||||
Total(2) |
$ | 423,161 | $ | 52,365 | $ | 67,233 | $ | 302,348 | $ | 1,215 | ||||||
- (1)
- Obligation
relates to prior acquisitions made by ISS.
- (2)
- Does not include $1.9 million of liabilities for uncertain tax liabilities. The timing of future cash flows associated with our liabilities for uncertain tax positions is highly uncertain and we are unable to make reasonably reliable estimates of the period of cash settlement with the respective taxing authorities.
Off-Balance Sheet Arrangements
We do not maintain any off-balance sheet arrangements, transactions, obligations or other relationships with unconsolidated entities that would be expected to have a material current or future impact upon our financial condition or results of operations.
Impact of Inflation
Our business may be significantly or adversely affected by inflation. Due to the high degree of competition in the marketplace, inflation rate increases might lead to an erosion of our profit margins.
Related Party Transaction
In May 2008, we entered into a contract for the sale of Market Risk products to Duff Capital Advisors, which was subsequently terminated. Philip Duff, a director of the Company, was the founder, CEO and General Partner of Duff Capital Advisors, but is no longer employed by that firm. The contract was entered into in the normal course of business on terms that we believe were consistent with (and not preferential to) those provided to our other clients. We recognized $0.3 million and
54
$0.7 million in revenue from the Duff Capital Advisors contract for the years ended December 31, 2009 and 2008, respectively.
Effects of Recently Issued Accounting Pronouncements
For a description of accounting changes and recent accounting pronouncement, including the expected dates of adoption and estimated effects, if any, on our consolidated financial statements, see Note 2, "Recent Accounting Pronouncements" in Item 8 of this Form 10-K.
Item 7A. Quantitative and Qualitative Disclosures About Market Risk
Our primary market risk exposure is interest rate risk associated with short and long-term debt bearing variable interest rates. To manage this interest rate risk exposure, we enter into interest rate swap agreements. We are also exposed to foreign currency risk, which can adversely affect our sales and operating profits. The following discussion should be read in conjunction with Note 10 of our consolidated financial statements appearing elsewhere in this Form 10-K, which provides further information on our derivative instruments.
Interest Rate Sensitivity
To reduce the exposure associated with our variable rate debt, we entered into two interest-rate swap agreements to reduce interest rate risks and to manage interest expense. By entering into these agreements, we change the fixed/variable interest-rate mix of our debt portfolio. As of December 31, 2009, the interest rate swaps had notional amounts totaling $251.4 million and a fair value liability totaling $15.0 million. The agreements effectively convert our floating-rate debt into fixed-rate debt. This reduces our risk of incurring higher interest costs in periods of rising interest rates. Our interest-rate swap agreements hedge a substantial majority of the interest rate risk exposure under our indebtedness. The interest rate swap agreements increased our weighted average effective interest rate to 6.8% during the year ended December 31, 2009. A hypothetical, instantaneous increase of one percentage point in the interest rates applicable to the variable interest rate debt would have increased our net interest expense for the year ended December 31, 2009 by approximately $0.4 million.
Exchange Rate Sensitivity
We have two separate exposures to currency fluctuation risk—subsidiaries outside the United States which use a foreign currency as their functional currency which are translated into U.S. dollars for consolidation of assets and liabilities and non-U.S. dollar invoiced revenues. Changes in foreign exchange rates for our subsidiaries that use a foreign currency as their functional currency are translated into U.S. dollars and result in cumulative translation adjustments, which are included in accumulated other comprehensive loss. At December 31, 2009, we had translation exposure to various foreign currencies including the Euro, Pounds Sterling, Canadian Dollar, and a limited number of other non-U.S. dollar currencies. The net potential loss resulting from a hypothetical 10% adverse change in quoted foreign currency exchange rates partially offset by a corresponding appreciation of the US dollar, as of December 31, 2009, amounts to $5.4 million.
We primarily invoice our clients in U.S. dollars; however, we also invoice a portion of our clients in Euro, Sterling, Canadian Dollar, Japanese Yen and a limited number of other non-U.S. dollar currencies. As such, the fluctuations in such currencies could impact our operating results
Item 8. Consolidated Financial Statements and Supplementary Data
The information required by this Item is set forth on page F-1 through F-42 of this Annual Report on Form 10-K.
55
Item 9. Changes in and Disagreements with Accountants on Accounting and Financial Disclosure
There were no changes in or disagreements on any matters of accounting principles or financial statement disclosure between us and our independent registered public accountants during our two most recent fiscal years.
Item 9A. Controls and Procedures
(a) Evaluation of Disclosure Controls and Procedures
As of the end of the period covered by this report, we carried out an evaluation, under the supervision and with the participation of our management, including our chief executive officer and chief financial officer, of the effectiveness of the design and operation of our disclosure controls and procedures, as such term is defined in Rules 13a-15(e) and 15d-15(e) of the Securities Exchange Act of 1934, as amended (the "Exchange Act"). Based upon that evaluation, our chief executive officer and chief financial officer concluded that as of the end of the period covered by this report our disclosure controls and procedures were effective to ensure that information required to be disclosed by us in reports we file or submit under the Exchange Act is (1) recorded, processed, summarized and reported within the time periods specified in SEC rules and forms, and (2) accumulated and communicated to our management, including our chief executive officer and chief financial officer, to allow timely decisions regarding required disclosure.
(b) Management's Report on Internal Control Over Financial Reporting
Management of RiskMetrics Group is responsible for establishing and maintaining adequate internal control over financial reporting as defined in Rules 13a-15(f) and 15d-15(f) under the Securities Exchange Act of 1934. The Company's internal control over financial reporting is a process designed to provide reasonable assurance regarding the reliability of financial reporting and the preparation of financial statements for external purposes in accordance with generally accounted accounting principles.
All internal control systems, no matter how well designed, have inherent limitations. Therefore, even those systems determined to be effective can provide only reasonable assurance with respect to financial statement preparation and presentation. Also, projections of any evaluation of effectiveness to future periods are subject to the risk that controls may become inadequate because of changes in conditions, or that the degree of compliance with the policies or procedures may deteriorate.
Management assessed the effectiveness of the Company's internal control over financial reporting as of December 31, 2009. In making this assessment, we used the criteria set forth by the Committee of Sponsoring Organizations of the Treadway Commission (COSO) in Internal Control—Integrated Framework. Based on our assessment, we determined that, as of December 31, 2009, the Company's internal control over financial reporting was effective based on those criteria.
Deloitte & Touche LLP, our independent registered public accounting firm, has performed an audit of the effectiveness of Company's internal control over financial reporting as of December 31, 2009, based on criteria established in Internal Control—Integrated Framework issued by the Committee of Sponsoring Organizations of the Treadway Commission (COSO). This audit is required to be performed in accordance with the standards of the Public Company Accounting Oversight Board (United States). Our independent auditors were given unrestricted access to all financial records and related data. The effectiveness of our internal control over financial reporting as of December 31, 2009 has been audited by Deloitte & Touche LLP, an independent registered public accounting firm, as stated in its attestation report which is included below.
(c) Changes in Internal Controls Over Financial Reporting
There were no changes in our internal controls over financial reporting during our fiscal quarter ended December 31, 2009 that have materially affected, or are reasonably likely to materially affect, our internal control over financial reporting.
56
REPORT OF INDEPENDENT REGISTERED PUBLIC ACCOUNTING FIRM
To
the Board of Directors and Stockholders of
RiskMetrics Group, Inc.
New York, New York
We have audited the internal control over financial reporting of RiskMetrics Group, Inc. and subsidiaries (the "Company") as of December 31, 2009, based on the criteria established in Internal Control—Integrated Framework issued by the Committee of Sponsoring Organizations of the Treadway Commission. The Company's management is responsible for maintaining effective internal control over financial reporting and for its assessment of the effectiveness of internal control over financial reporting, included in the accompanying Management's Report on Internal Control Over Financial Reporting. Our responsibility is to express an opinion on the Company's internal control over financial reporting based on our audit.
We conducted our audit in accordance with the standards of the Public Company Accounting Oversight Board (United States). Those standards require that we plan and perform the audit to obtain reasonable assurance about whether effective internal control over financial reporting was maintained in all material respects. Our audit included obtaining an understanding of internal control over financial reporting, assessing the risk that a material weakness exists, testing and evaluating the design and operating effectiveness of internal control based on the assessed risk, and performing such other procedures as we considered necessary in the circumstances. We believe that our audit provides a reasonable basis for our opinion.
A company's internal control over financial reporting is a process designed by, or under the supervision of, the company's principal executive and principal financial officers, or persons performing similar functions, and effected by the company's board of directors, management, and other personnel to provide reasonable assurance regarding the reliability of financial reporting and the preparation of financial statements for external purposes in accordance with generally accepted accounting principles. A company's internal control over financial reporting includes those policies and procedures that (1) pertain to the maintenance of records that, in reasonable detail, accurately and fairly reflect the transactions and dispositions of the assets of the company; (2) provide reasonable assurance that transactions are recorded as necessary to permit preparation of financial statements in accordance with generally accepted accounting principles, and that receipts and expenditures of the company are being made only in accordance with authorizations of management and directors of the company; and (3) provide reasonable assurance regarding prevention or timely detection of unauthorized acquisition, use, or disposition of the company's assets that could have a material effect on the financial statements.
Because of the inherent limitations of internal control over financial reporting, including the possibility of collusion or improper management override of controls, material misstatements due to error or fraud may not be prevented or detected on a timely basis. Also, projections of any evaluation of the effectiveness of the internal control over financial reporting to future periods are subject to the risk that the controls may become inadequate because of changes in conditions, or that the degree of compliance with the policies or procedures may deteriorate.
In our opinion, the Company maintained, in all material respects, effective internal control over financial reporting as of December 31, 2009, based on the criteria established in Internal Control—Integrated Framework issued by the Committee of Sponsoring Organizations of the Treadway Commission.
We have also audited, in accordance with the standards of the Public Company Accounting Oversight Board (United States), the consolidated financial statements and financial statement schedule as of and for the year ended December 31, 2009 of the Company and our report dated February 24, 2010, expressed an unqualified opinion on those financial statements and financial statement schedule.
/s/ Deloitte & Touche LLP
New
York, New York
February 24, 2010
57
None
The information required by Item 10 (Directors, Executive Officers, Corporate Governance and Section 16a), Item 11 (Executive Compensation), Item 12 (Security Ownership of Certain Beneficial Owners and Management and Related Stockholder Matters), Item 13 (Certain Relationships and Related Transactions, and Director Independence) and Item 14 (Principal Accounting Fees and Services) of this Annual Report on Form 10-K is incorporated by reference from our definitive Proxy Statement for our 2010 Annual Meeting of Stockholders which will be filed not later than 120 days after the close of our year ended December 31, 2009.
58
Item 15. Exhibits and Financial Statement Schedules
(a)(1.) Consolidated Financial Statements
The Index to Consolidated Financial Statements under Item 8 on page F-1 is incorporated herein by reference as the list of financial statements required as part of this report.
(a)(2.) Financial Statement Schedule
Schedule II—Valuation and Qualifying Accounts
| |
December 31, 2009, 2008 and 2007 | |||||||||||||||
|---|---|---|---|---|---|---|---|---|---|---|---|---|---|---|---|---|
Col. A
|
Col. B | Col. C | Col. D | Col. E | ||||||||||||
Description
|
Balance at beginning of the period |
Charged to costs and expenses |
Charged to other accounts |
Deductions | Balance at end of the period |
|||||||||||
| |
(Amounts in thousands) |
|||||||||||||||
Year Ended December 31, 2009 |
||||||||||||||||
Allowance for doubtful receivables |
583 | 364 | — | 487 | 460 | |||||||||||
Deferred tax asset valuation allowance |
590 | — | (33 | ) | — | 557 | ||||||||||
Year ended December 31, 2008 |
||||||||||||||||
Allowance for doubtful receivables |
405 | 516 | — | 338 | 583 | |||||||||||
Deferred tax asset valuation allowance |
119 | — | 471 | — | 590 | |||||||||||
Year ended December 31, 2007 |
||||||||||||||||
Allowance for doubtful receivables |
265 | 134 | 6 | — | 405 | |||||||||||
Deferred tax asset valuation allowance |
— | — | 119 | — | 119 | |||||||||||
59
(a)(3.) Exhibits
| Exhibit Number |
Description | ||
|---|---|---|---|
| 3.1 | Form of Second Amended and Restated Certificate of Incorporation* | ||
3.2 |
Form of Second Amended and Restated By-laws* |
||
4.1 |
Specimen Common Stock Certificate* |
||
10.1 |
First Lien Credit Agreement, dated as of January 11, 2007, among RiskMetrics Group Holdings, LLC, RiskMetrics Group, Inc., Bank of America, N.A. and the other lenders party thereto* |
||
10.2 |
First Lien Guaranty, dated as of January 11, 2007, among each of the subsidiaries of RiskMetrics Group Holdings, LLC listed on the schedules thereto and Bank of America, N.A.* |
||
10.3 |
First Lien Security Agreement, dated as of January 11, 2007, among RiskMetrics Group Holdings, LLC, the guarantors party thereto and Bank of America, N.A.* |
||
10.4 |
Registrant's 2007 Omnibus Incentive Compensation Plan* |
||
10.5 |
Registrant's 2004 Stock Option Plan* |
||
10.6 |
Registrant's 2000 Stock Option Plan* |
||
10.7 |
ISS Equity Incentive Plan* |
||
10.8 |
Second Amended and Restated Stockholders Agreement, dated as of January 11, 2007, between Registrant and the stockholders party thereto* |
||
10.9 |
Amended and Restated Investor Rights Agreement, dated as of January 11, 2007, between Registrant and the stockholders party thereto* |
||
10.10 |
Datafeed License Agreement, dated October 27, 2003, between ISS and ADP Investor Communications Services, Inc.* |
||
10.11 |
First Amendment to Datafeed License Agreement, dated as of January 3, 2005, between ISS and ADP Investor Communications Services, Inc.* |
||
10.12 |
Agreement and Plan of Merger by and among RiskMetrics Group, Inc., RMG Holdco, Inc., RMG Merger Sub, Inc., ISS Merger Sub, Inc., and Institutional Shareholder Services Holdings, Inc., dated as of October 31, 2006* |
||
21.1 |
Subsidiaries of RiskMetrics Group, Inc.** |
||
23.1 |
Consent of Deloitte & Touche LLP** |
||
31.1 |
Section 302 Certification of Principal Executive Officer** |
||
31.2 |
Section 302 Certification of Principal Financial Officer** |
||
32.1 |
Section 906 Certification of Principal Executive Officer** |
||
32.2 |
Section 906 Certification of Principal Financial Officer** |
||
- *
- Incorporated
by reference to the Company's Registration Statement on Form S-1 (File No. 333-146167).
- **
- Filed herewith.
60
Pursuant to the requirements of Section 13 or 15(d) of the Securities Act of 1934, the registrant has duly caused this report to be signed on its behalf by the undersigned; thereunto duly authorized this 24th day of February, 2010.
| RISKMETRICS GROUP, INC. | |||
By: |
/s/ M. ETHAN BERMAN M. Ethan Berman Chief Executive Officer |
||
Pursuant to the requirements of the Securities Act of 1934, this registration statement has been signed below by the following persons in the capacities and on the dates indicated.
Signature
|
Title
|
Date
|
||
|---|---|---|---|---|
| /s/ M. ETHAN BERMAN M. Ethan Berman |
Chief Executive Officer (Principal Executive Officer) |
February 24, 2010 | ||
/s/ DAVID M. OBSTLER David M. Obstler |
Chief Financial Officer (Principal Financial Officer) |
February 24, 2010 |
||
/s/ ERIC DANIELS Eric Daniels |
Global Controller (Principal Accounting Officer) |
February 24, 2010 |
||
/s/ LOVIDA COLEMAN, JR. Lovida Coleman, Jr. |
Director |
February 24, 2010 |
||
/s/ PHILIP DUFF Philip Duff |
Director |
February 24, 2010 |
||
/s/ STEPHANIE HANBURY-BROWN Stephanie Hanbury-Brown |
Director |
February 24, 2010 |
||
/s/ RENE M. KERN Rene M. Kern |
Director |
February 24, 2010 |
||
/s/ CHRISTOPHER MITCHELL Christopher Mitchell |
Director |
February 24, 2010 |
61
Signature
|
Title
|
Date
|
||
|---|---|---|---|---|
| /s/ FRANK NOONAN Frank Noonan |
Director | February 24, 2010 | ||
/s/ LYNN PAINE Lynn Paine |
Director |
February 24, 2010 |
||
/s/ THOMAS RENYI Thomas Renyi |
Director |
February 24, 2010 |
||
/s/ STEPHEN THIEKE Stephen Thieke |
Director |
February 24, 2010 |
||
/s/ ROBERT TRUDEAU Robert Trudeau |
Director |
February 24, 2010 |
62
Index to Consolidated Financial Statements
| |
Page | |
|---|---|---|
Consolidated Financial Statements as of December 31, 2009 and 2008 and for the Years Ended |
||
Report of Independent Registered Public Accounting Firm |
F-2 |
|
Consolidated Balance Sheets |
F-3 |
|
Consolidated Statements of Operations |
F-4 |
|
Consolidated Statements of Changes in Stockholders' Equity |
F-5 |
|
Consolidated Statements of Cash Flows |
F-7 |
|
Notes to Consolidated Financial Statements |
F-8 |
F-1
REPORT OF INDEPENDENT REGISTERED PUBLIC ACCOUNTING FIRM
To
the Board of Directors and Stockholders of
RiskMetrics Group, Inc.
New York, New York
We have audited the accompanying consolidated balance sheets of RiskMetrics Group, Inc. and subsidiaries (the "Company") as of December 31, 2009 and 2008, and the related consolidated statements of operations, changes in stockholders' equity, and cash flows for each of the three years in the period ended December 31, 2009. Our audits also included the financial statement schedule listed in the Index at Item 15(a)(2). These financial statements and financial statement schedule are the responsibility of the Company's management. Our responsibility is to express an opinion on the financial statements and financial statement schedule based on our audits.
We conducted our audits in accordance with the standards of the Public Company Accounting Oversight Board (United States). Those standards require that we plan and perform the audit to obtain reasonable assurance about whether the financial statements are free of material misstatement. An audit includes examining, on a test basis, evidence supporting the amounts and disclosures in the financial statements. An audit also includes assessing the accounting principles used and significant estimates made by management, as well as evaluating the overall financial statement presentation. We believe that our audits provide a reasonable basis for our opinion.
In our opinion, such consolidated financial statements present fairly, in all material respects, the financial position of RiskMetrics Group, Inc. and subsidiaries as of December 31, 2009 and 2008, and the results of their operations and their cash flows for each of the three years in the period ended December 31, 2009, in conformity with accounting principles generally accepted in the United States of America. Also, in our opinion, such financial statement schedule, when considered in relation to the basic consolidated financial statements taken as a whole, presents fairly, in all material respects, the information set forth therein.
We have also audited, in accordance with the standards of the Public Company Accounting Oversight Board (United States), the Company's internal control over financial reporting as of December 31, 2009, based on the criteria established in Internal Control—Integrated Framework issued by the Committee of Sponsoring Organizations of the Treadway Commission and our report dated February 24, 2010, expressed an unqualified opinion on the Company's internal control over financial reporting.
/s/ Deloitte & Touche LLP
New
York, New York
February 24, 2010
F-2
RISKMETRICS GROUP, INC.
CONSOLIDATED BALANCE SHEETS
DECEMBER 31, 2009 AND 2008
(In thousands, except share amounts)
| |
2009 | 2008 | |||||||
|---|---|---|---|---|---|---|---|---|---|
ASSETS |
|||||||||
CURRENT ASSETS: |
|||||||||
Cash and cash equivalents |
$ | 226,612 | $ | 170,799 | |||||
Accounts receivable—net |
38,534 | 42,319 | |||||||
Deferred tax assets |
839 | 2,092 | |||||||
Income taxes receivable |
10,139 | 4,562 | |||||||
Other receivables and prepaid expenses |
4,144 | 5,666 | |||||||
Total current assets |
280,268 | 225,438 | |||||||
Intangibles—net |
135,359 | 148,340 | |||||||
Goodwill |
326,247 | 308,613 | |||||||
Property and equipment—net |
14,042 | 15,400 | |||||||
Deferred financing costs |
4,188 | 5,227 | |||||||
Other assets |
2,036 | 1,995 | |||||||
TOTAL ASSETS |
$ | 762,140 | $ | 705,013 | |||||
LIABILITIES AND STOCKHOLDERS' EQUITY |
|||||||||
CURRENT LIABILITIES: |
|||||||||
Trade accounts payable |
$ | 3,337 | $ | 1,981 | |||||
Accrued expenses |
43,243 | 40,174 | |||||||
Debt—current portion |
2,966 | 2,224 | |||||||
Deferred revenue—current portion |
115,761 | 109,525 | |||||||
Other current liabilities |
221 | 211 | |||||||
Total current liabilities |
165,528 | 154,115 | |||||||
LONG-TERM LIABILITIES |
|||||||||
Debt |
285,430 | 288,395 | |||||||
Deferred tax liabilities |
29,891 | 31,405 | |||||||
Deferred revenue |
1,017 | 1,364 | |||||||
Other long-term liabilities |
18,621 | 26,567 | |||||||
Total liabilities |
500,487 | 501,846 | |||||||
COMMITMENTS AND CONTINGENCIES |
|||||||||
STOCKHOLDERS' EQUITY: |
|||||||||
Common stock, $.01 par value—200,000,000 authorized; 63,324,880 and 61,673,960 issued and 63,081,726 and 61,430,806 outstanding at December 31, 2009 and 2008, respectively |
633 | 617 | |||||||
Treasury stock—243,154 shares |
(579 | ) | (579 | ) | |||||
Additional paid-in capital |
451,110 | 431,781 | |||||||
Accumulated other comprehensive loss |
(9,240 | ) | (17,255 | ) | |||||
Accumulated deficit |
(180,271 | ) | (211,397 | ) | |||||
Total stockholders' equity |
261,653 | 203,167 | |||||||
TOTAL LIABILITIES AND STOCKHOLDERS' EQUITY |
$ | 762,140 | $ | 705,013 | |||||
See notes to consolidated financial statements.
F-3
RISKMETRICS GROUP, INC.
CONSOLIDATED STATEMENTS OF OPERATIONS
YEARS ENDED DECEMBER 31, 2009, 2008 AND 2007
(In thousands, except share and per share amounts)
| |
2009 | 2008 | 2007 | |||||||||
|---|---|---|---|---|---|---|---|---|---|---|---|---|
REVENUES |
$ | 303,361 | $ | 296,393 | $ | 240,301 | ||||||
OPERATING COSTS AND EXPENSES: |
||||||||||||
Cost of revenues |
91,326 | 93,387 | 77,317 | |||||||||
Research and development |
43,456 | 41,593 | 31,142 | |||||||||
Selling and marketing |
29,521 | 33,202 | 35,420 | |||||||||
General and administrative |
39,603 | 37,422 | 29,654 | |||||||||
Depreciation and amortization of property and equipment |
8,349 | 8,779 | 7,419 | |||||||||
Amortization of intangible assets |
23,441 | 21,758 | 19,145 | |||||||||
Impairment of goodwill and intangible asset |
— | 160,069 | — | |||||||||
Loss on disposal of property and equipment |
724 | 122 | 734 | |||||||||
Total operating costs and expenses(1) |
236,420 | 396,332 | 200,831 | |||||||||
INCOME (LOSS) FROM OPERATIONS |
66,941 | (99,939 | ) | 39,470 | ||||||||
INTEREST, DIVIDEND AND INVESTMENT INCOME (EXPENSE), NET: |
||||||||||||
Interest, dividend and investment income |
570 | 2,567 | 1,564 | |||||||||
Interest expense |
(20,825 | ) | (26,234 | ) | (36,922 | ) | ||||||
Other expenses |
— | (2,613 | ) | — | ||||||||
Total interest, dividend, investment and other income (expense), net |
(20,255 | ) | (26,280 | ) | (35,358 | ) | ||||||
INCOME (LOSS) BEFORE PROVISION FOR INCOME TAXES |
46,686 | (126,219 | ) | 4,112 | ||||||||
PROVISION FOR INCOME TAXES |
15,560 | 10,700 | 1,711 | |||||||||
NET INCOME (LOSS) |
$ | 31,126 | $ | (136,919 | ) | $ | 2,401 | |||||
INCOME (LOSS) PER SHARE: |
||||||||||||
Basic |
$ | 0.50 | $ | (2.28 | ) | $ | 0.05 | |||||
Diluted |
$ | 0.46 | $ | (2.28 | ) | $ | 0.04 | |||||
WEIGHTED AVERAGE NUMBER OF COMMON SHARES OUTSTANDING: |
||||||||||||
Basic |
62,020,616 | 59,970,438 | 46,380,175 | |||||||||
Diluted |
67,943,069 | 59,970,438 | 54,364,746 | |||||||||
- (1)
- Includes stock-based compensation expense of:
| |
2009 | 2008 | 2007 | |||||||
|---|---|---|---|---|---|---|---|---|---|---|
Cost of revenue |
$ | 2,848 | 3,614 | $ | 2,001 | |||||
Research and development |
2,432 | 2,877 | 1,199 | |||||||
Selling and marketing |
1,410 | 1,733 | 747 | |||||||
General and administrative |
2,325 | 1,669 | 2,086 | |||||||
Total stock-based compensation |
$ | 9,015 | 9,893 | $ | 6,033 | |||||
See notes to consolidated financial statements
F-4
RISKMETRICS GROUP, INC.
CONSOLIDATED STATEMENTS OF CHANGES IN STOCKHOLDERS' EQUITY
YEARS ENDED DECEMBER 31, 2009, 2008, AND 2007
(In thousands, except share amounts)
| |
Common Shares | |
|
|
|
|
|||||||||||||||||||
|---|---|---|---|---|---|---|---|---|---|---|---|---|---|---|---|---|---|---|---|---|---|---|---|---|---|
| |
|
|
Accumulated Other Comprehensive Loss |
|
|
||||||||||||||||||||
| |
Number of Shares Issued |
Amount | Treasury Stock |
Additional Paid-In Capital |
Accumulated Deficit |
Total Stockholders' Equity |
|||||||||||||||||||
BALANCE—January 1, 2007 |
52,859,460 | $ | 529 | $ | (103 | ) | $ | 130,765 | $ | (508 | ) | $ | (74,185 | ) | $ | 56,498 | |||||||||
Comprehensive income: |
|||||||||||||||||||||||||
Net income |
— | — | — | — | — | 2,401 | 2,401 | ||||||||||||||||||
Foreign currency translation adjustment |
— | — | — | — | (353 | ) | — | (353 | ) | ||||||||||||||||
Unrealized loss on cash flow hedge, net of deferred tax benefit of $4,585 |
— | — | — | — | (6,405 | ) | — | (6,405 | ) | ||||||||||||||||
Change in unrealized loss on investments |
— | — | — | — | 4 | — | 4 | ||||||||||||||||||
Total comprehensive loss |
— | — | — | — | — | — | (4,353 | ) | |||||||||||||||||
Retirement of outstanding treasury stock |
(10,329,405 | ) | (103 | ) | 103 | — | — | — | — | ||||||||||||||||
Common shares issued upon exercise of options |
1,538,133 | 15 | — | 5,929 | — | — | 5,944 | ||||||||||||||||||
Tax benefit associated with exercise of stock options |
— | — | — | 201 | — | — | 201 | ||||||||||||||||||
Stock-based compensation |
— | — | — | 6,033 | — | — | 6,033 | ||||||||||||||||||
Common shares issued in connection with acquisition of ISS (see Note 3) |
2,774,351 | 28 | — | 42,398 | — | — | 42,426 | ||||||||||||||||||
Options exchanged in connection with acquisition of ISS (see Note 3) |
— | — | — | 16,331 | — | — | 16,331 | ||||||||||||||||||
Uncertain tax positions (impact of adoption) |
— | — | — | — | — | (365 | ) | (365 | ) | ||||||||||||||||
Common shares issued in connection with the acquisition of CFRA (see Note 3) |
1,008,113 | 10 | — | 16,624 | — | — | 16,634 | ||||||||||||||||||
Stock repurchased |
— | — | (2 | ) | (926 | ) | — | (2,329 | ) | (3,257 | ) | ||||||||||||||
BALANCE—December 31, 2007 |
47,850,652 | $ | 479 | $ | (2 | ) | $ | 217,355 | $ | (7,262 | ) | $ | (74,478 | ) | $ | 136,092 | |||||||||
Comprehensive loss: |
|||||||||||||||||||||||||
Net loss |
— | — | — | — | — | (136,919 | ) | (136,919 | ) | ||||||||||||||||
Foreign currency translation adjustment |
— | — | — | — | (3,048 | ) | — | (3,048 | ) | ||||||||||||||||
Net unrealized loss on cash flow hedge, net of deferred tax benefit of $4,376 |
— | — | — | — | (6,945 | ) | — | (6,945 | ) | ||||||||||||||||
Total comprehensive loss |
— | — | — | — | — | — | (146,912 | ) | |||||||||||||||||
Common shares issued upon exercise of options |
1,611,358 | 16 | — | 5,901 | — | — | 5,917 | ||||||||||||||||||
Tax benefit associated with exercise of stock options |
— | — | — | 4,861 | — | — | 4,861 | ||||||||||||||||||
Stock-based compensation |
— | — | — | 9,893 | — | — | 9,893 | ||||||||||||||||||
Issuance of common stock |
147,766 | 1 | — | (1 | ) | — | — | — | |||||||||||||||||
Common shares recovered in connection with the acquisition of CFRA (Note 3) |
— | — | (577 | ) | — | — | — | (577 | ) | ||||||||||||||||
Net proceeds from equity offering (Note 4) |
12,064,184 | 121 | — | 193,772 | — | — | 193,893 | ||||||||||||||||||
BALANCE—December 31, 2008 |
61,673,960 | 617 | (579 | ) | 431,781 | (17,255 | ) | (211,397 | ) | 203,167 | |||||||||||||||
F-5
RISKMETRICS GROUP, INC.
CONSOLIDATED STATEMENTS OF CHANGES IN STOCKHOLDERS' EQUITY (Continued)
YEARS ENDED DECEMBER 31, 2009, 2008, AND 2007
(In thousands, except share amounts)
| |
Common Shares | |
|
|
|
|
||||||||||||||||
|---|---|---|---|---|---|---|---|---|---|---|---|---|---|---|---|---|---|---|---|---|---|---|
| |
|
|
Accumulated Other Comprehensive Loss |
|
|
|||||||||||||||||
| |
Number of Shares Issued |
Amount | Treasury Stock |
Additional Paid-In Capital |
Accumulated Deficit |
Total Stockholders' Equity |
||||||||||||||||
Comprehensive income: |
||||||||||||||||||||||
Net income |
— | — | — | — | — | 31,126 | 31,126 | |||||||||||||||
Foreign currency translation adjustment |
— | — | — | — | 3,229 | — | 3,229 | |||||||||||||||
Net unrealized gain on cash flow hedge, net of deferred tax of $2,544 |
— | — | — | — | 4,786 | — | 4,786 | |||||||||||||||
Total comprehensive income |
— | — | — | — | — | — | 39,141 | |||||||||||||||
Common shares issued upon exercise of options (Note 14) |
1,540,036 | 15 | — | 6,127 | — | — | 6,142 | |||||||||||||||
Tax benefit associated with exercise of stock options |
— | — | — | 4,188 | — | — | 4,188 | |||||||||||||||
Stock-based compensation |
— | — | — | 9,015 | — | — | 9,015 | |||||||||||||||
Issuance of common stock (Note 14) |
110,884 | 1 | — | (1 | ) | — | — | — | ||||||||||||||
BALANCE—December 31, 2009 |
63,324,880 | $ | 633 | $ | (579 | ) | $ | 451,110 | $ | (9,240 | ) | $ | (180,271 | ) | $ | 261,653 | ||||||
| |
2009 | 2008 | 2007 | |
|
|
|
||||||||||||||||
|---|---|---|---|---|---|---|---|---|---|---|---|---|---|---|---|---|---|---|---|---|---|---|---|
Disclosure of realized loss: |
|||||||||||||||||||||||
Unrealized loss on cash flow hedge |
$ | (2,052 | ) | $ | (10,474 | ) | $ | (6,058 | ) | ||||||||||||||
Realized gain (loss) for cash flow hedge settlement, net of tax benefit (Note 10) |
(6,838 | ) | (3,529 | ) | 347 | ||||||||||||||||||
Net unrealized gain (loss) on cash flow hedge |
$ | 4,786 | $ | (6,945 | ) | $ | (6,405 | ) | |||||||||||||||
See notes to consolidated financial statements.
F-6
RISKMETRICS GROUP, INC.
CONSOLIDATED STATEMENTS OF CASH FLOWS
YEARS ENDED DECEMBER 31, 2009, 2008, AND 2007
(Amounts in thousands)
| |
2009 | 2008 | 2007 | |||||||||||
|---|---|---|---|---|---|---|---|---|---|---|---|---|---|---|
CASH FLOWS FROM OPERATING ACTIVITIES: |
||||||||||||||
Net income (loss) |
$ | 31,126 | $ | (136,919 | ) | $ | 2,401 | |||||||
Adjustments to reconcile net income (loss) to net cash provided by operating activities: |
||||||||||||||
Depreciation and amortization of property and equipment |
8,349 | 8,779 | 7,419 | |||||||||||
Provision for bad debt |
364 | 516 | 140 | |||||||||||
Amortization of intangible assets |
23,441 | 21,758 | 19,145 | |||||||||||
Amortization and write-off of debt issuance costs |
1,039 | 3,450 | 1,397 | |||||||||||
Impairment of goodwill and intangible asset |
— | 160,069 | — | |||||||||||
Stock-based compensation |
9,015 | 9,893 | 6,033 | |||||||||||
Excess tax benefit associated with exercise of stock options |
(4,188 | ) | (4,861 | ) | (201 | ) | ||||||||
Loss on disposal of property and equipment |
724 | 122 | 734 | |||||||||||
Decrease (increase) in deferred tax benefit |
(910 | ) | 2,294 | (1,115 | ) | |||||||||
Changes in assets and liabilities (net of acquisitions): |
||||||||||||||
Decrease (increase) in accounts receivable |
6,504 | (8,177 | ) | 8,599 | ||||||||||
Decrease (increase) in other receivables and prepaid expenses |
1,805 | 192 | (934 | ) | ||||||||||
Increase in other assets |
(73 | ) | (329 | ) | (88 | ) | ||||||||
Increase (decrease) in deferred revenue |
1,618 | 10,863 | (4,370 | ) | ||||||||||
(Decrease) increase in income and deferred taxes |
(3,272 | ) | 11,211 | 2,561 | ||||||||||
Increase (decrease) in trade accounts payable |
1,076 | (4,029 | ) | 2,631 | ||||||||||
Increase in other accrued expenses and liabilities |
589 | 10,016 | 996 | |||||||||||
Net cash provided by operating activities |
77,207 | 84,848 | 45,348 | |||||||||||
CASH FLOWS FROM INVESTING ACTIVITIES: |
||||||||||||||
Purchase of property and equipment |
(7,107 | ) | (8,795 | ) | (11,091 | ) | ||||||||
Cash paid to acquire Institutional Shareholder Services Inc. ("ISS") and related acquisition costs (net of cash acquired) |
— | — | (471,764 | ) | ||||||||||
Payment of acquisition related costs incurred by ISS |
— | — | (7,413 | ) | ||||||||||
Cash paid to acquire CFRA and related acquisition costs (net of cash acquired) |
— | 223 | (45,946 | ) | ||||||||||
Cash paid to acquire Applied4 |
— | (1,860 | ) | — | ||||||||||
Cash paid to acquire Innovest (net of cash acquired) |
(14,806 | ) | — | — | ||||||||||
Cash paid to acquire KLD (net of cash acquired) |
(9,878 | ) | — | — | ||||||||||
Payment of deferred purchase price |
(143 | ) | (103 | ) | (128 | ) | ||||||||
Purchase of intangible asset |
— | (1,000 | ) | (250 | ) | |||||||||
Purchase of investments |
— | — | (21,289 | ) | ||||||||||
Proceeds from sale of investments |
— | — | 89,364 | |||||||||||
Net cash used in investing activities |
(31,934 | ) | (11,535 | ) | (468,517 | ) | ||||||||
CASH FLOWS FROM FINANCING ACTIVITIES: |
||||||||||||||
Proceeds from debt borrowings |
— | — | 440,000 | |||||||||||
Repayment of debt |
(2,224 | ) | (132,131 | ) | (17,250 | ) | ||||||||
Payment of debt issuance costs |
— | — | (10,074 | ) | ||||||||||
Principal payments on capital lease obligations |
— | (26 | ) | (23 | ) | |||||||||
Gross proceeds from equity offering (Note 4) |
— | 197,400 | — | |||||||||||
Equity offering expenses |
— | (1,581 | ) | (1,928 | ) | |||||||||
Excess tax benefit associated with exercise of stock options |
4,188 | 4,861 | 201 | |||||||||||
Proceeds from exercise of stock options |
6,142 | 5,917 | 5,944 | |||||||||||
Repurchase of stock |
— | — | (3,257 | ) | ||||||||||
Net cash provided by financing activities |
8,106 | 74,440 | 413,613 | |||||||||||
EFFECT OF EXCHANGE RATE CHANGES ON CASH |
2,434 | (4,409 | ) | (302 | ) | |||||||||
NET INCREASE (DECREASE) IN CASH AND CASH EQUIVALENTS |
55,813 | 143,344 | (9,858 | ) | ||||||||||
CASH AND CASH EQUIVALENTS—Beginning of year |
170,799 | 27,455 | 37,313 | |||||||||||
CASH AND CASH EQUIVALENTS—End of year |
$ | 226,612 | 170,799 | $ | 27,455 | |||||||||
SUPPLEMENTAL DISCLOSURES OF CASH FLOW INFORMATION: |
||||||||||||||
Cash paid for interest |
$ | 17,443 | $ | 22,475 | $ | 35,973 | ||||||||
Cash paid (refunded) for taxes |
$ | 19,375 | $ | (3,609 | ) | $ | (50 | ) | ||||||
NON CASH INVESTING AND FINANCING ACTIVITIES: |
||||||||||||||
Issuance of common stock to purchase ISS |
$ | — | $ | — | $ | 42,426 | ||||||||
Issuance of stock options to purchase ISS |
$ | — | $ | — | $ | 16,331 | ||||||||
Retirement of treasury stock |
$ | — | $ | — | $ | 103 | ||||||||
Tax benefit associated with exercise of ISS stock options |
$ | 364 | $ | 631 | $ | 3,463 | ||||||||
Issuance of common stock to purchase CFRA |
$ | — | $ | (577 | ) | $ | 16,634 | |||||||
See notes to consolidated financial statements.
F-7
RISKMETRICS GROUP, INC.
NOTES TO CONSOLIDATED FINANCIAL STATEMENTS
YEARS ENDED DECEMBER 31, 2009, 2008, AND 2007
(Amounts in thousands, except share and per share amounts)
1. OVERVIEW AND BASIS OF PRESENTATION
RiskMetrics Group, Inc. ("the Company" or "RMG") is a provider of risk management and corporate governance products and services to participants in the global financial markets. The Company's products and services enable its clients to better understand and manage the risks associated with their financial holdings, provide greater transparency to their internal and external constituencies, satisfy regulatory and reporting requirements and make more informed investment decisions. The Company provides its products and services across multiple asset classes, markets and geographies to a diverse client base including asset managers, hedge funds, pension funds, banks, insurance companies, financial advisors and corporations. The Company operates in two business segments, the "RiskMetrics business" and the "ISS business".
Reorganization—RiskMetrics Solutions, Inc., a Delaware corporation, was formed in June 1998. In January 2007, the Company, which was formed by RiskMetrics Solutions, Inc., (i) completed a corporate reorganization in which all of RiskMetrics Solutions, Inc.'s then-outstanding capital stock automatically was converted into and exchanged for capital stock of the Company and (ii) acquired Institutional Shareholder Services Holdings, Inc. ("ISS") for approximately $542.8 million in order to increase the scale and scope of the Company's risk management products and services. ISS provides proxy research, voting recommendations, and governance advisory services to financial institutions and corporations worldwide. ISS institutional and corporate clients are located throughout North America, Europe, Asia, and Australia. ISS analyzes proxy issues, issues research, and provides vote recommendations for companies across markets worldwide. Additionally, ISS provides services in the areas of Taft-Hartley proxy research and voting, social investment proxy research, voting and portfolio screening, global proxy distribution, and securities class action services.
Principles of Consolidation and Basis of Presentation—The consolidated financial statements include the accounts of RMG and its wholly owned-subsidiaries which are prepared in accordance with accounting principles generally accepted in the United States of America ("U.S. GAAP"). All intercompany accounts and transactions have been eliminated in consolidation.
2. SIGNIFICANT ACCOUNTING POLICIES AND RECENT ACCOUNTING PRONOUNCEMENTS
Management Estimates and Assumptions—The preparation of consolidated financial statements in conformity with U.S. GAAP requires management to make estimates, judgments and assumptions that affect the reported amounts of assets and liabilities and disclosure of contingent assets and liabilities at the date of the consolidated financial statements and the reported amounts of revenues and expenses during the reporting period. Significant estimates and assumptions made by management include the deferral and recognition of revenue, impairment of goodwill and intangible assets, the fair value of acquired assets and liabilities, stock-based compensation, gains or losses on derivative instruments, accounting for income taxes and other matters that affect the consolidated financial statements and related disclosures.
Foreign Currency Translation—The Company has foreign subsidiaries where the functional currency has been determined to be the local currency. Assets and liabilities are translated using end of period exchange rates; revenues, expenses, and cash flows are translated using average rates of exchange. These currency translation effects are accumulated as part of other comprehensive income in stockholders' equity. Gains and losses from foreign currency transactions are included in the
F-8
RISKMETRICS GROUP, INC.
NOTES TO CONSOLIDATED FINANCIAL STATEMENTS (Continued)
YEARS ENDED DECEMBER 31, 2009, 2008, AND 2007
(Amounts in thousands, except share and per share amounts)
2. SIGNIFICANT ACCOUNTING POLICIES AND RECENT ACCOUNTING PRONOUNCEMENTS (Continued)
consolidated statements of operations. Translation gains and losses related to long-term and permanently invested intercompany balances are recorded in accumulated other comprehensive income. The Company does not engage in foreign currency hedging.
Cash and Cash Equivalents—The Company considers all highly liquid securities with original maturities of three months or less when purchased to be cash equivalents.
Goodwill and Intangible Assets—Goodwill consists of the excess of the purchase price over the fair value of identifiable net assets of businesses acquired. Goodwill is not amortized and is evaluated for impairment using a two-step process that is performed at least annually on October 1 of each year, or whenever events or circumstances indicate that impairment may have occurred. The first step is a comparison of the fair value of a reporting unit with its carrying amount, including goodwill. If the fair value of the reporting unit exceeds its carrying value, goodwill of the reporting unit is not considered impaired and the second step is unnecessary. If the carrying value of the reporting unit exceeds its fair value, a second test is performed to measure the amount of impairment by comparing the carrying amount of the goodwill to a determination of the implied fair value of the goodwill. If the carrying amount of the goodwill is greater than the implied value, an impairment loss is recognized for the difference. The implied value of the goodwill is determined as of the test date by performing a purchase price allocation, as if the reporting unit had just been acquired, using currently estimated fair values of the individual assets and liabilities of the reporting unit, together with an estimate of the fair value of the reporting unit taken as a whole. The estimate of the fair value of the reporting unit is based upon information available regarding prices of similar groups of assets, or other valuation techniques including present value techniques based upon estimates of future cash flows (See Note 7).
Intangible assets, including acquired technology, customer relationships, certain trade names, proprietary process, and non-compete agreements arising principally from acquisitions, are recorded at cost less accumulated amortization and the finite-lived intangibles are amortized using the straight line method over the estimated useful life of the intangible asset. Intangible assets deemed to have indefinite useful lives, such as certain trade names, are not amortized and are subject to an annual impairment test or are tested whenever events or circumstances indicate impairment may have occurred. Impairment exists if the carrying value of the indefinite-lived intangible asset exceeds its fair value (See Note 7).
The goodwill acquired in business acquisitions is not amortized. Acquired intangibles are carried at cost less accumulated amortization. At December 31, 2009, intangible assets are amortized over the following estimated lives:
Acquired technology |
5 years | |
Customer relationships |
7–11 years | |
Covenants not to compete |
1–3 years | |
Proprietary process |
5–7 years | |
Trade names |
1–10 years | |
Customer contracts |
1 year | |
Other intangibles |
4 years |
F-9
RISKMETRICS GROUP, INC.
NOTES TO CONSOLIDATED FINANCIAL STATEMENTS (Continued)
YEARS ENDED DECEMBER 31, 2009, 2008, AND 2007
(Amounts in thousands, except share and per share amounts)
2. SIGNIFICANT ACCOUNTING POLICIES AND RECENT ACCOUNTING PRONOUNCEMENTS (Continued)
Property and Equipment and Related Depreciation and Amortization—Property and equipment are stated at cost less accumulated depreciation and amortization. Depreciation is calculated using the straight-line method over the estimated useful lives of the depreciable assets. Amortization of leasehold improvements is calculated using the straight-line method over the shorter of the life of the asset or the term of the related lease. Improvements are capitalized, while repair and maintenance costs are charged to operations as incurred.
The Company capitalizes certain acquisition and development costs of computer software developed or obtained for internal use. Capitalization begins when the preliminary project stage is complete. Capitalization ceases when the internal use software is substantially complete and ready for its intended use. Once the project is complete and available for intended use, the Company amortizes these costs over a three-year period.
During the years ended December 31, 2009 and 2008, $1,053 and $1,629 of internal software development costs have been capitalized and amortization expense of $1,720, $1,387 and $681 was recorded for internally developed software for the years ended December 31, 2009, 2008 and 2007, respectively.
Depreciation and Amortization of Property and Equipment. Depreciation and amortization of property and equipment in the consolidated statements of operations includes depreciation of internal use software, computer and related equipment, furniture and fixtures and telecommunications equipment, which is recorded on a straight-line basis over the respective useful life of the related asset. Depreciation and amortization of property and equipment also includes the amortization of leasehold improvements which are amortized over the shorter of the term of the lease or the assets' useful life and the amortization of capitalized software costs.
Amortization of Intangible Assets. Amortization of intangible assets includes the amortization of finite life intangibles such as acquired technology, customer relationships, proprietary processes, certain trade names, customer contracts and non-compete agreements.
Impairment of Long-Lived Assets—Long-lived assets of the Company (other than deferred tax assets) including furniture and fixtures, equipment, internal use software and leasehold improvements, trade names and other finite lived intangible assets are reviewed for impairment whenever events or changes in circumstances indicate that the net carrying amount of the asset may not be recoverable. In connection with such review, the Company also re-evaluates the periods of depreciation and amortization for these assets. Recoverability of assets to be held and used is measured by a comparison of the carrying amount of an asset to undiscounted future net cash flows expected to be generated by the asset. If such assets are considered to be impaired, the impairment to be recognized is measured by the amount by which the carrying amount of the assets exceeds the fair value of the asset.
Derivative Instruments—The Company's derivative instruments are recorded at fair value. Changes in fair value of derivatives that have been designated as cash flow hedging instruments are included in "Unrealized gains (losses) on cash flow hedge" as a component of other comprehensive income (loss)
F-10
RISKMETRICS GROUP, INC.
NOTES TO CONSOLIDATED FINANCIAL STATEMENTS (Continued)
YEARS ENDED DECEMBER 31, 2009, 2008, AND 2007
(Amounts in thousands, except share and per share amounts)
2. SIGNIFICANT ACCOUNTING POLICIES AND RECENT ACCOUNTING PRONOUNCEMENTS (Continued)
in the accompanying consolidated statements of changes in stockholders' equity to the extent of the effectiveness of such hedging instruments. Any ineffective portion of the change in fair value of the designated hedging instruments is included in the consolidated statements of operations. Changes in fair value of derivatives that are not designated as hedging instruments will be included in the consolidated statements of operations.
Revenue Recognition—The majority of the Company's revenues are generated from contracted annual subscriptions, for which the Company receives licensing fees from clients who utilize services. Depending on the service offering, the services are available through a variety of delivery options, including hosted web applications, fully-outsourced managed services, and local software installation. Revenues are recognized on a straight line basis over the term of the subscription period which is typically one year.
Revenue is recognized when all of the following conditions are met:
- •
- there is persuasive evidence of an arrangement;
- •
- the service has been provided to the customer;
- •
- the collection of the fees is reasonably assured; and
- •
- the amount of fees to be paid by the customer is fixed or determinable.
License fees associated with local software installations, for the RiskMetrics business, are recognized over the term of the license period, typically one year. The arrangement for local installation is a multiple-element arrangement that consists of software, post contract support (PCS) including unspecified upgrades and enhancements, and other service elements. Revenue is recognized ratably over the term of the license as there is no vendor-specific objective evidence of the fair value for PCS or the other service elements because they are not priced separately or sold separately to customers and there is no discernable pattern in which PCS and other services are expected to be performed.
The ISS business provides proxy advisory and voting services, corporate governance and financial research and analysis services to institutional investors and corporations. The majority of ISS's products and services are delivered through a web based platform and are typically provided through annual subscription agreements. Revenue is recognized ratably over the term of the subscription agreement. Many of ISS's subscription agreements are multiple element arrangements that provide for the delivery of more than one ISS product or service. Revenue is recognized on a straight-line basis over the term of the subscription as each of the services specified in these multiple element arrangements are performed continuously over the subscription term and there is no discernable pattern in which the services will be performed.
In situations where contracts include client acceptance provisions, the Company does not recognize revenue until such time as the client has confirmed its acceptance. Some of the Company's subscription
F-11
RISKMETRICS GROUP, INC.
NOTES TO CONSOLIDATED FINANCIAL STATEMENTS (Continued)
YEARS ENDED DECEMBER 31, 2009, 2008, AND 2007
(Amounts in thousands, except share and per share amounts)
2. SIGNIFICANT ACCOUNTING POLICIES AND RECENT ACCOUNTING PRONOUNCEMENTS (Continued)
contracts include automatic renewal provisions under existing contract terms. Reserves for possible losses on subscription service, if any, are recognized when determined.
A portion of the Company's revenues are derived from non-subscription services including implementation, Compensation Advisory Services and overages related to Proxy Research and Voting services. Revenues from implementation are recognized as the services are provided and other non-recurring revenues are recognized over the service period or upon delivery of the required service.
Deferred Revenue—Deferred revenue primarily consists of payments received in advance of revenue recognition from the Company's subscription services described above and is recognized as revenue recognition criteria are met. The Company generally invoices its customers in annual or quarterly installments. Accordingly, the deferred revenue balance does not represent the total contract value of annual or multi-year, non-cancelable subscription agreements.
Fair Value of Financial Instruments—The carrying value of the Company's cash, accounts receivable, accounts payable and accrued expenses approximates their fair value due to the short-term nature of these items. The carrying value and estimated fair value of the Company's debt based on prevailing interest rates as of December 31, 2009 and 2008 is as follows:
| |
December 31, 2009 |
December 31, 2008 |
|||||
|---|---|---|---|---|---|---|---|
Carrying value |
$ | 288,395 | $ | 290,619 | |||
Estimated fair value |
$ | 278,000 | $ | 253,000 | |||
Concentration of Risk—The Company's customers are primarily commercial organizations headquartered in the United States, Canada, Europe, Asia, the Middle East, and Africa.
Accounts receivable are generally unsecured and are due in accordance with payment terms included in contracts negotiated with customers. Amounts due from customers are stated net of an allowance for doubtful accounts. Accounts that are outstanding longer than the contracted payment terms are considered past due. The Company determines an allowance for doubtful accounts by considering a number of factors, including the length of time accounts are past due, the customer's current ability to pay its obligations to the Company, and the condition of the general economy and the industry as a whole. The Company writes-off accounts receivable when they are deemed uncollectible.
No customer comprised more than 10% of consolidated revenues during the years ended December 31, 2009, 2008 and 2007.
Cost of Revenues—Costs of revenues include costs related to production of proxy research and voting, web hosting, data, account management, implementation and systems operations and transactional foreign exchange gains and losses. Costs in this area consist primarily of staff compensation and related costs and payments to third party vendors, including third party web hosting and data providers.
F-12
RISKMETRICS GROUP, INC.
NOTES TO CONSOLIDATED FINANCIAL STATEMENTS (Continued)
YEARS ENDED DECEMBER 31, 2009, 2008, AND 2007
(Amounts in thousands, except share and per share amounts)
2. SIGNIFICANT ACCOUNTING POLICIES AND RECENT ACCOUNTING PRONOUNCEMENTS (Continued)
Research and Development—Research and development expenses include costs related to product development, research technology, application design, technology infrastructure and analytics development. Costs in this area consist primarily of staff compensation costs and related expenses and consultant expenses.
Selling and Marketing—Selling and marketing expenses consist of costs related to our sales force, product management and marketing professionals. These costs include staff compensation costs and related expenses, including commissions and general marketing costs.
General and Administrative—General and administrative expenses consist of expenses for finance, administration, legal, audit and accounting, human resources and information technology personnel. Costs in this area primarily consist of staff compensation and related expenses, legal costs, insurance costs, accounting fees and other professional services fees.
Income Taxes—The Company records income taxes under the asset and liability method. Deferred tax assets and liabilities are recognized for the future tax consequences attributable to temporary differences between the financial statement carrying amounts of existing assets and liabilities and their respective tax bases. Deferred tax assets and liabilities are measured using enacted tax rates expected to apply to taxable income in the years in which the temporary differences are expected to be recovered or settled. To the extent needed, the Company records valuation allowances against its deferred tax assets, if it determines it is not more likely than not that the assets will be utilized in the future.
The tax effects of an uncertain tax position taken or expected be taken in income tax returns are recognized only if it is "more likely-than-not" to be sustained on examination by the taxing authorities, based on its technical merits as of the reporting date. The tax benefits recognized in the financial statements from such a position are measured based on the largest benefit that has a greater than fifty percent likelihood of being realized upon ultimate settlement. The Company recognizes the benefit of an uncertain tax position in the period when it is effectively settled. Previously recognized tax positions are derecognized in the first period in which it is no longer more likely than not that the tax position would be sustained upon examination. The Company recognizes accrued interest and penalties related to uncertain tax positions in income tax expense (see Note 11).
Accounting for Stock-Based Compensation—Stock-based compensation expense is measured at the grant date based on the fair value of the award, and the cost is recognized as expense ratably over the award's vesting period. The Company measures the fair value of options to purchase its common stock on the date of grant using a Black-Scholes option-pricing model. The Company recognized compensation for unvested awards under the graded vesting method for options granted prior to January 1, 2006, and the Company will continue to do so for such grants. For all grants made subsequent to December 31, 2005, the Company recognizes compensation cost under the straight-line method.
Determining the fair value of stock options required the Company to make several estimates, including the volatility of its stock price, the expected life of the option, and interest rates. Prior to
F-13
RISKMETRICS GROUP, INC.
NOTES TO CONSOLIDATED FINANCIAL STATEMENTS (Continued)
YEARS ENDED DECEMBER 31, 2009, 2008, AND 2007
(Amounts in thousands, except share and per share amounts)
2. SIGNIFICANT ACCOUNTING POLICIES AND RECENT ACCOUNTING PRONOUNCEMENTS (Continued)
January 25, 2008, the Company was not a publicly traded company, and had limited historical information on the price of its common stock. Because of this limitation, the Company cannot solely rely on its historical experience alone to develop assumptions for stock price volatility. Accordingly, the Company also utilizes estimated stock-price volatility with reference to a peer group of companies. Determining the companies to include in this peer group involves judgment and the use of different assumptions in the Black-Scholes model would result in different amounts of stock-based compensation expense. The expected life of the options is based on internal studies of historical experience and projected exercise behavior of employees based on the Company's future prospects. The Company utilizes a risk-free interest rate, which is based on the yield of U.S. zero coupon securities with a maturity equal to the expected life of the options. The Company has not and does not expect to pay dividends on its common shares.
The Company estimates expected forfeitures of stock-based awards at the grant date and recognizes compensation cost only for those awards that are expected to vest. The forfeiture assumption is ultimately adjusted to the actual forfeiture rate. Therefore, changes in the forfeiture assumptions may impact the timing of the total amount of expense recognized over the vesting period. Estimated forfeitures are reassessed in each reporting period and may change based on new facts and circumstances.
The actual income tax benefit recorded relating to the exercise of stock options was $4,188, $4,861 and $201 for the years ended December 31, 2009, 2008 and 2007, respectively, and is classified as an operating cash outflow and financing cash inflow in the consolidated statements of cash flows.
Contingencies—Contingencies by their nature relate to uncertainties that require management to exercise judgment both in assessing the likelihood that a liability has been incurred as well as in estimating the amount of potential loss, if any. The Company accrues for costs relating to litigation, claims and other contingent matters when such liabilities become probable and reasonably estimable. Such estimates may be based on advice from third parties or on management's judgment,
Debt Issuance Costs—Loan fees and other costs incurred in connection with the issuance of long-term debt are deferred and amortized over the term of the related loan using the effective interest method. Such amortization is reported as a component of interest expense. If debt is repaid prior to the full amortization of the related issuance costs, the remaining balance of such issuance costs is recoded as interest expense in the Company's consolidated statements of operations.
Effects of Recently Issued Accounting Pronouncements
Fair Value Measurement
In September 2006, the Financial Accounting Standards Board ("FASB") amended its guidance for fair value measurement which establishes a framework for measuring fair value, and expands disclosures about fair value measurements. In February 2008, the FASB amended its guidance which provided a one year deferral of the effective date for fair value measurement for non-financial assets
F-14
RISKMETRICS GROUP, INC.
NOTES TO CONSOLIDATED FINANCIAL STATEMENTS (Continued)
YEARS ENDED DECEMBER 31, 2009, 2008, AND 2007
(Amounts in thousands, except share and per share amounts)
2. SIGNIFICANT ACCOUNTING POLICIES AND RECENT ACCOUNTING PRONOUNCEMENTS (Continued)
and liabilities (such as goodwill), except those that are recognized or disclosed in the Company's financial statements at fair value at least annually. Accordingly, we adopted this guidance for our financial assets and liabilities recognized or disclosed at fair value on a recurring basis effective January 1, 2008. We adopted this guidance for non-financial assets and liabilities effective January 1, 2009. The Company's financial assets measured at fair value on a recurring basis consist of derivative instruments (see Note 10).
Fair Value Option for Financial Assets and Financial Liabilities
In February 2007, the FASB amended its guidance providing companies with an option to report selected financial assets and liabilities at fair value. The objective of the guidance is to reduce both complexity in accounting for financial instruments and the volatility in earnings caused by measuring related assets and liabilities differently. U.S. GAAP required different measurement attributes for different assets and liabilities that can create artificial volatility in earnings. The guidance helps to mitigate this type of accounting-induced volatility by enabling companies to report related assets and liabilities at fair value, which may reduce the need for companies to comply with detailed rules for hedge accounting. The guidance also establishes presentation and disclosure requirements designed to facilitate comparisons between companies that choose different measurement attributes for similar types of asset and liabilities. This guidance requires companies to provide additional information that will help investors and other users of financial statements to more easily understand the effect of the Company's choice to use fair value on its earnings. It also requires entities to display the fair value of these assets and liabilities for which the Company has chosen to use fair value on the face of the balance sheet. The Company adopted the guidance for fair value option for financial assets and financial liabilities on January 1, 2008, but did not elect the fair value option for any qualifying financial instruments presented in the consolidated financial statements.
Accounting for Business Combinations and Noncontrolling Interests
In December 2007, the FASB amended its authoritative guidance for business combinations and noncontrolling interests in consolidated financial statements. Effective January 1, 2009, the Company adopted the amended guidance. These new standards significantly change the financial accounting and reporting of business combination transactions and noncontrolling interests in consolidated financial statements. The Company accounted for the acquisitions of Innovest Strategic Advisors ("Innovest") and KLD Research & Analytics, Inc. ("KLD") in accordance with this amended guidance (see Note 3).
Disclosures for Derivative Financial Instruments
In March 2008, the FASB amended its guidance for disclosures about derivative instruments and hedging activities. On January 1, 2009 the Company adopted this amended guidance for its disclosures about derivative instruments and hedging activities and has included the required disclosures regarding the fair value of derivative instruments in Note 10.
F-15
RISKMETRICS GROUP, INC.
NOTES TO CONSOLIDATED FINANCIAL STATEMENTS (Continued)
YEARS ENDED DECEMBER 31, 2009, 2008, AND 2007
(Amounts in thousands, except share and per share amounts)
2. SIGNIFICANT ACCOUNTING POLICIES AND RECENT ACCOUNTING PRONOUNCEMENTS (Continued)
Subsequent Events
In May 2009, the FASB issued new authoritative guidance for subsequent events. Such authoritative guidance establishes general standards of accounting for, and disclosure of, events that occur after the balance sheet date but before financial statements are issued or are available to be issued. In particular, this statement sets forth: (1) the period after the balance sheet date during which management of a reporting entity should evaluate events or transactions that may occur for potential recognition or disclosure in the financial statements, (2) the circumstances under which an entity should recognize events or transactions occurring after the balance sheet date in its financial statements and (3) the disclosures that an entity should make about events or transactions that occurred after the balance sheet date. On June 30, 2009, the Company adopted the authoritative guidance for subsequent events. Such adoption did not have a material impact on the Company's consolidated financial statements.
Multiple-Deliverable Revenue Arrangements
In October 2009, the FASB issued new accounting guidance for revenue arrangements with multiple deliverables. The new guidance impacts the determination of when the individual deliverables included in a multiple-element arrangement may be treated as separate units of accounting. Additionally, the guidance modifies the manner in which the transaction consideration is allocated across the separately identified deliverables by no longer permitting the residual method of revenue recognition in accounting for multiple deliverable arrangements. The guidance will be effective prospectively for revenue arrangements entered into or materially modified in fiscal years beginning on or after June 15, 2010, and will be effective for us in the first quarter of fiscal year 2011, however earlier adoption is permitted. We are currently assessing the impact the guidance may have on our consolidated financial statements upon adoption on January 1, 2011.
3. ACQUISITIONS
ISS Acquisition
On January 11, 2007, the Company acquired all of the outstanding capital stock of ISS for approximately $542.8 million. The purpose of the acquisition was to broaden the types of services the Company could offer its clients. The acquisition has been accounted for as a purchase and the operating results of ISS have been included in the consolidated financial statements since the date of acquisition.
The aggregate consideration paid for the acquisition is as follows:
Cash paid |
$ | 482,718 | ||
Fair value of 2,774,351 shares of common stock issued |
42,426 | |||
Fair value of stock options exchanged (1,396,000 shares underlying the stock options) |
16,331 | |||
Transaction costs |
1,296 | |||
Total purchase consideration |
$ | 542,771 | ||
F-16
RISKMETRICS GROUP, INC.
NOTES TO CONSOLIDATED FINANCIAL STATEMENTS (Continued)
YEARS ENDED DECEMBER 31, 2009, 2008, AND 2007
(Amounts in thousands, except share and per share amounts)
3. ACQUISITIONS (Continued)
The Company valued the shares of common stock issued in exchange for stock options held by employees and those issued to ISS shareholders at $15.29 per share (see Note 13).
The fair value of stock options issued in connection with the acquisition was estimated using the Black-Scholes option-pricing model utilizing the following weighted-average assumptions:
Risk-free interest rate |
4.7 | % | ||
Expected term (in years) |
3.0 | |||
Expected stock price volatility |
31 | % | ||
Expected dividend yield |
None |
The significant assumptions used in the valuation included factors affecting the duration, growth rates and amounts of future cash flows for each income stream, specifically: the future economic outlook for the industry, risks involved in the business, and the input of competition and technological changes. The following table summarizes the amounts allocated to the acquired assets and assumed liabilities based upon management's estimates:
Cash and cash equivalents and other current assets |
$ | 47,770 | ||
Property and equipment |
4,864 | |||
Non-current assets |
13,300 | |||
Intangible assets |
172,339 | |||
Goodwill |
418,563 | |||
Total assets acquired |
656,836 | |||
Accounts payable and accrued expenses |
(21,360 | ) | ||
Deferred revenue |
(43,510 | ) | ||
Other non-current liabilities |
(1,533 | ) | ||
Deferred tax liability |
(47,662 | ) | ||
Net assets acquired |
$ | 542,771 | ||
Goodwill |
$ | 418,563 | ||
Identifiable intangible assets |
172,339 | |||
Deferred tax liability |
(47,662 | ) | ||
Net liabilities assumed |
(469 | ) | ||
Total purchase consideration |
$ | 542,771 | ||
The goodwill and liabilities assumed were adjusted during the year ended December 31, 2008 to reflect certain liabilities for uncertain tax positions of ISS (see Note 7).
The Company has provided for deferred taxes of $47,662 representing the difference between the estimated book and tax basis of the net assets acquired. The excess of the purchase price over the estimated fair values of the assets acquired and liabilities assumed was allocated to goodwill. The Company did not recognize a deferred tax asset relating to the future tax deduction that will arise when the ISS employee rollover options are exercised. As such exercises occur, the Company recognizes a tax deduction and such benefit is recorded as a reduction of goodwill.
F-17
RISKMETRICS GROUP, INC.
NOTES TO CONSOLIDATED FINANCIAL STATEMENTS (Continued)
YEARS ENDED DECEMBER 31, 2009, 2008, AND 2007
(Amounts in thousands, except share and per share amounts)
3. ACQUISITIONS (Continued)
The purchase price for ISS was determined based on an auction whereby several companies arrived at a market price for the purchase of ISS. The Company believes the purchase price reflects the financial prospects of the existing business as well as the significant opportunities for revenue growth, cost savings and other synergies, including the ability to cross-sell to one another's clients, and offer more comprehensive and diverse services. The value reflected in these elements of the purchase price does not meet the definition of an intangible asset and is therefore reflected as goodwill. The amounts allocated to intangible assets and acquired technology was attributed to the following categories and estimated useful lives at the time of acquisition:
Acquired technology |
$ | 25,039 | 5 years | ||
Customer relationships |
117,900 | 9–11 years | |||
Trade names |
29,400 | 10 years–indefinite | |||
Total intangibles |
$ | 172,339 | |||
Center for Financial Research and Analysis ("CFRA") Acquisition
On August 1, 2007, the Company acquired all of the outstanding membership interests of CFRA for approximately $63.0 million. CFRA is a provider of forensic accounting research, legal and regulatory risk assessment, due diligence and educational services. The purpose of this acquisition was to broaden the quantitative and qualitative analysis services that the ISS business could offer its clients. The acquisition has been accounted for as a purchase, and the operating results of CFRA have been included in the consolidated financial statements since the date of its acquisition.
The aggregate consideration paid for the acquisition is as follows:
Cash paid (includes cash acquired of $1,213) |
$ | 46,275 | ||
Fair value of 973,151 shares of common stock issued |
16,057 | |||
Transaction costs |
661 | |||
Total purchase consideration |
$ | 62,993 | ||
The Company valued the shares of common stock issued in exchange for equity held and issued to CFRA shareholders at $16.50 per share (see Note 13).
F-18
RISKMETRICS GROUP, INC.
NOTES TO CONSOLIDATED FINANCIAL STATEMENTS (Continued)
YEARS ENDED DECEMBER 31, 2009, 2008, AND 2007
(Amounts in thousands, except share and per share amounts)
3. ACQUISITIONS (Continued)
The following table summarizes the amounts allocated to the acquired assets and liabilities assumed based upon management's estimates:
Cash and other current assets |
$ | 3,104 | ||
Property and equipment |
511 | |||
Non-current assets |
49 | |||
Intangible assets |
19,710 | |||
Goodwill |
46,736 | |||
Total assets acquired |
70,110 | |||
Accounts payable and accrued expenses |
(3,326 | ) | ||
Deferred revenue |
(3,791 | ) | ||
Net assets acquired |
$ | 62,993 | ||
Goodwill |
46,736 | |||
Identifiable intangible assets |
19,710 | |||
Net liabilities assumed |
(3,453 | ) | ||
Total purchase consideration |
$ | 62,993 | ||
The Company believes the purchase price reflects the prospects of the existing business. The amounts and useful lives allocated to intangible assets were as follows:
Customer relationships |
$ | 10,250 | 7 years | ||
Covenant not to compete |
250 | 1 year | |||
Trade name |
100 | 1 year | |||
Acquired technology |
240 | 5 years | |||
Proprietary process |
8,870 | 7 years | |||
Total intangibles |
$ | 19,710 | |||
Proprietary process represents the research technique process utilized by CFRA to derive independent value not generally known and is considered an asset apart from goodwill. The excess of the purchase price over the estimated fair values of the assets acquired and liabilities assumed was allocated to goodwill, which is expected to be deductible for tax purposes.
During 2008, the Company completed an internal study which determined certain sales tax liabilities are payable in connection with both the pre-acquisition and post-acquisition operational activity of CFRA. As a result, the Company entered into a voluntary agreement with the local taxing authority and agreed to pay a maximum and probable cost of $1,836, of which $1,438 relates to pre-acquisition activity. The Company has recovered $800 pursuant to an escrow agreement with the former equity owners of CFRA, comprised of $223 in cash and $577 in shares of the Company's common stock, and has recorded the recovery as a reduction to the CFRA purchase price.
During the year ended December 31, 2008 the Company recognized an impairment charge for goodwill and an intangible asset related to ISS and CFRA (see Note 7).
F-19
RISKMETRICS GROUP, INC.
NOTES TO CONSOLIDATED FINANCIAL STATEMENTS (Continued)
YEARS ENDED DECEMBER 31, 2009, 2008, AND 2007
(Amounts in thousands, except share and per share amounts)
3. ACQUISITIONS (Continued)
Innovest Acquisition
On March 2, 2009, the Company acquired all of the outstanding common stock of Innovest for $16.0 million in cash. Innovest is an international investment research and advisory firm specializing in analyzing "non-traditional" drivers of risk and shareholder value, including companies' performance on environmental, social and strategic governance issues. The purpose of this acquisition is to enhance the product offerings and services the Company may offer its customers in assessing risk within the environmental, social and governance sectors. The purchase of Innovest has been accounted for using the acquisition method, and the operating results of Innovest have been included within the ISS segment in the consolidated financial statements since the date of its acquisition.
The aggregate consideration paid for the acquisition is as follows:
Total cash purchase consideration |
$ | 15,996 | ||
Less: cash acquired |
1,190 | |||
Total cash paid |
$ | 14,806 | ||
The following table summarizes the amounts allocated to the acquired assets and liabilities assumed based on management's estimates:
Cash |
1,190 | |||
Accounts receivable |
1,256 | |||
Property and equipment and non-current assets |
259 | |||
Deferred tax assets |
1,745 | |||
Intangible assets |
5,780 | |||
Goodwill |
10,351 | |||
Total assets acquired |
20,581 | |||
Accounts payable |
(18 | ) | ||
Accrued expenses and other current liabilities |
(633 | ) | ||
Deferred tax liability |
(2,289 | ) | ||
Deferred revenue |
(1,645 | ) | ||
Net assets acquired |
$ | 15,996 | ||
Goodwill |
10,351 | |||
Identifiable intangible assets |
5,780 | |||
Net liabilites assumed |
(135 | ) | ||
Total purchase consideration |
$ | 15,996 | ||
The Company recorded a deferred tax liability representing the difference between the estimated book and tax basis of the net assets acquired. The excess of the purchase price over the estimated fair values of the assets acquired and liabilities assumed was allocated to goodwill, which is not expected to be deductible for tax purposes. The Company recorded a deferred tax asset for acquired net operating losses which are expected to be utilized over a period of approximately 6 years.
F-20
RISKMETRICS GROUP, INC.
NOTES TO CONSOLIDATED FINANCIAL STATEMENTS (Continued)
YEARS ENDED DECEMBER 31, 2009, 2008, AND 2007
(Amounts in thousands, except share and per share amounts)
3. ACQUISITIONS (Continued)
Revenue included in the consolidated statements of operations for the year ended December 31, 2009 pertaining to Innovest was approximately $5.6 million, and net earnings were not significant.
The Company incurred acquisition related expenses of $0.2 million in connection with the acquisition and such costs are included in general and administrative costs in the accompanying consolidated statement of operations for the year ended December 31, 2009. In addition, the purchase consideration was reduced by $0.2 million of employee severance costs and during the year ended December 31, 2009, the Company incurred a total of $0.5 million of employee severance costs as a result of reorganizing the ISS business due to the Innovest acquisition. Such expenses have been included in general and administrative expenses in the accompanying consolidated statements of operations.
The purchase price for Innovest was determined based on a valuation of market value comparables and future projections of discounted cash flows. The value reflected in these elements of the purchase price does not meet the definition of an intangible asset and is therefore reflected as goodwill within the ISS segment. The amounts and useful lives allocated to intangible assets were as follows:
Customer relationships |
$ | 4,300 | 10 years | ||
Covenant not to compete |
150 | 2 years | |||
Trade name |
350 | 1 year | |||
Customer contracts |
670 | 1 year | |||
Proprietary process |
310 | 5 years | |||
Total intangible assets |
$ | 5,780 | |||
KLD Acquisition
On October 30, 2009, the Company acquired all of the outstanding capital stock of KLD Research & Analytics, Inc. ("KLD") for approximately $9.9 million in cash, including a working capital adjustment. KLD is an independent investment research firm providing management tools to professionals integrating environmental, social and governance factors (ES&G) into their investment decisions. The purpose of this acquisition is to enhance the product offerings and services the Company may offer its customers in assessing risk within the environmental, social and governance sectors. The purchase of KLD has been accounted for using the acquisition method, and the operating results of KLD have been included within the ISS segment in the consolidated financial statements since the date of its acquisition.
The aggregate consideration paid for the acquisition is as follows:
Total cash purchase consideration |
$ | 9,881 | ||
Less: cash acquired |
3 | |||
Total cash paid |
$ | 9,878 | ||
F-21
RISKMETRICS GROUP, INC.
NOTES TO CONSOLIDATED FINANCIAL STATEMENTS (Continued)
YEARS ENDED DECEMBER 31, 2009, 2008, AND 2007
(Amounts in thousands, except share and per share amounts)
3. ACQUISITIONS (Continued)
The following table summarizes the amounts allocated to the acquired assets and liabilities assumed based on management's estimates:
Cash |
3 | |||
Accounts receivable |
763 | |||
Other receivables and prepaid expense |
124 | |||
Property and equipment and non-current assets |
85 | |||
Intangible assets |
4,680 | |||
Goodwill |
7,647 | |||
Total assets acquired |
13,302 | |||
Accounts payable |
(182 | ) | ||
Accrued expenses and other current liabilities |
(639 | ) | ||
Deferred revenue |
(2,600 | ) | ||
Net assets acquired |
$ | 9,881 | ||
Goodwill |
7,647 | |||
Identifiable intangible assets |
4,680 | |||
Net liabilities assumed |
(2,446 | ) | ||
Total purchase consideration |
$ | 9,881 | ||
Revenue included in the consolidated statements of operations for the year ended December 31, 2009 pertaining to KLD was approximately $1.1 million, and net earnings were not significant.
The Company incurred acquisition related expenses of $0.2 million in connection with the acquisition and such costs are included in general and administrative costs in the accompanying consolidated statement of operations for the year ended December 31, 2009. In addition, the purchase consideration was reduced by $0.5 million of employee severance costs. Such expenses have been included in general and administrative expenses in the accompanying consolidated statement of operations.
The purchase price for KLD was determined based on a valuation of market value comparables and future projections of discounted cash flows. The value reflected in these elements of the purchase price does not meet the definition of an intangible asset and is therefore reflected as goodwill within the ISS segment. The amounts and useful lives allocated to intangible assets were as follows:
Customer relationships |
$ | 2,990 | 10 years | ||
Covenant not to compete |
150 | 2 years | |||
Trade name |
370 | 2 year | |||
Customer contracts |
510 | 1 year | |||
Proprietary process |
420 | 5 years | |||
Other intangible assets |
240 | 4 years | |||
Total intangible assets |
$ | 4,680 | |||
F-22
RISKMETRICS GROUP, INC.
NOTES TO CONSOLIDATED FINANCIAL STATEMENTS (Continued)
YEARS ENDED DECEMBER 31, 2009, 2008, AND 2007
(Amounts in thousands, except share and per share amounts)
3. ACQUISITIONS (Continued)
The purchase price allocation for KLD is not complete as the acquisition occurred in October 2009 and the Company is still in the process of reviewing the valuation of assets and liabilities acquired.
The following table summarizes unaudited proforma financial information for the years ended December 31, 2009 and 2008 assuming the Innovest and KLD acquisitions had occurred on January 1, 2008.
| |
Years ended December 31, | |||||||
|---|---|---|---|---|---|---|---|---|
| |
2009 | 2008 | ||||||
Revenues |
$ | 310,131 | $ | 310,143 | ||||
Income from operations |
66,347 | (100,356 | ) | |||||
Net income |
30,611 | (136,931 | ) | |||||
Net income per share: |
||||||||
Diluted |
$ | 0.45 | $ | (2.28 | ) | |||
These unaudited proforma results are intended for informational purposes only and are not necessarily indicative of the results of operations that would have occurred had the Innovest and KLD acquisitions been in effect at the beginning of the periods presented.
4. INITIAL PUBLIC OFFERING
In January 2008, the Company completed an initial public offering of 16,100,000 shares of common stock, which included 4,035,816 shares sold by selling stockholders and 2,100,000 shares to cover over-allotments, which was exercised in full in January 2008. The Company did not receive any proceeds from the sale of the shares by the selling stockholders. Net proceeds from the offering, including the exercise of the underwriters' allotment, were $193.9 million, after deducting underwriting discounts and commissions and approximately $3.5 million of offering expenses, of which $1.6 million and $1.9 million were paid during the years ended December 31, 2008 and 2007, respectively. The Company utilized a portion of the proceeds to prepay the entire outstanding indebtedness under the Company's second loan lien credit facility (See Note 9).
5. ACCOUNTS RECEIVABLE
Unbilled accounts receivable represents revenue that has been earned based on services performed; however, billing has yet to commence under contractual terms of the arrangement. Accounts receivable as of December 31, 2009 and 2008 consist of the following:
| |
2009 | 2008 | |||||
|---|---|---|---|---|---|---|---|
Billed |
$ | 36,823 | $ | 42,150 | |||
Unbilled |
2,171 | 752 | |||||
Total |
38,994 | 42,902 | |||||
Less allowance for doubtful accounts |
(460 | ) | (583 | ) | |||
Accounts receivable, net |
$ | 38,534 | $ | 42,319 | |||
F-23
RISKMETRICS GROUP, INC.
NOTES TO CONSOLIDATED FINANCIAL STATEMENTS (Continued)
YEARS ENDED DECEMBER 31, 2009, 2008, AND 2007
(Amounts in thousands, except share and per share amounts)
6. PROPERTY AND EQUIPMENT
Property and equipment as of December 31, 2009 and 2008 consist of the following:
| |
Estimated Useful Life | 2009 | 2008 | |||||||
|---|---|---|---|---|---|---|---|---|---|---|
Cost: |
||||||||||
Hardware |
3 years | $ | 12,523 | $ | 20,867 | |||||
Internal use software |
3–4 years | 9,071 | 12,790 | |||||||
Telecommunications equipment |
5 years | 973 | 837 | |||||||
Furniture and fixtures |
7 years | 3,002 | 2,384 | |||||||
Leasehold improvements |
Shorter of the term of the lease or life of the asset |
6,306 | 6,248 | |||||||
|
$ | 31,875 | 43,126 | |||||||
Less accumulated depreciation and amortization |
(17,833 | ) | (27,726 | ) | ||||||
Property and equipment—net |
$ | 14,042 | $ | 15,400 | ||||||
Depreciation expense recorded for the years ended December 31, 2009, 2008, and 2007 was $7,265, $7,935 and $6,958, respectively. Amortization expense of leasehold improvements for the years ended December 31, 2009, 2008 and 2007 was $1,084, $844 and $461, respectively.
In 2007, the Company abandoned a software project and wrote-off certain assets in our London office, which resulted in a total loss on disposal of $732. In 2009, the Company also wrote off $433 of internal use software development costs which became obsolete due to the launch of a new ISS product offering.
7. GOODWILL AND INTANGIBLE ASSETS
Intangible Assets
Intangible assets as of December 31, 2009 and 2008 consist of the following:
| |
2009 | |||||||||||
|---|---|---|---|---|---|---|---|---|---|---|---|---|
| |
Useful Lives | Gross | Amortization | Net | ||||||||
Customer relationships |
7–11 years | $ | 135,440 | $ | (36,629 | ) | $ | 98,811 | ||||
Acquired technology |
5 years | 27,123 | (15,405 | ) | 11,718 | |||||||
Covenant not to compete |
1–3 years | 1,800 | (1,263 | ) | 537 | |||||||
Proprietary processes |
5–7 years | 9,600 | (3,128 | ) | 6,472 | |||||||
Trade names |
1–10 years | 24,320 | (7,265 | ) | 17,055 | |||||||
Other intangibles |
4 years | 240 | (10 | ) | 230 | |||||||
Customer contracts |
1 year | 1,180 | (644 | ) | 536 | |||||||
Total |
$ | 199,703 | $ | (64,344 | ) | $ | 135,359 | |||||
F-24
RISKMETRICS GROUP, INC.
NOTES TO CONSOLIDATED FINANCIAL STATEMENTS (Continued)
YEARS ENDED DECEMBER 31, 2009, 2008, AND 2007
(Amounts in thousands, except share and per share amounts)
7. GOODWILL AND INTANGIBLE ASSETS (Continued)
| |
2008 | |||||||||||
|---|---|---|---|---|---|---|---|---|---|---|---|---|
| |
Useful Lives | Gross | Amortization | Net | ||||||||
Customer relationships |
7–11 years | $ | 128,150 | $ | (23,751 | ) | $ | 104,399 | ||||
Acquired technology |
5 years | 27,123 | (10,013 | ) | 17,110 | |||||||
Covenant not to compete |
1–3 years | 1,500 | (771 | ) | 729 | |||||||
Proprietary processes |
5–7 years | 8,870 | (1,795 | ) | 7,075 | |||||||
Trade names |
1–10 years | 23,600 | (4,573 | ) | 19,027 | |||||||
Total |
$ | 189,243 | $ | (40,903 | ) | $ | 148,340 | |||||
In 2008, the Company determined that the useful life of an ISS product tradename should be changed from indefinite life to a finite life tradename with an estimated useful life of 8 years. The change resulted due to the Company beginning an integration plan, to transition the product tradename into the RiskMetrics tradename or a new tradename which reduced its expected useful life. The Company recorded a $5.9 million impairment charge for the product tradename which represented the difference between the fair value of the product tradename and related book value at the date of change. Such charge has been included in the impairment of goodwill and intangible asset caption within operating expenses on the accompanying consolidated statement of operations for the year ended December 31, 2008. As of December 31, 2009 and 2008, the $800 gross fair value of the product tradename is included in finite live tradenames and will be amortized over its remaining useful life.
In 2007, the Company acquired a covenant not to compete for the development of products and services which will support a broad range of corporate governance services for $1,250, of which $250 and $1,000 was paid during the years ended December 31, 2007 and 2008, respectively. The covenant not to compete is being amortized over its estimated useful life of three years.
Annual amortization expense, which is based on the values of intangibles and their useful lives, for the next five years, is expected to be as follows:
2010 |
$ | 23,731 | ||
2011 |
22,718 | |||
2012 |
17,611 | |||
2013 |
17,331 | |||
2014 |
15,801 |
Goodwill
All of the Company's goodwill is related to the ISS reporting unit which is also a reportable segment. The Company completed the first step of its 2008 annual goodwill evaluation as of October 1, 2008 which indicated the carrying value of the ISS reporting unit exceeded its fair value. The fair value of the ISS reporting unit was determined using a combination of present value techniques, including a discounted cash flow, as well as fair values of comparable businesses. The decrease in fair value of the ISS reporting unit was primarily a result of the negative equity market conditions which caused a material decline in industry market multiples in the second half of 2008. The Company re-evaluated the fair value of the ISS reporting unit as of December 31, 2008 and noted a further decline in the fair value of the ISS reporting unit due to further declines in comparable market value multiples. Accordingly, the Company completed the second step of the goodwill evaluation in order to determine
F-25
RISKMETRICS GROUP, INC.
NOTES TO CONSOLIDATED FINANCIAL STATEMENTS (Continued)
YEARS ENDED DECEMBER 31, 2009, 2008, AND 2007
(Amounts in thousands, except share and per share amounts)
7. GOODWILL AND INTANGIBLE ASSETS (Continued)
the implied fair value of ISS goodwill by performing a purchase price allocation as if ISS had been acquired on December 31, 2008. Based on the results of the fair value analysis, the carrying amount of ISS goodwill exceeded the implied value of goodwill and the difference of $154.2 million was recorded as a goodwill impairment charge during the year ended December 31, 2008.
Goodwill changed during the years ended December 31, 2009 and 2008 as follows:
| |
2009 | 2008 | ||||||
|---|---|---|---|---|---|---|---|---|
Balance as of January 1, |
||||||||
Goodwill |
$ | 462,782 | $ | 460,951 | ||||
Accumulated impairment losses |
(154,169 | ) | — | |||||
|
308,613 | 460,951 | ||||||
Tax benefit on exercise of ISS acquisition stock options |
(364 | ) | (631 | ) | ||||
CFRA sales tax liability (Note 3) |
— | 638 | ||||||
Adjustment of acquired ISS deferred and income taxes |
— | 1,824 | ||||||
Impairment loss |
— | (154,169 | ) | |||||
Goodwill from Innovest & KLD acquisitions |
17,998 | — | ||||||
|
326,247 | 308,613 | ||||||
Balance as of December 31, |
||||||||
Goodwill |
480,416 | 462,782 | ||||||
Accumulated Impairment Losses |
(154,169 | ) | (154,169 | ) | ||||
|
$ | 326,247 | $ | 308,613 | ||||
8. ACCRUED EXPENSES
Accrued expenses as of December 31, 2009 and 2008 consist of the following:
| |
2009 | 2008 | |||||
|---|---|---|---|---|---|---|---|
Accrued compensation and related tax |
$ | 31,543 | $ | 29,492 | |||
Accrued data and web hosting expenses |
1,160 | 1,907 | |||||
Accrued travel and entertainment |
389 | 393 | |||||
Accrued professional fees |
1,318 | 1,392 | |||||
Current portion of deferred rent |
203 | 273 | |||||
Interest payable |
2,170 | — | |||||
Other accrued expenses |
6,460 | 6,717 | |||||
|
$ | 43,243 | $ | 40,174 | |||
9. DEBT
In conjunction with the purchase of ISS on January 11, 2007, a subsidiary of the Company obtained $450 million of debt, of which $425 million was borrowed to complete the acquisition. The debt is comprised of two term loan facilities and a revolving credit facility. As of December 31, 2009, $288.4 million of debt remains outstanding under the first lien loan and no indebtedness remain
F-26
RISKMETRICS GROUP, INC.
NOTES TO CONSOLIDATED FINANCIAL STATEMENTS (Continued)
YEARS ENDED DECEMBER 31, 2009, 2008, AND 2007
(Amounts in thousands, except share and per share amounts)
9. DEBT (Continued)
outstanding under the second lien term loan or revolving credit facility. The maturity date for the first lien term loan is December 2013.
The first lien credit facilities consists of a $25 million revolving credit facility and $300 million of first lien term loan facility and accumulates interest, at the option of the Company at: (a) the LIBOR rate plus a margin of 1.75% to 2.25% depending on the Company's consolidated leverage ratio, or (b) the higher of (i) the Federal Funds Effective Rate plus 0.5% and (ii) Bank of America's "prime rate," plus a margin of 0.75% or 1.25% depending on the consolidated leverage ratio. Amounts repaid under the first lien term loan facility may not be re-borrowed. Amounts repaid under the revolving credit facility may be re-borrowed.
The second lien term loan facility was for $125 million and accumulated interest based on, at the option of the Company at: (a) the LIBOR rate plus a margin of 5.50%, or (b) the higher of (i) the Federal Funds Effective Rate plus 5.0% and (ii) Bank of America's "prime rate," plus a margin of 4.50%. In January 2008, the Company utilized a portion of proceeds from the initial public offering to prepay the entire outstanding indebtedness under the second lien loan, in the amount of $125.0 million. In addition, the Company paid a 1% prepayment penalty fee, or $1.25 million, upon repayment as set forth in the credit agreement, which has been included in other expenses for the year ended December 31, 2008, in the accompanying consolidated statements of operations. In conjunction with the repayment of the second lien term loan during the year ended December 31, 2008, the Company reduced the notional amount of the interest rate swap by $19.3 million, which resulted in other expense of $1.4 million in 2008 (Note 10).
The effective interest rate on the Company's debt, after considering the impact of interest rate swaps, was 6.8% and 7.4% for the year ended December 31, 2009 and 2008, respectively.
In addition to quarterly interest payments due on the credit facility, the Company is required to repay the principal amounts of the first lien credit facility in quarterly installments of $741. Furthermore, the Company is required to make a mandatory payment equal to each year's excess cash flow depending on leverage ratios, as defined in the first lien term loan facility, within five days of delivery of audited financial statements. Based on the Company's consolidated leverage ratio as of December 31, 2009, no future excess cash flow payments would be required as long as that ratio is maintained. The Company is required to repay the aggregate principal remaining on the first lien term loan facility on the maturity date. The Company may voluntarily prepay the first lien credit facilities in whole or in part without penalty.
Scheduled repayments of balances outstanding as of December 31, 2009 are as follows:
2010 |
2,966 | |||
2011 |
2,966 | |||
2012 |
2,966 | |||
2013 |
279,498 | |||
|
$ | 288,396 | ||
The Company has guaranteed the payment and performance of the credit facilities. The Company has pledged substantially all of its assets as collateral against the debt. The restrictive covenants set forth in the credit facilities restrict the Company from, among other things: permitting liens on its
F-27
RISKMETRICS GROUP, INC.
NOTES TO CONSOLIDATED FINANCIAL STATEMENTS (Continued)
YEARS ENDED DECEMBER 31, 2009, 2008, AND 2007
(Amounts in thousands, except share and per share amounts)
9. DEBT (Continued)
assets; incurring additional indebtedness (as defined per the debt agreement); making investments exceeding specific dollar amounts; making dispositions; making restricted payments; making fundamental changes to the business; changes in nature of business; restricting ability to pay dividends; entering into transactions with affiliates not in the ordinary course of business; use of proceeds to purchase margin stock; making amendments to the organization documents which are materially adverse to the lenders; making changes in accounting polices except as required by generally accepted accounting principles; prepayments of indebtedness (subject to amounts defined in the credit facilities); making amendments to second lien documents and indebtedness; and becoming legally obligated to make capital expenditures except in the ordinary course of business.
The indebtedness was obtained by a wholly-owned subsidiary of the Company (the "Borrower"). The Company, as parent holding company, has no independent assets or operations, and any other subsidiaries, other than the Borrower and its subsidiaries, are minor. The Company has guaranteed the indebtedness and such guarantee is full and unconditional. In addition, there are no restrictions on the ability of the Company to obtain funds from its subsidiaries by dividend or loan.
The credit facilities include certain covenants related to the delivery of financial results, maintenance of properties and insurance, consolidated leverage ratio limitations and limitations of capital expenditures. Upon the occurrence of an event of default under the credit facilities, the lenders may require that all amounts outstanding be repaid immediately and terminate the Company's ability to make further borrowings and foreclose on the collateral. Events relating to non-payment of amounts due under the credit facilities; breach of covenants; misrepresentation; insolvency of the Company; certain ERISA events; inability to pay the debts; change of control; invalidity of loan documents; certain judgments against any parties; cross-default; and failure of collateral agreements to be in effect are considered to be events of default after the passage of time or notice or both. As of December 31, 2009, we were in compliance with our credit agreements, and we are not aware of any future events or transactions that will impact such compliance.
The Company incurred debt issuance costs of $10,074, which have been recorded on the accompanying consolidated balance sheet. Such amount is being amortized over the life of the remaining debt and is reflected as a component of interest expense on the accompanying statement of operations. In conjunction with the prepayment of the second lien loan during the year ended December 31, 2008, the Company wrote-off debt issuance costs of $2,377. The following table summarizes amortization of debt issuance costs, including the write-off of debt issuance costs, in the accompanying consolidated statements of operations:
| |
Years Ended December 31, | |||||||||
|---|---|---|---|---|---|---|---|---|---|---|
| |
2009 | 2008 | 2007 | |||||||
Amortization of debt issuance costs (including write-offs) |
$ | 1,039 | $ | 3,450 | $ | 1,397 | ||||
10. FAIR VALUE OF DERIVATIVE INSTRUMENTS
The Company utilizes market data or assumptions that the Company believes market participants would use in pricing a financial asset or liability, including assumptions about risk and the risks inherent in the inputs to the valuation technique. These inputs can be readily observable quoted prices
F-28
RISKMETRICS GROUP, INC.
NOTES TO CONSOLIDATED FINANCIAL STATEMENTS (Continued)
YEARS ENDED DECEMBER 31, 2009, 2008, AND 2007
(Amounts in thousands, except share and per share amounts)
10. FAIR VALUE OF DERIVATIVE INSTRUMENTS (Continued)
in active markets for identical assets or liabilities (level 1), significant other observable inputs (level 2) or significant unobservable inputs (level 3). The Company primarily uses the income approach, which uses valuation techniques to convert future amounts to a single present amount to determine the estimated fair value of its financial instruments. Fair value is the price that would be received to sell an asset or paid to transfer a liability in an orderly transaction between market participants at the measurement date. As of December 31, 2009, the Company had interest rate swap agreements which are valued using level 2 inputs as shown in the following table:
| |
|
Fair value at December 31, 2009, using: | |||||||||||
|---|---|---|---|---|---|---|---|---|---|---|---|---|---|
| |
Total | Quoted prices in active markets for identical assets (Level 1) |
Significant other observable inputs (Level 2) |
Significant unobservable inputs (Level 3) |
|||||||||
Interest rate swap liability |
$ | 14,981 | $ | — | $ | 14,981 | $ | — | |||||
Total |
$ | 14,981 | $ | — | $ | 14,981 | $ | — | |||||
In February 2007, the Company entered into two interest-rate swap agreements to reduce interest rate risks and to manage interest expense. By entering into these agreements, the Company changed the fixed/variable interest-rate mix of its debt portfolio. The agreements effectively convert floating-rate debt into fixed-rate debt over the maturity life of the debt. This reduces the Company's risk of incurring higher interest costs in periods of rising interest rates and increases the Company's risk of paying higher interest costs in periods of decreasing interest rates. The interest rate swap agreements adjusted the Company's weighted average effective interest rate, which resulted in a gain (loss) being recorded in interest expense in the accompanying consolidated statements of operations.
The Company's interest-rate swap agreements hedge a substantial portion of the interest rate risk exposure under the Company's debt (see Note 9). As of December 31, 2009 and 2008, the swap agreements had a notional amount of $251,363 and $279,375, respectively. As of December 31, 2009 and 2008, the swap agreements had a fair value liability of $14,981 and $22,311, respectively, which is included in other long-term liabilities on the accompanying consolidated balance sheets.
In conjunction with the prepayment of the second lien term loan during the year ended December 31, 2008 (Note 9), the Company reduced the notional amount of the interest rate swap by $19,300 in order to hedge the remaining debt outstanding. The reduction of the notional amount cost $1,364 and has been included in other expenses on the accompanying consolidated statement of operations for the year ended December 31, 2008.
The notional amount of the swap amortizes over the life of the debt and results in gains and losses being recognized in interest expense in the accompanying consolidated statements of operations. The gain (loss) from the amortization and reduction of the swap agreement is summarized in the following table:
| |
Years Ended December 31, | |||||||||
|---|---|---|---|---|---|---|---|---|---|---|
| |
2009 | 2008 | 2007 | |||||||
Gain (loss) from swap agreement |
$ | (11,029 | ) | $ | (5,881 | ) | $ | 595 | ||
F-29
RISKMETRICS GROUP, INC.
NOTES TO CONSOLIDATED FINANCIAL STATEMENTS (Continued)
YEARS ENDED DECEMBER 31, 2009, 2008, AND 2007
(Amounts in thousands, except share and per share amounts)
10. FAIR VALUE OF DERIVATIVE INSTRUMENTS (Continued)
These hedges of interest rate risk relating to the Company's debt have been designated as effective cash flow hedges at inception and on an ongoing quarterly basis. The Company estimates the effectiveness of the interest rate swap agreement utilizing the hypothetical derivative method. Under this method, the fair value of the actual interest rate swap agreement is compared to the fair value of a hypothetical swap agreement. To the extent that the agreement is not considered to be highly effective in offsetting the change in the value of the interest payments being hedged, the fair value relating to the ineffective portion of such agreement and any subsequent changes in such fair value will be immediately recognized in earnings. To the extent that the agreement is considered highly effective but not completely effective in offsetting the change in the value of the interest payments being hedged, any changes in fair value relating to the ineffective portion of such agreement will be immediately recognized in earnings. Effective gains and losses have been included in the unrealized gain (losses) on cash flow hedges as a component of other comprehensive income (loss), net of tax.
11. INCOME TAXES
Income taxes
The components of income (loss) before provision for income taxes are as follows:
| |
2009 | 2008 | 2007 | |||||||
|---|---|---|---|---|---|---|---|---|---|---|
Domestic |
$ | 26,404 | $ | (139,341 | ) | $ | (1,423 | ) | ||
Foreign |
20,282 | 13,122 | 5,535 | |||||||
Total |
$ | 46,686 | $ | (126,219 | ) | $ | 4,112 | |||
The components of the provision for income taxes for the years ended December 31, 2009, 2008 and 2007 are as follows:
| |
2009 | 2008 | 2007 | ||||||||
|---|---|---|---|---|---|---|---|---|---|---|---|
Federal: |
|||||||||||
Current |
$ | 8,885 | $ | 164 | $ | 38 | |||||
Deferred |
(1,385 | ) | 2,322 | (724 | ) | ||||||
|
7,500 | 2,486 | (686 | ) | |||||||
State: |
|||||||||||
Current |
1,109 | 1,682 | 53 | ||||||||
Deferred |
334 | (3 | ) | (44 | ) | ||||||
|
1,443 | 1,679 | 9 | ||||||||
Foreign: |
|||||||||||
Current |
6,476 | 6,560 | 2,735 | ||||||||
Deferred |
141 | (25 | ) | (347 | ) | ||||||
|
6,617 | 6,535 | 2,388 | ||||||||
Total |
$ | 15,560 | $ | 10,700 | $ | 1,711 | |||||
F-30
RISKMETRICS GROUP, INC.
NOTES TO CONSOLIDATED FINANCIAL STATEMENTS (Continued)
YEARS ENDED DECEMBER 31, 2009, 2008, AND 2007
(Amounts in thousands, except share and per share amounts)
11. INCOME TAXES (Continued)