Attached files
Table of Contents
UNITED STATES
SECURITIES AND EXCHANGE COMMISSION
Washington, D.C. 20549
FORM 10-K
| x | ANNUAL REPORT PURSUANT TO SECTION 13 OR 15(d) OF THE SECURITIES EXCHANGE ACT OF 1934 FOR THE FISCAL YEAR ENDED DECEMBER 31, 2009 |
OR
| ¨ | TRANSITION REPORT PURSUANT TO SECTION 13 OR 15(d) OF THE SECURITIES EXCHANGE ACT OF 1934 |
001-14223
Commission File Number
KNIGHT CAPITAL GROUP, INC.
(Exact name of registrant as specified in its charter)
DELAWARE
(State or other jurisdiction of incorporation or organization)
22-3689303
(I.R.S. Employer Identification Number)
545 Washington Boulevard, Jersey City, NJ 07310
(Address of principal executive offices and zip code)
Registrant’s telephone number, including area code: (201) 222-9400
Securities registered pursuant to Section 12(b) of the Act:
| Title of each class |
Name of each exchange on which registered | |
| Class A Common Stock, $0.01 par value | The Nasdaq Global Select Market |
Securities registered pursuant to Section 12(g) of the Act:
Indicate by check mark if the registrant is a well-known seasoned issuer, as defined in Rule 405 of the Securities Act. Yes x No ¨
Indicate by check mark if the registrant is not required to file reports pursuant to Section 13 or Section 15(d) of the Act. Yes ¨ No x
Indicate by check mark whether the Registrant (1) has filed all reports required to be filed by Section 13 or 15(d) of the Securities Exchange Act of 1934 during the preceding 12 months (or for such shorter period that the Registrant was required to file such reports), and (2) has been subject to such filing requirements for the past 90 days. Yes x No ¨
Indicate by check mark whether the registrant has submitted electronically and posted on its corporate Web site, if any, every Interactive Data File required to be submitted and posted pursuant to Rule 405 of Regulation S-T during the preceding 12 months (or for such shorter period that the registrant was required to submit and post such files). Yes ¨ No ¨
Indicate by check mark if disclosure of delinquent filers pursuant to Item 405 of Regulation S-K is not contained herein, and will not be contained, to the best of Registrant’s knowledge, in definitive proxy or information statements incorporated by reference in Part III of this Form 10-K or any amendment to this Form 10-K. Yes x No ¨
Indicate by check mark whether the registrant is a large accelerated filer, an accelerated filer, a non-accelerated filer or a smaller reporting company. See the definitions of “large accelerated filer,” “accelerated filer” and “smaller reporting company” in Rule 12b-2 of the Exchange Act. Large accelerated filer x Accelerated filer ¨ Non-accelerated filer ¨ Smaller reporting company ¨
Indicate by check mark whether the registrant is a shell company (as defined in Rule 12b-2 of the Exchange Act). Yes ¨ No x
The aggregate market value of the Class A Common Stock held by nonaffiliates of the Registrant was approximately $1.32 billion at June 30, 2009 based upon the closing price for shares of the Registrant’s Class A Common Stock as reported by the Nasdaq Global Select Market on that date. For purposes of this calculation, affiliates are considered to be officers, directors and holders of 10% or more of the outstanding common stock of the Registrant.
At February 24, 2010 the number of shares outstanding of the Registrant’s Class A Common Stock was 94,428,957 and there were no shares outstanding of the Registrant’s Class B Common Stock as of such date.
DOCUMENTS INCORPORATED BY REFERENCE
Definitive Proxy Statement relating to the Company’s 2010 Annual Meeting of Stockholders to be filed hereafter (incorporated, in part, into Part III hereof).
Table of Contents
KNIGHT CAPITAL GROUP, INC.
FORM 10-K ANNUAL REPORT
For the Year Ended December 31, 2009
| Page | ||||
| Item 1. |
Business | 4 | ||
| Item 1A. |
Risk Factors | 15 | ||
| Item 1B. |
Unresolved Staff Comments | 23 | ||
| Item 2. |
Properties | 23 | ||
| Item 3. |
Legal Proceedings | 23 | ||
| Item 4. |
Submission of Matters to a Vote of Security Holders | 25 | ||
| Item 5. |
26 | |||
| Item 6. |
Selected Financial Data | 30 | ||
| Item 7. |
Management’s Discussion and Analysis of Financial Condition and Results of Operations |
32 | ||
| Item 7A. |
53 | |||
| Item 8. |
56 | |||
| Item 9. |
Changes in and Disagreements With Accountants on Accounting and Financial Disclosures |
98 | ||
| Item 9A. |
98 | |||
| Item 9B. |
98 | |||
| Item 10. |
98 | |||
| Item 11. |
98 | |||
| Item 12. |
Security Ownership of Certain Beneficial Owners and Management and Related Stockholder Matters |
98 | ||
| Item 13. |
Certain Relationships and Related Transactions, and Director Independence |
98 | ||
| Item 14. |
98 | |||
| Item 15. |
99 | |||
| 103 | ||||
| Certifications |
||||
| Exhibit Index |
||||
2
Table of Contents
FORWARD LOOKING STATEMENTS
Certain statements contained in this Annual Report on Form 10-K, including without limitation, those under “Legal Proceedings” in Part I, Item 3, “Management’s Discussion and Analysis of Financial Condition and Results of Operations” in Part II, Item 7 (“MD&A”), and “Quantitative and Qualitative Disclosures About Market Risk” in Part II, Item 7A, and the documents incorporated by reference herein may constitute forward-looking statements as defined in the Private Securities Litigation Reform Act of 1995. These forward-looking statements are not historical facts and are based on current expectations, estimates and projections about the Company’s industry, management’s beliefs and certain assumptions made by management, many of which, by their nature, are inherently uncertain and beyond our control. Accordingly, readers are cautioned that any such forward-looking statements are not guarantees of future performance and are subject to certain risks, uncertainties and assumptions that are difficult to predict including, without limitation, risks associated with changes in market structure, legislative or regulatory rule changes, the costs, integration, performance and operation of businesses recently acquired or developed organically, or that may be acquired in the future, by the Company and risks related to the costs and expenses associated with the Company's exit from the Asset Management business. Since such statements involve risks and uncertainties, the actual results and performance of the Company may turn out to be materially different from the results expressed or implied by such forward-looking statements. Given these uncertainties, readers are cautioned not to place undue reliance on such forward-looking statements. Unless otherwise required by law, the Company also disclaims any obligation to update its view of any such risks or uncertainties or to announce publicly the result of any revisions to the forward-looking statements made in this report. Readers should carefully review the risks and uncertainties disclosed in the Company’s reports with the U.S. Securities and Exchange Commission (“SEC”), including those detailed under “Certain Factors Affecting Results of Operations” in MD&A and in “Risk Factors” in Part I, Item 1A herein, and in other reports or documents the Company files with, or furnishes to, the SEC from time to time. This discussion should be read in conjunction with the Company’s Consolidated Financial Statements and the Notes thereto contained in this Form 10-K, and in other reports or documents the Company files with, or furnishes to, the SEC from time to time.
3
Table of Contents
| Item 1. | Business |
Overview
Knight Capital Group, Inc., a Delaware corporation (collectively with its subsidiaries, “Knight” or the “Company”), is a financial services firm that provides market access and trade execution services across multiple asset classes to buy- and sell-side firms as well as offers capital markets services to corporate issuers and private companies.
The Company was organized in January 2000 as the successor to the business of Knight/Trimark Group, Inc. (the “Predecessor”). The Predecessor was organized in April 1998 as the successor to the business of Roundtable Partners, LLC, which was formed in March 1995. In May 2000, the Company changed its name from Knight/Trimark Group, Inc. to Knight Trading Group, Inc., and in May 2005 the Company further changed its name to Knight Capital Group, Inc. Our corporate headquarters are located at 545 Washington Boulevard, Jersey City, New Jersey 07310. Our telephone number is (201) 222-9400.
Financial information concerning our business segments for each of 2009, 2008 and 2007, respectively, is set forth in “Management’s Discussion and Analysis of Financial Condition and Results of Operations” in Part II, Item 7 (“MD&A”) and the Consolidated Financial Statements and Notes thereto located in Part II, Item 8 entitled “Financial Statements and Supplementary Data.”
Available Information
Our Internet address is www.knight.com. We make available free of charge, on or through the “Investor Relations” section of our corporate website under “SEC Filings”, annual reports on Form 10-K, quarterly reports on Form 10-Q, current reports on Form 8-K, Forms 3, 4 and 5 filed on behalf of directors and executive officers, and any amendments to those reports filed or furnished pursuant to the Securities Exchange Act of 1934, and our proxy statement as soon as reasonably practicable after such materials are electronically filed with, or furnished to, the SEC. Also posted on our corporate website is our Code of Business Conduct and Ethics (the “Code”) governing our directors, officers and employees. Within the time period required by the SEC, we will post on our corporate website any amendments and waivers to such Code applicable to our executive officers and directors, as defined in the Code.
Our Board of Directors (the “Board”) has standing Finance and Audit, Compensation and Nominating and Corporate Governance committees. Each of these Board committees has a written charter approved by the Board. Our Board has also adopted a set of Corporate Governance Guidelines. Copies of each committee charter, along with the Corporate Governance Guidelines, are posted on the Company’s website. None of the information on our corporate website is incorporated by reference into this report.
All of the above materials are also available in print, without charge, to any person who requests them by writing or telephoning:
Knight Capital Group, Inc.
Communications, Marketing and Investor Relations
545 Washington Boulevard, 3rd Floor
Jersey City, NJ 07310
(201) 222-9400
Unless otherwise indicated, references to the “Company,” “Knight,” “We,” “Us,” or “Our” shall mean Knight Capital Group, Inc. and its subsidiaries.
4
Table of Contents
Operating Segments
Due to the general growth and evolution of our business, effective the fourth quarter of 2009, we separated our former Global Markets segment into two operating segments: i) Equities and ii) Fixed Income, Currencies and Commodities (“FICC”). This breakout is consistent with the organizational structure of our businesses. As a result of this change in segment reporting, we now have three operating segments within our continuing operations, Equities, FICC and Corporate. Effective March 31, 2009 the Company’s former Asset Management segment was classified as a discontinued operation.
| • | Equities—Our Equities segment includes equity market-making, and electronic and voice institutional sales and trading in global equities, futures and options. In the course of market-making and trading, we provide capital facilitation and a range of complementary services. Within our Equities segment, we also offer equity capital markets services. |
| • | FICC—Our FICC segment includes global research, voice sales and trading in fixed income, as well as electronic trading in fixed income and foreign exchange. Fixed income research generates analytical reports containing recommendations across a wide range of securities and sectors. Within our FICC segment, we also offer debt capital markets services. |
| • | Corporate—Our Corporate segment invests in strategic financial services-oriented opportunities, allocates, deploys and monitors all capital, and maintains all corporate overhead expenses and all other expenses that are not attributable to the Equities and FICC segments. |
The following table sets forth: (i) Revenues, (ii) Expenses, (iii) Other income and (iv) Pre-tax earnings (loss) from continuing operations of our segments and on a consolidated basis (in millions):
| For the years ended December 31, | ||||||||||||
| 2009 | 2008 | 2007 | ||||||||||
| Equities |
||||||||||||
| Revenues |
$ | 891.0 | $ | 851.5 | $ | 653.6 | ||||||
| Expenses |
663.7 | 505.0 | 470.1 | |||||||||
| Pre-tax earnings |
227.3 | 346.4 | 183.5 | |||||||||
| FICC |
||||||||||||
| Revenues |
266.7 | 79.3 | 32.1 | |||||||||
| Expenses |
218.8 | 67.0 | 29.0 | |||||||||
| Pre-tax earnings |
47.8 | 12.3 | 3.1 | |||||||||
| Corporate |
||||||||||||
| Revenues |
4.7 | 8.1 | 31.5 | |||||||||
| Expenses |
47.1 | 49.1 | 42.0 | |||||||||
| Other income |
— | 15.9 | 8.8 | |||||||||
| Pre-tax (loss) |
(42.3 | ) | (25.1 | ) | (1.8 | ) | ||||||
| Consolidated |
||||||||||||
| Revenues |
1,162.4 | 938.9 | 717.2 | |||||||||
| Expenses |
929.6 | 621.2 | 541.2 | |||||||||
| Other income |
— | 15.9 | 8.8 | |||||||||
| Pre-tax earnings |
$ | 232.8 | $ | 333.6 | $ | 184.7 | ||||||
Totals may not add due to rounding.
5
Table of Contents
Equities Segment
Business Segment Overview
We provide market access and trade execution services in global equities as well as futures and options. Our approach to trading combines deep liquidity with robust trading technology and capital facilitation, when necessary, to deliver high quality trade executions consistent with client-defined measures. Our hybrid market model features an array of electronic and voice services that allow buy- and sell-side clients to interact with the market based on their specific needs and preferences. This model allows us to attract a larger base of clients with diverse investment styles and strategies, while at the same time, capture a greater share of client order flow. To do so, our model requires that we manage risk and deploy capital effectively as well as maintain efficient and reliable trading technology. Knight is connected to a large number of external market centers including electronic communication networks (“ECN”), alternative trading systems (“ATS”), dark liquidity pools, alternative display facilities (“ADF”), multilateral trading facilities (“MTF”), exchanges and other broker-dealers.
The majority of our Equities revenue is derived from trade executions, making markets and providing market access services in U.S. equities. Generally, market makers display the prices at which they are willing to bid, meaning buy, or offer, meaning sell, securities and adjust their bid and offer prices in response to the forces of supply and demand for each security. As a market maker operating in Nasdaq, the over-the-counter (“OTC”) market for New York Stock Exchange (“NYSE”), NYSE Amex Equities and NYSE Arca listed securities, the OTC Bulletin Board, and the Pink Sheets, we provide trade executions by offering to buy securities from, or sell securities to, institutions and broker-dealers. When acting as principal, we commit our own capital and derive revenues from the difference between the price paid when securities are bought and the price received when securities are sold. We conduct the vast majority of market-making activity as principal through the use of automated quantitative models. Our traders offer execution services for complex trades and a variety of order types. We also provide trade executions for institutions on an agency or riskless principal basis, generating commissions or commission equivalents, respectively. Our trading strategy also employs the use of high velocity algorithmic principal trading models which interact with street flow. These principal models buy and sell equities with high frequency and very short holding periods and are generally designed to benefit from pricing and arbitrage opportunities within the marketplace, while leveraging our robust trading technology.
Our domestic Equities activities are primarily transacted out of the following subsidiaries: Knight Equity Markets, L.P. (“KEM”), Knight Capital Markets LLC (“KCM”) and Knight Direct LLC (“Knight Direct”). KEM, KCM and Knight Direct are broker-dealers registered with the SEC and members of the Financial Industry Regulatory Authority (“FINRA”).
Our international Equities activities are primarily operated through Knight Capital Europe Limited (“KCEL,” formerly known as Knight Equity Markets International Limited). KCEL is a U.K. registered broker-dealer authorized and regulated by the U.K. Financial Services Authority (“FSA”) and provides execution services for institutional and broker-dealer clients in global equities. Knight Capital Asia Limited (“KCAL”, formerly Knight Equity Markets Hong Kong Limited) offers trade execution services in Asian, U.S. and European equities to institutional clients worldwide. KCAL is a broker-dealer registered as an exchange participant with the Hong Kong Stock Exchange and is regulated by the Hong Kong Securities and Futures Commission (“SFC”). We intend to continue to expand our equities business and product offerings in Europe and Asia in 2010.
In addition to our organic initiatives to expand and diversify our products and services within our Equities segment, over the past five years, we have completed the following acquisitions (and subsequent sales of equity interests) of complementary businesses to strengthen our Equities business segment and expand and diversify our products and services:
6
Table of Contents
| • | In June 2005, we acquired the business of Direct Trading Institutional, now operating as Knight Direct. The acquired business was a privately held firm specializing in providing institutions with direct market access (“DMA”). Since the acquisition, we have developed our own advanced electronic platform, Knight DirectTM, which handles all of Knight’s DMA activity. Upon the close of the transaction, the Company made a $40 million initial cash payment. The transaction also contained a two-year contingency from the date of closing for the payment of additional consideration based on the profitability of the business. In the third quarters of 2007 and 2006, the Company paid $10.4 million and $12.7 million, respectively, in additional cash consideration based on the profitability of the business during each of the first two years of operation after the closing of the acquisition. |
| • | In October 2005, we acquired the business of the ATTAIN ECN (now operating as Direct Edge), an ATS that operates an ECN. Direct Edge provides a liquidity destination with the ability to match and route trades in Nasdaq, NYSE, NYSE Amex Equities and NYSE Arca listed securities. |
After the close of business on July 23, 2007 and September 28, 2007, Direct Edge Holdings LLC (“Direct Edge Holdings”), the parent company of Direct Edge, issued equity interests to Citadel Derivatives Group LLC (“Citadel”) in exchange for cash. Immediately following the September 28, 2007 issuance to Citadel, the Company and Citadel sold a portion of their equity interests in Direct Edge Holdings to The Goldman Sachs Group, Inc. for cash. At the close of business on September 28, 2007 (the “Deconsolidation Date”), the Company deconsolidated Direct Edge Holdings as it no longer controlled Direct Edge Holdings as of that date. The results of Direct Edge’s operations have been included in the Consolidated Statements of Operations for all periods presented from the original acquisition date through the Deconsolidation Date. We account for our interest in Direct Edge Holdings under the equity method for periods subsequent to the Deconsolidation Date. In December 2008, we sold part of our remaining interest in Direct Edge Holdings. As a result of that sale we own a 19.9% interest in Direct Edge Holdings.
| • | In January 2008, we acquired EdgeTrade Inc. (“EdgeTrade”) for $58.2 million comprising $28.2 million of cash and approximately 2.3 million shares of unregistered Knight common stock. EdgeTrade was an agency-only trade execution and algorithmic software firm that allowed buy- and sell-side clients to more effectively source liquidity and manage the trading process as well as maintain anonymity, reduce market impact and lower transaction costs. EdgeTrade merged into Knight Direct in August 2008. |
Clients and Products
Clients
Within Equities, we offer products and provide services via electronic and voice access points primarily to two main client groups: sell-side (also referred to as broker-dealers) and buy-side (also referred to as institutions). Our sell-side clients include global, national, regional and on-line broker-dealers, private wealth managers and traditional investment banks in North America and Europe. Knight provides sell-side clients with deep liquidity, high fulfillment rates and high-quality trade executions according to client-defined and regulatory measures. Our buy-side clients include mutual funds, pension plans, plan sponsors, hedge funds, trusts and endowments across North America, Europe and the Asia-Pacific region. Knight provides buy-side clients with deep liquidity, actionable market insights, anonymity and trade executions with minimal market impact.
In 2009, our Equities business did not have any client that accounted for more than 10% of our U.S. equity dollar value traded.
7
Table of Contents
We offer capital markets services to small- and mid-cap corporate issuers as well as private companies in the U.S. We offer corporate issuers and private companies with capital structure advisory services and access to our large equity distribution network.
Products and Services
Our strategy for our Equities segment is to continue to differentiate ourselves from competitors by providing high quality and competitive trade execution services combined with superior client service. Over the past several years we have worked to expand our products and services.
For our buy-side clients, we offer comprehensive, unbundled trade execution services covering the depth and breadth of the market. We handle large complex trades, accessing liquidity from our order flow, as well as other sources. When liquidity is not naturally present in the equities market, we offer capital facilitation, when necessary, to complete our clients’ trades. Our institutional products include access to our global sales and trading team, as well as our electronic trading products. Our institutional equity products and services include global equity, option and futures trade execution solutions, block trading, program trading, special situations/risk arbitrage, soft dollar and commission recapture programs, corporate access services, direct market access through Knight DirectTM, EdgeTrade algorithms and internal crossing through our Knight Match product. In 2009 we added exchange-traded fund (“ETF”) sales and trading and Knight Strategic Research to our institutional equity client offering. The majority of our revenues from institutional clients are commissions on agency transactions or commission-equivalents on riskless principal transactions.
We seek to provide sell-side clients with high quality and competitive trade executions that enable them to satisfy their fiduciary obligations to their customers to seek to obtain the best execution reasonably available in the marketplace. Most of our equity order flow is executed as principal and handled electronically using sophisticated algorithms to optimize the execution of client order flow, including access to our off-exchange liquidity through Knight Link. We maintain a team of cash traders to handle oversized or difficult-to-handle executions. The majority of the revenues we earn from broker-dealer clients are net trading revenues, generated from the difference between the price paid when we buy securities and the price received when we sell securities. We also interact directly with street flow through our high velocity algorithmic principal trading models. We have also begun the process of developing capabilities in electronic options market-making.
During 2009, we commenced the implementation of self-clearing for our equities trades. In connection with this initiative, we have developed, and continue to enhance, a proprietary platform and have enhanced our operational processes and infrastructure. We began clearing a limited number of proprietary trades in the second half of 2009 and expect to increase the number of trades we self-clear in 2010, with the intention to fully self-clear in the future.
Equities Competition
Since the second half of 2008, the securities markets endured unprecedented market conditions with high volatility, dramatic credit tightening and increased counterparty risk, requiring us to continue to adapt to our clients’ needs amidst an evolving competitive landscape. Our client offerings, including our trade execution services, compete primarily with similar products offered by domestic and international broker-dealers, exchanges, ATSs, crossing networks, ECNs and dark liquidity pools. We also compete with various market participants who utilize highly automated, electronic trading models. Another source of competition is broker-dealers who execute portions of their client flow through internal market-making desks rather than sending the client flow to third party execution destinations, such as Knight.
8
Table of Contents
We compete primarily on the basis of our execution standards (including price, liquidity, speed and other client-defined measures), client relationships, client service, payments for order flow and technology. Over the past several years, regulatory changes, competition and the continued focus by regulators and investors on execution quality and overall transaction costs have resulted in a market environment characterized by narrowed spreads and reduced revenue capture metrics. Consequently, maintaining profitability has become extremely difficult for many firms similarly situated to Knight. Generally, improvements in execution quality, such as faster execution speed and greater price improvement, negatively impact the ability to derive revenues from executing client order flow. For example, we have made, and continue to make, changes to our execution protocols and quantitative models, which have had, or could have, a significant impact on our profitability. To remain profitable, some competitors have limited or ceased activity in illiquid or marginally profitable securities or, conversely, have sought to execute a greater volume of trades at a lower cost by increasing the automation and efficiency of their operations.
Competition for order flow in the U.S. equity markets continues to be intense and is evolving rapidly as reflected in publicly disclosed execution metrics; i.e., SEC Rules 605 and 606. These rules, applicable to broker-dealers, add greater disclosure to execution quality and order-routing practices. Rule 605 requires market centers that trade national market system securities to make available to the public monthly electronic reports that include uniform statistical measures of execution quality on a security-by-security basis. Rule 606 requires broker-dealers that route equity and option orders on behalf of their customers to make publicly available quarterly reports that describe their order routing practices and disclose the venues to which customer orders are routed for execution. These statistics on execution quality vary by order sender based on their mix of business. This rule also requires the disclosure of payment for order flow arrangements and internalization practices. The intent of this rule is to encourage routing of order flow to destinations based primarily on the demonstrable quality of executions at those destinations, supported by the order entry firms’ fiduciary obligations to seek to obtain best execution for their customers’ orders.
Commission rates have been under pressure for a number of years, and the ability to execute trades electronically through various competitive trading venues (including both domestic and international broker-dealers, exchanges, ATSs, crossing networks, ECNs and dark liquidity pools) has placed increased pressure on trading commissions. We believe the trend toward increased competition and the growth of these and other alternative trading venues will continue. We may experience competitive pressures in these and other areas in the future as some of our competitors seek to obtain greater market share by reducing prices. Competition for business with institutional clients is based on a variety of factors, including execution quality, research, reputation, soft dollar and commission recapture services, technology, market access (including direct market access and execution algorithms), client relationships, client service, cost and capital facilitation.
Other factors contributing to increasing competition for order flow are the significant mergers among U.S. market centers over the past several years and the launch of independent ECNs, dark liquidity pools and joint ventures with regional stock exchanges.
In the equities capital markets space, we seek to compete against traditional investment banks and smaller boutique-sized firms.
9
Table of Contents
FICC Segment
Business Segment Overview
We provide global research, voice sales and trading in fixed income, as well as electronic trading in fixed income and foreign exchange. Our approach to trading involves traditional sales and trading on behalf of our clients as well as operating neutral platforms with robust trading technology that electronically match buyers and sellers.
We engage in sales and trading for buy-side clients on a riskless principal basis in a variety of fixed income products. We also operate a fixed income ECN that allows sell-side clients to engage in electronic trading of municipals, corporates, agencies, treasuries and certificates of deposit and a foreign exchange ECN that allows buy-side clients to engage in electronic trading in various currencies as well as precious metals.
Our specialized products and services allow us to deepen relationships with existing clients, build liquidity across asset classes and establish relationships with new clients.
Our domestic FICC activities are primarily transacted out of the following subsidiaries: Knight Libertas Holdings LLC and its affiliates (collectively, “Knight Libertas”), Hotspot Holdings FX, Inc. and its subsidiaries (collectively, “Hotspot”) and Knight BondPoint, Inc. (“Knight BondPoint”). Knight BondPoint and one Knight Libertas subsidiary are broker-dealers registered with the SEC and members of FINRA and registered with the Municipal Securities Rulemaking Board (“MSRB”).
Our international FICC activities are primarily operated through KCEL, a U.K. registered broker-dealer authorized and regulated by the FSA. Hotspot and Knight Libertas each has businesses that operate and are regulated in the U.K. and Hong Kong. We intend to continue to expand our FICC business and product offerings in Europe and Asia in 2010.
Over the past four years, we have built up our FICC segment through acquisitions of complementary businesses in an effort to expand and diversify our products and services:
| • | In April 2006, we acquired Hotspot for $77.5 million in cash. Hotspot is an electronic foreign exchange marketplace that provides access to electronic foreign exchange spot trade executions through an advanced ECN-based platform. |
| • | In October 2006, we acquired Knight BondPoint for $18.2 million in cash. Knight BondPoint provides electronic access and trade execution services for the fixed income market. |
| • | In July 2008, we acquired Knight Libertas, for an upfront payment of $50.3 million in cash and approximately 1.5 million shares of unregistered Knight common stock valued at $25.0 million. The terms of the agreement include a potential earn-out to the sellers of up to $75.0 million of unregistered Knight common stock based on the future performance of Knight Libertas during the three-year period following the closing of the transaction. In 2009, Knight Libertas achieved its first year performance target which entitled the sellers to receive $33.3 million of the aforementioned earn-out in 1.6 million shares of unregistered Knight common stock, of which 50% of such shares will be issued in July 2010 and the remaining 50% will be issued in July 2011. Knight Libertas is a riskless principal fixed income broker-dealer specializing in a variety of fixed income products. |
Clients and Products
Clients
Within our FICC segment, we serve a broad range of buy-side and sell-side firms across fixed income, foreign exchange and precious metals.
10
Table of Contents
In 2009, our FICC segment did not have any client that accounted for more than 10% of our fixed income notional value traded.
In fixed income, our buy-side clients include mutual funds, insurance companies, pension funds, hedge funds and banks across North America, Europe and the Asia-Pacific region. Knight Libertas provides buy-side clients with access to investment research, a broad range of securities and products, trading expertise and an extensive client network to match buyers and sellers. Knight BondPoint’s sell-side clients include broker-dealers, financial advisors and private wealth managers in the U.S. Knight BondPoint provides sell-side clients with centralized liquidity, connectivity, price discovery and trading efficiencies.
In foreign exchange and precious metals, Hotspot’s buy-side clients include mutual funds, pension funds, hedge funds, banks and commodity trade advisors across North America, Europe and the Asia-Pacific region. Hotspot provides buy-side clients with access to liquidity and fast anonymous trade executions.
In FICC, we offer debt capital markets services to small- and mid-cap corporate issuers as well as private companies in the U.S. We offer corporate issuers and private companies with capital structure advisory services and access to our large debt distribution network.
Products and Services
The FICC business segment includes fixed income research, voice sales and trading, as well as capital markets activities. This segment also includes electronic fixed income and foreign exchange trading.
Knight Libertas is a fixed income broker-dealer providing buy-side firms with research, sales and riskless principal trading across a broad range of fixed income securities, including high-yield and high-grade corporate bonds, distressed debt, asset- and mortgage-backed securities, federal agency securities, convertible bonds, hybrid securities, syndicated bank loans and emerging markets. Fixed income research generates analytical reports that span the capital structure of fixed income issuers across 30 industry sectors in the U.S. and emerging markets.
Knight BondPoint provides electronic fixed income trading solutions to sell-side firms. Knight BondPoint operates a fixed income ECN that serves as an electronic inter-dealer system and allows clients to access live and executable offerings. Knight BondPoint also provides a front-end application for brokers and advisors as well as a trading application for traders.
Hotspot provides electronic foreign exchange trading solutions to buy-side firms through a foreign exchange ECN that provides clients with access to live, executable prices for 51 currency pairs as well as spot gold and silver streamed by market maker banks and other clients. Hotspot offers clients several access options including direct, high-speed connection and a traditional front-end application.
FICC Competition
During 2009, there was new competition in the fixed income industry, tightening spreads and increased competitive pressure on a global basis. Our institutional fixed income offering, including sales, trading and independent research, competes with traditional investment banks and boutique firms.
There was also increased competition among traditional investment banks with talent moving to smaller boutique-sized firms. Demand for experienced professionals is expected to remain high in 2010.
11
Table of Contents
The tightening of spreads in the fixed income market has put pressure on firms to expand their global presence and to expand into other asset classes. We have continued to expand our offering to include emerging markets, convertibles, syndicated bank loans and ABS/MBS and have broadened our geographical reach by increasing our European sales and trading team. Geographic growth and expansion of our product offering will remain key focuses in 2010.
Independent research remains one of our competitive advantages as many other firms have stopped delivering this type of research to their clients. Our offering of fundamental research across an issuer’s capital structure including bank debt, corporate bonds, convertible bonds, preferred shares and common stock, provides our clients with the ability to make informed decisions.
In the debt capital markets space, we seek to compete against traditional investment banks and smaller boutique-sized firms.
There is increasing pressure in the retail bond space to deliver best execution similar to the equity markets. By delivering centralized liquidity and an electronic inter-dealer system, we offer clients greater price discovery.
In foreign exchange, market conditions are dictated by fluctuations in interest rates, risk and volatility. During 2009, market conditions produced heightened trade volumes across the industry. Hotspot operates a foreign exchange ECN that provides live, executable prices on currency pairs streamed by market maker banks and institutional firms. Hotspot competes with other electronic trading platforms for orders from institutional firms and, to a lesser extent, with foreign exchange sales and trading teams at larger firms. Hotspot provides clients with anonymity, speed, market data and an array of order types. Hotspot competes on the basis of full market transparency, centralized price discovery and full depth-of-book display.
Corporate Segment
Our Corporate segment invests in strategic financial service-oriented opportunities, allocates, deploys and monitors all capital, and maintains all corporate overhead expenses and all other expenses that are not attributable to the Equities and FICC segments. The Corporate segment includes investment income earned on strategic investments and our corporate investment in the Deephaven Funds. Corporate overhead expenses primarily consist of compensation for certain senior executives and other individuals employed at the corporate holding company, legal and other professional expenses related to corporate matters, directors’ fees, investor and public relations expenses and directors’ and officers’ insurance. The results from our Corporate segment for 2008 and 2007 were positively impacted by gains resulting from the partial sales of equity interests in Direct Edge.
Discontinued Operations
During the first quarter of 2009, we exited our Asset Management segment by completing the sale of substantially all of Deephaven’s assets to Stark & Roth, Inc. (together with its affiliates, “Stark”). Stark also replaced Deephaven as the managing member and general partner for the Deephaven Funds. The results of our Asset Management segment have been included within discontinued operations.
Infrastructure
We have invested significant resources to expand our execution capacity and upgrade our trading systems and infrastructure and plan to make additional investments in technology and infrastructure in the future. Our ability to identify and deploy emerging technologies that facilitate the execution of trades, including developing and enhancing our quantitative models, is key to the successful execution of our business model. Technology has enhanced our capacity and ability to handle order flow faster
12
Table of Contents
and also has been an important component of our strategy to comply with government and industry regulations, achieve competitive execution standards, increase trading automation and provide superior client service. We continually enhance our use of technology and quantitative models to further refine our execution services. We also continue to develop and enhance our high velocity algorithmic principal trading models.
We use our proprietary technology and technology licensed from third parties to execute trades, monitor the performance of our traders, assess our inventory positions, manage risk and provide ongoing information to our clients. We are electronically linked to institutions and broker-dealers to provide immediate access to our trading operations and to facilitate the handling of client orders. Our business-to-business portal, and our Knight Link, Knight Match, Knight BondPoint, Hotspot and Knight Direct™ platforms and EdgeTrade algorithms, provide our clients with an array of tools to interact with our trading systems, many marketplaces throughout the globe, and most U.S. equity, futures and options market centers. In addition, we clear the majority of our trade executions through unaffiliated clearing brokers with whom we are electronically linked.
In connection with the implementation of our self-clearing initiative for equities, we developed, and continue to enhance, a proprietary clearing platform. We have deployed a dedicated team of technology, operations, finance and compliance professionals to support these efforts. In the second half of 2009, we began self-clearing a limited number of proprietary equities transactions on a daily basis. We expect to increase the number of trades we self-clear in 2010, with the intention to fully self-clear in the future.
Alternative trading and data center facilities are in place for our primary domestic Equities and FICC operations. These facilities have been designed to allow us to continue a substantial portion of our operations if we are prevented from accessing or utilizing our primary office locations for an extended period of time. While we employ significant steps to develop, implement and maintain reasonable business continuity plans, we cannot guarantee our alternative systems and facilities will provide full continuity of operations after a significant business disruption.
Intellectual Property and Other Proprietary Rights
Our success and ability to compete are dependent to a degree on our intellectual property, which includes our proprietary trading and execution technology, trade secrets and client base. We rely primarily on trade secret, trademark, domain name, patent and contract law to protect our intellectual property. It is our policy to enter into confidentiality, intellectual property invention assignment and/or non-competition and non-solicitation agreements or restrictions with our employees, independent contractors and business partners, and to control access to and distribution of our intellectual property.
Government Regulation and Market Structure
Most aspects of the Company’s business are subject to extensive securities regulation under federal, state and international laws. The SEC, Commodity Futures Trading Commission (“CFTC”), FSA, SFC, FINRA, NYSE, MSRB, National Futures Association (“NFA”), other self-regulatory organizations (“SRO”), and other regulatory bodies, such as state securities commissions and foreign regulators, promulgate numerous rules and regulations that may impact our business. As a matter of public policy, regulatory bodies are charged with safeguarding the integrity of the securities and other financial markets and with protecting the interests of investors in those markets. Regulated entities are subject to regulations concerning all aspects of their business, including trade practices, best execution practices, capital structure, record retention and the conduct of officers, supervisors and registered employees. Failure to comply with any of these laws, rules or regulations could result in administrative or court proceedings, censures, fines, the issuance of cease-and-desist orders or injunctions, or the
13
Table of Contents
suspension or disqualification of the entity and/or its officers, supervisors or registered employees. We, and certain of our past and present officers, directors and employees, have in the past been subject to claims alleging the violation of such laws, rules and regulations. We are currently subject to such matters as further described in Part I, Item 3 “Legal Proceedings” herein. Certain aspects of the Company’s public disclosure, corporate governance principles, internal control environment and the roles of auditors and counsel are subject to the Sarbanes-Oxley Act of 2002 and related regulations and rules of the SEC and Nasdaq.
Rule-making by the SEC, CFTC, FSA, SFC, FINRA, NYSE, MSRB, NFA, other SRO or foreign regulators and corresponding market structure changes has an impact on the Company’s regulated subsidiaries by directly affecting our method of operation and, at times, our profitability. Legislation can impose, and has imposed, significant obligations on broker-dealers, including those of our regulated subsidiaries. These increased obligations require the implementation and maintenance of internal practices, procedures and controls which have increased our costs and may subject us to regulatory inquiries, claims or penalties.
The regulatory environment in which we operate our Equities and FICC business is subject to constant change. Our business, financial condition and operating results may be adversely affected as a result of new or revised legislation or regulations imposed by the U.S. Congress, SEC, CFTC, FSA, SFC, FINRA, NYSE, MSRB, NFA, other SROs, other United States or foreign governmental regulatory authorities, and other regulatory bodies. Additional regulations, changes in existing laws and rules, or changes in interpretations or enforcement of existing laws and rules often directly affect the method of operation and profitability of regulated broker-dealers. We cannot predict what effect, if any, such changes might have. However, there were, and could be, significant technological, operational and compliance costs associated with the obligations which derive from compliance with such regulations.
The market structure in which the Equities and FICC business segments operates is rapidly changing. The expansion of many regional or national exchanges, in which several exchanges have created their own ATSs (e.g., ECNs) and now compete in the OTC, listed, and derivative trading venues, as well as the consolidation of exchanges (e.g., Nasdaq’s acquisition of the Boston and Philadelphia Stock Exchanges, as well as the NYSE’s acquisition of the American Stock Exchange) and the global expansion of exchanges (e.g., Nasdaq and the OMX, and NYSE and Euronext), have altered the landscape of the marketplace and intensified competition.
We have foreign based subsidiaries and plan to continue to expand our international presence. The brokerage industry in many foreign countries is heavily regulated, much like the U.S. The varying compliance requirements of these different regulatory jurisdictions and other factors may limit our ability to conduct business or expand internationally. For example, the Markets in Financial Instruments Directive (“MiFID”) adopted by the European Commission was implemented in November 2007. MiFID represented one of the more significant changes to take place in the operation of European capital markets. There were, and could be, significant technological and compliance costs associated with the obligations which derive from compliance with this regulation.
Net Capital Requirements
Certain of our subsidiaries are subject to the SEC’s Uniform Net Capital Rule. This rule, which specifies minimum net capital requirements for registered broker-dealers, is designed to measure the general financial integrity and liquidity of a broker-dealer and requires that at least a minimum part of its assets be kept in relatively liquid form. In general, net capital is defined as net worth (assets minus liabilities), plus qualifying subordinated borrowings and certain discretionary liabilities, less certain mandatory deductions that result from excluding assets that are not readily convertible into cash and
14
Table of Contents
from valuing conservatively certain other assets. Among these deductions are adjustments, commonly called haircuts, which reflect the possibility of a decline in the market value of an asset before disposition, and non-allowable assets.
Failure to maintain the required net capital may subject a firm to suspension or revocation of registration by the SEC, and suspension or expulsion by FINRA and other regulatory bodies, and ultimately could require the relevant entity’s liquidation. The Uniform Net Capital Rule prohibits payments of dividends, redemption of stock, the prepayment of subordinated indebtedness and the making of any unsecured advance or loan to a stockholder, employee or affiliate, if such payment would reduce the firm’s net capital below required levels.
A change in the Uniform Net Capital Rule, the imposition of new rules or any unusually large charges against net capital could limit those operations that require the intensive use of capital and also could restrict our ability to withdraw capital from our broker-dealer subsidiaries. A significant operating loss or any unusually large charge against net capital could adversely affect our ability to expand or even maintain our present levels of business.
Certain of our foreign subsidiaries are subject to capital adequacy requirements set by their respective regulators.
We believe that during 2009, all of our broker-dealer subsidiaries were in compliance with their capital adequacy requirements. In connection with an ongoing regulatory examination of one of our broker-dealer subsidiaries, an issue has been identified as to whether a cash balance had been maintained in an acceptable control location within a bank, and therefore whether such balance should be considered an allowable asset in determining net capital of the broker-dealer. Several of our broker-dealer subsidiaries maintained balances in similar accounts at the bank. Due to the uncertainty as to the ultimate outcome of the examiner’s findings, we have closed the accounts in question and moved the cash balances to a more commonly used control location. In the event that FINRA and/or the SEC conclude that such balances are deemed to be non-allowable assets, three of our broker-dealer subsidiaries may be considered to have had inadequate regulatory capital at December 31, 2009 due to this administrative matter. While it may be determined that the affected broker-dealers were in technical violation at December 31, 2009, the capital existed within the affected broker-dealers at that time and has subsequently been transferred to a more commonly used control location.
For additional discussion related to net capital, see Footnote 18 “Net Capital Requirements” included in Part II, Item 8 “Financial Statements and Supplementary Data” of this document.
Employees
At December 31, 2009, our headcount from continuing operations was 1,126 full-time employees, compared to 910 full-time employees at December 31, 2008. The increase in headcount is primarily related to personnel additions related to prior acquisitions, new products and geographic expansion throughout the year. Of our 1,126 full-time employees at December 31, 2009, 976 were employed in the U.S. and 150 outside the U.S., primarily in London. None of our employees is subject to a collective bargaining agreement. We believe that our relations with our employees are good.
We face a number of risks that may adversely affect our business, financial condition and operating results. The risks described below are not the only risks facing our Company. Additional risks and uncertainties not currently known to us or that we currently deem to be immaterial also may adversely affect our business, financial condition and/or operating results in a material manner.
15
Table of Contents
RISKS RELATED TO OUR BUSINESSES
| • | Conditions in the financial services industry and the securities markets may adversely affect our trading volumes and market liquidity |
Our Equities and FICC operating segments are primarily transaction-based, and declines in trading volumes, prices and market liquidity would adversely affect our business and profitability. Declines in the volume of equities and fixed income securities transactions and in market liquidity generally result in lower revenues from transaction execution activities. Lower price levels of securities and other instruments and tightening spreads may also result in reduced revenue capture, and thereby reduced revenues from trade executions. Declines in market values of securities or other instruments can result in illiquid markets, losses on securities or other instruments held in inventory, the failure of buyers and sellers to fulfill their obligations and settle their trades, and increases in claims and litigation.
During the second half of 2008, the global financial services industry and securities markets experienced unprecedented conditions including substantially increased volatility, losses resulting from declining asset values, defaults on securities, and reduced liquidity. Some of these conditions have continued in 2009 and 2010. These events resulted in the failure of certain financial services firms, have led other firms to seek mergers with commercial banks and forced other firms to become bank holding companies that are regulated by the Federal Reserve Bank. While uncertainty surrounding the credit crisis and expectations for economic recovery led to high overall market volatility in the first half of 2009 and increased trading volume in certain markets, this trend may not continue. If the levels of trading volume decrease as a result of events stemming from the current economic crisis, our transaction-based revenues will decrease. Accordingly, any reduction in trading volumes, market liquidity or volatility could adversely affect our business and financial results in a material fashion.
| • | Our future operating results may fluctuate significantly as a result of numerous factors |
We may experience significant variation in our future results of operations. These fluctuations may result from numerous factors. These factors include, among other things, market conditions and the resulting volatility and credit and counterparty risks that may result; introductions of, or enhancements to, trade execution services by us or our competitors; the value of our securities positions and other instruments and our ability to manage the risks attendant thereto; the volume of our trade execution activities; the dollar value of securities and other instruments traded; the composition and profile of our order flow; our market share with institutional and broker-dealer clients; the performance and size of, and volatility in, our quantitative market-making and program trading portfolios; the performance of our high velocity algorithmic principal trading models; the performance of our international operations; costs associated with international expansion and domestic growth; our ability to manage personnel, overhead and other expenses, including our occupancy expenses under our office leases and expenses and charges relating to legal and regulatory proceedings; the strength of our client relationships; changes in payments for order flow, changes in execution quality and changes in clearing, execution and regulatory transaction costs; the addition or loss of executive management, sales, electronic and voice trading and technology professionals; legislative, legal and regulatory changes; legal and regulatory matters or proceedings; geopolitical risk; the amount and timing of capital expenditures, acquisitions and divestitures; the integration, performance and operation of acquired businesses; the incurrence of costs associated with acquisitions and dispositions; investor sentiment; technological changes and events; seasonality; competition; and market and economic conditions.
Such factors may also have an impact on our ability to achieve our strategic objectives, including, without limitation, increases in our market share, growth and profitability in our Equities and FICC
16
Table of Contents
segments. If demand for our services declines in our Equities or FICC business segments due to any of the above factors, and we are unable to adjust our cost structure on a timely basis, our operating results could be materially and adversely affected. As a result of the foregoing factors, period-to-period comparisons of our revenues and operating results are not necessarily meaningful and such comparisons cannot be relied upon as indicators of future performance. There also can be no assurance that we will be able to continue the rates of revenue growth that we have experienced in the past or that we will be able to improve our operating results.
| • | Our trading activities expose us to the risk of significant losses |
We conduct our trading activities predominantly as principal, which subjects our capital to significant risks. These activities involve the purchase, sale or short sale of securities and other instruments for our own account and, accordingly, involve risks of price fluctuations and illiquidity, or rapid changes in the liquidity of markets that may limit or restrict our ability to either resell securities or other instruments we purchase or to repurchase securities or other instruments we sell in such transactions. From time to time, we may have large position concentrations in securities or other instruments of a single issuer or issuers engaged in a specific industry, which might result in higher trading losses than would occur if our positions and activities were less concentrated. The success of our trading activities primarily depends upon our ability to attract order flow, the performance and size of, and volatility in, our quantitative market-making and program trading portfolios, the performance of our high velocity algorithmic principal trading models, market interaction, the skill of our trading personnel, general market conditions, effective hedging strategies and risk management processes, the price volatility of specific securities or other instruments, and the availability and allocation of capital. To attract order flow, we must be competitive on price, size of securities positions and other instruments traded, liquidity offerings, order execution speed, technology, reputation, and client relationships and service. In our role as a market maker, we attempt to derive a profit from the difference between the prices at which we buy and sell securities. However, competitive forces often require us to match, or improve upon, the quotes other market makers display and to hold varying amounts of securities in inventory. By having to maintain inventory positions, we are subject to a high degree of risk. There can be no assurance that we will be able to manage such risk successfully or that we will not experience significant losses from such activities. All of the above factors could have a material adverse effect on our business, financial condition and operating results.
| • | Regulatory and legal uncertainties could harm our business |
The capital markets industry in the United States and other jurisdictions where we conduct our business, is subject to extensive oversight under federal, state and applicable international laws as well as SRO rules. Broker-dealers and financial services firms are subject to regulations concerning all aspects of their business, including trade practices, best execution practices, capital structure, record-keeping, anti-money laundering and the conduct of their officers, supervisors and registered employees. Our operations and profitability may be directly affected by, among other things, additional legislation or regulation; changes in rules promulgated by the U.S Congress, SEC, CFTC, FSA, SFC, FINRA, NYSE, MSRB, NFA and other regulatory bodies or SROs; and changes in the interpretation or enforcement of existing laws, regulations and rules (including those related to the Foreign Corrupt Practices Act). Failure to comply with these laws, rules or regulations could result in, among other things, administrative or court proceedings, censure, fines, the issuance of cease-and-desist orders or injunctions, loss of membership, or the suspension or disqualification of the market participant or broker-dealer, and/or their officers, supervisors or registered employees. Our ability to comply with applicable laws, regulations and rules is largely dependent on our internal systems to ensure compliance, as well as our ability to attract and retain qualified compliance personnel. We are currently the subject of regulatory reviews and investigations that may result in disciplinary actions in the future due to alleged noncompliance.
17
Table of Contents
The events of 2007, 2008 and 2009 have led to various suggestions of an overhaul in financial regulation. Additional legislation, changes in rules, changes in the interpretation or enforcement of existing laws and rules, or the entering into businesses that subject us to new rules and regulations, may directly affect our mode of operation and our profitability.
The SEC, CFTC, FSA, SFC, FINRA, NYSE, MSRB, NFA and other regulatory bodies and SROs are constantly proposing, or enacting, new regulations for the marketplace. For example, the SEC has proposed a number of new regulations relating to the trading of securities, including: further short sale restrictions, elimination of flash orders, and limitations on the use of indications of interest; most recently, the SEC issued a Concept Release seeking public comment on certain market structure issues such as high frequency trading, co-location, and markets that do not publicly display priced quotations including dark liquidity pools. The SEC has stated that it is seeking to ensure that the current market structure is fair and serves the interests of “long-term investors.” Additionally, there continues to be a debate within Congress as to whether a transaction tax should be imposed on all (or some portion) of equity transactions. Any of these proposed laws, rules or regulations, as well as any regulatory or legal actions or proceedings, changes in legislation or regulation, and changes in market customs and practices could have a material adverse effect on the Company’s business, financial condition and operating results.
| • | Substantial competition could reduce our market share and harm our financial performance |
During the second half of 2008, the securities markets endured unprecedented market conditions with high volatility, dramatic credit tightening and increased counterparty risk. Some of these difficult conditions have continued into 2009 and beyond, requiring us to continue to adapt to our clients’ needs amidst an evolving competitive landscape. All aspects of our business are intensely competitive. We face competition in our Equities business primarily from global, national and regional broker-dealers, exchanges, ATSs, crossing networks, ECNs and dark liquidity pools. Equities competition is based on a number of factors, including our execution standards (e.g., price, liquidity, speed and other client-defined measures), client relationships and service, reputation, market structure, product and service offerings, and technology. In our FICC business, we face competition from global, national and regional broker-dealers who provide fixed income trade execution services, fixed income research firms, spot foreign exchange execution firms and capital market service firms. Competition in our fixed income business is primarily on the basis of the quality of trade execution services, quality of research, market intelligence, quality of professional personnel, price execution, consistency of performance, ability to make markets in a variety of securities and reputation. A number of competitors of our Equities and FICC businesses have greater financial, technical, marketing and other resources than we do. Some of our competitors offer a wider range of services and financial products than we do and have greater name recognition and a more extensive client base. These competitors may be able to respond more quickly than we do to new or evolving opportunities and technologies, market changes, and client requirements and may be able to undertake more extensive promotional activities and offer more attractive terms to clients. Moreover, current and potential competitors have established or may establish cooperative relationships among themselves or with third parties or may consolidate to enhance their services and products. It is possible that new competitors, or alliances among competitors, may also emerge and they may acquire significant market share. The trend toward increased competition in our businesses is expected to continue and it is possible that our competitors may acquire increased market share.
As a result of the above, there can be no assurance that we will be able to compete effectively with current or future competitors, which could have a material adverse effect on our business, financial condition and operating results.
18
Table of Contents
| • | We could lose significant sources of revenues if we lose any of our larger clients |
At times, a limited number of clients has accounted for a significant portion of our order flow, revenues and profitability, and we expect a large portion of the future demand for, and profitability from, our trade execution services to remain concentrated within a limited number of clients. None of our clients is contractually obligated to utilize us for trade execution services and, accordingly, these clients may direct their trade execution activities to other execution providers or market centers at any time. Some of these clients have acquired market makers and specialist firms to internalize order flow or have entered into strategic relationships with competitors. There can be no assurance that we will be able to retain these major clients or that such clients will maintain or increase their demand for our trade execution services. The loss, or a significant reduction, of demand for our services from any of these clients could have a material adverse effect on our business, financial condition and operating results.
| • | Exposure to credit risk and the increased risk of defaults by counterparties may adversely affect our results of operations |
Since the second half of 2008, the market has experienced unprecedented levels of defaults and uncertainty among participants in the financial services industry, with the failure of some firms and the bailout of other distressed institutions. We are at risk if issuers whose securities or other instruments we hold, customers, trading counterparties, counterparties under derivative contracts, clearing agents, exchanges, clearing houses or other financial intermediaries or guarantors default on their obligations to us due to bankruptcy, insolvency, lack of liquidity, adverse economic conditions, operational failure, fraud or other reasons. Such defaults could have a material adverse effect on our results of operations, financial condition and cash flows.
We conduct the majority of our trade executions as principal or riskless-principal with broker-dealers, financial services firms and institutional counterparties. We clear the majority of our trade executions through unaffiliated clearing brokers. Under the terms of the agreements between us and our clearing brokers, the clearing brokers have the right to charge us for losses that result from a counterparty’s failure to fulfill its contractual obligations. No assurance can be given that any such counterparty will not default on its obligations, which default could have a material adverse effect on our business, financial condition and operating results. At any time, a substantial portion of our assets are held at one or more clearing brokers and, accordingly, we are subject to credit risk with respect to such clearing brokers. One firm clears the majority of our trades and holds the majority of our assets. Consequently, we are reliant on the ability of our clearing brokers to adequately discharge their obligations on a timely basis. We are also dependent on the solvency of such clearing brokers. Any failure by the clearing brokers to adequately discharge their obligations on a timely basis, the insolvency of a clearing broker, or any event adversely affecting the clearing brokers could have a material adverse effect on our business, financial condition and operating results.
| • | The move to a self-clearing environment exposes us to significant operational, financial, and liquidity risks |
We have undertaken an initiative to self-clear our securities transactions using an internally-developed platform and currently self-clear a limited number of proprietary equities transactions on a daily basis. We expect to increase the number of trades we self-clear in 2010, with the intention to fully self-clear in the future. The conversion to self-clearing exposes our business to operational risks, including business disruption, operational inefficiencies, liquidity and financing risks and potentially increased expenses and lost revenue opportunities. While our conversion process, including the design and implementation of the clearing platform, redesigned operational processes, enhanced infrastructure, and current and future financing arrangements, has been carefully planned, we may nevertheless encounter difficulties in the process that may lead to operating inefficiencies, including
19
Table of Contents
delays in implementation, dissatisfaction amongst our client base, disruption in the infrastructure that supports the business, inadequate liquidity and financial loss. Any such delay, disruption or failure could adversely affect our ability to effect transactions and manage our exposure to risk.
| • | We may not be able to keep up with rapid technological and other changes or adequately protect our intellectual property |
The markets in which we compete are characterized by rapidly changing technology, evolving industry standards, frequent new product and service announcements, introductions and enhancements, and changing client demands. If we are not able to keep up with these rapid changes on a timely and cost-effective basis, we may be at a competitive disadvantage. The widespread adoption of new internet, networking or telecommunications technologies or other technological changes could require us to incur substantial expenditures to modify or adapt our services or infrastructure. Any failure by us to anticipate or respond adequately to technological advancements, client requirements or changing industry standards or to adequately protect our intellectual property, or any delays in the development, introduction or availability of new services, products or enhancements, could have a material adverse effect on our business, financial condition and operating results.
| • | Capacity constraints, systems failures and delays could harm our business |
Our business activities are heavily dependent on the integrity and performance of the computer and communications systems supporting them and the services of certain third parties. Our systems and operations are vulnerable to damage or interruption from human error, natural disasters, power loss, computer viruses, intentional acts of vandalism, terrorism and other similar events. Extraordinary trading volumes or other events could cause our computer systems to operate at an unacceptably low speed or even fail. While we have invested significant amounts of capital to upgrade the capacity, reliability and scalability of our systems, there can be no assurance that our systems will be sufficient to handle such extraordinary trading volumes. Many of our systems are, and much of our infrastructure is, designed to accommodate additional growth without redesign or replacement; however, we may need to make significant investments in additional hardware and software to accommodate growth. Failure to make necessary expansions and upgrades to our systems and infrastructure could lead to failures and delays. Such failures and delays could cause substantial losses for our clients and could subject us to claims from our clients for losses, including litigation claiming fraud or negligence. In the past, high trading volume has caused significant delays in executing some trading orders, resulting in some clients’ orders being executed at prices they did not anticipate. From time to time, we have reimbursed our clients for losses incurred in connection with systems failures and delays.
Capacity constraints, systems failures and delays may occur again in the future and could cause, among other things, unanticipated disruptions in service to our clients, slower system response times resulting in transactions not being processed as quickly as our clients desire, decreased levels of client service and client satisfaction, and harm to our reputation. If any of these events were to occur, we could suffer a loss of clients, including our largest clients, or a reduction in the growth of our client base, increased operating expenses, financial losses, litigation or other client claims, and regulatory sanctions or additional regulatory burdens.
We have developed business continuity capabilities that can be utilized in the event of a disaster or disruption. Since the timing and impact of disasters and disruptions are unpredictable, we have to be flexible in responding to actual events as they occur. Significant business disruptions can vary in their scope. A disruption might only affect the Company, a building housing the Company, a business district in which the Company is located, a city in which the Company is located or an entire region. Within each of these areas, the severity of the disruption can also vary from minimal to severe. Our business continuity facilities are designed to allow us to substantially continue operations if we are prevented from accessing or utilizing our primary offices for an extended period of time. Although we
20
Table of Contents
have employed significant effort to develop, implement and maintain reasonable business continuity plans, the Company cannot guarantee our systems will fully recover after a significant business disruption in a timely fashion. If we are prevented from using any of our current trading operations or any third party services, or if our business continuity operations do not work effectively, we may not have complete business continuity. This could have a material adverse effect on our business, financial condition and operating results.
| • | Our business is subject to substantial risk from litigation, regulatory investigations and potential liability under federal, state and international laws, rules and regulations |
Many aspects of our business involve substantial risks of liability. We are exposed to liability under federal and state securities laws, other federal and state laws and court decisions, as well as rules and regulations promulgated by the SEC, CFTC, FSA, SFC, FINRA, NYSE, MSRB, NFA, Department of Labor and other U.S. and non-U.S. regulatory bodies and SROs. We are also subject to the risk of litigation. From time to time, we, and certain of our past and present officers, directors and employees, have been named as parties in legal actions, regulatory investigations and proceedings, arbitrations and administrative claims and have been subject to claims alleging the violation of such laws, rules and regulations, some of which have resulted in the payment of fines and settlements. Moreover, we may be required to indemnify past and present officers, directors and employees in regards to these matters. We are subject to such matters as further described in “Legal Proceedings” in Part I, Item 3 herein. Certain corporate events, such as a reduction in our workforce, could also result in additional litigation or arbitration.
As we intend to defend vigorously any such litigation or proceeding, we could incur significant legal expenses. An adverse resolution of any current or future lawsuits, legal or regulatory proceedings or claims against us could have a material adverse effect on the Company’s business and reputation, financial condition and operating results.
| • | We have incurred substantial debt obligations under our Credit Agreement that could adversely affect our operations and financial condition |
As of December 31, 2009, we have borrowed the maximum $140.0 million of indebtedness under our three-year credit facility (the “Credit Agreement”) we entered into in October 2007. The proceeds of the borrowings under our credit facility have been used to finance share repurchases, finance selective acquisitions and for general corporate purposes. Incurring substantial indebtedness may have adverse consequences on us, including increasing our vulnerability to general adverse economic and industry conditions; limiting our ability to compete with other less leveraged competitors and our flexibility in planning for, or reacting to, changes in our business and the industry in which we operate; limiting our ability to borrow additional funds for working capital, capital expenditures, acquisitions, expansions and general corporate or other purposes; and exposing us to interest rate risk because the interest rate on borrowings under our credit facility is variable.
Moreover, our ability to repay or refinance our debt when due in October 2010, will depend on our successful financial and operating performance, and our ability to extract capital from our regulated subsidiaries. In addition, the Credit Agreement contains customary representations, warranties, affirmative and negative covenants (including, among others, limitations on certain payments, investments and transactions) and events of defaults. The Credit Agreement also contains financial covenants tied to the maintenance of financial ratios and metrics. These obligations may limit certain activities of the Company, including, but not limited to, certain mergers, acquisitions or dispositions of assets, repurchases of shares and payment of dividends, in each case above certain threshold amounts as set forth in the Credit Agreement. Our ability to satisfy certain of these covenants can be affected by a number of factors, many of which are beyond our control, and there can be no assurances that we will be able to satisfy them.
21
Table of Contents
| • | We are highly dependent on key personnel |
We are highly dependent on a limited number of key personnel. Except for Thomas Joyce, our Chairman of the Board and Chief Executive Officer, who has an employment contract through December 2012, and the head of our fixed income business, no other key executive has an employment contract with the Company. Our success will be dependent to a large degree on our ability to retain the services of our existing key executives and to attract and retain additional qualified personnel in the future. Competition for such personnel is intense. The loss of the services of any of our key executives or the inability to identify, hire and retain necessary highly qualified executive management in the future could have a material adverse effect on our business, financial condition and operating results.
Our success also depends, in part, on the highly skilled, and often specialized, individuals we employ. Our ability to attract and retain management, sales, electronic and voice trading and technology professionals is important to our business strategy. The Company strives to provide high quality services that will allow it to establish and maintain long-term relationships with its clients. The Company’s ability to do so depends, in large part, upon the individual employees who represent the Company in its dealings with such clients. There can be no assurance that the Company will not lose such professionals due to increased competition or other factors in the future. The loss of sales, trading or technology professionals, particularly senior professionals with broad industry expertise, could have a material adverse effect on the Company’s business, financial condition and operating results.
| • | Acquisitions, strategic investments and strategic relationships involve certain risks |
Over the last several years, we have undertaken several strategic acquisitions, including the completed acquisitions of EdgeTrade and Knight Libertas. We intend to continue to pursue opportunistic strategic acquisitions of, or investments in, businesses and technologies. Acquisitions may entail numerous risks, including difficulties in assessing values for acquired businesses, intangible assets and technologies, difficulties in the assimilation of acquired operations and products, diversion of management’s attention from other business concerns, assumption of unknown material liabilities of acquired companies, amortization of acquired intangible assets and the potential writedown of goodwill due to impairment, which could reduce future reported earnings, or result in potential loss of clients or key employees of acquired companies. We may not be able to integrate successfully any operations, personnel, services or products that we have acquired or may acquire in the future. Strategic investments may also entail some of the risks described above. If these investments are unsuccessful, we may need to incur charges against earnings. We have also established a number of strategic relationships. These relationships and others we may enter into in the future may be important to our business and growth prospects. We may not be able to maintain these relationships or develop new strategic alliances.
| • | International expansion involves certain risks |
The Company is expanding its international presence which may expose the Company to cultural, regulatory and governmental risks. The financial services industry in many foreign countries is heavily regulated, much like the U.S. The varying compliance requirements of these different regulatory jurisdictions and other factors may limit our ability to successfully conduct or expand our business internationally. Additionally, the expansion into international locations involves substantial operational and execution risk. We may not be able to manage these risks effectively.
| • | The market price of our common stock could fluctuate significantly |
Our Class A Common Stock, and the U.S. securities markets in general, have experienced significant price fluctuations in recent years. The price of our Class A Common Stock could decrease substantially. Since the market price of our Class A Common Stock tends to fluctuate significantly, we may become the subject of securities class action litigation which may result in substantial costs and a
22
Table of Contents
diversion of management’s attention and resources. Our future quarterly operating results may not consistently meet the expectations of securities analysts or investors, which could have a material adverse effect on the market price of our Class A Common Stock.
RISKS RELATED TO DISCONTINUED OPERATIONS—ASSET MANAGEMENT BUSINESS
| • | Deephaven may still face liabilities after the Stark Sale |
On March 31, 2009, Deephaven consummated the sale of substantially all of its assets to Stark (the “Stark Sale”). While the consummation of the Stark Sale was intended to facilitate Deephaven’s orderly exit from the asset management business, Deephaven is still subject to potential liabilities relating to its historical business operations and the Stark Sale. Under the terms of the Stark Sale, Stark assumed few, if any, potential historical liabilities of Deephaven which means that Deephaven continues to be responsible for any such liabilities. In addition, Deephaven and, in certain instances, we are responsible to indemnify Stark against certain potential liabilities and for breaches of representations, warranties and covenants under the sale agreement. Deephaven may also be subject to claims by, and liabilities to, various stakeholders or other parties, including Deephaven Fund investors, counterparties, regulatory authorities, owners and employees, resulting from the conduct of its business prior to the Stark Sale, the consummation of the Stark Sale and the terms offered to Deephaven Fund investors thereunder, and/or the wind-down of Deephaven’s business including the terminations of employment of Deephaven personnel.
| • | The reduction to cash of the Deephaven Fund portfolios may result in further losses to Fund investors and resulting claims |
Pursuant to the results of an election made by the investors of the Deephaven Funds, Stark is serving as investment manager, managing member and general partner of the Deephaven Funds. Stark is in the process of reducing to cash a significant portion, if not all, of the assets under management in the various Deephaven Funds. The attempt to reduce such investments to cash in a prompt manner may result in further losses to investors, including to our corporate investment in the Deephaven Funds. These losses could be exacerbated if trading counterparties take advantage of their knowledge that Stark may be reducing positions in the market. Any such losses may result in claims against Deephaven and/or Knight.
Item 1B. Unresolved Staff Comments
None.
Our corporate headquarters are located in Jersey City, New Jersey. We lease approximately 266,000 square feet at 545 Washington Boulevard under a lease that expires in October 2021. We also collectively lease approximately 121,000 square feet for our other office locations in the U.S., London and Hong Kong.
In January 2010, we entered into a lease for approximately 65,000 square feet of office space in Greenwich, Connecticut that expires in July 2024.
From time to time, we and certain of our past and present officers, directors and employees have been named as parties to legal actions, arbitrations, administrative claims and regulatory reviews and investigations arising in connection with the conduct of our businesses. We are subject to such matters at the present time. Although there can be no assurances, at this time the Company believes, based
23
Table of Contents
on information currently available, that the outcome of each of the matters will not have a material adverse effect on the consolidated financial condition of the Company, although they might be material to operating results for any particular period, depending, in part, upon operating results for that period.
Legal
Eagletech Communications Inc. et al. v. Citigroup, Inc. et al.—In this case, which was initially filed in the Circuit Court, Broward County, Florida, the plaintiffs generally allege that approximately 20 securities firms, including the Company, participated in a scheme to manipulate Eagletech stock using methods such as naked short selling. Pursuant to an Order dated June 25, 2008, the Court dismissed with prejudice four of plaintiffs’ federal claims against Knight and remanded plaintiffs’ remaining claims to the Clerk of the Circuit Court of the Seventeenth Judicial Circuit in and for Broward County, Florida. On or about July 25, 2008, plaintiffs filed a Notice of Appeal. On February 17, 2009, plaintiffs’ voluntary request to dismiss the Notice of Appeal was granted. The plaintiffs’ remaining claims are proceeding in state court.
Last Atlantis Capital LLC et al. v. Chicago Board Options Exchange, Inc. et al.—In January 2004, thirty-five securities firms, including the Company and its former operating subsidiary, Knight Financial Products LLC (collectively the “market-maker defendants”), as well as four options exchanges, were named in a complaint filed in the United States District Court for the Northern District of Illinois. The plaintiffs in the action allegedly submitted orders to buy and sell options on the four named options exchanges, and the market-maker defendants were prospective and/or actual counterparties to those orders. The plaintiffs alleged that during the period beginning on September 11, 2000 the market-maker defendants, among other things, failed to provide a competitive and orderly market for the purchase and sale of the options and issued false and misleading price quotations that deceived the plaintiffs. The plaintiffs alleged that this conduct violated the Sherman and Clayton Acts, the federal securities laws and Illinois state law, and also should result in common law liability. The plaintiffs requested unspecified monetary damages and injunctive relief. After motion practice had resulted in the dismissal of the antitrust claims against all defendants and all claims against some of the defendants, plaintiffs filed an amended complaint on April 5, 2007, which alleges federal claims based on the Securities Exchange Act of 1934 and state law claims based on Illinois statutory and common law. On May 25, 2007, the Company and Knight Financial Products LLC answered the amended complaint, denying liability. On February 7, 2008, the court reconsidered one of its prior orders and dismissed the Company and certain other defendants but not Knight Financial Products LLC. On January 7, 2010, the claims of four plaintiffs were dismissed with prejudice leaving five plaintiffs in the case. Discovery is proceeding and Knight Financial Products LLC is defending this action vigorously.
Regulatory
We own subsidiaries including regulated entities that are subject to extensive oversight under federal, state and applicable international laws as well as SRO rules. Changes in market structure and the need to remain competitive require constant changes to our systems and order handling procedures. We make these changes while continuously endeavoring to comply with many complex laws and rules. Compliance, surveillance and trading issues common in the securities industry are monitored by, reported to, and/or reviewed in the ordinary course of business by our primary regulators, the SEC, CFTC, FSA, SFC, FINRA, NYSE, MSRB, and NFA. As a major order flow execution destination, we are named from time to time in, or are asked to respond to a number of regulatory matters brought by U.S. regulators, foreign regulators and SROs that arise from our trading activity. The Company is currently the subject of various regulatory reviews and investigations. In some instances, these matters may rise to a SEC, CFTC, FSA, SFC, FINRA, NYSE, MSRB, NFA, other SRO disciplinary action and/or civil or administrative action.
24
Table of Contents
In March 2005, NASD (now known as FINRA) announced that it had charged Kenneth Pasternak, former CEO of Knight Securities, L.P. (“KSLP”) (now known as KEM), and John Leighton, former head of KSLP’s institutional sales desk, in an administrative complaint alleging “supervisory violations in connection with fraudulent sales to institutional customers in 1999 and 2000.” Pursuant to a decision dated April 11, 2007, the majority of a NASD Hearing Panel found that Pasternak and Leighton failed to supervise KSLP’s Institutional Sales Department reasonably during the period of January 1999 to September 2000 in violation of NASD rules. Pasternak and Leighton were each fined $100,000. Pasternak was suspended from acting in all supervisory capacities for two years and Leighton was barred from acting in all supervisory capacities. In May 2007, Pasternak and Leighton each filed a Notice of Appeal from the NASD Hearing Panel’s decision and the NASD filed a Notice of Cross-Appeal from the NASD Hearing Panel’s decision. This matter was heard on July 28, 2008 by a sub-committee of FINRA’s National Adjudicatory Council (the “NAC”), and we currently expect the NAC will issue its decision before the end of 2010.
Other Matters
In addition to the matters described above, in the normal course of business, the Company and its directors, officers and employees have been named, from time to time, as defendants or respondents in various legal actions, including arbitrations, class actions and other litigation arising in connection with their business activities. Certain of these legal actions include claims for substantial compensatory and/or punitive damages or claims for indeterminate amounts of damages. In view of the inherent difficulty of predicting the outcome of such matters, particularly in cases in which claimants seek substantial or indeterminate damages, the Company cannot predict with certainty the eventual loss, or range of loss, or the range of potential recovery, related to such matters. The Company is contesting liability and/or the amount of damages in each pending matter.
Item 4. Submission of Matters to a Vote of Security Holders
None.
25
Table of Contents
| Item 5. | Market for Registrant’s Common Equity, Related Stockholder Matters and Issuer Purchases of Equity Securities |
Our Class A Common Stock is listed on the Nasdaq Global Select Market under the symbol “NITE”. Public trading of our Class A Common Stock commenced on July 8, 1998. The following table sets forth, for the past two years, the high and low quarterly closing sales price per share of the Class A Common Stock as reported by the Nasdaq Global Select Market:
| 2009 |
High | Low | ||||
| First Quarter |
$ | 19.87 | $ | 13.54 | ||
| Second Quarter |
18.63 | 14.39 | ||||
| Third Quarter |
22.40 | 16.55 | ||||
| Fourth Quarter |
22.98 | 14.12 | ||||
| 2008 |
||||||
| First Quarter |
17.76 | 12.52 | ||||
| Second Quarter |
19.34 | 15.00 | ||||
| Third Quarter |
18.02 | 13.72 | ||||
| Fourth Quarter |
16.59 | 11.84 | ||||
The closing sale price of our Class A Common Stock as reported by the Nasdaq Global Select Market on February 22, 2010, was $16.36 per share. As of that date there were approximately 384 holders of record of our Class A Common Stock based on information provided by our transfer agent. The number of stockholders does not reflect the actual number of individual or institutional stockholders that hold our stock because certain stock is held in the name of nominees. Based on information made available to us by our transfer agent, there are approximately 34,000 beneficial holders of our Class A Common Stock. Restricted stock awards are included in the calculation of holders of record while restricted stock unit awards are not included.
We have never declared or paid a cash dividend on our Class A Common Stock. The payment of cash dividends is within the discretion of our Board of Directors and will depend on many other factors, including, but not limited to, our results of operations, financial condition, capital requirements, restrictions imposed by financing arrangements, general business conditions and legal requirements.
26
Table of Contents
Comparative Stock Performance Graph
The graph below compares the total cumulative return of the Knight Class A Common Stock from December 31, 2004 through December 31, 2009, to the Standard & Poor’s 500 Index and the SNL Broker/Dealer Index. The graph assumes that dividends were reinvested and is based on an investment of $100 on December 31, 2004.
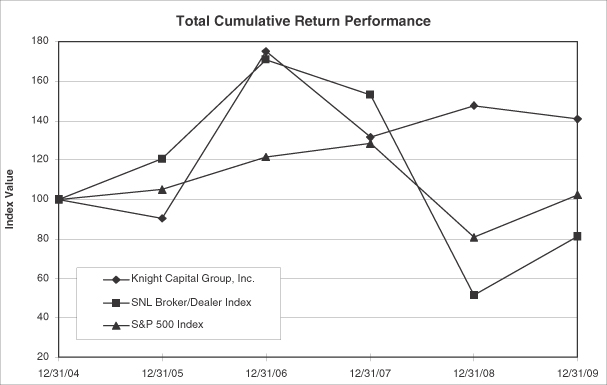
| Period Ending | ||||||||||||
| Index |
12/31/04 | 12/31/05 | 12/31/06 | 12/31/07 | 12/31/08 | 12/31/09 | ||||||
| Knight Capital Group, Inc. |
100.00 | 90.32 | 175.07 | 131.51 | 147.49 | 140.64 | ||||||
| SNL Broker/Dealer Index |
100.00 | 120.69 | 170.64 | 153.23 | 51.41 | 81.24 | ||||||
| S&P 500 Index |
100.00 | 104.91 | 121.48 | 128.16 | 80.74 | 102.11 | ||||||
27
Table of Contents
The following table contains information about our purchases of Knight Class A Common Stock during the fourth quarter of 2009 (in thousands, except per share amounts):
| Period |
Total Number of Shares Purchased |
Average Price Paid per Share |
Total Number of Shares Purchased as Part of Publicly Announced Plans or Programs(1) |
Approximate Dollar Value of Shares That May Yet Be Purchased Under the Plans or Programs | ||||||
| October 1, 2009 - October 31, 2009 |
||||||||||
| Common stock repurchases |
600 | 600 | $ | 235,719 | ||||||
| Employee transactions(2) |
22 | — | ||||||||
| Total |
622 | $ | 17.89 | 600 | ||||||
| November 1, 2009 - November 30, 2009 |
||||||||||
| Common stock repurchases |
200 | 200 | $ | 232,525 | ||||||
| Employee transactions(2) |
8 | — | ||||||||
| Total |
208 | $ | 15.98 | 200 | ||||||
| December 1, 2009 - December 31, 2009 |
||||||||||
| Common stock repurchases |
200 | 200 | $ | 229,597 | ||||||
| Employee transactions(2) |
215 | — | ||||||||
| Total |
415 | $ | 14.95 | 200 | ||||||
| Total |
||||||||||
| Common stock repurchases |
1,000 | 1,000 | ||||||||
| Employee transactions(2) |
245 | — | ||||||||
| Total |
1,245 | $ | 16.59 | 1,000 | ||||||
Totals may not add due to rounding.
| (1) | On April 4, 2002, the Company’s Board of Directors announced the authorization of a stock repurchase program, which allowed for the purchase of Class A Common Stock up to a total amount of $35 million. This repurchase program was increased by an aggregate of $965 million to a total of $1 billion by resolutions of the Company’s Board of Directors adopted on July 16, 2002, May 12, 2003, April 20, 2004, August 8, 2004, April 19, 2005, October 18, 2005, April 18, 2006 and July 17, 2007. The Company may repurchase shares from time to time in the open market, accelerated stock buyback programs, tender offers, privately negotiated transactions or by other means. Repurchases may also be made under a Rule 10b5-1 plan. The timing and amount of repurchase transactions will be determined by the Company’s management based on its evaluation of market conditions, share price, legal requirements and other factors. The program may be suspended, modified or discontinued at any time without prior notice. The Company cautions that there are no assurances that any further repurchases will actually occur. The repurchase program has no set expiration or termination date. |
| (2) | Represents shares of common stock withheld in satisfaction of tax withholding obligations upon vesting of employee equity awards. |
28
Table of Contents
Equity Compensation Plan Information
The following table sets forth certain information as of December 31, 2009, regarding the Company’s equity compensation plans for stock-based awards.
| Plan Category |
Number of securities to be issued upon exercise of outstanding options, warrants and rights |
Weighted-average exercise price of outstanding options, warrants and rights |
Number of securities remaining available for future issuance under equity compensation plans (excluding securities reflected in column(a))(1)(2) | ||||
| (In thousands, except weighted-average exercise price) | |||||||
| (a) | (b) | (c) | |||||
| Equity compensation plans approved by security holders |
3,554 | $ | 13.29 | 7,529 | |||
| Equity compensation plans not approved by security holders |
— | — | 1,122 | ||||
| Total |
3,554 | $ | 13.29 | 8,651 | |||
| (1) | Securities remaining available for future issuance under equity compensation plans approved by security holders comprise 1.6 million shares under the Knight Capital Group, Inc. 1998 Long Term Incentive Plan, 5.0 million shares under the Knight Capital Group, Inc. 2003 Equity Incentive Plan and 0.9 million shares under the Knight Capital Group, Inc. 2006 Equity Incentive Plan. |
| (2) | Securities remaining available for future issuance under equity compensation plans not approved by security holders comprise 1.1 million shares under the Knight Capital Group, Inc. Amended and Restated 2009 Inducement Award Plan. |
These plans are discussed further in Footnote 10, “Stock-Based Compensation” to the Company’s Consolidated Financial Statements included in Part II, Item 8 “Financial Statements and Supplementary Data.”
29
Table of Contents
Item 6. Selected Financial Data
The following should be read in conjunction with the Consolidated Financial Statements and the discussion under “Item 7. Management’s Discussion and Analysis of Financial Condition and Results of Operations” included elsewhere in this document. The Consolidated Statements of Operations Data for 2009, 2008 and 2007 and the Consolidated Statements of Financial Condition Data at December 31, 2009 and 2008 have been derived from our audited Consolidated Financial Statements included elsewhere in this document. The Consolidated Statements of Operations Data for 2006 and 2005 and the Consolidated Statements of Financial Condition Data at December 31, 2007, 2006 and 2005 are derived from Consolidated Financial Statements not included in this document.
| For the years ended December 31, | ||||||||||||||||||
| 2009 | 2008 | 2007 | 2006 | 2005 | ||||||||||||||
| Consolidated Statements of Operations Data(1): | (In thousands, except per share amounts) | |||||||||||||||||
| Revenues |
||||||||||||||||||
| Commissions and fees |
$ | 670,406 | $ | 478,126 | $ | 386,128 | $ | 339,857 | $ | 232,551 | ||||||||
| Net trading revenue |
486,684 | 446,707 | 286,199 | 243,761 | 165,614 | |||||||||||||
| Interest, net |
(1,712 | ) | 7,644 | 16,133 | 15,662 | 8,828 | ||||||||||||
| Investment income and other, net |
7,053 | 6,380 | 28,699 | 71,910 | 74,345 | |||||||||||||
| Total revenues |
1,162,431 | 938,857 | 717,159 | 671,190 | 481,338 | |||||||||||||
| Expenses |
||||||||||||||||||
| Employee compensation and benefits |
527,327 | 331,311 | 257,486 | 226,258 | 176,525 | |||||||||||||
| Execution and clearance fees |
169,805 | 107,402 | 120,261 | 106,908 | 99,427 | |||||||||||||
| Payments for order flow and ECN rebates |
71,629 | 43,639 | 54,564 | 42,191 | 21,220 | |||||||||||||
| Communications and data processing |
61,071 | 45,359 | 35,363 | 31,765 | 30,872 | |||||||||||||
| Depreciation and amortization |
34,368 | 26,535 | 21,567 | 20,059 | 15,338 | |||||||||||||
| Occupancy and equipment rentals |
23,177 | 19,642 | 13,194 | 12,644 | 12,684 | |||||||||||||
| Business development |
18,807 | 17,279 | 14,611 | 13,173 | 5,628 | |||||||||||||
| Professional fees |
13,043 | 14,749 | 14,491 | 16,961 | 16,227 | |||||||||||||
| Interest expense |
4,777 | 5,052 | 182 | 299 | 180 | |||||||||||||
| Writedown of assets and lease loss (benefit) accrual, net |
(9,704 | ) | 1,236 | (2,470 | ) | 8,480 | 10,009 | |||||||||||
| Other |
15,326 | 8,969 | 11,951 | 10,772 | 8,878 | |||||||||||||
| Total expenses |
929,626 | 621,173 | 541,200 | 489,510 | 396,988 | |||||||||||||
| Other Income |
||||||||||||||||||
| Non-operating gain from subsidiary stock issuance |
— | 15,947 | 8,757 | — | — | |||||||||||||
| Income from continuing operations before income taxes |
232,805 | 333,631 | 184,716 | 181,680 | 84,350 | |||||||||||||
| Income tax expense |
81,189 | 139,921 | 70,155 | 69,423 | 30,432 | |||||||||||||
| Income from continuing operations, net of tax |
151,616 | 193,710 | 114,561 | 112,257 | 53,918 | |||||||||||||
| (Loss) income from discontinued operations, net of tax |
(34,514 | ) | (15,799 | ) | 7,679 | 46,089 | 12,442 | |||||||||||
| Net Income |
$ | 117,102 | $ | 177,911 | $ | 122,240 | $ | 158,346 | $ | 66,360 | ||||||||
| Basic earnings per share from continuing operations |
$ | 1.70 | $ | 2.19 | $ | 1.18 | $ | 1.11 | $ | 0.52 | ||||||||
| Diluted earnings per share from continuing operations |
$ | 1.60 | $ | 2.11 | $ | 1.14 | $ | 1.06 | $ | 0.50 | ||||||||
| Basic earnings per share from discontinued operations |
$ | (0.39 | ) | $ | (0.18 | ) | $ | 0.08 | $ | 0.45 | $ | 0.12 | ||||||
| Diluted earnings per share from discontinued operations |
$ | (0.37 | ) | $ | (0.17 | ) | $ | 0.08 | $ | 0.43 | $ | 0.12 | ||||||
| Basic earnings per share |
$ | 1.31 | $ | 2.01 | $ | 1.26 | $ | 1.56 | $ | 0.64 | ||||||||
| Diluted earnings per share |
$ | 1.24 | $ | 1.94 | $ | 1.21 | $ | 1.49 | $ | 0.62 | ||||||||
| Shares used in computation of basic earnings per share |
89,095 | 88,407 | 97,050 | 101,420 | 103,456 | |||||||||||||
| Shares used in computation of diluted earnings per share |
94,504 | 91,760 | 100,796 | 106,243 | 106,882 | |||||||||||||
30
Table of Contents
| December 31, | |||||||||||||||
| 2009 | 2008 | 2007 | 2006 | 2005 | |||||||||||
| Consolidated Statements of Financial Condition Data: |
|||||||||||||||
| Cash and cash equivalents |
$ | 427,106 | $ | 416,957 | $ | 190,924 | $ | 170,958 | $ | 220,053 | |||||
| Securities owned, held at clearing brokers and depositories, at fair value |
926,589 | 476,111 | 412,565 | 711,775 | 380,367 | ||||||||||
| Total assets |
3,014,024 | 2,025,426 | 1,782,944 | 2,074,761 | 1,422,825 | ||||||||||
| Securities sold, not yet purchased, at fair value |
639,259 | 385,003 | 335,280 | 693,071 | 345,457 | ||||||||||
| Credit facility |
140,000 | 140,000 | 70,000 | — | — | ||||||||||
| Total Knight Capital Group, Inc. stockholders’ equity |
1,213,502 | 1,027,358 | 885,378 | 962,487 | 823,448 | ||||||||||
(1) - Certain prior year amounts have been reclassified to conform to current year presentation.
31
Table of Contents
| Item 7. | Management’s Discussion and Analysis of Financial Condition and Results of Operations |
Executive Overview
We are a financial services firm that provides market access and trade execution services across multiple asset classes for buy-side and sell-side clients. We seek to continually apply our expertise and innovation to the trade execution process to build lasting client relationships through consistent performance and superior client service. We also offer capital markets services to corporate issuers. We have three operating segments within our continuing operations, Equities, Fixed Income, Currencies and Commodities (“FICC”) and Corporate.
| • | Equities—Our Equities segment includes equity market-making, and electronic and voice institutional sales and trading in global equities, futures and options. In the course of market-making and trading, we provide capital facilitation and a range of complementary services. Within our Equities segment, we also offer equity capital markets services. |
| • | FICC—Our FICC segment includes global research, voice sales and trading in fixed income, as well as electronic trading in fixed income and foreign exchange. Fixed income research generates analytical reports containing recommendations across a wide range of securities and sectors. Within our FICC segment, we also offer debt capital markets services. |
| • | Corporate—Our Corporate segment invests in strategic financial services-oriented opportunities, allocates, deploys and monitors all capital, and maintains all corporate overhead expenses and all other expenses that are not attributable to the Equities and FICC segments. Corporate overhead expenses consist of compensation for senior executives and other employees of the corporate holding company, expenses from legal and other professional services relating to corporate matters as well as directors’ fees and directors’ and officers’ insurance. Results of our Corporate segment includes income from investments in funds formerly managed by Deephaven Capital Management. |
32
Table of Contents
The following table sets forth: (i) Revenues, (ii) Expenses, (iii) Other income and (iv) Pre-tax earnings (loss) from continuing operations of our segments and on a consolidated basis (in millions):
| For the years ended December 31, | ||||||||||||
| 2009 | 2008 | 2007 | ||||||||||
| Equities |
||||||||||||
| Revenues |
$ | 891.0 | $ | 851.5 | $ | 653.6 | ||||||
| Expenses |
663.7 | 505.0 | 470.1 | |||||||||
| Pre-tax earnings |
227.3 | 346.4 | 183.5 | |||||||||
| FICC |
||||||||||||
| Revenues |
266.7 | 79.3 | 32.1 | |||||||||
| Expenses |
218.8 | 67.0 | 29.0 | |||||||||
| Pre-tax earnings |
47.8 | 12.3 | 3.1 | |||||||||
| Corporate |
||||||||||||
| Revenues |
4.7 | 8.1 | 31.5 | |||||||||
| Expenses |
47.1 | 49.1 | 42.0 | |||||||||
| Other income |
— | 15.9 | 8.8 | |||||||||
| Pre-tax (loss) |
(42.3 | ) | (25.1 | ) | (1.8 | ) | ||||||
| Consolidated |
||||||||||||
| Revenues |
1,162.4 | 938.9 | 717.2 | |||||||||
| Expenses |
929.6 | 621.2 | 541.2 | |||||||||
| Other income |
— | 15.9 | 8.8 | |||||||||
| Pre-tax earnings |
$ | 232.8 | $ | 333.6 | $ | 184.7 | ||||||
| Totals | may not add due to rounding. |
Consolidated Revenues in 2009 increased $223.6 million, or 23.8% from 2008, while consolidated Expenses increased $308.5 million or 49.7% from 2008. Consolidated Pre-tax earnings from continuing operations in 2009 decreased $100.8 million, or 30.2% from 2008.
The changes in our Pre-tax earnings (loss) from continuing operations by segment from 2008 to 2009 are summarized as follows:
| • | Equities—Our Pre-tax earnings from Equities decreased in 2009 by $119.1 million, or 34.4%, from 2008. The decrease is primarily due to increased transaction costs principally driven by higher share volume, lower revenue capture, increased regulatory transaction fees and additional costs in 2009 associated with increased compensation due to additional headcount and our investments in businesses and infrastructure, both domestically and internationally. These factors were partially offset by higher equity volumes. |
| • | FICC—Our Pre-tax earnings from FICC increased in 2009 by $35.5 million, or 289.2%, from 2008. The increase is primarily due to higher earnings from Knight Libertas, which was acquired during the third quarter of 2008 offset, in part, by additional costs in 2009 associated with our investments in businesses and infrastructure, both domestically and internationally. |
| • | Corporate—Our Pre-tax loss from our Corporate segment increased in 2009 by $17.2 million from 2008, primarily due to the $51.6 million gain from the partial sale of our equity interest in Direct Edge in 2008 offset, in part, by a $13.1 million reversal of a lease loss accrual in 2009. |
Certain Factors Affecting Results of Operations
We may experience significant variation in our future results of operations. These fluctuations may result from numerous factors. These factors include, among other things, introductions of or
33
Table of Contents
enhancements to trade execution services by us or our competitors; the value of our securities positions and other financial instruments and our ability to manage the risks attendant thereto; the volume of our trade execution activities; the dollar value of securities traded; the composition and profile of our order flow; volatility in the Equities and FICC markets; our market share with institutional and broker-dealer clients; the performance and size of, and volatility in, our quantitative market-making and program trading portfolios; the performance of our high velocity algorithmic principal trading models; the performance of our international operations; costs associated with our international expansion and domestic growth; our ability to manage personnel, compensation, overhead and other expenses, including our occupancy expenses under our office leases and expenses and charges relating to legal and regulatory proceedings; the strength of our client relationships; changes in payments for order flow, changes to execution quality and changes in clearing, execution and regulatory transaction costs; the addition or loss of executive management, sales, electronic and voice trading and technology professionals; legislative, legal and regulatory changes; legal and regulatory matters; geopolitical risk; the amount, timing and cost to build out our self-clearing initiative and other capital expenditures, acquisitions and divestitures; the integration, performance and operation of acquired businesses; the incurrence of costs associated with acquisitions and dispositions; investor sentiment; technological changes and events; seasonality; competition; and market and economic conditions.
Such factors may also have an impact on our ability to achieve our strategic objectives, including, without limitation, increases in our market share, growth and profitability in our Equities or FICC segments. If demand for our services declines due to any of the above factors, and we are unable to adjust our cost structure on a timely basis, our operating results could be materially and adversely affected. As a result of the foregoing factors, period-to-period comparisons of our revenues and operating results are not necessarily meaningful and such comparisons cannot be relied upon as indicators of future performance. There also can be no assurance that we will be able to continue the rates of revenue growth that we have experienced in the past or that we will be able to improve our operating results.
Trends
Global Economic Trends
Our businesses are affected by many factors in the global financial markets and worldwide economic conditions. These factors include the growth level of gross domestic product in the U.S., Europe and Asia, and the existence of transparent, efficient and liquid equity and debt markets and level of trading volumes.
Global economic conditions generally improved during 2009. Volatility levels across equity markets declined and credit spreads tightened during the year. Despite the slight improvements in economic conditions, there were still concerns about the outlook for global growth, inflation and declining asset values.
Trends Affecting Our Company
We believe that our businesses are affected by the aforementioned global economic trends as well as more specific trends. Some of the specific trends that impact our operations, financial condition and results of operations are:
| • | Broker-dealer clients continue to focus on statistics measuring the quality of equity executions (including speed of execution and price improvement). In an effort to improve the quality of their executions as well as increase efficiencies, market makers have increased the level of automation within their operations and the extent of price improvement. The greater focus on |
34
Table of Contents
| execution quality has resulted in greater competition in the marketplace, which, along with market structure changes and market conditions, has negatively impacted the revenue capture metrics of the Company and other market-making firms. |
| • | Equities and FICC transaction volumes executed by broker-dealers have fluctuated over the past few years due to retail and institutional investor sentiment, market conditions and a variety of other factors, resulting in a shift of product mix. Equities and FICC transaction volumes may not be sustainable and are not predictable. |
| • | Over the past several years several exchanges have entered into joint ventures with broker-dealers to create their own alternative trading systems (“ATS”) and electronic communication networks (“ECN”) and compete within the OTC and listed trading venues. In addition, there are many new entrants into the market, including ATS, Multilateral Trading Facilities, dark liquidity pools, high frequency trading firms, and market-making firms competing for retail and institutional order flow. Further, many broker-dealers are offering their own internal crossing networks. These factors continue to create further fragmentation and competition in the marketplace. |
| • | Market structure changes, competition and market conditions have triggered an industry shift toward market makers charging explicit commissions or commission equivalents to institutional clients for executions in OTC securities. For the majority of our institutional client orders, we charge explicit fees in the form of commissions or commission equivalents. Institutional commission rates have fallen in the past few years due to competitive forces and increased electronic trading, and may continue to fall in the future. |
| • | Market structure changes, competition and technology advancements have also led to a dramatic increase in electronic message traffic. These increases in message traffic place heavy strains on the technology resources, bandwidth and capacities of market participants. |
| • | Due to regulatory scrutiny over the past several years relating to equity sell-side research and the continued focus by investors on execution quality and overall transaction costs, more institutional clients allocate commissions to broker-dealers based on the quality of executions. In the past, a good deal of institutional equity commissions were allocated to broker-dealers in exchange for either research or soft dollar and commission recapture programs. |
| • | There has been continued scrutiny of the capital markets industry by the regulatory and legislative authorities. New legislation or new or modified regulations and rules could occur in the future and could materially impact the Company’s revenues and profitability. Members of Congress have raised various concerns about the regulatory structure of the U.S. capital markets and have asked the SEC to take a close look at the regulatory structure and make the changes necessary to insure the rule framework governing the U.S. capital markets is comprehensive and complete. The SEC has stated that it will carefully review, and propose rules where necessary, a variety of marketplace trading issues – including, but not limited to: high frequency trading, indications of interest, various forms of off-exchange trading, dark liquidity pools, post-trade attribution, co-location, and sponsored access. In addition, the SEC recently filed proposed rules dealing with short sales and flash orders which have not been finalized and are currently subject to public comment. The short sale proposals could make it more difficult for market makers to sell stock short. Any legislative or regulatory action, including, but not limited to, new laws, rules or regulations in these or other areas could, depending on their form and scope, adversely impact trading volumes and profitability. |
| • | There continues to be growth in equity electronic trading, as evidenced by increased volumes in direct market access platforms, algorithmic and program trading, high frequency trading and ECNs and dark liquidity pools. In addition, electronic trading continues to expand to other asset classes, including options, currencies and fixed income. The expansion of electronic trading may result in the growth of innovative electronic products and competition for order flow. |
35
Table of Contents
| • | The macro-economic environment and market conditions have had an adverse impact on the profitability of the institutional customer base, resulting in volatile earnings and decreased volumes. |
| • | During 2009, there have been increased volumes in lower-priced stocks, driven by the decline in overall stock prices. As market volume, in general, is not predictable, an increase in retail volume in stocks with lower share prices may decrease the profit potential of trading these shares, while, at the same time, increase trade- or share-based transaction costs, thus lowering overall profitability. |
Income Statement Items
The following section briefly describes the key components of, and drivers to, our significant revenues and expenses.
Revenues
Our revenues consist principally of Commissions and fees and Net trading revenue from our Equities and FICC segments.
Revenues on transactions for which we charge explicit commissions or commission equivalents, which include the majority of our institutional client orders, are included within Commissions and fees. Commissions and fees are primarily affected by changes in our equity, fixed income and foreign exchange transaction volumes with institutional clients, changes in commission rates and the level of our soft dollar and commission recapture activity.
Trading profits and losses on principal transactions are primarily related to our market-making activities and are included within Net trading revenue. These revenues are primarily affected by changes in the amount and mix of U.S. equity trade and share volumes, our revenue capture, dollar value of equities traded, our ability to derive trading gains by taking proprietary positions, changes in our execution standards, development of, and enhancement to, our quantitative market-making models, performance of our high velocity algorithmic principal trading models that interact with street flow, volatility in the marketplace, our mix of sell- and buy-side clients, regulatory changes and evolving industry customs and practices.
Interest income, net is earned from our cash held at banks and cash held in trading accounts at clearing brokers and from collateralized financing arrangements, such as stock borrowing. The Company’s third party clearing agreements call for payment or receipt of interest income, net of transaction-related interest charged by clearing brokers for facilitating the settlement and financing of securities transactions. Net interest is primarily affected by interest rates, the level of cash balances held at banks and clearing brokers, our level of securities positions in which we are long compared to our securities positions in which we are short, and the extent of our collateralized financing arrangements.
Investment income and other, net primarily represents income earned, net of losses, related to our corporate investment as a limited partner or non-managing member in the Deephaven Funds, our strategic investments and returns on deferred compensation investments. Such income or loss is primarily affected by the level of our corporate investment in the Deephaven Funds and corresponding performance by the Deephaven Funds, as well as the performance and activity of our strategic investments and changes in value of certain deferred compensation investments.
36
Table of Contents
Expenses
Employee compensation and benefits expense, our largest expense, primarily consists of salaries and wages paid to all employees and profitability-based compensation, which includes compensation paid to sales personnel, incentive compensation paid to all other employees based on our profitability and changes in value of certain deferred compensation investments. Employee compensation and benefits expense fluctuates, for the most part, based on changes in our revenues and business mix, profitability and the number of employees. Compensation for employees engaged in sales activities is determined primarily based on a percentage of their gross revenues net of certain transaction-based expenses.
Execution and clearance fees primarily represent fees paid to third party clearing brokers for clearing equities transactions, transaction fees paid to Nasdaq and other exchanges and regulatory bodies, and execution fees paid to third parties, primarily for executing trades on the New York Stock Exchange (“NYSE”) and other exchanges, and for executing orders through ECNs. Execution and clearance fees primarily fluctuate based on changes in equity trade and share volume, changes in execution strategies, rate of clearance fees charged by clearing brokers and rate of fees paid to ECNs, exchanges and certain regulatory bodies.
Payments for order flow represent payments to broker-dealer clients, in the normal course of business, for directing to us their order flow in U.S. equities. Payments for order flow fluctuate as we modify our rates and as our percentage of clients whose policy is not to accept payments for order flow varies. Payments for order flow also fluctuate based on U.S. equity share volume, our profitability and the mix of market orders and limit orders.
Communications and data processing expense primarily consists of costs for obtaining market data, telecommunications services and systems maintenance.
Depreciation and amortization expense results from the depreciation of fixed assets, which consist of computer hardware, furniture and fixtures, and the amortization of purchased software, capitalized software development costs, acquired intangible assets and leasehold improvements. We depreciate our fixed assets and amortize our purchased software, capitalized software development costs and acquired intangible assets on a straight-line basis over their expected useful lives. We amortize leasehold improvements on a straight-line basis over the lesser of the life of the improvement or the remaining term of the lease.
Occupancy and equipment rentals consist primarily of rent and utilities related to rented premises and office equipment.
Professional fees consist primarily of legal, accounting and consulting fees.
Business development consists primarily of costs related to marketing, conferences and relationship management.
Interest expense consists primarily of costs associated with our credit facilities and for collateralized financing arrangements such as stock lending.
Other income
Other income consists of non-operating gains from subsidiary stock issuances relating to the partial sales of our ownership of Direct Edge.
37
Table of Contents
Results of Operations
The following table sets forth the consolidated statements of operations data as a percentage of total revenues:
| For the years ended December 31, |
|||||||||
| 2009 | 2008 | 2007 | |||||||
| Revenues |
|||||||||
| Commissions and fees |
57.7 | % | 50.9 | % | 53.2 | % | |||
| Net trading revenue |
41.9 | % | 47.6 | % | 39.4 | % | |||
| Interest, net |
-0.1 | % | 0.8 | % | 2.2 | % | |||
| Investment income and other, net |
0.6 | % | 0.7 | % | 5.2 | % | |||
| Total revenues |
100.0 | % | 100.0 | % | 100.0 | % | |||
| Expenses |
|||||||||
| Employee compensation and benefits |
45.4 | % | 35.3 | % | 35.5 | % | |||
| Execution and clearance fees |
14.6 | % | 11.4 | % | 16.6 | % | |||
| Payments for order flow and ECN rebates |
6.2 | % | 4.6 | % | 7.5 | % | |||
| Communications and data processing |
5.3 | % | 4.8 | % | 4.9 | % | |||
| Depreciation and amortization |
3.0 | % | 2.8 | % | 3.0 | % | |||
| Occupancy and equipment rentals |
2.0 | % | 2.1 | % | 1.8 | % | |||
| Business development |
1.6 | % | 1.8 | % | 2.0 | % | |||
| Professional fees |
1.1 | % | 1.6 | % | 2.0 | % | |||
| Regulatory charges and related matters |
0.0 | % | 0.0 | % | 0.3 | % | |||
| Interest expense |
0.4 | % | 0.5 | % | 0.0 | % | |||
| Writedown of assets and lease loss accrual (benefit), net |
-0.8 | % | 0.1 | % | -0.3 | % | |||
| Other |
1.3 | % | 1.0 | % | 1.3 | % | |||
| Total expenses |
80.0 | % | 66.2 | % | 74.6 | % | |||
| Other Income |
|||||||||
| Non-operating gain from subsidiary stock issuance |
0.0 | % | 1.7 | % | 0.0 | % | |||
| Income from continuing operations before income taxes |
20.0 | % | 35.5 | % | 25.4 | % | |||
| Income tax expense |
7.0 | % | 14.9 | % | 9.7 | % | |||
| Income from continuing operations, net of tax |
13.0 | % | 20.6 | % | 15.8 | % | |||
| (Loss) income from discontinued operations, net of tax |
-3.0 | % | -1.7 | % | 1.1 | % | |||
| Net income |
10.1 | % | 18.9 | % | 16.8 | % | |||
Percentages may not add due to rounding.
Years Ended December 31, 2009 and 2008
Revenues
The results for the year ended December 31, 2009 and 2008 include the full year results of KEM, KCM, Knight Libertas, Knight Direct, Hotspot, Knight BondPoint and KCEL. EdgeTrade was acquired in January 2008 and merged into Knight Direct in August 2008. Knight Libertas was acquired in July 2008. The results of EdgeTrade and Knight Libertas are consolidated from their respective acquisition dates.
38
Table of Contents
Equities
| For the years ended December 31, | ||||||||||||||
| 2009 | 2008 | Change | % of Change | |||||||||||
| Commissions and fees (millions) |
$ | 405.2 | $ | 392.5 | $ | 12.7 | 3.2 | % | ||||||
| Net trading revenue (millions) |
485.8 | 446.9 | 38.9 | 8.7 | % | |||||||||
| Interest, net (millions) |
(3.2 | ) | 3.6 | (6.7 | ) | -188.7 | % | |||||||
| Investment income and other, net (millions) |
3.2 | 8.6 | (5.4 | ) | -62.6 | % | ||||||||
| Total Revenues from Equities (millions) |
$ | 891.0 | $ | 851.5 | $ | 39.5 | 4.6 | % | ||||||
| Average daily U.S. equity dollar value traded ($ billions) |
23.0 | 19.2 | 3.9 | 20.1 | % | |||||||||
| Average daily U.S. equity trades (thousands) |
3,904.5 | 2,548.0 | 1,356.5 | 53.2 | % | |||||||||
| Nasdaq and Listed equity shares traded (billions) |
343.1 | 195.7 | 147.4 | 75.3 | % | |||||||||
| OTC Bulletin Board and Pink Sheet shares traded (billions) |
2,170.7 | 802.7 | 1,367.9 | 170.4 | % | |||||||||
| Average revenue capture per U.S. equity dollar value traded (bps) |
1.3 | 1.5 | (0.2 | ) | -12.5 | % | ||||||||
| Average daily Knight Direct equity shares (millions) |
69.1 | 50.6 | 18.5 | 36.7 | % | |||||||||
Total revenues from the Equities segment, which primarily comprises Commissions and fees and Net trading revenue from our domestic businesses, increased 4.6% to $891.0 million in 2009, from $851.5 million in 2008. Revenues in 2009 were positively impacted by higher volumes and improved results from additional trading strategies deployed through our quantitative market-making and high velocity algorithmic principal trading offset, in part, by lower average revenue capture per U.S. equity dollar value traded.
Average revenue capture per U.S. equity dollar value traded was 1.3 basis points (“bps”) in 2009, down 12.5% from 1.5 bps in 2008. The primary drivers for the decrease in revenue capture were the profile of our order flow which included a greater percentage of volumes derived from low-priced Nasdaq and Listed stocks, heightened competition, ongoing investments in price improvement and execution quality, and lower volatility. Average revenue capture per U.S. equity dollar value traded is calculated as the total of net domestic trading revenues plus U.S. institutional commissions and commission equivalents (included in Commissions and fees), less certain transaction-related regulatory fees (included in Execution and clearance fees), (collectively “Domestic Equity Trading Revenues”) divided by the total dollar value of the related equity transactions. Domestic Equity Trading Revenues were $756.5 million and $721.6 million in 2009 and 2008, respectively. Domestic Equity Trading Revenues do not include revenues from our international and direct market access businesses.
FICC
| For the years ended December 31, | |||||||||||||||
| 2009 | 2008 | Change | % of Change | ||||||||||||
| Commissions and fees (millions) |
$ | 265.0 | $ | 78.6 | $ | 186.4 | 237.0 | % | |||||||
| Net trading revenue (millions) |
0.9 | (0.1 | ) | 1.0 | N/M | ||||||||||
| Interest, net (millions) |
(0.7 | ) | 0.2 | (0.9 | ) | N/M | |||||||||
| Investment income and other, net (millions) |
1.5 | 0.6 | 0.9 | 153.1 | % | ||||||||||
| Total Revenues from FICC (millions) |
$ | 266.7 | $ | 79.3 | $ | 187.4 | 236.3 | % | |||||||
| Average daily Hotspot FX notional dollar value traded ($ billions) |
22.8 | 18.4 | 4.4 | 23.9 | % | ||||||||||
N/M—Not meaningful
39
Table of Contents
Total revenues from the FICC segment, which primarily comprises Commissions and fees, increased 236.3% to $266.7 million in 2009, from $79.3 million in 2008, primarily due to the inclusion of a full year of revenues from Knight Libertas in 2009 compared to a partial year in 2008, due to the closing of the transaction in July of that year as well as increased volumes from Hotspot and Knight BondPoint.
Corporate
| For the years ended December 31, | |||||||||||||
| 2009 | 2008 | Change | % of Change | ||||||||||
| Total Revenues from Corporate (millions) |
$ | 4.7 | $ | 8.1 | $ | (3.4 | ) | -41.6 | % | ||||
| Total Other income from Corporate (millions) |
— | 15.9 | (15.9 | ) | N/M | ||||||||
| NM—Not | meaningful |
Total revenues from the Corporate segment, which primarily represents income from our corporate investments as a limited partner or non-managing member in the Deephaven Funds and other strategic investments, decreased 41.6% to $4.7 million, from $8.1 million in 2008. Losses from our corporate investments in the Deephaven Funds were $2.2 million in 2009 and $28.3 million in 2008. These losses were primarily due to the performance of the Deephaven Funds and lower investment balances in such funds.
During 2008 we recognized a pre-tax gain of $51.6 million from the partial sale of our investment in Direct Edge. Of the $51.6 million pre-tax gain in 2008, $15.9 million is reported as Non-operating gain from subsidiary stock issuance, and $35.7 million is included in Investment income and other, net on the Consolidated Statements of Operations.
Expenses
Employee compensation and benefits expense increased to $527.3 million in 2009 from $331.3 million in 2008. As a percentage of total revenue, Employee compensation and benefits increased to 45.4% in 2009, from 35.3% in 2008. The increase on a dollar basis and as a percentage of total revenues was primarily due to increased headcount and a shift in the mix of our business, with a greater contribution from our voice-related businesses, including Knight Libertas, which generally have higher compensation ratios. The number of full time employees from continuing operations increased to 1,126 at December 31, 2009, from 910 at December 31, 2008, primarily due to the growth and expansion in our domestic and international Equities and FICC businesses and infrastructure, including our self-clearing initiative. Employee compensation and benefits expense fluctuates, for the most part, based on changes in our business mix, revenues, profitability and the number of employees.
Execution and clearance fees increased 58.1% to $169.8 million in 2009, from $107.4 million in 2008, primarily due to greater trade and share volumes along with higher regulatory fees resulting from higher rates enacted in the second quarter of 2009. As a percentage of total revenue, Execution and clearance fees increased to 14.6% in 2009, from 11.4% in 2008. Execution and clearance fees fluctuate based on changes in transaction volumes, regulatory fees and operational efficiencies and scale.
Payments for order flow increased to $71.6 million in 2009, from $43.6 million in 2008. As a percentage of total revenue, Payments for order flow increased to 6.2% in 2009, from 4.6% in 2008. This expense increased primarily due to the increase in shares traded, specifically in low-priced Nasdaq and Listed shares, increased profitability-based rebates paid to broker-dealer clients and heightened competition.
40
Table of Contents
Writedown of assets and lease loss accrual (benefit), net was a benefit of $9.7 million in 2009, primarily due to a $13.1 million lease loss reversal recognized with respect to office space at our 545 Washington Boulevard property in Jersey City, N.J. (the “J.C. lease”). We previously considered a portion of these premises to be excess real estate and had therefore recorded a lease loss accrual for such excess office space. Based on expected growth and future needs we decided to build out and occupy the excess office space and we therefore recorded a benefit related to the reversal of such previously recorded lease loss. Also included in Writedown of assets and lease loss accrual (benefit), net is a charge of $2.4 million related to our decision to discontinue the use of the Donaldson trade name, a charge of $292,000 due to a lease loss with respect to excess office space in New York City and the writedown of $699,000 of capitalized software resulting from the sale of Hotspot’s retail customer accounts.
All other expenses increased by $33.0 million to $170.6 million in 2009 from $137.6 million in 2008. Communications and data processing expense increased primarily due to higher market data and connectivity expenses within our business segments in connection with our overall growth. Depreciation and amortization expense increased primarily due to fixed asset purchases, greater capitalized software development costs and acquired intangible assets. Occupancy and equipment rentals expense increased primarily due to the costs associated with our international expansion efforts. Professional fees, which have fluctuated based on the activity relating to our various legal proceedings, decreased due to lower legal and consulting expenses. Other expenses increased due to higher employment fees and other administrative expenses.
Our effective tax rate for 2009 from continuing operations of 34.9% differed from the federal statutory rate of 35% primarily due to non-recurring tax benefits relating to the recognition of state net operating losses and the recognition of purchased net operating losses from certain acquisitions that demonstrated a track record of profitability during 2009, offset, by state income taxes and non-deductible charges.
41
Table of Contents
Years Ended December 31, 2008 and 2007
Revenues
The results for the years ended December 31, 2008 and 2007 include the full year results of KEM, KCM, Hotspot, Knight BondPoint and KCEL. EdgeTrade was acquired in January 2008 and merged into Knight Direct in August 2008. Knight Libertas was acquired in July 2008. The results of EdgeTrade and Knight Libertas are consolidated from their respective acquisition dates for the year ended December 31, 2008. The results of Direct Edge are included in the results of our Equities segment through September 28, 2007, which is the date that Direct Edge ceased to be consolidated for financial reporting purposes, and are recorded under the equity method within the Corporate segment subsequent to the Deconsolidation Date.
Equities
| For the years ended December 31, | |||||||||||||
| 2008 | 2007 | Change | % of Change | ||||||||||
| Commissions and fees (millions) |
$ | 392.5 | $ | 350.4 | $ | 42.1 | 12.0 | % | |||||
| Net trading revenue (millions) |
446.9 | 286.3 | 160.6 | 56.1 | % | ||||||||
| Interest, net (millions) |
3.6 | 14.0 | (10.4 | ) | -74.5 | % | |||||||
| Investment income and other, net (millions) |
8.6 | 3.0 | 5.6 | 190.5 | % | ||||||||
| Total Revenues from Equities (millions) |
$ | 851.5 | $ | 653.6 | $ | 197.9 | 30.3 | % | |||||
| Average daily U.S. equity dollar value traded ($ billions) |
19.2 | 12.7 | 6.4 | 50.4 | % | ||||||||
| Average daily U.S. equity trades (thousands) |
2,548.0 | 1,334.1 | 1,213.9 | 91.0 | % | ||||||||
| Nasdaq and Listed equity shares traded (billions) |
195.7 | 113.6 | 82.1 | 72.2 | % | ||||||||
| OTC Bulletin Board and Pink Sheet shares traded (billions) |
802.7 | 821.8 | (19.1 | ) | -2.3 | % | |||||||
| Average revenue capture per U.S. equity dollar value traded (bps) |
1.5 | 1.6 | (0.1 | ) | -5.0 | % | |||||||
Total revenues from the Equities segment, which primarily comprises Commissions and fees and Net trading revenue from our domestic businesses, increased 30.3% to $851.5 million in 2008, from $653.6 million in 2007. Revenues in 2008 were positively impacted by higher average daily U.S. equity dollar value traded, greater trade volumes, improved results from electronic quantitative market-making efforts, performance of our high velocity algorithmic principal trading models that interact with street flow and the addition of EdgeTrade offset, in part, by a decrease in revenue capture per U.S. equity dollar value traded, lower share volume in OTC Bulletin Board and Pink Sheet shares and the deconsolidation of Direct Edge in September 2007.
Average revenue capture per U.S. equity dollar value traded was 1.5 bps in 2008, down 5.0% from 1.6 bps in 2007. The primary driver for the decrease in revenue capture was a change in the mix of our order flow due to a significant increase in Nasdaq and Listed volumes from an expanded broker-dealer client base as well as a decrease in OTC Bulletin Board and Pink Sheet shares traded. Domestic Equity Trading Revenues were $721.6 million and $500.8 million in 2008 and 2007, respectively. Domestic Equity Trading Revenues do not include revenues from our international and DMA businesses.
42
Table of Contents
FICC
| For the years ended December 31, | |||||||||||||||
| 2008 | 2007 | Change | % of Change | ||||||||||||
| Commissions and fees (millions) |
$ | 78.6 | $ | 31.4 | $ | 47.2 | 150.4 | % | |||||||
| Net trading revenue (millions) |
(0.1 | ) | (0.1 | ) | (0.0 | ) | 57.0 | % | |||||||
| Interest, net (millions) |
0.2 | 0.5 | (0.3 | ) | -61.6 | % | |||||||||
| Investment income and other, net (millions) |
0.6 | 0.3 | 0.3 | 129.6 | % | ||||||||||
| Total Revenues from FICC (millions) |
$ | 79.3 | $ | 32.1 | $ | 47.2 | 146.8 | % | |||||||
Total revenues from the FICC segment, which primarily comprises Commissions and fees, increased 146.8% to $79.3 million in 2008, from $32.1 million in 2007. Revenues in 2008 were positively impacted from the acquisition of Knight Libertas in the middle of 2008 and increased revenues from Knight BondPoint.
Corporate
| For the years ended December 31, | |||||||||||||
| 2008 | 2007 | Change | % of Change | ||||||||||
| Total Revenues from Corporate (millions) |
$ | 8.1 | $ | 31.5 | $ | (23.5 | ) | -74.4 | % | ||||
| Total Other income from Corporate (millions) |
15.9 | 8.8 | 7.2 | 82.1 | % | ||||||||
Total revenues from the Corporate segment, which primarily represents income from our corporate investments as a limited partner or non-managing member in the Deephaven Funds and other strategic investments, decreased 74.4% to $8.1 million, from $31.5 million in 2007. Income from our corporate investments in the Deephaven Funds decreased to a loss of $28.3 million in 2008, down from a gain of $17.8 million in 2007. This decrease was primarily due to negative investment returns and lower investment balances in such funds during 2008.
Included in 2008 and 2007 are pre-tax gains of $51.6 million and $13.0 million, respectively, from the partial sales of our investment in Direct Edge. Of the $51.6 million pre-tax gain in 2008, $15.9 million is reported as Non-operating gain from subsidiary stock issuance, and $35.7 million is included in Investment income and other, net on the Consolidated Statements of Operations, while $8.8 million of the $13.0 million pre-tax gain in 2007 is reported as Non-operating gain from subsidiary stock issuance, and $4.2 million is included in Investment income and other, net on the Consolidated Statements of Operations.
Expenses
Employee compensation and benefits expense increased to $331.3 million in 2008 from $257.5 million in 2007. As a percentage of total revenue, Employee compensation and benefits decreased slightly to 35.3% in 2008, from 35.9% in 2007. The increase on a dollar basis is due to increased headcount. The number of full time employees from continuing operations increased to 910 at December 31, 2008, from 720 at December 31, 2007, primarily due to the growth and expansion in our Equities and FICC segments including the acquisitions of EdgeTrade and Knight Libertas. Employee compensation and benefits expense fluctuates, for the most part, based on changes in our business mix, revenues, profitability and the number of employees.
43
Table of Contents
Execution and clearance fees decreased 10.7% to $107.4 million in 2008 from $120.3 million in 2007, primarily due to the deconsolidation of Direct Edge in September 2007 and lower clearing rates offset, in part, by higher trade volumes. As a percentage of total revenue, Execution and clearance fees decreased to 11.4% in 2008 from 16.8% in 2007 primarily due to the deconsolidation of Direct Edge, which had higher transaction-based expenses as a percentage of revenue, and lower clearing rates. Execution and clearance fees fluctuate based on changes in transaction volumes, regulatory fees and operational efficiencies and scale.
Payments for order flow and ECN rebates decreased 20.0% to $43.6 million in 2008 from $54.6 million in 2007. As a percentage of total revenue, Payments for order flow and ECN rebates decreased to 4.6% in 2008 from 7.6% in 2007. These decreases were primarily due to the deconsolidation of Direct Edge and a decrease in profitability-based rebates paid to broker-dealer clients.
Writedown of assets and lease loss accrual (benefit), net was $1.2 million in 2008, primarily related to our decision to discontinue the use of the Direct Trading Institutional trade name, offset by a benefit related to an adjustment of a previously recognized lease loss with respect to the J.C. lease. The benefit of $2.5 million in 2007 was primarily related to an adjustment of previously recognized lease losses with respect to the J.C. lease. During 2007, we entered into two sub-lease agreements for a portion of the premises for which it had previously recorded a lease loss accrual. The lease loss accrual was adjusted based on the difference between the actual terms of the sub-leases and the assumptions previously used in the calculation of the lease loss accrual.
All other expenses increased by $26.2 million to $137.6 million in 2008 from $111.4 million in 2007. Communications and data processing expense increased primarily due to higher market data and connectivity expenses within our business segments, as well as additional costs related to overall growth. Depreciation and amortization expense increased primarily due to fixed asset purchases and acquired intangible assets. Occupancy and equipment rentals expense increased primarily due to the costs associated with our expansion efforts.
Our effective tax rate for 2008 from continuing operations of 41.9% differed from the federal statutory rate of 35% primarily due to state income taxes and non-deductible charges.
Financial Condition, Liquidity and Capital Resources
Financial Condition
We have historically maintained a highly liquid balance sheet, with a substantial portion of our total assets consisting of cash, highly liquid marketable securities and short term receivables. As of December 31, 2009, we had $3.0 billion in assets, 74.6% of which consisted of cash or assets readily convertible into cash, principally receivables from brokers and dealers, securities owned and securities borrowed. Receivables from brokers and dealers include interest bearing cash balances held with clearing brokers, including, or net of, amounts related to securities transactions that have not yet reached their contracted settlement date, which is generally within three business days of the trade date. Securities owned principally consist of equity securities that trade on the NYSE, NYSE Amex Equities and NYSE Arca markets, Nasdaq and on the OTC Bulletin Board. Securities borrowed represent the value of cash or collateral deposited with stock lenders to facilitate the trade settlement process.
Deferred compensation investments consists of investments held by us, including investments as a limited partner or non-managing member in the Deephaven Funds, for deferred compensation plans related to certain Knight employees and directors. Other assets primarily represent net deferred tax assets, deposits and miscellaneous receivables.
44
Table of Contents
Total assets increased $988.6 million, or 48.8%, from $2.0 billion at December 31, 2008 to $3.0 billion at December 31, 2009. The majority of the increase in assets relates to increases in securities owned and securities borrowed. Securities owned increased by $450.5 million, or 94.6%, from $476.1 million at December 31, 2008, to $926.6 million at December 31, 2009, due to an increase in the size of the securities inventory utilized in our market-making, high velocity algorithmic principal trading activities and trade execution services. Our securities inventory fluctuates based on trading volumes, market conditions, trading strategies utilized and our pre-determined risk limits. Securities borrowed increased by $382.6 million, from $11.8 million at December 31, 2008 to $394.4 million at December 31, 2009, due to the introduction of matched stock borrowed and stock loaned activity by our self-clearing entity.
Total liabilities increased $809.0 million, or 81.6%, from $990.9 million at December 31, 2008 to $1.8 billion at December 31, 2009. The majority of the increase in liabilities relates to increases in securities sold, not yet purchased and securities loaned. Securities sold, not yet purchased increased by $254.3 million, or 66.0%, from $385.0 million at December 31, 2008, to $639.3 million at December 31, 2009, due to an increase in the size of the securities inventory utilized in our market-making, high velocity algorithmic principal trading activities and trade execution services. Our securities inventory fluctuates based on trading volumes, market conditions, trading strategies utilized and our pre-determined risk limits and is consistent with the increase in our long securities position. Securities loaned were $550.2 million at December 31, 2009 due to the commencement of matched and principal stock borrowing and stock lending activities by our self-clearing entity.
Stockholders’ equity, excluding Noncontrolling interests, increased by $186.1 million, from $1,027.4 million at December 31, 2008 to $1,213.5 million at December 31, 2009. The increase was primarily due to net income of $117.1 million, Knight Libertas achieving its first year performance target resulting in an award of $33.3 million in 1.6 million shares of unregistered Knight common stock and stock-based awards activity of $80.5 million offset, in part, by common stock repurchases of $33.4 million.
Liquidity and Capital Resources
We have financed our business primarily through cash generated by operations, the proceeds from our stock issuances and the proceeds from our borrowing of $140.0 million under our credit facilities. At December 31, 2009, we had net current assets, which consist of net assets readily convertible into cash less current liabilities, of approximately $588.4 million.
We have previously disclosed our intent to pursue selective acquisitions of (or possible joint ventures with) complementary businesses primarily in the markets in which our Equities and FICC segments operate. We expect to fund the purchase price of any such acquisitions with our current cash position or, in some cases, through the issuance of our stock or debt.
We have acquired several businesses over the last few years. In January 2008, we completed the acquisition of EdgeTrade Inc. for $58.2 million comprising $28.2 million in cash and approximately 2.3 million shares of unregistered Knight common stock valued at $30.0 million. In July 2008, we completed the acquisition of Libertas Holdings LLC for $75.3 million, comprising $50.3 million in cash and approximately 1.5 million shares of unregistered Knight common stock valued at $25.0 million.
Several of these past acquisitions provided for contingent payments. The acquisition of the business of Direct Trading in 2005 resulted in a final contingent cash payment of $10.4 million, paid in the third quarter of 2007, based on the profitability of that business during the second year of operation after acquisition.
45
Table of Contents
The terms of the Libertas Holdings LLC transaction include a potential earn-out of up to $75.0 million of unregistered Knight common stock based on the future performance of Knight Libertas during the three-year period following the closing of the transaction. In the third quarter of 2009, Knight Libertas achieved its first year performance target which entitled the sellers to receive $33.3 million of the aforementioned earn-out in the form of 1.6 million shares of unregistered Knight common stock, of which 50% will be issued in July 2010 and the remaining 50% will be issued in July 2011.
Income from continuing operations before income taxes was $232.8 million, $333.6 million and $184.7 million for 2009, 2008 and 2007, respectively. Included in these amounts were certain non-cash expenses such as stock-based compensation, depreciation, amortization and certain non-cash writedowns. Stock-based compensation was $48.2 million, $28.1 million and $21.4 million during 2009, 2008 and 2007, respectively. Depreciation expense was $10.8 million, $7.5 million, and $7.1 million during 2009, 2008 and 2007, respectively. Amortization expense, which related to software, software development costs, intangible assets and leasehold improvements, was $23.6 million, $19.0 million and $14.5 million during 2009, 2008 and 2007, respectively. Non-cash gains were $15.9 million and $8.8 million during 2008 and 2007, respectively, representing non-operating gains from subsidiary stock issuances. Non-cash writedown of $3.1 million in 2009 represents the writedown of Donaldson trade name and the writedown of capitalized software. Non-cash writedown of $2.5 million in 2008 represents the writedown of Direct Trading Institutional trade name.
Capital expenditures were $42.2 million, $37.5 million and $14.7 million during 2009, 2008 and 2007, respectively. Purchases of strategic investments were $7.8 million, $13.4 million and $10.4 million and proceeds from sale of strategic investments were $27.8 million, $48.8 million and $5.5 million during 2009, 2008 and 2007, respectively. During 2008 and 2007, we received proceeds of $47.5 million and $12.9 million, respectively, relating to the sales of a portion of our interest in Direct Edge and our investment in the ISE Stock Exchange. There were no cash payments relating to acquisitions of businesses in 2009. Payments relating to acquisitions of businesses, net of cash received were $77.3 million and $10.4 million during 2008 and 2007, respectively. Strategic investments and acquisition expenditures primarily relate to outside investments and acquisitions of businesses in support of the development and growth of our business.
In October 2007, we entered into a three-year $140.0 million credit agreement (“Credit Agreement”) with a consortium of banks. The Credit Agreement includes a three-year delayed-draw senior secured term loan facility of $70.0 million and a three-year senior secured revolving facility of $70.0 million. As of December 31, 2009, we borrowed the full $140.0 million under the Credit Agreement. The proceeds of the borrowings under the Credit Agreement were used to finance share repurchases, finance selective acquisitions and for general corporate purposes. These credit obligations may limit our ability to undertake certain transactions, including, but not limited to, certain mergers, acquisitions or dispositions of assets, repurchases of shares and payment of dividends, each above certain thresholds as set forth in the Credit Agreement. The borrowings under the Credit Agreement are repayable in full by October 3, 2010. Our ability to repay or refinance borrowings under the Credit Agreement will depend on our financial and operating performance and the credit environment at the maturity date.
The Credit Agreement includes customary representations, warranties, affirmative and negative covenants (including, among others, limitations on certain payments, investments and transactions) and events of default. It also contains financial covenants tied to the maintenance of financial ratios and metrics. As of December 31, 2009, we were in compliance with all covenants under the Credit Agreement.
We have an authorized stock repurchase program of $1 billion. We repurchased 1.2 million shares for $20.0 million under the stock repurchase program during 2009. Through December 31, 2009, we had repurchased 68.3 million shares for $770.4 million under this program. We may repurchase shares
46
Table of Contents
from time to time in open market transactions, accelerated stock buyback programs, tender offers, privately negotiated transactions or by other means. Repurchases may also be made under Rule 10b5-1 plans. The timing and amount of repurchase transactions will be determined by our management based on its evaluation of market conditions, share price, legal requirements and other factors. The program may be suspended, modified or discontinued at any time without prior notice. We caution that there are no assurances that any further repurchases will actually occur. We had approximately 92.8 million shares of Class A Common Stock outstanding as of December 31, 2009.
Our U.S. registered broker-dealers are subject to regulatory requirements intended to ensure the general financial soundness and liquidity of broker-dealers and require the maintenance of minimum levels of net capital, as defined in SEC Rule 15c3-1. These regulations also prohibit a broker-dealer from repaying subordinated borrowings, paying cash dividends, making loans to its parent, affiliates or employees, or otherwise entering into transactions which would result in a reduction of its total net capital to less than 120% of its required minimum capital. Moreover, broker-dealers are required to notify the SEC and FINRA prior to repaying subordinated borrowings, paying dividends and making loans to its parent, affiliates or employees, or otherwise entering into transactions, which, if executed, would result in a reduction of 30% or more of its excess net capital (net capital less minimum requirement). The SEC has the ability to prohibit or restrict such transactions if the result is detrimental to the financial integrity of the broker-dealer.
We believe that during 2009, all of our broker-dealer subsidiaries were in compliance with their capital adequacy requirements. In connection with an ongoing regulatory examination of one of our broker-dealer subsidiaries, an issue has been identified as to whether a cash balance had been maintained in an acceptable control location within a bank, and therefore whether such balance should be considered an allowable asset in determining net capital of the broker-dealer. Several of our broker-dealer subsidiaries maintained balances in similar accounts at the bank. Due to the uncertainty as to the ultimate outcome of the examiner’s findings, we have closed the accounts in question and moved the cash balances to a more commonly used control location. In the event that FINRA and/or the SEC conclude that such balances are deemed to be non-allowable assets, three of our broker-dealer subsidiaries may be considered to have had inadequate regulatory capital at December 31, 2009 due to this administrative matter. While it may be determined that the affected broker-dealers were in technical violation at December 31, 2009, the capital existed within the affected broker-dealers at that time and has subsequently been transferred to a more commonly used control location.
The following table sets forth the net capital levels and requirements for the following significant regulated broker-dealer subsidiaries at December 31, 2009, as reported in their respective regulatory filings (in millions):
| Entity |
Net Capital | Net Capital Requirement |
Excess Net Capital | ||||||
| KEM |
$ | 100.2 | $ | 9.2 | $ | 91.0 | |||
| KCM |
52.7 | 2.6 | 50.1 | ||||||
| KCS |
37.2 | 0.3 | 36.9 | ||||||
| Knight Libertas |
21.6 | 3.0 | 18.6 | ||||||
| Knight Direct |
21.0 | 1.0 | 20.0 | ||||||
Our foreign registered broker-dealers are subject to certain financial resource requirements of either the FSA or the SFC. The following table sets forth the financial resource requirement for the following significant foreign regulated broker-dealer at December 31, 2009 (in millions):
| Entity |
Financial Resources |
Resource Requirement |
Excess Financial Resources | ||||||
| KCEL |
$ | 70.6 | $ | 25.5 | $ | 45.1 | |||
47
Table of Contents
Contractual Obligations
In connection with our operating activities, we enter into certain contractual obligations. Our future cash payments associated with our contractual obligations pursuant to operating leases, net of sublease obligations and guaranteed employment contracts longer than one year as of December 31, 2009 are summarized below (in millions):
| Payments due in: | |||||||||||||||
| 2010 | 2011-2012 | 2013-2014 | Thereafter through April 30, 2022 |
Total | |||||||||||
| Operating lease obligations1 |
$ | 15.6 | $ | 32.5 | $ | 28.3 | $ | 89.3 | $ | 165.8 | |||||
| Other obligations1 |
10.6 | 13.9 | — | — | 24.5 | ||||||||||
| Total |
$ | 26.2 | $ | 46.4 | $ | 28.3 | $ | 89.3 | $ | 190.3 | |||||
| 1 - See | Footnote 17, “Commitments and Contingent Liabilities” to the Consolidated Financial Statements |
| Totals | may not add due to rounding. |
Knight Capital Group, Inc. also has provided, and may in the future provide, in the ordinary course of business, unsecured guarantees to guarantee the payment obligations of certain of its trading subsidiaries and under certain leases.
Off-Balance Sheet Arrangements
As of December 31, 2009, we did not have any off-balance sheet arrangements, as defined in Item 303(a)(4)(ii) of SEC Regulation S-K.
Effects of Inflation
Because the majority of our assets are liquid in nature, they are not significantly affected by inflation. However, the rate of inflation may affect our expenses, such as employee compensation, office leasing costs and communications expenses, which may not be readily recoverable in the prices of the services offered us. To the extent inflation results in rising interest rates and has other adverse effects on the securities markets, it may adversely affect our financial position and results of operations.
Discontinued Operations
Our former Asset Management segment comprised Deephaven Capital Management LLC and its subsidiaries (collectively, “Deephaven”), which was formerly the registered investment adviser to, and sponsor of, the Deephaven investment funds (the “Deephaven Funds”). Prior to February 1, 2008, Deephaven was a wholly-owned subsidiary. On February, 1, 2008, we contributed our interest in Deephaven to Deephaven Capital Management Holdings LLC (“Deephaven Holdings”) in exchange for a 51% interest in Deephaven Holdings. Certain Deephaven managers (“Deephaven Managers”) acquired a 49% interest in Deephaven Holdings in exchange for the termination of their employment agreements and associated profit sharing bonuses and an equity contribution.
On January 27, 2009, Deephaven entered into an Asset Purchase Agreement along with Deephaven Managing Partners, LLC (“Deephaven Partners”), the Company, and each of the Deephaven Managers to sell substantially all of Deephaven’s assets to Stark & Roth, Inc. (together with its affiliates, “Stark”) with Stark agreeing to assume certain limited liabilities of Deephaven.
On March 31, 2009, Deephaven completed the sale of substantially all of its assets to Stark. As of that date, Deephaven was replaced by Stark as the investment manager, managing member and general partner for the Deephaven Funds and we exited the Asset Management business. As a result of this sale, our Asset Management segment was classified as a discontinued operation.
48
Table of Contents
Consideration for the sale is based on a formulaic purchase price based on the extent of Deephaven Global Multi-Strategy Fund (“GMS Fund”) assets that investors elect to have Stark manage on an ongoing basis, and the investment return of such transferred assets over a two-year period following the closing of the transaction. It is currently expected that the purchase price from the transaction will be zero.
We completed the sale of our former Derivative Markets business to Citigroup Financial Products Inc. (“Citigroup”) in 2004. Costs associated with the Derivative Markets segment have been included within discontinued operations. For a further discussion of the sale of our Derivative Markets business and its associated accounting treatment, see Footnote 13 “Discontinued Operations.”
For further discussion on risks related to the Deephaven Asset Sale, refer to “Risk Factors” in Part I, Item 1A of this Form 10-K.
Critical Accounting Estimates
Our Consolidated Financial Statements are based on the application of GAAP which requires us to make estimates and assumptions about future events that affect the amounts reported in our financial statements and the accompanying notes. Future events and their effects cannot be determined with certainty. Therefore, the determination of estimates requires the exercise of judgment. Actual results could differ from those estimates and any such differences may be material to our Consolidated Financial Statements. We believe that the estimates set forth below may involve a higher degree of judgment and complexity in their application than our other accounting estimates and represent the critical accounting estimates used in the preparation of our consolidated financial statements. We believe our judgments related to these accounting estimates are appropriate. However, if different assumptions or conditions were to prevail, the results could be materially different from the amounts recorded.
Goodwill and Intangible Assets—As a result of our acquisitions, principally Knight Direct, Hotspot, Knight BondPoint and Knight Libertas, we have acquired goodwill and identifiable intangible assets. We determine the values and useful lives of intangible assets upon acquisition. Goodwill is the cost of acquired companies in excess of the fair value of net assets, including identifiable intangible assets, at the acquisition date. We test goodwill and the useful lives of intangible assets for impairment at least annually or when an event occurs or circumstances change that signifies the existence of impairment.
Goodwill
Goodwill of $265.5 million at December 31, 2009 is related to our Equities and FICC segments. Goodwill primarily represents purchases of the businesses now operating as Knight Direct in our equities segment and Hotspot, Knight BondPoint and Knight Libertas in our FICC segment. We test the goodwill in each of our operating segments for impairment at least annually by comparing the estimated fair value of each segment with its estimated net book value. We derive the fair value of each of our operating segments based on valuation techniques we believe market participants would use for each segment (observable price-to-book multiples and discounted cash flow analyses) and we derive the net book value of our operating segments by estimating the amount of shareholders’ equity required to support the activities of each operating segment. As part of our test for impairment, we also consider the profitability of the applicable reporting unit as well as the overall market value of the Company, compared to the Company’s book value. We performed our annual test for impairment of goodwill in the second quarter of 2009 and determined that goodwill was not impaired at that time. We believe there was no impairment of our goodwill at December 31, 2009.
49
Table of Contents
Intangible Assets
Intangible assets with definite lives are amortized over their respective lives. Intangible assets, less accumulated amortization, of $77.8 million at December 31, 2009 are all attributable to our Equities and FICC segments. Substantially all intangible assets resulted from the purchases of the businesses now operating as Knight Direct, Hotspot, Knight BondPoint and Knight Libertas. We amortize these assets, which primarily consist of customer relationships on a straight-line basis over their useful lives, the majority of which have been determined to range from four to 24 years. We performed our annual test for impairment of intangible assets with definitive lives in the second quarter of 2009. We test amortizable intangibles for recoverability whenever events indicate that the carrying amounts may not be recoverable. During the second quarter of 2009, we discontinued the use of the Donaldson trade name. As such, we wrote off $2.4 million in intangible assets related to the trade name. During 2008, we discontinued the use of the Direct Trading Institutional trade name and wrote off the remaining book value of $2.5 million. No other events occurred in 2009 or 2008 that would indicate that the carrying amounts of our amortizable intangible assets may not be recoverable, and we do not believe that our intangible assets were impaired as of December 31, 2009.
Financial Instruments and Fair Value—We value our financial instruments using a hierarchy of fair value that maximizes the use of observable inputs and minimizes the use of unobservable inputs when measuring fair value.
The fair value hierarchy can be summarized as follows:
| • | Level 1—Valuations based on quoted prices in active markets for identical assets or liabilities that we have the ability to access. Since valuations are based on quoted prices that are readily and regularly available in an active market, valuation of these products does not entail a significant degree of judgment. |
| • | Level 2—Valuations based on quoted prices in markets that are not active or for which all significant inputs are observable, either directly or indirectly. |
| • | Level 3—Valuations based on inputs that are unobservable and significant to the overall fair value measurement. |
Changes in fair value are recognized in earnings each period for financial instruments that are carried at fair value.
Our securities owned and securities sold, not yet purchased will generally be classified within Level 1 of the fair value hierarchy because they are valued using quoted market prices or broker or dealer quotations with reasonable levels of price transparency.
The types of instruments that trade in markets that are not considered to be active, but are valued based on quoted market prices, broker or dealer quotations, or alternative pricing sources with reasonable levels of price transparency are generally classified within Level 2 of the fair value hierarchy. As of December 31, 2009, our investment in Deephaven funds, as well as Deferred compensation investments met the definition of Level 2.
Certain instruments are classified within Level 3 of the fair value hierarchy because they trade infrequently and therefore have little or no price transparency. For those instruments that are not traded in active markets or are subject to transfer restrictions, valuations are adjusted to reflect illiquidity and/or non-transferability, and such adjustments are generally based on available market evidence. In the absence of such evidence, management’s best estimate is used. As of December 31, 2009, we did not hold any financial instruments that met the definition of Level 3.
50
Table of Contents
Strategic Investments—Strategic investments include noncontrolling equity ownership interests held by us within our non-broker-dealer subsidiaries, primarily in financial services-related businesses. We account for strategic investments under the equity method, at cost or at fair value. We use the equity method of accounting for investments in limited partnerships and limited liability companies that are held by us within our non-broker-dealer subsidiaries. Our non-broker-dealers carry investments in corporations at adjusted cost. We use the equity method of accounting where we are considered to exert significant influence on the investee. We hold investments at adjusted cost when we are not considered to exert significant influence on the investee. We account for investments in liquid investment funds, including deferred compensation investments in mutual funds, at fair value.
We review strategic investments on an ongoing basis to ensure that the carrying values of the investments have not been impaired. If we assess that an impairment loss on a strategic investment has occurred due to a decline in fair value or other market conditions, we write the investment down to its estimated impaired value.
Lease Loss Accrual—It is our policy to identify excess real estate capacity and where applicable, accrue for related future costs, net of estimated sublease income. In determining the accrual, we perform a nominal cash flow analysis for lease losses initiated prior to December 31, 2002 and we accrue costs related to the excess capacity. For lease losses initiated after December 31, 2002, our policy is to accrue future costs related to excess capacity using a discounted cash flow analysis.
In 2006, we incurred a charge of $8.3 million, primarily related to the lease loss accrual on a portion of the J.C. lease encompassing approximately 78,000 square feet, all of which was unoccupied at the time. During 2007, we entered into two sublease agreements related to our J.C. lease for a portion of the premises for which we had previously recorded a lease loss accrual. As a result, we adjusted the lease loss accrual based on the difference between the actual terms of the subleases and the assumptions used in the previous calculation of the lease loss accrual and recorded a lease loss benefit of $2.6 million.
In 2008, we recorded a net benefit of $1.3 million primarily related to the J.C. lease. The accrual on the remaining unoccupied space of approximately 50,000 square feet was derived from assumptions and estimates based on lease terms of an anticipated additional sub-lease agreement, which assumed a sublease would commence in the beginning of 2010, anticipated market prices along the Jersey City waterfront and estimated up-front costs, including broker fees and build-out allowances.
In 2009, we recorded a benefit of $13.1 million primarily related to a reversal of a previously recognized lease loss with respect to the J.C. lease. We had previously considered a portion of these premises to be excess real estate and had therefore recorded a lease loss accrual for such excess office space. Based on expected growth and future needs, in the second quarter of 2009 we made the decision to build out and occupy the excess office space and therefore recorded a benefit related to the reversal of such previously recorded lease loss.
Market-Making, Trading and Sales Activities—Securities owned and securities sold, not yet purchased, which primarily consist of listed and OTC equities, are carried at fair value and are recorded on a trade date basis. Net trading revenue (trading gains, net of trading losses) and commissions (which includes commission equivalents earned on institutional client orders) and related expenses are also recorded on a trade date basis. Our third party clearing agreements call for payment or receipt of interest income, net of transaction-related interest charged by clearing brokers for facilitating the settlement and financing of securities transactions.
51
Table of Contents
Dividend income relating to securities owned and dividend expense relating to securities sold, not yet purchased, derived from our market-making activities are included as a component of Net trading revenue on our Consolidated Statements of Operations.
Other Estimates—The preparation of financial statements in conformity with GAAP requires management to make certain estimates and assumptions. In addition to the estimates that we make in connection with accounting for the items noted above, the use of estimates is also important in determining provisions for potential losses that may arise from litigation, regulatory proceedings and tax audits.
When determining stock-based employee compensation expense, we make certain estimates and assumptions relating to volatility and forfeiture rates. We estimate volatility based on several factors including implied volatility of market-traded options on our common stock on the grant date and the historical volatility of our common stock. We estimate forfeiture rates based on historical rates of forfeiture of employee stock awards.
A portion of our Employee compensation and benefits expense on the Consolidated Statements of Operations represents discretionary bonuses, which are accrued for throughout the year and paid after the end of the year. Among many factors, discretionary bonus accruals are generally influenced by our overall performance and competitive industry compensation levels.
We estimate and accrue for potential losses that may arise out of litigation and regulatory proceedings to the extent that such losses are probable and can be estimated. Significant judgment is required in making these estimates and our final liabilities may ultimately be materially different. Our total liability accrued with respect to litigation and regulatory proceedings is determined on a case-by-case basis and represents an estimate of probable losses based on, among other factors, the progress of each case, our experience and industry experience with similar cases and the opinions and views of internal and external legal counsel. Given the inherent difficulty of predicting the outcome of our litigation and regulatory matters, particularly in cases or proceedings in which substantial or indeterminate damages or fines are sought, or where cases or proceedings are in the early stages, we cannot estimate losses or ranges of losses for cases or proceedings where there is only a reasonable possibility that a loss may be incurred. For more information on our legal and regulatory matters, see “Legal Proceedings” in Part I, Item 3 included in this document.
Recently Issued Accounting Standards
In December 2007, the Financial Accounting Standards Board (“FASB”) issued an accounting standard which requires the acquiring entity in a business combination to recognize the acquisition date fair value for all identifiable assets acquired, and liabilities assumed, any noncontrolling interest in the acquiree and the goodwill acquired. Recognition of assets acquired and liabilities assumed arising from contingencies requires the capitalization of in-process research and development and requires the expensing of acquisition-related and restructuring costs as incurred. This new accounting standard was effective as of January 1, 2009 and we will apply the provisions of this statement to any future business combinations.
In March 2008, the FASB issued an accounting standard which requires enhanced disclosures about an entity’s derivative and hedging activities. This statement was effective as of January 1, 2009. The adoption only affected disclosures within the footnotes to the Consolidated Financial Statements.
In May 2009, the FASB issued an accounting standard which establishes accounting and reporting standards for events that occur after the balance sheet date but before financial statements are issued or are available to be issued. Specifically, the accounting standard sets forth (i) the period after the
52
Table of Contents
balance sheet date during which management of a reporting entity should evaluate events or transactions that may occur for potential recognition or disclosure in the financial statements, (ii) the circumstances under which an entity should recognize events or transactions occurring after the balance sheet date in its financial statements and (iii) the disclosures that an entity should make about events or transactions that occurred after the balance sheet date. In addition, the accounting standard requires a reporting entity to disclose the date through which subsequent events were evaluated. This new accounting standard was effective for reporting periods ended after June 15, 2009 and the adoption did not have any impact on the Consolidated Financial Statements.
On July 1, 2009, the FASB issued The FASB Accounting Standards Codification (the “Codification”). The Codification became the source of authoritative U.S. GAAP recognized by the FASB for nongovernmental entities. Rules and interpretive releases of the SEC under authority of federal securities laws are also sources of authoritative GAAP to the Company. The FASB will no longer issue new standards in the form of Statements, FASB Staff Positions or Emerging Issues Take Force Abstracts; instead the FASB will issue Accounting Standards Updates. The issuance of the Codification does not change GAAP and was effective for reporting periods ending after September 15, 2009. The implementation of the Codification did not have any impact on our Consolidated Financial Statements.
Since July 1, 2009, no Accounting Standards Updates were issued that are expected to have a significant effect on our Consolidated Financial Statements.
| Item 7A. | Quantitative and Qualitative Disclosures About Market Risk |
For a further discussion of these and other important factors that could affect our business, see Part I, Item 1A, “Risk Factors” of this Annual Report on Form 10-K.
Market Risk
Our market-making and trading activities expose our capital to significant risks. These risks include, but are not limited to, absolute and relative price movements, price volatility and changes in liquidity, over which we have virtually no control.
For working capital purposes, we invest in money market funds and government securities or maintain interest-bearing balances at banks and in our trading accounts with clearing brokers, which are classified as Cash and cash equivalents and Receivable from brokers and dealers, respectively, on the Consolidated Statements of Financial Condition. These financial instruments do not have maturity dates or present a material market risk, as the balances are short-term in nature and subject to daily repricing. Our cash and cash equivalents held in foreign currencies are subject to the exposure of foreign currency fluctuations. These balances are monitored daily and are not material to our overall cash position.
In our Equities segment where we maintain securities positions, we employ proprietary position management and trading systems that provide real-time, on-line position management and inventory control. We monitor our risks by reviewing trading positions and their appropriate risk measures. We have established a system whereby transactions are monitored by senior management and an independent risk control function on a real-time basis as are individual and aggregate dollar and inventory position totals, capital allocations, and real-time profits and losses. Our management of trading positions is enhanced by our review of mark-to-market valuations and position summaries on a daily basis.
In the normal course of business, we maintain inventories of exchange-listed and OTC equity securities, and to a significantly lesser extent, listed equity options and fixed income products. The fair
53
Table of Contents
value of these securities at December 31, 2009 and 2008 was $923.1 million and $469.4 million, respectively, in long positions and $639.3 million and $385.0 million, respectively, in short positions. The potential change in fair value, using a hypothetical 10% decline in prices, is estimated to be a loss of $28.4 million and $8.4 million as of December 31, 2009 and 2008, respectively, due to the offset of gains in short positions with the losses in long positions. The following table illustrates, for the period indicated, our average, highest and lowest month-end inventory at market value (based on both the aggregate and the net of the long and short positions of trading securities (in millions):
| 2009 | 2008 | 2007 | ||||||||||||||||
| Aggregate of Long and Short Positions |
Net of Long and Short Positions |
Aggregate of Long and Short Positions |
Net of Long and Short Positions |
Aggregate of Long and Short Positions |
Net of Long and Short Positions | |||||||||||||
| Average month-end |
$ | 1,514.0 | $ | 232.9 | $ | 899.1 | $ | 107.6 | $ | 1,014.0 | $ | 29.0 | ||||||
| Highest month-end |
1,727.6 | 283.8 | 1,015.3 | 198.8 | 1,498.2 | 70.9 | ||||||||||||
| Lowest month-end |
1,185.4 | 207.7 | 775.4 | 14.2 | 679.2 | 8.6 | ||||||||||||
Operational Risk
Operational risk can arise from many factors ranging from routine processing errors to potentially costly incidents arising, for example, from major systems failures. We incur operational risk across all of our business activities, including revenue generating activities as well as support functions. Legal and compliance risk is included in the scope of operational risk and is discussed below under “Legal Risk.”
Primary responsibility for the management of operational risk lies with our operating segments and supporting functions. Our operating segments maintain controls designed to manage and mitigate operational risk for existing activities. As new products and business activities are developed, we identify operational risks and design controls to mitigate the identified risks.
Disaster recovery plans are in place for critical facilities related to our primary operations and resources and redundancies are built into the systems as deemed appropriate. We have also established policies, procedures and technologies to protect our systems and other assets from unauthorized access.
Legal Risk
Legal risk includes the risk of non-compliance with applicable legal and regulatory requirements and standards. Legal risk also includes contractual and commercial risk such as the risk that a counterparty’s performance obligations will be unenforceable. We are generally subject to extensive regulation in the different jurisdictions in which we conduct our business (see “Government Regulation and Market Structure” in Part I, Item 1). We have established procedures based on legal and regulatory requirements that are designed to foster compliance with applicable statutory and regulatory requirements. We have also established procedures that are designed to require that our policies relating to conduct, ethics and business practices are followed.
54
Table of Contents
Consolidated Quarterly Results (unaudited)
The following table sets forth certain unaudited consolidated quarterly statement of operations data for 2009 and 2008. In the opinion of management, this unaudited information has been prepared on substantially the same basis as the Consolidated Financial Statements appearing elsewhere in this document and includes all adjustments (consisting of normal recurring adjustments) necessary for a fair statement of the unaudited consolidated quarterly data. The unaudited consolidated quarterly data should be read in conjunction with the audited Consolidated Financial Statements and notes thereto appearing elsewhere in this document. The results of any quarter are not necessarily indicative of results for any future period.
| Quarter Ended* | ||||||||||||||||||||||||||||||||
| Dec. 31, 2009 |
Sept. 30, 2009 |
Jun. 30, 2009 |
Mar. 31, 2009 |
Dec. 31, 2008 |
Sept. 30, 2008 |
Jun. 30, 2008 |
Mar. 31, 2008 |
|||||||||||||||||||||||||
| (in thousands, except per share amounts) | ||||||||||||||||||||||||||||||||
| Revenues |
||||||||||||||||||||||||||||||||
| Commissions and fees |
$ | 166,874 | $ | 177,025 | $ | 175,797 | $ | 150,710 | $ | 153,059 | $ | 132,317 | $ | 98,452 | $ | 94,300 | ||||||||||||||||
| Net trading revenue |
132,225 | 119,595 | 135,405 | 99,460 | 142,927 | 116,830 | 85,433 | 101,517 | ||||||||||||||||||||||||
| Interest, net |
975 | (1,050 | ) | (1,041 | ) | (597 | ) | 472 | 1,518 | 1,888 | 3,764 | |||||||||||||||||||||
| Investment income (loss) and other, net |
3,206 | 4,360 | 3,706 | (4,219 | ) | 17,854 | (9,890 | ) | 4,019 | (5,603 | ) | |||||||||||||||||||||
| Total revenues |
303,280 | 299,930 | 313,867 | 245,354 | 314,312 | 240,775 | 189,792 | 193,978 | ||||||||||||||||||||||||
| Expenses |
||||||||||||||||||||||||||||||||
| Employee compensation and benefits |
143,192 | 139,334 | 135,614 | 109,187 | 96,797 | 94,269 | 67,751 | 72,494 | ||||||||||||||||||||||||
| Execution and clearance fees |
47,852 | 50,430 | 42,432 | 29,091 | 31,288 | 27,062 | 23,828 | 25,224 | ||||||||||||||||||||||||
| Payments for order flow |
13,816 | 17,737 | 23,047 | 17,027 | 16,301 | 10,112 | 8,300 | 8,926 | ||||||||||||||||||||||||
| Communications and data processing |
17,221 | 15,781 | 14,281 | 13,788 | 13,109 | 11,551 | 11,234 | 9,466 | ||||||||||||||||||||||||
| Depreciation and amortization |
9,145 | 8,777 | 8,260 | 8,187 | 7,862 | 7,198 | 5,955 | 5,520 | ||||||||||||||||||||||||
| Occupancy and equipment rentals |
5,997 | 5,930 | 5,890 | 5,361 | 5,306 | 5,405 | 5,119 | 3,813 | ||||||||||||||||||||||||
| Business development |
5,310 | 4,058 | 5,093 | 4,346 | 5,328 | 4,084 | 4,256 | 3,611 | ||||||||||||||||||||||||
| Professional fees |
3,633 | 3,410 | 3,098 | 2,902 | 2,729 | 4,071 | 4,286 | 3,664 | ||||||||||||||||||||||||
| Interest expense |
2,108 | 713 | 974 | 981 | 1,627 | 1,476 | 891 | 1,057 | ||||||||||||||||||||||||
| Writedown of assets and lease loss accrual (benefit), net |
292 | — | (10,695 | ) | 699 | 592 | 2,516 | (1,872 | ) | — | ||||||||||||||||||||||
| Other |
3,587 | 4,003 | 4,981 | 2,756 | 2,495 | 3,478 | 2,725 | 269 | ||||||||||||||||||||||||
| Total expenses |
252,153 | 250,173 | 232,975 | 194,325 | 183,434 | 171,222 | 132,473 | 134,044 | ||||||||||||||||||||||||
| Other Income |
||||||||||||||||||||||||||||||||
| Non-operating gain from subsidiary stock issuance |
— | — | — | — | 15,947 | — | — | — | ||||||||||||||||||||||||
| Income from continuing operations before income taxes |
51,127 | 49,757 | 80,892 | 51,029 | 146,825 | 69,553 | 57,319 | 59,934 | ||||||||||||||||||||||||
| Income tax expense |
7,829 | 19,278 | 32,934 | 21,148 | 63,568 | 28,452 | 23,064 | 24,837 | ||||||||||||||||||||||||
| Income from continuing operations, net of tax |
43,298 | 30,479 | 47,958 | 29,881 | 83,257 | 41,101 | 34,255 | 35,097 | ||||||||||||||||||||||||
| Loss from discontinued operations, net of tax |
(286 | ) | (1,253 | ) | (12,460 | ) | (20,514 | ) | (3,555 | ) | (4,806 | ) | (4,844 | ) | (2,594 | ) | ||||||||||||||||
| Net income |
$ | 43,012 | $ | 29,226 | $ | 35,498 | $ | 9,367 | $ | 79,702 | $ | 36,295 | $ | 29,411 | $ | 32,503 | ||||||||||||||||
| Diluted earnings per share from continuing operations |
$ | 0.46 | $ | 0.32 | $ | 0.52 | $ | 0.33 | $ | 0.93 | $ | 0.46 | $ | 0.37 | $ | 0.38 | ||||||||||||||||
| Diluted earnings per share from discontinued operations |
$ | — | $ | (0.01 | ) | $ | (0.13 | ) | $ | (0.23 | ) | $ | (0.04 | ) | $ | (0.05 | ) | $ | (0.05 | ) | $ | (0.03 | ) | |||||||||
| Diluted earnings per share |
$ | 0.46 | $ | 0.31 | $ | 0.39 | $ | 0.10 | $ | 0.89 | $ | 0.40 | $ | 0.32 | $ | 0.35 | ||||||||||||||||
| * | Quarterly totals may not add to full year due to rounding. |
55
Table of Contents
Item 8. Financial Statements and Supplementary Data
KNIGHT CAPITAL GROUP, INC.
INDEX TO CONSOLIDATED FINANCIAL STATEMENTS
56
Table of Contents
MANAGEMENT’S REPORT ON INTERNAL CONTROL OVER FINANCIAL REPORTING
Knight Capital Group Inc.’s (“Knight”) management is responsible for establishing and maintaining adequate internal control over financial reporting. Internal control over financial reporting is defined in Rule 13a-15(f) and 15d-15(f) under the Securities Exchange Act of 1934, as amended, as a process designed by, or under the supervision of, the company’s principal executive and principal financial officers and effected by the company’s board of directors, management and other personnel to provide reasonable assurance regarding the reliability of financial reporting and the preparation of financial statements for external purposes in accordance with generally accepted accounting principles and includes those policies and procedures that:
| • | pertain to the maintenance of records that, in reasonable detail, accurately and fairly reflect the transactions and dispositions of the assets of Knight; |
| • | provide reasonable assurance that transactions are recorded as necessary to permit preparation of financial statements in accordance with generally accepted accounting principles, and that receipts and expenditures of the company are being made only in accordance with authorizations of management and directors of Knight; and |
| • | provide reasonable assurance regarding prevention or timely detection of unauthorized acquisition, use or disposition of the company’s assets that could have a material effect on the financial statements. |
Because of its inherent limitations, internal control over financial reporting may not prevent or detect misstatements. Projections of any evaluation of effectiveness to future periods are subject to the risks that controls may become inadequate because of changes in conditions, or that the degree of compliance with the policies or procedures may deteriorate.
Management assessed the effectiveness of Knight’s internal control over financial reporting as of December 31, 2009. In making this assessment, management used the criteria set forth by the Committee of Sponsoring Organizations of the Treadway Commission in Internal Control—Integrated Framework.
Based on our assessment, Knight’s management has concluded that, as of December 31, 2009, internal control over financial reporting is effective.
The effectiveness of Knight’s internal control over financial reporting as of December 31, 2009 has been audited by PricewaterhouseCoopers LLP, an independent registered public accounting firm, as stated in their report which appears herein.
57
Table of Contents
REPORT OF INDEPENDENT REGISTERED PUBLIC ACCOUNTING FIRM
To the Board of Directors and the Shareholders of
Knight Capital Group, Inc.:
In our opinion, the consolidated financial statements listed in the accompanying index present fairly, in all material respects, the financial position of Knight Capital Group, Inc. and its subsidiaries (the “Company”) at December 31, 2009 and December 31, 2008, and the results of their operations and their cash flows for each of the three years in the period ended December 31, 2009 in conformity with accounting principles generally accepted in the United States of America. Also in our opinion, the Company maintained, in all material respects, effective internal control over financial reporting as of December 31, 2009, based on criteria established in Internal Control—Integrated Framework issued by the Committee of Sponsoring Organizations of the Treadway Commission (COSO). The Company’s management is responsible for these financial statements and maintaining effective internal control over financial reporting and for its assessment of the effectiveness of internal control over financial reporting, included in Management’s Report on Internal Control over Financial Reporting appearing on page 57. Our responsibility is to express opinions on these financial statements and on the Company’s internal control over financial reporting based on our integrated audits. We conducted our audits in accordance with the standards of the Public Company Accounting Oversight Board (United States). Those standards require that we plan and perform the audits to obtain reasonable assurance about whether the financial statements are free of material misstatement and whether effective internal control over financial reporting was maintained in all material respects. Our audits of the financial statements included examining, on a test basis, evidence supporting the amounts and disclosures in the financial statements, assessing the accounting principles used and significant estimates made by management, and evaluating the overall financial statement presentation. Our audit of internal control over financial reporting included obtaining an understanding of internal control over financial reporting, assessing the risk that a material weakness exists, and testing and evaluating the design and operating effectiveness of internal control based on the assessed risk. Our audits also included performing such other procedures as we considered necessary in the circumstances. We believe that our audits provide a reasonable basis for our opinions.
A company’s internal control over financial reporting is a process designed to provide reasonable assurance regarding the reliability of financial reporting and the preparation of financial statements for external purposes in accordance with generally accepted accounting principles. A company’s internal control over financial reporting includes those policies and procedures that (i) pertain to the maintenance of records that, in reasonable detail, accurately and fairly reflect the transactions and dispositions of the assets of the company; (ii) provide reasonable assurance that transactions are recorded as necessary to permit preparation of financial statements in accordance with generally accepted accounting principles, and that receipts and expenditures of the company are being made only in accordance with authorizations of management and directors of the company; and (iii) provide reasonable assurance regarding prevention or timely detection of unauthorized acquisition, use, or disposition of the company’s assets that could have a material effect on the financial statements.
Because of its inherent limitations, internal control over financial reporting may not prevent or detect misstatements. Also, projections of any evaluation of effectiveness to future periods are subject to the risk that controls may become inadequate because of changes in conditions, or that the degree of compliance with the policies or procedures may deteriorate.
PRICEWATERHOUSECOOPERS LLP
New York, New York
February 24, 2010
58
Table of Contents
CONSOLIDATED STATEMENTS OF FINANCIAL CONDITION
| December 31, | ||||||||
| 2009 | 2008 | |||||||
| (In thousands) | ||||||||
| Assets | ||||||||
| Cash and cash equivalents |
$ | 427,106 | $ | 416,957 | ||||
| Securities owned, held at clearing brokers and depositories, at fair value |
926,589 | 476,111 | ||||||
| Securities borrowed |
394,417 | 11,848 | ||||||
| Receivable from brokers and dealers |
500,143 | 329,502 | ||||||
| Fixed assets and leasehold improvements, at cost, less accumulated depreciation and amortization of $128,045 in 2009 and $104,961 in 2008 |
98,696 | 81,237 | ||||||
| Strategic investments |
65,166 | 83,697 | ||||||
| Goodwill |
265,530 | 232,197 | ||||||
| Intangible assets, less accumulated amortization of $38,018 in 2009 and $24,853 in 2008 |
77,812 | 90,477 | ||||||
| Deferred compensation investments |
44,954 | 41,637 | ||||||
| Assets within discontinued operations |
14,023 | 84,868 | ||||||
| Other assets |
199,588 | 176,895 | ||||||
| Total assets |
$ | 3,014,024 | $ | 2,025,426 | ||||
| Liabilities & Equity | ||||||||
| Liabilities |
||||||||
| Securities sold, not yet purchased, at fair value |
$ | 639,259 | $ | 385,003 | ||||
| Securities loaned |
550,226 | — | ||||||
| Payable to brokers and dealers |
155,148 | 98,138 | ||||||
| Accrued compensation expense |
205,282 | 171,392 | ||||||
| Accrued expenses and other liabilities |
94,658 | 132,369 | ||||||
| Liabilities within discontinued operations |
15,329 | 63,988 | ||||||
| Credit facility |
140,000 | 140,000 | ||||||
| Total liabilities |
1,799,902 | 990,890 | ||||||
| Commitments and contingent liabilities (Note 17) |
||||||||
| Equity |
||||||||
| Knight Capital Group, Inc. stockholders' equity |
||||||||
| Class A common stock; Shares authorized: 500,000 at December 31, 2009 and December 31, 2008; Shares issued: 158,641 at December 31, 2009 and 154,404 at December 31, 2008; Shares outstanding: 92,791 at December 31, 2009 and 90,121 at December 31, 2008 |
1,586 | 1,544 | ||||||
| Additional paid-in capital |
746,778 | 648,716 | ||||||
| Retained earnings |
1,229,112 | 1,112,010 | ||||||
| Treasury stock, at cost; 65,850 shares at December 31, 2009 and 64,283 shares at December 31, 2008 |
(763,974 | ) | (734,912 | ) | ||||
| Total Knight Capital Group, Inc. stockholders' equity |
1,213,502 | 1,027,358 | ||||||
| Noncontrolling interests |
620 | 7,178 | ||||||
| Total equity |
1,214,122 | 1,034,536 | ||||||
| Total liabilities and equity |
$ | 3,014,024 | $ | 2,025,426 | ||||
The accompanying notes are an integral part of these consolidated financial statements.
59
Table of Contents
CONSOLIDATED STATEMENTS OF OPERATIONS
| For the years ended December 31, | ||||||||||||
| 2009 | 2008 | 2007 | ||||||||||
| (In thousands, except per share amounts) |
||||||||||||
| Revenues |
||||||||||||
| Commissions and fees |
$ | 670,406 | $ | 478,126 | $ | 386,128 | ||||||
| Net trading revenue |
486,684 | 446,707 | 286,199 | |||||||||
| Interest, net |
(1,712 | ) | 7,644 | 16,133 | ||||||||
| Investment income and other, net |
7,053 | 6,380 | 28,699 | |||||||||
| Total revenues |
1,162,431 | 938,857 | 717,159 | |||||||||
| Expenses |
||||||||||||
| Employee compensation and benefits |
527,327 | 331,311 | 257,486 | |||||||||
| Execution and clearance fees |
169,805 | 107,402 | 120,261 | |||||||||
| Payments for order flow and ECN rebates |
71,629 | 43,639 | 54,564 | |||||||||
| Communications and data processing |
61,071 | 45,359 | 35,363 | |||||||||
| Depreciation and amortization |
34,368 | 26,535 | 21,567 | |||||||||
| Occupancy and equipment rentals |
23,177 | 19,642 | 13,194 | |||||||||
| Business development |
18,807 | 17,279 | 14,611 | |||||||||
| Professional fees |
13,043 | 14,749 | 14,491 | |||||||||
| Interest expense |
4,777 | 5,052 | 182 | |||||||||
| Writedown of assets and lease loss accrual (benefit), net |
(9,704 | ) | 1,236 | (2,470 | ) | |||||||
| Other |
15,326 | 8,969 | 11,951 | |||||||||
| Total expenses |
929,626 | 621,173 | 541,200 | |||||||||
| Other Income |
||||||||||||
| Non-operating gain from subsidiary stock issuance |
— | 15,947 | 8,757 | |||||||||
| Income from continuing operations before income taxes |
232,805 | 333,631 | 184,716 | |||||||||
| Income tax expense |
81,189 | 139,921 | 70,155 | |||||||||
| Income from continuing operations, net of tax |
151,616 | 193,710 | 114,561 | |||||||||
| (Loss) income from discontinued operations, net of tax |
(34,514 | ) | (15,799 | ) | 7,679 | |||||||
| Net income |
$ | 117,102 | $ | 177,911 | $ | 122,240 | ||||||
| Basic earnings per share from continuing operations |
$ | 1.70 | $ | 2.19 | $ | 1.18 | ||||||
| Diluted earnings per share from continuing operations |
$ | 1.60 | $ | 2.11 | $ | 1.14 | ||||||
| Basic earnings per share from discontinued operations |
$ | (0.39 | ) | $ | (0.18 | ) | $ | 0.08 | ||||
| Diluted earnings per share from discontinued operations |
$ | (0.37 | ) | $ | (0.17 | ) | $ | 0.08 | ||||
| Basic earnings per share |
$ | 1.31 | $ | 2.01 | $ | 1.26 | ||||||
| Diluted earnings per share |
$ | 1.24 | $ | 1.94 | $ | 1.21 | ||||||
| Shares used in computation of basic earnings per share |
89,095 | 88,407 | 97,050 | |||||||||
| Shares used in computation of diluted earnings per share |
94,504 | 91,760 | 100,796 | |||||||||
The accompanying notes are an integral part of these consolidated financial statements.
60
Table of Contents
CONSOLIDATED STATEMENTS OF CHANGES IN EQUITY
For the Years Ended December 31, 2007, 2008 and 2009
(In thousands)
| Knight Capital Group, Inc. Stockholders' Equity | ||||||||||||||||||||||||||||||
| Class A Common Stock |
Treasury Stock | Additional Paid-In Capital |
Retained Earnings |
Total | Non- controlling Interests |
Total Equity |
||||||||||||||||||||||||
| Shares | Amount | Shares | Amount | |||||||||||||||||||||||||||
| Balance, January 1, 2007 |
144,959 | $ | 1,450 | (41,298 | ) | $ | (370,612 | ) | $ | 519,790 | $ | 811,859 | $ | 962,487 | $ | — | $ | 962,487 | ||||||||||||
| Net income |
— | — | — | — | — | 122,240 | 122,240 | — | 122,240 | |||||||||||||||||||||
| Common stock repurchased |
— | — | (17,967 | ) | (266,643 | ) | — | — | (266,643 | ) | — | (266,643 | ) | |||||||||||||||||
| Stock options exercised |
3,487 | 35 | — | — | 21,040 | — | 21,075 | — | 21,075 | |||||||||||||||||||||
| Income tax benefit—stock awards exercised |
— | — | — | — | 15,172 | — | 15,172 | — | 15,172 | |||||||||||||||||||||
| Stock-based compensation |
2,355 | 24 | — | — | 31,023 | — | 31,047 | — | 31,047 | |||||||||||||||||||||
| Balance, December 31, 2007 |
150,801 | 1,509 | (59,265 | ) | (637,255 | ) | 587,025 | 934,099 | 885,378 | — | 885,378 | |||||||||||||||||||
| Capital contribution from noncontrolling interests |
— | — | — | — | — | — | — | 1,000 | 1,000 | |||||||||||||||||||||
| Net income |
— | — | — | — | — | 177,911 | 177,911 | — | 177,911 | |||||||||||||||||||||
| Noncontrolling interests related to discontinued operations |
— | — | — | — | — | — | — | 6,178 | 6,178 | |||||||||||||||||||||
| Common stock repurchased |
— | — | (8,756 | ) | (138,229 | ) | — | — | (138,229 | ) | — | (138,229 | ) | |||||||||||||||||
| Reissuance of treasury shares |
— | 3,738 | 40,572 | 14,428 | — | 55,000 | — | 55,000 | ||||||||||||||||||||||
| Stock options exercised |
1,187 | 11 | — | — | 10,349 | — | 10,360 | — | 10,360 | |||||||||||||||||||||
| Income tax benefit—stock awards exercised |
— | — | — | — | 6,117 | — | 6,117 | — | 6,117 | |||||||||||||||||||||
| Stock-based compensation |
2,416 | 24 | — | — | 30,797 | — | 30,821 | — | 30,821 | |||||||||||||||||||||
| Balance, December 31, 2008 |
154,404 | 1,544 | (64,283 | ) | (734,912 | ) | 648,716 | 1,112,010 | 1,027,358 | 7,178 | 1,034,536 | |||||||||||||||||||
| Net income |
— | — | — | — | — | 117,102 | 117,102 | — | 117,102 | |||||||||||||||||||||
| Net loss attributable to noncontrolling interests related to discontinued operations |
— | — | — | — | — | — | — | (380 | ) | (380 | ) | |||||||||||||||||||
| Distribution to noncontrolling interests |
— | — | — | — | — | — | — | (6,178 | ) | (6,178 | ) | |||||||||||||||||||
| Common stock repurchased |
— | — | (1,945 | ) | (33,412 | ) | — | — | (33,412 | ) | — | (33,412 | ) | |||||||||||||||||
| Reissuance of treasury shares |
— | — | 378 | 4,350 | 2,201 | — | 6,551 | — | 6,551 | |||||||||||||||||||||
| Stock options exercised |
1,083 | 11 | — | — | 11,010 | — | 11,021 | — | 11,021 | |||||||||||||||||||||
| Income tax benefit—stock awards exercised |
— | — | — | — | 4,374 | — | 4,374 | — | 4,374 | |||||||||||||||||||||
| Stock-based compensation |
3,154 | 31 | — | — | 80,477 | — | 80,508 | — | 80,508 | |||||||||||||||||||||
| Balance, December 31, 2009 |
158,641 | $ | 1,586 | (65,850 | ) | $ | (763,974 | ) | $ | 746,778 | $ | 1,229,112 | $ | 1,213,502 | $ | 620 | $ | 1,214,122 | ||||||||||||
The accompanying notes are an integral part of these consolidated financial statements.
61
Table of Contents
CONSOLIDATED STATEMENTS OF CASH FLOWS
| For the years ended December 31, |
||||||||||||
| 2009 | 2008 | 2007 | ||||||||||
| (In thousands) | ||||||||||||
| Cash flows from operating activities |
||||||||||||
| Net income |
$ | 117,102 | $ | 177,911 | $ | 122,240 | ||||||
| Loss (income) from discontinued operations, net of tax |
(34,514 | ) | (15,799 | ) | 7,679 | |||||||
| Income from continuing operations, net of tax |
151,616 | 193,710 | 114,561 | |||||||||
| Adjustments to reconcile income from continuing operations, net of tax to net cash provided by operating activities |
||||||||||||
| Depreciation and amortization |
34,368 | 26,535 | 21,567 | |||||||||
| Stock-based compensation |
48,237 | 28,098 | 21,449 | |||||||||
| Deferred income taxes |
(5,332 | ) | 6,773 | (13,183 | ) | |||||||
| Deferred rent |
1,242 | 1,222 | 438 | |||||||||
| Writedown of assets and lease loss accrual (benefit), net |
(9,704 | ) | 1,236 | (2,470 | ) | |||||||
| Realized gain from sale of subsidiary stock |
— | — | (4,223 | ) | ||||||||
| Realized gain from sale of strategic investments |
— | (35,635 | ) | — | ||||||||
| Non-operating gain from subsidiary stock issuance |
— | (15,947 | ) | (8,757 | ) | |||||||
| Unrealized (gain) loss on strategic investments |
(1,438 | ) | 6,226 | (397 | ) | |||||||
| Unrealized loss (gain) on investments in Deephaven Funds |
2,167 | 28,195 | (17,786 | ) | ||||||||
| Operating activities from discontinued operations |
(6,063 | ) | 7,860 | 10,549 | ||||||||
| (Increase) decrease in operating assets, net of acquisitions and disposals |
||||||||||||
| Securities owned |
(450,478 | ) | (63,500 | ) | 299,209 | |||||||
| Securities borrowed |
(382,569 | ) | 29,335 | (15,935 | ) | |||||||
| Receivable from brokers and dealers |
(170,641 | ) | 17,675 | (12,442 | ) | |||||||
| Deferred compensation investments |
(3,379 | ) | 2,936 | (34,621 | ) | |||||||
| Other assets |
(56,013 | ) | (65,431 | ) | 40,615 | |||||||
| Increase (decrease) in operating liabilities, net of acquisitions and disposals |
||||||||||||
| Securities sold, not yet purchased |
254,256 | 49,723 | (357,791 | ) | ||||||||
| Securities loaned |
550,226 | — | — | |||||||||
| Payable to brokers and dealers |
57,011 | (18,863 | ) | 70,625 | ||||||||
| Accrued compensation expense |
32,732 | 58,522 | 12,022 | |||||||||
| Accrued expenses and other liabilities |
(26,180 | ) | 4,983 | 40,113 | ||||||||
| Net cash provided by operating activities |
20,058 | 263,653 | 163,543 | |||||||||
| Cash flows from investing activities |
||||||||||||
| Distributions from Deephaven Funds |
36,548 | 93,385 | 35,000 | |||||||||
| Purchases of fixed assets and leasehold improvements |
(42,230 | ) | (37,491 | ) | (14,740 | ) | ||||||
| Purchases of strategic investments |
(7,787 | ) | (13,442 | ) | (10,400 | ) | ||||||
| Distributions from strategic investments |
27,755 | 48,805 | 5,534 | |||||||||
| Purchases of businesses, net of cash acquired |
— | (77,308 | ) | (30 | ) | |||||||
| Contingent payment on purchases of businesses |
— | — | (10,363 | ) | ||||||||
| Proceeds from issuance of subsidiary stock |
— | — | 31,667 | |||||||||
| Proceeds from sale of subsidiary stock |
— | — | 12,750 | |||||||||
| Cash retained by deconsolidated entity |
— | — | (32,241 | ) | ||||||||
| Investing activities from discontinued operations |
— | (817 | ) | (358 | ) | |||||||
| Net cash provided by investing activities |
14,286 | 13,132 | 16,819 | |||||||||
| Cash flows from financing activities |
||||||||||||
| Proceeds from long-term borrowing |
— | 70,000 | 70,000 | |||||||||
| Stock options exercised |
11,021 | 10,360 | 21,075 | |||||||||
| Income tax benefit on stock awards exercised |
4,374 | 6,117 | 15,172 | |||||||||
| Cost of common stock repurchased |
(33,412 | ) | (138,229 | ) | (266,643 | ) | ||||||
| Financing activities from discontinued operations |
(6,178 | ) | 1,000 | — | ||||||||
| Net cash used in financing activities |
(24,195 | ) | (50,752 | ) | (160,396 | ) | ||||||
| Increase in cash and cash equivalents |
10,149 | 226,033 | 19,966 | |||||||||
| Cash and cash equivalents at beginning of period |
416,957 | 190,924 | 170,958 | |||||||||
| Cash and cash equivalents at end of period |
$ | 427,106 | $ | 416,957 | $ | 190,924 | ||||||
| Supplemental disclosure of cash flow information: |
||||||||||||
| Cash paid for interest |
$ | 4,777 | $ | 5,014 | $ | 285 | ||||||
| Cash paid for income taxes |
$ | 87,463 | $ | 114,618 | $ | 73,544 | ||||||
| Supplemental disclosure of investing activities: |
||||||||||||
| Goodwill |
$ | 33,333 | $ | 99,364 | $ | 30 | ||||||
| Intangible assets |
— | 44,500 | — | |||||||||
| Other assets |
— | 9,298 | — | |||||||||
| Accrued expenses and other liabilities |
— | (20,854 | ) | — | ||||||||
| 33,333 | 132,308 | 30 | ||||||||||
| Issuance of common stock in connection with acquisitions |
(33,333 | ) | (55,000 | ) | — | |||||||
| Purchases of businesses, net of cash acquired |
$ | — | $ | 77,308 | $ | 30 | ||||||
The accompanying notes are an integral part of these consolidated financial statements.
62
Table of Contents
NOTES TO CONSOLIDATED FINANCIAL STATEMENTS
1. Organization and Description of the Business
Knight Capital Group, Inc. (collectively with its subsidiaries, the “Company”) has three operating segments, (i) Equities, (ii) Fixed Income, Currencies and Commodities (“FICC”) and (iii) Corporate. As of December 31, 2009, the Company’s operating segments comprised the following:
Equities
| • | Knight Equity Markets, L.P. (“KEM”) primarily operates as a market maker in over-the-counter (“OTC”) equity securities, primarily those traded in the Nasdaq Stock Market and on the OTC Bulletin Board. KEM also operates the Company’s primary domestic institutional sales business and offers soft dollar and commission recapture services. KEM is a broker-dealer registered with the U.S. Securities and Exchange Commission (“SEC”) and is a member of the Nasdaq Stock Exchange (“Nasdaq”), the New York Stock Exchange (“NYSE”), Financial Industry Regulatory Authority (“FINRA”), the International Securities Exchange, LLC (“ISE”), the National Stock Exchange (“NSX”), the Chicago Board Options Exchange (“CBOE”), the National Futures Association (“NFA”), Nasdaq OMX, Nasdaq OMX BX and the Municipal Securities Rulemaking Board (“MSRB”). |
| • | Knight Capital Markets LLC (“KCM”) primarily operates as a market maker in the over-the-counter market for NYSE, NYSE Amex Equities and NYSE Arca listed securities. KCM is a broker-dealer registered with the SEC and is a member of Nasdaq and FINRA. |
| • | Knight Capital Europe Limited (“KCEL”, formerly known as Knight Equity Markets International Limited), is a U.K. registered broker-dealer that provides trade execution services for institutional and broker-dealer clients in U.S., European and Asian equities. KCEL also offers trade execution services for institutional clients in U.S., European and Asian fixed income products. KCEL is authorized and regulated by the U.K. Financial Services Authority (“FSA”) and is a member of the London Stock Exchange, Deutsche Börse AG, Euronext N.V. (incorporating Euronext Amsterdam, Euronext Brussels, Euronext Lisbon and Euronext Paris), Borsa Italiana, Nasdaq OMX (incorporating the Copenhagen Stock Exchange, Helsinki Stock Exchange and Stockholm Stock Exchange), Oslo Børs, SIX Swiss Exchange, Weiner Börse, Chi-X Europe Limited, Turquoise, Plus Markets, Equiduct, BATS Europe, Nasdaq OMX Europe, Nyfix Euromillennium, NYSE Arca and NYSE Smartpool. |
| • | Knight Capital Asia Limited LLC (“KCAL”) offers trade execution services in Asian, U.S. and European equities to institutional clients worldwide. KCAL is a broker-dealer registered as an exchange participant with the Hong Kong Stock Exchange and is regulated by the Hong Kong Securities and Futures Commission (“SFC”). |
| • | Knight Direct LLC (“Knight Direct”) provides institutions with direct market access trading through Knight DirectTM, an advanced electronic platform. EdgeTrade, LLC (“EdgeTrade”), an agency-only trade execution and algorithmic software firm that allows buy- and sell-side clients to more effectively source liquidity and manage the trading process as well as maintain anonymity, reduce market impact and lower transaction costs, was acquired by the Company in January 2008 and merged into Knight Direct in August 2008. Knight Direct is a broker-dealer registered with the SEC and is a member of Nasdaq, FINRA and the NFA. |
| • | Knight Clearing Services LLC (“KCS”) is a broker-dealer that has been established to provide settlement and clearance services for the Company’s broker-dealer subsidiaries. KCS is registered with the SEC and is a member of FINRA, Depository Trust Company, the National Securities Clearing Corporation and a registered clearing member of NYSE, Nasdaq, ISE, NSX, CBOE Stock Exchange, Nasdaq OMX, Nasdaq OMX BX and BATS. |
63
Table of Contents
KNIGHT CAPITAL GROUP, INC.
NOTES TO CONSOLIDATED FINANCIAL STATEMENTS—Continued
FICC
| • | Knight Libertas Holdings LLC and its affiliates (collectively, “Knight Libertas”) provide trade execution services and investment research across a broad range of fixed income securities, including high-yield and high-grade corporate bonds, distressed debt, asset- and mortgage-backed securities, federal agency securities, convertible bonds, hybrid securities, syndicated bank loans and emerging markets. Knight Libertas also offers capital markets services to companies seeking financing. One Knight Libertas subsidiary is a broker-dealer registered with the SEC and is a member of FINRA and MSRB. Knight Libertas’ European business is operated by KCEL. Knight Libertas also includes a Hong Kong registered broker-dealer that is regulated by the SFC. Knight Libertas was acquired by the Company in July 2008. |
| • | Hotspot Holdings FX, Inc. and its subsidiaries (“Hotspot”) provide institutions and dealers with spot foreign exchange, gold and silver executions through an advanced, fully electronic platform. Hotspot’s European business is regulated by the FSA. |
| • | Knight BondPoint, Inc. (“Knight BondPoint”) provides electronic access and trade execution services for the retail fixed income market. Knight BondPoint is a broker-dealer registered with the SEC and is a member of FINRA and MSRB. |
Corporate
The Corporate segment includes investment income earned on strategic investments, corporate investment in the Deephaven Funds and all corporate overhead expenses and all other expenses not attributable to the Equities and FICC segments. Corporate overhead expenses primarily consist of compensation for certain senior executives and other individuals employed at the corporate holding company, legal and other professional expenses related to corporate matters, directors’ fees, investor and public relations expenses and directors’ and officers’ insurance.
At the close of business on September 28, 2007 (the “Deconsolidation Date”) the Company deconsolidated Direct Edge ECN LLC (“Direct Edge”) as it no longer controlled Direct Edge as of that date. Direct Edge ECN LLC operates as an electronic communications network (“ECN”). Direct Edge is a liquidity destination offering the ability to match and route trades in Nasdaq, NYSE, NYSE Amex Equities and NYSE Arca listed securities. The results of its operations have been included in the Consolidated Statements of Operations up through the Deconsolidation Date. The Company accounts for its interest in Direct Edge Holdings LLC (“Direct Edge Holdings”), the newly formed immediate parent company of Direct Edge (together, “Direct Edge”) under the equity method for periods subsequent to the Deconsolidation Date. See Footnote 9 “Direct Edge” for further discussion.
Discontinued Operations
The Company’s former Asset Management segment comprised Deephaven Capital Management LLC and its subsidiaries (collectively, “Deephaven”), which was the registered investment adviser to, and sponsor of, the Deephaven investment funds (the “Deephaven Funds”). Prior to February 1, 2008, Deephaven was a wholly-owned subsidiary of the Company. On February, 1, 2008, the Company contributed its interest in Deephaven to Deephaven Capital Management Holdings LLC (“Deephaven Holdings”) in exchange for a 51% interest in Deephaven Holdings. In addition, certain Deephaven managers (“Deephaven Managers”) acquired a 49% interest in Deephaven Holdings in exchange for the termination of their employment agreements and associated profit sharing bonuses and an equity contribution.
64
Table of Contents
KNIGHT CAPITAL GROUP, INC.
NOTES TO CONSOLIDATED FINANCIAL STATEMENTS—Continued
On January 27, 2009, Deephaven entered into an Asset Purchase Agreement along with Deephaven Managing Partners, LLC (“Deephaven Partners”), the Company, and each of the Deephaven Managers to sell substantially all of Deephaven’s assets to Stark & Roth, Inc. (together with its affiliates, “Stark”) with Stark agreeing to assume certain limited liabilities of Deephaven.
On March 31, 2009, Deephaven completed the sale of substantially all of its assets to Stark. As of that date, Deephaven was replaced by Stark as the investment manager, managing member and general partner for the Deephaven Funds and the Company exited the Asset Management business. As a result of this sale, the Company’s Asset Management segment was classified as a discontinued operation.
The Company completed the sale of its Derivative Markets business to Citigroup Financial Products Inc. (“Citigroup”) in December of 2004. Costs associated with the Derivative Markets segment have been included within discontinued operations. For a further discussion of the sale of the Company’s Derivative Markets business and its associated accounting treatment, see Footnote 13 “Discontinued Operations.”
2. Significant Accounting Policies
Basis of consolidation and form of presentation
The accompanying Consolidated Financial Statements, prepared in conformity with accounting principles generally accepted in the United States of America (“GAAP”), include the accounts of the Company and its subsidiaries. All significant intercompany transactions and balances have been eliminated.
Certain reclassifications have been made to the prior years’ Consolidated Financial Statements in order to conform to the current year presentation. Such reclassifications are immaterial to both current and all previously issued financial statements taken as a whole and had no effect on previously reported Net income. These reclassifications are as follows:
| • | Effective January 1, 2009, as required by a new accounting standard, the Company retrospectively recharacterized its presentation and disclosure of minority interests as noncontrolling interests, which are classified as a component of equity on the Consolidated Statements of Financial Condition. The Company recorded a benefit (loss) attributable to noncontrolling interests of $380,000 and ($6.2 million) for the years ended December 31, 2009 and 2008, respectively, related to the former Asset Management segment and as such is included in (Loss) income from discontinued operations, net of tax on the Consolidated Statements of Operations. |
| • | The Company reclassified costs related to its soft dollar activity. The Company determined that it was appropriate to report commission revenue associated with these activities net of the associated soft dollar expense, instead of reporting such amounts on a gross basis. This reclassification resulted in a reduction of both the Company’s reported Commissions and fees and Total revenues of approximately $60.7 million and $49.8 million for the years ended December 31, 2008 and 2007, respectively. |
Cash and cash equivalents
Cash and cash equivalents include money market accounts, which are payable on demand, and short-term investments with an original maturity of less than 90 days. The carrying amount of such cash equivalents approximates their fair value due to the short-term nature of these instruments.
65
Table of Contents
KNIGHT CAPITAL GROUP, INC.
NOTES TO CONSOLIDATED FINANCIAL STATEMENTS—Continued
Market-making, trading and sales activities
Securities owned and securities sold, not yet purchased, which primarily consist of listed and OTC equities, are carried at fair value and are recorded on a trade date basis. Net trading revenue (trading gains, net of trading losses) and commissions (which includes commission equivalents earned on institutional client orders) and related expenses are also recorded on a trade date basis. The Company’s clearing agreements call for payment or receipt of interest income, net of transaction-related interest charged by clearing brokers for facilitating the settlement and financing of securities transactions. Such interest expense, which has been netted against interest income on the Consolidated Statements of Operations, was $6.5 million, $7.5 million and $18.2 million in 2009, 2008 and 2007, respectively.
Dividend income relating to securities owned and dividend expense relating to securities sold, not yet purchased, derived from the Company’s market-making activities are included as a component of Net trading revenue on the Consolidated Statements of Operations. Net trading revenue includes dividend income of $24.3 million, $20.1 million and $5.5 million in 2009, 2008 and 2007, respectively. Net trading revenue includes dividend expense of $22.3 million, $11.7 million and $5.2 million in 2009, 2008 and 2007, respectively.
Payments for order flow and ECN rebates represent payments to broker-dealer clients, in the normal course of business, for directing their order flow in U.S. equities to the Company, and rebates for providing liquidity to Direct Edge through the Deconsolidation Date.
Securities borrowed and securities loaned
Securities borrowed and securities loaned transactions are accounted for as collateralized financing transactions and are recorded at the amount of cash collateral advanced or received which approximates fair value. Securities borrowed transactions facilitate the settlement process and require the Company to deposit cash or other collateral with the lender. Securities loaned transactions help finance the Company’s securities inventory and require the Company to lend stock in exchange for the receipt of cash or collateral from the borrower. In these transactions, the Company receives or lends cash or other collateral in an amount generally in excess of the market value of the applicable securities borrowed and loaned. The Company monitors the market value of securities borrowed or loaned on a daily basis, with additional collateral obtained or refunded as necessary.
Estimated fair value of financial instruments
The Company values its financial instruments using a hierarchy of fair value that maximizes the use of observable inputs and minimizes the use of unobservable inputs when measuring fair value.
The fair value hierarchy can be summarized as follows:
| • | Level 1—Valuations based on quoted prices in active markets for identical assets or liabilities that the Company has the ability to access. Since valuations are based on quoted prices that are readily and regularly available in an active market, valuation of these products does not entail a significant degree of judgment. |
| • | Level 2—Valuations based on quoted prices in markets that are not active or for which all significant inputs are observable, either directly or indirectly. |
| • | Level 3—Valuations based on inputs that are unobservable and significant to the overall fair value measurement. |
66
Table of Contents
KNIGHT CAPITAL GROUP, INC.
NOTES TO CONSOLIDATED FINANCIAL STATEMENTS—Continued
Changes in fair value are recognized in earnings each period for financial instruments that are carried at fair value.
The Company’s securities owned and securities sold, not yet purchased will generally be classified within Level 1 of the fair value hierarchy because they are valued using quoted market prices or broker or dealer quotations with reasonable levels of price transparency.
The types of instruments that trade in markets that are not considered to be active, but are valued based on quoted market prices, broker or dealer quotations, or alternative pricing sources with reasonable levels of price transparency are generally classified within Level 2 of the fair value hierarchy. As of December 31, 2009 and 2008, the Company’s investment in Deephaven Funds as well as Deferred compensation investments met the definition of Level 2.
Certain instruments are classified within Level 3 of the fair value hierarchy because they trade infrequently and therefore have little or no price transparency. For those instruments that are not traded in active markets or are subject to transfer restrictions, valuations are adjusted to reflect illiquidity and/or non-transferability, and such adjustments are generally based on available market evidence. In the absence of such evidence, management’s best estimate is used. As of December 31, 2009 and 2008, the Company did not hold any financial instruments that met the definition of Level 3.
Strategic investments
Strategic investments include noncontrolling equity ownership interests and debt instruments held by the Company within its non-broker-dealer subsidiaries, primarily in financial services-related businesses. Strategic investments are accounted for under the equity method, at cost or at fair value. The equity method of accounting is used for investments in limited partnerships and limited liability companies that are held by the Company or any of its non-broker-dealer subsidiaries. Investments in corporations by such non-broker-dealers are held at amortized cost. The equity method of accounting is used where the Company is considered to exert significant influence on the investee. Investments are held at adjusted cost when the Company is not considered to exert significant influence on the investee. Investments in liquid investment funds, including deferred compensation investments in mutual funds, are accounted for at fair value.
Strategic investments are reviewed on an ongoing basis to ensure that the carrying values of the investments have not been impaired. If the Company determines that an impairment loss on a strategic investment has occurred due to a decline in fair value or other market conditions, the investment is written down to its estimated impaired value.
Goodwill and intangible assets
The Company tests goodwill and intangible assets with an indefinite useful life for impairment annually or when an event occurs or circumstances change that signifies the existence of impairment. The Company amortizes other intangible assets on a straight line basis over their useful lives and tests for recoverability whenever events indicate that the carrying amounts may not be recoverable.
67
Table of Contents
KNIGHT CAPITAL GROUP, INC.
NOTES TO CONSOLIDATED FINANCIAL STATEMENTS—Continued
Deferred compensation investments
The Company has several deferred compensation plans related to certain employees and directors. These plans provide a return to the participants based upon the performance of various investments. In order to hedge its liability under these plans, the Company generally acquires the underlying investments and holds such investments until the deferred compensation liabilities are satisfied. Changes in value of such investments are recorded in Investment income and other, net, with a corresponding charge or credit to Employee compensation and benefits on the Consolidated Statements of Operations.
Treasury stock
The Company records its purchases of treasury stock at cost as a separate component of stockholders’ equity. The Company obtains treasury stock through purchases in the open market or through privately negotiated transactions. The Company may re-issue treasury stock, at average cost, related to the acquisition of new businesses or, in certain instances, as inducement grants to new hires.
Foreign currencies
The functional currency of the Company’s foreign subsidiaries is the U.S. dollar. Assets and liabilities denominated in foreign currencies are translated into U.S. dollars using current exchange rates at the date of the Consolidated Statements of Financial Condition. Revenues and expenses are translated at average rates during the periods. Gains or losses resulting from foreign currency transactions are included in Investment income and other, net on the Consolidated Statements of Operations.
Soft dollar expense
Under a commission management program, the Company allows institutional clients to allocate a portion of their gross commissions to pay for research and other services provided by third parties. As the Company acts as an agent in these transactions, it records such expenses on a net basis within Commissions and fees on the Consolidated Statements of Operations.
Depreciation, amortization and occupancy
Fixed assets are depreciated on a straight-line basis over their estimated useful lives of three to seven years. Leasehold improvements are being amortized on a straight-line basis over the shorter of the life of the related office lease or the expected useful life of the assets. The Company capitalizes certain costs associated with the acquisition or development of internal-use software and amortizes the software over its estimated useful life of three years, commencing at the time the software is placed in service.
The Company recognizes rent expense under operating leases with fixed rent escalations, lease incentives and free rent periods on a straight-line basis over the lease term beginning on the date the Company takes possession of or controls the use of the space, including during free rent periods.
68
Table of Contents
KNIGHT CAPITAL GROUP, INC.
NOTES TO CONSOLIDATED FINANCIAL STATEMENTS—Continued
Lease loss accrual
The Company’s policy is to identify excess real estate capacity and where applicable, accrue for related future costs, net of estimated sub-lease income. In determining the accrual, a nominal cash flow analysis is performed for lease losses initiated prior to December 31, 2002 and costs related to the excess capacity are accrued. For lease losses initiated after December 31, 2002, the Company’s policy is to accrue future costs related to excess capacity using a discounted cash flow analysis.
In the event the Company is able to sublease the excess real estate after recording a lease loss, such accrual is adjusted to the extent the actual terms of sub-leased property differ from the assumptions used in the calculation of the accrual. In the event that the Company concludes that previously determined excess real estate is needed for the Company’s use, such lease loss accrual is adjusted accordingly. Any such adjustments to previous lease loss accruals are recorded in Writedown of assets and lease loss accrual (benefit), net on the Consolidated Statements of Operations.
Income taxes
The Company records deferred tax assets and liabilities for the expected future tax consequences of temporary differences between the financial reporting and tax bases of assets and liabilities and measures them using the enacted tax rates and laws that will be in effect when such differences are expected to reverse. The Company evaluates the recoverability of future tax deductions by assessing the adequacy of future expected taxable income from all sources, including reversal of temporary differences and forecasted operating earnings. Net deferred tax assets and liabilities are included in Other assets and Accrued expenses and other liabilities, respectively, on the Consolidated Statements of Financial Condition.
Discontinued operations
Revenues and expenses associated with a separate segment or reporting unit that has been disposed of through closure or sale are included in (Loss) income from discontinued operations, net of tax on the Consolidated Statements of Operations. Assets and liabilities of discontinued operations are included in Assets within discontinued operations and Liabilities within discontinued operations, respectively, on the Consolidated Statements of Financial Condition. Cash flows from discontinued operations are presented on the Consolidated Statements of Cash Flows within operating, investing and financing activities, as applicable.
Stock-based compensation
Stock-based compensation is measured based on the grant date fair value of the awards. These costs are amortized over the requisite service period, which is typically the vesting period.
Expected forfeitures are considered in determining stock-based employee compensation expense. For all periods presented, the Company recorded a benefit for expected forfeitures on all outstanding stock-based awards. The benefit recorded did not have a material impact on the results of operations in any of the periods presented.
The Company applies a non-substantive vesting period approach for stock-based awards whereby the expense is accelerated for those employees and directors that receive options and restricted stock units (“RSUs”) and are eligible to retire prior to the options or RSUs vesting.
69
Table of Contents
KNIGHT CAPITAL GROUP, INC.
NOTES TO CONSOLIDATED FINANCIAL STATEMENTS—Continued
Use of estimates
The preparation of financial statements in conformity with GAAP requires management to make estimates and assumptions that affect the reported amounts of assets and liabilities and disclosure of contingent assets and liabilities at the date of the financial statements and the reported amounts of revenues and expenses during the reporting period. Actual results may differ from those estimates.
Subsequent events
The Company evaluated all activities through February 24, 2010, the filing date of this Form 10-K.
Recently issued accounting standards
In December 2007, the Financial Accounting Standards Board (“FASB”) issued an accounting standard which requires the acquiring entity in a business combination to recognize the acquisition date fair value for all identifiable assets acquired, and liabilities assumed, any noncontrolling interest in the acquiree and the goodwill acquired. Recognition of assets acquired and liabilities assumed arising from contingencies requires the capitalization of in-process research and development and requires the expensing of acquisition-related and restructuring costs as incurred. This new accounting standard was effective as of January 1, 2009 and the Company will apply the provisions of this statement to any future business combinations.
In March 2008, the FASB issued an accounting standard which requires enhanced disclosures about an entity’s derivative and hedging activities. This statement was effective as of January 1, 2009. The adoption only affected disclosures within the Notes to the Consolidated Financial Statements.
In May 2009, the FASB issued an accounting standard which establishes accounting and reporting standards for events that occur after the balance sheet date but before financial statements are issued or are available to be issued. Specifically, the accounting standard sets forth (i) the period after the balance sheet date during which management of a reporting entity should evaluate events or transactions that may occur for potential recognition or disclosure in the financial statements, (ii) the circumstances under which an entity should recognize events or transactions occurring after the balance sheet date in its financial statements and (iii) the disclosures that an entity should make about events or transactions that occurred after the balance sheet date. In addition, the accounting standard requires a reporting entity to disclose the date through which subsequent events were evaluated. This new accounting standard was effective for reporting periods ended after June 15, 2009 and the adoption did not have any impact on the Consolidated Financial Statements.
On July 1, 2009, the FASB issued The FASB Accounting Standards Codification (the “Codification”). The Codification became the source of authoritative U.S. GAAP recognized by the FASB for nongovernmental entities. Rules and interpretive releases of the SEC under authority of federal securities laws are also sources of authoritative GAAP to the Company. The FASB will no longer issue new standards in the form of Statements, FASB Staff Positions or Emerging Issues Take Force Abstracts; instead the FASB now issues Accounting Standards Updates. The issuance of the Codification does not change GAAP and was effective for reporting periods ending after September 15, 2009. The implementation of the Codification did not have any impact on the Company’s Consolidated Financial Statements.
Since July 1, 2009, no Accounting Standards Updates were issued that are expected to have a significant effect on the Company’s Consolidated Financial Statements.
70
Table of Contents
KNIGHT CAPITAL GROUP, INC.
NOTES TO CONSOLIDATED FINANCIAL STATEMENTS—Continued
3. Fair Value of Financial Instruments
The Company’s financial instruments recorded at fair value have been categorized based upon a fair value hierarchy in accordance with accounting standards, as described more fully in Footnote 2 “Significant Accounting Policies.” The following fair value hierarchy table presents information about the Company’s financial assets and liabilities measured at fair value on a recurring basis (in millions):
| Assets and Liabilities Measured at Fair Value on a Recurring Basis | ||||||||||||
| December 31, 2009 |
Level 1 | Level 2 | Level 3 | Total | ||||||||
| Assets |
||||||||||||
| Securities owned, held at clearing brokers and depositories, at fair value: |
||||||||||||
| Equities (1) |
$ | 921.1 | $ | — | $ | — | $ | 921.1 | ||||
| U.S. government obligations |
3.5 | — | — | 3.5 | ||||||||
| Listed equity options |
2.0 | — | — | 2.0 | ||||||||
| Investment in Deephaven Funds |
— | 8.5 | — | 8.5 | ||||||||
| Deferred compensation investments (2) |
— | 45.0 | — | 45.0 | ||||||||
| Total fair value of financial instrument assets |
$ | 926.6 | $ | 53.5 | $ | — | $ | 980.0 | ||||
| Liabilities |
||||||||||||
| Securities sold, not yet purchased, at fair value: |
||||||||||||
| Equities (1) |
$ | 638.1 | $ | — | $ | — | $ | 638.1 | ||||
| Listed equity options |
1.2 | — | — | 1.2 | ||||||||
| Total fair value of financial instrument liabilities |
$ | 639.3 | $ | — | $ | — | $ | 639.3 | ||||
|
|
||||||||||||
| (1) Equities of $191.1 million have been netted by their respective long and short positions as of December 31, 2009. | ||||||||||||
| (2) Amount excludes $10.5 million of Level 2 assets which were recorded as part of Assets within discontinued operations at December 31, 2009. Totals may not add due to rounding.
| ||||||||||||
| Assets and Liabilities Measured at Fair Value on a Recurring Basis | ||||||||||||
| December 31, 2008 |
Level 1 | Level 2 | Level 3 | Total | ||||||||
| Assets |
||||||||||||
| Securities owned, held at clearing brokers, at fair value: |
||||||||||||
| Equities (1) |
$ | 469.4 | $ | — | $ | — | $ | 469.4 | ||||
| U.S. government obligations |
6.7 | — | — | 6.7 | ||||||||
| Investment in Deephaven Funds |
— | 47.2 | — | 47.2 | ||||||||
| Strategic investment |
— | 27.9 | — | 27.9 | ||||||||
| Deferred compensation investments (2) |
— | 41.6 | — | 41.6 | ||||||||
| Total fair value of financial instrument assets |
$ | 476.1 | $ | 116.7 | $ | — | $ | 592.8 | ||||
| Liabilities |
||||||||||||
| Securities sold, not yet purchased, at fair value: |
||||||||||||
| Equities (1) |
$ | 385.0 | $ | — | $ | — | $ | 385.0 | ||||
| Total fair value of financial instrument liabilities |
$ | 385.0 | $ | — | $ | — | $ | 385.0 | ||||
| (1) | Equities of $93.8 million have been netted by their respective long and short positions as of December 31, 2008. |
| (2) | Amount excludes $31.1 million of Level 2 assets which were recorded as part of Assets within discontinued operations at December 31, 2008. |
Totals may not add due to rounding.
71
Table of Contents
KNIGHT CAPITAL GROUP, INC.
NOTES TO CONSOLIDATED FINANCIAL STATEMENTS—Continued
As of December 31, 2009, the Company held 9,185 long listed equity option contracts with a gross fair value of $2.0 million and 5,675 short listed equity option contracts with a gross fair value of $1.2 million which are included on the Consolidated Statements of Financial Condition within Securities owned, held at clearing brokers, at fair value and Securities sold, not yet purchased, at fair value. These positions are not considered hedging instruments under GAAP since they are used for trading activities. In 2009, there was a pre-tax loss of $8.3 million pertaining to listed equity option contracts, which was recorded within Net trading revenue on the Consolidated Statements of Operations.
4. Receivable from/Payable to Brokers and Dealers
Amounts receivable from and payable to brokers and dealers consist of the following (in millions):
| December 31, | ||||||
| 2009 | 2008 | |||||
| Receivable: |
||||||
| Clearing brokers and other |
$ | 412.7 | $ | 281.9 | ||
| Securities failed to deliver |
87.5 | 47.6 | ||||
| $ | 500.1 | $ | 329.5 | |||
| Payable: |
||||||
| Clearing brokers and other |
$ | 92.8 | $ | 65.5 | ||
| Securities failed to receive |
62.4 | 32.6 | ||||
| $ | 155.1 | $ | 98.1 | |||
Totals may not add due to rounding.
Management believes that the carrying value of amounts receivable from and payable to brokers and dealers approximates fair value.
5. Fixed Assets and Leasehold Improvements
Fixed assets and leasehold improvements comprise the following (in millions):
| Depreciation Period |
December 31, | |||||||
| 2009 | 2008 | |||||||
| Computer hardware and software |
3 years | $ | 119.8 | $ | 100.5 | |||
| Leasehold improvements |
* | 83.0 | 66.2 | |||||
| Telephone systems |
5 years | 10.7 | 9.3 | |||||
| Furniture and fixtures |
7 years | 10.7 | 7.5 | |||||
| Trading systems and equipment |
5 years | 2.6 | 2.7 | |||||
| 226.7 | 186.2 | |||||||
| Less—Accumulated depreciation and amortization |
128.0 | 105.0 | ||||||
| $ | 98.7 | $ | 81.2 | |||||
* - Shorter of life of lease or useful life of assets
72
Table of Contents
KNIGHT CAPITAL GROUP, INC.
NOTES TO CONSOLIDATED FINANCIAL STATEMENTS—Continued
6. Strategic Investments and Deferred Compensation Investments
Strategic investments of $65.2 million at December 31, 2009 consisted of $57.4 million in ten limited liability companies, limited partnership investments and a corporation accounted for under the equity method, $0.3 million of investments in common stock of two private companies representing less than 20% equity ownership which are held at adjusted cost, and $7.5 million in four debt instruments, which are held at adjusted cost. Included in the $57.4 million investment in limited liability companies at December 31, 2009 is a $41.3 million equity investment in Direct Edge, which is described further in Footnote 9 “Direct Edge.”
Strategic investments of $83.7 million at December 31, 2008 consisted of a $27.9 million short-term investment in a liquid investment fund carried at fair value, $49.8 million in seven limited liability companies, limited partnership investments and a corporation accounted for under the equity method, $1.0 million of investments in common stock of two private companies representing less than 20% equity ownership which are held at adjusted cost, and $5.0 million in three debt instruments, which are held at adjusted cost. Included in the $49.8 million investment in limited liability companies at December 31, 2008 is a $33.7 million equity investment in Direct Edge, which is described further in Footnote 9 “Direct Edge.”
The Company has corporate investments in the Deephaven funds of $8.5 million and $47.2 million at December 31, 2009 and 2008, respectively. These investments are recorded in Other assets on the Company’s Statement of Financial Condition. The Company also has corporate deferred compensation investments of $45.0 million and $41.6 million at December 31, 2009 and December 31, 2008, respectively, related to employee and director deferred compensation plans.
See Footnote 2 “Significant Accounting Policies” for a discussion of valuation of Strategic investments.
7. Goodwill and Intangible Assets
Goodwill and intangible assets with indefinite useful lives are tested for impairment annually or when an event occurs or circumstances change that signify the existence of impairment. As part of the test for impairment, the Company considers the profitability of the respective segment or reporting unit, an assessment of the fair value of the respective segment or reporting unit as well as the overall market value of the Company compared to its net book value. In June 2009 and 2008, the Company tested for the impairment of goodwill and intangible assets with indefinite lives and concluded that there was no impairment.
Amortizable intangibles are tested for recoverability whenever events indicate that the carrying amounts may not be recoverable. In 2009, the Company discontinued the use of the Donaldson trade name and wrote off the remaining book value of $2.4 million. In 2008, the Company discontinued the use of the Direct Trading Institutional trade name and wrote off the remaining book value of $2.5 million. No other events occurred in 2009 or 2008 that would indicate that the carrying amounts of the Company’s goodwill or intangible assets may not be recoverable.
Goodwill of $114.7 million at both December 31, 2009 and 2008 relates to the Equities segment. Goodwill of $150.8 million and $117.5 million at December 31, 2009 and 2008, respectively relate to the FICC segment. Goodwill within the FICC segment increased by $33.3 million during 2009, as a result of Knight Libertas achieving its first year performance target in accordance with the earn-out
73
Table of Contents
KNIGHT CAPITAL GROUP, INC.
NOTES TO CONSOLIDATED FINANCIAL STATEMENTS—Continued
provisions in the acquisition documents. As such, the Company is required to issue $33.3 million in Knight unregistered common stock, as described in Footnote 20, “Acquisitions.” Goodwill primarily represents the Company’s purchases of the businesses now operating as KCM, Knight Direct, Hotspot, Donaldson, Knight BondPoint and Knight Libertas.
The Company had intangible assets, net of accumulated amortization, of $28.6 million and $35.1 million at December 31, 2009 and 2008, respectively related to the Equities segment. The Company had intangible assets, net of accumulated amortization, of $49.3 million and $55.4 million at December 31, 2009 and 2008, respectively related to the FICC segment. Total Intangible assets decreased by $12.8 million during the year ended December 31, 2009 due to amortization expense and the writedown of the Donaldson trade name. Intangible assets primarily represent client relationships and are being amortized over their remaining useful lives, the majority of which have been determined to range from 4 to 24 years. The weighted average remaining life of the Company’s intangible assets at December 31, 2009 and 2008 is approximately 11 and 12 years, respectively.
In 2009, 2008 and 2007, the Company recorded amortization expense, related to its intangible assets of $10.8 million, $9.4 million and $5.7 million, respectively. The estimated amortization expense relating to the intangible assets for each of the next five years approximates $10.6 million in 2010, $10.4 million in 2011, $10.1 million in 2012, $8.6 in 2013 and $7.4 million in 2014.
74
Table of Contents
KNIGHT CAPITAL GROUP, INC.
NOTES TO CONSOLIDATED FINANCIAL STATEMENTS—Continued
The following chart summarizes the Company’s Goodwill and Intangible assets, net of accumulated amortization, as of December 31, 2009 and 2008 (in millions):
| December 31, | ||||||
| Goodwill |
2009 | 2008 | ||||
| Equities |
||||||
| Purchase of Trimark business |
$ | 10.1 | $ | 10.1 | ||
| Purchase of Tradetech business |
3.0 | 3.0 | ||||
| Purchase of Donaldson business |
3.6 | 3.6 | ||||
| Purchase of remaining shares in Knight Roundtable Europe |
2.5 | 2.5 | ||||
| Purchase of Direct Trading business |
43.8 | 43.8 | ||||
| Purchase of EdgeTrade business |
51.7 | 51.7 | ||||
| Total |
114.7 | 114.7 | ||||
| FICC |
||||||
| Purchase of Hotspot business |
55.7 | 55.7 | ||||
| Purchase of Knight BondPoint business |
14.2 | 14.2 | ||||
| Purchase of Libertas business |
81.0 | 47.6 | ||||
| Total |
150.8 | 117.5 | ||||
| Consolidated Total |
$ | 265.5 | $ | 232.2 | ||
| December 31, | ||||||||||
| Intangible Assets |
2009 | 2008 | ||||||||
| Customer relationships(1) |
Gross carrying amount | $ | 85.3 | $ | 84.8 | |||||
| Accumulated amortization | (23.6 | ) | (15.4 | ) | ||||||
| Net carrying amount | 61.7 | 69.4 | ||||||||
| Trade names(2) |
Gross carrying amount | 8.8 | 11.7 | |||||||
| Accumulated amortization | (1.3 | ) | (1.3 | ) | ||||||
| Net carrying amount | 7.5 | 10.4 | ||||||||
| Other(3) |
Gross carrying amount | 13.5 | 16.1 | |||||||
| Accumulated amortization | (4.8 | ) | (5.4 | ) | ||||||
| Net carrying amount | 8.7 | 10.7 | ||||||||
| Total |
Gross carrying amount | 107.5 | 112.5 | |||||||
| Accumulated amortization | (29.7 | ) | (22.1 | ) | ||||||
| Net carrying amount |
$ | 77.8 | $ | 90.5 | ||||||
| (1) - Customer | relationships primarily relate to the Donaldson, Direct Trading, Hotspot, EdgeTrade and Libertas acquisitions. The weighted average remaining life is approximately 11 years as of December 31, 2009 and 12 years as of December 31, 2008. Lives may be reduced depending upon actual retention rates. |
| (2) - Trade | names relate to the acquisitions of Hotspot, EdgeTrade and Libertas. The weighted average remaining life is approximately 16 years as of December 31, 2009 and 19 years as of December 31, 2008. During 2009, the “Donaldson” trade name with an unamortized cost of $2.4 million was written off. During 2008, the “Direct Trading Institutional” trade name with an unamortized cost of $2.5 million was written off. |
| (3) - Other | includes technology, non-compete agreements and domain name rights acquired by the Company. The weighted average remaining life is approximately five years as of December 31, 2009 and six years as of December 31, 2008. |
Totals may not add due to rounding.
75
Table of Contents
KNIGHT CAPITAL GROUP, INC.
NOTES TO CONSOLIDATED FINANCIAL STATEMENTS—Continued
8. Credit Facility
On October 9, 2007, the Company entered into a three-year $140.0 million credit agreement (“Credit Agreement”) with a consortium of banks led by JPMorgan Chase Bank, N.A. (“JPM”). The Credit Agreement includes a three-year delayed-draw senior secured term loan facility of $70.0 million and a three-year senior secured revolving facility of $70.0 million. The proceeds of the credit facilities were used to finance share repurchases, finance selective acquisitions and for general corporate purposes. These credit facilities are repayable in full by October 3, 2010. Interest on the credit facilities is paid quarterly. As of December 31, 2009, $140.0 million was outstanding under the Credit Agreement.
Under the terms of the Credit Agreement, at the Company’s option, it may choose an interest rate based on the JPM Prime Rate or LIBOR rate. As of December 31, 2009 the $140.0 million loan facilities bear interest at 1.50% per annum, which is based on the three month LIBOR rate plus 1.25% and will reset at the lower of the JPM Prime Rate or LIBOR rate prevailing in March 2010. Approximately $3.0 million, $4.8 million and $132,000 of interest expense was recorded in 2009, 2008 and 2007, respectively.
The Company is charged a commitment fee of 0.3% on the unused portion of the credit facilities. For the years ended December 31, 2008 and 2007, the Company recorded commitment fees of approximately $0.1 million each year, which has been included in Other expenses on the Consolidated Statements of Operations. No commitment fees were recorded during 2009, since the Credit Agreement has been fully drawn.
Under the Credit Agreement, substantially all of the Company’s material subsidiaries, other than its foreign subsidiaries, registered broker-dealer subsidiaries and subsidiaries thereof, guarantee the repayment of loans made pursuant to the credit facilities. Pursuant to the Credit Agreement, the credit facilities have been secured by substantially all of the assets of the Company.
The Credit Agreement includes customary representations, warranties, affirmative and negative covenants (including, among others, limitations on certain payments, investments and transactions) and events of default. It also contains financial covenants tied to the maintenance of financial ratios and metrics. As of December 31, 2009 and 2008, the Company was in compliance with all covenants under the Credit Agreement.
Management believes that the carrying value of the $140.0 million credit agreement approximates fair value.
9. Direct Edge
Following the close of business on July 23, 2007, Direct Edge Holdings issued 1.33 million LLC units and a warrant to purchase an additional 1.9 million LLC units for $20 million (the “Warrant”) to Citadel Derivatives Group LLC (“Citadel”) in exchange for cash of $11.7 million. On September 28, 2007 (“the Deconsolidation Date”), Direct Edge Holdings issued an additional 1.9 million LLC units to Citadel in exchange for $20 million cash upon exercise of the Warrant. Immediately following the September 28, 2007 issuance to Citadel, the Company and Citadel sold a portion of their equity interests (1.2 million units and 1.0 million units, respectively) to Goldman Sachs for $12.75 million and $10.5 million cash, respectively.
76
Table of Contents
KNIGHT CAPITAL GROUP, INC.
NOTES TO CONSOLIDATED FINANCIAL STATEMENTS—Continued
As a result of Direct Edge Holdings’ issuance of equity interests to Citadel, the Company recognized a pre-tax non-operating gain from subsidiary stock issuance of $8.8 million in the third quarter of 2007. The Company also realized a pre-tax gain of $4.2 million from the sale of a portion of its interest in Direct Edge Holdings to The Goldman Sachs Group, Inc., which is included in Investment income and other, net for the year ended December 31, 2007. As a result of these transactions, the Company, through one of its non-broker-dealer subsidiaries, owned 38% of the LLC units of Direct Edge Holdings following the Deconsolidation date.
On December 23, 2008, Direct Edge Holdings and the International Securities Exchange Holdings, Inc. (“ISE”) completed a transaction through which the ISE Stock Exchange became a wholly owned subsidiary of Direct Edge Holdings and the ISE gained a significant equity stake in Direct Edge Holdings. In conjunction with the closing of this transaction, the Company sold approximately 0.9 million of its 2.8 million Direct Edge Holdings units and its interest in the ISE Stock Exchange to the ISE for cash of $47.5 million and recognized a pre-tax gain of $51.6 million of which $35.7 million is included in Investment income and other, net and $15.9 million is reported as Non-operating gain from subsidiary stock issuance. As a result of these transactions, the Company, through one of its non-broker-dealer subsidiaries, reduced its interest in Direct Edge Holdings from approximately 38% to 19.9%.
As Direct Edge was a subsidiary of the Company prior to the Deconsolidation Date, the results of its operations through the Deconsolidation Date are included in the Consolidated Statements of Operations for all periods presented. The Company recorded a noncontrolling interest benefit of $337,000 which represents Citadel’s minority interest share of Direct Edge’s pre-tax losses for the period July 24, 2007 through the Deconsolidation Date. This amount has been included within Other expenses on the Consolidated Statements of Operations for this period.
Since the Company no longer controlled Direct Edge as of the Deconsolidation Date, it is no longer a consolidated subsidiary. The Company accounts for its investment in Direct Edge under the equity method following the Deconsolidation Date, and such investment is included in Strategic investments on the December 31, 2009 and 2008 Consolidated Statements of Financial Condition.
Summarized financial information of Direct Edge is as follows (in millions):
| December 31, | ||||||
| 2009 | 2008 | |||||
| Total assets |
$ | 256.2 | $ | 197.6 | ||
| Total liabilities |
$ | 48.8 | $ | 27.7 | ||
| Members' equity |
207.4 | 169.9 | ||||
| Total liabilities and Members’ equity |
$ | 256.2 | $ | 197.6 | ||
| |
For the year ended December 31, | |||||
| 2009 | 2008 | |||||
| Total revenue |
$ | 831.7 | $ | 392.3 | ||
| Total expenses |
793.7 | 373.3 | ||||
| Net income |
$ | 38.1 | $ | 19.1 | ||
77
Table of Contents
KNIGHT CAPITAL GROUP, INC.
NOTES TO CONSOLIDATED FINANCIAL STATEMENTS—Continued
10. Stock-Based Compensation
The Company has established the Knight Capital Group, Inc. 1998 Long Term Incentive Plan, the Knight Capital Group, Inc. 1998 Nonemployee Director Stock Option Plan, the Knight Capital Group, Inc. 2003 Equity Incentive Plan, the Knight Capital Group, Inc. 2006 Equity Incentive Plan (the “2006 Plan”) and the Knight Capital Group, Inc. Amended and Restated 2009 Inducement Award Plan (the “Inducement Plan”) (collectively, the “Stock Plans”). The Inducement Plan, which was not approved by the Company’s shareholders, contains terms substantially similar to the 2006 Plan. The purpose of the Stock Plans is to provide long-term incentive compensation to employees and directors of the Company. The Stock Plans are administered by the Compensation Committee of the Company’s Board of Directors, and allow for the grant of options, stock appreciation rights (2006 Plan and Inducement Plan only), restricted stock and restricted stock units (collectively, the “awards”), as defined by the Stock Plans. In addition to overall limitations on the aggregate number of awards that may be awarded under the Stock Plans, the Stock Plans (except for the Inducement Plan) limit the number of awards that may be granted to a single individual as well as limit the amount of options, stock appreciation rights (2006 Plan only) or shares of restricted stock or restricted stock units that may be awarded. As of December 31, 2009, the Company has not issued any stock appreciation rights.
Restricted Shares and Restricted Stock Units
Eligible employees and directors may receive restricted shares and/or restricted stock units (collectively “restricted awards”) as a portion of their total compensation. The substantial majority of restricted awards generally vest ratably over three years. During 2009, the Company established the Inducement Plan with 1.5 million authorized shares and granted 378,000 restricted shares as inducement awards to new employees pursuant to this plan. These shares were issued out of treasury and vest ratably over three years. The fair value of the inducement awards are measured in the same manner as other restricted awards. The Company has also issued restricted awards that vest based upon the market price of Knight’s common stock reaching a certain price for a specified period of time (“Market Shares”). The Company has the right to fully vest employees and directors in their restricted stock units upon retirement and in certain other circumstances. Restricted awards are otherwise canceled if employment is terminated before the end of the relevant vesting period.
The Company measures compensation cost related to restricted awards other than Market Shares based on the fair value of the Company’s common stock at the date of grant, which the Stock Plans define as the average of the high and low sales price on the business day prior to the grant date. The Company determines compensation cost for Market Shares based upon the fair value of such awards at date of grant and projected median vesting periods, both of which are based on statistical simulation models. The principal assumptions utilized in valuing Market Shares and determining their median vesting periods include: 1) risk-free interest rate—estimate is based on the yield of U.S. zero coupon securities with a maturity equal to the expected life of the award; 2) expected volatility—estimate is based on several factors including implied volatility of market-traded options on the Company’s common stock on the grant date and the historical volatility of the Company’s common stock; and 3) maximum life—based upon the maximum contractual life of the award. Based upon the results of this model, the weighted-average fair value and median vesting period of Market Shares granted in 2009 were $9.65 per share and 1.7 years, respectively. The weighted-average fair value and median vesting period of Market Shares granted in 2008 were $10.02 per share and 1.5 years, respectively. The principal assumptions used in valuing Market Shares issued in 2008 and 2009 were a risk-free interest rate of 2.6%, expected volatility of 40% and maximum life of four years. There were no Market Shares granted in 2007.
78
Table of Contents
KNIGHT CAPITAL GROUP, INC.
NOTES TO CONSOLIDATED FINANCIAL STATEMENTS—Continued
The Company recorded compensation expense from continuing operations of $46.2 million, $24.5 million and $16.7 million for the years ended December 31, 2009, 2008 and 2007, respectively relating to restricted awards, the majority of which has been included in Employee compensation and benefits on the Consolidated Statements of Operations. The total income tax benefit recognized on the Consolidated Statements of Operations related to restricted awards was $18.5 million, $9.8 million and $6.7 million for the years ended December 31, 2009, 2008 and 2007, respectively.
The following table summarizes restricted awards activity in 2009, 2008 and 2007 (awards in thousands):
| 2009 | ||||||||||||
| Restricted Shares | Restricted Stock Units | |||||||||||
| Number of Shares |
Weighted- Average Grant Date Fair Value |
Number of Units |
Weighted- Average Grant Date Fair Value | |||||||||
| Outstanding at January 1, |
3,248.4 | $ | 16.95 | 782.6 | $ | 13.90 | ||||||
| Granted |
636.7 | 16.84 | 2,958.3 | 16.05 | ||||||||
| Vested |
(1,647.7 | ) | 16.94 | (137.8 | ) | 15.47 | ||||||
| Forfeited |
(50.8 | ) | 16.90 | (12.3 | ) | 18.45 | ||||||
| Outstanding at December 31, |
2,186.5 | $ | 16.92 | 3,590.7 | $ | 15.60 | ||||||
| 2008 | ||||||||||||
| Restricted Shares | Restricted Stock Units | |||||||||||
| Number of Shares |
Weighted- Average Grant Date Fair Value |
Number of Units |
Weighted- Average Grant Date Fair Value | |||||||||
| Outstanding at January 1, |
3,648.9 | $ | 15.19 | — | $ | — | ||||||
| Granted |
1,785.2 | 16.68 | 782.6 | 13.90 | ||||||||
| Vested |
(2,034.4 | ) | 13.73 | — | — | |||||||
| Forfeited |
(151.3 | ) | 14.57 | — | — | |||||||
| Outstanding at December 31, |
3,248.4 | $ | 16.95 | 782.6 | $ | 13.90 | ||||||
| 2007 | ||||||||||||
| Restricted Shares | Restricted Stock Units | |||||||||||
| Number of Shares |
Weighted- Average Grant Date Fair Value |
Number of Units |
Weighted- Average Grant Date Fair Value | |||||||||
| Outstanding at January 1, |
2,711.1 | $ | 11.55 | — | $ | — | ||||||
| Granted |
2,564.4 | 18.20 | — | — | ||||||||
| Vested |
(1,416.8 | ) | 13.86 | — | — | |||||||
| Forfeited |
(209.8 | ) | 14.06 | — | — | |||||||
| Outstanding at December 31, |
3,648.9 | $ | 15.19 | — | $ | — | ||||||
Based upon the value at date of vest, the cumulative fair value of restricted shares that vested in 2009, 2008 and 2007 was $29.1 million, $33.5 million and $22.9 million, respectively. The cumulative fair value of restricted stock units that vested in 2009 was $2.1 million.
79
Table of Contents
KNIGHT CAPITAL GROUP, INC.
NOTES TO CONSOLIDATED FINANCIAL STATEMENTS—Continued
There is $54.0 million of unamortized compensation related to the unvested restricted awards outstanding at December 31, 2009. The cost of these unvested restricted shares is expected to be recognized over a weighted average life of 1.6 years.
Stock Options
The Company’s policy is to grant options for the purchase of shares of Class A Common Stock at not less than market value, which the Stock Plans define as the average of the high and low sales price on the business day prior to the grant date. Options generally vest ratably over a three or four-year period and expire on the fifth or tenth anniversary of the grant date, pursuant to the terms of the applicable option award agreement. The Company has the right to fully vest employees in their options upon retirement and in certain other circumstances. Options are otherwise canceled if employment is terminated before the end of the relevant vesting period. The Company’s policy is to issue new shares upon share option exercises by its employees and directors.
The fair value of each option granted is estimated as of its respective grant date using the Black-Scholes option-pricing model. Stock options granted have exercise prices equal to the market value of the Company’s common stock at the date of grant as defined by the Stock Plans. The principal assumptions utilized in valuing options and the methodology for estimating such model inputs include: 1) risk-free interest rate—estimate is based on the yield of U.S. zero coupon securities with a maturity equal to the expected life of the option; 2) expected volatility—estimate is based on several factors including implied volatility of market-traded options on the Company’s common stock on the grant date and the historical volatility of the Company’s common stock; and 3) expected option life—estimate is based on internal studies of historical experience and projected exercise behavior based on different employee groups and specific option characteristics, including the effect of employee terminations. Based on the results of the model, the weighted-average fair value of the stock options granted in 2009, 2008 and 2007 was $4.90, $5.45 and $6.09, respectively. The weighted-average assumptions used were as follows in 2009, 2008 and 2007:
| 2009 | 2008 | 2007 | |||||||
| Dividend yield |
0.0 | % | 0.0 | % | 0.0 | % | |||
| Expected volatility |
40.0 | % | 40.0 | % | 40.0 | % | |||
| Risk-free interest rate |
1.5 | % | 2.6 | % | 4.3 | % | |||
| Expected life (in years) |
3.5 | 3.5 | 3.5 |
The Company recorded compensation expense relating to options of $2.1 million, $3.6 million and $4.7 million in 2009, 2008 and 2007, respectively, all of which was recorded in Employee compensation and benefits on the Consolidated Statements of Operations. The total income tax benefit recognized on the Consolidated Statements of Operations related to stock options was $0.8 million, $1.4 million and $1.9 million in 2009, 2008 and 2007, respectively.
80
Table of Contents
KNIGHT CAPITAL GROUP, INC.
NOTES TO CONSOLIDATED FINANCIAL STATEMENTS—Continued
The following table summarizes stock option activity and stock options exercisable in 2009, 2008 and 2007 (options in thousands):
| 2009 |
Number of Stock Options |
Weighted- Average Exercise Price |
Aggregate Intrinsic Value (in millions) |
Weighted- Average Remaining Life (years) | |||||||
| Outstanding at January 1, |
4,748.3 | $ | 13.32 | ||||||||
| Granted at market value |
210.0 | 15.78 | |||||||||
| Exercised |
(1,083.4 | ) | 10.15 | ||||||||
| Forfeited or expired |
(321.0 | ) | 25.96 | ||||||||
| Outstanding at December 31, |
3,554.0 | $ | 13.29 | $ | 11.1 | 4.95 | |||||
| Vested at December 31, |
3,509.5 | $ | 13.26 | $ | 11.1 | 4.97 | |||||
| Available for future grants at December 31, * |
8,651.3 | ||||||||||
| 2008 |
|||||||||||
| Outstanding at January 1, |
5,715.7 | $ | 12.16 | ||||||||
| Granted at market value |
312.5 | 16.88 | |||||||||
| Exercised |
(1,186.8 | ) | 8.82 | ||||||||
| Forfeited or expired |
(93.1 | ) | 11.16 | ||||||||
| Outstanding at December 31, |
4,748.3 | $ | 13.32 | $ | 19.2 | 5.93 | |||||
| Vested at December 31, |
3,697.1 | $ | 12.60 | $ | 18.0 | 5.51 | |||||
| Available for future grants at December 31, * |
9,838.2 | ||||||||||
| 2007 |
|||||||||||
| Outstanding at January 1, |
8,829.2 | $ | 9.43 | ||||||||
| Granted at market value |
609.8 | 17.39 | |||||||||
| Exercised |
(3,487.3 | ) | 6.05 | ||||||||
| Forfeited or expired |
(236.1 | ) | 13.82 | ||||||||
| Outstanding at December 31, |
5,715.7 | $ | 12.16 | $ | 21.0 | 6.28 | |||||
| Vested at December 31, |
3,355.5 | $ | 12.11 | $ | 19.7 | 6.17 | |||||
| Available for future grants at December 31, * |
11,672.1 | ||||||||||
| * | represents both options and awards available for grant |
81
Table of Contents
KNIGHT CAPITAL GROUP, INC.
NOTES TO CONSOLIDATED FINANCIAL STATEMENTS—Continued
| Options Outstanding | Options Exercisable | |||||||||||
| Range of Exercise Prices |
Outstanding at 12/31/09 |
Weighted- Average Remaining Contractual Life |
Weighted- Average Exercise Price |
Number Exercisable at 12/31/09 |
Weighted- Average Exercise Price | |||||||
| $ 4.56-$ 9.21 |
428.5 | 5.14 | $ | 7.96 | 428.5 | $ | 7.96 | |||||
| $ 9.52-$ 9.84 |
501.3 | 2.24 | 9.81 | 501.3 | 9.81 | |||||||
| $ 9.90-$ 9.90 |
180.0 | 5.22 | 9.90 | 180.0 | 9.90 | |||||||
| $10.24-$10.24 |
547.3 | 4.86 | 10.24 | 547.3 | 10.24 | |||||||
| $10.30-$14.37 |
358.2 | 4.72 | 12.32 | 349.8 | 12.30 | |||||||
| $14.53-$16.32 |
424.8 | 3.74 | 15.46 | 242.0 | 15.42 | |||||||
| $16.43-$16.93 |
394.5 | 7.64 | 16.85 | 142.8 | 16.81 | |||||||
| $16.98-$17.95 |
399.0 | 6.76 | 17.63 | 318.2 | 17.57 | |||||||
| $17.97-$39.84 |
317.3 | 5.29 | 21.17 | 240.4 | 22.17 | |||||||
| $46.19-$46.19 |
3.0 | 0.01 | 46.19 | 3.0 | 46.19 | |||||||
The aggregate intrinsic value is the amount by which the closing price of the Company’s common stock exceeds the exercise price of the stock options multiplied by the number of shares. The total intrinsic value of options exercised in 2009, 2008 and 2007 was $10.0 million, $9.8 million and $37.9 million, respectively. Cash received from the exercise of stock options in 2009 totaled $11.0 million.
There is $1.8 million of unrecognized compensation related to the unvested stock options outstanding at December 31, 2009. The cost of these unvested awards is expected to be recognized over a weighted average life of 1.4 years.
11. Employee Benefit Plan
The Company sponsors a 401(k) profit sharing plan (the “Plan”) in which substantially all of its employees are eligible to participate. Under the terms of the Plan, the Company is required to make annual contributions to the Plan equal to 100% of the contributions made by its employees, up to annual limits. The total expense, from continuing operations, recognized with respect to the Plan and included in Employee compensation and benefits on the Consolidated Statements of Operations, was as follows (in millions):
| For the year ended December 31, 2009 |
$ | 5.5 | |
| For the year ended December 31, 2008 |
4.3 | ||
| For the year ended December 31, 2007 |
3.9 |
12. Writedown of Assets and Lease Loss Accrual
The Writedown of assets and lease loss accrual (benefit), net during 2009, 2008 and 2007 was ($9.7 million), $1.2 million, and ($2.5 million), respectively. The benefit in 2009 was primarily due to a $13.1 million reversal of a previously recognized lease loss with respect to the Company’s 545 Washington Boulevard office space in Jersey City, N.J. (the “J.C. lease”). The Company had previously considered a portion of these premises to be excess real estate and had therefore recorded a lease loss accrual for such excess office space. Based on expected growth and future needs, in the second quarter of 2009 management made the decision to build out this space and therefore recorded a benefit related to the reversal of such previously recorded lease loss. This benefit was offset in part by a $292,000 lease loss charge related to a Knight Direct lease.
82
Table of Contents
KNIGHT CAPITAL GROUP, INC.
NOTES TO CONSOLIDATED FINANCIAL STATEMENTS—Continued
Also included in Writedown of assets and lease loss accrual (benefit), net for 2009 is a charge of $2.4 million related to the Company’s decision to discontinue the use of the Donaldson trade name and the writedown of $699,000 of capitalized software resulting from the sale of Hotspot’s retail customer accounts in 2009.
The charge in 2008 was primarily related to the Company’s decision to discontinue the use of the Direct Trading Institutional trade name, offset by a benefit related to an adjustment of a previously recognized lease loss with respect to the J.C. lease.
The benefit in 2007 was primarily related to an adjustment of previously recognized lease losses with respect to the J.C. lease. During 2007, the Company entered into two sub-lease agreements for a portion of the premises for which it had previously recorded a lease loss accrual. The lease loss accrual was adjusted based on the difference between the actual terms of the sub-leases and the assumptions previously used in the calculation of the lease loss accrual.
13. Discontinued Operations
On January 27, 2009, Deephaven announced that it entered into an Asset Purchase Agreement along with Stark, Deephaven Partners, the Company and each of the Deephaven Managers, pursuant to which Deephaven agreed to sell substantially all of its assets to Stark, and Stark agreed to assume certain limited liabilities of Deephaven.
On March 31, 2009, Deephaven completed the sale of substantially all of its assets to Stark, and Stark assumed certain limited liabilities of Deephaven and has been assigned the role of investment manager, managing member and general partner of the Deephaven Funds for which Deephaven previously served as investment advisor. As Deephaven no longer manages the Deephaven Funds effective March 31, 2009, as of that date it no longer has any cash flows related to asset management fees and no significant continuing involvement in the asset management business. As such, Deephaven was classified as a discontinued operation effective March 31, 2009.
Consideration for the sale is based on a formulaic purchase price based on the extent of Deephaven Global Multi-Strategy Fund (“GMS Fund”) assets that investors elect to have Stark manage on an ongoing basis, and the investment return of such transferred assets over a two-year period following the closing of the transaction. It is currently expected that the purchase price from the transaction will be zero.
The Company completed the sale of its former Derivative Markets business to Citigroup in December 2004. The results of the Derivative Markets operating segment, the revenues and expenses associated with these businesses as well as all costs associated with the sale transaction have been included in (Loss) income from discontinued operations, net of tax on the Consolidated Statements of Operations.
83
Table of Contents
KNIGHT CAPITAL GROUP, INC.
NOTES TO CONSOLIDATED FINANCIAL STATEMENTS—Continued
The revenues and results of operations of the Discontinued Operations for the years ended December 31, 2009, 2008 and 2007 are summarized as follows (in millions):
| For the years ended December 31, |
||||||||||||
| 2009 | 2008 | 2007 | ||||||||||
| Revenues |
$ | 3.3 | $ | 33.3 | $ | 118.2 | ||||||
| Pre-tax (loss) income from discontinued operations(1) |
$ | (53.1 | ) | $ | (25.5 | ) | $ | 14.5 | ||||
| Income tax benefit (expense) |
18.2 | 9.7 | (6.8 | ) | ||||||||
| (Loss) income from discontinued operations, net of tax(1) |
$ | (34.9 | ) | $ | (15.8 | ) | $ | 7.7 | ||||
| (1) | Includes Noncontrolling interests benefit of $0.4 million in 2009 and Noncontrolling interests expense of $6.2 million in 2008. Also, included in the results for 2009 and 2007 is a loss of $0.2 million and $1.4 million, net of tax, respectively, relating to the Company’s former Derivative Markets segment. |
Totals may not add due to rounding.
At December 31, 2009 and 2008, the assets and liabilities related to Discontinued Operations were as follows (in millions):
| December 31, | ||||||
| 2009 | 2008 | |||||
| Assets: |
||||||
| Cash and cash equivalents |
$ | 3.2 | $ | 23.7 | ||
| Deferred compensation assets |
10.5 | 31.1 | ||||
| Other assets |
0.3 | 30.2 | ||||
| Total assets |
$ | 14.0 | $ | 84.9 | ||
| Liabilities: |
||||||
| Accrued compensation expense |
$ | 10.9 | $ | 44.6 | ||
| Accrued expenses and other liabilities(1) |
4.5 | 19.4 | ||||
| Total liabilities |
$ | 15.3 | $ | 64.0 | ||
| (1) | Included in Accrued expenses and other liabilities is $1.3 million and $10.9 million at December 31, 2009 and December 31, 2008, respectively, which are payables to the Company and presented on the Consolidated Statements of Financial Condition within Other assets. |
Totals may not add due to rounding.
84
Table of Contents
KNIGHT CAPITAL GROUP, INC.
NOTES TO CONSOLIDATED FINANCIAL STATEMENTS—Continued
14. Income Taxes
The Company and its subsidiaries file a consolidated federal income tax return as well as combined state income tax returns in certain jurisdictions. In other jurisdictions, the Company and its subsidiaries file separate company income tax returns.
The provision for income taxes from continuing operations consists of (in millions):
| For the years ended December 31, |
||||||||||||
| 2009 | 2008 | 2007 | ||||||||||
| Current: |
||||||||||||
| U.S. federal |
$ | 73.2 | $ | 106.7 | $ | 69.5 | ||||||
| U.S. state and local |
13.1 | 26.2 | 13.8 | |||||||||
| Non U.S. |
0.2 | 0.3 | 0.2 | |||||||||
| 86.5 | 133.2 | 83.5 | ||||||||||
| Deferred: |
||||||||||||
| U.S. federal |
13.3 | 4.3 | (12.5 | ) | ||||||||
| U.S. state and local |
(4.9 | ) | 2.5 | (0.7 | ) | |||||||
| Non U.S. |
(13.7 | ) | (0.1 | ) | (0.1 | ) | ||||||
| (5.3 | ) | 6.7 | (13.3 | ) | ||||||||
| Provision for income taxes |
$ | 81.2 | $ | 139.9 | $ | 70.2 | ||||||
85
Table of Contents
KNIGHT CAPITAL GROUP, INC.
NOTES TO CONSOLIDATED FINANCIAL STATEMENTS—Continued
The following table reconciles income tax expense (benefit) from continuing operations at the U.S. federal statutory rate to the Company’s Income tax expense (in millions):
| For the years ended December 31, |
|||||||||||
| 2009 | 2008 | 2007 | |||||||||
| U.S. federal income tax expense at statutory rate |
$ | 81.5 | $ | 116.8 | $ | 64.7 | |||||
| U.S. state and local income tax expense (benefit), net of U.S. federal income tax effect |
5.4 | 18.7 | 8.5 | ||||||||
| Non U.S. |
0.2 | 0.0 | 0.0 | ||||||||
| Nondeductible charges |
1.2 | 3.2 | 0.6 | ||||||||
| Recognition of purchased federal net operating losses |
(5.7 | ) | 0.0 | 0.0 | |||||||
| Other, net |
(1.4 | ) | 1.2 | (3.6 | ) | ||||||
| Income tax expense |
$ | 81.2 | $ | 139.9 | $ | 70.2 | |||||
Deferred income taxes reflect the net tax effects of temporary differences between the financial reporting and tax bases of assets and liabilities and are measured using the enacted tax rates and laws that will be in effect when such differences are expected to reverse. Significant components of the Company’s deferred tax assets and liabilities at December 31, 2009 and 2008 are as follows (in millions):
| December 31, | ||||||||
| 2009 | 2008 | |||||||
| Deferred tax assets: |
||||||||
| Employee compensation and benefit plans |
$ | 51.0 | $ | 45.6 | ||||
| Fixed assets and other amortizable assets |
2.3 | 3.5 | ||||||
| Lease loss and other accruals |
0.2 | 6.1 | ||||||
| Valuation of investments |
5.1 | 5.5 | ||||||
| Net operating loss carryforwards, net |
30.0 | 41.3 | ||||||
| Less: Valuation allowance on net operating loss carryforwards |
(8.1 | ) | (41.3 | ) | ||||
| Total Deferred tax assets |
80.5 | 60.7 | ||||||
| Deferred tax liabilities |
||||||||
| Fixed assets and other amortizable assets |
20.0 | 19.2 | ||||||
| Valuation of investments |
8.3 | 8.3 | ||||||
| Net operating loss carryforwards, net |
13.7 | 0.0 | ||||||
| Total deferred tax liabilities |
42.0 | 27.5 | ||||||
| Net deferred tax assets |
$ | 38.5 | $ | 33.2 | ||||
At December 31, 2009, the Company had U.S. federal net operating loss carryforwards, resulting from acquisitions, of $33.8 million. The Company recorded a related deferred income tax asset of $11.8 million as of December 31, 2009, and an offsetting valuation allowance of $7.0 million which represents the portion of these net operating loss carryforwards that are considered more likely than not to expire unutilized. Prior to 2009 the Company recorded a valuation allowance for substantially all of these loss carryforwards, but reversed a portion of the valuation allowance during 2009 as a portion of such loss carryforwards are now expected to be utilized based upon the profitability of the acquired entities. These carryforwards are subject to annual limitations on utilization and will begin to expire in 2019.
86
Table of Contents
KNIGHT CAPITAL GROUP, INC.
NOTES TO CONSOLIDATED FINANCIAL STATEMENTS—Continued
At December 31, 2009, the Company had state net operating loss carryforwards of $570.5 million, of which $29.6 million resulted from acquisitions. The Company recorded a related deferred income tax asset of $6.8 million as of December 31, 2009, and an offsetting valuation allowance of $1.8 million which represents the portion of these net operating loss carryforwards that are considered more likely than not to expire unutilized. Prior to 2009, the Company recorded a valuation allowance for substantially all of these loss carryforwards, but reversed a portion of the valuation allowance during 2009 as a portion of such loss carryforwards are now expected to be utilized based upon the current structure and expected profitability of certain subsidiaries. Certain of these carryforwards are subject to annual limitations on utilization and they will begin to expire in 2011.
At December 31, 2009, the Company had U.K. net operating loss carryforwards of $49.1 million. The Company recorded a related foreign deferred income tax asset of $13.7 million for these loss carryforwards as of December 31, 2009, and an offsetting U.S. federal deferred tax liability of $13.7 million for the expected future reduction in U.S. foreign tax credits associated with the use of the U.K. loss carryforwards. These U.K. net operating losses may be carried forward indefinitely.
Effective January 1, 2007 the Company adopted an accounting standard which relates to accounting for uncertainty in income taxes. The Company recognized no material adjustment in the liability for unrecognized income tax benefits as a result of the implementation of this accounting standard. At the adoption date of January 1, 2007, the Company had $0.9 million of unrecognized tax benefits and at December 31, 2009, the Company had $1.6 million of unrecognized tax benefits, all of which would affect the Company's effective tax rate if recognized.
As of December 31, 2009, the Company is subject to U.S. Federal income tax examinations for the tax years 2006 through 2008, and to non U.S. income tax examinations for the tax years of 2006 through 2008. In addition, the Company is subject to state and local income tax examinations in various jurisdictions for the tax years 2000 through 2007. The final outcome of these examinations is not yet determinable. However, the Company anticipates that adjustments to the unrecognized tax benefits, if any, will not result in a material change to the results of operations or financial condition.
The Company’s policy for recording interest and penalties associated with audits is to record such items as a component of income from continuing operations before income taxes. Penalties are recorded in Other expenses and interest paid or received is recorded in Interest expense or Interest, net, respectively, in the Consolidated Statements of Operations.
15. Earnings per Share
Basic earnings per common share (“EPS”) has been calculated by dividing net income by the weighted average shares of Class A Common Stock outstanding during each respective period. Diluted EPS reflects the potential reduction in EPS using the treasury stock method to reflect the impact of common stock equivalents if stock options were exercised and restricted stock awards were to vest.
87
Table of Contents
KNIGHT CAPITAL GROUP, INC.
NOTES TO CONSOLIDATED FINANCIAL STATEMENTS—Continued
The following is a reconciliation of the numerators and denominators of the basic and diluted earnings per share computations for 2009, 2008 and 2007 (in millions, except per share data):
| For the years ended December 31, | ||||||||||||||||||
| 2009 | 2008 | 2007 | ||||||||||||||||
| Numerator / net income |
Denominator / shares |
Numerator / net income |
Denominator / shares |
Numerator / net income |
Denominator / shares | |||||||||||||
| Income and shares used in basic calculations |
$ | 117.1 | 89.1 | $ | 177.9 | 88.4 | $ | 122.2 | 97.1 | |||||||||
| Effect of dilutive stock based awards |
— | 5.4 | — | 3.4 | — | 3.7 | ||||||||||||
| Income and shares used in diluted calculations |
$ | 117.1 | 94.5 | $ | 177.9 | 91.8 | $ | 122.2 | 100.8 | |||||||||
| Basic earnings per share |
$ | 1.31 | $ | 2.01 | $ | 1.26 | ||||||||||||
| Diluted earnings per share |
$ | 1.24 | $ | 1.94 | $ | 1.21 | ||||||||||||
The above calculations exclude options that could potentially dilute EPS in the future but were antidilutive for the periods presented. The number of such options excluded was approximately 1.0 million, 1.4 million and 1.1 million in 2009, 2008 and 2007, respectively.
16. Significant Clients and Investors
The Company considers significant clients to be those clients who account for 10% or more of the total U.S. equity dollar value traded or fixed income notional value traded by the Company. No clients accounted for more than 10% of the Company’s U.S. equity dollar value traded or fixed income notional value traded during 2009, 2008 and 2007.
17. Commitments and Contingent Liabilities
In the ordinary course of business, the nature of the Company’s business subjects it to claims, lawsuits, regulatory examinations and other proceedings. The Company is subject to several of these matters at the present time. The results of these matters cannot be predicted with certainty, and the Company cannot estimate a possible range of loss for these matters at this time. There can be no assurance that these matters will not have a material adverse effect on the Company’s results of operations in any future period and a material judgment could have a material adverse impact on the Company’s financial condition and results of operations. However, it is the opinion of management, after consultation with legal counsel that, based on information currently available, the ultimate outcome of these matters will not have a material adverse impact on the business, financial condition or operating results of the Company although they might be material to the operating results for any particular period, depending, in part, upon operating results for that period.
The Company leases office space under noncancelable operating leases. Certain office leases contain fixed dollar-based escalation clauses. Rental expense from continuing operations under the office leases was $13.5 million, $11.3 million and $8.5 million in 2009, 2008 and 2007, respectively, and is included in Occupancy and equipment rentals on the Consolidated Statements of Operations.
88
Table of Contents
KNIGHT CAPITAL GROUP, INC.
NOTES TO CONSOLIDATED FINANCIAL STATEMENTS—Continued
The Company has sublet a portion of its excess office space to third parties. The Company leases certain computer and other equipment under noncancelable operating leases and has entered into guaranteed employment contracts with certain of its employees. As of December 31, 2009, future minimum rental commitments under all noncancelable office, computer and equipment leases (“Gross Lease Obligations”), Sublease Income and guaranteed employment contracts longer than one year (“Other Obligations”) were as follows (in millions):
Lease & Contract Obligations
| Gross Lease Obligations |
Sublease Income |
Net Lease Obligations |
Other Obligations | |||||||||
| Year ending December 31, 2010 |
$ | 16.7 | $ | 1.1 | $ | 15.6 | $ | 10.6 | ||||
| Year ending December 31, 2011 |
17.4 | 1.2 | 16.2 | 10.1 | ||||||||
| Year ending December 31, 2012 |
17.7 | 1.4 | 16.3 | 3.8 | ||||||||
| Year ending December 31, 2013 |
16.1 | 1.4 | 14.7 | — | ||||||||
| Year ending December 31, 2014 |
15.0 | 1.4 | 13.6 | — | ||||||||
| Thereafter through April 30, 2022 |
93.8 | 4.4 | 89.3 | — | ||||||||
| $ | 176.7 | $ | 10.9 | $ | 165.8 | $ | 24.5 | |||||
In addition to the above, in January 2010, we entered into a lease for approximately 65,000 square feet of office space in Greenwich, Connecticut that expires in July 2024.
During the normal course of business, the Company collateralizes certain leases or other contractual obligations through letters of credit or segregated funds held in escrow accounts. As of December 31, 2009, the Company has provided a letter of credit for $3.2 million, collateralized by U.S. Treasury Bills, as a guarantee for one of the Company’s lease obligations. Knight Capital Group, Inc. also has provided, and may provide in the future, in the ordinary course of business unsecured guarantees to guarantee the payment obligations of certain of its trading subsidiaries and leases.
18. Net Capital Requirements
The Company’s U.S. registered broker-dealers are subject to the SEC’s Uniform Net Capital Rule, which requires the maintenance of minimum net capital. The Company believes that during 2009, all of the broker-dealer subsidiaries were in compliance with their capital adequacy requirements. In connection with an ongoing regulatory examination of one of the Company’s broker-dealer subsidiaries, an issue has been identified as to whether a cash balance had been maintained in an acceptable control location within a bank, and therefore whether such balance should be considered an allowable asset in determining net capital of the broker-dealer. Several of the Company’s broker-dealer subsidiaries maintained balances in similar accounts at the bank. Due to the uncertainty as to the ultimate outcome of the examiner’s findings, the Company has closed the accounts in question and moved the cash balances to a more commonly used control location. In the event that FINRA and/or the SEC conclude that such balances are deemed to be non-allowable assets, three of our broker-dealer subsidiaries may be considered to have had inadequate regulatory capital at December 31, 2009 due to this administrative matter. While it may be determined that the affected broker-dealers were in technical violation at December 31, 2009, the capital existed within the affected broker-dealers at that time and has subsequently been transferred to a more commonly used control location.
89
Table of Contents
KNIGHT CAPITAL GROUP, INC.
NOTES TO CONSOLIDATED FINANCIAL STATEMENTS—Continued
The following table sets forth the net capital levels and requirements for the following significant U.S. registered broker-dealer subsidiaries at December 31, 2009 as filed in their respective regulatory filings (in millions):
| Entity |
Net Capital | Net Capital Requirement |
Excess Net Capital | ||||||
| KEM |
$ | 100.2 | $ | 9.2 | $ | 91.0 | |||
| KCM |
52.7 | 2.6 | 50.1 | ||||||
| KCS |
37.2 | 0.3 | 36.9 | ||||||
| Knight Libertas |
21.6 | 3.0 | 18.6 | ||||||
| Knight Direct |
21.0 | 1.0 | 20.0 | ||||||
The Company’s foreign registered broker-dealers are subject to certain financial resource requirements of either the FSA or the SFC. The following table sets forth the financial resource requirement for the following significant foreign regulated broker-dealer at December 31, 2009 (in millions):
| Entity |
Financial Resources |
Resource Requirement |
Excess Financial Resources | ||||||
| KCEL |
$ | 70.6 | $ | 25.5 | $ | 45.1 | |||
19. Financial Instruments with Off-Balance Sheet Risk and Concentrations of Credit Risk
As a market maker of equities, the majority of the Company’s securities transactions are conducted as principal or riskless principal with broker-dealer and institutional counterparties primarily located in the United States. The Company clears the majority of its securities transactions through third party clearing brokers. Foreign transactions are settled pursuant to a global custody and clearing agreements with major U.S. banks. Substantially all of the Company’s credit exposures are concentrated with its clearing brokers and the banks (the “clearing agents”). These clearing agents may re-hypothecate certain securities held on behalf of the Company. Additionally, pursuant to the terms of the agreements between the Company and the clearing agents, the clearing agents have the right to charge the Company for all losses that result from a counterparty’s failure to fulfill its contractual obligations. The Company has the ability to pursue collection from or performance with regard to this right. The Company’s policy is to monitor the credit standing of the clearing agents and all counterparties with which it conducts business.
In the normal course of its operations, the Company enters into contracts that contain a variety of representations and warranties which provide general indemnifications. The Company’s maximum exposure under these arrangements is unknown, as this would involve future claims that may be made against the Company that have not yet occurred. However, based on experience, the Company believes the risk of loss is minimal.
Securities sold, not yet purchased represent obligations to purchase such securities (or underlying securities) at a future date. The Company may incur a loss if the market value of the securities subsequently increases.
The Company receives financial instruments as collateral in connection with securities borrowed. Such financial instruments generally consist of equity and convertible securities but may include
90
Table of Contents
KNIGHT CAPITAL GROUP, INC.
NOTES TO CONSOLIDATED FINANCIAL STATEMENTS—Continued
obligations of the U.S. government, federal agencies, sovereignties and corporations. In most cases, the Company is permitted to deliver or repledge these financial instruments in connection with securities lending and other secured financings and meeting settlement requirements. As of December 31, 2009, the fair value of financial instruments received as collateral by the Company that it was permitted to deliver or repledge was $349.1 million, of which $314.7 million had been delivered or repledged, and all of which could be repledged by the receiving counterparty. The Company also pledges assets that it owns to counterparties who, in turn, are permitted to deliver or repledge them. Financial instruments pledged to counterparties that have the right to deliver or repledge them were $212.5 million at December 31, 2009 and are included in Securities owned, held at clearing brokers and depositories, at fair value.
During the normal course of business, the Company may enter into certain futures contracts. These financial instruments are subject to varying degrees of risks whereby the fair value of the securities underlying the financial instruments, may be in excess of, or less than, the contract amount. The Company is obligated to post collateral against certain futures contracts. As of December 31, 2009, the Company was a party to futures contracts having a notional value of $222.5 million. The fair value of $421,000 is recorded in Payable to brokers and dealers on the Consolidated Statements of Financial Condition, net of cash collateral, with realized and unrealized gains and losses recognized in Net trading revenue on the Consolidated Statements of Operations.
The Company currently has no loans outstanding to any former or current executive officer or director.
20. Acquisitions
EdgeTrade
On January 14, 2008, the Company completed the acquisition of EdgeTrade Inc. (“EdgeTrade”), an agency-only trade execution and algorithmic software firm, for $58.2 million, comprising $28.2 million in cash and approximately 2.3 million shares of unregistered Knight common stock valued at $30.0 million. Goodwill and intangible assets recognized upon the closing of the transaction amounted to $69.0 million. None of the goodwill from this transaction is expected to be deductible for income tax purposes. In August 2008, the business of EdgeTrade was merged into Knight Direct. The following table summarizes the estimated fair values of the assets acquired and liabilities assumed (in millions):
| Agreed purchase price |
$ | 59.5 | ||
| Adjustment for working capital |
(2.0 | ) | ||
| Adjusted purchase price |
57.5 | |||
| Acquisition costs |
0.7 | |||
| Purchase of business |
$ | 58.2 | ||
| Cash |
$ | 1.0 | ||
| Goodwill |
51.7 | |||
| Intangible assets |
17.3 | |||
| Other assets |
3.9 | |||
| Accrued expenses and other liabilities |
(15.7 | ) | ||
| Purchase of business |
$ | 58.2 | ||
91
Table of Contents
KNIGHT CAPITAL GROUP, INC.
NOTES TO CONSOLIDATED FINANCIAL STATEMENTS—Continued
Knight Libertas
On July 11, 2008, the Company acquired Libertas Holdings LLC and its subsidiaries, a boutique institutional fixed income brokerage firm, for $50.3 million in cash and approximately 1.5 million shares of unregistered Knight common stock valued at $25.0 million. The terms of the agreement include a potential earn-out to the sellers of up to $75.0 million of unregistered Knight common stock based on the future performance of Knight Libertas during the three-year period following the closing of the transaction. Goodwill and intangible assets recognized upon the closing of the transaction amounted to $73.8 million. The majority of goodwill from this transaction is expected to be deductible for income tax purposes.
In the third quarter of 2009, Knight Libertas achieved its first year performance target which entitled the sellers to receive $33.3 million of the aforementioned earn-out in the form of 1.6 million shares of unregistered Knight common stock, of which 50% of such shares will be issued in July 2010 and the remaining 50% will be issued in July 2011. The Company recorded this $33.3 million earn-out as an increase in Goodwill and Additional paid-in-capital on the Consolidated Statements of Financial Condition.
Upon acquisition, Libertas Holdings LLC was renamed Knight Libertas Holdings LLC and its U.S. broker-dealer subsidiary was renamed Knight Libertas LLC. The following table summarizes the estimated fair values of the assets acquired and liabilities assumed (in millions):
| Agreed purchase price |
$ | 75.2 | ||
| Year 1 earn-out |
33.3 | |||
| Adjustment for working capital |
(0.7 | ) | ||
| Adjusted purchase price |
107.8 | |||
| Acquisition costs |
0.8 | |||
| Purchase of business |
$ | 108.6 | ||
| Cash |
$ | 1.3 | ||
| Goodwill |
81.0 | |||
| Intangible assets |
26.2 | |||
| Other assets |
5.5 | |||
| Accrued expenses and other liabilities |
(5.3 | ) | ||
| Purchase of business |
$ | 108.6 | ||
21. Business Segments
Due to the general growth and evolution of the business, effective the fourth quarter of 2009, the Company separated the former Global Markets segment into two operating segments: i) Equities and ii) Fixed Income, Currencies and Commodities (“FICC”). This breakout is consistent with the organizational structure of the business. As a result of this change in segment reporting, the Company now has three operating segments within its continuing operations: Equities, FICC and Corporate. Effective March 31, 2009, the Company’s former Asset Management segment was classified as a discontinued operation.
The Equities segment includes equities market-making and electronic and voice institutional sales and trading in global equities, futures and options. In the course of market-making and trading, Equities
92
Table of Contents
KNIGHT CAPITAL GROUP, INC.
NOTES TO CONSOLIDATED FINANCIAL STATEMENTS—Continued
provides capital facilitation as well as a range of complementary services. The Equities segment also offers equity capital markets services. The FICC segment includes global research, voice sales and trading in fixed income as well as electronic trading in fixed income and foreign exchange. Fixed income research generates analytical reports containing recommendations across a wide range of securities and sectors. FICC also offers debt capital markets services. The Corporate segment invests in strategic financial services-oriented opportunities, allocates, deploys and monitors all capital, and maintains all corporate overhead expenses and all other expenses that are not attributable to the Equities and FICC segments. The Company’s revenues, income (loss) from continuing operations before income taxes (“Pre-tax earnings”) and total assets by segment are summarized below (in millions):
| Equities | FICC | Corporate | Consolidated Total | ||||||||||
| For the year ended December 31, 2009: |
|||||||||||||
| Revenues |
$ | 891.0 | $ | 266.7 | $ | 4.7 | $ | 1,162.4 | |||||
| Pre-tax earnings |
227.3 | 47.8 | (42.3 | ) | 232.8 | ||||||||
| Total assets(1) |
2,502.2 | 300.2 | 197.6 | 3,000.0 | |||||||||
| For the year ended December 31, 2008: |
|||||||||||||
| Revenues |
$ | 851.5 | $ | 79.3 | $ | 8.1 | $ | 938.9 | |||||
| Pre-tax earnings |
346.4 | 12.3 | (25.1 | ) | 333.6 | ||||||||
| Total assets(1) |
1,630.2 | 233.1 | 77.3 | 1,940.6 | |||||||||
| For the year ended December 31, 2007: |
|||||||||||||
| Revenues |
$ | 653.6 | $ | 32.1 | $ | 31.5 | $ | 717.2 | |||||
| Pre-tax earnings |
183.5 | 3.1 | (1.8 | ) | 184.7 | ||||||||
| Total assets(1) |
1,311.1 | 122.0 | 159.2 | 1,592.3 | |||||||||
Totals may not add due to rounding.
| (1) | Total assets do not include Assets within discontinued operations of $14.0 million, $84.9 million and $197.9 million at December 31, 2009, 2008 and 2007, respectively. |
93
Table of Contents
KNIGHT CAPITAL GROUP, INC.
NOTES TO CONSOLIDATED FINANCIAL STATEMENTS—Continued
22. Condensed Financial Statements of Knight Capital Group, Inc. (parent only)
Presented below are the Condensed Statements of Financial Condition, Operations and Cash Flows for the Company on an unconsolidated basis.
Statements of Financial Condition
Knight Capital Group, Inc. (parent only)
| December 31, 2009 |
December 31, 2008 | |||||
| (in thousands) | ||||||
| Assets |
||||||
| Cash and cash equivalents |
$ | 157,963 | $ | 64,619 | ||
| Securities owned, at fair value |
3,498 | 6,721 | ||||
| Investments in subsidiaries, equity method |
1,125,909 | 1,098,546 | ||||
| Fixed assets and leasehold improvements, at cost, less accumulated depreciation and amortization |
411 | 537 | ||||
| Investments in Deephaven funds |
8,499 | 47,152 | ||||
| Strategic investments |
23,833 | 50,029 | ||||
| Deferred compensation investments |
44,954 | 41,637 | ||||
| Other assets |
85,601 | 19,319 | ||||
| Total assets |
$ | 1,450,668 | $ | 1,328,560 | ||
| Liabilities and Stockholders’ Equity |
||||||
| Liabilities |
||||||
| Accrued compensation expense |
$ | 62,975 | $ | 57,419 | ||
| Accrued expenses and other liabilities |
2,822 | 2,815 | ||||
| Payable to subsidiaries |
29,017 | 75,897 | ||||
| Income taxes payable |
2,352 | 25,071 | ||||
| Credit facility |
140,000 | 140,000 | ||||
| Total liabilities |
237,166 | 301,202 | ||||
| Total stockholders’ equity |
1,213,502 | 1,027,358 | ||||
| Total liabilities and stockholders’ equity |
$ | 1,450,668 | $ | 1,328,560 | ||
The accompanying notes are an integral part of these condensed financial statements.
94
Table of Contents
KNIGHT CAPITAL GROUP, INC.
NOTES TO CONSOLIDATED FINANCIAL STATEMENTS—Continued
Statements of Operations
Knight Capital Group, Inc. (parent only)
| For the years ended December 31, | |||||||||||
| 2009 | 2008 | 2007 | |||||||||
| (in thousands) | |||||||||||
| Revenues |
|||||||||||
| Corporate management fees |
$ | 9,333 | $ | 28,000 | $ | 28,165 | |||||
| Investment income and other, net |
(3,168 | ) | (40,092 | ) | 22,631 | ||||||
| Total revenues |
6,165 | (12,092 | ) | 50,796 | |||||||
| Expenses |
|||||||||||
| Compensation expense |
34,591 | 21,599 | 20,505 | ||||||||
| Professional fees |
6,382 | 8,333 | 6,492 | ||||||||
| Business development |
2,175 | 849 | 432 | ||||||||
| Interest expense |
3,198 | 5,008 | 161 | ||||||||
| Other |
6,263 | 5,010 | 3,815 | ||||||||
| Total expenses |
52,609 | 40,799 | 31,405 | ||||||||
| (Loss) income before income taxes and equity in earnings of subsidiaries |
(46,444 | ) | (52,891 | ) | 19,391 | ||||||
| Income tax (benefit) expense |
(19,507 | ) | (14,233 | ) | 5,062 | ||||||
| (Loss) income before equity in earnings of subsidiaries |
(26,937 | ) | (38,658 | ) | 14,329 | ||||||
| Equity in earnings of subsidiaries |
144,039 | 216,569 | 107,911 | ||||||||
| Net income |
$ | 117,102 | $ | 177,911 | $ | 122,240 | |||||
The accompanying notes are an integral part of these condensed financial statements.
95
Table of Contents
KNIGHT CAPITAL GROUP, INC.
NOTES TO CONSOLIDATED FINANCIAL STATEMENTS—Continued
Statements of Cash Flows
Knight Capital Group, Inc. (parent only)
| For the years ended December 31, | ||||||||||||
| 2009 | 2008 | 2007 | ||||||||||
| (in thousands) | ||||||||||||
| Cash flows from operating activities |
||||||||||||
| Net income |
$ | 117,102 | $ | 177,911 | $ | 122,240 | ||||||
| Adjustments to reconcile net income to net cash (used in) provided by operating activities |
||||||||||||
| Equity in earnings of subsidiaries |
(144,039 | ) | (216,569 | ) | (107,911 | ) | ||||||
| Depreciation and amortization |
178 | 651 | 239 | |||||||||
| Stock-based compensation |
16,963 | 5,310 | 4,539 | |||||||||
| Unrealized loss (gain) on investments in Deephaven funds |
2,167 | 28,195 | (17,786 | ) | ||||||||
| Realized (gain) on strategic investments |
— | (1,547 | ) | — | ||||||||
| Unrealized loss (gain) on strategic investments |
6,227 | 13,288 | (688 | ) | ||||||||
| (Increase) decrease in operating assets |
||||||||||||
| Securities owned |
3,223 | (321 | ) | (57 | ) | |||||||
| Other assets |
(69,598 | ) | (32,185 | ) | (7,314 | ) | ||||||
| Increase (decrease) in operating liabilities |
||||||||||||
| Accrued compensation expense |
5,556 | 35,709 | 396 | |||||||||
| Accrued expenses and other liabilities |
3 | (7,279 | ) | 6,921 | ||||||||
| Payable to subsidiaries |
(9,800 | ) | (18,200 | ) | 55,612 | |||||||
| Income taxes payable |
(22,719 | ) | 1,044 | 4,865 | ||||||||
| Net cash (used in) provided by operating activities |
(94,737 | ) | (13,993 | ) | 61,056 | |||||||
| Cash flows from investing activities |
||||||||||||
| Purchases of fixed assets and leasehold improvements |
(53 | ) | (562 | ) | (14 | ) | ||||||
| Distributions from Deephaven Funds |
36,548 | 93,385 | 35,000 | |||||||||
| Distributions from strategic investments |
27,755 | 6,275 | 5,534 | |||||||||
| Purchases of strategic investments |
(7,787 | ) | (13,442 | ) | (10,400 | ) | ||||||
| Dividends received from subsidiaries |
265,180 | 123,503 | 129,324 | |||||||||
| Capital contributions to subsidiaries |
(115,545 | ) | (122,554 | ) | (21,252 | ) | ||||||
| Net cash provided by investing activities |
206,098 | 86,605 | 138,192 | |||||||||
| Cash flows from financing activities |
||||||||||||
| Stock options exercised |
11,021 | 10,360 | 21,075 | |||||||||
| Income tax benefit on stock awards exercised |
4,374 | 6,117 | 15,172 | |||||||||
| Proceeds from long term debt borrowing |
— | 70,000 | 70,000 | |||||||||
| Cost of common stock repurchased |
(33,412 | ) | (138,229 | ) | (266,643 | ) | ||||||
| Net cash used in financing activities |
(18,017 | ) | (51,752 | ) | (160,396 | ) | ||||||
| Increase in cash and cash equivalents |
93,344 | 20,860 | 38,852 | |||||||||
| Cash and cash equivalents at beginning of the year |
64,619 | 43,759 | 4,907 | |||||||||
| Cash and cash equivalents at end of the year |
$ | 157,963 | $ | 64,619 | $ | 43,759 | ||||||
| Supplemental disclosure of cash flow information: |
||||||||||||
| Cash paid for interest |
$ | 3,198 | $ | 5,008 | $ | 97 | ||||||
| Cash paid for income taxes |
$ | 87,463 | $ | 112,749 | $ | 73,544 | ||||||
The accompanying notes are an integral part of these condensed financial statements.
96
Table of Contents
KNIGHT CAPITAL GROUP, INC.
NOTES TO CONSOLIDATED FINANCIAL STATEMENTS—Continued
Notes to Condensed Financial Statements
Knight Capital Group, Inc. (parent only)
A. General
The condensed financial statements of Knight Capital Group, Inc. (parent only; the “Parent Company”) should be read in conjunction with the Consolidated Financial Statements of the Company and the notes thereto.
B. Income taxes
As stated in Footnote 14, “Income Taxes”, the Company and its subsidiaries file a consolidated federal income tax return as well as combined state income tax returns in certain jurisdictions. In other jurisdictions, the Company and its subsidiaries file separate income tax returns. As such, both federal and state income taxes attributable to subsidiaries are accrued at the subsidiary level and are therefore, included in Equity in earnings of subsidiaries on the Condensed Financial Statements. Income tax (benefit) expense included on the Parent Company’s Condensed Statements of Operations represents only the income taxes attributable to the Parent Company.
97
Table of Contents
| Item 9. | Changes in and Disagreements With Accountants on Accounting and Financial Disclosures |
None
| Item 9A. | Controls and Procedures |
(a) Disclosure Controls and Procedures. Knight’s management, with the participation of Knight’s Chief Executive Officer and Chief Financial Officer, has evaluated the effectiveness of Knight’s disclosure controls and procedures (as such term is defined in Rules 13a-15(e) and 15d-15(e) under the Securities Exchange Act of 1934, as amended (the “Exchange Act”)) as of the end of the period covered by this report. Based on such evaluation, Knight’s Chief Executive Officer and Chief Financial Officer have concluded that, as of the end of such period, Knight’s disclosure controls and procedures are effective.
(b) Management’s Report on Internal Control Over Financial Reporting. See report included in Item 8 of this Annual Report on Form 10-K.
(c) Changes in Internal Control Over Financial Reporting. There have not been any changes in Knight’s internal control over financial reporting (as such term is defined in Rules 13a-15(f) and 15d-15(f) under the Exchange Act) during the quarter ended December 31, 2009 that have materially affected, or are reasonably likely to materially affect, Knight’s internal control over financial reporting.
| Item 9B. | Other Information |
None
PART III—ITEMS 10, 11, 12, 13 and 14
The Company’s Proxy Statement for its 2010 Annual Meeting of Stockholders, which, when filed pursuant to Regulation 14A under the Securities Exchange Act of 1934, will be incorporated by reference in this Annual Report on Form 10-K pursuant to General Instruction G (3) of Form 10-K, provides the information required under Part III (Items 10, 11, 12, 13 and 14).
98
Table of Contents
| Item 15. | Exhibits and Financial Statement Schedules |
(a) The following documents are filed as part of this report:
Consolidated Financial Statements and Financial Statement Schedules. See “Part II Item 8, Financial Statements and Supplementary Data”
(c) INDEX TO EXHIBITS
| NUMBER ASSIGNED TO EXHIBIT (I.E. 601 OF REGULATION S-K) |
DESCRIPTION OF EXHIBITS | |
| 2.2 | Asset Purchase Agreement, dated as of August 8, 2004, by and among Citigroup Financial Products Inc. and KFP Holdings I LLC, Knight Financial Products LLC and Knight Execution Partners LLC. (Incorporated herein by reference to Exhibit 2.1 to Knight’s Current Report on Form 8-K (Commission file number 001-14223), dated August 9, 2004). | |
| 2.3 | Amendment No. 1 to the Asset Purchase Agreement by and among Citigroup Financial Products Inc. and KFP Holdings I LLC, Knight Financial Products LLC and Knight Execution Partners LLC dated December 9, 2004. (Incorporated herein by reference to Exhibit 2.2 to Knight’s Current Report on Form 8-K (Commission file number 001-14223), December 15, 2004). | |
| 3.1 | Amended and Restated Certificate of Incorporation of Knight/Trimark Group, Inc. (Incorporated herein by reference to Exhibit 3.1 to Knight’s Current Report on Form 8-K (Commission file number 001-14223), dated January 6, 2000). | |
| 3.2 | Certificate of Amendment to the Amended and Restated Certificate of Incorporation of Knight Trading Group, Inc., dated May 12, 2005 (Incorporated herein by reference to Exhibit 3.2 to Knight’s Annual Report on Form 10-K (Commission file number 001-14223) filed with the SEC on March 2, 2009). | |
| 3.3 | Amended and Restated By-Laws of the Registrant dated January 19, 2005. (Incorporated herein by reference to Exhibit 3.2 to Knight’s Annual Report on Form 10-K (Commission file number 001-14223), dated March 15, 2005). | |
| 10.1 | License Agreement between Automated Securities Clearance, Ltd. and Knight Securities, L.P., dated April 5th, 1995. (Incorporated herein by reference to Exhibit 10.8 to Amendment 1 to the Registration Statement on Form S-1 (Registration number 333-51653), filed with the SEC on May 22, 1998). | |
| 10.2* | Form of Registrant’s 1998 Long Term Incentive Plan. (Incorporated herein by reference to Exhibit 10.15 to Amendment 1 to the Registration Statement on Form S-1 (Registration number 333-51653), filed with the SEC on May 22, 1998). | |
| 10.3* | Form of Registrant’s 1998 Nonemployee Director Stock Option Plan. (Incorporated herein by reference to Exhibit 10.16 to Amendment 1 to the Registration Statement on Form S-1 (Registration number 333-51653), filed with the SEC on May 22, 1998). | |
99
Table of Contents
| NUMBER ASSIGNED TO EXHIBIT (I.E. 601 OF REGULATION S-K) |
DESCRIPTION OF EXHIBITS | |
| 10.4 | Clearing Agreement between Knight Securities, L.P. and Broadcort Capital Corp. (the “Knight Clearing Agreement”), dated September 28, 1999. (Incorporated herein by reference to Exhibit 10.1 to Knight’s Quarterly Report on Form 10-Q (Commission file number 001-14223), for the quarter ended September 30, 1999). | |
| 10.5 | Amendment to the Knight Clearing Agreement, dated October 18, 1999. (Incorporated herein by reference to Exhibit 10.2 to Knight’s Quarterly Report on Form 10-Q (Commission file number 001-14223), for the quarter ended September 30, 1999). | |
| 10.6 | Lease Agreement between Newport Office Center IV, Co., LLC and Knight Securities, L.P., dated May 11, 2000, for office space situated at 545 Washington Boulevard, Jersey City, New Jersey 07310. (Incorporated herein by reference to Exhibit 10.25 to Knight’s Annual Report on Form 10-K (Commission file number 001-14223), for the fiscal year ended December 31, 2002). | |
| 10.7 | Form of Indemnification Contract entered into by members of the Registrant’s Board of Directors. (Incorporated herein by reference to Exhibit 10.26 to Knight’s Quarterly Report on Form 10-Q (Commission file number 001-14223), for the quarter ended June 30, 2003). | |
| 10.8* | Amended and Restated 2003 Equity Incentive Plan of the Registrant. (Incorporated herein by reference to Exhibit 10.28 to Knight’s Quarterly Report on Form 10-Q (Commission file number 001-14223), for the quarter ended June 30, 2003). | |
| 10.9 | U.S. Securities and Exchange Commission Order. (Incorporated herein by reference to Exhibit 10.1 to Knight’s Current Report on Form 8-K (Commission file number 001-14223), dated December 17, 2004). | |
| 10.10 | NASD Letter of Acceptance, Waiver and Consent. (Incorporated herein by reference to Exhibit 10.2 to Knight’s Current Report on Form 8-K (Commission file number 001-14223), dated December 17, 2004). | |
| 10.11* | Form of Non-Qualified Stock Option Agreement under the 2003 Equity Incentive Plan. (Incorporated herein by reference to Exhibit 10.1 to Knight’s Current Report on Form 8-K (Commission file number 001-14223), dated April 4, 2005). | |
| 10.12* | Form of Restricted Stock Award Agreement under the 2003 Equity Incentive Plan. (Incorporated herein by reference to Exhibit 10.2 to Knight’s Current Report on Form 8-K (Commission file number 001-14223), dated April 4, 2005). | |
| 10.13* | Form of Non-Qualified Stock Option Agreement under the 1998 Long-Term Incentive Plan. (Incorporated herein by reference to Exhibit 10.2 to Knight’s Current Report on Form 8-K (Commission file number 001-14223), dated December 5, 2005). | |
| 10.14* | Form of Restricted Stock Award Agreement under the 1998 Long-Term Incentive Plan. (Incorporated herein by reference to Exhibit 10.3 to Knight’s Current Report on Form 8-K (Commission file number 001-14223), dated December 5, 2005). | |
100
Table of Contents
| NUMBER ASSIGNED TO EXHIBIT (I.E. 601 OF REGULATION S-K) |
DESCRIPTION OF EXHIBITS | |
| 10.15* | Option Agreement among Deephaven Managing Partners, LLC, Deephaven Capital Management LLC, Knight Capital Group, Inc., KFP Holdings I LLC, Colin Smith, Shailesh Vasundhra and Matthew Nunn, dated December 21, 2006. (Incorporated herein by reference to Exhibit 1.1 to Knight’s Current Report on Form 8-K (Commission file number 001-14223), dated December 22, 2006). | |
| 10.16* | 2006 Equity Incentive Plan of the Registrant. (Incorporated herein by reference from Exhibit A to Knight’s Definitive Proxy Statement on Schedule 14A (Commission file number 001-14223), filed April 5, 2006). | |
| 10.17 | Credit Agreement among Knight Capital Group, Inc., as Borrower, The Several Lenders from Time to Time Party Hereto, TD Banknorth, N.A and Wachovia Bank, National Association as Co-Syndication Agents, and JPMorgan Chase Bank, N.A, as Administrative Agent, dated October 3, 2007. (Incorporated herein by reference to Exhibit 10.1 to Knight’s Current Report on Form 8-K (Commission file number 001-14223), dated October 9, 2007). | |
| 10.18 | Limited Liability Company Agreement of Deephaven Capital Management Holdings LLC among Knight Capital Group, Inc., KFP Holdings I LLC, Deephaven Managing Partners, LLC, Colin Smith, Shailesh Vasundhra and Matthew Nunn, dated February 1, 2008. (Incorporated herein by reference to Exhibit 1.1 to Knight’s Current Report on Form 8-K (Commission file number 001-14223), dated February 7, 2008). | |
| 10.19* | Form of Non-Qualified Stock Option Agreement under the 2006 Equity Incentive Plan. (Incorporated herein by reference to Exhibit 10.20 to Knight’s Annual Report on Form 10-K (Commission file number 001-14223), dated February 29, 2008). | |
| 10.20* | Form of Restricted Stock Award Agreement under the 2006 Equity Incentive Plan. (Incorporated herein by reference to Exhibit 10.21 to Knight’s Annual Report on Form 10-K (Commission file number 001-14223), dated February 29, 2008). | |
| 10.21* | Form of Restricted Stock Unit Award Agreement under the 2003 Equity Incentive Plan and 2006 Equity Incentive Plan, with deferral feature. (Incorporated herein by reference to Exhibit 10.2 to Knight’s Current Report on Form 8-K (Commission file number 001-14223), dated December 24, 2008). | |
| 10.22* | Form of Restricted Stock Unit Award Agreement under the 2003 Equity Incentive Plan and 2006 Equity Incentive Plan, without deferral feature. (Incorporated herein by reference to Exhibit 10.3 to Knight’s Current Report on Form 8-K (Commission file number 001-14223), dated December 24, 2008). | |
| 10.23* | Performance Restricted Stock Unit Agreement with Thomas M. Joyce, dated December 31, 2008, under the 2006 Equity Incentive Plan ((Incorporated herein by reference to Exhibit 10.25 to Knight’s Annual Report on Form 10-K (Commission file number 001-14223), filed with the SEC on March 2, 2009). | |
101
Table of Contents
| NUMBER ASSIGNED TO EXHIBIT (I.E. 601 OF REGULATION S-K) |
DESCRIPTION OF EXHIBITS | |
| 10.24* | Amended and Employment Letter Agreement, dated as of March 31, 2009, between Thomas M. Joyce and Knight Capital Group, Inc. (Incorporated herein by reference to Exhibit 10.1 to Knight’s Quarterly Report on Form 10-Q (Commission file number 001-14223), for the quarter ended March 31, 2009). | |
| 10.25** | Amended and Restated 2009 Inducement Award Plan of the Registrant, effective December 22, 2009. | |
| 10.26** | Form of Restricted Stock Award Agreement under the Amended and Restated 2009 Inducement Award Plan. | |
| 10.27** | Form of Restricted Stock Unit Award Agreement under the Amended and Restated 2009 Inducement Award Plan. | |
| 10.28** | Employment Agreement, dated as of May 5, 2008, between Gary Katcher and Knight Libertas Holdings LLC (formerly known as Libertas Holdings LLC). | |
| 10.29** | Amendment No. 1 to Employment Agreement between Gary Katcher and Knight Libertas Holdings LLC (formerly known as Libertas Holdings LLC), effective as of December 31, 2009. | |
| 21.1** | Subsidiaries of the Registrant as of December 31, 2009. | |
| 23.1** | Consent of Independent Registered Public Accounting Firm. | |
| 24.1** | Powers of Attorney (included on signature page). | |
| 31.1** | Certification of Chief Executive Officer pursuant to Section 302 of the Sarbanes-Oxley Act of 2002. | |
| 31.2** | Certification of Chief Financial Officer pursuant to Section 302 of the Sarbanes-Oxley Act of 2002. | |
| 32.1** | Certification of Chief Executive Officer pursuant to 18 U.S.C. Section 1350, as adopted pursuant to Section 906 of the Sarbanes-Oxley Act of 2002. | |
| 32.2** | Certification of Chief Financial Officer pursuant to 18 U.S.C. Section 1350, as adopted pursuant to Section 906 of the Sarbanes-Oxley Act of 2002. | |
| * | Management contract or compensatory plan or arrangement identified in compliance with Item 15(c) of the rules governing the preparation of this report. |
| ** | Filed herewith. |
102
Table of Contents
Pursuant to the requirements of Section 13 or 15(d) of the Securities Exchange Act of 1934, the registrant has duly caused this report to be signed on its behalf by the undersigned, thereunto duly authorized, in the City of Jersey City, State of New Jersey, on this 24th day of February, 2010.
| KNIGHT CAPITAL GROUP, INC. | ||
| By: |
/s/ THOMAS M. JOYCE | |
| Chairman of the Board and Chief Executive Officer | ||
POWER OF ATTORNEY
KNOW ALL PERSONS BY THESE PRESENTS, that each person whose signature appears below constitutes and appoints Thomas M. Joyce and Steven Bisgay, and each of them severally, his or her true and lawful attorney-in-fact with power of substitution and resubstitution to sign in his or her name, place and stead, in any and all capacities, to do any and all things and execute any and all instruments that such attorney may deem necessary or advisable under the Securities Exchange Act of 1934 and any rules, regulations and requirements of the U.S. Securities and Exchange Commission in connection with this Annual Report on Form 10-K and any and all amendments hereto, as fully for all intents and purposes as he or she might or could do in person, and hereby ratifies and confirms all said attorneys-in-fact and agents, each acting alone, and his or her substitute or substitutes, may lawfully do or cause to be done by virtue hereof.
Pursuant to the requirements of the Securities Exchange Act of 1934, this Registration Statement has been signed by the following persons in the capacities and on the date indicated.
| Name |
Title |
Date | ||
| /s/ THOMAS M. JOYCE Thomas M. Joyce |
Chairman of the Board and Chief Executive Officer (Principal Executive Officer) | February 24, 2010 | ||
| /s/ STEVEN BISGAY Steven Bisgay |
Senior Managing Director and Chief Financial Officer (Principal Financial and Accounting Officer) |
February 24, 2010 | ||
| /s/ WILLIAM L. BOLSTER William L. Bolster |
Director | February 24, 2010 | ||
| /s/ GARY R. GRIFFITH Gary R. Griffith |
Director | February 24, 2010 | ||
| /s/ JAMES W. LEWIS James W. Lewis |
Director | February 24, 2010 | ||
| /s/ THOMAS C. LOCKBURNER Thomas C. Lockburner |
Director | February 24, 2010 | ||
| /s/ JAMES T. MILDE James T. Milde |
Director | February 24, 2010 | ||
| /s/ CHRISTOPHER C. QUICK Christopher C. Quick |
Director | February 24, 2010 | ||
| /s/ LAURIE M. SHAHON Laurie M. Shahon |
Director | February 24, 2010 | ||
103