Attached files
UNITED
STATES
SECURITIES
AND EXCHANGE COMMISSION
Washington,
D.C. 20549
FORM
10-K
|
ANNUAL
REPORT PURSUANT TO SECTION 13 OR 15(d) OF THE
|
|
SECURITIES
EXCHANGE ACT OF 1934
|
|
For
the fiscal year ended December 31, 2009
|
|
Commission
file number 001-09913
|

KINETIC
CONCEPTS, INC.
(Exact
name of registrant as specified in its charter)
|
Texas
|
74-1891727
|
|
|
(State
of Incorporation)
|
(I.R.S.
Employer Identification No.)
|
|
|
8023
Vantage Drive
San
Antonio,
Texas
|
78230
|
|
|
(Address
of principal executive offices)
|
(Zip
Code)
|
Registrant’s
telephone number, including area code: (210) 524-9000
Securities
registered pursuant to Section 12(b) of the Act:
|
Title
of each
class
|
Name of each exchange
on which registered
|
|
|
Common
stock, par value $0.001
|
New
York Stock Exchange
|
Securities
registered pursuant to section 12(g) of the Act: NONE
Indicate
by check mark if the registrant is a well-known seasoned issuer, as defined in
Rule 405 of the Securities Act.
Yes X No ____
Indicate
by check mark if the registrant is not required to file reports pursuant to
Section 13 or Section 15(d) of the Act.
Yes ____ No X
Indicate
by check mark whether the registrant (1) has filed all reports required to be
filed by Section 13 or 15(d) of the Securities Exchange Act of 1934 during the
preceding 12 months (or for such shorter period that the registrant was required
to file such reports), and (2) has been subject to such filing requirements for
the past 90 days.
Yes X No ____
Indicate
by check mark whether the registrant has submitted electronically and posted on
its corporate Web site, if any, every Interactive Data File required to be
submitted and posted pursuant to Rule 405 of Regulation S-T (§232.405 of this
chapter) during the preceding 12 months (or for such shorter period that the
registrant was required to submit and post such files).
Yes ____ No ____
Indicate
by check mark if disclosure of delinquent filers pursuant to Item 405 of
Regulation S-K is not contained herein, and will not be contained, to the best
of registrant's knowledge, in definitive proxy or information statements
incorporated by reference in Part III of this Form 10-K or any amendment to this
Form 10-K.
Indicate
by check mark whether the registrant is a large accelerated filer, an
accelerated filer, a non-accelerated filer or a smaller reporting
company. See the definitions of “large accelerated filer,”
“accelerated filer” and “smaller reporting company” in Rule 12b-2 of the
Exchange Act.
|
Large
accelerated filer
|
X
|
Accelerated
filer
|
||
|
Non-accelerated
filer
|
(Do
not check if a smaller reporting company)
|
Smaller
reporting company
|
Indicate
by check mark whether the registrant is a shell company (as defined in Rule
12b-2 of the Exchange Act).
Yes ____ No X
The
aggregate market value of the voting and non-voting common equity held by
non-affiliates as of June 30, 2009 was $1,234,957,983 based upon the closing
sales price for the registrant's common stock on the New York Stock
Exchange.
As of
February 19, 2010, there were 71,332,359 shares of the registrant's common stock
outstanding.
Documents
Incorporated by Reference: Certain information called for by Part III
of this Form 10-K is incorporated by reference to the definitive Proxy Statement
for the 2009 Annual Meeting of Shareholders, which will be filed not later than
120 days after the close of the Company's fiscal year.
KINETIC
CONCEPTS, INC.
|
Page
No.
|
|||
|
4
|
|||
|
30
|
|||
|
41
|
|||
|
42
|
|||
|
43
|
|||
|
45
|
|||
|
46
|
|||
|
49
|
|||
|
51
|
|||
|
74
|
|||
|
76
|
|||
|
121
|
|||
|
121
|
|||
|
124
|
|||
|
124
|
|||
|
124
|
|||
|
125
|
|||
|
125
|
|||
|
125
|
|||
|
126
|
|||
|
130
|
|||
SPECIAL
NOTE REGARDING FORWARD-LOOKING STATEMENTS
This
Annual Report on Form 10-K contains forward-looking statements within the
meaning of Section 27A of the Securities Act of 1933 and Section 21E of the
Securities Exchange Act of 1934, which are covered by the "safe harbor" created
by those sections. The forward-looking statements are based on our current
expectations and projections about future events. Discussions containing
forward-looking statements may be found in "Management's Discussion and Analysis
of Financial Condition and Results of Operations," "Risk Factors," and elsewhere
in this report. In some cases, you can identify forward-looking statements by
terminology such as "may," "will," "should," "could," "predicts," "projects,"
"potential," "continue," "expects," "anticipates," "future," "intends," "plans,"
"believes," "estimates," or the negative of those terms and other variations of
them or by comparable terminology.
These
forward-looking statements are only predictions, not historical facts, and
involve certain risks and uncertainties, as well as
assumptions. Actual results, levels of activity, performance,
achievements and events could differ materially from those stated, anticipated
or implied by such forward-looking statements. The factors that could
contribute to such differences include those discussed under the caption "Risk
Factors." You should consider each of the risk factors and uncertainties under
the caption "Risk Factors" in this Annual Report on Form 10-K among other
things, in evaluating our prospects and future financial performance. The
occurrence of the events described in the risk factors could harm our business,
results of operations and financial condition. These forward-looking statements
are made as of the date of this report. We disclaim any obligation to
update or alter these forward-looking statements, whether as a result of new
information, future events or otherwise.
TRADEMARKS
3M™
Tegaderm™ is a licensed trademark of 3M Company; Spirit Select™ is a
licensed trademark of Carroll Hospital Group, Inc.; and GraftJacket® is a
licensed mark of Wright Medical Technology Inc. All other trademarks appearing
in this report are proprietary to KCI Licensing, Inc., its affiliates and/or
licensors. The absence of a trademark or service mark or logo from this
report does not constitute a waiver of trademark or other intellectual property
rights of KCI Licensing, Inc., its affiliates and/or licensors.
INTRODUCTION
General
Kinetic
Concepts, Inc., or KCI®, is a
leading global medical technology company devoted to the discovery, development,
manufacture and marketing of innovative, high-technology therapies and products
that have been designed to leverage the body’s ability to heal, thus improving
clinical outcomes while helping to reduce the overall cost of patient
care. We have an infrastructure designed to meet the specific needs
of medical professionals and patients across all healthcare settings, including
acute care hospitals, extended care organizations and patients’ homes, both in
the United States and abroad. Our primary business units serve the
advanced wound care, regenerative medicine and therapeutic support system
markets.
|
·
|
Our
Active Healing Solutions™ business, or AHS, is focused on the development
and commercialization of advanced wound care therapies based on our
Negative Pressure Technology Platform, or NPTP, which employs negative
pressure to elicit a bioresponse in a variety of wound types to promote
wound healing through unique mechanisms of action and to speed recovery
times while reducing the overall cost of treating patients with complex
wounds. NPTP comprises three primary product categories:
Negative Pressure Wound Therapy, or NPWT, Negative Pressure Surgical
Management, or NPSM, and Negative Pressure Regenerative Medicine, or
NPRM. NPWT, through our V.A.C.®
Therapy portfolio, currently represents the primary source of revenue for
the AHS business. We continue to develop and commercialize new products
and therapies in NPSM and NPRM to diversify our NPTP revenue
streams.
|
|
·
|
Our
Regenerative Medicine business is primarily comprised of the operations of
our wholly-owned subsidiary, LifeCell Corporation, or
LifeCell™. LifeCell is focused on the development and
commercialization of regenerative and reconstructive acellular tissue
matrices for use in reconstructive, orthopedic, and urogynecologic
surgical procedures to repair soft tissue defects, as well as for
reconstructive and cosmetic procedures. Existing products include
our human-based AlloDerm®
Regenerative Tissue Matrix and porcine-based Strattice™ Tissue Matrix in
various configurations designed to meet the needs of patients and
caregivers. The majority of our Regenerative Medicine revenue is
generated from the clinical applications of challenging hernia repair and
post-mastectomy breast reconstruction. We continue our efforts
to penetrate markets with our other current products while developing and
commercializing additional tissue matrix products and applications to
expand into new markets and
geographies.
|
|
·
|
Our
Therapeutic Support Systems business, or TSS, is focused on
commercializing specialized therapeutic support systems, including
hospital beds, mattress replacement systems and overlays. Our
TSS business is comprised of three primary surface categories: critical
care, wound care and bariatric. Our critical care products,
often used in the intensive care unit, or ICU, are designed to address
pulmonary complications associated with immobility; our wound care
surfaces are used to reduce or treat skin breakdown; and our bariatric
surfaces assist caregivers in the safe and dignified handling of patients
of size. We also have products designed to reduce the incidence
and severity of patient falls in the hospital
setting.
|
KCI was
founded in 1976 and is incorporated in Texas. Our principal executive
offices are located at 8023 Vantage Drive, San Antonio, Texas
78230. Our telephone number is (210) 524-9000.
Corporate
Strategy
KCI is
committed to consistently generating superior clinical outcomes for patients and
caregivers using our products and therapies. Our differentiated
products, competencies and know-how continue to drive trust and recognition of
superior performance among our customers, which we believe translates into
strong stakeholder value. We intend to execute on our strategic
vision of sustaining leadership positions in each of our AHS, Regenerative
Medicine and TSS businesses by delivering unparalleled outcomes with compelling
economic value for our customers and focusing on innovation, globalization and
diversification. We are also focused on organizational readiness and
are making a concerted effort to enhance our management systems and business
processes through a corporate global business transformation initiative to
enable us to effectively and efficiently carry out our strategic
vision.
Innovation. We
continue to focus on our core technologies as platforms for growth through the
development of new products and clinical data. In our AHS business,
we plan to leverage our highly successful NPWT franchise, now with its third
generation V.A.C. Therapy System, into a more expansive NPTP portfolio based on
the successful development and commercialization of next generation NPWT systems
and dressings as well as new NPSM and NPRM products to diversify our AHS revenue
in the future. We are currently developing our fourth generation NPWT
portfolio of products including our V.A.C.Ulta™ and
V.A.C.Via™ Therapy Systems, for which we anticipate market launch during
2010. In 2009, we launched our first NPSM product, ABThera™ Open
Abdomen Negative Pressure Therapy System, which is used primarily for management
of the open abdomen, and we plan to launch a second product, Prevena™ Therapy
System, for the management of higher-risk surgical incisions, in
2010. In the future, our goal is to commercialize advanced NPRM
therapies for the treatment of chronic wounds and hard tissue
defects. In our Regenerative Medicine business, we are currently
launching products for use in new clinical applications such as stoma
reinforcement and mastopexy and are continuing development of additional
applications for lumpectomy and inguinal hernia. At the same time, we
are investing in advanced technologies in tissue engineering,
genetically-modified animals, and new tissue types to address unmet clinical
needs and to improve outcomes through regenerative medicine. In our
TSS business, we are investing in the development and commercialization of
enhanced products designed to meet the needs of ICU patients and to reduce or
prevent “never” events such as hospital-acquired pressure ulcers, nosocomial
infections and injurious falls. Over the long term, we will continue
to make significant investments in innovation to strengthen our competitive
position in the markets we serve.
Globalization. We
continue our efforts to increase penetration in existing geographic markets
while we expand availability of our product offerings in new
countries. Currently, the majority of our revenue from each of our
business units is generated in North America, while we have notable operations
in Europe, the Middle East and Africa, or EMEA, and the Asia Pacific, or APAC,
regions. The goal of our globalization efforts is to increase the
share of our revenue generated outside the United States over time while growing
our business overall. In our AHS business, we are now entering the
large and unpenetrated Japan market with our core NPWT product, the V.A.C.
Therapy System and related disposables. In 2009, we received approval
to begin market development activities in Japan, where we have submitted
applications to relevant reimbursement bodies for coverage determination of our
V.A.C. Therapy products. We expect to receive such coverage determination in the
first quarter of 2010, followed by commercial launch shortly
thereafter. In other countries, we have identified several
opportunities for our NPWT products that may be best served initially by
distributors. We are working aggressively to construct appropriate
networks to launch NPWT products in other countries including Brazil, Russia,
India and China. We have also recently expanded our NPWT dressing
portfolio with the Simplace™ Dressing and GranuFoam™ Bridge products, which are
now widely available in the countries where we operate. In early
2009, LifeCell launched Strattice Tissue Matrix in the United Kingdom and
Germany, and we are currently expanding further in other European
markets. In the future, we plan to commercialize our tissue matrix
products globally. Our TSS business currently operates primarily in
the United States and Europe, and we are evaluating opportunities for further
geographic expansion.
Diversification. Beyond
expanding our product offerings and revenue streams through innovation and
globalization, we plan to seek additional opportunities to diversify our
business through continued technology licensing and strategic
acquisitions. We intend to build on the leadership positions held by
our AHS, Regenerative Medicine and TSS businesses through the evaluation and
investment in adjacent or enabling technologies and synergistic growth
opportunities, supplementing our continued organic innovation
efforts. Our strong balance sheet and liquidity position should
enable us to take advantage of growth opportunities as they arise.
Organizational
Readiness. In an effort to implement our long-term strategy,
our management team is focused on organizational readiness, with a goal of
improved operations and management systems which transform us into a more agile,
progressive and global enterprise. We are currently undertaking a
global business transformation initiative designed to improve efficiencies in
our systems and operations through standardization and automation which
translate into reduced costs and more effective decision-making. As a
result of ongoing improvements to our manufacturing operations through improved
sourcing and automation, as well as global consolidation of certain shared
services, we look forward to substantial and permanent cost reductions exiting
2011. We are also making significant progress in the rationalization
of our service center and distribution infrastructure for our AHS and TSS
businesses, yielding additional cost savings. As we improve our
management systems and operations over time, we will continue to look for new
opportunities to augment our business processes and make infrastructure
enhancements to improve our efficiency and agility as a company.
Competitive
Strengths
We
believe we have the following competitive strengths:
Innovation and
commercialization. We have a successful track record spanning
over 30 years in commercializing novel technologies that change the clinical
practice of medicine by addressing the critical unmet needs of clinicians,
restoring the well-being of their patients and helping to reduce the overall
cost of patient care. We leverage our scientific depth, clinical
know-how and market experience, and we manage an active research and development
program in all three of our businesses in support of our development and
commercialization efforts. We seek to provide novel,
clinically-efficacious solutions and treatment alternatives that increase
patient compliance, enhance clinician performance and ease-of-use and ultimately
improve healthcare outcomes.
Product differentiation and superior
clinical efficacy. We differentiate our portfolio of products
by providing effective therapies, supported by a clinically-focused and
highly-trained sales and service organization, which combine to produce
clinically-proven, superior outcomes. The superior clinical efficacy
of our products is supported by an extensive collection of published clinical
studies, peer-reviewed journal articles and textbook citations, which aid
adoption by clinicians. We successfully distinguish our NPWT products from
competitive offerings through unique marketing claims that have been cleared by
the U.S. Food and Drug Administration, or FDA. These unique claims
mirror our novel mechanisms of actions with respect to the creation of an
environment that promotes wound healing through the reduction of edema and
promotion of granulation tissue formation and perfusion, ultimately preparing
the wound bed for closure. In addition, our V.A.C. Therapy Systems
are specifically cleared for use in all care settings, including in the home,
with the exception of the V.A.C. Instill system. In Regenerative
Medicine, we differentiate our products through clinically-proven performance
demonstrating tissue acceptance, cell recruitment and incorporation,
revascularization and angiogenesis and finally tissue remodeling and
regeneration. Our proprietary tissue processes minimize the potential
for specific rejection of transplanted tissue matrices, and our products offer
improved ease-of-use while reducing the risk of complications, including
adhesions to the implant. The benefits of using our tissue matrix
products over the use of autografts and other processed and synthetic products
include reduced susceptibility to infection, resorption, encapsulation, movement
away from the transplanted area, and erosion through the skin along with reduced
patient discomfort compared to autograft procedures. In our TSS
business, we have successfully differentiated our critical care products with
clinical data showing the benefits of our Kinetic Therapy™ surfaces in the
reduction of ventilator acquired pneumonia. We have also developed
and commercialized our RotoProne™ product, the only ICU therapeutic surface to
provide 360 degrees of rotation, essential automated proning therapy for
patients with acute respiratory distress syndrome, or ARDS, and other severe
pulmonary conditions. Through our commitment to innovation and
diversification, we are well positioned to continue differentiating our products
through demonstrated superior clinical efficacy.
Broad reach and customer
relationships. Our worldwide sales organization, consisting of
approximately 2,000 team members, has fostered strong relationships with our
prescribers, caregivers and payers over the past three decades by providing a
high degree of clinical support and consultation along with our extensive
education and training programs. Because our products address the
critical needs of patients who seek treatment in numerous locations where care
is provided, we have built a broad and diverse reach across all healthcare
settings and among a wide variety of clinicians and specialized
surgeons. We have key relationships with an extensive list of acute
care hospitals worldwide and long-term care facilities, skilled nursing
facilities, home healthcare agencies and wound care clinics in the United
States. Additionally, our LifeCell sales representatives interact
with plastic surgeons, general surgeons, head and neck surgeons, burn surgeons
and trauma/acute care surgeons regarding the use and potential benefits of our
tissue matrix products. As we continue to innovate in our product portfolio and
diversify our business, we plan to leverage our customer relationships to
advance the commercialization of essential therapies to patients and caregivers
worldwide.
Reimbursement
expertise. During the commercialization process for each of
our therapies and products, we dedicate substantial resources to seeking and
obtaining reimbursement from third-party payers in each of the countries where
we operate. This process requires demonstration of clinical efficacy,
determination of economic value and obtaining appropriate pricing for each
offering, which is critical to the commercial success of our
products. We have also developed a core competency in
post-commercialization reimbursement systems, which enables us to efficiently
manage our collections and accounts receivable with third-party
payers. We leverage a comprehensive set of skills and systems through
our Advantage Center operation to manage billing and collections activities in
support of our reimbursement efforts. Our focus on reimbursement provides us
with an advantage both in product development and in the responsible management
of our working capital.
Extensive service center
network. With a network of 111 domestic and 53 international
service centers, we are able to rapidly deliver, manage and service our products
at major hospitals in the United States, Canada, Australia, Singapore, South
Africa, and most major European countries. Our network gives us the ability to
deliver our products to any major Level I U.S. trauma center rapidly. This
extensive network and capability is critical to securing contracts with national
group purchasing organizations, or GPOs, and allows us to directly and
efficiently serve the homecare market. Our network also provides a platform for
the introduction of additional products in one or more care
settings.
Corporate
Organization
We are
principally engaged in the rental and sale of our products throughout the United
States and in 20 primary countries internationally. We are
headquartered in San Antonio, Texas, and our international corporate office is
located in Amstelveen, the Netherlands. We have research and
development facilities in the United States and the United Kingdom, and we
maintain manufacturing and engineering operations in the United States, the
United Kingdom, Ireland and Belgium. Our operations are run by our
three separate business units: AHS, Regenerative Medicine and
TSS. AHS and TSS are headquartered in San Antonio, and Regenerative
Medicine, primarily our LifeCell subsidiary, is located in Branchburg, New
Jersey.
During
the first quarter of 2009, we changed our operating unit reporting structure to
correspond with our current management structure, including the reclassification
of prior-period amounts to conform to this current reporting
structure. Under our current management structure, we manage our
business by each of our three business units. All three of our business units
are supported by shared services, which include Finance, Legal, Human Resources,
and Information Technology.
INFORMATION
RELATED TO BUSINESS UNITS
Introduction
and Revenue Summary
We have
three reportable operating segments which correspond to our business units: AHS,
Regenerative Medicine, and TSS. We have two primary geographic
regions: North America, which is comprised principally of the United States and
includes Canada and Puerto Rico; and EMEA/APAC, which is comprised principally
of Europe and includes the Middle East, Africa and the Asia Pacific
region.
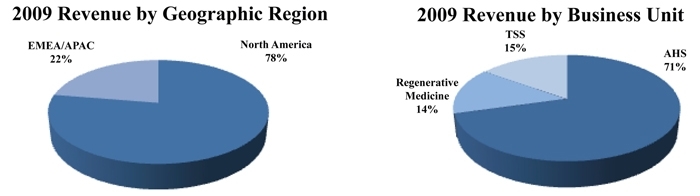
For the
year ended December 31, 2009, we generated revenue of
$1.99 billion. Approximately 70.6% of our 2009 revenue was from
our AHS business unit, while our Regenerative Medicine and TSS business units
accounted for 14.3% and 15.1%, respectively. Revenue from our North
America operations accounted for 77.6% of our fiscal 2009 revenue, while our
EMEA/APAC operations represented approximately 22.4% of total
revenue.
For
financial reporting purposes, our performance by reportable segment and
financial performance attributable to significant geographic areas is included
in Note 17 to our accompanying consolidated financial statements.
ACTIVE
HEALING SOLUTIONS
|
Description
of Business
|
Our
Active Healing Solutions business, or AHS, offers advanced wound healing and
tissue repair systems that are targeted to meet the needs of specific care
settings and wound or patient requirements and that incorporate our proprietary
Negative Pressure Technology Platform, or NPTP. NPTP comprises three
primary product categories, Negative Pressure Wound Therapy, or NPWT, Negative
Pressure Surgical Management, or NPSM, and Negative Pressure Regenerative
Medicine, or NPRM. NPWT currently represents the primary source of
revenue for the AHS business. We continue to develop and
commercialize new products and therapies in NPSM and NPRM to diversify our NPTP
revenue in the future.
Our NPWT
franchise is built upon our proprietary V.A.C. Therapy technology, which
promotes wound healing by delivering negative pressure (a vacuum) at the wound
site which is distributed to the wound bed through a patented disposable
dressing. This distributed negative pressure helps draw wound edges
together, removes infectious materials and actively promotes granulation at the
cellular level. Since its introduction, our V.A.C. Therapy technology
has changed the way wounds are treated and managed. With more published clinical
evidence than any competitive offering, V.A.C. Therapy has been selected by
prescribers as the treatment of choice for approximately 3,000,000 patients
worldwide. As part of our corporate strategy and to better address
customer and patient needs, we are in the process of expanding from our suite of
NPWT products to a broad, differentiated NPWT therapeutic
portfolio. We are currently planning the commercial launch of two new
NPWT products during 2010, the V.A.C.Ulta and V.A.C.Via Therapy
Systems. V.A.C.Ulta combines our existing V.A.C. Therapy technology
with instillation techniques in one device, intended to augment and accelerate
the wound healing process while targeting ease of use. V.A.C.Via is a disposable
device designed with the clinical benefits of V.A.C. Therapy in an embodiment
that is easier to procure, store and use, which we believe will enhance
utilization and patient compliance. Our new NPWT products, which are
supported by new intellectual property, are in pre-commercialization stages and
remain subject to regulatory approval in the U.S. and
internationally.
We are
also making significant investments in the development and commercialization of
new AHS products in NPSM and NPRM over the next several years. In 2009, we
launched our first NPSM product, the ABThera Open Abdomen Negative Pressure
Therapy System, which is used primarily for management of the open abdomen, and
we plan to launch the Prevena Therapy System in 2010 for the management of
higher-risk surgical site incisions. In the future, our goal is to develop
and commercialize new and next generation products in NPWT and NPSM, as well as
advanced NPRM therapies for the treatment of chronic wounds and hard tissue
defects.
Our AHS
business offers an exclusive combination of technology, support and proven
results that delivers 360 degrees of healing. In addition to the innovative
therapy systems and dressings and the most evidence-based outcomes in the NPWT
field, AHS also offers an unmatched integrated service and delivery model, which
includes support through the care continuum provided by on-call clinical experts
that offer clinical assistance and education across all care
settings.

|
Products
and Clinical Applications
|
Our AHS
products are designed to deliver highly-effective therapies in multiple clinical
applications with the needs of physicians, nurses, and patients in mind for both
the acute care and post-acute care settings. The table below provides
a summary view of our NPTP products, including those that are already
commercially available as well as those currently under
development. Unless otherwise noted, all of our AHS products are
approved for use in the United States, Canada, and the European
Union.
|
NPTP
(Negative Pressure Technology Platform)
|
||||||||
|
NPWT
(Negative Pressure Wound Therapy
|
NPSM
(Negative Pressure Surgical Management)
|
|||||||
|
Care
Setting
|
Acute
|
Post
-Acute
|
Acute
(Operating Room)
|
|||||
|
Products
|
InfoV.A.C.®
V.A.C.
ATS®
V.A.C.
Instill®
V.A.C.Ulta™†
|
ActiV.A.C.
®
V.A.C
Freedom®
(1)
V.A.C.Via™†
|
ABThera™
|
Prevena™ (2)
|
||||
|
Clinical
Application
|
Used
primarily for creating an environment that promotes wound healing by
preparing the wound bed for closure, reducing edema, promoting granulation
tissue formation and perfusion, and by removing exudate and infectious
material
|
Used
primarily for management of the open abdomen, as a temporary bridging of
abdominal wall openings where primary closure is not possible and/or
repeat abdominal entries are necessary
|
Used
primarily to manage surgical incisions by maintaining a closed environment
to protect the incision site from external infectious sources, removing
exudates, approximating incision edges and reducing edema
|
|||||
|
|
||||||||
|
† Product
currently in pre-commercialization phase; not currently approved for use
with patients
|
||||||||
|
(1)
Certified for Joint Airworthiness by the U.S. Military
|
||||||||
|
(2)
CE Marked, approved for use only in the European Union and Canada as of
January 29, 2010
|
||||||||
NPWT
Products
Each of
the V.A.C. Therapy Systems in our NPWT portfolio consists of a therapy unit and
four types of disposables: our proprietary dressings, an occlusive drape, a
unique tubing system connecting the dressing to the therapy unit and a
specialized canister. Our V.A.C. Therapy dressings are specially
designed to address the unique physical characteristics of different wound
types, such as large open wounds, surgical incisions, and diabetic foot ulcers,
among others. The V.A.C. Therapy unit consists of a pump that
generates controlled negative pressure and sophisticated internal software that
controls and monitors the application of the therapy. The therapy can
be programmed for individualized use based on prescriber preferences and
requirements. The occlusive drape covers the dressing and secures the
foam, thereby allowing negative pressure to be maintained at the wound
site. The tubing system is both a means of delivering negative
pressure therapy to a wound site as well as a proprietary feedback mechanism to
measure and monitor therapy levels. The canister collects the fluids, or
exudates, helps reduce odors through the use of special filters and provides for
safe disposal of medical waste. Additionally, all of our V.A.C.
Therapy units include safety alarms that respond in real time to signal users of
any tubing blockage, dressing leakage or other condition which may interfere
with appropriate therapy delivery. The systems have a number of
on-screen user-assist features such as treatment guidelines.
The
superior clinical efficacy of our V.A.C. Therapy wound healing and tissue repair
systems is proven and supported by an extensive collection of published clinical
studies. In addition, independent consensus conferences have issued guidelines
for the use of NPWT for diabetic foot wounds, pressure ulcers, complex chest
wounds, hospital-treated wounds and open abdominal wounds. The table
below provides a summary description of each of our NPWT therapy systems and
specialized dressings.
NPWT
Products
|
NPWT
Product
|
Introduction
Year
|
Description
|
||
|
V.A.C.Ulta™
Therapy
System
|
Planned
in 2010
|
V.A.C.Ulta
is designed to incorporate all of the functionality of InfoV.A.C. and
V.A.C. Instill into a single therapy system thereby enhancing efficiency
and ease of use. The therapeutic highlight is V.A.C. VeraFlo™ Therapy,
which enhances V.A.C. Therapy with the controlled delivery and removal of
topical solutions in the wound bed. V.A.C. VeraFlo Therapy expands the
current NPWT market opportunity.
|
||
|
V.A.C.Via™
Therapy
System
|
Planned
in 2010
|
V.A.C.Via
is designed as a single use, disposable NPWT device. V.A.C.Via provides
all of the clinical benefits of V.A.C. Therapy for less-complex wounds
having minimal to moderate levels of exudate. The portable, sleek design
of V.A.C.Via enhances patient mobility and provides discretion, which
enables improved patient therapy compliance.
|
||
|
V.A.C.
® GranuFoam™ Bridge Dressing
|
2009
|
The
V.A.C. GranuFoam Bridge Dressing is specifically designed to allow the
SensaT.R.A.C.™ Pad to be placed away from the wound site. This
makes the V.A.C. GranuFoam Bridge Dressing an ideal dressing for diabetic
foot wounds requiring NPWT and off-loading therapy. Because
V.A.C. GranuFoam Bridge Dressing can be used with all existing V.A.C.
Therapy Systems, and in combination with standard-of-care off-loading
boots or devices, the V.A.C. GranuFoam Bridge Dressing improves patient
mobility and allows patients to resume daily living
activities. The V.A.C. GranuFoam Bridge Dressing, when used
with an off-loading boot and V.A.C. Therapy, facilitates patient
transition from acute facilities to non-acute care settings.
|
||
|
V.A.C.
® Simplace™ Dressing
|
2008
|
The
V.A.C. Simplace Dressing features a newly designed GranuFoam Dressing and
a 3M™ Tegaderm™ Dressing designed exclusively for use with our proprietary
V.A.C. Therapy Systems. The unique features of the V.A.C.
Simplace Dressing kit are designed to simplify and quicken the V.A.C.
Therapy dressing application process, which results in improved adaptation
of the technology with less training required. The new spiral shaped
GranuFoam Dressing is pre-scored, which reduces the need to cut the foam
and facilitates easier placement in the wound site. The 3M
Tegaderm Dressing conforms to the body and flexes with the skin to help
ensure the existence of an optimal wound-healing environment.
|
||
|
InfoV.A.C.
®
Therapy
System
|
2007
|
InfoV.A.C.
provides a digital wound imaging feature that allows caregivers to monitor
and document wound healing progress. Digital images can be
reviewed on-screen or transferred electronically to help document patient
progress, which enables convenient sharing of wound information among
caregivers and payers who require evidence of wound
healing. Advancements also include SensaT.R.A.C. Technology and
Seal Check™ Leak Detector, which simplify the application, monitoring and
documentation of wound therapy.
|
||
|
ActiV.A.C.®
Therapy
System
|
2007
|
ActiV.A.C.
addresses the demand for a simpler, lighter, and lower profile design that
enhances patient comfort and mobility. ActiV.A.C. features newly-developed
technology that automatically documents the patient's therapy history and
treatment times. Reports can be reviewed on-screen or
downloaded to a computer and are electronically stored in the
system. ActiV.A.C., which can be battery operated, incorporates
SensaT.R.A.C. Technology and Seal Check Leak Detector, which simplify the
application, monitoring and documentation of wound therapy.
|
||
|
V.A.C.
GranuFoam Silver®
Dressing
|
2005
|
The
V.A.C. GranuFoam Silver Dressing combines the proven benefits of NPWT with
the antimicrobial attributes of silver. The V.A.C. GranuFoam
Silver Dressing is the only silver dressing that allows the GranuFoam
Silver Dressing pores to directly contact the wound, thereby eliminating
the need for additional silver dressing layers that may inhibit negative
pressure and granulation. Micro-bonded metallic silver is
uniformly distributed throughout the dressing, providing continuous
delivery of silver even after dressing sizing. A single
application of V.A.C. GranuFoam Silver Dressing eliminates the need for
adjunct silver dressings. The dressing offers a protective
barrier to reduce certain infection-producing bacteria, yeast and fungi
and may help reduce infections in the wound.
|
||
|
V.A.C.
Instill®
Therapy
System
|
2003
|
V.A.C.
Instill has all the capabilities and features of the V.A.C. ATS®
(described below), while also providing the ability to instill topical
wound treatment solutions and suspensions into the wound
bed.
|
||
|
V.A.C.
ATS®
Therapy
System
|
2002
|
V.A.C.
ATS incorporates our proprietary T.R.A.C. technology, which enables the
system to monitor pressure at the wound site and automatically adjust
system operation to maintain the desired therapy protocol. With
the introduction of the InfoV.A.C. to the acute care market, V.A.C. ATS is
being transitioned solely into the long-term care market segment and will
be the initial therapy system commercialized in Japan.
|
||
|
V.A.C.
Freedom®
Therapy
System
|
2002
|
V.A.C.
Freedom was designed to meet the requirements for a lightweight product
suitable for ambulatory patients. V.A.C. Freedom also utilizes
T.R.A.C. technology and T.R.A.C. dressings. With the
introduction of ActiV.A.C. to the post-acute market, V.A.C. Freedom is
being transitioned primarily into the long-term care market. In
addition, V.A.C. Freedom has achieved Joint Airworthiness Certification
status by the U.S. Military, following an extensive evaluation process
testing the device’s safety for use on military aeromedical evacuation
aircraft. The certification program is a shared U.S. Air
Force-Army initiative and applies to specific U.S. Air Force aircraft and
U.S. Army helicopters. The certification enables military
caregivers to continue providing effective and uninterrupted treatment for
injured military personnel that are being transported long distances from
theatre hospitals to continental U.S. hospitals.
|
NPSM
Products
The NPSM product portfolio consists of
products designed specifically for use in the surgical suite. These products
leverage the NPTP to address unique challenges that surgeons encounter during
and after surgical procedures. Each NPSM product offering includes a
therapy unit, specific dressing, tubing set, drape, and canister. The
levels of negative pressure for each therapy unit are pre-determined based on
the surgical procedures it is designed to address. Relevant alarms and alerts
are also built into the unit and are based on the specific surgical
procedure. The dressings offered are designed to suit the needs of
the surgeon during the surgical procedure. A tubing set connects the
dressing to the therapy unit. A canister is also available to collect exudate.
The canister size varies to accommodate levels of exudate observed for each type
of surgical procedure, ranging from 45 mL for the management of
surgically-closed incisions to 1000 mL for the management of the open
abdomen. The table below provides a summary description of each of
our NPSM therapy systems.
NPSM
Products
|
NPSM
Product
|
Introduction
Year
|
Description
|
||
|
Prevena™
Incision Management System
|
2010
|
Prevena
is designed for the management of surgical incisions. Prevena
provides a closed environment to protect the incision site from external
infectious sources, removes exudates, approximates incision edges, and
reduces edema, all of which assist with the management of surgical
incisions. Prevena is fully disposable and includes a
battery-powered, pre-programmed therapy unit delivering negative pressure,
a peel and place dressing and a carrying case. Prevena is
currently approved for use only in the European Union and Canada as of
January 29, 2010. Prevena is currently pending FDA approval in
the U.S.
|
||
|
ABThera™
Open
Abdomen Negative
Pressure
Therapy
System
|
2009
|
ABThera
is designed specifically for the management of patients with an open
abdomen. The system includes a dedicated therapy unit
delivering negative pressure, which is designed to be easy to use and is
made available in the operating room. ABThera Therapy is a
unique temporary abdominal closure technique, which helps
achieve primary fascial closure, manage exudate, protect the
abdominal contents and allow for rapid application.
|
|
Customers
|
In U.S.
acute care and long-term care facilities, we bill our customers directly for the
rental and sale of our products. We contract with healthcare
facilities individually or through GPOs that represent large numbers of
hospitals and long-term care facilities. In the U.S. homecare
setting, we provide products and services to patients in the home and bill
third-party payers, such as Medicare and private insurance,
directly. For 2009, 2008 and 2007, U.S. Medicare placements accounted
for 15.2%, 17.0%, and 19.1% of total AHS revenue, respectively. None
of our individual customers or third party payers accounted for 10% or more of
total AHS revenues for 2009, 2008 or 2007. Outside of the U.S., most
of our AHS revenue is generated in the acute care setting on a direct billing
basis. Sales and rentals of our AHS products accounted for
approximately 70.6% of our total revenue in 2009. By geographic
region, North America and EMEA/APAC represented 75.8% and 24.2%, respectively,
of total 2009 AHS revenue.
Reimbursement
We have
extensive contractual relationships and reimbursement coverage for our AHS
products in the United States. We have contracts with nearly all
major acute care hospital organizations and most major extended care
organizations, either directly or through GPOs. As of December 31,
2009, our AHS business had contracts with private and governmental payer
organizations covering over 200 million member lives in the United
States. We are paid directly by hospitals and extended care
organizations, who seek reimbursement for surgical procedures from both private
and public payers. A substantial portion of AHS product placements,
particularly placements in the home, are subject to reimbursement coverage from
various public and private third-party payers, including government-funded
programs, such as the Medicare and Medicaid programs in the United States, and
other publicly-funded health plans in foreign jurisdictions. As a
result, the demand and payment for our products are dependent, in part, on the
reimbursement policies of these payers.
In the
U.S. homecare market, our NPWT products are subject to Medicare Part B
reimbursement and many U.S. insurers have adopted coverage criteria similar to
Medicare standards. From time to time, the U.S. Medicare
administrative agency, The Centers for Medicare and Medicaid Services, or CMS,
publishes reimbursement policies and rates that affect reimbursement for our
Medicare placements in the home. The continued assignment of
reimbursement codes by CMS to competing products increases the likelihood of the
NPWT product category being included in future rounds of the Medicare
competitive bidding program.
We are
continuing our efforts to obtain expanded reimbursement for our NPWT products
and related disposables in foreign jurisdictions. These efforts have
resulted in varying levels of reimbursement from private and public payers in
Germany, Austria, the Netherlands, Switzerland, Canada, South Africa, Australia
and the United Kingdom, mainly in the acute care setting. Generally,
our NPWT products are covered and reimbursed in the inpatient hospital setting
and to some extent, depending on the country, in post-acute or community-based
care settings. However, in certain countries important to AHS’s
growth, such as Germany, the United Kingdom, France and Spain, post-acute care
coverage and reimbursement are largely provided on a case-by-case basis, and
multiple efforts are underway with certain countries to secure consistent
coverage and reimbursement policies in community-based outpatient care
settings. In targeted countries, we are utilizing accepted “coverage
with evidence” mechanisms in close cooperation with local clinicians and
clinical centers, government health ministry officials, and in some cases,
private payers to obtain the necessary evidence to support adequate coverage and
reimbursement.
In the
APAC region, we are undertaking major coverage and reimbursement efforts for our
NPWT products. In Japan, following our receipt of approval to begin
market development activities in 2009, we submitted reimbursement applications
for coverage of our V.A.C. Therapy Systems. The successful results
from our V.A.C. Therapy clinical trials, which we have reported, have been
submitted with our reimbursement dossiers. We expect to receive
reimbursement approval in Japan in the first quarter of 2010 followed by
commercial launch shortly thereafter. In Australia, where acute care
reimbursement for the V.A.C. Therapy System has been approved for many years, we
are seeking reimbursement approval for V.A.C. Therapy in the post acute or
community-based settings. In this regard, negotiations are underway
with the Australian health ministry, as well as that country’s largest private
payers. Other APAC countries that are important to AHS’s growth are China,
India, South Korea, Taiwan and Singapore, where we intend to dedicate
substantial efforts to obtain reimbursement in the future.
In
Germany, we now receive reimbursement for our NPWT products in the acute care
setting. We continue to seek expanded homecare reimbursement as part
of our growth plans in Germany although there have been delays in this approval
process. We are working with the German government and several German
insurance agencies to design clinical trials and possibly a registry for the
purposes of assessing payment and coverage for V.A.C. Therapy in the
home. Initial patient enrollment is expected in the latter half of
2010 with all studies concluding in the 2012 time frame. Assessment
of results and any coverage decisions will follow the conclusion of the
studies.
Overall,
the prospects of achieving broader global coverage and reimbursement for our
NPWT products in both acute and post-acute settings are dependent upon the
controls applied by governments and private payers with regard to rising
healthcare costs balanced by the significant and growing evidence that our NPWT
products have demonstrated the ability to prepare wounds for closure while
reducing the overall costs associated with treatment. We believe that our plans
to achieve positive coverage and reimbursement decisions for NPWT products
outside the United States are supported by the growing need for clinical and
economic evidence and are prioritizing these efforts country by
country.
To ensure
compliance with Medicare and other regulations to which we are subject, regional
carriers often conduct audits and request patient records and other documents to
support claims we submit for payment of services rendered to
customers. From time to time, we receive inquiries from various
government agencies requesting customer records and other
documents. It has been our policy to cooperate with all such requests
for information. We also are subject to routine pre-payment and post-payment
audits of reimbursement claims submitted to Medicare. These audits
typically involve a review, by Medicare or its designated contractors and
representatives, of documentation supporting the medical necessity of the
therapy provided by us and could ultimately result in denial, recoupment or
refund demands for claims submitted for Medicare reimbursement. In
addition, Medicare or its contractors could place us on extended pre-payment
review, which could slow our collections process for submitted
claims. Initial audit findings of this type are subject to
administrative remedies and appeals processes. Going forward, it is likely that
we will be subject to periodic inspections, assessments and audits of our
billing and collections practices.
|
Competition
|
Historically,
our AHS therapies and systems have competed primarily with traditional wound
care dressings, other advanced wound dressings (hydrogels, hydrocolloids,
alginates), skin substitutes, products containing growth factors and other
medical devices used for wound care. Many of these methods can be
used to compete with our NPWT products or as adjunctive therapies which may
complement our products. In recent years, as a result of the success
of our V.A.C. Therapy System, a number of companies have announced or introduced
products similar to, or designed to mimic the product component of, our NPWT
solution, and others may do so in the future.
We
believe that the principal competitive factors within our markets are clinical
outcomes, cost of care and support and service, especially across care settings.
Furthermore, we believe that a national presence with full distribution
capabilities is important to serve large, national and regional healthcare GPOs
and care systems. We believe our AHS business is well-positioned to
compete effectively in advanced wound care markets based on our broad reach and
relationships, the clinical efficacy and superior outcomes of our products,
which is supported by a large body of evidence, and our differentiated global
infrastructure, service and support. Multiple studies have
demonstrated that our V.A.C. Therapy System, including its unique foam dressing,
provides a clinical advantage for treatment of wounds, including limb salvage in
patients with diabetic foot ulcers.
Our AHS
business primarily competes with Convatec, Huntleigh Healthcare/Getinge, Smith
& Nephew, and Talley, in addition to several smaller companies that have
introduced medical devices designed to compete with our products.
|
Sales
and Marketing
|
We
currently market our AHS products in the acute, extended and home care
settings. We operate one of the largest sales organizations in the
world dedicated to wound healing with negative pressure, which is comprised of
approximately 1,550 employees. In each foreign market where we have a
presence, we sell our products through our direct sales force or through local
distributors with local expertise. Our U.S. dedicated AHS sales
organization consists of approximately 900 individuals dedicated to the
sale and placement of AHS products and is organized by care
setting. Our international sales organization includes approximately
350 employees in 20 foreign countries, and we also have over 300 individuals in
our sales organization that support both our AHS and TSS business
units. In addition, our Regenerative Medicine and AHS sales
organizations are beginning to capitalize on synergistic opportunities involving
commercialization of products used in surgical procedures, such as those
involving the open abdomen. Because physicians and nurses are
critical to the adoption and use of advanced medical systems, a major element of
our marketing focus is to educate and train these medical practitioners in the
application of our therapies, including the specific knowledge necessary to
drive optimal clinical outcomes, restore patient well-being and reduce the cost
of patient care. Our AHS sales organization includes over 500
clinical consultants, all of whom are healthcare professionals, whose principal
responsibilities are to make product rounds, consult on complex cases and assist
organizations and home health agencies in developing their patient-care
protocols and educate facility staff on the use of our
therapies. Additionally, these team members consult with our
customers regarding the often demanding and complex paperwork required by
Medicare and private insurance companies. In fulfilling the paperwork
requirements, these specialists enhance the overall productivity of our sales
force.
|
Seasonality
|
Historically,
we have experienced a seasonal slowing of AHS unit growth beginning in the
fourth quarter and continuing into the first quarter, which we believe has been
caused by year-end clinical treatment patterns, such as the postponement of
elective surgeries and increased discharges of individuals from the acute care
setting. Although we do not know if our historical experience will
prove to be indicative of future periods, similar slow-downs may occur in
subsequent periods.
Operations
and Manufacturing
Our
U.S. operations have a national 24-hour, seven days-a-week customer service
communications system, which allows us to quickly and efficiently respond to our
customers’ needs. Additionally, we have approximately 1,000 employees
located in San Antonio at our Advantage Center operation who perform functions
associated with customer service and sales administration. We
maintain a secure and encrypted website, KCI Express®,
allowing customers across all care settings to transact business with us
directly and efficiently on the web. This website, www.kciexpress.com,
provides AHS customers self-service applications designed to meet the specific
needs in their care setting. In the U.S., we distribute our AHS
products through a network of 111 service centers and three strategically
located distribution centers. Our U.S. network gives us the ability
to deliver our products to any major Level I domestic trauma center
rapidly. Our international operations distribute our products through
a network of 53 service centers. These international service centers
are strategically located within the regions and countries where we market our
products and provide services similar to those provided in the U.S. market, but
vary by country to ensure we meet the unique needs of our international
customers. In addition, we manage a V.A.C. Therapy van fleet which
has enhanced our efficiency and ability to better serve customers by providing
increased mobility and accelerated turnaround of products.
In
addition to delivery, pick-up and technical support services, our service
organization cleans, disinfects and reconditions products between
rentals. To ensure availability when products are needed, the service
organization manages our rental fleet of approximately 95,000 V.A.C.
Therapy units, deploying units to meet individual service center demand patterns
while maintaining high levels of rental asset utilization. Services
are provided by approximately 1,000 employees in the U.S. and 600 employees
internationally.
Our
manufacturing processes for AHS products involve producing final assemblies in
accordance with a master production plan. Assembly of our products is
accomplished using metal parts, plastics, electronics and other materials
and component parts that are primarily purchased from outside
suppliers. Component parts and materials are obtained from industrial
distributors, original equipment manufacturers and contract
manufacturers. The majority of parts and materials are readily
available in the open market (steel, aluminum, plastics, fabric, etc.) for which
price volatility is reasonably low. Our manufacturing processes and
quality systems are intended to comply with appropriate FDA and International
Organization for Standardization, or ISO, requirements.
Our
manufacturing plant in Athlone, Ireland currently manufactures our V.A.C.
Therapy units for our global markets. Our Ireland plant also
manufactures certain disposable supplies, on a high-volume automation line,
which have historically been supplied by Avail Medical Products, Inc., a
subsidiary of Flextronics International Ltd. We plan to continue
leveraging our existing infrastructure and manufacturing capabilities within our
Athlone plant and expand internal production in the future. In 2007,
we entered into a supply agreement with Avail, which has a term of five years
through November 2012 and may be renewed by agreement of both
parties. Under this agreement, we have title to the raw materials
used to manufacture our disposable supplies and retain title of all disposables
inventory throughout the manufacturing process. The terms of the
supply agreement provide that key indicators be provided to us that would alert
us to any inability of Avail to perform under the
agreement. Approximately 22.6%, 24.1% and 24.1% of our total revenue
for the years ended December 31, 2009, 2008 and 2007, respectively, was
generated from the sale of NPWT disposables.
REGENERATIVE
MEDICINE
|
Description
of Business
|
Our
Regenerative Medicine business unit, operated by our wholly-owned subsidiary
LifeCell Corporation, or LifeCell, develops, processes and markets novel
biological soft tissue repair products made from human or animal sources that
have been uniquely designed to harness the body’s natural healing processes to
promote remodeling and regeneration of lost or damaged tissue while restoring
function and well-being. Soft tissue, such as skin, heart valves,
blood vessels and nerve connective tissue, contains a complex, three-dimensional
structure consisting of multiple forms of collagen, elastin, proteoglycans,
other proteins and blood vessels making up the tissue matrix. As part
of the body’s natural regenerative process, cells within a tissue continuously
degrade and, in the process, replace the tissue matrix. However, in
the event that a large portion of the body’s existing tissue matrix is destroyed
or lost, such as from trauma or surgery, the body cannot effectively regenerate
the damaged portion, resulting in scar formation. In such situations,
surgeons consider a number of treatment options in the attempt to restore
structure, function and physiology, including the use of implant
materials. Alternatives include autograft transplants from one part
of the patient’s body to another, processed allograft tissue, processed
xenograft tissue and synthetic products.
We
believe the use of autograft tissue is disadvantageous due to the creation of a
separate donor site wound and the associated pain, morbidity and scarring from
this additional wound. We also believe there are disadvantages to
using synthetic materials and certain biologic materials including their
susceptibility to infection, resorption, encapsulation, movement away from the
transplanted area, and erosion through the skin. Some biologic
materials may include bovine collagen, which requires patient sensitivity
testing.
We
believe that our acellular tissue matrix products provide surgeons with benefits
over other implant materials due to our approach to biomaterials processing,
namely to produce advanced tissue matrix products which the body recognizes as
safe and self, thus encouraging acceptance and proper incorporation which in
turn allows progression to healing and restoration. Our tissue matrix
products undergo non-damaging proprietary processing, resulting in intact tissue
matrices that are strong and support tissue regeneration by way of rapid
revascularization and remodeling. Our proprietary tissue processes
remove cells from biologic tissues to minimize the potential for specific
rejection of the transplanted tissue. Our tissue matrix products also
offer ease of use and minimize risk of some complications, including adhesions
to the implant.
|
Products
and Clinical Applications
|
Our
Regenerative Medicine product portfolio includes biological soft tissue repair
products made from human and animal tissue for use in reconstructive, orthopedic
and urogynecologic surgical procedures to repair or reinforce soft tissue
defects or weaknesses.
Allograft-Based
Regenerative Tissue Matrix Products
Our
allograft-based tissue matrices are made from donated human skin tissue
processed with our non-damaging proprietary technique. Our allograft
products support the repair or reinforcement of damaged or weakened tissue by
providing a foundation for regeneration of normal human soft
tissue. Following transplant, our regenerative tissue matrix products
revascularize and repopulate with the patient’s own cells becoming incorporated
into the patient, thus providing a versatile scaffold with multiple surgical
applications. The table below provides a description of our allograft
tissue matrix products, common clinical applications and distribution
channels.
Allograft
Products
|
Product
|
Description
|
Clinical
Applications
|
Distribution
|
|||
|
AlloDerm®
Regenerative Tissue Matrix
|
Human
allograft tissue matrix product
|
Predominately
used in general, plastic and
reconstructive procedures:
· as
an implant for soft tissue reconstruction or tissue deficit
correction
· as
a graft for tissue coverage or closure; and
· as
a sling to provide support to tissue following nerve or muscle
damage
Examples
of application include:
· in
cancer reconstruction procedures, including breast reconstruction
following mastectomy procedures
· in
surgical repair of abdominal wall defects, to repair defects resulting
from trauma, previous surgery, hernia repair, infection, tumor resection
or general failure of the musculofascial tissue
· in
periodontal surgical procedures, to increase the amount of attached gum
tissue supporting the teeth as an alternative to autologous connective
tissue grafts
· for
the treatment of third-degree and deep second-degree burns requiring skin
grafting to replace lost skin
|
Our
direct sales force handles the distribution of AlloDerm RTM for all
applications other than periodontal applications.
BioHorizons
Implant Systems, Inc. is an exclusive distributor in the U.S. and certain
international markets of AlloDerm RTM for use in periodontal
applications.
|
|||
|
Cymetra®
Micronized AlloDerm®
Tissue
|
Micronized
human allograft tissue matrix product
|
Ideally
suited for the correction of soft-tissue defects requiring minimally
invasive techniques
Example
of application includes:
· injection
laryngoplasty
|
Our
direct sales force handles the distribution of Cymetra Micronized AlloDerm
Tissue.
|
|||
|
GRAFTJACKET®
Regenerative Tissue Matrix
|
Human
allograft tissue matrix product
|
Intended
for use in repairing damaged or inadequate integumental tissue in
orthopedic surgical procedures
Examples
of application include:
· for
rotator cuff tendon reinforcement
· by
podiatrists for the treatment of lower extremity wounds (e.g., deep,
chronic diabetic foot ulcers)
|
Wright
Medical Technology Inc. is an exclusive distributor in the U.S. and
certain international markets for GraftJacket RTM.
|
|||
|
GRAFTJACKET®
Xpress Flowable Soft Tissue Scaffold
|
Micronized
human allograft tissue matrix product
|
Intended
for the repair of damaged or inadequate integumental tissue, such as deep
dermal wounds
Example
of application includes:
· for
tunneling diabetic foot ulcers
|
Wright
Medical Technology Inc. is an exclusive distributor in the U.S. and
certain international markets for GraftJacket Xpress.
|
|||
|
AlloCraft®
DBM
|
Human
allograft bone-grafting product that combines demineralized bone and
micronized human tissue matrix to form a putty-like material
|
Intended
for use as a bone void filler in various orthopedic surgical
procedures
Example
of application includes:
· for
spinal infusions
|
Stryker
Corporation is our exclusive distributor for AlloCraft DBM in the United
States.
|
|||
|
Repliform®
Tissue Regeneration Matrix
|
Human
allograft tissue matrix product
|
Intended
for use in repairing damaged or inadequate integumental tissue in
urogynecologic surgical procedures
Examples
of application include:
· as
a bladder sling in the treatment of stress urinary
incontinence
· for
the repair of pelvic floor defects
|
Boston
Scientific Corporation is an exclusive worldwide sales and marketing agent
for Repliform TRM for use in urogynecology.
|
Xenograft-Based
Reconstructive Tissue Matrix Products
Our
xenograft-based tissue matrices are porcine skin tissue processed with our
non-damaging proprietary processing technique that removes cells and
significantly reduces a component believed to play a major role in the
xenogeneic rejection response. Our xenograft tissue matrix products
support the repair of damaged tissue by allowing rapid revascularization and
cell repopulation with a patient’s own cells, providing a versatile scaffold for
optimal remodeling into the patient’s own tissues. The table below provides a
description of our xenograft tissue matrix products, common clinical
applications and distribution channels.
Xenograft
Products
|
Product
|
Description
|
Clinical
Applications
|
Distribution
|
|||
|
Strattice™
Reconstructive Tissue Matrix
|
Porcine
reconstructive tissue matrix product
|
Intended
for use as an implant to reinforce soft tissue where weakness exists and
for the surgical repair of damaged or ruptured soft tissue
membranes
Examples
of application include:
· in
cancer reconstruction procedures, including breast reconstruction
following mastectomy procedures
· in
surgical repair of abdominal wall defects, to repair defects resulting
from trauma, previous surgery, hernia repair, infection, tumor resection
or general failure of the musculofascial tissue
· in
reinforcement and repair of stoma sites at risk of herniation
· in
breast augmentation revisionary procedures
|
Our
direct sales force handles the distribution of Strattice TM for
all applications.
|
|||
|
Conexa™
Reconstructive Tissue Matrix
|
Porcine
reconstructive tissue matrix product
|
Intended
for use in soft tissue reinforcement
Example
of application includes:
· for
reinforcement of rotator cuff, patellar, achilles, biceps, quadriceps, or
other tendons
|
Tornier
is an exclusive distributor for Conexa TM in the United States and certain
international markets.
|
|
Customers
|
Our
Regenerative Medicine sales accounted for approximately 14% of our total revenue
in 2009. By geographic region, North America and EMEA/APAC
represented approximately 99% and 1%, respectively, of total 2009 Regenerative
Medicine revenue. Our tissue matrix products are used primarily by
general, plastic and reconstruction surgeons for challenging abdominal
wall/hernia repair, stoma reinforcement, breast reconstruction post-mastectomy,
mastopexy, head and neck trauma, and certain cosmetic surgical
procedures. Hospitals are the primary purchasers of our tissue matrix
products, and these surgical procedures are handled primarily in the hospital
inpatient care setting.
|
Reimbursement
|
LifeCell
has contractual relationships with hospitals and ambulatory surgical centers, or
ASCs, in the United States. For direct sales of our tissue matrix
products, we are paid directly by hospitals and ASCs, who seek reimbursement for
surgical procedures from both private and public payers. In 2009, we
launched Strattice in our EMEA geographic region, where we have initially
contracted directly with hospitals for the use of Strattice in challenging
hernia repair and breast reconstruction. We are in the process of
seeking reimbursement for Strattice from payers in Germany and the United
Kingdom, and we plan to seek expanded reimbursement in other countries as we
continue our geographic expansion in EMEA.
We have
undertaken significant efforts to inform and educate private insurers about the
clinical efficacy and economic value associated with the use of AlloDerm in the
United States. The majority of national and regional insurers have
adopted coverage policies for the use of AlloDerm in connection with surgical
procedures, making AlloDerm more accessible in the United
States. With the launch of Strattice in the first quarter of 2008, we
initiated efforts to secure insurance coverage. Initial coverage of
Strattice has been favorable.
For the
2010 Healthcare Common Procedure Coding Systems, or HCPCS code set, we submitted
to CMS a Coding Modification Recommendation requesting an appropriate HCPCS code
for Strattice. In November 2009, CMS notified us that a new HCPCS code was
not created for Strattice and since that time we have resubmitted a new request
for a HCPCS code for Strattice. If we are successful in obtaining a code
under this new request, the code would be effective beginning in 2011.
HCPCS product codes are important to facilities for appropriate payment for
Strattice when procedures are performed in a hospital outpatient setting or in
an ASC.
|
Competition
|
Our
Regenerative Medicine products compete with autologous tissue and various
commercially available products made from synthetic materials or biologic
materials of human or animal tissue origin. Our tissue matrix
products compete with synthetic surgical mesh products marketed by such medical
device companies as Covidien, C.R. Bard Inc., Johnson & Johnson, Integra
LifeSciences Holdings Corporation, and W.L. Gore &
Associates. Our tissue matrix products also compete with
animal-derived products marketed by companies such as C.R. Bard Inc.; Cook,
Inc., Covidien, TEI Biosciences Inc., and Synovis Surgical
Innovations. Two tissue processors, Musculoskeletal Transplant
Foundation, or MTF, and RTI Biologics Inc., distribute human tissue-based
products that compete with our products. MTF distributes its products
through a direct sales force and through Synthes, Inc. and Johnson &
Johnson. RTI Biologics Inc. distributes its products through C.R.
Bard Inc. Our AlloCraftDBM product competes with other similar bone
repair products produced by companies such as RTI Biologics Inc.; Osteotech,
Inc.; AlloSource; Wright Medical Technology Inc.; IsoTis OrthoBiologics, Inc.
and MTF.
|
Sales
and Marketing
|
We
currently market tissue matrix products in the United States primarily for
abdominal wall surgery, breast reconstruction post-mastectomy, general
reconstruction and cosmetic applications through our LifeCell direct sales and
marketing organization. As of December 31, 2009, this organization
had a dedicated sales, marketing and customer service staff of approximately 200
employees, including 135 in the U.S. sales organization. LifeCell
sales representatives are responsible for interacting with plastic surgeons,
general surgeons, and head and neck surgeons to educate them regarding the use
and potential benefits of our tissue matrix products. We execute a
variety of professional medical education events including programs, national
and international conferences, trade shows, and medical symposia. We
also participate in numerous national fellowship programs. In
addition, our LifeCell and AHS sales organizations are beginning to capitalize
on synergistic opportunities involving commercialization of products used to
manage certain clinically-challenging situations, such as those involving the
open abdomen.
In
addition to our direct sales and marketing efforts, we have a number of
arrangements for the exclusive distribution of our tissue matrix
products. BioHorizons Implant Systems, Inc. is an exclusive
distributor in the United States and certain international markets of AlloDerm
for use in periodontal applications. Wright Medical Technology Inc.
is an exclusive distributor in the United States and certain international
markets for GraftJacket. Stryker Corporation is an exclusive
distributor in the U.S. for AlloCraft. Boston Scientific Corporation
is an exclusive worldwide sales and marketing agent for Repliform for use in
urogynecology. Tornier is an exclusive distributor for Conexa in the
United States and certain international markets.
|
Seasonality
|
Historically,
our Regenerative Medicine business has experienced a seasonal slowing of sales
in the third quarter of each year. This seasonality could be due to
less surgeries being performed when patients and surgeons are on
vacation. Although we do not know if our historical experience will
prove to be indicative of future periods, similar slow-downs may occur in
subsequent periods.
|
Operations
and Manufacturing
|
We
conduct our Regenerative Medicine manufacturing operations, including tissue
processing, warehousing and distribution at a single location in Branchburg, New
Jersey. We maintain inventory of our tissue matrix products for
direct sales and we periodically ship product to our distributors, which they
maintain in inventory until final sale. We maintain a comprehensive
quality assurance and quality control program, which includes documentation of
all material specifications, operating procedures, equipment maintenance, and
quality control test methods intended to comply with appropriate U.S. Food and
Drug Administration, or FDA, and ISO requirements. Demand for our
tissue matrix products Strattice and AlloDerm is significant in the United
States and we have expanded our manufacturing capabilities as a
result. In 2009, we finalized the validation of a new manufacturing
suite in our existing facility that is now fully operational. We
believe that demand for Strattice, especially larger product sizes, is likely to
increase further as we expand the number of applications, products and
geographies based on our corporate strategy. Also, demand for
AlloDerm continues to be strong in the United States in light of a demonstrated
physician preference for AlloDerm in breast reconstruction and head and neck
applications. Sales of Strattice and AlloDerm may be constrained in
the future by our ability to manufacture sufficient quantities to meet demand,
as they were in 2009. We currently believe that inventory levels of Strattice
are now sufficient to meet 2010 demand, and we expect to attain sufficient
inventory of AlloDerm by the end of the second quarter of 2010.
Our
allograft tissue matrix products are made from donated human skin
tissue. In 2009, we obtained all of our donated human cadaveric
tissue from tissue banks and organ procurement organizations in the United
States. These tissue banks and organ procurement organizations are
subject to federal and state regulations. Specifically, the National
Organ Transplant Act, or NOTA, prohibits the sale of any human organ or tissue
but permits the reasonable payment of costs associated with the removal,
transportation, implantation, processing, preservation, quality control and
storage of human tissue. We reimburse tissue banks and organ
procurement organizations for their expenses associated with the recovery,
storage and transportation of donated human skin that they provide to us for
processing. In addition, we require supplying tissue banks and organ
procurement organizations to comply with the guidelines of, and be registered
by, the FDA. NOTA does not apply to xenograft tissue products;
however, our materials and tissue suppliers are subject to extensive regulatory
requirements applicable to their operations.
Our
Regenerative Medicine business is dependent on the availability of sufficient
quantities of raw materials, including donated human cadaveric tissue, porcine
tissue and other materials required for tissue processing. We
currently receive human tissue from multiple U.S. tissue banks and organ
procurement organizations. Over the past few years, demand for our
products has increased substantially, and thus our requirements for donor tissue
have also increased substantially. Although we have numerous sources
of donated human tissue, we cannot be sure that donated human cadaveric tissue
will continue to be available at current levels or will be sufficient to meet
our future needs.
Our
xenograft tissue matrix products are made from porcine skin
tissue. Midwest Research Swine, or MRS, is our sole supplier of
porcine tissue. MRS is supplied by three separate breeding herd farms
that are isolated for biosecurity. We are currently exploring
additional supply alternatives to address our future supply requirements and
increase our supply chain security and plan to qualify a reliable second source
supplier by the third quarter of 2010. Also, we obtain from a single
supplier certain specialized solutions that are essential to the processing of
our xenograft tissue matrix products. We are exploring additional
supply alternatives to address our future supply requirements and increase our
supply chain security. We are currently in the process of building
inventory of these solutions and are currently negotiating a long-term supply
arrangement with the supplier.
THERAPEUTIC
SUPPORT SYSTEMS
|
Description
of Business
|
Our
Therapeutic Support Systems business, or TSS, originated with the introduction
of the RotoRest™ bed over 30 years ago and now includes other specialty hospital
beds, mattress replacement systems and other products. Our TSS
business is comprised of three primary surface categories: critical care, wound
care and bariatric. Our critical care products, often used in the
ICU, are designed to address pulmonary complications associated with immobility,
while our wound care surfaces are used to reduce or treat skin breakdown, and
our bariatric surfaces assist caregivers in the safe and dignified handling of
patients of size. We also market products designed to reduce the
incidence and severity of patient falls in the hospital setting. In
our TSS business, we are investing in the development and commercialization of
enhanced products designed to meet the needs of ICU patients and to reduce or
prevent “never” events such as hospital-acquired pressure ulcers, nosocomial
infections and injurious falls.
|
Products
and Clinical Applications
|
Our TSS
business offers the following clinically effective portfolio of beds, mattress
replacement systems, and other products for critical care, wound care and
bariatric care settings:
|
Care
Setting
|
Key
Products
|
Description
|
Key
Benefits
|
|||
|
Critical
Care
|
· RotoProne™
· TriaDyne
Proventa™
· TriaDyne™
II
· RotoRest™
Delta
|
· Product
offerings include proning, rotational and percussion specialty beds /
surfaces
· Beds
designed to address specific patient types in the ICU,
including:
o Pulmonary
complications (e.g., ARDS and VAP)
o Specific
mobility requirements (e.g., spinal cord injury)
· Some
ICU beds / surfaces may also have wound care features
|
· Provides
patient mobility to help treat Ventilator Acquired Pneumonia (VAP) through
continuous rotation
· Provides
therapeutic benefit for ARDS patients through prone
positioning
|
|||
|
Wound
Care
|
· TheraPulse™
ATP™
· KinAir™
products
· Spirit
Select™
· AtmosAir™
products
· First
Step™ products
· TheraKair™
products
· InterCell™
· ProfiCare™
· Innova™
products
· TheraRest™
· RIK™
Surfaces
|
· Beds
/ surfaces designed to redistribute pressure to slow the progression and
decrease the incidence of pressure wounds; these beds / surfaces also
provide pulsation, alternating pressure, and low air loss
· Most
beds / surfaces designed to provide an ideal microclimate for
skin protection and moisture control
|
· All
products provide pressure redistribution
· Some
products also manage skin microclimate (e.g., low air loss)
· Some
products reduce shear and friction (not including treatments that are
directly applied to wounds)
· Some
products provide pressure redistribution while minimizing the impact of
patient falls
|
|||
|
Bariatric
Care
|
· BariMaxx™
II
· BariAir™
· BariKare™
· MaxxAir
ETS™
|
· Provides
support for overweight and morbidly obese patients
· Some
bariatric beds / surfaces also have wound care features
· Some
products offer features to assist with mobility
|
· Beds
/ surfaces designed to support large patients weighing up to 1000 lbs and
accommodate patients up to 48” wide
· Some
products also contain wound care surfaces offering
o Pressure
redistribution
o Rotational
therapy
· Patient
transfer equipment offered, including lift systems, wheelchairs, walkers
and commodes
|
Critical
Care
The most
critically-ill patient population is generally cared for in the ICU of a
hospital, where they can receive the most intense medical treatment and
attention. Patients treated in the ICU usually suffer from serious
acute or chronic diseases or severe traumatic injuries. These
patients often have, or develop, pulmonary complications, such as ARDS,
resulting directly from their conditions or stemming from their impaired
mobility coupled with forced ventilation. Some ICU patients are in
such acute distress that their organ systems are at risk of failure and many are
on some type of life-support. Treating pulmonary complications requires special
equipment and treatment methods. Because of the aggressive and specialized
treatments required to address these life-threatening conditions, daily
patient-care costs in the ICU are high. The advanced therapies
offered by our TSS business are designed to help facilities manage patient
outcomes in the critical care setting by helping to treat and prevent pulmonary
complications associated with immobility. Our critical care therapies
consist of Kinetic Therapy, Prone Therapy and Kinetic Prone Therapy to improve
oxygenation levels and mobilization of lung secretions. We introduced
Kinetic Therapy in 1976 with the RotoRest bed; such therapy involves the
side-to-side rotation of a patient to an angle of at least 40 degrees per
side and has been shown in independent clinical studies to reduce the incidence
of certain pulmonary complications and length of stay in the
ICU. Prone Therapy involves turning a patient from the supine to
prone position (180 degrees) and often is done manually by nurses in the
ICU. Independent clinical studies have demonstrated that proning an
ICU patient improves oxygenation which is critical for the survival of ARDS
patients whose lungs have a seriously impaired ability to provide an adequate
gas exchange. Improvement of oxygenation levels can reduce ventilator
time and ICU length of stay, with more recent studies suggesting overall
improved mortality rates. We introduced Kinetic Prone Therapy in 2005
with RotoProne Therapy System and enabled the automatic proning and rotation of
a patient coupling the advantages of Kinetic Therapy and Prone
Therapy.
Wound
Care
Our
pressure relieving TSS products help manage the complications and expenses
associated with pressure ulcers by providing therapy for the treatment of
pressure sores, burns, ulcers, skin grafts, and other skin conditions as well as
helping prevent the formation of pressure sores that can develop in immobile
individuals. Our TSS products optimally redistribute the amount of
pressure on a patient's intact skin surface (prevention) or an existing wound
site (treatment) by redistributing forces away from the skin or wound site
through immersion of the patient into a medium such as air, foam, silicon beads,
or viscous fluid. Our TSS products also help to reduce shear, a major
factor in the development of pressure ulcers, by reducing the amount of friction
between the skin surface and the surface of the bed. Many of our TSS
products also provide moisture control, a major cause of maceration of the skin,
by flowing air through the support surface to the skin, keeping the skin dry and
moisture free. In addition to providing pressure-redistributing
therapy, some of our products also provide for the pulsing of air into the
surface cushions, known as Pulsation Therapy, which helps improve blood and
lymphatic flow to the skin. Some of our TSS products further promote
healing and reduce nursing time by providing an automated “wound care” turn of
at least 20 degrees per side. Our therapeutic wound care
surfaces are utilized by patients in hospitals, residents in nursing homes and
individuals in the home.
Bariatric
Care
In the
United States, the prevalence of morbidly obese patients (BMI>40) grew over
52% from the year 2000 to 2005 and super obese patients (BMI>50) saw an
increase of 75% over the same time period. In addition, obesity is now the
leading cause of preventable death in the U.S. Obese patients are
often unable to fit into standard-sized beds and wheelchairs and pose an
increased risk to themselves and caregivers. Moreover, treating obese
patients is a significant safety issue for many healthcare organizations,
causing several states and many organizations to adopt a “no lift” policy
because moving and handling obese patients increases the risk of injury to
healthcare personnel. We offer innovative solutions to help manage
the care of obese patients through a comprehensive offering of safety-focused
and therapy-driven products, education and training, which enables caregivers to
care for obese patients in a safe and dignified manner in all care settings
while complying with any applicable “no lift” policy. While our
bariatric products are generally used for patients weighing between 300 and 600
pounds, our products can accommodate patients weighing from 850 to 1,000
pounds. Our most sophisticated bariatric product can serve as a
cardiac chair, weight scale, and x-ray table; and many of our products provide
therapies like those in our wound treatment and prevention
products.
|
Customers
|
TSS sales
and rentals accounted for 15.1% of our total revenue in 2009. By
geographic region, North America and EMEA/APAC represented 65.4% and 34.6%,
respectively, of total 2009 TSS revenue. TSS is primarily a
rental-focused business, with 85.1% of TSS revenues from rentals. A
majority of TSS revenue comes from acute care facilities customers, accounting
for approximately 90% of TSS revenues. We have agreements with
numerous GPOs which negotiate rental and purchase terms on behalf of large
groups of acute care and extended care organizations. We believe that
some of our larger customers desire alternatives to rental for at least some of
their business, and we are evaluating and developing alternative models that
will meet our customers’ needs now and into the future.
Reimbursement
We have
extensive contractual relationships with hospitals and extended care facilities
for our products in our North America and EMEA geographic
regions. Acute and extended care organizations pay us directly for
our products and services. In the U.S., we have contracts with nearly
all major acute care hospital organizations and most major extended care
organizations who seek reimbursement from both private and public payers based
on the patient’s condition or diagnosis. Medicare and Medicaid
reimburse these care settings generally at prospective or fixed rates based on a
patient’s length of stay and disease complexity.
Competition
Our
primary competitors with respect to TSS products for treatment of pulmonary
complications in the ICU and wound treatment and prevention are Gaymar, Hill-Rom
Company, Huntleigh Healthcare/Getinge, Stryker Corporation and
UHS. In the bariatric market, our primary competitors are Hill-Rom
Company, Sizewise Rentals, Stryker Corporation and Huntleigh
Healthcare. We also compete on a regional, local and market segment
level with a number of other companies.
|
Sales
and Marketing
|
Our
worldwide TSS sales organization consists of approximately 200 dedicated
individuals, and we also have over 300 individuals in our sales organization
that support both our AHS and TSS business units. Because physicians
and nurses are critical to the adoption and use of our TSS products, a major
element of the sales force's responsibility is to educate and train these
medical practitioners in the application of our products, including the specific
knowledge necessary for optimal clinical outcomes and reducing the cost of
patient care. We have approximately 100 TSS clinical consultants, all
of whom are healthcare professionals, whose principal responsibilities are to
make product rounds, consult on complex cases and assist organizations and home
health agencies in developing their patient-care protocols. Our
clinicians educate acute care and extended care organizations on the use of our
products.
|
Operations
and Manufacturing
|
Through
our network of service centers, we are able to rapidly deliver, manage and
service our products at major hospitals in the United States, Canada, Australia,
New Zealand, Singapore, South Africa and most major European
countries. This extensive network is critical to securing national
contracts with GPOs. Our network also provides a platform for the
rapid introduction of new products. Our U.S. operations have a
national 24-hour, seven days-a-week customer service communications system,
which allows us to quickly and efficiently respond to our customers’
needs. In addition to delivery, pick-up and technical support
services, our service organization cleans, disinfects and reconditions products
between rentals. Our TSS business shares certain resources with the
AHS business, including our KCI Express website and approximately 1,000
employees located in San Antonio at our Advantage Center who perform functions
associated with customer service and sales administration. In the
United States, we distribute our TSS products through a network of 111 service
centers, which gives us the ability to deliver our products to any major Level I
domestic trauma center rapidly. Our international operations
distribute our TSS products through a network of 53 service
centers. These international service centers are strategically
located within the regions and countries where we market our products and
provide services similar to those provided in the U.S. market but vary by
country to ensure we meet the unique needs of our international
customers.
Our
manufacturing processes for TSS products, including mattress replacement systems
and overlays, involve producing final assemblies in accordance with a master
production plan. Assembly of our products is accomplished using metal
parts, including bed frames, plastics, electronics and other materials and
component parts that are primarily purchased from outside
suppliers. Component parts and materials are obtained from industrial
distributors, original equipment manufacturers and contract
manufacturers. The majority of parts and materials are readily
available in the open market (steel, aluminum, plastics, fabric, etc.) for which
price volatility is reasonably low. Our manufacturing processes and
quality systems are intended to comply with appropriate FDA and ISO
requirements.
INFORMATION
WITH RESPECT TO OUR BUSINESS IN GENERAL
Healthcare
Reform
In the
United States, healthcare reform legislation will most likely remain focused on
reducing the cost of healthcare. We believe that efforts by private
payers to contain costs through managed care and other methods will continue in
the future as efforts to reform the healthcare system continue. The
demand for our products and the amount we may be reimbursed for our products is
in many cases dependent on the policies of third-party payers such as Medicare,
Medicaid, private insurance and managed care organizations that reimburse us for
the sale and rental of our products.
The many
healthcare reform initiatives in the United States have caused healthcare
providers to examine their cost structures and reassess the manner in which they
provide healthcare services. This review, in turn, has led many
healthcare providers to merge or consolidate with other members of their
industry in an effort to reduce costs or achieve operating
synergies. A substantial number of our customers, including
proprietary hospital groups, GPOs, hospitals, national nursing home companies
and national home healthcare agencies, have been affected by this
consolidation. An extensive service and distribution network and a
broad product line are key to servicing the needs of these larger provider
networks. In addition, the consolidation of healthcare providers
often results in the re-negotiation of contracts and the granting of price
concessions. Finally, as GPOs and integrated healthcare systems
increase in size, each contract represents a greater concentration of market
share, and the adverse consequences of losing a particular contract
increases.
Intellectual
Property
To
protect our proprietary rights in our products, new developments, improvements
and inventions, we rely on a combination of patents, copyrights, trademarks,
trade secrets and other laws, and contractual restrictions on disclosure,
copying and transfer of title, including confidentiality agreements with
vendors, strategic partners, co-developers, employees, consultants and other
third parties. We seek patent protection in the United States and
abroad. We have approximately 200 issued U.S. patents relating to our
existing and prospective products. We also have over 230 pending U.S.
patent applications. Globally, we have over 1,300 issued patents and
over 1,300 pending patent applications. Many of our specialized beds,
medical devices and services are offered under proprietary trademarks and
service marks. We have over 85 trademarks registered with the U.S.
Patent and Trademark Office. We also have agreements with third
parties that provide for the licensing of patented and proprietary
technology.
We have
patents relating to our NPTP products, in the form of owned and licensed
patents, including over 85 issued U.S. patents and approximately 175 U.S. patent
applications pending. Our worldwide patent portfolio (including owned
and licensed patent assets) relating to our NPTP products includes more than 850
issued patents and approximately 1,100 pending patent applications, including
protection in Europe, Canada, Australia, Japan and the U.S. Most of
the V.A.C. Therapy patents in our patent portfolio have a term of 20 years
from their date of priority.
On
October 6, 1993, we entered into a license agreement with Wake Forest University
on which we rely in connection with our AHS business. Under this
agreement, Wake Forest University has licensed to us on a worldwide, exclusive
basis the right to use, lease, sell and sublicense its rights to certain patents
that are integral to the technology that we incorporate in our V.A.C. Therapy
Systems. These patents extend through late 2012 in certain
international markets and through the middle of 2014 in the United
States. The term of the agreement continues for as long as the
underlying patents are in effect, subject to Wake Forest University’s right to
terminate earlier if we fail to make required royalty payments or are otherwise
in material breach or default of the agreement.
There are
certain primary patents and patent applications that we rely upon to protect our
Regenerative Medicine technology. Three issued U.S. patents cover
methods of producing our tissue-based products. Seven additional U.S.
patents and over 20 pending U.S. patent applications supplement these patents
and cover methods and apparatus for using, preparing, preserving and
freeze-drying tissue-based products. Our Regenerative Medicine
technology also relies upon certain knowledge that we consider proprietary, and
we protect such information as trade secrets, as business confidential
information or as know-how. Additionally, we license rights to
additional technologies, some of which are protected by patents owned by
others. We also have applied for patent protection in several foreign
countries. Because of the differences in patent laws and laws
concerning proprietary rights, the extent of protection provided by U.S. patents
or proprietary rights owned by or licensed to us may differ from that of their
foreign counterparts.
We are
subject to legal proceedings involving our patents that are significant to our
business. These proceedings are discussed subsequently in "Item 3:
Legal Proceedings."
Research,
Development and Clinical Sciences
In 2009,
we continued our successful track record of advancing therapies in our AHS,
Regenerative Medicine and TSS businesses through new product introductions and
significant enhancements to existing products. Our development and
commercialization of our NPTP products, including proprietary, differentiated
disposable dressings, has established us as a leader in advanced wound care and
tissue healing. With the integration of LifeCell products, we now
offer a portfolio of tissue matrix products that are used in a variety of
surgical procedures including: breast reconstruction, abdominal wall
reconstruction, and orthopedic repair. From LifeCell, we also gained
valuable competencies in biological matrix and tissue regeneration technologies
to complement our product development efforts. Our TSS technology
originated with the introduction of the RotoRest bed over 30 years
ago. Since that time, we have continued to develop and commercialize
a broad spectrum of TSS products which have significantly enhanced patient
care. Additionally, we are committed to clinical research that
continues to demonstrate the benefits of our technologies.
We
continue to focus our efforts in developing new cost-effective products and
technologies that result in superior clinical outcomes. One of our
primary focuses for innovation is to gain greater insights into areas of high
clinical needs, where we can bring new product solutions with novel technologies
to help clinicians address these problems. In addition, we strive to
improve the value proposition of our products by increasing their clinical and
economic benefits and by improving their ease of use.
We are
devoted to the discovery, development and commercialization of innovative,
high-technology therapies and products that are designed to leverage the body’s
ability to heal, thus improving clinical outcomes while helping to reduce the
overall cost of patient care. Our current research and development
activities are accomplished through approximately 300 employees
worldwide. Significant investments in our 2009 research, development
and clinical sciences include:
|
·
|
new
products designed to simplify use and tailored to the needs of different
wound types and care settings;
|
|
·
|
new
applications of negative pressure technology and unique differentiated
dressings for other therapeutic
modalities;
|
|
·
|
development
of new surgical applications for LifeCell tissue
matrices;
|
|
·
|
research
on new technologies in wound healing and tissue
repair;
|
|
·
|
research
programs designed to expand our product line in the rapidly growing
biosurgery market, and
|
|
·
|
initiation,
execution or support of a number of clinical trials, registries,
development studies, and investigator initiated
trials.
|
Expenditures
for research and development, including clinical trials, in each of the periods
below, were as follows (dollars in thousands):
|
Year
ended December 31,
|
|||||||||||
|
2009
|
2008
|
2007
|
|||||||||
|
Research
and development spending
|
$ | 92,088 | $ | 75,839 | $ | 50,532 | |||||
|
Percentage
of total revenue
|
4.6 | % | 4.0 | % | 3.1 | % | |||||
Working
Capital Management
We
maintain inventory parts, supplies and disposables to support customer needs in
our service centers, manufacturing facilities and distribution
warehouses. We also maintain inventory for conversion to our AHS and
TSS rental fleet in our manufacturing facilities. Our AHS rental
equipment cannot be used without the disposables that support our therapy
systems. As such, we generally ship disposable inventory directly to
the customer.
Our
payment terms with acute care and extended care organizations are consistent
with industry standards and generally provide for payment within 30 days of
invoice. Our payment terms with third-party payers, including
Medicare and private insurance generally vary from 30 to 45 days, which is
consistent with industry standards and is regulated by contract and state
law. A portion of our receivables relate to unbilled revenues arising
in the normal course of business. A portion of our revenues remain
unbilled for a period of time due to monthly billing cycles requested by our
acute care or extended care organization customers or due to our internal
paperwork processing and compliance procedures regarding billing third-party
payers.
Regulatory
Matters
Regulation
of Medical Devices in the United States
The
development, manufacture, sale and distribution of our medical device products
are subject to comprehensive federal and state governmental
regulation. Most notably, all of our medical devices sold in the
United States are subject to the Federal Food, Drug, and Cosmetic Act, or FDC
Act, as implemented and enforced by the FDA. The FDA, and in some
cases other government agencies, administer requirements covering the design,
testing, safety, effectiveness, manufacturing, labeling, promotion and
advertising, distribution and post-market surveillance of our
products.
Unless an
exemption applies, each medical device that we market must first receive either
premarket notification clearance (by making a 510(k) submission) or premarket
approval (by filing a premarket approval application, or PMA) from the FDA
pursuant to the FDC Act. In addition, certain modifications made to
marketed devices also may require 510(k) clearance or approval of a PMA
supplement. The FDA’s 510(k) clearance process usually takes from
four to twelve months, but it can last longer. The process of
obtaining PMA approval is much more costly, lengthy and uncertain. It generally
takes from one to three years or even longer. We cannot be sure that
510(k) clearance or PMA approval will be obtained for any product that we
propose to market.
FDA
regulatory requirements for human allografts are complex and constantly
evolving. The FDA sets forth a test for determining whether human
cellular and tissue-based products, or HCT/P, are eligible for tissue regulation
(as opposed to medical device or biologic regulation). A product
containing human tissue may be regulated solely as a human cellular and
tissue-based product or it may also be subject to regulation as a medical device
or biologic. The FDA will apply human tissue regulation to an HCT/P
that is: (i) minimally manipulated; (ii) intended for homologous use; (iii) is
not combined with a device, drug or biologic (with limited exceptions); and (iv)
does not have a systemic effect and is not dependent upon metabolic activity for
its primary function (with certain exceptions). HCT/Ps generally may
be commercially distributed without prior FDA clearance or
approval.
We
believe that AlloDerm, GraftJacket RTM and Repliform TRM satisfy FDA
requirements to be considered HCT/P, eligible for regulation solely as human
tissue, and therefore, we have not obtained prior FDA clearance or approval for
commercial distribution of these products. AlloCraft DBM is regulated as an
HCT/P and medical device and had received 510(k) clearance. Our
xenograft products are regulated as medical devices and have all received 510(k)
clearance.
After a
device is placed on the market, numerous regulatory requirements continue to
apply. Those regulatory requirements include the following: product
listing and establishment registration; adherence to the Quality System
Regulation, or QSR, which requires stringent design, testing, control,
documentation and other quality assurance procedures; labeling requirements and
FDA prohibitions against the promotion of off-label uses or indications; adverse
event reporting; post-approval restrictions or conditions, including
post-approval study commitments; post-market surveillance requirements; the
FDA’s recall authority, whereby it can ask for, or require, the recall of
products from the market; and requirements relating to voluntary corrections or
removals.
Our
manufacturing facilities, as well as those of certain of our suppliers, are
subject to periodic and for-cause inspections to verify compliance with the QSR
as well as other regulatory requirements. If the FDA were to find
that we or certain of our suppliers have failed to comply with applicable
regulations, it could institute a wide variety of enforcement actions, ranging
from a public warning letter to more severe sanctions, such as product recalls
or seizures, monetary sanctions, consent decrees, injunctions to halt
manufacturing and distributing products, civil or criminal sanctions, refusal to
grant clearances or approvals or delays in granting such clearances or
approvals, import detentions of products made outside of the United States,
restrictions on operations or withdrawal or suspension of existing
approvals. The FDA also has the authority to request repair,
replacement or refund of the cost of any medical device manufactured or
distributed by us.
In
October 2008, LifeCell received a warning letter from the FDA identifying
certain non-compliance with Good Manufacturing Practice, or GMP, in the
manufacture of our Strattice product. This warning letter arose from
an inspection of LifeCell’s manufacturing facility in 2008 which led to
observations by the FDA identifying certain observed non-compliance with GMP in
the manufacture of Strattice and non-compliance with Good Tissue Practice, or
GTP, in the processing of AlloDerm. The FDA completed a re-inspection
of LifeCell in November 2009. The inspection included a verification of
all commitments made by LifeCell to address the items noted in the warning
letter as well as a complete Quality Systems inspection. The FDA concluded
that all items cited in the warning letter have been resolved. In
addition, the Quality Systems inspection did not result in any observed
non-compliance with GMP or GTP. The FDA requires no further action
or follow-up by LifeCell.
In
October 2009, we became aware of an investigation being conducted by the FDA
into the safety of certain power cords supplied to medical device manufacturers,
including KCI, by Electri-cord Manufacturing Company. Due to the potential
safety risks associated with the 110 volt AC power cords manufactured by
Electri-cord, we have determined to initiate a voluntary correction of specific
KCI for-sale products in order to inspect and replace the affected power
cords. Affected products include AHS and TSS products. With respect
to KCI’s AHS and TSS rental fleets, the power cord replacements will occur
during normal service cycles. KCI reported this voluntary correction to
the FDA and the agency published this action as a Class II recall in
a February 2010 enforcement report. The replacement of the
affected power cords began in 2009 and will continue in 2010, and we do not
expect this will have a material impact on our results of
operations.
In
November 2009, the FDA issued a Preliminary Public Health Notice, or PHN,
notifying caregivers and patients of potential complications associated with the
use of NPWT products. The complications cited by the FDA and the
recommendations for care-givers and patients are consistent with the labeling
and training we provide in our professional education programs. We
believe that our demonstrated commitment to the safety and efficacy of our
products is consistent with the FDA’s messaging in the PHN. In our
educational programs, we give detailed guidance to practitioners regarding the
selection of patients, contraindications, patient risk factors and the warnings
included in our labeling. In addition, all of our V.A.C. Therapy
patients receive detailed instructions on how to use our products as well as
information on possible complications, patient risk factors, and warnings
associated with using our products. These efforts, combined with our
nation-wide 24-hour clinical support and service, as well as our provision of a
continuum of care between care settings, set us apart as a leading NPWT provider
in the United States and around the world. We continue to provide our
customers with the highest level of clinical support and education to minimize
the incidence of complications associated with our products. However,
when complications associated with our products do occur, we file Medical Device
Reports with the FDA consistent with the highest standards of quality,
compliance and complaint reporting. V.A.C. Therapy is designed to
safely treat complicated wounds, often on patients with severe comorbidities;
reported complications are extremely rare. Although the FDA did not
specifically tie KCI or V.A.C. Therapy to safety issues in the PHN, we have
received and responded to several inquiries from customers and professional
associations concerned about the notice. We will continue to monitor
and respond to the concerns of our customers regarding the PHN and any similar
communications by the FDA in the future.
Regulation
of Medical Devices Outside of the United States
Medical
device laws also are in effect in many of the non-U.S. markets in which we
do business. These laws range from comprehensive device approval
requirements for some or all of our products to requests for product data or
certifications. Inspection of and controls over manufacturing, as
well as monitoring of device-related adverse events, also are components of most
of these regulatory systems. Most of our business is subject to
varying degrees of governmental regulation in the countries in which we operate,
and the general trend is toward increasingly stringent
regulation. For example, the European Commission, or EC, has
harmonized national regulations for the control of medical devices through
European Medical Device Directives with which manufacturers must comply. Under
these regulations, manufacturing plants must have received CE certification from
a “notified body” in order to be able to sell products within the member states
of the European Union. Certification allows manufacturers to stamp
the products of certified plants with a “CE” mark. Products covered by the EC
regulations that do not bear the CE mark may not be sold or distributed within
the European Union.
Human
Tissue Regulation
In
addition to the regulations applicable to our products generally, procurement of
certain human organs and tissue are subject to federal and state regulations,
such as NOTA, which prohibits the sale of any human organ or
tissue. The FDA has also issued regulations that require tissue
donors to be screened and tested for relevant communicable diseases and require
manufacturers of HCT/Ps to follow GTP in their recovery, processing, storage,
labeling, packaging and distribution of HCT/Ps in order to prevent the
introduction, transmission or spread of communicable
diseases. Moreover, the FDA has the authority to inspect our
facilities and to detain, recall or destroy our products and order us to cease
manufacturing if we fail to comply with these requirements. The FDA
regulations also require us to report adverse reactions and deviations from
donor screening and other applicable requirements.
A few but
increasing number of states including Florida, California, Oklahoma, Illinois,
New York and Maryland impose their own regulatory requirements on establishments
involved in the processing, handling, storage and distribution of human
tissue. Noncompliance with state requirements may include some or all
of the risks associated with noncompliance with FDA regulation, as well as other
risks.
The
regulation of our human tissue products outside the United States varies by
country and is complex and constantly evolving. A limited amount of
our human tissue products are currently distributed in several countries
internationally. Certain countries regulate our human tissue products
as pharmaceutical products, requiring us to make extensive filings and obtain
regulatory approvals before selling our product. Certain countries
classify our products as human tissue for transplantation but may restrict its
import or sale. Certain foreign countries have laws similar to
NOTA. These laws may restrict the amount that we can charge for our
products and may restrict our ability to export or distribute our products to
licensed not-for-profit organizations in those countries. Other
countries have no applicable regulations regarding the import or sale of human
tissue products similar to our products, creating uncertainty as to what
standards we may be required to meet. Noncompliance with foreign
country requirements may include some or all of the risks associated with
noncompliance with FDA regulation as well as other risks.
Healthcare
Laws
We are
subject to various federal, state and local laws in the United States targeting
fraud and abuse in the healthcare industry, which generally prohibit us from
soliciting, offering, receiving or paying any remuneration in order to induce
the ordering or purchasing of items or services that are in any way paid for by
Medicare, Medicaid or other government-sponsored healthcare programs. Healthcare
costs have been and continue to be a subject of study, investigation and
regulation by governmental agencies and legislative bodies around the
world. The U.S. federal government continues to scrutinize
potentially fraudulent practices affecting Medicare, Medicaid and other
government healthcare programs. Payers have become more influential
in the marketplace and increasingly are focused on drug and medical device
pricing, appropriate drug and medical device utilization and the quality and
costs of healthcare. Violations of fraud and abuse-related laws are
punishable by criminal or civil sanctions, including substantial fines,
imprisonment and exclusion from participation in healthcare programs such as
Medicare and Medicaid and health programs outside of the
United States.
Medical
Record Confidentiality and Privacy Laws
The
Health Insurance Portability and Accountability Act, or HIPAA, covers a variety
of provisions which impact our business, including the privacy of patient
healthcare information, the security of that information and the standardization
of electronic data transactions for billing. Sanctions for violating
HIPAA include criminal penalties and civil sanctions. HIPAA’s privacy
regulations restrict the use and disclosure of certain individually identifiable
protected health information, or PHI. The HIPAA security standards
require us to implement certain measures to protect the security and integrity
of electronic PHI. HIPAA regulations regarding standardization of
electronic data billing transactions also impact our business. We continue to
work with all of our business associates with whom we share PHI and who process
standardized transactions covered by the regulations in order to make the
transition to standardized billing codes as smooth as possible. However, the
healthcare industry’s continued transition to standardized billing codes may
create billing difficulties or business interruptions for us.
Other
Regulatory Requirements
We are
also subject to the U.S. Foreign Corrupt Practices Act and similar
anti-bribery laws applicable in non-U.S. jurisdictions that generally
prohibit companies and their intermediaries from making improper payments to
non-U.S. government officials for the purpose of obtaining or retaining
business. Because of the predominance of government-sponsored
healthcare systems around the world, most of our customer relationships outside
of the United States are with governmental entities and are therefore subject to
such anti-bribery laws. Our policies mandate compliance with these
anti-bribery laws. We operate in many parts of the world that have
experienced governmental corruption to some degree, and in certain circumstances
strict compliance with anti-bribery laws may conflict with local customs and
practices. In the sale, delivery and servicing of our medical devices
and software outside of the United States, we must also comply with various
export control and trade embargo laws and regulations, including those
administered by the Department of Treasury’s Office of Foreign Assets Control
and the Department of Commerce’s Bureau of Industry and Security, which may
require licenses or other authorizations for transactions relating to certain
countries and/or with certain individuals identified by the U.S.
government. Our policies require our employees to complete a training
and compliance program, and we have internal controls, policies, and procedures
aimed at providing employees with guidance related to the proper conduct of
international business.
Environmental
Matters
Our
manufacturing operations worldwide are subject to many requirements under
environmental laws. In the United States, the U.S. Environmental
Protection Agency and similar state agencies administer laws that restrict the
emission of pollutants into the air, discharges of pollutants into bodies of
water and disposal of pollutants on the ground. Violations of these
laws can result in significant civil and criminal penalties and
incarceration. The failure to obtain a permit for certain activities
may be a violation of environmental law and subject the owner and operator to
civil and criminal sanctions. Most environmental agencies also have
the power to shut down an operation if it is operating in violation of
environmental law. U.S. laws also typically allow citizens to
bring private enforcement action in some internal business
situations. Outside of the United States, the environmental laws and
their enforcement vary and may be more burdensome. For example, some European
countries impose environmental taxes or require manufacturers to take back used
products at the end of their useful life, and others restrict the materials that
manufacturers may use in their products and require redesign and labeling of
products. Although such laws do not currently have a significant
impact on our products, they are expanding rapidly in Europe. We have
management programs and processes in place that are intended to minimize the
potential for violations of these laws.
Other
environmental laws, primarily in the United States, address the contamination of
land and groundwater and require the clean-up of such
contamination. These laws may apply not only to the owner or operator
of an on-going business, but also to the owner of land contaminated by a prior
owner or operator. In addition, if a parcel is contaminated by the
release of a hazardous substance, such as through its historic use as a disposal
site, any person or company that has contributed to that contamination, whether
or not it has a legal interest in the land, may be subject to a requirement to
clean up the parcel.
Employees
We
currently have approximately 6,800 employees worldwide, the majority of whom are
located in North America. Other major concentrations of employees are
located in Europe and at our manufacturing, research and development and
engineering operations based in the United Kingdom, Ireland and
Belgium. None of our North American employees are represented by a
labor union. In various countries outside of North America, we interact with
trade unions and work councils that represent a limited number of
employees. We believe that our relationship with our employees is
generally good.
Availability
of Securities and Exchange Commission Filings
Our
annual report on Form 10-K, quarterly reports on Form 10-Q, current reports on
Form 8-K, and amendments to those reports filed or furnished pursuant to Section
13 or 15(d) of the Securities Exchange Act, as amended, are available free of
charge on our website at www.kci1.com,
as soon as reasonably practicable after we file or furnish such information with
the SEC. Information contained on our website is not incorporated by
reference to this report.
Risks
Related to Our Business
We
face significant and increasing competition, which could adversely affect our
operating results.
We face
significant and increasing competition in each of our businesses, which are
intensely competitive and are characterized by rapid technological
change. We compete with many companies, some of which have longer
operating histories, better brand or name recognition, broader product lines and
greater access to financial and other resources. Our customers
consider many factors when selecting a product, including product reliability,
clinical outcomes, product availability, price and services provided by the
manufacturer, and market share can shift as a result of technological innovation
and other business factors. Our ability to compete with other
developers of advanced therapies and technologies will depend in large part on
our ability to develop and acquire new products and technologies as well as
anticipate technology advances. Product introductions or enhancements
by competitors which have advanced technology, better features or lower pricing
may make our products or proposed products obsolete or less
competitive. Our competitive position can also be adversely affected
by product problems, physician advisories and safety alerts, reflecting the
importance of product quality in the medical device industry. For
additional information regarding our competitive positioning, see Item
1: “Business—Information Related to Business Units—Active Healing
Solutions—Competition; Regenerative Medicine—Competition; and Therapeutic
Support Systems—Competition.”
We expect
competition in our AHS business to increase over time as competitors introduce
additional products competitive with our products in the advanced wound care
market. Additionally, as some of our patents in the field of NPWT
start to expire in 2012 in certain international markets and in 2014 in the
United States we expect increased competition with products adopting basic NPWT
technologies. Our NPWT systems also compete with traditional wound
care dressings, other advanced wound care dressings, skin substitutes, products
containing growth factors and other medical devices used for wound care in the
United States and internationally. With respect to our Regenerative
Medicine business, any failure by us to adequately supply customers may give
competitors an opportunity to increase their sales to our customers, and it may
be difficult for us to win back lost accounts. In addition,
consolidation and the entrance of new low-cost competitors to our TSS business
has greatly increased competition in the United States and
abroad. These companies have competed in all areas, but most
effectively with our most price sensitive customers such as extended care
facilities, and have grown in size and scale. If we are unable to
effectively differentiate our products from those of our competitors, our market
share, sales and profitability could be adversely impacted.
If
we are unable to develop new generations of products and enhancements to
existing products, our competitive position may be harmed.
Our
success is dependent upon the successful development, introduction and
commercialization of new generations of products and enhancements to existing
products. Innovation in developing new product lines and in
developing enhancements to our existing products is required for us to grow and
compete effectively. The completion of development of any new
products remains subject to all the risks associated with the commercialization
of new products based on innovative technologies, including unanticipated
technical problems; obtaining regulatory approval of such products, if required;
manufacturing difficulties; the possibility of significantly higher development
costs than anticipated; and gaining customer acceptance. Innovation
through enhancements and new products requires significant capital commitments
and investments on our part, which we may be unable to recover.
Our
current and future products are subject to regulation by the FDA and other
national, federal and state governmental authorities. We may be
required to undertake time-consuming and costly development and clinical
activities and seek regulatory clearance or approval for expanded clinical
applications for current products and new products. Clearance and/or
approval might not be granted for a new or modified product or expanded uses of
existing products on a timely basis, if at all. Also, our
determination that our allograft products are eligible for regulation as HCT/P
is limited to their current intended uses. In the future, we may wish
to market our allograft products for new intended uses, which may be require
premarket clearance or approval under FDA medical device or biologic
regulations, which could be time consuming and costly. Applicable
regulations are subject to change as a result of legislative, administrative or
judicial action, which may further increase our costs or reduce
sales. Additionally, the FDA could prohibit distribution of existing
products for new uses until clearance or approval is obtained. We
cannot assure that clearance or approval for new uses of existing products, or
new products could be obtained in a timely fashion, or at all. Our
failure to maintain clearances or approvals for existing products or to obtain
clearance or approval for new or modified products could adversely affect our
results of operations and financial condition.
In
addition, we may be subject to intellectual property infringement claims from
individuals and companies who have acquired or developed patent portfolios in
the fields of advanced wound care, therapeutic support systems or regenerative
medicine for the purpose of developing competing products, or for the sole
purpose of asserting claims against us. Any claims that our products
or processes infringe the intellectual property rights of others, regardless of
the merit or resolution of such claims, could cause us to incur significant
costs in responding to, defending and resolving such claims, and may impair our
ability to successfully commercialize new products.
If
we are unsuccessful in protecting and maintaining our intellectual property,
particularly our rights under the exclusive license from Wake Forest University
to the patents protecting our V.A.C. Therapy Systems, our competitive position
would be harmed.
Our
ability to enforce our patents and those licensed to us, together with our other
intellectual property is subject to general litigation risks, as well as
uncertainty as to the enforceability of our intellectual property rights in
various countries. We have numerous patents on our existing products
and processes, and we file applications as appropriate for patents covering new
technologies as such technologies are developed. However, the patents
we own, or in which we have rights, may not be sufficiently broad to protect our
technology position against competitors, or may not otherwise provide us with
competitive advantages. We often retain certain knowledge that we
consider proprietary as confidential and elect to protect such information as
trade secrets, as business confidential information or as
know-how. In these cases, we rely upon trade secrets, know-how and
continuing technological innovation to maintain our competitive
position. Our intellectual property rights may not prevent other
companies from developing functionally equivalent products, developing
substantially similar proprietary processes, or otherwise gaining access to our
confidential know-how or trade secrets.
When we
seek to enforce our intellectual property rights, we may be subject to claims
that our rights are invalid, are otherwise not enforceable or are already
licensed to the party against whom we are asserting a claim. When we
assert our intellectual property rights, it is likely that the other party will
seek to assert intellectual property rights of its own against us, which may
adversely impact our business. All patents are subject to requests
for reexamination by third parties. When such requests for
reexamination are granted, some or all claims may require amendment or
cancellation. Since 2007, multiple requests for reexamination of
patents owned or licensed by KCI relating to our AHS business were granted by
the U.S. Patent and Trademark Office, or USPTO, including the Wake Forest
Patents. If we are unable to enforce our intellectual property
rights, or patent claims related to V.A.C. Therapy are altered or cancelled
through litigation or reexamination, our competitive position would be
harmed. For more information on our current intellectual property
litigation and the status of USPTO re-examination proceedings, see Item 3:
“Legal Proceedings.”
We have
agreements with third parties pursuant to which we license patented or
proprietary technologies, including the Wake Forest Patents. These
agreements commonly include royalty-bearing licenses. If we lose the
right to license technologies essential to our businesses, or the costs to
license these technologies materially increase, our businesses would
suffer.
KCI and
its affiliates are involved in multiple patent litigation suits in the United
States and Europe involving the Wake Forest Patents as well as other patents
owned or licensed by KCI, as described in Item 3: ‘‘Legal
Proceedings.” If any of our key patent claims are narrowed in scope
or found to be invalid or unenforceable, or we otherwise do not prevail, our
share of the advanced wound care market for KCI’s V.A.C. Therapy Systems could
be negatively impacted in the United States or Europe, due to increased
competition, and pricing of our therapy systems could decline significantly,
either of which would negatively affect our financial condition and results of
operations. For example, in the United Kingdom and Germany, where the
Wake Forest patents were invalidated in 2009 litigation, we have experienced
increased competition and reduced growth rates in AHS revenue as a
result. We derived approximately 51% and 53%, respectively, of total
revenue for the years ended December 31, 2009 and 2008 from our domestic NPWT
products relating to the U.S. patents at issue in ongoing U.S.
litigation. In continental Europe, we derived approximately 12% and
13%, respectively, of total revenue for the years ended December 31, 2009 and
2008 in AHS revenue relating to the patents at issue in ongoing European
litigation.
We
may not successfully identify and complete acquisitions or strategic alliances
on favorable terms or achieve anticipated synergies relating to any acquisitions
or alliances, and such acquisitions could result in unforeseen operating
difficulties and expenditures, require significant management resources, and
require significant charges or write-downs.
We
regularly review potential acquisitions of complementary businesses,
technologies, services or products, as well as potential strategic
alliances. We may be unable to find suitable acquisition candidates
or appropriate partners with which to form alliances. Even if we
identify appropriate acquisition or alliance candidates, we may be unable to
complete the acquisitions or alliances on favorable terms, if at
all. In addition, the process of integrating an acquired business,
technology, service or product into our existing operations could result in
unforeseen difficulties and expenditures. Integration of an acquired
company often requires significant expenditures as well as significant
management resources that otherwise would be available for ongoing development
of our other businesses. Moreover, we may not realize the anticipated
financial or other benefits of an acquisition or alliance. In May
2008, we completed our acquisition of LifeCell. The success of our
acquisition of LifeCell will depend, in part, on our ability to achieve the
anticipated revenue synergies and other strategic benefits from combining the
businesses of KCI and LifeCell.
We may be
required to take charges or write-downs in connection with
acquisitions. Our financial results, including earnings per share,
could be adversely affected by financial adjustments required by U.S. GAAP in
connection with our acquisition of LifeCell. To the extent the value
of goodwill or identifiable intangible assets with indefinite lives becomes
impaired, we may be required to incur material charges relating to the
impairment of those assets.
Changes
in U.S. and international reimbursement regulations, policies and rules, or
their interpretation, could reduce the reimbursement we receive for and
adversely affect the demand for our products.
The
demand for our products is highly dependent on the regulations, policies and
rules of third-party payers in the United States and internationally, including
the U.S. Medicare and Medicaid programs, as well as private insurance and
managed care organizations that reimburse us for the sale and rental of our
products. If coverage or payment regulations, policies or rules of
existing third-party payers are revised in any material way in light of
increased efforts to control healthcare spending or otherwise, the amount we may
be reimbursed or the demand for our products may decrease, or the costs of
furnishing or renting our products could increase.
In the
United States, the reimbursement of our products by Medicare is subject to
review by government contractors that administer payments under federal
healthcare programs. These contractors are delegated certain
authority to make local or regional determinations and policies for coverage and
payment of biologicals, durable medical equipment, or DME, medical devices, and
related supplies in various care settings. Adverse interpretation or
application of Medicare contractor coverage policies, adverse administrative
coverage determinations or changes in coverage policies can lead to denials of
our claims for payment and/or requests to recoup alleged overpayments made to us
for our products. Such determinations and changes can often be challenged only
through an administrative appeals process.
From time
to time, we have been engaged in dialogue with the medical directors of the
various Medicare contractors, including the Durable Medical Equipment Medicare
Administrative Contractors, or DMACs, in order to clarify local coverage
policies for our tissue matrix and NPWT products.
In some
instances relating to reimbursement of our NPWT products, the DMAC medical
directors have indicated that their interpretation of the NPWT coverage policy
differs from ours. Although we have informed the DMACs and medical directors of
our positions and billing practices, our dialogue has yet to resolve all open
issues. In the event that our interpretations of NPWT coverage
policies in effect at any given time do not prevail, we could be subject to
recoupment or refund of all or a portion of any disputed amounts as well as
penalties, which could exceed our related revenue realization reserves, and
could negatively impact our AHS revenue from Medicare placements in the United
States.
In
addition, the current Medicare NPWT coverage policy instructs the DMACs to
initially deny payment for any NPWT placements that have extended beyond four
months in the home; however, we are permitted to appeal such non-payment on a
claim-by-claim basis. As of December 31, 2009, we had approximately
$11.8 million in outstanding receivables relating to Medicare NPWT placements
that have extended beyond four months in the home, including both unbilled items
and claims where coverage or payment was initially denied. We are in the process
of submitting all unbilled claims for payment and appealing the remaining claims
through the appropriate administrative appeals processes necessary to obtain
payment. We may not be successful in collecting these
amounts. Further changes in policy or adverse determinations may
result in increases in denied claims and outstanding receivables. In
addition, if our appeals are unsuccessful and/or there are further policy
changes, we may be unable to continue to provide the same types of services that
are represented by these disputed claims in the future.
If
we are unable to obtain expanded reimbursement for our products in foreign
jurisdictions, our international expansion plans could be delayed and our plans
for growth could be negatively impacted.
The
successful global expansion of our business is dependent upon our ability to
obtain expanded reimbursement for our products in the United States and in
foreign jurisdictions. We are continuing our efforts to obtain
reimbursement for Strattice and V.A.C. Therapy systems and related disposables
in foreign jurisdictions. For V.A.C. Therapy systems and related
disposables, these efforts have resulted in varying levels of reimbursement from
private and public payers in multiple countries, mainly in the acute care
setting. In these jurisdictions and others outside the United States,
we continue to seek expanded homecare reimbursement, which we believe is
important in order to increase the demand for V.A.C. Therapy Systems and related
disposables in these markets. In Japan, our AHS commercialization
plans are dependent upon obtaining reimbursement for V.A.C. Therapy
Systems. We expect to receive reimbursement approval in Japan in the
first quarter of 2010 followed by commercial launch shortly
thereafter. In the event that we are unable to obtain reimbursement
approvals in 2010, it is likely that we would not be able to obtain acute care
reimbursement of V.A.C. Therapy in Japan until at least 2012. For our
Regenerative Medicine business, work has begun to secure appropriate coding,
coverage and reimbursement for AlloDerm in Canada, and for Strattice in the
United Kingdom and Germany. If we are unable to obtain expanded
reimbursement, our international expansion plans could be delayed and our plans
for growth could be negatively impacted. For a more detailed
discussion of our reimbursement efforts, see Item
1: “Business—Information Related to Business Units—Active Healing
Solutions—Reimbursement; and Regenerative Medicine—Reimbursement.”
U.S.
Medicare reimbursement of competitive products and the implementation of the
Medicare competitive bidding program could reduce the reimbursement we receive
and could adversely affect the demand for our V.A.C. Therapy Systems in the
United States.
From time
to time, Medicare publishes reimbursement policies and rates that may
unfavorably affect the reimbursement and market for our
products. Since 2005, Medicare has assigned NPWT reimbursement codes
to several devices being marketed to compete with V.A.C. Therapy
Systems. Due to the introduction of competitive products, CMS and
other third-party payers could attempt to reduce reimbursement rates on NPWT or
its various components through competitive bidding or otherwise, which could
negatively impact our AHS revenue from U.S. Medicare placements.
In the
future, our AHS revenue from U.S. Medicare placements of NPWT products is
expected to be subject to Medicare’s durable medical equipment competitive
bidding program. In 2008, the Medicare competitive bidding program
was delayed and significantly modified by the Medicare Improvements for Patients
and Providers Act, or MIPPA. MIPPA exempted NPWT from the first round
of competitive bidding and delayed implementation of the second round of
competitive bidding. The law also imposed a 9.5% price reduction for
all U.S. Medicare placements of our NPWT products as of January
2009. The 9.5% reduction in reimbursement resulted in lower Medicare
reimbursement levels, which negatively impacted our 2009 total revenue by
approximately 1%, compared to pre-2009 reimbursement levels. Future inclusion of
our NPWT products in the Medicare competitive bidding program could result in
increased competition and reduced reimbursement for our Medicare
placements.
Also as a
result of MIPPA, CMS was directed by HHS to conduct a comparison of products
currently included in the NPWT codes to determine if those products were
appropriately coded. CMS subsequently contracted with the Agency for
Healthcare Research and Quality, or AHRQ to conduct the technology
assessment. In May 2009, AHRQ published its final report which
concluded that there was no evidence to compare NPWT products because all of the
evidence accepted for its review was V.A.C. Therapy evidence. For
this reason, AHRQ was unable to answer the question of therapeutic distinctions
among NPWT products. At the same time, CMS posted a preliminary NPWT
coding decision for 2010 which kept the current codes for all NPWT products,
citing the AHRQ report as a basis for its decision. The final NPWT
coding decision was posted in October 2009 confirming that the current HCPCS
codes for NPWT pumps and supplies would be maintained for 2010. In
November, CMS announced that the 2010 fee schedules for the NPWT codes would
also remain the same. In the event that CMS adopts policies or
procedures that are unfavorable to us, any
resulting reduction in reimbursement could materially and adversely affect our
business and operating results.
U.S.
Medicare reimbursement changes applicable to facilities that use our products,
such as hospitals and skilled nursing facilities, could reduce the reimbursement
we receive for and adversely affect the demand for our products.
In 2006,
CMS finalized new provisions for the hospital inpatient prospective payment
system, or IPPS, which included a significant change in the manner in which it
determines the underlying relative weights used to calculate the
diagnosis-related group, or DRG, payment amount made to hospitals for certain
patient conditions. Beginning in 2007, CMS began to phase-in the use
of hospital costs rather than hospital charges for the DRG relative weight
determination. As expected, payments have increased for hospitals
serving more severely ill patients and decreased for those serving patients who
are less severely ill. The fiscal year 2009 IPPS final rule, issued
in 2008, announced the completion of the transition to the severity-adjusted
DRGs. The changes to IPPS reimbursement procedures have placed
downward pressure on prices paid by acute care hospitals to KCI and have
somewhat affected the demand for our products used for inpatient
services.
The
initiation by U.S. and foreign healthcare, safety and reimbursement agencies of
periodic inspections, assessments or studies of the products, services and
billing practices we provide could lead to reduced public reimbursement or the
inability to obtain reimbursement and could result in reduced demand for our
products.
Due to
the increased scrutiny and publicity of government efforts to contain rising
healthcare costs, we may be subject to future assessments or studies by U.S. and
foreign healthcare, safety and reimbursement agencies, which could lead to
changes in reimbursement policies that adversely affect our
business. We are also currently subject to multiple technology
assessments related to our V.A.C. Therapy Systems in foreign countries where we
conduct business. Any unfavorable results from these evaluations or
technology assessments could result in reduced reimbursement or prevent us from
obtaining reimbursement from third-party payers and could reduce the demand or
acceptance of our V.A.C. Therapy Systems.
In 2005,
the U.S. Department of Health and Human Services Office of Inspector General, or
OIG, initiated a study on NPWT. As part of the 2005 study, KCI
provided the OIG with requested copies of our billing records for Medicare
V.A.C. unit placements. In 2007, the OIG issued a report on its NPWT
study including a number of findings and recommendations to CMS. The
OIG determined that substantially all V.A.C. unit placement claims met supplier
documentation requirements; however, they were unable to conclude that the
underlying patient medical records fully supported the supplier documentation in
44% of the claims, which resulted in an OIG estimate that approximately $27
million in improper payments may have been made on NPWT claims in
2004. The purpose of the OIG report is to make recommendations for
potential Medicare program savings to CMS, but it did not constitute a formal
recoupment action. This report may result in increased audits and/or
demands by Medicare, its regional contractors and other third-party payers for
refunds or recoupments of amounts previously paid to us which could have a
material adverse effect on our financial condition and results of
operations.
In March
2009, the OIG published a report on the comparative pricing of NPWT
pumps. In that report, the OIG suggested that CMS is overpaying for
NPWT pumps because the current price is based on the price of the V.A.C. Therapy
System and did not consider the lower prices of new products added to the NPWT
category since 2005. The OIG suggested that CMS should either
competitively bid NPWT in the Second Round of DME Competitive Bidding or conduct
an inherent reasonableness assessment. Although CMS announced in
November 2009 that the fee schedule for NPWT would remain unchanged for 2010, it
is possible that CMS will elect to apply inherent reasonableness or competitive
bidding to NPWT pumps in the future, either of which could negatively impact
U.S. Medicare reimbursement of our products.
The OIG
has also reiterated that it plans to continue to review DME suppliers’ use of
certain claims modifiers to determine whether the underlying claims made
appropriate use of such modifiers when billing to Medicare. Under the
Medicare program, a DME supplier may use these modifiers to indicate that it has
the appropriate documentation on file to support its claim for
payment. Upon request, the supplier may be required to provide this
documentation; however, recent reviews by Medicare regional contractors have
indicated that some suppliers have been unable to furnish this
information. The OIG intends to continue its work to determine the
appropriateness of Medicare payments for certain DME items, including wound care
equipment, by assessing whether the suppliers’ documentation supports the claim,
whether the item was medically necessary, and/or whether the beneficiary
actually received the item. The OIG also plans to review DME that is
furnished to patients who are receiving home health services to determine
whether the DME is properly billed separately from the home health agency’s
reimbursement. In the event that these initiatives result in any
assessments with respect to KCI claims, we could be subject to material refunds,
recoupments or penalties. Such initiatives could also lead to further
changes to reimbursement or documentation requirements for our products, which
could be costly to administer. The results of U.S. or foreign
government agency studies could factor into governmental or private
reimbursement or coverage determinations for our products and could result in
changes to coverage or reimbursement rules which could reduce the amounts we
collect for our products and have a material adverse effect on our
business.
We
may be subject to claims audits that could harm our business and financial
results.
As a
healthcare supplier, we are subject to claims audits by government regulators,
contractors and private payers. Our documentation, billing and other
practices are subject to scrutiny by regulators, including claims
audits. To ensure compliance with U.S. reimbursement regulations, the
Medicare regional contractors and other government contractors periodically
conduct audits of billing practices and request medical records and other
documents to support claims submitted by us for payment of services rendered to
our customers. Such audits may also be initiated as a result of
recommendations made by government agencies, such as those in the June 2007 OIG
report. For more information on the status of ongoing claims audits,
see note 15 to our accompanying consolidated financial
statements. CMS’s Medicaid Integrity Plan, a national strategy to
detect and prevent Medicaid fraud and abuse, seeks to identify, recover and
prevent inappropriate Medicaid payments through increased review of suppliers of
Medicaid services. KCI could be subjected to such reviews in any
number of states potentially resulting in demands for refunds or assessments of
penalties against KCI, which could have a material adverse impact on our
financial condition and results of operations.
In
addition, our agreements with private payers commonly provide that payers may
conduct claims audits to ensure that our billing practices comply with their
policies. These audits can result in delays in obtaining
reimbursement, denials of claims, or demands for significant refunds or
recoupments of amounts previously paid to us.
We
could be subject to governmental investigations regarding the submission of
claims for payment for items and services furnished to federal and state
healthcare program beneficiaries.
There are
numerous rules and requirements governing the submission of claims for payment
to federal and state healthcare programs. In many cases, these rules
and regulations are not very clear and have not been interpreted on any official
basis by government authorities. If we fail to adhere to these
requirements, the government could allege we are not entitled to payment for
certain claims and may seek to recoup past payments
made. Governmental authorities could also take the position that
claims we have submitted for payment violate the federal False Claims
Act. The recoupment of alleged overpayments and/or the imposition of
penalties or exclusions under the federal False Claims Act or similar state
provisions could result in a significant loss of reimbursement and/or the
payment of significant fines and may have a material adverse effect on our
operating results. Even if we were ultimately to prevail, an
investigation by governmental authorities of the submission of widespread claims
in non-compliance with applicable rules and requirements could have a material
adverse impact on our business as the costs of addressing such investigations
could be significant.
In
February 2009, we received a subpoena from the OIG seeking records regarding our
billing practices under the local coverage policies of the four regional DMACs.
In response to the request, we have produced substantial documentation to the
OIG and have met with the U.S. Department of Justice and continue to assist the
government in its review. The government made additional informal
requests in November and December 2009, and we are currently in discussions with
the government regarding the scope of its inquiries. We have not been
advised of and cannot predict the time frame in which the government’s
investigation will be resolved nor the impact the findings may have on our
results of operations or our financial position. For a description of
other risks relating to governmental review and investigation of our businesses,
see each of the risk factors entitled “The initiation by U.S. and foreign
healthcare, safety and reimbursement agencies of periodic inspections,
assessments or studies of the products, services and billing practices we
provide could lead to reduced public reimbursement or the inability to obtain
reimbursement and could result in reduced demand for our products;”
“We may be subject to claims
audits that could harm our business and financial results;” and “We could be subject to governmental
investigations under the Anti-Kickback Statute, the Stark Law, the federal False
Claims Act or similar state laws with respect to our business arrangements with
prescribing physicians and other healthcare professionals.”
We
could be subject to governmental investigations under the Anti-Kickback Statute,
the Stark Law, the federal False Claims Act or similar state laws with respect
to our business arrangements with prescribing physicians and other healthcare
professionals.
We are
subject to various federal, state and foreign laws pertaining to healthcare
pricing and fraud and abuse, including prohibitions on kickbacks and the
submission of false claims and restrictions on relationships with physicians and
other referral sources. We have numerous business arrangements with
physicians and other potential referral sources. Although we believe
these arrangements or the remuneration provided thereunder in no way violate the
federal Anti-Kickback Statute, the Stark Law or similar state laws, governmental
authorities could attempt to take the position that one or more of these
arrangements, or the payments or other remuneration provided thereunder,
violates these statutes or laws. In addition, if any of our
arrangements were found to violate such laws, federal authorities or
whistleblowers could take the position that our submission of claims for payment
to a federal healthcare program for items or services realized as a result of
such violations also violates the federal False Claims
Act. Imposition of penalties or exclusions for violations of the
Anti-Kickback Statute, the Stark Law or similar state laws could result in a
significant loss of reimbursement and may have a material adverse effect on our
financial condition and results of operations. Even the assertion of
a violation under any of these provisions could have a material adverse effect
on our financial condition and results of operations.
Failure
of any of our clinical studies or third-party assessments to demonstrate desired
outcomes in proposed endpoints may reduce physician usage or result in pricing
pressures which could have a negative impact on business
performance.
We
regularly conduct clinical studies designed to test a variety of endpoints
associated with product performance and use across a number of
applications. If, as a result of poor design, implementation or
otherwise, a clinical study conducted by us or others fails to demonstrate
statistically significant results supporting performance or use benefits or cost
effectiveness of our products, physicians may elect not to use our products as a
treatment for conditions that may benefit from them. Furthermore, in
the event of an adverse clinical study outcome, our products may not achieve
“standard-of-care” designations, where they exist, for the conditions in
question, which could deter the adoption of our products. If we are
unable to develop a body of statistically significant evidence from our clinical
study program, whether due to adverse results or the inability to complete
properly designed studies, domestic and international public and private payers
could refuse to cover our products, limit the manner in which they cover our
products, or reduce the price they are willing to pay or reimburse for our
products. In the case of a pre-approval study or a study required by
a regulatory body as a condition of approval, a regulatory body can revoke,
modify or deny approval of the product in question.
Our
business is partly dependent on major contracts with group purchasing
organizations, or GPOs, and integrated delivery networks, or
IDNs. Our relationships with these organizations pose several
risks.
Our
products can be contracted under national tenders or with larger hospital
GPOs. The healthcare industry has been consolidating, and as a
result, transactions with customers are larger and more complex. The
purchasing power of these larger customers has increased, and may continue to
increase, generating downward pressure on product pricing. The majority of our
AHS and TSS U.S. hospital sales and rentals are made pursuant to contracts with
GPOs. At any given time, we are typically at various stages of
responding to bids and negotiating and renewing expiring GPO
agreements. Failure to be included in certain of these agreements
could have a material adverse effect on our business, including sales and rental
revenues. The contracting practices of GPOs change frequently to meet
the needs of their member hospitals. An emerging trend is for GPOs to
offer committed programs or standardization programs, where one supplier may be
chosen to serve designated members that elect to participate in the
program. Participation by us in such programs may require increased
discounting, and failure to participate or be selected for participation in such
programs may result in a reduction of sales to the member
hospitals. In addition, the industry is showing an increased focus on
contracting directly with health systems or IDNs (which typically represents
influential members and owners of GPOs). IDNs and health systems
often make key purchasing decisions and have influence over the GPO’s contract
decisions. This presents an opportunity to have more contracts
directly with customers, but customers may request additional discounts or
enhancements. GPOs, IDNs and large health care providers have
communicated that their member hospitals have limited access to capital, and
they have increased their focus on pricing and on limiting price
increases. Some of our sales contracts contain restrictions on our
ability to raise prices, therefore limiting our ability, in the short-term, to
respond to significant increases in raw material prices or other
factors.
Because
we depend upon a limited group of suppliers and, in some cases, exclusive
suppliers for products essential to our business, we may incur significant
product development costs and experience material delivery delays if we lose any
significant supplier, which could materially impact our rental and sales of AHS,
Regenerative Medicine and TSS products.
For all
three of our business units, we obtain some of our finished products and
components from a limited group of suppliers, and we purchase certain supplies
from single sources for reasons of quality assurance, cost-effectiveness,
availability, or constraints resulting from regulatory
requirements. While we work closely with suppliers to assure
continuity of supply and maintain high quality and reliability, these efforts
may not be successful. Manufacturing disruptions experienced by our
suppliers may jeopardize our supply of finished products and
components. A change in suppliers could require significant effort or
investment in circumstances where the items supplied are integral to product
performance or incorporate unique technology. Any casualty, natural
disaster or other significant disruption of any of our sole-source suppliers’
operations, or any unexpected loss of any existing exclusive supply contract
could have a material adverse effect on our business. For more
information regarding our sole-source supply arrangements, see Item
1: “Business—Information Related to Business Units—Active Healing
Solutions—Operations and Manufacturing; Regenerative Medicine—Operations and
Manufacturing; and Therapeutic Support Systems—Operations and
Manufacturing.”
Any
shortfall in our ability to procure unprocessed tissue or manufacture Strattice
and AlloDerm in sufficient quantities to meet market demand would negatively
impact our growth.
Demand
for our tissue matrix products is significant and increasing in the United
States, and we have expanded our manufacturing capabilities to meet this
demand. In 2009, we finalized the validation of a new manufacturing
suite in our existing facility that is now fully operational. We
believe that demand for Strattice is likely to increase further during our
planned expansion into additional EMEA countries. Also, demand growth
for AlloDerm continues to be strong in the U.S. in light of a demonstrated
physician preference for AlloDerm in breast reconstruction
applications. Sales of Strattice and AlloDerm may be constrained in
the future by our ability to manufacture sufficient quantities to meet demand,
as they were in 2009. We believe the Regenerative Medicine revenue
growth rate in the second half of 2009 was negatively impacted by approximately
3% to 4% due to AlloDerm and Strattice supply constraints compared to the prior
year. We currently expect that inventory levels of Strattice will be
sufficient to meet demand beginning in the first quarter of 2010 and by end of
second quarter 2010 for AlloDerm. However, any inability to
manufacture sufficient quantities of our products to meet demand in the future
could have a material adverse effect on our Regenerative Medicine
business. For more information respecting our procurement of tissue
for our AlloDerm and Strattice products, see Item
1: “Business—Information Related to Business Units—Regenerative
Medicine—Operations and Manufacturing.”
If
a natural or man-made disaster strikes our manufacturing facilities, we will be
unable to manufacture our products for a substantial amount of time and our
sales and profitability will decline.
Our
facilities and the manufacturing equipment we use to produce our products would
be costly to replace and could require substantial lead-time to repair or
replace. The manufacture of all of our Regenerative Medicine products
is conducted exclusively at our sole manufacturing facility in Branchburg, New
Jersey, where we completed validation of a new manufacturing suite that became
operational in the first quarter of 2009. The manufacture of our AHS
disposable supplies is conducted at our manufacturing facility in Athlone,
Ireland and the manufacturing facility of Avail Medical Products, Inc., one of
our third-party suppliers, in Mexico. Any temporary or permanent
facility shut-down caused by casualty (property damage caused by fire or other
perils), regulatory action, or other unexpected interruptions could cause a
significant disruption in our ability to supply our Regenerative Medicine
products or AHS products, which would impair our Regenerative Medicine or AHS
revenue growth, respectively. We take precautions to safeguard the
facilities, including security, health and safety protocols and off-site backup
and storage of electronic data. Additionally, we maintain property
insurance that includes coverage for business interruption. However,
a natural disaster such as a fire or flood could affect our ability to maintain
ongoing operations and cause us to incur additional
expenses. Insurance coverage may not be adequate to fully cover
losses in any particular case. Accordingly, damage to a facility or
other property due to fire, flood or other natural disaster or casualty event
could materially and adversely affect our revenues and results of
operations.
We
may not be able to maintain our competitive advantages if we are not able to
attract and retain key personnel.
Our
success depends to a significant extent on our ability to attract and retain key
members of our executive, technical, sales, marketing and engineering
staff. While we have taken steps to retain such key personnel, there
can be no assurance that we will be able to retain the services of individuals
whose knowledge and skills are important to our businesses. Our
success also depends on our ability to prospectively attract, expand, integrate,
train and retain qualified management, technical, sales, marketing and
engineering personnel. Because the competition for qualified
personnel is intense, costs related to compensation and retention could increase
significantly in the future.
Our
international business operations are subject to risks, including risks arising
from currency exchange rate fluctuations, which could adversely affect our
operating results.
Our
operations outside the United States, which represented approximately $490.0
million, or 24.6%, of our total revenue for the year ended December 31, 2009 and
$525.2 million, or 28.0%, of our total revenue for the year ended December 31,
2008, are subject to certain legal, regulatory, social, political, and economic
risks inherent in international business operations, including, but not limited
to:
|
·
|
less
stringent protection of intellectual property in some countries outside
the United States;
|
|
·
|
trade
protection measures and import and export licensing
requirements;
|
|
·
|
changes
in foreign regulatory requirements and tax
laws;
|
|
·
|
violations
of the Foreign Corrupt Practices Act of 1977, and similar local commercial
bribery and anti-corruption laws in the foreign jurisdictions in which we
do business;
|
|
·
|
changes
in foreign medical reimbursement programs and policies, and other
healthcare reforms;
|
|
·
|
political
and economic instability;
|
|
·
|
complex
tax and cash management issues;
|
|
·
|
potential
tax costs associated with repatriating cash from our non-U.S.
subsidiaries; and
|
|
·
|
longer-term
receivables than are typical in the United States, and greater difficulty
of collecting receivables in certain foreign
jurisdictions.
|
Because a
significant portion of our business is conducted outside the United States, we
face exposure to adverse movements in foreign currency exchange rates related to
the value of the U.S. dollar. While we enter into foreign currency exchange
contracts designed to reduce the short-term impact of foreign currency
fluctuations, we cannot eliminate the risk, which may adversely affect our
expected results.
If
we fail to comply with the extensive array of laws and regulations that apply to
our business, we could suffer civil or criminal penalties or be required to make
significant changes to our operations that could reduce our revenue and
profitability.
We are
required to comply with extensive and complex laws and regulations at the
federal, state and local government levels relating to among other
things:
|
·
|
billing
practices;
|
|
·
|
product
pricing and price reporting;
|
|
·
|
quality
of medical equipment and services and qualifications of
personnel;
|
|
·
|
confidentiality,
maintenance and security of patient medical
records;
|
|
·
|
marketing
and advertising, and related fees and expenses paid;
and
|
|
·
|
business
arrangements with other providers and suppliers of healthcare
services.
|
For
example, HIPAA defines two new federal crimes: (i) healthcare fraud and (ii)
false statements relating to healthcare matters, the violation of which may
result in fines, imprisonment, or exclusion from government healthcare
programs. Further, under separate statutes, any improper submission
of claims for payment, causing any claims to be submitted that are “not provided
as claimed,” or improper price reporting for products, may lead to civil
monetary penalties, criminal fines and imprisonment, and/or exclusion from
participation in Medicare, Medicaid and other federally funded state health
programs. We are subject to numerous other laws and regulations, the
application of which could have a material adverse impact on our operating
results.
We
are subject to regulation by the FDA and its foreign counterparts that could
materially reduce the demand for and limit our ability to distribute our
products and could cause us to incur significant compliance costs.
The
production and marketing of substantially all of our products and our ongoing
research and development activities are subject to regulation by the FDA and its
foreign counterparts. Complying with FDA requirements and other
applicable regulations imposes significant costs on our
operations. If we fail to comply with applicable regulations or if
postmarket safety issues arise, we could be subject to enforcement sanctions,
our promotional practices may be restricted, and our marketed products could be
subject to recall or otherwise impacted. Each of these potential
actions could result in a material adverse effect on our operating
results.
In
November 2009, the FDA issued a Preliminary Public Health Notice, or PHN,
notifying caregivers and patients of potential complications associated with the
use of NPWT products. The complications cited by the FDA and the
recommendations for care-givers and patients are consistent with the labeling
and training we provide in our professional education
programs. Although the FDA did not specifically tie KCI or V.A.C.
Therapy to safety issues in the PHN, it is possible that that the FDA’s recent
focus on NPWT safety could lead to future inspections of our AHS quality systems
by the FDA or its foreign counterparts. It is also possible that the
PHN or future communications by the FDA regarding safety concerns related to
NPWT could negatively impact demand for our products, which could have a
material adverse effect on our operating results. For more
information regarding the PHN, see Item 1: “Business—Information with
Respect to our Business in General—Regulatory Matters.”
In
addition, new FDA guidance and new and amended regulations that regulate the way
we do business may occasionally result in increased compliance
costs. In 2006, the FDA published notice of its intent to implement
new dimensional requirements for hospital bed side rails that may require us to
change the size of openings in new side rails for some of our surface
products. Over time, related market demands might also require us to
retrofit products in our existing rental fleet, and more extensive product
modifications might be required if the FDA decides to eliminate certain
exemptions in their proposed guidelines. In 2007, standardization
agencies in Europe and Canada adopted the revised standard, IEC 60601, requiring
labeling and electro-magnetic compatibility modifications to several product
lines in order for them to remain state-of-the-art. Listing bodies in
the United States are expected to adopt similar revised standards in
2010. Each of these revised standards will entail increased costs
relating to compliance with the new mandatory requirements that could adversely
affect our operating results.
Adverse
changes in general domestic and global economic conditions and instability and
disruption of credit markets could adversely affect our operating results,
financial condition or liquidity.
We are
subject to risks arising from adverse changes in general domestic and global
economic conditions, including recession or economic slowdown and disruption of
credit markets. The credit and capital markets experienced extreme volatility
and disruption over the past year, leading to recessionary conditions and
depressed levels of consumer and commercial spending. These
recessionary conditions have caused customers to reduce, modify, delay or cancel
plans to purchase our products and services. While recent indicators
suggest modest improvement in the United States and global economy, we cannot
predict the timing or extent of any economic recovery or the extent to which our
customers will return to more normalized spending behaviors. If the
recessionary conditions continue or worsen, we would expect our customers to
further scrutinize costs resulting from pressures on operating margin due to
rising supply costs, reduced investment income and philanthropic giving,
increased interest expense, reimbursement pressure, reduced elective health care
spending and uncompensated care. In addition, the general economic
uncertainties may decrease the demand for elective surgeries, and consequently,
the demand for our products, which are partly dependent upon hospital census, or
the number of patients being treated in hospitals, whether due to elective or
non-elective procedures.
Further
disruption in the credit markets could impede our access to capital, which could
be further adversely affected if we are unable to maintain our current credit
ratings. Should we have limited access to additional financing sources, we may
need to defer capital expenditures or seek other sources of liquidity, which may
not be available to us on acceptable terms if at all. Similarly, if
our suppliers face challenges in obtaining credit or other financial
difficulties, they may be unable to provide the materials required to
manufacture our products.
All of
these factors related to the global economic situation, which are beyond our
control, could negatively impact our business, results of operations, financial
condition and liquidity.
We
are exposed to product liability claims which may materially and adversely
affect our revenues and results of operations.
Our
businesses expose us to product liability risks inherent in the testing,
manufacturing, marketing and use of medical products. We maintain
product liability insurance; however, we cannot be certain that (1) the level of
insurance will provide adequate coverage against potential liabilities, (2) the
type of claim will be covered by the terms of the insurance coverage, (3)
adequate product liability insurance will continue to be available in the
future, or (4) the insurance can be maintained on acceptable
terms. The legal expenses associated with defending against product
liability claims and the obligation to pay a product liability claim in excess
of available insurance coverage would increase operating expenses and could
materially and adversely affect our results of operations and financial
position.
AlloDerm,
GraftJacket, AlloCraft DBM and Repliform TRM contain donated human cadaveric
tissue. The implantation of tissue products derived from donated cadaveric
tissue creates the potential for transmission of communicable disease. LifeCell is accredited by
the American Association of Tissue Banks and voluntarily complies with its
guidelines. LifeCell and its tissue suppliers are registered with and regulated
by the FDA and state regulatory bodies. These regulations have strict
requirements for testing donors to prevent communicable disease transmission.
However, there can be no assurance that our tissue suppliers will comply with
such regulations intended to prevent communicable disease transmission, or even
if such compliance is achieved, that our products have not been or will not be
associated with disease transmission, or a patient otherwise infected with
disease would not erroneously assert a claim that the use of our products
resulted in disease transmission. LifeCell is currently named
as a defendant in a number of lawsuits that are related to the distribution of
its products, including multiple lawsuits relating to certain human-tissue based
products because the organization that recovered the tissue, Biomedical Tissue
Services, Ltd., may not have followed FDA requirements for donor consent and/or
screening to determine if risk factors for communicable diseases existed.
Although we intend to defend against these actions, there can be no assurance
that we will prevail. Any actual or alleged transmission of
communicable disease could result in patient claims, litigation, distraction of
management’s attention and potentially increased expenses. As a
result, such actions or claims could potentially harm our reputation with our
customers and disrupt our ability to market our products, which may materially
and adversely affect our results of operations and financial
condition.
The
National Organ Transplant Act, or NOTA, could be interpreted in a way that could
reduce our revenues and income in the future.
Procurement
of certain human organs and tissue for transplantation is subject to the
restrictions of NOTA, which prohibits the sale of any human organ or tissue, but
permits the reasonable payment of costs associated with the removal,
transportation, implantation, processing, preservation, quality control and
storage of human tissue, including skin. We reimburse tissue banks
for expenses incurred that are associated with the recovery and transportation
of donated cadaveric human skin that the tissue bank processes and
distributes. In addition to amounts paid to tissue banks to reimburse
them for their expenses associated with the procurement and transportation of
human skin, we include in our pricing structure certain costs associated with
tissue processing, tissue preservation, quality control and storage of the
tissue, and marketing and medical education expenses.
NOTA
payment allowances may be interpreted to limit the amount of costs and expenses
that we may recover in our pricing for our products, thereby negatively
impacting our future revenues and profitability. If we are found to
have violated NOTA’s prohibition on the sale of human tissue, we also are
potentially subject to criminal enforcement sanctions which may materially and
adversely affect our results of operations.
Risks
Related to Our Capital Structure
Our
indebtedness will limit our financial flexibility.
Our
indebtedness as of December 31, 2009 was approximately $1.3 billion. The term
loan portion of our credit facilities has a required scheduled amortization,
with the percentage to be amortized increasing over the term of the loan, as
well as a requirement to use a portion of excess cash, as defined, to pay down
the debt. Our leverage is higher than KCI’s and LifeCell’s combined
previously-existing leverage. As a result of the increase in debt, demands on
our cash resources for debt service have increased, which could have the effect
of: reducing funds available to us for our operations and general corporate
purposes or for capital expenditures as a result of the dedication of a
substantial portion of our consolidated cash flow from operations to the payment
of principal and interest on our indebtedness; and increasing our vulnerability
to a general economic downturn or a significant reduction in the prices paid for
the our products caused by the coverage or reimbursement decisions of
third-party payers such as Medicare and private insurance. The increased debt
service obligations may place us at a competitive disadvantage compared to our
competitors with less debt, affecting our ability to obtain additional financing
in the future for refinancing indebtedness, acquisitions, working capital,
capital expenditures or other purposes, and subjecting us to the risks of higher
interest rates.
Restrictive
covenants in our credit facilities may restrict our ability to pursue our
business strategies.
Our
credit facilities contain limitations on our ability, among other things,
to:
|
·
|
incur
additional indebtedness or contingent
obligations;
|
|
·
|
pay
dividends or make distributions to our
shareholders;
|
|
·
|
repurchase
or redeem our stock;
|
|
·
|
repurchase
our Convertible Senior Notes;
|
|
·
|
make
investments;
|
|
·
|
grant
liens;
|
|
·
|
enter
into transactions with our shareholders and
affiliates;
|
|
·
|
sell
assets; and
|
|
·
|
acquire
the assets of, or merge or consolidate with, other
companies.
|
Our
credit facilities contain financial covenants requiring us to meet certain
leverage and interest coverage ratios. We may not be able to maintain these
ratios. As of December 31, 2009, we were in compliance with all
covenants under the senior credit agreement.
Our
credit facilities may impair our ability to finance future operations or capital
needs, or to enter into acquisitions or joint ventures or engage in other
favorable business activities.
If we are
unable to generate sufficient cash flow or otherwise obtain funds necessary to
make required payments under our new credit facilities or if we are unable to
maintain the financial ratios or otherwise fail to comply with the terms under
our new credit facilities, we will be in default under the agreements, which
could, in turn, cause a default under any other debt obligations that we may
incur from time to time. If we default under our credit facilities, the lenders
could require immediate repayment of the entire principal. If those lenders
require immediate repayment, we may not be able to repay them which could result
in the foreclosure of substantially all of our assets.
Our
3.25% convertible senior notes due 2015 (the “Convertible Notes”) and
corresponding warrant transactions may result in a dilution in our
earnings per share, and the conversion of these Convertible Notes and the
exercise of the related warrant transactions may, under certain circumstances,
dilute the ownership interest of existing shareholders.
During
the second quarter of 2008, we closed our offering of $690 million aggregate
principal amount of the Convertible Notes. Holders of our Convertible
Notes may, under certain circumstances, convert the Convertible Notes into cash,
and if applicable, shares of our common stock at the applicable conversion rate,
at any time on or prior to maturity. If the price of our common stock
exceeds the conversion price, initially $51.34 per share, the Convertible Notes
will cause a dilution in our reported earnings per share. A
conversion of some or all of the Convertible Notes will also dilute the
ownership interests of existing shareholders. In addition, the
anticipated conversion of the notes into shares of our common stock could
depress the price of our common stock.
Concurrently
with the issuance of the Convertible Notes, we entered into warrant transactions
with affiliates of the initial purchasers of the notes. Upon
exercise, the holder is entitled to purchase one share of KCI common stock for
the strike price of approximately $60.41 per share, which was approximately 50%
higher than the closing price of KCI’s common stock on April 15,
2008. These warrant transactions could separately have a dilutive
effect on our earnings per share to the extent that the market price per share
of our common stock exceeds the strike price of the warrants. Upon
the exercise of the warrants, if we elect to settle in net shares this will also
dilute the ownership interests of existing shareholders.
ITEM 1B.
UNRESOLVED
STAFF COMMENTS
None.
ITEM
2.
PROPERTIES
Our
principal offices are leased to us and are located in San Antonio, Texas. In
addition, we lease office space in San Antonio, Texas that is used for our
customer service center, our research and development and medical facility, our
information technology personnel and training, and for general corporate
purposes. We conduct domestic manufacturing, shipping, receiving,
repair, engineering and storage activities at facilities in San Antonio, Texas,
which we own. We also lease two storage facilities in San
Antonio. Throughout the U.S., we also lease approximately 111
domestic service centers.
We
conduct our Regenerative Medicine manufacturing operations, including tissue
processing, warehousing and distribution at a single location in Branchburg, New
Jersey. We lease the facility, which includes office, laboratory,
manufacturing and warehouse space. In addition, we lease additional
warehouse and laboratory space in Readington, New Jersey.
Our
international corporate office is located in Amstelveen, the Netherlands.
Internationally, we lease 53 service centers. International
manufacturing, research and development and engineering operations are based in
the United Kingdom, Ireland and Belgium. The plant in Athlone,
Ireland manufactures our V.A.C. Therapy units and now also manufactures certain
V.A.C. disposable products for our global markets. In addition, the Ireland
plant manages third-party manufacturers, global purchasing, supplier agreements
and distribution of our V.A.C. Therapy products.
We
believe that all buildings, machinery and equipment are in good condition,
suitable for their purposes and are maintained on a basis consistent with sound
operations and that our current facilities will be adequate to meet our needs
for 2010.
The
following is a summary of our primary facilities:
|
Owned
|
||||||
|
Location
|
Description
|
Segment
|
or
Leased
|
|||
|
KCI
Tower – San Antonio, TX
|
Corporate
Headquarters
|
Shared
Services
|
Leased
|
|||
|
KCI
Plaza – San Antonio, TX
|
Corporate
Offices
|
Shared
Services
|
Leased
|
|||
|
KCI
Manufacturing – San Antonio, TX
|
Manufacturing
Plant and Repair Services
|
AHS
and TSS
|
100%
Owned
|
|||
|
KCI
North IV - San Antonio, TX
|
Customer
Service Center
|
AHS
and TSS
|
Leased
|
|||
|
KCI
North V - San Antonio, TX
|
R&D
and Medical Facility
|
AHS
and TSS
|
Leased
|
|||
|
KCI
North VI - San Antonio, TX
|
Billings
& Collections
|
AHS
and TSS
|
Leased
|
|||
|
KCI
North VII - San Antonio, TX
|
Information
Technology Personnel
|
Shared
Services
|
Leased
|
|||
|
LifeCell
– Branchburg, NJ
|
LifeCell
Corporate Offices, Operations and
Manufacturing
|
Regenerative
Medicine
|
Leased
|
|||
|
Parktoren
– Amstelveen, The Netherlands
|
International
Corporate Headquarters and
Training
|
Shared
Services
|
Leased
|
|||
|
KCII
R&D - Dorset, United Kingdom
|
R&D
and Administrative Offices
|
AHS
|
Leased
|
|||
|
KCII
Manufacturing – Athlone, Ireland
|
Manufacturing
Plant
|
AHS
|
Leased
|
|||
|
KCII
Manufacturing – Peer, Belgium
|
Manufacturing
Plant
|
AHS
|
Leased
|
Patent
Litigation
Although
it is not possible to reliably predict the outcome of U.S. and foreign patent
litigation described below, we believe that each of the patents involved in
litigation are valid and enforceable and that our patent infringement claims are
meritorious. However, if any of our key patent claims were narrowed
in scope or found to be invalid or unenforceable, or we otherwise do not
prevail, our share of the advanced wound care market for our V.A.C. Therapy
Systems could be significantly reduced in the United States or Europe, due to
increased competition, and pricing of V.A.C. Therapy Systems could decline
significantly, either of which would negatively affect our financial condition
and results of operations. We derived approximately 51% and 53% of
total revenue for the years ended December 31, 2009 and 2008, respectively, from
our domestic NPWT products relating to the U.S. patents at issue. In
continental Europe, we derived approximately 12% and 13% of total revenue for
the years ended December 31, 2009 and 2008, respectively, from AHS revenue
relating to the patents at issue in the ongoing litigation in Germany, France
and the United Kingdom.
U.S.
NPWT Patent Litigation
KCI and
its affiliates, together with Wake Forest University Health Sciences, or Wake
Forest, are involved in multiple patent infringement suits involving patents
licensed exclusively to KCI by Wake Forest. In 2006, a U.S. Federal
District Court jury found that the Wake Forest patents involved in NPWT
litigation with BlueSky Medical and Medela were valid and enforceable, but that
the patent claims at issue were not infringed by a gauze-based device marketed
by BlueSky Medical. On appeal, the U.S. Court of Appeals for the
Federal Circuit affirmed the decision of the District Court in 2009, upholding
the validity of the patents at issue and the non-infringement
finding. Medela filed a petition for certiorari with the U.S.
Supreme Court challenging the Federal Circuit’s ruling, which was denied in
November 2009.
In May
2007, KCI, its affiliates and Wake Forest filed two related patent infringement
suits: one case against Smith & Nephew and BlueSky and a second case against
Medela, for the manufacture, use and sale of negative pressure devices which we
believe infringe patents licensed exclusively to KCI by Wake
Forest. These cases are being heard in the Federal District Court for
the Western District of Texas. As of the filing date of this
document, the case against Smith & Nephew is currently at
trial. By mutual agreement, the case against Medela will be tried at
a later time.
Related
to the Smith & Nephew litigation, the USPTO has issued certificates of
re-examination and office actions confirming the validity of three separate
patents licensed to KCI by Wake Forest University Health Sciences in
re-examination proceedings. The patents associated with these
decisions include U.S. Patent Nos. 5,636,643 (“the ‘643 Patent”), 5,645,081
(“the ‘081 Patent”), and 7,216,651 (“the ‘651 Patent”), which all relate to
KCI’s NPWT technologies. The USPTO issued certificates of
re-examination affirming the validity of key claims in the ‘643 Patent and the
‘081 Patent. The USPTO also issued a formal Office action confirming
the validity of all claims in the ‘651 Patent. Smith & Nephew has
appealed the Office action of the ‘651 Patent re-examination. The ‘651 Patent
re-examination remains subject to further proceedings in the USPTO.
In
September 2007, KCI and two affiliates were named in a declaratory judgment
action filed in the Federal District Court for the District of Delaware by
Innovative Therapies, Inc., or ITI. In that case, the plaintiff has
alleged the invalidity or unenforceability of four patents licensed to KCI by
Wake Forest and one patent owned by KCI relating to V.A.C. Therapy, and has
requested a finding that products made by the plaintiff do not infringe the
patents at issue. In 2008, the District Court dismissed ITI’s suit
based on a lack of subject matter jurisdiction. ITI has appealed the
dismissal of the suit and oral arguments were heard by the Federal Circuit Court
of Appeals in September 2009.
In
January 2008, KCI, its affiliates and Wake Forest filed a patent infringement
lawsuit against ITI in the U.S. District Court for the Middle District of North
Carolina. The federal complaint alleges that a NPWT device introduced
by ITI in 2007 infringes three Wake Forest patents which are exclusively
licensed to KCI. We are seeking damages and injunctive relief in the
case. Also in January and June of 2008, KCI and its affiliates filed
separate suits in state District Court in Bexar County, Texas, against ITI and
several of its principals, all of whom are former employees of
KCI. The claims in the state court suits include breach of
confidentiality agreements, conversion of KCI technology, theft of trade secrets
and conspiracy. We are seeking damages and injunctive relief in the
state court cases.
In
December 2008, KCI, its affiliates and Wake Forest filed a patent infringement
lawsuit against Boehringer Wound Systems, LLC, Boehringer Technologies, LP, and
Convatec, Inc. in the U.S. District Court for the Middle District of North
Carolina. The federal complaint alleges that an NPWT device
manufactured by Boehringer and commercialized by Convatec infringes Wake Forest
patents which are exclusively licensed to KCI. In February 2009, the
defendants filed their answer, which includes affirmative defenses and
counterclaims alleging non-infringement and invalidity of the Wake Forest
patents.
International
NPWT Patent Litigation
In June
2007, Medela filed a patent nullity suit in the German Federal Patent Court
against Wake Forest’s German patent corresponding to European Patent No.
EP0620720 (“the ‘720 Patent”), which is licensed to KCI. In March
2008 and February 2009, Mölnlycke Health Care AB and Smith & Nephew,
respectively, joined the nullity suit against the ‘720 Patent. In
March 2009, the German Federal Patent Court ruled the German patent
corresponding to the ‘720 Patent invalid. KCI and Wake Forest have
appealed that decision and the ‘720 patent remains valid and enforceable until a
final ruling on appeal.
In June
2007, Medela also filed a patent nullity suit in the German Federal Patent Court
against Wake Forest’s German patent corresponding to European Patent No.
EP0688189 (“the ‘189 Patent”), which is licensed to KCI. In May 2009,
the German Federal Patent Court ruled that the ‘189 Patent is valid as
granted.
In March
2008, Mölnlycke Health Care AB filed suit in the United Kingdom alleging
invalidity of the United Kingdom patent corresponding to the ‘720
Patent. Following a trial in July 2009, the trial court ruled the
United Kingdom patent corresponding to the ‘720 Patent invalid. Wake
Forest and KCI have appealed that decision.
In
December 2008, KCI and its affiliates filed a patent infringement lawsuit
against Smith & Nephew in the United Kingdom requesting preliminary and
interim injunctive relief based on the United Kingdom patent corresponding to
the ‘720 patent. A trial on infringement and validity of the patent
in the United Kingdom was held in March 2009. In May 2009, a judgment
was issued by the Court in which it determined that certain claims of the ‘720
Patent covering the use of foam dressing kits with NPWT systems were valid and
infringed by Smith & Nephew's foam-based NPWT dressing kits. The
court held that other claims under the patent were invalid. The
Court’s judgment extended a previously-issued injunction. Smith &
Nephew appealed the ruling and in July 2009, the Court of Appeal ruled the
claims at issue invalid and lifted the injunction in the United
Kingdom. KCI may be required to pay damages for the period of
injunction. In February 2010, KCI was denied permission to appeal by
the United Kingdom Supreme Court.
In March
2009, KCI and its affiliates filed a patent infringement lawsuit against Smith
& Nephew in the Federal Court of Australia, requesting preliminary
injunctive relief to prohibit the commercialization of a Smith & Nephew
negative pressure wound therapy dressing kit. The Federal Court
issued a temporary injunction in the case, which was subsequently overturned by
the Full Court of Federal Court of Australia. A full trial on
validity and infringement of the Wake Forest patent involved in the case is
expected in the summer of 2010.
In March
2009, KCI's German subsidiary filed a request for a preliminary injunction with
the German District Court of Düsseldorf to prevent commercialization of a Smith
& Nephew negative pressure wound therapy system that KCI believes infringes
the German counterpart of its European Patent No. EP0777504 (“the ‘504
Patent”). Following a hearing in July 2009 on this matter, the Court
denied KCI’s request. Also, in April 2009, KCI's German subsidiary
filed a patent infringement lawsuit against Smith & Nephew, GmbH Germany in
the German District Court of Mannheim. The lawsuit alleges that the
negative pressure wound therapy systems commercialized by Smith & Nephew
infringe the ‘504 Patent and another German patent owned by KCI corresponding to
European Patent No. EP0853950 (“the ‘950 Patent”). A trial was held
in October 2009 on the ‘504 Patent claims, after which the Court dismissed KCI’s
claims. A trial on KCI’s ‘950 Patent claims was temporarily adjourned
and is scheduled to resume in March 2010 after additional briefing by the
parties.
In July
2009, KCI and its affiliates filed a request for a preliminary injunction with
the Paris District Court in France to prevent commercialization of Smith &
Nephew’s NPWT system that KCI believes infringes the French counterpart of the
‘504 Patent. A hearing on KCI’s request for preliminary injunction
was held in October 2009 in France. In November 2009, the Paris
District Court denied KCI’s request for a preliminary injunction. A
trial on the matter is expected in early to mid 2011. Also in July
2009, KCI and its affiliates filed patent infringement lawsuits against Smith
& Nephew in the United Kingdom and its affiliates in France alleging
infringement of the ‘504 Patent and the ‘950 Patent in those
countries. KCI has withdrawn its request for a preliminary injunction
in the United Kingdom based on the ‘504 Patent and the ‘950 Patent and is
proceeding to trial in March 2010.
LifeCell
Litigation
In
September 2005, LifeCell recalled certain human-tissue based products because
the organization that recovered the tissue, Biomedical Tissue Services, Ltd., or
BTS, may not have followed FDA requirements for donor consent and/or screening
to determine if risk factors for communicable diseases
existed. LifeCell promptly notified the FDA and all relevant
hospitals and medical professionals. LifeCell did not receive any
donor tissue from BTS after September 2005. LifeCell has been named,
along with BTS and many other defendants, in lawsuits relating to the BTS donor
irregularities. These lawsuits generally fall within three
categories, (1) recipients of BTS tissue who claim actual injury, (2) suits
filed by recipients of BTS tissue seeking medical monitoring and/or damages for
emotional distress (categories (1) and (2) are collectively referred to herein
as “recipient cases”), (3) suits filed by family members of tissue donors who
did not authorize BTS to donate tissue (“family cases”).
In the
first category, LifeCell has been named in three cases filed in the State Court
of New Jersey and approximately seven cases in New Jersey Federal Court in which
the plaintiffs allege to have contracted a disease from BTS’s
tissue. The seven cases in the Federal Court were administratively
stayed pending an appeal filed by plaintiffs in other recipient cases that were
dismissed. The State Court cases are in discovery.
In the
second category, LifeCell has been named in more than twenty suits in which the
plaintiffs do not allege that they have contracted a disease or suffered
physical injury, but instead seek medical monitoring and/or damages for
emotional distress. Seventeen of those cases which were consolidated
in New Jersey Federal District Court as part of a Multi-District Litigation, or
MDL, were dismissed on December 10, 2008, and are now the subject of an appeal
by plaintiffs. The balance of those were filed in State Court in New
Jersey. On April 3, 2009, six of the State Court cases were
dismissed. On June 12, 2009, the remaining five State Court cases
were dismissed. All 11 cases are now on appeal.
In the
third category, approximately twenty suits have been filed by family members of
tissue donors seeking damages for emotional distress. Three of those
are in the MDL. The other family cases have been filed in state
courts in New Jersey and Pennsylvania. Many of these cases improperly
name LifeCell as a defendant as LifeCell did not receive any tissue from the
decedent donor. Voluntary dismissals have been obtained in many of
those cases. The balance of the family cases are in
discovery.
Although
it is not possible to reliably predict the outcome of the BTS-related
litigation, we believe that our defenses to the claims are meritorious and will
defend them vigorously. LifeCell insurance policies covering the
BTS-related claims, which were assumed in our acquisition of LifeCell, should
cover the majority of litigation expenses, settlement costs and damage awards,
if any, in the recipient cases.
We are
party to several additional lawsuits arising in the ordinary course of our
business. Additionally, the manufacturing and marketing of medical
products necessarily entails an inherent risk of product liability
claims.
None.
AND ISSUER PURCHASES OF
EQUITY SECURITIES
(a) Our
common stock has traded on the New York Stock Exchange under the symbol "KCI"
since February 24, 2004, the date of our initial public offering. The
following table sets forth, for the periods indicated, the high and low sales
prices for our common stock as reported by the New York Stock
Exchange:
|
2009
|
High
|
Low
|
|||||
|
First
Quarter
|
$ | 27.43 | $ | 18.20 | |||
|
Second
Quarter
|
$ | 29.37 | $ | 20.42 | |||
|
Third
Quarter
|
$ | 37.46 | $ | 25.05 | |||
|
Fourth
Quarter
|
$ | 39.25 | $ | 32.83 | |||
|
2008
|
High
|
Low
|
|||||
|
First
Quarter
|
$ | 54.80 | $ | 40.90 | |||
|
Second
Quarter
|
$ | 51.49 | $ | 37.39 | |||
|
Third
Quarter
|
$ | 43.02 | $ | 27.57 | |||
|
Fourth
Quarter
|
$ | 29.69 | $ | 17.86 | |||
On
February 19, 2010, the last reported sale price of our common stock on the New
York Stock Exchange was $41.56 per share. As of February 19, 2010,
there were approximately 532 shareholders of record of our common
stock.
We do not
currently pay cash dividends on our common stock. Any future payment of cash
dividends on our common stock will be at the discretion of our Board of
Directors and will depend upon our results of operations, earnings, capital
requirements, contractual restrictions and other factors deemed relevant by our
board. Our Board of Directors currently intends to retain any future
earnings to support our operations and to finance the growth and development of
our business and does not intend to declare or pay cash dividends on our common
stock for the foreseeable future. In addition, our senior credit
agreement limits our ability to declare or pay dividends on, or repurchase or
redeem, any of our outstanding equity securities. For
more information regarding the restrictions under our Senior Credit Agreement,
see "Management’s Discussion & Analysis of Financial Condition and Results
of Operations—Liquidity and Capital Resources—Senior Credit
Facility."
(b) None.
(c) Purchases
of Equity Securities by KCI (dollars in thousands, except per share
amounts):
|
Period
|
Total
Number of Shares Purchased (1)
|
Average
Price Paid per Share
|
Total
Number of Shares Purchased as Part of Publicly Announced
Program (2)
|
Approximate
Dollar Value of Shares That May Yet be Purchased Under the
Program (2)
|
|||||||
|
October
1 – 31, 2009
|
94 | $ | 37.54 | N/A | $ | N/A | |||||
|
November
1 – 30, 2009
|
34,699 | $ | 33.66 | N/A | $ | N/A | |||||
|
December
1 – 31, 2009
|
143 | $ | 36.49 | N/A | $ | N/A | |||||
|
Total
|
34,936 | $ | 33.68 | N/A | $ | N/A | |||||
|
|
|||||||||||
|
(1)
Shares
purchased and retired in connection with the withholding of shares to
satisfy
minimum tax withholding obligations upon vesting of previously issued
shares of restricted common stock.
(2)
The
share repurchase program authorized by the Board of Directors in October
2008 expired September 30, 2009, and no further share repurchase program
has been authorized.
|
|||||||||||
STOCK
PERFORMANCE GRAPH
The
following graph shows the change in our cumulative total shareholder return
since December 31, 2004 based upon the market price of our common stock,
compared with: (a) the cumulative total return on the Standard &
Poor’s 500 Large Cap Index and (b) the Standard & Poor’s
Healthcare Equipment Index. The graph assumes a total initial
investment of $100 as of December 31, 2004, and shows a "Total Return" that
assumes reinvestment of dividends, if any, and is based on market capitalization
at the beginning of each period. The performance on the following
graph is not necessarily indicative of future stock price
performance.
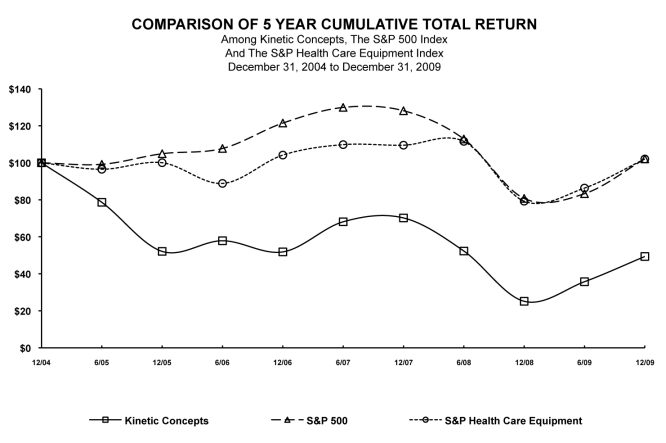
| 12/04 | 6/05 | 12/05 | 6/06 | 12/06 | 6/07 | 12/07 | 6/08 | 12/08 | 6/09 | 12/09 | ||||||||||||
|
Kinetic
Concepts
|
100.00 | 78.64 | 52.11 | 57.86 | 51.83 | 68.11 | 70.20 | 52.31 | 25.14 | 35.71 | 49.34 | |||||||||||
|
S&P
500
|
100.00 | 99.19 | 104.91 | 107.75 | 121.48 | 129.94 | 128.16 | 112.89 | 80.74 | 83.30 | 102.11 | |||||||||||
|
S&P
Health Care Equipment
|
100.00 | 96.51 | 100.05 | 88.86 | 104.18 | 109.83 | 109.52 | 111.59 | 79.25 | 86.34 | 102.06 |
The
following tables summarize our consolidated financial data for the periods
presented. You should read the following financial information
together with the information under "Management's Discussion and Analysis of
Financial Condition and Results of Operations" and our consolidated financial
statements and the notes to those consolidated financial statements appearing
elsewhere in this report. The selected consolidated balance sheet
data for fiscal years 2009 and 2008 and the selected consolidated statement of
earnings data for fiscal years 2009, 2008 and 2007 are derived from our audited
consolidated financial statements included elsewhere in this
report. The selected consolidated statement of earnings data for
fiscal years 2006 and 2005 and the selected consolidated balance sheet data for
fiscal years 2007, 2006 and 2005 are derived from our audited consolidated
financial statements not included in this report. Reclassifications
have been made to our results from prior years to conform to our current
presentation (in thousands, except per share data).
|
Year
Ended December 31,
|
||||||||||||||||||||
|
2009
|
2008
(1)
|
2007
|
2006
|
2005
|
||||||||||||||||
|
Consolidated
Statement of Earnings Data:
|
||||||||||||||||||||
|
Revenue:
|
||||||||||||||||||||
|
Rental
|
$ | 1,178,138 | $ | 1,199,778 | $ | 1,146,544 | $ | 979,669 | $ | 858,098 | ||||||||||
|
Sales
|
814,506 | 678,131 | 463,400 | 391,967 | 350,458 | |||||||||||||||
|
Total
revenue
|
1,992,644 | 1,877,909 | 1,609,944 | 1,371,636 | 1,208,556 | |||||||||||||||
|
Rental
expenses (2)
|
667,440 | 715,152 | 672,617 | 597,454 | 519,880 | |||||||||||||||
|
Cost
of sales (2)
|
244,784 | 218,503 | 145,611 | 120,492 | 115,069 | |||||||||||||||
|
Gross
profit
|
1,080,420 | 944,254 | 791,716 | 653,690 | 573,607 | |||||||||||||||
|
Selling,
general and administrative expenses (2)
|
505,214 | 433,331 | 368,878 | 307,754 | 261,989 | |||||||||||||||
|
Research
and development expenses
|
92,088 | 75,839 | 50,532 | 36,694 | 30,614 | |||||||||||||||
|
Acquired
intangible asset amortization
|
40,634 | 25,001 | - | - | - | |||||||||||||||
|
In-process
research and development
|
- | 61,571 | - | - | - | |||||||||||||||
|
Litigation
settlement expense (3)
|
- | - | - | - | 72,000 | |||||||||||||||
|
Operating
earnings
|
442,484 | 348,512 | 372,306 | 309,242 | 209,004 | |||||||||||||||
|
Interest
income and other
|
819 | 6,101 | 6,154 | 4,717 | 4,189 | |||||||||||||||
|
Interest
expense (4)
|
(104,918 | ) | (80,753 | ) | (19,883 | ) | (20,333 | ) | (25,152 | ) | ||||||||||
|
Foreign
currency gain (loss)
|
(4,004 | ) | 1,308 | (624 | ) | (1,580 | ) | (2,958 | ) | |||||||||||
|
Earnings
before income taxes
|
334,381 | 275,168 | 357,953 | 292,046 | 185,083 | |||||||||||||||
|
Income
taxes
|
105,679 | 108,724 | 120,809 | 96,578 | 62,928 | |||||||||||||||
|
Net
earnings
|
$ | 228,702 | $ | 166,444 | $ | 237,144 | $ | 195,468 | $ | 122,155 | ||||||||||
|
Net earnings per share:
|
||||||||||||||||||||
|
Basic
|
$ | 3.26 | $ | 2.33 | $ | 3.34 | $ | 2.76 | $ | 1.76 | ||||||||||
|
Diluted
|
$ | 3.24 | $ | 2.32 | $ | 3.31 | $ | 2.69 | $ | 1.67 | ||||||||||
|
Weighted
average shares outstanding:
|
||||||||||||||||||||
|
Basic
|
70,110 | 71,464 | 70,975 | 70,732 | 69,404 | |||||||||||||||
|
Diluted
(5)
|
70,542 | 71,785 | 71,674 | 72,652 | 73,024 | |||||||||||||||
|
As
of December 31,
|
||||||||||||||||||||
|
2009
|
2008 (1)
|
2007
|
2006
|
2005
|
||||||||||||||||
|
Consolidated
Balance Sheet Data:
|
||||||||||||||||||||
|
Cash
and cash equivalents
|
$ | 263,157 | $ | 247,767 | $ | 265,993 | $ | 107,146 | $ | 123,383 | ||||||||||
|
Working
capital
|
417,327 | 405,205 | 482,301 | 280,940 | 242,121 | |||||||||||||||
|
Total
assets
|
3,038,565 | 3,003,452 | 1,057,585 | 842,442 | 762,111 | |||||||||||||||
|
Total
debt (6)
|
1,306,493 | 1,515,776 | 68,592 | 208,249 | 295,934 | |||||||||||||||
|
Total
shareholders' equity
|
1,177,471 | 903,370 | 677,020 | 356,213 | 191,466 | |||||||||||||||
|
|
||||||||||||||||||||
|
(1) Amounts include the impact of our acquisition of LifeCell Corporation
in May 2008.
(2) Amounts
for fiscal years 2009, 2008, 2007 and 2006 include share-based
compensation expense recorded as required by the “Compensation-Stock
Compensation” Topic of the FASB Accounting Standards Codification.
See Note 1(u) to our consolidated financial
statements.
(3) Amount
for 2005 includes the litigation settlement with Novamedix Limited of
$72.0 million, net of previously-recorded reserves of $3.0
million.
(4) Amount
for fiscal year 2007 includes $7.6 million in expense for the
redemption premium paid in connection with the redemption of our
previously-existing 7 ⅜% senior subordinated notes combined with the write
off of unamortized debt issuance costs associated with the
previously-existing senior credit facility.
(5) Potentially
dilutive stock options and restricted stock totaling 5,836 shares, 4,977
shares, 1,779 shares, 3,241 shares and 595 shares for fiscal years 2009,
2008, 2007, 2006, and 2005, respectively, were excluded from the
computation of diluted weighted average shares outstanding due to their
antidilutive effect.
(6)
Total
debt equals current and long-term debt and capital lease
obligations.
|
||||||||||||||||||||
ITEM
7.
MANAGEMENT’S DISCUSSION AND ANALYSIS OF FINANCIAL CONDITION
AND
RESULTS OF
OPERATIONS
The
following discussion should be read in conjunction with the consolidated
financial statements and accompanying notes included in this
report. The following discussion contains forward-looking statements
that reflect our plans, estimates and beliefs. Our actual results
could differ materially from those discussed in the forward-looking
statements. Factors that could cause or contribute to these
differences include, but are not limited to, those discussed in our “Risk
Factors” (Part I, Item 1A).
GENERAL
Kinetic
Concepts, Inc., or KCI, is a leading global medical technology company devoted
to the discovery, development, manufacture and marketing of innovative,
high-technology therapies and products that have been designed to leverage the
body’s ability to heal, thus improving clinical outcomes while helping to reduce
the overall cost of patient care. We have an infrastructure designed
to meet the specific needs of medical professionals and patients across all
healthcare settings, including acute care hospitals, extended care organizations
and patients’ homes, both in the United States and abroad. Our
primary business units serve the advanced wound care, regenerative medicine and
therapeutic support system markets.
|
·
|
Our
Active Healing Solutions business, or AHS, is focused on the development
and commercialization of advanced wound care therapies based on our
Negative Pressure Technology Platform, or NPTP, which employs negative
pressure to elicit a bioresponse in a variety of wound types to promote
wound healing through unique mechanisms of action and to speed recovery
times while reducing the overall cost of treating patients with complex
wounds. NPTP comprises three primary product categories:
Negative Pressure Wound Therapy, or NPWT, Negative Pressure Surgical
Management, or NPSM, and Negative Pressure Regenerative Medicine, or
NPRM. NPWT, through our V.A.C. Therapy portfolio, currently
represents the primary source of revenue for the AHS
business. In the U.S. acute care setting, we bill our customers
directly for the rental and sale of our products. In the U.S.
homecare setting, we provide products and services to patients in the home
and bill third-party payers directly. We continue to develop
and commercialize new products and therapies in NPSM and NPRM to diversify
our NPTP revenue streams.
|
|
·
|
Our
Regenerative Medicine business is primarily comprised of the operations of
our wholly-owned subsidiary, LifeCell. LifeCell is focused on
the development and commercialization of regenerative and reconstructive
acellular tissue matrices for use in reconstructive, orthopedic, and
urogynecologic surgical procedures to repair soft tissue defects, as well
as for reconstructive and cosmetic procedures. Existing products
include our human-based AlloDerm and porcine-based Strattice in various
configurations designed to meet the needs of patients and
caregivers. The majority of our Regenerative Medicine revenue is
generated from the clinical applications of challenging hernia repair and
post-mastectomy breast reconstruction, which revenue is generated
primarily in the United States in the acute care setting on a direct
billing basis. We continue efforts to penetrate markets with our
other current products while developing and commercializing additional
tissue matrix products and applications to expand into new markets and
geographies.
|
|
·
|
Our
Therapeutic Support Systems business, or TSS, is focused on
commercializing specialized therapeutic support systems, including
hospital beds, mattress replacement systems and overlays. Our
TSS business is comprised of three primary surface categories: critical
care, wound care and bariatric. Our critical care products,
often used in the ICU are designed to address pulmonary complications
associated with immobility; our wound care surfaces are used to reduce or
treat skin breakdown; and our bariatric surfaces assist caregivers in the
safe and dignified handling of patients of size. We also have
products designed to reduce the incidence and severity of patient falls in
the hospital setting.
|
We are
principally engaged in the rental and sale of our products throughout the United
States and in 20 primary countries internationally. We currently have
approximately 6,800 employees worldwide. We are headquartered in San
Antonio, Texas and our international corporate office is located in Amstelveen,
the Netherlands. We have research and development facilities in the
United States and the United Kingdom, and we maintain manufacturing and
engineering operations in the United States, the United Kingdom, Ireland and
Belgium.
During
the first quarter of 2009, we changed our operating unit reporting structure to
correspond with our current management structure, including the reclassification
of prior-period amounts to conform to this current reporting
structure. Under our current management structure, we manage our
business by each of our three business units. All three of our
business units are supported by shared services, which include Finance, Legal,
Human Resources, and Information Technology.
Operations
for our North America geographic region accounted for 77.6% of our fiscal 2009
revenue, while our EMEA/APAC operations represented 22.4% of total
revenue. A significant majority of our revenue is generated by our
AHS business unit, which accounted for approximately 70.6% of total revenue for
the fiscal year ended December 31, 2009, compared to 74.2% for the same period
in 2008. We derive our revenue primarily from the rental of our
therapy systems and the sale of related disposables. The sale of our
Regenerative Medicine products accounted for 14.3% and 8.4% of our total revenue
for the fiscal years ended December 31, 2009 and 2008,
respectively. Our TSS business accounted for approximately 15.1% and
17.4% of our total revenue for the fiscal years ended December 31, 2009 and
2008, respectively.
Historically,
we have experienced a seasonal slowing of AHS unit growth beginning in the
fourth quarter and continuing into the first quarter, which we believe has been
caused by year-end clinical treatment patterns, such as the postponement of
elective surgeries and increased discharges of individuals from the acute care
setting around the winter holidays. Regenerative Medicine has also
historically experienced a similar seasonal slowing of sales in the third
quarter of each year. Although we do not know if our historical
experience will prove to be indicative of future periods, similar slow-downs may
occur in subsequent periods.
RESULTS OF
OPERATIONS
During
the first quarter of 2009, we changed our operating segment reporting structure
to correspond with our current management structure. For 2009, we are
reporting financial results consistent with this new structure. We
have three reportable operating segments which correspond to our three business
units: AHS; Regenerative Medicine; and TSS. We have two
primary geographic regions: North America, which is comprised of the United
States, Canada and Puerto Rico; and EMEA/APAC, which is comprised principally of
Europe and includes the Middle East, Africa and the Asia Pacific
region. Revenues for each of our geographic regions in which we
operate are disclosed for each of our business units. The results of
our Regenerative Medicine operating segment have been included in our
consolidated financial statements since the LifeCell acquisition
date.
Year
ended December 31, 2009 compared to Year ended December 31, 2008
Revenue
by Operating Segment
The
following table sets forth, for the periods indicated, business unit revenue by
geographic region, as well as the percentage change in each line item, comparing
2009 to 2008 (dollars in thousands):
|
Year
ended December 31,
|
||||||||||||
|
%
|
||||||||||||
|
2009
|
2008
|
Change
|
||||||||||
|
AHS
revenue:
|
||||||||||||
|
North
America
|
$ | 1,066,124 | $ | 1,049,215 | 1.6 | % | ||||||
|
EMEA/APAC
|
340,451 | 344,735 | (1.2 | ) | ||||||||
|
Total
– AHS
|
1,406,575 | 1,393,950 | 0.9 | |||||||||
|
Regenerative
Medicine revenue:
|
||||||||||||
|
North
America
|
284,075 | 156,837 | 81.1 | |||||||||
|
EMEA/APAC
|
1,823 | - | - | |||||||||
|
Total
–Regenerative Medicine
|
285,898 | 156,837 | 82.3 | |||||||||
|
TSS
revenue:
|
||||||||||||
|
North
America
|
196,354 | 221,684 | (11.4 | ) | ||||||||
|
EMEA/APAC
|
103,817 | 105,438 | (1.5 | ) | ||||||||
|
Total
– TSS
|
300,171 | 327,122 | (8.2 | ) | ||||||||
|
Total
revenue
|
$ | 1,992,644 | $ | 1,877,909 | 6.1 | % | ||||||
For
additional discussion on segment and operation information, see Note 17 to our
accompanying consolidated financial statements.
Revenue
by Geography
The
following table sets forth, for the periods indicated, rental and sales revenue
by geography, as well as the percentage change in each line item, comparing 2009
to 2008 (dollars in thousands):
|
Year
ended December 31,
|
||||||||||||
|
%
|
||||||||||||
|
2009
|
2008
|
Change
|
||||||||||
|
North
America revenue:
|
||||||||||||
|
Rental
|
$ | 930,638 | $ | 943,951 | (1.4 | )% | ||||||
|
Sales
|
615,915 | 483,785 | 27.3 | |||||||||
|
Total
– North America
|
1,546,553 | 1,427,736 | 8.3 | |||||||||
|
EMEA/APAC
revenue:
|
||||||||||||
|
Rental
|
247,500 | 255,827 | (3.3 | ) | ||||||||
|
Sales
|
198,591 | 194,346 | 2.2 | |||||||||
|
Total
– EMEA/APAC
|
446,091 | 450,173 | (0.9 | ) | ||||||||
|
Total
rental revenue
|
1,178,138 | 1,199,778 | (1.8 | ) | ||||||||
|
Total
sales revenue
|
814,506 | 678,131 | 20.1 | |||||||||
|
Total
revenue
|
$ | 1,992,644 | $ | 1,877,909 | 6.1 | % | ||||||
The
growth in total revenue over the prior year was due primarily to revenues
associated with our acquisition of LifeCell in May 2008 and increased rental and
sales volumes for AHS systems and related disposables. Foreign
currency exchange rate movements negatively impacted total revenue and EMEA/APAC
revenue by 1.6% and 5.7%, respectively, for 2009 compared to the prior
year.
Revenue
Relationship
The
following table sets forth, for the periods indicated, the percentage
relationship of each item to total revenue in the period, as well as the changes
in each line item, comparing 2009 to 2008:
|
Year
ended December 31,
|
|||||||
|
2009
|
2008
|
Change
|
|||||
|
AHS
revenue
|
70.6 | % | 74.2 | % |
(360
bps)
|
||
|
Regenerative
Medicine revenue
|
14.3 | 8.4 |
590
bps
|
||||
|
TSS
revenue
|
15.1 | 17.4 |
(230
bps)
|
||||
|
Total
revenue
|
100.0 | % | 100.0 | % | |||
|
North
America revenue
|
77.6 | 76.0 |
160
bps
|
||||
|
EMEA/APAC
revenue
|
22.4 | 24.0 |
(160
bps)
|
||||
|
Total
revenue
|
100.0 | % | 100.0 | % | |||
|
Rental
revenue
|
59.1 | % | 63.9 | % |
(480
bps)
|
||
|
Sales
revenue
|
40.9 | 36.1 |
480
bps
|
||||
|
Total
revenue
|
100.0 | % | 100.0 | % | |||
AHS
Revenue
The
following table sets forth, for the periods indicated, AHS rental and sales
revenue by geography, as well as the percentage change in each line item,
comparing 2009 to 2008 (dollars in thousands):
|
Year
ended December 31,
|
||||||||||||
|
%
|
||||||||||||
|
2009
|
2008
|
Change
|
||||||||||
|
North
America revenue:
|
||||||||||||
|
Rental
|
$ | 757,745 | $ | 755,868 | 0.2 | % | ||||||
|
Sales
|
308,379 | 293,347 | 5.1 | |||||||||
|
Total
– North America
|
1,066,124 | 1,049,215 | 1.6 | |||||||||
|
EMEA/APAC
revenue:
|
||||||||||||
|
Rental
|
164,950 | 169,658 | (2.8 | ) | ||||||||
|
Sales
|
175,501 | 175,077 | 0.2 | |||||||||
|
Total
– EMEA/APAC revenue
|
340,451 | 344,735 | (1.2 | ) | ||||||||
|
Total
rental revenue
|
922,695 | 925,526 | (0.3 | ) | ||||||||
|
Total
sales revenue
|
483,880 | 468,424 | 3.3 | |||||||||
|
Total
AHS revenue
|
$ | 1,406,575 | $ | 1,393,950 | 0.9 | % | ||||||
The
growth in North America AHS revenue over the prior-year period was due primarily
to continued market penetration and increased therapy unit sales
activity. Average North America rental unit volume during 2009
increased 4.3% over 2008, due to continued market penetration, partly offset by
reduced treatment periods and a lower average realized price due to payer mix
and lower Medicare pricing.
Foreign
currency exchange rate movements unfavorably impacted EMEA/APAC AHS revenue by
5.9% for 2009 compared to 2008. EMEA/APAC AHS revenue, excluding the
impact of foreign currency exchange rate movements, increased due primarily to
rental unit volumes which increased 14.4% for 2009 and an overall increase in
AHS disposable sales associated with the increase in AHS rental unit
volumes. Higher EMEA/APAC unit volume was partially offset by lower
realized pricing compared to the prior-year period due primarily to lower
contracted pricing resulting from an increase in long-term rental contracts, GPO
pricing pressures, continued economic weakness and increased
competition.
Regenerative
Medicine Revenue
LifeCell’s
revenue since May 2008, the acquisition date, has been included in our
consolidated financial statements. The following table reflects
Regenerative Medicine revenue by product included in our consolidated statements
of earnings during 2009 and 2008 and the unaudited pro forma revenue as though
the acquisition of LifeCell had occurred as of the beginning of 2008 (dollars in
thousands):
|
Year
ended December 31,
|
||||||||||||
|
Pro
|
||||||||||||
|
Forma
|
||||||||||||
|
2009
|
2008
|
2008
|
||||||||||
|
(unaudited)
|
||||||||||||
|
AlloDerm
|
$ | 173,996 | $ | 114,173 | $ | 186,495 | ||||||
|
Strattice
|
89,198 | 27,949 | 31,383 | |||||||||
|
Orthopedic,
urogynecologic and other products
|
22,704 | 14,715 | 23,952 | |||||||||
|
Total
Regenerative Medicine revenue
|
$ | 285,898 | $ | 156,837 | $ | 241,830 | ||||||
Regenerative
Medicine revenue generated from the use of AlloDerm, Strattice, and other
acellular tissue matrix products in reconstructive surgical procedures,
including challenging hernia repair and breast reconstruction, accounted for
92.1% of total Regenerative Medicine revenue for 2009. Revenue from
Strattice, our porcine-based tissue matrix product, accounted for 31.2% of total
Regenerative Medicine revenue for 2009. Sales generated outside of
the United States were not material for 2009.
The
growth in Regenerative Medicine revenue over the prior year was due primarily to
increased demand for our tissue matrix products due to continued market
penetration. We believe the Regenerative Medicine revenue growth rate in
the second half of 2009 was negatively impacted by approximately 3% to 4% due to
AlloDerm and Strattice supply constraints compared to the prior
year. We currently believe that inventory levels of Strattice are now
sufficient to meet 2010 demand, and we expect to attain sufficient inventory of
AlloDerm by the end of the second quarter of 2010.
TSS
Revenue
The
following table sets forth, for the periods indicated, TSS rental and sales
revenue by geography, as well as the percentage change in each line item,
comparing 2009 to 2008 (dollars in thousands):
|
Year
ended December 31,
|
||||||||||||
|
%
|
||||||||||||
|
2009
|
2008
|
Change
|
||||||||||
|
North
America revenue:
|
||||||||||||
|
Rental
|
$ | 172,893 | $ | 188,083 | (8.1 | ) % | ||||||
|
Sales
|
23,461 | 33,601 | (30.2 | ) | ||||||||
|
Total
– North America revenue
|
196,354 | 221,684 | (11.4 | ) | ||||||||
|
EMEA/APAC
revenue:
|
||||||||||||
|
Rental
|
82,550 | 86,169 | (4.2 | ) | ||||||||
|
Sales
|
21,267 | 19,269 | 10.4 | |||||||||
|
Total
– EMEA/APAC revenue
|
103,817 | 105,438 | (1.5 | ) | ||||||||
|
Total
rental revenue
|
255,443 | 274,252 | (6.9 | ) | ||||||||
|
Total
sales revenue
|
44,728 | 52,870 | (15.4 | ) | ||||||||
|
Total
TSS revenue
|
$ | 300,171 | $ | 327,122 | (8.2 | ) % | ||||||
Worldwide
TSS revenue decreased from the prior-year period due primarily to lower rental
and sales volumes in the United States resulting from the economic downturn and
capital constraints on acute care facilities combined with unfavorable foreign
currency exchange rate movements. Foreign currency exchange rate
movements unfavorably impacted worldwide TSS revenue by 2.4% for 2009 compared
to the prior year. North America TSS revenue decreased from the prior
year due primarily to lower hospital census and customer capital
constraints. EMEA/APAC TSS revenue decreased from the prior year due
primarily to foreign currency exchange rate movements, which unfavorably
impacted total EMEA/APAC TSS revenue by 5.3% for 2009 as compared to the prior
year. The EMEA/APAC TSS exchange rate movements were partially offset
by increased rental volume of our bariatric and wound care products and higher
wound care sales volumes.
Rental
Expenses
The
following table presents rental expenses and the percentage relationship to AHS
and TSS revenue comparing 2009 to 2008 (dollars in thousands):
|
Year
ended December 31,
|
|||||||||||
|
2009
|
2008
|
Change
|
|||||||||
|
Rental
expenses
|
$ | 667,440 | $ | 715,152 | (6.7 | )% | |||||
|
As
a percent of total AHS and TSS revenue
|
39.1 | % | 41.6 | % |
(250
|
bps) | |||||
Rental,
or field, expenses are comprised of both fixed and variable costs including
facilities, sales force compensation and royalties associated with our rental
products. Rental expenses as a percent of total AHS and TSS revenue
during 2009 decreased from the prior year due primarily to service center
rationalization efforts. These rationalization efforts have resulted
in the consolidation of over 20 service centers as of December 31, 2009 compared
to prior-year levels.
Cost
of Sales
The
following table presents cost of sales and the sales margin (calculated as sales
revenue less cost of sales divided by sales revenue for the period indicated)
comparing 2009 to 2008 (dollars in thousands):
|
Year
ended December 31,
|
|||||||||||
|
2009
|
2008
|
Change
|
|||||||||
|
AHS
and TSS:
|
|||||||||||
|
Cost
of sales
|
$ | 154,121 | $ | 154,542 | (0.3 | )% | |||||
|
Sales
margin
|
70.8 | % | 70.4 | % |
40
|
bps | |||||
|
Regenerative
Medicine:
|
|||||||||||
|
Cost
of sales
|
$ | 90,663 | $ | 63,961 | 41.7 | % | |||||
|
Sales
margin
|
68.3 | % | 59.2 | % |
910
|
bps | |||||
|
Total:
|
|||||||||||
|
Cost
of sales
|
$ | 244,784 | $ | 218,503 | 12.0 | % | |||||
|
Sales
margin
|
69.9 | % | 67.8 | % |
210
|
bps | |||||
Cost of
sales includes manufacturing costs, product costs and royalties associated with
our “for sale” products. During 2009, sales margins for AHS, TSS and
LifeCell improved over the prior year. Regenerative Medicine’s cost
of sales includes $15.0 million for 2008 related to LifeCell purchase accounting
adjustments associated with our inventory step-up to fair value, which
unfavorably impacted the LifeCell sales margin by 9.6% for 2008. On a
comparable basis, excluding the purchase accounting adjustments, the decrease in
the Regenerative Medicine sales margin was due primarily to unfavorable
production yields associated with the transition to full-scale Strattice
production in 2009.
Gross
Profit Margin
The
following table presents the gross profit margin (calculated as gross profit
divided by total revenue for the periods indicated) comparing 2009 to
2008:
|
Year
ended December 31,
|
||||||||
|
2009
|
2008
|
Change
|
||||||
|
Gross
profit margin
|
54.2 | % | 50.3 | % |
390
bps
|
|||
The gross
profit margin increase was due primarily to increased field service operations
productivity, higher gross margins associated with our first full year of
reported Regenerative Medicine results and lower product royalty
rates.
Selling,
General and Administrative Expenses
The
following table presents selling, general and administrative expenses and the
percentage relationship to total revenue comparing 2009 to 2008 (dollars in
thousands):
|
Year
ended December 31,
|
|||||||||||
|
2009
|
2008
|
Change
|
|||||||||
|
Selling,
general and administrative expenses
|
$ | 505,214 | $ | 433,331 | 16.6 | % | |||||
|
As
a percent of total revenue
|
25.4 | % | 23.1 | % |
230
|
bps | |||||
Selling,
general and administrative expenses include administrative labor, incentive and
sales compensation costs, insurance costs, professional fees, depreciation, bad
debt expense and information systems costs, but excludes rental compensation
costs. The increase in selling, general and administrative expenses
during 2009 was primarily due to increased legal fees associated with litigation
matters, higher share-based compensation expense, costs associated with our
upcoming market entry in Japan, global business transformation activities and
our service center rationalization efforts. Other selling, general
and administrative expenses included selling costs associated with our LifeCell
Regenerative Medicine business segment since the May 2008
acquisition. Selling, general and administrative expenses related to
our Regenerative Medicine business during 2009 and 2008 totaled $81.4 million
and $42.0 million, respectively.
Share-Based
Compensation Expense
Share-based
compensation expense was recognized in the consolidated statements of earnings
for 2009 and 2008, as follows (dollars in thousands, except per share
data):
|
Year
ended December 31,
|
||||||||
|
2009
|
2008
|
|||||||
|
Rental
expenses
|
$ | 4,974 | $ | 4,955 | ||||
|
Cost
of sales
|
978 | 559 | ||||||
|
Selling,
general and administrative expenses
|
26,554 | 20,801 | ||||||
|
Pre-tax
share-based compensation expense
|
32,506 | 26,315 | ||||||
|
Less: Income
tax benefit
|
(10,851 | ) | (8,310 | ) | ||||
|
Total
share-based compensation expense, net of tax
|
$ | 21,655 | $ | 18,005 | ||||
|
Diluted
net earnings per share impact
|
$ | 0.31 | $ | 0.25 | ||||
Research
and Development Expenses
The
following table presents research and development expenses and the percentage
relationship to total revenue comparing 2009 to 2008 (dollars in
thousands):
|
Year
ended December 31,
|
|||||||||||
|
2009
|
2008
|
Change
|
|||||||||
|
Research
and development expenses
|
$ | 92,088 | $ | 75,839 | 21.4 | % | |||||
|
As
a percent of total revenue
|
4.6 | % | 4.0 | % |
60
|
bps | |||||
Research
and development expenses relate to our investments in clinical studies and the
development of new and enhanced products and therapies. Our research
and development efforts include the development of new and synergistic
technologies across the continuum of wound care, including tissue regeneration,
preservation and repair, new applications of negative pressure technology, as
well as upgrading and expanding our surface technologies in our TSS
business. Our research and development program is also leveraging our
core understanding of biological tissues in order to develop biosurgery products
in our Regenerative Medicine business. The increase in research and
development expense during 2009 is primarily related to increased activity in
the development of our next generation of AHS and Regenerative Medicine
products. Research and development expenses related to our
Regenerative Medicine business during 2009 and 2008 totaled $24.2 million and
$14.1 million, respectively.
Acquired
Intangible Asset Amortization
In
connection with the LifeCell acquisition, we recorded $486.7 million of
identifiable definite-lived intangible assets during the second quarter of
2008. During 2009 and 2008, we recorded approximately $40.6 million
and $25.0 million, respectively, of amortization expense associated with these
acquired intangible assets.
In-Process
Research and Development
In
connection with our LifeCell purchase price allocation, we recorded a charge of
$61.6 million for the write-off of in-process research and development
(“IPR&D”) during 2008. We allocated value to IPR&D based on
an independent evaluation and appraisal of LifeCell’s research and development
projects. Such evaluation consisted of a specific review of the
efforts, including the overall objectives of the project, progress toward the
objectives and the uniqueness of the developments of these
objectives. Further, each IPR&D project was reviewed to determine
if technological feasibility had been achieved. The acquired
IPR&D was confined to new products and technologies under
development. No routine efforts to incrementally refine or enhance
existing products or production activities were included in the acquired
IPR&D write-off.
Operating
Margin
The
following table presents the operating margin, defined as operating earnings as
a percentage of total revenue, comparing 2009 to 2008:
|
Year
ended December 31,
|
||||||||
|
2009
|
2008
|
Change
|
||||||
|
Operating
margin
|
22.2 | % | 18.6 | % |
360
bps
|
|||
The
increase in operating margin is due primarily to higher gross profit combined
with operating efficiencies and process improvements and Regenerative Medicine’s
contributed operating profit. The operating margin for 2008 was
negatively impacted by the $61.6 million write-off of IPR&D and $15.0
million related to the step-up of LifeCell inventory to fair value associated
with our LifeCell acquisition.
Interest
Expense
Interest
expense was $104.9 million in 2009 compared to $80.8 million in the prior
year. The increase in interest expense for 2009 is due to our debt
financing that was only outstanding for a portion of the prior
year. At December 31, 2009, we had $750.0 million outstanding under
our term loan facility. Additionally, we had $690.0 million aggregate
principal amount of convertible senior notes outstanding. On
January 1, 2009, we adopted changes issued by the Financial Accounting
Standards Board (“FASB”) related to the accounting for convertible debt
instruments that may be settled in cash upon conversion. As a result
of the adoption of these changes, we recorded $19.7 million of additional
non-cash interest expense related to amortization of the discount on our
convertible senior notes in 2009. The adoption of the accounting
changes also resulted in additional non-cash interest expense for 2008 of
approximately $12.8 million. Additionally, interest expense for 2009 includes
write-offs of $3.0 million for unamortized deferred debt issuance costs
associated with optional prepayments on our senior credit facility totaling
$107.6 million. Interest expense for 2008 also includes write-offs of
$860,000 for unamortized deferred debt issuance costs on our previous debt
facility upon the refinancing of our credit facility and long-term
debt.
Foreign
Currency Gain (Loss)
We
recognized a foreign currency exchange loss of $4.0 million for 2009 compared to
a gain of $1.3 million in the prior year. The losses incurred during
2009 due to significant fluctuations in exchange rates were partially offset by
the expansion of our foreign currency hedging program, reduced exposures and the
conversion of a larger portion of foreign currency cash balances to U.S.
dollars.
Net
Earnings
For 2009,
we reported net earnings of $228.7 million, an increase of 37.4%, compared to
$166.4 million in the prior year. Net earnings for 2008 were
negatively impacted by the write-off of in-process research and development of
$61.6 million associated with our LifeCell acquisition.
Net
Earnings per Diluted Share
Net
earnings per diluted share for 2009 were $3.24, as compared to net earnings per
diluted share of $2.32 in the prior year. Net earnings per diluted
share for 2008 were negatively impacted by $0.86 per share as a result of the
write-off of IPR&D associated with our LifeCell acquisition.
Year
ended December 31, 2008 compared to Year ended December 31, 2007
Revenue
by Operating Segment
The
following table sets forth, for the periods indicated, product line revenue by
geographic region, as well as the percentage change in each line item, comparing
2008 to 2007 (dollars in thousands):
|
Year
ended December 31,
|
||||||||||||
|
%
|
||||||||||||
|
2008
|
2007
|
Change
|
||||||||||
|
AHS
revenue:
|
||||||||||||
|
North
America
|
$ | 1,049,215 | $ | 993,040 | 5.7 | % | ||||||
|
EMEA/APAC
|
344,735 | 286,583 | 20.3 | |||||||||
|
Total
– AHS
|
1,393,950 | 1,279,623 | 8.9 | |||||||||
|
Regenerative
Medicine revenue:
|
||||||||||||
|
North
America
|
156,837 | - | - | |||||||||
|
TSS
revenue:
|
||||||||||||
|
North
America
|
221,684 | 230,590 | (3.9 | ) | ||||||||
|
EMEA/APAC
|
105,438 | 99,731 | 5.7 | |||||||||
|
Total
– TSS
|
327,122 | 330,321 | (1.0 | ) | ||||||||
|
Total
revenue
|
$ | 1,877,909 | $ | 1,609,944 | 16.6 | % | ||||||
For
additional discussion on segment and operation information, see Note 17 to our
accompanying consolidated financial statements.
Revenue
by Geography
The
following table sets forth, for the periods indicated, rental and sales revenue
by geography, as well as the percentage change in each line item, comparing 2008
to 2007 (dollars in thousands):
|
Year
ended December 31,
|
||||||||||||
|
%
|
||||||||||||
|
2008
|
2007
|
Change
|
||||||||||
|
North
America revenue:
|
||||||||||||
|
Rental
|
$ | 943,951 | $ | 924,735 | 2.1 | % | ||||||
|
Sales
|
483,785 | 298,895 | 61.9 | |||||||||
|
Total
– North America
|
1,427,736 | 1,223,630 | 16.7 | |||||||||
|
EMEA/APAC
revenue:
|
||||||||||||
|
Rental
|
255,827 | 221,809 | 15.3 | |||||||||
|
Sales
|
194,346 | 164,505 | 18.1 | |||||||||
|
Total
– EMEA/APAC
|
450,173 | 386,314 | 16.5 | |||||||||
|
Total
rental revenue
|
1,199,778 | 1,146,544 | 4.6 | |||||||||
|
Total
sales revenue
|
678,131 | 463,400 | 46.3 | |||||||||
|
Total
revenue
|
$ | 1,877,909 | $ | 1,609,944 | 16.6 | % | ||||||
The
growth in total revenue over the prior year was due primarily to increased
rental and sales volumes for V.A.C. Therapy Systems and related disposables and
revenues associated with our acquisition of LifeCell in May
2008. Foreign currency exchange rate movements favorably impacted
total revenue by approximately 1%, compared to the prior year.
Revenue
Relationship
The
following table sets forth, for the periods indicated, the percentage
relationship of each item to total revenue in the period, as well as the changes
in each line item, comparing 2008 to 2007:
|
Year
ended December 31,
|
|||||||
|
2008
|
2007
|
Change
|
|||||
|
AHS
revenue
|
74.2 | % | 79.5 | % |
(530
bps)
|
||
|
Regenerative
Medicine revenue
|
8.4 | - |
840
bps
|
||||
|
TSS
revenue
|
17.4 | 20.5 |
(310
bps)
|
||||
|
Total
revenue
|
100.0 | % | 100.0 | % | |||
|
North
America revenue
|
76.0 | 76.0 | - | ||||
|
EMEA/APAC
revenue
|
24.0 | 24.0 | - | ||||
|
Total
revenue
|
100.0 | % | 100.0 | % | |||
|
Rental
revenue
|
63.9 | % | 71.2 | % |
(730
bps)
|
||
|
Sales
revenue
|
36.1 | 28.8 |
730
bps
|
||||
|
Total
revenue
|
100.0 | % | 100.0 | % | |||
AHS
Revenue
The
following table sets forth, for the periods indicated, AHS rental and sales
revenue by geography, as well as the percentage change in each line item,
comparing 2008 to 2007 (dollars in thousands):
|
Year
ended December 31,
|
||||||||||||
|
%
|
||||||||||||
|
2008
|
2007
|
Change
|
||||||||||
|
North
America revenue:
|
||||||||||||
|
Rental
|
$ | 755,868 | $ | 730,167 | 3.5 | % | ||||||
|
Sales
|
293,347 | 262,873 | 11.6 | |||||||||
|
Total
– North America
|
1,049,215 | 993,040 | 5.7 | |||||||||
|
EMEA/APAC
revenue:
|
||||||||||||
|
Rental
|
169,658 | 142,602 | 19.0 | |||||||||
|
Sales
|
175,077 | 143,981 | 21.6 | |||||||||
|
Total
– EMEA/APAC revenue
|
344,735 | 286,583 | 20.3 | |||||||||
|
Total
rental revenue
|
925,526 | 872,769 | 6.0 | |||||||||
|
Total
sales revenue
|
468,424 | 406,854 | 15.1 | |||||||||
|
Total
AHS revenue
|
$ | 1,393,950 | $ | 1,279,623 | 8.9 | % | ||||||
The
increase in North America AHS sales revenue over the prior year was due
primarily to higher sales volumes for V.A.C. disposables associated with the
increase in rental unit volume and the shift in pricing from V.A.C. rental units
to V.A.C. disposables. The year-over-year growth rate was negatively
impacted however, by a number of factors including increased competitive
activity, lower hospital census, institutional budget constraints, shorter
average treatment periods due to improved treatment protocols, faster healing
times and wound mix primarily in the acute care setting. In addition,
higher North America rental unit volume was partially offset by lower realized
pricing due primarily to changes in payer mix.
The
growth in EMEA/APAC AHS revenue over the prior year was due primarily to a 23.0%
increase in rental unit volume and an overall increase in V.A.C. disposable
sales associated with the increase in V.A.C. rental unit
volume. Higher EMEA/APAC rental unit volume was partially offset by
lower realized pricing due primarily to lower contracted pricing resulting from
competitive pricing pressures and an increase in long-term rental
contracts. Foreign currency exchange rate movements favorably
impacted EMEA/APAC AHS revenue by 4.6% compared to the prior year.
Regenerative
Medicine Revenue
Regenerative
Medicine revenue since the acquisition date has been included in our
consolidated financial statements. The following table reflects
Regenerative Medicine revenue by product included in our consolidated statements
of earnings during for the year ended December 31, 2008, as well as
unaudited pro forma revenue as though the acquisition of LifeCell had occurred
as of the beginning of the periods being presented (dollars in
thousands):
|
Post
Acquisition
|
Pro
forma
|
|||||||||||
|
Year
ended
|
Year
ended
|
Year
ended
|
||||||||||
|
December
31, 2008
|
December
31, 2008
|
December
31, 2007
|
||||||||||
|
(unaudited)
|
||||||||||||
|
AlloDerm
|
$ | 114,173 | $ | 186,495 | $ | 167,115 | ||||||
|
Strattice
|
27,949 | 31,383 | - | |||||||||
|
Orthopedic
and urogynecologic products
|
14,715 | 23,952 | 23,403 | |||||||||
|
Total
Regenerative Medicine revenue
|
$ | 156,837 | $ | 241,830 | $ | 190,518 | ||||||
Regenerative
Medicine revenue generated from the use of AlloDerm and Strattice in
reconstructive surgical procedures, including challenging hernia repair and
breast reconstruction procedures, accounted for approximately 91.5% of total
Regenerative Medicine revenue post acquisition for 2008. Revenue from
Strattice, which was launched in the first quarter of 2008, accounted for
approximately 17.8% of total Regenerative Medicine revenue post acquisition for
2008.
The
unaudited pro forma revenue presented above is for illustrative purposes only
and is not necessarily indicative of what actually would have occurred had the
acquisition been in effect for the periods presented, nor is it indicative of
future operating results. See Note 2 to our accompanying consolidated financial
statements.
TSS
Revenue
The
following table sets forth, for the periods indicated, TSS rental and sales
revenue by geography, as well as the percentage change in each line item,
comparing 2008 to 2007 (dollars in thousands):
|
Year
ended December 31,
|
||||||||||||
|
%
|
||||||||||||
|
2008
|
2007
|
Change
|
||||||||||
|
North
America revenue:
|
||||||||||||
|
Rental
|
$ | 188,083 | $ | 194,568 | (3.3 | ) % | ||||||
|
Sales
|
33,601 | 36,022 | (6.7 | ) | ||||||||
|
Total
– North America revenue
|
221,684 | 230,590 | (3.9 | ) | ||||||||
|
EMEA/APAC
revenue:
|
||||||||||||
|
Rental
|
86,169 | 79,207 | 8.8 | |||||||||
|
Sales
|
19,269 | 20,524 | (6.1 | ) | ||||||||
|
Total
– EMEA/APAC revenue
|
105,438 | 99,731 | 5.7 | |||||||||
|
Total
rental revenue
|
274,252 | 273,775 | 0.2 | |||||||||
|
Total
sales revenue
|
52,870 | 56,546 | (6.5 | ) | ||||||||
|
Total
TSS revenue
|
$ | 327,122 | $ | 330,321 | (1.0 | ) % | ||||||
TSS
revenue in North America decreased from the prior year primarily due to the loss
of a large GPO contract in the first quarter of 2008, the loss of a large GPO
contract in the fourth quarter of 2008 and lower demand during the fourth
quarter of 2008 resulting from economic constraints and reduced capital
availability to hospitals.
The
increase in total EMEA/APAC TSS revenue over the prior year was primarily due to
favorable foreign currency exchange rate movements, which impacted EMEA/APAC TSS
revenue by 6.5% for 2008 compared to the prior year. The increase in
TSS rental revenue was due to slightly higher realized pricing due to changes in
product mix, while rental unit volume was comparable to the prior
year.
Rental
Expenses
The
following table presents rental expenses and the percentage relationship to
total AHS and TSS revenue comparing 2008 to 2007 (dollars in
thousands):
|
Year
ended December 31,
|
|||||||||||
|
2008
|
2007
|
Change
|
|||||||||
|
Rental
expenses
|
$ | 715,152 | $ | 672,617 | 6.3 | % | |||||
|
As
a percent of total AHS and TSS revenue
|
41.6 | % | 41.8 | % |
(20
|
bps) | |||||
Rental,
or field, expenses are comprised of both fixed and variable
costs. The decrease in rental expenses as a percent of total AHS and
TSS revenue during 2008 was primarily due to increased productivity within our
service and sales force.
Cost
of Sales
The
following table presents cost of sales and the sales margin for the periods
indicated, comparing 2008 to 2007 (dollars in thousands):
|
Year
ended December 31,
|
|||||||||||
|
2008
|
2007
|
Change
|
|||||||||
|
AHS
and TSS:
|
|||||||||||
|
Cost
of sales
|
$ | 154,542 | $ | 145,611 | 6.1 | % | |||||
|
Sales
margin
|
70.4 | % | 68.6 | % |
180
|
bps | |||||
|
Regenerative
Medicine:
|
|||||||||||
|
Cost
of sales
|
$ | 63,961 | $ | - | - | ||||||
|
Sales
margin
|
59.2 | % | - | - | |||||||
|
Total:
|
|||||||||||
|
Cost
of sales
|
$ | 218,503 | $ | 145,611 | 50.1 | % | |||||
|
Sales
margin
|
67.8 | % | 68.6 | % |
(80
|
bps) | |||||
The
increased AHS and TSS sales margin was due to favorable changes in our product
mix and a shift in pricing from V.A.C. rental units to V.A.C. disposables
associated with our flexible pricing options in 2008 as compared to the prior
year. Regenerative Medicine’s cost of sales includes $15.0 million of
purchase accounting adjustments associated with our inventory step-up to fair
value that was realized upon the sale of the acquired inventory, which
unfavorably impacted the Regenerative Medicine sales margin by
9.6%.
Gross
Profit Margin
The
following table presents the gross profit margin comparing 2008 to
2007:
|
Year
ended December 31,
|
||||||||
|
2008
|
2007
|
Change
|
||||||
|
Gross
profit margin
|
50.3 | % | 49.2 | % |
110
bps
|
|||
Gross
profit margin in 2008 increased 110 basis points to 50.3% due in large part to
higher margins associated with Regenerative Medicine products. The
cost of sales for Regenerative Medicine products includes $15.0 million of
purchase accounting adjustments associated with our inventory step-up to fair
value that was realized upon the sale of the acquired inventory, which
unfavorably impacted the LifeCell sales margin by 9.6% in 2008. The
LifeCell purchase accounting adjustments negatively impacted the overall gross
profit margin by 0.8% in 2008.
Selling,
General and Administrative Expenses
The
following table presents selling, general and administrative expenses and the
percentage relationship to total revenue comparing 2008 to 2007 (dollars in
thousands):
|
Year
ended December 31,
|
|||||||||||
|
2008
|
2007
|
Change
|
|||||||||
|
Selling,
general and administrative expenses
|
$ | 433,331 | $ | 368,878 | 17.5 | % | |||||
|
As
a percent of total revenue
|
23.1 | % | 22.9 | % |
20
|
bps | |||||
The 2008
increase in selling, general and administrative expenses is due primarily to the
acquisition of LifeCell in the second quarter and fourth quarter restructuring
charges associated with our service productivity and globalization
efforts. LifeCell selling, general and administrative expense totaled
$42.0 million in 2008.
Share-Based
Compensation Expense
We
expense equity awards over the estimated service period and have experienced an
increase in share-based compensation expense as additional equity grants are
made, compared to the prior-year period. In addition, due to the
equity grants made in connection with the LifeCell acquisition during the second
quarter of 2008, we experienced an increase in share-based compensation expense
during 2008, compared to the prior year. Share-based compensation
expense was recognized in the consolidated statements of earnings for 2008 and
2007, as follows (dollars in thousands, except per share data):
|
Year
ended December 31,
|
||||||||
|
2008
|
2007
|
|||||||
|
Rental
expenses
|
$ | 4,955 | $ | 5,322 | ||||
|
Cost
of sales
|
559 | 623 | ||||||
|
Selling,
general and administrative expenses
|
20,801 | 17,769 | ||||||
|
Pre-tax
share-based compensation expense
|
26,315 | 23,714 | ||||||
|
Less: Income
tax benefit
|
(8,310 | ) | (6,933 | ) | ||||
|
Total
share-based compensation expense, net of tax
|
$ | 18,005 | $ | 16,781 | ||||
|
Diluted
net earnings per share impact
|
$ | 0.25 | $ | 0.23 | ||||
Research
and Development Expenses
The
following table presents research and development expenses and the percentage
relationship to total revenue comparing 2008 to 2007 (dollars in
thousands):
|
Year
ended December 31,
|
|||||||||||
|
2008
|
2007
|
Change
|
|||||||||
|
Research
and development expenses
|
$ | 75,839 | $ | 50,532 | 50.1 | % | |||||
|
As
a percent of total revenue
|
4.0 | % | 3.1 | % |
90
|
bps | |||||
LifeCell
research and development expense totaled $14.1 million and represented 40 basis
points of the increase as a percent of revenue during 2008.
Acquired
Intangible Asset Amortization
In
connection with the LifeCell acquisition, we recorded $486.7 million of
identifiable definite-lived intangible assets during the second quarter of
2008. During 2008, we recorded approximately $25.0 million of
amortization expense associated with these acquired intangible
assets.
In-Process
Research and Development
In
connection with our preliminary LifeCell purchase price allocation, we recorded
a charge of $61.6 million for the write-off of IPR&D during the second
quarter of 2008. We allocated value to the IPR&D based on an
independent evaluation and appraisal of LifeCell’s research and development
projects. Such evaluation consisted of a specific review of the
efforts, including the overall objectives of the project, progress toward the
objectives and the uniqueness of the developments of these
objectives. Further, each IPR&D project was reviewed to determine
if technological feasibility had been achieved. The acquired
IPR&D was confined to new products/technologies under
development. No routine efforts to incrementally refine or enhance
existing products or production activities were included in the acquired
IPR&D write-off.
Operating
Margin
The following table presents the
operating margin comparing 2008 to 2007:
|
Year
ended December 31,
|
||||||||
|
2008
|
2007
|
Change
|
||||||
|
Operating
margin
|
18.6 | % | 23.1 | % |
(450
bps)
|
|||
The 2008
decrease in operating margin was largely attributable to the $61.6 million
write-off of IPR&D, $25.0 million of amortization related to acquired
identifiable intangible assets, and $15.0 million of purchase accounting
adjustments charged to cost of sales that was associated with our inventory
step-up to fair value. The decrease in operating margin is partially
offset by improvements in service productivity and the beneficial impact of
LifeCell’s operating margin on our consolidated results. Costs
related to our LifeCell acquisition, including purchase and transaction costs,
lowered the operating margin during 2008 by 540 basis points.
Interest
Expense
Interest
expense was $80.8 million in 2008 compared to $19.9 million in the prior
year. The increase in interest expense over the prior year is due to
our debt refinancing in the second quarter of 2008 associated with our LifeCell
acquisition. At December 31, 2008, we had $950.0 million and $29.0
million outstanding under our term loan facility and revolving credit facility,
respectively. Additionally, we had $690.0 million aggregate principal
amount of convertible senior notes outstanding. Interest expense in
2008 and 2007 includes deferred debt issuance cost write-offs of $860,000 and
$3.9 million, respectively, on our previous debt facility, which were recorded
upon the refinancing of our credit facility and long-term debt. On
January 1, 2009, we adopted changes issued by the Financial Accounting
Standards Board (“FASB”) related to the accounting for convertible debt
instruments that may be settled in cash upon conversion. The adoption
of the accounting changes resulted in additional non-cash interest expense for
2008 of approximately $12.8 million.
Net
Earnings
Net
earnings for 2008 were $166.4 million, compared to $237.1 million in the prior
year. Net earnings for 2008 were negatively impacted by transaction-related
expenses associated with our acquisition of LifeCell, higher debt interest costs
and restructuring charges recorded during the year. The effective
income tax rate for 2008 was 39.5% compared to 33.8% in 2007. The
increase in the effective income tax rate was due primarily to the
non-deductibility of the $61.6 million write-off of IPR&D associated with
the LifeCell acquisition.
Net
Earnings per Diluted Share
Net
earnings per diluted share for 2008 were $2.32, as compared to net earnings per
diluted share of $3.31 in the prior year. This decrease resulted from
lower net earnings in 2008, due to transaction-related costs associated with the
LifeCell acquisition. Diluted weighted average shares outstanding of
71.8 million increased 0.2% from the prior year as additional share-based
compensation grants were partially offset by open-market share
repurchases.
LIQUIDITY
AND CAPITAL RESOURCES
General
We
require capital principally for capital expenditures, systems infrastructure,
debt service, interest payments and working capital. Our capital expenditures
consist primarily of manufactured rental assets, manufacturing equipment,
computer hardware and software and expenditures related to leasehold
improvements. Working capital is required principally to finance
accounts receivable and inventory. Our working capital requirements
vary from period-to-period depending on manufacturing volumes, the timing of
shipments and the payment cycles of our customers and payers.
Sources
of Capital
Based
upon the current level of operations, we believe our existing cash resources, as
well as cash flows from operating activities and availability under our
revolving credit facility, will be adequate to meet our anticipated cash
requirements for at least the next twelve months. During 2009, 2008
and 2007, our primary source of capital was cash from operations. The
following table summarizes the net cash provided and used by operating
activities, investing activities and financing activities for the years ended
December 31, 2009, 2008 and 2007 (dollars in thousands):
|
Year
ended December 31,
|
|||||||||||||
|
2009
|
2008
|
2007
|
|||||||||||
|
Net
cash provided by operating activities
|
$ | 387,521 | $ | 427,131 | $ | 348,938 | |||||||
|
Net
cash used by investing activities
|
(152,918 | ) | (1,887,235 | ) | (1) | (101,685 | ) | ||||||
|
Net
cash provided (used) by financing activities
|
(221,417 | ) | (2) | 1,449,209 | (3) | (97,659 | ) | (4) | |||||
|
Effect
of exchange rates changes on cash and cash equivalents
|
2,204 | (7,331 | ) | 9,253 | |||||||||
|
Net
increase (decrease) in cash and cash equivalents
|
$ | 15,390 | $ | (18,226 | ) | $ | 158,847 | ||||||
|
|
|||||||||||||
|
(1)
Includes
the LifeCell acquisition, net of cash acquired, of $1.7 billion utilizing
funds received from our new senior credit facility and convertible senior
notes.
(2)
The
amount for 2009 includes net debt prepayments and regularly-scheduled debt
payments totaling $229.0 million on our senior credit
facility.
(3)
Includes
proceeds of $1.7 billion on our senior credit facility and convertible
senior notes and $114.0 million on our revolving facility, partially
offset by the repayment of our previous revolving credit facility of $68.0
million, regularly scheduled debt payments totaling $50.0 million on our
current senior credit facility, payments totaling $85.0 million on our
revolving facility and a net cash payment of $48.7 million for our
convertible note hedge and warrant transactions.
(4)
This
amount for 2007 includes debt prepayments and regularly scheduled debt
payments totaling $120.0 million on our revolving credit facility, $139.5
million on our previous senior credit facility and $68.1 million for
redemption of our subordinated notes, partially offset by proceeds of
$188.0 million from our previously-existing revolving credit
facility.
|
|||||||||||||
As of
December 31, 2009, our principal sources of liquidity consisted of
$263.2 million of cash and cash equivalents and $288.6 million available
under our revolving credit facility, net of $11.4 million in undrawn letters of
credit. During 2009, we made scheduled and voluntary senior credit facility net
repayments totaling $229.0 million from cash-on-hand. Subsequent to
December 31, 2009, we made a voluntary prepayment of $50.0 million on our senior
credit facility.
Working
Capital
As of
December 31, 2009, we had current assets of $858.3 million, including
$425.0 million in net accounts receivable and $121.0 million in net inventory,
and current liabilities of $441.0 million resulting in a working capital surplus
of $417.3 million compared to a surplus of $405.2 million at December 31,
2008.
As of
December 31, 2009, we had $425.0 million of receivables outstanding, net of
realization reserves of $105.5 million. North America receivables,
net of realization reserves, were outstanding for an average of 68 days at
December 31, 2009, down from 71 days at December 31, 2008. EMEA/APAC
net receivable days decreased from 84 days at December 31, 2008 to 82 days at
December 31, 2009.
As of
December 31, 2008, we had current assets of $817.6 million, including
$406.0 million in net accounts receivable and $109.1 million in net inventory,
and current liabilities of $412.4 million resulting in a working capital surplus
of $405.2 million compared to a surplus of $482.3 million at December 31,
2007. The decrease in working capital is primarily due to current
installments of our long-term debt under our senior credit
facility.
Capital
Expenditures
During
2009, 2008 and 2007, we made capital expenditures of $103.3 million,
$131.3 million and $95.8 million, respectively, due primarily to
expanding the rental fleet, information technology purchases and leasehold
improvements for the expansion of our LifeCell manufacturing
facility. Net capital expenditures were higher in 2008 as a result of
the global deployment of our newly-introduced InfoV.A.C. and ActiV.A.C. Therapy
Systems.
Senior
Credit Facility
On May
19, 2008, we entered into a senior credit facility, consisting of a $1.0 billion
term loan facility and a $300.0 million revolving credit facility due May
2013. The following table sets forth the amounts owed under the term
loan and revolving credit facility, the effective interest rates on such
outstanding amounts, and the amount available for additional borrowing
thereunder, as of December 31, 2009 (dollars in thousands):
|
Effective
|
Amount
Available
|
||||||||||||
|
Maturity
|
Interest
|
Amount
|
for
Additional
|
||||||||||
|
Senior
Credit Facility
|
Date
|
Rate
|
Outstanding
|
Borrowing
|
|||||||||
|
Revolving
credit facility
|
May
2013
|
- | $ | - | $ | 288,615 | (1) | ||||||
|
Term
loan facility
|
May
2013
|
4.744 | % | (2) | 750,000 | (3) | - | ||||||
|
Total
|
$ | 750,000 | $ | 288,615 | |||||||||
|
|
|||||||||||||
|
(1) At
December 31, 2009, amount available under the revolving portion of our
credit facility reflected a reduction of $11.4 million for letters of
credit issued on our behalf, none of which have been drawn upon by the
beneficiaries thereunder.
(2) The
effective interest rate includes the effect of interest rate hedging
arrangements. Excluding the interest rate hedging arrangements, our
nominal interest rate as of December 31, 2009 was 3.143%.
(3)
Subsequent to December 31, 2009, we made a voluntary prepayment of
$50.0 million on our senior credit
facility.
|
|||||||||||||
Amounts
outstanding under the senior credit facility bear interest at a rate equal to
the base rate (defined as the higher of Bank of America's prime rate or 50 basis
points above the federal funds rate) or the Eurocurrency rate (the LIBOR rate),
in each case plus an applicable margin. The applicable margin varies
in reference to our consolidated leverage ratio and ranges from 1.75% to 3.50%
in the case of loans based on the Eurocurrency rate and 0.75% to 2.50% in the
case of loans based on the base rate.
We may
choose base rate or Eurocurrency pricing and may elect interest periods of 1, 2,
3 or 6 months for the Eurocurrency borrowings. We have generally
elected to use Eurocurrency pricing with a duration of 3
months. Interest on base rate borrowings is payable quarterly in
arrears. Interest on Eurocurrency borrowings is payable at the end of
each applicable interest period or every three months in the case of interest
periods in excess of three months. Interest on all past due amounts
will accrue at 2.00% over the applicable rate.
Our
senior credit facility contains affirmative and negative covenants customary for
similar facilities and transactions including, but not limited to, quarterly and
annual financial reporting requirements and limitations on other debt, other
liens or guarantees, mergers or consolidations, capital expenditures, asset
sales, certain investments, distributions to shareholders or share repurchases,
early retirement of subordinated debt, changes in the nature of the business,
changes in organizational documents and documents evidencing or related to
indebtedness that are materially adverse to the interests of the lenders under
the senior credit facility and changes in accounting policies or reporting
practices. For further information on our covenants and obligations
under the senior credit agreement, see note 5 to or accompanying consolidated
financial statements. As of December 31, 2009, we were in compliance
with all covenants under the senior credit agreement.
Convertible
Senior Notes
On April
21, 2008, we closed our offering of $600.0 million aggregate principal amount of
3.25% convertible senior notes due 2015 (the “Convertible Notes”). On
May 1, 2008, we issued an additional $90.0 million aggregate principal amount of
notes to cover over-allotments. The notes are governed by the terms
of an indenture dated as of April 21, 2008. Interest on the notes
accrues at a rate of 3.25% per annum and is payable semi-annually in arrears on
April 15 and October 15. For further information on our convertible
notes and the related note hedge and warrant transactions, see Note 5 to the
accompanying consolidated financial statements.
On
January 1, 2009, we adopted changes issued by the FASB related to the
accounting for convertible debt instruments that may be settled in cash upon
conversion (including partial cash settlement). These changes specify
that issuers of such instruments account separately for the liability and equity
components of convertible debt instruments in a manner that reflects an issuer’s
estimated non-convertible debt borrowing rate. Upon adoption of these
changes, we allocated the proceeds received from the issuance of the convertible
notes between a liability component and equity component by determining the fair
value of the liability component using our estimated non-convertible debt
borrowing rate. The difference between the proceeds of the notes and
the fair value of the liability component was recorded as a discount on the debt
with a corresponding offset to paid-in-capital (the equity component), net of
applicable deferred income taxes and the portion of debt issuance costs
allocated to the equity component. The resulting debt discount will
be accreted by recording additional non-cash interest expense over the expected
life of the convertible notes using the effective interest rate method. The
accounting changes were effective for periods subsequent to December 15, 2008
and were applied retroactively. Due to the required retrospective
application, the notes reflect a lower principal balance and additional non-cash
interest expense has been recorded based on our estimated non-convertible
borrowing rate. For 2009, we recorded $22.4 million of interest
related to the contractual interest coupon rate. Additionally, based
on our estimated non-convertible borrowing rate of 7.78%, the adoption of the
accounting changes resulted in approximately $19.7 million and $12.8 million of
additional non-cash interest expense for 2009 and 2008,
respectively.
Interest
Rate Protection
At
December 31, 2009, we had seventeen interest rate swap agreements pursuant to
which we have fixed the rate on $662.0 million notional amount of our
outstanding variable rate debt at an average interest rate of 2.074%, exclusive
of the Eurocurrency Rate Loan Spread as disclosed in the senior credit
agreement. As of December 31, 2009 and 2008, the aggregate fair value
of our swap agreements was negative and recorded as a liability of $8.4 million
and $13.3 million, respectively. If our interest rate protection
agreements were not in place, interest expense would have been approximately
$11.1 million, $492,000 and $51,000 lower for 2009, 2008 and 2007,
respectively.
In
addition to the swaps in effect at December 31, 2009, we have entered into two
additional interest rate swap agreements to convert $100.0 million of our
variable-rate debt to a fixed rate basis, which become effective on March 31,
2010. These agreements have been designated as cash flow hedge
instruments. The following chart summarizes these new agreements
(dollars in thousands):
|
Original
|
||||||||
|
Notional
|
Fixed
|
|||||||
|
Accounting
Method
|
Effective
Dates
|
Amount
|
Interest
Rate
|
|||||
|
Hypothetical
|
03/31/10-03/31/11
|
$ | 50,000 | 0.785 | % | |||
|
Hypothetical
|
03/31/10-03/31/11
|
$ | 50,000 | 0.774 | % | |||
Contractual
Obligations
We are
committed to making cash payments in the future on long-term debt, capital
leases, operating leases, licensing agreements and purchase
commitments. We have not guaranteed the debt of any other
party. The following table summarizes our contractual cash
obligations as of December 31, 2009 for each of the periods indicated (dollars
in thousands):
|
Less
Than
|
1 - 3 | 4 - 5 |
After
5
|
|||||||||||||||||
|
1
Year
|
Years
|
Years
|
Years
|
Total
(1)
|
||||||||||||||||
|
Long-term
debt obligations
|
$ | 132,353 | $ | 463,235 | $ | 154,412 | $ | 690,000 | $ | 1,440,000 | ||||||||||
|
Interest
on long-term debt obligations (2)
|
53,962 | 72,307 | 46,222 | 6,478 | 178,969 | |||||||||||||||
|
Capital
lease obligations
|
198 | 184 | 8 | - | 390 | |||||||||||||||
|
Operating
lease obligations
|
37,154 | 53,418 | 22,577 | 30,355 | 143,504 | |||||||||||||||
|
Licensing
agreements
|
4,250 | 4,500 | 2,250 | 3,000 | 14,000 | |||||||||||||||
|
Purchase
obligations
|
27,554 | - | - | - | 27,554 | |||||||||||||||
|
Total
|
$ | 255,471 | $ | 593,644 | $ | 225,469 | $ | 729,833 | $ | 1,804,417 | ||||||||||
|
|
||||||||||||||||||||
|
(1)
This
excludes our liability of $29.1 million for unrecognized tax
benefits. We cannot make a reasonably reliable estimate of the amount
and period of related future payments for such
liability.
(2)
Amounts
and timing may be different from our estimated interest payments due to
potential voluntary prepayments, borrowings and interest rate
fluctuations.
|
||||||||||||||||||||
In 2007,
we entered into a supply agreement with Avail Medical Products, Inc., a
subsidiary of Flextronics International Ltd., which has a term of five years
through November 2012 and may be renewed by agreement of both
parties. Under this agreement, we have title to the raw materials
used to manufacture our disposable supplies and retain title of all disposables
inventory throughout the manufacturing process. In the event of
termination, we would have been committed to purchase from Avail approximately
$2.1 million of inventory as of December 31, 2009, which is included within
Purchase Obligations in the table above.
OTHER
MATTERS
In an
effort to reduce U.S. healthcare costs, there have been and continue to be
proposals by legislators, regulators, and governmental payers to reduce these
costs. Certain legislative proposals, if passed, may impose
additional taxes on certain healthcare companies, limitations on the prices we
will be able to charge for our products or the amounts of reimbursement
available for our products from governmental agencies or third-party
payers. In particular, President Obama and members of the U.S.
Congress have proposed significant reforms to the U.S. healthcare
system. The Obama administration’s fiscal year 2010 budget included
proposals to limit Medicare payments, reduce drug spending and increase
taxes. In addition, members of Congress have proposed a single-payer
healthcare system, a government health insurance option to compete with private
plans and other expanded public healthcare measures. Various
healthcare reform proposals have also emerged at the state level. We
cannot predict what healthcare initiatives, if any, will be implemented at the
federal or state level, or the effect any future legislation or regulation will
have on us. However, an expansion in the government’s role in the
U.S. healthcare industry is likely and may lower reimbursements for our
products, reduce medical procedure volumes and increase taxes certain healthcare
companies are required to pay.
We
continue to see signs of weakness in the U.S. and global
economies. We believe the economic downturn may generally decrease
hospital census and the demand for elective surgeries. Also, the
global financial crisis, increasing unemployment and general economic
uncertainties have made it more difficult and more expensive for hospitals and
health systems to obtain credit, and may contribute to pressures on their
operating margins. We believe that rising unemployment reduces the
number of individuals covered by private insurance, which has resulted in a
noticeable increase in our charity-care placements and may increase the cost of
uncompensated care for hospitals. Rising unemployment may also result
in a shift in reimbursement patterns as unemployed individuals switch from
private plans to public plans such as Medicaid or Medicare. If the
economic downturn persists and unemployment remains high or increases, any
significant shift in coverage for the unemployed may have an unfavorable impact
on our reimbursement mix and may result in a decrease in our overall average
unit prices.
As our
AHS business continues to expand globally, we are now entering the large and
unpenetrated Japan market with our core NPWT product, the V.A.C. Therapy System
and related disposables. In 2009, we received approval to begin
market development activities in Japan for our innovative V.A.C. Therapy
product, and we have submitted applications to relevant reimbursement bodies for
coverage determination of our products in Japan. We are currently
proceeding with initial commercialization activities in Japan and plan
commercial launch of NPWT there in the second quarter of 2010. In
addition, we have identified several opportunities for our NPWT products in
countries that may be best served initially by distributors and are working
aggressively to construct appropriate networks to launch in countries including
Brazil, Russia, India and China.
In the
future, our U.S. Medicare placements of V.A.C. Therapy products are expected to
be subject to Medicare’s durable medical equipment competitive bidding
program. In 2008, the Medicare competitive bidding program was
delayed and significantly modified by the Medicare Improvements for Patients and
Providers Act (“MIPPA”). MIPPA exempted NPWT from the first round of
competitive bidding and delayed implementation of the second round of
competitive bidding. The law also imposed a 9.5% price reduction for
all U.S. Medicare placements of our NPWT beginning in 2009. The 9.5%
reduction in reimbursement resulted in lower Medicare reimbursement levels,
which negatively impacted our 2009 total revenue by approximately 1% compared to
pre-2009 reimbursement levels.
In
October 2008, LifeCell received a warning letter from the FDA identifying
certain non-compliance with Good Manufacturing Practice (“GMP”) in the
manufacture of our Strattice product. This warning letter arose from an
inspection of LifeCell’s manufacturing facility in 2008 which led to
observations by the FDA identifying certain observed non-compliance with GMP in
the manufacture of Strattice and non-compliance with Good Tissue Practice
(“GTP”) in the processing of AlloDerm. The FDA completed a
re-inspection of LifeCell in November 2009. The inspection included a
verification of all commitments made by LifeCell to address the items noted in
the warning letter as well as a complete Quality Systems inspection. The
FDA concluded that all items cited in the warning letter have been
resolved. In addition, the Quality Systems inspection did not result in
any observed non-compliance with GMP or GTP. The FDA requires no
further action or follow-up by LifeCell.
In
October 2009, we became aware of an investigation being conducted by the FDA
into the safety of certain power cords supplied to medical device manufacturers,
including KCI, by Electri-cord Manufacturing Company. Due to the potential
safety risks associated with the 110 volt AC power cords manufactured by
Electri-cord, we have determined to initiate a voluntary correction of specific
KCI for-sale products in order to inspect and replace the affected power
cords. Products affected include AHS and TSS products. With respect
to KCI’s V.A.C. AHS and TSS rental fleets, the power cord replacements will
occur during normal service cycles. We expect that the FDA may publish our
voluntary correction as a recall in its periodic enforcement report following
our submission of the required documentation. The replacement of the
affected power cords began in 2009 and will continue in 2010, and we do not
expect this will have a material impact on our results of
operations.
In
November 2009, the FDA issued a Preliminary Public Health Notice, or PHN,
notifying caregivers and patients of potential complications associated with the
use of NPWT products. The complications cited by the FDA and the
recommendations for care-givers and patients are consistent with the labeling
and training we provide in our professional education programs. We
believe that our demonstrated commitment to the safety and efficacy of our
products is consistent with the FDA’s messaging in the PHN. In our
educational programs, we give detailed guidance to practitioners regarding the
selection of patients, contraindications, patient risk factors and the warnings
included in our labeling. In addition, all of our V.A.C. Therapy
patients receive detailed instructions on how to use our products as well as
information on possible complications, patient risk factors, and warnings
associated with using our products. These efforts, combined with our
nation-wide 24-hour clinical support and service, as well as our provision of a
continuum of care between care settings, set us apart as a leading NPWT provider
in the United States and around the world. We continue to provide our
customers with the highest level of clinical support and education to minimize
the incidence of complications associated with our products. However,
when complications associated with our products do occur, we file Medical Device
Reports with the FDA consistent with the highest standards of quality,
compliance and complaint reporting. V.A.C. Therapy is designed to
safely treat complicated wounds, often on patients with severe comorbidities;
reported complications are extremely rare. Although the FDA did not
specifically tie KCI or V.A.C. Therapy to safety issues in the PHN, we have
received and responded to several inquiries from customers and professional
associations concerned about the notice. We will continue to monitor
and respond to the concerns of our customers regarding the PHN and any similar
communications by the FDA in the future.
In
February 2010, the Board of Directors formally adopted a Compensation Adjustment
Policy. The goal of the policy is to ensure the fair and accurate payment
of bonus and incentive compensation to executive officers based on the Company's
actual financial performance if subsequent information is revealed which leads
to a restatement of financial results. Under the policy, in the event of a
restatement of the Company’s financial results due to material noncompliance
with any then-applicable financial reporting requirement under either GAAP or
the federal securities laws, the Board may require executive officers of the
company to repay any portion of bonus or incentive
compensation payments which are in excess of the amounts that would
have been paid based on the restated financial results. In addition, the
Board has the discretion to cause the Company to make incremental payouts to
executive officers and other employees if any restatement of the Company’s
financial results indicates that the Company should have made higher bonus or
incentive compensation payments than those actually made.
Critical
Accounting Estimates
The
Securities and Exchange Commission, or SEC, defines critical accounting
estimates as those that are, in management's opinion, very important to the
portrayal of our financial condition and results of operations and require our
management's most difficult, subjective or complex judgments. In
preparing our financial statements in accordance with U.S. generally accepted
accounting principles, we must often make estimates and assumptions that affect
the reported amounts of assets, liabilities, revenue, expenses and related
disclosures at the date of the financial statements and during the reporting
period. Some of those judgments can be subjective and
complex. Consequently, actual results could differ from our
estimates. The accounting policies that are most subject to important
estimates or assumptions are described below. Also, see Note 1
to our accompanying consolidated financial statements.
Revenue
Recognition and Accounts Receivable Realization
We
recognize revenue in accordance with the Revenue Recognition topic of the
Codification when each of the following four criteria are met:
|
1)
|
a
contract or sales arrangement
exists;
|
|
2)
|
products
have been shipped and title has transferred or services have been
rendered;
|
|
3)
|
the
price of the products or services is fixed or determinable;
and
|
|
4)
|
collectibility
is reasonably assured.
|
We
recognize rental revenue based on the number of days a product is used by the
patient/organization, (i) at the contracted rental rate for contracted customers
and (ii) generally, retail price for non-contracted customers. Sales
revenue is recognized when products are shipped and title has
transferred. In addition, we establish realization reserves against
revenue to provide for adjustments including capitation agreements, estimated
credit memos, volume discounts, pricing adjustments, utilization adjustments,
product returns, cancellations, estimated uncollectible amounts and payer
adjustments based on historical experience. In addition, revenue is recognized
net of administrative fees paid to group purchasing organizations, or
GPO’s.
Domestic
trade accounts receivable consist of amounts due directly from acute and
extended care organizations, third-party payers, or TPP, both governmental and
non-governmental, and patient pay accounts. Included within the TPP
accounts receivable balances are amounts that have been or will be billed to
patients once the primary payer portion of the claim has been settled by the
TPP. EMEA/APAC and LifeCell trade accounts receivable consist of
amounts due primarily from acute care organizations.
The
domestic TPP reimbursement process requires extensive documentation, which has
had the effect of slowing both the billing and cash collection cycles relative
to the rest of the business, and therefore, increasing total accounts
receivable. Because of the extensive documentation required and the
requirement to settle a claim with the primary payer prior to billing the
secondary and/or patient portion of the claim, the collection period for a claim
in our homecare business may, in some cases, extend beyond one year prior to
full settlement of the claim.
We
utilize a combination of factors in evaluating the collectibility of our
accounts receivable. For unbilled receivables, we establish reserves
against revenue to allow for expected denied or uncollectible
items. In addition, items that remain unbilled for more than a
specified period of time, or beyond an established billing window, are reserved
against revenue. For billed receivables, we generally establish
reserves against revenue and bad debt using a combination of factors including
historic adjustment rates for credit memos and cancelled transactions,
historical collection experience, and the length of time receivables have been
outstanding. The reserve rates vary by payer group. In
addition, we record specific reserves for bad debt when we become aware of a
customer's inability or refusal to satisfy its debt obligations, such as in the
event of a bankruptcy filing. If circumstances change, such as higher
than expected claims denials, post-payment claim recoupments, a material change
in the interpretation of reimbursement criteria by a major customer or payer, or
payment defaults or an unexpected material adverse change in a major customer's
or payer's ability to meet its obligations, our estimates of the realizability
of trade receivables could be reduced by a material amount. A
hypothetical 1% change in the collectibility of our billed receivables at
December 31, 2009 would impact pre-tax earnings by an estimated $2.6
million.
Inventory
AHS
and TSS inventories
Inventories
are stated at the lower of cost (first-in, first-out) or market (net realizable
value). Costs include material, labor and manufacturing overhead
costs. Inventory expected to be converted into equipment for
short-term rental is reclassified to property, plant and
equipment. We review our inventory balances monthly for excess sale
products or obsolete inventory levels. Inventory quantities of sale-only
products in excess of anticipated demand are considered excess and are reserved
at 100%. For rental products, we review both product usage and product life
cycle to classify inventory as active, discontinued or
obsolete. Obsolescence reserve balances are established on an
increasing basis from 0% for active, high-demand products to 100% for obsolete
products. The reserve is reviewed and, if necessary, adjustments are made on a
monthly basis. We rely on historical information and production
planning forecasts to support our reserve and utilize management's business
judgment for "high risk" items, such as products that have a fixed shelf
life. Once the value of inventory is reduced, we do not adjust the
reserve balance until the inventory is sold or otherwise disposed.
Regenerative
Medicine inventories
Inventories
are stated at the lower of cost or market, with cost being determined on a
first-in, first-out basis. Inventories on hand include the cost of
materials, freight, direct labor and manufacturing overhead. We
record a provision for excess and obsolete inventory based primarily on
inventory quantities on hand, the historical product sales and estimated
forecast of future product demand and production requirements. In
addition, we record a provision for tissue that will not meet tissue standards
based on historic rejection rates.
Long-Lived
Assets
Property,
plant and equipment are stated at cost. Betterments, which extend the
useful life of the equipment, are capitalized. Depreciation on
property, plant and equipment is calculated on the straight-line method over the
estimated useful lives (20 to 30 years for buildings and between three and
seven years for most of our other property and equipment) of the
assets. If an event were to occur that indicates the carrying value
of long-lived assets might not be recoverable, we would review property, plant
and equipment for impairment using an undiscounted cash flow analysis and if an
impairment had occurred on an undiscounted basis, we would compute the fair
market value of the applicable assets on a discounted cash flow basis and adjust
the carrying value accordingly.
Goodwill
Goodwill
represents the excess purchase price over the fair value of net assets
acquired. We account for goodwill in accordance with the
“Intangibles-Goodwill and Other” Topic of the FASB Accounting Standards
Codification which requires that goodwill and other intangible assets that have
indefinite lives not be amortized but instead be tested at least annually, by
reporting unit, for impairment, or more frequently when events or changes in
circumstances indicate that the asset might be impaired. Examples of
such events or circumstances include, but are not limited to, a significant
adverse change in legal or business climate, an adverse regulatory action or
unanticipated competition.
We
conducted our annual impairment test of goodwill as of October 31, 2009 and
2008. Impairment is tested by comparing the carrying value of the reporting unit
to the reporting unit’s fair value. The carrying value of each reporting unit is
determined by taking the reported net assets of the consolidated entity,
identifying reporting unit specific assets (including goodwill) and liabilities
and allocating shared operational and administrative assets and liabilities to
the appropriate reporting unit, which is the same as the segment to which they
are assigned.
The fair
value of each reporting unit was primarily determined using discounted cash flow
models. The aggregate fair values of our reporting units were
reconciled to our market capitalization. The estimate of cash flow used to
estimate fair value is based upon, among other things, certain assumptions about
expected future operating performance and appropriate discount rates determined
by our management. Our estimates of discounted cash flows may differ from actual
cash flows due to, among other things, economic conditions, changes to our
business model or changes in operating performance. Significant differences
between these estimates and actual cash flows could materially affect our future
financial results. These factors increase the risk of differences between
projected and actual performance that could impact future estimates of fair
value of all reporting units.
As a
result of this test, we determined that no adjustment to the carrying value of
goodwill for any reporting units was required. A sensitivity analysis of the
material assumptions used in assessing recoverability of goodwill was also
performed and did not impact the outcome of the goodwill impairment
test. No events or circumstances have occurred subsequent to
October 31, 2009 that would indicate a further assessment was
necessary.
Income
Taxes
Deferred
income taxes are accounted for in accordance with the “Income Taxes” Topic of
the FASB Accounting Standards Codification which requires the asset and
liability method, whereby deferred tax assets and liabilities are recognized
based on the tax effects of temporary differences between the financial
statements and the tax bases of assets and liabilities, as measured by current
enacted tax rates. When appropriate, we evaluate the need for a
valuation allowance to reduce our deferred tax assets.
We also
account for uncertain tax positions in accordance with the “Income Taxes” Topic
of the FASB Accounting Standards Codification. Accordingly, a
liability is recorded for unrecognized tax benefits resulting from uncertain tax
positions taken or expected to be taken in a tax return. We recognize
interest and penalties, if any, related to unrecognized tax benefits in income
tax expense.
At
December 31, 2009, deferred tax assets recorded by KCI increased from 2008.
We have established a valuation allowance to reduce deferred tax assets
associated with foreign net operating losses, certain foreign deferred tax
assets and state research and development credits to an amount whose realization
is more likely than not. We anticipate that the reversal of existing
taxable temporary difference and future income will provide sufficient taxable
income to realize the tax benefit of the remaining deferred tax assets;
therefore we have not provided a valuation allowance.
The
effective income tax rate for 2009 was 31.6% compared to 39.5% in 2008.
The decrease in the effective income tax rate was due primarily to the
non-deductibility of the $61.6 million write-off of in-process research and
development (“IPR&D”) associated with the LifeCell acquisition recorded in
2008.
Share-based
Compensation
We
recognize share-based compensation expense under the provisions of
“Compensation-Stock Compensation” Topic of the FASB Accounting Standards
Codification which requires the measurement and recognition of compensation
expense over the estimated service period for all share-based payment awards,
including stock options, restricted stock awards and restricted stock units
based on estimated fair values on the date of grant.
We have
elected to use the Black-Scholes model to estimate the fair value of stock
options. We believe that the use of the Black-Scholes model meets the
fair value measurement objective of the FASB Codification and reflects all
substantive characteristics of the instruments being
valued. Estimates of fair value are not intended to predict actual
future events or the value ultimately realized by employees who receive
share-based compensation awards, and subsequent events will not affect the
original estimates of fair value made by us.
We
estimate forfeitures when recognizing compensation costs. We will
adjust our estimate of forfeitures as actual forfeitures differ from our
estimates, resulting in the recognition of compensation cost only for those
awards that actually vest.
The
weighted-average estimated fair value of stock options granted during 2009, 2008
and 2007 was $11.48, $19.52 and $24.30, respectively, using the Black-Scholes
option pricing model with the following weighted average assumptions (annualized
percentages):
|
2009
|
2008
|
2007
|
||||||||||
|
Expected
stock volatility
|
43.7 | % | 39.4 | % | 39.6 | % | ||||||
|
Expected
dividend yield
|
- | - | - | |||||||||
|
Risk-free
interest rate
|
2.2 | % | 3.2 | % | 4.5 | % | ||||||
|
Expected
life (years)
|
6.2 | 6.3 | 6.2 | |||||||||
The
expected stock volatility is based on historical volatilities of KCI and other
similar entities. The expected dividend yield is 0% as we have
historically not paid cash dividends on our common stock. The
risk-free interest rates for periods within the contractual life of the option
are based on the U.S. Treasury yield curve in effect at the time of
grant. We have chosen to estimate expected life using the simplified
method as permitted rather than using our own historical expected life as there
has not been sufficient history since we completed our initial public offering
to allow us to better estimate this variable.
Legal
Proceedings and Other Loss Contingencies
We are
subject to various legal proceedings, many involving routine litigation
incidental to our business. The outcome of any legal proceeding is
not within our complete control, is often difficult to predict and is resolved
over very long periods of time. Estimating probable losses associated
with any legal proceedings or other loss contingencies is very complex and
requires the analysis of many factors including assumptions about potential
actions by third parties. Loss contingencies are disclosed when there
is at least a reasonable possibility that a loss has been incurred and are
recorded as liabilities in the consolidated financial statements when it is both
(1) probable or known that a liability has been incurred and (2) the
amount of the loss is reasonably estimable. If the reasonable estimate of the
loss is a range and no amount within the range is a better estimate, the minimum
amount of the range is recorded as a liability. If a loss contingency
is not probable or cannot be reasonably estimated, a liability is not recorded
in the consolidated financial statements.
Recently
Adopted Accounting Principles
In June
2009, the FASB issued a new pronouncement which establishes the single source of
authoritative U.S. generally accepted accounting principles (“GAAP” or “the
Codification”). Rules and interpretive releases of the SEC under
authority of federal securities laws are also sources of authoritative GAAP for
SEC registrants. The Codification superseded all previously-existing
non-grandfathered non-SEC accounting and reporting standards. The
Codification reorganizes all GAAP into approximately 90 accounting topics and
displays them using a consistent structure, and includes relevant SEC guidance
organized using the same topical structure in separate sections. This statement
was effective for KCI beginning September 30, 2009. This pronouncement does not
change GAAP; therefore, our adoption of this pronouncement did not have an
impact on our results of operations, financial condition or cash
flows.
On
June 30, 2009, KCI adopted changes issued by the FASB related to subsequent
events. These changes established standards for accounting for and
disclosing subsequent events (events which occur after the balance sheet date
but before financial statements are issued or are available to be issued). The
changes require an entity to disclose the date subsequent events were evaluated
and whether that evaluation took place on the date financial statements were
issued or were available to be issued. The adoption of the changes did not have
a material impact on our results of operations or our financial
position.
On
January 1, 2009, KCI adopted changes issued by the FASB related to the
accounting for convertible debt instruments that may be settled in cash upon
conversion (including partial cash settlement). These changes specify
that issuers of such instruments account separately for the liability and equity
components of convertible debt instruments in a manner that reflects an issuer’s
estimated non-convertible debt borrowing rate. The impact associated
with our adoption of these changes is disclosed in this report. (See Note 1 (bb)
to our accompanying consolidated financial statements.)
Recently
Issued Accounting Principles
In
October 2009, the FASB issued Accounting Standards Update No. 2009-13 “Revenue
Recognition (Topic 605): Multiple-Deliverable Revenue Arrangements – a consensus
of the FASB Emerging Issues Task Force.” This update provides
amendments to the criteria for separating consideration in multiple-deliverable
arrangements. This update also significantly expands the disclosures
related to a company’s multiple-deliverable revenue arrangements. The
amendments in this update will be effective prospectively for revenue
arrangements entered into or materially modified in fiscal years beginning on or
after June 15, 2010. The adoption of this update is not expected to
have a material impact on our results of operations or our financial
position.
ITEM
7A.
QUANTITATIVE AND QUALITATIVE DISCLOSURES ABOUT MARKET
RISK
We are
exposed to various market risks, including fluctuations in interest rates and
variability in currency exchange rates. We have established policies,
procedures and internal processes governing our management of market risk and
the use of financial instruments to manage our exposure to such
risk.
Interest
Rate Risk
We have
variable interest rate debt and other financial instruments, which are subject
to interest rate risk that could have a negative impact on our business if not
managed properly. We have a risk management policy which is designed
to reduce the potential negative earnings effect arising from the impact of
fluctuating interest rates. We manage our interest rate risk on our
borrowings through interest rate swap agreements which effectively convert a
portion of our variable-rate borrowings to a fixed rate basis through June 2011,
thus reducing the impact of changes in interest rates on future interest
expenses. We do not use financial instruments for speculative or
trading purposes.
At
December 31, 2009, we had seventeen interest rate swap agreements in effect
pursuant to which we have fixed the rate on an aggregate $662.0 million notional
amount of our outstanding variable rate debt at a weighted average interest rate
of 2.074%, exclusive of the Eurocurrency Rate Loan Spread as disclosed in the
senior credit agreement. In addition to the swaps in effect at
December 31, 2009, we have entered into two additional interest rate swap
agreements to convert $100.0 million of our variable-rate debt to a fixed rate
basis which become effective on March 31, 2010. These agreements have
been designated as cash flow hedge instruments. (See Note 6 to our
accompanying consolidated financial statements.)
The
tables below provide information as of December 31, 2009 and 2008 about our
long-term debt and interest rate swaps, both of which are sensitive to changes
in interest rates. For long-term debt, the table presents principal
cash flows and related weighted average interest rates by expected maturity
dates. For interest rate swaps, the table presents notional amounts and weighted
average interest rates by expected (contractual) maturity dates. Notional
amounts are used to calculate the contractual payments to be exchanged under the
contract. Weighted average variable rates are based on implied forward rates in
the yield curve at the reporting date (dollars in thousands):
|
Expected
Maturity Date as of December 31, 2009
|
||||||||||||||||||||||||||||
|
2010
|
2011
|
2012
|
2013
|
Thereafter
|
Total
|
Fair
Value
|
||||||||||||||||||||||
|
Long-term
debt
|
||||||||||||||||||||||||||||
|
Fixed
rate
|
$ | — | $ | — | $ | — | $ | — | $ | 690,000 | $ | 690,000 | $ | 676,545 | (1) | |||||||||||||
|
Average
interest rate
|
— | — | — | — | 3.250 | % | 3.250 | % | ||||||||||||||||||||
|
Variable
rate
|
$ | 132,353 | $ | 198,529 | $ | 264,706 | $ | 154,412 | $ | — | $ | 750,000 | $ | 729,375 | ||||||||||||||
|
Weighted
average interest rate(2)
|
4.744 | % | 4.744 | % | 4.744 | % | 4.744 | % | — | 4.744 | % | |||||||||||||||||
|
Interest rate swap(3)
|
||||||||||||||||||||||||||||
|
Variable
to fixed-notional amount
|
$ | 442,500 | $ | 219,500 | $ | — | $ | — | $ | — | $ | 662,000 | $ | (8,436 | ) | |||||||||||||
|
Average
pay rate
|
2.077 | % | 2.035 | % | — | — | — | 2.074 | % | |||||||||||||||||||
|
Average
receive rate(4)
|
0.260 | % | 0.260 | % | — | — | — | 0.260 | % | |||||||||||||||||||
|
|
||||||||||||||||||||||||||||
|
(1)
The
fair value of our 3.25% Convertible Senior Notes due 2015 is based on a
limited number of trades and does not necessarily represent the purchase
price of the entire convertible note portfolio.
(2)
The
weighted average interest rates for future periods were based on the
nominal interest rates as of the specified date.
(3)
Interest
rate swaps relate to the variable rate debt under long-term debt.
The aggregate fair value of our interest rate swap agreements was negative
and was recorded as a liability at December 31, 2009.
(4)
The
average receive rates for future periods are based on the current period
average receive rates. These rates reset
quarterly.
|
||||||||||||||||||||||||||||
|
Expected
Maturity Date as of December 31, 2008
|
||||||||||||||||||||||||||||
|
2009
|
2010
|
2011
|
2012
|
Thereafter
|
Total
|
Fair
Value
|
||||||||||||||||||||||
|
Long-term
debt
|
||||||||||||||||||||||||||||
|
Fixed
rate
|
$ | — | $ | — | $ | — | $ | — | $ | 690,000 | $ | 690,000 | $ | 392,955 | (5) | |||||||||||||
|
Average
interest rate
|
— | — | — | — | 3.250 | % | 3.250 | % | ||||||||||||||||||||
|
Variable
rate
|
$ | 100,000 | $ | 150,000 | $ | 225,000 | $ | 300,000 | $ | 204,000 | $ | 979,000 | $ | 881,100 | ||||||||||||||
|
Weighted
average interest rate(6)
|
4.748 | % | 4.748 | % | 4.748 | % | 4.748 | % | 4.748 | % | 4.748 | % | ||||||||||||||||
|
Interest rate swap(7)
|
||||||||||||||||||||||||||||
|
Variable
to fixed-notional amount
|
$ | 205,500 | $ | 192,500 | $ | 69,500 | $ | — | $ | — | $ | 467,500 | $ | (13,272 | ) | |||||||||||||
|
Average
pay rate
|
3.293 | % | 3.511 | % | 3.797 | % | — | — | 3.380 | % | ||||||||||||||||||
|
Average
receive rate(8)
|
1.460 | % | 1.460 | % | 1.460 | % | — | — | 1.460 | % | ||||||||||||||||||
|
|
||||||||||||||||||||||||||||
|
(5)
The
fair value of our 3.25% Convertible Senior Notes due 2015 was based on a
limited number of trades and did not necessarily represent the purchase
price of the entire convertible note portfolio.
(6)
The
weighted average interest rates for future periods were based on the
nominal interest rates as of the specified date.
(7)
Interest
rate swaps relate to the variable rate debt under long-term debt.
The aggregate fair value of our interest rate swap agreements was negative
and was recorded as a liability at December 31, 2008.
(8)
The
average receive rates for future periods were based on the then-existing
average receive rates. These rates reset
quarterly.
|
||||||||||||||||||||||||||||
Foreign
Currency and Market Risk
We have
direct operations in the United States, Canada, Western Europe, Australia, New
Zealand, Singapore and South Africa, and we conduct additional business through
distributors in Latin America, the Middle East, Eastern Europe and Asia. Our
foreign operations are measured in their applicable local currencies. As a
result, our financial results could be affected by factors such as changes in
foreign currency exchange rates or weak economic conditions in the foreign
markets in which we have operations. Exposure to these fluctuations is managed
primarily through the use of natural hedges, whereby funding obligations and
assets are both managed in the applicable local currency.
KCI faces
transactional currency exposures when its foreign subsidiaries enter into
transactions and associated cash flows denominated in currencies other than
their local currency. These nonfunctional currency exposures relate
primarily to existing and forecasted intercompany receivables and payables
arising from intercompany purchases of manufactured products. KCI
enters into foreign currency exchange contracts to mitigate the impact of
currency fluctuations on transactions and associated cash flows denominated in
nonfunctional currencies, thereby limiting risk that would otherwise result from
changes in exchange rates. The periods of the foreign currency
exchange contracts correspond to the periods of the exposed transactions but
generally do not extend beyond 12 months.
At
December 31, 2009, we had outstanding foreign currency exchange contracts to
sell approximately $99.9 million of various currencies. Based on our
overall transactional currency rate exposure, movements in the currency rates
will not materially affect our financial condition. We are exposed to
credit loss in the event of nonperformance by counterparties on their
outstanding foreign currency exchange contracts, but we do not anticipate
nonperformance by any of the counterparties.
International
operations reported operating profit of $123.3 million for the year ended
December 31, 2009. We estimate that a 10% fluctuation in the value of
the U.S. dollar relative to these foreign currencies as of and for the year
ended December 31, 2009 would change our net earnings for the year ended
December 31, 2009 by approximately $14.3 million. Our analysis does
not consider the impact the fluctuation would have on the value of our foreign
currency exchange contracts or the implications that such fluctuations could
have on the overall economic activity that could exist in such an environment in
the United States or the foreign countries or on the results of operations of
our foreign entities.
Report
of Independent Registered Public Accounting Firm
The Board
of Directors and Shareholders of Kinetic Concepts, Inc.
We have
audited the accompanying consolidated balance sheets of Kinetic Concepts, Inc.
and subsidiaries as of December 31, 2009 and 2008, and the related consolidated
statements of earnings, shareholders’ equity, and cash flows for each of the
three years in the period ended December 31, 2009. Our audits also included the
financial statement schedule listed in the index at Item 15(a). These
financial statements and schedule are the responsibility of the Company’s
management. Our responsibility is to express an opinion on these
financial statements and schedule based on our audits.
We
conducted our audits in accordance with the standards of the Public Company
Accounting Oversight Board (United States). Those standards require
that we plan and perform the audit to obtain reasonable assurance about whether
the financial statements are free of material misstatement. An audit
includes examining, on a test basis, evidence supporting the amounts and
disclosures in the financial statements. An audit also includes
assessing the accounting principles used and significant estimates made by
management, as well as evaluating the overall financial statement
presentation. We believe that our audits provide a reasonable basis
for our opinion.
In our
opinion, the financial statements referred to above present fairly, in all
material respects, the consolidated financial position of Kinetic Concepts, Inc.
and subsidiaries at December 31, 2009 and 2008, and the consolidated results of
their operations and their cash flows for each of the three years in the period
ended December 31, 2009, in conformity with U.S. generally accepted accounting
principles. Also, in our opinion, the related financial statement
schedule, when considered in relation to the financial statements taken as a
whole, presents fairly in all material respects the information set forth
within.
As
discussed in Note 1 to the consolidated financial statements, in 2009, Kinetic
Concepts, Inc. changed its method of accounting for convertible
instruments.
We also
have audited, in accordance with the standards of the Public Company Accounting
Oversight Board (United States), Kinetic Concepts, Inc.’s internal control over
financial reporting as of December 31, 2009, based on criteria established in
Internal Control – Integrated Framework issued by the Committee of Sponsoring
Organizations of the Treadway Commission and our report dated February 24, 2010
expressed an unqualified opinion thereon.
|
/s/
ERNST & YOUNG LLP
|
|
ERNST
& YOUNG LLP
|
San
Antonio, Texas
February
24, 2010
|
KINETIC
CONCEPTS, INC. AND SUBSIDIARIES
|
||||||||
|
Consolidated
Balance Sheets
|
||||||||
|
(in
thousands)
|
||||||||
|
December
31,
|
December
31,
|
|||||||
|
2009
|
2008
|
|||||||
|
Assets:
|
||||||||
|
Current
assets:
|
||||||||
|
Cash
and cash equivalents
|
$ | 263,157 | $ | 247,767 | ||||
|
Accounts
receivable, net
|
425,042 | 406,007 | ||||||
|
Inventories,
net
|
121,044 | 109,097 | ||||||
|
Deferred
income taxes
|
11,715 | 19,972 | ||||||
|
Prepaid
expenses and other
|
37,330 | 34,793 | ||||||
|
Total
current assets
|
858,288 | 817,636 | ||||||
|
Net
property, plant and equipment
|
296,055 | 303,799 | ||||||
|
Debt
issuance costs, less accumulated amortization of $23,000 at 2009 and
$7,896 at 2008
|
35,191 | 50,295 | ||||||
|
Deferred
income taxes
|
17,513 | 8,635 | ||||||
|
Goodwill
|
1,328,881 | 1,337,810 | ||||||
|
Identifiable
intangible assets, net
|
489,213 | 472,547 | ||||||
|
Other
non-current assets
|
13,424 | 12,730 | ||||||
| $ | 3,038,565 | $ | 3,003,452 | |||||
|
Liabilities
and Shareholders' Equity:
|
||||||||
|
Current
liabilities:
|
||||||||
|
Accounts
payable
|
$ | 63,301 | $ | 53,765 | ||||
|
Accrued
expenses and other
|
226,823 | 258,666 | ||||||
|
Current
installments of long-term debt
|
132,353 | 100,000 | ||||||
|
Income
taxes payable
|
18,484 | - | ||||||
|
Total
current liabilities
|
440,961 | 412,431 | ||||||
|
Long-term
debt, net of current installments and discount
|
1,173,808 | 1,415,443 | ||||||
|
Non-current
tax liabilities
|
29,074 | 26,205 | ||||||
|
Deferred
income taxes
|
212,257 | 239,621 | ||||||
|
Other
non-current liabilities
|
4,994 | 6,382 | ||||||
|
Total
liabilities
|
1,861,094 | 2,100,082 | ||||||
|
Shareholders'
equity:
|
||||||||
|
Common
stock; authorized 225,000 at 2009 and 2008, issued and outstanding 71,256
at 2009 and 70,524 at 2008
|
71 | 71 | ||||||
|
Preferred
stock; authorized 50,000 at 2009 and 2008; issued and outstanding 0 at
2009 and 2008
|
- | - | ||||||
|
Additional
paid-in capital
|
804,111 | 765,645 | ||||||
|
Retained
earnings
|
357,350 | 128,648 | ||||||
|
Accumulated
other comprehensive income, net
|
15,939 | 9,006 | ||||||
|
Shareholders'
equity
|
1,177,471 | 903,370 | ||||||
| $ | 3,038,565 | $ | 3,003,452 | |||||
|
See
accompanying notes to consolidated financial
statements.
|
||||||||
|
KINETIC
CONCEPTS, INC. AND SUBSIDIARIES
|
||||||||||||
|
Consolidated
Statements of Earnings
|
||||||||||||
|
(in
thousands, except per share data)
|
||||||||||||
|
Year
Ended December 31,
|
||||||||||||
|
2009
|
2008
|
2007
|
||||||||||
|
Revenue:
|
||||||||||||
|
Rental
|
$ | 1,178,138 | $ | 1,199,778 | $ | 1,146,544 | ||||||
|
Sales
|
814,506 | 678,131 | 463,400 | |||||||||
|
Total
revenue
|
1,992,644 | 1,877,909 | 1,609,944 | |||||||||
|
Rental
expenses
|
667,440 | 715,152 | 672,617 | |||||||||
|
Cost
of sales
|
244,784 | 218,503 | 145,611 | |||||||||
|
Gross
profit
|
1,080,420 | 944,254 | 791,716 | |||||||||
|
Selling,
general and administrative expenses
|
505,214 | 433,331 | 368,878 | |||||||||
|
Research
and development expenses
|
92,088 | 75,839 | 50,532 | |||||||||
|
Acquired
intangible asset amortization
|
40,634 | 25,001 | - | |||||||||
|
In-process
research and development
|
- | 61,571 | - | |||||||||
|
Operating
earnings
|
442,484 | 348,512 | 372,306 | |||||||||
|
Interest
income and other
|
819 | 6,101 | 6,154 | |||||||||
|
Interest
expense
|
(104,918 | ) | (80,753 | ) | (19,883 | ) | ||||||
|
Foreign
currency gain (loss)
|
(4,004 | ) | 1,308 | (624 | ) | |||||||
|
Earnings
before income taxes
|
334,381 | 275,168 | 357,953 | |||||||||
|
Income
taxes
|
105,679 | 108,724 | 120,809 | |||||||||
|
Net
earnings
|
$ | 228,702 | $ | 166,444 | $ | 237,144 | ||||||
|
Net
earnings per share:
|
||||||||||||
|
Basic
|
$ | 3.26 | $ | 2.33 | $ | 3.34 | ||||||
|
Diluted
|
$ | 3.24 | $ | 2.32 | $ | 3.31 | ||||||
|
Weighted
average shares outstanding:
|
||||||||||||
|
Basic
|
70,110 | 71,464 | 70,975 | |||||||||
|
Diluted
|
70,542 | 71,785 | 71,674 | |||||||||
|
See
accompanying notes to consolidated financial
statements.
|
||||||||||||
|
KINETIC
CONCEPTS, INC. AND SUBSIDIARIES
|
|||||||||||||||||||||||
|
Consolidated
Statements of Shareholders' Equity
|
|||||||||||||||||||||||
|
(in
thousands)
|
|||||||||||||||||||||||
|
Common
Stock
|
Additional
Paid-in
|
Retained
Earnings
|
Accumulated
Other Comprehensive
|
Total
Shareholders’
|
|||||||||||||||||||
|
Shares
|
Par
|
Capital
|
(Deficit)
|
Income
|
Equity
|
||||||||||||||||||
|
Balances
at December 31, 2006
|
70,461 | $ | 70 | $ | 575,539 | $ | (244,325 | ) | $ | 24,929 | $ | 356,213 | |||||||||||
|
Net
earnings
|
- | - | - | 237,144 | - | 237,144 | |||||||||||||||||
|
Foreign
currency translation adjustment, net of taxes of $353
|
- | - | - | - | 14,819 | 14,819 | |||||||||||||||||
|
Net
derivative gain, net of taxes of $1
|
- | - | - | - | 1 | 1 | |||||||||||||||||
|
Reclassification
adjustment for derivative losses included in income, net of taxes of
$18
|
- | - | - | - | 33 | 33 | |||||||||||||||||
|
Exercise
of stock options and other
|
1,459 | 2 | 42,738 | - | - | 42,740 | |||||||||||||||||
|
Shares
purchased under ESPP
|
119 | - | 4,083 | - | - | 4,083 | |||||||||||||||||
|
Restricted
stock issued, net of forfeitures and shares withheld for minimum tax
withholdings
|
114 | - | (1,097 | ) | - | - | (1,097 | ) | |||||||||||||||
|
Share-based
compensation expense
|
- | - | 23,084 | - | - | 23,084 | |||||||||||||||||
|
Balances
at December 31, 2007
|
72,153 | $ | 72 | $ | 644,347 | $ | (7,181 | ) | $ | 39,782 | $ | 677,020 | |||||||||||
|
Net
earnings
|
- | - | - | 166,444 | - | 166,444 | |||||||||||||||||
|
Foreign
currency translation adjustment, net of taxes of $565
|
- | - | - | - | (22,170 | ) | (22,170 | ) | |||||||||||||||
|
Net
derivative loss, net of taxes of $(4,806)
|
- | - | - | - | (8,926 | ) | (8,926 | ) | |||||||||||||||
|
Reclassification
adjustment for derivative losses included in income, net of taxes of
$172
|
- | - | - | - | 320 | 320 | |||||||||||||||||
|
Adoption
of convertible debt accounting pronouncement
|
- | - | 99,899 | - | - | 99,899 | |||||||||||||||||
|
Repurchase
of common stock in open-market transactions
|
(2,073 | ) | (1 | ) | (19,384 | ) | (30,615 | ) | - | (50,000 | ) | ||||||||||||
|
Exercise
of stock options and other
|
94 | - | 1,495 | - | - | 1,495 | |||||||||||||||||
|
Shares
purchased under ESPP
|
172 | - | 4,457 | - | - | 4,457 | |||||||||||||||||
|
Restricted
stock issued, net of forfeitures and shares withheld for minimum tax
withholdings
|
178 | - | (1,010 | ) | - | - | (1,010 | ) | |||||||||||||||
|
Share-based
compensation expense
|
- | - | 26,315 | - | - | 26,315 | |||||||||||||||||
|
Convertible
bond note hedge, net of taxes of ($58,178), and warrants
|
- | - | 9,526 | - | - | 9,526 | |||||||||||||||||
|
Balances
at December 31, 2008
|
70,524 | $ | 71 | $ | 765,645 | $ | 128,648 | $ | 9,006 | $ | 903,370 | ||||||||||||
|
Net
earnings
|
- | - | - | 228,702 | - | 228,702 | |||||||||||||||||
|
Foreign
currency translation adjustment, net of taxes of $(148)
|
- | - | - | - | 3,822 | 3,822 | |||||||||||||||||
|
Net
derivative loss, net of taxes of $(2,226)
|
- | - | - | - | (4,133 | ) | (4,133 | ) | |||||||||||||||
|
Reclassification
adjustment for derivative losses included in income, net of taxes of
$3,901
|
- | - | - | - | 7,244 | 7,244 | |||||||||||||||||
|
Exercise
of stock options and other
|
169 | - | 1,441 | - | - | 1,441 | |||||||||||||||||
|
Shares
purchased under ESPP
|
281 | - | 5,938 | - | - | 5,938 | |||||||||||||||||
|
Restricted
stock issued, net of forfeitures and shares withheld for minimum tax
withholdings
|
282 | - | (1,419 | ) | - | - | (1,419 | ) | |||||||||||||||
|
Share-based
compensation expense
|
- | - | 32,506 | - | - | 32,506 | |||||||||||||||||
|
Balances
at December 31, 2009
|
71,256 | $ | 71 | $ | 804,111 | $ | 357,350 | $ | 15,939 | $ | 1,177,471 | ||||||||||||
|
See
accompanying notes to consolidated financial
statements.
|
|||||||||||||||||||||||
|
KINETIC
CONCEPTS, INC. AND SUBSIDIARIES
|
||||||||||||
|
Consolidated
Statements of Cash Flows
|
||||||||||||
|
(in
thousands)
|
||||||||||||
|
Year
ended December 31,
|
||||||||||||
|
2009
|
2008
|
2007
|
||||||||||
|
Cash
flows from operating activities:
|
||||||||||||
|
Net
earnings
|
$ | 228,702 | $ | 166,444 | $ | 237,144 | ||||||
|
Adjustments
to reconcile net earnings to net cash provided by operating
activities:
|
||||||||||||
|
Depreciation,
amortization and other
|
156,930 | 134,709 | 93,823 | |||||||||
|
Provision
for bad debt
|
10,166 | 10,605 | 7,567 | |||||||||
|
Amortization
of deferred gain on sale of headquarters facility
|
(1,070 | ) | (1,070 | ) | (1,070 | ) | ||||||
|
Amortization
of convertible debt discount
|
19,718 | 12,777 | - | |||||||||
|
Write-off
of deferred debt issuance costs
|
3,035 | 860 | 3,922 | |||||||||
|
Share-based
compensation expense
|
32,506 | 26,315 | 23,714 | |||||||||
|
Excess
tax benefit from share-based payment arrangements
|
(1,214 | ) | (1,917 | ) | (14,318 | ) | ||||||
|
Write-off
of in-process research and development
|
- | 61,571 | - | |||||||||
|
Change
in assets and liabilities, net of business acquired:
|
||||||||||||
|
Increase
in accounts receivable, net
|
(29,271 | ) | (39,884 | ) | (33,534 | ) | ||||||
|
Decrease
(increase) in inventories, net
|
(11,953 | ) | 5,632 | (8,731 | ) | |||||||
|
Decrease
(increase) in prepaid expenses and other
|
(1,560 | ) | 2,528 | (5,592 | ) | |||||||
|
Increase
(decrease) in deferred income taxes, net
|
(16,356 | ) | 80,108 | (16,091 | ) | |||||||
|
Increase
(decrease) in accounts payable
|
9,530 | (15,618 | ) | 12,793 | ||||||||
|
Increase
(decrease) in accrued expenses and other
|
(28,291 | ) | (6,085 | ) | 23,409 | |||||||
|
Increase
(decrease) in tax liabilities, net
|
16,649 | (9,844 | ) | 25,902 | ||||||||
|
Net
cash provided by operating activities
|
387,521 | 427,131 | 348,938 | |||||||||
|
Cash
flows from investing activities:
|
||||||||||||
|
Additions
to property, plant and equipment
|
(103,289 | ) | (131,283 | ) | (95,847 | ) | ||||||
|
Decrease
(increase) in inventory to be converted into equipment for short-term
rental
|
8,462 | (11,200 | ) | (5,000 | ) | |||||||
|
Dispositions
of property, plant and equipment
|
4,976 | 5,998 | 2,528 | |||||||||
|
Business
acquired in purchase transaction, net of cash acquired
|
(173 | ) | (1,745,743 | ) | - | |||||||
|
Purchase
of investments
|
- | - | (36,425 | ) | ||||||||
|
Maturities
of investments
|
- | - | 36,425 | |||||||||
|
Increase
in identifiable intangible assets and other non-current
assets
|
(62,894 | ) | (5,007 | ) | (3,366 | ) | ||||||
|
Net
cash used by investing activities
|
(152,918 | ) | (1,887,235 | ) | (101,685 | ) | ||||||
|
Cash
flows from financing activities:
|
||||||||||||
|
Proceeds
from revolving credit facility
|
105,000 | 114,000 | 188,000 | |||||||||
|
Repayments
of long-term debt, revolving credit facility and capital lease
obligations
|
(334,000 | ) | (135,260 | ) | (327,659 | ) | ||||||
|
Payments
of debt issuance costs
|
- | - | (2,359 | ) | ||||||||
|
Repurchase
of common stock in open-market transactions
|
- | (50,000 | ) | - | ||||||||
|
Excess
tax benefit from share-based payment arrangements
|
1,214 | 1,917 | 14,318 | |||||||||
|
Proceeds
from exercise of stock options
|
1,850 | 2,454 | 28,372 | |||||||||
|
Purchase
of immature shares for minimum tax withholdings
|
(1,419 | ) | (1,010 | ) | (2,414 | ) | ||||||
|
Proceeds
from purchase of stock in ESPP and other
|
5,938 | 4,457 | 4,083 | |||||||||
|
Acquisition
financing:
|
||||||||||||
|
Proceeds
from senior credit facility
|
- | 1,000,000 | - | |||||||||
|
Proceeds
from convertible senior notes
|
- | 690,000 | - | |||||||||
|
Repayment
of long-term debt
|
- | (68,000 | ) | - | ||||||||
|
Proceeds
from convertible debt warrants
|
- | 102,458 | - | |||||||||
|
Purchase
of convertible debt hedge
|
- | (151,110 | ) | - | ||||||||
|
Payment
of debt issuance costs
|
- | (60,697 | ) | - | ||||||||
|
Net
cash provided (used) by financing activities
|
(221,417 | ) | 1,449,209 | (97,659 | ) | |||||||
|
Effect
of exchange rate changes on cash and cash equivalents
|
2,204 | (7,331 | ) | 9,253 | ||||||||
|
Net
increase (decrease) in cash and cash equivalents
|
15,390 | (18,226 | ) | 158,847 | ||||||||
|
Cash
and cash equivalents, beginning of year
|
247,767 | 265,993 | 107,146 | |||||||||
|
Cash
and cash equivalents, end of year
|
$ | 263,157 | $ | 247,767 | $ | 265,993 | ||||||
|
See
accompanying notes to consolidated financial
statements.
|
||||||||||||
Notes
to Consolidated Financial Statements
NOTE
1. Summary of Significant Accounting
Policies
(a) Principles of
Consolidation
The
consolidated financial statements presented herein include the accounts of
Kinetic Concepts, Inc., together with its consolidated subsidiaries. All
inter-company balances and transactions have been eliminated in consolidation.
The consolidated entity is referred to herein as "KCI." Certain prior
period amounts have been reclassified to conform to the 2009
presentation.
During
the first quarter of 2009, we redefined our operating segments to correspond
with our current management structure. We have three reportable
operating segments: Active Healing Solutions (“AHS”); Regenerative
Medicine; and Therapeutic Support Systems (“TSS”). We are reporting
financial results consistent with this new structure, including the
reclassification of prior period amounts to conform to this current reporting
structure. The geographic reporting structure continues to consist of
(i) North America, which is comprised of the United States, Canada and Puerto
Rico; and (ii) EMEA/APAC, which is comprised principally of Europe, the Middle
East, Africa and the Asia Pacific region.
(b) Nature of
Operations and Customer Concentration
KCI is a
leading global medical technology company devoted to the discovery, development,
manufacture and marketing of innovative, high-technology therapies and products
that have been designed to leverage the body’s ability to heal, thus improving
clinical outcomes while helping to reduce the overall cost of patient
care. We have an infrastructure designed to meet the specific needs
of medical professionals and patients across all healthcare settings, including
acute care hospitals, extended care organizations and patients’ homes, both in
the United States and abroad. We design, manufacture, market and
service a wide range of proprietary products that can improve clinical outcomes
and can help reduce the overall cost of patient care. Our AHS systems
incorporate our proprietary V.A.C. Therapy technology, which is
clinically-proven to promote wound healing through unique mechanisms of action,
and to speed recovery times while reducing the overall cost of treating patients
with complex wounds. Our Regenerative Medicine products include
tissue-based products for use in reconstructive, orthopedic and urogynecologic
surgical procedures to repair soft tissue defects. Our TSS business
includes specialty hospital beds, mattress replacement systems and overlays,
which are designed to address pulmonary complications associated with influenza,
acute respiratory distress syndrome (“ARDS”) and immobility, to reduce or treat
skin breakdown and assist caregivers in the safe and dignified handling of
patients of size. We have an infrastructure designed to meet the
specific needs of medical professionals and patients across all healthcare
settings, including acute care hospitals, extended care organizations and
patients’ homes, both in the United States and abroad.
We have
direct operations in the United States, Canada, Western Europe, Australia, New
Zealand, Singapore, Hong Kong and South Africa, and we conduct additional
business through distributors in Latin America, the Middle East, Eastern Europe
and Asia. We manage our business in three reportable operating
segments which correspond to our three business units: AHS,
Regenerative Medicine, and TSS. We have operations in two primary
geographic regions: North America, which is comprised principally of the United
States and includes Canada and Puerto Rico; and EMEA/APAC, which is comprised
principally of Europe and includes the Middle East, Africa, and the Asia Pacific
region.
Operations
for our North America geographic region accounted for approximately 77.6%, 76.0%
and 76.0% of our total revenue for 2009, 2008 and 2007,
respectively. In the U.S. acute care setting, which accounted for
approximately half of our North American revenue for the year ended December 31,
2009, we bill our customers directly for the rental and sale of our
products. Also in the U.S. acute and extended care settings, we
contract with both proprietary hospital groups and voluntary group purchasing
organizations, or GPOs. Proprietary hospital groups own all of the
hospitals which they represent and, as a result, can ensure compliance with an
executed national agreement. Voluntary GPOs negotiate contracts on
behalf of member hospital organizations, but cannot ensure that their members
will comply with the terms of an executed national
agreement. Approximately 33.1%, 32.6% and 36.9% of our total revenue
during 2009, 2008 and 2007, respectively, was generated under national
agreements with GPOs. During 2009, 2008 and 2007, we recorded
approximately $192.9 million, $198.3 million and $193.6 million,
respectively, in AHS and TSS revenues under contracts with Novation, LLC, our
largest single GPO relationship.
In the
U.S. homecare setting, where our revenue comes predominantly from our NPWT
products, we provide products and services to patients in the home and bill
third-party payers directly, such as Medicare and private
insurance. During 2009, 2008 and 2007, we recorded revenue related to
Medicare claims of approximately $155.2 million, $170.4 million and
$181.5 million, respectively.
In May
2008, we completed the acquisition of all the outstanding capital stock of
LifeCell for an aggregate purchase price of approximately $1.8
billion. LifeCell operates our Regenerative Medicine business unit
and develops, processes and markets biological soft tissue repair products made
from human or animal tissue. These products are used by surgeons to
restore structure, function and physiology in a variety of reconstructive,
orthopedic and urogynecologic surgical procedures.
Regenerative
Medicine revenue is generated primarily in the United States in the acute care
setting on a direct billing basis. We market our regenerative and
reconstructive acellular tissue matrix products for plastic reconstructive,
general surgical and burn applications primarily to hospitals for use by general
and plastic surgeons. Our primary tissue matrix products, AlloDerm
and Strattice, are marketed through our direct sales and marketing
organization. Our LifeCell sales representatives are responsible for
interacting with plastic surgeons, general surgeons, head and neck surgeons, and
trauma/acute care surgeons to educate them on the use and potential benefits of
our tissue matrix products. We also participate in numerous national
fellowship programs, national and international conferences and trade shows, and
sponsor medical education symposiums. Our tissue matrix products for
orthopedic and urogynecologic procedures are marketed through independent sales
agents and distributors. These products include GraftJacket RTM, for
orthopedic applications and lower extremity wounds; AlloCraftDBM, for bone
grafting procedures; Repliform TRM, for urogynecologic surgical procedures; and
Conexa, for rotator cuff tissue repairs.
In the
EMEA/APAC geographic region, most of our AHS and TSS revenue is generated in the
acute care setting on a direct billing basis.
(c) Use of
Estimates
The
preparation of financial statements in conformity with U.S. generally accepted
accounting principles requires management to make estimates and assumptions that
affect the reported amounts of assets and liabilities and disclosure of
contingent assets and liabilities at the date of the financial statements and
the reported amounts of revenues and expenses during the reporting
period. Actual results could differ from those
estimates.
(d) Revenue
Recognition
We
recognize revenue in accordance with the “Revenue Recognition” Topic of the
Financial Accounting Standards Board (“FASB”) Accounting Standards Codification
when each of the following four criteria are met:
|
1)
|
a
contract or sales arrangement
exists;
|
|
2)
|
products
have been shipped, title has transferred or services have been
rendered;
|
|
3)
|
the
price of the products or services is fixed or determinable;
and
|
|
4)
|
collectibility
is reasonably assured.
|
We
recognize rental revenue based on the number of days a product is used by the
patient or organization, at the contracted rental rate for contracted customers
and generally, retail price for non-contracted customers. Sales
revenue is recognized when products are shipped and title has transferred.
We establish realization reserves against revenue to provide for adjustments
including capitation agreements, credit memos, volume discounts, pricing
adjustments, utilization adjustments, product returns, cancellations, estimated
uncollectible amounts and payer adjustments based on historical
experience. In addition, revenue is recognized net of administrative
fees paid to GPOs.
(e) Cash and Cash
Equivalents
We
consider all highly liquid investments with an original maturity of ninety days
or less to be cash equivalents. We maintain cash and cash equivalents
with several financial institutions. Deposits held with banks may
exceed the amount of insurance provided on such deposits. Generally,
these deposits may be redeemed upon demand and are maintained at financial
institutions of reputable credit and therefore bear minimal credit
risk.
(f) Fair Value of
Financial Instruments
The
carrying amount reported in the balance sheet for cash and cash equivalents,
accounts receivable, accounts payable and long-term obligations, excluding our
senior credit facility and 3.25% Convertible Senior Notes, or the Notes,
approximates fair value. The fair value of our senior credit facility and the
Notes is estimated based upon open-market trades at or near
year-end. The carrying value of our senior credit facility and the
Notes as of December 31, 2009 was $750.0 million and $690.0 million,
respectively, with a corresponding fair value of approximately $729.4 million
and $676.5 million.
(g) Accounts
Receivable
Domestic
trade accounts receivable consist of amounts due directly from acute and
extended care organizations, third-party payers, or TPP, both governmental and
non-governmental, and patient pay accounts. Included within the TPP
accounts receivable balances are amounts that have been or will be billed to
patients once the primary payer portion of the claim has been settled by the
TPP. EMEA/APAC and LifeCell trade accounts receivable consist of
amounts due primarily from acute care organizations.
Significant
concentrations of accounts receivable include:
|
2009
|
2008
|
|||||
|
Acute
and extended care organizations
|
54 | % | 50 | % | ||
|
Managed
care, insurance and other
|
34 | % | 36 | % | ||
|
Medicare/Medicaid
|
11 | % | 12 | % | ||
|
Other
|
1 | % | 2 | % |
The
domestic TPP reimbursement process requires extensive documentation, which has
had the effect of slowing both the billing and cash collection cycles relative
to the rest of the business, and therefore, increasing total accounts
receivable. Because of the extensive documentation required and the
requirement to settle a claim with the primary payer prior to billing the
secondary and/or patient portion of the claim, the collection period for a claim
in our homecare business may, in some cases, extend beyond one year prior to
full settlement of the claim.
We
utilize a combination of factors in evaluating the collectibility of our
accounts receivable. For unbilled receivables, we establish reserves
against revenue to allow for expected denied or uncollectible
items. In addition, items that remain unbilled for more than a
specified period of time, or beyond an established billing window, are reserved
against revenue. For billed receivables, we generally establish
reserves against revenue and bad debt using a combination of factors including
historic adjustment rates for credit memos and cancelled transactions,
historical collection experience, and the length of time receivables have been
outstanding. The reserve rates vary by payer group. In
addition, we record specific reserves for bad debt when we become aware of a
customer's inability or refusal to satisfy its debt obligations, such as in the
event of a bankruptcy filing.
(h) Inventories
AHS
and TSS inventories
Inventories
are stated at the lower of cost (first-in, first-out) or market (net realizable
value). Costs include material, labor and manufacturing overhead costs.
Inventory expected to be converted into equipment for short-term rental is
reclassified to property, plant and equipment. We review our inventory balances
monthly for excess sale products or obsolete inventory levels. Inventory
quantities of sale-only products in excess of anticipated demand are considered
excess and are reserved at 100%. For rental products, we review both product
usage and product life cycle to classify inventory as active, discontinued or
obsolete. Obsolescence reserve balances are established on an increasing basis
from 0% for active, high-demand products to 100% for obsolete products. The
reserve is reviewed, and if necessary, adjustments are made on a monthly basis.
We rely on historical information and production planning forecasts to support
our reserve and utilize management's business judgment for "high risk" items,
such as products that have a fixed shelf life. Once the value of inventory is
reduced, we do not adjust the reserve balance until the inventory is sold or
otherwise disposed.
Our
manufacturing plant in Athlone, Ireland currently manufactures our V.A.C.
Therapy units for our global markets. Our Ireland plant also
manufactures certain disposable supplies, on a high-volume automation line,
which have historically been supplied by Avail Medical Products, Inc., a
subsidiary of Flextronics International Ltd. We plan to continue
leveraging our existing infrastructure and manufacturing capabilities within our
Athlone plant and expand internal production in the future. In 2007,
we entered into a supply agreement with Avail, which has a term of five years
through November 2012 and may be renewed by agreement of both
parties. Under this agreement, we have title to the raw materials
used to manufacture our disposable supplies and retain title of all disposables
inventory throughout the manufacturing process. The terms of the
supply agreement provide that key indicators be provided to us that would alert
us to any inability of Avail to perform under the
agreement. Approximately 22.6%, 24.1% and 24.1% of our total revenue
for the years ended December 31, 2009, 2008 and 2007, respectively, was
generated from the sale of NPWT disposables.
Regenerative
Medicine inventories
Inventories
are stated at the lower of cost or market, with cost being determined on a
first-in, first-out basis. Inventories on hand include the cost of
materials, freight, direct labor and manufacturing overhead. We
record a provision for excess and obsolete inventory based primarily on
inventory quantities on hand, the historical product sales and estimated
forecast of future product demand and production requirements. In
addition, we record a provision for tissue that will not meet tissue standards
based on historic rejection rates.
(i) Vendor
Rebates
We may
receive consideration from vendors in the normal course of business in the form
of rebates of purchase price paid. Our policy for accounting for
these funds is in accordance with the “Revenue Recognition” Topic of the FASB
Accounting Standards Codification. Funds are recognized as a
reduction of cost of sales and inventory if the funds are a reduction of the
price for the vendor’s products.
(j) Long-Lived
Assets
Property,
plant and equipment are stated at cost. Betterments, which extend the useful
life of the equipment, are capitalized. Software development costs
for internal use are capitalized pursuant to the “Intangibles-Goodwill and
Other” Topic of the Codification. Debt issuance costs at December 31,
2009 represent fees and other direct costs incurred in connection with our
borrowings. These amounts are capitalized and amortized using the
effective interest method over the contractual term of the
borrowing. During 2008, we capitalized $60.7 million related to the
completion of our acquisition financing. (See Note
2.) Other assets consist principally of patents, trademarks,
long-term investments and our investment in assets subject to leveraged
leases. Patents and trademarks are amortized over the estimated
useful life of the respective asset using the straight-line method unless
another method is determined to be more appropriate. Patent and
trademark costs associated with products for which we are no longer pursuing
development are written-off to expense.
Depreciation
on property, plant and equipment is calculated on the straight-line method over
the estimated useful lives (20 to 30 years for buildings and between three
and seven years for most of our other property and equipment) of the assets.
Amortization for leasehold improvements is taken over the shorter of the
estimated useful life of the asset or over the remaining lease
term. Depreciation expense for 2009, 2008 and 2007 was $99.3 million,
$97.1 million and $84.4 million, respectively.
(k) Goodwill and
Other Intangible Assets
Goodwill
represents the excess purchase price over the fair value of net assets acquired.
Goodwill is tested at least annually by reporting unit for impairment, or more
frequently when events or changes in circumstances indicate that the asset might
be impaired. For indefinite lived intangible assets, impairment is tested by
comparing the carrying value of the asset to the fair value of the reporting
unit. KCI defines its reporting units at the same level as our segments
disclosed in Note 17: AHS, Regenerative Medicine and TSS. Goodwill was tested
for impairment during the fourth quarter of 2009 and we determined no impairment
write down was required.
The fair
value of each reporting unit was primarily determined using discounted cash flow
models. Significant assumptions included risk-based discount rates ranging from
11% to 15%, estimated growth rates based on KCI’s long-range planning model and
terminal values of each reporting unit based on a growth rate of 3.5% after the
10th year. Goodwill arising from the LifeCell purchase was allocated to the
applicable reporting units based on the discounted projected benefit received by
that reporting unit. (See Note 4.)
Identifiable
intangible assets include developed technology, customer relationships,
trademarks and patents. We amortize our identifiable intangible
assets over 2 to 20 years, depending on the estimated economic or
contractual life of the individual asset.
(l) Income
Taxes
Deferred
income taxes are accounted for using the asset and liability method of
accounting for income taxes, whereby deferred tax assets and liabilities are
recognized based on the tax effects of temporary differences between the
financial statements and the tax bases of assets and liabilities, as measured by
current enacted tax rates. When appropriate, we evaluate the need for a
valuation allowance to reduce our deferred tax assets.
A
liability is recorded for unrecognized tax benefits resulting from uncertain tax
positions taken or expected to be taken in a tax return. We recognize
interest and penalties, if any, related to unrecognized tax benefits in income
tax expense.
At
December 31, 2009, deferred tax assets recorded by KCI increased from 2008.
We have established a valuation allowance to reduce deferred tax assets
associated with foreign net operating losses, certain foreign deferred tax
assets and state research and development credits to an amount whose realization
is more likely than not. We anticipate that the reversal of existing
taxable temporary difference and future income will provide sufficient taxable
income to realize the tax benefit of the remaining deferred tax assets;
therefore we have not provided a valuation allowance.
The
effective income tax rate for 2009 was 31.6% compared to 39.5% in 2008.
The decrease in the effective income tax rate was due primarily to the
non-deductibility of the $61.6 million write-off of in-process research and
development (“IPR&D”) associated with the LifeCell acquisition recorded in
2008.
(m) Net Earnings Per
Share
Basic net
earnings per share, or EPS, is computed by dividing net earnings by the weighted
average number of common shares outstanding for the period. Diluted EPS reflects
the potential dilution that could occur if securities or other contracts to
issue common stock were exercised or converted into common stock or resulted in
the issuance of common stock. The dilutive effect is calculated based
on the average share price for each fiscal period using the treasury stock
method.
(n) Royalties
We pay
royalties for the right to market many of our medical
devices. Royalties are based on applicable revenue and recognized in
the period that the related revenue is earned. Royalties related to
rental revenue are included in rental expense. Royalties on sales
revenue are included in cost of sales.
(o) Self-Insurance
We
self-insure certain employee benefit and casualty insurance
risks. Our group medical plan for U.S. employees is a qualified
self-insured plan subject to specific stop loss insurance coverage. Our
short-term disability plan for U.S. based employees is self-insured. The Texas
Employee Injury Benefit Plan is self-insured subject to a $1,000,000 per
occurrence deductible. Our casualty insurance program has a $750,000 deductible
for workers’ compensation, auto liability, and general liability and a $500,000
deductible for products liability. Our group life and accidental
death and dismemberment plan and our long-term disability plan are all fully
insured. We fully accrue our self-insurance and retained loss liabilities,
including claims incurred but not reported. Based on historical
trends, we believe our accruals for self-insured and retained losses are
adequate to cover future losses.
(p) Interest Rate
Protection Agreements
We use
derivative financial instruments to manage the economic impact of fluctuations
in interest rates. Periodically, we enter into interest rate
protection agreements to modify the interest characteristics of our outstanding
debt. Each interest rate swap is designated as a hedge of interest
payments associated with specific principal balances and terms of our debt
obligations. These agreements involve the exchange of amounts based
on variable interest rates, for amounts based on fixed interest rates over the
life of the agreement, without an exchange of the notional amount upon which the
payments are based. The differential to be paid or received, as
interest rates change, is accrued and recognized as an adjustment to interest
expense related to the debt. The value of our contracts at December
31, 2009 was determined based on inputs that are readily available in public
markets or can be derived from information available in publicly quoted markets.
(See Note 6.)
(q) Foreign Currency
Exchange Contracts
We use
derivative financial instruments to manage the economic impact of fluctuations
in currency exchange rates on our intercompany balances and corresponding cash
flows. We enter into foreign currency exchange contracts to manage
these economic risks. As required, KCI recognizes all derivative
instruments on the balance sheet at fair value. Gains and losses
resulting from the foreign currency fluctuations impact to transactional
exposures are included in foreign currency gain (loss) in our consolidated
statements of earnings. (See Note 6.)
(r) Convertible
Instruments
We
evaluate and account for conversion options embedded in convertible instruments
in accordance with the “Derivatives and Hedging” Topic of the FASB Accounting
Standards Codification and other related guidance. On January 1, 2009, KCI
adopted changes issued by the FASB related to the accounting for convertible
debt instruments that may be settled in cash upon conversion. The
impact associated with our adoption of these changes is disclosed in this
report. (See Note 1 (bb).)
(s) Foreign Currency
Translation and Transaction Gains and Losses
The
functional currency for the majority of our foreign operations is the applicable
local currency. The translation of the applicable foreign currencies into U.S.
dollars is performed for balance sheet accounts using the exchange rates in
effect at the balance sheet date and for revenue and expense accounts using a
weighted average exchange rate during the period. Gains and losses resulting
from the foreign currency translations are included in accumulated other
comprehensive income. Transaction gains and losses, such as those
resulting from the settlement of nonfunctional currency receivables or payables,
including intercompany balances, are included in foreign currency gain (loss) in
our consolidated statements of earnings. Additionally, payable and
receivable balances denominated in nonfunctional currencies are marked-to-market
at month-end, and the gain or loss is recognized in our consolidated statements
of earnings.
(t) Concentration of
Credit Risk
KCI has a
concentration of credit risk with financial institutions related to its
derivative instruments and the Note Hedge described in Note 5. As of
December 31, 2009, Bank of America and JP Morgan Chase collectively held equity
hedges related to our Note Hedge as described in Note 5 in notional amounts
totaling $352.9 million. Bank of America was also the counterparty on
some of our interest rate protection agreements and our foreign currency
exchange contracts in notional amounts totaling $59.9 million and $8.9 million,
respectively. Additionally, JP Morgan Chase was a counterparty on
some of our foreign currency exchange contracts in notional amounts totaling
$6.7 million. We use master netting agreements with our derivative
counterparties to reduce our risk and use multiple counterparties to reduce our
concentration of credit risk.
(u) Share-based
Compensation
We
measure and recognize share-based compensation expense over the estimated
service period for all share-based payment awards, including stock options,
restricted stock awards and restricted stock units based on estimated fair
values on the date of grant.
KCI has
elected to use the Black-Scholes model to estimate the fair value of option
grants. We believe that the use of the Black-Scholes model meets the
fair value measurement objective and reflects all substantive characteristics of
the instruments being valued. Estimates of fair value are not
intended to predict actual future events or the value ultimately realized by
employees who receive share-based compensation awards, and subsequent events
will not affect the original estimates of fair value made by us.
Share-based
compensation expense was recognized in the consolidated statements of earnings
for 2009, 2008 and 2007, as follows (dollars in thousands, except per share
data):
|
Year
ended December 31,
|
||||||||||||
|
2009
|
2008
|
2007
|
||||||||||
|
Rental
expenses
|
$ | 4,974 | $ | 4,955 | $ | 5,322 | ||||||
|
Cost
of sales
|
978 | 559 | 623 | |||||||||
|
Selling,
general and administrative expenses
|
26,554 | 20,801 | 17,769 | |||||||||
|
Pre-tax
share-based compensation expense
|
32,506 | 26,315 | 23,714 | |||||||||
|
Less: Income
tax benefit
|
(10,851 | ) | (8,310 | ) | (6,933 | ) | ||||||
|
Total
share-based compensation expense, net of tax
|
$ | 21,655 | $ | 18,005 | $ | 16,781 | ||||||
KCI
estimates forfeitures when recognizing compensation costs. We will
adjust our estimate of forfeitures as actual forfeitures differ from our
estimates, resulting in the recognition of compensation cost only for those
awards that actually vest.
The
weighted-average estimated fair value of stock options granted during 2009, 2008
and 2007 was $11.48, $19.52 and $24.30, respectively, using the Black-Scholes
option pricing model with the following weighted average assumptions (annualized
percentages):
|
2009
|
2008
|
2007
|
|||||||
|
Expected
stock volatility
|
43.7 | % | 39.4 | % | 39.6 | % | |||
|
Expected
dividend yield
|
- | - | - | ||||||
|
Risk-free
interest rate
|
2.2 | % | 3.2 | % | 4.5 | % | |||
|
Expected
life (years)
|
6.2 | 6.3 | 6.2 |
The
expected stock volatility is based on historical volatilities of KCI and other
similar entities. The expected dividend yield is 0% as we have
historically not paid cash dividends on our common stock. The
risk-free interest rates for periods within the contractual life of the option
are based on the U.S. Treasury yield curve in effect at the time of
grant. We have chosen to estimate expected life using the simplified
method as permitted rather than using our own historical expected life as there
has not been sufficient history since we completed our initial public offering
to allow us to better estimate this variable.
(v) Research and
Development
The focus
of our research and development program has been to invest in clinical studies
and the development of new advanced wound healing systems, products and
dressings. This includes the development of new and synergistic
technologies across the continuum of wound care including tissue regeneration,
preservation and repair, new applications of negative pressure technology, as
well as upgrading and expanding our surface technologies in our TSS business and
the leveraging of our core understanding of biological tissues in order to
develop biosurgery products in our regenerative medicine
business. The types of costs classified as research and development
expense include salaries of technical staff, consultant costs, facilities and
utilities costs related to offices occupied by technical staff, depreciation on
equipment and facilities used by technical staff, supplies and materials for
research and development and outside services such as prototype development and
testing and third-party research and development costs. Expenditures for
research and development, including expenses related to clinical studies, are
expensed as incurred.
(w) Shipping and
Handling
We
include shipping and handling costs in rental expense and cost of sales, as
appropriate. Shipping and handling costs on sales products recovered
from customers of $4.3 million, $4.2 million and $2.8 million for the
years ended December 31, 2009, 2008 and 2007, respectively, are included in
sales revenue for these periods.
(x) Taxes Collected
from Customers and Remitted to Governmental Units
Taxes
assessed by a government authority that are directly imposed on a revenue
producing transaction between KCI and our customers, including but not limited
to sales taxes, use taxes and value added taxes, are accounted for on a net
(excluded from revenues and costs) basis.
(y) Advertising
Expenses
Advertising
costs are expensed as incurred. Advertising expenses were $13.3
million, $12.1 million and $8.1 million for the years ended December 31, 2009,
2008 and 2007, respectively.
(z) Seasonality
Historically,
we have experienced a seasonal slowing of AHS unit growth beginning in the
fourth quarter and continuing into the first quarter, which we believe has been
caused by year-end clinical treatment patterns, such as the postponement of
elective surgeries and increased discharges of individuals from the acute care
setting. Regenerative Medicine has also historically experienced a
similar seasonal slowing of sales in the third quarter of each
year.
(aa) Legal
Proceedings and Other Loss Contingencies
We are
subject to various legal proceedings, many involving routine litigation
incidental to our business. The outcome of any legal proceeding is
not within our complete control, is often difficult to predict and is resolved
over very long periods of time. Estimating probable losses associated
with any legal proceedings or other loss contingencies is very complex and
requires the analysis of many factors including assumptions about potential
actions by third parties. Loss contingencies are disclosed when there
is at least a reasonable possibility that a loss has been incurred and are
recorded as liabilities in the consolidated financial statements when it is both
(1) probable or known that a liability has been incurred and (2) the
amount of the loss is reasonably estimable. If the reasonable estimate of the
loss is a range and no amount within the range is a better estimate, the minimum
amount of the range is recorded as a liability. If a loss contingency
is not probable or cannot be reasonably estimated, a liability is not recorded
in the consolidated financial statements.
(bb) Recently Adopted
Accounting Principles
In June
2009, the Financial Accounting Standards Board (“FASB”) issued a new
pronouncement which establishes the single source of authoritative U.S.
generally accepted accounting principles (“GAAP” or “the
Codification”). Rules and interpretive releases of the Securities and
Exchange Commission (“SEC”) under authority of federal securities laws are also
sources of authoritative GAAP for SEC registrants. The Codification
superseded all previously-existing non-grandfathered non-SEC accounting and
reporting standards. The Codification reorganizes all GAAP into
approximately 90 accounting topics and displays them using a consistent
structure, and includes relevant SEC guidance organized using the same topical
structure in separate sections. This statement was effective for KCI beginning
September 30, 2009. This pronouncement does not change GAAP; therefore, our
adoption of this pronouncement did not have an impact on our results of
operations, financial condition or cash flows.
On
January 1, 2009, KCI adopted changes issued by the FASB related to the
accounting for convertible debt instruments that may be settled in cash upon
conversion (including partial cash settlement). These changes specify
that issuers of such instruments account separately for the liability and equity
components of convertible debt instruments in a manner that reflects an issuer’s
estimated non-convertible debt borrowing rate. Upon adoption of these
changes, we allocated the proceeds received from the issuance of the convertible
notes between a liability component and equity component by determining the fair
value of the liability component using our estimated non-convertible debt
borrowing rate. The difference between the proceeds of the notes and
the fair value of the liability component was recorded as a discount on the debt
with a corresponding offset to paid-in-capital (the equity component), net of
applicable deferred income taxes and the portion of debt issuance costs
allocated to the equity component. The resulting debt discount will
be accreted by recording additional non-cash interest expense over the expected
life of the convertible notes using the effective interest rate method. The
accounting changes were effective for periods subsequent to December 15, 2008
and were applied retroactively. Due to the required retrospective
application, the notes reflect a lower principal balance and additional non-cash
interest expense has been recorded based on our estimated non-convertible
borrowing rate. For 2009, we recorded $22.4 million of interest
related to the contractual interest coupon rate. Additionally, based
on our estimated non-convertible borrowing rate of 7.78%, the adoption of the
accounting changes resulted in approximately $19.7 million and $12.8 million of
additional non-cash interest expense for 2009 and 2008,
respectively.
Upon
adoption, we adjusted the previously-reported amounts in our consolidated
statement of earnings for the year ended December 31, 2008 and our balance sheet
as of December 31, 2008 as follows (in thousands, except per share
data)
|
Year
Ended December 31, 2008
|
||||||||||||
|
As
Reported
|
Adjustments
|
As
Adjusted
|
||||||||||
|
Statement
of Earnings:
|
||||||||||||
|
Interest
expense
|
$ | 68,639 | $ | 12,114 | $ | 80,753 | ||||||
|
Income
taxes
|
$ | 113,387 | $ | (4,663 | ) | $ | 108,724 | |||||
|
Net
earnings
|
$ | 173,895 | $ | (7,451 | ) | $ | 166,444 | |||||
|
Net
earnings per share:
|
||||||||||||
|
Basic
|
$ | 2.43 | $ | (0.10 | ) | $ | 2.33 | |||||
|
Diluted
|
$ | 2.42 | $ | (0.10 | ) | $ | 2.32 | |||||
|
December
31, 2008
|
||||||||||||
|
As
Reported
|
Adjustments
|
As
Adjusted
|
||||||||||
|
Balance
Sheet:
|
||||||||||||
|
Debt
issuance costs, net
|
$ | 53,528 | $ | (3,233 | ) | $ | 50,295 | |||||
|
Long-term
debt, net of current installments and discount
|
$ | 1,569,000 | $ | (153,557 | ) | $ | 1,415,443 | |||||
|
Long-term
deferred income taxes
|
$ | 181,745 | $ | 57,876 | $ | 239,621 | ||||||
|
Additional
paid-in capital
|
$ | 665,746 | $ | 99,899 | $ | 765,645 | ||||||
|
Retained
earnings
|
$ | 136,099 | $ | (7,451 | ) | $ | 128,648 | |||||
On
January 1, 2009, KCI adopted changes issued by the FASB which enhance the
required disclosures regarding derivatives and hedging
activities. The adoption of the changes did not have a material
impact on our results of operations or our financial position. (See
Notes 5 and 6.)
On
January 1, 2009, KCI adopted changes issued by the FASB related to the
determination of the useful life of intangible assets. These changes
amend the factors that should be considered in developing renewal or extension
assumptions used to determine the useful life of a recognized intangible
asset. The changes are intended to improve the consistency between
the useful life of an intangible asset and the period of expected cash flows
used to measure the fair value of the asset. The adoption of the changes did not
have a material impact on our results of operations or our financial
position.
NOTE
2. Acquisition
On May
27, 2008, we completed the acquisition of all the outstanding capital stock of
LifeCell Corporation (“LifeCell”) for an aggregate purchase price of
approximately $1.8 billion. The purchase price consisted of $1.7
billion of cash paid to acquire the outstanding common stock of LifeCell, at a
price of $51.00 per share, $83.0 million in fair value of assumed vested stock
options, restricted stock awards and restricted stock units, and $20.7 million
of acquisition related transaction costs, which primarily consisted of fees
incurred for financial advisory and legal services.
The
LifeCell acquisition was accounted for as a business combination using the
purchase method and, accordingly, the fair value of the net assets acquired and
the results of operations for LifeCell have been included in KCI’s consolidated
financial statements from the acquisition date forward. The
preliminary allocation of the total purchase price to LifeCell’s net tangible
and identifiable intangible assets was based on their estimated fair values as
of the acquisition date. Adjustments to these estimates have been
included in the final allocation of the purchase price of
LifeCell. The excess of the purchase price over the identifiable
intangible and net tangible assets, in the amount of $1.3 billion, was allocated
to goodwill.
The
following table represents the final allocation of the purchase price as of the
acquisition date (dollars in thousands):
|
June
30, 2008
|
Adjustments
|
May
27, 2009
|
||||||||||
|
Goodwill
|
$ | 1,286,508 | $ | (6,524 | ) | $ | 1,279,984 | |||||
|
Identifiable
intangible assets
|
486,653 | 486,653 | ||||||||||
|
In-process
research and development
|
61,571 | 61,571 | ||||||||||
|
Tangible
assets acquired and liabilities assumed:
|
||||||||||||
|
Cash
and cash equivalents
|
96,269 | 96,269 | ||||||||||
|
Accounts
receivable
|
27,053 | 27,053 | ||||||||||
|
Inventories
|
66,298 | 66,298 | ||||||||||
|
Other
current assets
|
6,031 | 1,101 | 7,132 | |||||||||
|
Property
and equipment
|
37,331 | 37,331 | ||||||||||
|
Current
liabilities
|
(48,546 | ) | (4,377 | ) | (52,923 | ) | ||||||
|
Noncurrent
tax liabilities
|
(5,101 | ) | (4,295 | ) | (9,396 | ) | ||||||
|
Net
deferred income tax liability
|
(171,829 | ) | 14,042 | (157,787 | ) | |||||||
|
Total purchase
price
|
$ | 1,842,238 | $ | (53 | ) | $ | 1,842,185 | |||||
Purchase
accounting rules require that as certain pre-merger issues are identified,
modified or resolved, resulting increases or decreases to the preliminary value
of assets and liabilities are offset by a change in
goodwill. Modifications to goodwill reflected in the “Adjustments”
column above were primarily the result of a transaction cost analysis resulting
in the identification of additional tax deductions and severance costs
associated with the transaction, net of the related tax effects.
The
following sets forth the sources and uses of funds in connection with the
acquisition of LifeCell (dollars in thousands):
|
Amount
|
||||
|
Source
of funds:
|
||||
|
Borrowings
under the senior credit facility
|
$ | 1,000,000 | ||
|
Gross
proceeds from the sale of the 3.25% convertible senior
notes
|
690,000 | |||
|
Gross
proceeds from convertible debt warrants
|
102,458 | |||
|
Cash
on hand
|
329,534 | |||
|
Total
|
$ | 2,121,992 | ||
|
Use
of funds:
|
||||
|
Purchase
of LifeCell common stock and net settlement of options
|
$ | 1,821,496 | ||
|
Repayment
of debt under previous senior credit facility
|
68,000 | |||
|
Purchase
of convertible debt hedge
|
151,110 | |||
|
Transaction
fees and expenses for the Acquisition Financing (1)
|
60,697 | |||
|
Transaction
fees and expenses for the LifeCell acquisition
|
20,689 | |||
|
Total
|
$ | 2,121,992 | ||
|
|
||||
|
(1)
Transaction fees and expenses for the senior credit facility and the 3.25%
convertible senior notes have been deferred and will be amortized over
the life of the debt instruments.
|
||||
The
results of LifeCell’s operations since the acquisition date have been included
in our consolidated financial statements. The following table
reflects the unaudited pro forma consolidated results of operations, as though
the acquisition of LifeCell had occurred as of the beginning of the periods
being presented (dollars in thousands, except per share data):
|
Year
ended December 31,
|
||||||||
|
2008
|
2007
|
|||||||
|
(unaudited)
|
(unaudited)
|
|||||||
|
Pro
forma revenue
|
$ | 1,962,903 | $ | 1,800,462 | ||||
|
Pro
forma net earnings
|
$ | 216,229 | $ | 161,090 | ||||
|
Pro
forma net earnings per share:
|
||||||||
|
Basic
|
$ | 3.03 | $ | 2.27 | ||||
|
Diluted
|
$ | 3.01 | $ | 2.25 | ||||
Only
items with a continuing effect may be presented as adjustments when preparing
the pro forma income statement. As a result, the unaudited pro forma
results exclude the effects of the increased valuation of inventory and related
costs of goods sold and the in-process research and development expense recorded
in connection with the LifeCell acquisition as these represented non-recurring
expenses. The unaudited pro forma financial results presented above
are for illustrative purposes only and are not necessarily indicative of what
actually would have occurred had the acquisition been in effect for the period
presented, nor are they indicative of future operating results.
NOTE
3. Supplemental Balance Sheet
Data
(a) Accounts
Receivable
Accounts
receivable consist of the following (dollars in thousands):
|
December
31,
|
December
31,
|
|||||||
|
2009
|
2008
|
|||||||
|
Gross
trade accounts receivable:
|
||||||||
|
North
America:
|
||||||||
|
Acute
and extended care organizations
|
$ | 135,634 | $ | 122,373 | ||||
|
Medicare
/ Medicaid
|
56,316 | 58,662 | ||||||
|
Managed
care, insurance and other
|
178,613 | 184,172 | ||||||
|
North
America - trade accounts receivable
|
370,563 | 365,207 | ||||||
|
EMEA/APAC
- trade accounts receivable
|
114,146 | 98,500 | ||||||
|
LifeCell
– trade accounts receivable
|
34,773 | 33,521 | ||||||
|
Total
trade accounts receivable
|
519,482 | 497,228 | ||||||
|
Less: Allowance
for revenue adjustments
|
(96,640 | ) | (94,516 | ) | ||||
|
Gross
trade accounts receivable
|
422,842 | 402,712 | ||||||
|
Less: Allowance
for bad debt
|
(8,851 | ) | (9,469 | ) | ||||
|
Net
trade accounts receivable
|
413,991 | 393,243 | ||||||
|
Employee
and other receivables
|
11,051 | 12,764 | ||||||
| $ | 425,042 | $ | 406,007 | |||||
(b) Inventories
Inventories
consist of the following (dollars in thousands):
|
December
31,
|
December
31,
|
|||||||
|
2009
|
2008
|
|||||||
|
Finished
goods and tissue available for distribution
|
$ | 71,620 | $ | 68,837 | ||||
|
Goods
and tissue in-process
|
13,418 | 9,892 | ||||||
|
Raw
materials, supplies, parts and unprocessed tissue
|
65,910 | 64,242 | ||||||
| 150,948 | 142,971 | |||||||
|
Less:
Amounts expected to be converted into equipment for
|
||||||||
|
short-term
rental
|
(18,538 | ) | (27,000 | ) | ||||
|
Reserve
for excess and obsolete inventory
|
(11,366 | ) | (6,874 | ) | ||||
| $ | 121,044 | $ | 109,097 | |||||
(c) Net
property, plant and equipment
Net
property, plant and equipment consists of the following (dollars in
thousands):
|
December
31,
|
December
31,
|
|||||||
|
2009
|
2008
|
|||||||
|
Land
|
$ | 1,837 | $ | 599 | ||||
|
Buildings
|
16,710 | 16,501 | ||||||
|
Equipment
for short-term rental
|
357,126 | 363,743 | ||||||
|
Machinery,
equipment and furniture (1)
|
326,453 | 275,288 | ||||||
|
Leasehold
improvements
|
79,540 | 68,561 | ||||||
|
Inventory
to be converted to equipment
|
18,538 | 27,000 | ||||||
| 800,204 | 751,692 | |||||||
|
Less
accumulated depreciation (1)
|
(504,149 | ) | (447,893 | ) | ||||
| $ | 296,055 | $ | 303,799 | |||||
|
|
||||||||
|
(1)
Net
property, plant and equipment as of December 31, 2009 and 2008 includes
approximately $1.0 million and $1.2 million, respectively, in machinery,
equipment and furniture under various capital
leases.
|
||||||||
(d) Accrued
expenses and other
Accrued
expenses and other consist of the following (dollars in thousands):
|
December
31,
|
December
31,
|
|||||||
|
2009
|
2008
|
|||||||
|
Payroll,
benefits, commissions, bonuses and related taxes
|
$ | 76,861 | $ | 81,221 | ||||
|
Royalty
accrual
|
45,993 | 63,870 | ||||||
|
Derivative
liability
|
10,341 | 13,240 | ||||||
|
Interest
accruals
|
4,876 | 4,705 | ||||||
|
Insurance
accruals
|
6,691 | 5,915 | ||||||
|
Other
accrued expenses
|
82,061 | 89,715 | ||||||
| $ | 226,823 | $ | 258,666 | |||||
NOTE
4. Accounting for Goodwill and Other
Non-current Assets
(a) Goodwill
The
components of goodwill by reporting unit are listed below (dollars in
thousands):
|
December
31,
|
December
31,
|
|||||||
|
2009
|
2008
|
|||||||
|
AHS
|
$ | 167,639 | $ | 167,639 | ||||
|
Regenerative
Medicine
|
1,118,206 | 1,127,135 | ||||||
|
TSS
|
43,036 | 43,036 | ||||||
| $ | 1,328,881 | $ | 1,337,810 | |||||
The
change in goodwill is related to the final allocation of the purchase price of
our acquisition of LifeCell. As of December 31, 2009 and 2008, we
allocated $161.8 million of goodwill related to the LifeCell acquisition to our
AHS reporting unit based on the discounted projected benefit to be received by
this reporting unit.
(b) Identifiable intangible
assets
Identifiable
intangible assets include the following (dollars in thousands):
|
December
31,
|
December
31,
|
|||||||
|
2009
|
2008
|
|||||||
|
Developed
technology
|
$ | 238,391 | $ | 238,391 | ||||
|
Customer
relationships
|
192,204 | 192,204 | ||||||
|
Tradenames
and patents
|
140,234 | 78,725 | ||||||
|
Identifiable
intangible assets
|
570,829 | 509,320 | ||||||
|
Accumulated
amortization
|
(81,616 | ) | (36,773 | ) | ||||
| $ | 489,213 | $ | 472,547 | |||||
The
increase in identifiable intangible assets in 2009 is due primarily to patents
purchased related to V.A.C. Therapy technology.
Amortization
expense, related to definite-lived intangibles, was approximately $44.8 million,
$26.0 million, and $1.3 million for 2009, 2008 and 2007,
respectively. During 2009 and 2008, we recorded approximately $40.6
million and $25.0 million, respectively, of amortization expense associated with
acquired identifiable intangible assets. We amortize our intangible
assets over 2 to 20 years, depending on the estimated economic or
contractual life of the individual asset. The following table shows
the estimated amortization expense, in total, to be incurred over the next five
years for all definite-lived intangible assets as of December 31, 2009 (dollars
in thousands):
|
Estimated
|
||||
|
Year
ending
|
Amortization
|
|||
|
December
31,
|
Expense
|
|||
|
2010
|
$ | 52,005 | ||
|
2011
|
$ | 49,399 | ||
|
2012
|
$ | 49,399 | ||
|
2013
|
$ | 43,726 | ||
|
2014
|
$ | 38,052 | ||
(c) Debt
issuance costs
As of
December 31, 2009, unamortized debt issuance costs related to our current senior
credit facility and convertible senior notes were $35.2
million. Amortization of debt issuance costs recorded for the years
ended December 31, 2009, 2008 and 2007 were $15.1 million, $7.9 million and $4.8
million, respectively. The amortization for 2009, 2008 and 2007
includes approximately $3.0 million, $860,000 and $3.9 million, respectively, of
debt issuance costs written off in connection with our redemptions of our
subordinated notes and prepayments on our previously-existing senior revolving
credit facility. The remaining costs for the current senior credit
facility and convertible notes are amortized on a straight-line basis or using
the effective interest method, as appropriate, over the respective term of debt
to which they specifically relate.
NOTE
5. Long-Term Debt
Long-term
debt consists of the following (dollars in thousands):
|
December
31,
|
December
31,
|
|||||||
|
2009
|
2008
|
|||||||
|
Senior
Credit Facility – due 2013
|
$ | 750,000 | $ | 950,000 | ||||
|
Senior
Revolving Credit Facility – due 2013
|
- | 29,000 | ||||||
|
3.25%
Convertible Senior Notes due 2015
|
690,000 | 690,000 | ||||||
|
Less:
Convertible Notes Discount, net of accretion
|
(133,839 | ) | (153,557 | ) | ||||
| 1,306,161 | 1,515,443 | |||||||
|
Less: current
installments
|
(132,353 | ) | (100,000 | ) | ||||
| $ | 1,173,808 | $ | 1,415,443 | |||||
Senior
Credit Facility
On May
19, 2008, we entered into a new $1.3 billion senior secured credit facility due
May 2013.
Loans. The senior credit
facility consists of a $1.0 billion term loan facility and a $300.0 million
revolving credit facility. Up to $75.0 million of the revolving
credit facility is available for letters of credit and up to $25.0 million of
the revolving credit facility is available for swing-line
loans. Amounts available under the revolving credit facility are
available for borrowing and reborrowing until maturity. At December
31, 2009, $750.0 million was outstanding under the term loan facility and we had
no revolving credit loans outstanding. We had outstanding letters of
credit in the aggregate amount of $11.4 million. The resulting
availability under the revolving credit facility was $288.6 million at December
31, 2009.
Interest. Amounts outstanding
under the senior credit facility bear interest at a rate equal to the base rate
(defined as the higher of Bank of America's prime rate or 50 basis points above
the federal funds rate) or the Eurocurrency rate (the LIBOR rate), in each case
plus an applicable margin. The applicable margin varies in reference
to our consolidated leverage ratio and ranges from 1.75% to 3.50% in the case of
loans based on the Eurocurrency rate and 0.75% to 2.50% in the case of loans
based on the base rate. As of December 31 2009, our nominal interest
rate on borrowings under the senior credit facility was 3.143%.
We may
choose base rate or Eurocurrency pricing and may elect interest periods of 1, 2,
3 or 6 months for the Eurocurrency borrowings. Interest on base rate borrowings
is payable quarterly in arrears. Interest on Eurocurrency borrowings
is payable at the end of each applicable interest period or every three months
in the case of interest periods in excess of three months. Interest
on all past due amounts will accrue at 2.00% over the applicable
rate.
Collateral. The senior credit
facility is secured by a first priority lien and security interest in (a)
substantially all shares of capital stock and intercompany debt of each of our
present and future subsidiaries (limited in the case of certain subsidiaries to
65% of the voting stock of such entity) and (b) substantially all of our present
and future real property (with a value in excess of $10 million individually),
and the present and future assets of our subsidiaries that are and will be
guarantors under the senior credit facility. The security interest is
subject to some exceptions and permitted liens.
Guarantors. Our obligations
under the senior credit facility are guaranteed by each of our direct and
indirect 100% owned subsidiaries, other than foreign subsidiaries or
subsidiaries whose only assets are investments in foreign
subsidiaries.
Maturity. The senior credit
facility matures on May 19, 2013.
Voluntary Prepayments. We may
prepay, in full or in part, borrowings under the senior credit facility without
premium or penalty, subject to minimum prepayment amount and increment
limitations.
Mandatory Repayments. We must
make periodic prepayments of an aggregate principal amount of the term loans
equal to (i) 100% of the net cash proceeds of certain dispositions of property,
(ii) 100% of the net cash proceeds of the issuance or incurrence of certain
indebtedness, (iii) 50% of the net cash proceeds received from certain equity
issuances, and (iv) 50% (or a reduced percentage determined in reference to our
consolidated leverage ratio) of our domestic excess cash flow.
Representations. The senior
credit facility contains representations generally customary for similar
facilities and transactions.
Covenants. The senior credit
facility contains affirmative and negative covenants customary for similar
facilities and transactions. The material covenants and other restrictive
covenants in the senior credit agreement are summarized as follows:
|
·
|
quarterly
and annual financial reporting
requirements;
|
|
·
|
limitations
on other debt, with baskets for, among other things, the convertible
senior notes, debt used to acquire fixed or capital assets, debt of
foreign subsidiaries, certain intercompany debt, debt of newly-acquired
subsidiaries, debt under certain nonspeculative interest rate and foreign
currency swaps and up to $50 million of additional
debt;
|
|
·
|
limitations
on other liens, with baskets for certain ordinary-course liens and liens
securing certain permitted
debt above;
|
|
·
|
limitations
on mergers or consolidations and on sales of assets with baskets for
certain ordinary course asset sales and certain asset sales for fair
market value;
|
|
·
|
limitations
on investments, with baskets for certain ordinary-course extensions of
trade credit, investments in cash equivalents, certain intercompany
investments, interest rate and foreign currency swaps otherwise permitted,
investments constituting certain permitted debt and certain
acquisitions;
|
|
·
|
limitations
on early retirement of subordinated debt with a basket for certain
prepayments using excess cash not required to be applied to mandatory
prepayment of the term loan;
|
|
·
|
limitations
on changes in the nature of the business, on changes in our fiscal year,
and on changes in organizational
documents;
|
|
·
|
limitations
on changes in accounting policies or reporting practices;
and
|
|
·
|
limitations
on capital expenditures.
|
We are
permitted to pay dividends on our capital stock or effect unlimited repurchases
of our capital stock when our pro forma leverage ratio, as defined in the senior
credit agreement, is less than or equal to 1.75 to 1.00 and there is no default
under the senior credit agreement. In the event the leverage ratio is
greater than 1.75 to 1.00, open-market repurchases of our common stock are
limited to $100.0 million until such time as the leverage ratio has been
restored.
Our
senior credit facility contains financial covenants requiring us to meet certain
leverage and fixed charge coverage ratios. It will be an event of default if we
permit any of the following:
|
·
|
as
of the last day of any fiscal quarter, our leverage ratio of debt to
EBITDA, as defined in the senior credit agreement, to be greater than a
maximum leverage ratio, initially set at 3.50 to 1.00 and stepped down
periodically until the fiscal quarter ending December 31, 2009, upon which
date, and thereafter, the maximum leverage ratio will be 3.00 to 1.00;
and
|
|
·
|
as
of the last day of any fiscal quarter, our ratio of EBITDA (with certain
deductions) to fixed charges to be less than a minimum fixed charge
coverage ratio, initially set at 1.10 to 1.00 and stepped up for the
fiscal quarter ended December 31, 2008, and thereafter, to a minimum
coverage ratio of 1.15 to 1.00.
|
As of
December 31, 2009, our leverage ratio of debt to EBITDA was 2.3 to
1.0.
Events of Default. The senior
credit facility contains events of default including, but not limited to,
failure to pay principal or interest, breaches of representations and
warranties, violations of affirmative or negative covenants, cross-defaults to
other indebtedness, a bankruptcy or similar proceeding being instituted by or
against us, rendering of certain monetary judgments against us, impairments of
loan documentation or security, changes of ownership or operating control,
defaults with respect to certain ERISA obligations and termination of the
license agreement with Wake Forest University Health Sciences relating to our
negative pressure wound therapy line of products.
As of
December 31, 2009, we were in compliance with all covenants under the senior
credit agreement.
3.25%
Convertible Senior Notes
On April
21, 2008, we closed our offering of $600 million aggregate principal amount of
3.25% convertible senior notes due 2015 (the “Convertible Notes”). On
May 1, 2008, we issued an additional $90.0 million aggregate principal amount of
notes to cover over-allotments. The notes are governed by the terms
of an indenture dated as of April 21, 2008 (the “Indenture”).
Principal Amount. At December
31, 2009, $690.0 million in aggregate principal amount of the notes was
outstanding.
Interest. The coupon on the
notes is 3.25% per year on the principal amount. Interest began accruing from
April 21, 2008, and is payable semi-annually in arrears on April 15 and October
15 of each year, beginning October 15, 2008.
Recently adopted accounting
principle. On January 1, 2009, KCI adopted changes issued by the
FASB related to the accounting for convertible debt instruments that may be
settled in cash upon conversion (including partial cash
settlement). These changes specify that issuers of such instruments
account separately for the liability and equity components of convertible debt
instruments in a manner that reflects an issuer’s estimated non-convertible debt
borrowing rate. The impact associated with our adoption of these
changes is disclosed in this report. (See Note 1 (bb).)
Guarantor. Our wholly-owned
subsidiary, KCI USA, Inc. (the “Subsidiary Guarantor”), has
guaranteed the principal and interest payable under the notes on a contractually
subordinated basis to its secured guarantee of our new credit facility and any
credit facilities we enter into in the future.
Ranking. The notes are senior
unsecured obligations, and rank (i) senior to any of our future
indebtedness that is expressly subordinated to the notes; (ii) equally to
any future senior subordinated debt; and (iii) effectively junior to any
secured indebtedness to the extent of the value of the assets securing such
indebtedness. In addition, the notes are structurally junior to (i) all
existing and future indebtedness and other liabilities incurred by our
subsidiaries and (ii) preferred stock issued by our subsidiaries, except
that in the case of the guarantee of the principal and interest on the notes by
the Subsidiary Guarantor, such guarantee will be (a) effectively
subordinated to all of the Subsidiary Guarantor’s secured debt to the extent of
the value of the assets securing such debt, (b) contractually subordinated
to its secured guarantee of our new credit facility and any credit facilities we
enter into in the future, (c) pari passu with all of its other senior
indebtedness, and (d) senior to all of its indebtedness that is expressly
subordinated in right of payment to the subsidiary guarantee and all of its
preferred stock outstanding.
Maturity. The notes will
mature on April 15, 2015, unless previously converted or repurchased in
accordance with their terms prior to such date. As of December 31,
2009, the notes are classified as a non-current liability.
Redemption. The notes are not
redeemable by us prior to the maturity date, but the holders may require us to
repurchase the notes at 100% of the principal amount of the notes, plus accrued
and unpaid interest, following a “fundamental change” (as defined in the
Indenture).
Conversion.
Holders of the notes may convert their notes at their option on any day prior to
the close of business on the business day immediately preceding October 15, 2014
only if one or more of the following conditions is satisfied:
|
1)
|
during
any fiscal quarter commencing after June 30, 2008, if the last reported
sale price of our common stock for at least 20 trading days in the period
of 30 consecutive trading days ending on the last trading day of the
preceding fiscal quarter is greater than or equal to 130% of the
conversion price of the notes in effect on each applicable trading
day;
|
|
2)
|
during
the five business day period following any five consecutive trading day
period in which the trading price for the notes (per $1,000 principal
amount of the notes) for each such trading day was less than 98% of the
last reported sale price of our common stock on such date multiplied by
the applicable conversion rate; or
|
|
3)
|
if
we make certain significant distributions to holders of our common stock
or enter into specified corporate transactions. The notes are convertible,
regardless of whether any of the foregoing conditions has been satisfied,
on or after October 15, 2014 at any time prior to the close of
business on the third scheduled trading day immediately preceding the
stated maturity date.
|
Upon
conversion, holders will receive cash up to the aggregate principal amount of
the notes being converted and shares of our common stock in respect of the
remainder, if any, of our conversion obligation in excess of the aggregate
principal amount of the notes being converted. The initial conversion
rate for the notes is 19.4764 shares of our common stock per $1,000 principal
amount of notes, which is equivalent to an initial conversion price of
approximately $51.34 per share of common stock and represents a 27.5% conversion
premium over the last reported sale price of our common stock on April 15, 2008,
which was $40.27 per share. The conversion rate and the conversion
price are subject to adjustment upon the occurrence of certain events, such as
distributions of dividends or stock splits.
Events of Default. The
Indenture contains events of default including, but not limited to, failure to
pay the principal amount of any note when due or upon required repurchase,
failure to convert the notes into cash or shares of common stock, as applicable
and as required upon the occurrence of triggering events as detailed above,
failure to pay any interest amounts on any note when due if such failure
continues for 30 days, failure to provide timely notice of a fundamental change,
failure to comply with certain obligations upon certain consolidation, merger,
or sale of assets transactions, failure to pay any indebtedness for money
borrowed by us or any of our subsidiaries in excess of a specified amount,
(except in certain instances) if the guarantee of the Notes by the Subsidiary
Guarantor is held to be unenforceable, failure to comply with other terms and
covenants contained in the notes after a specified notice period and certain
events of bankruptcy, insolvency or reorganization of us or any of our
significant subsidiaries.
Note
Hedge and Warrants
Concurrently
with the issuance of the Convertible Notes, we entered into convertible note
hedge (the “Note Hedge”) and warrant transactions (the “Warrants”) with
affiliates of the initial purchasers of the notes. These consist of
purchased and written call options on KCI common stock. The Note
Hedge and Warrants are structured to reduce the potential future economic
dilution associated with conversion of the notes and to effectively increase the
initial conversion price to $60.41 per share, which was approximately 50% higher
than the closing price of KCI’s common stock on April 15, 2008. The
net cost of the Note Hedge and Warrants was $48.7 million.
The Note
Hedge consists of 690,000 purchased call options, representing the number of
$1,000 face value Convertible Notes and approximately 13.4 million shares of KCI
common stock based on the initial conversion ratio of 19.4764
shares. The strike price is $51.34, which corresponds to the initial
conversion price of the Convertible Notes and is similarly subject to customary
adjustments. The Note Hedge expires on April 15, 2015, the maturity
date of the Convertible Notes. Upon exercise of the Note Hedge, KCI
would receive from its counterparties, a number of shares generally based on the
amount by which the market value per share of our common stock exceeds the
strike price of the convertible note hedge as measured during the relevant
valuation period under the terms of the Note Hedge. The Note Hedge is
recorded in equity as a component of additional paid-in capital. The
Note Hedge is anti-dilutive and therefore will have no impact on net earnings
per share, or EPS.
The
Warrants consist of written call options on 13.4 million shares of KCI common
stock, subject to customary anti-dilution adjustments. Upon exercise,
the holder is entitled to purchase one share of KCI common stock for the strike
price of approximately $60.41 per share, which was approximately 50% higher than
the closing price of KCI’s common stock on April 15, 2008. KCI at its
option may elect to settle the Warrant in net shares or cash representing a net
share settlement. The Warrants were issued to reduce the net cost of
the Note Hedge to KCI. The Warrants are scheduled to expire during
the third and fourth quarters of 2015. The Warrants are recorded in
equity as a component of additional paid-in capital. The Warrants
will have no impact on EPS until our share price exceeds the $60.41 exercise
price. Prior to exercise, if our share price exceeds the $60.41
exercise price, we will include the effect of additional shares that may be
issued using the treasury stock method in our diluted EPS
calculations.
Interest
and Future Maturities
Interest
paid, net of cash received from interest rate swap agreements, during 2009, 2008
and 2007 was $70.0 million, $54.7 million and $15.6 million,
respectively. These amounts include any early redemption premium
payments associated with the purchase or redemption of our senior subordinated
notes.
Future
maturities of long-term debt at December 31, 2009 were (dollars in
thousands):
|
Year
|
Amount
|
|||
|
2010
|
$ | 132,353 | ||
|
2011
|
$ | 198,529 | ||
|
2012
|
$ | 264,706 | ||
|
2013
|
$ | 154,412 | ||
|
2014
|
$ | - | ||
|
Thereafter
|
$ | 690,000 | ||
NOTE
6. Derivative Financial Instruments
Interest
Rate Protection
All
derivative instruments are recorded on the balance sheet at fair
value. We designated our interest rate swap agreements as cash flow
hedge instruments. The swap agreements are used to manage exposure to
interest rate movements by effectively changing the variable interest rate to a
fixed rate. We do not use financial instruments for speculative or
trading purposes. We estimate the effectiveness of our interest rate
swap agreements utilizing the hypothetical derivative method. Under
this method, the fair value of the actual interest rate swap agreement is
compared to the fair value of a hypothetical swap agreement that has the same
critical terms as the portion of the loan being hedged. Changes in
the effective portion of the fair value of the remaining interest rate swap
agreement will be recognized in other comprehensive income, net of tax effects,
until the hedged item is recognized into earnings. The differential
to be paid or received, as interest rates change, is accrued and recognized as
an adjustment to interest expense related to the debt.
The
following chart summarizes interest rate hedge transactions effective as of
December 31, 2009 (dollars in thousands):
|
Original
|
||||||||||||||
|
Notional
|
Notional
Amount at
|
Fixed
|
||||||||||||
|
Accounting
Method
|
Effective
Dates
|
Amount
|
December
31, 2009
|
Interest
Rate
|
Status
|
|||||||||
|
Hypothetical
|
06/30/08-06/30/11
|
$ | 100,000 | $ | 60,500 | 3.895% |
Outstanding
|
|||||||
|
Hypothetical
|
06/30/08-06/30/11
|
$ | 50,000 | $ | 30,250 | 3.895% |
Outstanding
|
|||||||
|
Hypothetical
|
06/30/08-06/30/11
|
$ | 50,000 | $ | 30,250 | 3.895% |
Outstanding
|
|||||||
|
Hypothetical
|
09/30/08-03/31/11
|
$ | 40,000 | $ | 26,800 | 3.399% |
Outstanding
|
|||||||
|
Hypothetical
|
09/30/08-03/31/11
|
$ | 30,000 | $ | 20,100 | 3.399% |
Outstanding
|
|||||||
|
Hypothetical
|
09/30/08-03/31/11
|
$ | 30,000 | $ | 20,100 | 3.399% |
Outstanding
|
|||||||
|
Hypothetical
|
12/31/08-12/31/10
|
$ | 40,000 | $ | 29,600 | 3.030% |
Outstanding
|
|||||||
|
Hypothetical
|
12/31/08-12/31/10
|
$ | 30,000 | $ | 22,200 | 3.030% |
Outstanding
|
|||||||
|
Hypothetical
|
12/31/08-12/31/10
|
$ | 30,000 | $ | 22,200 | 3.030% |
Outstanding
|
|||||||
|
Hypothetical
|
12/31/09-12/31/10
|
$ | 50,000 | $ | 50,000 | 1.290% |
Outstanding
|
|||||||
|
Hypothetical
|
12/31/09-12/31/10
|
$ | 50,000 | $ | 50,000 | 0.955% |
Outstanding
|
|||||||
|
Hypothetical
|
12/31/09-12/31/10
|
$ | 50,000 | $ | 50,000 | 0.950% |
Outstanding
|
|||||||
|
Hypothetical
|
09/30/09-09/30/10
|
$ | 50,000 | $ | 50,000 | 1.055% |
Outstanding
|
|||||||
|
Hypothetical
|
06/30/09-06/30/10
|
$ | 60,000 | $ | 60,000 | 1.260% |
Outstanding
|
|||||||
|
Hypothetical
|
06/30/09-06/30/10
|
$ | 40,000 | $ | 40,000 | 1.260% |
Outstanding
|
|||||||
|
Hypothetical
|
03/31/09-03/31/10
|
$ | 60,000 | $ | 60,000 | 1.110% |
Outstanding
|
|||||||
|
Hypothetical
|
03/31/09-03/31/10
|
$ | 40,000 | $ | 40,000 | 1.110% |
Outstanding
|
|||||||
At
December 31, 2009, we had seventeen interest rate swap agreements in effect
pursuant to which we have fixed the rate on an aggregate $662.0 million notional
amount of our outstanding variable rate debt at a weighted average interest rate
of 2.074%, exclusive of the Eurocurrency Rate Loan Spread as disclosed in the
senior credit agreement.
In
addition to the swaps in effect at December 31, 2009, we have entered into two
additional interest rate swap agreements to convert $100.0 million of our
variable-rate debt to a fixed rate basis, which become effective on March 31,
2010. These agreements have been designated as cash flow hedge
instruments. The following chart summarizes these new agreements
(dollars in thousands):
|
Original
|
||||||||
|
Notional
|
Fixed
|
|||||||
|
Accounting
Method
|
Effective
Dates
|
Amount
|
Interest
Rate
|
|||||
|
Hypothetical
|
03/31/10-03/31/11
|
$ | 50,000 | 0.785 | % | |||
|
Hypothetical
|
03/31/10-03/31/11
|
$ | 50,000 | 0.774 | % | |||
We are
required under the Credit Agreement to enter into interest rate swaps to attain
a fixed interest rate on at least 50% of our aggregate outstanding indebtedness
through February 2011. As a result
of the swap agreements currently in effect as of December 31, 2009,
approximately 93.9% of our long-term debt outstanding, including the convertible
senior notes, has a fixed interest rate.
The
interest rate swap agreements have quarterly interest payments, based on three
month LIBOR, due on the last day of March, June, September and
December. The fair value of the swap agreements was zero at
inception. At December 31, 2009, the aggregate fair value of our
interest rate swap agreements was negative and was recorded as a liability of
approximately $8.4 million. This aggregate fair value was based on
inputs that are readily available in public markets or can be derived from
information available in publicly quoted markets. This amount was
also recorded in other comprehensive income, net of tax effects. No
asset derivatives were held as of December 31, 2009 related to our interest rate
swap agreements. The ineffective portion of these interest rate swaps
was not significant for the year ended December 31, 2009. As of
December 31, 2009, the amount of hedge gain or loss to be reclassified from
Accumulated Other Comprehensive Income over the next 12 months was $8.0
million.
We are
exposed to credit loss in the event of nonperformance by counterparties to the
extent of the fair values of the outstanding interest rate swap agreements, but
do not anticipate nonperformance by any of the counterparties. If our
interest rate protection agreements were not in place, interest expense would
have been approximately $11.1 million, $492,000 and $51,000 lower for 2009, 2008
and 2007, respectively.
Foreign
Currency Exchange Fluctuation Protection
We also
use derivative instruments to manage our transactional currency exposures when
our foreign subsidiaries enter into transactions denominated in currencies other
than their local currency. These nonfunctional currency exposures
relate primarily to existing and forecasted intercompany receivables and
payables arising from intercompany purchases of manufactured
products. KCI enters into foreign currency exchange contracts to
mitigate the impact of currency fluctuations on transactions denominated in
nonfunctional currencies, thereby limiting risk that would otherwise result from
changes in exchange rates. These contracts are not designated as
hedges; as such, we recognize the fair value of these instruments as an asset or
liability with income or expense recognized in the current
period. The periods of the foreign currency exchange contracts
generally do not exceed one year and correspond to the periods of the exposed
transactions and related settlements.
The
location and fair value amounts of derivative instruments reported as of
December 31, 2009 in the balance sheet are as follows (dollars in
thousands):
|
Asset
Derivatives
|
|||||
|
Balance
Sheet Location
|
Fair
Value
|
||||
|
Derivatives
not designated as hedging instruments
|
|||||
|
Foreign currency exchange contracts
|
Prepaid
expenses and other
|
$ | 995 | ||
|
Total derivatives
|
$ | 995 | |||
|
Liability
Derivatives
|
|||||
|
Balance
Sheet Location
|
Fair
Value
|
||||
|
Derivatives
designated as hedging instruments
|
|||||
|
Interest
rate swap agreements
|
Accrued
expenses and other
|
$ | 8,436 | ||
|
Derivatives
not designated as hedging instruments
|
|||||
|
Foreign
currency exchange contracts
|
Accrued
expenses and other
|
$ | 1,905 | ||
|
Total derivatives
|
$ | 10,341 | |||
The
location and net amounts reported in the statements of earnings or in
Accumulated Other Comprehensive Income (“OCI”) for derivatives designated as
cash flow hedging instruments under the Derivatives and Hedges topic of the
Codification for the year ended December 31, 2009 are as follows (dollars in
thousands):
|
Effective
portion
|
||||||||
|
Amount
of gain
|
Location
of gain (loss)
|
Amount
of gain (loss)
|
||||||
|
(loss)
recognized
|
reclassified
from
|
reclassified
from
|
||||||
|
in
OCI on
|
accumulated
OCI
|
accumulated
OCI
|
||||||
|
derivative
|
into
income
|
into
income
|
||||||
|
Year
ended December 31, 2009
|
||||||||
|
Interest
rate swap agreements
|
$ | (4,133 | ) |
Interest
expense
|
$ | 7,244 | ||
The
location and net amounts reported in the statements of earnings for derivatives
not designated as hedging instruments under the Derivatives and Hedges topic of
the Codification for the year ended December 31, 2009 are as follows (dollars in
thousands):
|
Location
of gain (loss)
|
Amount
of gain (loss)
|
||||
|
recognized
in income on
|
recognized
in income
|
||||
|
derivative
|
on
derivative
|
||||
|
Year ended
December 31, 2009
|
|||||
|
Foreign
currency exchange contracts
|
Foreign
currency gain (loss)
|
$ | (8,206 | ) | |
Certain
of KCI’s derivative instruments contain provisions that require compliance with
the restrictive covenants of our credit facilities. (See Note
5.)
If we
default under our credit facilities, the lenders could require immediate
repayment of the entire principal. If those lenders require immediate
repayment, we may not be able to repay them which could result in the
foreclosure of substantially all of our assets. In these
circumstances, the counterparties to the derivative instruments could request
immediate payment or full collateralization on derivative instruments in net
liability positions. All of our derivative counterparties are also
parties to our credit facilities.
No
collateral has been posted by KCI in the normal course of
business. If the credit-risk-related contingent features underlying
these agreements were triggered on December 31, 2009, KCI could be required to
settle or post the full amount as collateral to its counterparties.
NOTE
7. Fair Value
Measurements
The
Codification defines fair value as the exit
price that would be received to sell an asset or paid to transfer a
liability. The Fair Value Measurements and Disclosure topic of the
Codification establishes a three-tier fair value hierarchy, which prioritizes
the inputs used in measuring fair value. These tiers include: Level
1, defined as observable inputs such as quoted prices in active markets; Level
2, defined as inputs other than quoted prices in active markets that are either
directly or indirectly observable; and Level 3, defined as unobservable inputs
in which little or no market data exists, therefore requiring an entity to
develop its own assumptions.
At
December 31, 2009, we had seventeen interest rate swap agreements designated as
cash flow hedge instruments and foreign currency exchange contracts to sell
approximately $99.9 million of various currencies. The fair values of
these interest rate swap agreements and foreign currency exchange contracts are
determined based on inputs that are readily available in public markets or can
be derived from information available in publicly-quoted markets. The
following table sets forth the aggregate fair value of all derivative
instruments with credit-risk-related contingent features as of December 31, 2009
(dollars in thousands):
|
Fair
Value Measurements at Reporting
|
|||||||||||||
|
Fair
Value at
|
Date
Using Inputs Considered as
|
||||||||||||
|
December
31, 2009
|
Level
1
|
Level
2
|
Level
3
|
||||||||||
|
Assets:
|
|||||||||||||
|
Foreign
currency exchange contracts
|
$ | 995 | $ | - | $ | 995 | $ | - | |||||
|
Liabilities:
|
|||||||||||||
|
Foreign
currency exchange contracts
|
$ | 1,905 | $ | - | $ | 1,905 | $ | - | |||||
|
Interest
rate swap agreements
|
$ | 8,436 | $ | - | $ | 8,436 | $ | - | |||||
We did
not have any measurements of financial assets or financial liabilities at fair
value on a nonrecurring basis at December 31, 2009.
NOTE
8. Leasing
Obligations
We are
obligated for equipment under various capital leases, which expire at various
dates during the next four years. At December 31, 2009 and 2008, the gross
amount of equipment under capital leases totaled $2.5 million and
$2.5 million and related accumulated depreciation was approximately $1.5
million and $1.3 million, respectively.
In
August 2002, we sold our corporate headquarters facility and adjacent land
and buildings under a 10-year sale-leaseback arrangement. The
properties were sold for $17.9 million, net of selling costs, resulting in
a deferred gain of approximately $10.7 million. The deferred
gain is being amortized over the term of the lease. In 2009, 2008 and
2007, approximately $1.1 million of gain was recognized annually as a
reduction of selling, general and administrative expenses. The
initial lease term is 10 years, expiring in 2012. We have two
consecutive options to renew the lease for a term of three or five years each at
our option. If we exercise either renewal option, the terms of the
renewal lease will be on prevailing market rental terms, including the lease
rate and any improvement allowance or other inducements available to renewing
tenants on prevailing market terms. In order to exercise our renewal
options, we must give notice at least six months prior to the expiration of the
then-existing term. Rental expense for our corporate headquarters
totaled $4.7 million, $4.6 million and $4.2 million for the years ended 2009,
2008 and 2007, respectively. The following table indicates the
estimated future cash lease payments of our corporate headquarters, inclusive of
executory costs, for the years set forth below (dollars in
thousands):
|
Year
ending
|
Estimated
Cash
|
|||
|
December
31,
|
Lease
Payments
|
|||
|
2010
|
$ | 3,865 | ||
|
2011
|
3,900 | |||
|
2012
|
2,330 | |||
|
2013
|
- | |||
|
Thereafter
|
- | |||
| $ | 10,095 | |||
In
addition to leasing our headquarters facility, we lease computer and
telecommunications equipment, service vehicles, office space, various storage
spaces and manufacturing facilities under non-cancelable operating leases, which
expire at various dates over the next 24 years. Total rental expense for
operating leases, including our headquarters facility, was $40.6 million,
$37.7 million and $35.8 million for the years ended December 31, 2009,
2008 and 2007, respectively.
Future
minimum lease payments under capital and non-cancelable operating leases,
including our headquarters facility (with initial or remaining lease terms in
excess of one year) as of December 31, 2009 are as follows (dollars in
thousands):
|
Capital
|
Operating
|
|||||||
|
Leases
|
Leases
|
|||||||
|
2010
|
$ | 198 | $ | 37,154 | ||||
|
2011
|
132 | 31,213 | ||||||
|
2012
|
52 | 22,205 | ||||||
|
2013
|
8 | 13,312 | ||||||
|
2014
|
- | 9,265 | ||||||
|
Thereafter
|
- | 30,355 | ||||||
|
Total
minimum lease payments
|
$ | 390 | $ | 143,504 | ||||
|
Less
amount representing interest
|
(58 | ) | ||||||
|
Present
value of net minimum capital lease payments
|
332 | |||||||
|
Less
current portion
|
(198 | ) | ||||||
|
Obligations
under capital leases, excluding current installments
|
$ | 134 | ||||||
NOTE
9. Income Taxes
The
following table summarizes earnings before income taxes of U.S. and foreign
operations (dollars in thousands):
|
Year
Ended December 31,
|
||||||||||||
|
2009
|
2008
|
2007
|
||||||||||
|
Domestic
|
$ | 234,436 | $ | 187,022 | $ | 288,796 | ||||||
|
Foreign
|
99,945 | 88,146 | 69,157 | |||||||||
| $ | 334,381 | $ | 275,168 | $ | 357,953 | |||||||
The
following table summarizes the composition of income taxes (dollars in
thousands):
|
Year
Ended December 31,
|
||||||||||||
|
2009
|
2008
|
2007
|
||||||||||
|
Current:
|
||||||||||||
|
Federal
|
$ | 83,234 | $ | 9,586 | $ | 106,541 | ||||||
|
State
|
21,055 | 15,704 | 14,279 | |||||||||
|
International
|
16,513 | 12,357 | 11,799 | |||||||||
|
Total
current expense
|
120,802 | 37,647 | 132,619 | |||||||||
|
Deferred:
|
||||||||||||
|
Federal
|
(6,067 | ) | 74,595 | (9,462 | ) | |||||||
|
State
|
(2,065 | ) | 135 | (1,181 | ) | |||||||
|
International
|
(6,991 | ) | (3,653 | ) | (1,167 | ) | ||||||
|
Total
deferred tax expense (benefit)
|
(15,123 | ) | 71,077 | (11,810 | ) | |||||||
|
|
$ | 105,679 | $ | 108,724 | $ | 120,809 | ||||||
The
reconciliation of the U.S. federal statutory rate to the consolidated effective
tax rate is as follows:
|
Year
Ended December 31,
|
|||||||||
|
2009
|
2008
|
2007
|
|||||||
|
Computed
"expected" tax expense
|
35.0 | % | 35.0 | % | 35.0 | % | |||
|
State
income taxes, net of federal benefit
|
3.2 | 2.8 | 2.8 | ||||||
|
Non-deductible
in-process research & development
|
- | 7.8 | - | ||||||
|
Nondeductible
meals and entertainment
|
0.6 | 0.7 | 0.3 | ||||||
|
Foreign
income taxed at other than U.S. rates
|
(6.8 | ) | (6.8 | ) | (3.1 | ) | |||
|
Foreign
tax refund
|
- | - | (0.3 | ) | |||||
|
Section
199 production deduction
|
(0.6 | ) | (0.5 | ) | (0.9 | ) | |||
|
Research
and development credit
|
(0.4 | ) | (0.5 | ) | (0.5 | ) | |||
|
Non-deductible
Stock Options
|
0.4 | 0.5 | 0.5 | ||||||
|
Other,
net
|
0.2 | 0.5 | - | ||||||
| 31.6 | % | 39.5 | % | 33.8 | % | ||||
The tax
effects of temporary differences which give rise to significant portions of the
deferred tax assets and liabilities consist of the following (dollars in
thousands):
|
Year
Ended December 31,
|
||||||||
|
2009
|
2008
|
|||||||
|
Deferred
Tax Assets:
|
||||||||
|
Accounts
receivable, principally due to allowance for doubtful
accounts
|
$ | 2,295 | $ | 5,706 | ||||
|
Foreign
net operating loss carry forwards
|
8,415 | 9,983 | ||||||
|
Domestic
net operating loss
|
- | 1,071 | ||||||
|
Loan
fees
|
2,494 | 1,103 | ||||||
|
Convertible
note hedge
|
42,377 | 48,737 | ||||||
|
Tax
credits, primarily research and development
|
813 | 1,203 | ||||||
|
Accrued
liabilities
|
5,838 | 9,737 | ||||||
|
Deferred
foreign tax asset
|
20,777 | 11,222 | ||||||
|
Deferred
gain on sale of headquarters facility
|
968 | 1,342 | ||||||
|
Inventories,
principally due to additional costs capitalized for tax purposes pursuant
to the Tax Reform Act of 1986
|
4,539 | 3,606 | ||||||
|
Intangible
assets, deducted for book purposes but capitalized and amortized for tax
purposes
|
215 | 293 | ||||||
|
Share-based
compensation as a result of adoption of Codification
|
20,428 | 13,636 | ||||||
|
Accrued
Interest
|
1,522 | 1,262 | ||||||
|
Derivatives
|
2,959 | 4,634 | ||||||
|
Other
|
3,509 | 2,613 | ||||||
|
Total
gross deferred tax assets
|
117,149 | 116,148 | ||||||
|
Less:
valuation allowances
|
(10,322 | ) | (11,821 | ) | ||||
|
Net
deferred tax assets
|
106,827 | 104,327 | ||||||
|
Deferred
Tax Liabilities:
|
||||||||
|
Intangibles
amortized for book not tax
|
(146,764 | ) | (160,771 | ) | ||||
|
Deferred
state tax liability
|
(19,856 | ) | (22,773 | ) | ||||
|
Adoption
of accounting changes related to the accounting for
convertible debt instruments
|
(46,844 | ) | (53,718 | ) | ||||
|
Plant
and equipment, principally due to differences in depreciation and
basis
|
(64,345 | ) | (68,117 | ) | ||||
|
Net
intangible assets, deducted for book purposes over a longer life than for
tax purposes
|
(8,889 | ) | (7,625 | ) | ||||
|
Other
|
(3,158 | ) | (2,337 | ) | ||||
|
Total
gross deferred tax liabilities
|
(289,856 | ) | (315,341 | ) | ||||
|
Net
deferred tax asset (liability)
|
(183,029 | ) | (211,014 | ) | ||||
|
Less:
current deferred tax asset
|
(11,715 | ) | (19,972 | ) | ||||
|
Less:
non-current deferred tax asset
|
(17,513 | ) | (8,635 | ) | ||||
|
Non-current
deferred tax liability
|
$ | (212,257 | ) | $ | (239,621 | ) | ||
The
change in the balance sheet deferred tax accounts reflect deferred income tax
expense, the deferred tax impact of other comprehensive income items and
purchase accounting adjustments for the LifeCell acquisition.
At
December 31, 2009, $800,000 of state research and development credits and $8.4
million of foreign tax losses were available for carryforward. The
losses and credits generally expire within a period of three to 20 years, with
some foreign losses available indefinitely. We have valuation
allowances of $800,000 associated with our state research and development credit
carryforwards, $8.4 million associated with foreign loss carryforwards, and
approximately $1.1 million associated with certain foreign deferred tax assets
due to uncertainties regarding their realizability. The net valuation
allowance decreased by $1.5 million, $2.9 million and $199,000 for the years
ended December 31, 2009, 2008 and 2007, respectively. We believe that
the remaining deferred income tax assets will be realized based upon historical
pre-tax earnings, adjusted for reversals of existing taxable temporary
differences. Certain tax planning or other strategies will be
implemented, if necessary, to supplement income from operations to fully realize
these remaining deferred tax assets. Accordingly, we believe that no
additional valuation allowances are necessary.
KCI
operates in multiple tax jurisdictions with varying rates, both inside and
outside the United States and is routinely under audit by federal, state and
foreign tax authorities. These reviews can involve complex matters
that may require an extended period of time for resolution. KCI's
U.S. federal income tax returns have been examined and settled through fiscal
year 2006. In addition, KCI has ongoing audits in various state and
local jurisdictions, as well as audits in various foreign
jurisdictions. We provide tax reserves for federal, state, local and
international uncertain tax positions. The development of these tax
positions requires subjective, critical estimates and judgments about tax
matters, potential outcomes and timing. Although the outcome of open
tax examinations is uncertain, in management's opinion, adequate provisions for
income taxes have been made for potential liabilities emanating from these
reviews. If actual outcomes differ materially from these estimates,
they could have a material impact on our financial condition and results of
operations. Differences between actual results and assumptions, or changes in
assumptions in future periods, are recorded in the period they become
known. To the extent additional information becomes available prior
to resolution, such accruals are adjusted to reflect probable
outcomes.
At
December 31, 2009 and 2008, we had $29.1 million and $26.2 million,
respectively, of unrecognized tax benefits that were classified as long-term
liabilities, of which $25.1 million and $22.4 million, would favorably impact
our effective tax rate, if recognized. The reconciliation of the
allowance for uncertain tax positions is as follows (dollars in
thousands):
|
December
31,
|
December
31,
|
|||||||
|
2009
|
2008
|
|||||||
|
Balance
at beginning of year
|
$ | 19,293 | $ | 23,659 | ||||
|
Net
additions for tax positions of prior years
|
6,274 | 746 | ||||||
|
Net
reductions for tax positions of prior years
|
(5,913 | ) | (1,978 | ) | ||||
|
Net
additions on positions related to the current year
|
3,200 | 3,497 | ||||||
|
Settlements
|
- | (286 | ) | |||||
|
Reductions
resulting from a lapse of the applicable statute of
limitation
|
(699 | ) | (6,345 | ) | ||||
|
Balance
at end of year
|
$ | 22,155 | $ | 19,293 | ||||
|
Accrued
interest and penalties
|
6,919 | 6,912 | ||||||
|
Gross
unrecognized income tax benefit
|
$ | 29,074 | $ | 26,205 | ||||
KCI’s
continuing practice is to recognize interest and penalties related to income tax
matters in income tax expense. KCI recognized a decrease of net
interest and penalties in the consolidated statement of earnings of
approximately $100,000 in 2009 comprised of a decrease of $1.7 million
associated with releases and an increase of $1.6 million related to ongoing
accruals. In 2008, KCI recognized in the consolidated statement of
earnings net interest and penalties of approximately $400,000 comprised of an
increase of $1.4 million and a decrease of $1.0
million. Additionally, $6.9 million of interest and penalties were
recorded in the consolidated balance sheets as of December 31, 2009 and
2008.
KCI is
subject to U.S. federal income tax, multiple state taxes, and foreign income
tax. In general, the tax years 2005 through 2008 remain open in the
major taxing jurisdictions, with some state and foreign jurisdictions remaining
open longer, as the result of net operating losses and longer
statutes.
KCI is
periodically under examination in multiple tax jurisdictions. It is
reasonably possible that these examinations or statutes could close at various
times within the next twelve months. As a result, between $2.5
million and $6.5 million of our unrecognized tax benefit could be reduced within
the next twelve months.
The
cumulative undistributed earnings of our foreign subsidiaries were approximately
$756.3 million, $592.8 million and $267.4 million at December 31, 2009, 2008 and
2007, respectively. These earnings are considered to be permanently
reinvested in foreign operations and, accordingly, no provision for U.S. federal
or state income taxes has been provided thereon. Upon distribution of
those earnings in the form of dividends or otherwise, we would be subject to
both U.S. income taxes (subject to an adjustment for foreign tax credits) and
withholding taxes payable to various foreign countries. Determination
of the amount of unrecognized deferred U.S. income tax liability is not
practicable because of the complexities associated with its hypothetical
calculation.
Income
taxes paid were $91.6 million, $44.9 million and $113.9 million for the years
ended 2009, 2008 and 2007, respectively.
NOTE
10. Shareholders'
Equity
Under our
Articles of Incorporation, we are authorized to issue up to 225,000,000 shares
of common stock, $0.001 par value (the "Common Stock") and up to 50,000,000
shares of preferred stock, $0.001 par value. The number of shares of
Common Stock issued and outstanding as of December 31, 2009 and 2008 was
71,255,711 and 70,523,895, respectively. On May 27, 2009, KCI’s
shareholders approved and authorized certain issuances of shares of common stock
upon conversion of our 3.25% Convertible Senior Notes. During the
years ended December 31, 2009 and 2008, there were no preferred stock shares
issued or outstanding.
NOTE
11. Share Repurchase
Program
In
October 2008, our Board of Directors authorized a share repurchase program (the
“2008 Repurchase Program”) for the repurchase of up to $100.0 million in market
value of common stock, which expired September 30, 2009. Under the
2008 Repurchase Program, 2.1 million shares of common stock were repurchased at
an average price of $24.11 per share for an aggregate purchase price of $50.3
million. These repurchases include $50.0 million of common stock
repurchases made in open-market transactions. The remainder resulted
from the purchase and retirement of shares in connection with the withholding of
shares to satisfy the minimum tax withholdings on the vesting of restricted
stock.
The
purchase price for shares of KCI's stock repurchased under the 2008 Repurchase
Program was reflected as a reduction to shareholder's equity. The
purchase price of the repurchased shares is allocated as a reduction to common
stock, additional paid-in capital and retained earnings. The share
repurchases under this program are summarized in the table below (in
thousands):
|
Common
Stock
|
Total
|
|||||||||||||||
|
Shares
of
|
and
Additional
|
Retained
|
Shareholders’
|
|||||||||||||
|
Common
Stock
|
Paid-in
Capital
|
Earnings
|
Equity
|
|||||||||||||
|
Repurchase
of common stock
|
2,088 | $ | 19,728 | $ | 30,615 | $ | 50,343 | |||||||||
NOTE
12. Employee Benefit
Plans
Investment
Plan
We have
an Investment Plan intended to qualify as a deferred compensation plan under
Section 401(k) of the Internal Revenue Code of 1986. The
Investment Plan is available to all domestic employees and we match employee
contributions up to a specified limit. In 2009, 2008 and 2007,
matching contributions charged to expense were approximately $9.5 million,
$8.0 million and $7.4 million, respectively.
Deferred
Compensation Plan
In
December 2006, management decided to discontinue the Kinetic Concepts, Inc.
Executive Deferred Compensation Plan (the “Plan”) effective January 1,
2007. All balances as of December 31, 2006 remained with the Plan
throughout 2007 unless the participant had a previously-scheduled
distribution. All undistributed balances in the Plan, totaling $7.1
million as of December 31, 2007, were distributed during the first quarter of
2008. In addition, KCI liquidated the Plan assets totaling $7.4
million, which were used by KCI in the first quarter of 2008 to fund participant
distributions.
Stock
Option Plans
In
December 1997, the Board of Directors approved the 1997 Management Equity Plan
(the “Management Equity Plan”). In January of 2004, the Board of
Directors determined that no new equity grants would be made under the
Management Equity Plan. The maximum aggregate number of shares of
common stock that could be issued in connection with grants under the Management
Equity Plan, as amended, was approximately 13.9 million shares, subject to
adjustment as provided for in the plan. Outstanding grants under the
Management Equity Plan are administered by the Compensation Committee of the
Board of Directors. The exercise price and term of options granted
under the Management Equity Plan have been determined by the Compensation
Committee or the entire Board of Directors. However, in no event has
the term of any option granted under the Management Equity Plan exceeded ten
years.
The 2003
Non-Employee Directors Stock Plan (the “Directors Stock Plan”) became effective
on May 28, 2003, and was amended and restated on November 9, 2004, November 15,
2005, November 28, 2006, and December 4, 2007. In May of 2008, upon
approval of the Kinetic Concepts, Inc. 2008 Omnibus Stock Incentive Plan, the
Board of Directors determined that no new equity grants would be made under the
Directors Stock Plan. The maximum aggregate number of shares of
common stock that could be issued in connection with grants under the Directors
Stock Plan was 400,000 shares, subject to adjustment as provided for in the
plan. The exercise price of options granted under this plan was
determined as the fair market value of the shares of our common stock, which was
equal to the closing price of our common stock on the date that such option was
granted. The options granted vest and become exercisable
incrementally over a period of three years. The right to exercise an
option terminates seven years after the grant date, unless sooner as provided
for in the Directors Stock Plan. Outstanding grants under the
Directors Stock Plan are administered by the Compensation Committee of the Board
of Directors. During 2009 and 2008, no options to purchase shares of
common stock or restricted stock were granted under this plan. During
2007, we issued approximately 44,000 options to purchase shares of common
stock. Additionally, during 2007, we issued approximately 18,000
shares of restricted stock under this plan.
On
February 9, 2004, KCI’s shareholders approved the 2004 Equity Plan (the “2004
Equity Plan”) and the 2004 Employee Stock Purchase Plan (the
“ESPP”). In May of 2008, upon approval of the Kinetic Concepts, Inc.
2008 Omnibus Stock Incentive Plan, the Board of Directors determined that no new
equity grants would be made under the 2004 Equity Plan. The 2004
Equity Plan was effective on February 27, 2004 and reserved for issuance a
maximum of 7,000,000 shares of common stock to be awarded as stock options,
stock appreciation rights, restricted stock and/or restricted stock
units. Of the 7,000,000 shares, 20% could be issued in the form of
restricted stock, restricted stock units or a combination of the
two. The exercise price of options granted under the 2004 Equity Plan
was equal to KCI’s closing stock price on the date that such option was
granted. The options granted vest and become exercisable
incrementally over a period of four years unless otherwise provided in the
option award agreement. The right to exercise an option terminates
ten years after the grant date, unless sooner as provided for in the
plan. Restricted stock and restricted stock units granted under the
2004 Equity Plan generally vest over a period of three to six years unless
otherwise provided in the award agreement. The fair value of the
restricted stock and restricted stock units was determined on the grant date
based on KCI’s closing stock price. The likelihood of meeting the
performance criteria was considered when determining the vesting period on a
periodic basis. Restricted stock and restricted stock units granted
are classified primarily as equity awards. During 2009, no options to
purchase shares of common stock or restricted stock were granted under this
plan. During 2008 and 2007, we granted approximately 1,676,000 and 972,000
options, respectively, to purchase shares of common stock under the 2004 Equity
Plan. Additionally, during 2008 and 2007, we issued approximately
408,000 and 270,000 shares, respectively, of restricted stock and restricted
stock units under the 2004 Equity Plan at a weighted average estimated fair
value of $46.32 and $53.03, respectively.
The ESPP
became effective in the second quarter of 2004. The maximum number of
shares of common stock reserved for issuance under the ESPP is 2,500,000
shares. Under the ESPP, each eligible employee is permitted to
purchase shares of our common stock through regular payroll deductions in an
amount between 1% and 10% of the employee's compensation for each payroll
period, not to exceed $25,000 per year. The ESPP provides for
six-month offering periods. Each six-month offering period will be
composed of an identical six-month purchase period. Participating
employees are able to purchase shares of common stock with payroll deductions at
a purchase price equal to 85% of the fair market value of the common stock at
either the beginning of each offering period or the end of each respective
purchase period, whichever price is lower. During 2009, 2008 and
2007, there were approximately 281,000, 172,000 and 119,000 shares of common
stock purchased, respectively, under the ESPP.
On
May 20, 2008, the shareholders of the company approved the Kinetic
Concepts, Inc. 2008 Omnibus Stock Incentive Plan (the “2008 Plan”), which
provides for the reservation of 6,125,000 shares of KCI’s common stock, plus any
and all shares of common stock that would have been returned to the Directors
Stock Plan and the 2004 Equity Plan by reason of expiration of its term or
cancellation upon termination of employment or service. No additional
grants will be made under either the Directors Stock Plan or the 2004 Equity
Plan. The 2008 Plan is administered by the Compensation Committee of
the KCI Board of Directors, and provides for the grant of stock options, stock
appreciation rights, restricted stock, restricted stock units, performance
shares, stock bonuses, cash awards, or any combination of the
foregoing. The exercise price per share of stock purchasable under
the 2008 Plan shall be determined by the administrator in its sole discretion at
the time of grant but shall not be less than 100% of the fair market value of
the stock on such date. The term of each stock option shall be
fixed by the administrator, but no stock option shall be exercisable more than
ten years after the date such stock option is granted. During 2009
and 2008, we granted approximately 1,703,000 and 227,000 options, respectively,
to purchase shares of common stock under the 2008 Plan. Additionally,
during 2009 and 2008, we issued approximately 465,000 and 46,000 shares of
restricted stock and restricted stock units under the 2008 Plan at a weighted
average estimated fair value of $25.62 and $34.78, respectively.
The
following table summarizes the number of common shares reserved for future
issuance under our stock option plans, excluding shares issuable upon exercise
of outstanding options and restricted stock units, as of December 31,
2009:
|
2004
Employee Stock Purchase Plan
|
1,654,701 | ||
|
2008
Omnibus Stock Incentive Plan
|
4,925,569 | ||
| 6,580,270 |
A summary
of our stock option activity, and related information, for the year ended
December 31, 2009 is set forth in the table below:
|
Weighted
|
||||||||||||||
|
Average
|
||||||||||||||
|
Weighted
|
Remaining
|
Aggregate
|
||||||||||||
|
Average
|
Contractual
|
Intrinsic
|
||||||||||||
|
Options
|
Exercise
|
Term
|
Value
|
|||||||||||
|
(in
thousands)
|
Price
|
(years)
|
(in
thousands)
|
|||||||||||
|
Options
outstanding – January 1, 2009
|
4,366 | $ | 43.15 | |||||||||||
|
Granted
|
1,703 | $ | 25.28 | |||||||||||
|
Exercised
|
(169 | ) | $ | 10.96 | ||||||||||
|
Forfeited/Expired
|
(502 | ) | $ | 43.93 | ||||||||||
|
Options
outstanding – December 31, 2009
|
5,398 | $ | 38.45 | 7.34 | $ | 25,709 | ||||||||
|
Exercisable
as of December 31, 2009
|
2,120 | $ | 43.40 | 6.16 | $ | 4,327 | ||||||||
The
intrinsic value for stock options is defined as the difference between the
current market value and the grant price. The total intrinsic value
of stock options exercised during 2009, 2008 and 2007 was $3.4 million, $1.9
million and $50.5 million, respectively. Cash received from stock
options exercised during 2009, 2008 and 2007 was $1.9 million, $2.5 million and
$28.4 million, respectively, and the actual tax benefit from stock option
exercises totaled $1.2 million, $583,000 and $16.7 million,
respectively.
The fair
value of stock options granted during 2009, 2008 and 2007 was $11.48, $19.52 and
$24.30, respectively. As of December 31, 2009, there was $33.6
million of total unrecognized compensation cost, net of estimated forfeitures,
related to non-vested stock options granted under our various
plans. This unrecognized compensation cost is expected to be
recognized over a weighted average period of 2.4 years.
The 2009
stock option grants include approximately 205,000 shares of performance based
stock options granted to certain executives. The vesting for these
options is based on revenue performance milestones set forth by the Compensation
Committee of the Board of Directors. As of December 31, 2009, it is
probable that the performance milestones will be met, and therefore,
compensation cost has been recorded on these options. If it becomes
probable in the future that the performance milestones will not be met, a
cumulative catch-up adjustment will be made to retroactively decrease
compensation expense for these options.
During
2009, 2008 and 2007, we issued approximately 465,000, 454,000 and 289,000 shares
of restricted stock and restricted stock units under our equity plans,
respectively. The following table summarizes restricted stock
activity for the year ended December 31, 2009:
|
Number
of
|
Weighted
|
|||||||
|
Shares
|
Average
Grant
|
|||||||
|
(in
thousands)
|
Date
Fair Value
|
|||||||
|
Unvested
Shares – January 1, 2009
|
771 | $ | 45.21 | |||||
|
Granted
|
465 | $ | 25.62 | |||||
|
Vested
and Distributed
|
(148 | ) | $ | 36.18 | ||||
|
Forfeited
|
(96 | ) | $ | 39.18 | ||||
|
Unvested
Shares – December 31, 2009
|
992 | $ | 37.96 | |||||
The
weighted average grant date fair value of restricted stock granted during 2009,
2008 and 2007 was $25.62, $45.14 and $52.79, respectively. The total
fair value of restricted stock which vested during 2009, 2008 and 2007 was
approximately $5.4 million, $4.4 million and $4.3 million,
respectively. As of December 31, 2009, there was $15.2 million of
total unrecognized compensation cost related to non-vested restricted stock
granted under our plans. This unrecognized compensation cost is
expected to be recognized over a weighted average period of 1.7
years.
The 2008
restricted stock awards include 87,300 shares of performance based restricted
stock granted to certain executives. The lapsing of restrictions for
these awards is based on revenue performance milestones set forth by the
Compensation Committee of the Board of Directors. As of December 31,
2008, it has been determined that it is not probable that the performance
milestones will be met. As such, no compensation cost has been
recorded on these awards. If it becomes probable in the future that
the performance milestones will be met, a cumulative catch-up adjustment will be
made to retroactively record compensation expense.
KCI has a
policy of issuing new shares to satisfy stock option exercises and restricted
stock award issuances. In addition, KCI may purchase shares in
connection with the net share settlement exercise of employee stock options for
minimum tax withholdings and exercise price and the withholding of shares to
satisfy the minimum tax withholdings on the vesting of restricted
stock.
NOTE
13. Other Comprehensive
Income
The
components of other comprehensive income are as follows (dollars in
thousands):
|
Year
ended December 31,
|
||||||||||||
|
2009
|
2008
|
2007
|
||||||||||
|
Net
earnings
|
$ | 228,702 | $ | 166,444 | $ | 237,144 | ||||||
|
Foreign
currency translation adjustment, net of taxes of $(148) in 2009, $565 in
2008 and $353 in 2007
|
3,822 | (22,170 | ) | 14,819 | ||||||||
|
Net
derivative gain (loss), net of taxes of $(2,226) in 2009, $(4,806) in 2008
and $1 in 2007
|
(4,133 | ) | (8,926 | ) | 1 | |||||||
|
Reclassification
adjustment for derivative losses included in income, net of taxes of
$3,901 in 2009, $172 in 2008 and $18 in 2007
|
7,244 | 320 | 33 | |||||||||
|
|
$ | 235,635 | $ | 135,668 | $ | 251,997 | ||||||
The
components of accumulated other comprehensive income are as follows (dollars in
thousands):
|
Accumulated
|
||||||||||||
|
Foreign
|
Accumulated
|
Accumulated
|
||||||||||
|
Currency
|
Derivative
|
Other
|
||||||||||
|
Translation
|
Gains
|
Comprehensive
|
||||||||||
|
Adjustment
|
(Losses)
|
Income
|
||||||||||
|
Balances
at December 31, 2006
|
$ | 24,963 | $ | (34 | ) | $ | 24,929 | |||||
|
Foreign
currency translation adjustment, net of taxes of $353
|
14,819 | - | 14,819 | |||||||||
|
Net
derivative gain, net of taxes of $1
|
- | 1 | 1 | |||||||||
|
Reclassification
adjustment for derivative losses included in income, net of taxes of
$18
|
- | 33 | 33 | |||||||||
|
Balances
at December 31, 2007
|
$ | 39,782 | $ | - | $ | 39,782 | ||||||
|
Foreign
currency translation adjustment, net of taxes of $565
|
(22,170 | ) | - | (22,170 | ) | |||||||
|
Net
derivative loss, net of taxes of $(4,806)
|
- | (8,926 | ) | (8,926 | ) | |||||||
|
Reclassification
adjustment for derivative losses included in income, net of taxes of
$172
|
- | 320 | 320 | |||||||||
|
Balances
at December 31, 2008
|
$ | 17,612 | $ | (8,606 | ) | $ | 9,006 | |||||
|
Foreign
currency translation adjustment, net of taxes of $(148)
|
3,822 | - | 3,822 | |||||||||
|
Net
derivative loss, net of taxes of $(2,226)
|
- | (4,133 | ) | (4,133 | ) | |||||||
|
Reclassification
adjustment for derivative losses included in income, net of taxes of
$3,901
|
- | 7,244 | 7,244 | |||||||||
|
Balances
at December 31, 2009
|
$ | 21,434 | $ | (5,495 | ) | $ | 15,939 | |||||
NOTE
14. Earnings Per
Share
Net
earnings per share were calculated using the weighted average number of common
shares outstanding. (See Note 1(m).) The following table
sets forth the reconciliation from basic to diluted weighted average shares
outstanding and the calculations of net earnings per share (in thousands, except
per share data):
|
Year
ended December 31,
|
||||||||||||
|
2009
|
2008
|
2007
|
||||||||||
|
Net
earnings
|
$ | 228,702 | $ | 166,444 | $ | 237,144 | ||||||
|
Weighted
average shares outstanding:
|
||||||||||||
|
Basic
|
70,110 | 71,464 | 70,975 | |||||||||
|
Dilutive
potential common shares from stock options and restricted stock
(1)
|
432 | 321 | 699 | |||||||||
|
Diluted
|
70,542 | 71,785 | 71,674 | |||||||||
|
Basic
net earnings per share
|
$ | 3.26 | $ | 2.33 | $ | 3.34 | ||||||
|
Diluted
net earnings per share
|
$ | 3.24 | $ | 2.32 | $ | 3.31 | ||||||
|
|
||||||||||||
|
(1)Potentially
dilutive stock options and restricted stock totaling 5,836 shares, 4,977
shares and 1,779 shares for 2009, 2008 and 2007, respectively, were
excluded from the computation of diluted weighted average shares
outstanding due to their antidilutive
effect.
|
||||||||||||
Holders
of our Convertible Notes may, under certain circumstances, convert the
Convertible Notes into cash, and if applicable, shares of our common stock at
the applicable conversion rate, at any time on or prior to
maturity. (See Note 5.) The Convertible Notes will have no
impact on diluted earnings per share unless the price of our common stock
exceeds the conversion price (initially $51.34 per share) because the principal
amount of the Convertible Notes will be settled in cash upon
conversion. Prior to conversion we will use the treasury stock method
to include the effect of the additional shares that may be issued if our common
stock price exceeds the conversion price. The convertible note hedge
purchased in connection with the issuance of our Convertible Notes is excluded
from the calculation of diluted earnings per share as its impact is always
anti-dilutive. The warrant transactions associated with the issuance
of our Convertible Notes will have no impact on EPS unless our share price
exceeds the $60.41 exercise price.
NOTE
15. Commitments and
Contingencies
Patent
Litigation
Although
it is not possible to reliably predict the outcome of U.S. and foreign patent
litigation described below, we believe that each of the patents involved in
litigation are valid and enforceable and that our patent infringement claims are
meritorious. However, if any of our key patent claims were narrowed
in scope or found to be invalid or unenforceable, or we otherwise do not
prevail, our share of the advanced wound care market for our V.A.C. Therapy
Systems could be significantly reduced in the United States or Europe, due to
increased competition, and pricing of V.A.C. Therapy Systems could decline
significantly, either of which would negatively affect our financial condition
and results of operations. We derived approximately 51% and 53% of
total revenue for the years ended December 31, 2009 and 2008, respectively, from
our domestic NPWT products relating to the U.S. patents at issue. In
continental Europe, we derived approximately 12% and 13% of total revenue for
the years ended December 31, 2009 and 2008, respectively, from AHS revenue
relating to the patents at issue in the ongoing litigation in Germany, France
and the United Kingdom.
U.S.
NPWT Patent Litigation
KCI and
its affiliates, together with Wake Forest University Health Sciences, or Wake
Forest, are involved in multiple patent infringement suits involving patents
licensed exclusively to KCI by Wake Forest. In 2006, a U.S. Federal
District Court jury found that the Wake Forest patents involved in NPWT
litigation with BlueSky Medical and Medela were valid and enforceable, but that
the patent claims at issue were not infringed by a gauze-based device marketed
by BlueSky Medical. On appeal, the U.S. Court of Appeals for the
Federal Circuit affirmed the decision of the District Court in 2009, upholding
the validity of the patents at issue and the non-infringement
finding. Medela filed a petition for certiorari with the U.S.
Supreme Court challenging the Federal Circuit’s ruling, which was denied in
November 2009.
In May
2007, KCI, its affiliates and Wake Forest filed two related patent infringement
suits: one case against Smith & Nephew and BlueSky and a second case against
Medela, for the manufacture, use and sale of negative pressure devices which we
believe infringe patents licensed exclusively to KCI by Wake
Forest. These cases are being heard in the Federal District Court for
the Western District of Texas. As of the filing date of this
document, the case against Smith & Nephew is currently at
trial. By mutual agreement, the case against Medela will be tried at
a later time.
Related
to the Smith & Nephew litigation, the USPTO has issued certificates of
re-examination and office actions confirming the validity of three separate
patents licensed to KCI by Wake Forest University Health Sciences in
re-examination proceedings. The patents associated with these
decisions include U.S. Patent Nos. 5,636,643 (“the ‘643 Patent”), 5,645,081
(“the ‘081 Patent”), and 7,216,651 (“the ‘651 Patent”), which all relate to
KCI’s NPWT technologies. The USPTO issued certificates of
re-examination affirming the validity of key claims in the ‘643 Patent and the
‘081 Patent. The USPTO also issued a formal Office action confirming
the validity of all claims in the ‘651 Patent. Smith & Nephew has
appealed the Office action of the ‘651 Patent re-examination. The ‘651 Patent
re-examination remains subject to further proceedings in the USPTO.
In
September 2007, KCI and two affiliates were named in a declaratory judgment
action filed in the Federal District Court for the District of Delaware by
Innovative Therapies, Inc., or ITI. In that case, the plaintiff has
alleged the invalidity or unenforceability of four patents licensed to KCI by
Wake Forest and one patent owned by KCI relating to V.A.C. Therapy, and has
requested a finding that products made by the plaintiff do not infringe the
patents at issue. In 2008, the District Court dismissed ITI’s suit
based on a lack of subject matter jurisdiction. ITI has appealed the
dismissal of the suit and oral arguments were heard by the Federal Circuit Court
of Appeals in September 2009.
In
January 2008, KCI, its affiliates and Wake Forest filed a patent infringement
lawsuit against ITI in the U.S. District Court for the Middle District of North
Carolina. The federal complaint alleges that a NPWT device introduced
by ITI in 2007 infringes three Wake Forest patents which are exclusively
licensed to KCI. We are seeking damages and injunctive relief in the
case. Also in January and June of 2008, KCI and its affiliates filed
separate suits in state District Court in Bexar County, Texas, against ITI and
several of its principals, all of whom are former employees of
KCI. The claims in the state court suits include breach of
confidentiality agreements, conversion of KCI technology, theft of trade secrets
and conspiracy. We are seeking damages and injunctive relief in the
state court cases.
In
December 2008, KCI, its affiliates and Wake Forest filed a patent infringement
lawsuit against Boehringer Wound Systems, LLC, Boehringer Technologies, LP, and
Convatec, Inc. in the U.S. District Court for the Middle District of North
Carolina. The federal complaint alleges that an NPWT device
manufactured by Boehringer and commercialized by Convatec infringes Wake Forest
patents which are exclusively licensed to KCI. In February 2009, the
defendants filed their answer, which includes affirmative defenses and
counterclaims alleging non-infringement and invalidity of the Wake Forest
patents.
International
NPWT Patent Litigation
In June
2007, Medela filed a patent nullity suit in the German Federal Patent Court
against Wake Forest’s German patent corresponding to European Patent No.
EP0620720 (“the ‘720 Patent”), which is licensed to KCI. In March
2008 and February 2009, Mölnlycke Health Care AB and Smith & Nephew,
respectively, joined the nullity suit against the ‘720 Patent. In
March 2009, the German Federal Patent Court ruled the German patent
corresponding to the ‘720 Patent invalid. KCI and Wake Forest have
appealed that decision and the ‘720 patent remains valid and enforceable until a
final ruling on appeal.
In June
2007, Medela also filed a patent nullity suit in the German Federal Patent Court
against Wake Forest’s German patent corresponding to European Patent No.
EP0688189 (“the ‘189 Patent”), which is licensed to KCI. In May 2009,
the German Federal Patent Court ruled that the ‘189 Patent is valid as
granted.
In March
2008, Mölnlycke Health Care AB filed suit in the United Kingdom alleging
invalidity of the United Kingdom patent corresponding to the ‘720
Patent. Following a trial in July 2009, the trial court ruled the
United Kingdom patent corresponding to the ‘720 Patent invalid. Wake
Forest and KCI have appealed that decision.
In
December 2008, KCI and its affiliates filed a patent infringement lawsuit
against Smith & Nephew in the United Kingdom requesting preliminary and
interim injunctive relief based on the United Kingdom patent corresponding to
the ‘720 patent. A trial on infringement and validity of the patent
in the United Kingdom was held in March 2009. In May 2009, a judgment
was issued by the Court in which it determined that certain claims of the ‘720
Patent covering the use of foam dressing kits with NPWT systems were valid and
infringed by Smith & Nephew's foam-based NPWT dressing kits. The
court held that other claims under the patent were invalid. The
Court’s judgment extended a previously-issued injunction. Smith &
Nephew appealed the ruling and in July 2009, the Court of Appeal ruled the
claims at issue invalid and lifted the injunction in the United
Kingdom. KCI may be required to pay damages for the period of
injunction. In February 2010, KCI was denied permission to appeal by
the United Kingdom Supreme Court.
In March
2009, KCI and its affiliates filed a patent infringement lawsuit against Smith
& Nephew in the Federal Court of Australia, requesting preliminary
injunctive relief to prohibit the commercialization of a Smith & Nephew
negative pressure wound therapy dressing kit. The Federal Court
issued a temporary injunction in the case, which was subsequently overturned by
the Full Court of Federal Court of Australia. A full trial on
validity and infringement of the Wake Forest patent involved in the case is
expected in the summer of 2010.
In March
2009, KCI's German subsidiary filed a request for a preliminary injunction with
the German District Court of Düsseldorf to prevent commercialization of a Smith
& Nephew negative pressure wound therapy system that KCI believes infringes
the German counterpart of its European Patent No. EP0777504 (“the ‘504
Patent”). Following a hearing in July 2009 on this matter, the Court
denied KCI’s request. Also, in April 2009, KCI's German subsidiary
filed a patent infringement lawsuit against Smith & Nephew, GmbH Germany in
the German District Court of Mannheim. The lawsuit alleges that the
negative pressure wound therapy systems commercialized by Smith & Nephew
infringe the ‘504 Patent and another German patent owned by KCI corresponding to
European Patent No. EP0853950 (“the ‘950 Patent”). A trial was held
in October 2009 on the ‘504 Patent claims, after which the Court dismissed KCI’s
claims. A trial on KCI’s ‘950 Patent claims was temporarily adjourned
and is scheduled to resume in March 2010 after additional briefing by the
parties.
In July
2009, KCI and its affiliates filed a request for a preliminary injunction with
the Paris District Court in France to prevent commercialization of Smith &
Nephew’s NPWT system that KCI believes infringes the French counterpart of the
‘504 Patent. A hearing on KCI’s request for preliminary injunction
was held in October 2009 in France. In November 2009, the Paris
District Court denied KCI’s request for a preliminary injunction. A
trial on the matter is expected in early to mid 2011. Also in July
2009, KCI and its affiliates filed patent infringement lawsuits against Smith
& Nephew in the United Kingdom and its affiliates in France alleging
infringement of the ‘504 Patent and the ‘950 Patent in those
countries. KCI has withdrawn its request for a preliminary injunction
in the United Kingdom based on the ‘504 Patent and the ‘950 Patent and is
proceeding to trial in March 2010.
LifeCell
Litigation
In
September 2005, LifeCell recalled certain human-tissue based products because
the organization that recovered the tissue, Biomedical Tissue Services, Ltd., or
BTS, may not have followed FDA requirements for donor consent and/or screening
to determine if risk factors for communicable diseases
existed. LifeCell promptly notified the FDA and all relevant
hospitals and medical professionals. LifeCell did not receive any
donor tissue from BTS after September 2005. LifeCell has been named,
along with BTS and many other defendants, in lawsuits relating to the BTS donor
irregularities. These lawsuits generally fall within three
categories, (1) recipients of BTS tissue who claim actual injury, (2) suits
filed by recipients of BTS tissue seeking medical monitoring and/or damages for
emotional distress (categories (1) and (2) are collectively referred to herein
as “recipient cases”), (3) suits filed by family members of tissue donors who
did not authorize BTS to donate tissue (“family cases”).
In the
first category, LifeCell has been named in three cases filed in the State Court
of New Jersey and approximately seven cases in New Jersey Federal Court in which
the plaintiffs allege to have contracted a disease from BTS’s
tissue. The seven cases in the Federal Court were administratively
stayed pending an appeal filed by plaintiffs in other recipient cases that were
dismissed. The State Court cases are in discovery.
In the
second category, LifeCell has been named in more than twenty suits in which the
plaintiffs do not allege that they have contracted a disease or suffered
physical injury, but instead seek medical monitoring and/or damages for
emotional distress. Seventeen of those cases which were consolidated
in New Jersey Federal District Court as part of a Multi-District Litigation, or
MDL, were dismissed on December 10, 2008, and are now the subject of an appeal
by plaintiffs. The balance of those were filed in State Court in New
Jersey. On April 3, 2009, six of the State Court cases were
dismissed. On June 12, 2009, the remaining five State Court cases
were dismissed. All 11 cases are now on appeal.
In the
third category, approximately twenty suits have been filed by family members of
tissue donors seeking damages for emotional distress. Three of those
are in the MDL. The other family cases have been filed in state
courts in New Jersey and Pennsylvania. Many of these cases improperly
name LifeCell as a defendant as LifeCell did not receive any tissue from the
decedent donor. Voluntary dismissals have been obtained in many of
those cases. The balance of the family cases are in
discovery.
Although
it is not possible to reliably predict the outcome of the BTS-related
litigation, we believe that our defenses to the claims are meritorious and will
defend them vigorously. LifeCell insurance policies covering the
BTS-related claims, which were assumed in our acquisition of LifeCell, should
cover the majority of litigation expenses, settlement costs and damage awards,
if any, in the recipient cases.
We are
party to several additional lawsuits arising in the ordinary course of our
business. Additionally, the manufacturing and marketing of medical
products necessarily entails an inherent risk of product liability
claims.
Other
Commitments and Contingencies
As a
healthcare supplier, we are subject to extensive government regulation,
including laws and regulations directed at ascertaining the appropriateness of
reimbursement, preventing fraud and abuse and otherwise regulating reimbursement
under various government programs. The marketing, billing,
documenting and other practices are all subject to government
scrutiny. To ensure compliance with Medicare and other regulations,
regional carriers often conduct audits and request patient records and other
documents to support claims submitted by KCI for payment of services rendered to
customers.
From time
to time, we receive inquiries from various government agencies requesting
customer records and other documents. It has been our policy to
cooperate with all such requests for information. In 2005, the U.S.
Department of Health and Human Services Office of Inspector General, or OIG,
initiated a study on NPWT. As part of the 2005 study, KCI provided
the OIG with requested copies of our billing records for Medicare V.A.C. unit
placements. In June 2007, the OIG issued a report on the NPWT study
including a number of findings and recommendations to CMS. The OIG
determined that substantially all V.A.C. unit claims met supplier documentation
requirements; however, they were unable to conclude that the underlying patient
medical records fully supported the supplier documentation in 44% of the claims,
which resulted in an OIG estimate that approximately $27 million in improper
payments may have been made on NPWT claims in 2004. The purpose of
the OIG report is to make recommendations for potential Medicare program savings
to CMS, but it does not constitute a formal recoupment action. This
report may result in increased audits and/or demands by Medicare, its regional
contractors and other third-party payers for refunds or recoupments of amounts
previously paid to us.
We also
are subject to routine pre-payment and post-payment audits of reimbursement
claims submitted to Medicare. These audits typically involve a
review, by Medicare or its designated contractors and representatives, of
documentation supporting the medical necessity of the therapy provided by
KCI. While Medicare requires us to obtain a comprehensive physician
order prior to providing products and services, we are not required to, and do
not as a matter of practice require, or subsequently obtain the underlying
medical records supporting the information included in such
certificate. Following a Medicare request for supporting
documentation, we are obligated to procure and submit the underlying medical
records retained by various medical facilities and
physicians. Obtaining these medical records in connection with a
claims audit may be difficult or impossible and, in any event, all of these
records are subject to further examination and dispute by an auditing
authority. Under standard Medicare procedures, KCI is entitled to
demonstrate the sufficiency of documentation and the establishment of medical
necessity, and KCI has the right to appeal any adverse
determinations. If a determination is made that KCI’s records or the
patients’ medical records are insufficient to meet medical necessity or Medicare
reimbursement requirements for the claims subject to a pre-payment or
post-payment audit, KCI could be subject to denial, recoupment or refund demands
for claims submitted for Medicare reimbursement. In the event that an
audit results in discrepancies in the records provided, Medicare may be entitled
to extrapolate the results of the audit to make recoupment demands based on a
wider population of claims than those examined in the audit. In
addition, Medicare or its contractors could place KCI on extended pre-payment
review, which could slow our collections process for submitted
claims. If Medicare were to deny a significant number of claims in
any pre-payment audit, or make any recoupment demands based on any post-payment
audit, our business and operating results could be materially and adversely
affected. In addition, violations of federal and state regulations
regarding Medicare reimbursement could result in severe criminal, civil and
administrative penalties and sanctions, including disqualification from Medicare
and other reimbursement programs. Going forward, it is likely that we
will be subject to periodic inspections, assessments and audits of our billing
and collections practices.
In July
2008, the Durable Medical Equipment Medicare Administrative Contractors (“DMAC”)
for Region B notified KCI of a post-payment audit of claims paid during the
third quarter of 2008. The DMAC requested information on 98 NPWT
claims for patients treated with KCI’s V.A.C. Therapy. In addition to
KCI’s records, the DMAC requested relevant medical records supporting the
medical necessity of the V.A.C. Therapy treatment and related supplies and
quantities being billed. We submitted all of the requested
documentation in a timely manner and have received an initial report indicating
that approximately 41% of the claims subject to this audit were inappropriately
paid, which may result in future recoupments by Medicare. We have
disputed these initial audit findings and as is customary with activities of
this type, we will exhaust all administrative remedies and appeals to support
the claims billed.
In
February 2009, we received a subpoena from the OIG seeking records regarding our
billing practices under the local coverage policies of the four regional
DMACs. We are in discussions with the government regarding the scope
of the subpoena and have provided substantial documentation to the OIG in
response to their requests in a timely manner. We intend to cooperate
with the OIG’s inquiry. The review is in its initial stages and we
cannot predict the time frame in which it will be resolved nor the impact the
findings will have on our results of operations or our financial
position.
As of
December 31, 2009, our commitments for the purchase of new product inventory
were $27.6 million, including approximately $8.2 million of disposable products
from our main disposable supplier, $3.7 million from our provider of low height
medical-surgical beds and $2.7 million from our major electronic board and touch
panel suppliers. Other than commitments for new product inventory, we
have no material long-term purchase commitments.
See
discussion of our self-insurance program at Note 1(o) and leases at
Note 8.
NOTE
16. Related Party
Transactions
A member
of our Board of Directors, Harry R. Jacobson, M.D., was the Vice Chancellor for
Health Affairs of Vanderbilt University, with which we conduct business on a
limited basis. During fiscal years 2009, 2008 and 2007, we recorded
revenue of approximately $1.3 million, $1.3 million and $1.5 million,
respectively, for AHS and TSS products billed to Vanderbilt University. In
addition, following our acquisition of LifeCell, we recorded revenue of
approximately $2.0 million and $1.2 million for sales of LifeCell products to
Vanderbilt University during 2009 and 2008, respectively.
NOTE
17. Segment and Geographic
Information
We are
principally engaged in the rental and sale of advanced wound care systems and
therapeutic support systems throughout the United States and in 20 primary
countries internationally and the sale of regenerative medicine products
primarily throughout the United States.
During
the first quarter of 2009, we changed our operating unit reporting structure to
correspond with our current management structure, including the reclassification
of prior-period amounts to conform to this current reporting
structure. Under our current management structure, we manage our
business by each of our three business units.
We have
three reportable operating segments which correspond to our business
units: Active Healing Solutions; Regenerative Medicine; and
Therapeutic Support Systems. We have two primary geographic regions:
North America, which is comprised principally of the United States and includes
Canada and Puerto Rico; and EMEA/APAC, which is comprised principally of Europe
and includes the Middle East, Africa and the Asia Pacific
region. Revenues for each of our geographic regions in which we
operate are disclosed for each of our business units. In most
countries where we operate, our product lines are marketed and serviced by the
same infrastructure and, as such, we have allocated these costs to the various
business units based on allocation methods including rental and sales events,
headcount, revenue and other methods as deemed appropriate. We
measure segment profit as operating earnings, which is defined as income before
interest and other income, interest expense, foreign currency gains and losses,
and income taxes. All intercompany transactions are eliminated in
computing revenue and operating earnings. All intercompany
transactions are eliminated in computing revenue and operating
earnings.
Information
on segments and a reconciliation of consolidated totals are as follows (dollars
in thousands):
|
Year
Ended December 31,
|
||||||||||||
|
2009
|
2008
|
2007
|
||||||||||
|
Revenue:
|
||||||||||||
|
AHS
|
||||||||||||
|
North
America
|
$ | 1,066,124 | $ | 1,049,215 | $ | 993,040 | ||||||
|
EMEA/APAC
|
340,451 | 344,735 | 286,583 | |||||||||
|
Subtotal
–AHS
|
1,406,575 | 1,393,950 | 1,279,623 | |||||||||
|
Regenerative
Medicine
|
||||||||||||
|
North
America
|
284,075 | 156,837 | - | |||||||||
|
EMEA/APAC
|
1,823 | - | - | |||||||||
|
Subtotal
– Regenerative Medicine
|
285,898 | 156,837 | - | |||||||||
|
TSS
|
||||||||||||
|
North
America
|
196,354 | 221,684 | 230,590 | |||||||||
|
EMEA/APAC
|
103,817 | 105,438 | 99,731 | |||||||||
|
Subtotal
– TSS
|
300,171 | 327,122 | 330,321 | |||||||||
|
|
$ | 1,992,644 | $ | 1,877,909 | $ | 1,609,944 | ||||||
|
Year
Ended December 31,
|
||||||||||||
|
2009
|
2008
|
2007
|
||||||||||
|
Operating
earnings:
|
||||||||||||
|
AHS
|
$ | 444,296 | $ | 420,645 | $ | 412,564 | ||||||
|
Regenerative
Medicine
|
80,251 | 49,077 | - | |||||||||
|
TSS
|
36,387 | 46,031 | 22,181 | |||||||||
|
Other
(1):
|
||||||||||||
|
Executive
|
(43,153 | ) | (35,931 | ) | (38,725 | ) | ||||||
|
Share-based
compensation
|
(32,506 | ) | (26,315 | ) | (23,714 | ) | ||||||
|
In-process
research and development
|
- | (61,571 | ) | - | ||||||||
|
Acquired
intangible asset amortization
|
(40,634 | ) | (25,001 | ) | - | |||||||
|
Purchase
transactions (2)
|
(2,157 | ) | (18,423 | ) | - | |||||||
|
Total
other
|
(118,450 | ) | (167,241 | ) | (62,439 | ) | ||||||
|
|
$ | 442,484 | $ | 348,512 | $ | 372,306 | ||||||
|
|
||||||||||||
|
(1)Includes
general headquarter expenses, including severance costs associated with
workforce restructuring and share-based compensation expense, which
are not allocated to the individual segments. Additionally, “Other”
includes expenses related to our LifeCell acquisition in May
2008.
(2)Purchase
transactions are related to our LifeCell acquisition and include the
inventory mark-up on acquired inventories, integration-related costs,
professional fees and costs associated with retaining key LifeCell
employees and the write-off of in-process research and
development.
|
||||||||||||
|
Year
Ended December 31,
|
||||||||||||
|
2009
|
2008
|
2007
|
||||||||||
|
Depreciation,
amortization and other:
|
||||||||||||
|
AHS
|
$ | 52,376 | $ | 36,324 | $ | 44,562 | ||||||
|
Regenerative
Medicine
|
60,168 | 47,017 | 47,001 | |||||||||
|
TSS
|
44,386 | 47,566 | - | |||||||||
|
Other
|
- | 3,802 | 2,260 | |||||||||
|
|
$ | 156,930 | $ | 134,709 | $ | 93,823 | ||||||
AHS and
TSS assets are primarily accounts receivable, inventories, and net property,
plant and equipment identifiable by product. Regenerative Medicine
assets include accounts receivable, inventories, net property, plant and
equipment, goodwill, debt issuance costs and intangible assets specifically
identifiable to our LifeCell acquisition. Other assets include assets
not specifically identifiable to a product, such as cash, deferred income taxes,
prepaid expenses and other non-current assets. Segment assets as of December 31,
2008 and 2007 have been reclassified to reflect the change in our operating
segment reporting structure. Information on segment assets are as
follows (dollars in thousands):
|
December
31,
|
||||||||||||
|
2009
|
2008
|
2007
|
||||||||||
|
Total
assets:
|
||||||||||||
|
AHS
|
$ | 766,217 | $ | 680,338 | $ | 463,713 | ||||||
|
Regenerative
Medicine
|
1,712,376 | 1,758,218 | - | |||||||||
|
TSS
|
205,782 | 228,250 | 221,206 | |||||||||
|
Other
|
354,190 | 336,646 | 372,666 | |||||||||
|
|
$ | 3,038,565 | $ | 3,003,452 | $ | 1,057,585 | ||||||
|
Year
Ended December 31,
|
||||||||||||
| 2009 | 2008 | 2007 | ||||||||||
|
Gross
capital expenditures:
|
||||||||||||
|
AHS
|
$ | 17,140 | $ | 36,810 | $ | 38,869 | ||||||
|
Regenerative
Medicine
|
9,113 | 12,227 | - | |||||||||
|
TSS
|
15,047 | 16,995 | 22,318 | |||||||||
|
Other
|
61,989 | 65,251 | 34,660 | |||||||||
|
|
$ | 103,289 | $ | 131,283 | $ | 95,847 | ||||||
The
following is other selected geographic financial information of KCI (dollars in
thousands):
|
December
31,
|
||||||||||||
|
2009
|
2008
|
2007
|
||||||||||
|
Geographic
location of revenue:
|
||||||||||||
|
Domestic
|
$ | 1,476,114 | $ | 1,352,727 | $ | 1,150,210 | ||||||
|
Foreign
|
516,530 | 525,182 | 459,734 | |||||||||
|
Total
revenue
|
$ | 1,992,644 | $ | 1,877,909 | $ | 1,609,944 | ||||||
|
December
31,
|
||||||||||||
| 2009 | 2008 | 2007 | ||||||||||
|
Geographic
location of long-lived assets:
|
||||||||||||
|
Domestic
|
$ | 2,032,051 | $ | 2,082,929 | $ | 228,549 | ||||||
|
Foreign
|
148,226 | 102,887 | 83,057 | |||||||||
|
Total
long-lived assets
|
$ | 2,180,277 | $ | 2,185,816 | $ | 311,606 | ||||||
NOTE
18. Quarterly Financial Data
(unaudited)
The
unaudited consolidated results of operations by quarter are summarized below (in
thousands, except per share data):
|
Year
Ended December 31, 2009
|
||||||||||||||||
|
First
|
Second
|
Third
|
Fourth
|
|||||||||||||
|
Quarter
|
Quarter
|
Quarter
|
Quarter
|
|||||||||||||
|
Revenue
|
$ | 470,081 | $ | 491,349 | $ | 504,397 | $ | 526,817 | ||||||||
|
Gross
profit
|
$ | 244,124 | $ | 263,792 | $ | 274,902 | $ | 297,602 | ||||||||
|
Operating
earnings
|
$ | 91,580 | $ | 113,411 | $ | 114,235 | $ | 123,258 | ||||||||
|
Net
earnings
|
$ | 39,705 | $ | 58,097 | $ | 64,569 | $ | 66,331 | ||||||||
|
Net
earnings per share:
|
||||||||||||||||
|
Basic
|
$ | 0.57 | $ | 0.83 | $ | 0.92 | $ | 0.94 | ||||||||
|
Diluted
|
$ | 0.57 | $ | 0.82 | $ | 0.91 | $ | 0.93 | ||||||||
|
Weighted
average shares outstanding:
|
||||||||||||||||
|
Basic
|
69,898 | 70,069 | 70,150 | 70,334 | ||||||||||||
|
Diluted
|
70,173 | 70,432 | 70,666 | 70,974 | ||||||||||||
|
Year
Ended December 31, 2008
|
||||||||||||||||
|
First
|
Second
|
Third
|
Fourth
|
|||||||||||||
|
Quarter
|
Quarter
|
Quarter
|
Quarter
|
|||||||||||||
|
Revenue
|
$ | 420,016 | $ | 462,124 | $ | 503,299 | $ | 492,470 | ||||||||
|
Gross
profit
|
$ | 211,148 | $ | 229,037 | $ | 254,365 | $ | 249,704 | ||||||||
|
Operating
earnings
|
$ | 98,924 | $ | 43,247 | $ | 112,872 | $ | 93,469 | ||||||||
|
Net
earnings (loss)
|
$ | 67,955 | $ | (4,813 | ) | $ | 53,911 | $ | 49,391 | |||||||
|
Net
earnings (loss) per share:
|
||||||||||||||||
|
Basic
|
$ | 0.95 | $ | (0.07 | ) | $ | 0.75 | $ | 0.70 | |||||||
|
Diluted
|
$ | 0.94 | $ | (0.07 | ) | $ | 0.75 | $ | 0.70 | |||||||
|
Weighted
average shares outstanding:
|
||||||||||||||||
|
Basic
|
71,665 | 71,771 | 71,831 | 70,594 | ||||||||||||
|
Diluted
|
72,162 | 71,771 | 72,130 | 70,845 | ||||||||||||
NOTE
19. Subsequent Events
In
addition to the swaps in effect at December 31, 2009 we have entered into two
additional interest rate swap agreements to convert $100.0 million of our
variable-rate debt to a fixed rate basis which become effective on December 31,
2009. (See Note 6.)
On
January 22, 2010, we made a voluntary repayment of $50.0 million on our senior
credit facility.
Subsequent
events have been evaluated through February 24, 2010, the date these
consolidated financial statements were issued.
Schedule II
|
Kinetic
Concepts, Inc.
|
|||||||||||||||||||
|
Valuation
and Qualifying Accounts
|
|||||||||||||||||||
|
Three
Years ended December 31, 2009
|
|||||||||||||||||||
|
(in
thousands)
|
|||||||||||||||||||
|
Description
|
Balances
at December 31, 2006
|
Additions
Charged to Costs and Expenses
|
Acquired
LifeCell Reserves
|
Additions
Charged to Other Accounts
|
Deductions
|
Balances
at December 31, 2007
|
|||||||||||||
|
Accounts
receivable realization reserves
|
$ | 88,488 | $ | 7,567 | $ | - | $ | 41,262 | (1) | $ | 40,527 | $ | 96,790 | ||||||
|
Inventory
reserve
|
$ | 3,089 | $ | 3,412 | $ | - | $ | - | $ | 2,103 | $ | 4,398 | |||||||
|
Deferred
tax asset valuation allowance
|
$ | 14,872 | $ | - | $ | - | $ | - | $ | 199 | $ | 14,673 | |||||||
|
Description
|
Balances
at December 31, 2007
|
Additions
Charged to Costs and Expenses
|
Acquired
LifeCell Reserves
|
Additions
Charged to Other Accounts
|
Deductions
|
Balances
at December 31, 2008
|
|||||||||||||
|
Accounts
receivable realization reserves
|
$ | 96,790 | $ | 10,605 | $ | 279 | $ | 43,321 | (1) | $ | 47,010 | $ | 103,985 | ||||||
|
Inventory
reserve
|
$ | 4,398 | $ | 4,745 | $ | 2,198 | $ | - | $ | 4,467 | $ | 6,874 | |||||||
|
Deferred
tax asset valuation allowance
|
$ | 14,673 | $ | - | $ | - | $ | - | $ | 2,852 | $ | 11,821 | |||||||
|
Description
|
Balances
at December 31, 2008
|
Additions
Charged to Costs and Expenses
|
Acquired
LifeCell Reserves
|
Additions
Charged to Other Accounts
|
Deductions
|
Balances
at December 31, 2009
|
|||||||||||||
|
Accounts
receivable realization reserves
|
$ | 103,985 | $ | 10,166 | $ | - | $ | 70,380 | (1) | $ | 79,040 | $ | 105,491 | ||||||
|
Inventory
reserve
|
$ | 6,874 | $ | 8,033 | $ | - | $ | - | $ | 3,541 | $ | 11,366 | |||||||
|
Deferred
tax asset valuation allowance
|
$ | 11,821 | $ | - | $ | - | $ | - | $ | 1,499 | $ | 10,322 | |||||||
|
|
|||||||||||||||||||
|
(1)Additions
to the accounts receivable realization reserves charged to other accounts
reflect the net increase in revenue reserves to allow for expected credit
memos, cancelled transactions and uncollectible items where collectibility
is not reasonably assured in accordance with the provisions of the
“Revenue Recognition” Topic of the FASB Accounting Standards
Codification.
|
|||||||||||||||||||
None.
Disclosure Controls and
Procedures. KCI’s management, with the participation of KCI’s
Chief Executive Officer and Chief Financial Officer, has evaluated the
effectiveness of KCI’s disclosure controls and procedures (as such term is
defined in Rules 13a-15(e) and 15d-15(e) under the Securities Exchange Act of
1934, as amended (the "Exchange Act")) as of the end of the period covered by
this report. Based on such evaluation, KCI’s Chief Executive Officer
and Chief Financial Officer have concluded that, as of the end of such period,
KCI’s disclosure controls and procedures are effective in recording, processing,
summarizing and reporting, on a timely basis, information required to be
disclosed by KCI in the reports that it files or submits under the Exchange Act
and are effective in ensuring that information required to be disclosed by KCI
in the reports that it files or submits under the Exchange Act is accumulated
and communicated to KCI’s management, including KCI’s Chief Executive Officer
and Chief Financial Officer, as appropriate to allow timely decisions regarding
required disclosure.
Changes in Internal Control over
Financial Reporting. There have not been any changes in KCI’s
internal control over financial reporting (as such term is defined by paragraph
(d) of Rule 13a-15) under the Exchange Act, during the fourth fiscal quarter of
2009 that have materially affected, or are reasonably likely to materially
affect, KCI’s internal control over financial reporting.
Report
of Management on Internal Control Over Financial Reporting
The
management of Kinetic Concepts, Inc. (the "Company") is responsible for
establishing and maintaining adequate internal control over financial reporting,
as defined in Rules 13a-15(f) and 15d-15(f) under the Securities Exchange Act of
1934.
A
company’s internal control over financial reporting is a process designed to
provide reasonable assurance regarding the reliability of financial reporting
and the preparation of financial statements for external purposes in accordance
with generally accepted accounting principles. A company’s internal control over
financial reporting includes those policies and procedures that (1) pertain to
the maintenance of records that, in reasonable detail, accurately and fairly
reflect the transactions and dispositions of the assets of the company; (2)
provide reasonable assurance that transactions are recorded as necessary to
permit preparation of financial statements in accordance with generally accepted
accounting principles, and that receipts and expenditures of the company are
being made only in accordance with authorizations of management and directors of
the company; and (3) provide reasonable assurance regarding prevention or timely
detection of unauthorized acquisition, use, or disposition of the company’s
assets that could have a material effect on the financial
statements.
Because
of its inherent limitations, internal control over financial reporting may not
prevent or detect misstatements. Also, projections of any evaluation
of effectiveness to future periods are subject to the risk that controls may
become inadequate because of changes in conditions, or that the degree of
compliance with the policies or procedures may deteriorate.
The
Company’s management assessed the effectiveness of its internal control over
financial reporting as of December 31, 2009. In making this assessment, the
Company’s management used the criteria set forth by the Committee of Sponsoring
Organizations of the Treadway Commission (“COSO”) in Internal Control-Integrated
Framework. Based on our assessment, we believe that, as of December 31, 2009,
the Company’s internal control over financial reporting is effective based on
those criteria.
Ernst
& Young LLP, the Company’s independent registered public accounting firm,
has audited the Company's internal control over financial reporting as of
December 31, 2009 as stated in their report, included herein.
Date: February
24, 2010
|
/s/
Catherine M. Burzik
|
|
Catherine
M. Burzik
|
|
President
and Chief Executive Officer
|
|
/s/
Martin J. Landon
|
|
Martin
J. Landon
|
|
Executive
Vice President and Chief Financial Officer
|
The
Board of Directors and Shareholders
Kinetic
Concepts, Inc.
We have
audited Kinetic Concepts, Inc.’s internal control over financial reporting as of
December 31, 2009, based on criteria established in Internal Control—Integrated
Framework issued by the Committee of Sponsoring Organizations of the Treadway
Commission (the COSO criteria). Kinetic Concepts, Inc.’s management is
responsible for maintaining effective internal control over financial reporting,
and for its assessment of the effectiveness of internal control over financial
reporting included in the accompanying Report of Management on Internal Control
over Financial Reporting. Our responsibility is to express an opinion on the
company’s internal control over financial reporting based on our
audit.
We
conducted our audit in accordance with the standards of the Public Company
Accounting Oversight Board (United States). Those standards require that we plan
and perform the audit to obtain reasonable assurance about whether effective
internal control over financial reporting was maintained in all material
respects. Our audit included obtaining an understanding of internal control over
financial reporting, assessing the risk that a material weakness exists, testing
and evaluating the design and operating effectiveness of internal control based
on the assessed risk, and performing such other procedures as we considered
necessary in the circumstances. We believe that our audit provides a reasonable
basis for our opinion.
A
company’s internal control over financial reporting is a process designed to
provide reasonable assurance regarding the reliability of financial reporting
and the preparation of financial statements for external purposes in accordance
with generally accepted accounting principles. A company’s internal control over
financial reporting includes those policies and procedures that (1) pertain to
the maintenance of records that, in reasonable detail, accurately and fairly
reflect the transactions and dispositions of the assets of the company; (2)
provide reasonable assurance that transactions are recorded as necessary to
permit preparation of financial statements in accordance with generally accepted
accounting principles, and that receipts and expenditures of the company are
being made only in accordance with authorizations of management and directors of
the company; and (3) provide reasonable assurance regarding prevention or timely
detection of unauthorized acquisition, use or disposition of the company’s
assets that could have a material effect on the financial
statements.
Because
of its inherent limitations, internal control over financial reporting may not
prevent or detect misstatements. Also, projections of any evaluation of
effectiveness to future periods are subject to the risk that controls may become
inadequate because of changes in conditions, or that the degree of compliance
with the policies or procedures may deteriorate.
In our
opinion, Kinetic Concepts, Inc. maintained, in all material respects, effective
internal control over financial reporting as of December 31, 2009, based on the
COSO criteria.
We also
have audited, in accordance with the standards of the Public Company Accounting
Oversight Board (United States), the consolidated balance sheets of Kinetic
Concepts, Inc. and subsidiaries as of December 31, 2009 and 2008, and the
related consolidated statements of earnings, shareholders’ equity and cash flows
for each of the three years in the period ended December 31, 2009 of Kinetic
Concepts, Inc. and subsidiaries and our report dated February 24, 2010 expressed
an unqualified opinion thereon.
|
/s/
ERNST & YOUNG LLP
|
|
ERNST
& YOUNG LLP
|
San
Antonio, Texas
February
24, 2010
None.
Incorporated
in this Item 10, by reference, are those portions of the Company’s definitive
Proxy Statement for its 2010 Annual Meeting of Shareholders to be filed with the
SEC within 120 days after the close of the fiscal year ended December 31, 2009
appearing under the caption "Directors and Executive Officers" and "Section
16(a) Beneficial Ownership Reporting Compliance."
Our Code
of Ethics for Chief Executive and Senior Financial Officers, along with our
Directors' Code of Business Conduct and Ethics, and our KCI Code of Conduct can
be found on our website at www.kci1.com
under the tab entitled "Corporate Governance – Codes of Conduct" on the Investor
Relations page. We intend to satisfy the disclosure requirements
under Item 5.05 of Form 8-K regarding amendment to, or waiver from, a provision
of the Code of Ethics for Chief Executive and Senior Financial Officers by
posting such information on our website, at the address and location specified
above.
Information
about our board committees, including our Audit and Compliance Committee,
Compensation Committee and Director Affairs Committee, as well as the respective
charters for our board committees, can also be found on our website under the
tab entitled "Corporate Governance – Committee Composition and Charters" on the
Investor Relations page. Shareholders may request a copy of the above
referenced codes and charters, at no cost, from Investor Relations, Kinetic
Concepts, Inc., 8023 Vantage Drive, San Antonio, Texas 78230.
Furthermore,
because our common stock is listed on the NYSE, our Chief Executive Officer is
required to make a CEO's Annual Certification to the NYSE in accordance with
Section 303A.12 of the NYSE Listed Company Manual regarding the Company’s
compliance with the NYSE corporate governance listing standards. The
Annual Certification was made on June 22, 2009. In addition, the
certifications of the Company’s Chief Executive Officer and Chief Financial
Officer required under Section 302 of the Sarbanes-Oxley Act of 2002, regarding
the quality of the Company’s disclosures in this Annual Report on Form 10-K, are
filed as exhibits 31.1 and 31.2 hereto.
Incorporated
in this Item 11, by reference, is that portion of the Company’s definitive Proxy
Statement appearing under the caption "Executive Compensation."
RELATED SHAREHOLDER
MATTERS
The
following chart gives aggregate information regarding grants under all of our
equity compensation plans through December 31, 2009:
|
Plan
category
|
Number
of securities to be issued upon exercise of outstanding
options
|
Weighted-average
exercise price of outstanding options
|
Number
of securities remaining available for future issuance under equity
compensation plans (excluding securities reflected in column
(a))
|
|||||
|
(a)
|
(b)
|
(c)
|
||||||
|
Equity
compensation plans approved by security holders
|
5,573,633 | (1) | $ | 38.45 | (2) | 6,580,270 | (3) | |
|
Equity
compensation plans not approved by security holders
|
- | - | - | |||||
|
Total
|
5,573,633 | $ | 38.45 | 6,580,270 | ||||
|
|
||||||||
|
(1)This
amount includes 175,252 shares of common stock that are subject to
outstanding restricted stock unit awards. This amount does not
include 816,783 shares of common stock issued and outstanding pursuant to
unvested restricted stock awards.
(2)This
amount is calculated exclusive of outstanding restricted stock unit
awards.
(3)This
amount includes 4,925,569 shares available for future issuance under the
2008 Omnibus Stock Incentive Plan, which provides for grants of restricted
stock, options and other awards. This amount also includes 1,654,701
shares available for future issuance under the ESPP, which makes stock
available for purchase by employees at specified
times.
|
||||||||
Incorporated
in this Item 12, by reference, is that portion of the Company’s definitive Proxy
Statement appearing under the caption "Security Ownership of Certain Beneficial
Owners and Management."
INDEPENDENCE
Incorporated
in this Item 13, by reference, is that portion of the Company’s definitive Proxy
Statement appearing under the caption "Certain Relationships and Related
Transactions."
Incorporated
in this Item 14, by reference, is that portion of the Company’s definitive Proxy
Statement appearing under the caption "Principal Accounting Fees and
Services."
|
(a) The
following documents are filed as part of this Annual
Report:
|
||||
|
1. Financial
Statements
|
||||
|
The
following consolidated financial statements are filed as a part of this
report:
|
||||
|
Report
of Independent Registered Public Accounting Firm
|
||||
|
Consolidated
Balance Sheets as of December 31, 2009 and 2008
|
||||
|
Consolidated
Statements of Earnings for each of the three years ended December 31,
2009, 2008 and 2007
|
||||
|
Consolidated
Statements of Shareholders' Equity for each of the three years ended
December 31, 2009, 2008 and 2007
|
||||
|
Consolidated
Statements of Cash Flows for each of the three years ended
December 31, 2009, 2008 and 2007
|
||||
|
Notes
to Consolidated Financial Statements
|
||||
|
2. Financial
Statement Schedules
|
||||
|
The
following consolidated financial statement schedule for each of the three
years ended December 31, 2009 is filed as part of this Annual
Report:
|
||||
|
Schedule II—Valuation
and Qualifying Accounts— Three Years ended December 31,
2009
|
||||
|
All
other schedules have been omitted as the required information is not
present or is not present in amounts sufficient to require submission of
the schedule, or because the information required is included in the
financial statements and notes thereto.
|
||||
|
(b) Exhibits
|
||||
|
The
following exhibits are incorporated herein by reference or are filed as
part of this Annual Report:
|
||||
EXHIBITS
|
Exhibits
|
Description
|
|
|
2.1
|
Agreement
and Plan of Merger, dated as of April 7, 2008, between Kinetic Concepts,
Inc., Leopard Acquisition Sub, Inc., and LifeCell Corporation (filed as
Exhibit 2.1 to our Form 8-K filed on April 7, 2008).
|
|
|
3.1
|
Amended
and Restated Articles of Incorporation of Kinetic Concepts, Inc. (filed as
Exhibit 3.5 to Amendment No. 1 to our Registration Statement on Form S-1,
filed on February 2, 2004, as thereafter amended).
|
|
|
3.2
|
Fifth
Amended and Restated By-laws of Kinetic Concepts, Inc. (filed as
Exhibit 3.1 to our From 8-K filed on February 24,
2009).
|
|
|
4.1
|
Specimen
Common Stock Certificate (filed as Exhibit 4.3 to Amendment No. 1 to our
Registration Statement on Form S-1, filed on February 2, 2004, as
thereafter amended).
|
|
|
4.2
|
Form
of 3.25% Convertible Senior Note due 2015, dated as of April 21, 2008,
(included in Exhibit 4.1 to our Form 8-K filed on April 22,
2008).
|
|
|
4.3
|
Indenture,
dated as of April 21, 2008 between Kinetic Concepts, Inc., KCI USA, Inc.
and U.S. Bank National Association, as trustee (filed as Exhibit 4.1 to
our Form 8-K filed on April 22, 2008).
|
|
|
10.1
|
Amended
and Restated Agreement Among Shareholders, dated as of January 26, 2005
(filed as Exhibit 10.1 on Form 8-K, filed on January 27,
2005).
|
|
|
10.2
|
KCI
Employee Benefits Trust Agreement (filed as Exhibit 10.21 to our Annual
Report on Form 10-K/A, dated December 31, 1994, filed on January 23,
1996).
|
|
|
* 10.3
|
Kinetic
Concepts, Inc. Management Equity Plan effective October 2, 1997 (filed as
Exhibit 10.33 to our Annual Report on Form 10-K for the year ended
December 31, 1997, filed on March 31, 1998).
|
|
|
* 10.4
|
Form
of Option Instrument with respect to the Kinetic Concepts, Inc.
Management Equity Plan (filed as Exhibit 10.14 to our Annual Report
on Form 10-K for the year ended December 31, 2000, filed on
March 30, 2001).
|
|
|
10.5
|
Standard
Office Building Lease Agreement, dated July 31, 2002 between CKW San
Antonio, L.P. d/b/a San Antonio CKW, L.P. and Kinetic Concepts, Inc. for
the lease of approximately 138,231 square feet of space in the building
located at 8023 Vantage Drive, San Antonio, Bexar County, Texas 78230
(filed as Exhibit 10.27 on Form S-4, filed on September 29,
2003).
|
|
|
**10.6
|
Toll
Manufacturing Agreement, by and between KCI Manufacturing and Avail
Medical Products, Inc. dated December 14, 2007 (filed as Exhibit 10.6 to
our Annual Report on Form 10-K for the year ended December 31, 2007, filed
on February 26, 2008).
|
|
|
**10.7
|
Amendment
to Toll Manufacturing Agreement, by and between KCI Manufacturing and
Avail Medical Products, Inc. dated July 31, 2008 (filed as Exhibit 10.1 to
our Quarterly Report on Form 10-Q for the quarter ended September 30,
2008, filed on November 5, 2008).
|
|
|
**10.8
|
License
Agreement, dated as of October 6, 1993, between Wake Forest
University and Kinetic Concepts, Inc., as amended by that certain
Amendment to License Agreement, dated as of July 1, 2000 (filed as
Exhibit 10.29 to Amendment No. 4 to our Registration Statement
on Form S-1, filed on February 23, 2004).
|
|
|
* 10.9
|
Form
of Director Indemnity Agreement (filed as Exhibit 10.31 to Amendment No. 1
to Registration Statement on Form S-1, filed on February 2, 2004, as
amended).
|
|
|
*10.10
|
2004
Equity Plan (filed as Exhibit 10.32 to Amendment No. 1 to Registration
Statement on Form S-1, filed on February 2, 2004, as
amended).
|
|
|
*10.11
|
2004
Employee Stock Purchase Plan (filed as Exhibit 10.33 to Amendment No. 1 to
Form S-1, filed on February 2, 2004, as amended).
|
|
|
*10.12
|
Form
of Stock Option Agreement under Amended and Restated 2003 Non-Employee
Directors Stock Plan (filed as Exhibit 10.2 to our Current Report on
Form 8-K filed on November 15, 2004).
|
|
|
*10.13
|
Form
of Restricted Stock Award Agreement under Amended and Restated 2003
Non-Employee Directors Stock Plan (filed as Exhibit 10.3 to our
Current Report on Form 8-K filed on November 15,
2004).
|
|
|
*10.14
|
Executive
Deferred Compensation Plan (filed as Exhibit 10 to our Quarterly Report on
Form 10-Q for the quarter ended March 31, 2006, filed on May 9,
2006).
|
|
|
*10.15
|
Form
of KCI 2004 Equity Plan Restricted Stock Award Agreement (filed as Exhibit
10.1 to our Quarterly Report on Form 10-Q for the quarter ended June 30,
2006, filed on August 9, 2006).
|
|
|
*10.16
|
Form
of KCI 2004 Equity Plan Nonqualified Stock Option Agreement (filed as
Exhibit 10.2 to our Quarterly Report on Form 10-Q for the quarter ended
June 30, 2006, filed on August 9, 2006).
|
|
|
*10.17
|
Form
of KCI 2004 Equity Plan Restricted Stock Unit Award Agreement (filed as
Exhibit 10.3 to our Quarterly Report on Form 10-Q for the quarter ended
June 30, 2006, filed on August 9, 2006).
|
|
|
*10.18
|
Form
of KCI 2004 Equity Plan International Restricted Stock Unit Award
Agreement (filed as Exhibit 10.4 to our Quarterly Report on Form 10-Q for
the quarter ended June 30, 2006, filed on August 9,
2006).
|
|
|
*10.19
|
Form
of KCI 2004 Equity Plan International Stock Option Agreement (filed as
Exhibit 10.5 to our Quarterly Report on Form 10-Q for the quarter ended
June 30, 2006, filed on August 9, 2006).
|
|
|
*10.20
|
Letter,
dated October 16, 2006, from Kinetic Concepts, Inc. to Catherine M. Burzik
outlining the terms of her employment (filed as Exhibit 10.1 to our
Quarterly Report on Form 10-Q for the quarter ended September 30, 2006,
filed on November 3, 2006).
|
|
Exhibits
|
Description
|
|
|
*†10.21
|
Amendment
Number One to the Employment Agreement by and Between Kinetic Concepts,
Inc. and Catherine M. Burzik, dated December 22, 2008.
|
|
|
*10.22
|
2004
Equity Plan Nonqualified Stock Option Agreement between Kinetic Concepts,
Inc. and Catherine M. Burzik, dated November 6, 2006 (filed as
Exhibit 10.28 to our Annual Report on Form 10-K for the year
ended December 31, 2006, filed on February 23,
2007).
|
|
|
*10.23
|
2004
Equity Plan Restricted Stock Award Agreement between Kinetic Concepts,
Inc. and Catherine M. Burzik, dated November 6, 2006 (filed as
Exhibit 10.29 to our Annual Report on Form 10-K for the year
ended December 31, 2006, filed on February 23,
2007).
|
|
|
*10.24
|
Kinetic
Concepts, Inc. Compensation Policy for Outside Directors, as adopted on
December 4, 2007 (filed as Exhibit 10.22 to our Annual Report on Form 10-K
for the year ended December 31, 2007, filed on February 26,
2008).
|
|
|
*10.25
|
Executive
Retention Agreement between Kinetic Concepts, Inc. and Martin J. Landon,
dated February 21, 2007 (filed as Exhibit 10.31 to our Annual Report
on Form 10-K for the year ended December 31, 2006, filed on
February 23, 2007).
|
|
|
*10.26
|
Executive
Retention Agreement between Kinetic Concepts, Inc. and Stephen D. Seidel,
dated February 21, 2007 (filed as Exhibit 10.32 to our Annual Report
on Form 10-K for the year ended December 31, 2006, filed on
February 23, 2007).
|
|
|
*†10.27
|
Addendum
to Executive Retention Agreement between Kinetic Concepts, Inc. and Steve
Seidel, dated February 2007.
|
|
|
*10.28
|
Letter,
dated November 16, 2007, from KCI UK Holdings Limited to T.L.V. Kumar,
outlining his contract of employment (filed as Exhibit 10.32 to our Annual
Report on Form 10-K for the year ended December 31, 2007, filed on
February 26, 2008).
|
|
|
*10.29
|
Executive
Retention Agreement between Kinetic Concepts, Inc. and T.L.V. Kumar, dated
December 3, 2007 (filed as Exhibit 10.33 to our Annual Report on Form 10-K
for the year ended December 31, 2007, filed on February 26,
2008).
|
|
|
*†10.30
|
Addendum
to Executive Retention Agreement between Kinetic Concepts, Inc. and T.L.V.
Kumar, dated December 2007.
|
|
|
*10.31
|
2003
Non-Employee Directors Stock Plan, as Amended and Restated on December 4,
2007 (filed as Exhibit 10.34 to our Annual Report on Form 10-K for the
year ended December 31, 2007, filed on February 26,
2008).
|
|
|
*10.32
|
Form
of Kinetic Concepts, Inc. 2004 Equity Plan International Stock Option
Agreement, as amended on February 19, 2008 (filed as Exhibit 10.35 to our
Annual Report on Form 10-K for the year ended December 31, 2007, filed on
February 26, 2008).
|
|
|
*10.33
|
Form
of Kinetic Concepts, Inc. 2004 Equity Plan Restricted Stock Unit Award
Agreement, as amended on February 19, 2008 (filed as Exhibit 10.36 to our
Annual Report on Form 10-K for the year ended December 31, 2007, filed on
February 26, 2008).
|
|
|
*10.34
|
Form
of Kinetic Concepts, Inc. 2004 Equity Plan International Restricted Stock
Unit Award Agreement, as amended on February 19, 2008 (filed as Exhibit
10.37 to our Annual Report on Form 10-K for the year ended December 31,
2007, filed on February 26, 2008).
|
|
|
*10.35
|
Form
of Kinetic Concepts, Inc. 2004 Equity Plan Nonqualified Stock Option
Agreement, as amended on February 19, 2008 (filed as Exhibit 10.38 to our
Annual Report on Form 10-K for the year ended December 31, 2007, filed on
February 26, 2008).
|
|
|
*10.36
|
Form
of Kinetic Concepts, Inc. 2004 Equity Plan Restricted Stock Award
Agreement, as amended on February 19, 2008 (filed as Exhibit 10.39 to our
Annual Report on Form 10-K for the year ended December 31, 2007, filed on
February 26, 2008).
|
|
|
*10.37
|
Credit
Agreement, dated as of May 19, 2008 among Kinetic Concepts, Inc., the
lenders party thereto, and Banc of America, N.A. as administrative agent
for the lenders (filed as Exhibit 10.1 to our Form 8-K filed on May 23,
2008).
|
|
|
*10.38
|
Purchase
Agreement, dated as of April 15, 2008, among Kinetic Concepts, Inc., J.P.
Morgan Securities Inc. and Banc of America Securities LLC, as
representatives of the several Initial Purchasers (filed as Exhibit 1.1 to
our Form 8-K filed on April 22, 2008).
|
|
|
*10.39
|
Kinetic
Concepts, Inc. 2008 Omnibus Stock Incentive Plan (filed as Exhibit 10.2 to
our Form 8-K filed on May 23, 2008).
|
|
|
*10.40
|
Form
of Kinetic Concepts, Inc. 2008 Omnibus Stock Incentive Plan Non-Employee
Director Nonqualified Stock Option Agreement (filed as Exhibit 10.7 to our
Quarterly Report on Form 10-Q for the quarter ended June 30, 2008, filed
on August 8, 2008).
|
|
|
*10.41
|
Form
of Kinetic Concepts, Inc. 2008 Omnibus Stock Incentive Plan Non-Employee
Director Restricted Stock Award Agreement (filed as Exhibit 10.8 to our
Quarterly Report on Form 10-Q for the quarter ended June 30, 2008, filed
on August 8, 2008).
|
|
|
*10.42
|
Form
of Kinetic Concepts, Inc. 2008 Omnibus Stock Incentive Plan Nonqualified
Stock Option Agreement (filed as Exhibit 10.9 to our Quarterly Report on
Form 10-Q for the quarter ended June 30, 2008, filed on August 8,
2008).
|
|
|
*10.43
|
Form
of Kinetic Concepts, Inc. 2008 Omnibus Stock Incentive Plan Restricted
Stock Award Agreement (filed as Exhibit 10.10 to our Quarterly Report on
Form 10-Q for the quarter ended June 30, 2008, filed on August 8,
2008).
|
|
Exhibits
|
Description
|
|
| *10.44 | Form of Kinetic Concepts, Inc. 2008 Omnibus Stock Incentive Plan Restricted Stock Unit Award Agreement (filed as Exhibit 10.11 to our Quarterly Report on Form 10-Q for the quarter ended June 30, 2008, filed on August 8, 2008). | |
|
*10.45
|
Form
of Kinetic Concepts, Inc. 2008 Omnibus Stock Incentive Plan Cashless
International Stock Option Agreement (filed as Exhibit 10.12 to our
Quarterly Report on Form 10-Q for the quarter ended June 30, 2008, filed
on August 8, 2008).
|
|
|
*10.46
|
Form
of Kinetic Concepts, Inc. 2008 Omnibus Stock Incentive Plan International
Stock Option Agreement (filed as Exhibit 10.13 to our Quarterly Report on
Form 10-Q for the quarter ended June 30, 2008, filed on August 8,
2008).
|
|
|
*10.47
|
Form
of Kinetic Concepts, Inc. 2008 Omnibus Stock Incentive Plan International
Restricted Stock Unit Award Agreement (filed as Exhibit 10.14 to our
Quarterly Report on Form 10-Q for the quarter ended June 30, 2008, filed
on August 8, 2008).
|
|
|
*†10.48
|
Letter,
dated June 26, 2009, from KCI to Michael C. Genau outlining the terms of
his employment.
|
|
|
*†10.49
|
Executive
Retention Agreement between Kinetic Concepts, Inc. and Michael C. Genau,
dated July 2009.
|
|
|
*†10.50
|
Employment
Agreement, dated April 7, 2008, by and between LifeCell Corporation and
Lisa Colleran.
|
|
|
*†10.51
|
Memorandum
dated August 27, 2008, to Lisa Colleran from R. James Cravens, Senior Vice
President, Human Resources, regarding the modification of her employment
agreement.
|
|
|
†21.1
|
Subsidiaries
of the Registrant.
|
|
|
†23.1
|
Consent
of Independent Registered Public Accounting Firm, from Ernst & Young
LLP.
|
|
|
†31.1
|
Certification
of the Chief Executive Officer Pursuant to section 302 of the
Sarbanes-Oxley Act of 2002 dated February 24, 2010.
|
|
|
†31.2
|
Certification
of the Chief Financial Officer Pursuant to section 302 of the
Sarbanes-Oxley Act of 2002 dated February 24, 2010.
|
|
|
†32.1
|
Certification
of the Chief Executive Officer and Chief Financial Officer Pursuant to
section 18 U.S.C. section 1350, as adopted pursuant to section 906 of the
Sarbanes-Oxley Act of 2002 dated February 24, 2010.
|
|
|
|
||
|
* Compensatory
arrangements for director(s) and/or executive
officer(s).
|
||
|
** Confidential
treatment granted on certain portions of this exhibit. An
unredacted version of this exhibit has been filed separately with the
Securities and Exchange Commission.
|
||
|
†
Exhibit filed herewith.
|
Pursuant
to the requirements of Section 13 or 15(d) of the Securities Exchange Act
of 1934, the registrant has duly caused this report to be signed on its behalf
by the undersigned, thereunto duly authorized, in the City of San Antonio, State
of Texas on February 24, 2010.
|
KINETIC
CONCEPTS, INC.
|
||
|
By:
|
/s/
Ronald W. Dollens
|
|
|
Ronald
W. Dollens
|
||
|
Chairman
of the Board of Directors
|
||
Pursuant
to the requirements of the Securities Exchange Act of 1934, as amended, this
report has been signed below by the following persons on behalf of the
registrant and in the capacities and on the dates indicated.
|
Signatures
|
Title
|
Date
|
||
|
/s/
Ronald W. Dollens
|
Chairman
of the Board of Directors
|
February
24, 2010
|
||
|
RONALD
W. DOLLENS
|
||||
|
/s/
Catherine M. Burzik
|
Director,
President and Chief Executive Officer
|
February
24, 2010
|
||
|
CATHERINE
M. BURZIK
|
(Principal
Executive Officer)
|
|||
|
/s/
Martin J. Landon
|
Executive
Vice President and Chief Financial Officer
|
February
24, 2010
|
||
|
MARTIN
J. LANDON
|
(Principal
Financial and Principal Accounting Officer)
|
|||
|
/s/
James R. Leininger, M.D.
|
Director,
Chairman Emeritus
|
February
24, 2010
|
||
|
JAMES
R. LEININGER, M.D.
|
||||
|
/s/
John P. Byrnes
|
Director
|
February
24, 2010
|
||
|
JOHN
P. BYRNES
|
||||
|
/s/
Craig R. Callen
|
Director
|
February
24, 2010
|
||
|
CRAIG
R. CALLEN
|
||||
|
/s/
Woodrin Grossman
|
Director
|
February
24, 2010
|
||
|
WOODRIN
GROSSMAN
|
||||
|
/s/
Harry R. Jacobson
|
Director
|
February
24, 2010
|
||
|
HARRY
R. JACOBSON
|
||||
|
/s/
Carl F. Kohrt
|
Director
|
February
24, 2010
|
||
|
CARL
F. KOHRT
|
||||
|
/s/
David J. Simpson
|
Director
|
February
24, 2010
|
||
|
DAVID
J. SIMPSON
|
||||
|
/s/
C. Thomas Smith
|
Director
|
February
24, 2010
|
||
|
C.
THOMAS SMITH
|
||||
|
/s/
Donald E. Steen
|
Director
|
February
24, 2010
|
||
|
DONALD
E. STEEN
|
||||
EXHIBITS
|
Exhibits
|
Description
|
|
|
2.1
|
Agreement
and Plan of Merger, dated as of April 7, 2008, between Kinetic Concepts,
Inc., Leopard Acquisition Sub, Inc., and LifeCell Corporation (filed as
Exhibit 2.1 to our Form 8-K filed on April 7, 2008).
|
|
|
3.1
|
Amended
and Restated Articles of Incorporation of Kinetic Concepts, Inc. (filed as
Exhibit 3.5 to Amendment No. 1 to our Registration Statement on Form S-1,
filed on February 2, 2004, as thereafter amended).
|
|
|
3.2
|
Fifth
Amended and Restated By-laws of Kinetic Concepts, Inc. (filed as
Exhibit 3.1 to our From 8-K filed on February 24,
2009).
|
|
|
4.1
|
Specimen
Common Stock Certificate (filed as Exhibit 4.3 to Amendment No. 1 to our
Registration Statement on Form S-1, filed on February 2, 2004, as
thereafter amended).
|
|
|
4.2
|
Form
of 3.25% Convertible Senior Note due 2015, dated as of April 21, 2008,
(included in Exhibit 4.1 to our Form 8-K filed on April 22,
2008).
|
|
|
4.3
|
Indenture,
dated as of April 21, 2008 between Kinetic Concepts, Inc., KCI USA, Inc.
and U.S. Bank National Association, as trustee (filed as Exhibit 4.1 to
our Form 8-K filed on April 22, 2008).
|
|
|
10.1
|
Amended
and Restated Agreement Among Shareholders, dated as of January 26, 2005
(filed as Exhibit 10.1 on Form 8-K, filed on January 27,
2005).
|
|
|
10.2
|
KCI
Employee Benefits Trust Agreement (filed as Exhibit 10.21 to our Annual
Report on Form 10-K/A, dated December 31, 1994, filed on January 23,
1996).
|
|
|
* 10.3
|
Kinetic
Concepts, Inc. Management Equity Plan effective October 2, 1997 (filed as
Exhibit 10.33 to our Annual Report on Form 10-K for the year ended
December 31, 1997, filed on March 31, 1998).
|
|
|
* 10.4
|
Form
of Option Instrument with respect to the Kinetic Concepts, Inc.
Management Equity Plan (filed as Exhibit 10.14 to our Annual Report
on Form 10-K for the year ended December 31, 2000, filed on
March 30, 2001).
|
|
|
10.5
|
Standard
Office Building Lease Agreement, dated July 31, 2002 between CKW San
Antonio, L.P. d/b/a San Antonio CKW, L.P. and Kinetic Concepts, Inc. for
the lease of approximately 138,231 square feet of space in the building
located at 8023 Vantage Drive, San Antonio, Bexar County, Texas 78230
(filed as Exhibit 10.27 on Form S-4, filed on September 29,
2003).
|
|
|
**10.6
|
Toll
Manufacturing Agreement, by and between KCI Manufacturing and Avail
Medical Products, Inc. dated December 14, 2007 (filed as Exhibit 10.6 to
our Annual Report on Form 10-K for the year ended December 31, 2007, filed
on February 26, 2008).
|
|
|
**10.7
|
Amendment
to Toll Manufacturing Agreement, by and between KCI Manufacturing and
Avail Medical Products, Inc. dated July 31, 2008 (filed as Exhibit 10.1 to
our Quarterly Report on Form 10-Q for the quarter ended September 30,
2008, filed on November 5, 2008).
|
|
|
**10.8
|
License
Agreement, dated as of October 6, 1993, between Wake Forest
University and Kinetic Concepts, Inc., as amended by that certain
Amendment to License Agreement, dated as of July 1, 2000 (filed as
Exhibit 10.29 to Amendment No. 4 to our Registration Statement
on Form S-1, filed on February 23, 2004).
|
|
|
* 10.9
|
Form
of Director Indemnity Agreement (filed as Exhibit 10.31 to Amendment No. 1
to Registration Statement on Form S-1, filed on February 2, 2004, as
amended).
|
|
|
*10.10
|
2004
Equity Plan (filed as Exhibit 10.32 to Amendment No. 1 to Registration
Statement on Form S-1, filed on February 2, 2004, as
amended).
|
|
|
*10.11
|
2004
Employee Stock Purchase Plan (filed as Exhibit 10.33 to Amendment No. 1 to
Form S-1, filed on February 2, 2004, as amended).
|
|
|
*10.12
|
Form
of Stock Option Agreement under Amended and Restated 2003 Non-Employee
Directors Stock Plan (filed as Exhibit 10.2 to our Current Report on
Form 8-K filed on November 15, 2004).
|
|
|
*10.13
|
Form
of Restricted Stock Award Agreement under Amended and Restated 2003
Non-Employee Directors Stock Plan (filed as Exhibit 10.3 to our
Current Report on Form 8-K filed on November 15,
2004).
|
|
|
*10.14
|
Executive
Deferred Compensation Plan (filed as Exhibit 10 to our Quarterly Report on
Form 10-Q for the quarter ended March 31, 2006, filed on May 9,
2006).
|
|
|
*10.15
|
Form
of KCI 2004 Equity Plan Restricted Stock Award Agreement (filed as Exhibit
10.1 to our Quarterly Report on Form 10-Q for the quarter ended June 30,
2006, filed on August 9, 2006).
|
|
|
*10.16
|
Form
of KCI 2004 Equity Plan Nonqualified Stock Option Agreement (filed as
Exhibit 10.2 to our Quarterly Report on Form 10-Q for the quarter ended
June 30, 2006, filed on August 9, 2006).
|
|
|
*10.17
|
Form
of KCI 2004 Equity Plan Restricted Stock Unit Award Agreement (filed as
Exhibit 10.3 to our Quarterly Report on Form 10-Q for the quarter ended
June 30, 2006, filed on August 9, 2006).
|
|
|
*10.18
|
Form
of KCI 2004 Equity Plan International Restricted Stock Unit Award
Agreement (filed as Exhibit 10.4 to our Quarterly Report on Form 10-Q for
the quarter ended June 30, 2006, filed on August 9,
2006).
|
|
|
*10.19
|
Form
of KCI 2004 Equity Plan International Stock Option Agreement (filed as
Exhibit 10.5 to our Quarterly Report on Form 10-Q for the quarter ended
June 30, 2006, filed on August 9, 2006).
|
|
|
*10.20
|
Letter,
dated October 16, 2006, from Kinetic Concepts, Inc. to Catherine M. Burzik
outlining the terms of her employment (filed as Exhibit 10.1 to our
Quarterly Report on Form 10-Q for the quarter ended September 30, 2006,
filed on November 3, 2006).
|
|
Exhibits
|
Description
|
|
|
*†10.21
|
Amendment
Number One to the Employment Agreement by and Between Kinetic Concepts,
Inc. and Catherine M. Burzik, dated December 22, 2008.
|
|
|
*10.22
|
2004
Equity Plan Nonqualified Stock Option Agreement between Kinetic Concepts,
Inc. and Catherine M. Burzik, dated November 6, 2006 (filed as
Exhibit 10.28 to our Annual Report on Form 10-K for the year
ended December 31, 2006, filed on February 23,
2007).
|
|
|
*10.23
|
2004
Equity Plan Restricted Stock Award Agreement between Kinetic Concepts,
Inc. and Catherine M. Burzik, dated November 6, 2006 (filed as
Exhibit 10.29 to our Annual Report on Form 10-K for the year
ended December 31, 2006, filed on February 23,
2007).
|
|
|
*10.24
|
Kinetic
Concepts, Inc. Compensation Policy for Outside Directors, as adopted on
December 4, 2007 (filed as Exhibit 10.22 to our Annual Report on Form 10-K
for the year ended December 31, 2007, filed on February 26,
2008).
|
|
|
*10.25
|
Executive
Retention Agreement between Kinetic Concepts, Inc. and Martin J. Landon,
dated February 21, 2007 (filed as Exhibit 10.31 to our Annual Report
on Form 10-K for the year ended December 31, 2006, filed on
February 23, 2007).
|
|
|
*10.26
|
Executive
Retention Agreement between Kinetic Concepts, Inc. and Stephen D. Seidel,
dated February 21, 2007 (filed as Exhibit 10.32 to our Annual Report
on Form 10-K for the year ended December 31, 2006, filed on
February 23, 2007).
|
|
|
*†10.27
|
Addendum
to Executive Retention Agreement between Kinetic Concepts, Inc. and Steve
Seidel, dated February 2007.
|
|
|
*10.28
|
Letter,
dated November 16, 2007, from KCI UK Holdings Limited to T.L.V. Kumar,
outlining his contract of employment (filed as Exhibit 10.32 to our Annual
Report on Form 10-K for the year ended December 31, 2007, filed on
February 26, 2008).
|
|
|
*10.29
|
Executive
Retention Agreement between Kinetic Concepts, Inc. and T.L.V. Kumar, dated
December 3, 2007 (filed as Exhibit 10.33 to our Annual Report on Form 10-K
for the year ended December 31, 2007, filed on February 26,
2008).
|
|
|
*†10.30
|
Addendum
to Executive Retention Agreement between Kinetic Concepts, Inc. and T.L.V.
Kumar, dated December 2007.
|
|
|
*10.31
|
2003
Non-Employee Directors Stock Plan, as Amended and Restated on December 4,
2007 (filed as Exhibit 10.34 to our Annual Report on Form 10-K for the
year ended December 31, 2007, filed on February 26,
2008).
|
|
|
*10.32
|
Form
of Kinetic Concepts, Inc. 2004 Equity Plan International Stock Option
Agreement, as amended on February 19, 2008 (filed as Exhibit 10.35 to our
Annual Report on Form 10-K for the year ended December 31, 2007, filed on
February 26, 2008).
|
|
|
*10.33
|
Form
of Kinetic Concepts, Inc. 2004 Equity Plan Restricted Stock Unit Award
Agreement, as amended on February 19, 2008 (filed as Exhibit 10.36 to our
Annual Report on Form 10-K for the year ended December 31, 2007, filed on
February 26, 2008).
|
|
|
*10.34
|
Form
of Kinetic Concepts, Inc. 2004 Equity Plan International Restricted Stock
Unit Award Agreement, as amended on February 19, 2008 (filed as Exhibit
10.37 to our Annual Report on Form 10-K for the year ended December 31,
2007, filed on February 26, 2008).
|
|
|
*10.35
|
Form
of Kinetic Concepts, Inc. 2004 Equity Plan Nonqualified Stock Option
Agreement, as amended on February 19, 2008 (filed as Exhibit 10.38 to our
Annual Report on Form 10-K for the year ended December 31, 2007, filed on
February 26, 2008).
|
|
|
*10.36
|
Form
of Kinetic Concepts, Inc. 2004 Equity Plan Restricted Stock Award
Agreement, as amended on February 19, 2008 (filed as Exhibit 10.39 to our
Annual Report on Form 10-K for the year ended December 31, 2007, filed on
February 26, 2008).
|
|
|
*10.37
|
Credit
Agreement, dated as of May 19, 2008 among Kinetic Concepts, Inc., the
lenders party thereto, and Banc of America, N.A. as administrative agent
for the lenders (filed as Exhibit 10.1 to our Form 8-K filed on May 23,
2008).
|
|
|
*10.38
|
Purchase
Agreement, dated as of April 15, 2008, among Kinetic Concepts, Inc., J.P.
Morgan Securities Inc. and Banc of America Securities LLC, as
representatives of the several Initial Purchasers (filed as Exhibit 1.1 to
our Form 8-K filed on April 22, 2008).
|
|
|
*10.39
|
Kinetic
Concepts, Inc. 2008 Omnibus Stock Incentive Plan (filed as Exhibit 10.2 to
our Form 8-K filed on May 23, 2008).
|
|
|
*10.40
|
Form
of Kinetic Concepts, Inc. 2008 Omnibus Stock Incentive Plan Non-Employee
Director Nonqualified Stock Option Agreement (filed as Exhibit 10.7 to our
Quarterly Report on Form 10-Q for the quarter ended June 30, 2008, filed
on August 8, 2008).
|
|
|
*10.41
|
Form
of Kinetic Concepts, Inc. 2008 Omnibus Stock Incentive Plan Non-Employee
Director Restricted Stock Award Agreement (filed as Exhibit 10.8 to our
Quarterly Report on Form 10-Q for the quarter ended June 30, 2008, filed
on August 8, 2008).
|
|
|
*10.42
|
Form
of Kinetic Concepts, Inc. 2008 Omnibus Stock Incentive Plan Nonqualified
Stock Option Agreement (filed as Exhibit 10.9 to our Quarterly Report on
Form 10-Q for the quarter ended June 30, 2008, filed on August 8,
2008).
|
|
|
*10.43
|
Form
of Kinetic Concepts, Inc. 2008 Omnibus Stock Incentive Plan Restricted
Stock Award Agreement (filed as Exhibit 10.10 to our Quarterly Report on
Form 10-Q for the quarter ended June 30, 2008, filed on August 8,
2008).
|
|
Exhibits
|
Description
|
|
| *10.44 | Form of Kinetic Concepts, Inc. 2008 Omnibus Stock Incentive Plan Restricted Stock Unit Award Agreement (filed as Exhibit 10.11 to our Quarterly Report on Form 10-Q for the quarter ended June 30, 2008, filed on August 8, 2008). | |
|
*10.45
|
Form
of Kinetic Concepts, Inc. 2008 Omnibus Stock Incentive Plan Cashless
International Stock Option Agreement (filed as Exhibit 10.12 to our
Quarterly Report on Form 10-Q for the quarter ended June 30, 2008, filed
on August 8, 2008).
|
|
|
*10.46
|
Form
of Kinetic Concepts, Inc. 2008 Omnibus Stock Incentive Plan International
Stock Option Agreement (filed as Exhibit 10.13 to our Quarterly Report on
Form 10-Q for the quarter ended June 30, 2008, filed on August 8,
2008).
|
|
|
*10.47
|
Form
of Kinetic Concepts, Inc. 2008 Omnibus Stock Incentive Plan International
Restricted Stock Unit Award Agreement (filed as Exhibit 10.14 to our
Quarterly Report on Form 10-Q for the quarter ended June 30, 2008, filed
on August 8, 2008).
|
|
|
*†10.48
|
Letter,
dated June 26, 2009, from KCI to Michael C. Genau outlining the terms of
his employment.
|
|
|
*†10.49
|
Executive
Retention Agreement between Kinetic Concepts, Inc. and Michael C. Genau,
dated July 2009.
|
|
|
*†10.50
|
Employment
Agreement, dated April 7, 2008, by and between LifeCell Corporation and
Lisa Colleran.
|
|
|
*†10.51
|
Memorandum
dated August 27, 2008, to Lisa Colleran from R. James Cravens, Senior Vice
President, Human Resources, regarding the modification of her employment
agreement.
|
|
|
†21.1
|
Subsidiaries
of the Registrant.
|
|
|
†23.1
|
Consent
of Independent Registered Public Accounting Firm, from Ernst & Young
LLP.
|
|
|
†31.1
|
Certification
of the Chief Executive Officer Pursuant to section 302 of the
Sarbanes-Oxley Act of 2002 dated February 24, 2010.
|
|
|
†31.2
|
Certification
of the Chief Financial Officer Pursuant to section 302 of the
Sarbanes-Oxley Act of 2002 dated February 24, 2010.
|
|
|
†32.1
|
Certification
of the Chief Executive Officer and Chief Financial Officer Pursuant to
section 18 U.S.C. section 1350, as adopted pursuant to section 906 of the
Sarbanes-Oxley Act of 2002 dated February 24, 2010.
|
|
|
|
||
|
* Compensatory
arrangements for director(s) and/or executive
officer(s).
|
||
|
** Confidential
treatment granted on certain portions of this exhibit. An
unredacted version of this exhibit has been filed separately with the
Securities and Exchange Commission.
|
||
|
†
Exhibit filed herewith.
|
133