Attached files
Table of Contents
UNITED STATES
SECURITIES AND EXCHANGE COMMISSION
Washington, D.C. 20549
FORM 10-K
(Mark One)
| x | ANNUAL REPORT PURSUANT TO SECTION 13 OR 15(d) OF THE SECURITIES EXCHANGE ACT OF 1934 |
For the fiscal year ended December 31, 2009
| ¨ | TRANSITION REPORT PURSUANT TO SECTION 13 OR 15(d) OF THE SECURITIES EXCHANGE ACT OF 1934 |
For the transition period from to
Commission file number 001-34172
Fresenius Kabi Pharmaceuticals Holding, Inc.
(Exact name of registrant as specified in its charter)
| Delaware | 98-0589183 | |
| (State of Incorporation) | (I.R.S. Employer Identification No.) | |
| Else-Kroener-Strasse 1 61352 Bad Homburg v.d.H. Germany |
+49 (6172) 608 0 | |
| (Address of principal executive offices, including zip code) | (Registrant’s telephone number, including area code) | |
Securities registered pursuant to Section 12(b) of the Act:
| Contingent Value Rights, par value $0.001 per share | The NASDAQ Stock Market LLC | |
| (Title of Class) | (Name of each exchange on which registered) |
Securities registered pursuant to Section 12(g) of the Act: None
Indicate by check mark if the registrant is a well-known seasoned issuer, as defined in Rule 405 of the Securities Act. Yes ¨ No x
Indicate by check mark if the registrant is not required to file reports pursuant to Section 13 or Section 15(d) of the Act. Yes ¨ No x
Indicate by check mark whether the registrant (1) has filed all reports required to be filed by Section 13 or 15(d) of the Securities Exchange Act of 1934 during the preceding 12 months (or for such shorter period that the registrant was required to file such reports), and (2) has been subject to such filing requirements for the past 90 days. Yes x No ¨
Indicate by check mark whether the registrant has submitted electronically and posted on its corporate Web site, if any, every Interactive Data File required to be submitted and posted pursuant to Rule 405 of Regulation S-T during the preceding 12 months (or for such shorter period that the registrant was required to submit and post such files). Yes ¨ No ¨
Indicate by check mark if disclosure of delinquent filers pursuant to Item 405 of Regulation S-K is not contained herein, and will not be contained to the best of the registrant’s knowledge, in definitive proxy or information statements incorporated by reference in Part III of this Form 10-K or any amendment to this Form 10-K. ¨
Indicate by check mark whether the registrant is a large accelerated filer, an accelerated filer, a non-accelerated filer, or a smaller reporting company. See the definitions of “large accelerated filer,” “accelerated filer” and “smaller reporting company” in Rule 12b-2 of the Exchange Act (Check one):
| Large accelerated filer | ¨ | Accelerated filer | ¨ | |||
| Non-accelerated filer | x | Smaller reporting company | ¨ | |||
(Do not check if a smaller reporting company)
Indicate by check mark whether the registrant is a shell company (as defined in Rule 12b-2 of the Act). Yes ¨ No x
As of February 23, 2010, all of the shares of the registrant’s common stock were held by Fresenius Kabi AG.
Table of Contents
Fresenius Kabi Pharmaceuticals Holding, Inc.
FORM 10-K
For the Year Ended December 31, 2009
TABLE OF CONTENTS
| Page | ||||
| PART I | 1 | |||
| Item 1. |
Business | 1 | ||
| Item 1A. |
Risk Factors | 9 | ||
| Item 1B. |
Unresolved Staff Comments | 18 | ||
| Item 2. |
Properties | 18 | ||
| Item 3. |
Legal Proceedings | 18 | ||
| Item 4. |
Submission of Matters to a Vote of Security Holders | 21 | ||
| PART II | 21 | |||
| Item 5. |
Market for Registrant’s Common Equity, Related Stockholder Matters and Issuer Purchases of Equity Securities | 21 | ||
| Item 6. |
Selected Financial Data | 22 | ||
| Item 7. |
Management’s Discussion and Analysis of Financial Condition and Results of Operations | 22 | ||
| Item 7A. |
Quantitative and Qualitative Disclosures about Market Risk | 41 | ||
| Item 8. |
Financial Statements and Supplementary Data | 42 | ||
| Item 9. |
Changes in and Disagreements With Accountants on Accounting and Financial Disclosure | 84 | ||
| Item 9A. |
Controls and Procedures | 84 | ||
| Item 9B. |
Other Information | 85 | ||
| PART III | 85 | |||
| PART IV | 85 | |||
| Item 15. |
Exhibits, Financial Statement Schedule and Reports on Form 8-K | 85 | ||
| Signatures | 87 | |||
Table of Contents
| Item 1. | BUSINESS |
Unless the context otherwise requires, references in this report to “Fresenius Kabi Pharmaceuticals,” “FKP Holdings, Inc.,” “FKP Holdings,” “the Company,” “we,” “us” and “our” refer to “Fresenius Kabi Pharmaceuticals Holding, Inc. and its subsidiaries, including our operating subsidiary APP Pharmaceuticals, Inc, or “APP” (and its subsidiaries APP Pharmaceuticals, LLC, APP Pharmaceuticals Manufacturing, LLC, and Pharmaceutical Partners of Canada, Inc.). References to “the Merger” refer to the Merger between a subsidiary of FKP Holdings, an indirect wholly owned subsidiary of Fresenius SE (“Fresenius”), a societas europaea organized under the laws of the European Union and Germany, and APP. References to “New APP,” and “APP Pharmaceuticals,” refer to the company prior to the merger with FKP Holdings and after the separation from Abraxis BioScience, Inc. in 2007. References to “Old Abraxis” refer to Abraxis BioScience, Inc. prior to the separation in 2007 and related transactions and references to “New Abraxis” refer to New Abraxis Inc., which was our wholly owned subsidiary prior to the separation and which changed its name to Abraxis BioScience, Inc. following the separation. References to the “distribution,” “separation” or “spin-off” refer to the transactions occurring in 2007, in which the proprietary business was separated from Old Abraxis and New Abraxis became an independent publicly-traded company.
Note Regarding Forward-Looking Statements
This Annual Report on Form 10-K and other documents we file with the Securities and Exchange Commission contain forward-looking statements, as the term is defined in the Private Securities Litigation Reform Act of 1995. In addition, we may make forward-looking statements in press releases or written statements, or in our communications and discussions with investors and analysts in the normal course of business through meetings, webcasts, phone calls and conference calls. Such forward-looking statements, whether expressed or implied, are subject to risks and uncertainties which could cause our actual results to differ materially from those implied by such forward-looking statements, due to a number of factors, many of which are beyond our control, which include, but are not limited to:
| • | the market adoption of and demand for our existing and new pharmaceutical products; |
| • | our ability to maintain and/or improve sales and earnings performance; |
| • | the ability to successfully manufacture products in an efficient, time-sensitive and cost effective manner; |
| • | our ability to service our debt; |
| • | the impact on our products and revenues of patents and other proprietary rights licensed or owned by us, our competitors and other third parties; |
| • | our ability, and that of our suppliers, to comply with laws, regulations and standards, and the application and interpretation of those laws, regulations and standards, that govern or affect the pharmaceutical industry, the non-compliance with which may delay or prevent the sale of our products; |
| • | the difficulty in predicting the timing or outcome of product development efforts and regulatory approvals; |
| • | the availability and price of acceptable raw materials and components from third-party suppliers; |
| • | evolution of the fee-for-service arrangements being adopted by our major wholesale customers; |
| • | risks inherent in divestitures and spin-offs, including business risks, legal risks and risks associated with the tax and accounting treatment of such transactions; |
| • | inventory reductions or fluctuations in buying patterns by wholesalers or distributors; |
| • | the effect of the Merger on APP’s customer and supplier relationships, operating results and business generally; |
| • | risks that the Merger will disrupt APP’s current plans and operations, and the potential difficulties in retaining APP’s employees as a result of the Merger; |
| • | the outcome of any pending or future litigation and administrative claims; |
| • | the impact of recent legislative changes to the governmental reimbursement system; |
| • | potential restructurings of FKP Holdings and its subsidiaries (which include APP and its subsidiaries) which could affect its ability to generate Adjusted EBITDA; |
| • | the ability of FKP Holdings to generate Adjusted EBITDA sufficient to trigger a payment under the CVRs; |
| • | challenges of integration and restructuring associated with the Merger or other planned acquisitions and the challenges of achieving anticipated synergies; and |
| • | the impact of any product liability, or other litigation to which the company is, or may become a party. |
1
Table of Contents
Forward-looking statements also include the assumptions underlying or relating to any of the foregoing or other such statements. When used in this report, the words “may,” “will,” “should,” “could,” “expect,” “plan,” “anticipate,” “believe,” “estimate,” “predict” and similar expressions are generally intended to identify forward-looking statements.
Readers are cautioned not to place undue reliance on these forward-looking statements, which reflect management’s opinions only as of the date hereof. We undertake no obligation to revise or publicly release the results of any revision to these forward-looking statements, whether as a result of new information, changes in assumptions, future events or otherwise. Readers should carefully review the factors described in Item 1A: Risk Factors below and other documents we file from time to time with the Securities and Exchange Commission for a more detailed description of the risks and other factors that may affect the forward-looking statements. Readers should understand that it is not possible to predict or identify all such factors. Consequently, readers should not consider any such list to be a complete set of all potential risks or uncertainties.
Our Business
We are an integrated pharmaceutical company that develops, manufactures and markets injectable pharmaceutical products. We believe that we are the only company with a primary focus on the injectable oncology, anti-infective, anesthetic/analgesic and critical care markets. We believe that we offer one of the most comprehensive injectable product portfolios in the pharmaceutical industry. We manufacture products in each of the three basic forms in which injectable products are sold: liquid, powder and lyophilized, or freeze-dried.
Our products are generally used in hospitals, long-term care facilities, alternate care sites and clinics within North America. Unlike the retail pharmacy market for oral products, the injectable pharmaceuticals marketplace is largely made up of end users who have relationships with group purchasing organizations (or “GPOs”), and/or specialty distributors who distribute products within a particular end-user market, such as oncology clinics. GPOs and specialty distributors generally enter into collective product purchasing agreements with pharmaceutical suppliers like us in an effort to secure more favorable drug pricing on behalf of their members.
Our Organizational History
Fresenius Kabi Pharmaceuticals Holding, Inc. (“FKP Holding” or the “Company”) is a wholly-owned subsidiary of Fresenius Kabi AG, and an indirect wholly-owned subsidiary of Fresenius SE (“Fresenius”), a societas europaea organized under the laws of Germany. FKP Holding was formed on July 2, 2008, in order to facilitate the acquisition of APP Pharmaceuticals, Inc. (“APP or the Predecessor”) discussed below. See Note 3 to the consolidated financial statements – Merger with APP for details.
On September 10, 2008, FKP Holding completed the acquisition of APP (the “Merger”) pursuant to an Agreement and Plan of Merger dated July 6, 2008 (the “Merger Agreement”), and APP became a wholly-owned subsidiary of FKP Holding. Effective with the Merger, each outstanding share of common stock of APP and certain stock options and restricted stock units of APP were converted into the right to receive $23.00 in cash, without interest, and one Contingent Value Right (“CVR”), issued by FKP Holding and representing the right to receive a cash payment, without interest, of up to $6.00 determined in accordance with the terms of the CVR Agreement. Refer to Note 4 to the consolidated financial statements — Contingent Value Rights (CVR), for further details. The aggregate consideration paid in the Merger was $4,908.1 million, including $997.5 million in assumed APP debt. FKP Holding incurred $3,856 million in new external and intercompany debt due to Fresenius and its affiliates in connection with the Merger, the aggregate proceeds of which were used to pay the Merger consideration, repay a portion of APP’s then outstanding indebtedness and pay fees and expenses related to the Merger. See Note 9 to the consolidated financial statements- Long-Term Debt and Credit Facility.
The results of APP’s operations have been included in the consolidated financial statements of FKP Holding since September 10, 2008. APP is a fully-integrated pharmaceutical company that develops, manufactures and markets injectable pharmaceutical products with a primary focus on the oncology, anti-infective, anesthetic/analgesic and critical care markets. APP manufactures a comprehensive range of dosage formulations, and its products are used in hospitals, long-term care facilities, alternate care sites and clinics within North America. The Merger is an important step in Fresenius’ growth strategy. Through the merger with APP, Fresenius gains entry to the U.S. pharmaceuticals market and achieves a leading position in the global I.V. generics industry. The North American platform also provides further growth opportunities for Fresenius’ existing product portfolio.
2
Table of Contents
Prior to the Merger, FKP Holding had not carried on any activities or operations except for those activities incidental to its formation and in connection with the transactions related to the Merger. Following the Merger, the business of FKP Holding consists exclusively of that of APP. Accordingly, for accounting purposes FKP Holding is considered the successor to APP and the consolidated financial statements included in Item 8 are presented for two distinct periods: the periods preceding the Merger, or “predecessor” periods (all periods prior to September 10, 2008), and the period after the merger, or “successor” period (from the inception of FKP Holding on July 2, 2008, which includes the results of APP from September 10, 2008, the date of acquisition). The Company applied purchase accounting to the opening balance sheet on September 10, 2008. The Merger resulted in a new basis of accounting for the assets acquired and liabilities assumed in connection with the acquisition of APP beginning on September 10, 2008. As a result of the acquisition and the application of purchase accounting as described above, the consolidated financial information for the period after the acquisition is presented on a different basis than that for the periods before the acquisition and, therefore, is not comparable.
APP is a Delaware corporation that was formed in 2007. American Pharmaceutical Partners, Inc. (“Old APP”) was a Delaware corporation formed in 2001. On April 18, 2006, Old APP completed a merger with American BioScience Inc. (or “ABI”), Old APP’s former parent. In connection with the closing of that merger, Old APP’s certificate of incorporation was amended to change its original name of American Pharmaceutical Partners, Inc. to Abraxis BioScience, Inc. which we refer to as “Old Abraxis.”
On November 13, 2007, Old Abraxis separated into two independent publicly-traded companies, APP Pharmaceuticals Inc., which held the Abraxis Pharmaceutical Products business, focusing primarily on manufacturing and marketing our oncology, anti-infective and critical care hospital-based generic injectable products and marketing our proprietary anesthetic/analgesic products (which we refer to collectively as the “hospital-based business”), and Abraxis BioScience, Inc. (“New Abraxis”) which held the Abraxis Oncology and Abraxis Research businesses (which we refer to as the “proprietary business”). APP continued to operate the hospital-based business under the name APP Pharmaceuticals, Inc. APP and New Abraxis entered into a series of agreements in connection with the separation, including a credit facility under which APP borrowed $1 billion, a portion of which was paid to New Abraxis in connection with the separation, and a $150 million revolving credit facility. These credit facilities were retired in connection with the Merger and replaced with a similar external facility. The historical operating results of Old Abraxis through the date of the separation are presented as discontinued operations. Refer to Note 6 to the consolidated financial statements - Discontinued Operations - Spin-off of New Abraxis, for further details.
Our Products
Injectable Oncology Products
We presently manufacture and market 22 injectable oncology products in 52 dosages and formulations. According to IMS Health, Inc., or IMS, a pharmaceutical market research firm, during the last 12 months ending November 2009, we were a market leader for 6 of these products in terms of units sold in the United States. Net revenue of our injectable oncology products was $78 million in 2009 and represented 9 % of total 2009 revenue.
Oncology Products:
Carboplatin. Carboplatin is indicated for the initial treatment of advanced ovarian carcinoma in combination with other chemotherapeutic agents and for the palliative treatment of recurrent ovarian carcinoma after prior chemotherapy. Carboplatin is the generic equivalent of Bristol-Myers Squibb Company’s Paraplatin®. We launched the liquid and lyophilized versions of carboplatin in October 2004, and we received approval for the liquid, 600 mg, multi-dose vial form of the product in February 2006.
Doxorubicin. Doxorubicin is indicated for use in adjuvant therapy for the treatment of breast cancer where there is evidence of axillary lymph node involvement following tumor resection. Doxorubicin has been successful in producing regression in disseminated neoplastic conditions, including several types of leukemias, ovarian, breast and bladder cancers as well as Hodgkin’s disease. Doxorubicin is the generic equivalent of Pharmacia & Upjohn Company’s Adriamycin®. We launched the liquid version of doxorubicin in August 2007.
Fludarabine. Fludarabine is indicated for the treatment of adult patients with B-cell chronic lymphocytic leukemia whose disease is unresponsive, or has progressed, despite treatment with an alkylinating-agent containing regimen. We market both the liquid and lyophilized formulations. We launched fludarabine in October 2007.
Fluorouracil. Fluorouracil is part of a class of drugs known as “antineoplastics” which are used in the treatment of various cancers to slow or stop the growth of cancer cells. Fluorouracil is indicated for the palliative management of carcinoma of the colon, rectum, breast, stomach and pancreas and is the generic equivalent of Sicor Pharmaceuticals’ Adrucil®. We launched fluorouracil in December 1998.
3
Table of Contents
Ifosfamide. Ifosfamide is a chemotherapy drug used to treat germ cell testicular cancer and is often given in combination with mesna. Bristol-Myers originally marketed ifosfamide under the brand name Ifex®. In response to customer requests, we were the first to offer individually packaged generic ifosfamide; our lyophilized form eliminated the need for the refrigerated storage required by the previous generic ifosfamide/mesna kit packaging. We launched ifosfamide in July 2002 with 180-day exclusivity.
Irinotecan. Irinotecan is a chemotherapy drug used to treat advanced cancer of the large intestine and rectum. It is indicated as a component of first-line therapy in combination with 5-fluorouracil and leucovorin for patients with metastatic colorectal cancer. The drug is also indicated for patients with metastatic colorectal cancer whose disease has recurred or progressed following initial fluorouracil-based therapy. We launched irinotecan in February 2008.
Mesna. Mesna is a cytoprotectant used to treat the side effects associated with certain chemotherapy drugs. Bristol-Myers originally marketed mesna under the brand name Mesnex®. Launched in May 2001, we were the first to market a generic version of mesna.
Paclitaxel Injection, Paclitaxel is an antineoplastic drug indicated as a first-line therapy in combination with Cisplatin for the treatment of advanced carcinoma of the ovary, as well as non-small cell lung cancer. As a second-line treatment, Paclitaxel is approved for the treatment of (a) AIDS-related Kaposi’s sarcoma; and (b) breast cancer after failure of combination chemotherapy for metastatic disease or relapse within 6 months. Paclitaxel is also indicated as an adjuvant therapy for the treatment of node-positive breast cancer. Paclitaxel is the generic equivalent of Bristol-Meyers Squibb’s Taxol®.
Cisplatin Injection, Cisplatin is an antineoplastic drug approved for use in combination with other chemotherapeutic agents as the treatment for metastatic testicular tumors or metastatic ovarian tumors in patients who have already received appropriate non-pharmacological therapy. As a single agent, Cisplatin is indicated (a) as a secondary-line therapy for metastatic ovarian tumors refractory to standard chemotherapy; and (b) for patients with transitional cell bladder cancer which is no longer amenable to surgery and/or radiotherapy. Cisplatin is the generic equivalent to Platino-AQ®, a product of Bristol-Meyers Squibb.
Oxaliplatin for Injection. Oxaliplatin is an antineoplastic agent indicated for use in combination with Fluorouracil/leucovorin for (a) adjuvant therapy of stage III colon cancer in patients who have undergone complete resection of the primary tumor; and (b) treatment of advanced colorectal cancer. Oxaliplatin for Injection is the generic alternative for Eloxatin®, the brand name product of Sanofi Aventis US. Importantly, as opposed to the Eloxatin® that is currently on the market in the liquid form, our product is a lyophilized powder.
Injectable Anti-Infective Products
We manufacture and market 27 injectable anti-infective products. According to IMS, we were the United States market leader for 11 injectable anti-infective products in terms of units or dollars sold during the last twelve months ending November 2009. Our injectable anti-infective products generated net revenues of $226 million in 2009 and represented 25% of 2009 total net revenues.
We believe we offer one of the most comprehensive portfolios of injectable anti-infective products, including twelve different classes of antimicrobials. We believe we are the only generic pharmaceutical company that owns and operates a dedicated cephalosporins manufacturing facility in the United States. The Food and Drug Administration (“FDA”) requires dedicated facilities for the manufacture of cephalosporins.
Anti-Infective Products:
Ampicillin. Ampicillin is a penicillin based antibiotic, which treats various types of infections of the skin, central nervous system, heart, respiratory tract, sinuses, ear and kidney.
Ampicillin and Sulbactam. Ampicillin and Sulbactam is an injectable antibacterial combination consisting of the seminsynthetic antibiotic ampicillin sodium and the beta-lactamase inhibitor sulbactam sodium. Administered intravenously or intramuscular, Ampicillin and Sulbactam is indicated for the treatment of several skin and skin structure, intra-abdominal and gynecological infections due to susceptible strains of microorganisms. Ampicillin and Sulbactam is the generic equivalent of Pfizer Inc.’s Unasyn®. We launched this product in November 2006.
Azithromycin. Azithromycin is indicated for the treatment of community-acquired pneumonia and pelvic inflammatory disease when caused by susceptible microorganisms. Azithromycin is the generic equivalent of Pfizer Inc.’s Zithromax®. We launched azithromycin in February 2006.
Cefotetan. Cefotetan is a second-generation cephalosporin with a broad range of anti-microbial activity. Cefotetan is often used for surgical prophylaxis and offers the longest half-life of any cephalopsorin. AstraZeneca marketed the innovator product under the brand name Cefotan®. We launched cefotetan in September 2007 and are currently the only company to market cefotetan in the United States.
4
Table of Contents
Vancomycin. Vancomycin is an antibiotic used to treat some types of Staph, Strep or other infections, particularly in patients who are allergic to penicillins or cephalosporins. Eli Lilly originally marketed vancomycin under the brand name Vancocin®.
Injectable Critical Care Products
We manufacture and market more than 87 injectable critical care products including 29 anesthetic/analgesic products. According to IMS, 17 of our critical products held first position and 12 of our critical care products held second position in the United States market in terms of dollars sold in the last twelve months ending November 2009. Our critical care and anesthetic/analgesic products generated net revenues of approximately $577 million for the year ended December 31, 2009 and represented 65% of 2009 total net revenues.
Critical Care Products:
Heparin. Injectable heparin is a blood thinner used to prevent and treat blood clotting, especially during and after surgery. We manufacture the most comprehensive line of injectable therapeutic heparin. During 2008, we increased our manufacturing capacity and production and are currently the leading supplier in the U.S. market of therapeutic heparin vials.
Oxytocin. Oxytocin is used to induce labor at term and control postpartum bleeding. Wyeth-Ayerst originally marketed oxytocin under the brand name Pitocin®. We currently hold the number one unit and dollar share position for oxytocin in the US market.
Levothyroxine. Levothyroxine is used as replacement or supplemental therapy in hypothyroidism. APP introduced 2 codes of Levothyroxine in 2008 and we continue to be the only U.S. supplier.
Hydralazine. Hydralazine is used for hypertension and congestive heart failure. APP entered this market in 2001. A shortage of product in 2006 by American Regent allowed APP to take the U.S. market; we continue to maintain leadership in sales and units.
Thiamine. Thiamine HCL is a water soluble vitamin used for thiamine deficiency. APP has been the U.S. market leader in sales and units since 2001.
Chorionic. Human Chorionic Gonadotropin (HCG) is used as part of assisted reproductive technology (ART) program, induces ovulation and pregnancy in infertile females when the cause of infertility is functional. Also used for treatment of hypogonadotroic hypogonadism and prepubertal cryptorchidism.
Protamine. Protamine Sulfate is an antidote, used for heparin overdoses and to neutralize heparin during surgery and dialysis procedures. APP has been the U.S. market leader in sales and units since 2001.
Dexamethasone. Dexamethasone Sodium Phosphate is primarily used as an anti-inflammatory or immunosuppressant agent in the treatment of a variety of diseases. APP has been the market leader in number of units since 2004.
Diprivan. Diprivan® is a patent protected intravenous sedative-hypnotic agent and the first of a new class of intravenous anesthetic agents—the alkylphenols. Diprivan® is indicated for the induction of general anesthesia in adult and pediatric patients; maintenance of general anesthesia in adult and pediatric patients; and intensive care unit sedation for intubated, mechanically ventilated adults. Zeneca Pharmaceuticals first commercially introduced Diprivan® in the United States in 1989, and we purchased this product from AstraZeneca in June 2006. Diprivan® maintains the number one unit and dollar position in the US market.
Naropin. Naropin® is a patent protected long-acting local anesthetic that contains ropivicaine HCI, which is a member of the amino amide class of local anesthetics. Naropin® is indicated for the production of local or regional anesthesia for surgery and for acute pain management. AstraZeneca developed Naropin®, and we purchased this product from AstraZeneca in June 2006.
Injectable Pharmaceutical Products under Development
We believe that we are currently the leader in injectable abbreviated new drug applications, or “ANDA”. Since June 1, 1998, when we acquired 14 pending ANDAs, we have filed 109 applications with the FDA and received a total of 87 product approvals through December 31, 2009.
We currently have over 30 ANDAs pending with the FDA and over 70 product candidates under development across our oncology, anti-infective and critical care product categories.
5
Table of Contents
Research and Development
We have approximately 65 employees dedicated to product development who have expertise in areas such as pharmaceutical formulation, analytical chemistry and drug delivery. We currently lease and operate 48,000 square feet in a research and development facility in Melrose Park, Illinois.
When developing new products, we consider a variety of factors, including:
| • | potential pricing and gross margins; |
| • | existing and potential market size; |
| • | high barriers to entry; |
| • | patent expiration date; |
| • | our manufacturing capabilities and access to raw materials; |
| • | potential development and competitive challenges; and |
| • | whether these products complement our existing products and the opportunity to leverage these products with the development of additional products. |
We have made, and will continue to make, substantial investment in research and development. Research and development costs totaled $28.3 million in 2009, $51.5 million for the combined predecessor and successor period in 2008, and $46.5 million in 2007. The combined predecessor and successor period in 2008 and 2007 include Puerto Rico start-up facility costs.
Sales and Marketing
Our products are primarily marketed by a dedicated sales force to hospitals, long-term care facilities, alternate care sites, and clinics who administer injectable products in their offices. Many purchases by these customers are made through arrangements with Group Purchasing Organizations (GPOs), which negotiate collective purchasing agreements on behalf of their members, or through specialty distributors, which specialize in particular therapeutic categories such as oncology. We sell to members of all of the major GPOs in the United States, which we believe collectively represent over 95% of all hospital-based pharmaceutical purchasers in the United States. We also sell products to the leading specialty distributors. We believe we have access to nearly 100% of the buyers of injectable products in the United States. Our sales force is comprised of approximately 32 field sales and national accounts professionals, supported by our customer service and sales support groups. Our representatives typically have substantial injectable pharmaceutical sales experience in the geographic region in which they operate.
We currently derive, and expect to continue to derive, a large percentage of our revenue from customers that are members of a small number of GPOs. Sales to our three major wholesale customers comprised 75%, 70%, and 74% of our 2009, 2008 and 2007 net revenue, respectively. As is traditional in the pharmaceutical industry, a significant amount of our generic pharmaceutical products are sold to end users under GPO contracts through a relatively small number of drug wholesalers, which comprise the primary pharmaceutical distribution chain in the United States. Currently, fewer than ten GPOs control a large majority of sales to hospital customers. We have purchasing arrangements with the major GPOs in the United States, including AmeriNet, Inc., Broadlane Healthcare Corporation, HealthTrust Purchasing Group, MedAssets Inc., Novation, LLC, Cardinal Health Purchasing, PACT, LLC, Premier Purchasing Partners, LP, International Oncology Network, Oncology Therapeutic Network, and U.S. Oncology, Inc. In order to maintain these relationships, we believe we need to be a reliable supplier, offer a broad product line, remain price competitive, comply with FDA regulations and provide high-quality products. Our GPO agreements are typically multi-year in duration and may be terminated on short notice.
Competition
Competition among pharmaceutical and other companies that develop, manufacture or market pharmaceutical products is intense. We compete with these entities in all areas of business, including competing to attract and retain qualified scientific and technical personnel.
We face competition from major, brand name pharmaceutical companies as well as generic manufacturers such as Hospira, Inc., Bedford Laboratories, Baxter Laboratories, Teva Pharmaceuticals and increased competition from new, overseas competitors.
6
Table of Contents
Revenue and gross profit derived from sales of generic pharmaceutical products tend to follow a pattern based on regulatory and competitive factors. As patents for brand name products and related exclusivity periods expire, the first generic pharmaceutical manufacturer to receive regulatory approval for generic versions of these products is generally able to achieve significant market penetration and higher margins. As competing generic manufacturers receive regulatory approvals on similar products, market share, revenue and gross profit typically decline. The level of market share, revenue and gross profit attributable to a particular generic pharmaceutical product is normally related to the number of competitors in that product’s market and the timing of that product’s regulatory approval and launch in relation to competing approvals and launches. We continue to develop and introduce new products in a timely and cost-effective manner and identify niche products in order to maintain our revenue and gross margins.
Regulatory Considerations
Prescription pharmaceutical products are subject to extensive pre- and post-market regulation by the FDA, including regulations that govern the testing, manufacturing, safety, efficacy, labeling, storage, record keeping, advertising and promotion of the products under the Federal Food Drug and Cosmetic Act and the Public Health Services Act, and by comparable agencies in foreign countries. FDA approval is required before any dosage form of any drug can be marketed in the United States. All applications for FDA approval must contain information relating to pharmaceutical formulation, stability, manufacturing, processing, packaging, labeling and quality control.
Generic Drug Approval
The Drug Price Competition and Patent Term Restoration Act of 1984, or the Hatch-Waxman Act, established abbreviated FDA approval procedures for those drugs that are no longer protected by patents and which are shown to be equivalent to previously approved proprietary drugs. Approval to manufacture these drugs is obtained by filing an abbreviated new drug application, or an ANDA. An ANDA is a comprehensive submission that must contain data and information pertaining to the active pharmaceutical ingredient, drug product formulation, specifications and stability of the generic drug, as well as analytical methods, manufacturing process validation data and quality control procedures. As a substitute for clinical studies, the FDA may require data indicating that the ANDA drug formulation is equivalent to a previously approved proprietary drug. In order to obtain an ANDA approval of strength or dosage form that differs from the referenced brand name drug, an applicant must file and have granted an ANDA Suitability Petition. A product is not eligible for ANDA approval if it is not determined by the FDA to be equivalent to the referenced brand name drug or if it is intended for a different use. However, such a product might be approved under a New Drug Application, or an NDA, with supportive data from clinical trials.
One advantage of the ANDA approval process is that an ANDA applicant generally can rely upon equivalence data in lieu of conducting pre-clinical testing and clinical trials to demonstrate that a product is safe and effective for its intended use. We generally file ANDAs to obtain approval to manufacture and market our generic products. No assurance can be given that ANDAs submitted for our products will receive FDA approval on a timely basis, if at all.
Sales and Marketing Regulations
We are also subject to various federal and state laws pertaining to health care “fraud and abuse,” including anti-kickback laws and false claims laws. Anti-kickback laws make it illegal to solicit, offer, receive, or pay any remuneration in exchange for, or to induce, the referral of business, including the purchase or prescription of a particular drug. The federal government has published regulations that identify “safe harbors” or exemptions for certain arrangements that do not violate the anti-kickback statutes. Due to the breadth of the statutory provisions and the absence of guidance in the form of regulations or court decisions addressing some of these practices, it is possible that our practices might be challenged under anti-kickback or similar laws. False claims laws prohibit anyone from knowingly and willingly presenting, or causing to be presented for payment to third party payers (including Medicare and Medicaid), claims for reimbursed drugs or services that are false or fraudulent, claims for items or services not provided as claimed, or claims for medically unnecessary items or services. The activities of our strategic partners relating to the sale and marketing of our products may be subject to scrutiny under these laws. Violations of fraud and abuse laws may be punishable by criminal and/or civil sanctions, including fines and civil monetary penalties, as well as the possibility of exclusion from federal health care programs (including Medicare and Medicaid). If the government were to allege against or convict us of violating these laws, there could be a material adverse effect on us. Our activities could be subject to challenge for the reasons discussed above and due to the broad scope of these laws and the increasing attention being given to them by law enforcement authorities.
Other Regulations
We are also subject to regulation under the Occupational Safety and Health Act, the Toxic Substances Control Act, the Resource Conservation and Recovery Act, and other current and potential future federal, state, or local laws, rules, and/or regulations. Our research and development activities involve the controlled use of chemicals, biological materials and other hazardous materials. We believe that our procedures comply with the standards prescribed by federal, state, or local laws, rules, and/or regulations; however, the risk of injury or accidental contamination cannot be completely eliminated.
7
Table of Contents
Manufacturing
Our manufacturing operations are located in Melrose Park, Illinois, Grand Island, New York, Raleigh, North Carolina and Barceloneta, Puerto Rico. These manufacturing facilities, include dedicated cephalosporin powder filling, liquid filling line and oncolytic manufacturing suites. In aggregate, our facilities encompass approximately 1,050,000 square feet of manufacturing, packaging, laboratory, office and warehouse space. In 2009, we finalized a plan to close the Barceloneta, Puerto Rico manufacturing facility that we acquired in connection with the Merger, and to transfer its production operations to existing Company plants in the United States. We are continuing to operate this facility during the transition, and expect that manufacturing operations at the Puerto Rico facility will cease mid 2010.
We can produce a broad range of dosage formulations, including lyophilized products, liquids, both aseptically filled and terminally sterilized, and powders. We currently produce approximately 190 million vials of product per year and have the capacity to produce 250 million vials of product per year.
In addition to manufacturing, we have fully integrated manufacturing support systems, including quality assurance, quality control, regulatory affairs and inventory control. These support systems enable us to maintain high standards of quality for our products and simultaneously deliver reliable services and goods to our customers on a timely basis.
We are required to comply with the applicable FDA manufacturing requirements contained in the FDA’s current Good Manufacturing Practice, or cGMP, regulations. cGMP regulations require quality control and quality assurance as well as the corresponding maintenance of records and documentation. Our manufacturing facilities must meet cGMP requirements to permit us to manufacture our products. We are subject to the periodic inspection of our facilities, procedures and operations and/or the testing of our products by the FDA, the Drug Enforcement Administration and other authorities to assess our compliance with applicable regulations.
Failure to comply with the statutory and regulatory requirements subjects the manufacturer to possible legal or regulatory action, including the seizure or recall of products, injunctions, consent decrees placing significant restrictions on or suspending manufacturing operations, and civil and criminal penalties. Adverse experiences with the product must be reported to the FDA and could result in the imposition of market restriction through labeling changes or in product removal. Product approvals may be withdrawn if compliance with regulatory requirements is not maintained or if problems concerning safety or efficacy of the product occur following approval.
Raw Materials
The manufacture of our products requires raw materials and other components that must meet stringent FDA requirements. Some of these raw materials and other components currently are available only from a limited number of sources. Additionally, regulatory approvals for a particular product denote the raw materials and components, and the suppliers for such materials that may be used for that product. Even when more than one supplier exists, we may elect to list, and in some cases have only listed, one supplier in our applications with the FDA. Any change in or addition of a supplier not previously approved must then be submitted through a formal approval process with the FDA. From time to time, it is necessary to maintain increased levels of certain raw materials due to the anticipation of raw material shortages or in response to market opportunities.
Intellectual Property
We rely on trade secrets, unpatented proprietary know-how, continuing technological innovation and patent protection to preserve our competitive position. Our success depends on our ability to operate without infringing the patents and proprietary rights of third parties. We cannot determine with certainty whether patents or patent applications of other parties will materially affect our ability to make, use or sell any products. A number of pharmaceutical companies, biotechnology companies, universities and research institutions may have filed patent applications or may have been granted patents that cover aspects of our or our licensors’ products, product candidates or other technologies.
Intellectual property protection is highly uncertain and involves complex legal and factual questions. Our patents and those for which we have or will license rights may be challenged, invalidated, infringed or circumvented, and the rights granted in those patents may not provide proprietary protection or competitive advantages to us. We and our licensors may not be able to develop patentable products. Even if patent claims are allowed, the claims may not issue, or in the event of issuance, may not be sufficient to protect the technology owned by or licensed to us.
Third-party patent applications and patents could reduce the coverage of the patents licensed, or that may be licensed to or owned by us. If patents containing competitive or conflicting claims are issued to third parties, we may be enjoined from commercialization of products or be required to obtain licenses to these patents or to develop or obtain alternative technology. In addition, other parties may duplicate, design around or independently develop similar or alternative technologies to our licensors or ours.
8
Table of Contents
Litigation may be necessary to enforce patents issued or licensed to us or to determine the scope or validity of another party’s proprietary rights. U.S. Patent and Trademark Office interference proceedings may be necessary if we and another party both claim to have invented the same subject matter. We could incur substantial costs and our management’s attention would be diverted if:
| • | patent litigation is brought by third parties; |
| • | we are party to or participate in patent suits brought against or initiated by our licensors; |
| • | we initiate similar suits; or |
| • | we are party to or participate in an interference proceeding. |
In addition, we may not prevail in any of these actions or proceedings.
Employees
As of December 31, 2009, we had a total of 1,615 full-time employees, of which 65 were engaged in research and development, 411 were in quality assurance and quality control, 843 were in manufacturing, 96 were in sales and marketing and 200 were in administration and finance. None of our employees are represented by a labor union or subject to a collective bargaining agreement. We have not experienced any work stoppage and consider our relations with our employees to be good.
Environment
We believe that our operations comply in all material respects with applicable laws and regulations concerning the environment. While it is impossible to predict accurately the future costs associated with environmental compliance and potential remediation activities, compliance with environmental laws is not expected to require significant capital expenditures and has not had, and is not expected to have, a material adverse effect on our earnings or competitive position.
Available Information
Our Internet address is www.apppharma.com. Our annual reports on Form 10-K, quarterly reports on Form 10-Q, current reports on Form 8-K and amendments to such reports, are available free of charge on our website as soon as reasonably practical after they are electronically filed or furnished to the SEC. These filings may also be read and copied at the SEC’s Public Reference Room at 450 Fifth Street N.W., Washington D.C., 20549. Information on the operation of the Public Reference Room may be obtained by calling the SEC at 1-800-SEC-0330. The information found on our website shall not be deemed incorporated by reference by any general statement into any filing under the Securities Act of 1933 or under the Securities Exchange Act of 1934, except to the extent we specifically incorporate the information found on our website by reference, and shall not be deemed filed under such Acts.
The SEC also maintains an Internet site that contains reports, proxy and information statements, and other information about issuers that file reports electronically with the SEC. The address of that site is http://www.sec.gov.
| Item 1A. | RISK FACTORS |
You should carefully consider the risks described below before investing in our securities. The risks described below are not only risks unique to our company. Our business is also subject to the risks that affect many other companies, such as competition and general economic conditions. Additional risks not currently known to us or that we currently believe are immaterial also may impair our business operations and our liquidity.
Risk Factors Related to Our Business
If we are unable to develop and commercialize new products, our ability to generate revenue and Adjusted EBITDA will deteriorate.
Profit margins for a pharmaceutical product generally decline as new competitors enter the market. As a result, our future success will depend on our ability to commercialize the product candidates we are currently developing, as well as our ability to develop new products in a timely and cost-effective manner. We currently have over 30 ANDAs pending with the FDA, and approximately 70 product candidates under various stages of development. Successful development and commercialization of product candidates will require significant investment in many areas, including research and development and sales and marketing, and we may not realize a return on those investments. In addition, development and commercialization of new products are subject to inherent risks, including:
| • | failure to receive necessary regulatory approvals; |
9
Table of Contents
| • | difficulty or impossibility of manufacture on a large scale; |
| • | prohibitive or uneconomical costs of marketing products; |
| • | inability to secure raw material or components from third-party vendors in sufficient quantity or quality or at a reasonable cost; |
| • | failure of our products to be developed or commercialized prior to the successful marketing of similar or superior products by third parties; |
| • | lack of acceptance by customers; |
| • | impact of authorized generic competition; |
| • | infringement on the proprietary rights of third parties; |
| • | new patents may be granted for existing products, which could prevent the introduction of newly-developed products for additional periods of time; and |
| • | grant to another manufacturer by the FDA of a 180-day period of marketing exclusivity under the Drug Price Competition and Patent Term Restoration Act of 1984, or the Hatch-Waxman Act, as patents or other exclusivity periods for brand name products expire. |
The timely and continuous introduction of new products is critical to our business. Our ability to grow revenue will deteriorate if we are unable to successfully develop and commercialize new products, which could have an adverse effect on our ability to achieve the Adjusted EBITDA threshold required to trigger a payment under the CVRs.
As a result of the acquisition, we now have substantially more debt.
We now have substantial indebtedness as a result of the consummated acquisition. As of December 31, 2009 we have $ 3.9 billion of outstanding indebtedness; comprised of approximately $0.9 billion of term loans from a group of financial institutions and $3.0 billion of intercompany loans. There can be no assurance that our businesses will be able to generate sufficient cash flows from operations to meet our debt service obligations. Our level of indebtedness will have important consequences, including limiting our ability to invest operating cash flow to expand our businesses or execute our strategies, to capitalize on business opportunities and to react to competitive pressures, because we will need to dedicate a substantial portion of these cash flows to service our debt. In addition, we could be unable to refinance or obtain additional financing because of market conditions, high levels of debt and the restrictions included in the debt instruments executed in connection with our recent acquisition.
If sales of key products decline, our business may be adversely affected.
Our top ten products comprised approximately 58% of our total net revenue for the year ended December 31, 2009, with the top five products accounting for 48% of our total net revenue. Our key products could lose market share or revenue due to numerous factors, many of which are beyond our control, including:
| • | lower prices offered on similar products by other manufacturers; |
| • | substitute or alternative products or therapies; |
| • | development by others of new pharmaceutical products or treatments that are more effective than our products; |
| • | introduction of other generic equivalents or products which may be therapeutically interchanged with our products; |
| • | interruptions in manufacturing or supply; |
| • | changes in the prescribing practices of physicians; |
| • | changes in third-party reimbursement practices; and |
| • | migration of key customers to other manufacturers or sellers. |
Any factor adversely affecting the sale of our key products may cause our revenues to decline, which could have an adverse effect on our ability to achieve the Adjusted EBITDA threshold required to trigger a payment under the CVRs.
10
Table of Contents
We are subject to changes in general economic conditions that are beyond our control, including recession and declining consumer confidence.
The global economy is currently undergoing a period of unprecedented volatility, and the future economic environment may be less favorable than that of recent years. This has led, and could further lead, to reduced consumer spending in the foreseeable future, which may include reduced spending on healthcare. While generic drugs present an alternative to higher-priced branded products, our sales could be negatively impacted if patients forego obtaining healthcare and purchasing pharmaceutical products. In addition, reduced consumer spending may drive us and our competitors to decrease prices. These conditions may adversely affect our industry, business and results of operations.
If we or our suppliers are unable to comply with ongoing and changing regulatory standards, sales of our products could be delayed or prevented.
Virtually all aspects of our business, including the development, testing, manufacturing, processing, quality, safety, efficacy, packaging, labeling, record-keeping, distribution, storage and advertising and promotion of our products and disposal of waste products arising from these activities, are subject to extensive regulation by federal, state and local governmental authorities in the United States, including the FDA and the Department of Health and Human Services Office of Inspector General (OIG). Our business is also subject to regulation in foreign countries. Compliance with these regulations is costly and time-consuming.
Our manufacturing facilities and procedures and those of our suppliers are subject to ongoing regulation, including periodic inspection by the FDA and foreign regulatory agencies. For example, manufacturers of pharmaceutical products must comply with detailed regulations governing current good manufacturing practices, including requirements relating to quality control and quality assurance. We must spend funds, time and effort in the areas of production, safety, quality control and quality assurance to ensure compliance with these regulations. We cannot assure you that our manufacturing facilities or those of our suppliers will not be subject to regulatory action in the future.
Our products must receive appropriate regulatory clearance before they can be sold in a particular country, including the United States. We may encounter delays in the introduction of a product as a result of, among other things, failure of clinical trials to show safety or efficacy, undesirable side effects, insufficient or incomplete submissions to the FDA for approval of a product, objections by another company to submissions for approval, patent protection covering brand name products, patent challenges by other companies which result in a 180-day exclusivity period awarded to the challenger, and changes in regulatory policy during the period of product development or during the regulatory approval process. The FDA has the authority to revoke drug approvals previously granted and remove from the market previously approved products for various reasons, including issues related to current good manufacturing practices for that particular product or in general. We may be subject from time to time to product recalls initiated by them or by the FDA. Delays in obtaining regulatory approvals, the revocation of a prior approval or product recalls could impose significant costs on us and adversely affect our ability to generate revenue.
Our inability or the inability of our suppliers to comply with applicable FDA and other regulatory requirements can result in, among other things, warning letters, fines, consent decrees restricting or suspending our manufacturing operations, delay of approvals for new products, injunctions, civil penalties, recall or seizure of products, total or partial suspension of sales and criminal prosecution. Any of these regulatory actions could materially and adversely affect our ability to generate and receive revenue and result in the incurrence of significant expenses, which could have an adverse effect on our ability to achieve the Adjusted EBITDA threshold required to trigger a payment under the CVRs.
State pharmaceutical marketing compliance and reporting requirements may expose us to regulatory and legal action by state governments or other government authorities.
In recent years, several states, including California, Vermont, Maine, Minnesota, New Mexico, West Virginia and Nevada in addition to the District of Columbia, have enacted legislation requiring pharmaceutical companies to establish marketing compliance programs and file periodic reports on sales, marketing, pricing and other activities. Similar legislation is being considered in other states. Many of these requirements are new and uncertain, and available guidance is limited. We have received notice regarding possible non-compliance with these state laws and certain licensing requirements. However, we continue to assess and address our compliance obligations under these state laws. Unless we are in full compliance with these laws, we could face enforcement action and fines and other penalties and could receive adverse publicity, all of which could harm our business.
If side effects or manufacturing problems are identified after the products are on the market, we may be subject to additional regulatory requirements or enforcement.
If side effects are identified after any of our products are on the market, or if manufacturing problems occur, regulatory approval may be withdrawn and reformulation of products, additional clinical trials, changes in labeling of products, and changes to or re-approvals of our manufacturing facilities may be required, any of which could have a material adverse effect on our sales of the affected products.
11
Table of Contents
After any of our products are approved for commercial use, we or regulatory bodies could decide that changes to the product labeling are needed to ensure the safety and effectiveness of the products. Label changes may be necessary for a number of reasons, including the identification of actual or theoretical safety or efficacy concerns by regulatory agencies or the discovery of significant problems with a similar product that implicates an entire class of products. Any significant concerns raised about the safety or efficacy of the products could also result in the need to reformulate those products, to conduct additional clinical trials, to make changes to the manufacturing processes, or to seek re-approval of the relevant manufacturing facilities. Significant concerns about the safety and effectiveness of a product could ultimately lead to the revocation of its marketing approval. The revision of product labeling or the regulatory actions described above could be required even if there is no clearly established connection between the product and the safety or efficacy concerns that have been raised. The revision of product labeling or the regulatory actions described above could have a material adverse effect on our sales of the affected products and on our business and results of operations, which could have an adverse effect on our ability to achieve the Adjusted EBITDA threshold required to trigger a payment under the CVRs.
The manufacture of our products is highly exacting and complex, and if we or our suppliers encounter production problems, our business may suffer.
Almost all of the pharmaceutical products we make are sterile, injectable drugs. We also purchase some of these products from other companies. The manufacture of all the products is highly exacting and complex, due in part to strict regulatory requirements and standards which govern both the manufacture of a particular product and the manufacture of these types of products in general. Problems may arise during their manufacture due to a variety of reasons including equipment malfunction, failure to follow specific protocols and procedures and environmental factors. If problems arise during the production of a batch of product, that batch of product may have to be discarded. This could, among other things, lead to loss of the cost of raw materials and components used, lost revenue, time and expense spent in investigating the cause and, depending on the cause, similar losses with respect to other batches or products. If such problems are not discovered before the product is released to the market, recall costs may also be incurred. To the extent we experience problems in the production of our pharmaceutical products, this may be detrimental to our business, operating results and reputation.
Our market is highly competitive, and if we are unable to compete successfully, our revenue will decline and our business will be harmed.
The markets for injectable pharmaceutical products are highly competitive, rapidly changing and undergoing consolidation. Most of our products are generic injectable versions of brand name products that are still being marketed by proprietary pharmaceutical companies. The first company to market a generic product is often initially able to achieve high sales, profitability and market share with respect to that product. Prices, revenue and market size for a product typically decline, however, as additional generic manufacturers enter the market.
We face, and will continue to face, competition from major, brand-name pharmaceutical companies as well as generic manufacturers such as Hospira, Inc., Bedford Laboratories, Baxter Laboratories (including Elkin-Sinn), SICOR Inc. (acquired by Teva Pharmaceuticals USA) and Mayne Pharma (acquired by Hospira, Inc.) and, in the future, increased competition from new, foreign competitors. Smaller and foreign companies may also prove to be significant competitors, particularly through collaboration arrangements with large and established companies. Some of our competitors have significantly greater research and development, financial, sales and marketing, manufacturing, regulatory and other resources than we have. As a result, they may be able to devote greater resources to the development, manufacture, marketing or sale of their products, receive greater resources and support for their products, initiate or withstand substantial price competition, more readily take advantage of acquisition or other opportunities, or otherwise more successfully market their products.
Any reduction in demand for our products could lead to a decrease in prices, fewer customer orders, reduced revenues, reduced margins and reduced levels of profitability or loss of market share. These competitive pressures could adversely affect our business and operating results, which could have an adverse effect on our ability to achieve the Adjusted EBITDA threshold required to trigger a payment under the CVRs.
We face uncertainty related to pricing and reimbursement and health care reform.
In both domestic and foreign markets, sales of our products will depend, in part, on the availability of reimbursement from third-party payors such as government health administration authorities, private health insurers, health maintenance organizations and other health care-related organizations. However, reimbursement by such payors is presently undergoing reform, and there is significant uncertainty at this time how this will affect sales of certain pharmaceutical products. There is possible U.S. legislation or regulatory action affecting, among other things, pharmaceutical pricing and reimbursement, including under Medicaid and Medicare, and the importation of prescription drugs that are marketed outside the U.S. and sold at prices that are regulated by governments of various foreign countries.
12
Table of Contents
Medicare, Medicaid and other governmental reimbursement legislation or programs govern drug coverage and reimbursement levels in the United States. Federal law requires all pharmaceutical manufacturers to rebate a percentage of their revenue arising from Medicaid-reimbursed drug sales to individual states. Generic drug manufacturers’ agreements with federal and state governments provide that the manufacturer will remit to each state Medicaid agency, on a quarterly basis, 11% of the average manufacturer price for generic products marketed and sold under abbreviated new drug applications covered by the state’s Medicaid program. For proprietary products, which are marketed and sold under new drug applications, manufacturers are required to rebate the greater of: (a) 15.1% of the average manufacturer price or (b) the difference between the average manufacturer price and the manufacturer’s best price to any customer for products sold during a specified period. The Medicaid program also requires pharmaceutical manufacturers to report certain information to the Centers for Medicare & Medicaid Services (CMS) on a periodic basis, including average manufacturer price and best price. The Medicare program requires manufacturers of Part B drugs, generally injectables, to report average sales price to CMS on a quarterly basis. If a pharmaceutical manufacturer is found to have knowingly submitted false information to the government, it may be liable for civil monetary penalties per item of false information.
Both the federal and state governments in the United States and foreign governments continue to propose and pass new legislation, rules and regulations designed to contain or reduce the cost of health care. Existing regulations that affect the price of pharmaceutical and other medical products may also change before any of our products are approved for marketing. Cost control initiatives could decrease the price that we receive for any product we develop in the future. In addition, third-party payors are increasingly challenging the price and cost-effectiveness of medical products and services and litigation has been filed against a number of pharmaceutical companies in relation to these issues. Additionally, significant uncertainty exists as to the reimbursement status of newly approved injectable pharmaceutical products. Our products may not be considered cost effective or adequate third-party reimbursement may not be available to enable us to maintain price levels sufficient to realize an adequate return on our investment.
If we are unable to maintain key customer arrangements, sales of our products and revenue will decline.
Almost all injectable pharmaceutical products are sold to customers through arrangements with group purchasing organizations, or GPOs, and distributors. The majority of hospitals contract with the GPO of their choice for their purchasing needs. Prior to the Merger, APP derived, and we expect will continue to derive, a large percentage of its revenue through a small number of GPOs. Currently, fewer than ten GPOs control a large majority of sales to hospital customers.
We have purchasing arrangements with the major GPOs in the United States, including AmeriNet, Inc., Broadlane Healthcare Corporation, MedAssets Inc., Novation, LLC, PACT, LLC, Premier Purchasing Partners, LP, International Oncology Network, and U.S. Oncology, Inc. In order to maintain these relationships, we believe that we need to be a reliable supplier, offer a broad product line, remain price competitive, comply with FDA regulations and provide high-quality products. The GPOs through which we sell our products also have purchasing agreements with other manufacturers that sell competing products and the bid process for products like ours is highly competitive. Most of our GPO agreements may be terminated on short notice. If we are unable to maintain these arrangements with GPOs and key customers, revenue of our products would decline, which could have an adverse effect on our ability to achieve the Adjusted EBITDA threshold required to trigger a payment under the CVRs.
The strategy to license rights to or acquire and commercialize proprietary or other specialty injectable products may not be successful, and we may never receive any return on our investment in these product candidates.
We may license rights to or acquire or commercialize proprietary or other specialty injectable products or technologies. Other companies, including those with substantially greater financial and sales and marketing resources, will compete with us to license rights to or acquire or commercialize these products. We may not be able to license rights to or acquire these proprietary or other products or technologies on acceptable terms, if at all. Even if we obtain rights to a pharmaceutical product and commit to payment terms, including, in some cases, up-front license payments, we may not be able to generate product sales sufficient to create a profit or otherwise avoid a loss.
A product candidate may fail to result in a commercially successful drug for other reasons, including the possibility that the product candidate may:
| • | fail to receive necessary regulatory approvals; |
| • | be difficult or uneconomical to produce in commercial quantities; |
| • | be precluded from commercialization by proprietary rights of third parties; or |
| • | fail to achieve market acceptance. |
The marketing strategy, distribution channels and levels of competition with respect to any licensed or acquired product may be different from those of our current products, and we may not be able to compete favorably in any new product category.
13
Table of Contents
We depend heavily on the principal members of our management team, the loss of whom could harm our business.
We depend heavily on the principal members of our executive management team. Each of the members of our executive management team is employed “at will.” The loss of the services of any member of our executive management team may significantly delay or prevent the achievement of our product development or business objectives.
To be successful, we must attract, retain and motivate key employees, and the inability to do so could seriously harm our operations.
To be successful, we must attract, retain and motivate executives and other key employees. We face competition for qualified scientific, technical and other personnel, which may adversely affect our ability to attract and retain key personnel. We also must attract and motivate employees and keep them focused on our strategies and goals.
We depend on third parties to supply raw materials and other components and we may not be able to obtain sufficient quantities of these materials, which will limit our ability to manufacture our products on a timely basis and harm our operating results.
The manufacture of our products requires raw materials and other components that must meet stringent FDA requirements. Some of these raw materials and other components are available only from a limited number of sources. Additionally, our regulatory approval for each particular product specifies the raw materials and components, and the suppliers for such materials, that we may use for that product. Obtaining approval to change, substitute or add a raw material or component, or the supplier of a raw material or component, can be time consuming and expensive, as testing and regulatory approval is necessary. If our suppliers are unable to deliver sufficient quantities of these materials on a timely basis or we encounter difficulties in our relationships with these suppliers, the manufacture and sale of our products may be disrupted, and our business, operating results and reputation could be adversely affected.
Other companies may claim that we infringe on their intellectual property or proprietary rights, which could cause us to incur significant expenses or prevent us from selling our products.
Our success depends in part on our ability to operate our business without infringing the patents and proprietary rights of third parties. The manufacture, use, offer for sale and sale of pharmaceutical products have been subject to substantial litigation in the pharmaceutical industry. These lawsuits relate to the enforceability, validity and infringement of patents or proprietary rights of third parties. Infringement litigation is prevalent with respect to generic versions of products for which the patent covering the brand name product is expiring, particularly since many companies which market generic products focus their development efforts on products with expiring patents. A number of pharmaceutical companies, biotechnology companies, universities and research institutions may have filed patent applications or may have been granted patents that cover aspects of our products or their licensors’ products, product candidates or other technologies.
Future or existing patents issued to third parties may contain claims that conflict with our products. We are subject to infringement claims from time to time in the ordinary course of our business, and third parties could assert infringement claims against us in the future with respect to our current products, products we may develop or products we may license. In addition, our patents and patent applications, or those of our licensors, could face other challenges, such as interference, opposition and reexamination proceedings. Any such challenge, if successful, could result in the invalidation of, or a narrowing of scope of, any such patents and patent applications. Litigation or other proceedings could force us to:
| • | stop or delay selling, manufacturing or using products that incorporate or are made using the challenged intellectual property; |
| • | pay damages; or |
| • | enter into licensing or royalty agreements that may not be available on acceptable terms, if at all. |
Any litigation or interference proceedings, regardless of their outcome, would likely delay the regulatory approval process, be costly and require significant time and attention of key management and technical personnel.
Our inability to protect our intellectual property rights in the United States and foreign countries could limit our ability to manufacture or sell our products.
We rely on trade secrets, unpatented proprietary know-how, continuing technological innovation and patent protection to preserve our competitive position. Our patents and those for which we have or will license rights, may be challenged, invalidated, infringed or circumvented, and the rights granted in those for which we hold patents may not provide proprietary protection or competitive advantages to us. We and our licensors may not be able to develop patentable products. Even if patent claims are allowed, the claims may not issue, or in the event of issuance, may not be sufficient to protect the technology owned by or licensed to us. Third-party patents could reduce the coverage of the patents licensed, or that may be licensed to or owned by us. If patents containing competitive or conflicting claims are issued to third parties, we may be prevented from commercializing the products covered by such patents, or may be required to obtain or develop alternate technology. In addition, other parties may duplicate, design around or independently develop similar or alternative technologies.
14
Table of Contents
We may not be able to prevent third parties from infringing or using our intellectual property. We generally control and limit access to, and the distribution of, our product documentation and other proprietary information. Despite these efforts to protect this proprietary information, however, unauthorized parties may obtain and use information that we regard as proprietary. Other parties may independently develop similar know-how or may even obtain access to our technologies.
The laws of some foreign countries do not protect proprietary information to the same extent as the laws of the United States, and many companies have encountered significant problems and costs in protecting their proprietary information in these foreign countries.
The U.S. Patent and Trademark Office and the courts have not established a consistent policy regarding the breadth of claims allowed in pharmaceutical patents. The allowance of broader claims may increase the incidence and cost of patent interference proceedings and the risk of infringement litigation. On the other hand, the allowance of narrower claims may limit the value of our proprietary rights.
We may become subject to federal and state false claims or other similar litigation brought by private individuals and the government.
The Federal False Claims Act allows persons meeting specified requirements to bring suit alleging false or fraudulent Medicare or Medicaid claims and to share in any amounts paid to the government in fines or settlement. These suits, known as qui tam actions, have increased significantly in recent years and have increased the risk that a health care company will have to defend a false claim action, pay fines and/or be excluded from Medicare and Medicaid programs. Federal false claims litigation can lead to civil monetary penalties, criminal fines and imprisonment and/or exclusion from participation in Medicare, Medicaid and other federally-funded health programs. Other alternate theories of liability may also be available to private parties seeking redress for such claims. A number of parties have brought claims against numerous pharmaceutical manufacturers, and we cannot be certain that such claims will not be brought against us, or if they are brought, that such claims might not be successful. A majority of states have enacted their own false claim act statutes and have used them to bring similar suits against pharmaceutical manufacturers.
We may need to change our business practices to comply with changes to, or may be subject to charges under, the fraud and abuse laws.
We are subject to various federal and state laws pertaining to health care fraud and abuse, including the federal Anti-Kickback Statute and its various state analogues, the federal False Claims Act and marketing and pricing laws. Violations of these laws are punishable by criminal and/or civil sanctions, including, in some instances, imprisonment and exclusion from participation in federal and state health care programs such as Medicare and Medicaid. We believe that we are in substantial compliance with these laws, but the government could disagree and challenge our practices, which could materially and adversely affect our business. We may have to change our advertising and promotional business practices, or our existing business practices could be challenged as unlawful due to changes in laws, regulations or rules or due to administrative or judicial findings, which could materially adversely affect our business.
We may be required to defend lawsuits or pay damages for product liability claims.
Product liability is a major risk in testing and marketing pharmaceutical products. We may face substantial product liability exposure for products that we sell after regulatory approval. Historically, we carried product liability insurance and we continue to carry such policies. Product liability claims, regardless of their merits, could exceed policy limits, divert management’s attention and adversely affect our reputation and the demand for our products.
15
Table of Contents
We may be required to indemnify Abraxis BioScience, Inc. and may not be able to collect on indemnification rights from Abraxis BioScience.
Under the terms of the separation and distribution agreement relating to the separation of Abraxis BioScience, Inc. from APP in November 2007, Abraxis BioScience agreed to indemnify APP from and after the spin-off with respect to all liabilities of the pre-separation company not related to APP’s business and the use by APP of any trademarks or other source identifiers owned by Abraxis BioScience. Similarly, APP agreed to indemnify Abraxis BioScience from and after the spin-off with respect to all liabilities of the pre-separation company related to APP’s business and the use by Abraxis BioScience of any trademarks or other source identifiers owned by APP. Under the terms of a tax allocation agreement relating to the separation of Abraxis BioScience from APP, Abraxis BioScience agreed to indemnify APP against all tax liabilities to the extent they relate to the proprietary products business, and APP agreed to indemnify Abraxis BioScience against all tax liabilities to the extent they relate to the hospital-based products business. In addition, Abraxis BioScience agreed to indemnify APP against any tax liability arising as a result of the spin-off failing to qualify as a tax-free distribution unless such tax liability is imposed as a result of an acquisition of APP, including the Merger, or certain other specified acts of APP. Under the terms of a manufacturing agreement relating to the separation of Abraxis BioScience from APP, Abraxis BioScience agreed to indemnify APP from any damages resulting from a third-party claim caused by or alleged to be caused by (i) Abraxis BioScience’s failure to perform its obligations under the manufacturing agreement; (ii) any product liability claim arising from the negligence, fraud or intentional misconduct of Abraxis BioScience or any of its affiliates or any product liability claim arising from Abraxis BioScience’s manufacturing obligations (or any failure or deficiency in Abraxis BioScience’s manufacturing obligations) under the manufacturing agreement; (iii) any claim that the manufacture, use or sale of APP’s pipeline products infringes a patent or any other proprietary right of a third party; or (iv) any recall, product liability claim or other third-party claim not arising from the gross negligence or bad faith of, or intentional misconduct or intentional breach of the manufacturing agreement by, APP by reason of the $100 million limitation of liability described below. Abraxis BioScience also agreed to indemnify APP for liabilities that Abraxis BioScience becomes subject to as a result of Abraxis BioScience’s activities under the manufacturing agreement and for which Abraxis BioScience is not responsible under the terms of the manufacturing agreement. APP agreed to indemnify Abraxis BioScience from any damages resulting from a third-party claim caused by or alleged to be caused by (i) APP’s gross negligence, bad faith, intentional misconduct or intentional failure to perform its obligations under the manufacturing agreement; or (ii) any product liability claim arising from the gross negligence or bad faith of, or intentional misconduct or intentional breach of the manufacturing agreement by APP. APP generally will not have any liability for monetary damages to Abraxis BioScience or third parties in connection with the manufacturing agreement for damages in excess of $100 million in the aggregate. There are no time limits on when an indemnification claim must be brought and no other monetary limits on the amount of indemnification that may be provided. In addition, indemnification obligations could be significant. Our ability to satisfy any of these indemnification obligations will depend upon our future financial strength. We cannot determine whether we will have to indemnify Abraxis BioScience for any substantial obligations after the separation. In addition, we also cannot assure you that, if Abraxis BioScience becomes obligated to indemnify us for any substantial obligations, Abraxis BioScience will have the ability to satisfy those obligations.
Fluctuations in our effective tax rate may adversely affect our business and results of operations.
Our effective tax rate is derived from a combination of applicable tax rates in the various countries, states and other jurisdictions in which we operate. Our effective tax rate may be lower or higher than our tax rates have been in the past due to numerous factors, including the sources of our income, any agreements we may have with taxing authorities in various jurisdictions, and the tax filing positions we take in various jurisdictions. We base our estimate of an effective tax rate at any given point in time upon a calculated mix of the tax rates applicable to our company and to estimates of the amount of business likely to be done in any given jurisdiction. The loss of one or more agreements with taxing jurisdictions, a change in the mix of our business from year to year and from country to country, changes in rules related to accounting for income taxes, changes in tax laws in any of the multiple jurisdictions in which we operate or adverse outcomes from tax audits that we may be subject to in any of the jurisdictions in which we operate could result in an unfavorable change in our effective tax rate, which change could have an adverse effect on our business and results of our operations.
Risks Related to the Contingent Value Rights
CVR holders may not receive any payment on the CVRs.
The right to receive any future payment on the CVRs will be contingent upon our and our consolidated subsidiaries’ achievement of cumulative Adjusted EBITDA (calculated in accordance with the CVR indenture) in excess of the threshold specified in the CVR indenture, which equals $1.267 billion for the three years ending December 31, 2010. If our cumulative Adjusted EBITDA does not exceed this threshold for any reason, no payment will be made under the CVRs and the CVRs will expire valueless. Our and our consolidated subsidiaries’ Adjusted EBITDA for the cumulative period beginning January 1, 2008 and ending December 31, 2009 was $663.6 million. Accordingly, the value, if any, of the CVRs is speculative, and the CVRs may ultimately have no value. See Note 4 to the consolidated financial statements—Contingent Value Rights (CVR).
16
Table of Contents
It may be difficult to determine the amount of cash to be received under the CVRs until 2011 which makes it difficult to value the CVRs.
If any payment is made on the CVRs, it will not be made until June 2011 (except in certain cases of foreclosure of the APP shares pledged as security for our indebtedness), and the amount of any payment will not be determined prior to the second quarter of 2011. We will provide an interim statement of Adjusted EBITDA for each of 2008 and 2009, and a final statement of Adjusted EBITDA following the end of 2010. The final calculation of any CVR payment, however, will be provided to CVR holders as of December 31, 2010, no earlier than the second quarter of 2011. Because the amount of any payment on the CVRs will not be determined prior to the second quarter of 2011 and the CVR payment will be determined on the basis of cumulative Adjusted EBITDA for a three-year period, it may be difficult to value the CVRs, and accordingly it may be difficult or impossible for CVR holders to resell their CVRs.
Our management may not follow the business, financial and operational policies of APP prior to the Merger.
Our directors elected by Fresenius have significant authority with respect to the business, financial and operational policies of FKP Holdings and APP. There can be no assurance that the business, financial and operational policies of APP in effect prior to the Merger including, for example, APP’s business strategy, will continue after the Merger. Different policies may adversely affect the value of the CVRs and any payment thereunder. Except in limited circumstances described in the CVR indenture, we do not have any obligations to CVR holders regarding the operation of our business after the completion of the Merger.
We have no obligation to continue to research, develop or commercialize APP’s products.
We have no obligation to initiate or continue research, development or commercialization activities with respect to any APP products and, in our sole discretion, we may abandon efforts to research, develop or commercialize any product, whether or not such product was in development or commercialized as of the closing date of the Merger. Changes or abandonment of APP’s research, development or commercialization activities by us may adversely affect the amount of Adjusted EBITDA generated by us, and our consolidated subsidiaries, which would adversely affect the value of the CVRs and any payment thereunder.
The U.S. federal income tax treatment of the CVRs is unclear.
Pursuant to the CVR indenture, we agreed to report any CVR payment (excluding any imputed interest) as additional consideration for the sale of APP common stock. Assuming this method of reporting is correct, if a payment is made with respect to a CVR, the holder of the CVR generally should recognize capital gain or loss equal to the difference between the amount of such payment (less any imputed interest) and the holder’s adjusted tax basis in the CVR. We have also agreed that a portion of any CVR payment will be treated as interest income, in accordance with Section 483 of the Internal Revenue Code. However, there is no legal authority directly addressing the U.S. federal income tax treatment of the CVRs and, therefore, there can be no assurance that the Internal Revenue Service would not assert, or that a court would not sustain, a position that any CVR payment or a sale or exchange of a CVR does not attract capital gain treatment, or that a different method should be used for purposes of calculating the amount of imputed interest. If such a position were sustained, all or any part of any CVR payment could be treated as ordinary income and could be required to be included in income prior to the receipt of any CVR payment.
Any payments in respect of the CVRs are subordinated to the right of payment of our other indebtedness.
The CVRs are unsecured obligations of FKP Holdings and the CVR payments, acceleration payments, all other obligations under the CVR indenture and the CVRs and any rights or claims relating thereto are subordinated in right of payment to the prior payment in full of all of our senior obligations. Our senior obligations include all principal, interest, penalties, fees, indemnification, reimbursements, damages and other liabilities payable under, or with respect to, our and APP’s senior credit facilities and, so long as the senior obligations are outstanding pursuant to the preceding clause, intercompany loans and other senior debt. As a result of the financing arrangements entered into in connection with the Merger, as of December 31, 2008, there was approximately $3.9 billion outstanding under credit facilities of Fresenius and its subsidiaries that would be senior to the obligations under the CVRs. Substantially all of this indebtedness would be considered senior obligations for the purposes of the subordination provisions of the CVR indenture. In addition, if a default on our senior obligations would occur as a result of the CVR payment or there is an existing payment default on our senior obligations, the maturity of our senior obligations is accelerated or in other circumstances, no CVR payment will be payable, if any payment is due, until any such default is remedied.
An active public market for the CVRs may not develop, or the CVRs may trade at low volumes, both of which could have an adverse effect on the resale price, if any, of the CVRs.
The CVRs are a new security with a limited public trading market. An active public trading market for the securities may not develop or be sustained. We have listed the CVRs on NASDAQ, under the symbol “APCVZ”. However, there may be little or no market demand for the CVRs, making it difficult or impossible to resell the CVRs, which would have an adverse effect on the resale price, if any, of the CVRs. In addition, holders of CVRs may incur brokerage charges in connection with the resale of the CVRs, which in some cases could exceed the proceeds realized by the holder from the resale of its CVRs.
17
Table of Contents
The market price and trading volume of the CVRs may be volatile.
The market price of the CVRs could fluctuate significantly for many reasons, including, without limitation:
| • | as a result of the risk factors listed in this report on Form 10-K; |
| • | actual or anticipated fluctuations in the operating results of FKP Holdings; |
| • | for reasons unrelated to operating performance, such as reports by industry analysts, investor perceptions, or negative announcements by our customers or competitors regarding their own performance; |
| • | regulatory changes that could impact our business; and |
| • | general economic, securities markets and industry conditions. |
| Item 1B. | UNRESOLVED STAFF COMMENTS |
None.
| Item 2. | PROPERTIES |
We operate various facilities in the United States, Canada and Puerto Rico, which have an aggregate size of approximately 1,178,000 square feet. Our facilities include the following:
| Location |
Use |
Own/ |
Lease Expiration |
Approximate Square Feet | ||||
| Schaumburg, Illinois |
Administration | Lease | July 2016 | 48,000 | ||||
| Schaumburg, Illinois |
Administration | Lease | May 2015 | 22,000 | ||||
| Ontario, Canada |
Business office | Lease | June 2014 | 10,000 | ||||
| Melrose Park, Illinois |
Manufacturing (1) | Lease | December 2011 | 122,000 | ||||
| Melrose Park, Illinois |
Research and Development | Lease | December, 2010 | 48,000 | ||||
| Melrose Park, Illinois |
Warehouse and administrative | Lease | December 2011 | 71,000 | ||||
| Bensenville, Illinois |
Distribution facility | Lease | September 2010 | 109,000 | ||||
| Grand Island, New York |
Manufacturing (2) | Own | — | 214,000 | ||||
| Grand Island, New York |
Warehouse and administrative (3) | Own | — | 120,000 | ||||
| Grand Island, New York |
Manufacturing (4) | Own | — | 148,000 | ||||
| Barceloneta, Puerto Rico |
Manufacturing (5) | Own | — | 172,000 | ||||
| Raleigh, North Carolina |
Manufacturing (6) | Own | — | 94,000 | ||||
| 1,178,000 | ||||||||
| (1) | We also use this facility for packaging, laboratory, office and warehouse space. |
| (2) | Approximately 5,700 square feet of manufacturing space has been leased to New Abraxis through December 2011, with an option to extend until December 2012 in certain circumstances. |
| (3) | This facility is being marketed for sale and is expected to close during the first quarter 2010. |
| (4) | This facility was purchased in September 2008 from Astellas Pharma Manufacturing, Inc., and was leased back to Astellas through July 2009. We have occupied the facility since the end of the lease with Astellas. |
| (5) | Approximately 90,000 square feet of the Puerto Rico facility was conveyed to New Abraxis, representing the active pharmaceutical ingredients manufacturing plant currently leased to Pfizer for a term expiring on February 2012. In 2009, we finalized a plan to close the Barceloneta, Puerto Rico manufacturing facility, and to transfer its production operations to existing Company plants in the United States. We are continuing to operate this facility during the transition, and expect that manufacturing at the Puerto Rico facility will cease in mid 2010. |
| (6) | This facility was purchased in November 2009 from Catalent Pharma Solutions, LLC. |
| Item 3. | LEGAL PROCEEDINGS |
We are from time to time subject to claims and litigation arising in the ordinary course of business. These claims have included assertions that our products infringe existing patents, allegations of product liability and also claims that the uses of our products have caused personal injuries. We believe we have substantial defenses in these matters, however litigation is inherently unpredictable. Consequently any adverse judgment or settlement could have a material adverse effect on our results of operations, cash flows or financial condition for a particular period.
Summarized below are the more significant legal matters pending to which we are a party:
18
Table of Contents
Patent Litigation
Pemetrexed Disodium
We have filed an abbreviated new drug application, or “ANDA”, seeking approval from the FDA to market pemetrexed disodium for injection, 500 mg/vial. The Reference Listed Drug for APP’s ANDA is Alimta®, a chemotherapy agent for the treatment of various types of cancer marketed by Eli Lilly. Eli Lilly is believed to be the exclusive licensee of certain patent rights from Princeton University. We notified Eli Lilly and Princeton University of our ANDA filing pursuant to the provisions of the Hatch-Waxman Act and, in June 2008, Eli Lilly and Princeton University filed a patent infringement action in the U.S. District Court for the District of Delaware seeking to prevent us from marketing this product until after the expiration of U.S. Patent 5,344,932, which is alleged to expire in 2016. We filed our Answer and Counterclaims in August 2008 and trial is scheduled for November 2010.
Naropin®
In March 2007 we filed a complaint for patent infringement against Navinta LLC in the U.S District Court for the District of New Jersey. Navinta filed an ANDA seeking approval from the FDA to market ropivacaine hydrochloride injection, in the 2 mg/ml, 5 mg/ml and 10 mg/ml dosage forms. The Reference Listed Drug for Navinta’s ANDA is APP’s proprietary product Naropin®. This matter proceeded to trial on July 20, 2009. The U.S. District Court, District of New Jersey reached a judgment in favor of the Company on August 3, 2009, determining that Navinta’s ANDA product infringed on the Company’s proprietary product Naropin. The judgment has been appealed by Navinta.
Oxaliplatin
The Company filed ANDAs to market oxaliplatin for injection, 10 mg and 50mg vials, and oxaliplatin injection, in 5mg/ml, 10ml, 20ml and 40 ml dosage forms. The Reference Listed Drug is the chemotherapeutic agent Eloxatin® marketed by Sanofi-Aventis that is approved for the treatment of colorectal cancer. Sanofi-Aventis is believed to be the exclusive licensee of certain patent rights from Debiopharm. We notified Sanofi-Aventis and Debiopharm of the ANDA filings pursuant to the provisions of the Hatch-Waxman Act, and Sanofi-Aventis and Debiopharm filed a patent infringement action in the U.S. District Court for the District of New Jersey seeking to prevent us from marketing these products until after the expiration of various U.S. patents. Multiple cases proceeding against other generic drug manufacturers including a subsidiary of Fresenius Kabi were consolidated pursuant to a pre-trial scheduling order in April 2008. The defendants motion for summary judgment on one of the patent’s at issue was granted and an order entered by the U.S. District Court. The order was successfully challenged by Sanofi-Aventis, and on November 17, 2009 Sanofi-Aventis’s motion seeking a preliminary injunction to prevent sales of oxaliplatin by generic drug manufacturers was heard. Instead of ruling on the matter, the Judge has encouraged the parties to settle. A settlement hearing is scheduled for March 9, 2010.
Bivalirudin
We have filed an ANDA seeking approval from the FDA to market generic bivalirudin, 250 mg/vial for intravenous injection. The reference listed drug for APP’s ANDA is Angiomax, for use as an anticoagulant in patients with unstable angina and currently marketed by The Medicines Co. The Medicines Co. is believed to be the exclusive assignee of certain patent rights from Gopal Krishna and Gary Musso. The patent, alleged to be generally directed to bivalirudin compositions, was issued on September 1, 2009. APP notified The Medicines Co. of our ANDA filing pursuant to the provisions of the Hatch-Waxman Act, and on October 8, 2009, The Medicines Co. filed a patent infringement action in the United States District Court for the District of Delaware seeking to prevent APP from marketing this product until after its expiration. We filed our Answer and Counterclaims on December 9, 2009. The Medicines Co. filed its response on December 28, 2009. APP currently has a motion pending for Judgment on the Pleadings to remove allegations of willfullness. No status conference has been scheduled yet.
Gemcitabine
We have filed an ANDA seeking approval from the FDA to market gemcitabine for injection, 200 mg base/vial, 1 g base/vial and 2 g base/vial. The reference listed drug for APP’s ANDA is Gemzar, for use as a treatment for non-small lung cancer, pancreatic cancer, breast cancer and ovarian cancer. Eli Lilly is the holder of the New Drug Application for Gemzar and is believed to the owner of the patent rights, which is set to expire on November 7, 2012, followed by a six month period of pediatric market exclusivity ending on May 7, 2013. APP notified Eli Lilly of our ANDA filing pursuant to the provisions of the Hatch-Waxman Act on November 4, 2009. On December 16, 2009, Eli Lilly filed a patent infringement action in the United States District Court in the Southern District of Indiana seeking to prevent APP from marketing this product until after its expiration. APP was served on January 7, 2010 and expects to file its response in March.
19
Table of Contents
Product Liability Matters
Sensorcaine
We have been named as a defendant in approximately one hundred and thirteen personal injury/product liability actions brought against us and other pharmaceutical companies and medical device manufacturers by plaintiffs claiming that they suffered injuries resulting from the post-surgical release of certain local anesthetics into the shoulder joint via a pain pump. We acquired several generic anesthetic products from AstraZeneca in June 2006. Pursuant to the Asset Purchase Agreement with AstraZeneca we are responsible for indemnifying Astra Zeneca for defense of suits alleging injuries occurring after the acquisition date (unless the drugs are determined to be defective in manufacturing, in which case AstraZeneca will indemnify us pursuant to that certain Manufacturing and Supply Agreement entered into by us and AstraZeneca). Likewise Astra Zeneca agreed to indemnify us for suits alleging injuries occurring prior to the acquisition date. Forty of the actions involve an alleged event after the acquisition date. All of our local anesthetic products are approved by the FDA and continue to be marketed and sold to customers. Since December 2009, more than 100 cases naming APP or New Abraxis have been dismissed due to lack of product identification or failure to plead with sufficient specificity to withstand a Motion to Dismiss.
The cases have been filed in various jurisdictions around the country, including Indiana, Kentucky, New York, Colorado, Ohio, Minnesota, and California. Some are in state court, and most are in federal court. Discovery has just begun in most cases. We anticipate additional cases will be filed throughout the U.S. and we maintain product liability insurance for these matters. In December 2009, a group of plaintiffs filed a renewed motion to create a multi district litigation (“MDL”) in the United States District of Minnesota. Various plaintiffs and defendants have requested transfers to different districts. An MDL panel recently denied plaintiffs’ motion for an expedited hearing date and will hear the motion on a date yet to be determined.
Aredia and Zometa
We have been named as a defendant in approximately 30 personal injury/product liability cases brought against us and other manufacturers by plaintiffs claiming that they suffered injuries resulting from the use of pamidronate (the generic equivalent of Aredia®) prescribed for the management of metastic bone disease. Plaintiffs’ allege Aredia causes osteonecrosis to the jaw. Four cases have been consolidated into multi-district litigation before the Court in the U.S. District Court, Middle District Tennessee. We filed answers in three of the cases and filed a joinder in October 2008 with another defendant’s Motion to Dismiss for failure to serve the plaintiff’s complaint within 120 days of filing. The case was dismissed in November 2008. Defendants in these cases are opposed to the multi-district litigation Court issuing a remand order, and a ruling on this issue is pending before a United States Judicial Panel. Until a decision is reached, discovery in these cases remains stayed. Recently, four additional cases have been filed against us in a coordinated proceeding in the Superior Court of New Jersey, Middlesex County. One of those four complaints has yet to be served. Discovery has not yet started in these cases.
On December 2, 2009, nine cases naming APP were transferred to an MDL in the Eastern District of New York. Seven of the nine cases have been served on APP. At a January 26, 2010 status conference, the MDL Judge ordered the parties to begin product identification discovery and has ordered a progress report by April 26, 2010. Meanwhile, there are currently eleven cases filed against APP in a coordinated proceeding in New Jersey.
Heparin
We have been named as a defendant in three personal injury/product liability cases brought against us and other manufacturers claiming that they suffered side effects from heparin-induced thrombocytopenia (“HIT”). The cases reside in the United States District Court of New Jersey (Middlesex) and the United States District Court of West Virginia. Product identification discovery is underway in all three cases.
Breach of Contract Matters
On February 9, 2005, Pharmacy, Inc. filed suit against us in the U.S. District Court for the Eastern District of New York alleging our predecessor breached an Asset Purchase Agreement entered into September 30, 2002 by the parties. In its complaint Pharmacy seeks to recover monetary damages and other relief for the alleged breach of the contract. Discovery and dispositive motions have been substantially completed and the parties submitted an amended pre-trial order on December 10, 2008. The parties participated in a court ordered mediation which resulted in the Company agreeing to pay Pharmacy, Inc. $3.0 million in consideration for a settlement and release of all claims with respect to this matter. The funds were paid in October 2009 and the case has been dismissed by the court.
20
Table of Contents
Regulatory Matters
We are subject to regulatory oversight by the FDA and other regulatory authorities with respect to the development and manufacture of our products. Failure to comply with regulatory requirements can have a significant effect on our business and operations. Management has designed and operates a system of controls to attempt to ensure compliance with applicable regulatory requirements.
| Item 4. | SUBMISSION OF MATTERS TO A VOTE OF SECURITY HOLDERS |
There were no matters submitted to a vote of security holders during the quarter ended December 31, 2009. No Annual meeting was held during 2009.
| Item 5. | MARKET FOR REGISTRANT’S COMMON EQUITY, RELATED STOCKHOLDER MATTERS AND ISSUER PURCHASES OF EQUITY SECURITIES |
Market for Common Stock
On September 10, 2008, FKP Holdings completed the Merger, following which APP became a wholly-owned subsidiary of FKP Holdings. Under the terms of the Merger, Fresenius acquired all of the outstanding common stock of APP for $23.00 in cash per share (the “Cash Purchase Price”) plus a contingent value right (“CVR”). Our obligation to make a cash payment on the CVRs is determined on the basis of cumulative Adjusted EBITDA (as defined in the CVR indenture) for a three-year period ending on December 31, 2010. If Adjusted EBITDA for that period does not exceed a specified threshold amount, no amounts will be payable on the CVRs and the CVRs will expire valueless. The cash payment on the CVRs, if any, will be determined after December 31, 2010, and will be payable June 30, 2011, unless accelerated as a result of a change in control. See Note 3 – Merger with APP and Note 4 – Contingent Value Rights (CVR), to the consolidated financial statements for more details. The CVRs are traded on NASDAQ under the symbol “APCVZ”.
Issuer Purchases of Equity Securities
We did not purchase any of our securities during the fourth quarter of 2009.
21
Table of Contents
| Item 6. | SELECTED FINANCIAL DATA |
| Year ended December 31, | ||||||||||||||||||||||||||
| (Successor) | (Predecessor) | |||||||||||||||||||||||||
| Year ended December 31, 2009 |
July 2, 2008 through December 31, 2008 |
January 1, 2008 through September 9, 2008 |
2007 | 2006 | 2005 | |||||||||||||||||||||
| (in thousands) | ||||||||||||||||||||||||||
| Net revenue |
$ | 888,686 | $ | 280,836 | $ | 495,797 | $ | 647,374 | $ | 583,201 | $ | 385,082 | ||||||||||||||
| Gross profit |
435,129 | 107,762 | 248,160 | 315,328 | 295,122 | 181,646 | ||||||||||||||||||||
| (Loss) income from continuing operations(1) |
(30,385 | ) | (312,445 | ) | 9,543 | 82,179 | 55,226 | 30,456 | ||||||||||||||||||
| Loss from discontinued operations, net of taxes |
— | — | — | (47,821 | ) | (102,123 | ) | (12,799 | ) | |||||||||||||||||
| Net (loss) income |
$ | (30,385 | ) | $ | (312,445 | ) | $ | 9,543 | $ | 34,358 | $ | (46,897 | ) | $ | 17,657 | |||||||||||
| The composition of stock-based compensation included above is as follows: |
||||||||||||||||||||||||||
| Cost of sales |
$ | — | $ | — | $ | 1,275 | $ | 2,502 | $ | 2,668 | $ | 2,947 | ||||||||||||||
| Research and development |
— | — | 436 | 602 | 554 | 465 | ||||||||||||||||||||
| Selling, general and administrative |
360 | 19 | 4,039 | 8,977 | 7,902 | 8,625 | ||||||||||||||||||||
| Discontinued operations |
— | — | — | 16,517 | 23,899 | 4,372 | ||||||||||||||||||||
| $ | 360 | $ | 19 | $ | 5,750 | $ | 28,596 | $ | 35,023 | $ | 16,409 | |||||||||||||||
| Other data: |
||||||||||||||||||||||||||
| Cash flow provided by (used in) operating activities |
$ | 13,295 | $ | (37,042 | ) | $ | 105,515 | $ | 12,351 | $ | 324,977 | $ | 34,466 | |||||||||||||
| Cash flow used in investing activities |
(5,563 | ) | (3,683,468 | ) | (13,839 | ) | (89,022 | ) | (372,800 | ) | (43,172 | ) | ||||||||||||||
| Cash flow provided by (used in) financing activities |
(10,892 | ) | 3,733,428 | 5,016 | 66,893 | 59,391 | 33,872 | |||||||||||||||||||
| Consolidated balance sheet data as of December 31: |
||||||||||||||||||||||||||
| Working capital (deficit) |
$ | (273,880 | ) | $ | 93,343 | $ | — | $ | 216,727 | $ | 65,556 | $ | 248,284 | |||||||||||||
| Total assets |
4,858,685 | 4,837,746 | — | 1,077,587 | 1,773,721 | 524,229 | ||||||||||||||||||||
| Long term debt, less current portion |
3,436,662 | 3,718,322 | — | 995,000 | 165,000 | 190,000 | ||||||||||||||||||||
| Total stockholder’s equity (deficit) |
539,076 | 550,724 | — | (79,771 | ) | 1,033,361 | 68,140 | |||||||||||||||||||
| (1) | Net of income attributable to noncontrolling interest of $11,383 in 2006 and $25,875 in 2005. |
| Item 7. | MANAGEMENT’S DISCUSSION AND ANALYSIS OF FINANCIAL CONDITION AND RESULTS OF OPERATIONS |
OVERVIEW
The following management’s discussion and analysis of financial condition and results of operations, or MD&A, is intended to assist the reader in understanding our company, including our operating results and financial position. The MD&A is provided as a supplement to, and should be read in conjunction with the other sections of this Annual Report on Form 10-K, including “Item 1: Business”; “Item 1A: Risk Factors”; “Item 6: Selected Financial Data”; and “Item 8: Financial Statements and Supplementary Data.”
Background
We are an integrated pharmaceutical company that develops, manufactures and markets injectable pharmaceutical products. We believe that we are the only company with a primary focus on the injectable oncology, anti-infective, anesthetic/analgesic and critical care markets. We believe that we offer one of the most comprehensive injectable product portfolios in the pharmaceutical industry. We manufacture products in each of the three basic forms in which injectable products are sold: liquid, powder and lyophilized, or freeze-dried.
Our products are generally used in hospitals, long-term care facilities, alternate care sites and clinics within North America. Unlike the retail pharmacy market for oral products, the injectable pharmaceuticals marketplace is largely made up of end users who have relationships with group purchasing organizations, or GPOs, and/or specialty distributors who distribute products within a particular end-user market, such as oncology clinics. GPOs and specialty distributors generally enter into collective product purchasing agreements with pharmaceutical suppliers like us in an effort to secure more favorable drug pricing on behalf of their members.
22
Table of Contents
Fresenius Kabi Pharmaceuticals Holding, Inc. (“FKP Holding” or the “Company”) is a wholly-owned subsidiary of Fresenius Kabi AG, and an indirect wholly-owned subsidiary of Fresenius SE (“Fresenius”), a societas europaea organized under the laws of Germany. FKP Holdings was formed on July 2, 2008, in order to facilitate the acquisition of APP Pharmaceuticals, Inc. (“APP or the Predecessor”) discussed below. See Note 3 to the consolidated financial statements – Merger with APP for details.
On September 10, 2008, FKP Holdings completed the acquisition of APP (the “Merger”) pursuant to an Agreement and Plan of Merger dated July 6, 2008 (the “Merger Agreement”), and APP became a wholly-owned subsidiary of FKP Holdings. Effective with the Merger, each outstanding share of common stock of APP and certain stock options and restricted stock units of APP were converted into the right to receive $23.00 in cash, without interest, and one Contingent Value Right (“CVR”), issued by FKP Holdings and representing the right to receive a cash payment, without interest, of up to $6.00 determined in accordance with the terms of the CVR Agreement. Refer to Note 4 to the consolidated financial statements — Contingent Value Rights (CVR), for further details. The aggregate consideration paid in the Merger was $4,908.1 million, including $997.5 million in assumed APP debt. We incurred $3,856 million in new external and intercompany debt due to Fresenius and its affiliates in connection with the Merger, the aggregate proceeds of which were used to pay the Merger consideration, repay a portion of APP’s then outstanding indebtedness and pay fees and expenses related to the Merger. See Note 9 to the consolidated financial statements- Long-Term Debt and Credit Facility.
The results of APP’s operations have been included in the consolidated financial statements of FKP Holdings since September 10, 2008. APP is a fully-integrated pharmaceutical company that develops, manufactures and markets injectable pharmaceutical products with a primary focus on the oncology, anti-infective, anesthetic/analgesic and critical care markets. APP manufactures a comprehensive range of dosage formulations, and its products are used in hospitals, long-term care facilities, alternate care sites and clinics within North America. The Merger is an important step in Fresenius’ growth strategy. Through the merger with APP, Fresenius gains entry to the U.S. pharmaceuticals market and achieves a leading position in the global I.V. generics industry. The North American platform also provides further growth opportunities for Fresenius’ existing product portfolio. Additionally, Fresenius expects to be able to market APP’s product range through its international marketing and sales network, enabling Fresenius to sell APP’s products globally.
Prior to the Merger, FKP Holdings had not carried on any activities or operations except for those activities incidental to its formation and in connection with the transactions related to the Merger. Following the Merger, the business of FKP Holdings consists exclusively of that of APP. Accordingly, for accounting purposes FKP Holdings is considered the successor to APP and the consolidated financial statements included in Item 8 are presented for two distinct periods: the periods preceding the Merger, or “predecessor” periods (all periods prior to September 10, 2008), and the period after the merger, or “successor” period (from the inception of FKP Holdings on July 2, 2008, which includes the results of APP from September 10, 2008, the date of acquisition). The Company applied purchase accounting to the opening balance sheet on September 10, 2008. The Merger resulted in a new basis of accounting for the assets acquired and liabilities assumed in connection with the acquisition of APP beginning on September 10, 2008. As a result of the acquisition and the application of purchase accounting as described above, the consolidated financial information for the period after the acquisition is presented on a different basis than that for the periods before the acquisition and, therefore, is not comparable.
APP is a Delaware corporation that was formed in 2007. American Pharmaceutical Partners, Inc. (“Old APP”) was a Delaware corporation formed in 2001. On April 18, 2006, Old APP completed a merger with American BioScience Inc. (or “ABI”), Old APP’s former parent. In connection with the closing of that merger, Old APP’s certificate of incorporation was amended to change its original name of American Pharmaceutical Partners, Inc. to Abraxis BioScience, Inc. which we refer to as “Old Abraxis.”
On November 13, 2007, Old Abraxis separated into two independent publicly-traded companies, APP Pharmaceuticals Inc., which held the Abraxis Pharmaceutical Products business, focusing primarily on manufacturing and marketing of oncology, anti-infective and critical care hospital-based generic injectable products and marketing of proprietary anesthetic/analgesic products (which we refer to collectively as the “hospital-based business”), and Abraxis BioScience, Inc. (“New Abraxis”) which held the Abraxis Oncology and Abraxis Research businesses (which we refer to as the “proprietary business”). APP continued to operate the hospital-based business under the name APP Pharmaceuticals, Inc. APP and New Abraxis entered into a series of agreements in connection with the separation, including a credit facility under which APP borrowed $1 billion, a portion of which was paid to New Abraxis in connection with the separation, and a $150 million revolving credit facility. These credit facilities were retired in connection with the Merger and replaced with a similar external facility. The historical operating results of Old Abraxis through the date of the separation are presented as discontinued operations. Refer to Note 6 to the consolidated financial statements—Discontinued Operations—Spin-off of New Abraxis, for further details.
23
Table of Contents
RESULTS OF OPERATIONS
Overview
The following table sets forth the results of our operations for each of the three years ended December 31, 2009, 2008 and 2007, and forms the basis for the following discussion of our operating activities. For accounting purposes the Company has separated its historical financial results for the Predecessor Company (APP) for all periods prior to September 10, 2008, the effective date of the merger, and the Successor Company (FKP Holdings) for all periods after July 2, 2008 (the date of inception). The separate presentation is required as there was a change in accounting basis, which occurred when purchase accounting was applied to the acquisition of the Predecessor. Purchase accounting requires that the historical carrying value of assets acquired and liabilities assumed be adjusted to fair value, which may yield results that are not comparable on a period-to-period basis due to the different, and sometimes higher, cost basis associated with the allocation of the purchase price.
For purposes of discussing our historical results of operations, the following table compares the results of the successor companies for the year ended December 31, 2009 with the combined results of the predecessor and successor companies for the year ended December 31, 2008, which we refer to as the combined 2008 year period, and compares the results for the combined 2008 period to those of our predecessor for the year ended December 31, 2007. This comparative presentation is intended to facilitate the discussion of relevant trends and changes affecting our operating results. Where significant, the effect of merger related transactions and the application of purchase accounting are highlighted.
| Favorable/ (Unfavorable) | ||||||||||||||||||||||||||
| Year Ended December 31, | 2009 vs. 2008 | 2008 vs. 2007 | ||||||||||||||||||||||||
| 2009 | 2008 | 2007 | $ | % | $ | % | ||||||||||||||||||||
| (in thousands, except percentages) | ||||||||||||||||||||||||||
| Consolidated statements of operations data: |
||||||||||||||||||||||||||
| Net revenues |
||||||||||||||||||||||||||
| Critical care |
$ | 576,574 | $ | 476,091 | $ | 399,456 | $ | 100,483 | 21 | % | $ | 76,635 | 19 | % | ||||||||||||
| Anti-infective |
226,035 | 225,274 | 192,596 | 761 | 0 | % | 32,678 | 17 | % | |||||||||||||||||
| Oncology |
78,108 | 65,321 | 54,736 | 12,787 | 20 | % | 10,585 | 19 | % | |||||||||||||||||
| Contract manufacturing and other |
7,969 | 9,947 | 586 | (1,978 | ) | -20 | % | 9,361 | 1597 | % | ||||||||||||||||
| Total net revenue |
888,686 | 776,633 | 647,374 | 112,053 | 14 | % | 129,259 | 20 | % | |||||||||||||||||
| Cost of sales |
453,557 | 420,711 | 332,046 | (32,846 | ) | -8 | % | (88,665 | ) | -27 | % | |||||||||||||||
| Gross profit |
435,129 | 355,922 | 315,328 | 79,207 | 22 | % | 40,594 | 13 | % | |||||||||||||||||
| Percent of total net revenue |
49.0 | % | 45.8 | % | 48.7 | % | ||||||||||||||||||||
| Operating expenses: |
||||||||||||||||||||||||||
| Research and development |
28,277 | 51,485 | 46,497 | 23,208 | 45 | % | (4,988 | ) | -10.7 | % | ||||||||||||||||
| Percent of total net revenue |
3.2 | % | 6.6 | % | 7.2 | % | ||||||||||||||||||||
| Selling, general and administrative |
89,994 | 94,270 | 90,229 | 4,276 | 5 | % | (4,041 | ) | -5 | % | ||||||||||||||||
| Percent of total net revenue |
10.1 | % | 12.1 | % | 13.9 | % | ||||||||||||||||||||
| Merger related in-process research and development charge |
— | 365,700 | — | 365,700 | 100 | % | (365,700 | ) | NA | |||||||||||||||||
| Amortization of merger related intangibles |
36,650 | 21,492 | 15,418 | (15,158 | ) | -71 | % | (6,074 | ) | -39 | % | |||||||||||||||
| Impairment of fixed assets |
5,372 | — | — | (5,372 | ) | — | — | NA | ||||||||||||||||||
| Other merger related costs |
1,447 | 46,749 | — | 45,302 | 97 | % | (46,749 | ) | NA | |||||||||||||||||
| Separation related costs |
625 | 2,381 | 3,024 | 1,756 | 74 | % | 643 | 21 | % | |||||||||||||||||
| Total operating expenses |
162,365 | 582,077 | 155,168 | 419,712 | 72 | % | (426,909 | ) | -275 | % | ||||||||||||||||
| Percent of total net revenue |
18.3 | % | 74.9 | % | 24.0 | % | ||||||||||||||||||||
| Income (loss) from operations |
272,764 | (226,155 | ) | 160,160 | 498,919 | 221 | % | (386,315 | ) | -241 | % | |||||||||||||||
| Percent of total net revenue |
30.7 | % | -29.1 | % | 24.7 | % | ||||||||||||||||||||
| Interest expense |
(83,185 | ) | (97,709 | ) | (25,162 | ) | 14,524 | 15 | % | (72,547 | ) | -288 | % | |||||||||||||
| Intercompany interest expense |
(248,956 | ) | (66,690 | ) | — | (182,266 | ) | 273 | % | (66,690 | ) | NA | ||||||||||||||
| Unrealized gain in the fair value of contingent value rights |
8,163 | 101,216 | — | (93,053 | ) | -92 | % | 101,216 | NA | |||||||||||||||||
| Interest income and other, net |
3,379 | 360 | 2,182 | 3,019 | 839 | % | (1,822 | ) | -84 | % | ||||||||||||||||
| (Loss) income from continuing operations before income taxes |
(47,835 | ) | (288,978 | ) | 137,180 | 241,143 | -83 | % | (426,158 | ) | -311 | % | ||||||||||||||
| (Benefit) provision for income taxes |
(17,450 | ) | 13,924 | 55,001 | 31,374 | 225 | % | 41,077 | 75 | % | ||||||||||||||||
| (Loss) income from continuing operations |
(30,385 | ) | (302,902 | ) | 82,179 | $ | 272,517 | 90 | % | $ | (385,081 | ) | -469 | % | ||||||||||||
| Percent of total net revenue |
-3.4 | % | -39.0 | % | 12.7 | % | ||||||||||||||||||||
24
Table of Contents
| Favorable/ (Unfavorable) | ||||||||||||||||||||
| Year Ended December 31, | 2009 vs. 2008 | 2008 vs. 2007 | ||||||||||||||||||
| 2009 | 2008 | 2007 | $ | % | $ | % | ||||||||||||||
| (in thousands, except percentages) | ||||||||||||||||||||
| Loss from discontinued operations, net of taxes |
— | (47,821 | ) | |||||||||||||||||
| Net (loss) income |
$ | (30,385 | ) | $ | (302,902 | ) | $ | 34,358 | ||||||||||||
Operating Results
Net revenues
Total net revenues for the year ended December 31, 2009 increased $112.1 million, or 14%, to $888.7 million as compared to $776.6 million for the combined 2008 year period.
Net revenues for our critical care products for the year ended December 31, 2009 increased $100.5 million, or 21%, to $576.6 million as compared to $476.1 million for the combined 2008 year period, driven primarily by greater market penetration of our pre-existing products and by new product launches in 2009. Net revenue from anti-infective products for the year ended December 31, 2009 increased by $0.7 million to $226.0 million compared to $225.3 million for the combined 2008 year period. Net revenue for oncology products for the year ended December 31, 2009 increased by $12.8 million, or 20%, to $78.1 million over the combined 2008 year period, primarily due to new product launches in 2009. Contract manufacturing and other revenue for the year ended December 31, 2009 decreased by $1.9 million to $8.0 million from $9.9 million for the combined 2008 year period.
Total net revenues for the combined year period ended December 31, 2008 increased $129.2 million, or 20%, to $776.6 million as compared to $647.4 million for the same period in 2007.
Net revenues for our critical care products for the combined 2008 year period increased by $76.6 million, or 19%, to $476.1 million from $399.5 million for the prior year due primarily to higher sales of heparin. Net revenue from anti-infective products for the combined 2008 year period increased by $32.7 million, or 17%, to $225.3 million from $192.6 million in the prior year period due to higher volume as a result of increased market penetration. Net revenue for oncology products for the combined 2008 year period increased by $10.6 million, or 19%, to $65.3 million primarily due to new product launches in 2008. Contract manufacturing revenue for the combined 2008 year period increased by $9.4 million to $9.9 million from $0.5 million for the prior year.
Gross profit
Gross profit for the year ended December 31, 2009 was $435.1 million, or 49.0% of total net revenue, as compared to $355.9 million, or 45.8% of total net revenue, in the combined 2008 year period. The improvement in the overall gross profit percentage was primarily due to improved product mix in 2009 and the inclusion of purchase-accounting related amortization in cost of sales for the combined 2008 year period, partially offset by the reporting of $22.8 million of our 2009 Puerto Rico facility costs in cost of sales as we completed our production validation and transfer of products to our Puerto Rico facility. In 2008, we reported $26.3 million of our Puerto Rico facility costs in research and development until we completed production validation and transfer of products to the facility, which occurred in September 2008. Cost of sales for the combined 2008 year period included $11.0 million in non-cash amortization of intangible product rights associated with a product acquisition. Cost of sales for the combined 2008 year period also included $45.5 million of non-cash expense reflecting the portion of the purchase accounting step-up in inventory associated with the Merger attributable to inventory sold during the period. Excluding the impact of the Puerto Rico facility costs and these non-cash charges, gross profit margin for the twelve months ended December 31, 2009 and the combined 2008 year period would have been 51.5% and 53.1%, respectively.
Gross profit for the combined 2008 year period was $355.9 million, or 45.8% of total net revenue, as compared to $315.3 million, or 48.7% of total net revenue, in the same period in 2007. The increase in gross profit dollars was principally due to higher net revenue in the combined 2008 year period while the decrease in the overall gross profit percentage was primarily due to the effect of recognizing higher inventory costs recorded in purchase accounting in cost of sales, competitive pricing pressures and increasing freight costs due to higher fuel prices. Cost of sales for the combined 2008 year period and 2007 included $11.0 million and $16.4 million, respectively, in non-cash amortization of intangible product rights associated with a product acquisition. Cost of sales for the combined 2008 year period also includes $45.5 million of non-cash expense reflecting the portion of the purchase accounting step-up in inventory associated with the Merger attributable to inventory sold during the period. Excluding the impact of these non-cash charges, gross profit margin for the combined 2008 year period and 2007 would have been 53.1% and 51.2%, respectively.
25
Table of Contents
Research and development, or R&D
Research and development expense for the twelve months ended December 31, 2009 decreased $23.2 million, or 45.1%, to $28.3 million compared to $51.5 million for the combined 2008 year period. The decrease was due primarily to the classification of $22.8 million of 2009 costs associated with our Puerto Rico facility in cost of goods sold as described above. Excluding costs associated with our Puerto Rico facility research and development expense increased $3.1 million from $25.2 million for the combined 2008 year period to $28.3 million in 2009.
Research and development expense for combined 2008 year period increased $5.0 million, or 10.7%, to $51.5 million versus $46.5 million for the same period in 2007. The increase was due primarily to higher development activity associated with our strategic initiatives in the combined 2008 year period as compared to 2007.
Selling, general and administrative, or SG&A
Selling, general and administrative expense for the twelve months ended December 31, 2009 decreased $4.3 million to $90.0 million, or 10.1% of total net revenue, from $94.3 million, or 12.1% of total net revenue, for the combined 2008 year period. The decrease in costs was due primarily to the capitalization of $6.8 million in legal fees in 2009, associated with the defense of our Naropin patent. Similar fees incurred in the combined 2008 year period were expensed as we had not concluded that the likelihood of a successful defense of the patent was probable. Without this effect, SG&A expense would have increased to $96.8 million, or 10.9% of total net revenue for the twelve months ended December 31, 2009.
Selling, general and administrative expense for the combined 2008 year period increased $4.1 million to $94.3 million, or 12.1% of total net revenue, from $90.2 million, or 13.9% of total net revenue, for 2007. This increase in costs was due primarily to increased professional fees versus the prior year, while the decline in selling, general and administrative expense as a percent of total net revenue was due to better leverage of these costs as a result of the increase in revenue.
Amortization, impairment, merger and separation costs
The twelve months ended December 31, 2009 included $38.1 million of amortization of Merger-related intangibles and other costs associated with the Merger with APP. The combined 2008 year period included merger related costs of $433.9 million, comprised of $46.7 million of direct professional fees and transaction related costs associated with the Merger, $21.5 million of amortization of merger related intangibles, and $365.7 million related to the write-off of in-process research and development representing the value assigned in purchase accounting to projects that had not yet reached technological feasibility and had no alternative future use, which was immediately expensed in the condensed consolidated statement of operations as required under current GAAP. The $46.7 million of direct professional fees and transaction related costs associated with the Merger were recognized in the predecessor period ended September 9, 2008.
As a result of the finalization of a plan to close the Puerto Rico manufacturing facility during the year ended December 31, 2009, $5.4 million of impairment charges were included in the current year results. Separation costs for the year ended December 31, 2009 totaled $0.6 million compared to $2.4 million for the combined 2008 year period.
The combined 2008 year period included $433.9 million of merger related costs as described above. Included in this total was $21.5 million related to the amortization of Merger-related intangibles, an increase of $6.1 million over the $15.4 million in such costs reported in 2007.
Interest Expense and Intercompany Interest Expense
Interest expense on third party debt decreased to $83.2 million for the twelve months ended December 31, 2009, compared to $97.7 million for the combined 2008 year period. The decrease in third party interest expense was primarily due to the lower average third party debt levels and interest rates along with recognition in the prior year of $12.2 million of interest expense resulting from the write-off of loan fees related to the credit facility established in connection with the November 13, 2007 spin-off of New Abraxis, which was assumed in the merger and repaid, and the write-off of $13.4 million of unamortized deferred financing fees associated with the bridge loan that was restructured in the fourth quarter of 2008. The bridge facility was refinanced in the first quarter of 2009 and we wrote-off the remaining unamortized financing fees of $14.6 million at that time. Also, included in the combined 2008 year period is the loss on settlement of our predecessor’s interest rate swap of $2.7 million, which occurred in the predecessor period ended September 9, 2008, prior to the Merger. Intercompany interest expense was $249.0 million for the twelve months ended December 31, 2009, reflecting the $3,033.2 million of outstanding intercompany debt.
26
Table of Contents
Interest expense on third party debt increased to $97.7 million for the combined 2008 year period, compared to $25.2 million for the twelve months ended December 31, 2007. The $72.5 million increase in interest expense was primarily due to the fact that the Company and its predecessor had approximately $1.0 billion in third-party debt outstanding throughout the entire combined 2008 year period. In 2007, APP Pharmaceuticals had a modest outstanding debt level until it entered into a $1.0 billion credit facility in connection with the separation in November 2007. As noted above we additionally recognized $12.2 million of third-party interest expense resulting from the write-off of unamortized loan fees related to the credit facility established in connection with our predecessor’s November 2007 separation from New Abraxis, which was repaid at the time of the Merger, $13.4 million of third-party interest expense resulting from the write-off of unamortized debt issuance costs related to the restructuring of a portion of our bridge loan and $2.7 million of third-party interest expense resulting from the loss on settlement of our pre-merger interest rate swap, which occurred in the predecessor period ended September 9, 2008, prior to the Merger.
Other income, other non-operating items
Interest income and other income, net consists primarily of interest earned on invested cash and cash equivalents, and the impact of foreign currency rate changes on intercompany trading and debt accounts denominated in Euros and Canadian dollars, and other financing costs. Interest income and other income (expense), net was $3.4 million for the twelve months ended December 31, 2009 compared to $0.4 million in the combined 2008 year period.
Additionally, in 2009 we recognized $8.2 million of income resulting from the change in fair value of the contingent value rights (CVRs) issued to APP shareholders in connection with the Merger. The estimated fair value of the CVRs at the date of the acquisition was included in the acquisition cost and is adjusted at each reporting date (marked-to-market) based on the closing price of a CVR as reported by NASDAQ, with the change in the fair value of the CVR for the reporting period being included in non-operating income.
Interest income and other income (expense), net was $0.4 million for combined 2008 year period versus $2.2 million in the comparable 2007 period. We recognized a foreign currency gain of approximately $4.0 million in our other income (expense), net related to the change in fair value of the intercompany currency swap agreements that we entered into in the fourth quarter of 2008. This foreign currency gain was offset by the $5.7 million currency loss we recorded in order to adjust the carrying value of our Euro-denominated intercompany note to reflect the December 31, 2008 exchange rate.
The results of the combined 2008 year period include $101.2 million of income in the successor period related to the change in fair value of the contingent value rights (CVRs) issued to APP shareholders in connection with the Merger. The estimated fair value of the CVRs at the date of acquisition was included in the cost of the acquisition. At each reporting date, the CVRs are marked-to-market based on the closing price of a CVR as reported by NASDAQ, and the change in the fair value of the CVRs for the reporting period is included in operations.
Provision for Income Taxes
For the twelve month period ended December 31, 2009, we reported an income tax benefit of $17.5 million on a pretax loss from continuing operations of $47.8 million, or an effective tax rate of 36.5%. This rate differs from the statutory U.S. federal tax rate of 35% due primarily to state income taxes and the recognition of the tax cost of a hypothetical distribution of the profits of our foreign subsidiaries offset by the non-taxability of the $8.2 million in income recognized for accounting purposes as result of the change in the liability related to the CVRs.
For the successor period ended December 31, 2008, we reported an income tax benefit of $26.4 million on a pretax loss from continuing operations of $338.8 million, or an effective benefit rate of 7.8%. This rate differs from the statutory U.S. federal tax rate of 35% due primarily to the inclusion in pretax loss from continuing operations of $365.7 million related to the write-off of in-process R&D costs recognized in accounting for the Merger and a $101.2 million gain related to the change in fair value of the CVRs during the period, which are not included in the determination of taxable income, as well as the effect of state and foreign income taxes.
Tax expense on pretax income from continuing operations for the predecessor period from January 1, 2008 through September 9, 2008 was $40.3 million on pre-tax income from continuing operations of $49.9 million, or an effective tax rate of 80.9%. This rate differs from the statutory U.S. federal tax rate of 35% due primarily to the inclusion in pretax income from continuing operations of approximately $44.5 million of nondeductible costs incurred by APP and relating to the Merger, as well as the effect of state and foreign income taxes.
Our effective tax rate for the year ended December 31, 2007 was 40.1%. Our tax rate for this period was favorably impacted by the recognition of $3.1 million reduction of previously unrecognized tax benefits due to the closure of IRS examinations for the 2004 and 2005 tax years.
27
Table of Contents
LIQUIDITY AND CAPITAL RESOURCES
Overview
The following table summarizes key elements of our financial position as of December 31, 2009, 2008 and 2007, and our sources and (uses) of cash and cash equivalents for the indicated periods in 2009, 2009 and 2007:
| December 31, 2009 |
December 31, 2008 |
December 31, 2007 |
|||||||||
| (in thousands) | |||||||||||
| Summary Financial Position: |
|||||||||||
| Cash, cash equivalents and short-term investments |
$ | 10,469 | $ | 42,241 | $ | 31,788 | |||||
| Working capital |
$ | (273,880 | ) | $ | 93,343 | $ | 216,727 | ||||
| Total assets |
$ | 4,858,685 | $ | 4,837,746 | $ | 1,077,587 | |||||
| Total stockholders’ equity (deficit) |
$ | 539,076 | $ | 550,724 | $ | (79,771 | ) | ||||
| Successor | Combined | Successor | Predecessor | |||||||||||||||||||
| For the twelve months ended December 31, 2009 |
For the twelve months ended, December 31, 2008 |
July 2 through December 31, 2008 |
January 1 through September 9, 2008 |
For the twelve months ended December 31, 2007 |
||||||||||||||||||
| Summary of Sources and (Uses) of Cash and Cash Equivalents: |
||||||||||||||||||||||
| Operating activities |
$ | 13,295 | $ | 68,473 | $ | (37,042 | ) | $ | 105,515 | $ | 12,353 | |||||||||||
| Investing activities |
(5,563 | ) | (3,697,307 | ) | (3,683,468 | ) | (13,839 | ) | (89,022 | ) | ||||||||||||
| Financing activities |
(10,892 | ) | 3,738,444 | 3,733,428 | 5,016 | 66,893 | ||||||||||||||||
| Effect of exchange rates on cash and cash equivalents |
5,188 | (6,760 | ) | (4,477 | ) | (2,283 | ) | 2,267 | ||||||||||||||
| Increase (decrease) in cash and cash equivalents |
2,028 | 102,850 | 8,441 | 94,409 | (7,509 | ) | ||||||||||||||||
| Cash and cash equivalents, beginning of year |
8,441 | 31,788 | — | 31,788 | 39,297 | |||||||||||||||||
| Cash and cash equivalents, end of year |
$ | 10,469 | $ | 134,638 | $ | 8,441 | $ | 126,197 | $ | 31,788 | ||||||||||||
Sources and Uses of Cash
Overview
Prior to our predecessor’s November 2007 separation from New Abraxis, cash flow from operations was our primary source of liquidity. In connection with the November 2007 separation from New Abraxis, APP and New Abraxis entered into a series of agreements, including a credit facility under which APP borrowed $1 billion, a portion of which was paid to New Abraxis in connection with the separation, and a $150 million revolving credit facility. These credit facilities were retired in connection with the Merger and replaced with a similar external facility that includes both term and revolving credit arrangements.
In connection with the Merger, our parent contributed $900.0 million and loaned approximately $3.0 billion to FKP Holdings. We used the proceeds of the capital contribution and intercompany loans to complete the Merger. We also assumed our predecessor’s credit facility in connection with the Merger, which we retired and replaced with a similar facility. Principally as a result of these transactions, as of December 31, 2009 we have $ 3.9 billion of outstanding indebtedness; comprised of approximately $0.9 billion of term loans from a group of financial institutions and $3.0 billion of intercompany loans.
We anticipate that available cash and cash equivalents, cash generated from operations, and funds available under our credit facility or through borrowings or capital contributions from Fresenius, our parent, will be sufficient to finance our operations, including ongoing product development and capital expenditures for at least the next twelve months. In the event we engage in future acquisitions or capital projects, we may have to raise additional capital through additional borrowings or through additional intercompany debt. Fresenius has committed to the Company that it will provide financial support to FKP Holdings sufficient for it to satisfy its obligations and debt service requirements arising under all existing financing instruments that were entered into in connection with the Merger, and to which the Company is a party, as they come due until at least January 1, 2011.
28
Table of Contents
Operating Activities
Cash flow from operations has been our primary source of liquidity. Net cash provided by operating activities was $13.3 million for the twelve months ended December 31, 2009 as compared to $68.5 million for the combined 2008 year period. The change in cash provided by operating activities for the 2009 period as compared to 2008 was primarily due to the net settlement of non-current intercompany receivables and payables with our parent company resulting in operating cash outflow of $70.0 million in 2009. The settlement was funded by borrowings on the Company’s target revolver and was repaid through proceeds from short term intercompany notes. Other significant items included in operating cash flows included the impact of the increase in inventories and accrued intercompany interest, and the collection of tax receivables. Excluding the settlement of intercompany balances with our parent, cash flow from operations would have increased $14.8 million to $83.3 million for the twelve months ended December 31, 2009.
Net cash provided by operating activities was a combined $68.5 million for the combined 2008 year period ($37.0 million cash used in the successor period and $105.5 million cash provided in the predecessor period) as compared to cash provided by operations of $12.4 million for the year ended December 31, 2007. The change in cash provided by operating activities for the combined 2008 year period as compared to 2007 was due primarily to lower net earnings which were more than offset by the high levels of non-cash charges and credits that were recognized in the successor period relating to purchase accounting, including the write-off of in-process research and development (“IPR&D”) and the recognition of the fair value adjustment to inventory in cost of sales as the related goods were sold, as well as the fair market value adjustments to the CVRs.
Investing Activities
Our investing activities include cash paid for acquisitions, capital expenditures necessary to expand and maintain our manufacturing capabilities and infrastructure, and outlays to acquire various product or intellectual property rights needed to grow and maintain our business. Cash used in investing activities during the twelve months ended December 31, 2009 was $5.6 million, which included $16.7 million for purchases of property, plant and equipment along with an additional $2.0 million of payments related to the acquisition of APP and $10.7 million for the purchase of a manufacturing facility in Raleigh, North Carolina and $10.1 million related to cash paid for intangible assets. Cash used in investing activities was offset by $33.9 million of payments received on intercompany notes receivable and cash proceeds on sale of fixed assets.
Cash used in investing activities during the combined 2008 year period was $3,697.3 million ($3,683.5 million cash used in the successor period and $13.8 million of cash used in the predecessor period), which included the payments for the acquisition assets of APP, net of cash of $3,624.2 million and the purchase of a manufacturing facility adjacent to our Grand Island facility. Cash used in investing activities for the twelve months ended December 31, 2007 included purchases of property, plant and equipment totaling $86.1 million, including $32.5 million relating to the acquisition of our manufacturing facility in Puerto Rico.
Financing Activities
Financing activities generally include external borrowings under our credit facility and intercompany borrowing activity with Fresenius and its affiliated companies, and, prior to the Merger, the issuance or repurchase of our common stock and proceeds from the exercise of employee stock options. Net cash used in financing activities for the twelve months ended December 31, 2009 was $10.9 million which reflected net proceeds on external and internal borrowings of $31.3 million and $25.3 million, offset by payments of deferred financing costs of $67.5 million.
Net cash provided by financing activities for the combined 2008 year period was $3,738.4 million ($3,733.4 million of cash provided in the successor period and $5.0 million of cash provided in the predecessor period) which reflected the $900.0 million capital contribution received from Fresenius and proceeds from the external and intercompany borrowings incurred to finance the Merger totaling $3,856.2 million, offset by the retirement of pre-merger debt of $997.5 million and Merger-related payments of certain financing costs of $25.5 million.
Net cash provided by financing activities was $66.9 million for the twelve months ended December 31, 2007, which included issuance of $1 billion of debt in connection with the separation, as well as the issuance of other debt of $366.0 million, reduced by repayment of borrowings of $531 million and notes payable of $67 million. The $696.4 million outflow reflected in the consolidated statement of cash flows for 2007 includes $700.0 million of cash that distributed to New Abraxis as part of the separation.
Sources of Financing and Capital Requirements
Prior to the Merger, our predecessor had historically financed its operations primarily through cash flow from operations and borrowings under lines of credit. Fresenius, our ultimate parent, provided the capital to expand our business through the acquisition of APP, and has committed to the Company that it will provide financial support sufficient for it to satisfy its obligations and debt service requirements arising under all existing financing instruments that were entered into in connection with the Merger, and to which the Company is a party, as they come due until at least January 1, 2011.
29
Table of Contents
Spin-off Senior Secured Credit Agreement
On November 13, 2007, APP and certain of its wholly-owned subsidiaries entered into a senior secured credit agreement (the “Spin-off Credit Agreement”) with certain lenders and Deutsche Bank AG New York Branch, as Administrative Agent. The Spin-off Credit Agreement provided for two term loan facilities: a Term Loan A facility for $500 million and a Term Loan B facility for $500 million. The Credit Agreement also provided for a revolving credit facility of $150 million. The term loan facilities were scheduled to mature on November 13, 2013, and the revolving credit facility was scheduled to expire on November 13, 2012. A portion of the proceeds from the debt financing was used to repay APP’s existing indebtedness and fees and expenses related to the financing, and $700 million was contributed to New Abraxis immediately prior to the separation.
Additionally, on February 14, 2008, APP entered into interest rate swap agreements with an aggregate notional principal amount of $990 million. Under these agreements, APP paid interest to the counterparty at a fixed rate of 3.04% on the notional amount, and received interest at a variable rate equal to one-month LIBOR. The interest rate swaps were scheduled to expire in February, 2009. APP formally designated these swaps as hedges of its exposure to variability in future cash flows attributable to the LIBOR-based interest payments due on the credit facilities. Accordingly, the interest rate swaps were reported at fair value in the balance sheet and changes in their fair values were initially recorded in accumulated other comprehensive income in the balance sheet and recognized in operations each period when the hedged item impacted results.
All amounts owed under these credit facilities became due and payable and the agreements terminated upon the closing of the Merger on September 10, 2008. The interest rate swap was terminated on September 5, 2008 resulting in a recognized loss of $2.7 million, which is included in interest expense of the predecessor period in 2008. There were no penalties associated with the early pay-off of the debt or termination of the interest rate swap agreements.
Fresenius Merger—Credit Agreements
On August 20, 2008, in connection with the acquisition of APP described in Note 2—Merger with APP, Fresenius entered into a $2.45 billion credit agreement with Deutsche Bank AG, London Branch, as administrative agent, Deutsche Bank AG, London Branch, Credit Suisse, London Branch, and J.P. Morgan plc, as arrangers and book running managers, and the other lenders party thereto (the “Senior Credit Facilities Agreement”) and a $1.3 billion bridge credit agreement with Deutsche Bank AG, London Branch, as the administrative agent, Deutsche Bank AG, London Branch, Credit Suisse, London Branch, and J.P. Morgan plc, as arrangers and book running managers, and the other lenders party thereto (the “Bridge Facility Agreement”) to assist in the funding of the transaction. The $2.45 billion Senior Credit Facilities Agreement includes a $1 billion term loan A, a $1 billion term loan B, and revolving credit facilities of $300 million, which was subsequently increased to $400 million, and $150 million. Proceeds from borrowings under these credit facilities, together with other available funds provided by Fresenius through equity contributions and loans to FKP Holdings and its subsidiaries, were utilized to complete the purchase of APP on September 10, 2008.
The Senior Credit Facilities Agreement provides APP Pharmaceuticals, LLC, a wholly owned subsidiary of APP, with two term loan facilities: a Tranche A2 Term Loan (“Term Loan A2”) for $500 million and Tranche B2 Term Loan (“Term Loan B2”) for $497.5 million. The Senior Credit Facilities Agreement also provides APP Pharmaceuticals, LLC with a $150 million revolving credit facility. The revolving credit facility includes a $50 million sub-limit for swingline loans and a $20 million sub-limit for letters of credit. The Term Loan A2 and B2 loan facilities mature on September 10, 2013 and September 10, 2014, respectively, and the revolving credit facility expires on September 10, 2013. We incurred and capitalized approximately $25 million in debt issue costs in connection with the Senior Credit Facilities Agreement. As of December 31, 2009, the balance outstanding on APP Pharmaceuticals, LLC senior credit facilities was $921.4 million and the revolving credit facility had no outstanding balance.
Pursuant to the Senior Credit Facilities Agreement, Fresenius Kabi Pharmaceuticals, LLC (which was merged with and into APP Pharmaceuticals, Inc. upon consummation of the Merger) entered into an intercompany loan with the borrower of the $500 million Tranche A1 Term Loan and the $502.5 million Tranche B1 Term Loan, and an affiliate of FKP Holdings entered into an intercompany loan with the borrower under the $300 million revolving facility under the Senior Credit Facilities Agreement (collectively, the “Senior Intercompany Loans”), the amount, maturity and other financial terms of which correspond to those applicable to the loans provided to such borrowers under the Senior Credit Facilities Agreement described above. The Senior Intercompany Loans are guaranteed by FKP Holdings and certain of its affiliates and subsidiaries and secured by the assets of FKP Holdings and certain of its affiliates and subsidiaries. The Senior Intercompany Loans provide for an event of default and acceleration if there is an event of default and acceleration under the Senior Credit Facilities Agreement, but acceleration of the Senior Intercompany Loans may not occur prior to acceleration of the loans under the Senior Credit Facilities Agreement. By entering into certain of the Senior Intercompany Loans with Fresenius Kabi Pharmaceuticals, LLC, Fresenius effectively pushed-down its Merger-related term loan borrowings under the Senior Credit Facilities Agreement to the FKP Holdings group. The Senior Intercompany Loans bear interest at a variable rate based on the rates applicable to the corresponding loans under the Senior Credit Facilities Agreement, plus a margin, as discussed below, and are due in 2013 and 2014, as applicable. The balance of the Senior Intercompany Loans outstanding at December 31, 2009 was $1,386.0 million.
30
Table of Contents
The interest rate on each borrowing under the Senior Credit Facilities Agreement is a rate per annum equal to the aggregate of (a) the applicable margin and (b) LIBOR or EURIBOR for the relevant interest period, subject, in the case of Term Loan B, to a minimum LIBOR or EURIBOR. The applicable margin for Term Loan A Facilities and the Revolving Credit Facilities is variable and depends on the Fresenius Leverage Ratio as defined in the Senior Credit Facilities Agreement.
The Senior Credit Facilities Agreement contains a number of affirmative and negative covenants that are assessed at the Fresenius level and are not separately assessed at APP Pharmaceuticals, LLC. The obligations of APP Pharmaceuticals, LLC under the Senior Credit Facilities Agreement are unconditionally guaranteed by Fresenius SE, Fresenius Kabi AG, Fresenius ProServe GmbH and APP Pharmaceuticals, Inc. and are secured by a first-priority security interest in substantially all tangible and intangible assets of APP Pharmaceuticals, Inc. and APP Pharmaceuticals, LLC.
Pursuant to the Bridge Facility Agreement, FKP Holdings entered into an intercompany loan (the “Bridge Intercompany Loan”) with an affiliate of FKP Holdings who was the borrower under the Bridge Facility Agreement, the amount, maturity, and other financial terms of which corresponded to those applicable to the loans provided to such borrower under the Bridge Facility Agreement. The Bridge Intercompany Loan was guaranteed by certain of its affiliates and subsidiaries and secured by the assets of FKP Holdings and certain of its affiliates and subsidiaries. The Bridge Intercompany Loan provided for an event of default and acceleration if there was an event of default and acceleration under the Bridge Facility Agreement, but acceleration of the Bridge Intercompany Loan may not occur prior to acceleration of the loans under the Bridge Facility Agreement. By entering into the Bridge Intercompany Loan with FKP Holdings, Fresenius effectively pushed-down its Merger-related borrowings under the Bridge Credit Facility Agreement to FKP Holdings. The Bridge Intercompany Loan bore interest at the rate applicable to the corresponding loan under the Bridge Facility Agreement, plus a margin. In addition, Fresenius SE made two other intercompany loans totaling $456.2 million to FKP Holdings as part of the acquisition. These intercompany loans include fixed interest rates and mature on September 10, 2014. As described below, the original borrowing under the Bridge Facility Agreement was $1.3 billion, $650 million of which was repaid in October 2008 and the remainder of which was repaid in January 2009. Also as described below, the related intercompany loans were refinanced in connection with the repayments made on the Bridge Facility Agreement.
In connection with the intercompany loans described above, Fresenius also pushed-down to the Company approximately $101.1 million in fees and costs incurred in connection with establishing the Senior Credit Facilities Agreement and Bridge Facilities Agreement, the proceeds of which were used to finance the Merger.
Post-Merger Activity
On October 6, 2008, the amount available under the Senior Credit Facilities Agreement was increased to approximately $2.95 billion by increasing the amount of the Tranche B1 Term Loan facility by $483.1 million. On October 10, 2008, the full amount of the increase to the Tranche B1 Term Loan facility under the Senior Credit Facilities Agreement was drawn down. These funds, along with an additional $166.9 million of proceeds from other borrowings were used to repay a portion of the $1.3 billion outstanding under the Bridge Facility Agreement, so that the aggregate amount outstanding under Bridge Facility Agreement, after these repayments, was $650 million. The $650 million repayment of the Bridge Intercompany Loan resulted in the write-off of $13.4 million in related debt issuance costs in the fourth quarter of 2008. These changes to the Senior Credit Facilities Agreement and Bridge Credit Facility Agreement were also reflected in the Senior Intercompany Loans and Bridge Intercompany Loan. The balance of the Bridge Intercompany Loan outstanding at December 31, 2008 was $650.0 million.
On January 21, 2009, the borrower under the Bridge Facility Agreement, which is an affiliate of Fresenius, issued two tranches of notes in a private placement. The issuer sold $500 million aggregate principal amount of fixed interest rate senior notes and €275 million aggregate principal amount of fixed interest rate senior notes. The notes are senior unsecured obligations of the issuer and mature on July 15, 2015. Proceeds of the notes issuance were used among other things, to repay in full the $650 million outstanding under the Bridge Facility Agreement. Upon the repayment of the bridge loan, the Bridge Intercompany Loan was refinanced and replaced with an Intercompany Dollar Loan of $500 million and an Intercompany Euro Loan of €115.7 million. The interest payments for these notes are at fixed interest rates and are due semi-annually on January 15 and July 15. These new intercompany loans are not guaranteed or secured and the principal for both of these loans is due July 15, 2015. As a result of the refinancing, in the first quarter of 2009, the Company wrote-off $14.6 million of Bridge Intercompany Loan unamortized debt issuance costs and incurred debt issuance costs of $67.5 million for the new Intercompany Dollar and Euro loans.
31
Table of Contents
During the second half of 2009, the Company restructured certain of its unsecured intercompany loans. The Company did not receive or pay any cash as a result of the $523.1 million, $150 million and $75 million transactions described below. In connection with the restructuring, obligations related to $523.1 million of these unsecured intercompany loans were transferred from Fresenius SE to Fresenius Kabi AG along with the related outstanding accrued interest. The terms of these loans were unchanged in the transfer. Also, during the second half of 2009, the Company entered into the following unsecured intercompany loans with Fresenius Kabi AG: $150 million note of which the proceeds were used to pay down the entire $150 million balance outstanding under the $300 million revolving facility under the Senior Intercompany Loans; $75 million note and a $50 million note of which the proceeds were used to pay down the full amounts outstanding in September and December, respectively, under the APP Pharmaceuticals, LLC revolving credit facility under the Senior Credit Facilities Agreement; and $85 million note of which cash proceeds were received of $73.7 million and were used to pay our December debt costs and $11.3 million resulting from interest and principal payments made on our behalf. Prior to year end the $75 million note and the $150 million note were combined into a $225 million note. The $360 million of unsecured intercompany loans due to Fresenius Kabi AG are at fixed interest rates and have maturity dates of 30 or 60 days. These loans are intended to be extended for the near term and are included in the current portion of intercompany debt in the consolidated balance sheet.
On December 10, 2009 the Company entered into unsecured intercompany loans with Fresenius Kabi AG in the amount of 13 million Euros, $46.3 million and $32.3 million. The proceeds of these loans were used to pay the voluntary principal prepayments on Senior Intercompany Loans Euro Tranche Term B1 Loan of 13 million Euros and Tranche Term B1 Loan of $46.3 million and on APP Pharmaceuticals, LLC senior credit facilities Term Loan B2 of $32.3 million. These Fresenius Kabi AG notes are at fixed interest rates and have a maturity date of September 10, 2014. There was no change to principal maturity dates related to this exchange of notes. The balance of the unsecured intercompany loans at December 31, 2009 was $1,647.2 million.
The following is the repayment schedule for Term Loans A2 and B2 and the intercompany loans outstanding as of December 31, 2009 (in thousands):
| Term Loan A2 | Term Loan B2 | Intercompany Fresenius |
Total | |||||||||
| 2010 |
$ | 71,500 | $ | 4,975 | $ | 441,511 | $ | 517,986 | ||||
| 2011 |
122,500 | 4,975 | 132,511 | 259,986 | ||||||||
| 2012 |
150,000 | 4,975 | 160,011 | 314,986 | ||||||||
| 2013 |
118,500 | 4,975 | 128,511 | 251,986 | ||||||||
| 2014 |
— | 439,044 | 1,503,992 | 1,943,036 | ||||||||
| 2015 and thereafter |
— | — | 666,668 | 666,668 | ||||||||
| $ | 462,500 | $ | 458,944 | $ | 3,033,204 | $ | 3,954,648 | |||||
As a result of the use of derivative instruments, the Company is exposed to counterparty credit risk when these instruments are in an asset position. The Company manages the counterparty credit risk by entering into derivative contracts only with its Parent company and its affiliates. As a result, as of December 31, 2009, the Company does not expect to experience any losses as a result of default of its counterparty.
Foreign Currency Contracts: Included in our intercompany borrowings are several Euro-denominated notes, €197.5 million notes with maturities in 2014 and a €115.7 million note with a maturity in 2015. In connection with these borrowings, we entered into intercompany foreign currency swap contracts in order to limit our exposure to changes in current exchange rates on the Euro-denominated notes principal balance and related future interest payments. We have entered into foreign currency swaps with affiliates of Fresenius for the total of the Euro-denominated notes principal balance. These agreements mature at various dates through January 2012, and are not designated as hedging instruments for accounting purposes. During the year ended December 31, 2009 and the successor period in 2008, we recognized a foreign currency gain of approximately $30.1 million and $4.0 million, respectively, in our other income (expense) related to the change in fair value of these swap agreements. These foreign currency gains were offset by a the $26.2 million and $8.2 million currency losses we recorded in 2009 and in the successor period in 2008, in order to adjust the carrying value of the Euro-denominated note to reflect the year-end exchange rate.
We have also entered into foreign currency hedges for the €18.9 million of future cash flows related to the interest payments due on the €197.5 million notes through December 12, 2011, and for the €25.4 million of future cash flows related to the interest payments on the €115.7 million note through January 17, 2012. These foreign currency agreements have been designated as hedges of our exposure to fluctuations in interest payments on outstanding Euro-denominated borrowings due to changes in Euro/U.S. dollar exchange rates (a cash flow hedge). The fair value of these foreign currency hedges at December 31, 2009 and 2008 is an asset of $5.0 million and $0.0 million, respectively and is included in current prepaid expenses and other current assets and other non-current assets, net in our consolidated balance sheet. During the year ended December 31, 2009 and the successor period in 2008, we recognized a foreign currency gain of $5.0 million and $0.0 million, respectively, in other comprehensive income (loss).
32
Table of Contents
Interest Rate Swaps: On November 3, 2008, we entered into four interest rate swap agreements with Fresenius for an aggregate notional principal amount of $900 million. These agreements require us to pay interest at an average fixed rate of 3.97% and entitle us to receive interest at variable rate equal to three-month LIBOR on the notional amount. The interest rate swaps expire in October 2011 and December 2013. These swaps have been designated as hedges of our exposure to fluctuations in interest payments on outstanding variable rate borrowings due to changes in interest rates (a cash flow hedge). The fair value of these interest rate swap agreements at December 31, 2009 and 2008 is a liability of $53.2 million and $69.3 million, respectively, and is included in long-term liabilities in our consolidated balance sheets. As noted above the Company entered into derivative contracts with its Parent, who pushed down the interest rate swap agreements to the Company. From inception of the agreements to the time the interest rate swaps were transferred to the Company the Parent recognized $15.9 million in losses in other comprehensive income (loss). From the time the interest rate swap agreements were transferred to the Company through December 31, 2009, we recorded a deferred loss of $22.3 million, net of tax benefit of $14.1 million, in other comprehensive income (loss) and recognized $0.9 million, in intercompany interest expense, which represented the amount of hedge ineffectiveness.
The CVRs
In connection with the Merger, each APP shareholder was issued one contingent value right of FKP Holdings. The CVRs are intended to give holders an opportunity to participate in any excess Adjusted EBITDA, as defined in the CVR Indenture, generated during the three years ending December 31, 2010, referred to as the “CVR measuring period,” in excess of a threshold amount. Each CVR represents the right to receive a pro rata portion of an amount equal to 2.5 times the amount by which cumulative Adjusted EBITDA of APP and FKP Holdings and their subsidiaries on a consolidated basis, exceeds $1.267 billion for the three years ending December 31, 2010. The maximum amount payable under the CVR Indenture is $6.00 per CVR. If Adjusted EBITDA for the CVR measuring period does not exceed this threshold amount, no amounts will be payable on the CVRs and the CVRs will expire valueless. The cash payment on the CVRs, if any, will be determined after December 31, 2010, and will be payable June 30, 2011, except in the case of a change of control of FKP Holdings, which may result in an acceleration of any payment. The acceleration payment, if any, is payable within six months after the change of control giving rise to the acceleration payment. Because any amount payable to the holders of CVRs must be settled in cash, the CVRs are classified as liabilities in the consolidated financial statements. The estimated fair value of the CVRs at the date of acquisition was included in the cost of the acquisition. At each reporting date, the CVRs are marked-to-market based on the closing price of a CVR as reported by NASDAQ, and the change in the fair value of the CVRs for the reporting period is included in operations.
Assuming the Adjusted EBITDA threshold is met, the maximum amount payable under the CVR Indenture is $979.5 million. Such payment, if any, would be due on June 30, 2011. In the event that such a payment is required, we would likely need to seek financing from either an external source or Fresenius and its affiliates in order to satisfy the obligation.
The CVRs do not represent equity, or voting securities of FKP Holdings, and they do not represent ownership interests in FKP Holdings. Holders of the CVRs are not entitled to any rights of a stockholder or other equity or voting securities of FKP Holdings, either at law or in equity. Similarly, holders of CVRs are not entitled to any dividends declared or paid with respect to any equity security of FK Holdings. A holder of a CVR is entitled only to those rights set forth in the CVR indenture. Additionally, the right to receive amounts payable under the CVRs, if any, is subordinated to all senior obligations of FKP Holdings. The CVRs trade on NASDAQ under the symbol “APCVZ”.
Under the terms of the CVR Indenture, the amount, if any, payable in respect of each CVR on June 30, 2011 is determined based on Adjusted EBITDA. As a result, in addition to reporting financial results in accordance with generally accepted accounting principles (“GAAP”), FKP Holdings also must calculate and present Adjusted EBITDA, which is a non-GAAP financial measure, for the cumulative period from January 1, 2008 to the current reporting date until the expiration of the CVR measurement period (December 31, 2010) and settlement of the CVRs.
33
Table of Contents
The calculation of Adjusted EBITDA under the CVR Indenture for the year ended December 31, 2009 and the cumulative period from January 1, 2008 to December 31, 2009 is as follows (in thousands):
| For the twelve month Period Beginning January 1, 2009 and Ending December 31, 2009 |
For the Cumulative Period Beginning January 1, 2008 and Ending December 31, 2009 |
|||||||
| EBITDA CALCULATION: |
||||||||
| Net loss |
$ | (30,385 | ) | $ | (333,287 | ) | ||
| Interest expense (net of interest income) |
332,044 | 494,891 | ||||||
| Income tax benefit |
(17,450 | ) | (3,525 | ) | ||||
| Depreciation |
17,821 | 37,219 | ||||||
| Amortization |
38,185 | 481,928 | ||||||
| EBITDA |
$ | 340,215 | $ | 677,226 | ||||
| Reconciliation to Adjusted EBITDA: |
||||||||
| Stock compensation |
360 | 6,129 | ||||||
| Merger and separation related costs |
1,447 | 48,754 | ||||||
| Puerto Rico costs |
9,535 | 32,802 | ||||||
| Technology transfer costs |
1,019 | 2,098 | ||||||
| Change in fair value of contingent value rights |
(8,163 | ) | (109,379 | ) | ||||
| Other taxes |
518 | 1,386 | ||||||
| Loss on sale of fixed assets |
260 | 342 | ||||||
| Consulting fees |
400 | 600 | ||||||
| Foreign currency gain |
(4,036 | ) | (2,474 | ) | ||||
| Puerto Rico closure costs |
5,778 | 5,778 | ||||||
| Other charges (credits), net |
(489 | ) | 297 | |||||
| Adjusted EBITDA – per CVR Indenture |
$ | 346,844 | $ | 663,559 | ||||
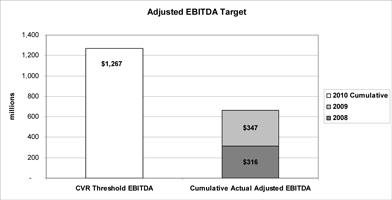
FKP Holdings believes that its presentation of these non-GAAP financial measures is consistent with the requirements of the CVR Indenture and also provides useful supplementary information to help investors in understanding the underlying operating performance and cash generating capacity of the Company. The calculation is based on the interpretation of the definition of Adjusted EBITDA set forth in the CVR Indenture by management of FKP Holdings and the final determination of Adjusted EBITDA under the CVR Indenture is subject to the terms of the CVR Indenture.
FKP Holdings does use these non-GAAP financial measures internally for operating, budgeting and financial planning purposes and also believes that its presentation of these non-GAAP financial measures can assist management and investors in assessing the financial performance and underlying strength of its core business. The non-GAAP financial measures presented by FKP Holdings may not be comparable to similarly titled measures reported by other companies. The non-GAAP financial measures are in addition to, and not a substitute for or superior to, measures of financial performance calculated in accordance with GAAP.
34
Table of Contents
Capital Requirements
Our future capital requirements will depend on numerous factors, including:
| • | the obligations placed upon our company from our credit agreements discussed above, including any debt covenants related to those obligations; |
| • | working capital requirements and production, sales, marketing and development costs required to support our business; |
| • | the need for manufacturing expansion and improvement; |
| • | the transfer of products from our Puerto Rico to Raleigh and Grand Island manufacturing facilities; |
| • | the requirements related to the settlement of the CVRs in 2011, if any; |
| • | the requirements of any potential future acquisitions, asset purchases or equity investments; and |
| • | the amount of cash generated by operations, including potential milestone and license revenue. |
We anticipate that available cash and short-term notes receivable, cash generated from operations, and funds available under our credit facility or through borrowings or capital contributions from Fresenius, our parent, will be sufficient to finance our operations, including ongoing product development and capital expenditures for at least the next twelve months. In the event we engage in future acquisitions or capital projects, we may have to raise additional capital through additional borrowings or through additional intercompany debt. Fresenius has committed to the Company that it will provide financial support to FKP Holdings sufficient for it to satisfy its obligations and debt service requirements arising under all existing financing instruments entered into in connection with the Merger, and to which the Company is a party, as they come due until at least January 1, 2011.
As described above, we are responsible for servicing the debt of $0.9 billion incurred in connection with the Merger, as well as to pay the principal and interest on the outstanding intercompany debt of $3.0 billion with funds generated by our operations. We expect that our funds generated by operations will be sufficient to satisfy all of our debt obligations, however it is likely that we will need to request that Fresenius refinance certain of our intercompany obligations, including those coming due in 2010, in order to extend their maturities.
Our ability to meet our debt service obligations will depend on our future performance, which will be affected by financial, business, economic and other factors, including potential changes in customer preferences, the success of product and marketing innovations and pressure from competitors. If we do not have enough money to pay our debt service obligations, we may be required to refinance all or part of our existing debt, sell assets or borrow more money. We may not be able to, at any given time, refinance this debt, sell assets or borrow more money on terms acceptable to us or at all, the failure to do any of which could have adverse consequences for our business, financial condition and results of operations.
Contractual Obligations and Off-Balance Sheet Arrangements
Contractual obligations represent future cash commitments and liabilities under agreements with third parties and intercompany agreements, and exclude contingent liabilities for which we cannot reasonably predict future payment. The following information summarizes our contractual obligations and other commitments, including credit facilities and operating leases, as of December 31, 2009:
| Payments due by period | |||||||||||||||
| Contractual Obligations |
Total | Less than 1 year |
1-3 years | 3-5 years | More than 5 years | ||||||||||
| (in thousands) | |||||||||||||||
| Term Loans A2 and B2 and intercompany loans principal repayments (excluding interest) |
$ | 3,954,648 | $ | 517,986 | $ | 574,972 | $ | 2,195,022 | $ | 666,668 | |||||
| Operating lease obligations |
17,028 | 7,231 | 5,193 | 3,167 | 1,437 | ||||||||||
| Total |
$ | 3,971,676 | $ | 525,217 | $ | 580,165 | $ | 2,198,189 | $ | 668,105 | |||||
Obligations related to interest on debt, the settlement of the Contingent Value Rights and liabilities for uncertain tax positions are not included in the table above because the timing and amount of any required payments cannot be reasonably estimated.
We do not currently have any off-balance sheet arrangements that are material or reasonably likely to be material to our financial position or results of operations.
35
Table of Contents
CRITICAL ACCOUNTING POLICIES AND ESTIMATES
The preparation of financial statements in conformity with accounting principles generally accepted in the United States requires management to make estimates and assumptions that affect the reported amounts of assets and liabilities and disclosure of contingent assets and liabilities at the date of the financial statements and the reported amounts of revenues and expenses during the reporting period. The most significant estimates in our consolidated financial statements are discussed below. Actual results could vary from these estimates.
Revenue Recognition
Product Revenue Recognition
We recognize revenue from the sale of a product and for contract manufacturing when title and risk of loss have transferred to the customer, collection is reasonably assured and we have no further performance obligation. This is typically when the product is received by the customer. At the time of sale, as further described below, we reduce sales and provide for estimated chargebacks, contractual allowances or customer rebates, product returns and customer credits and cash discounts. We have extensive, internal historical information on chargebacks, rebates and customer returns and credits which we use as the primary factor in determining the related provision and reserve requirements. As further described below, due to the nature of our generic injectable products and their primary use in hospital and clinical settings with generally consistent demand, we believe that this internal historical data, in conjunction with periodic review of available third-party data, provides a reliable basis for such estimates. In 2009, we revised our methodology to estimate certain of our sales provisions to reflect the availability of new information. Accruals for sales provisions are presented in our financial statements as a reduction of revenue and accounts receivable or, in the case of contractual allowances, an increase in accrued liabilities. We regularly review information related to these estimates and adjust our reserves accordingly if, and when, actual experience differs from estimates.
We periodically review the wholesale supply levels of our more significant products by reviewing inventory reports purchased or available from wholesalers, evaluating our unit sales volumes, and assessing data from third-party market research firms and our periodic visits to wholesaler warehouses. Based on this information, we attempt to keep a consistent wholesale stocking level of approximately two- to six-weeks across our hospital-based products. The buying patterns of our customers do vary from time to time, both from customer to customer and product to product, but we do not believe that variances in our historic wholesale stocking levels or speculative buying activity in our hospital-based distribution channels has had a significant impact on our historic sales comparisons or sales provisions.
Sales Provisions
Our sales provisions totaled $1,478.5 million, $1,222.0 million, and $1,080.1 million for the year ended December 31, 2009, the combined 2008 year period and the year ended December 31, 2007, respectively, and related reserves totaled $173.5 million, $176.5 million at December 31, 2009 and 2008, respectively.
Chargebacks
Following industry practice, we typically sell our products to independent pharmaceutical wholesalers at wholesale list price. These wholesalers in turn sell our products to an end user, normally a hospital or alternative healthcare facility, at a lower contractual price previously established between the end user and us via a group purchasing organization, or GPO. GPOs enter into collective purchasing contracts with pharmaceutical suppliers to secure more favorable product pricing on behalf of their end-user members.
Our initial sale to the wholesaler, and the resulting receivable, are recorded at our wholesale list price. However, as our agreements with our wholesalers specify that they are entitled to a credit for the difference between the wholesale list price and the lower end-user contract price, we reduce reported sales and receivables by the difference between the wholesale list price and the estimated end-user contract price by recording a chargeback provision and reserve at the time of sale. When the wholesaler ultimately sells the product to the end user at the end-user contract price, the wholesaler charges us, via a chargeback, for the difference between the wholesale list price and the end-user contract price and such chargeback is offset against the chargeback reserve established at the time of sale. On a monthly basis, we compare our recorded chargeback reserve to our estimate of the net proceeds we will realize from the wholesaler based on the estimated ending wholesale units in the distribution channel pending chargeback and the estimated end-user selling price of those units and adjust the chargeback provision as necessary.
36
Table of Contents
The determination of the estimated provision for chargebacks and the related reserve requires us to make significant estimates and judgments. The most significant estimates inherent in the measurement of the initial chargeback provision relate to the proportion of wholesale units that will ultimately be sold to an end-user with a lower-price contractual relationship with us, and the ultimate end-user contract-selling price we will realize when those units are sold. We base our estimates of these factors primarily on internal, product-specific sales and chargeback processing experience, estimated wholesaler inventory stocking levels, current contract pricing, IMS data and our expectation for future contract pricing changes. In our monthly assessment of the adequacy of our recorded chargeback reserve, we consider these same factors in estimating the ending wholesale units in the distribution channel pending chargeback and the net proceeds we will realize from the wholesaler. The amount of product in the channel is comprised of product at the distributor and product that the distributor has sold to an end-user, but has yet to report as end user sales. Accordingly, in estimating the ending wholesale units in the distribution channel pending chargeback, we also must make assumptions about the time lag between the date the product is sold to the wholesaler and the date the wholesaler sells the product to the end-user customer, and between the sale date and the date that sale is reported to us enabling us to process the chargeback. Physical inventory in the channel is based on inventory data received from certain of our wholesalers; for others it is estimated based on evaluation of our monthly sales to our wholesalers and our knowledge of inventory turnover at our major wholesalers. We estimate end user sales made but not yet reported to us based on either actual chargebacks processed in the following month or the historical average number of days to process a chargeback from the date of the end user sale. Our estimate of the chargeback provision and reserve could also be impacted by a number of market conditions that are beyond our control, including: competitive pricing, competitive products and changes impacting demand in both the distribution channel and at the level of the healthcare provider. We regularly review information related to these estimates and adjust our provisions and reserves accordingly if, and when, actual experience differs from our estimates.
Our net chargeback reserve totaled $129.0 million and $143.3 million at December 31, 2009 and 2008, respectively. Based on the availability of new information regarding inventory in the wholesale distribution channel and the chargeback processing lag, we revised our methodology to estimate the chargeback reserve in 2009. This change in estimate reduced the estimated chargeback reserve at December 31, 2009 by approximately $5.5 million.
Due to information constraints in the distribution channel, it has not been practical, and has not been necessary, for us to capture and quantify the impact of current versus prior year activity on the chargeback provision. Information constraints within the distribution channel primarily relate to our inability to track product through the channel on a unit or specific lot basis. In addition, for the most part, we do not receive information from our customers with respect to the level of their sales that are subject to chargeback. The lack of information on a specific lot basis precludes us from tracking actual chargeback activity to the period of our initial sale. As a result, we rely on internal data, external wholesaler and IMS data and management estimates in order to estimate the amount of product in the channel subject to future chargeback. We also review current year chargeback activity to determine whether material changes in the provision relate to prior period sales; such changes have not been material to our statements of operations. A one percent decrease in our estimated end-user contract-selling prices would reduce total net revenue for the year ended December 31, 2009 by $0.9 million and a one percent increase in wholesale units pending chargeback at December 31, 2009 would decrease total net revenue for the year ended December 31, 2009 by $0.8 million.
Contractual Allowances, Fee for Service, Returns and Credits, Cash Discounts and Bad Debts
Our net reserve for other sales provisions totaled $44.5 million and $33.2 million at December 31, 2009 and 2008, respectively. Contractual allowances, which generally consist of rebates or administrative fees, are offered to certain wholesale customers, GPOs and end-user customers consistent with pharmaceutical industry practices. Settlement of rebates and fees due to customers generally occurs between one to fifteen (15) months from the date of sale. We establish a general reserve for contractual allowances at the time of sale based on the historical relationship between sales and such allowances. Upon receipt of request for credit, we establish a specific liability for the fees or rebates due to the customer based on the specific terms of each agreement.
From time to time we enter into inventory management agreements with our wholesale customers which require us to pay a fee in connection with their distribution of our products or their performance of other services, including for example providing us with sales data and performing other services and contractual rights for us. In addition, we may be required to enter into such agreements in the future in order to maintain our relationships with other such wholesalers. We are unable to ascertain the potential impact of the terms of any such future agreements on our sales, but do not believe that such future agreements would result in a substantial change in wholesale stocking levels of our products as compared to current levels.
Consistent with industry practice, our return policy permits our customers to return products within a window of time before and after the expiration of product dating. We provide for product returns and other customer credits at the time of sale by applying historical experience factors, generally based on historic data on credits issued by credit type or product, relative to related sales and we provide specifically for identified outstanding returns and credits in the period in which they become known.
37
Table of Contents
We generally offer our customers a standard cash discount on our hospital-based products for prompt payments and, from time-to-time, may offer an additional discount and/or extended terms in support of product launches or other promotional programs. A provision for cash discounts is established at the time of sale based on the terms of sale and adjusted for historical experience factors regarding the level of cash discount taken.
We establish a reserve for bad debts based on general and identified customer credit exposure. Our actual losses due to bad debts were less than $0.2 million in each of 2009, 2008 and 2007.
Inventories
Inventories consist of products currently approved for marketing and costs related to certain products that are pending regulatory approval. From time to time, we capitalize inventory costs associated with products prior to regulatory approval based on our judgment of probable future regulatory approval, commercial success and realizable value. Such judgment incorporates our knowledge and best judgment of where the product is in the regulatory review process, our required investment in the product, market conditions, competing products and our economic expectations for the product post-approval relative to the risk of manufacturing the product prior to approval. If final regulatory approval for such products is denied or delayed, we revise our estimates and judgments about the recoverability of the capitalized costs and, where required, provide reserves for or write-off such inventory in the period those estimates and judgments change.
We routinely review our inventory and establish reserves when the cost of the inventory is not expected to be recovered or the cost of a product exceeds estimated net realizable value. In instances where inventory is at or approaching expiration, is not expected to be saleable based on our quality and control standards or is selling for a price below cost, we reserve for any inventory impairment based on the specific facts and circumstances. Provisions for inventory reserves are reflected in the consolidated financial statements as an element of cost of sales; inventories are presented net of related reserves.
Income taxes
Deferred tax assets and liabilities are recognized for the future tax consequences attributable to differences between the financial statement carrying amounts of existing assets and liabilities and their respective tax bases as well as net operating loss and capital loss carryforwards. Deferred tax assets and liabilities are measured using enacted tax rates expected to apply to taxable income in the years in which those temporary differences are expected to be recovered or settled. The effect on deferred tax assets and liabilities of a change in tax rates is recognized in the consolidated financial statements in the period that includes the legislative enactment date.
In determining our current income tax provision, we assess temporary differences resulting from differing treatments of items for tax and accounting purposes. These differences result in deferred tax assets and liabilities, which are recorded in our consolidated balance sheets. When we maintain deferred tax assets, we must assess the likelihood that these assets will be recovered through adjustments to future taxable income. To the extent we believe recovery is not likely, we establish a valuation allowance. We record an allowance reducing the asset to a value we believe is more likely than not to be recoverable based on our expectation of future taxable income. The accounting estimate related to the valuation allowance is susceptible to change from period to period as it requires management to make assumptions about our future income over the lives of the deferred tax assets. Forecasting future income requires us to use judgment. In estimating future income, we use our internal operating budgets and long-range planning projections. We develop our budgets and long-range projections based on recent results, trends, economic and industry forecasts influencing our performance, and planned timing of new product launches, among other factors. Significant changes in the expected realization of the deferred tax asset would require that we adjust the valuation allowance applied against the gross value of our total deferred tax assets, resulting in a change to net income.
As of December 31, 2008, we estimated that it is not likely that we will generate future taxable income in certain jurisdictions in which we have cumulative net operating losses and, therefore, we had provided a valuation allowance against the related deferred tax assets. Specifically, in August 2008, our predecessor determined that it could not conclude that it was more likely than not that tax benefits related to carryovers of net operating losses in Puerto Rico would be realized. Accordingly, APP recorded a valuation allowance of $1.0 million as of December 31, 2008. This amount represented the entire deferred tax asset resulting from the Puerto Rican loss carryovers. Because of the decision to shut down the Puerto Rican plant in September 2009, the deferred tax asset relating to the net operating losses in Puerto Rico was written off, as was the related valuation allowance. There was no net effect to income tax expense. Management believes that all other deferred tax assets are more likely than not to be fully realized.
38
Table of Contents
Our company is subject to tax audits in numerous jurisdictions in the U.S. as well as in Canada and Puerto Rico. Tax audits by their very nature are often complex and can require several years to complete. In the normal course of business, we are subject to challenges from the IRS and other tax authorities regarding amounts of taxes due. These challenges may alter the timing or amount of taxable income or deductions, or the allocation of income among tax jurisdictions. The benefits of tax positions that are more likely than not of being sustained upon audit based on the technical merits of the tax position are recognized in the consolidated financial statements; positions that do not meet this threshold are not recognized. For tax positions that are at least more likely than not of being sustained upon audit, the largest amount of the benefit that is more likely than not of being sustained is recognized in the consolidated financial statements.
In evaluating our unrecognized tax positions, we consider a variety of factors, including the technical merits of our tax positions, new and changing interpretations of tax laws and regulations, and the status of any pending or potential examinations of our tax returns by the applicable tax authorities. APP and its subsidiaries file income tax returns in the US Federal jurisdiction, Canada, Puerto Rico, and various state jurisdictions. APP is currently under Federal income tax examination for its 2006 and 2007 tax years. APP is also currently under state income tax examinations in California, Illinois, New York and North Carolina for various tax years. Although not currently under examination or audit, APP’s US federal income tax return for 2008, its Canadian income tax returns for the 2005 through 2008 tax years, its Puerto Rican income tax returns for the 2006 through 2008 tax years and its state income tax returns for the 2003 through 2008 tax years remain open for possible examination by the appropriate governmental agencies. There are no other open federal, state, or foreign government income tax audits at this time.
As of December 31, 2009, the total amount of gross unrecognized tax benefits, which are reported in other liabilities in our consolidated balance sheet, was $17.2 million. This entire amount would impact income tax expense if recognized. In addition, we accrue interest and any necessary penalties related to unrecognized tax positions in our provision for income taxes. For the twelve months ended December 31, 2009, $0.4 million of such interest was accrued.
Impairment of long-lived assets
We test long-lived assets, such as property, plant, and equipment and purchased intangibles subject to amortization, for recoverability when events or changes in circumstances indicate that the carrying amount of an asset may not be recoverable. Examples of events or circumstances that may be indicative of impairment include:
| • | A significant adverse change in legal factors or in the business climate that could affect the value of the asset, including, by way of example, a successful challenge of our patent rights resulting in generic competition earlier than expected. |
| • | A significant adverse change in the extent or manner in which an asset is used, including, by way of example, restrictions imposed by the FDA or other regulatory authorities that affect our ability to manufacture or sell a product. |
| • | A projection or forecast that demonstrates losses associated with an asset, including, by way of example, a change in a government reimbursement program that results in an inability to sustain projected product revenues or profitability or the introduction of a competitor’s product that results in a significant loss of market share. |
Recoverability of assets to be held and used is measured by a comparison of the carrying amount of an asset to the estimated undiscounted future cash flows expected to be generated by the asset. If the carrying amount of an asset exceeds its estimated future cash flows, an impairment charge is recognized equal to the amount by which the carrying amount of the asset exceeds the fair value of the asset. Assets to be disposed of are separately presented in the consolidated balance sheets and reported at the lower of the carrying amount or fair value less costs to sell, and are no longer depreciated.
The value of intangible assets is determined primarily using the “income method,” which starts with a forecast of all expected future net cash flows. Accordingly, the potential for impairment for intangible assets may exist if actual revenues are significantly less than those initially forecasted or actual expenses are significantly more than those initially forecasted. Some of the more significant estimates and assumptions inherent in the intangible asset impairment assessment process include: the amount and timing of projected future cash flows; the discount rate selected to measure the risks inherent in the future cash flows; and the assessment of the asset’s life cycle and the competitive trends impacting the asset, including consideration of any technical, legal, regulatory, or economic barriers to entry as well as expected changes in standards of practice for indications addressed by the asset.
Valuation Goodwill
Goodwill represents the excess of the cost of an acquired business over the amounts assigned to the net assets. Goodwill is not amortized but is tested for impairment at a reporting unit level on an annual basis or if an event occurs or circumstances change that would more likely than not reduce the fair value of a reporting unit below its carrying amount.
39
Table of Contents
Goodwill is tested for impairment using a two-step test. The first step, which is used to identify potential impairment, compares the fair value of a reporting unit with its carrying amount, including goodwill. If the fair value of a reporting unit exceeds its carrying amount, goodwill of the reporting unit is considered not impaired, thus the second step of the impairment test is unnecessary. If the carrying amount of a reporting unit exceeds its fair value, the second step of the goodwill impairment test is performed to measure the amount of impairment loss, if any. The second step compares the implied fair value of reporting unit goodwill with the carrying amount of that goodwill. If the carrying amount of reporting unit goodwill exceeds the implied fair value of that goodwill, an impairment loss shall be recognized in an amount equal to that excess.
Significant judgment is applied when goodwill is assessed for impairment. In performing our assessment of the carrying value of goodwill, we use the present value of estimated future cash flows to establish the estimated fair value of our reporting unit as of the testing date. Estimating the discounted future cash flows involves significant assumptions. These assumptions are related factors inherent in the business planning process, including future growth rates, the timing and acceptance of new products, the effects of competition, changes in volume, market pricing, cost, and business environment changes. Our assumed discount rate also has a significant impact on the estimated fair value of our reporting unit. Changes in economic and operating conditions impacting these assumptions could result in an impairment of goodwill in future periods. When available and as appropriate, we use comparative market multiples to corroborate the estimated fair value.
For the years presented, we did not recognize any goodwill impairment as the estimated fair value of our reporting unit with goodwill exceeded its carrying amount by more than 25%. While we believe that the assumptions used in estimating the fair value of our goodwill are reasonable and appropriate, we have recognized approximately $3.7 billion in goodwill in our consolidated balance sheet, and could be required to recognize significant goodwill impairment charges in the future if we have declines in profitability due to changes in volume, market pricing, cost, or the business environment. Future adverse changes in our economic environment could affect the discount rate and significant adverse changes to our business environment and future cash flows could cause us to record impairment charges in future periods which could be material.
RECENT ACCOUNTING PRONOUNCEMENTS
Recently Issued Accounting Pronouncements
In June 2009, the Financial Accounting Standards Board (“FASB”) issued guidance that eliminates the exceptions to the rules requiring consolidation of qualifying special-purpose entities which means more entities will be subject to consolidation assessments and reassessments. The guidance also requires ongoing reassessment of whether a company is the primary beneficiary of a variable interest entity (“VIE”) and clarifies characteristics that identify a VIE. In addition, additional disclosures about a company’s involvement with a VIE and any significant changes in risk exposure due to that involvement are required. This guidance is effective for the Company beginning in 2010. The Company is currently evaluating the impact of the adopting this guidance but does not anticipate it will have a material impact on our results of operations or financial condition.
Recently Adopted Accounting Pronouncements
In June 2009, the FASB issued Statement No. 168, “The FASB Accounting Standards Codification and the Hierarchy of Generally Accepted Accounting Principles-a replacement of FASB Statement No. 162” (“the ASC” or “the Codification”). Effective for interim and annual periods ended after September 15, 2009, the Codification became the source of authoritative U.S. generally accepted accounting principles (GAAP) and reporting standards recognized by the FASB to be applied by nongovernmental entities. Rules and interpretive releases of the Securities and Exchange Commission (SEC) under authority of federal securities laws are also sources of authoritative GAAP for SEC registrants. This statement is not intended to change existing GAAP and as such did not have an impact on the consolidated financial statements of the Company. The Company has updated its references in these consolidated financial statements to reflect the Codification.
In December 2007, the FASB issued new accounting guidance on business combinations and non-controlling interests in consolidated financial statements. The new guidance revises the method of accounting for a number of aspects of business combinations and non-controlling interest, including acquisition costs, contingencies (including contingent assets, contingent liabilities and contingent purchase price), the impacts of partial and step-acquisitions (including the valuation of net assets attributable to non-acquired minority interests) and post-acquisition exit activities of acquired businesses. The new guidance is effective for the Company for business combinations completed and non-controlling interests acquired or created after January 1, 2009. The adoption of this guidance on January 1, 2009 did not impact the accompanying consolidated financial statements.
40
Table of Contents
In April 2008, the FASB issued guidance that amends the factors that should be considered in developing renewal or extension assumptions used to determine the useful life of a recognized intangible asset and requires enhanced disclosures relating to: (a) the entity’s accounting policy on the treatment of costs incurred to renew or extend the term of a recognized intangible asset; (b) in the period of acquisition or renewal, the weighted-average period prior to the next renewal or extension (both explicit and implicit), by major intangible asset class; and (c) for an entity that capitalizes renewal or extension costs, the total amount of costs incurred to renew or extend the term of a recognized intangible asset for each period for which a statement of financial position is presented, by major intangible asset class. The adoption of this new guidance on January 1, 2009 did not impact the accompanying consolidated financial statements.
In March 2008, the FASB issued updated guidance that requires qualitative disclosures about the objectives and strategies for using derivatives, quantitative disclosures about the fair value amounts of and gains and losses on derivative instruments, and disclosures about credit-risk-related contingent features in derivative agreements. The effective date for adoption of this guidance by the Company was the first quarter of 2009. We have incorporated the required disclosures into these consolidated financial statements.
In September 2006, the FASB issued guidance that essentially redefined fair value, established a framework for measuring fair value in accordance with GAAP, and expanded disclosures about fair value measurements. This guidance applies where other accounting pronouncements require or permit fair value measurements and was effective for fiscal years beginning after November 15, 2007 for financial assets and liabilities, as well as for any other assets and liabilities that are carried at fair value on a recurring basis in the financial statements. In November 2007, the FASB provided a one year deferral for the implementation of this guidance for other non-financial assets and liabilities. Our predecessor adopted this guidance for financial assets and liabilities measured at fair value on a recurring basis on January 1, 2008, and the Company adopted it for non-financial assets and liabilities effective at the beginning of fiscal year 2009. The effects of its adoption were determined by the types of instruments carried at fair value in our financial statements at the time of adoption as well as the methods utilized to determine their fair values prior to adoption. The adoption of this guidance on January 1, 2008 did not have a significant impact on the consolidated financial statements of our predecessor. The adoption of the guidance for non-financial assets and liabilities had no impact on our consolidated financial statements for fiscal 2009.
In April 2009, the FASB issued updated guidance related to fair-value measurements to clarify the guidance related to measuring fair-value in inactive markets, modify the recognition and measurement of other-than-temporary impairments of debt securities, and require public companies to disclose the fair values of financial instruments in interim periods. The updated guidance is effective for interim and annual periods ended after June 15, 2009, with early adoption permitted for periods ended after March 15, 2009. The Company adopted the updated guidance in the first quarter of fiscal year 2009, which required certain additional disclosures regarding the fair value of financial instruments in the financial statements.
In May 2009, the FASB issued guidance which establishes accounting and disclosure requirements for subsequent events. This guidance details the period after the balance sheet date during which the Company should evaluate events or transactions that occur for potential recognition or disclosure in the financial statements, the circumstances under which the Company should recognize events or transactions occurring after the balance sheet date in its financial statements and the required disclosures for such events. The Company adopted this guidance in the second quarter of 2009, and has evaluated subsequent events through the filing date of this report.
| Item 7A. | QUANTITATIVE AND QUALITATIVE DISCLOSURES ABOUT MARKET RISK |
We are exposed to market risks associated with changes in interest rates and foreign currency exchange rates. Interest rate changes affect primarily our short-term advances to our parent and its affiliates and our debt obligations. Changes in foreign currency exchange rates can affect interest and principal cash flows related to our debt obligations that are denominated in foreign currencies, as will as our operations outside of the United States.
Foreign Currency Risk: We have operations in Canada; however, both revenue and expenses of those operations are typically denominated in the currency of the country of operations, providing a partial hedge. Nonetheless, our Canadian subsidiary is presented in our financial statement in U.S. dollars and can be impacted by foreign currency exchange fluctuations through both (i) translation risk, which is the risk that the financial statements for a particular period or as of a certain date depend on the prevailing exchange rates of the various currencies against the U.S. dollar, and (ii) transaction risk, which is the risk that the currency impact of transactions denominated in currencies other than the subsidiary’s functional currency may vary due to currency fluctuations.
41
Table of Contents
With respect to translation risk, even though there may be fluctuations of currencies against the U.S. dollar, which may impact comparisons with prior periods, the translation impact is included in accumulated other comprehensive income, a component of stockholders’ equity, and does not affect the underlying results of operations. Gains and losses related to transactions denominated in a currency other than the functional currency of the countries in which we operate are included in the condensed consolidated statements of operations.
Included in our intercompany borrowings are several Euro-denominated notes, €197.5 million notes with a maturity in 2014 and a €115.7 million note with a maturity in 2015. In connection with these borrowings, we entered into intercompany foreign currency forward swap contracts in order to limit our exposure to changes in current exchange rates on the Euro-denominated notes principal balance. We have entered into foreign currency swaps with affiliates of Fresenius for the total of the Euro-denominated notes principal balance. These agreements mature at various dates through January 2012, and are not designated as hedging instruments for accounting purposes.
During 2009 we have also entered into foreign currency hedges for the €18.9 million of future cash flows related to the interest payments due on the €197.5 million notes through December 12, 2011, and for the €25.4 million of future cash flows related to the interest payments on the €115.7 million note through January 17, 2012. These foreign currency agreements have been designated as hedges of our exposure to fluctuations in interest payments on outstanding Euro-denominated borrowings due to changes in Euro/U.S. dollar exchange rates (a cash flow hedge).
Investment Risk: The primary objective of our investment activities is to preserve principal while at the same time maximizing the income we receive from our activities without increasing risk. Since our merger with Fresenius, we use its cash management system to invest excess cash not needed for current operations. At December 31, 2009, we did not have any cash deposits with Fresenius.
Interest Rate Risk: We are also exposed to changes in interest rates on our variable rate borrowings. As of December 31, 2009, $921.5 million was outstanding on our credit facility and we had approximately $3,033.2 million of outstanding intercompany loans. If the interest rates on our outstanding borrowings were to increase by 1%, our interest expense would increase by $30.5 million (after considering the impact of the swap agreement described below) based on our outstanding debt balances at December 31, 2009.
On November 3, 2008, we entered into four interest rate swap agreements with Fresenius for an aggregate notional principal amount of $900 million. These agreements require us to pay interest at an average fixed rate of 3.97% and entitle us to receive interest at a variable rate equal to three-month LIBOR, which is equal to the benchmark rate for the Term A Loans being hedged, on the notional amount. The interest rate swaps expire in October 2011 and December 2013. These swaps have been designated as hedges of our exposure to fluctuations in interest payments on outstanding variable rate borrowings due to changes in interest rates (a cash flow hedge). The fair value of these interest rate swap agreements at December 31, 2009 is a liability of $53.2 million, and is included in long-term liabilities in our consolidated balance sheets.
| Item 8. | FINANCIAL STATEMENTS AND SUPPLEMENTARY DATA |
42
Table of Contents
Report of Independent Registered Public Accounting Firm
The Board of Directors
Fresenius Kabi Pharmaceuticals Holding, Inc.:
We have audited the accompanying consolidated balance sheets of Fresenius Kabi Pharmaceuticals Holding, Inc. and subsidiaries (the Company) as of December 31, 2009 and 2008, and the related consolidated statements of operations, stockholders’ equity, and cash flows for the year ended December 31, 2009 and the period from July 2, 2008 through December 31, 2008, and the consolidated statements of operations, stockholder’s equity and cash flows of APP Pharmaceuticals, Inc. and subsidiaries (formerly known as Abraxis BioScience, Inc.) (the “Predecessor”) for the period from January 1, 2008 through September 9, 2008. Our audits also included the 2009 and 2008 information in the financial statement schedule included in the Index at Item 15(a). These financial statements and schedule are the responsibility of the Company’s management. Our responsibility is to express an opinion on these financial statements and schedule based on our audits.
We conducted our audits in accordance with the standards of the Public Company Accounting Oversight Board (United States). Those standards require that we plan and perform the audit to obtain reasonable assurance about whether the financial statements are free of material misstatement. An audit includes examining, on a test basis, evidence supporting the amounts and disclosures in the financial statements. An audit also includes assessing the accounting principles used and significant estimates made by management, as well as evaluating the overall financial statement presentation. We believe that our audits provide a reasonable basis for our opinion.
In our opinion, the consolidated financial statements referred to above present fairly, in all material respects, the financial position of Fresenius Kabi Pharmaceuticals Holding, Inc. and subsidiaries at December 31, 2009 and 2008, and the results of their operations and their cash flows for the year ended December 31, 2009 and the period from July 2, 2008 through December 31, 2008, in conformity with U.S. generally accepted accounting principles. Further, in our opinion, the consolidated financial statements referred to above present fairly, in all material respects, the results of the Predecessor’s operations and their cash flows for the period from January 1, 2008 through September 9, 2008, in conformity with U.S. generally accepted accounting principles. Also, in our opinion the related 2009 and 2008 information in the financial statement schedule, when considered in relation to the basic financial statements taken as a whole, presents fairly in all material respects the information set forth therein.
As discussed in Note 1 to the consolidated financial statements, effective September 10, 2008, the Company acquired all of the outstanding stock of the Predecessor in a business combination accounted for as a purchase. As a result of the acquisition, the consolidated financial information for the period after the acquisition is presented on a different basis than that for the periods before the acquisition and, therefore, is not comparable.
/s/ KPMG
Chicago, Illinois
February 23, 2010
43
Table of Contents
Report of Independent Registered Public Accounting Firm
The Board of Directors
APP Pharmaceuticals, Inc.
We have audited the accompanying consolidated statements of operations, stockholders’ equity, and cash flows of APP Pharmaceuticals, Inc. and subsidiaries (previously known as Abraxis BioScience, Inc.) for the year ended December 31, 2007. Our audit also included the 2007 information in financial statement schedule included in the Index at Item 15(a). These financial statements and schedule are the responsibility of the Company’s management. Our responsibility is to express an opinion on these financial statements and schedule based on our audit.
We conducted our audit in accordance with the standards of the Public Company Accounting Oversight Board (United States). Those standards require that we plan and perform the audit to obtain reasonable assurance about whether the financial statements are free of material misstatement. An audit includes examining, on a test basis, evidence supporting the amounts and disclosures in the financial statements. An audit also includes assessing the accounting principles used and significant estimates made by management, as well as evaluating the overall financial statement presentation. We believe that our audit provides a reasonable basis for our opinion.
In our opinion, the financial statements referred to above present fairly, in all material respects, the consolidated results of their operations and cash flows of APP Pharmaceuticals, Inc. and subsidiaries for the year ended December 31, 2007, in conformity with U.S. generally accepted accounting principles. Also, in our opinion, the 2007 information in the related financial statement schedule, when considered in relation to the basic financial statements taken as a whole, presents fairly in all material respects the information set forth therein.
/s/ Ernst & Young LLP
Chicago, Illinois
March 17, 2008
44
Table of Contents
Fresenius Kabi Pharmaceuticals Holding, Inc.
Consolidated Balance Sheets
| December 31, 2009 |
December 31, 2008 |
|||||||||
| (in thousands, except share data) | ||||||||||
| Assets |
||||||||||
| Current assets: |
||||||||||
| Cash and cash equivalents |
$ | 10,469 | $ | 8,441 | ||||||
| Note receivable from Parent |
— | 33,800 | ||||||||
| Accounts receivable, net |
85,517 | 81,630 | ||||||||
| Inventories |
212,065 | 170,354 | ||||||||
| Prepaid expenses and other current assets |
31,606 | 19,756 | ||||||||
| Current receivables from related parties |
1,219 | — | ||||||||
| Income taxes receivable |
51,963 | 25,291 | ||||||||
| Deferred income taxes |
18,880 | 13,367 | ||||||||
| Total current assets |
411,719 | 352,639 | ||||||||
| Property, plant and equipment, net |
129,784 | 150,693 | ||||||||
| Intangible assets, net |
506,215 | 534,304 | ||||||||
| Goodwill |
3,664,371 | 3,662,126 | ||||||||
| Deferred financing costs |
117,166 | 103,793 | ||||||||
| Non-current receivables from related parties |
— | 27,832 | ||||||||
| Other non-current assets, net |
29,430 | 6,359 | ||||||||
| Total assets |
$ | 4,858,685 | $ | 4,837,746 | ||||||
| Liabilities and stockholder’s equity |
||||||||||
| Current liabilities: |
||||||||||
| Accounts payable |
$ | 53,238 | $ | 38,777 | ||||||
| Accrued liabilities |
57,320 | 48,139 | ||||||||
| Current payables to related parties |
9,914 | 2,129 | ||||||||
| Accrued intercompany interest |
47,141 | 26,640 | ||||||||
| Current portion of long-term debt |
76,475 | 43,719 | ||||||||
| Current portion of intercompany debt |
441,511 | 99,892 | ||||||||
| Total current liabilities |
685,599 | 259,296 | ||||||||
| Long-term debt |
844,969 | 953,781 | ||||||||
| Deferred income taxes, non-current |
77,593 | 81,889 | ||||||||
| Fair value of interest rate swaps with Parent and affiliates |
53,188 | 69,332 | ||||||||
| Intercompany note payable to Parent and affiliates |
2,591,693 | 2,764,541 | ||||||||
| Intercompany payable to Parent and affiliates |
— | 97,996 | ||||||||
| CVR payable |
48,976 | 57,138 | ||||||||
| Other non-current liabilities |
17,591 | 3,049 | ||||||||
| Total liabilities |
4,319,609 | 4,287,022 | ||||||||
| Stockholder’s equity: |
||||||||||
| Common stock - $0.001 par value; 1,000 shares authorized issued and outstanding in 2009 and 2008 |
— | — | ||||||||
| Additional paid-in capital |
900,379 | 900,019 | ||||||||
| Accumulated deficit |
(342,830 | ) | (312,445 | ) | ||||||
| Accumulated other comprehensive loss |
(18,473 | ) | (36,850 | ) | ||||||
| Total stockholder’s equity |
539,076 | 550,724 | ||||||||
| Total liabilities and stockholder’s equity |
$ | 4,858,685 | $ | 4,837,746 | ||||||
See accompanying notes to consolidated financial statements
45
Table of Contents
Fresenius Kabi Pharmaceuticals Holding, Inc.
Consolidated Statements of Operations
| (Successor) | (Predecessor) | |||||||||||||||||
| Year ended December 31 |
July 2 through December 31 |
January 1 through September 9 |
||||||||||||||||
| 2009 | 2008 | 2008 | 2007 | |||||||||||||||
| (in thousands) | ||||||||||||||||||
| Net revenue |
$ | 888,686 | $ | 280,836 | $ | 495,797 | $ | 647,374 | ||||||||||
| Cost of sales |
453,557 | 173,074 | 247,637 | 332,046 | ||||||||||||||
| Gross profit |
435,129 | 107,762 | 248,160 | 315,328 | ||||||||||||||
| Operating expenses: |
||||||||||||||||||
| Research and development |
28,277 | 16,352 | 35,133 | 46,497 | ||||||||||||||
| Selling, general and administrative |
89,994 | 31,374 | 62,896 | 90,229 | ||||||||||||||
| Write-off of merger in-process research and development |
— | 365,700 | — | — | ||||||||||||||
| Amortization of merger-related intangibles |
36,650 | 11,209 | 10,283 | 15,418 | ||||||||||||||
| Impairment of fixed assets |
5,372 | — | — | — | ||||||||||||||
| Merger related costs |
1,447 | 2,529 | 44,220 | — | ||||||||||||||
| Separation related costs |
625 | 142 | 2,239 | 3,024 | ||||||||||||||
| Total operating expenses |
162,365 | 427,306 | 154,771 | 155,168 | ||||||||||||||
| Income (loss) from operations |
272,764 | (319,544 | ) | 93,389 | 160,160 | |||||||||||||
| Interest expense |
(83,185 | ) | (52,585 | ) | (45,124 | ) | (25,162 | ) | ||||||||||
| Intercompany interest expense |
(248,956 | ) | (66,690 | ) | — | — | ||||||||||||
| Unrealized gain in the fair value of contingent value rights |
8,163 | 101,216 | — | — | ||||||||||||||
| Interest income and other, net |
3,379 | (1,233 | ) | 1,593 | 2,182 | |||||||||||||
| (Loss) income from continuing operations before income taxes |
(47,835 | ) | (338,836 | ) | 49,858 | 137,180 | ||||||||||||
| (Benefit) provision for income taxes |
(17,450 | ) | (26,391 | ) | 40,315 | 55,001 | ||||||||||||
| (Loss) income from continuing operations |
(30,385 | ) | (312,445 | ) | 9,543 | 82,179 | ||||||||||||
| Loss from discontinued operations, net of taxes |
— | — | — | (47,821 | ) | |||||||||||||
| Net (loss) income |
$ | (30,385 | ) | $ | (312,445 | ) | $ | 9,543 | $ | 34,358 | ||||||||
| The composition of stock-based compensation from continuing operations included above is as follows: |
||||||||||||||||||
| Cost of sales |
$ | — | $ | — | $ | 1,275 | $ | 2,502 | ||||||||||
| Research and development |
— | — | 436 | 602 | ||||||||||||||
| Selling, general and administrative |
360 | 19 | 4,039 | 8,977 | ||||||||||||||
| $ | 360 | $ | 19 | $ | 5,750 | $ | 12,081 | |||||||||||
See accompanying notes to consolidated financial statements
46
Table of Contents
Fresenius Kabi Pharmaceuticals Holding, Inc.
Consolidated Statements of Stockholder’s Equity (Deficit)
Years Ended December 31, 2009, 2008 and 2007
|
Common Stock |
Additional Paid-in Capital |
Retained Earnings (Deficit) |
Other Comprehensive Income (Loss) |
Treasury Stock | Total | |||||||||||||||||||||||||
| Shares | Amount | Shares | Amount | |||||||||||||||||||||||||||
| (in thousands, except share data) | ||||||||||||||||||||||||||||||
| Predecessor: |
||||||||||||||||||||||||||||||
| Balance, January 1, 2007 |
165,928,134 | $ | 166 | $ | 1,085,196 | $ | 4,483 | $ | 1,257 | (6,705,116 | ) | $ | (57,741 | ) | $ | 1,033,361 | ||||||||||||||
| Distribution of New Abraxis |
(1,173,518 | ) | (25,043 | ) | (773 | ) | — | — | (1,199,334 | ) | ||||||||||||||||||||
| Exercise of stock options |
439,325 | 3,450 | — | — | — | — | 3,450 | |||||||||||||||||||||||
| Issuance of stock for employee retirement and stock purchase plan |
220,010 | — | 3,801 | — | — | — | — | 3,801 | ||||||||||||||||||||||
| Unrestricted stock vesting and stock options forfeited |
127,375 | — | (2,611 | ) | — | — | — | — | (2,611 | ) | ||||||||||||||||||||
| Retirement of common stock |
— | — | — | (83 | ) | — | — | — | (83 | ) | ||||||||||||||||||||
| Purchase/(retirement) of treasury stock |
(6,689,148 | ) | (6 | ) | (57,735 | ) | — | — | 6,705,116 | 57,741 | — | |||||||||||||||||||
| Legal settlement |
43,500 | — | 14,763 | — | — | — | — | 14,763 | ||||||||||||||||||||||
| Stock compensation expense |
— | — | 28,136 | — | — | — | — | 28,136 | ||||||||||||||||||||||
| Tax benefit of stock compensation plans |
— | — | 1,083 | — | — | — | — | 1,083 | ||||||||||||||||||||||
| Tax benefit of licensing agreement |
— | — | 1,078 | — | — | — | — | 1,078 | ||||||||||||||||||||||
| Comprehensive income: |
— | — | — | — | — | — | — | |||||||||||||||||||||||
| Net income |
— | — | — | 34,358 | — | — | — | 34,358 | ||||||||||||||||||||||
| Unrealized loss on available-for-sale securities, net of tax |
— | — | — | — | (460 | ) | — | — | (460 | ) | ||||||||||||||||||||
| Foreign currency translation adjustments |
— | — | — | — | 2,687 | — | — | 2,687 | ||||||||||||||||||||||
| Comprehensive income |
— | — | — | — | — | — | — | 36,585 | ||||||||||||||||||||||
| Balance, December 31, 2007 |
160,069,196 | $ | 160 | $ | (96,357 | ) | $ | 13,715 | $ | 2,711 | — | — | $ | (79,771 | ) | |||||||||||||||
| Exercise of stock options |
849,853 | 1 | 7,431 | — | — | — | — | 7,431 | ||||||||||||||||||||||
| Unrestricted stock vesting and stock options forfeited |
68,149 | — | 46 | — | — | — | — | 46 | ||||||||||||||||||||||
| Stock compensation expense |
— | — | 5,276 | — | — | — | — | 5,276 | ||||||||||||||||||||||
| Unvested restricted stock under RSU II plan |
— | — | 1,596 | — | — | — | — | 1,596 | ||||||||||||||||||||||
| Tax benefit of disqualifying disposition |
— | — | 1,509 | — | — | — | — | 1,509 | ||||||||||||||||||||||
| Comprehensive income: |
— | — | — | — | — | — | — | |||||||||||||||||||||||
| Net income |
— | — | — | 9,543 | — | — | — | 9,543 | ||||||||||||||||||||||
| Foreign currency translation adjustments |
— | — | — | — | (2,302 | ) | — | — | (2,302 | ) | ||||||||||||||||||||
| Comprehensive income |
— | — | — | — | — | — | — | 7,241 | ||||||||||||||||||||||
| Predecessor: |
||||||||||||||||||||||||||||||
| Balance, September 9, 2008 |
160,987,198 | $ | 161 | $ | (80,499 | ) | $ | 23,258 | $ | 409 | — | — | $ | (56,671 | ) | |||||||||||||||
| Successor: |
||||||||||||||||||||||||||||||
| Balance, July 2, 2008 |
— | — | — | — | — | — | — | — | ||||||||||||||||||||||
| Capital contribution from Fresenius Kabi AG |
1,000 | — | 900,000 | — | — | — | — | 900,000 | ||||||||||||||||||||||
| Stock compensation expense |
— | — | 19 | — | — | — | — | 19 | ||||||||||||||||||||||
| Comprehensive income: |
||||||||||||||||||||||||||||||
| Net Loss |
— | — | — | (312,445 | ) | — | — | — | (312,445 | ) | ||||||||||||||||||||
| Unrealized loss on Intercompany interest rate swap, net of $20,308 tax benefit |
— | — | — | — | (32,338 | ) | — | — | (32,338 | ) | ||||||||||||||||||||
47
Table of Contents
|
Common Stock |
Additional Paid-in Capital |
Retained Earnings (Deficit) |
Other Comprehensive Income (Loss) |
Treasury Stock | Total | |||||||||||||||||||
| Shares | Amount | Shares | Amount | |||||||||||||||||||||
| (in thousands, except share data) | ||||||||||||||||||||||||
| Foreign currency translation adjustments |
— | — | — | — | (4,512 | ) | — | — | (4,512 | ) | ||||||||||||||
| Comprehensive loss |
— | — | — | — | — | — | — | (349,295 | ) | |||||||||||||||
| Balance, December 31, 2008 |
1,000 | $ | — | $ | 900,019 | $ | (312,445 | ) | $ | (36,850 | ) | — | — | $ | 550,724 | |||||||||
| Stock compensation expense |
— | — | 360 | — | — | — | — | 360 | ||||||||||||||||
| Comprehensive income: |
||||||||||||||||||||||||
| Net Loss |
— | — | — | (30,385 | ) | — | — | — | (30,385 | ) | ||||||||||||||
| Unrealized gain on Intercompany interest rate swap, net of $6,235 tax |
— | — | — | — | 10,074 | — | — | 10,074 | ||||||||||||||||
| Foreign currency translation adjustments |
— | — | — | — | 5,216 | — | — | 5,216 | ||||||||||||||||
| Unrealized gain on foreign currency fair value hedges, net of $1,928 tax |
— | — | — | — | 3,087 | — | — | 3,087 | ||||||||||||||||
| Comprehensive loss |
— | — | — | — | — | — | — | (12,008 | ) | |||||||||||||||
| Balance, December 31, 2009 |
1,000 | $ | — | $ | 900,379 | $ | (342,830 | ) | $ | (18,473 | ) | — | — | $ | 539,076 | |||||||||
See accompanying notes to consolidated financial statements
48
Table of Contents
Fresenius Kabi Pharmaceuticals Holding, Inc.
Consolidated Statements of Cash Flows
| (Successor) | (Predecessor) | |||||||||||||||||
| Year Ended December 31, 2009 |
July 2 through December 31, 2008 |
January 1 through September 9, 2008 |
Year Ended December 31, 2007 |
|||||||||||||||
| (in thousands) | ||||||||||||||||||
| Cash flows from operating activities: |
||||||||||||||||||
| Net (loss) income from continuing operations |
$ | (30,385 | ) | $ | (312,445 | ) | $ | 9,543 | $ | 82,179 | ||||||||
| Net loss from discontinued operations, net of taxes |
— | — | — | (47,821 | ) | |||||||||||||
| Net (loss) income |
(30,385 | ) | (312,445 | ) | 9,543 | 34,358 | ||||||||||||
| Adjustments to reconcile net (loss) income to net cash (used in) provided by operating activities: |
||||||||||||||||||
| Depreciation |
17,841 | 6,896 | 12,503 | 28,460 | ||||||||||||||
| Amortization |
1,535 | 24 | 1,633 | 1,796 | ||||||||||||||
| Amortization of product rights |
— | 17 | 10,960 | 16,440 | ||||||||||||||
| Amortization of merger related inventory step-up |
— | 45,465 | — | — | ||||||||||||||
| Merger related research and development charge |
— | 365,700 | — | — | ||||||||||||||
| Amortization of merger related intangibles |
36,650 | 11,208 | 10,284 | 50,811 | ||||||||||||||
| Amortization of loan fees |
39,422 | 19,727 | — | — | ||||||||||||||
| Change in the fair value of contingent value rights |
(8,162 | ) | (101,216 | ) | — | — | ||||||||||||
| Write-off of deferred financing fees |
14,661 | 12,241 | — | — | ||||||||||||||
| Stock-based compensation |
360 | 19 | 5,749 | 28,598 | ||||||||||||||
| Non-cash issuance for legal expenses |
— | — | — | 14,763 | ||||||||||||||
| Loss on disposal of property, plant and equipment |
303 | 19 | 87 | 797 | ||||||||||||||
| Excess tax benefit from stock-based compensation |
— | — | (493 | ) | (1,083 | ) | ||||||||||||
| Unrealized foreign currency (gain)/loss |
(4,308 | ) | 1,527 | — | — | |||||||||||||
| Stock option grants/forfeitures |
— | — | (328 | ) | (2,611 | ) | ||||||||||||
| Deferred income taxes |
(13,601 | ) | (3,270 | ) | (2,054 | ) | (10,142 | ) | ||||||||||
| Impairment of fixed assets |
5,372 | — | — | — | ||||||||||||||
| Equity in net income of Drug Source Company, LLC, net of dividends received |
— | — | — | (3,291 | ) | |||||||||||||
| Other non cash charges |
169 | — | — | — | ||||||||||||||
| Changes in operating assets and liabilities: |
||||||||||||||||||
| Accounts receivable, net |
(7,535 | ) | (7,253 | ) | 5,816 | (42,199 | ) | |||||||||||
| Income tax receivable |
12,109 | — | — | — | ||||||||||||||
| Inventories |
(42,989 | ) | 11,181 | (32,344 | ) | (12,165 | ) | |||||||||||
| Prepaid expenses and other current, non-current assets |
683 | 5,045 | (1,460 | ) | (7,900 | ) | ||||||||||||
| Current receivables from related parties |
(1,219 | ) | — | — | — | |||||||||||||
| Non-current receivables (due to) from related parties |
27,832 | — | 37,223 | (6,997 | ) | |||||||||||||
| Deferred revenue |
— | — | — | (33,945 | ) | |||||||||||||
| Minimum royalties payable |
— | — | — | (984 | ) | |||||||||||||
| Current payables to related parties |
7,785 | — | — | — | ||||||||||||||
| Intercompany payable Parent and affiliates |
(97,717 | ) | — | — | — | |||||||||||||
| Accrued intercompany interest |
30,406 | — | — | — | ||||||||||||||
| Other non-current liabilities |
2,776 | — | 314 | 2,607 | ||||||||||||||
| Income taxes payable |
— | (44,970 | ) | 6,696 | (80,031 | ) | ||||||||||||
| Accounts payable, accrued expenses |
21,307 | (46,957 | ) | 41,386 | 35,071 | |||||||||||||
| Net cash (used in) provided by operating activities |
13,295 | (37,042 | ) | 105,515 | 12,353 | |||||||||||||
| Cash flows from investing activities: |
||||||||||||||||||
| Purchases of property, plant and equipment |
(16,723 | ) | (24,703 | ) | (13,039 | ) | (86,160 | ) | ||||||||||
| Purchases of intangible assets |
(10,097 | ) | (750 | ) | (800 | ) | (2,862 | ) | ||||||||||
| Proceeds from sale of fixed assets |
154 | — | — | — | ||||||||||||||
| Proceeds from (payments for) investment with related parties |
33,800 | (33,800 | ) | — | — | |||||||||||||
| Assets acquired, net of cash |
(12,697 | ) | (3,624,215 | ) | — | — | ||||||||||||
| Net cash used in investing activities |
(5,563 | ) | (3,683,468 | ) | (13,839 | ) | (89,022 | ) | ||||||||||
| Cash flows from financing activities |
||||||||||||||||||
| Proceeds from the exercise of stock options the sale of stock under employee retirement and stock purchase plan |
— | — | 7,815 | 7,251 | ||||||||||||||
| Proceeds of borrowings under unsecured credit facility, net |
25,283 | — | — | — | ||||||||||||||
| Proceeds of borrowings under secured credit facility, net |
31,281 | — | — | — | ||||||||||||||
| Proceeds from issuance of debt |
— | 3,856,451 | — | 1,366,000 | ||||||||||||||
| Notes payable |
— | — | — | (66,735 | ) | |||||||||||||
| Excess tax benefit from stock-based compensation |
— | — | 493 | 1,083 | ||||||||||||||
| Repayment of borrowings |
— | (997,500 | ) | (2,500 | ) | (531,000 | ) | |||||||||||
| Payment of deferred financing costs excluding amount paid by Fresenius |
(67,456 | ) | (25,523 | ) | (792 | ) | (13,275 | ) | ||||||||||
| Equity contribution from Fresenius |
— | 900,000 | — | — | ||||||||||||||
| Separation asset transfer |
— | — | — | (696,431 | ) | |||||||||||||
| Net cash (used) provided by financing activities |
(10,892 | ) | 3,733,428 | 5,016 | 66,893 | |||||||||||||
| Effect of exchange rates on cash |
5,188 | (4,477 | ) | (2,283 | ) | 2,267 | ||||||||||||
49
Table of Contents
| (Successor) | (Predecessor) | |||||||||||||||
| Year Ended December 31, 2009 |
July 2 through December 31, 2008 |
January 1 through September 9, 2008 |
Year Ended December 31, 2007 |
|||||||||||||
| (in thousands) | ||||||||||||||||
| Net increase (decrease) in cash and cash equivalents |
2,028 | 8,441 | 94,409 | (7,509 | ) | |||||||||||
| Cash and cash equivalents, beginning of period |
8,441 | — | 31,788 | 39,297 | ||||||||||||
| Cash and cash equivalents, end of period |
$ | 10,469 | $ | 8,441 | $ | 126,197 | $ | 31,788 | ||||||||
| Supplemental disclosure of cash flow information: |
||||||||||||||||
| Cash paid for interest |
257,487 | 53,927 | 47,008 | 17,552 | ||||||||||||
| Cash (received) paid for income taxes, net of refunds |
(19,166 | ) | 6,135 | 45,270 | 122,501 | |||||||||||
| Supplemental disclosure of noncash investing and financing activities: |
||||||||||||||||
| Intercompany principal and interest payments made on Company’s behalf, net |
9,906 | — | — | — | ||||||||||||
See accompanying notes to consolidated financial statements
50
Table of Contents
Fresenius Kabi Pharmaceuticals Holding, Inc.
Notes to Consolidated Financial Statements
December 31, 2009
1. Description of Business and Basis of Presentation
We are an integrated pharmaceutical company that develops, manufactures and markets injectable pharmaceutical products. We believe that we are the only company with a primary focus on the injectable oncology, anti-infective, anesthetic/analgesic and critical care markets. We believe that we offer one of the most comprehensive injectable product portfolios in the pharmaceutical industry. We manufacture products in each of the three basic forms in which injectable products are sold: liquid, powder and lyophilized, or freeze-dried.
Our products are generally used in hospitals, long-term care facilities, alternate care sites and clinics within North America. Unlike the retail pharmacy market for oral products, the injectable pharmaceuticals marketplace is largely made up of end users who have relationships with group purchasing organizations, or GPOs, and/or specialty distributors who distribute products within a particular end-user market, such as oncology clinics. GPOs and specialty distributors generally enter into collective product purchasing agreements with pharmaceutical suppliers like us in an effort to secure more favorable drug pricing on behalf of their members.
Fresenius Kabi Pharmaceuticals Holding, Inc. is a wholly-owned subsidiary of Fresenius Kabi AG, and an indirect wholly-owned subsidiary of Fresenius SE (“Fresenius” or “Parent Company”), a societas europaea organized under the laws of Germany. FKP Holdings was formed on July 2, 2008, in order to facilitate the acquisition of APP Pharmaceuticals, Inc. (“APP or the Predecessor”) discussed below. See Note 3 to the consolidated financial statements – Merger with APP for details.
On September 10, 2008, FKP Holdings completed the acquisition of APP (the “Merger”) pursuant to an Agreement and Plan of Merger dated July 6, 2008 (the “Merger Agreement”), and APP became a wholly-owned subsidiary of FKP Holdings. Effective with the Merger, each outstanding share of common stock of APP and certain stock options and restricted stock units of APP were converted into the right to receive $23.00 in cash, without interest, and one Contingent Value Right (“CVR”), issued by FKP Holdings and representing the right to receive a cash payment, without interest, of up to $6.00 determined in accordance with the terms of the CVR Agreement. Refer to Note 4 to the consolidated financial statements — Contingent Value Rights (CVR), for further details. The aggregate consideration paid in the Merger was $4,908.1 million, including $997.5 million in assumed APP debt. We incurred $3,856 million in new external and intercompany debt due to Fresenius and its affiliates in connection with the Merger, the aggregate proceeds of which were used to pay the Merger consideration, repay a portion of APP’s then outstanding indebtedness and pay fees and expenses related to the Merger. Fresenius has committed to the Company that it will provide financial support to FKP Holdings sufficient for it to satisfy its obligations and debt service requirements arising under all existing financing instruments, entered into in connection with the Merger, and to which the Company is a party, as they come due until at least January 1, 2011.
The results of APP’s operations have been included in the consolidated financial statements of FKP Holdings since September 10, 2008. APP is a fully-integrated pharmaceutical company that develops, manufactures and markets injectable pharmaceutical products with a primary focus on the oncology, anti-infective, anesthetic/analgesic and critical care markets. APP manufactures a comprehensive range of dosage formulations, and its products are used in hospitals, long-term care facilities, alternate care sites and clinics within North America. The Merger is an important step in Fresenius’ growth strategy. Through the merger with APP, Fresenius gains entry to the U.S. pharmaceuticals market and achieves a leading position in the global I.V. generics industry. The North American platform also provides further growth opportunities for Fresenius’ existing product portfolio.
Prior to the Merger, FKP Holdings had not carried on any activities or operations except for those activities incidental to its formation and in connection with the transactions related to the Merger. Following the Merger, the business of FKP Holdings consists exclusively of that of APP. Accordingly, for accounting purposes FKP Holdings is considered the successor to APP and these consolidated financial statements are presented for two distinct periods: the periods preceding the Merger, or “predecessor” periods (all periods prior to September 10, 2008), and the period after the merger, or “successor” period (from the inception of FKP Holdings on July 2, 2008, which includes the results of APP from September 10, 2008, the date of acquisition). The Company applied purchase accounting to the opening balance sheet on September 10, 2008. The Merger resulted in a new basis of accounting for the assets acquired and liabilities assumed in connection with the acquisition of APP beginning on September 10, 2008. As a result of the acquisition and the application of purchase accounting as described above, the consolidated financial information for the period after the acquisition is presented on a different basis than that for the periods before the acquisition and, therefore, is not comparable.
51
Table of Contents
2. Summary of Significant Accounting Policies
Consolidation
The accompanying consolidated successor period financial statements of FKP Holdings include the accounts of the Company and its majority-owned subsidiaries, including the assets, liabilities and results of operations of APP and its wholly owned subsidiaries (Pharmaceutical Partners of Canada, Inc. and APP Pharmaceuticals Manufacturing, LLC) from the date of the Merger. The accompanying consolidated predecessor period financial statements include the accounts of APP Pharmaceuticals, Inc. and its majority-owned subsidiaries. All significant intercompany balances and transactions have been eliminated in consolidation.
In 2006, American Pharmaceutical Partners, Inc. (“Old APP”) completed a merger with American BioScience Inc. (or “ABI”), Old APP’s former parent. In connection with the closing of that merger, Old APP’s certificate of incorporation was amended to change its name to Abraxis BioScience, Inc. (“Old Abraxis”). On November 13, 2007, Old Abraxis separated into two independent publicly-traded companies. New APP, which operated the hospital-based business under the name APP Pharmaceuticals, Inc., and New Abraxis, which operated the proprietary business under the name Abraxis BioScience, Inc. Accordingly, the historical operating results of Old Abraxis through the date of the separation are presented as discontinued operations. Refer to Note 6—Discontinued Operations - Spin-off of New Abraxis, for further details.
Fiscal Year
Both the Company and the Predecessor use a calendar fiscal year, beginning on January 1 and ending on December 31.
Reclassifications
Certain prior year amounts have been reclassified to conform to the current year presentation.
Use of Estimates
The preparation of financial statements in conformity with accounting principles generally accepted in the United States requires management to make estimates and assumptions that affect the reported amounts of assets and liabilities and the disclosure of contingent assets and liabilities at the date of the consolidated financial statements. Estimates may also affect the reported amounts of revenues and expenses during the reporting period. Actual results could differ from these estimates, but management does not believe such differences will materially affect the Company’s financial position, results of operations or cash flows. Significant items subject to such estimates and assumptions include the measurement of fair values in purchase accounting; provisions and reserves for chargebacks, contractual allowances, returns, credits, and cash discounts; the recoverability of inventory pending regulatory approval and the net realizable value of inventory; the carrying amount of property, plant and equipment, intangibles and goodwill; the valuation of deferred income tax assets; and liabilities for self-insured obligations and other contingencies.
Cash, Cash Equivalents and Short-term Investments
Cash and cash equivalents include investments having a maturity of three months or less at the time of acquisition. These short-term investments consist of highly-liquid, debt instruments that are recorded at cost. Since the Merger, excess cash not needed for current operations has been invested in short-term debt instruments issued by the Parent through its centralized cash management system. Income earned on short-term investments is recorded as interest income.
Accounts Receivable and Concentration of Credit Risk
Accounts receivable relate primarily to amounts owed by customers for trade sales of products. We typically enter into multi-year contractual agreements with GPOs and individual hospital groups to supply our products to end-user hospital and alternate site customers. As is traditional in the pharmaceutical industry, a significant amount of our generic pharmaceutical products are sold to end users under GPO contracts through a limited number of drug wholesalers, which comprise the primary pharmaceutical distribution chain in the United States. Collectively, and approximately proportionately, three of these wholesalers represented approximately 82% and 84% of accounts receivable at December 31, 2009 and 2008, respectively. An allowance for doubtful accounts is recorded to provide for estimated losses resulting from uncollectible accounts, and is the Company’s best estimate of the amount of probable credit losses in the Company’s existing accounts receivable. To help control our credit exposure, we routinely monitor the creditworthiness of all of our customers, review outstanding customer balances for collectability and record allowances for bad debts as necessary. Historical credit losses have been insignificant.
52
Table of Contents
Inventories
Inventories are stated at the lower of cost or market (net realizable value). Cost is determined under the first-in, first-out, or FIFO, method. Inventories consist of the following at December 31, 2009 and 2008:
| December 31, 2009 | December 31, 2008 | |||||||||||||||||||
| Approved | Pending Regulatory Approval |
Total Inventory |
Approved | Pending Regulatory Approval |
Total Inventory | |||||||||||||||
| (in thousands) | ||||||||||||||||||||
| Finished goods |
$ | 70,551 | 16,733 | $ | 87,284 | $ | 72,677 | — | $ | 72,677 | ||||||||||
| Work in process |
27,934 | 1,499 | 29,433 | 16,574 | 1,512 | 18,086 | ||||||||||||||
| Raw materials |
90,476 | 4,872 | 95,348 | 75,482 | 4,109 | 79,561 | ||||||||||||||
| $ | 188,961 | $ | 23,104 | $ | 212,065 | $ | 164,733 | $ | 5,621 | $ | 170,354 | |||||||||
Inventories consist of products currently approved for marketing and costs related to certain products that are pending regulatory approval. From time to time, we capitalize inventory costs associated with products prior to regulatory approval based on our judgment of probable future regulatory approval, commercial success and realizable value. Such judgment incorporates our knowledge and best judgment of where the product is in the regulatory review process, our required investment in the product, market conditions, competing products and our economic expectations for the product post-approval relative to the risk of manufacturing the product prior to approval. If final regulatory approval for such products is denied or delayed, we revise our estimates and judgments about the recoverability of the capitalized costs and, where required, provide reserves for or write-off such inventory in the period those estimates and judgments change.
At December 31, 2009 and December 31, 2008, inventory included $23.1 million and $5.6 million, respectively, in costs related to products pending FDA approval.
We routinely review our inventory and establish reserves when the cost of the inventory is not expected to be recovered or the cost of a product exceeds estimated net realizable market value. In instances where inventory is at or approaching expiration, is not expected to be saleable based on our quality and control standards or is selling for a price below cost, we reserve for any inventory impairment based on the specific facts and circumstances. Provisions for inventory reserves are reflected in the consolidated financial statements as an element of cost of sales; inventories are presented net of related reserves.
Property, Plant and Equipment
Property, plant and equipment is stated on the basis of cost or allocated acquisition value. Provisions for depreciation are computed for financial reporting purposes using the straight-line method over the estimated useful life of the related asset; leasehold improvements are amortized over the lesser of the estimated useful life of the related asset or the term of the related lease. Amortization of leasehold improvements is included in depreciation expense. The estimated useful lives of assets are as follows:
| Buildings and improvements |
7-30 years | |
| Machinery and equipment |
3-10 years | |
| Furniture and fixtures |
5-7 years |
Depreciation expense from continuing operations was $17.8 million in 2009, $6.9 million in the 2008 successor period and $12.5 million in the 2008 predecessor period (a total of $19.4 million in 2008), and $28.5 million for the period ended December 31, 2007.
53
Table of Contents
Property, plant, and equipment consists of the following:
| December 31, | ||||||||||
| 2009 | 2008 | |||||||||
| (in thousands) | ||||||||||
| Land |
$ | 4,472 | $ | 3,672 | ||||||
| Building and improvements |
44,065 | 42,480 | ||||||||
| Machinery and equipment |
41,998 | 44,680 | ||||||||
| Furniture and fixtures |
27,560 | 25,498 | ||||||||
| Construction in progress |
36,470 | 41,308 | ||||||||
| 154,565 | 157,638 | |||||||||
| Less allowance for depreciation |
(24,781 | ) | (6,945 | ) | ||||||
| $ | 129,784 | $ | 150,693 | |||||||
Long-lived assets are evaluated periodically to determine if adjustment to the depreciation and amortization period or to the unamortized balance is warranted. Such evaluation is based principally on the expected utilization of the long-lived assets. We test for impairment of long-lived assets whenever events or changes in circumstances indicate that the carrying value of an asset or asset group may not be recoverable by comparing the carrying value to the sum of the estimated undiscounted future cash flows expected to result from the operation and eventual disposition of the asset group. If the sum of the undiscounted future cash flows is less than the carrying value, the fair value of the asset group is estimated. The amount of impairment is calculated by subtracting the estimated fair value of the asset group from the carrying value of the asset group.
Maintenance and repairs of property and equipment are expensed as incurred. We capitalize replacements and improvements that increase the estimated useful life or productive capacity of an asset and we capitalize interest on major construction and development projects while in progress.
Gains or losses on disposition of property and equipment are recognized in interest income and other, net in the consolidated statements of operations.
Deferred Financing Costs
Costs incurred in connection with the issuance of and amendments to our credit facilities are capitalized and amortized using the effective interest method. Unamortized debt issue costs are written-off in conjunction with the refinancing or termination of the applicable debt arrangement prior to its scheduled maturity.
We capitalized deferred financing costs of approximately $162 million associated with the senior secured credit agreement entered into in connection with the 2008 Merger and $13.3 million associated with the senior secured credit agreement entered into in connection with our Predecessor’s November 2007 separation from New Abraxis. In 2009, we wrote-off $14.6 million in unamortized debt issuance costs in connection with certain modifications to our intercompany loan agreements. In the 2008 successor period we wrote-off $12.2 million of unamortized deferred financing costs related to debt repaid in that period. Amortization and write-off of debt issue costs are recognized in third party and intercompany interest expense in the consolidated statements of operations.
Goodwill and Intangible Assets
We evaluate goodwill and other intangible assets not subject to amortization for impairment annually at October 1 or more frequently whenever indicators of potential impairment exist. A significant amount of judgment is involved in determining if an indicator of impairment has occurred. Such indicators may include, among others, (i) significant decline in expected future cash flows, (ii) a sustained, significant decline in equity price and market capitalization, (iii) a significant adverse change in legal factors or in the business climate, (iv)unanticipated competition, and (v) slower growth rates. Goodwill is considered impaired when the fair value of a reporting unit is determined to be less than the carrying value including goodwill. The impairment loss is determined based on a comparison of the implied fair value of the reporting unit’s goodwill to the actual carrying value. Intangible assets not subject to amortization are considered impaired when the intangible asset’s fair value is determined to be less than the carrying value.
In performing our assessment of the carrying value of goodwill, we use the present value of estimated future cash flows to establish the estimated fair value of our reporting unit as of the testing date. This approach includes many assumptions related to future growth rates, discount rates, market comparables, control premiums and tax rates, among other considerations. Changes in economic and operating conditions impacting these assumptions could result in an impairment of goodwill in future periods. When available and as appropriate, we use comparative market multiples to corroborate the estimated fair value. In 2009 and 2008, we did not recognize any goodwill impairment, as the estimated fair value of our reporting unit with goodwill exceeded its carrying amount as of our annual testing date in both periods.
54
Table of Contents
Intangible assets subject to amortization are also evaluated for impairment periodically or when indicators of impairment are determined to exist. We test for impairment of intangible assets subject to amortization by comparing the sum of the estimated undiscounted future cash flows expected to result from the use of the asset to the carrying value. If the sum of the estimated undiscounted future cash flows is less than the carrying value, the fair value of the asset group is determined. The amount of impairment, if any, is calculated by subtracting the fair value of the asset from the carrying value of the asset. Our impairment loss calculations require us to apply judgments in estimating future cash flows and asset fair values. These judgments include those required to develop asset level projections of future cash flows and assessments of the probability that certain business scenarios will be realized.
Other intangible assets could become impaired in the future or require additional charges as a result of declines in profitability due to changes in volume, market pricing, cost, manner in which an asset is used, laws and regulations, or in the business environment. Significant adverse changes in our business environment and estimated future cash flows could cause us to record additional impairment charges in future periods which could be material.
We amortize the cost of intangible assets on a straight-line basis over the period of expected benefit, which is equal to the period over which revenues are expected to be derived from such assets (weighted average amortization period of approximately eighteen and one-half years). The ranges for the amortization periods are generally as follows:
| Years | ||
| Developed product technology |
20 | |
| Product rights |
10 | |
| Patents |
5 | |
| Contracts and other |
5 | |
| Customer relationships |
3 |
Product Revenue Recognition
We recognize revenue from the sale of a product and for contract manufacturing when title and risk of loss have transferred to the customer, collection is reasonably assured and we have no further performance obligations. This is typically when the product is received by the customer. A significant amount of our generic pharmaceutical products are sold to end users through a limited number of drug wholesalers, which comprise the primary pharmaceutical distribution chain in the United States. Sales to our three major wholesale customers comprised 75%, 70%, and 74%, of our 2009, 2008 predecessor and successor period, and 2007 net revenue, respectively.
At the time of sale, as further described below, we reduce sales and provide for estimated chargebacks, contractual allowances or customer rebates, product returns, customer credits and cash discounts. We base our estimates of required provisions and reserves for chargebacks, rebates and customer returns and credits on our historical experience. As further described below, due to the nature of our generic injectable products and their primary use in hospital and clinical settings with generally consistent demand, we believe that this historical data, in conjunction with periodic review of available third-party data, provides a reliable basis for such estimates. We regularly review information related to these estimates and adjust our provisions and reserves accordingly if, and when, actual experience differs from estimates. In 2009, we revised our methodology to estimate certain of our sales provisions to reflect the availability of new information. The methodology we used to estimate theses sales provisions was consistent across all periods presented.
Accruals for sales provisions are presented in our consolidated financial statements as a reduction of revenues and accounts receivable or, in the case of contractual allowances, in accrued liabilities. Our total sales provisions totaled $1,478.5 million in 2009 and $490.3 million in the 2008 successor period and $731.7 million in the 2008 predecessor period (a total of $1,222.0 million in 2008), and $1,080.1 million in 2007, and related reserves totaled $173.5 million and $176.5 million at December 31, 2009 and 2008, respectively.
55
Table of Contents
Chargebacks
Following industry practice, we typically sell our products to independent pharmaceutical wholesalers at wholesale list price. The wholesalers in turn sell our products to an end user, normally a hospital or alternative healthcare facility, at a lower contractual price previously established between the end user and us via a group purchasing organization, or GPO. GPOs enter into collective purchasing contracts with pharmaceutical suppliers to secure more favorable product pricing on behalf of their end-user members.
Our initial sale to the wholesaler, and the resulting receivable, are recorded at our wholesale list price. However, as our agreements with our wholesalers specify that they are entitled to a credit for the difference between the wholesale list price and the lower end-user contract price, we reduce reported sales and receivables by the difference between the wholesale list price and the estimated end-user contract price by recording a chargeback provision and reserve at the time of sale. When the wholesaler ultimately sells the product to the end user at the end-user contract price, the wholesaler charges us, via a chargeback, for the difference between the wholesale list price and the end-user contract price and such chargeback is offset against the chargeback reserve established at the time of sale. On a monthly basis, we compare our recorded chargeback reserve to our estimate of the net proceeds we will realize from the wholesaler based on the estimated ending wholesale units in the distribution channel pending chargeback and the estimated end-user selling price of those units and adjust the chargeback provision as necessary.
The determination of the estimated provision for chargebacks and the related reserve requires us to make significant estimates and judgments. The most significant estimates inherent in the measurement of the initial chargeback provision relate to the proportion of wholesale units that will ultimately be sold to an end-user with a lower-price contractual relationship with us, and the ultimate end-user contract selling price we will realize when those units are sold. We base our estimates of these factors on internal, product-specific sales and chargeback processing experience, current contract pricing, our expectation for future contract pricing changes and IMS data. In our monthly assessment of the adequacy of our recorded chargeback reserve, we consider these same factors in estimating the ending wholesale units in the distribution channel pending chargeback and the net proceeds we will realize from the wholesaler. The amount of product in the channel is comprised of product at the distributor and product that the distributor has sold to an end-user, but has yet to report as end user sales. Accordingly, in estimating the ending wholesale units in the distribution channel pending chargeback, we also must make assumptions about the time lag between the date the product is sold to the wholesaler and the date the wholesaler sells the product to the end-user customer, and between the sale date and the date that sale is reported to us enabling us to process the chargeback. Physical inventory in the channel is based on inventory data received from certain of our wholesalers; for others it is estimated based on evaluation of our monthly sales to our wholesalers and our knowledge of inventory turnover at our major wholesalers. We estimate end user sales made but not yet reported to us based on either actual chargebacks processed in the following month or the historical average number of days to process a chargeback from the date of the end user sale.
Our estimate of the chargeback provision and reserve could also be impacted by a number of market conditions that are beyond our control, including: competitive pricing, competitive products and changes impacting demand in both the distribution channel and at the level of the healthcare provider. We regularly review information related to these estimates and adjust our provisions and reserves accordingly if, and when, actual experience differs from our estimates.
Due to information constraints in the distribution channel, it has not been practical, and has not been necessary, for us to capture and quantify the impact of current versus prior year activity on the chargeback provision. Information constraints within the distribution channel primarily relate to our inability to track product through the channel on a unit or specific lot basis. In addition, for the most part, we do not receive information from our customers with respect to the level of their sales that are subject to chargeback. The lack of information on a specific lot basis precludes us from tracking actual chargeback activity to the period of its initial sale. As a result, we rely on internal data, external wholesaler and IMS data and management estimates in order to estimate the amount of inventory in the channel subject to future chargeback. We also review current year chargeback activity to determine whether changes in the provision relate to prior period sales; such changes have not been material to the consolidated statement of operations.
The provision for chargebacks is presented in our consolidated financial statements as a reduction of sales. Activity in the reserve for chargebacks for the periods included in the consolidated financial statements was as follows:
| Year Ended December 31, | ||||||||||||
| 2009 | 2008 | 2007 | ||||||||||
| (in thousands) | ||||||||||||
| Balance at beginning of period |
$ | 143,265 | $ | 100,413 | $ | 92,427 | ||||||
| Provision for chargebacks |
1,341,571 | 1,122,109 | 1,006,686 | |||||||||
| Credits or checks issued to third parties |
(1,355,834 | ) | (1,079,257 | ) | (997,968 | ) | ||||||
| Balance transferred at separation |
— | — | (732 | ) | ||||||||
| Balance at end of period |
$ | 129,002 | $ | 143,265 | $ | 100,413 | ||||||
56
Table of Contents
For the period ended December 31, 2008, our chargeback provision totaled $447.1 million in the successor period and $675.0 million in the predecessor period (a total of $1,122.1 million in 2008). The balance of this reserve accounted was not impacted by purchase accounting.
Based on the availability of new information regarding inventory in the wholesale distribution channel and the chargeback processing lag, we revised our methodology to estimate the chargeback reserve in 2009. This change in estimate reduced the estimated chargeback reserve at December 31, 2009 by approximately $5.5 million.
Contractual Allowances, Fee for Service, Returns and Credits, Cash Discounts and Bad Debts
Contractual allowances, which generally consist of rebates or administrative fees, are offered to certain wholesale customers, GPOs and end-user customers consistent with pharmaceutical industry practices. Settlement of rebates and fees due to customers generally occurs between one to fifteen (15) months from the date of sale. We establish a general reserve for contractual allowances at the time of sale based on the historical relationship between sales and such allowances. Upon receipt of request for credit, we establish a specific liability for the fees or rebates due to the customer based on the specific terms of each agreement. Contractual allowances are reflected in the consolidated financial statements as a reduction of revenue and as a current accrued liability.
From time to time we enter into inventory management agreements with our wholesale customers which require us to pay a fee in connection with their distribution of our products or their performance of other services, including for example providing us with sales data and performing other services and contractual rights for us. In addition, we may be required to enter into such agreements in the future in order to maintain our relationships with other such wholesalers. We are unable to ascertain the potential impact of the terms of any such future agreements on our sales, but do not believe that such future agreements would result in a substantial change in wholesale stocking levels of our products as compared to current levels. Fee for service provisions are reflected in the consolidated financial statements as a reduction of revenue and accounts receivable.
Consistent with industry practice, our return policy permits our customers to return products within a window of time before and after the expiration of product dating. We provide for product returns and other customer credits at the time of sale by applying historical experience factors, generally based on historic data on credits issued by credit type or product, relative to related sales and we provide specifically for identified outstanding returns and credits in the period in which they become known. The accrual for customer credits and product returns is presented in the consolidated financial statements as a reduction of revenue and accounts receivable.
We generally offer our customers a standard cash discount on our hospital-based products for prompt payments and, from time-to-time, may offer an additional discount and/or extended terms in support of product launches or other promotional programs. A provision for cash discounts is established at the time of sale based on the terms of sale and adjusted for historical experience factors regarding the level of cash discount taken. The accrual for customer discounts is presented in the consolidated financial statements as a reduction of revenue and accounts receivable.
We establish a reserve for bad debts based on general and identified customer credit exposure. Our actual losses due to bad debts were less than $0.2 million in each of 2009, 2008 and 2007.
Activity in the reserve for other sales provisions for the periods included in the consolidated financial statements was as follows:
| Year Ended December 31, | ||||||||||||
| 2009 | 2008 | 2007 | ||||||||||
| (in thousands) | ||||||||||||
| Balance at beginning of period |
$ | 33,206 | $ | 24,554 | $ | 31,650 | ||||||
| Provisions |
136,907 | 99,856 | 73,435 | |||||||||
| Credits or checks issued to third parties |
(125,677 | ) | (91,204 | ) | (74,617 | ) | ||||||
| Balance transferred at separation |
— | — | (5,914 | ) | ||||||||
| Balance at end of period |
$ | 44,436 | $ | 33,206 | $ | 24,554 | ||||||
For the period ended December 31, 2008, our other sales provisions totaled $56.7 million in the successor period and $43.1 million in the predecessor period (a total of $99.8 million in 2008). The balance of this reserve account was not impacted by purchase accounting.
57
Table of Contents
Shipping and Handling Fees and Costs
Shipping and handling fees billed to customers are recognized in revenues. Other shipping and handling costs are included in cost of sales.
Income Taxes
Income taxes are accounted for under the asset and liability method. Deferred tax assets and liabilities are recognized for the future tax consequences attributable to differences between the financial statement carrying amounts of existing assets and liabilities and their respective tax bases, as well as net operating loss and capital loss carry forwards. Deferred tax assets and liabilities are measured using enacted tax rates expected to apply to taxable income in the years in which those temporary differences are expected to be recovered or settled. The effect on deferred tax assets and liabilities of a change in tax rates is recognized in the consolidated financial statements in the period that includes the legislative enactment date.
Deferred tax assets are evaluated for recoverability at each reporting date. A valuation allowance is established for deferred tax assets that are not considered more likely than not to be recoverable based on our expectation of future taxable income.
Our company is subject to tax audits in the numerous jurisdictions in which we operate. In the normal course of business, we are subject to challenges from the IRS and other tax authorities regarding amounts of taxes due. These challenges may alter the timing or amount of taxable income or deductions, or the allocation of income among tax jurisdictions. The benefits of tax positions that are judged to be more likely than not of being sustained upon audit based on the technical merits of the tax position are recognized in the consolidated financial statements; positions that do not meet this threshold are not recognized. For tax positions that are at least more likely than not of being sustained upon audit, the largest amount of the benefit that is more likely than not of being sustained is recognized in the consolidated financial statements.
The determination of the Company’s provision for income taxes requires significant judgment, the use of estimates, and the interpretation and application of complex tax laws. Significant judgment is also required in assessing the timing and amounts of deductible and taxable items, establishing reserves for uncertain tax positions and evaluating the recoverability of deferred tax assets.
Research and Development Costs
Research and development costs are expensed as incurred or as assets are consumed and consist of costs related to pre-production manufacturing scale-up activities and related salaries and other personnel-related expenses, operating costs of equipment and facilities, depreciation, raw material and production costs and professional services.
Equity-Based Compensation
Prior to the Merger and subsequent plan termination, our Predecessor accounted for the recognition of compensation cost for all share-based payments (including employee stock options) at fair value. Effective January 1, 2006, our Predecessor used a modified version of retrospective application to determine the fair value of stock options. As a result, stock-based employee compensation for options was recorded as an expense based on the fair value method and using the straight-line attribution method to recognize share-based compensation expense over the vesting period of the award.
To determine stock-based compensation, our Predecessor used the Black-Scholes option pricing model to estimate the fair value of options granted under share-based compensation plans. The Black-Scholes option pricing model requires us to estimate a variety of factors, including the applicable risk-free rate, the expected term of the option, the volatility of the common stock and the forfeiture rate. The risk-free rate of interest for the average contractual life of an option is based on the U.S. Treasury yield curve in effect at the time of grant. The assumed dividend yield is zero as APP did not anticipate paying any dividends. The expected term of awards granted is based upon the historical exercise patterns of the participants in APP’s plans and the expected volatility is based on the historical volatility of APP’s stock over the expected term of the award. Compensation expense related to awards of restricted stock units is based upon the market price on the date of grant of the shares for which vested units may be exchanged.
Following the Merger, we terminated our stock-based compensation programs.
58
Table of Contents
Fair Value of Financial Instruments
Our financial instruments consist mainly of cash and cash equivalents, notes receivable from Parent, accounts receivable, accounts payable, borrowings under our credit facility, intercompany loans and currency and interest rate swap agreements, and our outstanding contingent value rights. Cash equivalents are stated at cost which approximates fair value. Notes receivable from Parent are stated at cost which approximates market value due to the short maturity of these instruments. At December 31, 2009 and 2008, the carrying amounts of other items comprising current assets and current liabilities approximate fair value due to the short-term nature of these financial instruments. The interest rates on borrowings under the bank credit facility and intercompany loan agreements are revised periodically to reflect changes in market interest rates; as such, the carrying amounts of these obligations approximate fair value. Our currency and interest rate swap agreements and our outstanding contingent value rights are reflected in the accompanying consolidated financial statements at fair value.
Foreign Currency Translation
Local currencies are considered the functional currencies for the Company’s operations outside the United States. Assets and liabilities of foreign operations are translated into U.S. dollars at the rate of exchange in effect at the balance sheet date with the related translation adjustments reported in stockholders’ equity as a component of accumulated other comprehensive income (loss). Revenues and expenses are translated into U.S. dollars at average monthly exchange rates prevailing during the year. Foreign currency transaction gains and losses related to assets and liabilities that are denominated in a currency other than the functional currency are reported in the consolidated statements of operations in the period they occur.
Derivative Instruments and Hedging Activities
The Company records all derivative instruments on the balance sheet at fair value. Changes in the fair value of derivative instruments are included in operations or deferred in accumulated other comprehensive income (loss), depending on whether a derivative is designated as, and is effective as, a hedge and on the type of hedging transaction. Changes in fair value of derivatives that are designated as cash flow hedges are deferred in accumulated other comprehensive income (loss) until the underlying hedged transactions are recognized in operations, at which time any deferred hedging gains or losses are also recorded in operations. If a derivative instrument is designated as a fair value hedge, changes in the fair value of the instrument are reported in interest income and other, net in the consolidated statements of operations, and offset the change in fair value of the hedged assets, liabilities or firm commitments. The ineffective portion of an instrument’s change in fair value is immediately recognized in interest income and other, net. Instruments that do not meet the criteria for hedge accounting or for which the Company has not elected hedge accounting are marked to fair value each period with unrealized gains or losses reported in interest income and other, net.
RECENT ACCOUNTING PRONOUNCEMENTS
Recently Issued Accounting Pronouncements
In June 2009, the Financial Accounting Standards Board (“FASB”) issued guidance that eliminates the exceptions to the rules requiring consolidation of qualifying special-purpose entities (the “QSPE”) which means more entities will be subject to consolidation assessments and reassessments. The guidance also requires ongoing reassessment of whether a company is the primary beneficiary of a variable interest entity (“VIE”) and clarifies characteristics that identify a VIE. In addition, additional disclosures about a company’s involvement with a VIE and any significant changes in risk exposure due to that involvement are required. This guidance is effective for the Company beginning in 2010. The Company is currently evaluating the impact of the adopting this guidance but does not anticipate it will have a material impact on our results of operations or financial condition.
Recently Adopted Accounting Pronouncements
In June 2009, the FASB issued Statement No. 168, “The FASB Accounting Standards Codification and the Hierarchy of Generally Accepted Accounting Principles-a replacement of FASB Statement No. 162” (“the ASC” or “the Codification”). Effective for interim and annual periods ended after September 15, 2009, the Codification became the source of authoritative U.S. generally accepted accounting principles (GAAP) and reporting standards recognized by the FASB to be applied by nongovernmental entities. Rules and interpretive releases of the Securities and Exchange Commission (SEC) under authority of federal securities laws are also sources of authoritative GAAP for SEC registrants. This statement is not intended to change existing GAAP and as such did not have an impact on the consolidated financial statements of the Company. The Company has updated its references in these consolidated financial statements to reflect the Codification.
59
Table of Contents
In December 2007, the FASB issued new accounting guidance on business combinations and non-controlling interests in consolidated financial statements. The new guidance revises the method of accounting for a number of aspects of business combinations and non-controlling interest, including acquisition costs, contingencies (including contingent assets, contingent liabilities and contingent purchase price), the impacts of partial and step-acquisitions (including the valuation of net assets attributable to non-acquired minority interests) and post-acquisition exit activities of acquired businesses. The new guidance is effective for the Company for business combinations completed and non-controlling interests acquired or created after January 1, 2009. The adoption of this guidance on January 1, 2009 did not impact the accompanying consolidated financial statements.
In April 2008, the FASB issued guidance that amends the factors that should be considered in developing renewal or extension assumptions used to determine the useful life of a recognized intangible asset and requires enhanced disclosures relating to: (a) the entity’s accounting policy on the treatment of costs incurred to renew or extend the term of a recognized intangible asset; (b) in the period of acquisition or renewal, the weighted-average period prior to the next renewal or extension (both explicit and implicit), by major intangible asset class; and (c) for an entity that capitalizes renewal or extension costs, the total amount of costs incurred to renew or extend the term of a recognized intangible asset for each period for which a statement of financial position is presented, by major intangible asset class. The adoption of this new guidance on January 1, 2009 did not impact the accompanying consolidated financial statements.
In March 2008, the FASB issued updated guidance that requires qualitative disclosures about the objectives and strategies for using derivatives, quantitative disclosures about the fair value amounts of gains and losses on derivative instruments, and disclosures about credit-risk-related contingent features in derivative agreements. The effective date for adoption of this guidance by the Company was the first quarter of 2009. We have incorporated the required disclosures into these condensed consolidated financial statements. In September 2006, the FASB issued guidance that essentially redefined fair value, established a framework for measuring fair value in accordance with GAAP, and expanded disclosures about fair value measurements. This guidance applies where other accounting pronouncements require or permit fair value measurements and was effective for fiscal years beginning after November 15, 2007 for financial assets and liabilities, as well as for any other assets and liabilities that are carried at fair value on a recurring basis in the financial statements. In November 2007, the FASB provided a one year deferral for the implementation of this guidance for other non-financial assets and liabilities. Our Predecessor adopted this guidance for financial assets and liabilities measured at fair value on a recurring basis on January 1, 2008, and the Company adopted it for non-financial assets and liabilities effective at the beginning of fiscal year 2009. The effects of its adoption were determined by the types of instruments carried at fair value in our financial statements at the time of adoption as well as the methods utilized to determine their fair values prior to adoption. The adoption of this guidance on January 1, 2008 did not have a significant impact on the consolidated financial statements of our Predecessor. The adoption of the guidance for non-financial assets and liabilities had no impact on our consolidated financial statements for fiscal year 2009.
In April 2009, the FASB issued updated guidance related to fair-value measurements to clarify the guidance related to measuring fair-value in inactive markets, modify the recognition and measurement of other- than-temporary impairments of debt securities, and require public companies to disclose the fair values of financial instruments in interim periods. The updated guidance is effective for interim and annual periods ended after June 15, 2009, with early adoption permitted for periods ended after March 15, 2009. The Company adopted the updated guidance in the first quarter of fiscal year 2009, which required certain additional disclosures regarding the fair value of financial instruments in the financial statements.
In May 2009, the FASB issued guidance which establishes accounting and disclosure requirements for subsequent events. This guidance details the period after the balance sheet date during which the Company should evaluate events or transactions that occur for potential recognition or disclosure in the financial statements, the circumstances under which the Company should recognize events or transactions occurring after the balance sheet date in its financial statements and the required disclosures for such events. The Company adopted this guidance in the second quarter of 2009, and has evaluated subsequent events through the filing date of this report.
3. Merger with APP
On September 10, 2008, FKP Holdings completed the Merger, following which APP became a wholly-owned subsidiary of FKP Holdings. The results of APP’s operations have been included in the consolidated financial statements of FKP Holdings since September 10, 2008. APP is a fully-integrated pharmaceutical company that develops, manufactures and markets injectable pharmaceutical products with a primary focus on the oncology, anti-infective, anesthetic/analgesic and critical care markets. APP manufactures a comprehensive range of dosage formulations, and its products are used in hospitals, long-term care facilities, alternate care sites and clinics within North America. The Merger is an important step in Fresenius’ growth strategy. Through the merger with APP, Fresenius gains entry to the U.S. pharmaceuticals market and achieves a leading position in the global I.V. generics industry. The North American platform also provides further growth opportunities for Fresenius’ existing product portfolio.
60
Table of Contents
Effective with the Merger, each outstanding share of common stock of APP and certain stock options and restricted stock units of APP were converted into the right to receive $23.00 in cash, without interest, and one CVR issued by FKP Holdings and representing the right to receive a cash payment, without interest, of up to $6.00 determined in accordance with the terms of the CVR Agreement. The aggregate consideration paid in the Merger was $4,908.1 million (including assumed APP debt), comprised as follows (in millions):
| Purchase of outstanding common stock (cash portion) |
$ | 3,702.7 | |
| Buy-out of restricted stock units and stock options under stock compensation plans |
27.7 | ||
| Estimated fair value of CVRs |
158.4 | ||
| Direct acquisition costs |
21.8 | ||
| Fair value of consideration paid |
3,910.6 | ||
| Assumption of APP debt |
997.5 | ||
| Total aggregate consideration |
$ | 4,908.1 | |
The CVRs were issued on the acquisition date and are traded on the NASDAQ Capital Market (“NASDAQ”) under the symbol “APCVZ.” The fair value of the CVRs at the date of the acquisition was estimated based on the average of their closing prices for the five trading days following the acquisition. Direct costs of the acquisition include investment banking fees, legal and accounting fees and other external costs directly related to the acquisition.
As the APP acquisition occurred prior to December 15, 2008, the acquisition was accounted for under the purchase method of accounting with the Company treated as the acquiring entity in accordance with the transition guidance in ASC 805-10-65. Accordingly, the consideration paid by the Company to complete the acquisition has been allocated to the assets acquired and liabilities assumed based upon their estimated fair values as of the date of acquisition. The excess of the purchase price over the estimated fair values of assets acquired and liabilities assumed was recorded as goodwill. Goodwill is non-amortizing for financial statement purposes and is not tax deductible.
The following summarizes the final fair values of the assets acquired and liabilities assumed at the acquisition date (in millions):
| Net working capital and other assets |
$ | 323.1 | ||
| Property, plant and equipment |
108.8 | |||
| In-process research and development |
365.7 | |||
| Identifiable intangible assets |
542.0 | |||
| Deferred tax liability, net |
(95.9 | ) | ||
| Long-term debt |
(997.5 | ) | ||
| Goodwill |
3,664.4 | |||
| Total |
$ | 3,910.6 | ||
The changes in goodwill from December 31, 2008 to December 31, 2009 are primarily due to (i) finalization of a plan to close the acquired Barceloneta, Puerto Rico manufacturing facility and to transfer its production operations to existing Company plants in the United States; (ii) tax adjustments resulting from the decision to close the Puerto Rico manufacturing facility, filing of tax returns covering the pre-acquisition period and other acquisition-related matters; (iii) changes in the estimated fair value of acquired fixed assets, in part due to the finalization of the decision to close the Puerto Rico facility; (iv) revisions to the estimated fair values of certain acquired assets and assumed liabilities related to the APP acquisition. The Company recorded an immaterial amount of these final purchase accounting adjustments in the fourth quarter of 2009.
On September 8, 2009, the Board of Directors of FKP Holdings formally approved management’s plan to close the Barceloneta, Puerto Rico manufacturing facility and transfer production operations to existing Company plants in the United States. This action is consistent with the Company’s objective to lower overall manufacturing costs and to strengthen the Company’s long-term competitive position. The closure is expected to be substantially completed by mid 2010. The Company acquired the Barceloneta, Puerto Rico manufacturing facility in connection with the September 2008 acquisition of APP. Various plans to lower the Company’s overall manufacturing costs, including the closure of the Puerto Rico manufacturing facility along with the transfer of its production operations to existing Company plants in the United States, have been under consideration since the date of the acquisition and, accordingly, the decision to close this facility resulted in various adjustments to the estimated amounts assigned to certain assets acquired, liabilities assumed and residual goodwill in connection with the APP acquisition based on market valuations of the related assets and liabilities. These adjustments included a reduction in the estimated fair value of the acquired plant and equipment at the Puerto Rico facility, the recognition of estimated liabilities for employee severance and contract termination costs related to the Puerto Rico facility, and the recording of associated tax effects.
61
Table of Contents
Due to the decision to close the Puerto Rico facility, (which was made in 2009) and the recognition of the related impairments for tax purposes, the Company expects to be able to file a carry back claim and recover approximately $39.2 million of taxes paid by APP in prior years. The portion of this benefit attributable to the assets acquired and liabilities assumed in connection with the purchase of APP has been reflected as an adjustment to goodwill in the consolidated balance sheet.
Because the Company continued to operate the Puerto Rico facility subsequent to the acquisition date, a portion of the adjustment to the carrying value of property and equipment (approximately $5.4 million) and the anticipated tax benefit (approximately $7.9 million) have been reflected in the consolidated statement of operations for the period ended December 31, 2009.
Approximately $365.7 million of the purchase price represents the estimated fair value of acquired in-process research and development (R&D) projects that had not yet reached technological feasibility and had no alternative future use. Accordingly, this amount was immediately expensed in the 2008 successor period, $252.0 million as of the acquisition date and $113.7 million upon finalization of the fair value of the R&D projects during the fourth quarter 2008. The value assigned to the acquired in-process R&D was determined by project using a discounted cash flow model. The discount rates used take into consideration the stage of completion and the risks surrounding the successful development and commercialization of each of the acquired in-process R&D projects that were valued.
Identifiable intangible assets consist of developed product technology and are amortized using the straight-line method over the estimated useful life of the assets of 20 years. Refer to Note 7 to the consolidated financial statements—Goodwill and Other Intangibles.
Unaudited Pro Forma Financial Information
The following unaudited pro forma financial information presents the combined historical results of the operations of the Company and APP as if the acquisition had occurred on the first day of the periods presented.
Unaudited pro forma results of operations are as follows (in thousands):
| Three months ended December 31, 2008 |
For the year ended December 31, |
|||||||||||
| 2008 | 2007 | |||||||||||
| Sales |
$ | 232,756 | $ | 776,633 | $ | 647,374 | ||||||
| Gross profit |
$ | 132,341 | $ | 368,271 | $ | 288,408 | ||||||
| Net loss |
$ | (59,066 | ) | $ | (402,692 | ) | $ | (542,932 | ) | |||
This unaudited pro forma financial information is not intended to represent or be indicative of what would have occurred if the transaction had taken place on the dates presented and is not indicative of what the Company’s actual results of operations would have been had the acquisition been completed at the beginning of the periods indicated above. The unaudited pro forma information includes the write-off of $365.7 million of in-process R&D and $45.5 million of expense in cost of goods sold due to inventory step up. Further, the pro forma combined results do not reflect one-time costs to fully merge and operate the combined organization more efficiently, or anticipated synergies expected to result from the combination and should not be relied upon as being indicative of the future results that the Company will experience.
4. Contingent Value Rights (CVR)
In connection with the Merger, each APP shareholder was issued one contingent value right of FKP Holdings for each share held. The CVRs are intended to give holders an opportunity to participate in any excess Adjusted EBITDA, as defined in the CVR Indenture, generated by FKP Holdings during the three years ending December 31, 2010, referred to as the “CVR measuring period,” in excess of a threshold amount. Each CVR represents the right to receive a pro rata portion of an amount equal to 2.5 times the amount by which cumulative Adjusted EBITDA of APP and FKP Holdings and their subsidiaries on a consolidated basis, exceeds $1.267 billion for the three years ending December 31, 2010. If Adjusted EBITDA for the CVR measuring period does not exceed this threshold amount, no amounts will be payable on the CVRs and the CVRs will expire valueless. The maximum amount payable under the CVR Indenture is $6.00 per CVR. The cash payment on the CVRs, if any, will be determined after December 31, 2010, and will be payable June 30, 2011, except in the case of a change of control of FKP Holdings, which may result in an acceleration of any payment. The acceleration payment, if any, is payable within six months after the change of control giving rise to the acceleration payment.
62
Table of Contents
The CVRs do not represent equity, or voting securities of FKP Holdings, and they do not represent ownership interests in FKP Holdings. Holders of the CVRs are not entitled to any rights of a stockholder or other equity or voting securities of FKP Holdings, either at law or in equity. Similarly, holders of CVRs are not entitled to any dividends declared or paid with respect to any equity security of FK Holdings. A holder of a CVR is entitled only to those rights set forth in the CVR Indenture. Additionally, the right to receive amounts payable under the CVRs, if any, is subordinated to all senior obligations of FKP Holdings. The CVRs trade on NASDAQ under the symbol “APCVZ”.
Because any amount payable to the holders of CVRs must be settled in cash, the CVRs are classified as liabilities in the accompanying consolidated financial statements. The estimated fair value of the CVRs at the date of acquisition was included in the cost of the acquisition. At each reporting date, the CVRs are marked-to-market based on the closing price of a CVR as reported by NASDAQ, and the change in the fair value of the CVRs for the reporting period is included in the statements of operations. At December 31, 2009 and 2008, the carrying value of the CVR liability was approximately $49.0 million and $57.1 million, respectively.
5. Adjusted EBITDA Calculation for Contingent Value Rights
Under the terms of the CVR Indenture, the amount, if any, payable in respect of each CVR on June 30, 2011 is determined based on Adjusted EBITDA. As a result, in addition to reporting financial results in accordance with generally accepted accounting principles, FKP Holdings also must calculate and present Adjusted EBITDA, which is a non-GAAP financial measure, for the cumulative period from January 1, 2008 to the current reporting date until the expiration of the CVR measurement period (December 31, 2010) and settlement of the CVRs.
Under the CVR Indenture, Adjusted EBITDA is measured without taking into account the Merger and assuming that APP would have remained a stand-alone company with its existing assets; it also excludes (i) costs, expenses, and revenue from sales outside the U.S. and Canada, and (ii) costs, expenses and revenue for sales of product not currently under development by APP at the time of the Merger.
Adjusted EBITDA, as defined in the CVR Indenture, consists of consolidated net income determined in accordance with U.S. GAAP plus:
| • | interest expense, the provision for income taxes, and depreciation and amortization; |
| • | non-cash charges or losses resulting from (i) the sale or other disposal of assets; (ii) impairment charges or asset write-offs related to intangible assets, long-lived assets, and investments in debt and equity securities; (iii) losses from investments recorded using the equity method; and (iv) non-cash expenses relating to the vesting of warrants; |
| • | any extraordinary, unusual or non-recurring expenses or losses related to FKP Holdings’ acquisition of APP, and expenses (not to exceed $1 million in the aggregate) arising out of the spin-off of Abraxis BioScience from APP to APP’s stockholders on November 13, 2007; |
| • | any costs and expenses incurred in connection with any management equity plan; |
| • | any non-cash increase in expenses resulting from the revaluation of inventory, non-cash charges due to any change in accounting policy, or increased expenses due to purchase accounting associated with the Merger, including the issuance of the CVRs; |
| • | expenses with respect to liability or casualty events or business interruption only to the extent of any reasonably anticipated insurance recovery, and only to the extent that such recovery has not already been recorded in consolidated net income; |
| • | certain research and development expenses relating to the build-out of facilities and costs incurred to transfer production to or start-up any facilities not to exceed $34.9 million; |
| • | any deductions attributable to minority interests; and |
| • | any expenses or losses arising out of the consulting agreement among FKP Holdings, Dr. Soon-Shiong and Fresenius. |
And less:
| • | extraordinary and unusual or non-recurring cash gains; |
| • | non-cash gains; |
| • | gains on sales of fixed assets; |
| • | any net after-tax income from the early extinguishment of indebtedness or hedging obligations or other derivative instruments; and |
| • | all one-time gains from investments recorded using the equity method. |
63
Table of Contents
6. Discontinued Operations – Spin-off of New Abraxis
On November 13, 2007, Old Abraxis was separated into two independent publicly-traded companies: APP, which owns and operates the hospital-based business; and New Abraxis, which owns and operates the proprietary business. Following the spin-off, APP continued to operate the hospital-based business under the name APP Pharmaceuticals, Inc., which on September 10, 2008, became a wholly-owned subsidiary of FKP Holdings. For accounting purposes, the historical operating results of the proprietary business are presented as discontinued operations.
Summarized financial information for discontinued operations is as follows (in thousands):
| Year ended December 31, 2007 |
||||
| Net revenue |
$ | 293,415 | ||
| Loss before taxes |
(67,854 | ) | ||
| Income taxes |
(20,033 | ) | ||
| Net loss |
(47,821 | ) | ||
APP and New Abraxis also entered into a series of agreements in connection with the separation, including a separation and distribution agreement, a transition services agreement, an employee matters agreement, a tax allocation agreement, a manufacturing agreement and various real estate leases. Refer to Note 12 to the consolidated financial statements– Related Party Transactions. Also, in connection with the separation, APP incurred $1 billion of indebtedness and, in addition, entered into a $150 million revolving credit facility, each of which was extinguished as part of the Merger. There were no costs and expenses incurred related to discontinued operation expenses during 2009 or the successor or predecessor periods in 2008.
7. Goodwill and Other Intangibles
As of December 31, 2009 and 2008, goodwill had a carrying value of $3,664.4 million and $3,662.1 million, respectively, with the decrease in carrying value resulting from the finalization of fair value estimates related to the acquired net assets offset by the recognition of additional direct costs associated with the Merger. All of our intangible assets, other than goodwill, are subject to amortization.
The following table reflects the components of identifiable intangible assets, all of which have finite lives, as of December 31, 2009 and 2008:
| December 31, 2009 | December 31, 2008 | Category Amortization Period | ||||||||||||
| Gross Carrying Amount |
Accumulated Amortization |
Gross Carrying Amount |
Accumulated Amortization |
|||||||||||
| (in thousands) | (in thousands) | |||||||||||||
| Developed product technology |
$ | 489,000 | $ | 31,928 | $ | 489,000 | $ | 7,478 | 20 years | |||||
| Product rights |
2,300 | 87 | 1,550 | 37 | 10 years | |||||||||
| Patents |
6,847 | 553 | — | — | 5 years | |||||||||
| Contracts and other |
45,500 | 11,641 | 43,000 | 2,508 | 5 years | |||||||||
| Customer relationships |
12,000 | 5,223 | 12,000 | 1,223 | 3 years | |||||||||
| Total |
$ | 555,647 | $ | 49,432 | $ | 545,550 | $ | 11,246 | ||||||
We amortize all of our identifiable intangible assets with finite lives over their expected period of benefit using the straight-line method. In determining the appropriate amortization period and method for developed product technology, we considered, among other things, the nature of the products, the anticipated timing of cash flows and the relatively high barriers to entry for competition due to the complex development and manufacturing processes. In addition, the products all share similar attributes in that they have a favorable risk profile (e.g., minimal side effects, adverse experiences, etc.) and are easy to administer to patients. Based on the risk profile and ease of use of the related products, we do not expect that new competing products will enter the market in the foreseeable future, and that the barriers to entry will help to protect the market positions of the products and preserve their useful lives. We have manufactured and sold many of our products for more than 20 years. Accordingly, as future cash flows with respect to these and our other products are expected to exceed 20 years, we have utilized the straight-line amortization method and a 20-year expected period of benefit. However, we cannot predict with certainty whether new competing products will enter the market, the timing of such competition or the Company’s ability to protect the market positions of its products and preserve their useful lives. In the event that we experience stronger or more rapid competition or other conditions that change the market positions of our products, we may need to accelerate the amortization of our developed product technology intangibles or recognize an impairment charge.
64
Table of Contents
The Company follows the policy of capitalizing patent defense costs when it determines that such costs are recoverable from future product sales and a successful defense is probable. These costs are amortized over the remaining useful life of the patent. Patent defense costs are expensed as incurred until the criteria for capitalization are met, previously capitalized costs are written-off when it is determined that the likelihood of success is no longer considered probable. During the year ended December 31, 2009 the Company capitalized $6.8 million in legal costs related to the defense of its patents.
Amortization expense on intangible assets attributable to operations for the year ended December 31, 2009 was $38.1 million. Amortization expense for the period from July 2, 2008 through December 31, 2008 (successor period) was $11.2 million and for the period from January 1 through September 9, 2008 (predecessor period) was $10.3 million, (a total of $21.5 million in 2008) and amortization expense for the year ended December 31, 2007 was $50.8 million. At December 31, 2009, the weighted average expected lives of intangibles was approximately 18.5 years. Total estimated amortization expense for our finite-lived intangible assets for the next five years is as follows:
| Estimated Amortization | |||
| (in thousands) | |||
| 2010 |
$ | 38,917 | |
| 2011 |
37,694 | ||
| 2012 |
34,916 | ||
| 2013 |
32,409 | ||
| 2014 |
25,494 | ||
8. Acquisition of Assets
On November 13, 2009 the Company finalized an Asset Purchase Agreement with Catalent Pharma Solutions, LLC to acquire its Raleigh, North Carolina manufacturing facility as well as related production equipment and certain raw materials for $10.7 million. The acquisition was accounted for using the purchase method of accounting and no goodwill or intangible assets were recognized.
9. Long-Term Debt and Credit Facility
Fresenius Merger – Credit Agreements
On August 20, 2008, in connection with the acquisition of APP, Fresenius entered into a $2.45 billion credit agreement with Deutsche Bank AG, London Branch, as administrative agent; Deutsche Bank AG, London Branch; Credit Suisse, London Branch; and J.P. Morgan plc, as arrangers and book running managers, and the other lenders party thereto (the “Senior Credit Facilities Agreement”) and a $1.3 billion bridge credit agreement with Deutsche Bank AG, London Branch, as the administrative agent; Deutsche Bank AG, London Branch; Credit Suisse, London Branch; and J.P. Morgan plc, as arrangers and book running managers, and the other lenders party thereto (the “Bridge Facility Agreement”) to assist in the funding of the transaction. The $2.45 billion Senior Credit Facilities Agreement included a $1 billion term loan A, a $1 billion term loan B, and revolving credit facilities of $300 million, which was subsequently increased to $400 million, and $150 million. Proceeds from borrowings under these credit facilities, together with other available funds provided by Fresenius through equity contributions and loans to FKP Holdings and its subsidiaries, were utilized to complete the purchase of APP on September 10, 2008.
The Senior Credit Facilities Agreement provides APP Pharmaceuticals, LLC, a wholly owned subsidiary of APP, with two term loan facilities: a Tranche A2 Term Loan (“Term Loan A2”) for $500 million and Tranche B2 Term Loan (“Term Loan B2”) for $497.5 million. The Senior Credit Facilities Agreement also provides APP Pharmaceuticals, LLC with a $150 million revolving credit facility. The revolving credit facility includes a $50 million sub-limit for swingline loans and a $20 million sub-limit for letters of credit. The Term Loan A2 and B2 loan facilities mature on September 10, 2013 and September 10, 2014, respectively, and the revolving credit facility expires on September 10, 2013. We incurred and capitalized approximately $25 million in debt issue costs in connection with the Senior Credit Facilities Agreement. As of December 31, 2009, the balance outstanding on APP Pharmaceuticals, LLC senior credit facilities was $921.4 million and the revolving credit facility had no outstanding balance.
65
Table of Contents
Pursuant to the Senior Credit Facilities Agreement, Fresenius Kabi Pharmaceuticals, LLC (which was merged with and into APP Pharmaceuticals, Inc. upon consummation of the Merger) entered into an intercompany loan with the borrower of the $500 million Tranche A1 Term Loan and the $502.5 million Tranche B1 Term Loan, and an affiliate of FKP Holdings entered into an intercompany loan with the borrower under the $300 million revolving facility under the Senior Credit Facilities Agreement (collectively, the “Senior Intercompany Loans”), the amount, maturity and other financial terms of which correspond to those applicable to the loans provided to such borrowers under the Senior Credit Facilities Agreement described above. The Senior Intercompany Loans are guaranteed by FKP Holdings and certain of its affiliates and subsidiaries and secured by the assets of FKP Holdings and certain of its affiliates and subsidiaries. The Senior Intercompany Loans provide for an event of default and acceleration if there is an event of default and acceleration under the Senior Credit Facilities Agreement, but acceleration of the Senior Intercompany Loans may not occur prior to acceleration of the loans under the Senior Credit Facilities Agreement. By entering into the Senior Intercompany Loans with Fresenius Kabi Pharmaceuticals, LLC, Fresenius effectively pushed-down its Merger-related term loan borrowings under the Senior Credit Facilities Agreement to the FKP Holdings group. The Senior Intercompany Loans bear interest at a variable rate based on the rates applicable to the corresponding loans under the Senior Credit Facilities Agreement, plus a margin, as discussed below, and are due in 2013 and 2014, as applicable. The balance of the Senior Intercompany Loans outstanding at December 31, 2009 was $1,386.0 million.
The interest rate on each borrowing under the Senior Credit Facilities Agreement is a rate per annum equal to the aggregate of (a) the applicable margin and (b) LIBOR or EURIBOR for the relevant interest period, subject, in the case of Term Loan B, to a minimum LIBOR or EURIBOR. The applicable margin for Term Loan A Facilities and the Revolving Credit Facilities is variable and depends on the Fresenius Leverage Ratio as defined in the Senior Credit Facilities Agreement.
The Senior Credit Facilities Agreement contains a number of affirmative and negative covenants that are assessed at the Fresenius level and are not separately assessed at APP Pharmaceuticals, LLC. The obligations of APP Pharmaceuticals, LLC under the Senior Credit Facilities Agreement are unconditionally guaranteed by Fresenius SE, Fresenius Kabi AG, Fresenius ProServe GmbH and APP Pharmaceuticals, Inc. and are secured by a first-priority security interest in substantially all tangible and intangible assets of APP Pharmaceuticals, Inc. and APP Pharmaceuticals, LLC.
Pursuant to the Bridge Facility Agreement, FKP Holdings entered into an intercompany loan (the “Bridge Intercompany Loan”) with an affiliate of Fresenius who was the borrower under the Bridge Facility Agreement, the amount, maturity, and other financial terms of which corresponded to those applicable to the loans provided to such borrower under the Bridge Facility Agreement. The Bridge Intercompany Loan was guaranteed by certain of its affiliates and subsidiaries and secured by the assets of FKP Holdings and certain of its affiliates and subsidiaries. The Bridge Intercompany Loan provided for an event of default and acceleration if there was an event of default and acceleration under the Bridge Facility Agreement, but acceleration of the Bridge Intercompany Loan may not occur prior to acceleration of the loans under the Bridge Facility Agreement. By entering into the Bridge Intercompany Loan with FKP Holdings, Fresenius effectively pushed-down its Merger-related borrowings under the Bridge Credit Facility Agreement to FKP Holdings. The Bridge Intercompany Loan bore interest at the rate applicable to the corresponding loan under the Bridge Facility Agreement, plus a margin. As described below, the original borrowing under the Bridge Facility Agreement was $1.3 billion, $650 million of which was repaid in October 2008 and the remainder of which was repaid in January 2009. As described below, the related intercompany loans were refinanced in connection with the repayments made on the Bridge Facility Agreement.
In addition, Fresenius SE made two other intercompany loans totaling $456.2 million to FKP Holdings as part of the acquisition. These intercompany loans include fixed interest rates and mature on September 10, 2014.
In connection with the intercompany loans described above, Fresenius also pushed-down to the Company approximately $101.1 million in fees and costs incurred in connection with establishing the Senior Credit Facilities Agreement and Bridge Facilities Agreement, the proceeds of which were used to finance the Merger.
Post-Merger Activity
On October 6, 2008, the amount available under the Senior Credit Facilities Agreement was increased to approximately $2.95 billion by increasing the amount of the Tranche B1 Term Loan facility by approximately $483.1 million. On October 10, 2008, the full amount of the increase to the Tranche B1 Term Loan facility under the Senior Credit Facilities Agreement was drawn down. These funds, along with an additional $166.9 million of proceeds from other borrowings were used to repay a portion of the $1.3 billion outstanding under the Bridge Facility Agreement, so that the aggregate amount outstanding under Bridge Facility Agreement, after these repayments, was $650 million. The $650 million repayment of the Bridge Intercompany Loan resulted in the write-off of $13.4 million in related debt issuance costs in the fourth quarter of 2008. These changes to the Senior Credit Facilities Agreement and Bridge Credit Facility Agreement were also reflected in the Senior Intercompany Loans and Bridge Intercompany Loan. The balance of the Bridge Intercompany Loan outstanding at December 31, 2008 was $650.0 million.
66
Table of Contents
On January 21, 2009, the borrower under the Bridge Facility Agreement, which is an affiliate of Fresenius, issued two tranches of notes in a private placement. The issuer sold $500 million aggregate principal amount of fixed interest rate senior notes and €275 million aggregate principal amount of fixed interest rate senior notes. The notes are senior unsecured obligations of the issuer and mature on July 15, 2015. Proceeds of the notes issuance were used among other things, to repay in full the $650 million outstanding under the Bridge Facility Agreement. Upon the repayment of the bridge loan, the Bridge Intercompany Loan was refinanced and replaced with an Intercompany Dollar Loan of $500 million and an Intercompany Euro Loan of €115.7 million. The interest payments for these notes are at fixed interest rates and are due semi-annually on January 15 and July 15 in line with the maturity date of the senior notes. These new intercompany loans are not guaranteed or secured and the principal for both of these loans is due July 15, 2015. As a result of the refinancing, in the first quarter of 2009, the Company wrote-off $14.6 million of Bridge Intercompany Loan unamortized debt issuance costs and incurred debt issuance costs of $67.5 million for the new Intercompany Dollar and Euro loans.
During the second half of 2009, the Company restructured certain of its unsecured intercompany loans. The Company did not receive or pay any cash as a result of the $523.1 million, $150 million and $75 million transactions described below. In connection with the restructuring, obligations related to $523.1 million of these unsecured intercompany loans were transferred from Fresenius SE to Fresenius Kabi AG along with the related outstanding accrued interest. The terms of these loans were unchanged in the transfer. Also, during the second half of 2009, the Company entered into the following unsecured intercompany loans with Fresenius Kabi AG: $150 million note of which the proceeds were used to pay down the entire $150 million balance outstanding under the $300 million revolving facility under the Senior Intercompany Loans; $75 million note and a $50 million note of which the proceeds were used to pay down the full amounts outstanding in September and December, respectively, under the APP Pharmaceuticals, LLC revolving credit facility under the Senior Credit Facilities Agreement; and $85 million note of which cash proceeds were received of $73.7 million and were used to pay our December debt costs and $11.3 million resulting from interest and principal payments made on our behalf. Prior to year end the $75 million note and the $150 million note were combined into a $225 million note. The $360 million of unsecured intercompany loans due to Fresenius Kabi AG are at fixed interest rates and have maturity dates of 30 or 60 days. These loans are intended to be extended for the near term and are included in the current portion of intercompany debt in the consolidated balance sheet.
On December 10, 2009 the Company entered into additional unsecured intercompany loans with Fresenius Kabi AG in the amount of 13 million Euros, $46.3 million and $32.3 million. The proceeds of these loans were used to pay the voluntary principal prepayments on Senior Intercompany Loans Euro Tranche Term B1 Loan of 13 million Euros and Tranche Term B1 Loan of $46.3 million and on APP Pharmaceuticals, LLC senior credit facilities Term Loan B2 of $32.3 million. These Fresenius Kabi AG notes are at fixed interest rates and have a maturity date of September 10, 2014. There was no change to principal maturity dates related to this exchange of notes. The balance of the unsecured intercompany loans at December 31, 2009 was $1,647.2 million.
The following is the repayment schedule for Term Loans A2 and B2 and the intercompany loans outstanding as of December 31, 2009 (in thousands):
| Term Loan A2 | Term Loan B2 | Intercompany Fresenius |
Total | |||||||||
| 2010 |
$ | 71,500 | $ | 4,975 | $ | 441,511 | $ | 517,986 | ||||
| 2011 |
122,500 | 4,975 | 132,511 | 259,986 | ||||||||
| 2012 |
150,000 | 4,975 | 160,011 | 314,986 | ||||||||
| 2013 |
118,500 | 4,975 | 128,511 | 251,986 | ||||||||
| 2014 |
— | 439,044 | 1,503,992 | 1,943,036 | ||||||||
| 2015 and thereafter |
— | — | 666,668 | 666,668 | ||||||||
| $ | 462,500 | $ | 458,944 | $ | 3,033,204 | $ | 3,954,648 | |||||
10. Derivatives
The Company does not engage in the trading of derivative financial instruments except where the Company’s objective is to manage the variability of forecasted principal and interest payments attributable to changes in interest rates or foreign currency exchange rate fluctuations. In general, the Company enters into derivative transactions in limited situations based on management’s assessment of current market conditions and perceived risks.
As a result of the use of derivative instruments, the Company is exposed to counterparty credit risk when these instruments are in an asset position. The Company manages the counterparty credit risk by entering into derivative contracts only with its Parent company and its affiliates. As a result, as of December 31, 2009, the Company does not expect to experience any losses as a result of default of its counterparty.
67
Table of Contents
Foreign Currency Contracts: Included in our intercompany borrowings are several Euro-denominated notes, €197.5 million notes with a maturity in 2014 and a €115.7 million note with a maturity in 2015. In connection with these borrowings, we entered into intercompany foreign currency swap contracts in order to limit our exposure to changes in current exchange rates on the Euro-denominated notes principal balance. We have entered into foreign currency swaps with affiliates of Fresenius for the total of the Euro-denominated notes principal balance. These agreements mature at various dates through January 2012, and are not designated as hedging instruments for accounting purposes. During the year ended December 31, 2009 and the successor period in 2008, we recognized a foreign currency gain of approximately $30.1 million and $4.0 million, respectively, in our other income (expense) related to the change in fair value of these swap agreements. These foreign currency gains were offset by $26.2 million and $8.2 million in currency losses we recorded in 2009 and in the successor period in 2008, in order to adjust the carrying value of the Euro-denominated notes to reflect the year-end exchange rate.
We have also entered into foreign currency hedges for the €18.9 million of future cash flows related to the interest payments due on the €197.5 million notes through December 12, 2011, and for the €25.4 million of future cash flows related to the interest payments on the €115.7 million note through January 17, 2012. These foreign currency agreements have been designated as hedges of our exposure to fluctuations in interest payments on outstanding Euro-denominated borrowings due to changes in Euro/U.S. dollar exchange rates (a cash flow hedge). The fair value of these foreign currency hedges at December 31, 2009 and 2008 is an asset of $5.0 million and $0.0 million, respectively and is included in current prepaid expenses and other current assets and other non-current assets, net in our consolidated balance sheet. During the year ended December 31, 2009 and the successor period in 2008, we recognized a foreign currency gain of $5.0 million and $0.0 million, respectively, in other comprehensive income (loss).
Interest Rate Swaps: On November 3, 2008, we entered into four interest rate swap agreements with Fresenius for an aggregate notional principal amount of $900 million. These agreements require us to pay interest at an average fixed rate of 3.97% and entitle us to receive interest at a variable rate equal to three-month LIBOR, which is equal to the benchmark for the term A Loans being hedged, on the notional amount. The interest rate swaps expire in October 2011 and December 2013. These swaps have been designated as hedges of our exposure to fluctuations in interest payments on outstanding variable rate borrowings due to changes in interest rates (a cash flow hedge). The fair value of these interest rate swap agreements at December 31, 2009 and 2008 is a liability of $53.2 million and $69.3 million, respectively and is included in long-term liabilities in our consolidated balance sheets. As noted above the Company entered into derivative contracts with its Parent, who pushed down the interest rate swap agreements to the Company. From inception of the agreements to the time the interest rate swaps were transferred to the Company the Parent recognized $15.9 million in losses in other comprehensive income (loss). From the time the interest rate swap agreements were transferred to the Company through December 31, 2009, we recorded a deferred loss of $22.3 million, net of tax benefit of $14.1 million, in other comprehensive income (loss) and recognized $0.9 million, in intercompany interest expense, which represented the amount of hedge ineffectiveness. The Company did not enter into any derivatives during 2007.
68
Table of Contents
The fair value amounts in our consolidated balance sheet at December 31, 2009 and 2008, related to foreign currency forward and interest rate swap contracts were as follows:
| Asset Derivatives |
Liability Derivatives | ||||||||||
| December 31, 2009 (In millions) |
Balance Sheet Location |
Fair Value |
Balance Sheet Location |
Fair Value | |||||||
| Derivatives designated as hedging instruments |
|||||||||||
| Foreign currency forward contracts-Interest (current) |
Prepaid expense and other current assets | $ | 2.7 | Other accrued expenses | $ | — | |||||
| Foreign currency forward contracts-Interest (non-current) |
Other non-current assets, net | 2.3 | Other non-current liabilities | — | |||||||
| Interest rate swap contracts (non-current) |
Other non-current assets, net | — | Fair value of interest rate swaps with Parent and affiliates | 53.2 | |||||||
| Total |
$ | 5.0 | $ | 53.2 | |||||||
| Asset Derivatives |
Liability Derivatives | ||||||||||
| (In millions) |
Balance Sheet Location |
Fair Value |
Balance Sheet Location |
Fair Value | |||||||
| Derivatives not designated as hedging instruments |
|||||||||||
| Foreign currency forward contracts (current) |
Prepaid expense and other current assets | $ | 8.6 | Other accrued expenses | $ | — | |||||
| Foreign currency forward contracts (non-current) |
Other non-current assets, net | 25.6 | Other non-current liabilities | — | |||||||
| Total |
$ | 34.2 | $ | — | |||||||
| Asset Derivatives |
Liability Derivatives | ||||||||||
| December 31, 2008 (In millions) |
Balance Sheet Location |
Fair Value |
Balance Sheet Location |
Fair Value | |||||||
| Derivatives designated as hedging instruments |
|||||||||||
| Foreign currency forward contracts-Interest (current) |
Prepaid expense and other current assets | $ | — | Other accrued expenses | $ | — | |||||
| Foreign currency forward contracts-Interest (non-current) |
Other non-current assets, net | — | Other non-current liabilities | — | |||||||
| Interest rate swap contracts (non-current) |
Other non-current assets, net | — | Fair value of interest rate swaps with Parent and affiliates | 69.3 | |||||||
| Total |
$ | — | $ | 69.3 | |||||||
| Asset Derivatives |
Liability Derivatives | ||||||||||
| (In millions) |
Balance Sheet Location |
Fair Value |
Balance Sheet Location |
Fair Value | |||||||
| Derivatives not designated as hedging instruments |
|||||||||||
| Foreign currency forward contracts (current) |
Prepaid expense and other current assets | $ | (0.2 | ) | Other accrued expenses | $ | — | ||||
| Foreign currency forward contracts (non-current) |
Other non-current assets, net | 4.2 | Other non-current liabilities | — | |||||||
| Total |
$ | 4.0 | $ | — | |||||||
69
Table of Contents
The pretax derivative gains and losses in our consolidated statement of operations for the year ended December 31, 2009 and the successor period in 2008, related to our foreign currency forward and interest rate swap contracts were as follows:
December 31, 2009
| Derivatives in Cash Flow Hedging Relationships |
Gain (Loss) Recognized in Other Comprehensive Income on Effective Portion of Derivative |
Gain (Loss) on Effective Portion of Derivative Reclassified from Accumulated Other Comprehensive Income |
Ineffective Portion of Gain (Loss) on Derivative and Amount Excluded from Effectiveness Testing Recognized in Income |
|||||||||||
| (In millions) |
Amount | Location | Amount | Location | Amount | |||||||||
| Foreign currency forward contracts-Interest |
$ | 5.0 | Interest income and other, net |
$ | — | Interest income and other, net |
$ | — | ||||||
| Interest rate swap contracts |
16.3 | Interest income and other, net |
— | Interest income and other, net |
(0.2 | ) | ||||||||
| Total |
$ | 21.3 | $ | — | $ | (0.2 | ) | |||||||
| Derivatives Not Designated as Hedging Instruments |
Location of Gain (Loss) Recognized in Income on Derivative |
Gain (Loss) Recognized in Income on Derivative | |||
| Foreign currency forward contracts |
Interest income and other, net |
$ | 30.1 | ||
December 31, 2008
| Derivatives in Cash Flow Hedging Relationships |
Gain (Loss) Recognized in Other Comprehensive Income on Effective Portion of Derivative |
Gain (Loss) on Effective Portion of Derivative Reclassified from Accumulated Other Comprehensive Income |
Ineffective Portion of Gain (Loss) on Derivative and Amount Excluded from Effectiveness Testing Recognized in Income |
||||||||||||
| (In millions) |
Amount | Location | Amount | Location | Amount | ||||||||||
| Foreign currency forward contracts-Interest |
$ | — | Interest income and other, net |
$ | — | Interest income and other, net |
$ | — | |||||||
| Interest rate swap contracts |
(52.6 | ) | Interest income and other, net |
— | Interest income and other, net |
(0.8 | ) | ||||||||
| Total |
$ | (52.6 | ) | $ | — | $ | (0.8 | ) | |||||||
| Derivatives Not Designated as Hedging Instruments |
Location of Gain (Loss) Recognized in Income on Derivative |
Gain (Loss) Recognized in Income on Derivative | |||
| Foreign currency forward contracts |
Interest income and other, net |
$ | 4.0 | ||
11. Fair Value Measurements
Accounting guidance on fair value measurements sets a fair value hierarchy that prioritizes the inputs to valuation techniques used to measure fair value for certain financial assets and liabilities. The basis of the fair value measurement is categorized in three levels, in order of priority, as described below:
| Level 1: | Unadjusted quoted prices in active markets that are accessible at the measurement date for identical, unrestricted assets or liabilities. | |
| Level 2: | Quoted prices in markets that are not active, or financial instruments for which all significant inputs are observable either directly or indirectly. | |
| Level 3: | Prices or valuation techniques that require inputs that are both significant to the fair value measurement and unobservable thus reflecting assumptions about the market participants. | |
70
Table of Contents
In valuing assets and liabilities, we are required to maximize the use of quoted market prices and minimize the use of unobservable inputs. We calculated the fair value of our Level 1 and Level 2 instruments based on the exchange traded price of similar or identical instruments where available or based on other observable instruments. The Company has not changed its valuation techniques in measuring the fair value of any financial assets and liabilities during the period.
The following table sets forth the Company’s financial assets and liabilities as of December 31, 2009 that are measured at fair value on a recurring basis, segregated by level within the fair value hierarchy:
| Basis of Fair Value Measurement (in thousands) | ||||||||||||
| Balance at December 31, 2009 |
Quoted Prices in Active Markets for Identical Items (Level 1) |
Significant Other Observable Inputs (Level 2) |
Significant Unobservable Inputs (Level 3) | |||||||||
| Assets – fair value of foreign currency swaps |
$ | 39,244 | $ | — | $ | 39,244 | $ | — | ||||
| Liabilities: |
||||||||||||
| Contingent value rights |
$ | 48,976 | $ | 48,976 | — | — | ||||||
| Fair value of interest rate swaps |
53,188 | — | $ | 53,188 | — | |||||||
| Total liabilities |
$ | 102,163 | $ | 48,976 | $ | 53,188 | $ | — | ||||
12. Related Party Transactions
Related parties balances and transactions for the successor periods ended December 31, 2009 and 2008 pertain to balances and transactions with Fresenius and its direct and indirectly owned subsidiaries, while related party balances and transactions for the predecessor periods pertain to balances and transactions with New Abraxis, which was spun-off by APP on November 13, 2007. Below is a detailed discussion of these transactions.
Transactions with Fresenius
In connection with the Merger and associated financing transactions, FKP Holdings and its subsidiaries entered into a number of intercompany loan agreements with subsidiaries of Fresenius, the Company’s parent, as described in Note 9 to the consolidated financial statements—Long-Term Debt and Credit Facility. At December 31, 2009 and 2008, the principal amount outstanding under these loans was $3,033.2 million and $2,864.4 million, respectively. Interest expense recognized on these intercompany loans for the year ended December 31, 2009 and the successor 2008 period was $249.0 million and $66.7 million, respectively. Accrued interest of $47.1 and $26.6 million was due on these intercompany loans at December 31, 2009 and 2008, respectively. As described in Note 9 to the consolidated financial statements—Long-Term Debt and Credit Facility, in the year ended December 31, 2009 the Company paid $67.5 million in issuance costs related to the refinancing of the Bridge Intercompany Loan. In addition, during the successor period ended December 31, 2008, Fresenius pushed-down approximately $101.1 million in issuance costs associated with these intercompany loans.
In December 2008, the Company entered into a $2.5 million, 5 year licensing agreement with a subsidiary of Fresenius related to certain oncology products. The capitalized product rights are included in intangible assets.
On December 29, 2008, FKP Holdings received two short-term notes totaling $33.8 million ($26.1 million and $7.7 million, respectively) from Fresenius in exchange for a short-term cash deposit. The $26.1 million and $7.7 million notes receivable became due and payable on January 2, 2009 and January 8, 2009, respectively. The interest rates on the notes receivable were 2.1% and 1.0% respectively, and were set based on lender country’s LIBOR rate plus 0.5%. These two loans were repaid at maturity and are reflected as notes receivable from Parent in the accompanying consolidated balance sheet at December 31, 2008.
Transactions with New Abraxis
In connection with the November 13, 2007 separation, APP entered into a number of agreements that govern its relationship with New Abraxis for a period of time after the separation. These agreements were entered into while New Abraxis was still a wholly owned subsidiary of Old Abraxis. These agreements include (i) a tax allocation agreement, (ii) a dual officer agreement, (iii) an employee matters agreement, (iv) a transition services agreement, (v) a manufacturing agreement, and (vi) various real estate leases. The following is a description of these agreements.
71
Table of Contents
Tax Allocation Agreement
The tax allocation agreement allocates the liability for taxes. Under the tax allocation agreement, APP is responsible for and has agreed to indemnify New Abraxis against all tax liabilities to the extent they relate to APP’s hospital-based products business, and New Abraxis is responsible for and has agreed to indemnify APP against all tax liabilities to the extent they relate to New Abraxis’ proprietary products business. The tax allocation agreement also provides the extent to which, and the circumstances under which, the parties would be liable if the distribution were not to constitute a tax-free distribution under Section 355 and Section 368(a)(1)(D) of the Internal Revenue Code. In general, New Abraxis would be required to indemnify APP for any taxes resulting from a failure of the distribution to so qualify, unless such failure results solely from APP’s specified acts.
Dual Officer Agreement
APP entered into an agreement with New Abraxis under which APP and New Abraxis acknowledged and agreed that Dr. Soon-Shiong and Ms. Gopala may serve as an officer of both companies and receive compensation from either or both companies. APP also acknowledged and agreed in this agreement that neither Dr. Soon-Shiong nor Ms. Gopala will have any obligation to present to APP any business or corporate opportunity that may come to his or her attention, other than certain business opportunities relating to the manufacture or sale of products that either were manufactured and sold by the hospital-based products business prior to the separation or were the subject of an ANDA filed by APP prior to the separation and related transactions. This agreement does not ensure the continued services of either Dr. Soon-Shiong or Ms. Gopala following the separation and related transactions, restrict these individuals from resigning from APP or restrict APP’s board of directors from terminating their employment with APP. No person served as an executive officer of both New Abraxis and APP during the one year period following the distribution.
Employee Matters Agreement
APP entered into an employee matters agreement with New Abraxis, providing our respective obligations to employees and former employees who are or were associated with our respective businesses, and for other employment and employee benefit matters. Under the terms of the employee matters agreement, we generally assumed all liabilities and obligations related to employee benefits for current and former employees who are or were associated with the hospital-based products business, and New Abraxis generally assumed all liabilities and obligations related to employee benefits for current and former employees who are or were associated with the proprietary products business. Under the employee matters agreement, the parties have agreed to reimburse one another for all indemnifiable losses that each may incur on behalf of the other as a result of any of the benefit plans or any of the termination or severance obligations.
Transition Services Agreement
Pursuant to the transition services agreement, New Abraxis and APP will continue to provide to one another various services on an interim, transitional basis, for periods up to 24 months depending on the particular service. Services that New Abraxis provides to APP include legal services (e.g., assistance with SEC filings, labor and employment matters, and litigation support), financial services and corporate development. Services that APP provides to New Abraxis include information technology support, tax services, accounts payable services, internal audit services, accounts receivable services, general legal services, accounting related assistance, corporate insurance and franchise tax services, human resources, customer operations, sales and marketing support, corporate purchasing and facility services and regulatory support (including assistance with state and federal license renewals). Payments made under the transition services agreement are based on the providing party’s actual costs of providing a particular service. This agreement will terminate after a period of 24 months, but generally may be terminated earlier by either party as to specific services on certain conditions.
72
Table of Contents
Manufacturing Agreement
APP entered into a manufacturing agreement with New Abraxis, through its wholly-owned subsidiary, APP Pharmaceuticals, LLC (“New APP LLC”), for the manufacture of Abraxane® and certain of New Abraxis’ pipeline products by New APP LLC at APP’s Melrose Park and Grand Island manufacturing facilities. Under the terms of the manufacturing agreement, New Abraxis will perform certain manufacturing activities with respect to Abraxane® or other pipeline products, principally related to the formulation and compounding of the active pharmaceutical ingredients in such products, and New APP LLC will undertake the remainder of the manufacturing processes. As part of the manufacturing services, New APP LLC will also provide New Abraxis with training related to proper manufacturing practices and other related training, assistance with quality assurance and control and information technology support related to manufacturing operations. With regard to the Melrose Park and Grand Island facilities, New APP LLC will be responsible for obtaining and maintaining necessary approvals to manufacture Abraxane® or other pipeline products in compliance with the regulatory requirements applicable to the jurisdictions in which such products are sold, subject to the right to receive reimbursement from New Abraxis for the costs of such approvals in certain circumstances. New Abraxis will be responsible for obtaining and maintaining the remainder of the regulatory approvals required to sell and distribute Abraxane® both in the United States and in other jurisdictions, and New Abraxis will be responsible for the final release of the product for sale at the completion of the manufacturing process.
In the manufacturing agreement, New APP LLC agreed with New Abraxis to cap the manufacturing growth of Abraxane® and other pipeline products that New APP LLC is required to manufacture under the agreement over the term of the agreement. Further, in the event of capacity constraints at the Melrose Park or Grand Island facilities, the manufacturing agreement provides that the available capacity will be prorated between New Abraxis and New APP LLC according to the parties’ then current use of New APP LLC’s manufacturing capacity. While the manufacturing agreement allows New Abraxis to override these proration provisions, New Abraxis may only do so by paying New APP LLC additional fees under the manufacturing agreement. The fee New Abraxis would be required to pay New APP LLC to override the proration provisions of the manufacturing agreement is equal to the profit lost by New APP LLC as a result of New Abraxis’ election to override the proration provisions.
New Abraxis will pay New APP LLC a customary margin on its manufacturing costs. In addition, during each of the first three years of the manufacturing agreement, New Abraxis will pay New APP LLC a facility management fee equal to $3 million. The amount of this fee may be offset to the extent New APP employees are transferred to New Abraxis; such offset would be based upon the amount of compensation paid to such transferred employees. The term of the manufacturing agreement will end on December 31, 2011, which will be automatically extended for one year if either New APP LLC exercises its right to extend the lease on New Abraxis’ Melrose Park manufacturing facility for an additional year or New Abraxis exercises its right to extend the lease for New APP LLC’s Grand Island manufacturing facility for an additional year. (See “—Real Estate Leases” below).
The manufacturing agreement includes customary confidentiality provisions pursuant to which New Abraxis and New APP LLC will keep confidential all confidential information of the other party, subject to certain exceptions.
In addition, the manufacturing agreement contains the following indemnification provisions. New Abraxis will indemnify New APP LLC, its affiliates and its officers, directors, employees and agents (which are referred to as the “APP indemnified parties”) from any damages incurred by or assessed against them resulting from a third-party claim caused by or alleged to be caused by (i) New Abraxis’ failure to perform its obligations under the manufacturing agreement (ii) any product liability claim arising from the negligence, fraud or intentional misconduct of New Abraxis or any of its affiliates or any product liability claim arising from its manufacturing obligations (or any failure or deficiency in New Abraxis’ manufacturing obligations) under the manufacturing agreement; (iii) any claim that the manufacture, use or sale of Abraxane® or New Abraxis pipeline products infringes a patent or any other proprietary right of a third party; or (iv) any recall, product liability claim or other third-party claim not arising from the gross negligence or bad faith of, or intentional misconduct or intentional breach of the manufacturing agreement by, the APP indemnified parties. New Abraxis will also indemnify the APP indemnified parties for liabilities that they become subject to as a result of their activities under the manufacturing agreement and for which they are not responsible under the terms of the manufacturing agreement. New APP LLC will indemnify New Abraxis, and its affiliates, and their respective officers, directors, employees and agents from any damages incurred or assessed against them resulting from a third-party claim caused by or alleged to be caused by (i) New APP LLC’s gross negligence, bad faith, intentional misconduct or intentional failure to perform its obligations under the manufacturing agreement; and (ii) any product liability claim arising from the gross negligence or bad faith of, or intentional misconduct or intentional breach of the manufacturing agreement by, New APP LLC or its affiliates. The APP indemnified parties will not have any liability for monetary damages to New Abraxis or its affiliates or third parties in connection with the manufacturing agreement for damages in excess of $100 million in the aggregate, except to the extent that the damages are the result of (i) one of New APP LLC’s executive officers in bad faith affirmatively instructing their employees to intentionally breach New APP LLC’s obligation to manufacture Abraxane® or pipeline products under the manufacturing agreement or (ii) any intentional failure by New APP LLC, in bad faith, to cure any material breach of its obligation to manufacture Abraxane® or pipeline products under the manufacturing agreement following notice of this breach.
73
Table of Contents
Real Estate Leases
Following the distribution, New Abraxis owns the manufacturing facility located on Ruby Street, Melrose Park, Illinois, and the research and development and the warehouse facility, both located in the same building on N. Cornell Avenue, Melrose Park, Illinois. APP owns the manufacturing facility located in Grand Island, New York. Following the distribution, the parties entered into a series of lease agreements to facilitate continued production of their respective pharmaceutical products while a manufacturing transition plan is being implemented. Under the terms of the lease agreements, New Abraxis leases the Ruby Street facility, consisting of approximately 122,000 square feet of office, warehouse and pharmaceutical manufacturing space, to APP. The initial term of the lease expires on December 31, 2011 and may be renewed at New Abraxis’ option for one additional year if APP is manufacturing a certain level of its products at the Ruby Street facility in the period prior to the expiration of the lease. During the term of the lease, New Abraxis will have access to the Ruby Street facility to perform certain elements of the manufacturing processes of Abraxane® and other nab™ technology product candidates under the manufacturing agreement as well as, under certain circumstances, to provide contract manufacturing services to third parties. See “Manufacturing Agreement” above. In order to provide sufficient warehouse space to APP during the term of the Ruby Street lease, New Abraxis also leased the Cornell Warehouse facility, consisting of approximately 71,000 square feet of warehouse space, to APP. The initial term of the lease runs until December 31, 2011, and may be renewed at APP’s option for one additional year if the lease for the Ruby Street manufacturing facility is extended. New Abraxis also leased the Cornell R&D facility, consisting of approximately 48,000 square feet of research and development space, to APP. The initial term of the lease runs until December 31, 2010 and may be terminated upon twelve months written notice from and after January 1, 2009. This lease has no option to extend the term of the lease.
New Abraxis leased a portion of APP’s Grand Island facility, consisting of approximately 5,700 square feet of pharmaceutical manufacturing space, to allow New Abraxis to perform its obligations under the manufacturing agreement. The initial term of the lease runs until December 31, 2011, and may be renewed at New Abraxis’ option for one additional year if New Abraxis has not received regulatory approvals from the European Medicines Agency (or “EMEA”), the European equivalent to the FDA, to manufacture Abraxane® in at least two facilities (not including our Grand Island facility) by June 30, 2011.
Transactions relating to these agreements are summarized in the following table:
| Successor | Predecessor | |||||||||||||||
| Year ended December 31, 2009 |
July 2 through December 31, 2008 |
January 1 through September 9, 2008 |
Year ended December 31, 2007 |
|||||||||||||
| (in thousands) | ||||||||||||||||
| Transition service income |
$ | — | $ | — | $ | 275 | $ | 100 | ||||||||
| Facility management fees |
— | — | 2,075 | 300 | ||||||||||||
| Net rental expense |
— | — | (1,912 | ) | (200 | ) | ||||||||||
| Margins on the manufacture and distribution of Abraxane® |
— | — | 1,490 | — | ||||||||||||
At December 31, 2007, net receivable from related parties totaled $7.0 million, $6.9 million of which was related to activities under the various agreements with New Abraxis, and $0.1 related to charges associated with services rendered under these agreements.
From time to time in the ordinary course of business, APP purchases active pharmaceutical ingredients or final dosage forms from Interchem Corporation and World Gen, LLC. Joseph M. Pizza, who became a director on December 19, 2007, is the president and chief executive officer of these entities. During the year ended December 31, 2007, we purchased a total of $20.7 million of products from these entities. As of December 31, 2007, we had approximately $3.8 million in accounts payable to these entities. Mr. Pizza has not been a board member of APP since the Merger, and has never been affiliated with FKP Holding.
74
Table of Contents
13. Accrued Liabilities
Accrued liabilities consisted of the following at December 31, 2009 and December 31, 2008:
| December 31, 2009 |
December 31, 2008 | |||||||
| (in thousands) | ||||||||
| Sales and marketing |
$ | 28,099 | $ | 17,881 | ||||
| Payroll and employee benefits |
17,935 | 14,077 | ||||||
| Legal and insurance |
2,252 | 5,068 | ||||||
| Accrued interest |
7,600 | 5,903 | ||||||
| Accrued separation costs |
— | 429 | ||||||
| Other |
1,434 | 4,781 | ||||||
| $ | 57,320 | $ | 48,139 | |||||
14. Leases and Commitments
We have entered into various operating lease agreements for warehouses, office space, automobiles, communications equipment, information technology equipment and software, and office equipment. Rental expense for continuing operations amounted to $5.9 million in 2009, $1.8 million in the successor period and $4.0 million in the predecessor period in 2008 (total of $5.8 million in 2008), and $3.2 million in 2007. Rental expense is recognized on a straight-line basis.
As of December 31, 2009, total future annual minimum lease payments related to non-cancelable operating leases, are as follows:
| Year |
Total Amount | ||
| (in thousands) | |||
| 2010 |
$ | 7,231 | |
| 2011 |
3,531 | ||
| 2012 |
1,662 | ||
| 2013 |
1,586 | ||
| 2014 |
1,581 | ||
| 2015 and thereafter |
1,437 | ||
| $ | 17,028 | ||
15. Employee Benefit Plan
APP sponsors a 401(k) defined-contribution plan, or 401(k) Plan, covering substantially all eligible employees. Employee contributions to the 401(k) Plan are voluntary. APP makes a qualified non-elective contribution to this plan in an amount equal to 3% of all eligible employees’ compensation, regardless of participation in the plan, with such employer contributions vesting immediately. Participants’ contributions are limited to their annual tax deferred contribution limit as allowed by the Internal Revenue Service. APP’s total matching contributions to the 401(k) Plan on a continuing operations basis were $2.8 million in 2009, $0.8 million in the 2008 successor period and $1.6 million in the 2008 predecessor period (a total of $2.4 million in 2008), and $2.1 million in 2007. APP may contribute additional amounts to the 401(k) Plan at its discretion, however APP has never made a discretionary contribution to the 401(k) Plan.
16. Stockholder’s Equity
For accounting purposes, the September 10, 2008 Merger with Fresenius resulted in the cancellation of all outstanding shares of APP. In connection with its establishment, FKP Holdings issued 1,000 shares of its common stock to its direct parent, Fresenius Kabi AG.
Common Stock Voting Rights
The holders of both our common stock and that of our Predecessor are entitled to one vote for each share held of record upon such matters and in such manner as may be provided by law.
75
Table of Contents
Dividends
As part of the separation and distribution, APP distributed on a pro rata basis to holders of record of its common stock on November 13, 2007 one share of New Abraxis common stock for every four shares of APP common stock held on that date, or 39.9 million common stock shares (see Note 6 to the consolidated financial statements – Discontinued Operations—Spin-off of New Abraxis above for more information). Other than the distribution of New Abraxis, APP never paid a dividend on any class of stock.
Under the terms of its various debt agreements, FKP Holdings has restrictions on paying cash dividends in the future. The CVR holders have no rights to dividends.
Treasury Stock
All treasury shares held by our Predecessor were cancelled as part of the separation and distribution of New Abraxis on November 13, 2007.
17. Stock Options
Effective with the Merger, all outstanding “in the money” stock options and restricted stock units of APP were accelerated and became immediately 100% vested and were exercised in accordance with the terms of the Merger Agreement. “In the money” stock options were stock options with an exercise price less than the cash consideration of $23.00 plus the maximum CVR payment. In exchange, the holders received common shares, which were converted into the right to receive $23.00 in cash without interest, and one Contingent Value Right (“CVR”), issued by FKP Holdings and representing the right to receive a cash payment without interest of up to $6.00, as determined in accordance with the terms of the CVR Indenture. All “out of the money” stock options, which were stock options with an exercise price more than the combination of the Merger cash consideration of $23.00 plus the maximum CVR payment, were cancelled upon the closing of the Merger. As a result, all APP stock-based incentive plans were terminated as of the Merger date of September 10, 2008.
Prior to the Merger, APP sponsored the following stock compensation plans:
1997 Stock Option Plan
Under the 1997 Stock Option Plan, or the 1997 Plan, options to purchase shares of APP common stock were granted to certain employees and the directors with an exercise price equal to the estimated fair market value of APP’s common stock on the date of grant. The 1997 Plan stock options were vested upon completion of APP’s initial public offering in December 2001.
2001 Stock Incentive Plan
The 2001 Stock Incentive Plan, or the 2001 Plan, provided for the grant of incentive stock options and restricted stock to APP’s employees, including officers and employee directors non-qualified stock options to employees, directors and consultants and other types of awards. Except as determined by APP’s compensation committee, the number of shares reserved for issuance increased annually on the first day of each fiscal year by an amount equal to the lesser of a) 6,000,000 shares, b) 5% of the total number of shares outstanding as of that date or c) a number of shares as determined by APP’s Board of Directors.
The compensation committee of APP’s Board of Directors administered the 2001 Plan and had the authority to determine the terms and conditions of awards, including the types of awards, the number of shares subject to each award, the vesting schedule of the awards and the selection of the grantees. The exercise price of all options granted under the 2001 Plan was determined by the compensation committee of APP’s Board of Directors, but in no event could this price be less than the fair market value of APP’s common stock on the date of grant.
2001 Non-Employee Director Stock Option Program
The 2001 Non-Employee Director Stock Option Program, or the 2001 Program, was adopted as part, and is subject to the terms and conditions, of the 2001 Plan. The 2001 Program established a program for the automatic grant of awards to APP’s non-employee directors at the time that they initially joined the board, and at each annual meeting of the stockholders at which they were elected.
76
Table of Contents
Restricted Stock
Upon vesting, each restricted unit entitled the holder to one share of APP’s common stock. Compensation expense related to restricted stock grants was based upon the market price of APP’s common stock on the date of grant and was charged to operations on a straight-line basis over the applicable vesting period. Restricted stock units granted generally vested ratably over a four year period.
Restricted Unit Plan
In connection with the separation with Abraxis Bioscience, APP assumed the restricted units previously granted to its employees under the American BioScience Restricted Unit Plan II. Those awards became governed under the APP Pharmaceuticals, Inc. Restricted Stock Unit Plan (the “RSU Plan”). Shares of APP’s common stock were issuable upon the vesting of these units. The units issued under the RSU Plan vested one-half on April 18, 2008 (which was the second anniversary of the closing of the merger between Old Abraxis, then known as American Pharmaceutical Partners, and American BioScience). The balance of the shares were scheduled to vest on April 18, 2010, but were accelerated in connection with the Merger. The restricted stock units entitled their holders to receive a number of APP’s shares of common stock on each vesting date determined by taking the value of the vested portion of the award divided by APP’s average trading price over the three days prior to vesting; except that if the average trading price of APP’s stock was less than $14.47, then the notional price was divided by $14.47. The maximum number of APP’s shares that could be issued under this restricted unit plan was 345,542 shares.
Pursuant to an agreement between Old Abraxis and RSU Plan LLC (“RSU LLC”), RSU LLC agreed that prior to the date on which restricted stock units issued pursuant to the RSU Plan became vested, RSU LLC would deliver, or cause to be delivered, to APP the number of its shares of common stock or cash (or a combination thereof) in an amount sufficient to satisfy APP’s obligations relative to vested restricted units under the RSU Plan. APP was required to satisfy its obligations under the RSU Plan by paying to the participant’s cash and/or shares of its common stock in the same proportion as was delivered by the RSU LLC. The intention of this agreement was to have RSU LLC satisfy APP’s obligations under the RSU Plan so that there would not be any further dilution to APP’s stockholders as a result of APP’s assumption of certain awards under the American BioScience Restricted Unit Plan II. Effective with the Merger, all outstanding RSU’s of APP became immediately vested, were exercised and were exchanged for APP common shares, which were converted into the right to receive $23.00 in cash, without interest, and one Contingent Value Right (“CVR”).
At September 10, 2008, 373,279 restricted shares were outstanding under our 2001 Stock Incentive Plan with a weighted average per share market value of $12.82. All of these restricted shares were vested effective with the Merger. At December 31, 2007 487,397 restricted shares were outstanding with a weighted average per share market value of $12.56. During the successor period 94,754 restricted shares vested with a weighted average per share market value of $11.71 and 19,364 restricted shares were forfeited with a weighted average per share market value of $11.99. There were no unvested restricted shares outstanding at December 31, 2008.
Excluding the effects of discontinued operations, stock based compensation costs for RSU awards were $0 million in 2008 successor period and $3.1 million in the 2008 predecessor period (a total of $3.1 million in 2008), and $6.0 million in 2007.
Employee Stock Purchase Plan
Under the 2001 Employee Stock Purchase Plan, or the ESPP, eligible employees could contribute up to 10% of their base earnings toward the semi-annual purchase and issuance of APP common stock. The employees’ purchase price was equal to the lesser of 85% of the fair market value of the stock on the first business day of the offer period, or 85% of the fair market value of the stock on the last business day of the semi-annual purchase period. Employees could purchase no more than 625 shares of APP’s common stock within any given purchase period. An aggregate of 9,238,726 shares of APP’s common stock were reserved for issuance under the ESPP at December 31, 2007. The ESPP provided for annual increases in the number of shares of APP’s common stock issuable under the ESPP equal to the lesser of: a) 3,000,000 shares; b) a number of shares equal to 2% of the total number of shares outstanding; or c) a number of shares as determined by APP’s Board of Directors. On August 7, 2007, in connection with the separation of Old Abraxis’ proprietary products business, Old Abraxis’ Compensation Committee indefinitely suspended the ESPP from and after completion of the purchase period that ended on July 31, 2007.
Stock Options
Prior to the Merger, APP accounted for stock-based compensation in accordance with SFAS 123(R), which requires the recognition of compensation cost for all share-based payments, including employee stock options, at fair value. Our Predecessor utilized the straight-line attribution method to recognize share-based compensation expense over the vesting period of the award. Options granted generally expired ten years from the grant date and vested ratably over a four-year period.
77
Table of Contents
APP adjusted stock-based compensation on a quarterly basis for revisions to the estimated rate of equity award forfeitures based on actual forfeiture experience. The effect of adjusting the forfeiture rate for all periods after January 1, 2005 was recognized in the period the forfeiture estimate was changed. During the fourth quarter of 2007, APP revised the estimated forfeiture rate with respect to stock options. The fair values of options granted during the 2008 predecessor period and the years ended December 31, 2007 were determined using the Black-Scholes option pricing model, which incorporates various assumptions. The risk-free rate of interest for the average contractual life of the option is based on the U.S. Treasury yield curve in effect at the time of grant. The dividend yield is zero as APP had not and did not anticipate paying any dividends. The expected term of awards granted is based upon the historical exercise patterns of the participants in APP’s plans and the expected volatility is based on the historical volatility of APP’s stock over the expected term of the award. The weighted average estimated values of employee stock option grants and rights granted under APP’s employee stock purchase plan as well as the weighted average assumptions that were used in calculating such values during the periods were based on estimates at the date of grant as follows:
| September 9, 2008 |
December 31, 2007 |
|||||||
| Stock Options |
||||||||
| Risk-free rate |
4.1 | % | 4.1 | % | ||||
| Dividend yield |
— | — | ||||||
| Expected life in years |
5 | 5 | ||||||
| Volatility |
55 | % | 55 | % | ||||
| Fair value of options granted |
$ | 459,315 | $ | 1,440,389 | ||||
| Weighted average grant date fair value of options granted |
$ | 6.12 | $ | 5.76 | ||||
| Employee Stock Purchase Plan |
||||||||
| Risk-free rate |
— | 4.0 | % | |||||
| Dividend yield |
— | — | ||||||
| Expected life in years |
— | 1.2 | ||||||
| Volatility |
— | 60 | % | |||||
Additional information with respect to APP’s stock option activity for 2007 and the 2008 period through the date of the Merger is as follows:
| Options Outstanding | Exercisable Options | |||||||||||
| Shares | Weighted Average Exercise Price |
Shares | Weighted Average Exercise Price | |||||||||
| Outstanding at December 31, 2006 |
3,971,871 | $ | 23.81 | 1,783,696 | $ | 14.94 | ||||||
| Granted |
437,000 | $ | 23.41 | |||||||||
| Exercised |
(398,871 | ) | $ | 8.17 | ||||||||
| Forfeited |
(363,285 | ) | $ | 35.15 | ||||||||
| Outstanding at November 13, 2007 |
3,646,715 | $ | 24.39 | $ | 1,960,183 | $ | 20.18 | |||||
| Separation Conversion(1) |
(514,245 | ) | ||||||||||
| Granted |
42,500 | $ | 10.28 | |||||||||
| Exercised |
(39,468 | ) | $ | 4.91 | ||||||||
| Forfeited |
(27,786 | ) | $ | 15.67 | ||||||||
| Outstanding at December 31, 2007 |
3,107,716 | $ | 12.95 | 1,695,836 | $ | 10.83 | ||||||
| Granted |
75,000 | $ | 13.67 | |||||||||
| Exercised |
(849,853 | ) | $ | 9.19 | ||||||||
| Forfeited |
(151,731 | ) | $ | 13.82 | ||||||||
| Merger Conversion(2) |
(2,181,132 | ) | $ | 14.38 | ||||||||
| Outstanding at December 31, 2008 |
— | $ | — | — | $ | — | ||||||
| (1) | As part of the separation, stock options relating to employees of New Abraxis were eliminated and stock options for our employees were converted to reflect the adjusted value of the options post-separation. The number of options outstanding on the split date and the associated exercise prices were converted at a rate of 1.9533, which was based on our closing stock price for the 10 consecutive trading days preceding and 10 consecutive trading days following the separation. No additional stock compensation expense resulted from the modifications made due to the anti-dilutive provisions related to the plan. |
| (2) | Effective with the Merger, all outstanding stock options and restricted stock units of APP were immediately vested into common shares and were converted into the right to receive $23.00 in cash without interest and one Contingent Value Right issued by FKP Holdings and representing the right to receive a cash payment without interest of up to $6.00 as determined in accordance with the terms of the CVR Indenture. |
78
Table of Contents
18. Income Taxes
The provision (benefit) for income taxes from continuing operations consists of the following:
| Successor | Predecessor | |||||||||||||||||||||
| Year Ended December 31, |
July 2 through December 31, |
January 1 through September 9, |
Year Ended December 31, | |||||||||||||||||||
| 2009 | 2008 | 2008 | 2008 | 2007 | ||||||||||||||||||
| (in thousands) | ||||||||||||||||||||||
| Current: |
||||||||||||||||||||||
| Federal |
$ | (14,644 | ) | $ | (14,348 | ) | $ | 33,691 | $ | 19,343 | $ | 49,925 | ||||||||||
| State |
6,153 | (1,791 | ) | 4,373 | 2,582 | 8,788 | ||||||||||||||||
| Foreign |
3,648 | 2,058 | 4,305 | 6,363 | 4,376 | |||||||||||||||||
| Total current |
(4,843 | ) | (14,081 | ) | 42,369 | 28,288 | 63,089 | |||||||||||||||
| Deferred: |
||||||||||||||||||||||
| Federal |
(3,085 | ) | (8,085 | ) | (1,861 | ) | (9,946 | ) | (7,381 | ) | ||||||||||||
| State |
(9,522 | ) | (4,225 | ) | (193 | ) | (4,418 | ) | (707 | ) | ||||||||||||
| Total deferred |
(12,607 | ) | (12,310 | ) | 2,054 | (14,364 | ) | (8,088 | ) | |||||||||||||
| Total (benefit) provision for income taxes |
$ | (17,450 | ) | $ | (26,391 | ) | $ | 40,315 | $ | 13,924 | $ | 55,001 | ||||||||||
A reconciliation of the federal statutory rate to our effective tax rate is as follows (in %):
| Successor | Predecessor | ||||||||||||||||
| Year Ended December 31, |
July 2, through December 31, |
January 1, through September 9, |
Year Ended December 31, | ||||||||||||||
| 2009 | 2008 | 2008 | 2008 | 2007 | |||||||||||||
| Tax provision at statutory federal rate |
35.0 | % | 35.0 | % | 35.0 | % | 35.0 | % | 35.0 | % | |||||||
| State income taxes, net of federal income tax benefit |
5.5 | 1.2 | 5.5 | 0.4 | 3.8 | ||||||||||||
| In-process research and development charge |
— | (37.8 | ) | — | (44.3 | ) | — | ||||||||||
| Research and development tax credits |
— | — | — | — | (0.7 | ) | |||||||||||
| Foreign rate differential |
(14.5 | ) | (0.9 | ) | 11.2 | (2.9 | ) | 6.2 | |||||||||
| Domestic production activities deduction |
— | (0.2 | ) | (2.3 | ) | 0.1 | (2.1 | ) | |||||||||
| Stock based compensation |
(0.3 | ) | — | (3.2 | ) | 0.6 | 1.0 | ||||||||||
| Nondeductible transaction costs |
(0.4 | ) | — | 31.8 | (5.5 | ) | — | ||||||||||
| Shutdown of Puerto Rico |
13.7 | — | — | — | — | ||||||||||||
| Change in CVR liability |
6.4 | 10.5 | — | 12.3 | — | ||||||||||||
| Other items |
(2.8 | ) | 0.1 | 1.2 | (0.1 | ) | (2.3 | ) | |||||||||
| Change in FIN 48 liability |
(5.6 | ) | — | 0.1 | — | (0.8 | ) | ||||||||||
| Valuation allowance |
(0.5 | ) | (0.1 | ) | 1.6 | (0.4 | ) | — | |||||||||
| Income tax expense |
36.5 | % | 7.8 | % | 80.9 | % | (4.8 | )% | 40.1 | % | |||||||
79
Table of Contents
Deferred tax assets and liabilities consist of the following:
| December 31, | ||||||||
| 2009 | 2008 | |||||||
| (in thousands) | ||||||||
| Deferred tax assets: |
||||||||
| Inventory |
$ | 9,390 | $ | 6,105 | ||||
| Interest rate swap |
12,145 | 20,308 | ||||||
| Net operating loss and credit carryforwards |
8,568 | 3,188 | ||||||
| Accrued interest |
5,030 | 5,404 | ||||||
| Other accruals and reserves |
5,259 | 2,447 | ||||||
| Gross deferred tax assets |
40,392 | 37,452 | ||||||
| Less: Valuation allowance |
— | (1,002 | ) | |||||
| Gross deferred tax assets |
40,392 | 36,450 | ||||||
| Deferred tax liabilities: |
||||||||
| Intangible asset amortization |
(88,426 | ) | (98,810 | ) | ||||
| Depreciation |
(4,428 | ) | (4,962 | ) | ||||
| Foreign exchange |
(952 | ) | — | |||||
| Prepaid expenses |
(799 | ) | — | |||||
| Foreign earnings repatriation |
(4,500 | ) | (1,200 | ) | ||||
| Total deferred tax liabilities |
(99,105 | ) | (104,972 | ) | ||||
| Net deferred tax liability |
$ | (58,713 | ) | $ | (68,522 | ) | ||
Deferred tax assets are recognized if, in management’s judgment, it is more likely than not that, such assets will be realized. The Company had determined that it cannot conclude that it is more likely than not that the deferred tax assets related to the carryover of net operating losses in Puerto Rico will be realized. Accordingly, the Company recorded a valuation allowance of $1.0 million related to these future deductible amounts as of December 31, 2008. This total represented the entire deferred tax asset resulting from the Puerto Rican loss carryovers. Because of the decision to shut down the Puerto Rican plant, the deferred tax asset relating to the net operating losses in Puerto Rico was written off in September 2009, as was the related valuation allowance. There was no net effect to income tax expense. Management believes that all other deferred tax assets will be fully realized.
New APP and New Abraxis entered into a series of agreements in connection with the separation, including a tax allocation agreement. Refer to Note 12 to the consolidated financial statements—Related Party Transactions for further details.
Our Predecessor adopted the guidance on accounting for uncertainty in income taxes on January 1, 2007. The effect of the implementation of this guidance was not material. The following is a rollforward of our total gross unrecognized tax benefits for the year- ended December 31, 2009 (in thousands). Of the total amount of unrecognized the total tax benefits of $17.2 million, all would affect the effective rate if recognized in future periods.
| For the Year Ended December, 31, 2009 |
||||
| Beginning balance |
$ | 2,714 | ||
| Additions for tax positions related to current year |
13,189 | |||
| Additions for tax positions related to prior years |
3,000 | |||
| Reductions for tax positions of prior years |
(1,747 | ) | ||
| Ending balance |
$ | 17,156 | ||
A portion of the change in unrecognized tax benefits during the year affected goodwill. The following table summarizes the changes in the unrecognized tax benefits:
| Income Tax Expense |
Goodwill | Payments | Total | ||||||||||||
| Additions for tax positions related to current year |
2,556 | 10,633 | 13,189 | ||||||||||||
| Additions for tax positions related to prior years |
3,000 | 3,000 | |||||||||||||
| Reductions for tax periods of prior years |
(1,572 | ) | (175 | ) | (1,747 | ) | |||||||||
| Total |
$ | 2,556 | $ | 12,061 | $ | (175 | ) | $ | 14,442 | ||||||
80
Table of Contents
We recognize interest and penalties related to unrecognized tax benefits in income tax expense. At December 31, 2009, we had accrued $0.4 million for the payment of such interest.
We and our subsidiaries file income tax returns in the US Federal jurisdiction, Canada, Puerto Rico, and various state jurisdictions. We are currently undergoing a US federal income tax examination for calendar years 2006 and 2007, and are subject to US federal income tax examination for calendar year 2008. We are also subject to Canadian income tax examinations for the 2005 through 2008 tax years, and to Puerto Rican income tax examinations for the 2006 through 2008 tax years. Additionally, we are subject to various state income tax examinations for the 2003 through 2008 tax years. We are currently under state income tax examinations in California, Illinois, New York and North Carolina for various tax years. There are no other open federal, state, or foreign government income tax audits at this time.
19. Regulatory Matters
We are subject to regulatory oversight by the FDA and other regulatory authorities with respect to the development and manufacturing of our products. Failure to comply with regulatory requirements can have a significant effect on our business and operations. Management has designed and operates a system of controls to attempt to ensure compliance with regulatory requirements.
20. Litigation
We are from time to time subject to claims and litigation arising in the ordinary course of business. These claims have included assertions that our products infringe existing patents, allegations of product liability and also claims that the uses of our products have caused personal injuries. We believe we have substantial defenses in these matters, however litigation is inherently unpredictable. Consequently any adverse judgment or settlement could have a material adverse effect on our results of operations, cash flows or financial condition for a particular period. We record accruals for such contingencies to the extent that we conclude a loss is probable and the amount can be reasonably estimated. We also record receivables for probable and estimable insurance recoveries from third party insurers.
Summarized below are the more significant legal matters pending to which we are a party:
Patent Litigation
Pemetrexed Disodium
We have filed an abbreviated new drug application, or “ANDA”, seeking approval from the FDA to market pemetrexed disodium for injection, 500 mg/vial. The Reference Listed Drug for APP’s ANDA is Alimta®, a chemotherapy agent for the treatment of various types of cancer marketed by Eli Lilly. Eli Lilly is believed to be the exclusive licensee of certain patent rights from Princeton University. We notified Eli Lilly and Princeton University of our ANDA filing pursuant to the provisions of the Hatch-Waxman Act and, in June 2008, Eli Lilly and Princeton University filed a patent infringement action in the U.S. District Court for the District of Delaware seeking to prevent us from marketing this product until after the expiration of U.S. Patent 5,344,932, which is alleged to expire in 2016. We filed our Answer and Counterclaims in August 2008 and trial is scheduled for November 2010.
Naropin®
In March 2007 we filed a complaint for patent infringement against Navinta LLC in the U.S District Court for the District of New Jersey. Navinta filed an ANDA seeking approval from the FDA to market ropivacaine hydrochloride injection, in the 2 mg/ml, 5 mg/ml and 10 mg/ml dosage forms. The Reference Listed Drug for Navinta’s ANDA is APP’s proprietary product Naropin®. This matter proceeded to trial on July 20, 2009. The U.S. District Court, District of New Jersey reached a judgment in favor of the Company on August 3, 2009, determining that Navinta’s ANDA product infringed on the Company’s proprietary product Naropin. The judgment has been appealed by Navinta.
81
Table of Contents
Oxaliplatin
The Company filed ANDAs to market oxaliplatin for injection, 10 mg and 50mg vials, and oxaliplatin injection, in 5mg/ml, 10ml, 20ml and 40 ml dosage forms. The Reference Listed Drug is the chemotherapeutic agent Eloxatin® marketed by Sanofi-Aventis that is approved for the treatment of colorectal cancer. Sanofi-Aventis is believed to be the exclusive licensee of certain patent rights from Debiopharm. We notified Sanofi-Aventis and Debiopharm of the ANDA filings pursuant to the provisions of the Hatch-Waxman Act, and Sanofi-Aventis and Debiopharm filed a patent infringement action in the U.S. District Court for the District of New Jersey seeking to prevent us from marketing these products until after the expiration of various U.S. patents. Multiple cases proceeding against other generic drug manufacturers including a subsidiary of Fresenius Kabi were consolidated pursuant to a pre-trial scheduling order in April 2008. The defendants motion for summary judgment on one of the patent’s at issue was granted and an order entered by the U.S. District Court. The order was successfully challenged by Sanofi-Aventis and on November 17, 2009, Sanofi-Aventis’s motion seeking a preliminary injunction to prevent sales of oxaliplatin by generic drug manufacturers was heard. Instead of ruling on the matter, the Judge has encouraged the parties to settle. A settlement hearing is scheduled for March 9, 2010.
Bivalirudin
We have filed an ANDA seeking approval from the FDA to market generic bivalirudin, 250 mg/vial for intravenous injection. The reference listed drug for APP’s ANDA is Angiomax, for use as an anticoagulant in patients with unstable angina and currently marketed by The Medicines Co. The Medicines Co. is believed to be the exclusive assignee of certain patent rights from Gopal Krishna and Gary Musso. The patent, alleged to be generally directed to bivalirudin compositions, was issued on September 1, 2009. APP notified The Medicines Co. of our ANDA filing pursuant to the provisions of the Hatch-Waxman Act, and on October 8, 2009, The Medicines Co. fled a patent infringement action in the United States District Court for the District of Delaware seeking to prevent APP from marketing this product until after its expiration. We filed our Answer and Counterclaims on December 9, 2009. The Medicines Co. filed its response on December 28, 2009. APP currently has a motion pending for Judgment on the Pleadings to remove allegations of willfullness. No status conference has been scheduled yet.
Gemcitabine
We have filed an ANDA seeking approval from the FDA to market gemcitabine for injection, 200 mg base/vial, 1 g base/vial and 2 g base/vial. The reference listed drug for APP’s ANDA is Gemzar, for use as a treatment for non-small lung cancer, pancreatic cancer, breast cancer and ovarian cancer. Eli Lilly is the holder of the New Drug Application for Gemzar and is believed to the owner of the patent rights, which is set to expire on November 7, 2012, followed by a six month period of pediatric market exclusivity ending on May 7, 2013. APP notified Eli Lilly of our ANDA filing pursuant to the provisions of the Hatch-Waxman Act on November 4, 2009. On December 16, 2009, Eli Lilly filed a patent infringement action in the United States District Court in the Southern District of Indiana seeking to prevent APP from marketing this product until after its expiration. APP was served on January 7, 2010 and expects to file its response in March.
Product Liability Matters
Sensorcaine
We have been named as a defendant in approximately one hundred and thirteen personal injury/product liability actions brought against us and other pharmaceutical companies and medical device manufacturers by plaintiffs claiming that they suffered injuries resulting from the post-surgical release of certain local anesthetics into the shoulder joint via a pain pump. We acquired several generic anesthetic products from AstraZeneca in June 2006. Pursuant to the Asset Purchase Agreement with AstraZeneca we are responsible for indemnifying Astra Zeneca for defense of suits alleging injuries occurring after the acquisition date (unless the drugs are determined to be defective in manufacturing, in which case AstraZeneca will indemnify us pursuant to that certain Manufacturing and Supply Agreement entered into by us and AstraZeneca). Likewise Astra Zeneca agreed to indemnify us for suits alleging injuries occurring prior to the acquisition date. Forty of the actions involve an alleged event after the acquisition date. All of our local anesthetic products are approved by the FDA and continue to be marketed and sold to customers. Since December 2009, more than 100 cases naming APP or New Abraxis have been dismissed due to lack of product identification or failure to plead with sufficient specificity to withstand a Motion to Dismiss
The cases have been filed in various jurisdictions around the country, including Indiana, Kentucky, New York, Colorado, Ohio, Minnesota, and California. Some are in state court, and most are in federal court. Discovery has just begun in most cases. We anticipate additional cases will be filed throughout the U.S. and we maintain product liability insurance for these matters. In December 2009, a group of plaintiffs filed a renewed motion to create a multi district litigation (“MDL”) in the United States District of Minnesota. Various plaintiffs and defendants have requested transfers to different districts. An MDL panel recently denied plaintiffs’ motion for an expedited hearing date and will hear the motion on a date yet to be determined.
82
Table of Contents
Aredia and Zometa
We have been named as a defendant in approximately 30 personal injury/product liability cases brought against us and other manufacturers by plaintiffs claiming that they suffered injuries resulting from the use of pamidronate (the generic equivalent of Aredia®) prescribed for the management of metastic bone disease. Plaintiffs’ allege Aredia causes osteonecrosis to the jaw. Four cases have been consolidated into multi-district litigation before the Court in the U.S. District Court, Middle District Tennessee. We filed answers in three of the cases and filed a joinder in October 2008 with another defendant’s Motion to Dismiss for failure to serve the plaintiff’s complaint within 120 days of filing. The case was dismissed in November 2008. Defendants in these cases are opposed to the multi-district litigation Court issuing a remand order, and a ruling on this issue is pending before a United States Judicial Panel. Until a decision is reached, discovery in these cases remains stayed. Recently, four additional cases have been filed against us in a coordinated proceeding in the Superior Court of New Jersey, Middlesex County. One of those four complaints has yet to be served. Discovery has not yet started in these cases.
On December 2, 2009, nine cases naming APP were transferred to an MDL in the Eastern District of New York. Seven of the nine cases have been served on APP. At a January 26, 2010 status conference, the MDL Judge ordered the parties to begin product identification discovery and has ordered a progress report by April 26, 2010. Meanwhile, there are currently eleven cases filed against APP in a coordinated proceeding in New Jersey.
Heparin
We have been named as a defendant in three personal injury/product liability cases brought against us and other manufacturers claiming that they suffered side effects from heparin-induced thrombocytopenia (“HIT”). The cases reside in the United States District Court of New Jersey (Middlesex) and the United States District Court of West Virginia. Product identification discovery is underway in all three cases.
Breach of Contract Matters
On February 9, 2005, Pharmacy, Inc. filed suit against us in the U.S. District Court for the Eastern District of New York alleging our predecessor breached an Asset Purchase Agreement entered into September 30, 2002 by the parties. In its complaint Pharmacy seeks to recover monetary damages and other relief for the alleged breach of the contract. Discovery and dispositive motions have been substantially completed and the parties submitted an amended pre-trial order on December 10, 2008. The parties participated in a court ordered mediation which resulted in the Company agreeing to pay Pharmacy $3 million in consideration for a settlement and release of all claims with respect to this matter. The funds were paid in October 2009 and the case has been dismissed by the court.
21. Total Net Revenue by Product Line
Total net revenue by product line was as follows:
| Successor | Predecessor | |||||||||||||
| Year Ended December 31, 2009 |
July 2, through December 31, 2008 |
January 1, through September 9, 2008 |
2007 | |||||||||||
| (in thousands) | ||||||||||||||
| Critical care |
$ | 576,574 | $ | 173,055 | $ | 303,036 | $ | 399,456 | ||||||
| Anti-infective |
226,035 | 80,075 | 145,199 | 192,596 | ||||||||||
| Oncology |
78,108 | 23,835 | 41,486 | 54,736 | ||||||||||
| Contract manufacturing and other |
7,969 | 3,871 | 6,076 | 586 | ||||||||||
| Total net revenue |
$ | 888,686 | $ | 280,836 | $ | 495,797 | $ | 647,374 | ||||||
Our top ten products comprised approximately 58% of our total net revenue for the year ended December 31, 2009, with the top five products accounting for 48% of our total net revenue. We continue to derive a large percentage of our revenue through a small number of GPOs. Currently, fewer than ten GPOs control a large majority of sales to hospital customers.
83
Table of Contents
22. Unaudited Quarterly Financial Data
Selected quarterly data for 2009 and 2008 is as follows:
| Year Ended December 31, 2009 | |||||||||||||||
| First | Second | Third | Fourth | ||||||||||||
| (in thousands) | |||||||||||||||
| Net revenue |
$ | 192,197 | $ | 215,335 | $ | 224,654 | $ | 256,500 | |||||||
| Gross profit |
100,020 | 109,766 | 107,884 | 117,459 | |||||||||||
| Income (loss) from continuing operations |
(11,105 | ) | (3,694 | ) | (61,226 | ) | 45,640 | ||||||||
| Net income (loss) |
$ | (11,105 | ) | $ | (3,694 | ) | $ | (61,226 | ) | $ | 45,640 | ||||
| Year Ended December 31, 2008 | ||||||||||||||||||||
| Predecessor | Successor | |||||||||||||||||||
| July 1, through September 9, |
July 2, through September 30, |
|||||||||||||||||||
| First | Second | 2008 | 2008 | Fourth | ||||||||||||||||
| (in thousands) | ||||||||||||||||||||
| Net revenue |
$ | 148,079 | $ | 197,918 | $ | 149,800 | $ | 48,080 | $ | 232,756 | ||||||||||
| Gross profit |
70,063 | 94,148 | 81,348 | 13,302 | 97,061 | |||||||||||||||
| Income (loss) from continuing operations |
9,157 | 23,892 | (23,506 | ) | (218,355 | ) | (94,090 | ) | ||||||||||||
| Net income (loss) |
$ | 9,157 | $ | 23,892 | $ | (23,506 | ) | $ | (218,355 | ) | $ | (94,090 | ) | |||||||
| Item 9. | CHANGES IN AND DISAGREEMENTS WITH ACCOUNTANTS ON ACCOUNTING AND FINANCIAL DISCLOSURE |
None.
| Item 9A. | CONTROLS AND PROCEDURES |
(a) Evaluation of disclosure controls and procedures.
We maintain disclosure controls and procedures, as such term is defined under Exchange Act Rules 13a-15(e) and 15d-15(e), that are designed to ensure that information required to be disclosed by us in the reports that we file or submit under the Exchange Act is recorded, processed, summarized and reported within the time periods specified in the SEC’s rules and forms, and that such information is accumulated and communicated to management, including our Chief Executive Officer and our Chief Financial Officer, to allow timely decisions regarding required disclosures. In designing and evaluating our disclosure controls and procedures, we recognize that any controls and procedures, no matter how well designed and operated, can only provide reasonable assurance of achieving the desired control objectives and in reaching a reasonable level of assurance we necessarily are required to apply judgment in evaluating the cost-benefit relationship of possible controls and procedures. Our management, with participation of our Chief Executive Officer and Chief Financial Officer, evaluated the effectiveness of our disclosure controls and procedures as of the end of the fiscal year covered by this report. Based on their evaluation and subject to the foregoing, management concluded that our disclosure controls and procedures were effective as of December 31, 2009.
(b) Management’s Report on Internal Control Over Financial Reporting
The management of Fresenius Kabi Pharmaceuticals Holding, Inc. is responsible for establishing and maintaining adequate internal control over financial reporting as such term is defined in Exchange Act Rules 13a-15(f) and 15d-15(f). FKPH Holdings’ internal control over financial reporting was designed to provide reasonable assurance to the Company’s management and Board of Directors regarding the preparation and fair presentation of published financial statements.
All internal control systems, no matter how well designed, have inherent limitations. Therefore, even those systems determined to be effective can provide only reasonable assurance with respect to financial statement preparation and presentation.
Under the supervision and participation of the Company’s Chief Executive Officer and Chief Financial Officer, management conducted an evaluation of the effectiveness of the Company’s internal control over financial reporting as of December 31, 2009, based on the framework established by the Committee of Sponsoring Organizations of the Treadway Commission in Internal Control — Integrated Framework (commonly referred to as the COSO framework). Based on its evaluation, management concluded that the Company’s internal control over financial reporting was effective as of December 31, 2009, based on the criteria outlined in the COSO framework.
84
Table of Contents
This annual report does not include an attestation report of the Company’s independent registered public accounting firm regarding internal control over financial reporting. Management’s report was not subject to attestation by the Company’s independent registered public accounting firm pursuant to the temporary rules of the Securities and Exchange Commission that permit the Company to provide only management’s report in this annual report.
(c) Changes in internal controls.
Management has determined that, as of December 31, 2009, there were no changes in our internal control over financial reporting, as such term is defined in Exchange Act Rules 13a-15(f) and 15d-15(f), that occurred during our most recent fiscal quarter that have materially affected, or are reasonably likely to materially affect, our internal control over financial reporting.
| Item 9B. | OTHER INFORMATION |
None.
We are omitting Part III, Items 10, 11, 12, 13 and 14 and will incorporate such items by reference to an amendment to this Annual Report on Form 10-K.
| Item 15. | EXHIBITS, FINANCIAL STATEMENT SCHEDULE AND REPORTS ON FORM 8-K |
a. (1) Financial Statements
The following consolidated financial statements of Fresenius Kabi Pharmaceuticals Holding, Inc. are included in Part II, Item 8 of this Report:
Reports of Independent Registered Public Accounting Firms
Consolidated Balance Sheets at December 31, 2009 and 2008
Consolidated Statements of Operations for the year ended December 31, 2009 and for the successor period from July 2, 2008 through December 31, 2008, predecessor period from January 1, 2008 through September 9, 2008, and the year ended December 31, 2007
Consolidated Statements of Stockholders’ Equity for the year ended December 31, 2009 and for the successor period from July 2, 2008 through December 31, 2008, predecessor period from January 1, 2008 through September 9, 2008, and the year ended December 31, 2007
Consolidated Statements of Cash Flows for the year ended December 31, 2009 and for the successor period from July 2, 2008 through December 31, 2008, predecessor period from January 1, 2008 through September 9, 2008, and the year ended December 31, 2008, 2007
Notes to Consolidated Financial Statements
| (2) | Financial Statement Schedule |
The following consolidated financial statement schedule of Fresenius Kabi Pharmaceuticals Holding, Inc. is filed as part of this Report:
Schedule II. Valuation and Qualifying Accounts and Reserves for the year ended December 31, 2009 and for the successor period from July 2, 2008 through December 31, 2008, predecessor period from January 1, 2008 through September 9, 2008, and the year ended December 31, 2007
All other schedules are omitted because the required information is not present or is not present in amounts sufficient to require submission of the schedule or because the information required is given in the consolidated financial statements or the notes thereto.
85
Table of Contents
| (3) | Exhibits |
The exhibits are as set forth in the Exhibit Index.
86
Table of Contents
Pursuant to the requirements of Section 13 or 15(d) of the Securities Exchange Act of 1934, the registrant has duly caused this report to be signed on its behalf by the undersigned, thereunto duly authorized, in the City of Los Angeles, State of California on the 23rd day of February 2010.
| Fresenius Kabi Pharmaceuticals Holding, Inc. | ||
| By: | /S/ JOHN DUCKER | |
| Chief Executive Officer | ||
POWER OF ATTORNEY
KNOW ALL PEOPLE BY THESE PRESENTS, that each director of Fresenius Kabi Pharmaceuticals Holding, Inc. whose signature appears below hereby appoints Dr. Ulf M. Schneider, Rainer Baule and Richard E. Maroun, and each of them, severally, acting alone and without the other, his/her true and lawful attorney-in-fact, each with the power of substitution, for him or her in any and all capacities, to sign on such person’s behalf, individually and in each capacity stated below, any and all amendments to this Annual Report on Form 10-K and to file the same, with exhibits thereto and other documents in connection therewith, with the Securities and Exchange Commission, granting to said attorneys-in-fact, and each of them, full power and authority to do and perform each and every act and thing requisite and necessary to be done in connection therewith, as fully to all intents and purposes as he or she might or could do in person, hereby ratifying and confirming all that said attorneys-in-fact or their substitute or substitutes, may lawfully do or cause to be done by virtue hereof.
Pursuant to the requirements of the Securities Exchange Act of 1934, this report has been signed below by the following persons on behalf of the Partnership in the capacities and on the dates indicated.
| Signature |
Title |
Date | ||
| /s/ JOHN DUCKER |
Chief Executive Officer | February 23, 2010 | ||
| John Ducker | (Principal Executive Officer) | |||
| /s/ RICHARD J. TAJAK |
Executive Vice President and Chief Financial Officer | February 23, 2010 | ||
| Richard J. Tajak | (Principal Accounting Officer) | |||
| /s/ DR. BERNHARD HAMPL |
Executive Chairman of the Board of Director | February 23, 2010 | ||
| Dr. Bernhard Hampl | ||||
| /s/ DR. ULF M. SCHNEIDER |
Director | February 23, 2010 | ||
| Dr. Ulf M. Schneider | ||||
| /s/ RAINER BAULE |
Director | February 23, 2010 | ||
| Rainer Baule | ||||
| /s/ MICHAEL D. BLASZYK |
Director | February 23, 2010 | ||
| Michael D. Blaszyk | ||||
| /s/ PERRY PREMDAS |
Director | February 23, 2010 | ||
| Perry Premdas | ||||
| /s/ PATRICK SOON-SHIONG, M.D. |
Director | February 23, 2010 | ||
| Patrick Soon-Shiong, M.D. | ||||
| /s/ RICHARD GANZ |
Director | February 23, 2010 | ||
| Richard Ganz | ||||
87
Table of Contents
Fresenius Kabi Pharmaceuticals Holding, Inc.
Schedule II—Valuation and Qualifying Accounts and Reserves for the Year Ended December 31, 2009 and for the Successor Period from July 2, 2008 Through December 31, 2008, Predecessor Period from
January 1, 2008 Through September 9, 2008 and the Year Ended December 31, 2007 and 2006
Allowance for doubtful accounts:
| Column A |
Column B | Column C | Column D | Column E | ||||||||
| Description |
Balance at beginning of period |
Additions charged to costs and expenses |
Deductions | Balance at end of period | ||||||||
| (in thousands) | ||||||||||||
| Year ended December 31, 2009 |
$ | 197 | $ | 171 | $ | 267 | $ | 101 | ||||
| July 2 through December 31, 2008 (Successor) |
$ | 100 | $ | 123 | $ | 26 | $ | 197 | ||||
| January 1 through September 9, 2008 (Predecessor) |
$ | 100 | $ | — | $ | — | $ | 100 | ||||
| Year ended December 31, 2007 |
$ | 100 | $ | 7 | $ | 7 | $ | 100 | ||||
Table of Contents
EXHIBIT INDEX
| Exhibit |
Description | |
| 2.1 | Separation and Distribution Agreement among APP, Abraxis BioScience, LLC, APP Pharmaceuticals, LLC and Abraxis BioScience, Inc. (f/k/a New Abraxis, Inc.) (Incorporated by reference to Exhibit 2.3 to APP’s Annual Report on Form 10-K filed with the Securities and Exchange Commission on March 17, 2008) | |
| 2.2 | Agreement and Plan of Merger, dated July 6, 2008 among APP, Fresenius SE, Fresenius Kabi Pharmaceuticals Holding LLC, and Fresenius Kabi Pharmaceuticals LLC (Incorporated by reference to Exhibit 2.1 to APP’s Current Report on Form 8-K filed with the Securities and Exchange Commission on July 7, 2008) | |
| 3.1 | Amended and Restated Certificate of Incorporation of the Registrant (Incorporated by reference to Exhibit 3.1 to Registrant’s Current Report on Form 8-K filed with the Securities and Exchange Commission on September 10, 2008) | |
| 3.2 | Bylaws of the Registrant (Incorporated by reference to Exhibit 3.2 to Registrant’s Current Report on Form 8-K filed with the Securities and Exchange Commission on September 10, 2008) | |
| 4.1 | Reference is made to Exhibits 3.1 and 3.2 | |
| 10.1 | Tax Allocation Agreement among APP, Abraxis BioScience, LLC, APP Pharmaceuticals, LLC and Abraxis BioScience, Inc. (f/k/a New Abraxis, Inc.) (Incorporated by reference to Exhibit 10.2 to APP’s Annual Report on Form 10-K filed with the Securities and Exchange Commission on March 17, 2008) | |
| 10.2 | Transition Services Agreement between APP, and Abraxis BioScience, Inc. (f/k/a New Abraxis, Inc.) (Incorporated by reference to Exhibit 10.3 to APP’s Annual Report on Form 10-K filed with the Securities and Exchange Commission on March 17, 2008) | |
| 10.3 | Employee Matters Agreement among APP, APP Pharmaceuticals, LLC, Abraxis BioScience, LLC and Abraxis BioScience, Inc. (f/k/a New Abraxis, Inc.) (Incorporated by reference to Exhibit 10.4 to APP’s Annual Report on Form 10-K filed with the Securities and Exchange Commission on March 17, 2008) | |
| 10.4* | Manufacturing Agreement between APP Pharmaceuticals, LLC and Abraxis BioScience, Inc. (f/k/a New Abraxis, Inc.) (Incorporated by reference to Exhibit 10.5 to APP’s Annual Report on Form 10-K filed with the Securities and Exchange Commission on March 17, 2008) | |
| 10.5 | Lease Agreement between APP Pharmaceuticals, LLC and Abraxis BioScience, LLC for the premises located at 2020 Ruby Street, Melrose Park, Illinois (Incorporated by reference to Exhibit 10.6 to APP’s Annual Report on Form 10-K filed with the Securities and Exchange Commission on March 17, 2008) | |
| 10.6 | Lease Agreement between APP Pharmaceuticals, LLC and Abraxis BioScience, LLC for the warehouse facilities located at 2045 N. Cornell Avenue, Melrose Park, Illinois (Incorporated by reference to Exhibit 10.7 to APP’s Annual Report on Form 10-K filed with the Securities and Exchange Commission on March 17, 2008) | |
| 10.7 | Lease Agreement between APP Pharmaceuticals, LLC and Abraxis BioScience, LLC for the research and development facility located at 2045 N. Cornell Avenue, Melrose Park, Illinois (Incorporated by reference to Exhibit 10.8 to APP’s Annual Report on Form 10-K filed with the Securities and Exchange Commission on March 17, 2008) | |
| 10.8 | Lease Agreement between Abraxis BioScience, LLC and APP Pharmaceuticals, LLC for the premises located at 3159 Staley Road, Grand Island, New York (Incorporated by reference to Exhibit 10.9 to APP’s Annual Report on Form 10-K filed with the Securities and Exchange Commission on March 17, 2008) | |
| 10.9 | Lease Agreement between Manufacturers Life Insurance Company (U.S.A.) and APP for 1501 E. Woodfield Road, Suite 300 East Schaumburg, Illinois, known as Schaumburg Corporate Center (Incorporated by reference to APP’s Current Report on Form 8-K filed with the Securities and Exchange Commission on February 23, 2005) | |
| 10.10 | Purchase and Sale Agreement, dated April 24, 2006, between APP and Pfizer, Inc. (Incorporated by reference to Exhibit 10.26 to APP’s Quarterly Report on Form 10-Q filed with the Securities and Exchange Commission on May 10, 2006) | |
| 10.11* | Asset Purchase Agreement, dated April 26, 2006, between APP and AstraZeneca UK Limited (Incorporated by reference to Exhibit 10.14 to APP’s Quarterly Report on Form 10-Q/A filed with the Securities and Exchange Commission on August 10, 2006) | |
| 10.12* | Amendment to the Asset Purchase Agreement, dated June 28, 2006, between APP and AstraZeneca UK Limited (Incorporated by reference to Exhibit 10.15 to APP’s Quarterly Report on Form 10-Q/A filed with the Securities and Exchange Commission on August 10, 2006) | |
Table of Contents
| 10.13* | Manufacturing and Supply Agreement, dated June 28, 2006, between APP and AstraZeneca LP. (Incorporated by reference to Exhibit 10.17 to APP’s Quarterly Report on Form 10-Q/A filed with the Securities and Exchange Commission on August 10, 2006) | |
| 10.14* | Manufacturing and Supply Agreement, dated June 28, 2006, between APP and AstraZeneca Pharmaceuticals LP. (Incorporated by reference to Exhibit 10.18 to APP’s Quarterly Report on Form 10-Q/A filed with the Securities and Exchange Commission on August 10, 2006) | |
| 10.15 | Retention Agreement, dated as of November 20, 2006, between APP and Thomas H. Silberg (Incorporated by reference to Exhibit 10.24 to APP’s Annual Report on Form 10-K filed with the Securities and Exchange Commission on March 1, 2007) | |
| 10.16 | Retention Agreement, dated as of November 20, 2006, between APP and Frank Harmon (Incorporated by reference to Exhibit 10.25 to APP’s Annual Report on Form 10-K filed with the Securities and Exchange Commission on March 1, 2007) | |
| 10.17* | Credit Agreement, dated August 20, 2008, among Fresenius SE, the borrowers and other guarantors identified therein, Deutsche Bank AG London Branch, as Administrative Agent and certain lenders thereto (Incorporated by reference to Exhibit 10.17 to Fresenius Kabi Pharmaceuticals Holding, Inc.’s Quarterly Report on Form 10-Q filed with the Securities and Exchange Commission on November 14, 2008) | |
| 10.18 | First Amendment to the Credit Agreement dated October 6, 2008 among the Registrant, Fresenius SE, certain affiliates of Fresenius SE named therein and Deutsche Bank AG London Branch, as Administrative Agent (Incorporated by reference to Exhibit 10.18 to Fresenius Kabi Pharmaceuticals Holding, Inc.’s Quarterly Report on Form 10-Q filed with the Securities and Exchange Commission on November 14, 2008) | |
| 10.19* | Intercompany Term Loan Agreement dated September 10, 2008 among Fresenius Kabi Pharmaceuticals, LLC, the guarantors listed therein, Deutsche Bank AG London Branch as collateral agent and Fresenius US Finance I, Inc. (Incorporated by reference to Exhibit 10.19 to Fresenius Kabi Pharmaceuticals Holding, Inc.’s Quarterly Report on Form 10-Q filed with the Securities and Exchange Commission on November 14, 2008) | |
| 10.20 | First Amendment to Intercompany Term Loan Agreement dated October 10, 2008 among APP Pharmaceuticals, Inc., the guarantors listed therein, Deutsche Bank AG London Branch as collateral agent and Fresenius US Finance I, Inc. (Incorporated by reference to Exhibit 10.20 to Fresenius Kabi Pharmaceuticals Holding, Inc.’s Quarterly Report on Form 10-Q filed with the Securities and Exchange Commission on November 14, 2008) | |
| 10.21* | Intercompany Bridge Term Loan Agreement dated September 10, 2008 among Fresenius Kabi Pharmaceuticals Holding, Inc., the guarantors named therein, Deutsche Bank AG London Branch as collateral agent and Fresenius US Finance II, Inc. (Incorporated by reference to Exhibit 10.21 to Fresenius Kabi Pharmaceuticals Holding, Inc.’s Quarterly Report on Form 10-Q filed with the Securities and Exchange Commission on November 14, 2008) | |
| 10.22 | Employment Agreement between APP and Richard Tajak (Incorporated by reference to Exhibit 10.25 to APP’s Quarterly Report on Form 10-Q filed with the Securities and Exchange Commission on May 12, 2008) | |
| 10.23 | Form of Contingent Value Rights Agreement (Incorporated by reference to Exhibit 4.1 to Fresenius Kabi Pharmaceuticals Holding, LLC Form S-4 filed with the Securities and Exchange Commission on July 31, 2008) | |
| 10.24 | Non-Competition Agreement, dated as of July 6, 2008, among Fresenius SE and Dr. Patrick Soon-Shiong (Incorporated by reference to Exhibit 10.2 to Fresenius Kabi Pharmaceuticals Holding, LLC Form S-4 filed with the Securities and Exchange Commission on July 31, 2008) | |
| 10.25 | Consulting Agreement dated as of July 6, 2008, among Fresenius SE, Fresenius Kabi Pharmaceuticals Holding, LLC and Dr. Patrick Soon-Shiong (Incorporated by reference to Exhibit 10.3 to Fresenius Kabi Pharmaceuticals Holding, LLC Form S-4 filed with the Securities and Exchange Commission on July 31, 2008) | |
| 14.1 | Code of Business Conduct (Incorporated by reference to Exhibit 14.1 to APP’s Annual Report on Form 10-K filed with the Securities and Exchange Commission on March 1, 2007) | |
| 21.1† | List of Subsidiaries of the Registrant | |
| 24.1 | Power of Attorney (included on signature page) | |
| 31.1† | Certification of Chief Executive Officer pursuant to Section 302 of the Sarbanes-Oxley Act of 2002 | |
| 31.2† | Certification of Chief Financial Officer pursuant to Section 302 of the Sarbanes-Oxley Act of 2002 | |
| 32.1† | Certification of Chief Executive Officer pursuant to 18 U.S.C. Section 1350, as adopted by Section 906 of the Sarbanes-Oxley Act of 2002 | |
Table of Contents
| 32.2† | Certification of Chief Financial Officer pursuant to 18 U.S.C. Section 1350, as adopted by Section 906 of the Sarbanes-Oxley Act of 2002 | |
| * | Certain portions of this exhibit have been omitted pursuant to a request for confidential treatment filed with the Securities and Exchange Commission. |
| † | Filed herewith. |