Attached files
| file | filename |
|---|---|
| EX-4.8 - EXHIBIT 4.8 - E TRADE FINANCIAL CORP | dex48.htm |
| EX-4.4 - EXHIBIT 4.4 - E TRADE FINANCIAL CORP | dex44.htm |
| EX-32.1 - EXHIBIT 32.1 - E TRADE FINANCIAL CORP | dex321.htm |
| EX-23.1 - EXHIBIT 23.1 - E TRADE FINANCIAL CORP | dex231.htm |
| EX-4.10 - EXHIBIT 4.10 - E TRADE FINANCIAL CORP | dex410.htm |
| EX-4.12 - EXHIBIT 4.12 - E TRADE FINANCIAL CORP | dex412.htm |
| EX-10.1 - EXHIBIT 10.1 - E TRADE FINANCIAL CORP | dex101.htm |
| EX-31.2 - EXHIBIT 31.2 - E TRADE FINANCIAL CORP | dex312.htm |
| EX-4.13 - EXHIBIT 4.13 - E TRADE FINANCIAL CORP | dex413.htm |
| EX-12.1 - EXHIBIT 12.1 - E TRADE FINANCIAL CORP | dex121.htm |
| EX-21.1 - EXHIBIT 21.1 - E TRADE FINANCIAL CORP | dex211.htm |
| EX-31.1 - EXHIBIT 31.1 - E TRADE FINANCIAL CORP | dex311.htm |
| EX-10.20 - EXHIBIT 10.20 - E TRADE FINANCIAL CORP | dex1020.htm |
| EX-10.21 - EXHIBIT 10.21 - E TRADE FINANCIAL CORP | dex1021.htm |
Table of Contents
UNITED STATES
SECURITIES AND EXCHANGE COMMISSION
Washington, D.C. 20549
FORM 10-K
(Mark One)
| x | ANNUAL REPORT PURSUANT TO SECTION 13 OR 15(d) OF THE SECURITIES EXCHANGE ACT OF 1934 FOR THE FISCAL YEAR ENDED DECEMBER 31, 2009. |
or
| ¨ | TRANSITION REPORT PURSUANT TO SECTION 13 OR 15(d) OF THE SECURITIES EXCHANGE ACT OF 1934 FOR THE TRANSITION PERIOD FROM TO . |
Commission File Number 1-11921
E*TRADE Financial Corporation
(Exact Name of Registrant as Specified in its Charter)
| Delaware | 94-2844166 | |
| (State or Other Jurisdiction of Incorporation or Organization) |
(I.R.S. Employer Identification Number) |
135 East 57th Street, New York, New York 10022
(Address of Principal Executive Offices and Zip Code)
(646) 521-4300
(Registrant’s Telephone Number, including Area Code)
Indicate by check mark if the registrant is a well-known seasonal issuer, as defined in Rule 405 of the Securities Act. Yes x No ¨
Indicate by check mark if the registrant is not required to file reports pursuant to Section 13 or Section 15(d) of the Securities Act. Yes ¨ No x
Indicate by check mark whether the registrant (1) has filed all reports required to be filed by Section 13 or 15(d) of the Securities Exchange Act of 1934 during the preceding 12 months (or for such shorter period that the registrant was required to file such reports) and (2) has been subject to such filing requirements for the past 90 days. Yes x No ¨
Indicate by check mark whether the registrant has submitted electronically and posted on its corporate Web site, if any, every Interactive Data File required to be submitted and posted pursuant to Rule 405 of Regulation S-T during the preceding 12 months (or for such shorter period that the registrant was required to submit and post such files). Yes ¨ No ¨
Indicate by check mark if disclosure of delinquent filers pursuant to Item 405 of Regulation S-K is not contained herein, and will not be contained, to the best of registrant’s knowledge, in definitive proxy or information statements incorporated by reference in Part III of this Form 10-K, or any amendment to this Form 10-K. ¨
Indicate by check mark whether the registrant is a large accelerated filer, an accelerated filer, a non-accelerated filer or a smaller reporting company. See definitions of “large accelerated filer,” “accelerated filer” and “smaller reporting company” in Rule 12b-2 of the Exchange Act.
| Large accelerated filer x |
Accelerated filer ¨ | |||
| Non-accelerated filer ¨ (Do not check if a smaller reporting company) |
Smaller reporting company ¨ | |||
Indicate by check mark whether the registrant is a shell company (as defined in Rule 12b-2 of the Exchange Act). Yes ¨ No x
At June 30, 2009, the aggregate market value of voting stock held by non-affiliates of the registrant was approximately $1.2 billion (based upon the closing price for shares of the registrant’s common stock as reported by the NASDAQ Global Select Market on that date). Shares of common stock held by each officer, director and holder of 5% or more of the outstanding common stock have been excluded in that such persons may be deemed to be affiliates. This determination of affiliate status is not necessarily a conclusive determination for other purposes.
Indicate the number of shares outstanding of each of the issuer’s classes of common stock, as of the latest practicable date:
As of February 22, 2010, there were 1,917,988,680 shares of common stock outstanding.
DOCUMENTS INCORPORATED BY REFERENCE
Certain portions of the definitive Proxy Statement relating to the Company’s 2010 Annual Meeting of Shareholders, to be filed hereafter (incorporated into Part III hereof).
Table of Contents
E*TRADE FINANCIAL CORPORATION
FORM 10-K ANNUAL REPORT
For the Year Ended December 31, 2009
| PART I |
||||
| 1 | ||||
| Item 1. |
Business | 1 | ||
| 1 | ||||
| 1 | ||||
| 2 | ||||
| 2 | ||||
| 2 | ||||
| 4 | ||||
| 4 | ||||
| 4 | ||||
| 5 | ||||
| 5 | ||||
| Item 1A. |
7 | |||
| Item 1B. |
16 | |||
| Item 2. |
17 | |||
| Item 3. |
17 | |||
| Item 4. |
20 | |||
| Item 5. |
Market for Registrant’s Common Equity, Related Shareholder Matters and Issuer Purchases of Equity Securities | 21 | ||
| Item 6. |
23 | |||
| Item 7. |
Management’s Discussion and Analysis of Financial Condition and Results of Operations | 25 | ||
| 25 | ||||
| 30 | ||||
| 45 | ||||
| 50 | ||||
| 55 | ||||
| 60 | ||||
| 63 | ||||
| 74 | ||||
| 82 | ||||
| 88 | ||||
| Item 7A. |
92 | |||
| Item 8. |
94 | |||
| Management Report on Internal Control Over Financial Reporting |
94 | |||
| 95 | ||||
| 97 | ||||
| 98 | ||||
| 99 | ||||
| 100 | ||||
| 102 | ||||
| 104 | ||||
| Note 1—Organization, Basis of Presentation and Summary of Significant Accounting |
104 | |||
i
Table of Contents
| 114 | ||||
| 116 | ||||
| Note 4—Operating Interest Income and Operating Interest Expense |
118 | |||
| 118 | ||||
| Note 6—Available-for-Sale Mortgage-Backed and Investment Securities |
126 | |||
| 130 | ||||
| Note 8—Accounting for Derivative Instruments and Hedging Activities |
132 | |||
| 137 | ||||
| 137 | ||||
| 139 | ||||
| 140 | ||||
| Note 13—Securities Sold Under Agreement to Repurchase and Other Borrowings |
141 | |||
| 143 | ||||
| 146 | ||||
| 146 | ||||
| 151 | ||||
| 154 | ||||
| 154 | ||||
| 157 | ||||
| 158 | ||||
| Note 22—Commitments, Contingencies and Other Regulatory Matters |
159 | |||
| 163 | ||||
| Note 24—Condensed Financial Information (Parent Company Only) |
168 | |||
| 171 | ||||
| Item 9. |
Changes in and Disagreements with Accountants on Accounting and Financial Disclosure |
172 | ||
| Item 9A. |
Controls and Procedures | 172 | ||
| Item 9B. |
Other Information | 172 | ||
| Item 15. |
Exhibits and Financial Statement Schedules | 172 | ||
| Exhibit Index | 173 | |||
| Signatures | 177 | |||
Unless otherwise indicated, references to “the Company,” “we,” “us,” “our” and “E*TRADE” mean E*TRADE Financial Corporation or its subsidiaries.
E*TRADE, E*TRADE Financial, E*TRADE Bank, Equity Edge, OptionsLink and the Converging Arrows logo are registered trademarks of E*TRADE Financial Corporation in the United States and in other countries.
ii
Table of Contents
This report contains forward-looking statements involving risks and uncertainties. These statements relate to our future plans, objectives, expectations and intentions. These statements may be identified by the use of words such as “expect,” “may,” “anticipate,” “intend,” “plan” and similar expressions. Our actual results could differ materially from those discussed in these forward-looking statements, and we caution that we do not undertake to update these statements. Factors that could contribute to our actual results differing from any forward-looking statements include those discussed under “Risk Factors,” “Management’s Discussion and Analysis of Financial Condition and Results of Operations” and elsewhere in this report. The cautionary statements made in this report should be read as being applicable to all forward-looking statements wherever they appear in this report. We further caution that there may be risks associated with owning our securities other than those discussed in this report.
| ITEM 1. | BUSINESS |
E*TRADE Financial Corporation is a financial services company that provides online brokerage and related products and services primarily to individual retail investors, under the brand “E*TRADE Financial.” Our primary focus is to profitably grow our online brokerage business, which includes our active trader and long term investing customers. We also provide investor-focused banking products, primarily sweep deposits and savings products, to retail investors. Our competitive strategy is to attract and retain customers by emphasizing low-cost, ease of use and innovation, with delivery of our products and services primarily through online and technology-intensive channels.
Our corporate offices are located at 135 East 57th Street, New York, New York 10022. We were incorporated in California in 1982 and reincorporated in Delaware in July 1996. We have approximately 3,100 employees. We operate directly and through numerous subsidiaries many of which are overseen by governmental and self-regulatory organizations. Our most significant subsidiaries are described below:
| • | E*TRADE Bank is a federally chartered savings bank that provides investor-focused banking products to retail customers nationwide and deposit accounts insured by the Federal Deposit Insurance Corporation (“FDIC”); |
| • | E*TRADE Capital Markets, LLC is a registered broker-dealer and market-maker; |
| • | E*TRADE Clearing LLC is the clearing firm for our brokerage subsidiaries and is a wholly-owned operating subsidiary of E*TRADE Bank. Its main purpose is to transfer securities from one party to another; and |
| • | E*TRADE Securities LLC is a registered broker-dealer and became a wholly-owned operating subsidiary of E*TRADE Bank in June 2009. It is the primary provider of brokerage services to our customers. |
A complete list of our subsidiaries can be found in Exhibit 21.1.
We provide services to customers in the U.S. through our website at www.etrade.com. In addition to our website, we also provide services through our network of customer service representatives, relationship managers and investment advisors. We also provide these services over the phone or in person through our 28 E*TRADE Branches. Information on our website is not a part of this report.
Our core business is our trading and investing customer franchise. Our strategy is to profitably grow this business by focusing on two primary groups of customers: traders and long-term investors. We believe our trading customers, particularly our active traders, are the foundation of our brokerage business and we are focused on
1
Table of Contents
maintaining our competitive position with this customer group. Our long-term investing customer group is less developed when compared to our trading customers and represents our largest opportunity for future growth.
We believe our focus on certain key factors will enable us to execute our strategy of profitably growing our trading and investing business. These key factors include the development of innovative online trading and long-term investing products and services, a concerted effort to deliver superior customer service, creative and cost-effective marketing and sales, and expense discipline. In addition, we continue to invest significantly for long-term growth so that we remain competitive among the largest online brokers.
In addition to focusing on our customer franchise, our strategy includes an intense focus on addressing the balance sheet issues primarily caused by the mortgage crisis. We are focused on improving our capital structure as well as mitigating the credit losses inherent in our loan portfolio. We believe the recapitalization transactions executed in the second and third quarters of 2009 significantly improved our capital structure and better positioned the Company for future growth.
During the second and third quarters of 2009, the Company executed a series of transactions as part of a comprehensive plan to strengthen our capital structure. We raised $733 million in net proceeds from three separate stock offerings: $63 million from the Equity Drawdown Program in May 2009; $523 million from the Public Equity Offering in June 2009; and $147 million from the At the Market Offering in September 2009. In connection with these stock offerings, 621 million shares of common stock were issued.
We also exchanged $1.7 billion aggregate principal amount of interest-bearing corporate debt for an equal principal amount of newly-issued non-interest-bearing convertible debentures (“Debt Exchange”). As a result of the Debt Exchange, we reduced our annual corporate interest payments by approximately $200 million and eliminated any substantial debt maturities until 2013.
Subsequent to the Debt Exchange, $720.9 million, or 41%, of convertible debentures were converted into 697 million shares of common stock during the third and fourth quarters of 2009.
DISPOSITIONS AND EXIT ACTIVITIES
In the fourth quarter of 2009, we decided to restructure our international brokerage business, which provides trading products and services through two primary channels: 1) cross-border trading, where customers residing outside of the U.S. trade in U.S. securities; and 2) local market trading, where customers residing outside of the U.S. trade in non-U.S. securities.
We believe cross-border trading is a key strategic component of our global brokerage product offering and plan to continue to offer trading products and services through this channel. We believe local market trading is not a key strategic component of our global brokerage product offering; therefore, we decided to exit this channel. We have entered into agreements to sell the local market trading operations in Germany, the Nordic region, and the United Kingdom. The sale of the German operations closed in 2009 and we expect to complete the Nordic and United Kingdom transactions during 2010.
Trading and Investing
Our trading and investing segment offers a full suite of financial products and services to individual retail investors. The most significant of these products and services are described below:
Trading Products and Services
| • | automated order placement and execution of U.S. equities, futures, options, exchange-traded funds and bond orders; |
2
Table of Contents
| • | access to E*TRADE Mobile Pro, which allows customers to trade stocks and transfer funds between accounts via a Blackberry® or Apple iPhoneTM and iPod® Touch as well as the ability to monitor real-time investment, market and account information; |
| • | use of Power E*TRADE Pro, which is our newly redesigned desktop trading software for active traders; |
| • | two-second execution guarantee on all Standard & Poor’s (“S&P”) 500 stocks and exchange-traded funds; |
| • | margin accounts allowing customers to borrow against their securities; |
| • | access to international equities in Canada, France, Germany, Hong Kong, Japan and the United Kingdom and foreign currencies, including the Canadian dollar, Euro, Hong Kong dollar, Yen and Sterling; and |
| • | FDIC-insured sweep deposit accounts that automatically transfer funds to and from customer brokerage accounts. |
Long-Term Investing Products and Services
| • | use of the Investor Resource Center, which provides an aggregated view of our investing tools, market insights, independent research, education and other investing resources; |
| • | flexible advisory services through Online Advisor, our investment advice tool designed to provide investors with actionable investment guidance, including recommended asset allocations ranging from fully self-directed investing to 100 percent discretionary portfolio management from a registered investment advisor; |
| • | fixed income tools in our Bond Resource Center aimed at helping customers identify, evaluate and implement fixed income investment strategies; |
| • | access to Retirement QuickPlan, which is an easy-to-use, four-step retirement planning tool that provides a quick assessment of an individual’s or a family’s retirement savings and investing plan as well as tips to help get on track with personal retirement goals; |
| • | no fee and no minimum individual retirement accounts; |
| • | access to more than 1,000 non-proprietary exchange-traded funds and over 8,000 non-proprietary mutual funds; |
| • | investing and trading educational services via online videos, web seminars and web tutorials; and |
| • | FDIC insured deposit accounts, including checking, savings and money market accounts. |
Our trading and investing segment also includes market-making activities which match buyers and sellers of securities from our retail brokerage business and unrelated third parties. As a market maker, we take positions in securities and function as a wholesale trader by combining trading lots to match buyers and sellers of securities. Trading gains and losses result from these activities. Our revenues are influenced by overall trading volumes, the number of stocks for which we act as a market maker and the trading volumes and volatility of those specific stocks.
In addition to the services above, we also offer employee stock option management software and services for corporate customers. This software system facilitates the management of employee option plans, employee stock purchase plans and restricted stock plans, including necessary accounting and reporting functions. This is a product of the trading and investing segment since it serves as an introduction to E*TRADE for many employees of our corporate customers who conduct equity option and restricted stock transactions, with our goal being that these individuals will also use our other products and services.
3
Table of Contents
Balance Sheet Management
The balance sheet management segment consists of the management of our balance sheet, focusing on asset allocation and managing credit, liquidity and interest rate risks. The balance sheet management segment manages loans previously originated or purchased from third parties as well as our customer cash and deposits, which originate in the trading and investing segment.
For additional statistical information regarding products and customers, see Item 7. Management’s Discussion and Analysis of Financial Condition and Results of Operations (“MD&A”) beginning on page 25. Three years of segment financial performance and data can be found in the MD&A beginning on page 45 and in Note 23—Segment and Geographic Information of Item 8. Financial Statements and Supplementary Data beginning on page 163.
We believe providing superior customer service is fundamental to our business. We strive to maintain a high standard of customer service by staffing the customer support team with appropriately trained personnel who are equipped to handle customer inquiries in a prompt yet thorough manner. Our customer service representatives utilize our proprietary web-based platform to provide customers with answers to their inquiries. We also have specialized customer service programs that are tailored to the needs of each customer group.
We provide customer support through the following channels:
| • | Branches—we have 28 branches located in the U.S. where retail investors can go to service any of their needs while receiving face to face customer support. |
| • | Online—we have an online service center where customers can request services on their accounts and obtain answers to frequently asked questions. The online service center also provides customers with the ability to send a secure message to one of our customer service representatives. |
| • | Telephonic—we have a toll free number that connects customers to an automated phone system which will help ensure that they are directed to the appropriate department for their inquiry. We have been improving the expertise within our customer service team as the vast majority of our customer service representatives now hold a Series 7 license. |
We believe our focus on being a technological leader in the financial services industry enhances our competitive position. This focus allows us to deploy a secure, scalable technology and back office platform that promotes innovative product development and delivery. We continued to increase our investments in these critical platforms in 2009, helping to drive significant cost efficiencies as well as enhancing our service and operational support capabilities. Our technology platform also enabled us to deliver long-term investing functionality with the introduction of our Investing Resource Center and Online Advisor offerings.
The online financial services market continues to evolve rapidly and we expect it to remain highly competitive. Our trading and investing segment competes with full commission brokerage firms, discount brokerage firms, online brokerage firms, Internet banks, traditional “brick & mortar” retail banks and thrifts and market-making firms. Some of these competitors provide Internet trading and banking services, investment advisor services, touchtone telephone and voice response banking services, electronic bill payment services and a host of other financial products. Our balance sheet management segment, in addition to the competitors above, competes with investment banking firms and other users of market liquidity in its quest for the least expensive source of funding.
4
Table of Contents
Many of our competitors have longer operating histories and greater resources than we do and offer a wider range of financial products and services. Many also have greater name recognition, greater market acceptance and larger customer bases. In recent years, the financial services industry has become more concentrated, as companies involved in a broad range of financial services have been acquired, merged or have declared bankruptcy. During 2008 and 2009, this trend accelerated considerably, as a significant number of U.S. financial institutions consolidated, were forced to merge, or received substantial government assistance. These developments could result in our remaining competitors having greater capital and other resources, such as the ability to offer a broader range of products and services.
We believe we can continue to attract customers by appealing to retail investors within large established financial institutions by providing them with low-cost, easy to use and innovative financial products and services. However, our exposure to the crisis in the residential real estate and credit markets has created some uncertainty surrounding the Company. These concerns may make it more difficult to retain our current customer base as well as hinder our ability to attract new customers.
We also face intense competition in attracting and retaining qualified employees. Our ability to compete effectively in financial services will depend upon our ability to attract new employees and retain and motivate our existing employees while efficiently managing compensation related costs.
We assess the performance of our business based on our primary segments, trading and investing and balance sheet management. We consider multiple factors, including the competitiveness of our pricing compared to similar products and services in the market, the overall profitability of our businesses and customer relationships when pricing our various products and services. We manage the performance of our business using various customer activity and financial metrics, including daily average revenue trades (“DARTs”), average commission per trade, end of period brokerage accounts and net new brokerage accounts, customer assets and net new brokerage assets, brokerage related cash, corporate cash, E*TRADE Bank excess risk-based capital, allowance for loan losses, enterprise net interest spread and average enterprise interest-earning assets. The overall performance of our business is also based on the management of our expenses related to our various products and services. The same or similar products and services may be offered to both segments, utilizing the same infrastructure or in some circumstances, a single infrastructure may be used to support multiple products and services offered to our customers. As such, we do not separately disclose the costs associated with products and services sold or our general and administrative costs. All operating expenses incurred are integral to the operation of the business and are considered when evaluating the profitability of our business.
Our business is subject to regulation by U.S. federal and state regulatory and self-regulatory agencies and securities exchanges and by various non-U.S. governmental agencies or regulatory or self-regulatory bodies, securities exchanges and central banks, each of which has been charged with the protection of the financial markets and the protection of the interests of those participating in those markets. In light of the current conditions in the global financial markets and the global economy, regulators have increased their focus on the regulation of the financial services industry. Substantial regulatory and legislative initiatives have been introduced, including a comprehensive overhaul of the regulatory system in the U.S. Such action could have a material impact on our business, financial condition and results of operations.
Our regulators, rulemaking agencies and primary securities exchanges in the U.S. include, among others, the Securities and Exchange Commission (“SEC”), the Financial Industry Regulatory Authority (“FINRA”), the New York Stock Exchange (“NYSE”), the National Association of Securities Dealers Automated Quotations (“NASDAQ”), the FDIC, the Federal Reserve, the Municipal Securities Rulemaking Board and the Office of
5
Table of Contents
Thrift Supervision (“OTS”). Additional legislation, regulations and rulemaking may directly affect our manner of operation and profitability. Our broker-dealers are registered with the SEC and are subject to regulation by the SEC and by self-regulatory organizations, such as FINRA and the securities exchanges of which each is a member, as well as various state regulators. Such regulation covers all aspects of the brokerage business, including, but not limited to, client protection, net capital requirements, required books and records, safekeeping of funds and securities, trading, prohibited transactions, public offerings, margin lending, customer qualifications for margin and options transactions, registration of personnel and transactions with affiliates. Our banking entities are subject to regulation, supervision and examination by the OTS, the Federal Reserve and the FDIC. Such regulation covers all aspects of the banking business, including lending practices, safeguarding deposits, capital structure, transactions with affiliates and conduct and qualifications of personnel. Our international broker-dealers are regulated by their respective local regulators such as the United Kingdom Financial Services Authority (“FSA”) and Hong Kong Securities & Futures Commission. For additional regulatory information, see Note 20—Regulatory Requirements of Item 8. Financial Statements and Supplementary Data beginning on page 157.
We make our annual reports on Form 10-K, quarterly reports on Form 10-Q, current reports on Form 8-K, and amendments to those reports, available free of charge at our website as soon as reasonably practicable after they have been filed with the SEC. Our website address is www.etrade.com.
The public may read and copy any materials we file with the SEC at the SEC’s Public Reference Room at 100 F Street, NE, Washington, DC 20549. The public may obtain information of the Public Reference Room by calling the SEC at 1-800-SEC-0330. The SEC maintains an Internet site that contains reports, proxy and information statements, and other information regarding issuers that file electronically with the SEC at www.sec.gov.
6
Table of Contents
| ITEM 1A. RISK | FACTORS |
Risks Relating to the Nature and Operation of Our Business
We have incurred significant losses and cannot assure that we will be profitable.
We incurred a net loss of $1.3 billion, or $1.18 loss per share, for the year ended December 31, 2009, due primarily to the loss on the Debt Exchange in which $1.7 billion aggregate principal amount of interest-bearing debt was exchanged for an equal principal amount of non-interest-bearing convertible debentures, and the credit losses in our loan portfolio. Although we have taken a significant number of steps to reduce our credit exposure, we likely will continue to suffer significant credit losses in 2010. In late 2007, we experienced a substantial diminution of customer assets and accounts as a result of customer concerns regarding our credit related exposures. While we were able to stabilize our retail franchise during 2008 and 2009, it could take a significant amount of time to fully mitigate the credit issues in our loan portfolio and return to profitability.
We will continue to experience losses in our mortgage loan portfolio.
At December 31, 2009, the principal balance of our home equity loan portfolio was $7.8 billion and the allowance for loan losses for this portfolio was $620.0 million. At December 31, 2009, the principal balance of our one- to four-family loan portfolio was $10.6 billion and the allowance for loan losses for this portfolio was $489.9 million. As the crisis in the residential real estate and credit markets continues, we expect credit losses to continue at elevated levels. In particular, a significant portion of our mortgage loan portfolio is collateralized by properties in which the value is now estimated to be less than the outstanding balance of the loan. There can be no assurance that our allowance for loan losses will be adequate if the residential real estate and credit markets deteriorate beyond our expectations. We may be required under such circumstances to further increase our allowance for loan losses, which could have an adverse effect on our regulatory capital position and our results of operations in future periods.
We could experience significant losses on other securities held on the balance sheet.
At December 31, 2009, we held $590.2 million in amortized cost of non-agency collateralized mortgage obligations (“CMO”) on our consolidated balance sheet. We incurred net impairment charges of $89.1 million during 2009, which was a result of the deterioration in the expected credit performance of the underlying loans in the securities. If the credit quality of these securities further deteriorates, this may result in additional impairment charges which would have an adverse effect on our regulatory capital position and our results of operations in future periods.
Our chief executive officer stepped down at the end of 2009 as planned. If we are unable to hire a qualified replacement in a timely manner, our ability to execute our business plan could be harmed.
Donald H. Layton stepped down as Chairman and CEO, and as a member of the Board of Directors, at the end of 2009 when his contract expired. We are conducting a search to find a replacement for Mr. Layton. If we are unable to hire a qualified replacement in a timely manner, our ability to execute our business plan could be harmed. Even if we can timely hire a qualified replacement, we may experience operational disruptions and inefficiencies during any transition. Additionally, any further changes in senior management could result in disruptions to our operations. If we lose or terminate the services of one or more of our current executives, or if we are unable to attract or retain qualified personnel, it could adversely affect our business.
Losses of customers and assets could destabilize the Company or result in lower revenues in future periods.
During November 2007, well-publicized concerns about E*TRADE Bank’s holdings of asset-backed securities led to widespread concerns about our continued viability. From the beginning of this crisis through December 31, 2007, when the situation stabilized, customers withdrew approximately $5.6 billion of net cash and approximately $12.2 billion of net assets from our bank and brokerage businesses. Many of the accounts that were closed belonged to sophisticated and active customers with large cash and securities balances. While we
7
Table of Contents
were able to stabilize our retail franchise in 2008 and 2009, concerns about our viability may recur, which could lead to destabilization and asset and customer attrition. If such destabilization should occur, there can be no assurance that we will be able to successfully rebuild our franchise by reclaiming customers and growing assets. If we are unable to sustain or, if necessary, rebuild our franchise, in future periods our revenues will be lower and our losses will be greater than we have experienced.
We have a large amount of debt.
We have issued a substantial amount of high-yield debt, with restrictive financial and other covenants. Following the completion of the Debt Exchange, in which $1.7 billion aggregate principal amount of interest-bearing corporate debt was exchanged for an equal principal amount of non-interest-bearing convertible debentures, our expected annual interest cash outlay decreased by approximately $200 million. Our ratio of debt (our corporate debt) to equity (expressed as a percentage) was 66% at December 31, 2009. The degree to which we are leveraged could have important consequences, including (i) a substantial portion of our cash flow from operations is dedicated to the payment of principal and interest on our indebtedness, thereby reducing the funds available for other purposes; (ii) our ability to obtain additional financing for working capital, capital expenditures, acquisitions and other corporate needs is significantly limited; and (iii) our substantial leverage may place us at a competitive disadvantage, hinder our ability to adjust rapidly to changing market conditions and make us more vulnerable in the event of a further downturn in general economic conditions or our business. In addition, a significant reduction in revenues could have a material adverse effect on our ability to meet our obligations under our debt securities.
We are subject to investigations and lawsuits as a result of our losses from mortgage loans and asset-backed securities.
In 2007, we recognized an increased provision expense totaling $640 million and asset losses and impairments of $2.45 billion, including the sale of our asset-backed securities portfolio to Citadel. As a result, various plaintiffs filed class actions and derivative lawsuits, which have subsequently been consolidated into one class action and one derivative lawsuit, alleging disclosure violations regarding our home equity, mortgage and securities portfolios during 2007. In addition, the SEC initiated an informal inquiry into matters related to our loan and securities portfolios. The defense of these matters has and will continue to entail considerable cost and will be time-consuming for our management. Unfavorable outcomes in any of these matters could have a material adverse effect on our business, financial condition, results of operations and cash flows.
Many of our competitors have greater financial, technical, marketing and other resources.
The financial services industry is highly competitive, with multiple industry participants competing for the same customers. Many of our competitors have longer operating histories and greater resources than we do and offer a wider range of financial products and services. Other of our competitors offer a more narrow range of financial products and services and have not been as susceptible to the disruptions in the credit markets that have impacted our Company, and therefore have not suffered the losses we have. The impact of competitors with superior name recognition, greater market acceptance, larger customer bases or stronger capital positions could adversely affect our revenue growth and customer retention. Our competitors may also be able to respond more quickly to new or changing opportunities and demands and withstand changing market conditions better than we can. Competitors may conduct extensive promotional activities, offering better terms, lower prices and/or different products and services or combination of products and services that could attract current E*TRADE customers and potentially result in price wars within the industry. Some of our competitors may also benefit from established relationships among themselves or with third parties enhancing their products and services.
The continuing turmoil in the global financial markets could reduce trade volumes and margin borrowing and increase our dependence on our more active customers who receive lower pricing.
Online investing services to the retail customer, including trading and margin lending, account for a significant portion of our revenues. Continuing turmoil in the global financial markets could lead to changes in
8
Table of Contents
volume and price levels of securities and futures transactions which may, in turn, result in lower trading volumes and margin lending. In particular, a decrease in trading activity within our lower activity accounts or our accounts related to employee stock option management software and services would significantly impact revenues and increase dependence on more active trading customers who receive more favorable pricing based on their trade volume. A decrease in trading activity or securities prices would also typically be expected to result in a decrease in margin borrowing, which would reduce the revenue that we generate from interest charged on margin borrowing. More broadly, any reduction in overall transaction volumes would likely result in lower revenues and may harm our operating results because many of our overhead costs are fixed.
We depend on payments from our subsidiaries.
We depend on dividends, distributions and other payments from our subsidiaries to fund payments on our obligations, including our debt obligations. Regulatory and other legal restrictions may limit our ability to transfer funds to or from our subsidiaries. In addition, many of our subsidiaries are subject to laws and regulations that authorize regulatory bodies to block or reduce the flow of funds to us, or that prohibit such transfers altogether in certain circumstances. These laws and regulations may hinder our ability to access funds that we may need to make payments on our obligations. The majority of our capital is invested in our banking subsidiary E*TRADE Bank, which may not pay dividends to us without approval from the OTS. Our primary brokerage subsidiaries, E*TRADE Securities LLC and E*TRADE Clearing LLC, are both subsidiaries of E*TRADE Bank; therefore, as our primary banking regulator and as a result of the memoranda of understanding with the OTS under which we continue to operate, the OTS controls our ability to receive dividend payments from our brokerage business as well. Furthermore, even if we receive the approval of the OTS to receive dividend payments from our brokerage business, in the event of our bankruptcy or liquidation or E*TRADE Bank’s receivership, we would not be entitled to receive any cash or other property or assets from our subsidiaries (including E*TRADE Bank, E*TRADE Clearing LLC and E*TRADE Securities LLC) until those subsidiaries pay in full their respective creditors, including customers of those subsidiaries and, as applicable, the FDIC and the Securities Investor Protection Corporation.
We rely heavily on technology, and technology can be subject to interruption and instability.
We rely on technology, particularly the Internet, to conduct much of our activity. Our technology operations are vulnerable to disruptions from human error, natural disasters, power loss, computer viruses, spam attacks, unauthorized access and other similar events. Disruptions to or instability of our technology or external technology that allows our customers to use our products and services could harm our business and our reputation. In addition, technology systems, whether they be our own proprietary systems or the systems of third parties on whom we rely to conduct portions of our operations, are potentially vulnerable to security breaches and unauthorized usage. An actual or perceived breach of the security of our technology could harm our business and our reputation.
Vulnerability of our customers’ computers could lead to significant losses related to identity theft or other fraud and harm our reputation and financial performance.
Because our business model relies heavily on our customers’ use of their own personal computers and the Internet, our business and reputation could be harmed by security breaches of our customers and third parties. Computer viruses and other attacks on our customers’ personal computer systems could create losses for our customers even without any breach in the security of our systems, and could thereby harm our business and our reputation. As part of our E*TRADE Complete Protection Guarantee, we reimburse our customers for losses caused by a breach of security of the customers’ own personal systems. Such reimbursements could have a material impact on our financial performance.
Downturns in the securities markets increase the credit risk associated with margin lending or stock loan transactions.
We permit customers to purchase securities on margin. A downturn in securities markets may impact the value of collateral held in connection with margin receivables and may reduce its value below the amount
9
Table of Contents
borrowed, potentially creating collections issues with our margin receivables. In addition, we frequently borrow securities from and lend securities to other broker-dealers. Under regulatory guidelines, when we borrow or lend securities, we must generally simultaneously disburse or receive cash deposits. A sharp change in security market values may result in losses if counterparties to the borrowing and lending transactions fail to honor their commitments.
We may be unsuccessful in managing the effects of changes in interest rates and the enterprise interest-earning assets in our portfolio.
Net operating interest income is an important source of our revenue. Our results of operations depend, in part, on our level of net operating interest income and our effective management of the impact of changing interest rates and varying asset and liability maturities. Our ability to manage interest rate risk could impact our financial condition. We use derivatives to help manage interest rate risk. However, the derivatives we utilize may not be completely effective at managing this risk and changes in market interest rates and the yield curve could reduce the value of our financial assets and reduce net operating interest income. Among other items, we periodically enter into repurchase agreements to support the funding and liquidity requirements of E*TRADE Bank. Several market participants have reduced or terminated their participation in the repurchase agreement market. If we are unsuccessful in maintaining our relationships with counterparties, we could recognize substantial losses on the derivatives we utilized to hedge repurchase agreements.
If we do not successfully manage consolidation opportunities, we could be at a competitive disadvantage.
There has recently been significant consolidation in the financial services industry and this consolidation is likely to continue in the future. Should we be excluded from or fail to take advantage of viable consolidation opportunities, our competitors may be able to capitalize on those opportunities and create greater scale and cost efficiencies to our detriment.
We have acquired a number of businesses and, although we are currently constrained by the terms of our corporate debt and the memoranda of understanding we and E*TRADE Bank entered into with the OTS, may continue to acquire businesses in the future. The primary assets of these businesses are their customer accounts. Our retention of these assets and the customers of businesses we acquire may be impacted by our ability to successfully continue to integrate the acquired operations, products (including pricing) and personnel. Diversion of management attention from other business concerns could have a negative impact. If we are not successful in our integration efforts, we may experience significant attrition in the acquired accounts or experience other issues that would prevent us from achieving the level of revenue enhancements and cost savings that we expect with respect to an acquisition.
Risks associated with principal trading transactions could result in trading losses.
A majority of our market-making revenues are derived from trading as a principal. We may incur trading losses relating to the purchase, sale or short sale of securities for our own account, as well as trading losses in our market maker stocks. From time to time, we may have large positions in securities of a single issuer or issuers engaged in a specific industry. Sudden changes in the value of these positions could impact our financial results.
Reduced spreads in securities pricing, levels of trading activity and trading through market makers could harm our market maker business.
Computer-generated buy/sell programs and other technological advances and regulatory changes in the marketplace may continue to tighten securities spreads. Tighter spreads could reduce revenue capture per share by our market maker, thus reducing revenues for this line of business.
Advisory services subject us to additional risks.
We provide advisory services to investors to aid them in their decision making and also provide full service portfolio management. Investment decisions and suggestions are based on publicly available documents and
10
Table of Contents
communications with investors regarding investment preferences and risk tolerances. Publicly available documents may be inaccurate and misleading, resulting in recommendations or transactions that are inconsistent with the investors’ intended results. In addition, advisors may not understand investor needs or risk tolerances, failures that may result in the recommendation or purchase of a portfolio of assets that may not be suitable for the investor. To the extent that we fail to know our customers or improperly advise them, we could be found liable for losses suffered by such customers, which could harm our reputation and business.
Our international operations subject us to additional risks and regulation, which could impair our business growth.
We conduct business in a number of international locations, sometimes through joint venture and/or licensee relationships. Action or inaction in any of these operations, including the failure to follow proper practices with respect to regulatory compliance and/or corporate governance, could harm our operations and/or our reputation.
We have a significant deferred tax asset and cannot assure it will be fully realized.
We had net deferred tax assets of $1.4 billion as of December 31, 2009. We did not establish a valuation allowance against our federal net deferred tax assets as of December 31, 2009 as we believe that it is more likely than not that all of these assets will be realized. In evaluating the need for a valuation allowance, we estimated future taxable income based on management approved forecasts. This process required significant judgment by management about matters that are by nature uncertain. If future events differ significantly from our current forecasts, a valuation allowance may need to be established, which would have a material adverse effect on our results of operations and our financial condition.
As a result of the Public Equity Offering, the Debt Exchange and related transactions, we believe that we have recently experienced an “ownership change” for tax purposes that could cause us to permanently lose a significant portion of our U.S. federal and state deferred tax assets.
As a result of the Public Equity Offering, the Debt Exchange and related transactions, we believe that we have recently experienced an “ownership change” as defined under Section 382 of the Internal Revenue Code of 1986, as amended (which is generally a greater than 50 percentage point increase by certain “5% shareholders” over a rolling three year period). Section 382 imposes an annual limitation on the utilization of deferred tax assets, such as net operating loss carryforwards and other tax attributes, once an ownership change has occurred. Depending on the size of the annual limitation (which is in part a function of our market capitalization at the time of the ownership change) and the remaining carryforward period of the tax assets (U.S. federal net operating losses generally may be carried forward for a period of 20 years), we could realize a permanent loss of a portion of our U.S. federal and state deferred tax assets and certain built-in losses that have not been recognized for tax purposes. We believe the tax ownership change will extend the period of time it will take to fully utilize our pre-ownership change net operating losses (“NOLs”), but will not limit the total amount of pre-ownership change NOLs we can utilize. This is a complex analysis and requires the Company to make certain judgments in determining the annual limitation. As a result, it is possible that we could ultimately lose a significant portion of our deferred tax assets, which could have a material adverse effect on our results of operations and financial condition.
Risks Relating to the Regulation of Our Business
We are subject to extensive government regulation, including banking and securities rules and regulations, which could restrict our business practices.
The securities and banking industries are subject to extensive regulation. All of our broker-dealer subsidiaries have to comply with many laws and rules, including rules relating to sales practices and the suitability of recommendations to customers, possession and control of customer funds and securities, margin lending, execution and settlement of transactions and anti money-laundering. We are also subject to additional laws and rules as a result of our market maker operations.
11
Table of Contents
Similarly, E*TRADE Financial Corporation and ETB Holdings, Inc., as savings and loan holding companies, and E*TRADE Bank, E*TRADE Savings Bank and E*TRADE United Bank, as federally chartered savings banks, are subject to extensive regulation, supervision and examination by the OTS (including pursuant to the terms of the memoranda of understanding) and, in the case of the savings banks, also the FDIC. Such regulation covers all banking business, including lending practices, safeguarding deposits, capital structure, recordkeeping, transactions with affiliates and conduct and qualifications of personnel.
The OTS may request that we raise additional equity to support E*TRADE Bank or to further reduce debt. If we are unable to do so, we could face negative regulatory actions. Any such actions could have a material negative effect on our business.
In early 2009, the OTS advised us, and we agreed, that we needed to raise additional equity capital for E*TRADE Bank and reduce substantially the amount of our outstanding debt in order to withstand any further deterioration in current credit and market conditions. In furtherance of these objectives, we completed the Debt Exchange, the Public Equity Offering and the At the Market common stock offering. Pursuant to memoranda of understanding we and E*TRADE Bank entered into with the OTS, we and E*TRADE Bank are required to submit to the OTS and implement both capital and de-leveraging plans to continue to monitor and address these matters.
If we are unable to comply with the terms of our capital and de-leveraging plan in the ordinary course of business or are unable to raise any additional cash equity to be contributed as capital to E*TRADE Bank or to further reduce our debt as may be required by the OTS, we could face negative regulatory consequences.
If we fail to comply with applicable securities and banking laws, rules and regulations, either domestically or internationally, we could be subject to disciplinary actions, damages, penalties or restrictions that could significantly harm our business.
The SEC, FINRA and other self-regulatory organizations and state securities commissions, among other things, can censure, fine, issue cease-and-desist orders or suspend or expel a broker-dealer or any of its officers or employees. The OTS may take similar action with respect to our banking activities. Similarly, the attorneys general of each state could bring legal action on behalf of the citizens of the various states to ensure compliance with local laws. Regulatory agencies in countries outside of the U.S. have similar authority. The ability to comply with applicable laws and rules is dependent in part on the establishment and maintenance of a reasonable compliance system. The failure to establish and enforce reasonable compliance procedures, even if unintentional, could subject us to significant losses or disciplinary or other actions.
If we do not maintain the capital levels required by regulators, we may be fined or even forced out of business.
The SEC, FINRA, OTS and various other regulatory agencies have stringent rules with respect to the maintenance of specific levels of regulatory capital by banks and net capital by securities broker-dealers. E*TRADE Bank is subject to various regulatory capital requirements administered by the OTS. Failure to meet minimum capital requirements can trigger certain mandatory, and possibly additional discretionary actions by regulators that, if undertaken, could harm E*TRADE Bank’s operations and financial statements. The Bank must meet specific capital guidelines that involve quantitative measures of E*TRADE Bank’s assets, liabilities and certain off-balance sheet items as calculated under regulatory accounting practices. Quantitative measures established by regulation to ensure capital adequacy require E*TRADE Bank to maintain minimum amounts and ratios of total and Tier 1 capital to risk-weighted assets and of Tier 1 capital to adjusted total assets. To satisfy the capital requirements for a “well capitalized” financial institution, E*TRADE Bank must maintain higher total and Tier 1 capital to risk-weighted assets and Tier 1 capital to adjusted total assets ratios. E*TRADE Bank’s capital amounts and classification are subject to qualitative judgments by the regulators about the strength of components of its capital, risk weightings of assets, off-balance sheet transactions and other factors. Any significant reduction in E*TRADE Bank’s regulatory capital could result in E*TRADE Bank being less than
12
Table of Contents
“well capitalized” or “adequately capitalized” under applicable capital rules. A failure of E*TRADE Bank to be “adequately capitalized” which is not cured within time periods specified in the indentures governing our debt securities would constitute a default under our debt securities and likely result in the debt securities becoming immediately due and payable at their full face value.
Similarly, failure to maintain the required net capital by our securities broker-dealers could result in suspension or revocation of registration by the SEC and suspension or expulsion by FINRA, and could ultimately lead to the firm’s liquidation. Net capital is the net worth of a broker or dealer (assets minus liabilities), less deductions for certain types of assets. In the past, our broker-dealer subsidiaries have depended largely on capital contributions by us in order to comply with net capital requirements. If such net capital rules are changed or expanded, or if there is an unusually large charge against net capital, operations that require an intensive use of capital could be limited. Such operations may include investing activities, marketing and the financing of customer account balances. Also, our ability to withdraw capital from brokerage subsidiaries could be restricted, which in turn could limit our ability to repay debt and redeem or purchase shares of our outstanding stock.
As a non-grandfathered savings and loan holding company, we are subject to regulations that could restrict our ability to take advantage of certain business opportunities.
We are required to file periodic reports with the OTS and are subject to examination by the OTS. The OTS also has certain types of enforcement powers over us, ETB Holdings, Inc. and certain of its subsidiaries, including the ability to issue cease-and-desist orders, force divestiture of E*TRADE Bank and impose civil and monetary penalties for violations of federal banking laws and regulations or for unsafe or unsound banking practices. In addition, under the Gramm-Leach-Bliley Act, our activities are restricted to those that are financial in nature and certain real estate-related activities. We may make merchant banking investments in companies whose activities are not financial in nature if those investments are made for the purpose of appreciation and ultimate resale of the investment and we do not manage or operate the company. Such merchant banking investments may be subject to maximum holding periods and special recordkeeping and risk management requirements. In recent periods, the Company moved its subsidiaries, E*TRADE Clearing LLC and E*TRADE Securities LLC, respectively, to become operating subsidiaries of E*TRADE Bank, resulting in increased regulatory oversight and restrictions on the activities of E*TRADE Clearing LLC and E*TRADE Securities LLC.
We believe all of our existing activities and investments are permissible under the Gramm-Leach-Bliley Act, but the OTS has not yet fully interpreted these provisions. Even if our existing activities and investments are permissible, we are unable to pursue future activities that are not financial in nature. We are also limited in our ability to invest in other savings and loan holding companies.
In addition, E*TRADE Bank is subject to extensive regulation of its activities and investments, capitalization, community reinvestment, risk management policies and procedures and relationships with affiliated companies. Acquisitions of and mergers with other financial institutions, purchases of deposits and loan portfolios, the establishment of new Bank subsidiaries and the commencement of new activities by Bank subsidiaries require the prior approval of the OTS, and in some cases the FDIC, which may deny approval or limit the scope of our planned activity. These regulations and conditions could place us at a competitive disadvantage in an environment in which consolidation within the financial services industry is prevalent. Also, these regulations and conditions could affect our ability to realize synergies from future acquisitions, could negatively affect us following the acquisition and could also delay or prevent the development, introduction and marketing of new products and services.
Risks Relating to Owning Our Stock
We are substantially restricted by the terms of our corporate debt.
The indentures governing our corporate debt contain various covenants and restrictions that limit our ability and certain of our subsidiaries’ ability to, among other things:
| • | incur additional indebtedness; |
13
Table of Contents
| • | create liens; |
| • | pay dividends or make other distributions; |
| • | repurchase or redeem capital stock; |
| • | make investments or other restricted payments; |
| • | enter into transactions with our stockholders or affiliates; |
| • | sell assets or shares of capital stock of our subsidiaries; |
| • | receive dividend or other payments from our subsidiaries; and |
| • | merge, consolidate or transfer substantially all of our assets. |
As a result of the covenants and restrictions contained in the indentures, we are limited in how we conduct our business and we may be unable to raise additional debt or equity financing to compete effectively or to take advantage of new business opportunities. Each of these series of our corporate debt contains a limitation, subject to important exceptions, on our ability to incur additional debt if our Consolidated Fixed Charge Coverage Ratio (as defined in the relevant indentures) is less than or equal to 2.50 to 1.0. As of December 31, 2009, our Consolidated Fixed Charge Coverage Ratio was (1.1) to 1.0. The terms of any future indebtedness could include more restrictive covenants.
Although these covenants provide substantial flexibility, for example the ability to incur “refinancing indebtedness” and to incur up to $300 million of secured debt under a credit facility, the covenants, among other things, generally limit our ability to incur additional debt even if we were to substantially reduce our existing debt through debt exchange transactions. We could be forced to repay immediately all our outstanding debt securities at their full principal amount if we were to breach these covenants and did not cure the breach within the cure periods (if any) specified in the respective indentures. Further, if we experience a change of control, as defined in the indentures, we could be required to offer to purchase our debt securities at 101% of their principal amount. Under our debt securities a “change of control” would occur if, among other things, a person became the beneficial owner of more than 50% of the total voting power of our voting stock which, with respect to the 2011 Notes, 2013 Notes and 2015 Notes, would need to be coupled with a ratings downgrade before we would be required to offer to purchase those securities.
We cannot assure that we will be able to remain in compliance with these covenants in the future and, if we fail to do so, that we will be able to obtain waivers from the appropriate parties and/or amend the covenants.
The value of our common stock may be diluted if we need additional funds in the future or engage in debt-for-equity exchanges in the future.
In the future, we may need to raise additional funds via debt and/or equity instruments, which may not be available on favorable terms, if at all. If adequate funds are not available on acceptable terms, we may be unable to fund our capital needs and our plans for the growth of our business. In addition, if funds are available, the issuance of equity securities could significantly dilute the value of our shares of our common stock and cause the market price of our common stock to fall. We have the ability to issue a significant number of shares of stock in future transactions, which would substantially dilute existing stockholders, without seeking further stockholder approval.
In addition, we may engage in future debt exchange transactions similar to the Debt Exchange we completed in 2009, in which we issue new shares of common stock or securities convertible into or exchangeable or exercisable for our common stock in exchange for our existing interest-bearing debt. Any such exchange transactions would be designed to reduce the amount of interest we are required to pay in the future, reduce the principal amount due at maturity and/or extend the maturity profile of our outstanding debt and may allow us to recognize income to the extent we retire the debt at a fair value that is less than its face value, but would not in any case result in our receiving cash proceeds. In any future debt exchange transactions, we expect that the fair
14
Table of Contents
value of the equity or convertible debt we issue would have to exceed the fair value of the debt offered in exchange in order to provide sufficient incentive to debt holders to participate. As of December 31, 2009, we had approximately $1.6 billion aggregate principal amount of interest-bearing debt and approximately $1.0 billion of non-interest-bearing convertible debentures outstanding. From time to time, available trading data has indicated that the aggregate fair value of our interest-bearing debt has been significantly less than the aggregate principal amount of such debt. Any meaningful reduction in our leverage through debt exchange transactions for our interest-bearing debt could result in significant dilution to holders of our common stock.
In recent periods, the global financial markets were in turmoil and the equity and credit markets experienced extreme volatility, which caused already weak economic conditions to worsen. Continued turmoil in the global financial markets could further restrict our access to the public equity and debt markets.
Citadel is our largest stockholder and debtholder, with approximately 9.8% of our common stock as of December 31, 2009, or approximately 34% as converted, as of December 31, 2009. Accordingly, Citadel’s interests may conflict with the interests of other stockholders.
Citadel is the largest holder of our common stock, and as of December 31, 2009, owned approximately 185 million shares or 9.8% (980 million shares or approximately 34%, as converted) of our common stock. In addition, although Citadel is not required to disclose to us the amount of our outstanding debt securities it owns, we believe it owns in the aggregate more than 80% of the non-interest-bearing convertible debentures, as of December 31, 2009. In addition, Kenneth Griffin, President and CEO of Citadel, joined the Board of Directors on June 8, 2009 pursuant to a director nomination right granted to Citadel in 2007.
Citadel is an independent entity with its own investors and is entitled to act in its own economic interest with respect to its equity and debt investments in E*TRADE. As discussed below, our debt securities contain restrictive covenants. In pursuing its economic interests, Citadel may make decisions with respect to fundamental corporate transactions which may be different than the decisions of investors who own only common shares.
Citadel is a substantial holder of our common stock and has not entered into any contractual arrangements to protect the interests of other stockholders.
Citadel owned approximately 9.8% of our outstanding common stock, as of December 31, 2009. Based upon publicly available information, we believe that the common stock owned by Citadel, together with the common stock issuable on conversion of the Debentures held by Citadel, represents approximately 34% of the common stock on a fully diluted basis. Under the law of Delaware, where the Company is incorporated, this would most likely be sufficient to permit Citadel to influence or cause the election of a substantial number of directors and significantly impact, corporate policy, including decisions to enter into mergers or other extraordinary transactions. Citadel will be unable to accomplish these matters for so long as it is subject to certain rules of the OTS regarding rebuttals of control over thrifts and thrift holding companies. If these rules change, or if Citadel receives a waiver or is no longer subject to its rebuttal of control agreement with the OTS or decides to become a thrift holding company, it will be in a position to influence or cause the election of a substantial number of directors and to substantially impact, corporate policy. Further, if Citadel acquires securities representing more than 50% of the total voting power, holders of our debt securities would have the right to require the Company to repurchase all such securities for cash at 101% of their face amount.
The market price of our common stock may continue to be volatile.
From January 1, 2007 through December 31, 2009, the price per share of our common stock ranged from a low of $0.59 to a high of $26.08. The market price of our common stock has been, and is likely to continue to be, highly volatile and subject to wide fluctuations. In the past, volatility in the market price of a company’s securities has often led to securities class action litigation. Such litigation could result in substantial costs to us and divert our attention and resources, which could harm our business. As discussed in Note 22—Commitments, Contingencies and Other Regulatory Matters of Item 8. Financial Statements and Supplementary Data, we are currently a party to litigation related to the decline in the market price of our stock, and such litigation could occur again in the future.
15
Table of Contents
Declines in the market price of our common stock or failure of the market price to increase could also harm our ability to retain key employees, reduce our access to capital and otherwise harm our business.
We have various mechanisms in place that may discourage takeover attempts.
Certain provisions of our certificate of incorporation and bylaws may discourage, delay or prevent a third party from acquiring control of us in a merger, acquisition or similar transaction that a shareholder may considerfavorable. Such provisions include:
| • | authorization for the issuance of “blank check” preferred stock; |
| • | provision for a classified Board of Directors with staggered, three-year terms; |
| • | the prohibition of cumulative voting in the election of directors; |
| • | a super-majority voting requirement to effect business combinations or certain amendments to our certificate of incorporation and bylaws; |
| • | limits on the persons who may call special meetings of shareholders; |
| • | the prohibition of shareholder action by written consent; and |
| • | advance notice requirements for nominations to the Board or for proposing matters that can be acted on by shareholders at shareholder meetings. |
In addition, certain provisions of our stock incentive plans, management retention and employment agreements (including severance payments and stock option acceleration), and certain provisions of Delaware law and the requirements under our debt securities to offer to purchase such securities at 101% of their principal amount may also discourage, delay or prevent someone from acquiring or merging with us.
We may not be able to generate sufficient cash to service all of our indebtedness and may be forced to take other actions to satisfy our obligations under our indebtedness, which may not be successful.
Our ability to make scheduled payments on or to refinance our debt obligations depends on our financial condition and operating performance, which is subject to prevailing economic and competitive conditions and to certain financial, business and other factors beyond our control. We may not be able to maintain a level of cash flows from operating activities sufficient to permit us to pay the principal, premium, if any, and interest on our indebtedness.
If our cash flows and capital resources are insufficient to fund our debt service obligations, we may be forced to reduce or delay investments and capital expenditures, or to sell assets, seek additional capital or restructure or refinance our indebtedness. These alternative measures may not be successful and may not permit us to meet our scheduled debt service obligations. In addition, the terms of existing or future debt instruments may restrict us from adopting some of these alternatives.
Our ability to restructure or refinance our debt will depend on the condition of the capital markets and our financial condition at such time. Any refinancing of our debt could be at higher interest rates and may require us to comply with more onerous covenants, which could further restrict our business operations. In addition, any failure to make payments of interest and principal on our outstanding indebtedness on a timely basis would likely result in a reduction of our credit rating, which could harm our ability to incur additional indebtedness. If our operating results and available cash are insufficient to meet our debt service obligations, we could face substantial liquidity problems and might be required to dispose of material assets or operations to meet our debt service and other obligations. We may not be able to consummate those dispositions or to obtain the proceeds that we could realize from them, and these proceeds may not be adequate to meet any debt service obligations then due.
| ITEM 1B. UNRESOLVED | STAFF COMMENTS |
None.
16
Table of Contents
| ITEM 2. | PROPERTIES |
A summary of our significant locations at December 31, 2009 is shown in the following table. All facilities are leased, except for 165,000 square feet of our office in Alpharetta, Georgia. Square footage amounts are net of space that has been sublet or part of a facility restructuring.
| Location |
Approximate Square Footage | |
| Alpharetta, Georgia |
260,000 | |
| Arlington, Virginia |
140,000 | |
| Jersey City, New Jersey |
107,000 | |
| Sandy, Utah |
77,000 | |
| Menlo Park, California |
76,000 | |
| New York, New York |
53,000 | |
| Chicago, Illinois |
25,000 |
All of our facilities are used by either our trading and investing or balance sheet management segments. All other leased facilities with space of less than 25,000 square feet are not listed by location. In addition to the significant facilities above, we also lease all of our 28 E*TRADE Branches, ranging in space from approximately 2,500 to 13,000 square feet. We believe our facilities space is adequate to meet our needs in 2010.
| ITEM 3. | LEGAL PROCEEDINGS |
On October 27, 2000, Ajaxo, Inc. (“Ajaxo”) filed a complaint in the Superior Court for the State of California, County of Santa Clara. Ajaxo sought damages and certain non-monetary relief for the Company’s alleged breach of a non-disclosure agreement with Ajaxo pertaining to certain wireless technology that Ajaxo offered the Company as well as damages and other relief against the Company for their alleged misappropriation of Ajaxo’s trade secrets. Following a jury trial, a judgment was entered in 2003 in favor of Ajaxo against the Company for $1.3 million dollars for breach of the Ajaxo non-disclosure agreement. Although the jury also found in favor of Ajaxo on its claim against the Company for misappropriation of trade secrets, the trial court subsequently denied Ajaxo’s requests for additional damages and relief. On December 21, 2005, the California Court of Appeal affirmed the above-described award against the Company for breach of the nondisclosure agreement but remanded the case to the trial court for the limited purpose of determining what, if any, additional damages Ajaxo may be entitled to as a result of the jury’s previous finding in favor of Ajaxo on its claim against the Company for misappropriation of trade secrets. Although the Company paid Ajaxo the full amount due on the above-described judgment, the case, consistent with the rulings issued by the Court of Appeal, was remanded back to the trial court, and on May 30, 2008, a jury returned a verdict in favor of the Company denying all claims raised and demands for damages against the Company. Following the trial court’s filing of entry of judgment in favor of the Company on September 5, 2008, Ajaxo filed post-trial motions for vacating this entry of judgment and requesting a new trial. On November 4, 2008, the trial court denied these motions. On December 2, 2008, Ajaxo filed a notice of appeal with the Court of Appeal of the State of California for the Sixth District, and the parties completed the briefing of Ajaxo’s appeal on December 14, 2009. The Company will continue to vigorously defend itself and oppose Ajaxo’s appeal.
On October 11, 2006, a state class action was filed by Nikki Greenberg on her own behalf and on behalf of all those similarly situated plaintiffs, in the Superior Court for the State of California, County of Los Angeles on behalf of all customers or consumers who allegedly made or received telephone calls from the Company that were recorded without their knowledge or consent. On February 7, 2008, class certification was granted and the class defined to consist of (1) all persons in California who received telephone calls from the Company and whose calls were recorded without their consent within three years of October 11, 2006, and (2) all persons who made calls from California to the Beverly Hills branch of the Company on August 8, 2006. Plaintiffs sought to recover unspecified monetary damages plus injunctive relief, including punitive and exemplary damages, interest, attorneys’ fees and costs. On October 16, 2009, the court granted final approval of the parties’ proposed
17
Table of Contents
settlement agreement. Objectors to the court’s order granting final approval of the parties’ settlement agreement filed notices of appeal which were subsequently dismissed on January 26, 2010.
On October 2, 2007, a class action complaint alleging violations of the federal securities laws was filed in the United States District Court for the Southern District of New York against the Company and its then Chief Executive Officer and Chief Financial Officer, Mitchell H. Caplan and Robert J. Simmons by Larry Freudenberg on his own behalf and on behalf of others similarly situated (the “Freudenberg Action”). On July 17, 2008, the trial court consolidated this action with four other purported class actions, all of which were filed in the United States District Court for the Southern District of New York and which were based on the same facts and circumstances. On January 16, 2009, plaintiffs served their consolidated amended class action complaint in which they also named Dennis Webb, the Company’s former Capital Markets Division President as a defendant. Plaintiffs contend, among other things, that the value of the Company’s stock between April 19, 2006 and November 9, 2007 was artificially inflated because defendants issued materially false and misleading statements and failed to disclose that the Company was experiencing a rise in delinquency rates in its mortgage and home equity portfolios; failed to timely record an impairment on its mortgage and home equity portfolios; materially overvalued its securities portfolio, which included assets backed by mortgages; and based on the foregoing, lacked a reasonable basis for the positive statements made about the Company’s earnings and prospects. Plaintiffs seek to recover damages in an amount to be proven at trial, including interest and attorneys’ fees and costs. Defendants filed their motion to dismiss on April 2, 2009, and briefing on defendants’ motion to dismiss was completed on August 31, 2009. The Company intends to vigorously defend itself against these claims.
On August 15, 2008, Ronald M. Tate as trustee of the Ronald M. Tate Trust Dtd 4/13/88, and George Avakian filed an action in the United States District Court for the Southern District of New York against the Company, Mitchell H. Caplan and Robert J. Simmons based on the same facts and circumstances, and containing the same claims, as the Freudenberg consolidated actions discussed above. By agreement of the parties and approval of the court, the Tate action has been consolidated with the Freudenberg consolidated actions for the purpose of pre-trial discovery. Plaintiffs seek to recover damages in an amount to be proven at trial, including interest, attorneys’ and expert fees and costs. The Company intends to vigorously defend itself against these claims.
Based upon the same facts and circumstances alleged in the Freudenberg consolidated actions above, a verified shareholder derivative complaint was filed in the United States District Court for the Southern District of New York on October 4, 2007 by Catherine Rubery, against the Company and its then Chief Executive Officer, President/Chief Operating Officer, Chief Financial Officer and individual members of its board of directors. Plaintiff alleges, among other things, causes of action for breach of fiduciary duty, waste of corporate assets, unjust enrichment, and violation of the Securities Exchange Act of 1934 and Rule 10b-5 promulgated thereunder. The above federal shareholder derivative complaint has been consolidated with another shareholder derivative complaint brought by shareholder Marilyn Clark in the same court and against the same named defendants. Three similar derivative actions, based on the same facts and circumstances as the federal derivative actions, but alleging exclusively state causes of action, have been filed in the Supreme Court of the State of New York, New York County and have been ordered consolidated in that court. In these state derivative actions, plaintiffs Frank Fosbre, Brian Kallinen and Alexander Guiseppone filed a consolidated amended complaint on March 23, 2009. Plaintiffs in the foregoing actions seek unspecified monetary damages against the Individual Defendants in favor of the Company, plus an injunction compelling changes to the Company’s Corporate Governance policies. By agreement of the parties and approval of the respective courts, further proceedings in both these federal and state derivative actions will continue to trail those in the federal securities class actions discussed above.
On April 2, 2008, a class action complaint alleging violations of the federal securities laws was filed by John W. Oughtred on his own behalf and on behalf of all others similarly situated in the United States District Court for the Southern District of New York against the Company. Plaintiff contends, among other things, that the Company committed various sales practice violations in the sale of certain auction rate securities to investors between April 2, 2003, and February 13, 2008 by allegedly misrepresenting that these securities were highly
18
Table of Contents
liquid and safe investments for short term investing. On December 18, 2008, plaintiffs filed their first amended class action complaint. Defendants filed their pending motion to dismiss plaintiffs’ amended complaint on February 5, 2009, and briefing on defendants’ motion to dismiss was completed on April 15, 2009. Plaintiffs seek to recover damages in an amount to be proven at trial, or, in the alternative, rescission of auction rate securities purchases, plus interest and attorney’s fees and costs. The Company intends to vigorously defend itself against the claims raised in this action.
On October 17, 2007, the SEC initiated an informal inquiry into matters related to the Company’s mortgage loan and mortgage-related securities investment portfolios. The Company is cooperating fully with the SEC in this matter.
Beginning in approximately August 2008, representatives of various states attorneys general and FINRA initiated inquiries regarding the purchase of auction rate securities by E*TRADE Securities LLC’s customers. E*TRADE Securities LLC is cooperating with these inquiries. As of February 19, 2010, the total amount of auction rate securities held by all E*TRADE Securities LLC customers was approximately $169.7 million.
On January 19, 2010, the North Carolina Securities Division filed an administrative petition against E*TRADE Securities LLC seeking to revoke the North Carolina securities dealer registration of E*TRADE Securities LLC or, alternatively, to suspend that registration until all North Carolina residents are made whole for their investments in auction rate securities purchased through E*TRADE Securities LLC. E*TRADE Securities LLC is defending that action. As of February 19, 2010, the total amount of auction rate securities held by North Carolina customers is approximately $2.2 million.
In March 2009, the Company’s subsidiary E*TRADE Capital Markets, LLC and 13 other current or former specialist firms on various regional exchanges finalized a settlement of SEC charges alleging that such firms executed proprietary orders in a given security prior to a customer order in the same security during the period 1999-2005. E*TRADE Capital Markets, LLC was a specialist on the Chicago Stock Exchange during the period under review although it exited the specialist business in 2007. According to the SEC complaint, the majority of the alleged violations occurred between 1999 and 2002. As part of the settlement, E*TRADE Capital Markets, LLC consented to the entry of an injunction from future violations of Chicago Stock Exchange Article 9 Rule 17 and the payment of $28.3 million in disgorgement and a $5.7 million penalty, both of which had been reserved for in prior periods. E*TRADE Capital Markets, LLC also consented to findings that it violated section 17(a) of the Securities Exchange Act of 1934 and Rule 17a-3(a)(1) thereunder by failing to make or keep current an itemized record of all purchases and sales in its proprietary account. E*TRADE Capital Markets, LLC settled the SEC charges without admitting or denying the allegations of the complaint.
On February 3, 2010, a class action complaint was filed in the United States District Court for the Northern District of California against E*TRADE Securities LLC by Joseph Roling on his own behalf and on behalf of all others similarly situated. The lead plaintiff alleges that E*TRADE Securities LLC unlawfully charged and collected certain account activity fees from its customers. Claimant, on behalf of himself and the putative class, asserts breach of contract, unjust enrichment and violation of California Civil Code Section 1671 and seeks equitable and injunctive relief for alleged illegal, unfair and fraudulent practices under California’s Unfair Competition Law, California Business and Professional Code Section 17200 et seq. The plaintiff seeks, among other things, certification of the class action on behalf of alleged similarly situated plaintiffs, unspecified damages and restitution of amounts allegedly wrongfully collected by E*TRADE Securities LLC, attorneys fees and expenses and injunctive relief. The Company intends to vigorously defend itself against the claims raised in this action.
In addition to the matters described above, the Company is subject to various legal proceedings and claims that arise in the normal course of business which could have a material adverse effect on its financial position, results of operations or cash flows. In each pending matter, the Company contests liability or the amount of claimed damages. In view of the inherent difficulty of predicting the outcome of such matters, particularly in cases where claimants seek substantial or indeterminate damages, or where investigation or discovery have yet to
19
Table of Contents
be completed, the Company cannot predict with certainty the loss or range of loss related to such matters, how such matters will be resolved, when they will ultimately be resolved, or what any eventual settlement, fine, penalty or other relief might be. Subject to the foregoing, the Company believes that the outcome of any such pending matter will not have a material adverse effect on the consolidated financial condition of the Company, although the outcome could be material to the Company’s or a business segment’s operating results in the future, depending, among other things, upon the Company’s or business segment’s income for such period.
An unfavorable outcome in any matter that is not covered by insurance could have a material adverse effect on the Company’s business, financial condition, results of operations or cash flows. In addition, even if the ultimate outcomes are resolved in the Company’s favor, the defense of such litigation could entail considerable cost or the diversion of the efforts of management, either of which could have a material adverse effect on the Company’s business, financial condition, results of operations or cash flows.
The Company maintains insurance coverage that management believes is reasonable and prudent. The principal insurance coverage it maintains covers commercial general liability; property damage; hardware/software damage; cyber liability; directors and officers; employment practices liability; certain criminal acts against the Company; and errors and omissions. The Company believes that such insurance coverage is adequate for the purpose of its business. The Company’s ability to maintain this level of insurance coverage in the future, however, is subject to the availability of affordable insurance in the marketplace.
| ITEM 4. | SUBMISSION OF MATTERS TO A VOTE OF SECURITY HOLDERS |
None.
20
Table of Contents
| ITEM 5. | MARKET FOR REGISTRANT’S COMMON EQUITY, RELATED SHAREHOLDER MATTERS AND ISSUER PURCHASES OF EQUITY SECURITIES |
Price Range of Common Stock
The following table shows the high and low sale prices of our common stock as reported by the NASDAQ for the periods indicated:
| High | Low | |||||
| 2009: |
||||||
| First Quarter |
$ | 1.58 | $ | 0.59 | ||
| Second Quarter |
$ | 2.90 | $ | 1.17 | ||
| Third Quarter |
$ | 2.08 | $ | 1.15 | ||
| Fourth Quarter |
$ | 1.84 | $ | 1.33 | ||
| 2008: |
||||||
| First Quarter |
$ | 5.48 | $ | 2.08 | ||
| Second Quarter |
$ | 4.53 | $ | 3.02 | ||
| Third Quarter |
$ | 4.05 | $ | 2.30 | ||
| Fourth Quarter |
$ | 3.30 | $ | 0.79 | ||
The closing sale price of our common stock as reported on the NASDAQ on February 22, 2010 was $1.57 per share. At that date, there were 1,812 holders of record of our common stock.
Dividends
We have never declared or paid cash dividends on our common stock. The terms of our corporate debt currently prohibit the payment of dividends and will continue to for the foreseeable future. E*TRADE Bank may not pay dividends to the parent company without approval from the OTS. This dividend restriction includes E*TRADE Securities LLC and E*TRADE Clearing LLC as they are subsidiaries of E*TRADE Bank.
Equity Compensation Plan Information
Refer to Note 19—Employee Shared-Based Payments and Other Benefits of Item 8. Financial Statements and Supplementary Data for equity compensation plan information.
21
Table of Contents
Performance Graph
The following performance graph shows the cumulative total return to a holder of the Company’s common stock, assuming dividend reinvestment, compared with the cumulative total return, assuming dividend reinvestment, of the S&P 500 and the S&P Super Cap Diversified Financials during the period from December 31, 2004 through December 31, 2009.
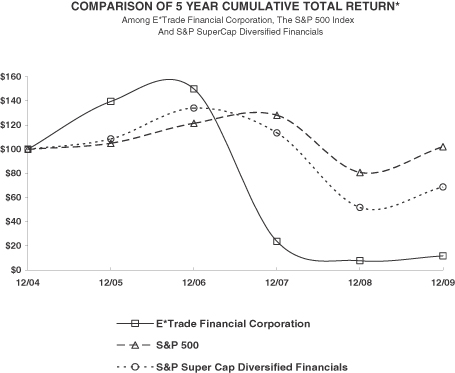
| 12/04 | 12/05 | 12/06 | 12/07 | 12/08 | 12/09 | |||||||
| E*TRADE Financial Corporation |
100.00 | 139.53 | 149.97 | 23.75 | 7.69 | 11.77 | ||||||
| S&P 500 |
100.00 | 104.91 | 121.48 | 128.16 | 80.74 | 102.11 | ||||||
| S&P Super Cap Diversified Financials |
100.00 | 108.57 | 134.05 | 113.51 | 51.77 | 68.73 |
| * | $100 invested on 12/31/04 in stock or index-including reinvestment of dividends. Fiscal year ending December 31. |
| * | Copyright © 2010, Standard & Poor’s, a division of The McGraw-Hill Companies, Inc. All rights reserved. (www.researchdatagroup.com/S&P.htm) |
22
Table of Contents
| ITEM 6. | SELECTED CONSOLIDATED FINANCIAL DATA |
(Dollars in millions, shares in thousands, except per share amounts):
| Year Ended December 31, | Variance | ||||||||||||||||||||
| 2009 | 2008 | 2007 | 2006 | 2005 | 2009 vs. 2008 | ||||||||||||||||
| Results of Operations:(1) | |||||||||||||||||||||
| Net operating interest income |
$ | 1,260.6 | $ | 1,268.0 | $ | 1,583.6 | $ | 1,385.5 | $ | 861.8 | (1 | )% | |||||||||
| Total net revenue |
$ | 2,217.0 | $ | 1,925.6 | $ | 161.7 | $ | 2,368.6 | $ | 1,647.9 | 15 | % | |||||||||
| Provision for loan losses |
$ | 1,498.1 | $ | 1,583.7 | $ | 640.1 | $ | 45.0 | $ | 54.0 | (5 | )% | |||||||||
| Income (loss) from continuing operations |
$ | (1,297.8 | ) | $ | (809.4 | ) | $ | (1,442.3 | ) | $ | 626.9 | $ | 427.3 | * | |||||||
| Net income (loss) |
$ | (1,297.8 | ) | $ | (511.8 | ) | $ | (1,441.8 | ) | $ | 628.9 | $ | 430.4 | * | |||||||
| Basic earnings (loss) per share from continuing operations |
$ | (1.18 | ) | $ | (1.58 | ) | $ | (3.40 | ) | $ | 1.49 | $ | 1.15 | * | |||||||
| Diluted earnings (loss) per share from continuing operations |
$ | (1.18 | ) | $ | (1.58 | ) | $ | (3.40 | ) | $ | 1.44 | $ | 1.11 | * | |||||||
| Basic net earnings (loss) per share |
$ | (1.18 | ) | $ | (1.00 | ) | $ | (3.40 | ) | $ | 1.49 | $ | 1.16 | * | |||||||
| Diluted net earnings (loss) per share |
$ | (1.18 | ) | $ | (1.00 | ) | $ | (3.40 | ) | $ | 1.44 | $ | 1.12 | * | |||||||
| Weighted average shares—basic |
1,095,437 | 509,862 | 424,439 | 421,127 | 371,468 | 115 | % | ||||||||||||||
| Weighted average shares—diluted |
1,095,437 | 509,862 | 424,439 | 436,357 | 384,630 | 115 | % | ||||||||||||||
| * | Percentage not meaningful. |
| (1) | In 2008, the Company sold its Canadian brokerage business and exited its direct retail lending business. In 2006, the Company completed the sale of its professional agency trading business. In 2005, the Company exited the professional proprietary business and completed the sale of E*TRADE Consumer Finance Corporation. |
23
Table of Contents
(Dollars in millions):
| December 31, | Variance | |||||||||||||||||
| 2009 | 2008 | 2007 | 2006 | 2005 | 2009 vs. 2008 | |||||||||||||
| Financial Condition: |
||||||||||||||||||
| Available-for-sale mortgage-backed and investment securities |
$ | 13,319.7 | $ | 10,806.1 | $ | 11,255.0 | $ | 13,677.8 | $ | 12,564.7 | 23 | % | ||||||
| Margin receivables |
$ | 3,827.2 | $ | 2,791.2 | $ | 7,179.2 | $ | 6,828.4 | $ | 5,642.0 | 37 | % | ||||||
| Loans, net |
$ | 19,174.9 | $ | 24,451.8 | $ | 30,139.4 | $ | 26,656.2 | $ | 19,512.3 | (22 | )% | ||||||
| Total assets |
$ | 47,366.5 | $ | 48,538.2 | $ | 56,845.9 | $ | 53,739.3 | $ | 44,567.7 | (2 | )% | ||||||
| Deposits |
$ | 25,597.7 | $ | 26,136.2 | $ | 25,884.8 | $ | 24,071.0 | $ | 15,948.0 | (2 | )% | ||||||
| Corporate debt |
||||||||||||||||||
| Interest-bearing |
$ | 1,437.8 | $ | 2,750.5 | $ | 3,022.7 | $ | 1,842.2 | $ | 2,022.7 | (48 | )% | ||||||
| Non-interest-bearing |
$ | 1,020.9 | $ | — | $ | — | $ | — | $ | — | * | |||||||
| Shareholders’ equity |
$ | 3,749.6 | $ | 2,591.5 | $ | 2,829.1 | $ | 4,196.4 | $ | 3,399.6 | 45 | % | ||||||
| * | Percentage not meaningful. |
(Dollars in billions, except per trade amounts):
| At or For the Year Ended December 31, | Variance | |||||||||||||||||
| 2009 | 2008 | 2007 | 2006 | 2005 | 2009 vs. 2008 | |||||||||||||
| Key Measures(1): |
||||||||||||||||||
| Customer assets |
$ | 153.2 | $ | 112.2 | $ | 185.0 | $ | 191.3 | $ | 175.6 | 37 | % | ||||||
| Customer cash and deposits |
$ | 33.8 | $ | 32.3 | $ | 32.7 | $ | 33.0 | $ | 27.8 | 5 | % | ||||||
| Total DARTs |
196,521 | 188,116 | 177,900 | 153,146 | 95,209 | 4 | % | |||||||||||
| Average commission per trade |
$ | 11.11 | $ | 10.88 | $ | 11.72 | $ | 11.97 | $ | 13.44 | 2 | % | ||||||
| End of period brokerage accounts(2) |
2,630,079 | 2,515,806 | 2,373,265 | 2,368,577 | N/A | 5 | % | |||||||||||
| Enterprise net interest spread (basis points) |
272 | 252 | 264 | 285 | 249 | 8 | % | |||||||||||
| Enterprise interest-earning assets (average) |
$ | 44.5 | $ | 46.9 | $ | 56.1 | $ | 44.9 | $ | 32.0 | (5 | )% | ||||||
| Total employees (period end) |
3,084 | 3,249 | 3,757 | 4,126 | 3,439 | (5 | )% | |||||||||||
| (1) | Metrics have been represented to exclude activity from discontinued operations. |
| (2) | References to “brokerage” in these metrics refer to activity on our domestic platforms and do not include brokerage activity from our international local brokerage accounts. |
The selected consolidated financial data should be read in conjunction with Item 7. Management’s Discussion and Analysis of Financial Condition and Results of Operations and Item 8. Financial Statements and Supplementary Data.
24
Table of Contents
| ITEM 7. | MANAGEMENT’S DISCUSSION AND ANALYSIS OF FINANCIAL CONDITION AND RESULTS OF OPERATIONS |
The following discussion should be read in conjunction with the consolidated financial statements and the related notes that appear elsewhere in this document.
In analyzing and discussing our business, we utilize certain metrics, ratios and other terms that are defined in the Glossary of Terms, which is located at the end of Item 7. Management’s Discussion and Analysis of Financial Condition and Results of Operations.
Strategy
Our core business is our trading and investing customer franchise. Our strategy is to profitably grow this business by focusing on two primary groups of customers: traders and long-term investors. We believe our trading customers, particularly our active traders, are the foundation of our brokerage business and we are focused on maintaining our competitive position with this customer group. Our long-term investing customer group is less developed when compared to our trading customers and represents our largest opportunity for future growth.
We believe our focus on certain key factors will enable us to execute our strategy of profitably growing our trading and investing business. These key factors include the development of innovative online trading and long-term investing products and services, a concerted effort to deliver superior customer service, creative and cost-effective marketing and sales, and expense discipline. In addition, we continue to invest significantly for long-term growth so that we remain competitive among the largest online brokers.
In addition to focusing on our customer franchise, our strategy includes an intense focus on addressing the balance sheet issues primarily caused by the mortgage crisis. We are focused on improving our capital structure as well as mitigating the credit losses inherent in our loan portfolio. We believe the recapitalization transactions executed in the second and third quarters of 2009 significantly improved our capital structure and better positioned the Company for future growth.
Key Factors Affecting Financial Performance
Our financial performance is affected by a number of factors outside of our control, including:
| • | customer demand for financial products and services; |
| • | the weakness or strength of the residential real estate and credit markets; |
| • | the performance, volume and volatility of the equity and capital markets; |
| • | customer perception of the financial strength of our franchise; |
| • | market demand and liquidity in the secondary market for mortgage loans and securities; and |
| • | market demand and liquidity in the wholesale borrowings market, including securities sold under agreements to repurchase. |
In addition to the items noted above, our success in the future will depend upon, among other things:
| • | continuing our success in the acquisition, growth and retention of trading customers; |
| • | our ability to generate meaningful growth in the long-term investing customer group; |
| • | our ability to assess and manage credit risk; |
25
Table of Contents
| • | our ability to generate capital sufficient to meet our operating needs, particularly at a level sufficient to offset loan losses; |
| • | our ability to assess and manage interest rate risk; and |
| • | disciplined expense control and improved operational efficiency. |
Management monitors a number of metrics in evaluating the Company’s performance. The most significant of these are shown in the table and discussed in the text below:
| As of or For the Year Ended December 31, | Variance | ||||||||||||
| 2009 | 2008 | 2007 | 2009 vs. 2008 | ||||||||||
| Customer Activity Metrics: | |||||||||||||
| U.S. DARTs(1) |
179,183 | 169,075 | 161,219 | 6 | % | ||||||||
| U.S. average commission per trade |
$ | 11.33 | $ | 10.98 | $ | 11.57 | 3 | % | |||||
| End of period brokerage accounts(2) |
2,630,079 | 2,515,806 | 2,373,265 | 5 | % | ||||||||
| Net new brokerage accounts(2) |
114,273 | 142,541 | 4,688 | (20 | )% | ||||||||
| Customer assets (dollars in billions) |
$ | 153.2 | $ | 112.2 | $ | 185.0 | 37 | % | |||||
| Net new brokerage assets (dollars in billions)(2) |
$ | 7.2 | $ | 3.9 | $ | (13.3 | ) | * | |||||
| Brokerage related cash (dollars in billions)(2) |
$ | 20.4 | $ | 15.8 | $ | 17.5 | 29 | % | |||||
| Company Financial Metrics: | |||||||||||||
| Corporate cash (dollars in millions) |
$ | 393.2 | $ | 434.9 | $ | 312.4 | (10 | )% | |||||
| E*TRADE Bank excess risk-based capital (dollars in millions) |
$ | 899.1 | $ | 714.7 | $ | 435.1 | 26 | % | |||||
| Allowance for loan losses (dollars in millions) |
$ | 1,182.7 | $ | 1,080.6 | $ | 508.2 | 9 | % | |||||
| Enterprise net interest spread (basis points) |
272 | 252 | 264 | 8 | % | ||||||||
| Enterprise interest-earning assets (average in billions) |
$ | 44.5 | $ | 46.9 | $ | 56.1 | (5 | )% | |||||
| * | Percentage not meaningful. |
| (1) | U.S. DARTs are defined as transactions executed on our domestic platforms. |
| (2) | References to “brokerage” in these metrics refer to activity on our domestic platforms and do not include brokerage activity from our international local brokerage accounts. |
Customer Activity Metrics
| • | DARTs are the predominant driver of commissions revenue from our customers. |
| • | Average commission per trade is an indicator of changes in our customer mix, product mix and/or product pricing. As a result, this metric is impacted by the mix between our customer groups. |
| • | End of period brokerage accounts and net new brokerage accounts are indicators of our ability to attract and retain trading and investing customers. |
| • | Changes in customer assets are an indicator of the value of our relationship with the customer. An increase in customer assets generally indicates that the use of our products and services by existing and new customers is expanding. Changes in this metric are also driven by changes in the valuations of our customers’ underlying securities, which declined substantially towards the end of 2008 and into 2009. |
| • | Net new brokerage assets are total inflows to all new and existing brokerage accounts less total outflows from all closed and existing brokerage accounts and are a general indicator of the use of our products and services by existing and new brokerage customers. |
| • | Customer cash and deposits, particularly our brokerage related cash, are an indicator of a deepening engagement with our customers and are a key driver of net operating interest income. |
26
Table of Contents
Company Financial Metrics
| • | Corporate cash is an indicator of the liquidity at the parent company. It is also a source of cash that can be deployed in our regulated subsidiaries. |
| • | E*TRADE Bank excess risk-based capital is the excess capital that E*TRADE Bank has compared to the regulatory minimum to be considered well-capitalized and is an indicator of E*TRADE Bank’s ability to absorb future loan losses. |
| • | Allowance for loan losses is an estimate of the losses inherent in our loan portfolio as of the balance sheet date and is typically equal to the expected charge-offs in our loan portfolio over the next twelve months as well as the estimated charge-offs, including economic concessions to borrowers, over the estimated remaining life of loans modified in troubled debt restructurings. |
| • | Enterprise interest-earning assets, in conjunction with our enterprise net interest spread, are indicators of our ability to generate net operating interest income. |
Significant Events in 2009
Completion of $1.7 Billion Debt Exchange
| • | We exchanged $1.7 billion aggregate principal amount of our corporate debt, including $1.3 billion principal amount of our 12 1/2% Notes and $0.4 billion principal amount of our 8% Notes, for an equal principal amount of newly-issued non-interest-bearing convertible debentures (“Debt Exchange”); |
| • | As a result of the Debt Exchange, we reduced our annual corporate interest payments by approximately $200 million and eliminated any substantial debt maturities until 2013; and |
| • | The completion of the Debt Exchange resulted in a pre-tax non-cash charge of $968.3 million ($772.9 million after tax) and an increase of $707.2 million to additional paid-in capital. The net effect of the exchange to shareholders’ equity was a reduction of $65.7 million. For further details regarding this charge, see Note 1—Organization, Basis of Presentation and Summary of Significant Accounting Policies and Note 14—Corporate Debt of Item 8. Financial Statements and Supplementary Data. |
Conversions of the Newly-Issued Convertible Debentures into Equity
| • | The newly-issued non-interest-bearing convertible debentures are convertible into shares of our common stock at any time at the election of the holder; and |
| • | As of December 31, 2009, $720.9 million principal amount, or 41%, of the convertible debentures had been converted into 696.6 million shares of our common stock. |
Raised $765 Million in Gross Proceeds from Common Stock Offerings
| • | We raised $65 million in gross proceeds ($63 million in net proceeds) from our equity drawdown program launched in May 2009 (the “Equity Drawdown Program”) in which a total of 41 million shares of common stock were issued; |
| • | We raised $550 million in gross proceeds ($523 million in net proceeds) from a public offering of our common stock that was launched and completed in June 2009 (the “Public Equity Offering”) in which a total of 500 million shares of common stock were issued; and |
| • | We raised $150 million in gross proceeds ($147 million in net proceeds) from our common stock offering that was launched and completed in September 2009 (the “At the Market Offering”) in which a total of 80.2 million shares of common stock were issued. |
27
Table of Contents
Enhancements to Our Trading and Investing Products and Services
| • | We launched the E*TRADE Mobile Pro application for Apple iPhoneTM and iPod® Touch, expanding customer access to their E*TRADE accounts; |
| • | We introduced a new online center, the Investor Resource Center, which provides customers with an aggregated view of information, guidance and solutions to work toward achieving personal financial goals quickly and easily; |
| • | We introduced Online Advisor, which provides customers with a tool designed to provide actionable investment guidance, including recommended asset allocations and solutions ranging from fully self- directed investing to 100% discretionary portfolio management from a registered investment advisor affiliate; |
| • | We introduced new tools that are designed to simplify the bond and fixed income mutual fund selection and investment process in order to help customers make more informed fixed income decisions; |
| • | We launched online chat services providing prospective customers with the opportunity to receive live online help when opening an account; |
| • | We increased customer service phone support to 24 hours per day, seven days a week; and |
| • | We launched Equity Edge Online, a web-based, integrated, end-to-end equity compensation management platform. |
Restructuring of International Brokerage Business
| • | We decided to restructure our international brokerage business, which provides trading products and services through two primary channels: 1) cross-border trading, where customers residing outside of the U.S. trade in U.S. securities; and 2) local market trading, where customers residing outside of the U.S. trade in non-U.S. securities. We believe cross-border trading is a key strategic component of our global brokerage product offering and plan to continue to offer trading products and services through this channel. We believe local market trading is not a key strategic component of our global brokerage product offering; therefore, we decided to exit this channel. We have entered into agreements to sell the local market trading operations in Germany, the Nordic region, and the United Kingdom. The sale of the German operations closed in 2009 and we expect to complete the Nordic and United Kingdom transactions during 2010. |
28
Table of Contents
Summary Financial Results
Income Statement Highlights (dollars in millions, except per share amounts):
| Year Ended December 31, | Variance | ||||||||||
| 2009 | 2008 | 2009 vs. 2008 | |||||||||
| Net operating interest income |
$ | 1,260.6 | $ | 1,268.0 | (1 | )% | |||||
| Commissions |
$ | 548.0 | $ | 515.5 | 6 | % | |||||
| Fees and service charges |
$ | 192.5 | $ | 200.0 | (4 | )% | |||||
| Total net revenue |
$ | 2,217.0 | $ | 1,925.6 | 15 | % | |||||
| Provision for loan losses |
$ | 1,498.1 | $ | 1,583.7 | (5 | )% | |||||
| Operating margin |
$ | (524.4 | ) | $ | (948.3 | ) | * | ||||
| Loss from continuing operations |
$ | (1,297.8 | ) | $ | (809.4 | ) | * | ||||
| Less: net loss on the Debt Exchange |
(772.9 | ) | — | * | |||||||
| Loss from continuing operations excluding the Debt Exchange(1) |
$ | (524.9 | ) | $ | (809.4 | ) | * | ||||
| Diluted loss per share from continuing operations |
$ | (1.18 | ) | $ | (1.58 | ) | * | ||||
| Less: diluted loss per share on the Debt Exchange |
(0.71 | ) | — | * | |||||||
| Diluted loss per share from continuing operations excluding the Debt Exchange(1) |
$ | (0.47 | ) | $ | (1.58 | ) | * | ||||
| * | Percentage not meaningful. |
| (1) | Net loss excluding the non-cash charge on the Debt Exchange represents net loss plus the non-cash charge on the Debt Exchange, net of tax and is a non-GAAP measure. Loss per share excluding the non-cash charge on the Debt Exchange represents net loss plus the non-cash charge on the Debt Exchange, net of tax, divided by diluted shares and is a non-GAAP measure. Management believes that excluding the non-cash charge associated with the Debt Exchange from net loss and loss per share provides a useful additional measure of the Company’s ongoing operating performance because the charge is not directly related to our performance. The reconciliation of these non-GAAP measures is provided in the table above. |
During the year ended December 31, 2009, we increased the level of income generated in the trading and investing segment and achieved record levels of DARTs and brokerage accounts. This strong performance was more than offset by the provision for loan losses reported in our balance sheet management segment. Although we expect our provision for loan losses to continue at elevated levels in future periods, the level of provision for loan losses has declined for five consecutive quarters. While we cannot state with certainty that this trend will continue, we believe it is a positive indicator that our loan portfolio has continued to stabilize.
We made significant progress during the year ended December 31, 2009 on our comprehensive plan to strengthen the Company’s capital structure. We completed an offer to exchange $1.7 billion aggregate principal amount of our corporate debt for an equal principal amount of newly-issued non-interest-bearing convertible debentures. The Debt Exchange resulted in a $968.3 million pre-tax non-cash loss on extinguishment of debt and an increase to additional paid-in capital of $707.2 million during the year ended December 31, 2009. The net effect of the Debt Exchange to shareholders’ equity was a reduction of $65.7 million(1). As a result of the completion of this exchange, we reduced our annual corporate interest payments by approximately $200 million and eliminated any substantial debt maturities until 2013.
In addition to the Debt Exchange, we successfully raised $765 million of gross proceeds ($733 million in net proceeds) from our common stock equity offerings during the year ended December 31, 2009.
| (1) | For further details regarding the loss on extinguishment of debt, see “Earnings Overview” in Item 7. Management’s Discussion and Analysis of Financial Condition and Results of Operations, Note 1—Organization, Basis of Presentation and Summary of Significant Accounting Policies and Note 14—Corporate Debt of Item 8. Financial Statements and Supplementary Data. |
29
Table of Contents
Balance Sheet Highlights (dollars in millions):
| December 31, | Variance | ||||||||||
| 2009 | 2008 | 2009 vs. 2008 | |||||||||
| Total assets |
$ | 47,366.5 | $ | 48,538.2 | (2 | )% | |||||
| Less: Goodwill and other intangibles, net |
(2,308.7 | ) | (2,324.5 | ) | (1 | )% | |||||
| Add: Deferred tax liability related to goodwill |
176.9 | 127.7 | 39 | % | |||||||
| Tangible assets(1) |
$ | 45,234.7 | $ | 46,341.4 | (2 | )% | |||||
| Loans, net |
$ | 19,174.9 | $ | 24,451.8 | (22 | )% | |||||
| Corporate debt(2) |
|||||||||||
| Interest-bearing |
$ | 1,591.7 | $ | 3,150.4 | (49 | )% | |||||
| Non-interest-bearing |
$ | 1,020.9 | $ | — | * | ||||||
| Shareholders’ equity |
$ | 3,749.6 | $ | 2,591.5 | 45 | % | |||||
| Less: Goodwill and other intangibles, net |
(2,308.7 | ) | (2,324.5 | ) | (1 | )% | |||||
| Add: Deferred tax liability related to goodwill |
176.9 | 127.7 | 39 | % | |||||||
| Tangible common equity(3) |
$ | 1,617.8 | $ | 394.7 | 310 | % | |||||
| Tangible common equity to tangible assets(4) |
3.58 | % | 0.85 | % | 2.73 | % | |||||
| * | Percentage not meaningful. |
| (1) | Tangible assets is calculated as total assets less goodwill (net of related deferred tax liability) and other intangible assets and is a non-GAAP measure. Management believes that tangible assets is a measure of the Company’s capital strength and is additional useful information that supplements the regulatory capital ratios of E*TRADE Bank. |
| (2) | The corporate debt balances represent the amount of principal outstanding. |
| (3) | Tangible common equity is calculated as shareholders’ equity less goodwill (net of related deferred tax liability) and other intangible assets and is a non-GAAP measure. Management believes that tangible common equity is a measure of the Company’s capital strength and is additional useful information that supplements the regulatory capital ratios of E*TRADE Bank. |
| (4) | Tangible common equity to tangible assets is a non-GAAP measure, the components of which are defined above. Management believes that tangible common equity to tangible assets ratio is a measure of the Company’s capital strength and is additional useful information that supplements the regulatory capital ratios of E*TRADE Bank. |
During the third quarter of 2009, we exchanged $1.7 billion principal amount of our interest-bearing debt for an equal principal amount of non-interest-bearing convertible debentures. Subsequent to the Debt Exchange, $720.9 million debentures were converted into 696.6 million shares of common stock during the third and fourth quarters of 2009. The subsequent debt conversions combined with the common stock issued in connection with our equity offerings resulted in an increase of $1.5 billion in tangible common equity during the year ended December 31, 2009.
2009 Compared to 2008
We incurred a net loss of $1.3 billion for the year ended December 31, 2009 due principally to the Debt Exchange that resulted in a non-cash loss of $772.9 million (pre-tax loss of $968.3 million) on early extinguishment of debt during the third quarter of 2009. Our trading and investing segment income was $659.1 million for the year ended December 31, 2009. However, the provision for loan losses in our balance sheet management segment more than offset this strong performance, resulting in an overall segment loss of $524.4 million for the year ended December 31, 2009.
On April 1, 2009, we adopted the amended guidance for the recognition of other-than-temporary impairment (“OTTI”) for debt securities as well as the presentation of OTTI on the consolidated financial statements. As a result of the adoption, we recognized a $20.2 million after-tax decrease to beginning accumulated deficit and a corresponding offset in accumulated other comprehensive loss on our consolidated
30
Table of Contents
balance sheet. This adjustment represents the after-tax difference between the impairment reported in prior periods for securities on our balance sheet as of April 1, 2009 and the level of impairment that would have been recorded on these same securities under the new accounting guidance. Additionally, in accordance with the new guidance, we changed the presentation of the consolidated statement of loss to state “Net impairment” as a separate line item, as well as the credit and noncredit components of net impairment. Prior to this new presentation, OTTI was included in the “Gains (losses) on loans and securities, net” line item on the consolidated statement of loss.
We added a new operating expense line item to the consolidated statement of loss for FDIC insurance premiums. During the year ended December 31, 2009, these expenses increased to a level at which we believed a separate line item on the consolidated statement of loss was appropriate. This increase was due primarily to an increase in the ongoing FDIC insurance rates as well as an industry wide special assessment in the second quarter of 2009. FDIC insurance premium expenses were previously presented in the “Other operating expenses” line item.
The following sections describe in detail the changes in key operating factors and other changes and events that have affected our net revenue, provision for loan losses, operating expense, other income (expense) and income tax benefit.
Revenue
The components of net revenue and the resulting variances are as follows (dollars in millions):
| Variance | |||||||||||||||
| Year Ended December 31, | 2009 vs. 2008 | ||||||||||||||
| 2009 | 2008 | Amount | % | ||||||||||||
| Revenue: |
|||||||||||||||
| Net operating interest income |
$ | 1,260.6 | $ | 1,268.0 | $ | (7.4 | ) | (1 | )% | ||||||
| Commissions |
548.0 | 515.5 | 32.5 | 6 | % | ||||||||||
| Fees and service charges |
192.5 | 200.0 | (7.5 | ) | (4 | )% | |||||||||
| Principal transactions |
88.1 | 84.9 | 3.2 | 4 | % | ||||||||||
| Gains (losses) on loans and securities, net |
169.1 | (100.5 | ) | 269.6 | * | ||||||||||
| Net impairment |
(89.1 | ) | (95.0 | ) | * | * | |||||||||
| Other revenues |
47.8 | 52.7 | (4.9 | ) | (9 | )% | |||||||||
| Total non-interest income |
956.4 | 657.6 | 298.8 | 45 | % | ||||||||||
| Total net revenue |
$ | 2,217.0 | $ | 1,925.6 | $ | 291.4 | 15 | % | |||||||
| * | Percentage not meaningful |
Total net revenue increased 15% to $2.2 billion for the year ended December 31, 2009 compared to 2008. This was driven by our gains (losses) on loans and securities, net, which increased from net losses of $100.5 million to net gains of $169.1 million for the year ended December 31, 2009 compared to 2008. Commissions revenue also increased $32.5 million to $548.0 million for the year ended December 31, 2009 compared to 2008.
On February 5, 2010, we announced several changes to the pricing structure in our brokerage business. We eliminated the $12.99 commission tier, account activity fees and a per share commission applied to market trades larger than 2,000 shares. We believe these changes will improve the simplicity and value of our overall pricing structure. The total impact of these pricing changes in 2010 is estimated to decrease our revenue by approximately $50 million.
Net Operating Interest Income
Net operating interest income decreased 1% to $1.3 billion for the year ended December 31, 2009 compared to 2008. Net operating interest income is earned primarily through holding credit balances, which include margin, real estate and consumer loans, and by holding customer cash and deposits, which are a low cost source of funding. The slight decrease in net operating interest income was due primarily to a decrease in our average interest earning assets of $2.3 billion during the year ended December 31, 2009, which was largely offset by an increase in our net operating interest spread during the same period.
31
Table of Contents
The following table presents enterprise average balance sheet data and enterprise income and expense data for our operations, as well as the related net interest spread, yields and rates and has been prepared on the basis required by the SEC’s Industry Guide 3, “Statistical Disclosure by Bank Holding Companies” (dollars in millions):
| Year Ended December 31, | |||||||||||||||||||||||||||
| 2009 | 2008 | 2007 | |||||||||||||||||||||||||
| Average Balance |
Operating Interest Inc./Exp. |
Average Yield / Cost |
Average Balance |
Operating Interest Inc./Exp. |
Average Yield / Cost |
Average Balance |
Operating Interest Inc./Exp. |
Average Yield / Cost |
|||||||||||||||||||
| Enterprise interest-earning assets: |
|||||||||||||||||||||||||||
| Loans(1) |
$ | 23,113.6 | $ | 1,138.1 | 4.92 | % | $ | 27,761.9 | $ | 1,587.8 | 5.72 | % | $ | 30,887.1 | $ | 1,986.0 | 6.43 | % | |||||||||
| Margin receivables |
3,103.5 | 138.5 | 4.46 | % | 5,833.6 | 278.2 | 4.77 | % | 7,033.6 | 502.1 | 7.14 | % | |||||||||||||||
| Available-for-sale mortgage-backed securities |
10,365.7 | 436.9 | 4.22 | % | 9,455.4 | 435.9 | 4.61 | % | 12,425.4 | 650.9 | 5.24 | % | |||||||||||||||
| Available-for-sale investment securities |
1,227.6 | 36.2 | 2.95 | % | 141.2 | 9.4 | 6.63 | % | 3,946.3 | 259.9 | 6.59 | % | |||||||||||||||
| Trading securities |
21.4 | 2.6 | 12.02 | % | 350.5 | 23.6 | 6.74 | % | 110.8 | 11.5 | 10.38 | % | |||||||||||||||
| Cash and cash equivalents(2) |
6,001.4 | 19.0 | 0.32 | % | 2,546.3 | 60.6 | 2.38 | % | 718.3 | 34.4 | 4.79 | % | |||||||||||||||
| Stock borrow and other |
669.0 | 47.8 | 7.14 | % | 762.5 | 53.7 | 7.04 | % | 960.1 | 69.3 | 7.21 | % | |||||||||||||||
| Total enterprise interest-earning assets |
44,502.2 | 1,819.1 | 4.09 | % | 46,851.4 | 2,449.2 | 5.22 | % | 56,081.6 | 3,514.1 | 6.27 | % | |||||||||||||||
| Non-operating interest-earning assets(3) |
3,873.3 | 5,002.3 | 5,417.4 | ||||||||||||||||||||||||
| Total assets |
$ | 48,375.5 | $ | 51,853.7 | $ | 61,499.0 | |||||||||||||||||||||
| Enterprise interest-bearing liabilities: |
|||||||||||||||||||||||||||
| Retail deposits: |
|||||||||||||||||||||||||||
| Sweep deposit accounts |
$ | 11,022.3 | 7.6 | 0.07 | % | $ | 9,904.7 | 40.0 | 0.40 | % | $ | 11,044.2 | 102.1 | 0.92 | % | ||||||||||||
| Complete savings accounts |
11,539.9 | 140.1 | 1.21 | % | 9,790.2 | 331.0 | 3.37 | % | 6,426.5 | 313.3 | 4.87 | % | |||||||||||||||
| Certificates of deposit |
1,750.4 | 45.2 | 2.58 | % | 3,258.9 | 137.4 | 4.22 | % | 4,509.7 | 224.7 | 4.98 | % | |||||||||||||||
| Other money market and savings accounts |
1,243.7 | 5.9 | 0.47 | % | 1,844.9 | 38.9 | 2.10 | % | 4,138.6 | 150.8 | 3.64 | % | |||||||||||||||
| Checking accounts |
797.5 | 3.0 | 0.37 | % | 908.0 | 19.7 | 2.17 | % | 390.1 | 5.7 | 1.46 | % | |||||||||||||||
| Brokered certificates of deposit |
193.8 | 10.0 | 5.17 | % | 976.1 | 48.9 | 5.01 | % | 512.5 | 25.4 | 4.96 | % | |||||||||||||||
| Customer payables |
4,662.9 | 8.8 | 0.19 | % | 4,288.8 | 29.7 | 0.69 | % | 5,707.2 | 67.5 | 1.18 | % | |||||||||||||||
| Repurchase agreements and other borrowings |
7,216.8 | 216.3 | 3.00 | % | 7,736.9 | 318.3 | 4.11 | % | 12,261.1 | 643.4 | 5.25 | % | |||||||||||||||
| Federal Home Loan Bank (“FHLB”) advances |
2,900.6 | 132.6 | 4.57 | % | 4,667.4 | 218.9 | 4.69 | % | 7,071.8 | 364.4 | 5.15 | % | |||||||||||||||
| Stock loan and other |
513.0 | 2.4 | 0.46 | % | 1,075.5 | 18.6 | 1.73 | % | 1,298.3 | 39.7 | 3.06 | % | |||||||||||||||
| Total enterprise interest-bearing liabilities |
41,840.9 | 571.9 | 1.37 | % | 44,451.4 | 1,201.4 | 2.70 | % | 53,360.0 | 1,937.0 | 3.63 | % | |||||||||||||||
| Non-operating interest-bearing liabilities(4) |
3,558.5 | 4,706.3 | 4,002.6 | ||||||||||||||||||||||||
| Total liabilities |
45,399.4 | 49,157.7 | 57,362.6 | ||||||||||||||||||||||||
| Total shareholders’ equity |
2,976.1 | 2,696.0 | 4,136.4 | ||||||||||||||||||||||||
| Total liabilities and shareholders’ equity |
$ | 48,375.5 | $ | 51,853.7 | $ | 61,499.0 | |||||||||||||||||||||
| Excess of enterprise interest-earning assets over enterprise interest-bearing liabilities/Enterprise net interest income/Spread |
$ | 2,661.3 | $ | 1,247.2 | 2.72 | % | $ | 2,400.0 | $ | 1,247.8 | 2.52 | % | $ | 2,721.6 | $ | 1,577.1 | 2.64 | % | |||||||||
Reconciliation from enterprise net interest income to net operating interest income (dollars in millions):
| Year Ended December 31, | ||||||||||||
| 2009 | 2008 | 2007 | ||||||||||
| Enterprise net interest income(5) |
$ | 1,247.2 | $ | 1,247.8 | $ | 1,577.1 | ||||||
| Taxable equivalent interest adjustment |
(2.1 | ) | (9.1 | ) | (30.9 | ) | ||||||
| Customer cash held by third parties and other(6) |
15.5 | 29.3 | 37.4 | |||||||||
| Net operating interest income |
$ | 1,260.6 | $ | 1,268.0 | $ | 1,583.6 | ||||||
| (1) | Nonaccrual loans are included in the respective average loan balances. Income on such nonaccrual loans is recognized on a cash basis. |
| (2) | Includes segregated cash balances. |
| (3) | Non-operating interest-earning assets consist of property and equipment, net, goodwill, other intangibles, net and other assets that do not generate operating interest income. Some of these assets generate corporate interest income. |
| (4) | Non-operating interest-bearing liabilities consist of corporate debt, accounts payable, accrued and other liabilities that do not generate operating interest expense. Some of these liabilities generate corporate interest expense. |
| (5) | Enterprise net interest income is taxable equivalent basis net operating interest income excluding corporate interest income and corporate interest expense, stock conduit interest income and expense and interest earned on customer cash held by third parties. Management believes this non-GAAP measure is useful to analysts and investors as it is a measure of the net operating interest income generated by our operations. |
| (6) | Includes interest earned on average customer assets of $2.9 billion, $3.2 billion and $3.9 billion for the years ended December 31, 2009, 2008 and 2007, respectively, held by parties outside E*TRADE Financial, including third party money market funds and sweep deposit accounts at unaffiliated financial institutions. Other consists of net operating interest earned on average stock conduit assets of $1.3 million for the year ended December 31, 2007. There were not any stock conduit assets at December 31, 2009 or 2008. |
32
Table of Contents
| Year Ended December 31, | |||||||||
| 2009 | 2008 | 2007 | |||||||
| Enterprise net interest: |
|||||||||
| Spread |
2.72 | % | 2.52 | % | 2.64 | % | |||
| Margin (net yield on interest-earning assets) |
2.80 | % | 2.66 | % | 2.81 | % | |||
| Ratio of enterprise interest-earning assets to enterprise interest- bearing liabilities |
106.36 | % | 105.40 | % | 105.10 | % | |||
| Return on average: |
|||||||||
| Total assets |
(2.68 | )% | (0.99 | )% | (2.34 | )% | |||
| Total shareholders’ equity |
(43.61 | )% | (18.98 | )% | (34.86 | )% | |||
| Average equity to average total assets |
6.15 | % | 5.20 | % | 6.73 | % | |||
Average enterprise interest-earning assets decreased 5% to $44.5 billion for the year ended December 31, 2009 compared to 2008. This decrease was primarily a result of the decrease in our average loans portfolio and our average margin receivables, partially offset by an increase in average cash and equivalents. Average loans decreased 17% to $23.1 billion for the year ended December 31, 2009 compared to 2008. For the foreseeable future, we plan to allow our loan portfolio to pay down. Average margin receivables decreased 47% to $3.1 billion for the year ended December 31, 2009 compared to 2008. We believe this decrease was due to customers deleveraging and reducing their risk exposure given the substantial volatility in the financial markets. These decreases were offset by increases in average cash and cash equivalents and available-for-sale investment securities. Average cash and cash equivalents increased 136% to $6.0 billion for the year ended December 31, 2009 compared to 2008. The increase in average available-for-sale investment securities was related to purchases of AAA-rated agency debentures during 2009.
Average enterprise interest-bearing liabilities decreased 6% to $41.8 billion for the year ended December 31, 2009 compared to 2008. The decrease in average enterprise interest-bearing liabilities was primarily due to a decrease in average FHLB advances, average brokered certificates of deposit and average stock loan and other. Average FHLB advances decreased 38% to $2.9 billion for the year ended December 31, 2009 compared to 2008. Brokered certificates of deposit decreased 80% to $0.2 billion for the year ended December 31, 2009 compared to 2008. Average stock loan and other decreased 52% to $0.5 billion for the year ended December 31, 2009 compared to 2008. While our average retail deposits increased by $0.6 billion for the year ended December 31, 2009 when compared to 2008, our deposits at December 31, 2009 decreased $0.5 billion when compared to December 31, 2008, and we expect the non-sweep deposit balances to continue to decrease into 2010.
Enterprise net interest spread increased by 20 basis points to 2.72% for the year ended December 31, 2009 compared to 2008. This increase was largely driven by a decrease in the yields paid on our deposits and lower wholesale borrowing costs, partially offset by a decrease in higher yielding enterprise interest-earning assets.
Commissions
Commissions revenue increased 6% to $548.0 million for the year ended December 31, 2009 compared to 2008. The main factors that affect our commissions revenue are DARTs, average commission per trade and the number of trading days during the period. Average commission per trade is impacted by both trade types and the mix between our domestic and international businesses. Each business has a different pricing structure, unique to its customer base and local market practices and, as a result, a change in the relative number of executed trades in these businesses impacts average commission per trade. Each business also has different trade types (e.g., equities, options, fixed income, exchange-traded funds, contract for difference and mutual funds) that can have different commission rates. Accordingly, changes in the mix of trade types within either of these businesses may impact average commission per trade.
DARTs increased 4% to 196,521 for the year ended December 31, 2009 compared to 2008. Our U.S. DART volume increased 6% for the year ended December 31, 2009 compared to 2008, driven entirely by organic
33
Table of Contents
growth. Option-related DARTs as a percentage of our total U.S. DARTs represented 13% and 15% of U.S. trading volume for the years ended December 31, 2009 and 2008, respectively. Exchange-traded funds-related DARTs as a percentage of our total U.S. DARTs represented 14% and 11% of U.S. trading volume for the years ended December 31, 2009 and 2008, respectively.
Average commission per trade increased 2% to $11.11 for the year ended December 31, 2009 compared to 2008. The increase in the average commission per trade for the year ended December 31, 2009 was primarily due to an improvement in product and customer mix compared to 2008, partially offset by the impact of foreign currency exchange as a result of the strengthening U.S. dollar.
Fees and Service Charges
Fees and service charges decreased 4% to $192.5 million for the year ended December 31, 2009 compared to 2008. The decline was driven by a decrease in account service fee and advisory management fee revenue, which was partially offset by an increase in order flow revenue compared to 2008. The decrease in advisory management fees was primarily due to our sale of RAA in the second quarter of 2008. Declines in foreign currency margin revenue, fixed income product revenue and mutual fund fees also contributed to the decrease in fees and service charges. We expect our order flow revenue, which is reported within fees and service charges, to decrease slightly in 2010 due to an overall decline in market rates paid for order flow.
Principal Transactions
Principal transactions increased 4% to $88.1 million for the year ended December 31, 2009 compared to 2008. Our principal transactions revenue is influenced by overall trading volumes, the number of stocks for which we act as a market-maker, the trading volumes of those specific stocks and the performance of our proprietary trading activities. The increase in principal transactions revenue was driven by an increase in the volume of equity shares that were traded, which was partially offset by a decrease in our average revenue earned per share traded for the year ended December 31, 2009.
Gains (Losses) on Loans and Securities, Net
Gains (losses) on loans and securities, net were gains of $169.1 million and losses of $100.5 million for the years ended December 31, 2009 and 2008, respectively, as shown in the following table (dollars in millions):
| Year Ended December 31, |
Variance | ||||||||||||||
| 2009 vs. 2008 | |||||||||||||||
| 2009 | 2008 | Amount | % | ||||||||||||
| Losses on sales of loans, net |
$ | (12.5 | ) | $ | (0.8 | ) | $ | (11.7 | ) | 1496 | % | ||||
| Gains on securities and other investments |
173.2 | 32.4 | 140.8 | 435 | % | ||||||||||
| Gains (losses) on trading securities, net |
7.8 | (134.3 | ) | 142.1 | * | ||||||||||
| Hedge ineffectiveness |
0.6 | 2.2 | (1.6 | ) | (74 | )% | |||||||||
| Gains (losses) on securities, net |
181.6 | (99.7 | ) | 281.3 | * | ||||||||||
| Gains (losses) on loans and securities, net |
$ | 169.1 | $ | (100.5) | $ | 269.6 | * | ||||||||
| * | Percentage not meaningful. |
The gains on loans and securities, net for the year ended December 31, 2009, were due primarily to gains on the sale of certain agency mortgage-backed securities, which were partially offset by net losses on the sales of loans. The losses on the sales of loans were due to the sale of a $0.4 billion pool of home equity loans during the third quarter of 2009. We purchased this particular pool of loans from the originator of the loans in a prior period. This same originator, who continued to service the loans subsequent to our purchase, made an unsolicited offer to
34
Table of Contents
repurchase the loans back from us at a price of 98% of the balance of the loan portfolio and we accepted this offer. We believe transactions of this nature are rare and are unlikely to occur again in future periods. The losses on loans and securities, net during the year ended December 31, 2008 were due primarily to losses on our preferred stock in Federal National Mortgage Association (“Fannie Mae”) and Federal Home Loan Mortgage Corporation (“Freddie Mac”).
Net Impairment
In accordance with the OTTI accounting guidance that became effective in the second quarter of 2009, we changed the presentation of the consolidated statement of loss to state “Net impairment” as a separate line item, as well as the credit and noncredit components of net impairment. Prior to this new presentation, OTTI was included in the “Gains (losses) on loans and securities, net” line item on the consolidated statement of loss.
We recognized $89.1 million of net impairment during the year ended December 31, 2009, on certain securities in our non-agency collateralized mortgage obligation (“CMO”) portfolio due to continued deterioration in the expected credit performance of the underlying loans in the securities. The net impairment included gross OTTI of $232.1 million for the year ended December 31, 2009. Of the $232.1 million of gross OTTI for the year ended December 31, 2009, $143.0 million related to the noncredit portion of OTTI, which was recorded through other comprehensive income (loss).
We had net impairment of $95.0 million for the year ended December 31, 2008, which represented the total decline in the fair value of impaired securities in accordance with the OTTI accounting guidance that was in effect prior to April 1, 2009.
Other Revenues
Other revenues decreased 9% to $47.8 million for the year ended December 31, 2009 compared to 2008. The decrease in other revenue was driven by lower employee stock option management fees from our Corporate Services business.
Provision for Loan Losses
Provision for loan losses decreased $85.6 million to $1.5 billion for the year ended December 31, 2009 compared to 2008. The provision for loan losses for the year ended December 31, 2009 was due primarily to the high levels of delinquent loans in our one- to four-family and home equity loan portfolios. We believe the delinquencies in both of these portfolios were caused by several factors, including: home price depreciation in key markets; growing inventories of unsold homes; rising foreclosure rates; significant contraction in the availability of credit; and a general decline in economic growth. In addition, the combined impact of home price depreciation and the reduction of available credit made it increasingly difficult for borrowers to refinance existing loans. Although we expect these factors will cause the provision for loan losses to continue at elevated levels in future periods, the level of provision for loan losses has declined for five consecutive quarters. While we cannot state with certainty that this trend will continue, we believe it is a positive indicator that our loan portfolio has continued to stabilize.
35
Table of Contents
Operating Expense
The components of operating expense and the resulting variances are as follows (dollars in millions):
| Year Ended December 31, | Variance | ||||||||||||
| 2009 vs. 2008 | |||||||||||||
| 2009 | 2008 | Amount | % | ||||||||||
| Operating expense: |
|||||||||||||
| Compensation and benefits |
$ | 366.2 | $ | 383.4 | $ | (17.2 | ) | (4 | )% | ||||
| Clearing and servicing |
170.7 | 185.1 | (14.4 | ) | (8 | )% | |||||||
| Advertising and market development |
114.4 | 175.2 | (60.8 | ) | (35 | )% | |||||||
| FDIC insurance premiums |
94.3 | 31.2 | 63.1 | 202 | % | ||||||||
| Communications |
84.4 | 96.8 | (12.4 | ) | (13 | )% | |||||||
| Professional services |
78.7 | 94.1 | (15.4 | ) | (16 | )% | |||||||
| Occupancy and equipment |
78.4 | 85.8 | (7.4 | ) | (9 | )% | |||||||
| Depreciation and amortization |
83.3 | 82.5 | 0.8 | 1 | % | ||||||||
| Amortization of other intangibles |
29.7 | 35.7 | (6.0 | ) | (17 | )% | |||||||
| Facility restructuring and other exit activities |
20.7 | 29.5 | (8.8 | ) | (30 | )% | |||||||
| Other operating expenses |
122.5 | 90.9 | 31.6 | 35 | % | ||||||||
| Total operating expense |
$ | 1,243.3 | $ | 1,290.2 | $ | (46.9 | ) | (4 | )% | ||||
Operating expense decreased 4% to $1.2 billion for the year ended December 31, 2009 compared to 2008. The decrease during the year ended December 31, 2009 compared to 2008 was driven by decreases in the majority of the operating expense categories, offset by increases in FDIC insurance premiums and other operating expenses.
Compensation and Benefits
Compensation and benefits decreased 4% to $366.2 million for the year ended December 31, 2009 compared to 2008. The decrease for the year ended December 31, 2009 resulted primarily from lower salary expense due to a reduction in our employee base of 5% compared to the year ended December 31, 2008.
Advertising and Market Development
Advertising and market development expense decreased 35% to $114.4 million for the year ended December 31, 2009 compared to 2008. This decrease was due to high levels of advertising in the first half of 2008 that was aimed at restoring customer confidence as well as an overall decline in advertising rates in the year ended December 31, 2009.
FDIC Insurance Premiums
FDIC insurance premiums increased 202% to $94.3 million for the year ended December 31, 2009 compared to 2008. The increase was primarily due to an increase in the ongoing FDIC insurance rates as well as an industry wide special assessment in the second quarter of 2009. Our portion of this special assessment was $21.6 million.
Facility Restructuring and Other Exit Activities
Facility restructuring and other exit activities were $20.7 million for the year ended December 31, 2009. These costs were due primarily to the restructuring of our international brokerage business. We expect to incur additional costs in connection with our international brokerage business in 2010 as we complete this restructuring plan.
36
Table of Contents
Other Operating Expenses
Other operating expenses increased 35% to $122.5 million for the year ended December 31, 2009 compared to 2008. The increase for the year ended December 31, 2009, was primarily due to a $23.7 million gain on the sale of our corporate aircraft related assets during the year ended December 31, 2008, which reduced other operating expenses during that period and to higher real-estate owned expenses during the year ended December 31, 2009. We expect our real-estate owned expenses to continue to increase in future periods.
Other Income (Expense)
Other income (expense) was an expense of $1.3 billion for the year ended December 31, 2009 compared to an expense of $330.6 million for the year ended December 31, 2008, as shown in the following table (dollars in millions):
| Year Ended December 31, |
Variance | ||||||||||||||
| 2009 vs. 2008 | |||||||||||||||
| 2009 | 2008 | Amount | % | ||||||||||||
| Other income (expense): |
|||||||||||||||
| Corporate interest income |
$ | 0.9 | $ | 7.2 | $ | (6.3 | ) | (88 | )% | ||||||
| Corporate interest expense |
(282.7 | ) | (362.2 | ) | 79.5 | (22 | )% | ||||||||
| Losses on sales of investments, net |
(1.7 | ) | (4.2 | ) | 2.5 | (59 | )% | ||||||||
| Gains (losses) on early extinguishment of debt |
(1,018.9 | ) | 10.1 | (1,029.0 | ) | * | |||||||||
| Equity in income (loss) of investments and venture funds |
(8.6 | ) | 18.5 | (27.1 | ) | * | |||||||||
| Total other income (expense) |
$ | (1,311.0 | ) | $ | (330.6 | ) | $ | (980.4 | ) | 297 | % | ||||
| * | Percentage not meaningful. |
Total other expense of $1.3 billion for the year ended December 31, 2009 was largely due to the $968.3 million pre-tax non-cash loss on the early extinguishment of debt related to our Debt Exchange. The loss on the Debt Exchange resulted from the de-recognition of the debt that was exchanged and the corresponding recognition of the newly-issued non-interest-bearing convertible debentures at fair value. The loss consisted of two main components: 1) the difference between the fair value of the newly-issued convertible debentures and the face amount of the exchanged debt, which resulted in a $725.0 million premium on the new debt; and 2) the realization of the $243.3 million discount on the debt that was exchanged. The fair value of the newly-issued convertible debentures(1) was greater than the face amount of the debt that was exchanged primarily due to the significant increase in our stock price from June 22, 2009, the date on which the conversion price was established, to August 25, 2009, the date on which the Debt Exchange was consummated. The time delay was due to the required shareholder approval prior to the consummation of the Debt Exchange, which occurred at a special meeting on August 19, 2009. This component of the loss did not significantly impact our shareholders’ equity as it was substantially offset by a simultaneous increase in additional paid-in capital(2). The remaining $243.3 million component of the loss represented an acceleration of the interest expense that otherwise would have been recorded in future periods. Prior to the consummation of the Debt Exchange, this discount was being accreted into interest expense over the life of the exchanged debt under the effective interest method.
Total other income (expense) also includes corporate interest expense resulting from our interest-bearing corporate debt. Corporate interest expense decreased 22% to $282.7 million for the year ended December 31, 2009, primarily due to the reduction in interest-bearing debt in connection with our Debt Exchange. Based on our remaining balance of interest-bearing debt subsequent to the Debt Exchange, we estimate that our annual
| (1) | For further details on the calculation of the fair value of the non-interest-bearing convertible debentures, see Note 5—Fair Value Disclosures of Item 8. Financial Statements and Supplementary Data. |
| (2) | For further details on the accounting for the Debt Exchange see, Note 1—Organization, Basis of Presentation and Summary of Significant Accounting Policies of Item 8. Financial Statements and Supplementary Data. |
37
Table of Contents
corporate interest payments in future periods will be approximately $160 million on an annual basis, which is approximately $200 million lower than our estimated annual corporate interest payments prior to the Debt Exchange.
Income Tax Benefit
Income tax benefit from continuing operations was $537.7 million and $469.5 million for the years ended December 31, 2009 and 2008, respectively. Our effective tax rates were (29.3)% and (36.7)% for the years ended December 31, 2009 and 2008, respectively.
Debt Exchange
The effective tax rate on the Debt Exchange of 20% was below our statutory federal tax rate of 35%. This was primarily due to certain components of the loss on the Debt Exchange not being deductible for tax purposes, which are summarized in the following table (dollars in millions):
| Year Ended December 31, 2009 | ||||||||||
| Amount of Loss | Tax Rate | Tax Benefit | ||||||||
| Deductible portion of the loss on the Debt Exchange |
$ | 723.0 | 35 | % | $ | 253.0 | ||||
| Non-deductible portion of the loss on the Debt Exchange |
245.3 | — | % | — | ||||||
| Prior period interest expense on the 12 1/2% Notes not deductible as a result of the Debt Exchange |
N/A | N/A | (57.7 | ) | ||||||
| Total |
$ | 968.3 | 20 | % | $ | 195.3 | ||||
Tax Ownership Change
During the third quarter of 2009, we exchanged $1.7 billion principal amount of our interest-bearing debt for an equal principal amount of non-interest-bearing convertible debentures. Subsequent to the Debt Exchange, $592.3 million and $720.9 million debentures were converted into 572.2 million and 696.6 million shares of common stock during the third and fourth quarters of 2009, respectively. As a result of these conversions, we believe we experienced a tax ownership change during the third quarter of 2009.
As of the date of the ownership change, we estimate that we had federal net operating losses (“NOLs”) available to carry forward of approximately $1.4 billion. Section 382 of the Internal Revenue Code of 1986, as amended, imposes restrictions on the use of a corporation’s NOLs, certain recognized built-in losses and other carryovers after an “ownership change” occurs. Section 382 rules governing when a change in ownership occurs are complex and subject to interpretation; however, an ownership change generally occurs when there has been a cumulative change in the stock ownership of a corporation by certain “5% shareholders” of more than 50 percentage points over a rolling three-year period.
Section 382 imposes an annual limitation on the amount of post-ownership change taxable income a corporation may offset with pre-ownership change NOLs. In general, the annual limitation is determined by multiplying the value of the corporation’s stock immediately before the ownership change (subject to certain adjustments) by the applicable long-term tax-exempt rate. Any unused portion of the annual limitation is available for use in future years until such NOLs are scheduled to expire (in general, our NOLs may be carried forward 20 years). In addition, the limitation may, under certain circumstances, be increased or decreased by built-in gains or losses, respectively, which may be present with respect to assets held at the time of the ownership change that are recognized in the five-year period (one-year for loans) after the ownership change. The use of NOLs arising after the date of an ownership change would not be affected unless a corporation experienced an additional ownership change in a future period.
38
Table of Contents
We believe the tax ownership change will extend the period of time it will take to fully utilize our pre-ownership change NOLs, but will not limit the total amount of pre-ownership change NOLs we can utilize. Our preliminary estimate is that we will be subject to an overall annual limitation on the use of our pre-ownership change NOLs of approximately $155 million; however, this amount is subject to change in future periods as we finalize the tax change of control analysis in 2010. Since the statutory carry forward period for our overall pre-ownership change NOLs, which are approximately $1.4 billion, is 20 years (the majority of which expire in 19 years), we believe we will be able to fully utilize these NOLs in future periods.
Our ability to utilize the pre-ownership change NOLs is dependent on our ability to generate sufficient taxable income over the duration of the carry forward periods and will not be impacted by our ability or inability to generate taxable income in an individual year.
Valuation Allowance
During the year ended December 31, 2009, we did not provide for a valuation allowance against our federal deferred tax assets. We are required to establish a valuation allowance for deferred tax assets and record a charge to income if we determine, based on available evidence at the time the determination is made, that it is more likely than not that some portion or all of the deferred tax assets will not be realized. If we did conclude that a valuation allowance was required, the resulting loss would have a material adverse effect on our results of operations and financial condition.
We did not establish a valuation allowance against our federal deferred tax assets as of December 31, 2009 as we believe that it is more likely than not that all of these assets will be realized. Our evaluation focused on identifying significant, objective evidence that we will be able to realize our deferred tax assets in the future. We reviewed the estimated future taxable income for our trading and investing and balance sheet management segments separately and determined that our net operating losses since 2007 are due solely to the credit losses in our balance sheet management segment. We believe these losses were caused by the crisis in the residential real estate and credit markets which significantly impacted our asset-backed securities and home equity loan portfolios in 2007 and continued to generate credit losses in 2008 and 2009. We estimate that these credit losses will continue in future periods; however, we ceased purchasing asset-backed securities and home equity loans which we believe are the root cause of the majority of these losses. Therefore, while we do expect credit losses to continue in future periods, we do expect these amounts to decline when compared to our credit losses in the three-year period ending in 2009. Our trading and investing segment generated substantial book taxable income for each of the last six years and we estimate that it will continue to generate taxable income in future periods at a level sufficient to generate taxable income for the Company as a whole. We consider this to be significant, objective evidence that we will be able to realize our deferred tax assets in the future.
A key component of our evaluation of the need for a valuation allowance was our level of corporate interest expense, which represents our most significant non-segment related expense. Our estimates of future taxable income included this expense, which reduces the amount of segment income available to utilize our federal deferred tax assets. Therefore, a decrease in this expense in future periods would increase the level of estimated taxable income available to utilize our federal deferred tax assets. As a result of the Debt Exchange, we reduced our annual cash interest payments by approximately $200 million. We believe this decline in cash interest payments significantly improves our ability to utilize our federal deferred tax assets in future periods when compared to evaluations in prior periods which did not include this decline in corporate interest payments.
Our analysis of the need for a valuation allowance recognizes that we are in a cumulative book taxable loss position as of the three-year period ended December 31, 2009, which is considered significant and objective evidence that we may not be able to realize some portion of our deferred tax assets in the future. However, we believe we are able to rely on our forecasts of future taxable income and overcome the uncertainty created by the cumulative loss position.
39
Table of Contents
The crisis in the residential real estate and credit markets has created significant volatility in our results of operations. This volatility is isolated almost entirely to our balance sheet management segment. Our forecasts for this segment include assumptions regarding our estimate of future expected credit losses, which we believe to be the most variable component of our forecasts of future taxable income. We believe this variability could create a book loss in our overall results for an individual reporting period while not significantly impacting our overall estimate of taxable income over the period in which we expect to realize our deferred tax assets. Conversely, we believe our trading and investing segment will continue to produce a stable stream of income which we believe we can reliably estimate in both individual reporting periods as well as over the period in which we estimate we will realize our deferred tax assets.
In evaluating the need for a valuation allowance, we estimated future taxable income based on management approved forecasts. This process required significant judgment by management about matters that are by nature uncertain. If future events differ significantly from our current forecasts, a valuation allowance may need to be established, which would have a material adverse effect on our results of operations and our financial condition.
2008 Compared to 2007
We had a net loss from continuing operations of $809.4 million for the year ended December 31, 2008. The loss for the year ended December 31, 2008 was due principally to an increase in our provision for loan losses of $943.6 million to $1.6 billion. In addition, we incurred losses of $153.8 million, net of hedges, on our preferred stock in Fannie Mae and Freddie Mac during the period ended December 31, 2008. The losses in our balance sheet management segment, which included both of these items, more than offset our trading and investing segment income, which was $623.2 million for the year ended December 31, 2008.
Revenue
The components of net revenue and the resulting variances are as follows (dollars in millions):
| Year Ended December 31, |
Variance | ||||||||||||||
| 2008 vs. 2007 | |||||||||||||||
| 2008 | 2007 | Amount | % | ||||||||||||
| Revenue: |
|||||||||||||||
| Net operating interest income |
$ | 1,268.0 | $ | 1,583.6 | $ | (315.6 | ) | (20 | )% | ||||||
| Commissions |
515.5 | 663.6 | (148.1 | ) | (22 | )% | |||||||||
| Fees and service charges |
200.0 | 230.5 | (30.5 | ) | (13 | )% | |||||||||
| Principal transactions |
84.9 | 102.2 | (17.3 | ) | (17 | )% | |||||||||
| Losses on loans and securities, net |
(100.5 | ) | (2,296.7 | ) | 2,196.2 | * | |||||||||
| Net impairment |
(95.0 | ) | (168.7 | ) | 73.7 | (44 | )% | ||||||||
| Other revenues |
52.7 | 47.2 | 5.5 | 12 | % | ||||||||||
| Total non-interest income |
657.6 | (1,421.9 | ) | 2,079.5 | * | ||||||||||
| Total net revenue |
$ | 1,925.6 | $ | 161.7 | $ | 1,763.9 | * | ||||||||
| * | Percentage not meaningful. |
Total net revenue increased to $1.9 billion for the year ended December 31, 2008 compared to 2007. This increase was primarily due to the $2.2 billion loss on the sale of our asset-backed securities portfolio for the year ended December 31, 2007.
40
Table of Contents
Net Operating Interest Income
Net operating interest income decreased 20% to $1.3 billion for the year ended December 31, 2008 compared to December 31, 2007. Net operating interest income is earned primarily through holding credit balances, which include margin, real estate and consumer loans, and by holding customer cash and deposits, which are a low cost source of funding. The decrease in net operating interest income was due primarily to the planned decline in enterprise interest-earning assets during 2008.
Average enterprise interest-earning assets decreased 16% to $46.9 billion for the year ended December 31, 2008 compared to 2007, primarily the result of a decrease in our average available-for-sale portfolio, average margin receivables and average loans, offset by an increase in average cash and equivalents. Average available-for-sale mortgage-backed and investment securities decreased 41% to $9.6 billion for the year ended December 31, 2008 compared to 2007. This decrease was primarily due to the sale of certain mortgage-backed securities in the first quarter of 2008 and the sale of our asset-backed securities portfolio towards the end of the fourth quarter of 2007. Average margin receivables decreased 17% to $5.8 billion for the year ended December 31, 2008 compared to 2007. We believe this decrease was due to customers deleveraging and reducing their risk exposure given the substantial volatility in the financial markets. Average loans decreased 10% to $27.8 billion for the year ended December 31, 2008 compared to 2007 as a result of our focus on growing the one- to four-family loan portfolio in the first and second quarters of 2007. Beginning in the second half of 2007, we altered our strategy and halted the focus on growing the balance sheet.
Average enterprise interest-bearing liabilities decreased 17% to $44.5 billion for the year ended December 31, 2008 compared to 2007. The decrease in average enterprise interest-bearing liabilities was primarily due to a decrease in average repurchase agreements and average other borrowings, average FHLB advances and average customer payables. Average repurchase agreements and other borrowings decreased 37% to $7.7 billion for the year ended December 31, 2008 compared to 2007. Average FHLB advances decreased 34% to $4.7 billion for the year ended December 31, 2008 compared to 2007. The decreases in these balances were the result of paying down these liabilities as we decreased the size of our balance sheet during 2008. Average customer payables decreased 25% to $4.3 billion for the year ended December 31, 2008 compared to 2007, which was related primarily to the sale of our Canadian brokerage business during the third quarter of 2008.
Enterprise net interest spread decreased by 12 basis points to 2.52% for the year ended December 31, 2008 compared to 2007. This decrease was driven in part by an atypical spread among two key benchmark interest rates: federal funds and the London Interbank Offered Rate (“LIBOR”). The majority of our interest-earning assets and liabilities are linked, either directly or indirectly, to these benchmark interest rates.
Commissions
Commissions revenue decreased 22% to $515.5 million for the year ended December 31, 2008 compared to 2007. This decrease was due almost entirely to a decrease of $142.6 million, or 99%, in our balance sheet management commissions revenue as a result of the exit of our institutional brokerage operations.
DARTs increased 6% to 188,116 for the year ended December 31, 2008 compared to 2007. Our U.S. DART volume increased 5% for the year ended December 31, 2008 compared to 2007, driven entirely by organic growth. In addition, option-related DARTs as a percentage of our total U.S. DARTs represented 15% and 16% of U.S. trading volume for the periods ending December 31, 2008 and 2007, respectively.
Average commission per trade decreased 7% to $10.88 for the year ended December 31, 2008 compared to 2007. The decrease was primarily a function of the product and customer mix. The overall poor performance of the equity markets for the year ended December 31, 2008 disproportionately impacted higher commission products, such as corporate services transactions and mutual funds. Our customers who have a higher
41
Table of Contents
commission per trade traded less during the period compared to our active trader customers, who generally have a lower commission per trade. Customer appreciation, win-back and other promotional campaigns also contributed to the decrease in average commission per trade.
Fees and Service Charges
Fees and service charges decreased 13% to $200.0 million for the year ended December 31, 2008 compared to 2007. This decrease was primarily due to a lower order flow revenue, advisory management fees and CDO management fees. The decrease in advisory management fees was primarily due to our sale of RAA. The decrease in CDO management fees was due to the sale of our collateral management agreements during the first quarter of 2008.
Principal Transactions
Principal transactions decreased 17% to $84.9 million for the year ended December 31, 2008 compared to 2007. The decrease in principal transactions resulted from lower trading volumes.
Losses on Loans and Securities, Net
The losses on loans and securities, net during the year ended December 31, 2008 was due principally to losses on our preferred stock in Fannie Mae and Freddie Mac, which experienced record price declines and volatility during the third quarter of 2008. Based upon our concerns about continuing market instability, all of our positions were liquidated during the third quarter of 2008, resulting in a pre-tax loss of $153.8 million, net of hedges, that was recognized in loss on trading securities, net. In addition, we recognized $7.7 million of impairment related to the funds held in the Reserve Funds’ Primary Fund.
The loss on loans and securities, net during the year ended December 31, 2007 was due primarily to the $2.2 billion loss on the sale of our asset-backed securities portfolio in the fourth quarter of 2007.
Net Impairment
We recognized $95.0 million of impairment on certain securities in our CMO portfolio during the year ended December 31, 2008, which was a result of the deterioration in the expected credit performance of the underlying loans in the securities. We recognized $168.7 million of impairment on certain asset-backed securities during the third quarter of 2007, which was a result of anticipated deterioration in the expected credit performance of the underlying assets in the securities and our decision to sell these securities. The net impairment for the periods ended December 31, 2008 and 2007 represented the total decline in the fair value of impaired securities in accordance with the OTTI accounting guidance that was in effect prior to April 1, 2009.
Other Revenues
Other revenues increased 12% to $52.7 million for the year ended December 31, 2008 compared to 2007. The increase in other revenues was due to income from the cash surrender value of Bank-Owned Life Insurance (“BOLI”), which was entered into during the third quarter of 2007.
Provision for Loan Losses
Provision for loan losses increased $943.6 million to $1.6 billion for the year ended December 31, 2008 compared to 2007. The increase in the provision for loan losses was related primarily to deterioration in the performance of our home equity loan portfolio, which began in the second half of 2007. During the year ended December 31, 2008, we also experienced deterioration in the performance of our one- to four-family loan portfolio.
42
Table of Contents
Operating Expense
The components of operating expense and the resulting variances are as follows (dollars in millions):
| Year Ended December 31, |
Variance | ||||||||||||
| 2008 vs. 2007 | |||||||||||||
| 2008 | 2007 | Amount | % | ||||||||||
| Operating expense: |
|||||||||||||
| Compensation and benefits |
$ | 383.4 | $ | 434.8 | $ | (51.4 | ) | (12 | )% | ||||
| Clearing and servicing |
185.1 | 270.2 | (85.1 | ) | (32 | )% | |||||||
| Advertising and market development |
175.2 | 138.6 | 36.6 | 26 | % | ||||||||
| FDIC insurance premiums |
31.2 | 20.2 | 11.0 | 55 | % | ||||||||
| Communications |
96.8 | 98.3 | (1.5 | ) | (2 | )% | |||||||
| Professional services |
94.1 | 99.2 | (5.1 | ) | (5 | )% | |||||||
| Occupancy and equipment |
85.8 | 85.2 | 0.6 | 1 | % | ||||||||
| Depreciation and amortization |
82.5 | 83.2 | (0.7 | ) | (1 | )% | |||||||
| Amortization of other intangibles |
35.7 | 40.5 | (4.8 | ) | (12 | )% | |||||||
| Impairment of goodwill |
— | 101.2 | (101.2 | ) | * | ||||||||
| Facility restructuring and other exit activities |
29.5 | 27.2 | 2.3 | 9 | % | ||||||||
| Other operating expenses |
90.9 | 175.2 | (84.3 | ) | (48 | )% | |||||||
| Total operating expense |
$ | 1,290.2 | $ | 1,573.8 | $ | (283.6 | ) | (18 | )% | ||||
| * | Percentage not meaningful. |
Operating expense decreased 18% to $1.3 billion for the year ended December 31, 2008 compared to 2007. The decrease in operating expense was driven primarily by decreases in compensation and benefits, clearing and servicing, impairment of goodwill and other expense. These decreases were offset slightly by an increase in advertising and market development expense.
Compensation and Benefits
Compensation and benefits decreased 12% to $383.4 million for the year ended December 31, 2008 compared to 2007. The decrease resulted primarily from lower salary expense due to a reduction in our employee base and decreased variable compensation during the year ended December 31, 2008 when compared to 2007.
Clearing and Servicing
Clearing and servicing expense decreased 32% to $185.1 million for the year ended December 31, 2008 compared to 2007. This decrease is related primarily to the exit of our institutional brokerage operations, which resulted in lower clearing expenses.
Advertising and Market Development
Advertising and market development expense increased 26% to $175.2 million for the year ended December 31, 2008 compared to 2007. This planned increase was aimed at restoring customer confidence as well as expanded efforts to promote our products and services to investors.
Impairment of Goodwill
Impairment of goodwill was $101.2 million for the year ended December 31, 2007. This impairment represents the entire amount of goodwill associated with our balance sheet management business, which had a significant decline in fair value during the fourth quarter of 2007. There was no such impairment for the year ended December 31, 2008.
43
Table of Contents
Facility Restructuring and Other Exit Activities
Facility restructuring and other exit activities expense was $29.5 million for the year ended December 31, 2008. These costs were due primarily to the exit of certain facilities during the year ended December 31, 2008. Slightly offsetting the restructuring expense is the gain on the sale of RAA of $2.8 million which was recorded in the second quarter of 2008.
Other Operating Expenses
Other operating expenses decreased 48% to $90.9 million for the year ended December 31, 2008 compared to 2007, which was primarily due to items that are not expected to recur in future periods. During the first quarter of 2008, we sold our corporate aircraft related assets, which resulted in a $23.7 million gain on sale. During the second quarter of 2008, we realized approximately $13 million of insurance recoveries of fraud losses incurred in prior periods as well as other recoveries to legal reserves. The decrease is also due to $35.1 million in expense recorded for certain legal and regulatory matters for the year ended December 31, 2007.
Other Income (Expense)
Other income (expense) was an expense of $330.6 million for 2008 compared to an expense of $123.1 million for 2007. Total other income (expense) for the year ended December 31, 2008 consisted primarily of corporate interest expense resulting from our corporate debt, which included the springing lien notes, senior notes and mandatory convertible notes. Corporate interest expense increased 110% to $362.2 million for the year ended December 31, 2008 compared to 2007, primarily due to the interest expense on the springing lien notes that were issued in the fourth quarter of 2007 and first quarter of 2008. During 2008, our wholly owned subsidiary, E*TRADE Mauritius, sold its equity shares in Investsmart for proceeds of approximately $145 million, which resulted in a gain on sale of $22.3 million recorded in equity in income of investments and venture funds. During 2007, we sold our investments in E*TRADE Australia and E*TRADE Korea, which resulted in $37.0 million in gain on sales of investments, net.
The gain on early extinguishment of debt is primarily due to a gain of $21.5 million recognized on the exchange of our senior notes for shares of our common stock for the year ended December 31, 2008. The gain of $21.5 million is offset by a loss of $10.8 million related to the early extinguishment of FHLB advances and a loss of $0.6 million on the prepayment of debt related to the sale of the corporate aircraft.
Income Tax Benefit
The income tax benefit from continuing operations was $469.5 million and $732.9 million for the years ended December 31, 2008 and 2007, respectively. Our effective tax rate for 2008 was (36.7)% compared to (33.7)% for 2007. Our 2008 effective tax rate included a number of tax benefits and expenses which were incremental to the amount of tax accrued based on the statutory tax rates in the jurisdictions in which we operate.
During the year ended December 31, 2008 we did not provide for a valuation allowance against our federal deferred tax assets as we believed that it was more likely than not that all of these assets will be realized. Our evaluation focused on identifying significant, objective evidence that we will be able to realize our deferred tax assets in the future. Our analysis of the need for a valuation allowance recognized that we were in a cumulative book taxable loss position as of the three-year period ended December 31, 2008, which is considered significant, objective evidence that we may not be able to realize some portion of our deferred tax assets in the future. However, we believed we were able to rely on our forecasts of future taxable income and overcome the uncertainty created by the cumulative loss position.
44
Table of Contents
Discontinued Operations
During the year ended December 31, 2008, we sold our Canadian brokerage business to Scotiabank. The sale resulted in proceeds of approximately $515 million, including $54 million in repatriation of capital prior to the close and a pre-tax gain of $429.0 million. We also exited our direct retail lending business, which was our last remaining loan origination channel (we exited our wholesale mortgage lending channel in 2007). Therefore, the results of operations of our Canadian brokerage business, including the gain on sale, and the entire direct retail lending business are reported as discontinued operations on our consolidated statement of income (loss) for all periods presented. The following table outlines the components of discontinued operations (dollars in millions):
| Years Ended December 31, |
Variance | |||||||||||||
| 2008 vs. 2007 | ||||||||||||||
| 2008 | 2007 | Amount | % | |||||||||||
| Lending loss, net of tax |
$ | (6.2 | ) | $ | (21.6) | $ | 15.4 | (71 | )% | |||||
| Canada income, net of tax |
10.9 | 22.2 | (11.3 | ) | (51 | )% | ||||||||
| Canada—gain on disposal, net of tax |
268.8 | — | 268.8 | * | ||||||||||
| Canada—tax benefit of excess tax basis over book basis |
24.1 | — | 24.1 | * | ||||||||||
| Income from discontinued operations, net of tax |
$ | 297.6 | $ | 0.6 | $ | 297.0 | * | |||||||
| * | Percentage not meaningful. |
The benefit of excess tax basis over book basis is related to our Canadian brokerage business, which resulted from the difference between the tax and financial reporting bases of the business. We recognized this difference in the second quarter of 2008 because a commitment to sell the Canadian brokerage business was in place. The sale of the Canadian brokerage business was completed in the third quarter of 2008 for a gain of $268.8 million, net of tax.
Beginning in the first quarter of 2009, we revised our segment financial reporting to reflect the manner in which our chief operating decision maker had begun assessing the Company’s performance and making resource allocation decisions. As a result, we now report our operating results in two segments: 1) “Trading and Investing,” which includes the businesses that were formerly in the “Retail” segment and now includes our market-making business; and 2) “Balance Sheet Management,” which includes the businesses from the former “Institutional” segment, other than the market-making business. Our segment financial information from prior periods has been reclassified in accordance with the new segment financial reporting.
45
Table of Contents
Trading and Investing
The following table summarizes trading and investing financial information and key metrics for the periods ended December 31, 2009, 2008 and 2007 (dollars in millions, except for key metrics):
| Year Ended December 31, | Variance | ||||||||||||||||||
| 2009 vs. 2008 | |||||||||||||||||||
| 2009 | 2008 | 2007 | Amount | % | |||||||||||||||
| Trading and investing segment income: |
|||||||||||||||||||
| Net operating interest income |
$ | 793.4 | $ | 830.4 | $ | 962.8 | $ | (37.0 | ) | (4 | )% | ||||||||
| Commissions |
548.0 | 514.7 | 520.2 | 33.3 | 6 | % | |||||||||||||
| Fees and service charges |
185.6 | 191.6 | 209.0 | (6.0 | ) | (3 | )% | ||||||||||||
| Principal transactions |
88.1 | 84.8 | 101.1 | 3.3 | 4 | % | |||||||||||||
| Gains (losses) on loans and securities, net |
(0.1 | ) | (0.1 | ) | 0.2 | — | — | % | |||||||||||
| Other revenues |
35.5 | 38.6 | 41.1 | (3.1 | ) | (8 | )% | ||||||||||||
| Net segment revenue |
1,650.5 | 1,660.0 | 1,834.4 | (9.5 | ) | (1 | )% | ||||||||||||
| Total segment expense |
991.4 | 1,036.8 | 1,045.3 | (45.4 | ) | (4 | )% | ||||||||||||
| Total trading and investing segment income |
$ | 659.1 | $ | 623.2 | $ | 789.1 | $ | 35.9 | 6 | % | |||||||||
| Key Metrics: |
|||||||||||||||||||
| U.S. DARTs(1) |
179,183 | 169,075 | 161,219 | 10,108 | 6 | % | |||||||||||||
| U.S. average commission per trade |
$ | 11.33 | $ | 10.98 | $ | 11.57 | $ | 0.35 | 3 | % | |||||||||
| End of period brokerage accounts(2) |
2,630,079 | 2,515,806 | 2,373,265 | 114,273 | 5 | % | |||||||||||||
| Net new brokerage accounts(2) |
114,273 | 142,541 | 4,688 | (28,268 | ) | (20 | )% | ||||||||||||
| Customer assets (dollars in billions) |
$ | 153.2 | $ | 112.2 | $ | 185.0 | $ | 41.0 | 37 | % | |||||||||
| Net new brokerage assets (dollars in billions)(2) |
$ | 7.2 | $ | 3.9 | $ | (13.3 | ) | * | * | ||||||||||
| Brokerage related cash (dollars in billions)(2) |
$ | 20.4 | $ | 15.8 | $ | 17.5 | $ | 4.6 | 29 | % | |||||||||
| * | Percentage not meaningful. |
| (1) | U.S. DARTs are defined as transactions executed on our domestic platforms. |
| (2) | References to “brokerage” in these metrics refer to activity on our domestic platforms and do not include brokerage activity from our international local brokerage accounts. |
Our trading and investing segment generates revenue from brokerage and banking relationships with investors and from market-making activities. This segment generates six main sources of revenue: net operating interest income; commissions; fees and service charges; principal transactions; gains (losses) on loans and securities, net; and other revenues. Other revenues include results from our employee stock option management software and services from our corporate customers, as we ultimately service retail investors through these corporate relationships.
2009 Compared to 2008
Trading and investing segment income increased 6% to $659.1 million for the year ended December 31, 2009 compared to 2008. Trading activity was strong during 2009 resulting in total DARTs of 196,521 and an average commission per trade of $11.11. We also continued to generate new brokerage accounts, ending the year with 2.6 million accounts. Our brokerage related cash, which is one of our most profitable sources of funding, increased by $4.6 billion when compared to 2008. We believe these metrics are indicators of a brokerage business that is able to compete effectively in a volatile environment and we believe we are positioned for continued growth in our trading and investing segment.
Trading and investing net operating interest income decreased 4% to $793.4 million for the year ended December 31, 2009 compared to 2008. This decrease was driven primarily by a decrease in the average balance of our margin receivables during the comparable periods, which was partially offset by a decrease in yields paid on our deposits.
46
Table of Contents
Trading and investing commissions revenue increased 6% to $548.0 million for the year ended December 31, 2009 compared to 2008. The increase in commissions revenue was the result of an increase in DARTs of 4% to 196,521 and an increase in the average commission per trade of 2% to $11.11 for the year ended December 31, 2009 compared to 2008.
Trading and investing principal transactions revenue increased 4% to $88.1 million for the year ended December 31, 2009 compared to 2008. Our principal transactions revenue is influenced by overall trading volumes, the number of stocks for which we act as a market-maker, the trading volumes of those specific stocks and the performance of our proprietary trading activities. The increase in principal transactions revenue was driven by an increase in the volume of equity shares that were traded, which was partially offset by a decrease in our average revenue earned per share traded for the year ended December 31, 2009.
Trading and investing segment expense decreased 4% to $991.4 million for the year ended December 31, 2009 compared to 2008. The decrease related primarily to a decrease in advertising and market development expense and a decrease in bad debt expense, which were partially offset by an increase in FDIC insurance premiums.
As of December 31, 2009, we had approximately 2.6 million brokerage accounts (excluding 0.1 million international local accounts), 1.0 million stock plan accounts and 0.7 million banking accounts. For the years ended December 31, 2009 and 2008, our brokerage products contributed 63% for both years and our banking products, which include sweep products, contributed 28% and 27%, respectively, of total trading and investing net revenue. All other products contributed less than 10% of total trading and investing net revenue for the years ended December 31, 2009 and 2008.
2008 Compared to 2007
Trading and investing segment income decreased 21% to $623.2 million for the year ended December 31, 2008 compared to 2007. This was due primarily to a decrease in net operating interest income.
Trading and investing net operating interest income decreased 14% to $830.4 million for the year ended December 31, 2008 compared to 2007. This decrease was driven primarily by a decrease in average margin receivables as well as the above market rate on our Complete Savings Account.
Trading and investing commissions revenue decreased 1% to $514.7 million for the year ended December 31, 2008 compared to 2007. The slight decrease in commissions revenue was primarily the result of a decrease in average commissions per trade of 7%, offset by an increase in DARTs of 6%.
Trading and investing principal transactions decreased 16% to $84.8 million for the year ended December 31, 2008 compared to 2007. The decrease in principal transactions resulted from lower trading volumes.
Trading and investing segment expense decreased 1% to $1.0 billion for the year ended December 31, 2008 compared to 2007. This decrease related primarily to $35.1 million in expense recorded for certain legal and regulatory matters for the year ended December 31, 2007 for which there was no similar expense in the year ended December 31, 2008. This decrease was partially offset by our planned growth in marketing spend as we expanded efforts to promote our products and services to investors.
As of December 31, 2008, we had approximately 2.5 million brokerage accounts (excluding 0.1 million international local accounts), 1.0 million stock plan accounts and 0.8 million banking accounts. For the years ended December 31, 2008 and 2007, our brokerage products contributed 63% for both years and our banking
47
Table of Contents
products contributed 27% and 26%, respectively, of total trading and investing net revenue. All other products contributed less than 10% of total trading and investing net revenue for the years ended December 31, 2008 and 2007.
Balance Sheet Management
The following table summarizes balance sheet management financial information and key metrics for the periods ended December 31, 2009, 2008 and 2007 (dollars in millions, except for key metrics):
| Year Ended December 31, | Variance | ||||||||||||||||||
| 2009 vs. 2008 | |||||||||||||||||||
| 2009 | 2008 | 2007 | Amount | % | |||||||||||||||
| Balance sheet management segment loss: |
|||||||||||||||||||
| Net operating interest income |
$ | 467.2 | $ | 437.6 | $ | 620.8 | $ | 29.6 | 7 | % | |||||||||
| Commissions |
— | 0.8 | 143.4 | (0.8 | ) | (100 | )% | ||||||||||||
| Fees and service charges |
6.9 | 8.4 | 21.6 | (1.5 | ) | (18 | )% | ||||||||||||
| Principal transactions |
— | 0.1 | 1.1 | (0.1 | ) | (100 | )% | ||||||||||||
| Gains (losses) on loans and securities, net |
169.2 | (100.4 | ) | (2,296.9 | ) | 269.6 | * | ||||||||||||
| Net impairment |
(89.1 | ) | (95.0 | ) | (168.7 | ) | * | * | |||||||||||
| Other revenues |
12.3 | 14.2 | 6.6 | (1.9 | ) | (13 | )% | ||||||||||||
| Net segment revenue |
566.5 | 265.7 | (1,672.1 | ) | 300.8 | 113 | % | ||||||||||||
| Provision for loan losses |
1,498.1 | 1,583.7 | 640.1 | (85.6 | ) | (5 | )% | ||||||||||||
| Total segment expense |
251.9 | 253.4 | 529.1 | (1.5 | ) | (1 | )% | ||||||||||||
| Total balance sheet management segment loss |
$ | (1,183.5 | ) | $ | (1,571.4 | ) | $ | (2,841.3 | ) | $ | 387.9 | (25 | )% | ||||||
| Key Metrics: |
|||||||||||||||||||
| Allowance for loan losses (dollars in millions) |
$ | 1,182.7 | $ | 1,080.6 | $ | 508.2 | $ | 102.1 | 9 | % | |||||||||
| Allowance for loan losses as a % of nonperforming loans |
79.54 | % | 114.70 | % | 121.44 | % | * | (35.16 | )% | ||||||||||
| * | Percentage not meaningful |
Our balance sheet management segment generates revenue from managing loans previously originated or purchased from third parties as well as our customer cash and deposit relationships to generate additional net operating interest income.
2009 Compared to 2008
The balance sheet management segment reported a loss of $1.2 billion for the year ended December 31, 2009. The losses in this segment are due primarily to the high levels of delinquent loans in our one- to four-family and home equity loan portfolios, which in turn resulted in provision for loan losses of $1.5 billion for the year ended December 31, 2009.
Gains (losses) on loans and securities, net were gains of $169.2 million for the year ended December 31, 2009, compared to losses of $100.4 million for the year ended December 31, 2008. The gains on loans and securities, net for the year ended December 31, 2009 were due primarily to gains on the sale of certain agency mortgage-backed securities, which were partially offset by net losses on the sales of loans. The losses on the sales of loans were due to the sale of a $0.4 billion pool of home equity loans during the year ended December 31, 2009. We purchased this particular pool of loans from the originator of the loans in a prior period. This same originator, who continued to service the loans subsequent to our purchase, made an unsolicited offer to repurchase the loans back from us at a price of 98% of the balance of the loan portfolio and we accepted this offer. We believe transactions of this nature are rare and are unlikely to occur again in future periods. The losses on loans and securities, net for the year ended December 31, 2008 were due primarily to losses on our preferred stock in Fannie Mae and Freddie Mac.
48
Table of Contents
We recognized $89.1 million net impairment during the year ended December 31, 2009 on certain securities in our non-agency CMO portfolio due to continued deterioration in the expected credit performance of the underlying loans in the securities. The net impairment included gross OTTI of $232.1 million for the year ended December 31, 2009. Of the $232.1 million of gross OTTI for the year ended December 31, 2009, $143.0 million related to the noncredit portion of OTTI, which was recorded through other comprehensive income (loss). We had net impairment of $95.0 million for the year ended December 31, 2008, which represented the total decline in the fair value of impaired securities in accordance with the OTTI accounting guidance that was in effect prior to April 1, 2009.
Provision for loan losses decreased $85.6 million to $1.5 billion for the year ended December 31, 2009 compared to 2008. The provision for loan losses for the year ended December 31, 2009 was due primarily to the high levels of delinquent loans in our one- to four-family and home equity loan portfolios. We believe the delinquencies in both of these portfolios were caused by several factors, including: home price depreciation in key markets; growing inventories of unsold homes; rising foreclosure rates; significant contraction in the availability of credit; and a general decline in economic growth. In addition, the combined impact of home price depreciation and the reduction of available credit made it increasingly difficult for borrowers to refinance existing loans. Although we expect these factors will cause the provision for loan losses to continue at elevated levels in future periods, the level of provision for loan losses has declined for five consecutive quarters. While we cannot state with certainty that this trend will continue, we believe it is a positive indicator that our loan portfolio has continued to stabilize.
Total balance sheet management segment expense decreased slightly to $251.9 million for the year ended December 31, 2009 compared to 2008. The slight decrease for the year ended December 31, 2009 was due primarily to lower facility restructuring expense, lower expenses on servicing loans and lower salary expense, offset by an increase in expenses related to corporate overhead expenses, the majority of which are allocated to the balance sheet management segment, and an increase in expenses related to real estate owned (“REO”) and other repossessed assets.
2008 Compared to 2007
Our balance sheet management segment incurred a loss of $1.6 billion for the year ended December 31, 2008. The loss was driven primarily by an increase in our provision for loan losses for our loan portfolio of $943.6 million to $1.6 billion for the year ended December 31, 2008 compared to 2007.
Net operating interest income decreased 30% to $437.6 million for the year ended December 31, 2008 compared to 2007. The decrease in net operating interest income was due primarily to the decrease in average enterprise interest-earning assets of 16% to $46.9 billion as of December 31, 2008 compared to 2007.
Balance sheet management commissions revenue decreased to $0.8 million for the year ended December 31, 2008 compared to 2007. The decrease was a result of the exit of our institutional brokerage operations.
Fees and service charges revenue decreased 61% to $8.4 million for the year ended December 31, 2008 compared to 2007. The decrease is primarily the result of a decrease in CDO management fees, which are no longer a revenue stream due to the sale of our collateral management agreements during the first quarter of 2008.
The total loss on loans and securities, net during year ended December 31, 2008 was due principally to losses on our preferred stock in Fannie Mae and Freddie Mac, which experienced record price declines and volatility during the third quarter of 2008. Based upon our concerns about continuing market instability, all of our positions were liquidated during the third quarter of 2008, resulting in a pre-tax loss of $153.8 million, net of hedges, that was recognized in loss on trading securities, net.
In addition, we recognized $95.0 million of impairment on certain securities in our CMO portfolio during the year ended December 31, 2008, which was a result of the deterioration in the expected credit performance of the underlying loans in the securities. Further declines in the performance of our CMO portfolio could result in additional impairments in future periods.
49
Table of Contents
Provision for loan losses increased $943.6 million to $1.6 billion for the year ended December 31, 2008 compared to 2007. The increase in the provision for loan losses was related primarily to deterioration in the performance of our home equity loan portfolio, which began in the second half of 2007.
Total balance sheet management segment expense decreased 52% to $253.4 million for the year ended December 31, 2008 compared to 2007. This decrease was due primarily to the goodwill impairment recorded for the year ended December 31, 2007 for which there was no similar expense in the year ended December 31, 2008. There was also a decline in our clearing expense related to the exit of our institutional brokerage operations, as well as a reduction in corporate overhead expenses, the majority of which are allocated to the balance sheet management segment.
The following table sets forth the significant components of our consolidated balance sheet (dollars in millions):
| December 31, | Variance | ||||||||||||
| 2009 vs. 2008 | |||||||||||||
| 2009 | 2008 | Amount | % | ||||||||||
| Assets: |
|||||||||||||
| Cash and equivalents |
$ | 3,483.2 | $ | 3,853.8 | $ | (370.6 | ) | (10 | )% | ||||
| Cash and investments required to be segregated under federal or other regulations |
1,545.3 | 1,141.6 | 403.7 | 35 | % | ||||||||
| Trading securities |
38.3 | 55.5 | (17.2 | ) | (31 | )% | |||||||
| Available-for-sale mortgage-backed and investment securities |
13,319.7 | 10,806.1 | 2,513.6 | 23 | % | ||||||||
| Margin receivables |
3,827.2 | 2,791.2 | 1,036.0 | 37 | % | ||||||||
| Loans, net |
19,174.9 | 24,451.8 | (5,276.9 | ) | (22 | )% | |||||||
| Investment in FHLB stock |
183.9 | 200.9 | (17.0 | ) | (8 | )% | |||||||
| Other assets(1) |
5,794.0 | 5,237.3 | 556.7 | 11 | % | ||||||||
| Total assets |
$ | 47,366.5 | $ | 48,538.2 | $ | (1,171.7 | ) | (2 | )% | ||||
| Liabilities and shareholders’ equity: |
|||||||||||||
| Deposits |
$ | 25,597.7 | $ | 26,136.2 | $ | (538.5 | ) | (2 | )% | ||||
| Wholesale borrowings(2) |
9,188.8 | 11,735.1 | (2,546.3 | ) | (22 | )% | |||||||
| Customer payables |
5,234.2 | 3,753.3 | 1,480.9 | 39 | % | ||||||||
| Corporate debt |
2,458.7 | 2,750.5 | (291.8 | ) | (11 | )% | |||||||
| Accounts payable, accrued and other liabilities |
1,137.5 | 1,571.6 | (434.1 | ) | (28 | )% | |||||||
| Total liabilities |
43,616.9 | 45,946.7 | (2,329.8 | ) | (5 | )% | |||||||
| Shareholders’ equity |
3,749.6 | 2,591.5 | 1,158.1 | 45 | % | ||||||||
| Total liabilities and shareholders’ equity |
$ | 47,366.5 | $ | 48,538.2 | $ | (1,171.7 | ) | (2 | )% | ||||
| (1) | Includes balance sheet line items property and equipment, net, goodwill, other intangibles, net and other assets. |
| (2) | Includes balance sheet line items securities sold under agreements to repurchase and other borrowings. |
The slight decrease in total assets was attributable primarily to a decrease of $5.3 billion in loans, net, offset by increases of $2.5 billion in available-for-sale mortgage-backed and investment securities and $1.0 billion in margin receivables. The decrease in loans, net was due to our strategy of reducing balance sheet risk by allowing our loan portfolio to pay down, which we plan to do for the foreseeable future.
The decrease in total liabilities was attributable primarily to the decrease of $2.5 billion in wholesale borrowings, which was partially offset by an increase of $1.5 billion in customer payables. The decrease in
50
Table of Contents
wholesale borrowings was a result of paying down our FHLB advances and securities sold under agreements to repurchase. Customer payables increased due to higher trading activity and net new brokerage customer acquisition.
The increase in shareholders’ equity was due to the issuance of 620.9 million shares of common stock in connection with our common stock offerings and the completion of our Debt Exchange along with the subsequent conversions of the newly-issued convertible debentures into 696.6 million shares of common stock as of December 31, 2009. The common stock issued in connection with our equity offerings combined with the subsequent debt conversions resulted in an increase of $1.5 billion in shareholders’ equity during the year ended December 31, 2009.
Available-for-Sale Mortgage-Backed and Investment Securities
Available-for-sale securities are summarized as follows (dollars in millions):
| December 31, | Variance | ||||||||||||
| 2009 vs. 2008 | |||||||||||||
| 2009 | 2008 | Amount | % | ||||||||||
| Residential mortgage-backed securities: |
|||||||||||||
| Agency mortgage-backed securities and CMOs |
$ | 8,966.9 | $ | 10,110.8 | $ | (1,143.9 | ) | (11 | )% | ||||
| Non-agency CMOs and other |
375.1 | 602.4 | (227.3 | ) | (38 | )% | |||||||
| Total residential mortgage-backed securities |
9,342.0 | 10,713.2 | (1,371.2 | ) | (13 | )% | |||||||
| Investment securities |
3,977.7 | 92.9 | 3,884.8 | 4181 | % | ||||||||
| Total available-for-sale securities |
$ | 13,319.7 | $ | 10,806.1 | $ | 2,513.6 | 23 | % | |||||
Available-for-sale securities represented 28% and 22% of total assets at December 31, 2009 and 2008, respectively. Total available-for-sale securities increased 23% to $13.3 billion at December 31, 2009 when compared to December 31, 2008, due primarily to the purchase of agency debentures, which increased investment securities to $4.0 billion. This increase was partially offset by the sale of certain agency mortgage-backed securities and CMOs. During the third quarter of 2009, we decided to reduce our interest rate risk exposure in our available-for-sale securities portfolio. We accomplished this by reducing our position in mortgage-backed securities and increasing our position in agency debentures, which have a lower sensitivity to changes in interest rates when compared to mortgage-backed securities.
Loans, Net
Loans, net are summarized as follows (dollars in millions):
| December 31, | Variance | ||||||||||||||
| 2009 vs. 2008 | |||||||||||||||
| 2009 | 2008 | Amount | % | ||||||||||||
| Loans held-for-sale |
$ | 7.9 | $ | — | $ | 7.9 | * | ||||||||
| One- to four-family |
10,567.1 | 12,979.8 | (2,412.7 | ) | (19 | )% | |||||||||
| Home equity |
7,769.7 | 10,017.2 | (2,247.5 | ) | (22 | )% | |||||||||
| Consumer and other |
1,841.3 | 2,298.6 | (457.3 | ) | (20 | )% | |||||||||
| Unamortized premiums, net |
171.6 | 236.8 | (65.2 | ) | (28 | )% | |||||||||
| Allowance for loan losses |
(1,182.7 | ) | (1,080.6 | ) | (102.1 | ) | 9 | % | |||||||
| Total loans, net |
$ | 19,174.9 | $ | 24,451.8 | $ | (5,276.9 | ) | (22 | )% | ||||||
| * | Percentage not meaningful |
51
Table of Contents
Loans, net decreased 22% to $19.2 billion at December 31, 2009 from $24.5 billion at December 31, 2008. This decline was due primarily to our strategy of reducing balance sheet risk by allowing our loan portfolio to pay down, which we plan to do for the foreseeable future. In addition, we sold a $0.4 billion pool of home equity loans during the year ended December 31, 2009. We purchased this particular pool of loans from the originator of the loans in a prior period. This same originator, who continued to service the loans subsequent to our purchase, made an unsolicited offer to repurchase the loans back from us at a price of 98% of the balance of the loan portfolio and we accepted this offer. We believe transactions of this nature are rare and are unlikely to occur again in future periods.
Loans held-for-sale of $7.9 million as of December 31, 2009 represents loans originated through, but not yet purchased by, a third party company that we partnered with to provide access to real estate loans for our customers. The product is offered as a convenience to our customers and is not one of our primary product offerings. The third party company providing this product performs all processing and underwriting of these loans and is responsible for the credit risk associated with these loans, which minimizes our assumption of any of the typical risks commonly associated with mortgage lending. There is a short period of time after closing of the loans in which we record the originated loan as held-for-sale prior to the third party company purchasing the loan.
We have a credit default swap (“CDS”) on a portion of our first-lien residential real estate loan portfolio through a synthetic securitization structure that provides, for a fee, an assumption by a third party of a portion of the credit risk related to the underlying loans. The CDS provides protection for losses in excess of $4 million, but not to exceed $30 million. During the year ended December 31, 2009, the entire $30 million in losses had been recognized and as a result, there is not a related benefit reflected in the allowance for loan losses as of December 31, 2009. We have received approximately $8 million in payments out of the total $30 million benefit as of December 31, 2009. We expect to receive the remaining $22 million in 2010.
Deposits
Deposits are summarized as follows (dollars in millions):
| December 31, | Variance | ||||||||||||
| 2009 vs. 2008 | |||||||||||||
| 2009 | 2008 | Amount | % | ||||||||||
| Sweep deposit accounts |
$ | 12,551.5 | $ | 9,650.4 | $ | 2,901.1 | 30 | % | |||||
| Complete savings accounts |
9,704.0 | 11,298.5 | (1,594.5 | ) | (14 | )% | |||||||
| Certificates of deposit |
1,215.8 | 2,363.4 | (1,147.6 | ) | (49 | )% | |||||||
| Other money market and savings accounts |
1,183.4 | 1,394.2 | (210.8 | ) | (15 | )% | |||||||
| Checking accounts |
813.7 | 991.5 | (177.8 | ) | (18 | )% | |||||||
| Brokered certificates of deposit |
129.3 | 438.2 | (308.9 | ) | (70 | )% | |||||||
| Total deposits |
$ | 25,597.7 | $ | 26,136.2 | $ | (538.5 | ) | (2 | )% | ||||
Deposits represented 59% and 57% of total liabilities at December 31, 2009 and 2008, respectively. Deposits generally provide us the benefit of lower interest costs compared with wholesale funding alternatives. The complete savings accounts and certificates of deposits decreased 14% and 49%, respectively, during the year ended December 31, 2009 compared to 2008 as we are no longer focused on growing these specific products. These decreases were offset by a 30% increase in sweep deposit accounts. We expect the non-sweep deposit balances to continue to decrease in 2010. At December 31, 2009, 95% of our customer deposits were covered by FDIC insurance.
During the fourth quarter of 2009, we entered into an agreement to sell up to $1.4 billion of our complete savings accounts to a third party. This transaction requires notification to each customer account being sold; therefore, we expect that upon closing, the amount of deposits ultimately transferred will be less than $1.4
52
Table of Contents
billion. We believe this transaction is in line with our overall strategy of reducing our balance sheet and growing our brokerage business as the customers being sold are primarily not affiliated with an active broker account.
The deposits balance is a component of the total customer cash and deposits balance reported as a customer activity metric of $33.8 billion and $32.3 billion at December 31, 2009 and 2008, respectively. The total customer cash and deposits balance is summarized as follows (dollars in millions):
| December 31, | Variance | ||||||||||||||
| 2009 vs. 2008 | |||||||||||||||
| 2009 | 2008 | Amount | % | ||||||||||||
| Deposits |
$ | 25,597.7 | $ | 26,136.2 | $ | (538.5 | ) | (2 | )% | ||||||
| Less: brokered certificates of deposit |
(129.3 | ) | (438.2 | ) | 308.9 | (70 | )% | ||||||||
| Retail deposits |
25,468.4 | 25,698.0 | (229.6 | ) | (1 | )% | |||||||||
| Customer payables |
5,234.2 | 3,753.3 | 1,480.9 | 39 | % | ||||||||||
| Customer cash balances held by third parties and other |
3,132.8 | 2,805.1 | 327.7 | 12 | % | ||||||||||
| Total customer cash and deposits |
$ | 33,835.4 | $ | 32,256.4 | $ | 1,579.0 | 5 | % | |||||||
Wholesale Borrowings
Wholesale borrowings, which consist of securities sold under agreements to repurchase and other borrowings are summarized as follows (dollars in millions):
| December 31, | Variance | ||||||||||||
| 2009 vs. 2008 | |||||||||||||
| 2009 | 2008 | Amount | % | ||||||||||
| Securities sold under agreements to repurchase |
$ | 6,441.9 | $ | 7,381.3 | $ | (939.4 | ) | (13 | )% | ||||
| FHLB advances |
$ | 2,303.6 | $ | 3,903.6 | $ | (1,600.0 | ) | (41 | )% | ||||
| Subordinated debentures |
427.4 | 427.3 | 0.1 | 0 | % | ||||||||
| Other |
15.9 | 22.9 | (7.0 | ) | (31 | )% | |||||||
| Total other borrowings |
$ | 2,746.9 | $ | 4,353.8 | $ | (1,606.9 | ) | (37 | )% | ||||
| Total wholesale borrowings |
$ | 9,188.8 | $ | 11,735.1 | $ | (2,546.3 | ) | (22 | )% | ||||
Wholesale borrowings represented 21% and 26% of total liabilities at December 31, 2009 and 2008, respectively. The decrease in wholesale borrowings of $2.5 billion during the year ended December 31, 2009 was due primarily to the early termination of certain FHLB advances that resulted in a loss on early extinguishment of debt of $50.6 million and a decrease in securities sold under agreements to repurchase. FHLB advances coupled with securities sold under agreements to repurchase are the primary wholesale funding sources of the Bank. As a result, we expect these balances to fluctuate over time as our deposits and our interest-earning assets fluctuate.
53
Table of Contents
Corporate Debt
Corporate debt by type is shown as follows (dollars in millions):
| December 31, 2009 |
Face Value | Discount | Fair Value Adjustment |
Net | |||||||||
| Interest-bearing notes: |
|||||||||||||
| Senior notes: |
|||||||||||||
| 8% Notes, due 2011 |
$ | 3.6 | $ | — | $ | — | $ | 3.6 | |||||
| 7 3/8% Notes, due 2013 |
414.7 | (3.4 | ) | 21.5 | 432.8 | ||||||||
| 7 7/8% Notes, due 2015 |
243.2 | (1.8 | ) | 11.2 | 252.6 | ||||||||
| Total senior notes |
661.5 | (5.2 | ) | 32.7 | 689.0 | ||||||||
| 12 1/2% Springing lien notes, due 2017 |
930.2 | (189.8 | ) | 8.4 | 748.8 | ||||||||
| Total interest-bearing notes |
1,591.7 | (195.0 | ) | 41.1 | 1,437.8 | ||||||||
| Non-interest-bearing debt: |
|||||||||||||
| 0% Convertible debentures, due 2019 |
1,020.9 | — | — | 1,020.9 | |||||||||
| Total corporate debt |
$ | 2,612.6 | $ | (195.0 | ) | $ | 41.1 | $ | 2,458.7 | ||||
| December 31, 2008 |
Face Value | Discount | Fair Value Adjustment |
Net | |||||||||
| Senior notes: |
|||||||||||||
| 8% Notes, due 2011 |
$ | 435.5 | $ | (1.8 | ) | $ | 13.9 | $ | 447.6 | ||||
| 7 3/8% Notes, due 2013 |
414.7 | (4.4 | ) | 32.4 | 442.7 | ||||||||
| 7 7/8% Notes, due 2015 |
243.2 | (2.1 | ) | 13.2 | 254.3 | ||||||||
| Total senior notes |
1,093.4 | (8.3 | ) | 59.5 | 1,144.6 | ||||||||
| 12 1/2% Springing lien notes, due 2017 |
2,057.0 | (460.5 | ) | 9.4 | 1,605.9 | ||||||||
| Total corporate debt |
$ | 3,150.4 | $ | (468.8 | ) | $ | 68.9 | $ | 2,750.5 | ||||
In the third quarter of 2009, we exchanged $1.7 billion aggregate principal amount of our corporate debt, including $1.3 billion principal amount of the 12 1/ 2% Notes and $0.4 billion principal amount of the 8% Notes, for an equal principal amount of newly-issued non-interest-bearing convertible debentures. Subsequent to the Debt Exchange, $720.9 million of convertible debentures were converted into 696.6 million shares of common stock during the third and fourth quarters of 2009. For further details on the Debt Exchange, see Note 1—Organization, Basis of Presentation and Summary of Significant Accounting Policies, Note 5—Fair Value Disclosures and 14—Corporate Debt of Item 8. Financial Statements and Supplementary Data.
54
Table of Contents
Shareholders’ Equity
The activity in shareholders’ equity during the year ended December 31, 2009 is summarized as follows (dollars in millions):
| Common Stock/ Additional Paid- In Capital |
Accumulated Deficit/Other Comprehensive Loss |
Total | |||||||||
| Beginning balance, December 31, 2008 |
$ | 4,069.9 | $ | (1,478.4 | ) | $ | 2,591.5 | ||||
| Common stock offerings |
733.1 | — | 733.1 | ||||||||
| Activity related to the Debt Exchange: |
|||||||||||
| After-tax loss related to the Debt Exchange |
— | (772.9 | ) | (772.9 | ) | ||||||
| Amortization of premium on the convertible debentures |
707.2 | — | 707.2 | ||||||||
| Conversions of convertible debentures |
720.9 | — | 720.9 | ||||||||
| All other after-tax operating losses |
— | (524.9 | ) | (524.9 | ) | ||||||
| Net change from available-for-sale securities |
— | 107.6 | 107.6 | ||||||||
| Net change from cash flow hedging instruments |
— | 138.9 | 138.9 | ||||||||
| Other(1) |
46.0 | 2.2 | 48.2 | ||||||||
| Ending balance, December 31, 2009 |
$ | 6,277.1 | $ | (2,527.5 | ) | $ | 3,749.6 | ||||
| (1) | Other includes employee stock compensation accounting, additional purchase consideration paid in connection with prior acquisitions, and changes in other comprehensive income (loss) from foreign currency translation. |
Shareholders’ equity increased 45% to $3.7 billion at December 31, 2009 from $2.6 billion at December 31, 2008. This increase was due primarily to the issuance of 620.9 million shares of common stock related to our common stock offerings and the completion of our Debt Exchange along with the subsequent conversions of the newly-issued convertible debentures into 696.6 million shares of common stock that occurred during the third and fourth quarters of 2009. The increase was also attributable to the amortization of the entire premium on the newly-issued convertible debentures, which was immediately amortized to additional paid-in capital since amortizing the premium into interest expense over the life of the non-interest-bearing convertible debentures would have resulted in recording interest income on a liability (a negative yield)(1).
In January 2010, a security holder paid the Company $35 million to settle a claim under Section 16(b) of the Securities Exchange Act of 1934. Section 16(b) requires certain persons and entities whose securities trading activities result in “short swing” profits to repay such profits to the issuer of the security. Section 16(b) liability does not require that the security holder trade while in possession of material non-public information. This payment will be recorded as an increase to shareholder’s equity in the first quarter of 2010.
LIQUIDITY AND CAPITAL RESOURCES
We have established liquidity and capital policies to support the successful execution of our business strategies, while ensuring ongoing and sufficient liquidity through the business cycle. These policies are especially important during periods of stress in the financial markets, which have been ongoing since the fourth quarter of 2007 and will likely continue for some time.
We believe liquidity is of critical importance to the Company and especially important within E*TRADE Bank. The objective of our policies is to ensure that we can meet our corporate and banking liquidity needs under both normal operating conditions and under periods of stress in the financial markets. Our corporate liquidity needs are primarily driven by the amount of principal and interest due on our corporate debt as well as any capital needs at E*TRADE Bank. Our banking liquidity needs are driven primarily by the level and volatility of our customer deposits. Management maintains an extensive set of liquidity sources and monitors certain business
| (1) | See Note 1—Organization, Basis of Presentation and Summary of Significant Accounting Policies of Item 8. Financial Statements and Supplementary Data for a description of the accounting of the Debt Exchange. |
55
Table of Contents
trends and market metrics closely to ensure we have sufficient liquidity and to avoid dependence on other more expensive sources of funding. Management believes the following sources of liquidity are of critical importance in maintaining ample funding for liquidity needs: Corporate cash, Bank cash, deposits and unused FHLB borrowing capacity. Management believes that within deposits, sweep deposits are of particular importance as they are the most stable source of liquidity for E*TRADE Bank when compared to non-sweep deposits. Overall, management believes that these liquidity sources, which we expect to fluctuate in any given period, are more than sufficient to meet our needs for the foreseeable future.
Capital is generated primarily through our business operations and our capital market activities. Our trading and investing segment has been profitable and a generator of capital for the past six years and we expect that trend to continue. However, our provision for loan losses, which is reported in the balance sheet management segment, has more than offset the capital generated by both of our segments. While we cannot state this with certainty, we believe that this trend will reverse at some point in the foreseeable future and our business operations will again be a net generator of capital.
During the second and third quarters of 2009, our primary banking regulator, the OTS, advised us to raise additional equity capital for E*TRADE Bank and to substantially reduce our corporate debt service burden. This was also consistent with management’s belief during the same period. In response, we implemented a plan to strengthen our capital structure by raising cash equity primarily to support E*TRADE Bank and also to enhance our liquidity. As part of this plan, we raised $733 million in net proceeds from three separate common stock offerings, as detailed in the table below (dollars and shares in millions):
| Net Proceeds | Shares | ||||
| Equity Drawdown Program, May 2009 |
$ | 63 | 41 | ||
| Public Equity Offering, June 2009 |
523 | 500 | |||
| At the Market Offering, September 2009 |
147 | 80 | |||
| Total |
$ | 733 | 621 | ||
Also as part of our capital plan, we completed an exchange of $1.7 billion aggregate principal amount of our corporate debt, which included $1.3 billion principal amount of our 12 1 /2% Notes and $0.4 billion principal amount of our 8% Notes, for an equal principal amount of newly-issued non-interest-bearing convertible debentures. As a result of the completion of this exchange, we reduced our annual corporate interest payments by approximately $200 million and eliminated any substantial debt maturities until 2013. As of December 31, 2009, $720.9 million of the newly-issued non-interest-bearing convertible debentures had been converted into 696.6 million shares of common stock.
We believe the combined impact of our common stock offerings and the Debt Exchange substantially improved our capital structure. As a result, we believe we will be in a position to respond opportunistically with regard to any additional capital planning actions, such as further debt-for-equity exchanges, additional cash capital raising activities or sales of any non-core assets.
During the fourth quarter of 2008, we applied to the U.S. Treasury for funding under the Troubled Asset Relief Program (“TARP”) Capital Purchase Program. In the fourth quarter of 2009, the OTS requested that we declare our intentions with respect to our application. In light of our capital raising activities in the second and third quarters of 2009 and the reduction in interest-bearing debt in connection with the completion of the Debt Exchange, we withdrew our application on October 30, 2009.
56
Table of Contents
Corporate Cash
Corporate cash is the primary source of liquidity at the parent company and is available to invest in our regulated subsidiaries. We define corporate cash as cash held at the parent company as well as cash held in certain subsidiaries that can distribute cash to the parent company without any regulatory approval. The components of corporate cash as of December 31, 2009 and 2008 are as follows (dollars in millions):
| December 31, | Variance | |||||||||
| 2009 | 2008 | 2009 vs. 2008 | ||||||||
| Parent company cash |
$ | 388.7 | $ | 216.6 | $ | 172.1 | ||||
| Other cash(1) |
4.5 | 218.3 | (213.8 | ) | ||||||
| Total corporate cash |
$ | 393.2 | $ | 434.9 | $ | (41.7 | ) | |||
| (1) | Other cash consists of corporate subsidiaries that can distribute cash to the parent company without any regulatory approval. |
Consolidated Cash and Equivalents
The consolidated cash and equivalents balance increased by $0.4 billion to $3.5 billion for the year ended December 31, 2009. The majority of this balance is cash held in regulated subsidiaries, primarily the Bank, outlined as follows (dollars in millions):
| December 31, | Variance | |||||||||||
| 2009 | 2008 | 2009 vs. 2008 | ||||||||||
| Corporate cash |
$ | 393.2 | $ | 434.9 | $ | (41.7 | ) | |||||
| Bank cash(1) |
2,863.2 | 3,276.5 | (413.3 | ) | ||||||||
| International brokerage and other cash |
275.8 | 288.7 | (12.9 | ) | ||||||||
| Less: |
||||||||||||
| Cash reported in other assets(2) |
(49.0 | ) | (146.3 | ) | 97.3 | |||||||
| Total consolidated cash |
$ | 3,483.2 | $ | 3,853.8 | $ | (370.6 | ) | |||||
| (1) | During the second quarter of 2009, E*TRADE Securities LLC became a wholly-owned operating subsidiary of E*TRADE Bank. As a result, $167.1 million and $56.4 million in cash held at E*TRADE Securities LLC is included in Bank cash at December 31, 2009 and 2008, respectively. |
| (2) | Cash reported in other assets consists of cash that we invested in The Reserve Funds’ Primary Fund and is included as a receivable in the other assets line item. |
The cash held in our regulated subsidiaries serves as a source of liquidity for those subsidiaries and is not a primary source of capital for the parent company.
Cash and Equivalents Held in the Reserve Fund
At December 31, 2009, we held cash in The Reserve Funds’ Primary Fund (“the Fund”) of $49.0 million, which is included as a receivable in the other assets line item on the balance sheet. On September 16, 2008, the Fund reported that its shares had fallen below the standard of $1 per share, which is commonly referred to as “breaking the buck.” The following table details our cash held in the Fund at the date the Fund was reported as “breaking the buck” and at December 31, 2009 (dollars in millions):
| Variance | ||||||||||
| December 31, 2009 |
September 15, 2008 |
December 31, 2009 vs. September 15, 2008 |
||||||||
| Corporate cash |
$ | 15.2 | $ | 230.3 | $ | (215.1 | ) | |||
| Bank cash(1) |
32.2 | 489.7 | (457.5 | ) | ||||||
| International brokerage and other cash |
1.6 | 24.3 | (22.7 | ) | ||||||
| Total cash held in the Fund |
$ | 49.0 | $ | 744.3 | $ | (695.3 | ) | |||
| (1) | During the second quarter of 2009, E*TRADE Securities LLC became a wholly-owned operating subsidiary of E*TRADE Bank. As a result, $4.6 million and $69.3 million in cash related to E*TRADE Securities LLC is included in Bank cash at December 31, 2009 and September 15, 2008, respectively. |
57
Table of Contents
On February 26, 2009, The Reserve announced that it had adopted a Plan of Liquidation for the orderly liquidation of the assets of the Fund. Under the terms of the plan, which is subject to the supervision of the SEC, The Reserve will continue to make interim distributions up to $0.9172 per share. The Reserve indicated in this announcement that it was taking this approach in order to provide liquidity to investors without prejudicing the legal right and remedies of any shareholder’s claims. As of December 31, 2009, we had received a total of $684.1 million in cash distributions made by the Fund. In the fourth quarter of 2008, we recorded an impairment charge of $11.2 million, which represented our estimate of the amount we would lose in a pro-rata distribution.
On January 29, 2010, we received a final distribution from The Reserve Fund for $49.8 million. This distribution will result in a gain of $0.8 million in the first quarter of 2010 as the pro-rata final distribution was greater than what we originally estimated we would receive.
Liquidity Available from Subsidiaries
Liquidity available to the Company from its subsidiaries, other than Converging Arrows, Inc., is limited by regulatory requirements. In addition, E*TRADE Bank may not pay dividends to the parent company without approval from the OTS and any loans by E*TRADE Bank to the parent company and its other non-bank subsidiaries are subject to various quantitative, arm’s length, collateralization and other requirements.
We maintain capital in excess of regulatory minimums at our regulated subsidiaries, the most significant of which is E*TRADE Bank. As of December 31, 2009, we held $899.1 million of risk-based total capital at E*TRADE Bank in excess of the regulatory minimum level required to be considered “well capitalized.” In the current credit environment, we plan to maintain excess risk-based total capital at E*TRADE Bank in order to enhance our ability to absorb credit losses while still maintaining “well capitalized” status. However, events beyond management’s control, such as a continued deterioration in residential real estate and credit markets, could adversely affect future earnings and E*TRADE Bank’s ability to meet its future capital requirements.
The Company’s broker-dealer subsidiaries are subject to capital requirements determined by their respective regulators. At December 31, 2009 and 2008, all of our brokerage subsidiaries met their minimum net capital requirements. Our broker-dealer subsidiaries had excess net capital of $558.3 million(1) at December 31, 2009, a decline of $159.3 million from December 31, 2008. This decline was due to dividends paid by broker-dealer subsidiaries during the year ended December 31, 2009. While we cannot assure that we would obtain regulatory approval again in the future to withdraw any of this excess net capital, $432.4 million is available for dividend while still maintaining a capital level above regulatory “early warning” guidelines.
Other Sources of Liquidity
We also maintain $375 million in uncommitted financing to meet margin lending needs. At December 31, 2009, there were no outstanding balances and the full $375 million was available.
We rely on borrowed funds, such as FHLB advances and securities sold under agreements to repurchase, to provide liquidity for the Bank. Our ability to borrow these funds is dependent upon the continued availability of funding in the wholesale borrowings market. At December 31, 2009, the Bank had approximately $5.2 billion in additional collateralized borrowing capacity with the FHLB. We will also have the ability to generate liquidity in the form of additional deposits by raising the yield on our customer deposit accounts.
We have the option to make the interest payments on our 12 1/2% Notes in the form of either cash or additional 12 1/2% Notes through May 2010. During the second quarter of 2008, we elected to make our first interest payment of approximately $121 million in cash. During 2008 and 2009, we elected to make our second,
| (1) | The excess net capital of the broker-dealer subsidiaries at December 31, 2009 included $398.7 million and $92.3 million of excess net capital at E*TRADE Clearing LLC and E*TRADE Securities LLC, respectively, which are subsidiaries of E*TRADE Bank and are also included in the excess risk-based capital of E*TRADE Bank. |
58
Table of Contents
third and fourth interest payments of $121 million, $129 million and $55 million, respectively, in the form of additional 12 1/2% Notes. Based on the balance of the 12 1/2% Notes as of December 31, 2009, the interest payments are approximately $116 million per annum. The May 2010 interest payment is the last payment in which we have the option to pay in the form of either cash or additional 12 1/2% Notes. We will determine whether to make this interest payment in the form of cash or additional 12 1/2% Notes based on the facts and circumstances at that time. We are required to pay the November 2010 payment and all remaining interest payments in cash.
Corporate Debt
Our current senior debt ratings are B3 by Moody’s Investor Service, CCC by Standard & Poor’s and B (high) by Dominion Bond Rating Service (“DBRS”). The Company’s long-term deposit ratings are Ba3 by Moody’s Investor Service, B- by Standard & Poor’s and BB by DBRS. A significant change in these ratings may impact the rate and availability of future borrowings.
Off-Balance Sheet Arrangements
We enter into various off-balance-sheet arrangements in the ordinary course of business, primarily to meet the needs of our customers and to reduce our own exposure to interest rate risk. These arrangements include firm commitments to extend credit and letters of credit. Additionally, we enter into guarantees and other similar arrangements as part of transactions in the ordinary course of business. For additional information on each of these arrangements, see Note 22—Commitments, Contingencies and Other Regulatory Matters of Item 8. Financial Statements and Supplementary Data.
Contractual Obligations and Commitments
The following summarizes our contractual obligations at December 31, 2009 and the effect such obligations are expected to have on our liquidity and cash flow in future periods (dollars in millions):
| Payments Due by Period | |||||||||||||||
| Less Than 1 Year | 1-3 Years | 3-5 years | Thereafter | Total | |||||||||||
| Securities sold under agreements to repurchase(1) |
$ | 3,800.2 | $ | 1,564.6 | $ | 391.2 | $ | 962.4 | $ | 6,718.4 | |||||
| Corporate debt(2) |
166.3 | 335.8 | 707.2 | 2,551.1 | 3,760.4 | ||||||||||
| Other borrowings(1)(3) |
950.4 | 172.7 | 489.9 | 1,900.4 | 3,513.4 | ||||||||||
| Certificates of deposit and brokered certificate of deposit(1)(4) |
849.6 | 446.8 | 44.6 | 62.1 | 1,403.1 | ||||||||||
| Operating lease payments(5) |
27.1 | 42.6 | 24.7 | 51.3 | 145.7 | ||||||||||
| Purchase obligations(6) |
55.2 | 36.1 | 3.1 | 0.6 | 95.0 | ||||||||||
| Uncertain tax positions |
5.6 | 5.9 | 5.7 | 49.4 | 66.6 | ||||||||||
| Total contractual obligations |
$ | 5,854.4 | $ | 2,604.5 | $ | 1,666.4 | $ | 5,577.3 | $ | 15,702.6 | |||||
| (1) | Includes annual interest based on the contractual features of each transaction, using market rates at December 31, 2009. Interest rates are assumed to remain at current levels over the life of all adjustable rate instruments. |
| (2) | Includes annual interest payments. Does not assume conversion for the non-interest bearing convertible debentures due 2019. |
| (3) | For subordinated debentures included in other borrowings, does not assume early redemption under current conversion provisions. |
| (4) | Does not include sweep deposit accounts, complete savings accounts, other money market and savings accounts or checking accounts as there are no maturities and /or scheduled contractual payments. |
| (5) | Includes facilities restructuring leases and is net of estimated future sublease income. |
| (6) | Includes purchase obligations for goods and services covered by non-cancelable contracts and contracts including cancellation fees. Excluded from the table are purchase obligations expected to be settled in cash within one year of the end of the reporting period. |
As of December 31, 2009, the Company had $0.9 billion of unused lines of credit available to customers under home equity lines of credit and $0.4 billion of unused credit card and commercial lines. As of December 31, 2009, the Company had no commitments to purchase loans. The Company had a commitment to
59
Table of Contents
originate and sell loans of $34.2 million and $7.9 million, respectively. The Company had a commitment to purchase securities of $25.0 million and no commitments to sell securities. The Company also had $9.1 million in commitments to fund low income housing tax credit partnerships and other limited partnerships as of December 31, 2009. Additional information related to commitments and contingent liabilities is detailed in Note 22—Commitments, Contingencies and Other Regulatory Matters of Item 8. Financial Statements and Supplementary Data.
Other Liquidity Matters
We currently anticipate that our available cash resources and credit will be sufficient to meet our anticipated working capital and capital expenditure requirements for at least the next 12 months. We may need to raise additional funds in order to support regulatory capital needs at our Bank, reduce holding company debt, support more rapid expansion, develop new or enhanced products and services, respond to competitive pressures, acquire businesses or technologies or take advantage of unanticipated opportunities.
As a financial services company, we are exposed to risks in every component of our business. The identification and management of existing and potential risks are the keys to effective risk management. Our risk management framework, principles and practices support decision-making, improve the success rate for new initiatives and strengthen the organization. Our goal is to balance risks and rewards through effective risk management. Risks cannot be completely eliminated; however, we do believe risks can be identified and managed within the Company’s risk tolerance.
Our businesses expose us to the following four major categories of risk that often overlap:
| • | Credit Risk—Credit risk is the risk of loss resulting from adverse changes in the ability or willingness of a borrower or counterparty to meet the agreed-upon terms of their financial obligations. |
| • | Liquidity Risk—Liquidity risk is the risk of loss resulting from the inability to meet current and future cash flow and collateral needs. |
| • | Interest Rate Risk—Interest rate risk is the risk of loss from adverse changes in interest rates, which could cause fluctuations in our long-term earnings or in the value of the Company’s net assets. |
| • | Operational Risk—Operational risk is the risk of loss resulting from fraud, inadequate controls or the failure of the internal controls process, third party vendor issues, processing issues and external events. |
We also are subject to other risks that could impact our business, financial condition, results of operations or cash flows in future periods. See Part I—Item 1A—Risk Factors.
We manage risk through a governance structure involving the various boards, senior management and several risk committees. We use management level risk committees to help ensure that business decisions are executed within our desired risk profile. A variety of methodologies and measures are used to monitor, quantify, assess and forecast risk. Measurement criteria, methodologies and calculations are reviewed periodically to assure that risks are represented appropriately. Risks are managed and controlled under policies and related limits that are approved by the Board of Directors and delegated to senior management.
The Finance and Risk Oversight Committee, which was established in the second quarter of 2008 and consists of members of the Board of Directors, monitors the risk process and significant risks throughout the Company. In addition to this committee, various enterprise risk committees and departments throughout the Company aid in the identification and management of risks, including:
| • | Asset Liability Committee—The Asset Liability Committee (“ALCO”) has primary responsibility for managing liquidity risk and interest rate risk and reviews balance sheet trends, market interest rate and sensitivity analyses. |
60
Table of Contents
| • | Credit Risk Committee—The Credit Risk Committee monitors asset quality trends, evaluates market conditions, determines the adequacy for allowance of loan losses, establishes underwriting standards, approves large credit exposures, approves large portfolio purchases and delegates credit approval authority. |
We use various departments throughout the Company to aid in the identification and management of risks. These departments include internal audit, compliance, finance, legal, treasury, credit and enterprise risk management. Risk reporting occurs at the business or operating units and is aggregated across the Company through the enterprise risk management process.
Credit Risk Management
Our primary sources of credit risk are our loan and securities portfolios, where risk results from extending credit to customers and purchasing securities, respectively. The degree of credit risk associated with our loans and securities varies based on many factors including the size of the transaction, the credit characteristics of the borrower, features of the loan product or security, the contractual terms of the related documents and the availability and quality of collateral. Credit risk is one of the most common risks in financial services and is one of our most significant risks.
Credit risk is monitored by our Credit Risk Committee. The Credit Risk Committee uses detailed tracking and analysis to measure credit performance and reviews and modifies credit policies as appropriate.
Loss Mitigation
Given the deterioration in the performance of our loan portfolio, particularly in our home equity loan portfolio, we formed a special credit management team in early 2008 to focus on the mitigation of potential losses in the loan portfolio.
This team’s initial focus was to reduce our exposure to open home equity lines. Through a variety of strategies, including voluntary line closures, automatically freezing lines on all delinquent accounts, and freezing lines on loans with materially reduced home equity, we have reduced this amount from a high of over $7 billion in 2007 to $0.9 billion as of December 31, 2009.
We initiated a loan modification program in 2008 that in its early stages, resulted in an insignificant number of minor modifications. This loan modification program became more active during the first half of 2009 and is now the primary focus of the special credit management team. We consider modifications in which we made an economic concession to a borrower experiencing financial difficulty a troubled debt restructuring (“TDR”). As of December 31, 2009, we had modified $578.9 million of loans in which the modification was considered a TDR. We also modified a number of loans through traditional collections actions taken in the normal course of servicing delinquent accounts. These actions typically result in an insignificant delay in the timing of payments; therefore, the Company does not consider such activities to be economic concessions to the borrowers. On February 18, 2009, the U.S. Department of the Treasury announced the Homeowner Affordability and Stability Plan. The primary focus of this plan is to create requirements and provide incentives to modify mortgages with the goal of avoiding foreclosure. We believe our loan modification program goals are in line with the Homeowner Affordability and Stability Plan and we have aligned our servicer guidelines with the government’s program. Our loan modification programs target borrowers who demonstrate a willingness and ability to meet their loan obligations and stay in their homes. To date our programs have focused on modifications to the rate and term of loans, which often results in a lower monthly payment for the borrower.
The team has several other initiatives either in progress or in development which are focused on mitigating losses in our loan portfolio. Those initiatives include improving collection efforts and practices of our servicers as well as increasing our loss recovery efforts to minimize the level of loss on a loan that goes to charge-off.
61
Table of Contents
In addition, we continue to review our mortgage loan portfolio in order to identify loans to be repurchased by the originator. Our review is primarily focused on identifying loans with violations of transaction representations and warranties or material misrepresentation on the part of the seller. Any loans identified with these deficiencies are submitted to the original seller for repurchase. Approximately $74.4 million and $105.6 million of loans were repurchased by the original sellers for the years ended December 31, 2009 and 2008, respectively.
Underwriting Standards—Originated Loans
During 2008, we exited our retail mortgage origination business, which represented our last remaining loan origination channel. Prior to the exit of our retail mortgage origination business, we originated approximately $158 million in one- to four-family loans during the six months ended June 30, 2008. These loans were predominantly prime credit quality first-lien mortgage loans secured by a single-family residence. In the first quarter of 2009, we partnered with a third party company to provide access to real estate loans for our customers. This product is being offered as a convenience to our customers and is not one of our primary product offerings. We structured this arrangement to minimize our assumption of any of the typical risks commonly associated with mortgage lending. The third party company providing this product performs all processing and underwriting of these loans. Shortly after closing, the third party company purchases the loans from us and is responsible for the credit risk associated with these loans. We originated $125.7 million in loans during the year ended December 31, 2009 and we had commitments to originate mortgage loans of $34.2 million at December 31, 2009.
Liquidity Risk Management
Liquidity risk is monitored and managed primarily by the ALCO. We have in place a comprehensive set of liquidity and funding policies that are intended to maintain our flexibility to address liquidity events specific to us or the market in general. See Item 7 Management’s Discussion and Analysis of Financial Condition and Results of Operations—Liquidity and Capital Resources for additional information.
Interest Rate Risk Management
Interest rate risks are monitored and managed by the ALCO. The analysis of interest sensitivity to changes in market interest rates under various scenarios is reviewed by ALCO. The scenarios assume both parallel and non-parallel shifts in the yield curve. See Item 7A. Quantitative and Qualitative Disclosures about Market Risk for additional information about our interest rate risks.
Operational Risk Management
Operational risks exist in most areas of the Company from clearing to customer service. While we make every effort to protect against failures in the internal controls system, no system is completely fail proof.
Loss of company and customer assets due to fraud represents one of our most significant operational risks. Fraud losses typically result from unauthorized use of customer and corporate funds and resources. We monitor customer transactions and use scoring tools which prevent a significant number of fraudulent transactions on a daily basis. However, new techniques and strategies are constantly being developed by perpetrators to commit fraud. In order to minimize this threat, we offer our customers various security measures, including a token based multi-factor verification system. This token creates a unique password which changes every sixty seconds and must be used along with the customer’s self-selected password to access their account. We believe this system is an extremely effective tool for preventing unauthorized access to a customer’s account.
The failure of a third party vendor to adequately meet its responsibilities could result in financial loss and impact our reputation. The Vendor Management group monitors our vendor relationships and arrangements. The vendor risk identification process includes reviews of contracts, financial soundness of providers, information security and business continuity.
62
Table of Contents
Processing issues and external events may result in opportunity loss depending on the situation. These types of losses include issues resulting from human error, equipment failures, significant weather events or other related types of events. External events resulting in actual losses could be due to Internet performance issues, litigation, change in public policy and our reputation.
Loans
We track and review many factors to predict and monitor credit risk in our loan portfolio, which is primarily made up of loans secured by residential real estate. These factors, which are documented at the time of origination, include: borrowers’ debt-to-income ratio, borrowers’ credit scores, housing prices, documentation type, occupancy type, and loan type. We also review estimated current loan-to-value (“LTV”) ratios when monitoring credit risk in our loan portfolios. In economic conditions in which housing prices generally appreciate, we believe that loan type, LTV ratios and credit scores are the key factors in determining future loan performance. In the current housing market with declining home prices and less credit available for refinance, we believe the LTV ratio becomes a more important factor in predicting and monitoring credit risk.
We believe certain categories of loans inherently have a higher level of credit risk due to characteristics of the borrower and/or features of the loan. Two of these categories are sub-prime and option adjustable rate mortgages (“ARM”) loans. As a general matter, we did not originate or purchase these loans to hold on our balance sheet; however, in the normal course of purchasing large pools of real estate loans, we invariably ended up acquiring a de minimis amount of sub-prime loans. As of December 31, 2009, sub-prime real estate loans represented less than one-fifth of one percent of our total real estate loan portfolio and we held no option ARM loans.
As noted above, we believe loan type, LTV ratios and borrowers’ credit scores are key determinants of future loan performance. Our home equity loan portfolio is primarily second lien loans(1) on residential real estate properties, which have a higher level of credit risk than first lien mortgage loans. We believe home equity loans with a combined loan-to-value (“CLTV”) of 90% or higher or a Fair Isaac Credit Organization (“FICO”) score below 700 are the loans with the highest levels of credit risk in our portfolios.
| (1) | Approximately 13% of the home equity portfolio is in the first lien position. For home equity loans that are in a second lien position, we also hold the first lien position on the same residential real estate property for less than 1% of the loans in this portfolio. |
63
Table of Contents
The breakdown by current LTV/CLTV and FICO score of our two main loan portfolios, one-to four-family and home equity, are as follows (dollars in millions):
| One- to Four-Family |
Home Equity | |||||||||||||||
| Current LTV/CLTV(1) |
December 31, 2009 |
December 31, 2008 |
December 31, 2009 |
December 31, 2008 |
||||||||||||
| <=70% |
$ | 2,095.3 | $ | 3,004.9 | $ | 1,379.6 | $ | 1,981.9 | ||||||||
| 70% – 80% |
1,148.2 | 1,662.4 | 507.6 | 749.0 | ||||||||||||
| 80% – 90% |
1,464.2 | 1,999.8 | 705.6 | 1,000.7 | ||||||||||||
| 90% – 100% |
1,500.9 | 1,891.2 | 885.9 | 1,291.9 | ||||||||||||
| >100% |
4,358.5 | 4,421.5 | 4,291.0 | 4,993.7 | ||||||||||||
| Total real estate loans |
$ | 10,567.1 | $ | 12,979.8 | $ | 7,769.7 | $ | 10,017.2 | ||||||||
| Average estimated current LTV/CLTV(2) |
97.3 | % | 90.1 | % | 106.0 | % | 99.7 | % | ||||||||
| Average LTV/CLTV at loan origination(3) |
70.1 | % | 68.8 | % | 79.5 | % | 79.1 | % | ||||||||
| (1) | Current CLTV calculations for home equity are based on drawn balances. Current property values are updated on a quarterly basis using the most recent property value data available to us. For properties in which we did not have an updated valuation, we utilized home price indices to estimate the current property value. |
| (2) | The average estimated current LTV ratio reflects the outstanding balance at the balance sheet date, divided by the estimated current property value. |
| (3) | Average LTV/CLTV at loan origination calculations are based on LTV/CLTV at time of purchase for one- to four-family purchased loans and undrawn balances for home equity loans. |
| One- to Four-Family |
Home Equity | |||||||||||
| Current FICO(1) |
December 31, 2009 |
December 31, 2008 |
December 31, 2009 |
December 31, 2008 | ||||||||
| >=720 |
$ | 6,313.2 | $ | 8,458.0 | $ | 4,154.4 | $ | 5,539.9 | ||||
| 719 – 700 |
870.1 | 1,072.9 | 782.6 | 1,029.0 | ||||||||
| 699 – 680 |
698.0 | 871.2 | 622.9 | 866.6 | ||||||||
| 679 – 660 |
492.8 | 645.7 | 472.6 | 647.7 | ||||||||
| 659 – 620 |
647.9 | 717.2 | 584.8 | 770.1 | ||||||||
| <620 |
1,545.1 | 1,214.8 | 1,152.4 | 1,163.9 | ||||||||
| Total real estate loans |
$ | 10,567.1 | $ | 12,979.8 | $ | 7,769.7 | $ | 10,017.2 | ||||
| (1) | FICO scores are updated on a quarterly basis; however, as of December 31, 2009, there were some loans for which the updated FICO scores were not available. The current FICO distribution as of December 31, 2009 included original FICO scores for approximately $365 million and $847 million of one- to four-family and home equity loans, respectively. |
In addition to the factors described above, we monitor credit trends in loans by acquisition channel, vintage and geographic location, which are summarized below as of December 31, 2009 and 2008 (dollars in millions):
| One- to Four-Family |
Home Equity | |||||||||||
| Acquisition Channel |
December 31, 2009 |
December 31, 2008 |
December 31, 2009 |
December 31, 2008 | ||||||||
| Purchased from a third party |
$ | 8,660.2 | $ | 10,646.3 | $ | 6,803.9 | $ | 8,873.2 | ||||
| Originated by the Company |
1,906.9 | 2,333.5 | 965.8 | 1,144.0 | ||||||||
| Total real estate loans |
$ | 10,567.1 | $ | 12,979.8 | $ | 7,769.7 | $ | 10,017.2 | ||||
64
Table of Contents
| One- to Four-Family |
Home Equity | |||||||||||
| Vintage Year |
December 31, 2009 |
December 31, 2008 |
December 31, 2009 |
December 31, 2008 | ||||||||
| 2003 and prior |
$ | 438.4 | $ | 577.4 | $ | 550.1 | $ | 754.1 | ||||
| 2004 |
1,034.9 | 1,310.0 | 715.4 | 990.1 | ||||||||
| 2005 |
2,219.1 | 2,695.7 | 1,898.5 | 2,426.0 | ||||||||
| 2006 |
3,944.2 | 4,890.4 | 3,626.4 | 4,668.7 | ||||||||
| 2007 |
2,904.2 | 3,475.6 | 963.8 | 1,161.7 | ||||||||
| 2008 |
26.3 | 30.7 | 15.5 | 16.6 | ||||||||
| Total real estate loans |
$ | 10,567.1 | $ | 12,979.8 | $ | 7,769.7 | $ | 10,017.2 | ||||
| One- to Four-Family |
Home Equity | |||||||||||
| Geographic Location |
December 31, 2009 |
December 31, 2008 |
December 31, 2009 |
December 31, 2008 | ||||||||
| California |
$ | 4,829.6 | $ | 5,853.5 | $ | 2,472.8 | $ | 3,056.8 | ||||
| New York |
800.9 | 966.0 | 533.8 | 628.9 | ||||||||
| Florida |
717.8 | 859.8 | 561.9 | 725.8 | ||||||||
| Virginia |
438.6 | 541.0 | 327.9 | 397.7 | ||||||||
| Other states |
3,780.2 | 4,759.5 | 3,873.3 | 5,208.0 | ||||||||
| Total real estate loans |
$ | 10,567.1 | $ | 12,979.8 | $ | 7,769.7 | $ | 10,017.2 | ||||
Approximately 40% and 39% of the Company’s real estate loans were concentrated in California at December 31, 2009 and 2008, respectively. No other state had concentrations of real estate loans that represented 10% or more of the Company’s real estate portfolio.
Allowance for Loan Losses
The allowance for loan losses is management’s estimate of credit losses inherent in our loan portfolio as of the balance sheet date. The estimate of the allowance for loan losses is based on a variety of quantitative and qualitative factors, including the composition and quality of the portfolio; delinquency levels and trends; current and historical charge-off and loss experience; current industry charge-off and loss experience; the condition of the real estate market and geographic concentrations within the loan portfolio; the interest rate climate; the overall availability of housing credit; and general economic conditions. The allowance for loan losses is typically equal to management’s estimate of loan charge-offs in the twelve months following the balance sheet date as well as the estimated charge-offs, including economic concessions to borrowers, over the estimated remaining life of loans modified in TDRs. Determining the adequacy of the allowance is complex and requires judgment by management about the effect of matters that are inherently uncertain. Subsequent evaluations of the loan portfolio, in light of the factors then prevailing, may result in significant changes in the allowance for loan losses in future periods. We believe our allowance for loan losses at December 31, 2009 is representative of probable losses inherent in the loan portfolio at the balance sheet date.
The general allowance for loan losses also included a specific qualitative component to account for environmental factors that we believe will impact our level of credit losses. This qualitative component, which was applied by loan type, reflects our estimate of credit losses inherent in the loan portfolio due to environmental factors which are not directly considered in our quantitative loss model but are factors we believe will have an impact on credit losses (e.g. the current level of unemployment).
In determining the allowance for loan losses, we allocate a portion of the allowance to various loan products based on an analysis of individual loans and pools of loans. However, the entire allowance is available to absorb credit losses inherent in the total loan portfolio as of the balance sheet date.
65
Table of Contents
The following table presents the allowance for loan losses by major loan category (dollars in millions):
| One- to Four-Family | Home Equity | Consumer and Other | Total | |||||||||||||||||||||
| Allowance | Allowance as a % of Loans Receivable(1) |
Allowance | Allowance as a % of Loans Receivable(1) |
Allowance | Allowance as a % of Loans Receivable(1) |
Allowance | Allowance as a % of Loans Receivable(1) |
|||||||||||||||||
| December 31, 2009 |
$ | 489.9 | 4.62 | % | $ | 620.0 | 7.87 | % | $ | 72.8 | 3.90 | % | $ | 1,182.7 | 5.81 | % | ||||||||
| December 31, 2008 |
$ | 185.2 | 1.42 | % | $ | 833.8 | 8.19 | % | $ | 61.6 | 2.65 | % | $ | 1,080.6 | 4.23 | % | ||||||||
| (1) | Allowance as a percentage of loans receivable is calculated based on the gross loans receivable for each respective category. |
During the year ended December 31, 2009, the allowance for loan losses increased by $102.1 million from the level at December 31, 2008. This increase was driven primarily by the increase in the allowance allocated to the one- to four-family loan portfolio, which began to deteriorate during 2008. However, the majority of the allowance as of December 31, 2009 related to the home equity portfolio, which began to deteriorate during the second half of 2007. We believe the deterioration in both of these portfolios was caused by several factors, including: home price depreciation in key markets; growing inventories of unsold homes; rising foreclosure rates; significant contraction in the availability of credit; and a general decline in economic growth. In addition, the combined impact of home price depreciation and the reduction of available credit made it increasingly difficult for borrowers to refinance existing loans. Although we expect these factors will cause the provision for loan losses to continue at elevated levels in future periods, the level of provision for loan losses has declined for five consecutive quarters. While we cannot state with certainty that this trend will continue, we believe it is a positive indicator that our loan portfolio has continued to stabilize.
Included in our allowance for loan losses at December 31, 2009 was a specific allowance of $193.6 million that was established for TDRs. The specific allowance for these individually impaired loans represents the expected loss, including the economic concession to the borrower, over the remaining life of the loan. The following table shows the TDRs and specific valuation allowance by loan portfolio (dollars in millions):
| Recorded Investment in TDRs |
Specific Valuation Allowance |
Specific Valuation Allowance as a % of TDR Loans |
|||||||
| December 31, 2009 | |||||||||
| One- to four-family |
$ | 207.6 | $ | 26.9 | 13 | % | |||
| Home equity |
371.3 | 166.7 | 45 | % | |||||
| Total(1) |
$ | 578.9 | $ | 193.6 | 33 | % | |||
| (1) | The recorded investment in TDRs represents the balance of TDRs, net of charge-offs, at December 31, 2009. |
The recorded investment in TDRs includes the charge-offs related to certain loans that were written down to the estimated current property value less costs to sell. These charge-offs were recorded primarily on loans that were delinquent in excess of 180 days prior to the loan modification. The total expected loss on TDRs, which includes both previously recorded charge-offs and the specific valuation allowance, as a percentage of TDRs, was 21% and 48% for our one- to four-family and home equity loan portfolios, respectively, as of December 31, 2009.
The following table shows the TDRs by delinquency category (dollars in millions):
| TDRs Current |
TDRs 30-89 Days Delinquent |
TDRs 90+ Days Delinquent |
Total Recorded Investment in TDRs | |||||||||
| December 31, 2009 | ||||||||||||
| One- to four-family |
$ | 128.5 | $ | 34.6 | $ | 44.5 | $ | 207.6 | ||||
| Home equity |
304.1 | 41.5 | 25.7 | 371.3 | ||||||||
| Total |
$ | 432.6 | $ | 76.1 | $ | 70.2 | $ | 578.9 | ||||
66
Table of Contents
The following table provides an analysis of the allowance for loan losses and net charge-offs for the past five years (dollars in millions):
| Year Ended December 31, | ||||||||||||||||||||
| 2009 | 2008 | 2007 | 2006 | 2005 | ||||||||||||||||
| Allowance for loan losses, beginning of period |
$ | 1,080.6 | $ | 508.2 | $ | 67.6 | $ | 63.3 | $ | 47.7 | ||||||||||
| Provision for loan losses |
1,498.1 | 1,583.7 | 640.1 | 45.0 | 54.0 | |||||||||||||||
| Charge-offs: |
||||||||||||||||||||
| One- to four-family |
(364.3 | ) | (138.0 | ) | (5.7 | ) | (0.6 | ) | (0.9 | ) | ||||||||||
| Home equity |
(966.3 | ) | (820.2 | ) | (168.1 | ) | (15.4 | ) | (3.9 | ) | ||||||||||
| Consumer and other |
(111.6 | ) | (84.8 | ) | (53.9 | ) | (45.9 | ) | (52.0 | ) | ||||||||||
| Total charge-offs |
(1,442.2 | ) | (1,043.0 | ) | (227.7 | ) | (61.9 | ) | (56.8 | ) | ||||||||||
| Recoveries: |
||||||||||||||||||||
| One- to four-family |
— | 0.4 | 0.5 | 0.2 | 0.2 | |||||||||||||||
| Home equity |
15.3 | 8.2 | 4.4 | 0.8 | 0.5 | |||||||||||||||
| Consumer and other |
30.9 | 23.1 | 23.3 | 20.2 | 17.7 | |||||||||||||||
| Total recoveries |
46.2 | 31.7 | 28.2 | 21.2 | 18.4 | |||||||||||||||
| Net charge-offs |
(1,396.0 | ) | (1,011.3 | ) | (199.5 | ) | (40.7 | ) | (38.4 | ) | ||||||||||
| Allowance for loan losses, end of period |
$ | 1,182.7 | $ | 1,080.6 | $ | 508.2 | $ | 67.6 | $ | 63.3 | ||||||||||
| Net charge-offs to average loans receivable outstanding |
6.04 | % | 3.64 | % | 0.65 | % | 0.18 | % | 0.26 | % | ||||||||||
The following table allocates the allowance for loan losses by loan category (dollars in millions):
| December 31, | |||||||||||||||||||||||||||||
| 2009 | 2008 | 2007 | 2006 | 2005 | |||||||||||||||||||||||||
| Amount | %(1) | Amount | %(1) | Amount | %(1) | Amount | %(1) | Amount | %(1) | ||||||||||||||||||||
| One- to four- family |
$ | 489.9 | 52.4 | % | $ | 185.2 | 51.3 | % | $ | 18.8 | 51.3 | % | $ | 7.7 | 41.7 | % | 4.9 | 37.0 | % | ||||||||||
| Home equity |
620.0 | 38.5 | 833.8 | 39.6 | 459.2 | 39.4 | 31.7 | 45.3 | 26.0 | 42.3 | |||||||||||||||||||
| Consumer and other |
72.8 | 9.1 | 61.6 | 9.1 | 30.2 | 9.3 | 28.2 | 13.0 | 32.4 | 20.7 | |||||||||||||||||||
| Total allowance for loan losses |
$ | 1,182.7 | 100.0 | % | $ | 1,080.6 | 100.0 | % | $ | 508.2 | 100.0 | % | $ | 67.6 | 100.0 | % | 63.3 | 100.0 | % | ||||||||||
| (1) | Represents percentage of loans receivable in category to total loans receivable, excluding premium (discount). |
Loan losses are recognized when it is probable that a loss will be incurred. Our policy for both one- to four-family and home equity loans is to assess the value of the property when the loan has been delinquent for 180 days or is in bankruptcy, regardless of whether or not the property is in foreclosure, and charge-off the amount of the loan balance in excess of the estimated current property value less costs to sell. Our policy is to charge-off credit cards when collection is not probable or the loan has been delinquent for 180 days and to charge-off closed-end consumer loans when the loan is 120 days delinquent or when we determine that collection is not probable.
67
Table of Contents
Net charge-offs for the year ended December 31, 2009 compared to 2008 increased by $384.7 million. The overall increase was primarily due to higher net charge-offs on our one- to four-family loans and home equity loans, which were driven mainly by the same factors as described above. We believe net charge-offs will decline in future periods when compared to the level of charge-offs in the three months ended December 31, 2009 as a result of our decline in special mention delinquencies, which is discussed below. The following graph illustrates the net charge-offs by quarter:
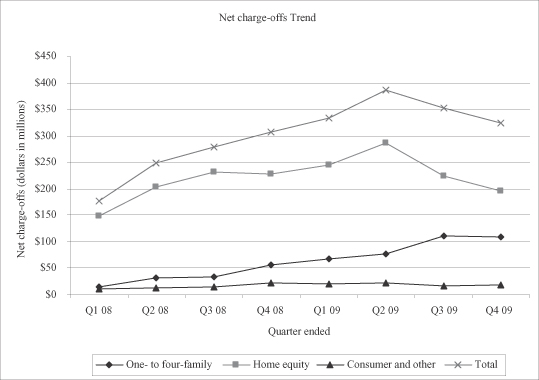
68
Table of Contents
Nonperforming Assets
We classify loans as nonperforming when they are 90 days past due. The following table shows the comparative data for nonperforming loans and assets (dollars in millions):
| Year Ended December 31, | ||||||||||||||||||||
| 2009 | 2008 | 2007 | 2006 | 2005 | ||||||||||||||||
| One- to four-family |
$ | 1,229.7 | $ | 593.1 | $ | 181.3 | $ | 33.6 | $ | 17.4 | ||||||||||
| Home equity |
250.6 | 341.2 | 229.5 | 32.2 | 9.6 | |||||||||||||||
| Consumer and other |
6.7 | 7.8 | 7.6 | 8.9 | 7.0 | |||||||||||||||
| Total nonperforming loans |
1,487.0 | 942.1 | 418.4 | 74.7 | 34.0 | |||||||||||||||
| Real estate owned (“REO”) and other repossessed assets, net |
115.7 | 108.1 | 45.9 | 12.9 | 6.5 | |||||||||||||||
| Total nonperforming assets, net |
$ | 1,602.7 | $ | 1,050.2 | $ | 464.3 | $ | 87.6 | $ | 40.5 | ||||||||||
| Nonperforming loans receivable as a percentage of gross loans receivable |
7.31 | % | 3.69 | % | 1.37 | % | 0.28 | % | 0.17 | % | ||||||||||
| One- to four-family allowance for loan losses as a percentage of one- to four-family nonperforming loans receivable |
39.84 | % | 31.22 | % | 10.39 | % | 23.10 | % | 27.93 | % | ||||||||||
| Home equity allowance for loan losses as a percentage of home equity nonperforming loans receivable |
247.46 | % | 244.34 | % | 200.05 | % | 98.31 | % | 272.25 | % | ||||||||||
| Consumer and other allowance for loan losses as a percentage of consumer and other nonperforming loans receivable |
1082.29 | % | 790.72 | % | 396.71 | % | 316.61 | % | 461.31 | % | ||||||||||
| Total allowance for loan losses as a percentage of total nonperforming loans receivable |
79.54 | % | 114.70 | % | 121.44 | % | 90.52 | % | 186.24 | % | ||||||||||
During the year ended December 31, 2009, our nonperforming assets, net increased $552.5 million to $1.6 billion when compared to December 31, 2008. The increase was attributed primarily to a $522.7 million increase in our one- to four-family loans delinquent in excess of 180 days for the year ended December 31, 2009 when compared to December 31, 2008. This increase was due primarily to the extensive amount of time it takes to foreclose on a property in the current real estate market.
69
Table of Contents
The following graph illustrates the nonperforming loans by quarter:
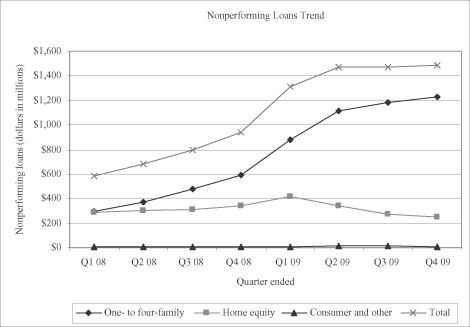
The allowance as a percentage of total nonperforming loans receivable, net decreased from 114.70% at December 31, 2008 to 79.54% at December 31, 2009. This decrease was driven by an increase in one- to four-family nonperforming loans, which have a lower level of expected loss when compared to home equity loans as one- to four-family loans are generally secured in a first lien position by real estate assets. The balance of nonperforming loans includes loans delinquent 90 to 179 days as well as loans delinquent 180 days and greater. We believe the distinction between these two periods is important as loans delinquent 180 days and greater have been written down to their expected recovery value, whereas loans delinquent 90 to 179 days have not. We believe loans delinquent 90 to 179 days is an important measure because these loans are expected to drive the vast majority of future charge-offs. Additional charge-offs on loans delinquent 180 days are possible if home prices decline beyond our current expectations, but we do not anticipate these charge-offs to be significant, particularly when compared to the expected charge-offs on loans delinquent 90 to 179 days. We expect the balances of one- to four-family loans delinquent 180 days and greater to increase in the future due to the extensive amount of time it takes to foreclose on a property in the current real estate market.
70
Table of Contents
The following graph shows the loans delinquent 90 to 179 days for each of our major loan categories:
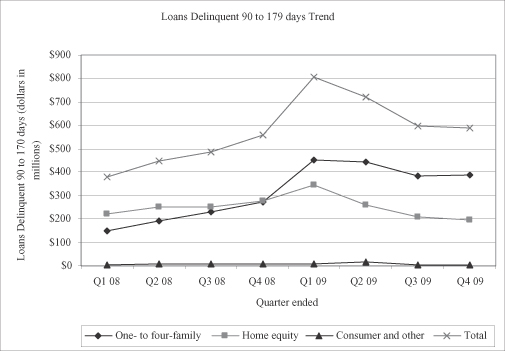
In addition to nonperforming assets, we monitor loans where a borrower’s past credit history casts doubt on their ability to repay a loan (“special mention” loans). We classify loans as special mention when they are between 30 and 89 days past due. The following table shows the comparative data for special mention loans (dollars in millions):
| December 31, | ||||||||
| 2009 | 2008 | |||||||
| One- to four-family |
$ | 527.9 | $ | 594.4 | ||||
| Home equity |
246.2 | 407.4 | ||||||
| Consumer and other |
30.4 | 33.3 | ||||||
| Total special mention loans |
$ | 804.5 | $ | 1,035.1 | ||||
| Special mention loans receivable as a percentage of gross loans receivable |
3.95 | % | 4.05 | % | ||||
The trend in special mention loan balances are generally indicative of the expected trend for charge-offs in future periods, as these loans have a greater propensity to migrate into nonaccrual status and ultimately charge-off. One- to four-family loans are generally secured in a first lien position by real estate assets, reducing the potential loss when compared to an unsecured loan. Our home equity loans are generally secured by real estate assets; however, the majority of these loans are secured in a second lien position, which substantially increases the potential loss when compared to a first lien position.
71
Table of Contents
During the year ended December 31, 2009, special mention loans decreased by $230.6 million to $804.5 million. This decrease was largely due to a decrease in home equity special mention loans. The decrease in home equity special mention loans includes the impact of our loan modification programs in which borrowers who were 30 to 89 days past due were made current(1). While our level of special mention loans can fluctuate significantly in any given period, we believe the decrease we observed in 2009 is an encouraging sign regarding the future credit performance of this portfolio.
The following graph illustrates the special mention loans by quarter:
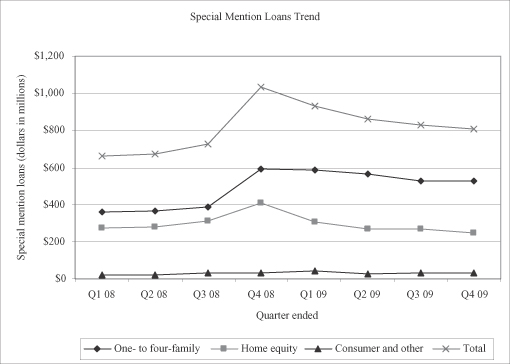
| (1) | Loans modified as TDRs are accounted for as nonaccrual loans at the time of modification and return to accrual status after six consecutive payments are made in accordance with the modified terms. |
72
Table of Contents
Securities
We focus primarily on security type and credit rating to monitor credit risk in our securities portfolios. We believe our highest concentration of credit risk within this portfolio is the non-agency CMO portfolio. The table below details the amortized cost by average credit ratings and type of asset as of December 31, 2009 and 2008 (dollars in millions):
| December 31, 2009 |
AAA | AA | A | BBB | Below Investment Grade and Non-Rated |
Total | ||||||||||||
| Agency mortgage-backed securities and CMOs |
$ | 8,946.0 | $ | — | $ | — | $ | — | $ | — | $ | 8,946.0 | ||||||
| Agency debentures |
3,928.9 | — | — | — | — | 3,928.9 | ||||||||||||
| Non-agency CMOs and other |
43.6 | 60.2 | 129.6 | 17.2 | 339.6 | 590.2 | ||||||||||||
| Municipal bonds, corporate bonds and FHLB stock |
214.4 | 9.5 | 7.9 | — | 19.9 | 251.7 | ||||||||||||
| Total |
$ | 13,132.9 | $ | 69.7 | $ | 137.5 | $ | 17.2 | $ | 359.5 | $ | 13,716.8 | ||||||
| December 31, 2008 |
AAA | AA | A | BBB | Below Investment Grade and Non-Rated |
Total | ||||||||||||
| Agency mortgage-backed securities |
$ | 10,118.8 | $ | — | $ | — | $ | — | $ | — | $ | 10,118.8 | ||||||
| Agency debentures |
— | — | — | — | — | — | ||||||||||||
| Non-agency CMOs and other |
625.1 | 68.0 | 64.8 | 18.5 | 173.0 | 949.4 | ||||||||||||
| Municipal bonds, corporate bonds and FHLB stock |
231.5 | 11.9 | 83.5 | — | — | 326.9 | ||||||||||||
| Total |
$ | 10,975.4 | $ | 79.9 | $ | 148.3 | $ | 18.5 | $ | 173.0 | $ | 11,395.1 | ||||||
While the vast majority of this portfolio is AAA-rated, we concluded during the year ended December 31, 2009 that approximately $394.7 million of the non-agency CMOs in this portfolio were other-than-temporarily impaired. As a result of the deterioration in the expected credit performance of the underlying loans in the securities, they were written down by recording $89.1 million of net impairment during the year ended December 31, 2009. Further declines in the performance of our non-agency CMO portfolio could result in additional impairments in future periods.
Derivatives
Credit risk is an element of the recurring fair value measurements for certain assets and liabilities, including derivative instruments. We monitor the collateral requirements on derivative instruments through credit support agreements, which reduce risk by permitting the netting of transactions with the same counterparty upon occurrence of certain events. We considered the impact of credit risk on the fair value measurement for derivative instruments, particularly those in net liability positions, to be mitigated by the enforcement of credit support agreements, and the collateral requirements therein. Our credit risk analysis for derivative instruments also considered whether the cost to mitigate the credit loss exposure on derivative instruments in net asset positions would have resulted in material adjustments to the valuations. During the year ended December 31, 2009, the consideration of credit risk, the Company’s or the counterparty’s, did not result in an adjustment to the valuation of its derivative financial instruments.
73
Table of Contents
SUMMARY OF CRITICAL ACCOUNTING POLICIES AND ESTIMATES
Our discussion and analysis of our financial condition and results of operations are based on our consolidated financial statements, which have been prepared in conformity with GAAP. Note 1—Organization, Basis of Presentation and Summary of Significant Accounting Policies of Item 8. Financial Statements and Supplementary Data contains a summary of our significant accounting policies, many of which require the use of estimates and assumptions. We believe that of our significant accounting policies, the following are noteworthy because they are based on estimates and assumptions that require complex, subjective judgments by management, which can materially impact reported results. Changes in these estimates or assumptions could materially impact our financial condition and results of operations
Allowance for Loan Losses
Description
The allowance for loan losses is management’s estimate of credit losses inherent in our loan portfolio as of the balance sheet date. In determining the adequacy of the allowance, we perform periodic evaluations of the loan portfolio and loss forecasting assumptions. As of December 31, 2009, our allowance for loan losses was $1.2 billion on $20.2 billion of total loans receivable designated as held-for-investment.
Judgments
The estimate of the allowance is based on a variety of quantitative and qualitative factors, including the composition and quality of the portfolio; delinquency levels and trends; current and historical charge-off and loss experience; current industry charge-off and loss experience; the condition of the real estate market and geographic concentrations within the loan portfolio; the interest rate climate; the overall availability of housing credit; and general economic conditions. The allowance for loan losses is typically equal to management’s estimate of loan charge-offs in the twelve months following the balance sheet date as well as the estimated charge-offs, including economic concessions to borrowers, over the estimated remaining life of loans modified in TDRs. Determining the adequacy of the allowance is complex and requires judgment by management about the effect of matters that are inherently uncertain. Subsequent evaluations of the loan portfolio, in light of the factors then prevailing, may result in significant changes in the allowance for loan losses in future periods. We evaluate the adequacy of the allowance for loan losses by loan type: one- to four-family, home equity and consumer and other loan portfolios.
For loans that are not specifically identified for impairment, we established a general allowance that is assessed in accordance with the loss contingencies accounting guidance. Our one- to four-family and home equity loan portfolios are separated into risk segments based on key risk factors, which include but are not limited to channel of loan origination, documentation type, loan product type and LTV ratio. Based upon the segmentation, probable losses are determined with expected loss rates in each segment. The additional protection provided by mortgage insurance has been factored into the expected loss on defaulted mortgage loans. The expected recovery from the liquidation of foreclosed real estate and expected recoveries from loan sellers related to contractual guarantees are also factored into the expected loss on defaulted mortgage loans. Our one- to four-family and home equity loan portfolios represented 52% and 39%, respectively, of total loans receivable as of December 31, 2009.
For the consumer and other loan portfolio, management establishes loss estimates for each consumer portfolio based on credit characteristics and observation of the existing markets. The expected recoveries from the sale of repossessed collateral are factored into the expected loss on defaulted consumer loans based on current liquidation experience. Our consumer and other loan portfolio represented 9% of total loans receivable as of December 31, 2009.
The general allowance for loan losses also included a specific qualitative component to account for environmental factors that we believe will impact our level of credit losses. This qualitative component, which
74
Table of Contents
was applied by loan type, reflects our estimate of credit losses inherent in the loan portfolio due to environmental factors which are not directly considered in our quantitative loss model but are factors we believe will have an impact on credit losses (e.g. the current level of unemployment).
In addition to the general allowance, we also established a specific allowance for loans modified as TDRs. The impairment of a loan is measured using a discounted cash flow analysis. A specific allowance is established to the extent that the recorded investment exceeds the discounted cash flows of a TDR with a corresponding charge to the provision for loan losses. The specific allowance for these individually impaired loans represents the expected loss over the remaining life of the loan, including the economic concession to the borrower.
Effects if Actual Results Differ
The crisis in the residential real estate and credit markets has substantially increased the complexity and uncertainty involved in estimating the losses inherent in our loan portfolio. If our underlying assumptions and judgments prove to be inaccurate, the allowance for loan losses could be insufficient to cover actual losses. We may be required under such circumstances to further increase our provision for loan losses, which could have an adverse effect on our regulatory capital position and our results of operations in future periods.
Fair Value Measurements
Description
Fair value is defined as the price that would be received to sell an asset or paid to transfer a liability in an orderly transaction between market participants at the measurement date. As of December 31, 2009, 30% and less than 1% of our total assets and total liabilities, respectively, represented instruments measured at fair value on a recurring basis. During the year ended December 31, 2009, fair value was also used for certain other nonrecurring measurements, including the Debt Exchange. The fair value measurement accounting guidance describes the following three levels used to classify fair value measurements:
| • | Level 1—Quoted prices in active markets for identical assets or liabilities. |
| • | Level 2—Quoted prices in markets that are not active or for which all significant inputs are observable, either directly or indirectly. |
| • | Level 3—Unobservable inputs that are significant to the fair value of the assets or liabilities. |
In determining fair value, we use various valuation approaches, including market, income and/or cost approaches. The fair value hierarchy requires an entity to maximize the use of observable inputs and minimize the use of unobservable inputs when measuring fair value. Fair value is a market-based measure considered from the perspective of a market participant. As such, even when market assumptions are not readily available, our own assumptions reflect those that market participants would use in pricing the asset or liability at the measurement date. The availability of observable inputs can vary and in certain cases, the inputs used to measure fair value may fall into different levels of the fair value hierarchy. In such cases, the level within the fair value hierarchy is based on the lowest level of input that is significant to the fair value measurement. Our assessment of the significance of a particular input to a fair value measurement requires judgment and consideration of factors specific to the asset or liability.
Recurring Fair Value Measurements
Judgments
Of assets measured at fair value on a recurring basis, 66% were available-for-sale residential mortgage-backed securities as of December 31, 2009. Our residential mortgage-backed securities portfolio is composed of: 1) agency mortgage-backed securities and CMOs; and 2) non-agency CMOs and other. The fair value of agency mortgage-backed securities and CMOs is determined using quoted market prices, recent market transactions and
75
Table of Contents
spread data for similar instruments and are generally categorized in Level 2 of the fair value hierarchy. Non-agency CMOs are typically valued using market observable data, when available, including recent market transactions. We also utilized a pricing service to corroborate the market observability of our inputs used in the fair value measurements. The valuations of non-agency CMOs reflect our best estimate of what market participants would consider in pricing the financial instruments. We consider the price transparency for these financial instruments to be a key determinant of the degree of judgment involved in determining the fair value. As of December 31, 2009, the majority of our non-agency CMOs were categorized in Level 3 of the fair value hierarchy.
Effects if Actual Results Differ
As of December 31, 2009, less than 1% of our total assets and none of our total liabilities represented instruments measured at fair value on a recurring basis categorized as Level 3. Level 3 assets represented 2% of total assets measured at fair value on a recurring basis as of December 31, 2009 and were composed primarily of non-agency CMOs. While our recurring fair value estimates of Level 3 instruments utilized observable inputs where available, the valuations included significant management judgment in determining the relevance and reliability of market information considered.
Nonrecurring Fair Value Measurements—Debt Exchange
Judgments
In the third quarter of 2009, we exchanged $1.7 billion aggregate principal amount of the 12 1/2% Notes and 8% Notes for an equal principal amount of newly-issued non-interest-bearing convertible debentures(1). The Debt Exchange was accounted for as a debt extinguishment at fair value with the resulting loss recognized in the consolidated statement of loss. Our methodology for determining the fair value of the non-interest-bearing convertible debentures was based on the following three factors: 1) intrinsic value of the underlying stock; 2) value of the 10-year put option; and 3) liquidity discount.
The most significant factor in the valuation of the non-interest-bearing convertible debentures was the intrinsic value of the underlying stock, which represented the value of the underlying shares of our stock at the date of exchange. The fair value of the non-interest-bearing convertible debentures was greater than the face amount of the corporate debt that was exchanged primarily due to the significant increase in our stock price from June 22, 2009, the date on which the conversion price was established, to August 25, 2009, the date on which the Debt Exchange was consummated. The other inputs to the valuation of the non-interest-bearing convertible debentures included the value of the 10-year put option and a liquidity discount. The value of the 10-year put option represented the value associated with creditors’ option to receive cash equal to the face value of the non-interest-bearing convertible debentures at the end of 10 years in lieu of converting the non-interest-bearing convertible debentures into common stock. The liquidity discount represented our consideration that the non-interest-bearing convertible debentures are not as liquid as our stock or might not be readily tradable once issued and that future conversions would be subject to certain limitations.
| (1) | For further details on the newly-issued non-interest-bearing convertible debentures see Note 14—Corporate Debt of Item 8. Financial Statements and Supplementary Data. |
76
Table of Contents
The following table outlines our fair value measurement of the non-interest-bearing convertible debentures, including the fair value of each individual component, using the $1.35 closing stock price on August 25, 2009, the date of consummation of the Debt Exchange (dollars in millions):
| August 25, 2009 | |||||||
| Fair Value | Fair Value as a % of Principal Amount |
||||||
| Intrinsic value of the underlying stock |
$ | 2,273.2 | 131 | % | |||
| Value of 10-year put option |
467.7 | 27 | % | ||||
| Liquidity discount |
(274.1 | ) | (16 | )% | |||
| Fair value of convertible debentures(1) |
$ | 2,466.8 | 142 | % | |||
| (1) | We classified this fair value measurement as Level 3 of the fair value hierarchy as the liquidity discount represented an unobservable input significant to the fair value measurement. |
Effects if Actual Results Differ
The Debt Exchange resulted in a $968.3 million pre-tax non-cash loss on extinguishment of debt during the third quarter of 2009. The difference between the fair value of the newly-issued non-interest-bearing convertible debentures and the face amount of the exchanged debt resulted in a $725.0 million premium on the new debt that represented a key component of the loss. While our methodology for determining the fair value of the non-interest-bearing convertible debentures utilized observable inputs where available, the liquidity discount represented an unobservable input significant to the fair value measurement. Each 1% increase in the liquidity discount in our valuation methodology would have resulted in a 1%, or approximately $27 million, decrease in the fair value measurement of the non-interest-bearing convertible debentures. For further details on the accounting for the Debt Exchange see Note 1—Organization, Basis of Presentation and Summary of Significant Accounting Policies of Item 8. Financial Statements and Supplementary Data.
Classification and Valuation of Certain Investments
Description
The classification of an investment determines its accounting treatment. We generally classify our investments in securities as either trading or available-for-sale. We have not classified any investments as held-to-maturity. Trading securities are carried at fair value and both unrealized and realized gains and losses are recognized in the consolidated statement of loss. Securities classified as available-for-sale are carried at fair value with unrealized gains and losses included in accumulated other comprehensive loss, net of tax. Declines in fair value for available-for-sale debt securities that we believe to be other-than-temporary are included in the consolidated statement of loss in the net impairment line item. Available-for-sale securities consist primarily of debt securities, specifically residential mortgage-backed securities, as of December 31, 2009. As of December 31, 2009, 70% and 29% of our available-for-sale securities were residential mortgage-backed securities and other debt securities, respectively.
Beginning in the second quarter of 2009, our OTTI evaluation for available-for-sale debt securities reflects the adoption of the amended OTTI accounting guidance. Under the amended OTTI accounting guidance, we consider OTTI for an available-for-sale debt security to have occurred if one of the following conditions are met: we intend to sell the impaired debt security; it is more likely than not that we will be required to sell the impaired debt security before recovery of the security’s amortized cost basis; or we do not expect to recover the entire amortized cost basis of the security. If we intend to sell an impaired available-for-sale debt security or if it is more likely than not that we will be required to sell the impaired available-for-sale debt security before recovery of the security’s amortized cost basis, we will recognize OTTI in earnings equal to the entire difference between the security’s amortized cost basis and the security’s fair value. For impaired available-for-sale debt securities
77
Table of Contents
that we do not to intend to sell and it is not more likely than not that we will be required to sell before recovery of the security’s amortized cost basis, if we do not expect to recover the entire amortized cost basis of the securities, we will separate OTTI into two components: 1) the amount related to credit loss, recognized in earnings; and 2) the noncredit portion of OTTI, recognized through other comprehensive income (loss). For the year ended December 31, 2009, we recognized $89.1 million of net impairment on certain securities in our non-agency CMO portfolio.
Judgments
Our evaluation of whether we intend to sell an impaired available-for-sale debt security considers whether management has decided to sell the security as of the balance sheet date. Our evaluation of whether it is more likely than not that we will be required to sell an impaired available-for-sale debt security before recovery of the security’s amortized cost basis considers the likelihood of sales that involve legal, regulatory or operational requirements. For impaired available-for-sale debt securities that we do not to intend to sell and it is not more likely than not that we will be required to sell before recovery of the security’s amortized cost basis, we use both qualitative and quantitative valuation measures to evaluate whether we expect to recover the entire amortized cost basis of the security. We consider all available information relevant to the collectability of the security, including credit enhancements, security structure, vintage, credit ratings and other relevant collateral characteristics.
Effects if Actual Results Differ
Determining if a security has other-than-temporary impairment is complex and requires judgment by management about circumstances that are inherently uncertain. Subsequent evaluations of these securities, in light of factors then prevailing, may result in additional OTTI in future periods. If all available-for-sale securities with fair values lower than amortized cost as of December 31, 2009 were other-than-temporarily impaired and the gross OTTI was recorded through earnings, we would record a pre-tax loss of $304.7 million.
Accounting for Derivative Instruments
Description
We enter into derivative transactions primarily to protect against interest rate risk on the value of certain assets, liabilities and future cash flows. Accounting for derivatives differs significantly depending on whether a derivative is designated as a hedge. In order to qualify for hedge accounting treatment, documentation must indicate the intention to designate the derivative as a hedge of a specific asset or liability or a future cash flow. Effectiveness of the hedge must be monitored over the life of the derivative.
The majority of derivative transactions outstanding as of December 31, 2009 were cash flow hedges. These hedges, which include a combination of interest rate swaps, forward-starting swaps and purchased options, including caps and floors, are used primarily to reduce the variability of future cash flows associated with existing variable-rate liabilities and assets and forecasted issuances of liabilities. These cash flow hedge relationships are treated as effective hedges as long as the future issuances of liabilities remain probable and the hedges continue to meet the requirements of derivatives and hedging accounting guidance. Changes in the fair value of derivatives that hedge cash flows associated with repurchase agreements, FHLB advances and home equity lines of credit are reported in accumulated other comprehensive loss as unrealized gains or losses, for both active and terminated hedges. As of December 31, 2009, we had an unrealized pre-tax loss reported in accumulated other comprehensive loss of $450.3 million related to cash flow hedges.
Judgments
If the derivatives in these cash flow hedge relationships are determined to be effective hedges, the amounts in accumulated other comprehensive loss are included in net operating interest income as a yield adjustment during the same periods in which the related interest on the hedged item affects earnings. If hedge accounting is
78
Table of Contents
discontinued because a derivative instrument ceases to be a highly effective hedge; or is sold, terminated or de-designated, amounts included in accumulated other comprehensive loss related to the specific hedging instrument continue to be reported in other comprehensive income or loss until the forecasted transaction affects earnings. If it becomes probable that a hedged forecasted transaction will not occur, amounts included in accumulated other comprehensive loss related to the specific hedging instruments would be reclassified into the gains (losses) on loans and securities, net line item in the consolidated statement of loss.
The future issuances of liabilities, including repurchase agreements, are largely dependent on the market demand and liquidity in the wholesale borrowings market. As of December 31, 2009, we believe the forecasted issuance of all debt in cash flow hedge relationships is probable. However, unexpected changes in market conditions in future periods could impact our ability to issue this debt. We believe the forecasted issuance of debt in the form of repurchase agreements is most susceptible to an unexpected change in market conditions.
Effects if Actual Results Differ
If our hedging strategies were to become significantly ineffective or our assumptions about the nature and timing of forecasted transactions were to be inaccurate, we could no longer apply hedge accounting and our reported results would be significantly affected. In particular, if we determined that the forecasted issuance of repurchase agreements associated with our cash flow hedges was no longer probable, the $403.4 million pre-tax loss in accumulated other comprehensive loss related to cash flow hedges on repurchase agreements would be reclassified into the gains (losses) on loans and securities, net line item in the consolidated statement of loss in the period in which this determination was made. This loss would have a material adverse effect on our regulatory capital position and our results of operations.
Estimates of Effective Tax Rates, Deferred Taxes and Valuation Allowances
Description
In preparing our consolidated financial statements, we calculate our income tax benefit based on our interpretation of the tax laws in the various jurisdictions where we conduct business. This requires us to estimate our current tax obligations and the realizability of uncertain tax positions and to assess temporary differences between the financial statement carrying amounts and the tax bases of assets and liabilities. These differences result in deferred tax assets and liabilities, the net amount of which we show as other assets or other liabilities on our consolidated balance sheet. We must also assess the likelihood that each of our deferred tax assets will be realized. To the extent we believe that realization is not more likely than not, we establish a valuation allowance. When we establish a valuation allowance or increase this allowance in a reporting period, we generally record a corresponding tax expense in our consolidated statement of loss. Conversely, to the extent circumstances indicate that a valuation allowance is no longer necessary, that portion of the valuation allowance is reversed, which generally reduces our overall income tax expense. At December 31, 2009 we had net deferred tax assets of $1.4 billion, net of a valuation allowance (on state and foreign country deferred tax assets) of $107.3 million.
Judgments
Management must make significant judgments to determine our provision for income tax benefit, our deferred tax assets and liabilities and any valuation allowance to be recorded against our net deferred tax assets. Changes in our estimate of these taxes occur periodically due to changes in the tax rates, changes in our business operations, implementation of tax planning strategies, the expiration of relevant statutes of limitations, resolution with taxing authorities of uncertain tax positions and newly enacted statutory, judicial and regulatory guidance. These changes in judgment as well as differences between our estimates and actual amount of taxes ultimately due, when they occur, affect accrued taxes and can be material to our operating results for any particular reporting period.
The most significant tax related judgment made by management was the determination of whether to provide for a valuation allowance against our net deferred tax assets. During the year ended December 31, 2009 we did not provide for a valuation allowance against our federal deferred tax assets. We are required to establish
79
Table of Contents
a valuation allowance for deferred tax assets and record a charge to income if we determine, based on available evidence at the time the determination is made, that it is more likely than not that some portion or all of the deferred tax assets will not be realized.
We did not establish a valuation allowance against our federal deferred tax assets as of December 31, 2009 as we believe that it is more likely than not that all of these assets will be realized. Our evaluation focused on identifying significant, objective evidence that we will be able to realize our deferred tax assets in the future. We reviewed the estimated future taxable income for our trading and investing and balance sheet management segments separately and determined that our net operating losses since 2007 are due solely to the credit losses in our balance sheet management segment. We believe these losses were caused by the crisis in the residential real estate and credit markets which significantly impacted our asset-backed securities and our home equity loan portfolios in 2007 and continued to generate credit losses in 2008 and 2009. We estimate that these credit losses will continue in future periods; however, we ceased purchasing asset-backed securities and home equity loans which we believe are the root cause of the majority of these losses. Therefore, while we do expect credit losses to continue in future periods, we do expect these amounts to decline when compared to our credit losses in the three-year period ending in 2009. Our trading and investing segment generated substantial book taxable income for each of the last six years and we estimate that it will continue to generate taxable income in future periods at a level sufficient enough to generate taxable income for the Company as a whole. We consider this to be significant, objective evidence that we will be able to realize our deferred tax assets in the future.
A key component of our evaluation of the need for a valuation allowance was our level of corporate interest expense, which represents our most significant non-segment related expense. Our estimates of future taxable income included this expense, which reduces the amount of segment income available to utilize our federal deferred tax assets. Therefore, a decrease in this expense in future periods would increase the level of estimated taxable income available to utilize our federal deferred tax assets. As a result of the Debt Exchange, we reduced our annual cash interest payments by approximately $200 million. We believe this decline in cash interest payments significantly improves our ability to utilize our federal deferred tax assets in future periods when compared to evaluations in prior periods which did not include this decline in corporate interest payments.
Our analysis of the need for a valuation allowance recognizes that we are in a cumulative book taxable loss position as of the three-year period ended December 31, 2009, which is considered significant, objective evidence that we may not be able to realize some portion of our deferred tax assets in the future. However, we believe we are able to rely on our forecasts of future taxable income and overcome the uncertainty created by the cumulative loss position.
Effects if Actual Results Differ
Changes in our tax benefit due to the actual effective tax rates differing from our estimates, when they occur, affect accrued taxes and can be material to our operating results for any particular reporting period.
In evaluating the need for a valuation allowance, we estimated future taxable income based on management approved forecasts. This process required significant judgment by management about matters that are by nature uncertain. If future events differ significantly from our current forecasts, a valuation allowance may need to be established, which would have a material adverse effect on our results of operations and our financial condition. In addition, a significant portion of the net deferred tax asset relates to a $1.4 billion federal tax loss carryforward, the utilization of which may be further limited in the event of certain material changes in the ownership of the Company.
Valuation of Goodwill and Other Intangibles
Description
We review goodwill and purchased intangible assets with indefinite lives for impairment on at least an annual basis or when events or changes indicate the carrying value of an asset may not be recoverable. Our
80
Table of Contents
recorded goodwill at December 31, 2009 was $2.0 billion, and we will continue to evaluate it for impairment at least annually. Our recorded intangible assets net of amortization at December 31, 2009 were $356.4 million, which have useful lives between five and thirty years.
Judgments
The valuation of our goodwill and other intangible assets depends on a number of factors, including estimates of future market growth and trends, forecasted revenue and costs, expected useful lives of the assets, appropriate discount rates and other variables. Goodwill is allocated to our reporting units, which are components of the business that are one level below our operating segments. Each of these reporting units is tested for impairment individually during the annual evaluation. There is no goodwill assigned to reporting units within the balance sheet management segment. The following table shows the amount of goodwill allocated to each of the reporting units in our trading and investing segment (dollars in millions):
| Reporting Unit |
December 31, 2009 | ||
| U.S. Brokerage |
$ | 1,757.7 | |
| Capital Markets |
142.4 | ||
| Retail Bank |
52.2 | ||
| Total goodwill |
$ | 1,952.3 | |
In connection with our annual impairment test of goodwill, we concluded that the goodwill was not impaired as the fair value of the reporting units is in excess of the book value of those reporting units. We also evaluate the remaining useful lives on intangible assets each reporting period to determine whether events and circumstances warrant a revision to the remaining period of amortization.
Effects if Actual Results Differ
If our estimates of goodwill fair value change due to changes in our businesses or other factors, we may determine that an impairment charge is necessary. Estimates of fair value are determined based on a complex model using cash flows and company comparisons. If management’s estimates of future cash flows are inaccurate, the fair value determined could be inaccurate and impairment would not be recognized in a timely manner. Intangible assets are amortized over their estimated useful lives. If changes in the estimated underlying revenues occur, impairment or a change in the remaining life may need to be recognized.
Valuation and Expensing of Share-Based Payments
Description
We value employee share-based payments, which are primarily stock options, at the grant date and expense the associated compensation cost over the vesting period less estimated forfeitures. We value each granted option using an option pricing model using assumptions that match the characteristics of the granted options. We then assume a forfeiture rate that is used to calculate each period’s compensation expense attributed to these options.
Judgments
We estimate the value of employee stock options using the Black-Scholes-Merton option pricing model. Assumptions necessary for the calculation of fair value include expected term and expected volatility. These assumptions are management’s best estimate of the characteristics of the options. Additionally, forfeiture rates are estimated based on historical vesting experience.
81
Table of Contents
Effects if Actual Results Differ
If our estimates of employees’ forfeiture rates are not correct at the end of the term of the option, we will record either additional expense or a reduction of expense in the period it completely vests. This adjustment may be material to the period in which it is recorded. In addition, option fair value is based on estimates of volatility determined by us. Many methods are available to determine volatility, so the determination is subjective. Applying a different method to determine volatility could impact earnings. A 10% change in volatility would increase or decrease stock option fair value by approximately 7%. A change in fair value would affect all amortization periods.
STATISTICAL DISCLOSURE BY BANK HOLDING COMPANIES
The following table outlines the information required by the SEC’s Industry Guide 3, “Statistical Disclosure by Bank Holding Companies.” These disclosures are at the enterprise level.
| Required Disclosure |
Page | |
| Distribution of Assets, Liabilities and Shareholders’ Equity; Interest Rates and Operating Interest Differential |
||
| Average Balance Sheet and Analysis of Net Interest Income |
32 | |
| Net Operating Interest Income—Volumes and Rates Analysis |
83 | |
| Investment Portfolio |
||
| Investment Portfolio—Book Value and Fair Value |
86 | |
| Investment Portfolio Maturity |
86 | |
| Loan Portfolio |
||
| Loans by Type |
84 | |
| Loan Maturities |
84 | |
| Loan Sensitivities |
85 | |
| Risk Elements |
||
| Nonaccrual, Past Due and Restructured Loans |
69 | |
| Past Due Interest |
131 | |
| Policy for Nonaccrual |
67 | |
| Potential Problem Loans |
71 | |
| Summary of Loan Loss Experience |
||
| Analysis of Allowance for Loan Losses |
67 | |
| Allocation of the Allowance for Loan Losses |
67 | |
| Deposits |
||
| Average Balance and Average Rates Paid |
32 | |
| Time Deposit Maturities |
140 | |
| Time Deposits in Excess of the FDIC Deposit Insurance Coverage Limits |
141 | |
| Return of Equity and Assets |
33 | |
| Short-Term Borrowings |
87 |
82
Table of Contents
Interest Rates and Operating Interest Differential
Increases and decreases in operating interest income and operating interest expense result from changes in average balances (volume) of enterprise interest-earning assets and liabilities, as well as changes in average interest rates (rate). The following table shows the effect that these factors had on the interest earned on our enterprise interest-earning assets and the interest incurred on our enterprise interest-bearing liabilities. The effect of changes in volume is determined by multiplying the change in volume by the previous year’s average yield/ cost. Similarly, the effect of rate changes is calculated by multiplying the change in average yield/cost by the previous year’s volume. Changes applicable to both volume and rate have been allocated proportionately (dollars in millions):
| 2009 Compared to 2008 Increase (Decrease) Due To |
2008 Compared to 2007 Increase (Decrease) Due To |
|||||||||||||||||||||||
| Volume | Rate | Total | Volume | Rate | Total | |||||||||||||||||||
| Enterprise interest-earning assets: |
||||||||||||||||||||||||
| Loans, net(1) |
$ | (245.7 | ) | $ | (204.0 | ) | $ | (449.7 | ) | $ | (190.3 | ) | $ | (207.9 | ) | $ | (398.2 | ) | ||||||
| Margin receivables |
(122.8 | ) | (16.9 | ) | (139.7 | ) | (76.0 | ) | (147.9 | ) | (223.9 | ) | ||||||||||||
| Available-for-sale mortgage-backed securities |
40.1 | (39.1 | ) | 1.0 | (143.2 | ) | (71.8 | ) | (215.0 | ) | ||||||||||||||
| Available-for-sale investment securities |
34.6 | (7.8 | ) | 26.8 | (252.2 | ) | 1.7 | (250.5 | ) | |||||||||||||||
| Trading securities |
(31.6 | ) | 10.6 | (21.0 | ) | 17.4 | (5.3 | ) | 12.1 | |||||||||||||||
| Cash and cash equivalents(2) |
38.7 | (80.3 | ) | (41.6 | ) | 50.8 | (24.6 | ) | 26.2 | |||||||||||||||
| Stock borrow and other |
(6.7 | ) | 0.8 | (5.9 | ) | (14.0 | ) | (1.6 | ) | (15.6 | ) | |||||||||||||
| Total enterprise interest-earning assets(3) |
(293.4 | ) | (336.7 | ) | (630.1 | ) | (607.5 | ) | (457.4 | ) | (1,064.9 | ) | ||||||||||||
| Enterprise interest-bearing liabilities: |
||||||||||||||||||||||||
| Retail deposits |
13.9 | (379.1 | ) | (365.2 | ) | (23.4 | ) | (206.2 | ) | (229.6 | ) | |||||||||||||
| Brokered certificates of deposit |
(40.4 | ) | 1.5 | (38.9 | ) | 23.2 | 0.3 | 23.5 | ||||||||||||||||
| Customer payables |
2.3 | (23.2 | ) | (20.9 | ) | (14.2 | ) | (23.6 | ) | (37.8 | ) | |||||||||||||
| Repurchase agreements and other borrowings |
(20.2 | ) | (81.8 | ) | (102.0 | ) | (205.0 | ) | (120.1 | ) | (325.1 | ) | ||||||||||||
| FHLB advances |
(80.8 | ) | (5.5 | ) | (86.3 | ) | (115.1 | ) | (30.4 | ) | (145.5 | ) | ||||||||||||
| Stock loan and other |
(6.8 | ) | (9.4 | ) | (16.2 | ) | (6.0 | ) | (15.1 | ) | (21.1 | ) | ||||||||||||
| Total enterprise interest-bearing liabilities |
(132.0 | ) | (497.5 | ) | (629.5 | ) | (340.5 | ) | (395.1 | ) | (735.6 | ) | ||||||||||||
| Change in enterprise net interest income |
$ | (161.4 | ) | $ | 160.8 | $ | (0.6 | ) | $ | (267.0 | ) | $ | (62.3 | ) | $ | (329.3 | ) | |||||||
| (1) | Nonaccrual loans are included in the respective average loan balances. Income on such nonaccrual loans is recognized on a cash basis. |
| (2) | Includes segregated cash balances. |
| (3) | Amount includes a taxable equivalent increase in operating interest income of $2.1 million, $9.1 million and $30.9 million for years ended December 31, 2009, 2008 and 2007, respectively. |
83
Table of Contents
Lending Activities
The following table presents the balance and associated percentage of each major loan category in our portfolio (dollars in millions):
| December 31, | |||||||||||||||||||||||||||||||||||
| 2009 | 2008 | 2007 | 2006 | 2005 | |||||||||||||||||||||||||||||||
| Balance | % | Balance | % | Balance | % | Balance | % | Balance | % | ||||||||||||||||||||||||||
| One- to four-family |
$ | 10,567.1 | 52.4 | % | $ | 12,979.8 | 51.3 | % | $ | 15,607.4 | 51.5 | % | $ | 11,150.0 | 42.4 | % | $ | 7,178.9 | 37.3 | % | |||||||||||||||
| Home equity |
7,769.7 | 38.5 | 10,017.2 | 39.6 | 11,901.3 | 39.2 | 11,809.1 | 44.8 | 8,106.9 | 42.1 | |||||||||||||||||||||||||
| Consumer and other: |
1,841.3 | 9.1 | 2,298.6 | 9.1 | 2,823.3 | 9.3 | 3,372.9 | 12.8 | 3,966.1 | 20.6 | |||||||||||||||||||||||||
| Total loans |
20,178.1 | 100.0 | % | 25,295.6 | 100.0 | % | 30,332.0 | 100.0 | % | 26,332.0 | 100.0 | % | 19,251.9 | 100.0 | % | ||||||||||||||||||||
| Adjustments: |
|||||||||||||||||||||||||||||||||||
| Premiums (discounts) and deferred fees on loans |
171.6 | 236.8 | 315.5 | 391.8 | 323.7 | ||||||||||||||||||||||||||||||
| Allowance for loan losses |
(1,182.7 | ) | (1,080.6 | ) | (508.1 | ) | (67.6 | ) | (63.3 | ) | |||||||||||||||||||||||||
| Total adjustments |
(1,011.1 | ) | (843.8 | ) | (192.6 | ) | 324.2 | 260.4 | |||||||||||||||||||||||||||
| Loans, net(1)(2) |
$ | 19,167.0 | $ | 24,451.8 | $ | 30,139.4 | $ | 26,656.2 | $ | 19,512.3 | |||||||||||||||||||||||||
| (1) | Excludes loans held-for-sale of $7.9 million at December 31, 2009. The third party company providing this product performs all processing and underwriting of these loans and is responsible for the credit risk associated with these loans, which minimizes our assumption of any of the typical risks commonly associated with mortgage lending. There is a short period of time after closing of the loans in which we record the originated loan as held-for-sale prior to the third party company purchasing the loan. |
| (2) | Includes loans held-for-sale, principally one- to four-family real estate loans of $0.1 billion, $0.3 billion and $0.1 billion at December 31 2007, 2006, and 2005, respectively. There were no loans held-for-sale at December 31, 2008. Loans held-for-sale are accounted for at lower of cost or fair value with adjustments recorded in the gains (losses) on loans and securities, net line item and are not considered in the allowance for loan losses. |
The following table shows the contractual maturities of our loan portfolio at December 31, 2009, including scheduled principal repayments. This table does not, however, include any estimate of prepayments. These prepayments could significantly shorten the average loan lives and cause the actual timing of the loan repayments to differ from those shown in the following table (dollars in millions):
| Due in(1) | ||||||||||||
| < 1 Year | 1-5 Years | > 5 Years | Total | |||||||||
| One- to four-family |
$ | 173.8 | $ | 807.2 | $ | 9,586.1 | $ | 10,567.1 | ||||
| Home equity |
448.3 | 2,088.3 | 5,233.1 | 7,769.7 | ||||||||
| Consumer and other |
243.4 | 545.1 | 1,052.8 | 1,841.3 | ||||||||
| Total loans(2) |
$ | 865.5 | $ | 3,440.6 | $ | 15,872.0 | $ | 20,178.1 | ||||
| (1) | Estimated scheduled principal repayments are calculated using weighted-average interest rate and weighted-average remaining maturity of each loan portfolio. |
| (2) | Excludes loans held-for-sale of $7.9 million at December 31, 2009. The third party company providing this product performs all processing and underwriting of these loans and is responsible for the credit risk associated with these loans, which minimizes our assumption of any of the typical risks commonly associated with mortgage lending. There is a short period of time after closing of the loans in which we record the originated loan as held-for-sale prior to the third party company purchasing the loan. |
84
Table of Contents
The following table shows the distribution of those loans that mature in more than one year between fixed and adjustable interest rate loans at December 31, 2009 (dollars in millions):
| Interest Rate Type | |||||||||
| Fixed | Adjustable | Total | |||||||
| One- to four-family |
$ | 2,606.9 | $ | 7,786.4 | $ | 10,393.3 | |||
| Home equity |
1,730.1 | 5,591.3 | 7,321.4 | ||||||
| Consumer and other |
1,526.5 | 71.4 | 1,597.9 | ||||||
| Total loans(1) |
$ | 5,863.5 | $ | 13,449.1 | $ | 19,312.6 | |||
| (1) | Excludes loans held-for-sale of $7.9 million at December 31, 2009. The third party company providing this product performs all processing and underwriting of these loans and is responsible for the credit risk associated with these loans, which minimizes our assumption of any of the typical risks commonly associated with mortgage lending. There is a short period of time after closing of the loans in which we record the originated loan as held-for-sale prior to the third party company purchasing the loan. |
Available-for-Sale and Trading Securities
Our portfolios of mortgage-backed and investment securities are classified into three categories: trading, available-for-sale or held-to-maturity. None of our mortgage-backed or investment securities was classified as held-to-maturity during 2009, 2008 and 2007.
Our mortgage-backed securities portfolio is composed of:
| • | Fannie Mae participation certificates, guaranteed by Fannie Mae; |
| • | Freddie Mac participation certificates, guaranteed by Freddie Mac; |
| • | Government National Mortgage Association participation certificates, guaranteed by the full faith and credit of the U.S.; |
| • | Collateralized Mortgage Obligations; and |
| • | Privately insured mortgage pass-through securities. |
The majority of our investment securities portfolio is composed primarily of agency debentures which are unsecured senior debt offered by Fannie Mae, Freddie Mac and FHLB.
Trading securities are carried at fair value with any realized or unrealized gains and losses reflected in our consolidated statement of loss as gains (losses) on loans and securities, net. Our securities classified as available-for-sale are carried at fair value with the unrealized gains and losses reflected as a component of accumulated other comprehensive loss.
85
Table of Contents
The following table shows the cost basis and fair value of our mortgage-backed and investment securities portfolio that the Company held and classified as available-for-sale (dollars in millions):
| December 31, | ||||||||||||||||||
| 2009 | 2008 | 2007 | ||||||||||||||||
| Cost Basis |
Fair Value |
Cost Basis |
Fair Value |
Cost Basis |
Fair Value | |||||||||||||
| Residential mortgage-backed securities: |
||||||||||||||||||
| Agency mortgage-backed securities and CMOs |
$ | 8,945.4 | $ | 8,966.9 | $ | 10,115.8 | $ | 10,110.8 | $ | 9,638.7 | $ | 9,330.1 | ||||||
| Non-agency CMOs and other |
590.2 | 375.1 | 920.5 | 602.4 | 1,170.3 | 1,123.3 | ||||||||||||
| Total residential mortgage-backed securities |
9,535.6 | 9,342.0 | 11,036.3 | 10,713.2 | 10,809.0 | 10,453.4 | ||||||||||||
| Investment securities: |
||||||||||||||||||
| Debt securities: |
||||||||||||||||||
| Agency debentures |
3,928.9 | 3,920.0 | — | — | — | — | ||||||||||||
| Municipal bonds |
42.5 | 39.0 | 100.7 | 79.6 | 320.5 | 314.3 | ||||||||||||
| Corporate bonds |
25.4 | 17.8 | 25.5 | 12.8 | 36.6 | 35.3 | ||||||||||||
| Other debt securities |
— | — | — | — | 78.8 | 77.3 | ||||||||||||
| Publicly traded equity securities: |
||||||||||||||||||
| Preferred stock(1) |
— | — | — | — | 505.5 | 371.4 | ||||||||||||
| Corporate investments |
0.2 | 0.9 | 0.5 | 0.5 | 1.5 | 1.3 | ||||||||||||
| Retained interest from securitizations |
— | — | — | — | 1.0 | 2.0 | ||||||||||||
| Total investment securities |
3,997.0 | 3,977.7 | 126.7 | 92.9 | 943.9 | 801.6 | ||||||||||||
| Total available-for-sale securities |
$ | 13,532.6 | $ | 13,319.7 | $ | 11,163.0 | $ | 10,806.1 | $ | 11,752.9 | $ | 11,255.0 | ||||||
| (1) | On January 1, 2008, the Company elected the fair value option for preferred stock in accordance with fair value measurement accounting guidance. As a result of this election, preferred stock was classified on the balance sheet as trading securities during 2008; however, in the third quarter of 2008, all preferred stock positions were sold. |
The following table shows the scheduled maturities, carrying values and current yields for the Company’s available-for-sale investment portfolio at December 31, 2009 (dollars in millions):
| Within One Year | After One But Within Five Years |
After Five But Within Ten Years |
After Ten Years | Total | |||||||||||||||||||||||||
| Balance Due |
Weighted Average Yield |
Balance Due |
Weighted Average Yield |
Balance Due |
Weighted Average Yield |
Balance Due |
Weighted Average Yield |
Balance Due |
Weighted Average Yield |
||||||||||||||||||||
| Residential mortgage-backed securities: |
|||||||||||||||||||||||||||||
| Agency mortgage-backed securities and CMOs |
$ | — | N/A | $ | 29.5 | 5.50 | % | $ | 257.2 | 4.02 | % | $ | 8,658.7 | 4.73 | % | $ | 8,945.4 | 4.71 | % | ||||||||||
| Non-agency CMOs and other |
— | N/A | — | N/A | 0.5 | 6.14 | % | 589.7 | 4.67 | % | 590.2 | 4.67 | % | ||||||||||||||||
| Total residential mortgage-backed securities |
— | 29.5 | 257.7 | 9,248.4 | 9,535.6 | ||||||||||||||||||||||||
| Investment securities: |
|||||||||||||||||||||||||||||
| Debt securities: |
|||||||||||||||||||||||||||||
| Agency debentures |
— | N/A | 3,253.0 | 2.44 | % | 675.9 | 4.18 | % | — | N/A | 3,928.9 | 2.74 | % | ||||||||||||||||
| Municipal bonds(1) |
— | N/A | — | N/A | — | N/A | 42.5 | 4.78 | % | 42.5 | 4.78 | % | |||||||||||||||||
| Corporate bonds |
— | N/A | — | N/A | — | N/A | 25.4 | 0.83 | % | 25.4 | 0.83 | % | |||||||||||||||||
| Publicly traded equity securities: |
|||||||||||||||||||||||||||||
| Corporate investments |
— | N/A | — | N/A | — | N/A | 0.2 | N/A | 0.2 | N/A | |||||||||||||||||||
| Total investment securities |
— | 3,253.0 | 675.9 | 68.1 | 3,997.0 | ||||||||||||||||||||||||
| Total available-for-sale securities |
$ | — | $ | 3,282.5 | $ | 933.6 | $ | 9,316.5 | $ | 13,532.6 | |||||||||||||||||||
| (1) | Yields on tax-exempt obligations are computed on a tax-equivalent basis. |
86
Table of Contents
Borrowings
Deposits represent our most significant source of funding. In addition, we borrow from the FHLB and sell securities under repurchase agreements.
We are a member of, and own capital stock in, the FHLB system. The FHLB provides us with reserve credit capacity and authorizes us to apply for advances based on the security of pledged home mortgages and other assets—principally securities that are obligations of, or guaranteed by, the U.S. Government—provided we meet certain creditworthiness standards. At December 31, 2009, our outstanding advances from the FHLB totaled $2.3 billion at interest rates ranging from 0.33% to 5.56% and at a weighted-average rate of 3.17%.
We also raise funds by selling securities under agreements to repurchase the same or similar securities. The counterparties to these agreements hold the securities in custody. We treat repurchase agreements as borrowings and secure them with designated fixed- and variable-rate securities. We also participate in the Federal Reserve Bank’s term investment option and treasury, tax and loan borrowing programs. We use the proceeds from these transactions to meet our cash flow or asset/liability matching needs.
The following table sets forth information regarding the weighted-average interest rates and the highest and average month-end balances of our borrowings (dollars in millions):
| Ending Balance |
Weighted- Average Rate(1) |
Maximum Amount At Month-End |
Yearly Weighted -Average |
||||||||||||
| Balance | Rate | ||||||||||||||
| At or for the year ended December 31, 2009: |
|||||||||||||||
| FHLB advances |
$ | 2,303.6 | 3.17 | % | $ | 3,903.6 | $ | 2,900.6 | 4.57 | % | |||||
| Securities sold under agreement to repurchase and other borrowings(2) |
$ | 6,883.7 | 0.85 | % | $ | 7,646.7 | $ | 7,216.8 | 3.00 | % | |||||
| At or for the year ended December 31, 2008: |
|||||||||||||||
| FHLB advances |
$ | 3,903.6 | 4.15 | % | $ | 6,549.1 | $ | 4,667.4 | 4.69 | % | |||||
| Securities sold under agreement to repurchase and other borrowings(2) |
$ | 7,828.0 | 3.04 | % | $ | 8,153.7 | $ | 7,736.9 | 4.11 | % | |||||
| At or for the year ended December 31, 2007: |
|||||||||||||||
| FHLB advances |
$ | 6,967.4 | 4.80 | % | $ | 9,959.3 | $ | 7,071.8 | 5.15 | % | |||||
| Securities sold under agreement to repurchase and other borrowings(2) |
$ | 9,372.0 | 5.11 | % | $ | 14,593.9 | $ | 12,261.1 | 5.25 | % | |||||
| (1) | Excludes hedging costs. |
| (2) | Excludes other borrowings of the parent company of $1.6 million, $3.4 million and $39.8 million at December 31, 2009, 2008 and 2007, respectively, which do not generate operating interest expense. These liabilities generate corporate interest expense. |
87
Table of Contents
GLOSSARY OF TERMS
Active accounts—Accounts with a balance of $25 or more or a trade in the last six months.
Active customers—Customers that have an account with a balance of $25 or more or a trade in the last six months.
Active Trader—The customer group that includes those who execute 30 or more trades per quarter.
Adjusted total assets—E*TRADE Bank-only assets composed of total assets plus/(less) unrealized losses (gains) on available-for-sale securities, less deferred tax assets, goodwill and certain other intangible assets.
Agency—U.S. Government sponsored and federal agencies, such as Federal National Mortgage Association, Federal Home Loan Mortgage Corporate and Government National Mortgage Association.
ALCO—Asset Liability Committee.
APIC—Additional paid-in capital.
ARM—Adjustable-rate mortgage.
Average commission per trade—Total trading and investing segment commissions revenue divided by total number of trades.
Average equity to average total assets—Average total shareholders’ equity divided by average total assets.
Bank—ETB Holdings, Inc. (“ETBH”), the entity that is our bank holding company and parent to E*TRADE Bank.
Basis point—One one-hundredth of a percentage point.
BOLI—Bank-Owned Life Insurance.
Cash flow hedge—A derivative instrument designated in a hedging relationship that mitigates exposure to variability in expected future cash flows attributable to a particular risk.
CDS—Credit default swap, which is a swap designed to transfer credit exposure between parties.
Charge-off—The result of removing a loan or portion of a loan from an entity’s balance sheet because the loan is considered to be uncollectible.
Citadel Investment—In 2007, we entered into an agreement to receive a $2.5 billion cash infusion from Citadel. In consideration for the cash infusion, Citadel received three primary items: substantially all of our asset-backed securities portfolio, 84.7 million shares of common stock in the Company and approximately $1.8 billion 12 1/2% Notes.
CLTV—Combined loan-to-value.
CDOs—Collateralized debt obligations.
CMOs—Collateralized mortgage obligations.
Corporate cash—Cash held at the parent company as well as cash held in certain subsidiaries that can distribute cash to the parent company without any regulatory approval.
Customer assets—Market value of all customer assets held by the Company including security holdings, customer cash and deposits and vested unexercised options.
88
Table of Contents
Customer cash and deposits—Customer cash, deposits, customer payables and money market balances, including those held by third parties.
Daily average revenue trades (“DARTs”)—Total revenue trades in a period divided by the number of trading days during that period.
DBRS—Dominion Bond Rating Service.
Debt Exchange—In the third quarter of 2009, we exchanged $1.7 billion aggregate principal amount of our corporate debt, including $1.3 billion principal amount of our 12 1/2% Notes and $0.4 billion principal amount of our 8% Notes, for an equal principal amount of newly-issued non-interest-bearing convertible debentures.
Derivative—A financial instrument or other contract, the price of which is directly dependent upon the value of one or more underlying securities, interest rates or any agreed upon pricing index. Derivatives cover a wide assortment of financial contracts, including forward contracts, options and swaps.
Enterprise interest-bearing liabilities—Liabilities such as customer deposits, repurchase agreements and other borrowings, FHLB advances, certain customer credit balances and stock loan programs on which the Company pays interest; excludes customer money market balances held by third parties.
Enterprise interest-earning assets—Consists of the primary interest-earning assets of the Company and includes: loans, available-for-sale mortgage-backed and investment securities, margin receivables, trading securities, stock borrow balances and cash required to be segregated under regulatory guidelines that earn interest for the Company.
Enterprise net interest income—The taxable equivalent basis net operating interest income excluding corporate interest income and corporate interest expense and interest earned on customer cash held by third parties.
Enterprise net interest margin—The enterprise net operating interest income divided by total enterprise interest-earning assets.
Enterprise net interest spread—The taxable equivalent rate earned on average enterprise interest-earning assets less the rate paid on average enterprise interest-bearing liabilities, excluding corporate interest-earning assets and liabilities and customer cash held by third parties.
Exchange-traded funds—A fund that invests in a group of securities and trades like an individual stock on an exchange.
Fair value—The price that would be received to sell an asset or paid to transfer a liability in an orderly transaction between market participants at the measurement date.
Fair value hedge—A derivative instrument designated in a hedging relationship that mitigates exposure to changes in the fair value of a recognized asset or liability or a firm commitment.
Fannie Mae—Federal National Mortgage Association.
FASB—Financial Accounting Standards Board.
FDIC—Federal Deposit Insurance Corporation.
FHLB—Federal Home Loan Bank.
FICO—Fair Isaac Credit Organization.
89
Table of Contents
FINRA—Financial Industry Regulatory Authority.
Fixed Charge Coverage Ratio—Net loss before taxes, depreciation and amortization and corporate interest expense divided by corporate interest expense. This ratio indicates the Company’s ability to satisfy fixed financing expenses.
Freddie Mac—Federal Home Loan Mortgage Corporation.
Generally Accepted Accounting Principles (“GAAP”)—Accounting principles generally accepted in the United States of America.
LIBOR—London Interbank Offered Rate. LIBOR is the interest rate at which banks borrow funds from other banks in the London wholesale money market (or interbank market).
Interest rate cap—An options contract that puts an upper limit on a floating exchange rate. The writer of the cap has to pay the holder of the cap the difference between the floating rate and the upper limit when that upper limit is breached. There is usually a premium paid by the buyer of such a contract.
Interest rate floor—An options contract that puts a lower limit on a floating exchange rate. The writer of the floor has to pay the holder of the floor the difference between the floating rate and the lower limit when that lower limit is breached. There is usually a premium paid by the buyer of such a contract.
Interest rate swaps—Contracts that are entered into primarily as an asset/liability management strategy to reduce interest rate risk. Interest rate swap contracts are exchanges of interest rate payments, such as fixed-rate payments for floating-rate payments, based on notional principal amounts.
Long term investor—The customer group that includes those who invest for the long term.
LTV—Loan-to-value.
NASDAQ—National Association of Securities Dealers Automated Quotations.
Net New Customer Asset Flows—The total inflows to all new and existing customer accounts less total outflows from all closed and existing customer accounts, excluding the effects of market movements in the value of customer assets.
Net Present Value of Equity (“NPVE”)—The present value of expected cash inflows from existing assets, minus the present value of expected cash outflows from existing liabilities, plus the expected cash inflows and outflows from existing derivatives and forward commitments. This calculation is performed for E*TRADE Bank.
NOLs—Net operating losses.
Nonperforming assets—Assets that do not earn income, including those originally acquired to earn income (nonperforming loans) and those not intended to earn income (REO). Loans are classified as nonperforming when full and timely collection of interest and principal becomes uncertain or when the loans are 90 days past due.
Notional amount—The specified dollar amount underlying a derivative on which the calculated payments are based.
NYSE—New York Stock Exchange.
Operating margin—Loss before other income (expense), income tax benefit and discontinued operations.
Options—Contracts that grant the purchaser, for a premium payment, the right, but not the obligation, to either purchase or sell the associated financial instrument at a set price during a period or at a specified date in the future.
90
Table of Contents
Organic—Business related to new and existing customers as opposed to acquisitions.
OTS—Office of Thrift Supervision.
OTTI—Other-than-temporary impairment.
Principal transactions—Transactions that primarily consist of revenue from market-making activities.
QSPEs—Qualifying special-purpose entities.
Real estate owned (“REO”) and other repossessed assets—Ownership of real property by the Company, generally acquired as a result of foreclosure or repossession.
Recovery—Cash proceeds received on a loan that had been previously charged off.
Repurchase agreement—An agreement giving the seller of an asset the right or obligation to buy back the same or similar securities at a specified price on a given date. These agreements are generally collateralized by mortgage-backed or investment-grade securities.
Retail deposits—Balances of customer cash held at the Bank; excludes brokered certificates of deposit.
Return on average total assets—Annualized net income divided by average assets.
Return on average total shareholders’ equity—Annualized net income divided by average shareholders’ equity.
Risk-weighted assets—Primarily computed by the assignment of specific risk-weightings assigned by the OTS to assets and off-balance sheet instruments for capital adequacy calculations. This calculation is for E*TRADE Bank only.
SEC—Securities and Exchange Commission.
Special mention loans—loans where a borrower’s past credit history casts doubt on their ability to repay a loan. Loans are classified as special mention when loans are between 30 and 89 days past due.
S&P—Standard & Poor’s.
Sweep deposit accounts—Accounts with the functionality to transfer brokerage cash balances to and from a FDIC insured money market account at the banking subsidiaries.
Sub-prime—Defined as borrowers with FICO scores less than 620 at the time of origination.
Taxable equivalent interest adjustment—The operating interest income earned on certain assets is completely or partially exempt from federal and/or state income tax. As such, these tax-exempt instruments typically yield lower returns than a taxable investment. To provide more meaningful comparison of yields and margins for all interest-earning assets, the interest income earned on tax exempt assets is increased to make it fully equivalent to interest income on other taxable investments. This adjustment is done for the analytic purposes in the net enterprise interest income/spread calculation and is not made on the consolidated statement loss, as that is not permitted under GAAP.
Tier 1 capital—Adjusted equity capital used in the calculation of capital adequacy ratios at E*TRADE Bank as required by the OTS. Tier 1 capital equals: total shareholder’s equity at E*TRADE Bank, plus/(less) unrealized losses (gains) on available-for-sale securities and cash flow hedges, less deferred tax assets, goodwill and certain other intangible assets.
Troubled Debt Restructuring (“TDR”)—A loan modification that involves granting an economic concession to a borrower who is experiencing financial difficulty.
91
Table of Contents
| ITEM 7A. | QUANTITATIVE AND QUALITATIVE DISCLOSURES ABOUT MARKET RISK |
The following discussion about our market risk disclosure includes forward-looking statements. Actual results could differ materially from those projected in the forward-looking statements as a result of certain factors, including, but not limited to, those set forth in Item 1A. “Risk Factors” in this report. Market risk is our exposure to changes in interest rates, foreign exchange rates and equity and commodity prices. Our exposure to interest rate risk is related primarily to interest-earning assets and interest-bearing liabilities.
Interest Rate Risk
The management of interest rate risk is essential to profitability. Interest rate risk is our exposure to changes in interest rates. In general, we manage our interest rate risk by balancing variable-rate and fixed-rate assets and liabilities and we utilize derivatives in a way that reduces our overall exposure to changes in interest rates. In recent years, we have managed our interest rate risk to achieve a minimum to moderate risk profile with limited exposure to earnings volatility resulting from interest rate fluctuations. Exposure to interest rate risk requires management to make complex assumptions regarding maturities, market interest rates and customer behavior. Changes in interest rates, including the following, could impact interest income and expense:
| • | Interest-earning assets and interest-bearing liabilities may re-price at different times or by different amounts creating a mismatch. |
| • | The yield curve may flatten or change shape affecting the spread between short- and long-term rates. Widening or narrowing spreads could impact net interest income. |
| • | Market interest rates may influence prepayments resulting in maturity mismatches. In addition, prepayments could impact yields as premiums and discounts amortize. |
Exposure to market risk is dependent upon the distribution and composition of interest-earning assets, interest-bearing liabilities and derivatives. The differing risk characteristics of each product are managed to mitigate our exposure to interest rate fluctuations. At December 31, 2009, 92% of our total assets were enterprise interest-earning assets.
At December 31, 2009, approximately 59% of our total assets were residential real estate loans and available-for-sale mortgage-backed securities. The values of these assets are sensitive to changes in interest rates, as well as expected prepayment levels. As interest rates increase, fixed rate residential mortgages and mortgage-backed securities tend to exhibit lower prepayments. The inverse is true in a falling rate environment.
When real estate loans prepay, unamortized premiums are written off. Depending on the timing of the prepayment, the write-offs of unamortized premiums may result in lower than anticipated yields. The ALCO reviews estimates of the impact of changing market rates on prepayments. This information is incorporated into our interest rate risk management strategy.
Our liability structure consists of two central sources of funding: deposits and wholesale borrowings. Cash provided to us through deposits is the primary source of our funding. Our key deposit products include sweep accounts, complete savings accounts and other money market and savings accounts. Our wholesale borrowings include securities sold under agreements to repurchase and FHLB advances. Customer payables, which represents customer cash contained within our broker-dealers, is an additional source of funding. In addition, the parent company has issued a significant amount of corporate debt.
Our deposit accounts and customer payables tend to be less rate-sensitive than wholesale borrowings. Agreements to repurchase securities re-price as interest rates change. Sweep accounts, complete savings accounts, other money market and savings accounts re-price at management’s discretion. FHLB advances and corporate debt generally have fixed rates.
92
Table of Contents
Derivative Instruments
We use derivative instruments to help manage our interest rate risk. Interest rate swaps involve the exchange of fixed-rate and variable-rate interest payments between two parties based on a contractual underlying notional amount, but do not involve the exchange of the underlying notional amounts. Option products are utilized primarily to decrease the market value changes resulting from the prepayment dynamics of the mortgage portfolio, as well as to protect against increases in funding costs. The types of options employed include Cap Options (“Caps”) and Floor Options (“Floors”). Caps mitigate the market risk associated with increases in interest rates while Floors mitigate the risk associated with decreases in market interest rates. See derivative instruments discussion at Note 8—Accounting for Derivative Instruments and Hedging Activities of Item 8. Financial Statements and Supplementary Data.
Scenario Analysis
Scenario analysis is an advanced approach to estimating interest rate risk exposure. Under the NPVE approach, the present value of all existing assets, liabilities, derivatives and forward commitments are estimated and then combined to produce a NPVE figure. The sensitivity of this value to changes in interest rates is then determined by applying alternative interest rate scenarios, which include, but are not limited to, instantaneous parallel shifts up 100, 200 and 300 basis points and down 100 basis points. The NPVE method is used at the E*TRADE Bank level and not for the Company. E*TRADE Bank has 97% and 98% of our enterprise interest-earning assets at December 31, 2009 and 2008, respectively, and holds 97% and 98% of our enterprise interest-bearing liabilities at December 31, 2009 and 2008, respectively. The sensitivity of NPVE at December 31, 2009 and 2008 and the limits established by E*TRADE Bank’s Board of Directors are listed below (dollars in millions):
| Change in NPVE | |||||||||||||||||
| December 31, 2009(1) | December 31, 2008 | ||||||||||||||||
| Parallel Change in Interest Rates (basis points)(2) |
Amount | Percentage | Amount | Percentage | Board Limit | ||||||||||||
| +300 |
$ | (453.6 | ) | (14 | )% | $ | (65.6 | ) | (3 | )% | (55 | )% | |||||
| +200 |
$ | (276.6 | ) | (9 | )% | $ | 68.9 | 3 | % | (30 | )% | ||||||
| +100 |
$ | (89.2 | ) | (3 | )% | $ | 119.4 | 5 | % | (20 | )% | ||||||
| -100 |
$ | (110.5 | ) | (3 | )% | $ | (334.1 | ) | (14 | )% | (20 | )% | |||||
| (1) | Amounts and percentages include E*TRADE Securities LLC. |
| (2) | On December 31, 2009 and 2008, the yield on the three-month Treasury bill was 0.06% and 0.11%, respectively. As a result, the OTS temporarily modified the requirements of the NPV Model, resulting in removal of the minus 200 and 300 basis points scenarios for the periods ended December 31, 2009 and 2008. |
Under criteria published by the OTS, E*TRADE Bank’s overall interest rate risk exposure at December 31, 2009 was characterized as “minimum.” We actively manage our interest rate risk positions. As interest rates change, we will re-adjust our strategy and mix of assets, liabilities and derivatives to optimize our position. For example, a 100 basis points increase in rates may not result in a change in value as indicated above. The ALCO monitors E*TRADE Bank’s interest rate risk position.
Other Market Risk
Equity Security Risk
Equity securities risk is the risk of potential loss from investing in public and private equity securities. We hold equity securities for corporate investment and market-making purposes. For corporate investment purposes, we currently hold publicly traded equity securities with a fair value of $0.8 million as of December 31, 2009. For market-making purposes, we currently hold equity securities with a fair value of $67.2 million as of December 31, 2009.
93
Table of Contents
| ITEM 8. | FINANCIAL STATEMENTS AND SUPPLEMENTARY DATA |
MANAGEMENT REPORT ON INTERNAL CONTROL OVER FINANCIAL REPORTING
The management of E*TRADE Financial Corporation is responsible for establishing and maintaining adequate internal control over financial reporting. E*TRADE Financial Corporation’s internal control system was designed to provide reasonable assurance to the company’s management and board of directors regarding the preparation and fair presentation of published financial statements. Internal control over financial reporting is defined in Rule 13a-15(f) or 15d-15(f) promulgated under the Securities Exchange Act of 1934 as a process designed by, or under the supervision of, the company’s principal executive and principal financial officers and effected by the company’s board of directors, management and other personnel, to provide reasonable assurance regarding the reliability of financial reporting and the preparation of financial statements for external purposes in accordance with GAAP and includes those policies and procedures that:
| • | pertain to the maintenance of records that, in reasonable detail, accurately and fairly reflect the transactions and dispositions of the assets of the company; |
| • | provide reasonable assurance that transactions are recorded as necessary to permit preparation of financial statements in accordance with GAAP, and that receipts and expenditures of the company are being made only in accordance with authorizations of management and directors of the company; and |
| • | provide reasonable assurance regarding prevention or timely detection of unauthorized acquisition, use or disposition of the company’s assets that could have a material effect on the financial statements. |
Because of the inherent limitations of internal control over financial reporting, including the possibility of collusion or improper management override of controls, material misstatements due to error or fraud may not be prevented or detected on a timely basis. Also, projections of any evaluation of the effectiveness of the internal control over financial reporting to future periods are subject to the risk that the controls may become inadequate because of changes in conditions, or that the degree of compliance with the policies or procedures may deteriorate.
E*TRADE Financial Corporation’s management assessed the effectiveness of its internal control over financial reporting as of December 31, 2009. In making this assessment, management used the criteria set forth by the Committee of Sponsoring Organizations of the Treadway Commission in “Internal Control—Integrated Framework.” Based on management’s assessment, management believes as of December 31, 2009, that E*TRADE Financial Corporation’s internal control over financial reporting is effective based on those criteria.
E*TRADE Financial Corporation’s Independent Registered Public Accounting Firm, Deloitte & Touche LLP, has issued an audit report regarding E*TRADE Financial Corporation’s internal control over financial reporting. The report of Deloitte & Touche LLP appears on the next page.
94
Table of Contents
REPORTS OF INDEPENDENT REGISTERED PUBLIC ACCOUNTING FIRM
To the Board of Directors and Shareholders of
E*TRADE Financial Corporation
New York, New York
We have audited the internal control over financial reporting of E*TRADE Financial Corporation and subsidiaries (the “Company”) as of December 31, 2009, based on criteria established in Internal Control—Integrated Framework issued by the Committee of Sponsoring Organizations of the Treadway Commission. The Company’s management is responsible for maintaining effective internal control over financial reporting and for its assessment of the effectiveness of internal control over financial reporting, included in the accompanying Management Report on Internal Control Over Financial Reporting. Our responsibility is to express an opinion on the Company’s internal control over financial reporting based on our audit.
We conducted our audit in accordance with the standards of the Public Company Accounting Oversight Board (United States). Those standards require that we plan and perform the audit to obtain reasonable assurance about whether effective internal control over financial reporting was maintained in all material respects. Our audit included obtaining an understanding of internal control over financial reporting, assessing the risk that a material weakness exists, testing and evaluating the design and operating effectiveness of internal control based on the assessed risk, and performing such other procedures as we considered necessary in the circumstances. We believe that our audit provides a reasonable basis for our opinion.
A company’s internal control over financial reporting is a process designed by, or under the supervision of, the company’s principal executive and principal financial officers, or persons performing similar functions, and effected by the company’s board of directors, management, and other personnel to provide reasonable assurance regarding the reliability of financial reporting and the preparation of financial statements for external purposes in accordance with generally accepted accounting principles. A company’s internal control over financial reporting includes those policies and procedures that (1) pertain to the maintenance of records that, in reasonable detail, accurately and fairly reflect the transactions and dispositions of the assets of the company; (2) provide reasonable assurance that transactions are recorded as necessary to permit preparation of financial statements in accordance with generally accepted accounting principles, and that receipts and expenditures of the company are being made only in accordance with authorizations of management and directors of the company; and (3) provide reasonable assurance regarding prevention or timely detection of unauthorized acquisition, use, or disposition of the company’s assets that could have a material effect on the financial statements.
Because of the inherent limitations of internal control over financial reporting, including the possibility of collusion or improper management override of controls, material misstatements due to error or fraud may not be prevented or detected on a timely basis. Also, projections of any evaluation of the effectiveness of the internal control over financial reporting to future periods are subject to the risk that the controls may become inadequate because of changes in conditions, or that the degree of compliance with the policies or procedures may deteriorate.
In our opinion, the Company maintained, in all material respects, effective internal control over financial reporting as of December 31, 2009, based on the criteria established in Internal Control—Integrated Framework issued by the Committee of Sponsoring Organizations of the Treadway Commission.
We have also audited, in accordance with the standards of the Public Company Accounting Oversight Board (United States), the consolidated financial statements as of and for the year ended December 31, 2009 of the Company and our report dated February 24, 2010 expressed an unqualified opinion on those consolidated financial statements and included an explanatory paragraph regarding the Company’s adoption of a new accounting standard on April 1, 2009.
/s/ Deloitte & Touche LLP
McLean, Virginia
February 24, 2010
95
Table of Contents
To the Board of Directors and Shareholders of
E*TRADE Financial Corporation
New York, New York
We have audited the accompanying consolidated balance sheets of E*TRADE Financial Corporation and subsidiaries (the “Company”) as of December 31, 2009 and 2008, and the related consolidated statements of loss, comprehensive loss, shareholders’ equity, and cash flows for each of the three years in the period ended December 31, 2009. These consolidated financial statements are the responsibility of the Company’s management. Our responsibility is to express an opinion on these consolidated financial statements based on our audits.
We conducted our audits in accordance with the standards of the Public Company Accounting Oversight Board (United States). Those standards require that we plan and perform the audit to obtain reasonable assurance about whether the consolidated financial statements are free of material misstatement. An audit includes examining, on a test basis, evidence supporting the amounts and disclosures in the consolidated financial statements. An audit also includes assessing the accounting principles used and significant estimates made by management, as well as evaluating the overall consolidated financial statement presentation. We believe that our audits provide a reasonable basis for our opinion.
In our opinion, such consolidated financial statements present fairly, in all material respects, the financial position of E*TRADE Financial Corporation and subsidiaries as of December 31, 2009 and 2008, and the results of their operations and their cash flows for each of the three years in the period ended December 31, 2009, in conformity with accounting principles generally accepted in the United States of America.
As discussed in Notes 1 and 17 to the consolidated financial statements, the Company adopted the accounting standards: Accounting for Uncertainty in Income Taxes, as of January 1, 2007; Fair Value Measurement and The Fair Value Option for Financial Assets and Financial Liabilities, on January 1, 2008; and Recognition and Presentation of Other-Than-Temporary Impairments, on April 1, 2009.
We have also audited, in accordance with the standards of the Public Company Accounting Oversight Board (United States), the Company’s internal control over financial reporting as of December 31, 2009, based on the criteria established in Internal Control—Integrated Framework issued by the Committee of Sponsoring Organizations of the Treadway Commission and our report dated February 24, 2010 expressed an unqualified opinion on the Company’s internal control over financial reporting.
/s/ Deloitte & Touche LLP
McLean, Virginia
February 24, 2010
96
Table of Contents
E*TRADE FINANCIAL CORPORATION AND SUBSIDIARIES
CONSOLIDATED STATEMENT OF LOSS
(In thousands, except per share amounts)
| Year Ended December 31, | ||||||||||||
| 2009 | 2008 | 2007 | ||||||||||
| Revenue: |
||||||||||||
| Operating interest income |
$ | 1,832,558 | $ | 2,469,940 | $ | 3,523,055 | ||||||
| Operating interest expense |
(571,956 | ) | (1,201,934 | ) | (1,939,456 | ) | ||||||
| Net operating interest income |
1,260,602 | 1,268,006 | 1,583,599 | |||||||||
| Commissions |
547,993 | 515,551 | 663,642 | |||||||||
| Fees and service charges |
192,516 | 199,956 | 230,567 | |||||||||
| Principal transactions |
88,053 | 84,882 | 102,180 | |||||||||
| Gains (losses) on loans and securities, net |
169,106 | (100,473 | ) | (2,296,735 | ) | |||||||
| Other-than-temporary impairment (“OTTI”) |
(232,139 | ) | (95,010 | ) | (168,739 | ) | ||||||
| Less: noncredit portion of OTTI recognized in other comprehensive loss (before tax) |
143,044 | — | — | |||||||||
| Net impairment |
(89,095 | ) | (95,010 | ) | (168,739 | ) | ||||||
| Other revenues |
47,841 | 52,684 | 47,212 | |||||||||
| Total non-interest income (expense) |
956,414 | 657,590 | (1,421,873 | ) | ||||||||
| Total net revenue |
2,217,016 | 1,925,596 | 161,726 | |||||||||
| Provision for loan losses |
1,498,112 | 1,583,666 | 640,078 | |||||||||
| Operating expense: |
||||||||||||
| Compensation and benefits |
366,232 | 383,385 | 434,785 | |||||||||
| Clearing and servicing |
170,711 | 185,082 | 270,199 | |||||||||
| Advertising and market development |
114,399 | 175,250 | 138,675 | |||||||||
| FDIC insurance premiums |
94,258 | 31,258 | 20,200 | |||||||||
| Communications |
84,381 | 96,792 | 98,347 | |||||||||
| Professional services |
78,718 | 94,070 | 99,193 | |||||||||
| Occupancy and equipment |
78,360 | 85,766 | 85,189 | |||||||||
| Depreciation and amortization |
83,337 | 82,483 | 83,198 | |||||||||
| Amortization of other intangibles |
29,737 | 35,746 | 40,472 | |||||||||
| Impairment of goodwill |
— | — | 101,208 | |||||||||
| Facility restructuring and other exit activities |
20,652 | 29,502 | 27,183 | |||||||||
| Other operating expenses |
122,544 | 90,881 | 175,184 | |||||||||
| Total operating expense |
1,243,329 | 1,290,215 | 1,573,833 | |||||||||
| Loss before other income (expense), income tax benefit and discontinued operations |
(524,425 | ) | (948,285 | ) | (2,052,185 | ) | ||||||
| Other income (expense): |
||||||||||||
| Corporate interest income |
860 | 7,210 | 5,755 | |||||||||
| Corporate interest expense |
(282,688 | ) | (362,160 | ) | (172,482 | ) | ||||||
| Gains (losses) on sales of investments, net |
(1,714 | ) | (4,230 | ) | 35,980 | |||||||
| Gains (losses) on early extinguishment of debt |
(1,018,848 | ) | 10,084 | (19 | ) | |||||||
| Equity in income (loss) of investments and venture funds |
(8,616 | ) | 18,462 | 7,665 | ||||||||
| Total other income (expense) |
(1,311,006 | ) | (330,634 | ) | (123,101 | ) | ||||||
| Loss before income tax benefit and discontinued operations |
(1,835,431 | ) | (1,278,919 | ) | (2,175,286 | ) | ||||||
| Income tax benefit |
(537,669 | ) | (469,535 | ) | (732,949 | ) | ||||||
| Loss from continuing operations |
(1,297,762 | ) | (809,384 | ) | (1,442,337 | ) | ||||||
| Income from discontinued operations, net of tax |
— | 297,594 | 583 | |||||||||
| Net loss |
$ | (1,297,762 | ) | $ | (511,790 | ) | $ | (1,441,754 | ) | |||
| Basic loss per share from continuing operations |
$ | (1.18 | ) | $ | (1.58 | ) | $ | (3.40 | ) | |||
| Basic earnings per share from discontinued operations |
— | 0.58 | 0.00 | |||||||||
| Basic net loss per share |
$ | (1.18 | ) | $ | (1.00 | ) | $ | (3.40 | ) | |||
| Diluted loss per share from continuing operations |
$ | (1.18 | ) | $ | (1.58 | ) | $ | (3.40 | ) | |||
| Diluted earnings per share from discontinued operations |
— | 0.58 | 0.00 | |||||||||
| Diluted net loss per share |
$ | (1.18 | ) | $ | (1.00 | ) | $ | (3.40 | ) | |||
| Shares used in computation of per share data: |
||||||||||||
| Basic |
1,095,437 | 509,862 | 424,439 | |||||||||
| Diluted |
1,095,437 | 509,862 | 424,439 | |||||||||
See accompanying notes to consolidated financial statements
97
Table of Contents
E*TRADE FINANCIAL CORPORATION AND SUBSIDIARIES
CONSOLIDATED BALANCE SHEET
(In thousands, except share amounts)
| December 31, | ||||||||
| 2009 | 2008 | |||||||
| ASSETS |
||||||||
| Cash and equivalents |
$ | 3,483,238 | $ | 3,853,849 | ||||
| Cash and investments required to be segregated under federal or other regulations |
1,545,280 | 1,141,598 | ||||||
| Trading securities |
38,303 | 55,481 | ||||||
| Available-for-sale mortgage-backed and investment securities (includes securities pledged to creditors with the right to sell or repledge of $7,298,631 and $8,398,346 at December 31, 2009 and 2008, respectively) |
13,319,712 | 10,806,094 | ||||||
| Margin receivables |
3,827,212 | 2,791,168 | ||||||
| Loans, net (net of allowance for loan losses of $1,182,738 and $1,080,611 at December 31, 2009 and 2008, respectively) |
19,174,933 | 24,451,852 | ||||||
| Investment in FHLB stock |
183,863 | 200,892 | ||||||
| Property and equipment, net |
320,169 | 319,222 | ||||||
| Goodwill |
1,952,326 | 1,938,325 | ||||||
| Other intangibles, net |
356,404 | 386,130 | ||||||
| Other assets |
3,165,045 | 2,593,604 | ||||||
| Total assets |
$ | 47,366,485 | $ | 48,538,215 | ||||
| LIABILITIES AND SHAREHOLDERS’ EQUITY |
||||||||
| Liabilities: |
||||||||
| Deposits |
$ | 25,597,721 | $ | 26,136,246 | ||||
| Securities sold under agreements to repurchase |
6,441,875 | 7,381,279 | ||||||
| Customer payables |
5,234,199 | 3,753,332 | ||||||
| Other borrowings |
2,746,959 | 4,353,777 | ||||||
| Corporate debt |
2,458,691 | 2,750,532 | ||||||
| Accounts payable, accrued and other liabilities |
1,137,485 | 1,571,553 | ||||||
| Total liabilities |
43,616,930 | 45,946,719 | ||||||
| Commitments and contingencies (see Note 22) |
||||||||
| Shareholders’ equity: |
||||||||
| Common stock, $0.01 par value, shares authorized: 4,000,000,000 and 1,200,000,000 at December 31, 2009 and 2008, respectively; shares issued and outstanding: 1,893,970,995 and 563,523,086 at December 31, 2009 and 2008, respectively |
18,940 | 5,635 | ||||||
| Additional paid-in capital (“APIC”) |
6,258,111 | 4,064,282 | ||||||
| Accumulated deficit |
(2,123,366 | ) | (845,767 | ) | ||||
| Accumulated other comprehensive loss |
(404,130 | ) | (632,654 | ) | ||||
| Total shareholders’ equity |
3,749,555 | 2,591,496 | ||||||
| Total liabilities and shareholders’ equity |
$ | 47,366,485 | $ | 48,538,215 | ||||
See accompanying notes to consolidated financial statements
98
Table of Contents
E*TRADE FINANCIAL CORPORATION AND SUBSIDIARIES
CONSOLIDATED STATEMENT OF COMPREHENSIVE LOSS
(In thousands)
| Year Ended December 31, | ||||||||||||
| 2009 | 2008 | 2007 | ||||||||||
| Net loss |
$ | (1,297,762 | ) | $ | (511,790 | ) | $ | (1,441,754 | ) | |||
| Other comprehensive income (loss): |
||||||||||||
| Available-for-sale securities: |
||||||||||||
| OTTI, net(1) |
133,179 | — | — | |||||||||
| Noncredit portion of OTTI reclassification out of (into) other comprehensive loss, net(2) |
(91,246 | ) | — | — | ||||||||
| Unrealized gains (losses), net(3) |
160,398 | (18,088 | ) | (478,538 | ) | |||||||
| Reclassification into earnings, net(4) |
(94,743 | ) | 35,255 | 361,569 | ||||||||
| Net change from available-for-sale securities |
107,588 | 17,167 | (116,969 | ) | ||||||||
| Cash flow hedging instruments: |
||||||||||||
| Unrealized gains (losses), net(5) |
101,886 | (302,132 | ) | (116,101 | ) | |||||||
| Reclassifications into earnings, net(6) |
37,055 | 16,866 | 11,722 | |||||||||
| Net change from cash flow hedging instruments |
138,941 | (285,266 | ) | (104,379 | ) | |||||||
| Foreign currency translation gains (losses) |
2,158 | (37,476 | ) | 31,424 | ||||||||
| Reclassification of foreign currency translation gains associated with the disposition of a subsidiary |
— | (22,577 | ) | — | ||||||||
| Other comprehensive income (loss) |
248,687 | (328,152 | ) | (189,924 | ) | |||||||
| Comprehensive loss |
$ | (1,049,075 | ) | $ | (839,942 | ) | $ | (1,631,678 | ) | |||
| (1) | Amount is net of benefit from income taxes of $80.2 million for the year ended December 31, 2009. |
| (2) | Amount is net of benefit from income taxes of $51.8 million for the year ended December 31, 2009. |
| (3) | Amounts are net of provision for income taxes of $96.5 million for the year ended December 31, 2009, and benefit from income taxes of $7.4 million and $286.2 million for the years ended December 31, 2008, and 2007, respectively. |
| (4) | Amounts are net of provision for income taxes of $59.7 million for the year ended December 31, 2009, and benefit from income taxes of $18.4 million and $217.8 million the years ended December 31, 2008 and 2007, respectively. |
| (5) | Amounts are net of provision for income taxes of $59.8 million for the year ended December 31, 2009, and benefit from income taxes of $185.5 million and $68.9 million the years ended December 31, 2008 and 2007, respectively. |
| (6) | Amounts are net of benefit from income taxes of $22.2 million, $9.5 million, and $16.8 million for the years ended December 31, 2009, 2008 and 2007, respectively. |
See accompanying notes to consolidated financial statements
99
Table of Contents
E*TRADE FINANCIAL CORPORATION AND SUBSIDIARIES
CONSOLIDATED STATEMENT OF SHAREHOLDERS’ EQUITY
(In thousands)
| Common Stock | Additional Paid-in Capital |
Retained Earnings (Accumulated Deficit) |
Accumulated Other Comprehensive Loss |
Total Shareholders’ Equity |
|||||||||||||||||||
| Shares | Amount | ||||||||||||||||||||||
| Balance, December 31, 2006 |
426,304 | $ | 4,263 | $ | 3,184,290 | $ | 1,209,289 | $ | (201,472 | ) | $ | 4,196,370 | |||||||||||
| Cumulative effect of the adoption of accounting guidance on January 1, 2007(1) |
— | — | — | (14,903 | ) | — | (14,903 | ) | |||||||||||||||
| Adjusted balance |
426,304 | 4,263 | 3,184,290 | 1,194,386 | (201,472 | ) | 4,181,467 | ||||||||||||||||
| Net loss |
— | — | — | (1,441,754 | ) | — | (1,441,754 | ) | |||||||||||||||
| Other comprehensive loss |
— | — | — | — | (189,924 | ) | (189,924 | ) | |||||||||||||||
| Issuance of common stock |
38,023 | 380 | 338,598 | — | — | 338,978 | |||||||||||||||||
| Repurchases of common stock |
(7,228 | ) | (72 | ) | (148,560 | ) | — | — | (148,632 | ) | |||||||||||||
| Exercise of stock options and purchase plans and related tax effects |
4,260 | 43 | 55,848 | — | — | 55,891 | |||||||||||||||||
| Issuance of restricted stock, net of forfeitures and retirements to pay taxes |
(558 | ) | (6 | ) | (4,151 | ) | — | — | (4,157 | ) | |||||||||||||
| Share-based compensation |
— | — | 34,983 | — | — | 34,983 | |||||||||||||||||
| Other |
97 | 1 | 2,212 | — | — | 2,213 | |||||||||||||||||
| Balance, December 31, 2007 |
460,898 | 4,609 | 3,463,220 | (247,368 | ) | (391,396 | ) | 2,829,065 | |||||||||||||||
| Cumulative effect of the adoption of accounting guidance on January 1, 2008(1) |
— | — | — | (86,609 | ) | 86,894 | 285 | ||||||||||||||||
| Adjusted balance |
460,898 | 4,609 | 3,463,220 | (333,977 | ) | (304,502 | ) | 2,829,350 | |||||||||||||||
| Net loss |
— | — | — | (511,790 | ) | — | (511,790 | ) | |||||||||||||||
| Other comprehensive loss |
— | — | — | — | (328,152 | ) | (328,152 | ) | |||||||||||||||
| Issuance of common stock |
46,685 | — | — | — | — | — | |||||||||||||||||
| Exchange of debt for common stock |
52,094 | 521 | 554,656 | — | — | 555,177 | |||||||||||||||||
| Exercise of stock options and purchase plans and related tax effects |
633 | 6 | (7,401 | ) | — | — | (7,395 | ) | |||||||||||||||
| Issuance of restricted stock, net of forfeitures and retirements to pay taxes |
464 | 5 | (2,248 | ) | — | — | (2,243 | ) | |||||||||||||||
| Share-based compensation |
— | — | 42,426 | — | — | 42,426 | |||||||||||||||||
| Other |
2,749 | 494 | 13,629 | — | — | 14,123 | |||||||||||||||||
| Balance, December 31, 2008 |
563,523 | $ | 5,635 | $ | 4,064,282 | $ | (845,767 | ) | $ | (632,654 | ) | $ | 2,591,496 | ||||||||||
| (1) | See Note 17—Shareholders’ Equity for more details related to the cumulative effect of the adoption of accounting guidance. |
See accompanying notes to consolidated financial statements
100
Table of Contents
E*TRADE FINANCIAL CORPORATION AND SUBSIDIARIES
CONSOLIDATED STATEMENT OF SHAREHOLDERS’ EQUITY—(Continued)
(In thousands)
| Common Stock | Additional Paid-in Capital |
Accumulated Deficit |
Accumulated Other Comprehensive Loss |
Total Shareholders’ Equity |
|||||||||||||||||
| Shares | Amount | ||||||||||||||||||||
| Balance, December 31, 2008 |
563,523 | $ | 5,635 | $ | 4,064,282 | $ | (845,767 | ) | $ | (632,654 | ) | $ | 2,591,496 | ||||||||
| Cumulative effect of the adoption of accounting guidance on April 1, 2009(1) |
— | — | — | 20,163 | (20,163 | ) | — | ||||||||||||||
| Net loss |
— | — | — | (1,297,762 | ) | — | (1,297,762 | ) | |||||||||||||
| Other comprehensive income |
— | — | — | — | 248,687 | 248,687 | |||||||||||||||
| Issuance of common stock |
620,949 | 6,209 | 726,909 | — | — | 733,118 | |||||||||||||||
| Amortization of premiums on the convertible debentures |
— | — | 707,224 | — | — | 707,224 | |||||||||||||||
| Conversion of convertible debentures |
696,566 | 6,966 | 713,964 | — | — | 720,930 | |||||||||||||||
| Exercise of stock options and purchase plans and related tax effects |
— | — | (9,456 | ) | — | — | (9,456 | ) | |||||||||||||
| Issuance of restricted stock, net of forfeitures and retirements to pay taxes |
5,073 | 51 | (3,235 | ) | — | — | (3,184 | ) | |||||||||||||
| Share-based compensation |
— | — | 46,184 | — | — | 46,184 | |||||||||||||||
| Other |
7,860 | 79 | 12,239 | — | — | 12,318 | |||||||||||||||
| Balance, December 31, 2009 |
1,893,971 | $ | 18,940 | $ | 6,258,111 | $ | (2,123,366 | ) | $ | (404,130 | ) | $ | 3,749,555 | ||||||||
| (1) | See Note 17—Shareholders’ Equity for more details related to the cumulative effect of the adoption of accounting guidance. |
See accompanying notes to consolidated financial statements
101
Table of Contents
E*TRADE FINANCIAL CORPORATION AND SUBSIDIARIES
CONSOLIDATED STATEMENT OF CASH FLOWS
(In thousands)
| Year Ended December 31, | ||||||||||||
| 2009 | 2008 | 2007 | ||||||||||
| Cash flows from operating activities: |
||||||||||||
| Net loss |
$ | (1,297,762 | ) | $ | (511,790 | ) | $ | (1,441,754 | ) | |||
| Adjustments to reconcile net loss to net cash provided by operating activities: |
||||||||||||
| Provision for loan losses |
1,498,112 | 1,583,666 | 640,078 | |||||||||
| Depreciation and amortization (including discount amortization and accretion) |
345,969 | 292,828 | 282,491 | |||||||||
| Net impairment, (gains) losses on loans and securities, net and (gains) losses on sales of investments, net |
(78,297 | ) | 201,475 | 2,419,065 | ||||||||
| Impairment of goodwill |
— | — | 101,208 | |||||||||
| Equity in (income) loss of investments and venture funds |
8,616 | (18,462 | ) | (7,665 | ) | |||||||
| Gain on sale of the Canadian brokerage business |
— | (428,979 | ) | — | ||||||||
| Gain on sale of corporate aircraft related assets |
— | (23,715 | ) | — | ||||||||
| (Gains) losses on early extinguishment of debt |
1,018,848 | (10,084 | ) | 19 | ||||||||
| Share-based compensation |
46,184 | 42,426 | 34,982 | |||||||||
| Deferred taxes |
(488,689 | ) | (446,758 | ) | (425,355 | ) | ||||||
| Other |
(4,480 | ) | (11,545 | ) | 17,270 | |||||||
| Net effect of changes in assets and liabilities: |
||||||||||||
| Increase in cash and investments required to be segregated under federal or other regulations |
(394,523 | ) | (1,065,756 | ) | (22,045 | ) | ||||||
| (Increase) decrease in margin receivables |
(1,023,373 | ) | 4,114,180 | (284,267 | ) | |||||||
| Increase (decrease) in customer payables |
1,346,736 | (638,884 | ) | (987,620 | ) | |||||||
| Proceeds from sales, repayments and maturities of loans held-for-sale |
118,100 | 232,214 | 1,418,313 | |||||||||
| Purchases and originations of loans held-for-sale |
(125,650 | ) | (135,411 | ) | (1,261,980 | ) | ||||||
| Proceeds from sales, repayments and maturities of trading securities |
1,229,635 | 1,364,194 | 2,831,736 | |||||||||
| Purchases of trading securities |
(1,207,151 | ) | (1,260,333 | ) | (2,777,449 | ) | ||||||
| (Increase) decrease in other assets |
(265,797 | ) | 840,918 | 422,413 | ||||||||
| Increase (decrease) in accounts payable, accrued and other liabilities |
245,479 | (1,872,899 | ) | (159,190 | ) | |||||||
| Net cash provided by operating activities |
971,957 | 2,247,285 | 800,250 | |||||||||
| Cash flows from investing activities: |
||||||||||||
| Purchases of available-for-sale mortgage-backed and investment securities |
(22,370,041 | ) | (6,745,582 | ) | (13,113,671 | ) | ||||||
| Proceeds from sales, maturities of and principal payments on available-for-sale mortgage-backed and investment securities |
19,945,842 | 7,540,966 | 13,805,661 | |||||||||
| Net decrease (increase) in loans receivable |
3,555,843 | 3,449,898 | (5,341,116 | ) | ||||||||
| Purchases of property and equipment |
(86,195 | ) | (110,237 | ) | (129,295 | ) | ||||||
| Proceeds from sale of the Canadian brokerage business, net |
— | 469,737 | — | |||||||||
| Cash transferred to Scotiabank on sale of the Canadian brokerage business |
— | (502,919 | ) | — | ||||||||
| Proceeds from sale of corporate aircraft related assets |
— | 69,250 | — | |||||||||
| Proceeds from sale of RAA |
— | 22,844 | — | |||||||||
| Net cash flow from derivatives hedging assets |
991 | 11,267 | 2,176 | |||||||||
| Proceeds from sales of REO and repossessed assets |
156,783 | 91,453 | 32,260 | |||||||||
| Other |
(5,000 | ) | (7,840 | ) | (45,796 | ) | ||||||
| Net cash provided by (used in) investing activities |
$ | 1,198,223 | $ | 4,288,837 | $ | (4,789,781 | ) | |||||
102
Table of Contents
E*TRADE FINANCIAL CORPORATION AND SUBSIDIARIES
CONSOLIDATED STATEMENT OF CASH FLOWS—(Continued)
(In thousands)
| Year Ended December 31, | ||||||||||||
| 2009 | 2008 | 2007 | ||||||||||
| Cash flows from financing activities: |
||||||||||||
| Net (decrease) increase in deposits |
$ | (539,596 | ) | $ | 246,556 | $ | 1,806,961 | |||||
| Net decrease in securities sold under agreements to repurchase |
(919,784 | ) | (1,535,174 | ) | (855,054 | ) | ||||||
| Net (decrease) increase in other borrowed funds |
(7,059 | ) | 7,379 | (23,034 | ) | |||||||
| Advances from other long-term borrowings |
3,400,000 | 2,350,507 | 21,422,913 | |||||||||
| Payments on advances from other long-term borrowings |
(5,000,000 | ) | (5,462,459 | ) | (19,327,723 | ) | ||||||
| Proceeds from issuance of common stock |
733,118 | — | 338,978 | |||||||||
| Proceeds from issuance of 12 1 /2% Notes |
— | 150,000 | 1,193,767 | |||||||||
| Proceeds from issuance of trust preferred securities |
— | — | 41,000 | |||||||||
| Proceeds from issuance of common stock from employee stock transactions |
— | 2,420 | 35,981 | |||||||||
| Repurchases of common stock |
— | — | (148,632 | ) | ||||||||
| Net cash flow from derivatives hedging liabilities |
(161,074 | ) | (179,559 | ) | (28,927 | ) | ||||||
| Other |
(68,002 | ) | 4,458 | 29,946 | ||||||||
| Net cash (used in) provided by financing activities |
(2,562,397 | ) | (4,415,872 | ) | 4,486,176 | |||||||
| Effect of exchange rates on cash |
21,606 | (44,645 | ) | 69,365 | ||||||||
| (Decrease) increase in cash and equivalents |
(370,611 | ) | 2,075,605 | 566,010 | ||||||||
| Cash and equivalents, beginning of period |
3,853,849 | 1,778,244 | 1,212,234 | |||||||||
| Cash and equivalents, end of period |
$ | 3,483,238 | $ | 3,853,849 | $ | 1,778,244 | ||||||
| Supplemental disclosures: |
||||||||||||
| Cash paid for interest |
$ | 665,027 | $ | 1,612,976 | $ | 2,204,505 | ||||||
| Cash paid (refund received) for income taxes |
$ | 19,342 | $ | (415,258 | ) | $ | 123,005 | |||||
| Non-cash investing and financing activities: |
||||||||||||
| Convertible debentures issued in connection with the Debt Exchange |
$ | 1,741,871 | $ | — | $ | — | ||||||
| Transfers from loans to other real estate owned and repossessed assets |
$ | 272,306 | $ | 267,243 | $ | 114,124 | ||||||
| Conversion of convertible debentures to common stock |
$ | 720,930 | $ | — | $ | — | ||||||
| Reclassification of loans held-for-investment to loans held-for-sale |
$ | 389,337 | $ | — | $ | — | ||||||
| Reclassification of loans held-for-sale to loans held-for-investment |
$ | — | $ | 4,049 | $ | 35,672 | ||||||
| Issuance of common stock to retire debentures |
$ | — | $ | 555,177 | $ | — | ||||||
| Capitalized interest in the form of 12 1/2% Notes |
$ | 183,230 | $ | 121,000 | $ | — | ||||||
| Exchange of senior notes for 12 1 /2% Notes |
$ | — | $ | — | $ | 139,745 | ||||||
| Issuance of common stock upon acquisition |
$ | 9,000 | $ | 9,432 | $ | — | ||||||
See accompanying notes to consolidated financial statements
103
Table of Contents
E*TRADE FINANCIAL CORPORATION AND SUBSIDIARIES
NOTES TO CONSOLIDATED FINANCIAL STATEMENTS
| NOTE 1—ORGANIZATION, | BASIS OF PRESENTATION AND SUMMARY OF SIGNIFICANT ACCOUNTING POLICIES |
Organization—E*TRADE Financial Corporation is a financial services company that provides online brokerage and related products and services primarily to individual retail investors under the brand “E*TRADE Financial.” The Company also provides investor-focused banking products, primarily sweep deposits and savings products. The Company’s most significant subsidiaries are described below:
| • | E*TRADE Bank is a federally chartered savings bank that provides investor-focused banking products to retail customers nationwide and deposit accounts insured by the FDIC; |
| • | E*TRADE Capital Markets, LLC is a registered broker-dealer and market-maker; |
| • | E*TRADE Clearing LLC is the clearing firm for the Company’s brokerage subsidiaries and is a wholly-owned operating subsidiary of E*TRADE Bank. Its main purpose is to transfer securities from one party to another; and |
| • | E*TRADE Securities LLC is a registered broker-dealer and became a wholly-owned operating subsidiary of E*TRADE Bank in June 2009. It is the primary provider of brokerage services to the Company’s customers. |
Basis of Presentation—The consolidated financial statements include the accounts of the Company and its majority-owned subsidiaries. Entities in which the Company holds at least a 20% ownership or in which there are other indicators of significant influence are generally accounted for by the equity method. Entities in which the Company holds less than 20% ownership and does not have the ability to exercise significant influence are generally carried at cost. Intercompany accounts and transactions are eliminated in consolidation. The Company evaluates investments including low-income housing tax credit partnerships and other limited partnerships to determine if the Company is required to consolidate the entities under the consolidation of variable interest entities accounting guidance.
Certain prior period items in these consolidated financial statements have been reclassified to conform to the current period presentation. As discussed in Note 2—Discontinued Operations, the operations of certain businesses have been accounted for as discontinued operations and have been reclassified to discontinued operations. Unless noted, discussions herein pertain to the Company’s continuing operations. The Company evaluated events or transactions occurring after December 31, 2009 through February 24, 2010 for potential recognition or disclosure in the financial statements. These consolidated financial statements reflect all adjustments, which are all normal and recurring in nature, necessary to present fairly the financial position, results of operations and cash flows for the periods presented.
On April 1, 2009, the Company adopted the amended guidance for the recognition of OTTI for debt securities as well as the presentation of OTTI on the consolidated financial statements. In accordance with the amended guidance, the Company changed the presentation of the consolidated statement of loss to state “Net impairment” as a separate line item, as well as the credit and noncredit components of net impairment. Prior to this new presentation, OTTI was included in the “Gains (losses) on loans and securities, net” line item on the consolidated statement of loss.
The Company added a new operating expense line item to the consolidated statement of loss for FDIC insurance premiums. During the year ended December 31, 2009, these expenses increased to a level at which the Company believed a separate line item on the consolidated statement of loss was appropriate. This increase was due primarily to an increase in the ongoing FDIC insurance rates as well as an industry wide special assessment in the second quarter of 2009. FDIC insurance premium expenses were previously presented in the “Other operating expenses” line item.
104
Table of Contents
The Company reports corporate interest income and corporate interest expense separately from operating interest income and operating interest expense. The Company believes reporting these two items separately provides a clearer picture of the financial performance of the Company’s operations than would a presentation that combined these two items. Operating interest income and operating interest expense is generated from the operations of the Company. Corporate debt, which is the primary source of the corporate interest expense, has been issued primarily in connection with recapitalization transactions and past acquisitions, such as Harrisdirect and BrownCo.
Similarly, the Company reports gains (losses) on sales of investments, net separately from gains (losses) on loans and securities, net. The Company believes reporting these two items separately provides a clearer picture of the financial performance of its operations than would a presentation that combined these two items. Gains (losses) on loans and securities, net are the result of activities in the Company’s operations, namely its balance sheet management segment. Gains (losses) on sales of investments, net relate to historical equity investments of the Company at the corporate level and are not related to the ongoing business of the Company’s operating subsidiaries.
Use of Estimates—The consolidated financial statements were prepared in accordance with GAAP, which require management to make estimates and assumptions that affect the amounts reported in the consolidated financial statements and related notes for the periods presented. Actual results could differ from management’s estimates. Material estimates in which management believes near-term changes could reasonably occur include allowance for loan losses; fair value measurements; classification and valuation of certain investments; accounting for derivative instruments; estimates of effective tax rates, deferred taxes and valuation allowances; valuation of goodwill and other intangibles; and valuation and expensing of share-based payments.
Debt Exchange—In the third quarter of 2009, the Company exchanged $1.7 billion aggregate principal amount of its 12 1/ 2% Notes and 8% Notes for an equal principal amount of newly-issued non-interest-bearing convertible debentures(1). The Debt Exchange was accounted for as a debt extinguishment at fair value with the resulting loss recognized in the consolidated statement of loss. The Company accounted for the Debt Exchange as a debt extinguishment, in accordance with debt modifications and extinguishments accounting guidance, primarily based on the Company’s assessment that the newly-issued non-interest-bearing convertible debentures were substantially different from the debt exchanged in the transaction.
The Debt Exchange resulted in a $968.3 million pre-tax non-cash loss on extinguishment of debt during the third quarter of 2009. The loss on the Debt Exchange resulted from the de-recognition of the debt that was exchanged and the corresponding recognition of the newly-issued non-interest-bearing convertible debentures at fair value. The loss consisted of two main components: 1) the difference between the fair value of the newly-issued non-interest-bearing convertible debentures and the face amount of the exchanged debt, which resulted in a $725.0 million premium on the new debt; and 2) the realization of the $243.3 million discount on the debt that was exchanged. The fair value (2) of the newly-issued non-interest-bearing convertible debentures was greater than the face amount of the debt that was exchanged primarily due to the significant increase in the Company’s stock price from June 22, 2009, the date on which the conversion price was established, to August 25, 2009, the date on which the Debt Exchange was consummated. The time delay was due to the required shareholder approval prior to consummation of the Debt Exchange, which occurred at a special meeting on August 19, 2009. The remaining $243.3 million component of the loss represented an acceleration of the interest expense that otherwise would have been recorded in future periods. Prior to the consummation of the Debt Exchange, this discount was being accreted into interest expense over the life of the exchanged debt under the effective interest method.
| (1) | For further details on the newly-issued non-interest-bearing convertible debentures see Note 14—Corporate Debt. |
| (2) | For further details on the fair value of the newly-issued non-interest-bearing convertible debentures see Note 5—Fair Value Disclosures. |
105
Table of Contents
The loss on the Debt Exchange did not significantly impact the Company’s shareholders’ equity as the loss was substantially offset by a simultaneous increase in additional paid-in capital related to the amortization of the premium on the newly-issued non-interest-bearing convertible debentures. The $725.0 million premium was offset by $17.8 million in capitalized debt issuance costs that resulted in a net premium on the newly-issued non-interest-bearing convertible debentures of $707.2 million. If the newly-issued convertible debentures had been interest-bearing, the net premium would have been amortized as a reduction to interest expense over the life of the convertible debentures under the effective interest method. However, since the newly-issued convertible debentures are non-interest-bearing, the amortization of the premium would have resulted in the Company recording interest income on a liability (a negative yield). Based on the accounting guidance for similar debt instruments, the Company immediately amortized the entire net premium to additional paid-in capital.
Financial Statement Descriptions and Related Accounting Policies—Below are descriptions and accounting policies for certain of the Company’s financial statement categories.
Cash and Equivalents—For the purpose of reporting cash flows, the Company considers all highly liquid investments with original or remaining maturities of three months or less at the time of purchase that are not required to be segregated under federal or other regulations to be cash and equivalents. Cash and equivalents are composed of interest-bearing and non-interest-bearing deposits, certificates of deposit, commercial paper, funds due from banks and federal funds. Cash and equivalents included $2.4 billion and $2.7 billion at December 31, 2009 and 2008, respectively, of overnight cash deposits that the Company maintains with the Federal Reserve Bank.
Cash and Investments Required to be Segregated Under Federal or Other Regulations—Cash and investments required to be segregated under federal or other regulations consist of interest-bearing and non-interest-bearing cash accounts and U.S. Treasuries. Certain cash balances and investments, related to collateralized financing transactions by the Company’s brokerage subsidiaries, are required to be segregated for the exclusive benefit of the Company’s brokerage customers.
Trading Securities—Trading securities are bought and held principally for the purpose of selling them in the near term and are carried at fair value. Realized and unrealized gains and losses on securities classified as trading held by the Bank are included in the gains (losses) on loans and securities, net line item and are derived using the specific identification method. Realized and unrealized gains and losses on trading securities from market-making activities are included in the principal transactions line item and are also derived by the specific identification method.
Available-for-Sale Mortgage-Backed and Investment Securities—The Company generally classifies its investments in debt securities and marketable equity securities as either trading or available-for-sale. None of the Company’s debt securities were classified as held-to-maturity as of December 31, 2009 or 2008. Available-for-sale securities consist primarily of debt securities, specifically residential mortgage-backed securities, as of December 31, 2009 and 2008. Securities classified as available-for-sale are carried at fair value, with the unrealized gains and losses reflected as a component of accumulated other comprehensive loss, net of tax. Realized and unrealized gains or losses on available-for-sale debt securities are computed using the specific identification method. Interest earned on available-for-sale debt securities is included in operating interest income. Amortization or accretion of premiums and discounts are also recognized in operating interest income using the effective interest method over the life of the security.
Realized gains and losses on available-for-sale debt securities, other than OTTI, are included in the gains (losses) on loans and securities, net line item. Available-for-sale securities that have an unrealized loss (impaired securities) are evaluated for OTTI at each balance sheet date. OTTI is included in the net impairment line item. Beginning in the second quarter of 2009, the Company’s OTTI evaluation for available-for-sale debt securities reflects the Company’s adoption of the amended OTTI accounting guidance. The Company considers OTTI for an available-for-sale debt security to have occurred if one of the following conditions are met: the Company
106
Table of Contents
intends to sell the impaired debt security; it is more likely than not that the Company will be required to sell the impaired debt security before recovery of the security’s amortized cost basis; or the Company does not expect to recover the entire amortized cost basis of the security. The Company’s evaluation of whether it intends to sell an impaired available-for-sale debt security considers whether management has decided to sell the security as of the balance sheet date. The Company’s evaluation of whether it is more likely than not that the Company will be required to sell an impaired available-for-sale debt security before recovery of the security’s amortized cost basis considers the likelihood of sales that involve legal, regulatory or operational requirements. For impaired available-for-sale debt securities that the Company does not intend to sell and it is not more likely than not that the Company will be required to sell before recovery of the security’s amortized cost basis, the Company uses both qualitative and quantitative valuation measures to evaluate whether the Company expects to recover the entire amortized cost basis of the security. The Company considers all available information relevant to the collectability of the security, including credit enhancements, security structure, vintage, credit ratings and other relevant collateral characteristics.
Margin Receivables—Margin receivables represent credit extended to customers and non-customers to finance their purchases of securities by borrowing against securities they currently own. Receivables from non-customers represent credit extended to principal officers and directors of the Company to finance their purchase of securities by borrowing against securities owned by them. The Company had no margin receivables to principal officers and directors at December 31, 2009 and less than $0.1 million at December 31, 2008. Securities owned by customers and non-customers are held as collateral for amounts due on the margin receivables, the value of which is not reflected in the consolidated balance sheet. In many cases, the Company is permitted to sell or re-pledge these securities held as collateral and use the securities to enter into securities lending transactions, to collateralize borrowings or for delivery to counterparties to cover customer short positions. The fair value of securities that the Company received as collateral in connection with margin receivables and stock borrowing activities, where the Company is permitted to sell or re-pledge the securities, was approximately $5.3 billion and $3.8 billion as of December 31, 2009 and 2008, respectively. Of this amount, $0.9 billion and $1.0 billion had been pledged or sold in connection with securities loans, bank borrowings and deposits with clearing organizations as of December 31, 2009 and 2008, respectively.
Loans, Net—Loans, net consists of real estate and consumer loans that management has the intent and ability to hold for the foreseeable future or until maturity, also known as loans held for investment. Loans, net also includes loans held for sale, which represent loans originated through, but not yet purchased by, a third party company that the Company partnered with to provide access to real estate loans for its customers. There is a short time period after closing in which the Company records the originated loan as held for sale prior to the third party company purchasing the loan. The Company’s commitment to sell mortgage loans was the entire balance of loans held for sale, $7.9 million, at December 31, 2009.
Loans that are held for investment are carried at amortized cost adjusted for charge-offs, net, allowance for loan losses, deferred fees or costs on originated loans and unamortized premiums or discounts on purchased loans. Deferred fees or costs on originated loans and premiums or discounts on purchased loans are recognized in operating interest income using the effective interest method over the contractual life of the loans and are adjusted for actual prepayments.
The Company classifies loans as nonperforming when full and timely collection of interest or principal becomes uncertain or when they are 90 days past due. Interest previously accrued, but not collected, is reversed against current income when a loan is placed on nonaccrual status and is considered nonperforming. The recognition of deferred fees or costs on originated loans and premiums or discounts on purchased loans in operating interest income is discontinued for nonperforming loans. Payments received on nonperforming loans are recognized in operating interest income when the loan is considered collectible and applied to principal when it is doubtful that full payment will be collected.
The Company’s charge-off policy for both one- to four-family and home equity loans is to assess the value of the property when the loan has been delinquent for 180 days or it is in bankruptcy, regardless of whether or not the property is in foreclosure, and charge-off the amount of the loan balance in excess of the estimated
107
Table of Contents
current property value less costs to sell. Credit cards are charged-off when collection is not probable or the loan has been delinquent for 180 days. Consumer loans are charged-off when the loan has been delinquent for 120 days or when it is determined that collection is not probable.
Modified loans in which economic concessions were granted to borrowers experiencing financial difficulty are considered TDRs. TDRs are accounted for as nonaccrual loans at the time of modification and return to accrual status after six consecutive payments are made in accordance with the modified terms.
Allowance for Loan Losses—The allowance for loan losses is management’s estimate of credit losses inherent in the Company’s loan portfolio as of the balance sheet date.
For loans that are not specifically identified for impairment, the Company established a general allowance that is assessed in accordance with the loss contingencies accounting guidance. The estimate of the allowance for loan losses is based on a variety of quantitative and qualitative factors, including the composition and quality of the portfolio; delinquency levels and trends; current and historical charge-off and loss experience; current industry charge-off and loss experience; the condition of the real estate market and geographic concentrations within the loan portfolio; the interest rate climate; the overall availability of housing credit; and general economic conditions. The Company’s one- to four-family and home equity loan portfolios are separated into risk segments based on key risk factors, which include but are not limited to channel of loan origination, documentation type, loan product type and LTV ratio. Based upon the segmentation, probable losses are determined with expected loss rates in each segment. The additional protection provided by mortgage insurance has been factored into the expected loss on defaulted mortgage loans. The expected recovery from the liquidation of foreclosed real estate and expected recoveries from loan sellers related to contractual guarantees are also factored into the expected loss on defaulted mortgage loans. For the consumer and other loan portfolio, management establishes loss estimates for each consumer portfolio based on credit characteristics and observation of the existing markets. The expected recoveries from the sale of repossessed collateral are factored into the expected loss on defaulted consumer loans based on current liquidation experience. Loan losses are charged and recoveries are credited to the allowance for loan losses.
The allowance for loan losses is typically equal to management’s estimate of loan charge-offs in the twelve months following the balance sheet date. Management believes this level is representative of probable losses inherent in the loan portfolio at the balance sheet date. The general allowance for loan losses also included a specific qualitative component to account for environmental factors that the Company believes will impact the Company’s level of credit losses. This qualitative component, which was applied by loan type, reflects the Company’s estimate of credit losses inherent in the loan portfolio due to environmental factors which are not directly considered in the quantitative loss model but are factors the Company believes will have an impact on credit losses (e.g., the current level of unemployment).
For modified loans accounted for as TDRs, the Company establishes a specific allowance. The impairment of a loan is measured using a discounted cash flow analysis. A specific allowance is established to the extent that the recorded investment exceeds the discounted cash flows of a TDR with a corresponding charge to the provision for loan losses. The specific allowance for these individually impaired loans represents the expected loss over the remaining life of the loan, including the economic concession to the borrower.
Investment in FHLB stock—The Company is a member of, and owns capital stock in, the FHLB system. The FHLB provides the Company with reserve credit capacity and authorizes advances based on the security of pledged home mortgages and other assets—principally securities that are obligations of, or guaranteed by, the U.S. Government—provided the Company meets certain creditworthiness standards. FHLB advances, included in the other borrowings line item, is a wholesale funding source of E*TRADE Bank. As a condition of its membership in the FHLB, the Company is required to maintain a FHLB stock investment. The Company accounts for its investment in FHLB stock as a cost method investment.
108
Table of Contents
Property and Equipment, Net—Property and equipment are carried at cost and depreciated on a straight-line basis over their estimated useful lives, generally three to seven years. Leasehold improvements are amortized over the lesser of their estimated useful lives or lease terms. Buildings are depreciated over the lesser of their estimated useful lives or forty years. Land is carried at cost.
The costs of internally developed software that qualify for capitalization under internal-use software accounting guidance are included in the property and equipment, net line item at the point at which the conceptual formulation, design and testing of possible software project alternatives are complete and management authorizes and commits to funding the project. The Company does not capitalize pilot projects and projects where it believes that future economic benefits are less than probable. Technology development costs incurred in the development and enhancement of software used in connection with services provided by the Company that do not otherwise qualify for capitalization treatment are expensed as incurred.
Goodwill and Other Intangibles, Net—Goodwill and other intangibles, net represents the excess of the purchase price over the fair value of net tangible assets acquired through the Company’s business combinations. The Company tests goodwill and intangible assets with indefinite lives for impairment on at least an annual basis or when events or changes indicate the carrying value of an asset may not be recoverable. The Company evaluates the remaining useful lives of other intangible assets with finite lives each reporting period to determine whether events and circumstances warrant a revision to the remaining period of amortization.
Real Estate Owned and Repossessed Assets—Included in the other assets line item in the consolidated balance sheet is real estate acquired through foreclosure and repossessed consumer assets. Real estate properties acquired through foreclosures, commonly referred to as REO, and repossessed assets are carried at the lower of carrying value or fair value, less estimated selling costs.
Income Taxes—Deferred income taxes are recorded when revenues and expenses are recognized in different periods for financial statement and tax return purposes. Deferred tax asset or liability account balances are calculated at the balance sheet date using current tax laws and rates in effect. Valuation allowances are established, when necessary, to reduce deferred tax assets when it is more likely than not that a portion or all of a given deferred tax asset will not be realized. Income tax expense includes (i) deferred tax expense, which generally represents the net change in the deferred tax asset or liability balance during the year plus any change in valuation allowances and (ii) current tax expense, which represents the amount of tax currently payable to or receivable from a taxing authority. Uncertain tax positions are only recognized to the extent they satisfy the accounting for uncertain tax positions criteria included in the income taxes accounting guidance, which states that in order to recognize an uncertain tax position it must be more likely than not that it will be sustained upon examination. The amount of tax benefit recognized is the largest amount of tax benefit that is more than fifty percent likely of being sustained on ultimate settlement of an uncertain tax position. See Note 16—Income Taxes.
Securities Sold Under Agreements to Repurchase—Securities sold under agreements to repurchase the same or similar securities, also known as repurchase agreements, are collateralized by fixed- and variable-rate mortgage-backed securities or investment grade securities. Repurchase agreements are treated as secured borrowings for financial statement purposes and the obligations to repurchase securities sold are reflected as such in the consolidated balance sheet.
Customer Payables—Customer payables to customers and non-customers represent credit balances in customer accounts arising from deposits of funds and sales of securities and other funds pending completion of securities transactions. Customer payables primarily represent customer cash contained within the Company’s broker-dealer subsidiaries. The Company pays interest on certain customer payables balances.
Foreign Currency Translation—Assets and liabilities of consolidated subsidiaries whose functional currency is not the U.S. dollar are translated into U.S. dollars, the functional currency of the Company, using the exchange rate in effect at each period end. Revenues and expenses are translated at the weighted average
109
Table of Contents
exchange rate during the period. The effects of foreign currency translation adjustments arising from differences in exchange rates from period to period are deferred and included in accumulated other comprehensive loss for subsidiaries whose functional currency is their local currency. Currency transaction gains or losses, derived on monetary assets and liabilities stated in a currency other than the functional currency, are recognized in current operations and have not been significant to the Company’s operating results in any period.
Comprehensive Loss—The Company’s comprehensive loss is composed of net loss, noncredit portion of OTTI on available-for-sale debt securities, unrealized gains (losses) on available-for-sale securities, the effective portion of the unrealized gains (losses) on derivatives in cash flow hedge relationships and foreign currency translation gains (losses), net of reclassification adjustments and related tax.
Derivative Instruments and Hedging Activities—The Company enters into derivative transactions primarily to protect against interest rate risk on the value of certain assets, liabilities and future cash flows. Each derivative is recorded on the consolidated balance sheet at fair value as a freestanding asset or liability. For financial statement purposes, the Company’s policy is to not offset fair value amounts recognized for derivative instruments and fair value amounts related to collateral arrangements under master netting arrangements.
Accounting for derivatives differs significantly depending on whether a derivative is designated as a hedge and, if designated as a hedge, the kind hedge designation. Derivative instruments designated in hedging relationships that mitigate the exposure to the variability in expected future cash flows or other forecasted transactions are considered cash flow hedges. Derivative instruments in hedging relationships that mitigate exposure to changes in the fair value of assets or liabilities are considered fair value hedges. The Company formally documents at inception all relationships between hedging instruments and hedged items and the risk management objective and strategy for each hedge transaction. Cash flow and fair value hedge ineffectiveness is re-measured on a quarterly basis and is included in the gains (losses) on loans and securities, net line item in the consolidated statement of loss. The Company also recognizes certain contracts and commitments as derivatives when the characteristics of those contracts and commitments meet the definition of a derivative. Gains and losses on derivatives that are not held as accounting hedges are recognized in the gains (losses) on loans and securities, net line item in the consolidated statement of loss. See Note 8—Accounting for Derivative Instruments and Hedging Activities.
Fair Value—Fair value is defined as the price that would be received to sell an asset or paid to transfer a liability in an orderly transaction between market participants at the measurement date. The Company determines the fair value for its financial instruments and for nonfinancial assets and nonfinancial liabilities that are recognized or disclosed at fair value in the consolidated financial statements on a recurring basis. In addition, the Company determines the fair value for nonfinancial assets and nonfinancial liabilities on a nonrecurring basis as required during impairment testing or other accounting guidance. See Note 5—Fair Value Disclosures.
Operating Interest Income—Operating interest income is recognized as earned through holding mortgage related assets, primarily real estate loans and mortgage-backed securities. Other interest-earning assets include margin receivables, investment securities, cash and equivalents, including cash and investments required to be segregated under regulatory guidelines, and stock borrow balances. Operating interest income includes the impact of effective hedges on interest-earning assets.
Operating Interest Expense—Operating interest expense is recognized as incurred primarily through holding customer cash and deposits. Other interest-bearing liabilities include repurchase agreements and other borrowings, FHLB advances and stock loan balances. Operating interest expense includes the impact of effective hedges on interest-bearing liabilities.
Commissions—Commissions revenue is derived primarily from the Company’s customers and is impacted by both trade types and the mix between the Company’s domestic and international businesses. Commissions revenue from securities transactions is recognized on a trade date basis.
110
Table of Contents
Fees and Service Charges—Fees and service charges revenue primarily consists of order flow revenue and account service fees. Fees and service charges revenue also includes advisor management fee revenue, 12b-1 fees, foreign exchange margin revenue and fixed income product revenue. Order flow revenue is accrued in the same period in which the related securities transactions are completed or related services are rendered. Account service fees are charged to the customer either quarterly or annually and are accrued as earned.
Principal Transactions—Principal transactions revenue consists primarily of revenue from market-making activities. Market-making activities are the matching of buyers and sellers of securities and include transactions where the Company will purchase securities for its balance sheet with the intention of resale to transact the customer’s buy or sell order. Principal transactions revenue earned on the Company’s market-making activities is recorded on a trade date basis.
Gains (Losses) on Loans and Securities, Net—Gains (losses) on loans and securities, net includes gains or losses resulting from the sale of available-for-sale securities; gains or losses on trading securities; gains or losses resulting from sales of loans; hedge ineffectiveness; and gains or losses on derivative instruments that are not accounted for as hedging instruments. Gains or losses resulting from the sale of loans are recognized at the date of settlement and are based on the difference between the cash received and the carrying value of the related loans, less related transaction costs. Gains or losses resulting from the sale of available-for-sale securities are recognized at the trade date, based on the difference between the anticipated proceeds and the amortized cost of the specific securities sold.
Net Impairment—Net impairment includes OTTI net of the noncredit portion of OTTI on available-for-sale debt securities recognized through other comprehensive income (loss) (before tax). If the Company intends to sell an impaired available-for-sale debt security or if it is more likely than not that the Company will be required to sell the impaired available-for-sale debt security before recovery of the security’s amortized cost basis, the Company will recognize OTTI in earnings equal to the entire difference between the security’s amortized cost basis and the security’s fair value. If the Company does not intend to sell the impaired available-for-sale debt security and it is not more likely than not that the Company will be required to sell the impaired available-for-sale debt security before recovery of its amortized cost basis but the Company does not expect to recover the entire amortized cost basis of the security, the Company will separate OTTI into two components: 1) the amount related to credit loss, recognized in earnings; and 2) the noncredit portion of OTTI, recognized through other comprehensive income (loss). If the impairment of an available-for-sale equity security is determined to be other-than-temporary, the Company will recognize OTTI in earnings equal to the entire difference between the security’s amortized cost basis and the security’s fair value.
Other Revenues—Other revenues primarily consists of employee stock option management software and services, other revenue ancillary to the Company’s customer transactions and income from the cash surrender value of BOLI. Employee stock option management fees are recognized in accordance with applicable accounting guidance, including software revenue recognition accounting guidance.
Share-Based Payments—The Company records share-based payments expense in accordance with the stock compensation accounting guidance. The Company records compensation cost at the grant date fair value of a share-based payment award over the vesting period less estimated forfeitures. The underlying assumptions to these fair value calculations are discussed in Note 19—Employee Share-Based Payments and Other Benefits. Additionally, the Company elected to use the alternative transition method provided for calculating the tax effects of share-based compensation pursuant to the stock compensation accounting guidance. Share-based payments expense is included in the compensation and benefits line item.
Advertising and Market Development—Advertising production costs are expensed when the initial advertisement is run.
Loss Per Share—Basic loss per share is computed by dividing net loss by the weighted-average common shares outstanding for the period. Diluted loss per share reflects the potential dilution that could occur if securities or other contracts to issue common stock were exercised or converted into common stock. The
111
Table of Contents
Company excludes from the calculation of diluted loss per share stock options, unvested restricted stock awards and units and shares related to convertible debentures that would have been anti-dilutive.
New Accounting and Disclosure Guidance—Below is the new accounting and disclosure guidance that relates to activities in which the Company is engaged.
Disclosures about Derivative Instruments and Hedging Activities
In March 2008, the Financial Accounting Standards Board (“FASB”) amended the disclosure requirements for derivative instruments and hedging activities. The amendments became effective on January 1, 2009 for the Company. The Company’s disclosures about derivative instruments and hedging activities in Note 8—Accounting for Derivative Instruments and Hedging Activities reflect the adoption of the amended disclosure requirements.
Accounting for Assets Acquired and Liabilities Assumed in a Business Combination That Arise from Contingencies
In April 2009, the FASB amended the accounting and disclosure guidance for business combinations to address application issues raised by preparers, auditors, and members of the legal profession on initial recognition and measurement, subsequent measurement and accounting, and disclosure of assets and liabilities arising from contingencies in a business combination. The amended accounting and disclosure guidance is effective for assets or liabilities arising from contingencies in business combinations for which the acquisition date is on or after January 1, 2009 for the Company and did not impact its financial condition, results of operations or cash flows.
Interim Disclosures about Fair Value of Financial Instruments
In April 2009, the FASB amended the disclosure guidance specific to the fair value of financial instruments to require the fair value disclosures for interim reporting periods of publicly traded companies as well as in annual financial statements. The Company’s disclosures about the fair value of financial instruments during interim reporting periods reflected the adoption of the amended disclosure guidance beginning in the second quarter of 2009.
Recognition and Presentation of Other-Than-Temporary Impairments
In April 2009, the FASB amended the OTTI accounting guidance for debt securities and the presentation and disclosure requirements of OTTI on debt and equity securities in the financial statements. The amended accounting guidance did not amend existing recognition and measurement guidance related to OTTI of equity securities. The Company adopted the amended guidance on April 1, 2009. As a result of the adoption, the Company recognized a $20.2 million after-tax decrease to beginning accumulated deficit and a corresponding offset in accumulated other comprehensive loss on the consolidated balance sheet as of April 1, 2009. For additional information regarding the adoption of this amended accounting and disclosure guidance, see Note 6—Available-for-Sale Mortgage-Backed and Investment Securities.
Determining Fair Value When the Volume and Level of Activity for the Asset or Liability Have Significantly Decreased and Identifying Transactions That Are Not Orderly
In April 2009, the FASB amended the fair value measurements accounting guidance to provide additional guidance for estimating fair value when the volume and level of activity for the asset or liability have significantly decreased. The amended accounting guidance also included guidance on identifying circumstances that indicate a transaction is not orderly. The Company adopted this amended accounting guidance on April 1, 2009. The Company’s adoption of this guidance did not have a material impact on its financial condition, results of operations or cash flows.
112
Table of Contents
Subsequent Events
In May 2009, the FASB established general standards of accounting and disclosure for events that occur after the balance sheet date but before financial statements are issued (subsequent events). The two types of subsequent events include those that provide additional evidence about conditions that existed at the date of the balance sheet, including the estimates inherent in the process of preparing financial statements (recognized subsequent events), and those that provide evidence about conditions that did not exist at the date of the balance sheet but arose after that date (nonrecognized subsequent events). The Company’s adoption of the general standards of accounting and disclosure for subsequent events in the second quarter of 2009 did not impact its financial condition, results of operations or cash flows.
Accounting for Transfers of Financial Assets
In June 2009, the FASB amended the derecognition provisions in the accounting guidance for transfers and servicing, including the removal of the concept of qualifying special-purpose entities (“QSPEs”). The amended derecognition provisions will be effective for financial asset transfers occurring after the beginning of the first fiscal year that begins after November 15, 2009, or January 1, 2010 for the Company. The Company’s adoption of the amended derecognition provisions to transfers of financial assets, which did not impact its financial condition, results of operations or cash flows, will be applied to transfers of financial assets occurring on or after January 1, 2010.
Consolidation of Variable Interest Entities
In June 2009, the FASB amended the accounting and disclosure guidance for the consolidation of variable interest entities. The amended accounting guidance requires the reconsideration of previous conclusions related to the consolidation of variable interest entities, including whether an entity is a variable interest entity and whether the Company is the variable interest entity’s primary beneficiary. The amended accounting guidance carries forward the scope of the previous accounting guidance for the consolidation of variable interest entities with the addition of entities previously considered QSPEs. The amended accounting and disclosure guidance will be effective as of the beginning of the first fiscal year that begins after November 15, 2009, or January 1, 2010 for the Company. The Company’s reconsideration of previous conclusions related to the consolidation of variable interest entities will not result in the consolidation of additional entities as of January 1, 2010. Beginning on January 1, 2010, the Company’s assessment of whether it is a variable interest entity’s primary beneficiary will be ongoing and will consider changes in facts and circumstances related to the variable interest entities.
The FASB Accounting Standards Codification™ and the Hierarchy of GAAP
In June 2009, the FASB established the FASB Accounting Standards Codification™ (“the Codification”) as the source of authoritative GAAP. Rules and interpretative releases of the SEC under federal securities laws also continue to be a source of authoritative GAAP for the Company. All guidance contained in the Codification carries an equal level of authority. This Codification became effective for financial statements issued for interim and annual periods ending after September 15, 2009, or September 30, 2009 for the Company. The Company’s adoption of the Codification as the source of authoritative GAAP did not impact its financial condition, results of operations or cash flows.
Fair Value Measurements and Disclosures–Measuring Liabilities at Fair Value
In August 2009, the FASB amended the fair value measurements accounting guidance for measuring the fair value of liabilities. The amended accounting guidance clarifies that the quoted price for an identical liability, when traded as an asset in an active market, is also a Level 1 measurement for that liability when no adjustment to the quoted price is required. In the absence of a Level 1 measurement, the amended accounting guidance clarifies that the Company must use a valuation technique that uses a quoted price or a valuation technique based
113
Table of Contents
on the amount the Company would pay to transfer the identical liability or receive to enter into an identical liability. The amended accounting guidance is effective for the first interim or annual reporting period beginning after August 2009, or October 1, 2009 for the Company. The Company’s adoption of the amended fair value measurements accounting guidance for measuring the fair value of liabilities did not have an impact on its financial condition, results of operations or cash flows.
Income Taxes—Implementation Guidance on Accounting for Uncertainty in Income Taxes and Disclosure Amendments for Nonpublic Entities
In September 2009, the FASB provided additional implementation guidance related to accounting for uncertainty in income taxes and amended the disclosure requirements for nonpublic entities. The implementation guidance was not intended to change practice and did not change other income tax accounting guidance. Guidance was provided on the following: 1) what constitutes a tax position for a pass-through or not-for-profit entity; 2) determining when an income tax is attributed to the reporting entity or its owners; and 3) application of accounting for uncertainty in income taxes to a group of related entities composed of both taxable and nontaxable entities. As the Company is currently applying the standards for accounting for uncertainty in income taxes, the implementation guidance became effective for interim and annual periods ending after September 15, 2009, or September 30, 2009 for the Company. The Company’s adoption of this guidance did not impact its financial condition, results of operations or cash flows.
Consolidation—Accounting and Reporting for Decreases in Ownership of a Subsidiary—a Scope Clarification
In January 2010, the FASB amended the accounting and disclosure guidance related to entities that experience a decrease in ownership in a subsidiary that is a business or nonprofit activity and entities that exchange a group of assets that constitutes a business or nonprofit activity for an equity interest in another entity. The amended accounting and disclosure guidance clarifies, but does not necessarily change, the scope of current consolidation guidance. As the Company is currently applying the previously amended consolidation guidance, this amended accounting and disclosure guidance became effective in the first interim and annual period ending after December 15, 2009, or December 31, 2009 for the Company. The Company’s adoption of this guidance did not impact its financial condition, results of operations or cash flows.
Fair Value Measurements and Disclosures–Improving Disclosures about Fair Value Measurements
In January 2010, the FASB amended the disclosure guidance related to fair value measurements. The amended disclosure guidance requires new fair value measurement disclosures and clarifies existing fair value measurement disclosure requirements. The amended disclosure guidance related to disclosures about purchases, sales, issuances and settlements of Level 3 instruments will be effective for fiscal years beginning after December 15, 2010, or January 1, 2011 for the Company. The remaining amended disclosure guidance will be effective for interim and annual reporting periods beginning after December 31, 2009, or January 1, 2010 for the Company. The Company’s disclosures about fair value measurements will reflect the adoption of the amended disclosure guidance related to disclosures about purchases, sales, issuances and settlements of Level 3 instruments in the first quarter of 2011. The Company’s disclosures about fair value measurements will reflect the adoption of the remaining disclosure guidance in the first quarter of 2010.
NOTE 2—DISCONTINUED OPERATIONS
The Company sold its Canadian brokerage business and exited its direct retail lending business in 2008. Results of operations from these businesses have been reclassified to discontinued operations for the years ended December 31, 2008 and 2007. The Company had no discontinued operations for the year ended December 31, 2009.
Sale of Canadian Brokerage Business
The Company sold its Canadian brokerage business to Scotiabank in 2008. The transaction resulted in a pre-tax gain of $429.0 million and associated income tax expense of $160.2 million. The Canadian brokerage business qualified as a discontinued operation as the Company does not have significant continuing involvement
114
Table of Contents
in the Canadian brokerage business, and its operations and cash flows were eliminated from the ongoing operations of the Company. The Company’s results of operations, net of income tax, include the Canadian brokerage business as a discontinued operation on the Company’s consolidated statement of loss for all periods presented. Prior to the Canadian brokerage business being recorded as a discontinued operation, it was included in the results of operations of both the Company’s former retail and institutional segments.
The following table summarizes the results of discontinued operations for the Canadian brokerage business (dollars in thousands):
| For the year ended December 31, | |||||||
| 2008 | 2007 | ||||||
| Net revenue |
$ | 59,404 | $ | 85,175 | |||
| Income from discontinued operations before income tax expense (benefit) |
$ | 15,558 | $ | 33,032 | |||
| Income tax expense (benefit) |
(19,473 | ) | 10,837 | ||||
| Income from discontinued operations, net of tax |
$ | 35,031 | $ | 22,195 | |||
Exit of the Direct Retail Lending Business
In 2008, the Company exited its direct retail lending business, which was the Company’s last remaining loan origination channel (the Company exited the wholesale mortgage lending business in 2007). The entire direct retail lending business, including the wholesale mortgage lending business, met the requirements under the discontinued operations accounting guidance to be recorded and reported as a discontinued operation. The operations and cash flows of the direct retail lending business were eliminated from the ongoing operations of the Company, and the Company does not have any significant continuing involvement in the direct retail lending business after its closure. Therefore, the Company’s results of operations, net of income tax, include the direct retail lending business as a discontinued operation on the Company’s consolidated statement of loss for all periods presented. Prior to the direct retail lending business being recorded as a discontinued operation, it was included in the results of operations of the Company’s former retail segment.
The following table summarizes the results of discontinued operations for the direct retail lending business (dollars in thousands):
| For the year ended December 31, |
||||||||
| 2008 | 2007 | |||||||
| Net revenue |
$ | 1,300 | $ | 10,001 | ||||
| Loss from discontinued operations before income tax benefit |
$ | (9,932 | ) | $ | (35,450 | ) | ||
| Income tax benefit |
(3,697 | ) | (13,838 | ) | ||||
| Loss from discontinued operations, net of tax |
$ | (6,235 | ) | $ | (21,612 | ) | ||
115
Table of Contents
NOTE 3—FACILITY RESTRUCTURING AND OTHER EXIT ACTIVITIES
Restructuring and other exit activities liabilities are included in accounts payable, accrued and other liabilities in the consolidated balance sheet. The following table summarizes the changes in the facility restructuring and other exit activities liabilities for the years ended December 31, 2009 and 2008 (dollars in thousands):
| Year Ended December 31, |
||||||||
| 2009 | 2008 | |||||||
| Beginning balance |
$ | 21,883 | $ | 26,651 | ||||
| Facility restructuring and other exit activities |
20,652 | 29,502 | ||||||
| Cash payments | (16,618 | ) | (27,232 | ) | ||||
| Non-cash charges(1) |
(7,388 | ) | (7,038 | ) | ||||
| Total facility restructuring and other exit activities liabilities |
$ | 18,529 | $ | 21,883 | ||||
| (1) | Non-cash charges primarily relate to fixed assets that were written off related to the restructuring or exit activity. |
The following table summarizes the expense recognized by the Company as facility restructuring and other exit activities from continuing operations for the periods presented (dollars in thousands):
| Year Ended December 31, | ||||||||||
| 2009 | 2008 | 2007 | ||||||||
| Restructuring of international brokerage business |
$ | 15,655 | $ | — | $ | — | ||||
| Restructuring of institutional brokerage business |
— | 10,292 | 17,094 | |||||||
| Gain on sale of RAA |
— | (2,753 | ) | — | ||||||
| Other exit activities |
4,997 | 21,963 | 10,089 | |||||||
| Total facility restructuring and other exit activities |
$ | 20,652 | $ | 29,502 | $ | 27,183 | ||||
Exit of Non-Core Operations
International Brokerage Business
In the fourth quarter of 2009, the Company decided to restructure its international brokerage business, which provided trading products and services through two primary channels: 1) cross-border trading, where customers residing outside of the U.S. trade in U.S. securities; and 2) local market trading, where customers residing outside of the U.S. trade in non-U.S. securities. The Company believes the local market trading is not a key strategic component of its global brokerage product offering and therefore decided to exit this channel. This exit does not qualify for discontinued operations accounting as the Company will have significant continuing involvement in the international brokerage business with cross-border trading.
The Company entered into agreements to sell the local market trading operations in Germany, the Nordic region and the United Kingdom. The sale of the local market trading operations in Germany was completed in December 2009 and the Company expects to close on the sale of the local market trading operations in the Nordic region and United Kingdom during 2010.
116
Table of Contents
As of December 31, 2009, the local market trading operations in Nordic and UK were considered held-for-sale. Below is a table summarizing the carrying amounts of the major classes of assets and liabilities of these operations as of December 31, 2009 (dollars in thousands):
| December 31, 2009 | |||
| Assets |
|||
| Cash and equivalents |
$ | 226,060 | |
| Cash and investments required to be segregated under federal or other regulations |
141,082 | ||
| Margin receivables |
83,131 | ||
| Property and equipment, net |
3,461 | ||
| Other assets |
19,286 | ||
| Total assets |
$ | 473,020 | |
| Liabilities |
|||
| Customer payables |
$ | 440,606 | |
| Accounts payable, accrued and other liabilities |
8,741 | ||
| Total liabilities |
$ | 449,347 | |
As a result of the international brokerage business restructuring, the Company recognized $7.4 million in severance costs and $8.3 million of other costs for the year ended December 31, 2009. The total charges for this restructuring are expected to be up to $30 million, all of which will be recorded to the trading and investing segment.
Institutional Brokerage Operations
In 2007, the Company announced a plan to simplify and streamline the business by exiting and/or restructuring certain non-core operations and took steps to restructure the institutional brokerage business to focus on areas that complement order flow generated by retail customers. In 2008, the Company announced the decision to exit certain institutional trading operations in the U.S. that did not align with the core retail business. As a result of these exits, the Company incurred $5.6 million and $9.1 million for facilities consolidation and asset write-off costs, $3.1 million and $7.0 million in severance costs and $1.5 million and $1.0 million of other costs related to these exits for the years ended December 31, 2008 and 2007, respectively. All of these charges were recorded in the trading and investing segment.
The Company expects to incur charges in future periods as it periodically evaluates the estimates made in connection with this activity; however, the Company does not expect these charges to be significant.
Sale of RAA
In 2008, the Company sold substantially all of the assets of RAA to PHH Investments, Ltd for approximately $25 million. The sale of RAA resulted in a pre-tax gain of $2.8 million, which was recorded in the trading and investing segment.
Other Exit Activities
In 2007, the Company decided to consolidate and relocate certain of its facilities, which continued into 2008. The Company incurred $21.4 million and $7.5 million of charges for the years ended December 31, 2008 and 2007, respectively, primarily related to the exit of certain operating leases. These charges have been recorded in both the trading and investing and balance sheet management segments. Additionally, in 2007 the Company incurred $3.1 million in connection with reorganizing the management structure of the balance sheet management business, including changing the nature and focus of its operations.
117
Table of Contents
The Company expects to incur charges in future periods as it periodically evaluates the estimates made in connection with this activity; however, the Company does not expect those costs to be significant.
Facility Consolidation Obligations
The components of the facility consolidation obligations for the Company’s restructuring and other exit activities at December 31, 2009 and their timing are as follows (dollars in thousands):
| Facilities Obligations |
Sublease Income | Discounted Rents and Sublease |
Net | |||||||||||||||
| Contracted | Estimate | |||||||||||||||||
| Years ending December 31, |
||||||||||||||||||
| 2010 |
$ | 7,954 | $ | (602 | ) | $ | (96 | ) | $ | (644 | ) | $ | 6,612 | |||||
| 2011 |
3,288 | (23 | ) | (702 | ) | (246 | ) | 2,317 | ||||||||||
| 2012 |
2,290 | — | (889 | ) | (73 | ) | 1,328 | |||||||||||
| 2013 |
291 | — | (154 | ) | (12 | ) | 125 | |||||||||||
| Thereafter |
— | — | — | — | — | |||||||||||||
| Total future facility consolidation obligations |
$ | 13,823 | $ | (625 | ) | $ | (1,841 | ) | $ | (975 | ) | $ | 10,382 | |||||
NOTE 4—OPERATING INTEREST INCOME AND OPERATING INTEREST EXPENSE
The following table shows the components of operating interest income and operating interest expense from continuing operations (dollars in thousands):
| Year Ended December 31, | ||||||||||||
| 2009 | 2008 | 2007 | ||||||||||
| Operating interest income: |
||||||||||||
| Loans |
$ | 1,138,116 | $ | 1,587,838 | $ | 1,986,034 | ||||||
| Mortgage-backed and investment securities |
471,087 | 436,165 | 879,922 | |||||||||
| Margin receivables |
138,510 | 278,213 | 502,149 | |||||||||
| Other |
84,845 | 167,724 | 154,950 | |||||||||
| Total operating interest income(1) |
1,832,558 | 2,469,940 | 3,523,055 | |||||||||
| Operating interest expense: |
||||||||||||
| Deposits |
(211,788 | ) | (615,848 | ) | (821,955 | ) | ||||||
| Repurchase agreements and other borrowings |
(216,300 | ) | (318,291 | ) | (643,382 | ) | ||||||
| FHLB advances |
(132,560 | ) | (218,940 | ) | (364,442 | ) | ||||||
| Other |
(11,308 | ) | (48,855 | ) | (109,677 | ) | ||||||
| Total operating interest expense(2) |
(571,956 | ) | (1,201,934 | ) | (1,939,456 | ) | ||||||
| Net operating interest income |
$ | 1,260,602 | $ | 1,268,006 | $ | 1,583,599 | ||||||
| (1) | Operating interest income reflects $53.9 million, $26.1 million and $13.6 million in income on hedges that qualify for hedge accounting for the years ended December 31, 2009, 2008 and 2007, respectively. |
| (2) | Operating interest expense reflects $136.3 million, $74.9 million and $3.2 million in expense on hedges that qualify for hedge accounting for the years ended December 31, 2009, 2008 and 2007, respectively. |
Fair value is defined as the price that would be received to sell an asset or paid to transfer a liability in an orderly transaction between market participants at the measurement date. In determining fair value, the Company may use various valuation approaches, including market, income and/or cost approaches. The fair value hierarchy requires an entity to maximize the use of observable inputs and minimize the use of unobservable inputs when measuring fair value. Fair value is a market-based measure considered from the perspective of a market
118
Table of Contents
participant. As such, even when market assumptions are not readily available, the Company’s own assumptions reflect those that market participants would use in pricing the asset or liability at the measurement date. The fair value measurement accounting guidance describes the following three levels used to classify fair value measurements:
| • | Level 1—Quoted prices in active markets for identical assets or liabilities. |
| • | Level 2—Quoted prices in markets that are not active or for which all significant inputs are observable, either directly or indirectly. |
| • | Level 3—Unobservable inputs that are significant to the fair value of the assets or liabilities. |
The availability of observable inputs can vary and in certain cases, the inputs used to measure fair value may fall into different levels of the fair value hierarchy. In such cases, the level within the fair value hierarchy is based on the lowest level of input that is significant to the fair value measurement. The Company’s assessment of the significance of a particular input to a fair value measurement requires judgment and consideration of factors specific to the asset or liability.
Recurring Fair Value Measurement Techniques
U.S. Treasuries and Agency Debentures
The fair value measurements of U.S. Treasuries are classified as Level 1 of the fair value hierarchy as they are based on quoted market prices in active markets. The fair value measurements of agency debentures are classified as Level 2 of the fair value hierarchy as they are based on quoted market prices that can be derived from assumptions observable in the marketplace.
Agency Mortgage-Backed Securities and Collateralized Mortgage Obligations
The fair value of agency mortgage-backed securities is determined using quoted market prices, recent market transactions and spread data for similar instruments. Agency mortgage-backed securities are generally categorized in Level 2 of the fair value hierarchy. Agency CMOs are collateralized mortgage obligations backed by agency-guaranteed loans. The fair value of agency CMOs is determined using recent market transactions. Agency CMOs are generally categorized in Level 2 of the fair value hierarchy.
Non-Agency Collateralized Mortgage Obligations
Non-agency CMOs are valued using market observable data, when available, including recent market transactions. The Company also utilized a pricing service to corroborate the market observability of the Company’s inputs used in the fair value measurements. The valuations of non-agency CMOs reflect the Company’s best estimate of what market participants would consider in pricing the financial instruments. The Company considers the price transparency for these financial instruments to be a key determinant of the degree of judgment involved in determining the fair value. As of December 31, 2009, the majority of the Company’s non-agency CMOs were categorized in Level 3 of the fair value hierarchy.
Municipal Bonds and Corporate Bonds
For municipal bonds and corporate bonds, the Company’s valuation utilized pricing service valuations corroborated by recent market transactions for similar or identical bonds. Municipal bonds and corporate bonds are generally categorized in Level 2 of the fair value hierarchy.
119
Table of Contents
Derivative Instruments
The majority of the Company’s derivative instruments, interest rate swap and option contracts, are valued with pricing models commonly used by the financial services industry using market observable pricing inputs. The Company does not consider these models to involve significant judgment on the part of management and corroborated the fair value measurements with counterparty valuations. The Company’s derivative instruments are generally categorized in Level 2 of the fair value hierarchy. The consideration of credit risk, the Company’s or the counterparty’s, did not result in an adjustment to the valuation of its derivative instruments in the periods presented.
Securities Owned and Securities Sold, Not Yet Purchased
Securities transactions entered into by a broker-dealer subsidiary are included in trading securities and securities sold, not yet purchased in the Company’s fair value disclosures. For equity securities, the Company’s definition of actively traded is based on average daily volume and other market trading statistics. The fair value of securities owned and securities sold, not yet purchased is determined using listed or quoted market prices and are categorized in Level 1 or Level 2 of the fair value hierarchy.
120
Table of Contents
Recurring Fair Value Measurements
Assets and liabilities measured at fair value on a recurring basis are summarized below (dollars in thousands):
| Level 1 | Level 2 | Level 3 | Fair Value | |||||||||
| December 31, 2009: |
||||||||||||
| Assets |
||||||||||||
| Investments required to be segregated under federal or other regulations(1) |
$ | 687,617 | $ | — | $ | — | $ | 687,617 | ||||
| Trading securities |
31,085 | 5,727 | 1,491 | 38,303 | ||||||||
| Available-for-sale securities: |
||||||||||||
| Residential mortgage-backed securities: |
||||||||||||
| Agency mortgage-backed securities and CMOs |
— | 8,948,904 | 17,972 | 8,966,876 | ||||||||
| Non-agency CMOs and other |
— | 140,534 | 234,629 | 375,163 | ||||||||
| Total residential mortgage-backed securities |
— | 9,089,438 | 252,601 | 9,342,039 | ||||||||
| Investment securities: |
||||||||||||
| Debt securities: |
||||||||||||
| Agency debentures |
— | 3,920,011 | — | 3,920,011 | ||||||||
| Municipal bonds |
— | 38,990 | — | 38,990 | ||||||||
| Corporate bonds |
— | 17,823 | — | 17,823 | ||||||||
| Total debt securities |
— | 3,976,824 | — | 3,976,824 | ||||||||
| Public traded equity securities: |
||||||||||||
| Corporate investments |
— | 676 | 173 | 849 | ||||||||
| Total investment securities |
— | 3,977,500 | 173 | 3,977,673 | ||||||||
| Total available-for-sale securities |
— | 13,066,938 | 252,774 | 13,319,712 | ||||||||
| Other assets: |
||||||||||||
| Derivative assets |
— | 93,397 | — | 93,397 | ||||||||
| Deposits with clearing organizations(1) |
38,000 | — | — | 38,000 | ||||||||
| Total other assets measured at fair value on a recurring basis |
38,000 | 93,397 | — | 131,397 | ||||||||
| Total assets measured at fair value on a recurring basis(2) |
$ | 756,702 | $ | 13,166,062 | $ | 254,265 | $ | 14,177,029 | ||||
| Liabilities |
||||||||||||
| Derivative liabilities |
$ | — | $ | 143,602 | $ | — | $ | 143,602 | ||||
| Securities sold, not yet purchased |
27,861 | 3,112 | — | 30,973 | ||||||||
| Total liabilities measured at fair value on a recurring basis(2) |
$ | 27,861 | $ | 146,714 | $ | — | $ | 174,575 | ||||
| (1) | Represents U.S. Treasuries held by a broker-dealer subsidiary. |
| (2) | Assets and liabilities measured at fair value on a recurring basis represented 30% and less than 1% of the Company’s total assets and total liabilities, respectively. |
121
Table of Contents
| Level 1 | Level 2 | Level 3 | Fair Value | |||||||||
| December 31, 2008: |
||||||||||||
| Assets |
||||||||||||
| Trading securities |
$ | 2,363 | $ | 19,712 | $ | 33,406 | $ | 55,481 | ||||
| Available-for-sale securities: |
||||||||||||
| Residential mortgage-backed securities |
— | 10,408,528 | 304,661 | 10,713,189 | ||||||||
| Investment securities |
— | 92,735 | 170 | 92,905 | ||||||||
| Total available-for-sale securities |
— | 10,501,263 | 304,831 | 10,806,094 | ||||||||
| Other assets: |
||||||||||||
| Derivative assets |
— | 137,308 | 8 | 137,316 | ||||||||
| Deposits with clearing organizations(1) |
28,000 | 11,659 | — | 39,659 | ||||||||
| Total other assets measured at fair value on a recurring basis |
28,000 | 148,967 | 8 | 176,975 | ||||||||
| Total assets measured at fair value on a recurring basis(2) |
$ | 30,363 | $ | 10,669,942 | $ | 338,245 | $ | 11,038,550 | ||||
| Liabilities |
||||||||||||
| Derivative liabilities |
$ | — | $ | 484,681 | $ | 500 | $ | 485,181 | ||||
| Securities sold, not yet purchased |
1,844 | 4,926 | — | 6,770 | ||||||||
| Total liabilities measured at fair value on a recurring basis(2) |
$ | 1,844 | $ | 489,607 | $ | 500 | $ | 491,951 | ||||
| (1) | Represents U.S. Treasuries and other investment securities held by broker-dealer subsidiaries. |
| (2) | Assets and liabilities measured at fair value on a recurring basis represented 23% and 1% of the Company’s total assets and total liabilities, respectively. |
The following tables present additional information about Level 3 assets and liabilities measured at fair value on a recurring basis (dollars in thousands):
| December 31, 2008 |
Realized and Unrealized Gains (Losses) |
Purchases, Sales, Other Settlements and Issuances Net |
Net Transfers In and/or (Out) of Level 3 |
December 31, 2009 | |||||||||||||||||||||||
| Included in Earnings(1) |
Included in Other Comprehensive Income |
Total(2) | |||||||||||||||||||||||||
| Trading securities |
$ | 33,406 | $ | 2,016 | $ | — | $ | 2,016 | $ | (37,377 | ) | $ | 3,446 | $ | 1,491 | ||||||||||||
| Available-for-sale securities: |
|||||||||||||||||||||||||||
| Agency mortgage-backed securities and CMOs |
$ | — | $ | — | $ | (783 | ) | $ | (783 | ) | $ | 4 | $ | 18,751 | $ | 17,972 | |||||||||||
| Non-agency CMOs and other |
$ | 304,661 | $ | (86,215 | ) | $ | 102,346 | $ | 16,131 | $ | (84,050 | ) | $ | (2,113 | ) | $ | 234,629 | ||||||||||
| Corporate investments |
$ | 170 | $ | — | $ | 3 | $ | 3 | $ | — | $ | — | $ | 173 | |||||||||||||
| Derivative instruments, net(3) |
$ | (492 | ) | $ | 492 | $ | — | $ | 492 | $ | — | $ | — | $ | — | ||||||||||||
| (1) | The majority of realized and unrealized gains (losses) included in earnings are reported in the net impairment line item. |
| (2) | The majority of total realized and unrealized gains (losses) were related to instruments held at December 31, 2009. |
| (3) | Represents derivative assets net of derivative liabilities for presentation purposes only. |
122
Table of Contents
| January 1, 2008 |
Realized and Unrealized Gains (Losses) | Purchases, Sales, Other Settlements and Issuances Net |
Net Transfers In and/or (Out) of Level 3 |
December 31, 2008 |
||||||||||||||||||||||||
| Included in Earnings(1) |
Included in Other Comprehensive Loss |
Total(2) | ||||||||||||||||||||||||||
| Trading securities |
$ | 37,795 | $ | 387 | $ | — | $ | 387 | $ | (2,386 | ) | $ | (2,390 | ) | $ | 33,406 | ||||||||||||
| Available-for-sale securities: |
||||||||||||||||||||||||||||
| Residential mortgage-backed securities |
$ | 768,815 | $ | (99,895 | ) | $ | (144,947 | ) | $ | (244,842 | ) | $ | (72,177 | ) | $ | (147,135 | ) | $ | 304,661 | |||||||||
| Investment securities |
$ | 2,117 | $ | (970 | ) | $ | (1,096 | ) | $ | (2,066 | ) | $ | 119 | $ | — | $ | 170 | |||||||||||
| Derivative instruments, net(3) |
$ | (3,644 | ) | $ | 2,896 | $ | — | $ | 2,896 | $ | 256 | $ | — | $ | (492 | ) | ||||||||||||
| (1) | The majority of realized and unrealized gains (losses) included in earnings are reported in the net impairment line item. |
| (2) | The majority of total realized and unrealized gains (losses) were related to instruments held at December 31, 2008. |
| (3) | Represents derivative assets net of derivative liabilities for presentation purposes only. |
Level 3 Assets and Liabilities
Level 3 assets and liabilities included instruments whose value is determined using pricing models, discounted cash flow methodologies, or similar techniques, as well as instruments for which the determination of fair value requires significant management judgment or estimation. While the Company’s fair value estimates of Level 3 instruments utilized observable inputs where available, the valuation included significant management judgment in determining the relevance and reliability of market information considered and the financial instruments were therefore classified as Level 3.
The Company’s transfers of certain CMOs in and out of Level 3 are generally driven by changes in price transparency for the securities. Financial instruments for which actively quoted prices or pricing parameters are available will have a higher degree of price transparency than financial instruments that are thinly traded or not quoted. The Company’s transfers in and out of Level 3 are as of the beginning of the reporting period on a quarterly basis. As of December 31, 2009, less than 1% of the Company’s total assets and none of its total liabilities represented instruments measured at fair value on a recurring basis categorized as Level 3. As of December 31, 2008, less than 1% of the Company’s total assets and total liabilities represented instruments measured at fair value on a recurring basis categorized as Level 3.
Nonrecurring Fair Value Measurements
The Company measures certain other assets at fair value on a nonrecurring basis: 1) one- to four-family and home equity loans in which the amount of the loan balance in excess of the estimated current property value less costs to sell has been charged-off; and 2) real estate acquired through foreclosure that is carried at the lower of the property’s carrying value or fair value, less estimated selling costs. The following table presents the losses associated with the assets measured at fair value on a nonrecurring basis during the years ended December 31, 2009 and 2008 and still held on the consolidated balance sheet as of the periods presented (dollars in thousands):
| Carrying Value | Losses | |||||||||||
| As of December 31, |
Year Ended December 31, | |||||||||||
| 2009 | 2008(1) | 2009 | 2008(1) | |||||||||
| One- to four-family and home equity loans(2) |
$ | 766,087 | $ | 240,976 | $ | 389,857 | $ | 132,147 | ||||
| REO(3) |
$ | 77,875 | N/A | $ | 28,752 | N/A | ||||||
| (1) | The disclosure for REO is excluded for prior periods as the fair value measurement accounting guidance for nonfinancial assets that are recognized or disclosed at fair value on a nonrecurring basis was not adopted by the Company until January 1, 2009. |
| (2) | The fair value measurements of one- to four-family and home equity loans, regardless of whether or not the loans were held on the consolidated balance sheet as of the periods presented, resulted in charge-offs totaling $556.7 million and $224.5 million for the years ended December 31, 2009 and 2008, respectively. |
| (3) | The fair value measurements of REO, regardless of whether or not the REO was held on the consolidated balance sheet as of the period presented, resulted in losses totaling $55.7 million for the year ended December 31, 2009. |
123
Table of Contents
Property valuations are based on the most recent property value data available, which may include appraisals, prices for identical or similar properties, broker price opinions or home price indices. These fair value measurements were classified as Level 3 of the fair value hierarchy as the majority of the valuations included Level 3 inputs that were significant to the estimate of fair value.
Debt Exchange
In the third quarter of 2009, the Company exchanged $1.7 billion aggregate principal amount of its 12 1/2% Notes and 8% Notes for an equal principal amount of newly-issued non-interest-bearing convertible debentures(1). The Debt Exchange was accounted for as a debt extinguishment at fair value with the resulting loss recognized in the consolidated statement of loss(2). The Company’s methodology for determining the fair value of the non-interest-bearing convertible debentures was based on the following three factors: 1) intrinsic value of the underlying stock; 2) value of the 10-year put option; and 3) liquidity discount.
The most significant factor in the valuation of the non-interest-bearing convertible debentures was the intrinsic value of the underlying stock, which represented the value of the underlying shares of the Company’s stock at the date of exchange. The fair value of the non-interest-bearing convertible debentures was greater than the face amount of the corporate debt that was exchanged primarily due to the significant increase in the Company’s stock price from June 22, 2009, the date on which the conversion price was established, to August 25, 2009, the date on which the Debt Exchange was consummated. The other inputs to the valuation of the non-interest-bearing convertible debentures included the value of the 10-year put option and a liquidity discount. The value of the 10-year put option represented the value associated with creditors’ option to receive cash equal to the face value of the non-interest-bearing convertible debentures at the end of 10 years in lieu of converting the non-interest-bearing convertible debentures into common stock. The liquidity discount represented the Company’s consideration that the non-interest-bearing convertible debentures are not as liquid as the Company’s stock or might not be readily tradable once issued and that future conversions would be subject to certain limitations.
The following table outlines the Company’s fair value measurement of the non-interest-bearing convertible debentures, including the fair value of each individual component, using the $1.35 closing stock price on August 25, 2009, the date of consummation of the Debt Exchange (dollars in thousands):
| August 25, 2009 | |||||||
| Fair Value | Fair Value as a % of Principal Amount |
||||||
| Intrinsic value of the underlying stock |
$ | 2,273,222 | 13 | 1% | |||
| Value of 10-year put option |
467,699 | 2 | 7% | ||||
| Liquidity discount |
(274,092 | ) | (1 | 6)% | |||
| Fair value of convertible debentures(1) |
$ | 2,466,829 | 14 | 2% | |||
| (1) | The Company classified this fair value measurement as Level 3 of the fair value hierarchy as the liquidity discount represented an unobservable input significant to the fair value measurement. |
| (1) | For further details on the newly-issued non-interest-bearing convertible debentures see Note 14—Corporate Debt. |
| (2) | For further details on the accounting for the Debt Exchange see Note 1—Organization, Basis of Presentation and Summary of Significant Accounting Policies. |
124
Table of Contents
Disclosures about Fair Value of Financial Instruments
The fair value measurements accounting guidance also requires the disclosure of the fair value of financial instruments not otherwise disclosed above. Different market assumptions and estimation methodologies could significantly affect fair value amounts. The fair value of financial instruments, not otherwise disclosed above, whose fair value approximates carrying value is summarized as follows:
| • | Cash and equivalents, cash required to be segregated, margin receivables and customer payables—Fair value is estimated to be carrying value. |
| • | Investment in FHLB stock—FHLB stock is carried at cost, which is considered to be a reasonable estimate of fair value. |
The fair value of financial instruments whose fair values were different from their carrying values is summarized below (dollars in thousands):
| December 31, 2009 | December 31, 2008 | |||||||||||
| Carrying Value | Fair Value | Carrying Value | Fair Value | |||||||||
| Assets |
||||||||||||
| Loans, net(1) |
$ | 19,174,933 | $ | 18,439,112 | $ | 24,451,852 | $ | 24,072,373 | ||||
| Liabilities |
||||||||||||
| Deposits |
$ | 25,597,721 | $ | 25,620,950 | $ | 26,136,246 | $ | 26,194,430 | ||||
| Securities sold under agreements to repurchase |
$ | 6,441,875 | $ | 6,518,762 | $ | 7,381,279 | $ | 7,488,380 | ||||
| Other borrowings |
$ | 2,746,959 | $ | 2,562,228 | $ | 4,353,777 | $ | 4,349,862 | ||||
| Corporate debt(2) |
$ | 2,458,691 | $ | 3,390,734 | $ | 2,750,532 | $ | 1,645,136 | ||||
| (1) | The carrying value of loans, net includes the allowance for loan losses of $1.2 billion and $1.1 billion as of December 31, 2009 and 2008, respectively. |
| (2) | In the third quarter of 2009, the Company exchanged $1.7 billion aggregate principal amount of its interest-bearing corporate debt for an equal principal amount of newly-issued non-interest-bearing convertible debentures. For further details on the convertible debentures, see Note 14—Corporate Debt. |
| • | Loans, net—For the held-for-investment portfolio, including one- to four-family, home equity, and consumer and other loans, fair value is estimated by differentiating loans based on their individual portfolio characteristics, such as product classification, loan category, pricing features and remaining maturity. Management adjusts assumptions for expected losses, prepayments and discount rates to reflect the individual characteristics of the loans, such as credit risk, coupon, term, and payment characteristics, as well as the secondary market conditions for these types of loans. For loans held-for sale, fair value is estimated using third party commitments to purchase loans. |
| • | Deposits—For sweep deposit accounts, complete savings accounts, other money market and savings accounts and checking accounts, fair value is the amount payable on demand at the reporting date. For certificates of deposit and brokered certificates of deposit, fair value is estimated by discounting future cash flows at the rates currently offered for deposits of similar remaining maturities. |
| • | Securities sold under agreements to repurchase—Fair value is determined by discounting future cash flows at the rate implied for other similar instruments with similar remaining maturities. |
| • | Other borrowings—For FHLB advances, fair value is estimated by discounting future cash flows at the rates currently offered for borrowings of similar remaining maturities. For subordinated debentures, fair value is estimated by discounting future cash flows at the rate implied by dealer pricing quotes. For margin collateral, overnight and other short-term borrowings and collateralized borrowings, fair value approximates carrying value. |
| • | Corporate debt—Fair value is estimated using dealer pricing quotes. The fair value of the non-interest-bearing convertible debentures is directly correlated to the intrinsic value of the Company’s underlying stock. As the price of the Company’s stock increases relative to the conversion price, the fair value of the convertible debentures increases. |
125
Table of Contents
In the normal course of business, the Company makes various commitments to extend credit and incur contingent liabilities that are not reflected in the consolidated balance sheet. Changes in the economy or interest rates may influence the impact that these commitments and contingencies have on the Company in the future. The Company does not estimate the fair value of those commitments. The Company has the right to cancel these commitments in certain circumstances and has closed a significant amount of lines of credit in recent periods. As of December 31, 2009, the Company had $1.3 billion of unfunded commitments to extend credit. Information related to such commitments and contingent liabilities is detailed in Note 22—Commitments, Contingencies and Other Regulatory Matters.
NOTE 6—AVAILABLE-FOR-SALE MORTGAGE-BACKED AND INVESTMENT SECURITIES
The amortized cost basis and fair value of available-for-sale mortgage-backed and investment securities are shown in the following tables (dollars in thousands):
| Amortized Cost |
Gross Unrealized Gains |
Gross Unrealized Losses |
Fair Value | ||||||||||
| December 31, 2009: |
|||||||||||||
| Residential mortgage-backed securities: |
|||||||||||||
| Agency mortgage-backed securities and CMOs |
$ | 8,945,396 | $ | 85,184 | $ | (63,704 | ) | $ | 8,966,876 | ||||
| Non-agency CMOs and other |
590,215 | 17 | (215,069 | ) | 375,163 | ||||||||
| Total residential mortgage-backed securities |
9,535,611 | 85,201 | (278,773 | ) | 9,342,039 | ||||||||
| Investment securities: |
|||||||||||||
| Debt securities: |
|||||||||||||
| Agency debentures |
3,928,927 | 5,883 | (14,799 | ) | 3,920,011 | ||||||||
| Municipal bonds |
42,474 | — | (3,484 | ) | 38,990 | ||||||||
| Corporate bonds |
25,422 | 6 | (7,605 | ) | 17,823 | ||||||||
| Total debt securities |
3,996,823 | 5,889 | (25,888 | ) | 3,976,824 | ||||||||
| Publicly traded equity securities: |
|||||||||||||
| Corporate investments |
173 | 676 | — | 849 | |||||||||
| Total investment securities |
3,996,996 | 6,565 | (25,888 | ) | 3,977,673 | ||||||||
| Total available-for-sale securities |
$ | 13,532,607 | $ | 91,766 | $ | (304,661 | ) | $ | 13,319,712 | ||||
| December 31, 2008: |
|||||||||||||
| Residential mortgage-backed securities: |
|||||||||||||
| Agency mortgage-backed securities |
$ | 10,115,865 | $ | 82,663 | $ | (87,715 | ) | $ | 10,110,813 | ||||
| Non-agency CMOs and other |
920,474 | 14 | (318,112 | ) | 602,376 | ||||||||
| Total residential mortgage-backed securities |
11,036,339 | 82,677 | (405,827 | ) | 10,713,189 | ||||||||
| Investment securities: |
|||||||||||||
| Debt securities: |
|||||||||||||
| Municipal bonds |
100,706 | 1 | (21,101 | ) | 79,606 | ||||||||
| Corporate bonds |
25,454 | 14 | (12,667 | ) | 12,801 | ||||||||
| Total debt securities |
126,160 | 15 | (33,768 | ) | 92,407 | ||||||||
| Publicly traded equity securities: |
|||||||||||||
| Corporate investments |
532 | 285 | (319 | ) | 498 | ||||||||
| Total investment securities |
126,692 | 300 | (34,087 | ) | 92,905 | ||||||||
| Total available-for-sale securities |
$ | 11,163,031 | $ | 82,977 | $ | (439,914 | ) | $ | 10,806,094 | ||||
126
Table of Contents
Contractual Maturities
The contractual maturities of available-for-sale debt securities, including mortgage-backed and debt securities, at December 31, 2009 are shown below (dollars in thousands):
| Amortized Cost |
Fair Value | |||||
| Due within one year |
$ | 23 | $ | 23 | ||
| Due within one to five years |
3,282,508 | 3,285,578 | ||||
| Due within five to ten years |
933,576 | 920,012 | ||||
| Due after ten years |
9,316,327 | 9,113,250 | ||||
| Total available-for-sale debt securities |
$ | 13,532,434 | $ | 13,318,863 | ||
The Company pledged $7.3 billion and $8.4 billion at December 31, 2009 and 2008, respectively, of available-for-sale securities as collateral for federal reserves, repurchase agreements and short-term borrowings.
Other-Than-Temporary Impairment of Investments
The following tables show the fair value and unrealized losses on investments, aggregated by investment category, and the length of time that individual securities have been in a continuous unrealized loss position (dollars in thousands):
| Less than 12 Months | 12 Months or More | Total | |||||||||||||||||||
| Fair Value |
Unrealized Losses |
Fair Value |
Unrealized Losses |
Fair Value |
Unrealized Losses |
||||||||||||||||
| December 31, 2009: |
|||||||||||||||||||||
| Residential mortgage-backed securities: |
|||||||||||||||||||||
| Agency mortgage-backed securities and CMOs |
$ | 3,656,469 | $ | (42,667 | ) | $ | 946,056 | $ | (21,037 | ) | $ | 4,602,525 | $ | (63,704 | ) | ||||||
| Non-agency CMOs and other |
27,245 | (14,747 | ) | 347,600 | (200,322 | ) | 374,845 | (215,069 | ) | ||||||||||||
| Debt securities: |
|||||||||||||||||||||
| Agency debentures |
2,349,310 | (14,799 | ) | — | — | 2,349,310 | (14,799 | ) | |||||||||||||
| Municipal bonds |
— | — | 38,986 | (3,484 | ) | 38,986 | (3,484 | ) | |||||||||||||
| Corporate bonds |
— | — | 17,748 | (7,605 | ) | 17,748 | (7,605 | ) | |||||||||||||
| Total temporarily impaired securities |
$ | 6,033,024 | $ | (72,213 | ) | $ | 1,350,390 | $ | (232,448 | ) | $ | 7,383,414 | $ | (304,661 | ) | ||||||
| December 31, 2008: |
|||||||||||||||||||||
| Residential mortgage-backed securities: |
|||||||||||||||||||||
| Agency mortgage-backed securities |
$ | 1,050,268 | $ | (9,255 | ) | $ | 3,157,773 | $ | (78,460 | ) | $ | 4,208,041 | $ | (87,715 | ) | ||||||
| Non-agency CMOs and other |
53,836 | (40,668 | ) | 522,313 | (277,444 | ) | 576,149 | (318,112 | ) | ||||||||||||
| Debt securities: |
|||||||||||||||||||||
| Agency debentures |
— | — | — | — | — | — | |||||||||||||||
| Municipal bonds |
— | — | 79,595 | (21,101 | ) | 79,595 | (21,101 | ) | |||||||||||||
| Corporate bonds |
39 | (4 | ) | 12,719 | (12,663 | ) | 12,758 | (12,667 | ) | ||||||||||||
| Publicly traded equity securities: |
|||||||||||||||||||||
| Corporate investments |
— | — | 43 | (319 | ) | 43 | (319 | ) | |||||||||||||
| Total temporarily impaired securities |
$ | 1,104,143 | $ | (49,927 | ) | $ | 3,772,443 | $ | (389,987 | ) | $ | 4,876,586 | $ | (439,914 | ) | ||||||
127
Table of Contents
Effective April 1, 2009, the Company adopted the amended guidance for the recognition and presentation of OTTI for debt securities. The Company assessed whether it intends to sell, or whether it is more likely than not that the Company will be required to sell a security before recovery of its amortized cost basis. For debt securities that are considered other-than-temporarily impaired and that the Company does not intend to sell and will not be required to sell prior to recovery of its amortized cost basis, the Company determines the amount of the impairment that is related to credit and the amount due to all other factors. The credit loss component is the difference between the security’s amortized cost basis and the present value of its expected future cash flows and is recognized in earnings. The noncredit loss component is the difference between the present value of its expected future cash flows and the fair value and is recognized through other comprehensive income (loss).
The Company does not believe that any individual unrealized loss in the available-for-sale portfolio as of December 31, 2009 represents a credit related impairment. The majority of the unrealized losses on mortgage-backed securities are attributable to changes in interest rates and a re-pricing of risk in the market. All agency mortgage-backed securities and CMOs and agency debentures are AAA-rated. Municipal bonds and corporate bonds are evaluated by reviewing the credit-worthiness of the issuer and general market conditions. The Company does not intend to sell the securities in an unrealized loss position and it is not more likely than not that the Company will be required to sell the debt securities before the anticipated recovery of its remaining amortized cost of the securities in an unrealized loss position at December 31, 2009.
The majority of the Company’s available-for-sale portfolio consists of residential mortgage-backed securities. For residential mortgage-backed securities, the Company calculates the credit portion of OTTI by comparing the present value of the expected future cash flows with the amortized cost basis of the security. The expected future cash flows are determined using the remaining contractual cash flows adjusted for future credit losses. The estimate of expected future credit losses includes the following assumptions: 1) expected default rates based on current delinquency trends, foreclosure statistics of the underlying mortgages and loan documentation type; 2) expected loss severity based on the underlying loan characteristics, including loan-to-value, origination vintage and geography; and 3) expected loan prepayments and principal reduction based on current experience and existing market conditions that may impact the future rate of prepayments. The expected cash flows of the security are then discounted at the interest rate used to recognize interest income on the security to arrive at the present value amount. The following table presents a summary of the significant inputs considered for securities that were other-than-temporarily impaired as of December 31, 2009:
| December 31, 2009 | |||||
| Weighted Average | Range | ||||
| Default rate(1) |
9 | % | 2% – 45% | ||
| Loss severity |
46 | % | 40% –65% | ||
| Prepayment rate |
12 | % | 8% – 45% | ||
| (1) | Represents the expected default rate for the next twelve months. |
The following table presents a roll-forward of the credit loss component of the amortized cost of debt securities, which has noncredit loss recognized in other comprehensive income (loss) and has credit loss recognized in earnings for the nine months ended December 31, 2009 (dollars in thousands):
| Nine Months Ended December 31, 2009(1) | |||
| Credit loss balance, beginning of period |
$ | 80,060 | |
| Additions: |
|||
| Initial credit impairment |
11,780 | ||
| Subsequent credit impairment |
58,532 | ||
| Credit loss balance, end of period |
$ | 150,372 | |
| (1) | The Company adopted the amended guidance for the recognition and presentation of OTTI for debt securities on April 1, 2009. |
128
Table of Contents
Within the securities portfolio, the highest concentration of credit risk is the non-agency CMO portfolio. The Company recognized $89.1 million in net impairment for non-agency CMO securities for year ended December 31, 2009. The Company concluded during 2009 that approximately $394.7 million of non-agency CMO securities were other-than-temporarily impaired as a result of deterioration in the expected credit performance of the underlying loans in the securities. For the year ended December 31, 2009, these securities were written down to their fair value by recording gross OTTI of $232.1 million, of which $143.0 million was recorded as the noncredit portion of OTTI through other comprehensive income (loss) (before tax). For the years ended December 31, 2008 and 2007, the Company recognized net impairment of $95.0 million on non-agency CMO securities and $168.7 million on asset-backed securities.
The detailed components of the gains (losses) on loans and securities, net and gains (losses) on sales of investment, net line items on the consolidated statement of loss is shown below.
Gains (Losses) on Loans and Securities, Net
Gains (losses) on loans and securities, net are as follows (dollars in thousands):
| Year Ended December 31, | ||||||||||||
| 2009 | 2008 | 2007 | ||||||||||
| Losses on sales of loans, net |
$ | (12,496 | ) | $ | (783 | ) | $ | (14,343 | ) | |||
| Gains (losses) on securities, net: |
||||||||||||
| Gains on available-for-sale securities and other investments |
203,619 | 49,397 | 23,399 | |||||||||
| Losses on available-for-sale securities and other investments |
(30,441 | ) | (17,007 | ) | (26,310 | ) | ||||||
| Losses on sale of asset-backed securities |
— | — | (2,241,031 | ) | ||||||||
| Gains (losses) on trading securities, net |
7,845 | (134,297 | ) | (33,441 | ) | |||||||
| Hedge ineffectiveness |
579 | 2,217 | (5,009 | ) | ||||||||
| Gains (losses) on securities, net |
181,602 | (99,690 | ) | (2,282,392 | ) | |||||||
| Gains (losses) on loans and securities, net |
$ | 169,106 | $ | (100,473 | ) | $ | (2,296,735 | ) | ||||
Gains (losses) on Sales of Investments, Net
Gains (losses) on sales of investments, net are as follows (dollars in thousands):
| Year Ended December 31, | ||||||||||||
| 2009 | 2008 | 2007 | ||||||||||
| Realized gains (losses) on sales of publicly traded equity securities |
$ | (317 | ) | $ | 254 | $ | 36,053 | |||||
| Losses on impairment |
(1,636 | ) | (4,425 | ) | — | |||||||
| Other |
239 | (59 | ) | (73 | ) | |||||||
| Gains (losses) on sales of investments, net |
$ | (1,714 | ) | $ | (4,230 | ) | $ | 35,980 | ||||
129
Table of Contents
Loans, net are summarized as follows (dollars in thousands):
| December 31, | ||||||||
| 2009 | 2008 | |||||||
| Loans held-for-sale |
$ | 7,865 | $ | — | ||||
| Loans receivable, net: |
||||||||
| One- to four-family |
10,567,129 | 12,979,844 | ||||||
| Home equity |
7,769,711 | 10,017,183 | ||||||
| Consumer and other |
1,841,317 | 2,298,670 | ||||||
| Total loans receivable |
20,178,157 | 25,295,697 | ||||||
| Unamortized premiums, net |
171,649 | 236,766 | ||||||
| Allowance for loan losses |
(1,182,738 | ) | (1,080,611 | ) | ||||
| Total loans receivable, net |
19,167,068 | 24,451,852 | ||||||
| Total loans, net |
$ | 19,174,933 | $ | 24,451,852 | ||||
In addition to these loans, the Company had $34.2 million in commitments to originate loans at December 31, 2009. The Company had $7.9 million in commitments to sell loans and no commitments to purchase loans at December 31, 2009 (See Note 22—Commitments, Contingencies, and Other Regulatory Matters).
The following table shows the percentage of adjustable and fixed-rate loans in the Company’s portfolio (dollars in thousands):
| December 31, 2009 | December 31, 2008 | |||||||||||
| $ Amount | % of Total | $ Amount | % of Total | |||||||||
| Adjustable rate loans: |
||||||||||||
| One- to four-family |
$ | 7,916,259 | 39.2 | % | $ | 9,705,494 | 38.4 | % | ||||
| Home equity |
5,770,779 | 28.6 | 7,287,615 | 28.8 | ||||||||
| Consumer and other |
214,086 | 1.1 | 299,966 | 1.2 | ||||||||
| Total adjustable rate loans |
13,901,124 | 68.9 | 17,293,075 | 68.4 | ||||||||
| Fixed rate loans |
6,284,898 | 31.1 | 8,002,622 | 31.6 | ||||||||
| Total loans(1) |
$ | 20,186,022 | 100.0 | % | $ | 25,295,697 | 100.0 | % | ||||
| (1) | Includes the principal balance of held-for-sale loans of $7.9 million at December 31, 2009. There were no held-for-sale loans at December 31, 2008. |
The weighted-average remaining maturity of mortgage loans secured by one- to four-family residences was 316 and 326 months at December 31, 2009 and 2008, respectively. Additionally, all mortgage loans outstanding at December 31, 2009 and 2008 in the held-for-investment portfolio were serviced by other companies.
Activity in the allowance for loan losses is summarized as follows (dollars in thousands):
| Year Ended December 31, | ||||||||||||
| 2009 | 2008 | 2007 | ||||||||||
| Allowance for loan losses, beginning of period |
$ | 1,080,611 | $ | 508,164 | $ | 67,628 | ||||||
| Provision for loan losses |
1,498,112 | 1,583,666 | 640,078 | |||||||||
| Charge-offs |
(1,442,187 | ) | (1,043,015 | ) | (227,679 | ) | ||||||
| Recoveries |
46,202 | 31,796 | 28,137 | |||||||||
| Net charge-offs |
(1,395,985 | ) | (1,011,219 | ) | (199,542 | ) | ||||||
| Allowance for loan losses, end of period |
$ | 1,182,738 | $ | 1,080,611 | $ | 508,164 | ||||||
130
Table of Contents
The Company classifies loans as nonperforming when they are 90 days past due. The following table provides the breakout of nonperforming loans by type (dollars in thousands):
| December 31, | ||||||
| 2009 | 2008 | |||||
| One- to four-family |
$ | 1,229,678 | $ | 593,075 | ||
| Home equity |
250,576 | 341,255 | ||||
| Consumer and other |
6,725 | 7,792 | ||||
| Total nonperforming loans |
$ | 1,486,979 | $ | 942,122 | ||
If the Company’s nonperforming loans at December 31, 2009 had been performing in accordance with their terms, the Company would have recorded additional interest income of approximately $108.7 million, $45.9 million and $19.9 million for the years ended December 31, 2009, 2008 and 2007, respectively. During 2009, the Company recognized $37.2 million in interest on loans that were in nonperforming status at December 31, 2009. At December 31, 2009 and 2008, there were no commitments to lend additional funds to any of these borrowers.
The Company has a CDS on a portion of its first-lien residential real estate loan portfolio through a synthetic securitization structure that provides, for a fee, an assumption by a third party of a portion of the credit risk related to the underlying loans. The CDS provides protection for losses in excess of $4.0 million, but not to exceed approximately $30.3 million. During the year ended December 31, 2009, the entire $30.3 million in losses had been recognized and as a result, there is not a related benefit reflected in the allowance for loan losses as of December 31, 2009. The Company has received approximately $8 million in payments out of the total $30 million benefit as of December 31, 2009. The Company expects to receive the remaining $22 million in 2010.
The Company initiated a loan modification program in 2008 that in its early stages, resulted in an insignificant number of minor modifications. This loan modification program became more active during 2009. As part of the program, the Company considers modifications in which it made an economic concession to a borrower experiencing financial difficulty a TDR. The Company has also modified a number of loans through traditional collections actions taken in the normal course of servicing delinquent accounts. These actions typically result in an insignificant delay in the timing of payments; therefore, the Company does not consider such activities to be economic concessions to the borrowers.
Included in the allowance for loan losses at December 31, 2009 was a specific allowance of $193.6 million that was established for TDRs. The specific allowance for these individually impaired loans represents the expected loss over the remaining life of the loan, including the economic concession to the borrower. The following table shows detailed information related to the Company’s modified loans accounted for as TDRs for the year ended December 31, 2009 (dollars in thousands):
| Recorded Investment in TDRs (1) |
Specific Valuation Allowance |
Specific Valuation Allowance as a % of TDR Loans |
|||||||
| December 31, 2009 |
|||||||||
| One- to four-family |
$ | 207,581 | $ | 26,916 | 13 | % | |||
| Home equity |
371,320 | 166,636 | 45 | % | |||||
| Total(2) |
$ | 578,901 | $ | 193,552 | 33 | % | |||
| (1) | For the year ended December 31, 2009, the average recorded investment in TDR loans was $309.8 million, and the interest income recognized on these loans was $6.8 million. |
| (2) | At December 31, 2009, $519.2 million of TDRs had an associated specific valuation allowance and $59.7 million did not have an associated specific valuation allowance as the amount of the loan balance in excess of the estimated current property value less costs to sell has been charged-off. |
131
Table of Contents
NOTE 8—ACCOUNTING FOR DERIVATIVE INSTRUMENTS AND HEDGING ACTIVITIES
The Company enters into derivative transactions primarily to protect against interest rate risk on the value of certain assets, liabilities and future cash flows. Derivative instruments designated in hedging relationships that mitigate exposure to the variability in expected future cash flows or other forecasted transactions are considered cash flow hedges. Derivative instruments in hedging relationships that mitigate exposure to changes in the fair value of assets or liabilities are considered fair value hedges. The Company also recognizes certain contracts and commitments as derivatives when the characteristics of those contracts and commitments meet the definition of a derivative. Each derivative is recorded on the consolidated balance sheet at fair value as a freestanding asset or liability. Cash flow and fair value hedge ineffectiveness is re-measured on a quarterly basis. The following table summarizes the location and fair value amounts of derivative instruments reported in the consolidated balance sheet (dollars in thousands):
| Fair Value | |||||||||||
| Asset(1) | Liability(2) | Net(3) | |||||||||
| December 31, 2009 |
|||||||||||
| Derivatives designated as hedging instruments: |
|||||||||||
| Interest rate contracts: |
|||||||||||
| Cash flow hedges |
$ | 87,534 | $ | (143,602 | ) | $ | (56,068 | ) | |||
| Fair value hedges |
5,863 | — | 5,863 | ||||||||
| Total derivatives designated as hedging instruments(4) |
$ | 93,397 | $ | (143,602 | ) | $ | (50,205 | ) | |||
| (1) | Reflected in the other assets line item on the consolidated balance sheet. |
| (2) | Reflected in the accounts payable, accrued and other liabilities line item on the consolidated balance sheet. |
| (3) | Represents derivative assets net of derivative liabilities for presentation purposes only. |
| (4) | There were no derivatives not designated as hedging instruments as of December 31, 2009. |
Cash Flow Hedges
The majority of the Company’s derivative instruments as of December 31, 2009 and 2008 were designated as cash flow hedges. These hedges, which include a combination of interest rate swaps, forward-starting swaps and purchased options, including caps and floors, are used primarily to reduce the variability of future cash flows associated with existing variable-rate assets and liabilities and forecasted issuances of liabilities.
The effective portion of changes in fair value of the derivative instruments that hedge cash flows is reported as a component of accumulated other comprehensive loss, net of tax in the consolidated balance sheet, for both active and terminated hedges. Amounts are then included in net operating interest income as a yield adjustment in the same period the hedged transaction affects earnings. The ineffective portion of changes in fair value of the derivative instruments is reported as a fair value adjustment in the gains (losses) on loans and securities, net line item in the consolidated statement of loss.
If it becomes probable that a hedged forecasted transaction will not occur, amounts included in accumulated other comprehensive loss related to the specific hedging instruments are reclassified into the gains (losses) on loans and securities, net line item in the consolidated statement of loss. If hedge accounting is discontinued because a derivative instrument ceases to be a highly effective hedge; or is sold, terminated or de-designated, amounts included in accumulated other comprehensive loss related to the specific hedging instrument continue to be reported in other comprehensive income or loss until the forecasted transaction affects earnings. Derivative instruments no longer in hedging relationships continue to be recorded at fair value with changes in fair value reported in the gains (losses) on loans and securities, net line item in the consolidated statement of loss.
The future issuances of liabilities, including repurchase agreements, are largely dependent on the market demand and liquidity in the wholesale borrowings market. As of December 31, 2009, the Company believes the forecasted issuance of all debt in cash flow hedge relationships is probable. However, unexpected changes in
132
Table of Contents
market conditions in future periods could impact the ability to issue this debt. The Company believes the forecasted issuance of debt in the form of repurchase agreements is most susceptible to an unexpected change in market conditions.
The following table summarizes information related to the Company’s interest rate contracts in cash flow hedge relationships hedging variable-rate assets and liabilities and the forecasted issuances of liabilities (dollars in thousands):
| Notional Amount |
Fair Value | Weighted-Average | |||||||||||||||||||||||
| Asset | Liability | Net | Pay Rate |
Receive Rate |
Strike Rate |
Remaining Life (Years) | |||||||||||||||||||
| December 31, 2009: |
|||||||||||||||||||||||||
| Pay-fixed interest rate swaps: |
|||||||||||||||||||||||||
| Repurchase agreements |
$ | 1,565,000 | $ | — | $ | (125,954 | ) | $ | (125,954 | ) | 4.87 | % | 0.26 | % | N/A | 9.68 | |||||||||
| FHLB advances |
530,000 | — | (17,648 | ) | (17,648 | ) | 4.32 | % | 0.25 | % | N/A | 8.11 | |||||||||||||
| Purchased interest rate forward-starting swaps: |
|||||||||||||||||||||||||
| Repurchase agreements |
200,000 | 2,031 | — | 2,031 | 3.88 | % | N/A | N/A | 10.09 | ||||||||||||||||
| Purchased interest rate options(1) : |
|||||||||||||||||||||||||
| Caps |
2,185,000 | 36,233 | — | 36,233 | N/A | N/A | 4.76 | % | 3.42 | ||||||||||||||||
| Floors |
1,900,000 | 49,270 | — | 49,270 | N/A | N/A | 6.43 | % | 1.46 | ||||||||||||||||
| Total cash flow hedges |
$ | 6,380,000 | $ | 87,534 | $ | (143,602 | ) | $ | (56,068 | ) | 4.66 | % | 0.25 | % | 5.54 | % | 4.97 | ||||||||
| December 31, 2008: |
|||||||||||||||||||||||||
| Pay-fixed interest rate swaps: |
|||||||||||||||||||||||||
| Repurchase agreements |
$ | 2,080,000 | $ | — | $ | (415,410 | ) | $ | (415,410 | ) | 4.88 | % | 2.61 | % | N/A | 9.89 | |||||||||
| FHLB advances |
330,000 | — | (44,135 | ) | (44,135 | ) | 4.50 | % | 1.91 | % | N/A | 7.85 | |||||||||||||
| Purchased interest rate forward-starting swaps: |
|||||||||||||||||||||||||
| Repurchase agreements |
100,000 | — | (11,254 | ) | (11,254 | ) | 3.90 | % | N/A | N/A | 10.15 | ||||||||||||||
| Purchased interest rate options(1) : |
|||||||||||||||||||||||||
| Caps |
1,635,000 | 2,620 | — | 2,620 | N/A | N/A | 5.19 | % | 3.13 | ||||||||||||||||
| Floors |
1,900,000 | 99,473 | — | 99,473 | N/A | N/A | 6.43 | % | 2.46 | ||||||||||||||||
| Total cash flow hedges |
$ | 6,045,000 | $ | 102,093 | $ | (470,799 | ) | $ | (368,706 | ) | 4.79 | % | 2.52 | % | 5.86 | % | 5.62 | ||||||||
| (1) | Caps are used to hedge repurchase agreements. Floors are used to hedge home equity lines of credit. |
Additionally, the Company enters into forward purchase and sale agreements, which are considered cash flow hedges, when the terms of the commitments exactly match the terms of the securities purchased or sold. As of December 31, 2009, there were no forward contracts accounted for as cash flow hedges.
133
Table of Contents
The following table shows: 1) amounts recorded in accumulated other comprehensive loss related to derivative instruments accounted for as cash flow hedges; 2) amount of ineffectiveness recorded in earnings related to derivative instruments accounted for as cash flow hedges; 3) the notional amount and fair value of terminated derivative instruments accounted for as cash flow hedges for the periods presented; and 4) the amortization of terminated derivative instruments accounted for as cash flow hedges included in net operating interest income (dollars in thousands):
| Year Ended December 31, | ||||||||||||
| 2009 | 2008 | 2007 | ||||||||||
| Impact on accumulated other comprehensive loss (net of tax): |
||||||||||||
| Beginning balance |
$ | (417,489 | ) | $ | (132,223 | ) | $ | (27,844 | ) | |||
| Unrealized gains (losses), net |
101,886 | (302,132 | ) | (116,101 | ) | |||||||
| Reclassifications into earnings, net |
37,055 | 16,866 | 11,722 | |||||||||
| Ending balance |
$ | (278,548 | ) | $ | (417,489 | ) | $ | (132,223 | ) | |||
| Cash flow hedge ineffectiveness(1)(2) |
$ | 579 | $ | 180 | $ | (336 | ) | |||||
| Derivatives terminated during the period: |
||||||||||||
| Notional |
$ | 1,140,000 | $ | 7,135,000 | $ | 11,435,000 | ||||||
| Fair value of net losses recognized in accumulated other comprehensive loss |
$ | (128,869 | ) | $ | (268,364 | ) | $ | (17,530 | ) | |||
| Amortization of terminated interest rate swaps and options included in net operating interest income |
$ | (39,629 | ) | $ | 5,811 | $ | 1,090 | |||||
| (1) | The amount of ineffectiveness recorded in earnings for cash flow hedges is equal to the excess of the cumulative change in the fair value of the actual derivative over the cumulative change in the fair value of a hypothetical derivative which is created to match the exact terms of the underlying instruments being hedged. |
| (2) | The cash flow hedge ineffectiveness is reflected in the gains (losses) on loans and securities, net line item. |
During the upcoming twelve months, the Company expects to include a pre-tax amount of approximately $19.3 million of net unrealized gains that are currently reflected in accumulated other comprehensive loss in net operating interest income as a yield adjustment in the same periods in which the related items affect earnings. The losses accumulated in other comprehensive loss on terminated derivative instruments will be included in net operating interest income over the periods the related items will affect earnings, ranging from 48 days to approximately 13 years.
The following table shows the balance in accumulated other comprehensive loss attributable to open cash flow hedges and discontinued cash flow hedges (dollars in thousands):
| As of December 31, | ||||||||
| 2009 | 2008 | |||||||
| Accumulated other comprehensive loss balance (net of tax) related to: |
||||||||
| Open cash flow hedges |
$ | (73,368 | ) | $ | (266,704 | ) | ||
| Discontinued cash flow hedges |
(205,180 | ) | (150,785 | ) | ||||
| Total cash flow hedges |
$ | (278,548 | ) | $ | (417,489 | ) | ||
134
Table of Contents
The following table shows the balance in accumulated other comprehensive loss attributable to cash flow hedges by type of hedged item (dollars in thousands):
| As of December 31, | ||||||||
| 2009 | 2008 | |||||||
| Accumulated other comprehensive loss balance related to cash flow hedges: |
||||||||
| Repurchase agreements |
$ | (403,384 | ) | $ | (664,847 | ) | ||
| FHLB advances |
(102,572 | ) | (104,839 | ) | ||||
| Home equity lines of credit |
56,480 | 99,453 | ||||||
| Other |
(848 | ) | (1,068 | ) | ||||
| Total cash flow hedges before tax |
(450,324 | ) | (671,301 | ) | ||||
| Tax benefit |
171,776 | 253,812 | ||||||
| Total cash flow hedges, net of tax |
$ | (278,548 | ) | $ | (417,489 | ) | ||
Fair Value Hedges
The Company uses interest rate swaps to offset its exposure to changes in value of certain fixed-rate liabilities. Changes in the fair value of the derivatives are recognized currently in the gains (losses) on loans and securities, net line item.
Fair value hedges are accounted for by recording the fair value of the derivative instrument and the change in fair value of the asset or liability being hedged on the consolidated balance sheet. To the extent that the hedge is ineffective, the changes in the fair values will not offset and the difference, or hedge ineffectiveness, is reflected in the gains (losses) on loans and securities, net line item in the consolidated statement of loss. Cash payments or receipts and related accruals during the reporting period on derivatives included in fair value hedge relationships are recorded as an adjustment to interest income or interest expense on the hedged item.
Hedge accounting is discontinued for fair value hedges if a derivative instrument ceases to be highly effective as a hedge or if the derivative is sold, terminated or de-designated. If fair value hedge accounting is discontinued, the net gain or loss on the asset or liability being hedged at the time of de-designation is amortized to interest expense or interest income over the expected remaining life of the hedged item using the effective interest method. Changes in the fair value of the derivative instruments after de-designation of fair value hedge accounting are recorded in the gains (losses) on loans and securities, net line item in the consolidated statement of loss. For a discontinued fair value hedge, the previously hedged item is no longer adjusted for changes in fair value.
The following table summarizes information related to the Company’s interest rate contracts in fair value hedge relationships (dollars in thousands):
| Notional Amount |
Fair Value | Weighted-Average | ||||||||||||||||||||
| Asset | Liability | Net | Pay Rate |
Receive Rate |
Strike Rate |
Remaining Life (Years) | ||||||||||||||||
| December 31, 2009: |
||||||||||||||||||||||
| Receive-fixed interest rate swaps: |
||||||||||||||||||||||
| Corporate debt |
$ | 225,000 | $ | 5,863 | $ | — | $ | 5,863 | 3.82 | % | 7.38 | % | N/A | 3.72 | ||||||||
| Total fair value hedges |
$ | 225,000 | $ | 5,863 | $ | — | $ | 5,863 | 3.82 | % | 7.38 | % | N/A | 3.72 | ||||||||
| December 31, 2008: |
||||||||||||||||||||||
| Receive-fixed interest rate swaps: |
||||||||||||||||||||||
| Corporate debt |
$ | 414,500 | $ | 20,726 | $ | — | $ | 20,726 | 4.70 | % | 7.38 | % | N/A | 4.71 | ||||||||
| Brokered certificates of deposit |
4,210 | 8 | — | 8 | 1.85 | % | 5.38 | % | N/A | 11.21 | ||||||||||||
| Total fair value hedges |
$ | 418,710 | $ | 20,734 | $ | — | $ | 20,734 | 4.67 | % | 7.35 | % | N/A | 4.77 | ||||||||
135
Table of Contents
The following table summarizes the effect of interest rate contracts designated and qualifying as hedging instruments in fair value hedges and related hedged items on the consolidated statement of loss in accordance with the Company’s adoption of the amended disclosure requirements on January 1, 2009 (dollars in thousands):
| Year Ended December 31, 2009 | |||||||
| Hedging Instrument |
Hedged Item | ||||||
| Gains (losses) included in earnings: |
|||||||
| Interest rate contracts: |
|||||||
| Corporate debt |
$ | (7,874 | ) | $ | 7,874 | ||
| Brokered certificates of deposit |
(8 | ) | 8 | ||||
| Total fair value hedges |
$ | (7,882 | ) | $ | 7,882 | ||
There was no fair value hedge ineffectiveness for the year ended December 31, 2009. There was $2.0 million of fair value hedge ineffectiveness income and $4.7 million of fair value hedge ineffectiveness expense for the years ended December 31, 2008 and 2007, respectively. The fair value hedge ineffectiveness is reflected in the gains (losses) on loans and securities, net line item.
Liability to Lehman Brothers
Prior to Lehman Brothers’ declaration of bankruptcy in September 2008, E*TRADE Bank was a counterparty to interest rate derivative contracts with a subsidiary of Lehman Brothers. The declaration of bankruptcy by Lehman Brothers triggered an event of default and early termination under E*TRADE Bank’s International Swap Dealers Association Master Agreement. As of the date of the event of default, E*TRADE Bank’s net amount due to the Lehman Brothers subsidiary was approximately $101 million, the majority of which was collateralized by securities held by or on behalf of the Lehman Brothers subsidiary. E*TRADE Bank currently is negotiating with Lehman Brothers in an attempt to resolve the parties’ respective obligations.
Credit Risk
Impact on Fair Value Measurements
Credit risk is an element of the recurring fair value measurements for certain assets and liabilities, including derivative instruments. Credit risk is managed by limiting activity to approved counterparties and setting aggregate exposure limits for each approved counterparty. The Company also monitors collateral requirements on derivative instruments through credit support agreements, which reduce risk by permitting the netting of transactions with the same counterparty upon occurrence of certain events.
The Company considered the impact of credit risk on the fair value measurement for derivative instruments, particularly those in net liability positions to counterparties, to be mitigated by the enforcement of credit support agreements, and the collateral requirements therein. The Company pledged approximately $146.1 million of its mortgage-backed and investment securities as collateral related to its derivative contracts in net liability positions to counterparties as of December 31, 2009.
The Company’s credit risk analysis for derivative instruments also considered whether the cost to mitigate the credit loss exposure on derivative instruments in net asset positions would have resulted in material adjustments to the valuations. During the year ended December 31, 2009, the consideration of counterparty credit risk did not result in an adjustment to the valuation of the Company’s derivative instruments.
Impact on Liquidity
In the normal course of business, collateral requirements contained in the Company’s derivative instruments are enforced by the Company and its counterparties. Upon enforcement of the collateral requirements, the amount of collateral requested is typically based on the net fair value of all derivative instruments with the counterparty; that
136
Table of Contents
is derivative assets net of derivative liabilities at the counterparty level. If the Company were to be in violation of certain provisions of the derivative instruments, the counterparties to the derivative instruments could request payment or collateralization on derivative instruments. The Company expects such requests would be based on the fair value of derivative assets net of derivative liabilities at the counterparty level. The fair value of derivative instruments in net liability positions at the counterparty level was $113.1 million as of December 31, 2009. The fair value of the Company’s mortgage-backed and investment securities pledged as collateral related to derivative contracts in net liability positions to counterparties, $146.1 million as of December 31, 2009, exceeded derivative instruments in net liability positions at the counterparty level by $33.0 million.
NOTE 9—PROPERTY AND EQUIPMENT, NET
Property and equipment, net consists of the following (dollars in thousands):
| December 31, 2009 | December 31, 2008 | |||||||||||||||||||
| Gross Amount |
Accumulated Depreciation and Amortization |
Net Amount |
Gross Amount |
Accumulated Depreciation and Amortization |
Net Amount | |||||||||||||||
| Software |
$ | 559,262 | $ | (393,895 | ) | $ | 165,367 | $ | 493,588 | $ | (346,750 | ) | $ | 146,838 | ||||||
| Equipment |
182,753 | (147,592 | ) | 35,161 | 174,871 | (132,551 | ) | 42,320 | ||||||||||||
| Leasehold improvements |
115,643 | (64,123 | ) | 51,520 | 111,112 | (54,454 | ) | 56,658 | ||||||||||||
| Buildings |
71,927 | (15,755 | ) | 56,172 | 71,927 | (13,700 | ) | 58,227 | ||||||||||||
| Furniture and fixtures |
28,637 | (20,115 | ) | 8,522 | 31,223 | (19,766 | ) | 11,457 | ||||||||||||
| Land |
3,427 | — | 3,427 | 3,722 | — | 3,722 | ||||||||||||||
| Total |
$ | 961,649 | $ | (641,480 | ) | $ | 320,169 | $ | 886,443 | $ | (567,221 | ) | $ | 319,222 | ||||||
Depreciation and amortization expense from continuing operations related to property and equipment was $83.3 million, $82.5 million and $83.2 million for the years ended December 31, 2009, 2008 and 2007, respectively.
Software includes capitalized internally developed software costs. These costs were $59.2 million, $65.5 million and $64.1 million for the years ended December 31, 2009, 2008 and 2007, respectively. Completed projects are carried at cost and are amortized on a straight-line basis over their estimated useful lives, generally four years. Amortization expense from continuing operations for the capitalized amounts was $39.6 million, $33.4 million and $27.2 million for the years ended December 31, 2009, 2008 and 2007. Also included in software at December 31, 2009 is $56.0 million of internally developed software in the process of development for which amortization has not begun.
NOTE 10—GOODWILL AND OTHER INTANGIBLES, NET
The following table discloses the changes in the carrying value of the Company’s goodwill that occurred in the trading and investing segment for the periods presented (dollars in thousands):
| Trading & Investing | ||||
| Balance at December 31, 2007 |
$ | 1,933,368 | ||
| Additional purchase consideration |
17,314 | |||
| Write-off of goodwill related to exit activities and discontinued operations |
(12,357 | ) | ||
| Balance at December 31, 2008 |
1,938,325 | |||
| Additional purchase consideration |
14,001 | |||
| Balance at December 31, 2009(1) |
$ | 1,952,326 | ||
| (1) | As of December 31, 2009, there is no accumulated impairment losses related to the trading and investing segment goodwill. |
137
Table of Contents
For the years ended December 31, 2009 and 2008, the increases in the carrying value of goodwill are the result of the Company paying additional purchase consideration in connection with prior acquisitions. For the year ended December 31, 2008, the increase was offset by write-offs of goodwill related to certain exit activities and discontinued operations (see Note 2—Discontinued Operations and Note 3—Facility Restructuring and Other Exit Activities for further discussion).
During the year ended December 31, 2007, the Company’s balance sheet management segment had a decline in fair value related to the crisis in the residential real-estate and credit markets. As a result, the entire carrying value of the segment’s goodwill of $101.2 million was impaired for the year ended December 31, 2007. There was no goodwill assigned to reporting units within the balance sheet management segment for the years ended December 31, 2009 and 2008.
The following table shows the Company’s accumulated impairment losses related to its goodwill from January 1, 2002 through December 31, 2009 (dollars in thousands):
| Goodwill |
$ | 2,053,534 | ||
| Accumulated impairment losses |
(101,208 | ) | ||
| Balance at December 31, 2009 |
$ | 1,952,326 | ||
Other intangible assets with finite lives, which are primarily amortized on an accelerated basis, consist of the following (dollars in thousands):
| December 31, 2009 | ||||||||||||||
| Weighted Average Original Useful Life (Years) |
Weighted Average Remaining Useful Life (Years) |
Gross Amount |
Accumulated Amortization |
Net Amount | ||||||||||
| Customer list |
21 | 16 | $ | 501,820 | $ | (152,398) | $ | 349,422 | ||||||
| Active accounts |
10 | 5 | 17,004 | (11,079 | ) | 5,925 | ||||||||
| Other |
18 | 17 | 1,400 | (343 | ) | 1,057 | ||||||||
| Total other intangible assets(1) |
$ | 520,224 | $ | (163,820 | ) | $ | 356,404 | |||||||
| December 31, 2008 | ||||||||||||||
| Weighted Average Original Useful Life (Years) |
Weighted Average Remaining Useful Life (Years) |
Gross Amount |
Accumulated Amortization |
Net Amount | ||||||||||
| Customer list |
21 | 17 | $ | 501,820 | $ | (124,469 | ) | $ | 377,351 | |||||
| Active accounts |
10 | 6 | 17,004 | (9,383 | ) | 7,621 | ||||||||
| Other |
18 | 18 | 1,400 | (242 | ) | 1,158 | ||||||||
| Total other intangible assets(1) |
$ | 520,224 | $ | (134,094 | ) | $ | 386,130 | |||||||
| (1) | Fully amortized other intangible assets not included in the table above. |
138
Table of Contents
Assuming no future impairments of these assets or additional acquisitions, annual amortization expense will be as follows (dollars in thousands):
| Years ending December 31, |
|||
| 2010 |
$ | 28,562 | |
| 2011 |
27,451 | ||
| 2012 |
26,420 | ||
| 2013 |
25,461 | ||
| 2014 |
24,394 | ||
| Thereafter |
224,116 | ||
| Total future amortization expense |
$ | 356,404 | |
Amortization of other intangibles from continuing operations was $29.7 million, $35.7 million and $40.5 million for the years ended December 31, 2009, 2008 and 2007, respectively.
Other assets consist of the following (dollars in thousands):
| December 31, | ||||||
| 2009 | 2008 | |||||
| Deferred tax asset |
$ | 1,441,861 | $ | 1,034,697 | ||
| Deposit paid for securities borrowed |
419,893 | 216,458 | ||||
| Bank owned life insurance policy(1) |
271,549 | 259,268 | ||||
| Prepaid FDIC insurance premiums |
268,520 | — | ||||
| Accrued interest receivable |
203,680 | 243,071 | ||||
| Real estate owned and repossessed assets |
115,677 | 108,105 | ||||
| Derivative assets |
93,397 | 137,316 | ||||
| Brokerage operational related receivables |
72,203 | 203,262 | ||||
| Reserve fund receivable |
48,988 | 146,308 | ||||
| Third party loan servicing receivable |
48,429 | 47,933 | ||||
| Other investments |
45,701 | 56,022 | ||||
| Other prepaids |
31,152 | 35,220 | ||||
| Other |
103,995 | 105,944 | ||||
| Total other assets |
$ | 3,165,045 | $ | 2,593,604 | ||
| (1) | Represents the cash surrender value. |
Other Investments
The Company has investments in low-income housing tax credit partnerships and other limited partnerships. As of December 31, 2009, the Company had $9.1 million in commitments to fund low income housing tax credit partnerships and other limited partnerships.
Equity Method Investments
Equity method investments are reported as part of the other investments balance within the other assets line item on the consolidated balance sheet and consist of the following (dollars in thousands):
| December 31, | ||||||
| 2009 | 2008 | |||||
| Arrowpath Fund II, L.P. |
$ | 15,530 | $ | 21,765 | ||
| MMA Mid-Atlantic Affordable Housing Fund III |
3,150 | 3,478 | ||||
| Other |
11,257 | 11,470 | ||||
| Total equity method investments |
$ | 29,937 | $ | 36,713 | ||
139
Table of Contents
Deposits are summarized as follows (dollars in thousands):
| Weighted-Average Rate |
Amount | Percentage to Total |
||||||||||||||||
| December 31, | December 31, | December 31, | ||||||||||||||||
| 2009 | 2008 | 2009 | 2008 | 2009 | 2008 | |||||||||||||
| Sweep deposit accounts(1) |
0.07 | % | 0.07 | % | $ | 12,551,497 | $ | 9,650,431 | 49.0 | % | 36.9 | % | ||||||
| Complete savings accounts |
0.50 | % | 2.97 | % | 9,704,045 | 11,298,553 | 37.9 | 43.2 | ||||||||||
| Certificates of deposit |
1.69 | % | 3.37 | % | 1,215,780 | 2,363,385 | 4.8 | 9.0 | ||||||||||
| Other money market and savings accounts |
0.29 | % | 0.86 | % | 1,183,392 | 1,394,176 | 4.6 | 5.4 | ||||||||||
| Checking accounts |
0.19 | % | 1.06 | % | 813,663 | 991,477 | 3.2 | 3.8 | ||||||||||
| Brokered certificates of deposit |
4.51 | % | 4.48 | % | 129,344 | 438,224 | 0.5 | 1.7 | ||||||||||
| Total deposits |
0.35 | % | 1.77 | % | $ | 25,597,721 | $ | 26,136,246 | 100.0 | % | 100.0 | % | ||||||
| (1) | A sweep product transfers brokerage customer balances to banking subsidiaries, which hold these funds as customer deposits in FDIC-insured demand deposits and money market deposit accounts. |
Deposits, classified by rates are as follows (dollars in thousands):
| December 31, | ||||||
| 2009 | 2008 | |||||
| Less than 2.00% |
$ | 25,108,277 | $ | 12,177,178 | ||
| 2.00%–3.99% |
123,831 | 13,067,930 | ||||
| 4.00%–5.99% |
365,508 | 889,446 | ||||
| 6.00% and above |
105 | 1,659 | ||||
| Subtotal |
25,597,721 | 26,136,213 | ||||
| Fair value adjustments |
— | 33 | ||||
| Total deposits |
$ | 25,597,721 | $ | 26,136,246 | ||
At December 31, 2009, scheduled maturities of certificates of deposit and brokered certificates of deposit were as follows (dollars in thousands):
| < 1 Year | 1-2 Years | 2-3 Years | 3-4 Years | 4-5 Years | > 5 Years | Total | ||||||||||||||||
| Less than 2.00% |
$ | 676,985 | $ | 146,251 | $ | 18,737 | $ | 1,560 | $ | 6,744 | $ | 6,118 | $ | 856,395 | ||||||||
| 2.00%–3.99% |
46,428 | 60,888 | 3,054 | 11,904 | 2,037 | — | 124,311 | |||||||||||||||
| 4.00%–5.99% |
105,119 | 131,575 | 70,762 | 16,486 | 625 | 41,855 | 366,422 | |||||||||||||||
| 6.00% and above |
82 | 20 | 3 | — | — | — | 105 | |||||||||||||||
| Subtotal |
$ | 828,614 | $ | 338,734 | $ | 92,556 | $ | 29,950 | $ | 9,406 | $ | 47,973 | 1,347,233 | |||||||||
| Unamortized discount, net |
(2,109 | ) | ||||||||||||||||||||
| Total certificates of deposit and brokered certificates of deposit |
$ | 1,345,124 | ||||||||||||||||||||
140
Table of Contents
Scheduled maturities of certificates of deposit with denominations greater than or equal to the FDIC deposit insurance coverage limits were as follows (dollars in thousands):
| December 31, | ||||||
| 2009 | 2008 | |||||
| Three months or less |
$ | 16,887 | $ | 47,861 | ||
| Three through six months |
6,652 | 23,565 | ||||
| Six through twelve months |
4,556 | 17,051 | ||||
| Over twelve months |
4,130 | 7,526 | ||||
| Total certificates of deposit |
$ | 32,225 | $ | 96,003 | ||
Operating interest expense on deposits is summarized as follows (dollars in thousands):
| Year Ended December 31, | |||||||||
| 2009 | 2008 | 2007 | |||||||
| Sweep deposit accounts |
$ | 7,653 | $ | 39,971 | $ | 102,131 | |||
| Complete savings accounts |
140,086 | 331,009 | 313,269 | ||||||
| Certificates of deposit |
45,175 | 137,394 | 224,649 | ||||||
| Other money market and savings accounts |
5,900 | 38,916 | 150,815 | ||||||
| Checking accounts |
2,957 | 19,665 | 5,689 | ||||||
| Brokered certificates of deposit |
10,017 | 48,893 | 25,402 | ||||||
| Total operating interest expense related to deposits |
$ | 211,788 | $ | 615,848 | $ | 821,955 | |||
Accrued interest payable on these deposits, which is included in accounts payable, accrued and other liabilities, was $2.6 million and $10.0 million at December 31, 2009 and 2008, respectively.
During the fourth quarter of 2009, the Company entered into an agreement to sell up to $1.4 billion of its complete savings accounts to a third party. This transaction requires notification to each customer account being sold; therefore, the Company expects that upon closing, the amount of deposits ultimately transferred will be less than $1.4 billion.
NOTE 13—SECURITIES SOLD UNDER AGREEMENTS TO REPURCHASE AND OTHER BORROWINGS
The maturities of borrowings at December 31, 2009 and total borrowings at December 31, 2009 and 2008 are shown below (dollars in thousands):
| Repurchase Agreements |
Other Borrowings | Total | Weighted Average Interest Rate |
||||||||||||
| FHLB Advances |
Other | ||||||||||||||
| Years Ending December 31, |
|||||||||||||||
| 2010 |
$ | 3,767,040 | $ | 850,000 | $ | 15,833 | $ | 4,632,873 | 0.32 | % | |||||
| 2011 |
1,374,835 | — | 111 | 1,374,946 | 0.68 | % | |||||||||
| 2012 |
100,000 | — | — | 100,000 | 2.14 | % | |||||||||
| 2013 |
100,000 | — | — | 100,000 | 2.06 | % | |||||||||
| 2014 |
200,000 | 320,000 | — | 520,000 | 4.69 | % | |||||||||
| Thereafter |
900,000 | 1,133,600 | 427,415 | 2,461,015 | 3.19 | % | |||||||||
| Total borrowings at December 31, 2009 |
$ | 6,441,875 | $ | 2,303,600 | $ | 443,359 | $ | 9,188,834 | 1.43 | % | |||||
| Total borrowings at December 31, 2008 |
$ | 7,381,279 | $ | 3,903,600 | $ | 450,177 | $ | 11,735,056 | 3.42 | % | |||||
141
Table of Contents
Securities Sold Under Agreements to Repurchase
Repurchase agreements are collateralized by fixed- and variable-rate mortgage-backed securities or investment grade securities. Repurchase agreements are treated as secured borrowings for financial statement purposes and obligations to repurchase securities sold are reflected as such in the consolidated balance sheet. The brokers retain possession of the securities collateralizing the repurchase agreements until maturity. At December 31, 2009, there were no counterparties with whom the Company’s amount of risk exceeded 10% of its shareholders’ equity.
Below is a summary of repurchase agreements and collateral associated with the repurchase agreements at December 31, 2009 (dollars in thousands):
| Collateral | ||||||||||||||||||
| Repurchase Agreements | U.S. Government Sponsored Enterprise Obligations |
Collateralized Mortgage Obligations and Other | ||||||||||||||||
| Contractual Maturity |
Weighted Average Interest Rate |
Amount | Amortized Cost |
Fair Value | Amortized Cost |
Fair Value | ||||||||||||
| Up to 30 days |
0.35 | % | $ | 2,496,808 | $ | 2,675,969 | $ | 2,649,288 | $ | — | $ | — | ||||||
| 30 to 90 days |
0.34 | % | 399,859 | 452,721 | 452,653 | — | — | |||||||||||
| Over 90 days |
1.04 | % | 3,545,208 | 3,992,147 | 3,992,594 | 89,996 | 74,864 | |||||||||||
| Total |
0.71 | % | $ | 6,441,875 | $ | 7,120,837 | $ | 7,094,535 | $ | 89,996 | $ | 74,864 | ||||||
Other Borrowings
FHLB Advances—The Company had $0.1 billion and $0.3 billion in floating-rate and $2.2 billion and $3.6 billion in fixed-rate FHLB advances at December 31, 2009 and 2008, respectively. The floating-rate advances adjust quarterly based on the LIBOR. As a condition of its membership in the FHLB Atlanta, the Company is required to maintain a FHLB stock investment currently equal to the lesser of: a percentage of 0.2% of total Bank assets; or a dollar cap amount of $25 million. Additionally, the Bank must maintain an Activity Based Stock investment which is currently equal to 4.5% of the Bank’s outstanding advances. The Company had an investment in FHLB stock of $183.9 million and $200.9 million at December 31, 2009 and 2008, respectively. The Company must also maintain qualified collateral as a percent of its advances, which varies based on the collateral type, and is further adjusted by the outcome of the most recent annual collateral audit and by FHLB’s internal ranking of the Bank’s creditworthiness. These advances are secured by a pool of mortgage loans and mortgage-backed securities. At December 31, 2009 and 2008, the Company pledged loans with a lendable value of $8.3 billion and $13.2 billion, respectively, of the one- to four-family and home equity loans as collateral in support of both its advances and unused borrowing lines.
During the years ended December 31, 2009 and 2008, the Company paid down in advance of maturity $1.6 billion and $1.8 billion of its FHLB advances. The Company recorded losses on the early extinguishment of FHLB advances of $50.6 million and $10.9 million for the years ended December 31, 2009 and 2008, respectively. These losses are recorded in the gains (losses) on early extinguishment of debt line item in the consolidated statement of loss.
Other—ETBH raised capital through the formation of trusts, which sell trust preferred securities in the capital markets. The capital securities must be redeemed in whole at the due date, which is generally 30 years after issuance. Each trust issued Floating Rate Cumulative Preferred Securities (“trust preferred securities”), at par with a liquidation amount of $1,000 per capital security. The trusts used the proceeds from the sale of issuances to purchase Floating Rate Junior Subordinated Debentures (“subordinated debentures”) issued by ETBH, which guarantees the trust obligations and contributed proceeds from the sale of its subordinated debentures to E*TRADE Bank in the form of a capital contribution.
142
Table of Contents
The face values of outstanding trusts at December 31, 2009 are shown below (dollars in thousands):
| Trusts |
Face Value |
Maturity Date |
Annual Interest Rate | ||||
| ETBH Capital Trust II |
$ | 5,000 | 2031 | 10.25% | |||
| ETBH Capital Trust I |
20,000 | 2031 | 3.75% above 6-month LIBOR | ||||
| ETBH Capital Trust V, VI, VIII |
51,000 | 2032 | 3.25%-3.65% above 3-month LIBOR | ||||
| ETBH Capital Trust VII, IX—XII |
65,000 | 2033 | 3.00%-3.30% above 3-month LIBOR | ||||
| ETBH Capital Trust XIII—XVIII, XX |
77,000 | 2034 | 2.45%-2.90% above 3-month LIBOR | ||||
| ETBH Capital Trust XIX, XXI, XXII |
60,000 | 2035 | 2.20%-2.40% above 3-month LIBOR | ||||
| ETBH Capital Trust XXIII—XXIV |
45,000 | 2036 | 2.10% above 3-month LIBOR | ||||
| ETBH Capital Trust XXV—XXX |
110,000 | 2037 | 1.90%-2.00% above 3-month LIBOR | ||||
| Total |
$ | 433,000 | |||||
Other borrowings also includes $13.8 million and $18.8 million of margin collateral and $0.5 million and $0.6 million of overnight and other short-term borrowings in connection with the Federal Reserve Bank’s term investment option and treasury, tax and loan programs as of December 31, 2009 and 2008, respectively. The Company pledged $17.6 million and $14.1 million of securities to secure these borrowings from the Federal Reserve Bank as of December 31, 2009 and 2008, respectively.
The Company’s corporate debt by type is shown below (dollars in thousands):
| December 31, 2009 |
Face Value | Discount | Fair Value Adjustment(1) |
Net | |||||||||
| Interest-bearing notes: |
|||||||||||||
| Senior notes: |
|||||||||||||
| 8% Notes, due 2011 |
$ | 3,644 | $ | — | $ | — | $ | 3,644 | |||||
| 7 3/8% Notes, due 2013 |
414,665 | (3,390 | ) | 21,473 | 432,748 | ||||||||
| 7 7/8% Notes, due 2015 |
243,177 | (1,770 | ) | 11,225 | 252,632 | ||||||||
| Total senior notes |
661,486 | (5,160 | ) | 32,698 | 689,024 | ||||||||
| 12 1/2% Springing lien notes, due 2017 |
930,230 | (189,838 | ) | 8,334 | 748,726 | ||||||||
| Total interest-bearing notes |
1,591,716 | (194,998 | ) | 41,032 | 1,437,750 | ||||||||
| Non-interest-bearing debt: |
|||||||||||||
| 0% Convertible debentures, due 2019 |
1,020,941 | — | — | 1,020,941 | |||||||||
| Total corporate debt |
$ | 2,612,657 | $ | (194,998 | ) | $ | 41,032 | $ | 2,458,691 | ||||
| December 31, 2008 |
Face Value | Discount | Fair Value Adjustment(1) |
Net | |||||||||
| Senior notes: |
|||||||||||||
| 8% Notes, due 2011 |
$ | 435,515 | $ | (1,763 | ) | $ | 13,855 | $ | 447,607 | ||||
| 7 3/8% Notes, due 2013 |
414,665 | (4,334 | ) | 32,435 | 442,766 | ||||||||
| 7 7/8% Notes, due 2015 |
243,177 | (2,071 | ) | 13,183 | 254,289 | ||||||||
| Total senior notes |
1,093,357 | (8,168 | ) | 59,473 | 1,144,662 | ||||||||
| 12 1/2% Springing lien notes, due 2017 |
2,057,000 | (460,515 | ) | 9,385 | 1,605,870 | ||||||||
| Total corporate debt |
$ | 3,150,357 | $ | (468,683 | ) | $ | 68,858 | $ | 2,750,532 | ||||
| (1) | The fair value adjustment is related to changes in fair value of the debt while in a fair value hedge relationship. |
143
Table of Contents
All of the Company’s notes are unsecured and will rank equal in right of payment with all of the Company’s existing and future unsubordinated indebtedness and will rank senior in right of payment to all its existing and future subordinated indebtedness.
Debt Exchanges
In the third quarter of 2009, the Company exchanged $1.7 billion aggregate principal amount of its corporate debt, including $1.3 billion principal amount of the 12 1/2% Notes and $0.4 billion principal amounts of the 8% Notes for an equal principal amount of newly-issued non-interest-bearing convertible debentures. The Company recorded a pre-tax non-cash charge of $968.3 million on the early extinguishment of debt related to the Debt Exchange for the year ended December 31, 2009. For further details regarding the accounting on the exchange of the corporate debt, see Note 1—Organization, Basis of Presentation and Summary of Significant Accounting Policies.
In 2008, the Company exchanged $120.8 million in principal of its outstanding senior notes through debt to equity exchanges. The details of these exchanges are discussed below.
8% Senior Notes due June 2011
In 2005 and 2004, the Company issued an aggregate principal amount of $100 million and $400 million in senior notes due June 2011, respectively. Interest is payable semi-annually and notes are non-callable for four years and may then be called by the Company at a premium, which declines over time.
In 2009, $0.4 billion of the 8% Notes were exchanged for an equal principal amount of the newly-issued non-interest-bearing convertible debentures. Refer to the Debt Exchanges section above for more details. In 2008, the Company exchanged $18.3 million in principal of its 8% Senior Notes for 4.9 million shares of common stock. This exchange resulted in the Company recording a $0.8 million pre-tax gain on extinguishment.
7 3/8% Senior Notes due September 2013
In 2005, the Company issued an aggregate principal amount of $600 million in senior notes due September 2013 (“7 3/8% Notes”). Interest is payable semi-annually and the notes are non-callable for four years and may then be called by the Company at a premium, which declines over time.
In 2008, the Company exchanged $97.5 million in principal of its 7 3/8% Senior Notes for 21.1 million shares of common stock. This exchange resulted in the Company recording a $19.7 million pre-tax gain on extinguishment.
7 7/8% Senior Notes due December 2015
In 2005, the Company issued an aggregate principal amount of $300 million in senior notes due December 2015 (“7 7/8% Notes”). Interest is payable semi-annually and the notes are non-callable for four years and may then be called by the Company at a premium, which declines over time.
In 2008, the Company exchanged $5.0 million in principal of its 7 7/8% Senior Notes for 1.1 million shares of common stock. This exchange resulted in the Company recording a $1.0 million pre-tax gain on extinguishment.
12 1/2% Springing Lien Notes due November 2017
In 2007 and 2008, the Company issued an aggregate principal amount of $1.8 billion and $150 million of 12 1/2% Notes, respectively. Interest is payable semi-annually and the notes are non-callable for five years and may then be called by the Company at a premium, which declines over time. The Company has the option to make interest payments on its 12 1/2% Notes in the form of either cash or additional 12 1/2% Notes through May 2010. In
144
Table of Contents
2008, the Company elected to make its May interest payment of $121 million in cash and its November interest payment of $121 million in the form of additional 12 1/2% Notes. In 2009, the Company elected to make both the May and November interest payments of $128.5 million and $54.7 million, respectively, in the form of additional 12 1/2 % Notes. The November 2010 payment is the first payment the Company is required to pay in cash.
The indenture for the Company’s 12 1/2% Notes requires the Company to secure the 12 1/2% Notes with the property and assets of the Company and any future subsidiary guarantors (subject to certain exceptions). The requirement to secure the 12 1/2% Notes will occur on the earlier of: 1) the date on which the 8% Notes are redeemed; or 2) the first date on which the Company is allowed to grant liens in excess of $300 million under the 8% Notes. The requirement to secure the 12 1/2% Notes is limited to the amount of debt under the 12 1/2% Notes that would trigger a requirement for the Company to equally and ratably secure the existing 8% Notes, 7 3/8% Notes and the 7 7/8% Notes.
In 2009, $1.3 billion of the 12 1/2% Notes were exchanged for an equal principal amount of the newly-issued non-interest-bearing convertible debentures. Refer to the Debt Exchanges section above for more details.
0% Convertible Debentures due August 2019
In August 2009, the Company issued an aggregate principal amount of $1.7 billion in Class A convertible debentures and $2.3 million in Class B convertible debentures (collectively “convertible debentures”) of non-interest-bearing notes due August 31, 2019, in exchange for $1.3 billion principal of the 12 1/2% Notes and $0.4 billion principal of the 8% Notes. The Class A convertible debentures are convertible into the Company’s common stock at a conversion rate of $1.034 per $1,000 principal amount of Class A convertible debentures. The Class B convertible debentures are convertible into the Company’s common stock at a conversion rate of $1.551 per $1,000 principal amount of Class B convertible debentures. The holders of the convertible debentures may convert all or any portion of the debentures at any time prior to the close of business on the second scheduled trading day immediately preceding the maturity date. The indenture for the Company’s convertible debentures requires the Company to secure equally and ratably the convertible debentures to the extent the 12 1/2% Notes are secured. For details on the accounting of the convertible debentures and the determination of their fair value, see Note 1—Organization, Basis of Presentation and Summary of Significant Accounting Policies and Note 5—Fair Value Disclosures.
As of December 31, 2009, $718.9 million of the Class A convertible debentures and $2.0 million of the Class B convertible debentures had been converted into 695.3 million shares and 1.3 million shares, respectively, of the Company’s common stock.
Corporate Debt Covenants
Certain of the Company’s corporate debt described above have terms which include customary financial covenants. As of December 31, 2009, the Company was in compliance with all such covenants.
Future Maturities of Corporate Debt
Scheduled principal payments of corporate debt as of December 31, 2009 are as follows (dollars in thousands):
| Years ending December 31, |
||||
| 2010 |
$ | — | ||
| 2011 |
3,644 | |||
| 2012 |
— | |||
| 2013 |
414,665 | |||
| 2014 |
— | |||
| Thereafter |
2,194,348 | |||
| Total future principal payments of corporate debt |
2,612,657 | |||
| Unamortized discount and fair value adjustment, net |
(153,966 | ) | ||
| Total corporate debt |
$ | 2,458,691 | ||
145
Table of Contents
NOTE 15—ACCOUNTS PAYABLE, ACCRUED AND OTHER LIABILITIES
Accounts payable, accrued and other liabilities consist of the following (dollars in thousands):
| December 31, | ||||||
| 2009 | 2008 | |||||
| Deposits received for securities loaned |
$ | 438,566 | $ | 288,384 | ||
| Other payables to brokers, dealers and clearing organizations |
161,484 | 148,603 | ||||
| Accounts payable and accrued expenses |
148,704 | 192,613 | ||||
| Derivative liabilities |
143,602 | 485,181 | ||||
| Subserviced loan advances |
135,693 | 92,081 | ||||
| Reserves for legal and regulatory matters |
24,435 | 54,954 | ||||
| Senior and convertible debt accrued interest |
20,217 | 32,054 | ||||
| Facility restructuring and other exit activities liability |
18,529 | 21,883 | ||||
| Other |
46,255 | 255,800 | ||||
| Total accounts payable, accrued and other liabilities |
$ | 1,137,485 | $ | 1,571,553 | ||
The components of income tax benefit from continuing operations are as follows (dollars in thousands):
| Year Ended December 31, | ||||||||||||
| 2009 | 2008 | 2007 | ||||||||||
| Current: |
||||||||||||
| Federal |
$ | (58,042 | ) | $ | (8,773 | ) | $ | (316,799 | ) | |||
| Foreign |
24 | 2,379 | 4,628 | |||||||||
| State |
6,049 | (2,383 | ) | 7,904 | ||||||||
| Tax benefit recognized for uncertainties |
2,989 | (14,000 | ) | (3,327 | ) | |||||||
| Total current |
(48,980 | ) | (22,777 | ) | (307,594 | ) | ||||||
| Deferred: |
||||||||||||
| Federal |
(448,903 | ) | (404,217 | ) | (422,218 | ) | ||||||
| Foreign |
207 | 1,233 | 1,560 | |||||||||
| State |
(39,993 | ) | (43,774 | ) | (4,697 | ) | ||||||
| Total deferred |
(488,689 | ) | (446,758 | ) | (425,355 | ) | ||||||
| Income tax benefit |
$ | (537,669 | ) | $ | (469,535 | ) | $ | (732,949 | ) | |||
The components of loss before income tax benefit and discontinued operations are as follows (dollars in thousands):
| Years Ended December 31, | ||||||||||||
| 2009 | 2008 | 2007 | ||||||||||
| Domestic |
$ | (1,771,693 | ) | $ | (1,274,987 | ) | $ | (2,178,430 | ) | |||
| Foreign |
(63,738 | ) | (3,932 | ) | 3,144 | |||||||
| Loss before income tax benefit and discontinued operations |
$ | (1,835,431 | ) | $ | (1,278,919 | ) | $ | (2,175,286 | ) | |||
146
Table of Contents
A reconciliation of the beginning and ending amount of unrecognized tax benefits as of December 31, 2009 and 2008 is as follows (dollars in thousands):
| December 31, | ||||||||||||
| 2009 | 2008 | 20007 | ||||||||||
| Unrecognized tax benefits, beginning of period |
$ | 64,655 | $ | 74,853 | $ | 150,428 | ||||||
| Additions based on tax positions related to prior years |
2,783 | 1,320 | 1,402 | |||||||||
| Additions based on tax positions related to the current year |
2,293 | 18,232 | 8,687 | |||||||||
| Reductions based on tax positions related to prior years |
(1,229 | ) | (8,299 | ) | (136 | ) | ||||||
| Reductions based on tax positions related to the current year |
(8,159 | ) | (2,240 | ) | (79,551 | ) | ||||||
| Settlements with taxing authorities |
(681 | ) | (4,869 | ) | (5,472 | ) | ||||||
| Statute of limitations lapses |
(966 | ) | (14,342 | ) | (505 | ) | ||||||
| Unrecognized tax benefits, end of period |
$ | 58,696 | $ | 64,655 | $ | 74,853 | ||||||
At December 31, 2009 and 2008, the unrecognized tax benefit was $58.7 million and $64.7 million, respectively. At December 31, 2009, $39.2 million (net of federal benefits on state issues) represents the amount of unrecognized tax benefits that, if recognized, would favorably affect the effective income tax rate in future periods.
The following table summarizes the tax years that are either currently under examination or remain open under the statute of limitations and subject to examination by the major tax jurisdictions in which the Company operates:
| Jurisdiction |
Open Tax Year | |
| Hong Kong |
2001 – 2009 | |
| United Kingdom |
2005 – 2009 | |
| United States |
2005 – 2009 | |
| Various states(1) |
1999 – 2009 |
| (1) | Includes California, Georgia, Illinois, New Jersey, New York and Virginia. |
It is likely that certain examinations may be settled or the statute of limitations could expire with regards to other tax filings, in the next twelve months. In addition, proposed legislation could favorably impact certain of the Company’s unrecognized tax benefits. Such events would generally reduce the Company’s unrecognized tax benefits, either because the tax positions are sustained or because the Company agrees to the disallowance, by as much as $5.6 million, all of which could affect the Company’s total tax provision or the effective tax rate.
The Company’s practice is to recognize interest and penalties, if any, related to income tax matters in income tax expense. The Company has total gross reserves for interest and penalties of $7.9 million and $5.9 million as of December 31, 2009 and 2008, respectively. The tax benefit for the year ended December 31, 2009 includes an increase in the accrual for interest and penalties of $2.0 million, principally related to the state taxes.
147
Table of Contents
Deferred income taxes are recorded when revenues and expenses are recognized in different periods for financial statement and tax return purposes. Prior year balances for the deferred tax assets and liabilities have been re-presented to ensure consistency between periods. The adjustments relate to the presentation of the federal benefit of the state deferred assets and liabilities. The temporary differences and tax carryforwards that created deferred tax assets and deferred tax liabilities are as follows (dollars in thousands):
| December 31, | ||||||||
| 2009 | 2008 | |||||||
| Deferred tax assets: |
||||||||
| Reserves and allowances, net |
$ | 1,115,187 | $ | 420,472 | ||||
| Net unrealized loss on equity investments and Bank assets held-for-sale |
187,385 | 335,966 | ||||||
| Net operating losses |
665,183 | 937,815 | ||||||
| Deferred compensation |
55,987 | 27,577 | ||||||
| Capitalized interest |
63,864 | 47,186 | ||||||
| Tax credits |
29,950 | 24,448 | ||||||
| Restructuring reserve and related write-downs |
13,800 | 45,274 | ||||||
| Other |
9,940 | 3,437 | ||||||
| Total deferred tax assets |
2,141,296 | 1,842,175 | ||||||
| Valuation allowance (on state and foreign country deferred tax assets) |
(107,314 | ) | (127,693 | ) | ||||
| Total deferred tax assets, net of valuation allowance |
2,033,982 | 1,714,482 | ||||||
| Deferred tax liabilities: |
||||||||
| Internally developed software |
(31,215 | ) | (43,814 | ) | ||||
| Basis differences in investments |
(409,963 | ) | (464,213 | ) | ||||
| Depreciation and amortization |
(150,943 | ) | (171,105 | ) | ||||
| Other |
— | (653 | ) | |||||
| Total deferred tax liabilities |
(592,121 | ) | (679,785 | ) | ||||
| Net deferred tax asset |
$ | 1,441,861 | $ | 1,034,697 | ||||
During the year ended December 31, 2009, the Company generated a federal net operating loss of approximately $321 million and did not provide for a valuation allowance against the federal deferred tax assets. Of the $321 million net operating loss, $153 million is expected to be carried back to prior years, generating an expected federal tax refund of approximately $50 million. The remaining $1.4 billion federal net operating loss will be carried forward and generally can be used to offset future taxable income. The majority of the carryforwards expire in 19 years.
The Company did not provide for a valuation allowance against its federal deferred tax assets as of December 31, 2009. The Company is required to establish a valuation allowance for deferred tax assets and record a charge to income if it is determined, based on available evidence at the time the determination is made, that it is more likely than not that some portion or all of the deferred tax assets will not be realized. If the Company did conclude that a valuation allowance was required, the resulting loss would have a material adverse effect on its results of operations and financial condition.
The Company did not establish a valuation allowance against its federal deferred tax assets as of December 31, 2009 as it believes that it is more likely than not that all of these assets will be realized. The Company’s evaluation focused on identifying significant, objective evidence that it will be able to realize its deferred tax assets in the future. The Company reviewed the estimated future taxable income for its trading and investing and balance sheet management segments separately and determined that the net operating losses since 2007 are due solely to the credit losses in the balance sheet management segment. The Company believes these losses were caused by the crisis in the residential real estate and credit markets which significantly impacted its asset-backed securities and home equity loan portfolios in 2007 and continued to generate credit losses in 2008 and 2009. The Company estimates that these credit losses will continue in future periods; however, the Company
148
Table of Contents
ceased purchasing asset-backed securities and home equity loans which it believes are the root cause of the majority of these losses. Therefore, while the Company does expect credit losses to continue in future periods, it does expect these amounts to decline when compared to the credit losses in the three-year period ending in 2009. The Company’s trading and investing segment generated substantial book taxable income for each of the last six years and the Company estimates that it will continue to generate taxable income in future periods at a level sufficient to generate taxable income for the Company as a whole. The Company considers this to be significant, objective evidence that it will be able to realize its deferred tax assets in the future.
A key component of the Company’s evaluation of the need for a valuation allowance was its level of corporate interest expense, which represents the most significant non-segment related expense. The Company’s estimates of future taxable income included this expense, which reduces the amount of segment income available to utilize its federal deferred tax assets. Therefore, a decrease in this expense in future periods would increase the level of estimated taxable income available to utilize the federal deferred tax assets. As a result of the Debt Exchange, the Company reduced its annual cash interest payments by approximately $200 million. The Company believes this decline in cash interest payments significantly improves its ability to utilize its federal deferred tax assets in future periods when compared to evaluations in prior periods which did not include this decline in corporate interest payments.
The Company’s analysis of the need for a valuation allowance recognizes that it is in a cumulative book taxable loss position as of the three-year period ended December 31, 2009, which is considered significant and objective evidence that the Company may not be able to realize some portion of its deferred tax assets in the future. However, the Company believes it is able to rely on its forecasts of future taxable income and overcome the uncertainty created by the cumulative loss position.
The crisis in the residential real estate and credit markets has created significant volatility in the Company’s results of operations. This volatility is isolated almost entirely to the balance sheet management segment. The Company’s forecasts for this segment include assumptions regarding its estimate of future expected credit losses, which the Company believes to be the most variable component of its forecasts of future taxable income. The Company believes this variability could create a book loss in its overall results for an individual reporting period while not significantly impacting the overall estimate of taxable income over the period in which the Company expects to realize its deferred tax assets. Conversely, the Company believes the trading and investing segment will continue to produce a stable stream of income which the Company believes it can reliably estimate in both individual reporting periods as well as over the period in which it estimates it will realize its deferred tax assets.
In evaluating the need for a valuation allowance, the Company estimated future taxable income based on management approved forecasts. This process required significant judgment by management about matters that are by nature uncertain. If future events differ significantly from the Company’s current forecasts, a valuation allowance may need to be established, which would have a material adverse effect on the results of operations and financial condition.
For certain of the Company’s state and foreign country deferred tax assets, the Company maintains a valuation allowance of $107.3 million and $127.7 million at December 31, 2009 and 2008, respectively, as it is more likely than not that they will not be fully realized. The Company’s valuation allowance decreased by $20.4 million for the year ended December 31, 2009. The principal components of the deferred tax assets for which a valuation allowance has been established include the following state and foreign country net operating loss carryforwards and charitable contributions which have a limited carryforward period:
| • | At December 31, 2009, the Company had foreign country net operating loss carryforwards of approximately $114 million for which a deferred tax asset of approximately $31 million was established. The foreign net operating losses represent the foreign tax loss carryforwards in numerous foreign countries, the vast majority of which are not subject to expiration. In most of these foreign countries, the Company has historical tax losses, and the Company continues to project operating losses in most of these countries. Accordingly, the Company has provided a valuation allowance of $29 million against such deferred tax asset at December 31, 2009. |
149
Table of Contents
| • | At December 31, 2009, the Company had gross state net operating loss carryforwards of $2.2 billion that expire between 2010 and 2029, most of which are subject to reduction for apportionment when utilized. A deferred tax asset of approximately $83.0 million has been established related to these state net operating loss carryforwards with a valuation allowance of $71.7 million against such deferred tax asset at December 31, 2009. |
| • | At December 31, 2009, the Company had charitable contribution carryforwards of $11.1 million that expire between 2012 and 2014. A deferred tax asset of approximately $4.2 million was established with a corresponding $4.2 million valuation allowance as it is more likely than not that these contributions will expire unused. |
The Company has not provided $8.0 million of deferred income taxes on $22.0 of undistributed earnings and profits in its foreign subsidiaries at December 31, 2009 since the Company intends to permanently reinvest such earnings.
The effective tax rates differed from the federal statutory rates as follows:
| Year Ended December 31, | |||||||||
| 2009 | 2008 | 2007 | |||||||
| Federal statutory rate |
(35.0 | )% | (35.0 | )% | (35.0 | )% | |||
| State income taxes, net of federal tax benefit |
(2.6 | ) | (3.5 | ) | (2.3 | ) | |||
| Difference between statutory rate and foreign effective tax rate and establishment of valuation allowance for foreign deferred tax assets |
0.1 | 0.5 | 0.2 | ||||||
| Tax exempt income |
(0.1 | ) | (0.8 | ) | (1.1 | ) | |||
| Disallowed Interest Expense |
4.1 | 1.9 | 0.1 | ||||||
| Disallowed Debt Exchange Loss |
4.7 | — | — | ||||||
| Impairment of goodwill |
— | — | 1.2 | ||||||
| Change in valuation allowance |
(0.7 | ) | 2.4 | 2.3 | |||||
| Other |
0.2 | (2.2 | ) | 0.9 | |||||
| Effective tax rate |
(29.3 | )% | (36.7 | )% | (33.7 | )% | |||
Debt Exchange
The effective tax rate on the Debt Exchange of 20% was below the Company’s statutory federal tax rate of 35%. This was primarily due to certain components of the loss on the Debt Exchange not being deductible for tax purposes, which are summarized in the following table (dollars in thousands):
| Year Ended December 31, 2009 | ||||||||||
| Amount of Loss |
Tax Rate | Tax Benefit | ||||||||
| Deductible portion of the loss on the Debt Exchange |
$ | 722,952 | 35 | % | $ | 253,033 | ||||
| Non-deductible portion of the loss on the Debt Exchange |
245,302 | — | % | — | ||||||
| Prior period interest expense on the 12 1/2% Notes not deductible as a result of the Debt Exchange |
N/A | N/A | (57,687 | ) | ||||||
| Total |
$ | 968,254 | 20 | % | $ | 195,346 | ||||
Tax Ownership Change
During the third quarter of 2009, the Company exchanged $1.7 billion principal amount of its interest-bearing debt for an equal principal amount of non-interest-bearing convertible debentures. Subsequent to the Debt Exchange, $592.3 million and $720.9 million debentures were converted into 572.2 million and 696.6 million shares of common stock during the third and fourth quarters of 2009, respectively. As a result of these conversions, the Company believed it experienced a tax ownership change during the third quarter of 2009.
150
Table of Contents
As of the date of the ownership change, the Company estimated that it had federal net operating losses (“NOLs”) available to carry forward of approximately $1.4 billion. Section 382 of the Internal Revenue Code of 1986, as amended, imposes restrictions on the use of a corporation’s NOLs, certain recognized built-in losses and other carryovers after an “ownership change” occurs. Section 382 rules governing when a change in ownership occurs are complex and subject to interpretation; however, an ownership change generally occurs when there has been a cumulative change in the stock ownership of a corporation by certain “5% shareholders” of more than 50 percentage points over a rolling three-year period.
Section 382 imposes an annual limitation on the amount of post-ownership change taxable income a corporation may offset with pre-ownership change NOLs. In general, the annual limitation is determined by multiplying the value of the corporation’s stock immediately before the ownership change (subject to certain adjustments) by the applicable long-term tax-exempt rate. Any unused portion of the annual limitation is available for use in future years until such NOLs are scheduled to expire (in general, the Company’s NOLs may be carried forward 20 years). In addition, the limitation may, under certain circumstances, be decreased by built-in losses which may be present with respect to assets held at the time of the ownership change that are recognized in the five-year period (one-year for loans) after the ownership change. The use of NOLs arising after the date of an ownership change would not be affected unless a corporation experienced an additional ownership change in a future period.
The Company believes the tax ownership change will extend the period of time it will take to fully utilize its pre-ownership change NOLs, but will not limit the total amount of pre-ownership change NOLs it can utilize. The Company’s preliminary estimate is that it will be subject to an overall annual limitation on the use of its pre-ownership change NOLs of approximately $155 million; however, this amount is subject to change in future periods as the Company finalizes the tax change of control analysis in 2010. Since the statutory carry forward period for the Company’s overall pre-ownership change NOLs, which are approximately $1.4 billion, is 20 years (the majority of which expire in 19 years), the Company believes it will be able to fully utilize these NOLs in future periods.
The Company’s ability to utilize the pre-ownership change NOLs is dependent on its ability to generate sufficient taxable income over the duration of the carry forward periods and will not be impacted by its ability or inability to generate taxable income in an individual year.
The activity in shareholders’ equity during the year ended December 31, 2009 is summarized as follows (dollars in thousands):
| Common Stock/ Additional Paid- In Capital |
Accumulated Deficit/Other Comprehensive Loss |
Total | |||||||||
| Beginning balance, December 31, 2008 |
$ | 4,069,917 | $ | (1,478,421 | ) | $ | 2,591,496 | ||||
| Common stock offerings |
733,118 | — | 733,118 | ||||||||
| Activity related to the Debt Exchange: |
|||||||||||
| After-tax loss related to the Debt Exchange |
— | (772,908 | ) | (772,908 | ) | ||||||
| Amortization of premium on the convertible debentures |
707,224 | — | 707,224 | ||||||||
| Conversions of convertible debentures |
720,930 | — | 720,930 | ||||||||
| All other after-tax operating losses |
— | (524,854 | ) | (524,854 | ) | ||||||
| Net change from available-for-sale securities |
— | 107,588 | 107,588 | ||||||||
| Net change from cash flow hedging instruments |
— | 138,941 | 138,941 | ||||||||
| Other(1) |
45,862 | 2,158 | 48,020 | ||||||||
| Ending balance, December 31, 2009 |
$ | 6,277,051 | $ | (2,527,496 | ) | $ | 3,749,555 | ||||
| (1) | Other includes employee stock compensation accounting, additional purchase consideration paid in connection with prior acquisitions and changes in accumulated other comprehensive loss from foreign currency translation. |
151
Table of Contents
Preferred Stock
The Company has 1.0 million shares authorized in preferred stock. None were issued and outstanding at December 31, 2009 and 2008.
Common Stock Offerings
In September 2009, the Company initiated and completed an At the Market Program to offer and sell up to $150 million of common stock, in which the Company issued 80.2 million shares of common stock resulting in net proceeds of $147 million.
In June 2009, the Company issued 500 million shares of common stock, par value $0.01 in a Public Equity Offering. The Public Equity Offering resulted in net proceeds, after commissions, of $523 million. Citadel, the Company’s largest stock and debt holder, purchased approximately 90.9 million shares of the Company’s common stock in the Public Equity Offering.
In May 2009, the Company initiated an Equity Drawdown Program to offer and sell up to $150 million of common stock from time to time, in which the Company issued 40.7 million shares of common stock resulting in net proceeds of $63 million. The Equity Drawdown Program was suspended in June 2009.
In 2008, the Company exchanged a total of $120.8 million in principal of outstanding senior notes for 27.1 million shares of common stock. Also in 2008, the Company retired the entire $450 million principal amount of the 6 1/8% Mandatory Convertible Notes due November 2018 by issuing 25.0 million shares of common stock at $18 per share (the mandatory conversion price).
In 2008 and 2007, the Company issued $339.0 million or 84.7 million shares of common stock in conjunction with the Citadel Investment. The 84.7 million shares of common stock were issued in three increments: 14.8 million upon initial closing in November 2007; 23.2 million shares upon Hart-Scott-Rodino Antitrust Improvements Act approval in December 2007 and 46.7 million shares upon all required regulatory approvals in May 2008.
Debt Exchange Impact on Shareholders’ Equity
The completion of the Debt Exchange in 2009 resulted in a pre-tax non-cash charge of $968.3 million and an increase of $707.2 million to additional paid-in capital. The net effect of the exchange to shareholders’ equity was a reduction of $65.7 million. The increase of $707.2 million in additional paid-in capital was attributable to the amortization of the entire premium on the newly-issued convertible debentures, which was immediately amortized to additional paid-in capital since amortizing the premium into interest expense over the life of the non-interest-bearing convertible debentures would have resulted in recording interest income on a liability (a negative yield)(1).
Conversions of Convertible Debentures
During the year ended December 31, 2009, $720.9 million of the Company’s convertible debentures were converted into 696.6 million shares of common stock. For further details on the convertible debentures, see Note 14—Corporate Debt.
| (1) | See Note 1—Organization, Basis of Presentation and Summary of Significant Accounting Policies for a description of the accounting of the Debt Exchange. |
152
Table of Contents
Share Repurchases
On April 18, 2007, the Company announced that its Board of Directors authorized a $250.0 million common stock repurchase program (the “April 2007 Plan”). The April 2007 Plan is open-ended and allows for the repurchase of common stock on the open market, in private transactions or a combination of both. The $200.0 million repurchase program approved by the Board in December 2004 (the “December 2004 Plan”) was completed in 2007.
The Company did not repurchase any shares of common stock in 2009 or 2008. In 2007, the Company repurchased a total of 7.2 million shares of common stock for an aggregate $148.6 million under the April 2007 Plan and the December 2004 Plan. As of December 31, 2009 and 2008, the Company had approximately $158.5 million available to purchase additional shares under the April 2007 Plan.
Cumulative Effect of the Adoption of Accounting Guidance
On April 1, 2009, the Company adopted the amended guidance for the recognition of OTTI for debt securities. As a result of the adoption, the Company recognized a $20.2 million after-tax decrease to beginning accumulated deficit and a corresponding offset in accumulated other comprehensive loss on the consolidated balance sheet. This adjustment represents the after-tax difference between the impairment reported in prior periods for securities on the consolidated balance sheet as of April 1, 2009 and the level of impairment that would have been recorded on these same securities under the new accounting guidance.
On January 1, 2008, the Company elected to carry investments in Fannie Mae and Freddie Mac preferred stock at fair value through earnings under the fair value option in the financial instruments accounting guidance. The impact of this adoption was an after-tax decrease to opening retained earnings as of January 1, 2008 of approximately $86.9 million.
On January 1, 2007, the Company adopted the accounting for uncertainty in income taxes accounting guidance. As a result of the adoption, the Company recognized a $14.9 million increase to its liability for unrecognized tax benefits, which was accounted for as a reduction to the beginning balance of retained earnings.
153
Table of Contents
The following table is a reconciliation of basic and diluted loss per share (dollars and shares in thousands, except per share amounts):
| Year Ended December 31, | ||||||||||||
| 2009 | 2008 | 2007 | ||||||||||
| Basic: |
||||||||||||
| Numerator: |
||||||||||||
| Loss from continuing operations |
$ | (1,297,762 | ) | $ | (809,384 | ) | $ | (1,442,337 | ) | |||
| Income from discontinued operations, net of tax |
— | 297,594 | 583 | |||||||||
| Net loss |
$ | (1,297,762 | ) | $ | (511,790 | ) | $ | (1,441,754 | ) | |||
| Denominator: |
||||||||||||
| Basic weighted-average shares outstanding |
1,095,437 | 509,862 | 424,439 | |||||||||
| Diluted: |
||||||||||||
| Numerator: |
||||||||||||
| Net loss |
$ | (1,297,762 | ) | $ | (511,790 | ) | $ | (1,441,754 | ) | |||
| Denominator: |
||||||||||||
| Diluted weighted-average shares outstanding |
1,095,437 | 509,862 | 424,439 | |||||||||
| Per share: |
||||||||||||
| Basic loss per share: |
||||||||||||
| Loss per share from continuing operations |
$ | (1.18 | ) | $ | (1.58 | ) | $ | (3.40 | ) | |||
| Earnings per share from discontinued operations |
— | 0.58 | 0.00 | |||||||||
| Net loss per share |
$ | (1.18 | ) | $ | (1.00 | ) | $ | (3.40 | ) | |||
| Diluted loss per share: |
||||||||||||
| Loss per share from continuing operations |
$ | (1.18 | ) | $ | (1.58 | ) | $ | (3.40 | ) | |||
| Earnings per share from discontinued operations |
— | 0.58 | 0.00 | |||||||||
| Net loss per share |
$ | (1.18 | ) | $ | (1.00 | ) | $ | (3.40 | ) | |||
The Company excluded from the calculations of diluted loss per share 33.3 million, 37.4 million, and 21.0 million shares of stock options and unvested restricted stock awards and units that would have been anti-dilutive for the years ended December 31, 2009, 2008 and 2007, respectively. Of the excluded shares, 5.8 million, 1.4 million, and 9.6 million shares were anti-dilutive because of the Company’s net loss for the years ended December 31, 2009, 2008 and 2007, respectively.
In addition, the Company excluded 388.8 million shares related to the convertible debentures that would have been anti-dilutive from the calculations of diluted loss per share for the year ended December 31, 2009 because of the Company’s net loss for the period. There were no convertible debentures for the years ended December 31, 2008 and 2007. For the year ended December 31, 2007, there were 46.7 million shares that had not been issued in connection with the Citadel Investment of which 3.9 million shares were anti-dilutive because of the Company’s net loss for the period.
NOTE 19—EMPLOYEE SHARE-BASED PAYMENTS AND OTHER BENEFITS
In 2005, the Company adopted and the shareholders approved the 2005 Stock Incentive Plan (“2005 Plan”) to replace the 1996 Stock Incentive Plan (“1996 Plan”) which provides for the grant of nonqualified or incentive stock options and awards to officers, directors, key employees and consultants for the purchase of newly issued shares of the Company’s common stock at a price determined by the Board at the date the option is granted. The
154
Table of Contents
Company does not have a specific policy for issuing shares upon stock option exercises and share unit conversions; however, new shares are typically issued in connection with exercises and conversions. The Company intends to continue to issue new shares for future exercises and conversions. A total of 85.4 million shares had been authorized under the 1996 Plan. Under the 2005 Plan, the remaining unissued authorized shares of the 1996 Plan, up to 42.0 million shares, were authorized for issuance. Additionally, any shares that had been awarded but remained unissued under the 1996 Plan that were subsequently canceled, would be authorized for issuance under the 2005 Plan, up to 39.0 million shares. In May 2009, an additional 30.0 million shares were authorized for issuance under the 2005 Plan at the Company’s shareholders’ annual meeting. As of December 31, 2009, 21.9 million shares were available for grant under the 2005 Plan.
Employee Stock Option Plans
Options are generally exercisable ratably over a two- to four-year period from the date the option is granted and most options expire within seven years from the date of grant. Certain options provide for accelerated vesting upon a change in control. Exercise prices are generally equal to the fair value of the shares on the grant date.
The Company recognized $19.5 million, $26.6 million and $25.0 million in compensation expense from continuing operations for stock options for the years ended December 31, 2009, 2008 and 2007, respectively. The Company recognized a tax benefit of $7.2 million, $9.8 million and $8.1 million related to the stock options for the years ended December 31, 2009, 2008 and 2007, respectively.
The fair value of each option award is estimated on the date of grant using a Black-Scholes-Merton option pricing model based on the assumptions noted in the table below. Expected volatility is based on a combination of historical volatility of the Company’s stock and implied volatility of publicly traded options on the Company’s stock. The expected term represents the period of time that options granted are expected to be outstanding. The expected term is estimated using employees’ actual historical behavior and projected future behavior based on expected exercise patterns. The risk-free interest rate is based on the U.S. Treasury zero-coupon bond where the remaining term approximates the expected term. The dividend yield is zero as the Company has not, nor does it currently plan to, issue dividends to its shareholders.
| Year Ended December 31, | |||||||||
| 2009 | 2008 | 2007 | |||||||
| Expected volatility |
90 | % | 50 | % | 32 | % | |||
| Expected term (years) |
4.3 | 4.6 | 4.5 | ||||||
| Risk-free interest rate |
2 | % | 3 | % | 5 | % | |||
| Dividend yield |
— | — | — | ||||||
The weighted-average fair values of options granted were $0.62, $2.02 and $7.48 for the years ended December 31, 2009, 2008 and 2007, respectively. Intrinsic value of options exercised were $0.1 million and $50.6 million for the years ended December 31, 2008 and 2007, respectively. No stock options were exercised for the year ended December 31, 2009.
A summary of options activity under the stock option plan is presented below:
| Shares (in thousands) |
Weighted- Average Exercise Price |
Weighted- Average Remaining Contractual Life |
Aggregate Intrinsic Value (in thousands) | ||||||||
| Outstanding at December 31, 2008 |
28,626 | $ | 11.52 | 4.75 | $ | — | |||||
| Granted |
5,451 | $ | 0.95 | ||||||||
| Exercised |
— | $ | — | ||||||||
| Canceled/forfeited |
(4,555 | ) | $ | 14.25 | |||||||
| Outstanding at December 31, 2009 |
29,522 | $ | 9.14 | 3.83 | $ | 3,932 | |||||
| Vested and expected to vest at December 31, 2009 |
28,826 | $ | 9.28 | 3.78 | $ | 3,539 | |||||
| Exercisable at December 31, 2009 |
20,608 | $ | 10.58 | 3.06 | $ | 290 | |||||
155
Table of Contents
As of December 31, 2009, there was $11.4 million of total unrecognized compensation cost related to non-vested stock options. This cost is expected to be recognized over a weighted-average period of 1.0 year.
Restricted Stock Awards and Restricted Stock Units
The Company issues restricted stock awards and restricted stock units to its employees. Each restricted stock unit can be converted into one share of the Company’s common stock upon vesting. These awards are issued at the fair value on the date of grant and vest ratably over the period, generally six months to four years. The fair value is calculated as the market price upon issuance.
The Company recorded $26.7 million, $15.5 million and $9.4 million for the years ended December 31, 2009, 2008 and 2007, respectively, in compensation expense from continuing operations related to restricted stock awards and restricted stock units. The Company recognized a tax benefit of $9.6 million, $3.9 million and $3.2 million related to restricted stock awards and restricted stock units for the years ended December 31, 2009, 2008 and 2007, respectively.
A summary of non-vested restricted stock award activity is presented below:
| Shares (in thousands) |
Weighted- Average Grant Date Fair Value | |||||
| Non-vested at December 31, 2008 |
985 | $ | 9.27 | |||
| Issued |
2,756 | $ | 1.46 | |||
| Released (vested) |
(1,347 | ) | $ | 4.90 | ||
| Canceled/forfeited |
(15 | ) | $ | 24.59 | ||
| Non-vested at December 31, 2009 |
2,379 | $ | 2.54 | |||
A summary of non-vested restricted stock unit activity is presented below:
| Units (in thousands) |
Weighted-Average Remaining Contractual Life |
Aggregate Intrinsic Value (in thousands) | ||||||
| Outstanding at December 31, 2008 |
4,995 | 0.64 | $ | 5,669 | ||||
| Issued |
18,733 | |||||||
| Released |
(4,193 | ) | ||||||
| Canceled/forfeited |
(817 | ) | ||||||
| Outstanding at December 31, 2009 |
18,718 | 0.73 | $ | 33,037 | ||||
| Vested and expected to vest at December 31, 2009 |
17,171 | 0.70 | $ | 30,306 | ||||
As of December 31, 2009, there was $18.1 million of total unrecognized compensation cost related to non-vested awards. This cost is expected to be recognized over a weighted-average period of 1.1 years. The total fair value of restricted shares and restricted stock units vested was $8.1 million, $5.6 million and $11.0 million for the years ended December 31, 2009, 2008 and 2007, respectively.
Employee Stock Purchase Plan
The shareholders of the Company previously approved the 2002 Employee Stock Purchase Plan (“2002 Purchase Plan”), and reserved 5,000,000 shares of common stock for sale to employees at a price no less than 85% of the lower of the fair value of the common stock at the beginning of the one-year offering period or the end of each of the six-month purchase periods. Effective August 1, 2005, the Company changed the terms of its
156
Table of Contents
purchase plan to reduce the discount to 5% and discontinued the look-back provision. As a result, the purchase plan was not compensatory beginning August 1, 2005. In 2008, the Company temporarily suspended the 2002 Purchase Plan due to the low number of shares remaining for issuance. At December 31, 2009, 212,650 shares were available under the 2002 Purchase Plan.
401(k) Plan
The Company has a 401(k) salary deferral program for eligible employees who have met certain service requirements. The Company matches certain employee contributions; additional contributions to this plan are at the discretion of the Company. Total contribution expense from continuing operations under this plan was $4.1 million, $4.6 million and $5.4 million for the years ended December 31, 2009, 2008 and 2007, respectively.
NOTE 20—REGULATORY REQUIREMENTS
Registered Broker-Dealers
The Company’s U.S. broker-dealer subsidiaries are subject to the Uniform Net Capital Rule (the “Rule”) under the Securities Exchange Act of 1934 administered by the SEC and FINRA, which requires the maintenance of minimum net capital. The minimum net capital requirements can be met under either the Aggregate Indebtedness method or the Alternative method. Under the Aggregate Indebtedness method, a broker-dealer is required to maintain minimum net capital of the greater of 6 2/3% of its aggregate indebtedness, as defined, or a minimum dollar amount. Under the Alternative method, a broker-dealer is required to maintain net capital equal to the greater of $250,000 or 2% of aggregate debit balances arising from customer transactions. The method used depends on the individual U.S. broker-dealer subsidiary. The Company’s international broker-dealer subsidiaries, located in Europe and Asia, are subject to capital requirements determined by their respective regulators.
As of December 31, 2009, all of the Company’s broker-dealer subsidiaries met minimum net capital requirements. Total required net capital was $0.1 billion at December 31, 2009. In addition, the Company’s broker-dealer subsidiaries had excess net capital of $0.6 billion at December 31, 2009.
The table below summarizes the minimum excess capital requirements for the Company’s broker-dealer subsidiaries (dollars in thousands):
| December 31, 2009 | |||||||||
| Required Net Capital |
Net Capital |
Excess Net Capital | |||||||
| E*TRADE Clearing LLC(1) |
$ | 83,816 | $ | 482,535 | $ | 398,719 | |||
| E*TRADE Securities LLC(1) |
250 | 92,581 | 92,331 | ||||||
| E*TRADE Capital Markets, LLC(2) |
1,000 | 40,148 | 39,148 | ||||||
| International broker-dealers |
24,965 | 53,097 | 28,132 | ||||||
| Total |
$ | 110,031 | $ | 668,361 | $ | 558,330 | |||
| (1) | Elected to use the Alternative method to compute net capital. |
| (2) | Elected to use the Aggregate Indebtedness method to compute net capital. |
Banking
During the second quarter of 2009, E*TRADE Securities LLC became a wholly-owned operating subsidiary of E*TRADE Bank. E*TRADE Securities LLC continues to be an SEC-registered broker-dealer and is included in the minimum net capital requirements under the Rule. E*TRADE Bank is subject to various regulatory capital requirements administered by federal banking agencies. Failure to meet minimum capital requirements can
157
Table of Contents
trigger certain mandatory and possibly additional discretionary actions by regulators that, if undertaken, could have a direct material effect on E*TRADE Bank’s financial condition and results of operations. Under capital adequacy guidelines and the regulatory framework for prompt corrective action, E*TRADE Bank must meet specific capital guidelines that involve quantitative measures of E*TRADE Bank’s assets, liabilities and certain off-balance sheet items as calculated under regulatory accounting practices. In addition, E*TRADE Bank may not pay dividends to the parent company without approval from the OTS and any loans by E*TRADE Bank to the parent company and its other non-bank subsidiaries are subject to various quantitative, arm’s length, collateralization and other requirements. E*TRADE Bank’s capital amounts and classification are also subject to qualitative judgments by the regulators about components, risk weightings and other factors.
Quantitative measures established by regulation to ensure capital adequacy require E*TRADE Bank to maintain minimum amounts and ratios of Total and Tier I capital to risk-weighted assets and Tier I capital to adjusted total assets. As shown in the table below, at both December 31, 2009 and 2008, the OTS categorized E*TRADE Bank as “well capitalized” under the regulatory framework for prompt corrective action. However, events beyond management’s control, such as a continued deterioration in residential real estate and credit markets, could adversely affect future earnings and E*TRADE Bank’s ability to meet its future capital requirements.
E*TRADE Bank’s required actual capital amounts and ratios are presented in the table below (dollars in thousands):
| Actual | Minimum Required to Qualify as Adequately Capitalized |
Minimum Required to be Well Capitalized Under Prompt Corrective Action Provisions |
||||||||||||||||
| Amount | Ratio | Amount | Ratio | Amount | Ratio | |||||||||||||
| December 31, 2009(1): |
||||||||||||||||||
| Total capital to risk-weighted assets |
$ | 3,102,618 | 14.08 | % | >$ | 1,762,794 | >8.0 | % | >$ | 2,203,492 | >10.0 | % | ||||||
| Tier I capital to risk-weighted assets |
$ | 2,818,370 | 12.79 | % | >$ | 881,397 | >4.0 | % | >$ | 1,322,095 | > 6.0 | % | ||||||
| Tier I capital to adjusted total assets |
$ | 2,860,312 | 6.69 | % | >$ | 1,709,402 | >4.0 | % | >$ | 2,136,752 | > 5.0 | % | ||||||
| December 31, 2008: |
||||||||||||||||||
| Total capital to risk-weighted assets |
$ | 3,136,650 | 12.95 | % | > $ | 1,937,583 | >8.0 | % | >$ | 2,421,979 | >10.0 | % | ||||||
| Tier I capital to risk-weighted assets |
$ | 2,824,299 | 11.66 | % | > $ | 968,792 | >4.0 | % | >$ | 1,453,187 | > 6.0 | % | ||||||
| Tier I capital to adjusted total assets |
$ | 2,824,299 | 6.29 | % | > $ | 1,796,601 | >4.0 | % | >$ | 2,245,751 | > 5.0 | % | ||||||
| (1) | Capital amounts and ratios include E*TRADE Securities LLC. |
The Company has non-cancelable operating leases for facilities through 2022. Future minimum lease payments and sublease proceeds under these leases, including leases involved in facility restructurings, are as follows (dollars in thousands):
| Minimum Lease Payments |
Sublease Proceeds |
Net Lease Commitments | ||||||||
| Years ending December 31, |
||||||||||
| 2010 |
$ | 30,277 | $ | (3,139 | ) | $ | 27,138 | |||
| 2011 |
25,010 | (2,667 | ) | 22,343 | ||||||
| 2012 |
22,972 | (2,724 | ) | 20,248 | ||||||
| 2013 |
15,656 | (2,805 | ) | 12,851 | ||||||
| 2014 |
14,700 | (2,890 | ) | 11,810 | ||||||
| Thereafter |
51,633 | (284 | ) | 51,349 | ||||||
| Total future minimum lease payments |
$ | 160,248 | $ | (14,509 | ) | $ | 145,739 | |||
158
Table of Contents
Certain leases contain provisions for renewal options and rent escalations based on increases in certain costs incurred by the lessor. Rent expense from continuing operations, net of sublease income, was $24.5 million, $25.6 million and $25.0 million for the years ended December 31, 2009, 2008 and 2007, respectively. Rent expense excludes costs related to leases involved in facility restructurings, which are recorded in the facility restructuring and other exit activities line item in the consolidated statement of loss.
NOTE 22—COMMITMENTS, CONTINGENCIES AND OTHER REGULATORY MATTERS
Legal Matters
Litigation Matters
On October 27, 2000, Ajaxo, Inc. (“Ajaxo”) filed a complaint in the Superior Court for the State of California, County of Santa Clara. Ajaxo sought damages and certain non-monetary relief for the Company’s alleged breach of a non-disclosure agreement with Ajaxo pertaining to certain wireless technology that Ajaxo offered the Company as well as damages and other relief against the Company for their alleged misappropriation of Ajaxo’s trade secrets. Following a jury trial, a judgment was entered in 2003 in favor of Ajaxo against the Company for $1.3 million dollars for breach of the Ajaxo non-disclosure agreement. Although the jury also found in favor of Ajaxo on its claim against the Company for misappropriation of trade secrets, the trial court subsequently denied Ajaxo’s requests for additional damages and relief. On December 21, 2005, the California Court of Appeal affirmed the above-described award against the Company for breach of the nondisclosure agreement but remanded the case to the trial court for the limited purpose of determining what, if any, additional damages Ajaxo may be entitled to as a result of the jury’s previous finding in favor of Ajaxo on its claim against the Company for misappropriation of trade secrets. Although the Company paid Ajaxo the full amount due on the above-described judgment, the case, consistent with the rulings issued by the Court of Appeal, was remanded back to the trial court, and on May 30, 2008, a jury returned a verdict in favor of the Company denying all claims raised and demands for damages against the Company. Following the trial court’s filing of entry of judgment in favor of the Company on September 5, 2008, Ajaxo filed post-trial motions for vacating this entry of judgment and requesting a new trial. On November 4, 2008, the trial court denied these motions. On December 2, 2008, Ajaxo filed a notice of appeal with the Court of Appeal of the State of California for the Sixth District, and the parties completed the briefing of Ajaxo’s appeal on December 14, 2009. The Company will continue to vigorously defend itself and oppose Ajaxo’s appeal.
On October 11, 2006, a state class action was filed by Nikki Greenberg on her own behalf and on behalf of all those similarly situated plaintiffs, in the Superior Court for the State of California, County of Los Angeles on behalf of all customers or consumers who allegedly made or received telephone calls from the Company that were recorded without their knowledge or consent. On February 7, 2008, class certification was granted and the class defined to consist of (1) all persons in California who received telephone calls from the Company and whose calls were recorded without their consent within three years of October 11, 2006, and (2) all persons who made calls from California to the Beverly Hills branch of the Company on August 8, 2006. Plaintiffs sought to recover unspecified monetary damages plus injunctive relief, including punitive and exemplary damages, interest, attorneys’ fees and costs. On October 16, 2009, the court granted final approval of the parties’ proposed settlement agreement. Objectors to the court’s order granting final approval of the parties’ settlement agreement filed notices of appeal which were subsequently dismissed on January 26, 2010.
On October 2, 2007, a class action complaint alleging violations of the federal securities laws was filed in the United States District Court for the Southern District of New York against the Company and its then Chief Executive Officer and Chief Financial Officer, Mitchell H. Caplan and Robert J. Simmons, by Larry Freudenberg on his own behalf and on behalf of other similarly situated (the “Freudenberg Action”). On July 17, 2008, the trial court consolidated this action with four other purported class actions, all of which were filed in the United States District Court for the Southern District of New York and which were based on the same facts and circumstances. On January 16, 2009, plaintiffs served their consolidated amended class action complaint in which they also named Dennis Webb, the Company’s former Capital Markets Division President as defendant.
159
Table of Contents
Plaintiffs contend, among other things, that the value of the Company’s stock between April 19, 2006 and November 9, 2007 was artificially inflated because defendants issued materially false and misleading statements and failed to disclose that the Company was experiencing a rise in delinquency rates in its mortgage and home equity portfolios; failed to timely record an impairment on its mortgage and home equity portfolios; materially overvalued its securities portfolio, which included assets backed by mortgages; and based on the foregoing, lacked a reasonable basis for the positive statements made about the Company’s earnings and prospects. Plaintiffs seek to recover damages in an amount to be proven at trial, including interest and attorneys’ fees and costs. Defendants filed their motion to dismiss on April 2, 2009, and briefing on defendants’ motion to dismiss was completed on August 31, 2009. The Company intends to vigorously defend itself against these claims.
On August 15, 2008, Ronald M. Tate, as trustee of the Ronald M. Tate Trust Dtd 4/13/88, and George Avakian, filed an action in the United States District Court for the Southern District of New York against the Company, Mitchell H. Caplan and Robert J. Simmons based on the same facts and circumstances, and containing the same claims, as the Freudenberg consolidated actions discussed above. By agreement of the parties and approval of the court, the Tate action has been consolidated with the Freudenberg consolidated actions for the purpose of pre-trial discovery. Plaintiffs seek to recover damages in an amount to be proven at trial, including interest, attorneys’ and expert fees and costs. The Company intends to vigorously defend itself against these claims.
Based upon the same facts and circumstances alleged in the Freudenberg consolidated actions above, a verified shareholder derivative complaint was filed in the United States District Court for the Southern District of New York on October 4, 2007 by Catherine Rubery, against the Company and its then Chief Executive Officer, President/Chief Operating Officer, Chief Financial Officer and individual members of its board of directors. Plaintiff alleges, among other things, causes of action for breach of fiduciary duty, waste of corporate assets, unjust enrichment, and violation of the Securities Exchange Act of 1934 and Rule 10b-5 promulgated thereunder. The above federal shareholder derivative complaint has been consolidated with another shareholder derivative complaint brought by shareholder Marilyn Clark in the same court and against the same named defendants. Three similar derivative actions, based on the same facts and circumstances as the federal derivative actions, but alleging exclusively state causes of action, have been filed in the Supreme Court of the State of New York, New York County and have been ordered consolidated in that court. In these state derivative actions, plaintiffs Frank Fosbre, Brian Kallinen and Alexander Guiseppone filed a consolidated amended complaint on March 23, 2009. Plaintiffs in the foregoing actions seek unspecified monetary damages against the Individual Defendants in favor of the Company, plus an injunction compelling changes to the Company’s Corporate Governance policies. By agreement of the parties and approval of the respective courts, further proceedings in both these federal and state derivative actions will continue to trail those in the federal securities class actions discussed above.
On April 2, 2008, a class action complaint alleging violations of the federal securities laws was filed by John W. Oughtred on his own behalf and on behalf of all others similarly situated in the United States District Court for the Southern District of New York against the Company. Plaintiff contends, among other things, that the Company committed various sales practice violations in the sale of certain auction rate securities to investors between April 2, 2003, and February 13, 2008 by allegedly misrepresenting that these securities were highly liquid and safe investments for short term investing. On December 18, 2008, plaintiffs filed their first amended class action complaint. Defendants filed their pending motion to dismiss plaintiffs’ amended complaint on February 5, 2009, and briefing on defendants’ motion to dismiss was completed on April 15, 2009. Plaintiffs seek to recover damages in an amount to be proven at trial, or, in the alternative, recession of auction rate securities purchases, plus interest and attorney’s fees and costs. The Company intends to vigorously defend itself against the claims raised in this action.
On February 3, 2010, a class action complaint was filed in the United States District Court for the Northern District of California against E*TRADE Securities LLC by Joseph Roling on his own behalf and on behalf of all others similarly situated. The lead plaintiff alleges that E*TRADE Securities LLC unlawfully charged and collected certain account activity fees from its customers. Claimant, on behalf of himself and the putative class,
160
Table of Contents
asserts breach of contract, unjust enrichment and violation of California Civil Code Section 1671 and seeks equitable and injunctive relief for alleged illegal, unfair and fraudulent practices under California’s Unfair Competition Law, California Business and Professional Code Section 17200 et seq. The plaintiff seeks, among other things, certification of the class action on behalf of alleged similarly situated plaintiffs, unspecified damages and restitution of amounts allegedly wrongfully collected by E*TRADE Securities LLC, attorneys fees and expenses and injunctive relief. The Company intends to vigorously defend itself against the claims raised in this action.
In addition to the matters described above, the Company is subject to various legal proceedings and claims that arise in the normal course of business which could have a material adverse effect on its financial position, results of operations or cash flows. In each pending matter, the Company contests liability or the amount of claimed damages. In view of the inherent difficulty of predicting the outcome of such matters, particularly in cases where claimants seek substantial or indeterminate damages, or where investigation or discovery have yet to be completed, the Company cannot predict with certainty the loss or range of loss related to such matters, how such matters will be resolved, when they will ultimately be resolved, or what any eventual settlement, fine, penalty or other relief might be. Subject to the foregoing, the Company believes that the outcome of any such pending matter will not have a material adverse effect on the consolidated financial condition of the Company, although the outcome could be material to the Company’s or a business segment’s operating results in the future, depending, among other things, upon the Company’s or business segment’s income for such period.
An unfavorable outcome in any matter that is not covered by insurance could have a material adverse effect on the Company’s business, financial condition, results of operations or cash flows. In addition, even if the ultimate outcomes are resolved in the Company’s favor, the defense of such litigation could entail considerable cost or the diversion of the efforts of management, either of which could have a material adverse effect on the Company’s business, financial condition, results of operations or cash flows.
Regulatory Matters
The securities and banking industries are subject to extensive regulation under federal, state and applicable international laws. From time to time, the Company has been threatened with or named as a defendant in, lawsuits, arbitrations and administrative claims involving securities, banking and other matters. The Company is also subject to periodic regulatory audits and inspections. Compliance and trading problems that are reported to regulators, such as the SEC, FINRA, OTS or FDIC by dissatisfied customers or others are investigated by such regulators, and may, if pursued, result in formal claims being filed against the Company by customers or disciplinary action being taken against the Company or its employees by regulators. Any such claims or disciplinary actions that are decided against the Company could have a material impact on the financial results of the Company or any of its subsidiaries.
In the second quarter of 2009, the OTS advised the Company, and the Company agreed, that it was necessary to raise additional equity capital for E*TRADE Bank and reduce substantially the amount of the Company’s outstanding debt in order to withstand any further deterioration in credit and market conditions. Subsequently, the Company strengthened its capital structure by successfully raising $733 million in net proceeds from stock offerings in the second and third quarters of 2009 to further support E*TRADE Bank and enhance the Company’s liquidity. In addition, the Company exchanged $1.7 billion aggregate principal amount of its interest-bearing corporate debt for an equal principal amount of newly-issued non-interest-bearing convertible debentures.
On October 17, 2007, the SEC initiated an informal inquiry into matters related to the Company’s mortgage loan and mortgage-related securities investment portfolios. The Company is cooperating fully with the SEC in this matter.
Beginning in approximately August 2008, representatives of various states attorneys general and FINRA initiated inquiries regarding the purchase of auction rate securities by E*TRADE Securities LLC’s customers. E*TRADE Securities LLC is cooperating with these inquiries. As of February 19, 2010, the total amount of auction rate securities held by all E*TRADE Securities LLC customers was approximately $169.7 million.
161
Table of Contents
On January 19, 2010, the North Carolina Securities Division filed an administrative petition against E*TRADE Securities LLC seeking to revoke the North Carolina securities dealer registration of E*TRADE Securities LLC or, alternatively, to suspend that registration until all North Carolina residents are made whole for their investments in auction rate securities purchased through E*TRADE Securities LLC. E*TRADE Securities LLC is defending that action. As of February 19, 2010, the total amount of auction rate securities held by North Carolina customers is approximately $2.2 million.
In March 2009, the Company’s subsidiary E*TRADE Capital Markets, LLC and 13 other current or former specialist firms on various regional exchanges finalized a settlement of SEC charges alleging that such firms executed proprietary orders in a given security prior to a customer order in the same security during the period 1999-2005. E*TRADE Capital Markets, LLC was a specialist on the Chicago Stock Exchange during the period under review although it exited the specialist business in 2007. According to the SEC complaint, the majority of the alleged violations occurred between 1999 and 2002. As part of the settlement, E*TRADE Capital Markets, LLC consented to the entry of an injunction from future violations of Chicago Stock Exchange Article 9 Rule 17 and the payment of $28.3 million in disgorgement and a $5.7 million penalty, both of which had been reserved for in prior periods. E*TRADE Capital Markets, LLC also consented to findings that it violated section 17(a) of the Securities Exchange Act of 1934 and Rule 17a-3(a)(1) thereunder by failing to make or keep current an itemized record of all purchases and sales in its proprietary account. E*TRADE Capital Markets, LLC settled the SEC charges without admitting or denying the allegations of the complaint.
Insurance
The Company maintains insurance coverage that management believes is reasonable and prudent. The principal insurance coverage it maintains covers commercial general liability; property damage; hardware/software damage; cyber liability; directors and officers; employment practices liability; certain criminal acts against the Company; and errors and omissions. The Company believes that such insurance coverage is adequate for the purpose of its business. The Company’s ability to maintain this level of insurance coverage in the future, however, is subject to the availability of affordable insurance in the marketplace.
Reserves
For all legal matters, reserves are established in accordance with the loss contingencies accounting guidance. Once established, reserves are adjusted based on available information when an event occurs requiring an adjustment.
Loans
In 2008, the Company exited its direct retail lending business, which was the last remaining loan origination channel of the Company. In March 2009, the Company partnered with a third party company to provide access to real estate loans for the Company’s customers. This product is being offered as a convenience to the Company’s customers and is not one of its primary product offerings. The Company structured this arrangement to minimize the assumption of any of the typical risks commonly associated with mortgage lending. The third party company providing this product performs all processing and underwriting of these loans. Shortly after closing, the third party company purchases the loans from the Company and is responsible for the credit risk associated with these loans. As a result, the Company had $34.2 million in commitments to originate loans at December 31, 2009. The Company had $7.9 million in commitments to sell loans and no commitments to purchase loans at December 31, 2009.
Securities, Unused Lines of Credit and Certificates of Deposit
At December 31, 2009, the Company had commitments to purchase $25 million and no commitments to sell securities. In addition, the Company had approximately $0.8 billion of certificates of deposit scheduled to mature in less than one year and $1.3 billion of unfunded commitments to extend credit.
162
Table of Contents
Guarantees
In prior periods when the Company sold loans, the Company provided guarantees to investors purchasing mortgage loans, which are considered standard representations and warranties within the mortgage industry. The primary guarantees are that: the mortgage and the mortgage note have been duly executed and each is the legal, valid and binding obligation of the Company, enforceable in accordance with its terms; the mortgage has been duly acknowledged and recorded and is valid; and the mortgage and the mortgage note are not subject to any right of rescission, set-off, counterclaim or defense, including, without limitation, the defense of usury, and no such right of rescission, set-off, counterclaim or defense has been asserted with respect thereto. The Company is responsible for the guarantees on loans sold. If these claims prove to be untrue, the investor can require the Company to repurchase the loan and return all loan purchase and servicing release premiums. Management has determined that quantifying the potential liability exposure is not meaningful due to the nature of the standard representations and warranties, which have resulted in a minimal amount of loan repurchases.
ETBH raised capital through the formation of trusts, which sold trust preferred securities in the capital markets. The capital securities are mandatorily redeemable in whole at the due date, which is generally 30 years after issuance. Each trust issues trust preferred securities at par, with a liquidation amount of $1,000 per capital security. The proceeds from the sale of issuances are invested in ETBH’s subordinated debentures.
During the 30-year period prior to the redemption of the trust preferred securities, ETBH guarantees the accrued and unpaid distributions on these securities, as well as the redemption price of the securities and certain costs that may be incurred in liquidating, terminating or dissolving the trusts (all of which would otherwise be payable by the trusts). At December 31, 2009, management estimated that the maximum potential liability under this arrangement is equal to approximately $436.5 million or the total face value of these securities plus dividends, which may be unpaid at the termination of the trust arrangement.
NOTE 23—SEGMENT AND GEOGRAPHIC INFORMATION
Beginning in the first quarter of 2009, the Company revised its segment financial reporting to reflect the manner in which its chief operating decision maker had begun assessing the Company’s performance and making resource allocation decisions. As a result, the Company now reports its operating results in two segments: 1) “Trading and Investing,” which includes the businesses that were formerly in the “Retail” segment and now includes the Company’s market making business; and 2) “Balance Sheet Management,” which includes the businesses from the former “Institutional” segment, other than the market-making business. The Company’s segment financial information from prior periods has been reclassified in accordance with the new segment financial reporting.
Trading and investing includes:
| • | trading and investing related brokerage products and services; |
| • | investor-focused banking products; |
| • | market-making; and |
| • | employee stock option management software and services. |
Balance sheet management includes:
| • | managing asset allocation and credit, liquidity and interest rate risk; |
| • | managing loans previously originated or purchased from third parties; and |
| • | managing customer cash and deposits. |
163
Table of Contents
The Company evaluates the performance of its segments based on segment contribution (net revenue less provision for loan losses and operating expense). All corporate overhead, administrative and technology charges are allocated to segments either in proportion to their respective direct costs or based upon specific operating criteria.
Financial information for the Company’s reportable segments is presented in the following tables (dollars in thousands):
| Year Ended December 31, 2009 | ||||||||||||||||
| Trading and Investing |
Balance Sheet Management |
Eliminations(1) | Total | |||||||||||||
| Revenue: |
||||||||||||||||
| Operating interest income |
$ | 1,007,319 | $ | 1,623,566 | $ | (798,327 | ) | $ | 1,832,558 | |||||||
| Operating interest expense |
(213,953 | ) | (1,156,330 | ) | 798,327 | (571,956 | ) | |||||||||
| Net operating interest income |
793,366 | 467,236 | — | 1,260,602 | ||||||||||||
| Commissions |
547,993 | — | — | 547,993 | ||||||||||||
| Fees and service charges |
185,652 | 6,864 | — | 192,516 | ||||||||||||
| Principal transactions |
88,053 | — | — | 88,053 | ||||||||||||
| Gains (losses) on loans and securities, net |
(81 | ) | 169,187 | — | 169,106 | |||||||||||
| Other-than-temporary impairment |
— | (232,139 | ) | — | (232,139 | ) | ||||||||||
| Less: noncredit portion of OTTI recognized in other comprehensive loss (before tax) |
— | 143,044 | — | 143,044 | ||||||||||||
| Net impairment |
— | (89,095 | ) | — | (89,095 | ) | ||||||||||
| Other revenues |
35,555 | 12,286 | — | 47,841 | ||||||||||||
| Total non-interest income |
857,172 | 99,242 | — | 956,414 | ||||||||||||
| Total net revenue |
1,650,538 | 566,478 | — | 2,217,016 | ||||||||||||
| Provision for loan losses |
— | 1,498,112 | — | 1,498,112 | ||||||||||||
| Operating expense: |
||||||||||||||||
| Compensation and benefits |
295,955 | 70,277 | — | 366,232 | ||||||||||||
| Clearing and servicing |
86,984 | 83,727 | — | 170,711 | ||||||||||||
| Advertising and market development |
114,391 | 8 | — | 114,399 | ||||||||||||
| FDIC insurance premiums |
93,750 | 508 | — | 94,258 | ||||||||||||
| Communications |
83,991 | 390 | — | 84,381 | ||||||||||||
| Professional services |
49,694 | 29,024 | — | 78,718 | ||||||||||||
| Occupancy and equipment |
76,075 | 2,285 | — | 78,360 | ||||||||||||
| Depreciation and amortization |
72,867 | 10,470 | — | 83,337 | ||||||||||||
| Amortization of other intangibles |
29,737 | — | — | 29,737 | ||||||||||||
| Facility restructuring and other exit activities |
20,093 | 559 | — | 20,652 | ||||||||||||
| Other operating expenses |
67,865 | 54,679 | — | 122,544 | ||||||||||||
| Total operating expense |
991,402 | 251,927 | — | 1,243,329 | ||||||||||||
| Segment income (loss) |
$ | 659,136 | $ | (1,183,561 | ) | $ | — | $ | (524,425 | ) | ||||||
| (1) | Reflects elimination of transactions between trading and investing and balance sheet management segments, which includes deposits and intercompany transfer pricing arrangements. |
164
Table of Contents
| Year Ended December 31, 2008 | ||||||||||||||||
| Trading and Investing |
Balance Sheet Management |
Eliminations(1) | Total | |||||||||||||
| Revenue: |
||||||||||||||||
| Operating interest income |
$ | 1,533,378 | $ | 2,116,372 | $ | (1,179,810 | ) | $ | 2,469,940 | |||||||
| Operating interest expense |
(702,946 | ) | (1,678,798 | ) | 1,179,810 | (1,201,934 | ) | |||||||||
| Net operating interest income |
830,432 | 437,574 | — | 1,268,006 | ||||||||||||
| Commissions |
514,736 | 815 | — | 515,551 | ||||||||||||
| Fees and service charges |
191,534 | 8,422 | — | 199,956 | ||||||||||||
| Principal transactions |
84,798 | 84 | — | 84,882 | ||||||||||||
| Gains (losses) on loans and securities, net |
(78 | ) | (100,395 | ) | — | (100,473 | ) | |||||||||
| Other-than-temporary impairment |
— | (95,010 | ) | — | (95,010 | ) | ||||||||||
| Less: noncredit portion of OTTI recognized in other comprehensive loss (before tax) |
— | — | — | — | ||||||||||||
| Net impairment |
— | (95,010 | ) | — | (95,010 | ) | ||||||||||
| Other revenues |
38,565 | 14,169 | (50 | ) | 52,684 | |||||||||||
| Total non-interest income |
829,555 | (171,915 | ) | (50 | ) | 657,590 | ||||||||||
| Total net revenue |
1,659,987 | 265,659 | (50 | ) | 1,925,596 | |||||||||||
| Provision for loan losses |
— | 1,583,666 | — | 1,583,666 | ||||||||||||
| Operating expense: |
||||||||||||||||
| Compensation and benefits |
308,422 | 74,963 | — | 383,385 | ||||||||||||
| Clearing and servicing |
89,220 | 95,912 | (50 | ) | 185,082 | |||||||||||
| Advertising and market development |
175,262 | (12 | ) | — | 175,250 | |||||||||||
| FDIC insurance premiums |
30,075 | 1,183 | — | 31,258 | ||||||||||||
| Communications |
94,357 | 2,435 | — | 96,792 | ||||||||||||
| Professional services |
58,152 | 35,918 | — | 94,070 | ||||||||||||
| Occupancy and equipment |
82,123 | 3,643 | — | 85,766 | ||||||||||||
| Depreciation and amortization |
67,005 | 15,478 | — | 82,483 | ||||||||||||
| Amortization of other intangibles |
35,746 | — | — | 35,746 | ||||||||||||
| Facility restructuring and other exit activities |
10,174 | 19,328 | — | 29,502 | ||||||||||||
| Other operating expenses |
86,299 | 4,582 | — | 90,881 | ||||||||||||
| Total operating expense |
1,036,835 | 253,430 | (50 | ) | 1,290,215 | |||||||||||
| Segment income (loss) |
$ | 623,152 | $ | (1,571,437 | ) | $ | — | $ | (948,285 | ) | ||||||
| (1) | Reflects elimination of transactions between trading and investing and balance sheet management segments, which includes deposits and intercompany transfer pricing arrangements. |
165
Table of Contents
| Year Ended December 31, 2007 | ||||||||||||||||
| Trading and Investing |
Balance Sheet Management |
Eliminations(1) | Total | |||||||||||||
| Revenue: |
||||||||||||||||
| Operating interest income |
$ | 1,956,995 | $ | 2,921,189 | $ | (1,355,129 | ) | $ | 3,523,055 | |||||||
| Operating interest expense |
(994,200 | ) | (2,300,385 | ) | 1,355,129 | (1,939,456 | ) | |||||||||
| Net operating interest income |
962,795 | 620,804 | — | 1,583,599 | ||||||||||||
| Commissions |
520,216 | 143,426 | — | 663,642 | ||||||||||||
| Fees and service charges |
208,948 | 21,619 | — | 230,567 | ||||||||||||
| Principal transactions |
101,122 | 1,058 | — | 102,180 | ||||||||||||
| Gains (losses) on loans and securities, net |
180 | (2,296,915 | ) | — | (2,296,735 | ) | ||||||||||
| Other-than-temporary impairment |
— | (168,739 | ) | — | (168,739 | ) | ||||||||||
| Less: noncredit portion of OTTI recognized in other comprehensive loss (before tax) |
— | — | — | — | ||||||||||||
| Net impairment |
— | (168,739 | ) | — | (168,739 | ) | ||||||||||
| Other revenues |
41,138 | 6,608 | (534 | ) | 47,212 | |||||||||||
| Total non-interest income |
871,604 | (2,292,943 | ) | (534 | ) | (1,421,873 | ) | |||||||||
| Total net revenue |
1,834,399 | (1,672,139 | ) | (534 | ) | 161,726 | ||||||||||
| Provision for loan losses |
— | 640,078 | — | 640,078 | ||||||||||||
| Operating expense: |
||||||||||||||||
| Compensation and benefits |
313,176 | 121,609 | — | 434,785 | ||||||||||||
| Clearing and servicing |
98,596 | 172,137 | (534 | ) | 270,199 | |||||||||||
| Advertising and market development |
135,481 | 3,194 | — | 138,675 | ||||||||||||
| FDIC insurance premiums |
21,345 | (1,145 | ) | — | 20,200 | |||||||||||
| Communications |
89,604 | 8,743 | — | 98,347 | ||||||||||||
| Professional services |
64,259 | 34,934 | — | 99,193 | ||||||||||||
| Occupancy and equipment |
77,040 | 8,149 | — | 85,189 | ||||||||||||
| Depreciation and amortization |
62,306 | 20,892 | — | 83,198 | ||||||||||||
| Amortization of other intangibles |
40,334 | 138 | — | 40,472 | ||||||||||||
| Impairment of goodwill |
— | 101,208 | — | 101,208 | ||||||||||||
| Facility restructuring and other exit activities |
5,855 | 21,328 | — | 27,183 | ||||||||||||
| Other operating expenses |
137,288 | 37,896 | — | 175,184 | ||||||||||||
| Total operating expense |
1,045,284 | 529,083 | (534 | ) | 1,573,833 | |||||||||||
| Segment income (loss) |
$ | 789,115 | $ | (2,841,300 | ) | $ | — | $ | (2,052,185 | ) | ||||||
| (1) | Reflects elimination of transactions between trading and investing and balance sheet management segments, which includes deposits and intercompany transfer pricing arrangements. |
Segment Assets
| Trading and Investing |
Balance Sheet Management |
Eliminations | Total | |||||||||
| As of December 31, 2009 |
$ | 9,207,981 | $ | 38,158,504 | $ | — | $ | 47,366,485 | ||||
| As of December 31, 2008 |
$ | 7,748,725 | $ | 40,789,490 | $ | — | $ | 48,538,215 | ||||
166
Table of Contents
Geographic Information
The Company operates in both U.S. and international markets. The Company’s international operations are conducted through offices in Europe and Asia. The following information provides a representation of each region’s contribution to the consolidated amounts (dollars in thousands):
| United States |
Europe | Asia | Total | ||||||||||
| Total net revenue: |
|||||||||||||
| Year ended December 31, 2009 |
$ | 2,142,693 | $ | 60,136 | $ | 14,187 | $ | 2,217,016 | |||||
| Year ended December 31, 2008 |
$ | 1,824,310 | $ | 88,920 | $ | 12,366 | $ | 1,925,596 | |||||
| Year ended December 31, 2007 |
$ | (63,158 | ) | $ | 162,981 | $ | 61,903 | $ | 161,726 | ||||
| Long-lived assets: |
|||||||||||||
| At December 31, 2009 |
$ | 313,269 | $ | 6,010 | $ | 890 | $ | 320,169 | |||||
| At December 31, 2008 |
$ | 310,717 | $ | 7,356 | $ | 1,149 | $ | 319,222 | |||||
No single customer accounted for greater than 10% of gross revenues for the years ended December 31, 2009, 2008 and 2007.
167
Table of Contents
NOTE 24—CONDENSED FINANCIAL INFORMATION (PARENT COMPANY ONLY)
The following presents the Parent’s condensed statement of loss, balance sheet and statement of cash flows:
CONDENSED STATEMENT OF LOSS
(In thousands)
| Year Ended December 31, | ||||||||||||
| 2009 | 2008 | 2007 | ||||||||||
| Revenue: |
||||||||||||
| Management fees from subsidiaries |
$ | 152,093 | $ | 184,761 | $ | 189,203 | ||||||
| Other revenues (expenses) |
(150 | ) | 3,628 | 953 | ||||||||
| Total net revenue |
151,943 | 188,389 | 190,156 | |||||||||
| Operating expense: |
||||||||||||
| Compensation and benefits |
140,861 | 134,819 | 135,356 | |||||||||
| Advertising and market development |
6,982 | 7,385 | 8,979 | |||||||||
| Communications |
15,949 | 22,778 | 24,856 | |||||||||
| Professional services |
44,266 | 47,624 | 51,039 | |||||||||
| Occupancy and equipment |
36,634 | 37,836 | 35,173 | |||||||||
| Depreciation and amortization |
76,543 | 73,888 | 70,125 | |||||||||
| Intercompany allocations and charges |
(207,047 | ) | (200,673 | ) | (190,294 | ) | ||||||
| Other operating expenses |
23,056 | 49,742 | 30,934 | |||||||||
| Total operating expense |
137,244 | 173,399 | 166,168 | |||||||||
| Income before other income (expense), income tax expense (benefit), discontinued operations and equity in loss of consolidated subsidiaries |
14,699 | 14,990 | 23,988 | |||||||||
| Other income (expense): |
||||||||||||
| Corporate interest income |
1,163 | 5,668 | 2,169 | |||||||||
| Corporate interest expense |
(282,524 | ) | (359,971 | ) | (169,475 | ) | ||||||
| Losses on sales of investments, net |
— | (2,539 | ) | (3 | ) | |||||||
| Gains (losses) on early extinguishment of debt |
(968,254 | ) | 21,517 | — | ||||||||
| Equity in income (loss) of investments and venture funds |
(6,267 | ) | (4,960 | ) | 5,590 | |||||||
| Total other income (expense) |
(1,255,882 | ) | (340,285 | ) | (161,719 | ) | ||||||
| Loss before income tax expense (benefit), discontinued operations and equity in loss of consolidated subsidiaries |
(1,241,183 | ) | (325,295 | ) | (137,731 | ) | ||||||
| Income tax expense (benefit) |
(340,749 | ) | (138,686 | ) | 18,231 | |||||||
| Loss from continuing operations and before equity in loss of consolidated subsidiaries |
(900,434 | ) | (186,609 | ) | (155,962 | ) | ||||||
| Income from discontinued operations, net of tax |
— | 268,797 | — | |||||||||
| Equity in loss of consolidated subsidiaries |
(397,328 | ) | (593,978 | ) | (1,285,792 | ) | ||||||
| Net loss |
(1,297,762 | ) | (511,790 | ) | (1,441,754 | ) | ||||||
168
Table of Contents
CONDENSED BALANCE SHEET
(In thousands)
| December 31, | ||||||
| 2009 | 2008 | |||||
| ASSETS | ||||||
| Cash and equivalents |
$ | 377,496 | $ | 183,264 | ||
| Property and equipment, net |
293,573 | 283,682 | ||||
| Investment in consolidated subsidiaries |
5,107,971 | 4,357,987 | ||||
| Receivable from subsidiaries |
30,227 | 32,022 | ||||
| Other assets |
601,863 | 688,278 | ||||
| Total assets |
$ | 6,411,130 | $ | 5,545,233 | ||
| LIABILITIES AND SHAREHOLDERS’ EQUITY | ||||||
| Liabilities: |
||||||
| Corporate debt |
$ | 2,458,691 | $ | 2,750,532 | ||
| Other liabilities |
202,884 | 203,205 | ||||
| Total liabilities |
2,661,575 | 2,953,737 | ||||
| Total shareholders’ equity |
3,749,555 | 2,591,496 | ||||
| Total liabilities and shareholders’ equity |
$ | 6,411,130 | $ | 5,545,233 | ||
169
Table of Contents
CONDENSED STATEMENT OF CASH FLOWS
(In thousands)
| Year Ended December 31, | ||||||||||||
| 2009 | 2008 | 2007 | ||||||||||
| Cash flows from operating activities: |
||||||||||||
| Net loss |
$ | (1,297,762 | ) | $ | (511,790 | ) | $ | (1,441,754 | ) | |||
| Adjustments to reconcile net loss to net cash provided by (used in) operating activities: |
||||||||||||
| Depreciation and amortization (including discount amortization) |
87,191 | 99,420 | 75,057 | |||||||||
| Losses (gains) on sales of investments, net |
150 | 2,539 | (951 | ) | ||||||||
| Equity in undistributed loss (income) of subsidiaries |
675,700 | 808,814 | 1,727,862 | |||||||||
| Equity in loss of investments and venture funds |
6,267 | 4,960 | (5,590 | ) | ||||||||
| Gain on sale of the Canadian brokerage business |
— | (428,979 | ) | — | ||||||||
| (Gains) losses on early extinguishment of debt |
968,254 | (21,517 | ) | — | ||||||||
| Share-based compensation |
20,779 | 20,938 | 15,084 | |||||||||
| Other |
3,548 | 16,486 | 4,199 | |||||||||
| Net effect of changes in assets and liabilities: |
||||||||||||
| (Increase) decrease in other assets |
(429,058 | ) | (508,675 | ) | 82,526 | |||||||
| Increase (decrease) in accounts payable, accrued and other liabilities |
176,156 | 58,118 | (7,610 | ) | ||||||||
| Net cash provided by (used in) operating activities |
211,225 | (459,686 | ) | 448,823 | ||||||||
| Cash flows from investing activities: |
||||||||||||
| Purchases of property and equipment |
(86,252 | ) | (98,883 | ) | (114,838 | ) | ||||||
| Cash contributions to subsidiaries |
(653,438 | ) | (191,831 | ) | (1,641,000 | ) | ||||||
| Proceeds from sale of Canadian brokerage business, net |
— | 469,737 | — | |||||||||
| Other |
9,000 | (2,266 | ) | (17,218 | ) | |||||||
| Net cash (used in) provided by investing activities |
(730,690 | ) | 176,757 | (1,773,056 | ) | |||||||
| Cash flows from financing activities: |
||||||||||||
| Proceeds from issuance of common stock |
733,119 | — | 338,978 | |||||||||
| Proceeds from issuance of springing lien notes |
— | 150,000 | 1,193,767 | |||||||||
| Proceeds from issuance of common stock from employee stock transactions |
— | 2,420 | 35,981 | |||||||||
| Repurchases of common stock |
— | — | (148,632 | ) | ||||||||
| Net cash flow from derivatives hedging liabilities |
— | 59,055 | — | |||||||||
| Other |
(19,422 | ) | 3,055 | 16,260 | ||||||||
| Net cash provided by financing activities |
713,697 | 214,530 | 1,436,354 | |||||||||
| Increase (decrease) in cash and equivalents |
194,232 | (68,399 | ) | 112,121 | ||||||||
| Cash and equivalents, beginning of period |
183,264 | 251,663 | 139,542 | |||||||||
| Cash and equivalents, end of period |
$ | 377,496 | $ | 183,264 | $ | 251,663 | ||||||
170
Table of Contents
Parent Company Guarantees
Guarantees are contingent commitments issued by the Company for the purpose of guaranteeing the financial obligations of a subsidiary to a financial institution. The financial obligations of the Company and the relevant subsidiary do not change by the existence of a corporate guarantee. Rather, upon the occurrence of certain events, the guarantee shifts ultimate payment responsibility of an existing financial obligation from the relevant subsidiary to the guaranteeing parent company.
In support of the Company’s brokerage business, the Company has provided guarantees on the settlement of its subsidiaries’ financial obligations with several financial institutions related to its securities lending activities. Terms and conditions of the guarantees, although typically undefined in the guarantees themselves, are governed by the conditions of the underlying obligation that the guarantee covers. Thus, the Company’s obligation to pay under these guarantees coincides exactly with the terms and conditions of those underlying obligations. At December 31, 2009, no claims had been filed with the Company for payment under any of these guarantees. None of these guarantees are collateralized.
In addition to guarantees issued on behalf its subsidiaries participating in securities lending programs, the Company also issues guarantees for the settlement of foreign exchange transactions. If a subsidiary fails to deliver currency on the settlement date of a foreign exchange arrangement, the beneficiary financial institution may seek payment from the Company. Terms are undefined, and are governed by the terms of the underlying financial obligation. At December 31, 2009, no claims had been made against the Company for payment under these guarantees and thus, no obligations have been recorded. None of these guarantees are collateralized.
NOTE 25—QUARTERLY DATA (UNAUDITED)
The information presented below reflects all adjustments, which, in the opinion of management, are of a normal and recurring nature necessary to present fairly the results of operations for the quarterly periods presented (dollars in thousands, except per share amounts):
| 2009 | 2008 | |||||||||||||||||||||||||||||||
| 1st | 2nd | 3rd | 4th | 1st | 2nd | 3rd | 4th | |||||||||||||||||||||||||
| Total net revenue |
$ | 497,343 | $ | 620,906 | $ | 575,327 | $ | 523,440 | $ | 529,094 | $ | 532,337 | $ | 377,732 | $ | 486,433 | ||||||||||||||||
| Loss from continuing operations |
$ | (232,685 | ) | $ | (143,237 | ) | $ | (854,691 | ) | $ | (67,149 | ) | $ | (92,927 | ) | $ | (119,443 | ) | $ | (320,789 | ) | $ | (276,225 | ) | ||||||||
| Net loss |
$ | (232,685 | ) | $ | (143,237 | ) | $ | (854,691 | ) | $ | (67,149 | ) | $ | (91,193 | ) | $ | (94,559 | ) | $ | (50,475 | ) | $ | (275,563 | ) | ||||||||
| Loss per share from continuing operations: |
||||||||||||||||||||||||||||||||
| Basic |
$ | (0.41 | ) | $ | (0.22 | ) | $ | (0.67 | ) | $ | (0.04 | ) | $ | (0.20 | ) | $ | (0.24 | ) | $ | (0.60 | ) | $ | (0.50 | ) | ||||||||
| Diluted |
$ | (0.41 | ) | $ | (0.22 | ) | $ | (0.67 | ) | $ | (0.04 | ) | $ | (0.20 | ) | $ | (0.24 | ) | $ | (0.60 | ) | $ | (0.50 | ) | ||||||||
| Net loss per share: |
||||||||||||||||||||||||||||||||
| Basic |
$ | (0.41 | ) | $ | (0.22 | ) | $ | (0.67 | ) | $ | (0.04 | ) | $ | (0.20 | ) | $ | (0.19 | ) | $ | (0.09 | ) | $ | (0.50 | ) | ||||||||
| Diluted |
$ | (0.41 | ) | $ | (0.22 | ) | $ | (0.67 | ) | $ | (0.04 | ) | $ | (0.20 | ) | $ | (0.19 | ) | $ | (0.09 | ) | $ | (0.50 | ) | ||||||||
Subsequent to the issuance of the Company’s interim financial statements as of and for the periods ended September 30, 2009 and during the preparation of the consolidated financial statements for the year ended December 31, 2009, management determined that the previously reported income tax benefit for the three months ended September 30, 2009 was overstated as a result of preparation and effective tax rate errors. The net effect of correcting these errors was to reduce the Company’s income tax benefit in the third quarter by $23 million (from the previously reported $319 million to a corrected $296 million). This correction increased the Company’s net loss by $23 million (from the previously reported $832 million to a corrected $855 million) and increased the diluted net loss per share by $0.01 (from the previously reported $0.66 to a corrected $0.67) for the three months ended September 30, 2009. The Company has corrected the unaudited quarterly data in the table above for the three months ended September 30, 2009 for the overstatement of the estimated income tax benefit. Based on an evaluation of all relevant factors, management concluded the overstatement of income tax benefit was immaterial to the Company’s results for
171
Table of Contents
the three months ended September 30, 2009 as well as to the quarterly trend of earnings. Therefore, the Company determined that an amendment of its previously filed Form 10-Q for the quarterly period ended September 30, 2009 was not necessary.
In the third quarter of 2009, the increase in net loss was due principally to an early extinguishment of debt that resulted in a non-cash loss of $772.9 million (pre-tax loss of $968.3 million). The loss from continuing operations for the third and fourth quarter of 2008 was due primarily to the $517.8 million and $512.9 million in provision for loan losses, respectively. Additionally, the Company incurred losses of $153.8 million, net of hedges, on its preferred stock in Fannie Mae and Freddie Mac during the third quarter of 2008.
| ITEM 9. | CHANGES IN AND DISAGREEMENTS WITH ACCOUNTANTS ON ACCOUNTING AND FINANCIAL DISCLOSURE |
Not applicable.
ITEM 9A. CONTROLS AND PROCEDURES
| (a) | Our Interim Chief Executive Officer and our Chief Financial Officer, after evaluating the effectiveness of the Company’s “disclosure controls and procedures” (as defined in the Securities Exchange Act of 1934 (“Exchange Act”) Rules 13a-15(e) and 15d-15(e)) as of the end of the period covered by this annual report, have concluded that our disclosure controls and procedures are effective based on their evaluation of these controls and procedures required by paragraph (b) of Exchange Act Rules 13a-15 or 15d-15. |
| (b) | Our Interim Chief Executive Officer and our Chief Financial Officer have evaluated the changes to the Company’s internal control over financial reporting that occurred during our last fiscal quarter ended December 31, 2009, as required by paragraph (d) of Exchange Act Rules 13a-15 and 15d-15, and have concluded that there were no such changes that materially affected, or are reasonably likely to materially affect, the Company’s internal control over financial reporting. The Management Report on Internal Control Over Financial Reporting and the Reports of Independent Registered Public Accounting Firm are included in Item 8. Financial Statements and Supplementary Data. |
| ITEM 9B. | OTHER INFORMATION |
Not applicable.
Certain portions of the Company’s Proxy Statement for its 2009 Annual Meeting of Shareholders, which, when filed pursuant to Regulation 14A under the Securities Exchange Act of 1934, will be incorporated by reference in this Annual Report on Form 10-K pursuant to General Instruction G(3) of Form 10-K, provide the information required under Part III (Items 10, 11, 12, 13 and 14).
| ITEM 15. | EXHIBITS AND FINANCIAL STATEMENT SCHEDULES |
(a) The following documents are filed as part of this report:
Consolidated Financial Statements and Financial Statement Schedules
Consolidated Financial Statement Schedules have been omitted because the required information is not applicable, not material or is provided in the consolidated financial statements or notes thereto.
172
Table of Contents
| Exhibit |
Description | |
| 3.1 | Restated Certificate of Incorporation of E*TRADE Financial Corporation as currently in effect. (Incorporated by reference to Exhibit 3.1 of the Company’s Current Report on Form 8-K filed September 14, 2009.) | |
| 3.2 | Certificate of Designation of Series A Preferred Stock of the Company (Incorporated by reference to Exhibit 4.2 of Amendment No. 1 to the Company’s Registration Statement on Form S-3, Registration Statement No. 333-41628, filed August 25, 2000.) | |
| 3.3 | Certificate of Designation of Series B Participating Cumulative Preferred Stock of the Company (Incorporated by reference to Exhibit 3.1 of the Company’s Form 10-Q filed August 14, 2001.) | |
| 3.4 | Restated Bylaws of the Registrant (Incorporated by reference to Exhibit 3.3 to the Company’s Annual Report on Form 10-K filed November 9, 2000, Exhibit 3.2 to the Company’s Current Report on Form 8-K filed May 22, 2008 and Exhibit 3.1 to the Company’s Current Report on Form 8-K filed June 10, 2009.) | |
| 4.1 | Specimen of Common Stock Certificate (Incorporated by reference to Exhibit 4.1 of Amendment No. 1 to the Company’s Registration Statement on Form S-1, Registration Statement No. 333-05525, filed July 22, 1996.) | |
| 4.2 | Indenture dated June 8, 2004, between E*TRADE Financial Corporation and The Bank of New York, as Trustee, relating to the 2011 Notes (includes form of note) (Incorporated by reference to Exhibit 4 of the Company’s Registration Statement on Form S-4, Registration Statement No. 333-117080, filed on July 1, 2004.) | |
| 4.3 | First Supplemental Indenture dated September 19, 2005, between the Company and The Bank of New York, as Trustee, relating to the 2011 Notes (Incorporated by reference to Exhibit 4.1 of the Company’s Form 10-Q filed November 1, 2005.) | |
| *4.4 | Second Supplemental Indenture dated November 1, 2006, between the Company and The Bank of New York, as Trustee, relating to the 2011 Notes | |
| 4.5 | Third Supplemental Indenture dated as of July 9, 2009, between E*TRADE Financial Corporation and The Bank of New York Mellon, as Trustee, relating to the 2011 Notes (Incorporated by reference to Exhibit 4.1 of the Company’s Current Report on Form 8-K filed on July 9, 2009.) | |
| 4.6 | Indenture dated September 19, 2005, between the Company and The Bank of New York, as Trustee, relating to the 2013 Notes (includes form of note) (Incorporated by reference to Exhibit 4.2 of the Company’s Form 10-Q filed November 1, 2005.) | |
| 4.7 | First Supplemental Indenture dated November 10, 2005, between E*TRADE Financial Corporation and The Bank of New York, as Trustee, relating to the 2013 Notes (Incorporated by reference to Exhibit 4.1 of the Company’s Current Report on Form 8-K filed on November 15, 2005.) | |
| *4.8 | Second Supplemental Indenture dated November 1, 2006, between the Company and The Bank of New York, as Trustee, relating to the 2013 Notes | |
| 4.9 | Indenture dated November 22, 2005, between E*TRADE Financial Corporation and The Bank of New York, as Trustee, relating to the 2015 Notes (includes form of note) (Incorporated by reference to Exhibit 4.15 of the Company’s Form 10-K filed March 1, 2006.) | |
| *4.10 | First Supplemental Indenture dated November 1, 2006, between the Company and The Bank of New York, as Trustee, relating to the 2015 Notes | |
173
Table of Contents
| Exhibit |
Description | |
| 4.11 | Indenture dated November 29, 2007, between E*TRADE Financial Corporation and The Bank of New York, as Trustee, relating to the 2017 Notes (includes form of note) (Incorporated by reference to Exhibit 4.2 of the Company’s Current Report on Form 8-K filed on December 4, 2007.) | |
| *4.12 | First Supplemental Indenture dated December 27, 2007, between the Company and The Bank of New York, as Trustee, relating to the 2017 Notes | |
| *4.13 | Second Supplemental Indenture dated January 18, 2008, between the Company and The Bank of New York, as Trustee, relating to the 2017 Notes | |
| 4.14 | Third Supplemental Indenture dated as of July 9, 2009, between E*TRADE Financial Corporation and The Bank of New York Mellon, as trustee, relating to the 2017 Notes (Incorporated by reference to Exhibit 4.2 of the Company’s Current Report on Form 8-K filed on July 9, 2009.) | |
| 4.15 | Indenture dated as of August 25, 2009 between E*TRADE Financial Corporation and The Bank of New York Mellon, as Trustee, relating to the 2019 Debentures (includes form of note) (Incorporated by reference to Exhibit 4.1 of the Company’s Current Report on Form 8-K filed on August 25, 2009.) | |
| 4.16 | Rights Agreement dated at July 9, 2001 between E*TRADE Financial Corporation and American Stock Transfer and Trust Company, as Rights Agent (Incorporated by reference to Exhibit 99.2 to the Company’s Current Report on Form 8-K filed on July 10, 2001.) | |
| 4.17 | Second Amendment to Rights Agreement, dated as of June 17, 2009, by and between E*TRADE Financial Corporation and American Stock Transfer & Trust Company, as rights agent (Incorporated by reference to Exhibit 4.1 of the Company’s Current Report on Form 8-K filed on June 17, 2009.) | |
| 4.18 | Third Amendment to Rights Agreement, dated as of June 30, 2009, by and between E*TRADE Financial Corporation and American Stock Transfer & Trust Company, as Rights Agent (Incorporated by reference to Exhibit 4.1 of the Company’s Current Report on Form 8-K filed on June 30, 2009.) | |
| 4.19 | Fourth Amendment, dated as of September 11, 2009, to Rights Agreement by and among E*TRADE Financial Corporation and American Transfer and Trust Company (Incorporated by reference to Exhibit 4.1 of the Company’s Current Report on Form 8-K filed on September 14, 2009.) | |
| 4.20 | Registration Rights Agreement, dated as of November 29, 2007, by and between Wingate Capital Ltd. and E*TRADE Financial Corporation (Incorporated by reference to Exhibit 4.1 of the Company’s Current Report on Form 8-K filed on December 4, 2007.) | |
| *10.1 | Executive Deferred Compensation Plan | |
| 10.2 | [redacted] Master Service Agreement and Global Services Schedule, dated April 9, 2003, between E*TRADE Group, Inc. and ADP Financial Information Services, Inc. (Incorporated by reference to Exhibit 10.1 of the Company’s Form 10-Q filed on August 8, 2003.) | |
| 10.3 | E*TRADE Financial Sweep Deposit Account Brokerage and Servicing Agreement, dated September 12, 2003, by and between E*TRADE Bank and E*TRADE Clearing LLC. (Incorporated by reference to Exhibit 10.1 of the Company’s Form 10-Q filed on November 7, 2003.) | |
| 10.4 | Code of Professional Conduct (Incorporated by reference to Exhibit 99.1 of the Company’s Form 8-K filed on October 24, 2008). | |
| 10.5 | 2005 Equity Incentive Plan and Forms of Award Agreements (Incorporated by reference to Exhibit 10.66 to the Company’s Current Report on Form 8-K filed on May 31, 2005.) | |
| 10.6 | Executive Bonus Plan (Incorporated by reference to Exhibit 10.67 to the Company’s Current Report on Form 8-K filed on May 31, 2005.) | |
| 10.7 | Master Investment and Securities Purchase Agreement, dated November 29, 2007 by and between E*TRADE Financial Corporation and Wingate Capital Ltd. (Incorporated by reference to Exhibit 10.1 of the Company’s Current Report on Form 8-K filed on December 4, 2007.) | |
174
Table of Contents
| Exhibit |
Description | |
| 10.8 | First Amendment to Master Investment and Securities Purchase Agreement, dated as of December 12, 2007, by and between Wingate Capital Ltd. and E*TRADE Financial Corporation (Incorporated by reference to Exhibit 99.5 of the Schedule 13D filed by Citadel Limited Partnership et al with respect to E*TRADE Financial Corporation on December 7, 2007.) | |
| 10.9 | Second Amendment to Master Investment and Securities Purchase Agreement, dated as of January 18, 2008, by and between Wingate Capital Ltd. and E*TRADE Financial Corporation (Incorporated by reference to Exhibit 99.12 of the Amendment No. 1 to Schedule 13D filed by Citadel Limited Partnership et al with respect to E*TRADE Financial Corporation on January 18, 2008.) | |
| 10.10 | Securities Purchase Agreement, dated November 29, 2007 among E*TRADE Financial Corporation, Investment Partners (A), LLC and the additional investors party thereto (Incorporated by reference to Exhibit 10.2 of the Company’s Current Report on Form 8-K filed on December 4, 2007.) | |
| 10.11 | ABS Purchase Agreement, dated as of November 29, 2007, by and among E*TRADE Financial Corporation, E*TRADE Bank, E*TRADE Global Asset Management, Inc. and Citadel Equity Fund Ltd. (Incorporated by reference to Exhibit 10.3 of the Company’s Current Report on Form 8-K filed on December 4, 2007.) | |
| 10.12 | [redacted] Equities and Options Order Handling Agreement, dated as of November 29, 2007, by and among E*TRADE Financial Corporation, E*TRADE Securities LLC, and Citadel Derivatives Group LLC (Incorporated by reference to Exhibit 10.29 of the Company’s Form 10-K filed on February 28, 2008.) | |
| 10.13 | Employment Agreement dated March 2, 2008 by and between E*TRADE Financial Corporation and Donald H. Layton. (Incorporated by reference to Exhibit 10.1 of the Company’s Form 10-Q filed on May 9, 2008.) | |
| 10.14 | Exchange Agreement dated June 17, 2009 between E*TRADE Financial Corporation and Citadel Equity Fund Ltd. (Incorporated by reference to Exhibit 10.1 of the Company’s Form 10-Q filed on June 17, 2009.) | |
| 10.15 | Amendment No. 1 to Exchange Agreement dated June 22, 2009 between E*TRADE Financial Corporation and Citadel Equity Fund Ltd. (Incorporated by reference to Exhibit 10.1 of the Company’s Current Report on Form 8-K filed on June 23, 2009.) | |
| 10.16 | Form of Exchange Agreement (Incorporated by reference to Exhibit 10.1 of the Company’s Current Report on Form 8-K filed on May 6, 2008.) | |
| 10.17 | Guarantee and Support Agreement, dated as of July 14, 2008, by E*TRADE Financial Corporation in favor of The Bank of Nova Scotia (Incorporated by reference to Exhibit 10.1 of the Company’s Current Report on Form 8-K filed on July 16, 2008). | |
| 10.18 | Form of Indemnification Agreement for Directors dated July 30, 2008. (Incorporated by reference to Exhibit 10.2 of the Company’s Form 10-Q filed on August 8, 2008.) | |
| 10.19 | Employment Agreement between E*TRADE Financial Corporation and Bruce P. Nolop as of September 12, 2008. (Incorporated by reference to Exhibit 10.1 of the Company’s Form 10-Q filed on November 5, 2008.) | |
| *10.20 | Transition Arrangements between E*TRADE Financial Corporation and Donald Layton | |
| *10.21 | Form of Employment Agreement between E*TRADE Financial Corporation and each of Michael Curcio, Greg Framke and Nicholas Utton. | |
| *12.1 | Statement of Ratio of Earnings to Fixed Charges. | |
| *21.1 | Subsidiaries of the Registrant. | |
175
Table of Contents
| Exhibit |
Description | |
| *23.1 | Consent of Independent Registered Public Accounting Firm. | |
| *31.1 | Certification—Section 302 of the Sarbanes-Oxley. | |
| *31.2 | Certification—Section 302 of the Sarbanes-Oxley. | |
| *32.1 | Certification —Section 906 of the Sarbanes-Oxley. | |
| * | Filed herein. |
176
Table of Contents
Pursuant to the requirements of Section 13 or 15(d) of the Securities Exchange Act of 1934, the Registrant has duly caused this report to be signed on its behalf by the undersigned, thereunto duly authorized.
Dated: February 24, 2010
| E*TRADE Financial Corporation (Registrant) | ||
| By | /S/ ROBERT A. DRUSKIN | |
| Robert A. Druskin Chairman & Interim Chief Executive Officer (Principal Executive Officer) | ||
| By | /S/ BRUCE P. NOLOP | |
| Bruce P. Nolop Chief Financial Officer (Principal Financial and Accounting Officer) | ||
Pursuant to the requirements of the Securities Exchange Act of 1934, this report has been signed below by the following persons on behalf of the Registrant and in the capacities and on the dates indicated.
| Signature |
Title |
Date | ||
| /s/ ROBERT A. DRUSKIN Robert A. Druskin |
Chairman & Interim Chief Executive Officer (Principal Executive Officer) | February 24, 2010 | ||
| /s/ BRUCE P. NOLOP Bruce P. Nolop |
Chief Financial Officer (Principal Financial and Accounting Officer) | February 24, 2010 | ||
| /s/ RONALD D. FISHER Ronald D. Fisher |
Director |
February 24, 2010 | ||
| /s/ KENNETH C. GRIFFIN Kenneth C. Griffin |
Director |
February 24, 2010 | ||
| /s/ GEORGE A. HAYTER George A. Hayter |
Director |
February 24, 2010 | ||
| /s/ FREDERICK W. KANNER Frederick W. Kanner |
Director |
February 24, 2010 | ||
| /s/ MICHAEL K. PARKS Michael K. Parks |
Director |
February 24, 2010 | ||
| /s/ C. CATHLEEN RAFFAELI C. Cathleen Raffaeli |
Director |
February 24, 2010 | ||
| /s/ LEWIS E. RANDALL Lewis E. Randall |
Director |
February 24, 2010 | ||
| /s/ JOSEPH L. SCLAFANI Joseph L. Sclafani |
Director |
February 24, 2010 | ||
|
Joseph M. Velli |
Director |
|||
| /s/ DONNA L. WEAVER Donna L. Weaver |
Director |
February 24, 2010 | ||
| /s/ STEPHEN H. WILLARD Stephen H. Willard |
Director |
February 24, 2010 | ||
177