Attached files
| file | filename |
|---|---|
| EX-10.7 - Dealertrack Technologies, Inc | v174968_ex10-7.htm |
| EX-10.9 - Dealertrack Technologies, Inc | v174968_ex10-9.htm |
| EX-10.6 - Dealertrack Technologies, Inc | v174968_ex10-6.htm |
| EX-23.1 - Dealertrack Technologies, Inc | v174968_ex23-1.htm |
| EX-21.1 - Dealertrack Technologies, Inc | v174968_ex21-1.htm |
| EX-32.1 - Dealertrack Technologies, Inc | v174968_ex32-1.htm |
| EX-31.1 - Dealertrack Technologies, Inc | v174968_ex31-1.htm |
| EX-31.2 - Dealertrack Technologies, Inc | v174968_ex31-2.htm |
| EX-10.39 - Dealertrack Technologies, Inc | v174968_ex10-39.htm |
| EX-10.11 - Dealertrack Technologies, Inc | v174968_ex10-11.htm |
| EX-10.10 - Dealertrack Technologies, Inc | v174968_ex10-10.htm |
| EX-10.8 - Dealertrack Technologies, Inc | v174968_ex10-8.htm |
UNITED
STATES SECURITIES AND EXCHANGE COMMISSION
Washington,
D.C. 20549
Form 10-K
(Mark
One)
|
þ
|
ANNUAL
REPORT PURSUANT TO SECTION 13 OR 15(d) OF THE SECURITIES EXCHANGE ACT OF
1934
|
For
the fiscal year ended December 31, 2009
or
|
o
|
TRANSITION
REPORT PURSUANT TO SECTION 13 OR 15(d) OF THE SECURITIES EXCHANGE ACT OF
1934
|
Commission
file number 000-51653
DEALERTRACK
HOLDINGS, INC.
(Exact
name of registrant as specified in its charter)\
|
Delaware
(State
or other jurisdiction
of
incorporation or organization)
|
52-2336218
(I.R.S.
Employer
Identification
Number)
|
1111
Marcus Ave., Suite M04
Lake
Success, NY 11042
(Address
of principal executive offices, including zip code)
(516) 734-3600
(Registrant’s
telephone number, including area code)
Securities
registered pursuant to Section 12(b) of the Act:
|
Common
Stock, $0.01 Par Value Per Share
(Title
of each class)
|
The
NASDAQ Stock Market, LLC
(Name
of exchange on which registered)
|
Securities
registered pursuant to Section 12(g) of the Act: None
Indicate by check mark if the registrant is a well-known seasoned
issuer, as defined in Rule 405 of the Securities Act. Yes o No þ
Indicate by check mark if the registrant is not required to file
reports pursuant to Section 13 or Section 15(d) of the Act. Yes o No þ
Indicate
by check mark whether the registrant: (1) has filed all reports required to
be filed by Section 13 or 15(d) of the Securities Exchange Act of 1934
during the preceding 12 months (or for such shorter period that the
registrant was required to file such reports), and (2) has been subject to
such filing requirements for the past 90 days. Yes þ No o
Indicate by check mark whether the registrant has submitted
electronically and posted on its corporate Website, if any, every Interactive
Data File required to be submitted and posted pursuant to Rule 405 of Regulation
S-T (§232.405 of this chapter) during the preceding 12 months (or for such
shorter period that the registrant was required to submit and post such files).
Yes o No þ
Indicate by check mark if disclosure of delinquent filers pursuant
to Item 405 of Regulation S-K is not contained herein, and will not be
contained, to the best of registrant’s knowledge, in definitive proxy or
information statements incorporated by reference in Part III of this Form
10-K or any amendment to this Form 10-K. o
Indicate by check mark whether the registrant is a large
accelerated filer, an accelerated filer, a non-accelerated filer, or a smaller
reporting company. See the definitions of “large accelerated filer,”
“accelerated filer” and “smaller reporting company” in Rule 12b-2 of the
Exchange Act. (Check one):
|
Large
accelerated filer þ
|
Accelerated
filer o
|
Non-accelerated
filer o
|
Smaller
reporting company o
|
|||
|
(Do
not check if a smaller reporting
company)
|
||||||
Indicate by check mark whether the registrant is a shell company
(as defined in Rule 12b-2 of the Exchange Act). Yes o No þ
The aggregate market value of the common stock held by
non-affiliates of the registrant as of June 30, 2009, the last business day
of the registrant’s most recently completed second fiscal quarter, was
approximately $679 million (based on the closing price for the registrant’s
common stock on the NASDAQ Global Market of $16.99 per share).
As of February 1, 2010, 40,070,756 shares of the registrant’s
common stock were outstanding.
DOCUMENTS
INCORPORATED BY REFERENCE
The Registrant intends to file a proxy statement pursuant to
Regulation 14A within 120 days of the end of the fiscal year ended
December 31, 2009. Portions of such proxy statement are incorporated by
reference into Part III of this Annual Report on Form 10-K.
TABLE
OF CONTENTS
|
Page
|
|
|
Item 1. Business
|
3
|
|
Item 1A.
Risk Factors
|
13
|
|
Item 1B.
Unresolved Staff Comments
|
22
|
|
Item 2.
Properties
|
22
|
|
Item 3.
Legal Proceedings
|
22
|
|
Item 4.
Submission of Matters to a Vote of Security
Holders
|
23
|
|
Item 5.
Market for Registrant’s Common Equity, Related Stockholder Matters and
Issuer Purchases of Equity Securities
|
23
|
|
Item 6.
Selected Consolidated Financial Data
|
24
|
|
Item 7.
Management’s Discussion and Analysis of Financial Condition and Results of
Operations
|
25
|
|
Item 7A.
Quantitative and Qualitative Disclosures About Market
Risk
|
45
|
|
Item 8.
Financial Statements and Supplementary Data
|
46
|
|
Item 9.
Changes in and Disagreements with Accountants on Accounting and Financial
Disclosure
|
78
|
|
Item 9A.
Controls and Procedures
|
78
|
|
Item 9B.
Other Information
|
79
|
|
Item 10.
Directors, Executive Officers and Corporate
Governance
|
79
|
|
Item 11.
Executive Compensation
|
79
|
|
Item 12.
Security Ownership of Certain Beneficial Owners and Management and Related
Stockholder Matters
|
79
|
|
Item 13.
Certain Relationships and Related Transactions, and Director
Independence
|
79
|
|
Item 14.
Principal Accountant Fees and Services
|
79
|
|
Item 15.
Exhibits and Financial Statement Schedule
|
80
|
|
EX-21.1:
LIST OF SUBSIDIARIES
|
|
|
EX-23.1:
CONSENT OF PRICEWATERHOUSECOOPERS LLP
|
|
|
EX-31.1:
CERTIFICATION
|
|
|
EX-31.2:
CERTIFICATION
|
|
|
EX-32.1:
CERTIFICATIONS
|
2
PART
I
Item 1. Business
Certain statements in this Annual
Report on Form
10-K are
“forward-looking statements” within the meaning of Section 27A of the
Securities Act of 1933, as amended (the “Securities Act”), and Section 21E
of the Securities Exchange Act of 1934, as amended (the “Exchange Act”). These
statements involve a number of risks, uncertainties and other factors that could
cause our actual results, performance or achievements to be materially different
from any future results, performance or achievements expressed or implied by
these forward-looking statements. Factors which could materially affect such
forward-looking statements can be found in the section entitled “Risk Factors”
in Part 1, Item 1A in this Annual Report on Form 10-K. Investors are urged to
consider these factors carefully in evaluating the forward-looking statements
and are cautioned not to place undue reliance on such forward-looking
statements. The forward-looking statements made herein are only made as of the
date hereof and we will undertake no obligation to publicly update such
forward-looking statements to reflect subsequent events or
circumstances.
References in this Annual Report
on Form 10-K
to “DealerTrack,” the
“Company,” “our” or “we” are to DealerTrack Holdings, Inc., a Delaware
corporation, and/or its subsidiaries.
Overview
DealerTrack’s
intuitive and high-value software solutions enhance efficiency and profitability
for all major segments of the automotive retail industry, including dealers,
lenders, OEMs, agents and aftermarket providers. We believe our solution set for
dealers is the industry’s most comprehensive. DealerTrack operates the
industry’s largest online credit application network, connecting approximately
17,000 dealers with over 800 lenders. Our dealer management system (DMS)
provides dealers with easy-to-use tools with real-time data access that will
streamline any automotive business. With our inventory management solution
(DealerTrack AAX), dealers get better data along with the tools to make smarter,
more profitable inventory decisions. Our sales and finance and insurance
(F&I) solution enables dealers to streamline the entire sales process,
quickly structuring all types of deals from a single integrated platform.
DealerTrack’s compliance solution helps dealers meet legal and regulatory
requirements and protect their hard-earned assets. DealerTrack’s family of
companies also includes data, accessories and consulting services
providers, Automotive Lease Guide (ALG) and Chrome Systems
(Chrome).
We are a
Delaware corporation formed in August 2001. We are organized as a holding
company and conduct a substantial amount of our business through our
subsidiaries, including Automotive Lease Guide (alg), Inc., Chrome Systems,
Inc., DealerTrack Aftermarket Services, Inc., DealerTrack Canada, Inc.,
DealerTrack Digital Services, Inc., DealerTrack, Inc., and DealerTrack Systems,
Inc.
We
maintain a website at www.dealertrack.com. We make
available, free of charge through our website, our Annual Report on Form 10-K,
Quarterly Reports on Form 10-Q, Current Reports on Form 8-K, including exhibits
thereto, and any amendments to those reports filed or furnished pursuant to
Section 13(a) or 15(d) of the Exchange Act, as soon as reasonably practicable
after the reports are electronically filed with, or furnished to the Securities
and Exchange Commission (the “SEC”). Our reports that are filed with, or
furnished to, the SEC are also available at the SEC’s website at www.sec.gov. You may also
obtain copies of any of our reports filed with, or furnished to, the SEC, free
of charge, at the SEC’s public reference room at 100 F Street, N.E., Washington,
DC 20549.
Our
Market
Historically,
dealers had traditionally relied upon fax and mail delivery methods for
processing their financing and insurance offerings. This method produced lengthy
processing times and increased the cost of assisting the consumer to obtain
financing or insurance. For example, legacy paper systems required the consumer
to fill out a paper credit application for each of the lenders to which he or
she applied. The dealer then faxed the credit application to each lender and
awaited a series of return faxes. When a lender approved the consumer’s credit
application, the consumer manually signed a paper finance or lease contract with
the dealer, who then delivered it with ancillary documents to the lender via
mail or overnight courier. The lender then manually checked the contract for any
errors or omissions and if the contract or ancillary documents were accurate and
complete, the lender paid the dealer for the assignment of the contract. The
cumbersome nature of this process can limit the range of options available to
consumers and delay the availability of financing. In addition, the sale of
insurance and warranty products can be hindered by dealers consulting
out-of-date paper program catalogues and not being aware of all of the insurance
programs and other aftermarket sales opportunities available to offer the
consumer.
Dealers
have also employed technology to address inefficiencies in a variety of their
other traditional workflow processes. For example, dealers have made significant
investments in DMS software to streamline their back office functions, such as
accounting, inventory, communications with manufacturers, parts and service, and
have deployed customer relationship management (CRM) software to track consumer
behavior and maintain active post-sale relationships with consumers to increase
aftermarket sales and future automobile sales. However, these DMS and CRM
software systems typically reside within the physical dealership and have not
historically been fully integrated with each other, resulting in new
inefficiencies. These inefficiencies slow the sales and customer management
process, as different and sometimes contradictory information is recorded on
separate systems. In addition, key information about the consumer may not be
provided to the salesperson on the sales floor although it may exist in one of
the dealers’ systems.
3
In contrast to most dealer legacy systems, our low cost, high value
web-based solutions are generally open and flexible. Our network improves
efficiency and reduces processing time for dealers, lenders, and other
participants, and integrates the products and services of third-party service
and information providers, such as credit reporting agencies and aftermarket
providers. We primarily generate revenue on either a transaction or subscription
basis, depending on the customer and the product or service
provided.
DealerTrack
also addresses the inefficiencies in the process in which dealers manage their
used vehicles. The procedures to appraise, accept trade ins, market, source and
dispose of vehicles have generally been manual procedures not supported by
sophisticated technology. DealerTrack AAX assists a dealerships’ need to more
effectively manage its used vehicle inventory and increase profits at the
same time.
Our
Customers
We believe our suite of integrated on-demand software addresses
many of the inefficiencies in the automotive retail value chain and delivers
benefits to dealers, lenders, OEM’s, aftermarket providers, and other service
and information providers.
Dealers
We offer franchised and independent dealers a suite of low-cost
on-demand DMS, inventory management, sales, F&I and compliance solutions
that significantly shorten financing processing times, increase efficiencies
across the dealership, and allow dealers to spend more time selling
automobiles.
Our automated, web-based credit application-processing product
allows automotive dealers to originate and route their consumers’ credit
application information. This product has eliminated the need to fax a paper
application to each lender to which a consumer applies for financing. Once a
dealer enters a consumer’s information into our system, the dealer can
distribute the credit application data electronically to one or multiple lenders
and obtain credit decisions quickly and efficiently. This service is free to our
dealer customers.
We offer a comprehensive DMS, allowing dealers to manage functions
across their entire business, and a complete suite of other subscription
solutions that complement our credit application processing product, allowing
dealers to integrate and better manage their business processes. We offer a
compliance solution that helps dealers comply with red flags regulations and
offers reporting functions. Additionally, DealerTrack AAX helps dealers manage
their inventory and pricing and our sales and F&I solutions streamline the
vehicle and aftermarket sales processes. Included in our sales and F&I
solutions are products that allow dealers and consumers to complete finance
contracts electronically, which a dealer can then transmit to participating
lenders for funding, further streamlining the financing process and reducing
transaction costs for both dealers and lenders. We give each dealership the
ability to select the specific tools they need to reduce costs, increase profits
and sell more vehicles.
Lenders
Our on-demand credit application processing and electronic
contracting products eliminate expensive and time-consuming inefficiencies in
legacy paper systems, and thereby decrease lenders’ costs of originating loans
or leases. We also offer a contract-processing solution, which can provide
lenders with retail automotive contracts and related documents in a digital or
electronic format. We believe our solutions significantly streamline the
financing process and improve the efficiency and/or profitability of each
financing transaction. We electronically transmit complete credit application
and contract data, reducing costs and errors and improving efficiency for both
prime and non-prime lenders. We also believe that our credit application
processing product enables our lender customers to increase credit originations.
Our network is configured to enable our lender customers to connect easily with
dealers with whom they can establish new business relations. We believe that
lenders that utilize our solutions experience a significant competitive
advantage over lenders that rely on the legacy paper and fax
processes.
OEM’s
We offer
vehicle manufacturers comprehensive technology and consulting solutions to
improve brand health, increase vehicle and accessories sales, and streamline
interactions with franchised dealerships. Our solutions help improve residual
vehicle values and consumer brand perception with automotive OEM consulting
services and tools from ALG. Our solutions boost the selling power of a
dealer website and maximize accessories sales with fully functional and
customizable build, price and competitive-comparison solutions from
Chrome. In addition, DealerTrack DMS streamlines manufacturer
interactions by integrating warranty claims, part orders and returns, and
financial statement submission.
Aftermarket Providers
The
DealerTrack Aftermarket Network™ gives dealers access to real-time contract
rating information and quote generation, and provides digital contracting for
aftermarket products and services. The aftermarket sales and contracting process
was previously executed through individual aftermarket providers’ websites or
through a cumbersome paper-based process prone to frequent delays and errors.
Our on-demand connection between dealers and aftermarket providers creates a
faster process, improves accuracy, and eliminates duplicate data entry for both
dealers and aftermarket providers. We believe this more efficient process
combined with the use of our on-demand electronic menu product makes it possible
for dealers to more effectively sell aftermarket products and
services.
4
Other Service and Information Providers
We believe that our software as a service model is a superior
method of delivering products and services to our customers. Our web-based
solutions enable third-party service and information providers to deliver their
products and services more broadly and efficiently, which increases the value of
our integrated solutions to our dealer customers. We believe we offer our
third-party service and information providers a secure and efficient means of
delivering their data to our dealer and lender customers. For example, the
credit reporting agencies can provide dealers with consumers’ credit reports
electronically and integrate the delivery of the prospective consumers’ credit
reports with our credit application processing and other products. Additionally,
our inventory management solution integrates real time pricing data and
wholesale auction data to give dealers access to available market
information.
Our
Web-based Network
Our web-based network is independent and does not give
any single lender preference over any other lender. Each dealer sees its
individualized list of available lenders listed alphabetically, based on our
proprietary matching process, and can transmit credit application information
simultaneously to multiple lenders that they select. Lenders’ responses to
requests for financing through our network are presented back to the dealer in
their order of response.
Our
Growth Strategy
Our growth strategy is to leverage our position as a leading
provider of on-demand software solutions to the U.S. and Canadian automotive
retail industries. Key elements of our growth strategy are:
Expand Our Customer Base
We intend to increase our market penetration by expanding our
automotive dealer and lender customer base through the efforts of our direct
sales force. While as of December 31, 2009 we had over 800 active lender
customers in the United States, we will focus on adding select regional banks,
credit unions, financing companies, and the captive financing affiliates of
automotive manufacturers to our network. We also intend to increase the number
of other service and information providers in our networks by adding, among
others, insurance and other aftermarket service providers. Additionally, we have
increased our installation capacity for our DMS business in order to expand our
customer base for that solution.
Sell Additional Products and Services to Our Existing Customers
We believe that a significant market opportunity exists for us to
sell additional products and services to our approximately 17,000 active dealer
customers that utilize our credit application processing product, and have
purchased one or more of our subscription-based products or services. Similarly,
the over 800 lenders that utilize our U.S. credit application processing network
represent a market opportunity for us to sell our electronic and digital
contracting solutions.
Expand Our Offerings
We expect to expand our suite of products and services to address
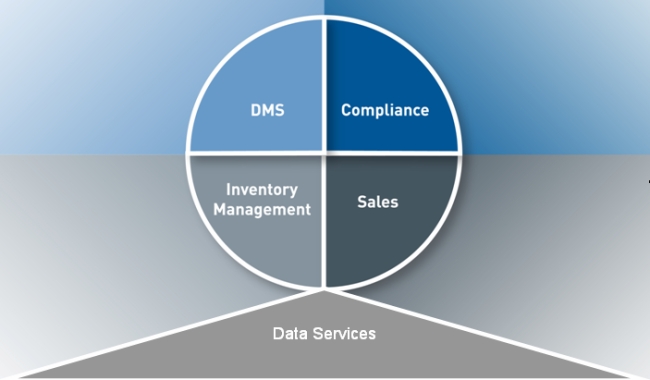
the evolving needs of our customers. We market our products as four integrated
solutions: DMS, Inventory Management, Sales and F&I, and Compliance. We have
identified a number of opportunities to leverage our network of relationships
and our core competencies to benefit dealers, lenders and other service and
information providers. For example, we expanded our DMS solution through the
integration of OEM dealer communication systems specifically for Audi, Hyundai,
and Kia, provided significant enhancements for Honda and General
Motors in the United States and introduced our DMS in Canada. We are committed
to being an open technology partner with our dealers and further integrating our
solutions with third parties to meet their needs. We also are continuing to add
reporting capability to our compliance solution and third-party integrations to
our inventory management solution.
Pursue Acquisitions and Strategic Alliances
We have augmented the growth of our business by completing
strategic acquisitions. In executing our acquisition strategy, we have focused
on identifying businesses that we believe will increase our market share or that
have products, services and technology that are complementary to our product and
service offerings. We believe that our success in completing these acquisitions
and integrating them into our business has allowed us to maintain our leadership
position in the industry, enhance our network of relationships and accelerate
our growth. We intend to continue to grow and advance our business through
acquisitions and strategic alliances. We believe that acquisitions and strategic
alliances will allow us to enhance our product and service offerings, sell new
products using our networks, strengthen technology offerings and/or increase our
market share.
5
Our
Solutions
DealerTrack
markets its dealer-facing solutions under the DealerTrack Performance Suite
umbrella brand. The solutions fit within four categories: DMS, Inventory, Sales
and F&I, and Compliance.
|
Solutions
|
Products
and Services
|
Subscription/Transaction
|
||
|
Dealer
Management System (DMS) Solution:
|
• DealerTrack
DMS
|
•
Subscription
|
||
|
Inventory
Management Solutions:
|
• DealerTrack AAX
®
|
•
Subscription
|
||
|
Sales
and F&I Solution:
|
• DealerTrack
credit application network (On-line credit
application processing platform and credit bureau access
platform)
|
•
Transaction
|
||
|
• SalesMaker
™
|
•
Subscription
|
|||
|
•
BookOut
|
•
Subscription
|
|||
|
• DealerTrack
eMenu™
|
•
Subscription
|
|||
|
• DealerTrack
Aftermarket Network™
|
•
Transaction
|
|||
|
• DealerTrack
eContracting ™
|
• Subscription and
Transaction
|
|||
|
• eDocs (for
lenders)
|
•
Transaction
|
|||
|
• DealTransfer
®
|
•
Subscription
|
|||
|
Compliance
Solution:
|
• DealerTrack
Compliance Solution™
|
•
Subscription
|
||
|
• DealerTrack
eMenu™
|
•
Subscription
|
Each of
our four integrated solutions are supported by our Data Services, which include
ALG Data Services, Chrome New Vehicle Data, Chrome VIN Match, Chrome Construct,
Automotive Description Services, Chrome IQ, Chrome BookLink, Chrome Carbook
Showroom ®, PC Carbook ®, Carbook Fleet Edition, Chrome Accessories Solution and
Chrome Interactive Media. We generally charge our customers a subscription fee
to use these products.
6
We generally charge dealers a monthly subscription fee for each of
our solutions. A transaction fee is generally charged to our lender customers
for each credit application that dealers submit to them and for each financing
contract executed via our electronic contracting and digital contract processing
solution, as well as for any portfolio residual value analyses we perform for
them. We charge a transaction fee to the dealer or credit report provider for
each fee-bearing credit report accessed by dealers. We charge transaction fees
to aftermarket providers for each aftermarket contract executed and delivered to
them from our network.
DMS Solution:
DealerTrack DMS —DealerTrack
DMS is a dealer management system that gives dealers control of their business
across every department. It is an open platform that allows dealers to integrate
and manage all the primary functions of their store operations including:
vehicle sales, portfolio management, showroom management, service department,
general ledger, automated dispatching, parts inventory and invoicing, electronic
repair order, service price guides, vehicle inventory, contact management,
payroll and personnel management.
Inventory Management Solution:
DealerTrack AAX ® —
DealerTrack AAX is a full-featured inventory system. Dealers can identify
high-profit, fast turning vehicles, quickly and easily adjust price to be more
competitive. The robust enterprise reporting is designed for multi-store
inventory optimization. Daily performance tracking is enabled by real time
reporting and custom built inventory modeling. Consulting services
optimize inventory management and enhance product performance. The solution also
includes functionality to help a dealer appraise vehicles, source vehicles and
access vehicle pricing recommendations, vehicle performance scores, as well as
dealership transactional history.
Sales and F&I Solution:
A dealer
can choose one or more of the sales and F&I solutions
subscriptions as listed below:
DealerTrack credit application
network — Our DealerTrack credit application network facilitates the
online credit application process by enabling dealers to transmit a consumer’s
credit application information to one or multiple lenders and obtain credit
decisions quickly and efficiently as well as pull credit bureau data. Generally,
our dealer customers maintain active relationships with numerous lenders. We
offer each lender customer the option to provide other value-added services to
dealers that facilitate the financing process, including dealer reserve
statements, payoff quotes, prospect reports for consumers nearing the end of
their current loan or lease and reports of current financing rates and
programs.
SalesMaker ™ —
SalesMaker is a profit management system enabling dealers to search the hundreds
of current lender programs in our database, and, within seconds, find the
financing or lease program that is best for a consumer and the most profitable
for the dealership. SalesMaker also assists dealers in finding financing for
consumers with low credit scores, while maximizing their own profit. In
addition, dealers can quickly pre-qualify prospective consumers and then match
the best lender program against their available inventory. SalesMaker represents
the integration and enhancement of our previous DeskLink and FinanceWizard
products.
BookOut — With BookOut, a
dealer can quickly and easily look up used automobile values by year/make/model
or vehicle identification number for use in the credit application process. We
currently offer separate BookOut subscriptions for data provided by Black Book,
Kelley Blue Book and NADA. These products facilitate the financing process by
providing dealers with reliable valuation information about the relevant
automobile. BookOut is also a product offering in the inventory management
solution.
DealerTrack eMenu ™ —
DealerTrack eMenu allows dealers to consistently present consumers with the full
array of insurance and other aftermarket product options they offer in a menu
format. The product also creates an auditable record of the disclosures to
consumers during the aftermarket sales process, helping to reduce dealers’
potential legal risks. DealerTrack eMenu is also a product offering in the
compliance solution.
DealerTrack Aftermarket
Network ™ — The DealerTrack Aftermarket Network provides real-time
aftermarket contract rating and quote generation from participating providers of
aftermarket products. Categories of aftermarket products represented on the
network include extended service contracts, GAP, etch, credit life and
disability insurance, and vehicle recovery systems. Since the DealerTrack
Aftermarket Network is fully integrated into the DealerTrack network, we expect
both dealers and aftermarket providers will benefit from improved accuracy and
elimination of duplicate data entry.
DealerTrack eContracting and
eDocs — Our DealerTrack eContracting product allows dealers to obtain
electronic signatures and transmit contracts and contract information
electronically to lenders that participate in eContracting. eContracting
increases the speed of the automotive financing process by replacing the
cumbersome paper contracting process with an efficient electronic process. Our
eDocs digital contract processing service receives paper-based contracts from
dealers, digitizes the contracts and submits them electronically to the
appropriate lender. Together, eDocs and eContracting enable lenders to create a
100% digital contract workflow.
DealTransfer® —
DealTransfer permits dealers to transfer transaction information directly
between select dealer management systems and our DealerTrack credit application
network with just a few mouse clicks. This allows dealers to avoid reentering
transaction information once the information is on any of the dealer’s
systems.
Compliance Solution:
DealerTrack Compliance
Solution ™ — DealerTrack compliance solution provides automotive dealers
with a safe and reliable method to sign, store and protect customer and
financing activity at the dealership. It also provides safeguards, such as
limited access to sensitive information based on a user’s role and permission,
to help reduce compliance risk by handling every customer financing deal
consistently.
7
DealerTrack eMenu ™ —
DealerTrack eMenu allows dealers to consistently present consumers with the full
array of insurance and other aftermarket product options they offer in a menu
format. The product also creates an auditable record of the disclosures to
consumers during the aftermarket sales process, helping to reduce dealers’
potential legal risks.
Data Services:
ALG Residual Value Guides —
ALG Residual Value Guides are the industry standard for the residual value
forecasting of vehicles. New car residual values are available in a national
percentage guide, as well as regional dollar guides. Lenders and dealers use ALG
Residual Value Guides as the basis to create leasing programs for new and used
automotive leases.
ALG Data Services — ALG is
the primary provider of vehicle residual value data to automotive industry
participants, including manufacturers, banks and other lenders, desking software
companies and automotive websites.
Chrome New Vehicle Data —
Chrome New Vehicle Data identifies automobile prices, as well as the standard
and optional equipment available on particular automobiles. Dealers provide
Chrome’s data on their websites and lenders use the data in making financing
decisions.
Chrome VINMatch — Chrome
VINMatch converts a nondescript VIN, or Vehicle Identification Number, into a
rich description of a vehicle. Chrome’s vehicle descriptions allow dealers
to get an accurate vehicle description and drill down to not only the year,
make, and model, but unearthing engine type, fuel system, and even GVWR
(Gross Vehicle Weight Ranges).
Chrome Construct — Chrome
Construct combines vehicle research, configuration and comparison tools into a
single web service. The data is provided and maintained by Chrome.
Chrome Automotive Description
Service (ADS) and ChromeIQ — Chrome ADS is a web service that turns a VIN
into a rich description of a vehicle, including prices, options, colors and
standard equipment. Chrome IQ converts batches of VINs into rich vehicle
descriptions.
Chrome BookLink— Chrome
BookLink allows customers to quickly and easily map between Chrome's New Vehicle
Data and a used book provider without having to implement, host, or update
mapping tables.
Chrome Carbook Showroom ®, PC Carbook ® and Carbook Fleet Edition —
Carbook Showroom, PC Carbook and Carbook Fleet Edition provide automotive
specification and pricing information. These products enable dealers, fleet
managers, financial institutions and consumers to specify and price a new and
used automobile online, which helps promote standardized information among these
parties and facilitates the initial contact between buyer and
seller.
Chrome Interactive Media —
Chrome Interactive Media includes vehicle still photographs and full motion
vehicle video for use on dealer and auto industry portal websites. The products
are used to present an accurate, high-impact view of vehicles to facilitate
sales.
Chrome Accessories Solution —
Chrome Accessories Solution provides OEMs with a complete digital marketing
and accessories sales system for their dealer network and websites. This
includes a catalog of accessories with eCommerce capabilities for dealer
websites and an in-showroom sales and fulfillment system.
International
Our subsidiary, DealerTrack Canada Inc., is a leading provider of
on-demand credit application and contract processing services to the indirect
automotive finance industry in Canada. Historically, we have provided our
Canadian customers with only our credit application and contract processing
products. In 2007, we began offering them select subscription products. For the
year ended December 31, 2009, 2008 and 2007, our Canadian operations
generated approximately 11%, 11% and 10% of our net revenue,
respectively.
Technology
Our technology platform is robust, flexible and extendable and is
designed to be integrated with a variety of other technology platforms. We
believe our open architecture is fully scalable and designed for high
availability, reliability and security. Product development expense for the
years ended December 31, 2009, 2008, and 2007 was $14.0 million,
$11.7 million and $9.8 million, respectively. Our technology includes
the following primary components:
Web-Based Interface
Our customers access our on-demand application products and
services through an easy-to-use web-based interface. Our web-based delivery
method gives us control over our applications and permits us to make
modifications at a single central location. We can easily add new functionality
and deliver new products to our customers by centrally updating our software on
a regular basis.
8
Partner Integration
We believe that our on-demand model is a uniquely suited method of
delivering our products and services to our customers. Our customers can access
our highly specialized applications on-demand, avoiding the expense and
difficulty of installing and maintaining them independently. Our lender
integration and partner integration use XML encoded messages. We are a member of
both Standards for Technology in Automotive Retail (STAR) and American
Financial Services Association (AFSA) and are committed to supporting
published standards as they evolve.
Infrastructure
Our technology infrastructure is hosted externally and consists of
production sites and a disaster recovery site. The production site for the
DealerTrack network and the DealerTrack DMS network are fully hardware
redundant. Our customers depend on the availability and reliability of our
products and services and we employ system redundancy in order to minimize
system downtime.
Security
We maintain high security standards with a layered firewall
environment and employ an intrusion detection system. Our firewalls and
intrusion detection system are both managed and monitored continuously by an
independent security management company. Our communications are secured using
secure socket layer 128-bit encryption. We also utilize a commercial software
solution to securely manage user access to our applications. All incoming
traffic must be authenticated before it is authorized to be passed on to the
application. Once a user has been authorized, access control to specific
functions within the site is performed by the application. Our access control
system is highly granular and includes the granting and revocation of user
permissions to functions on the site.
We maintain a certification from Verizon Cybertrust Security, a
leading industry security certification body, for the DealerTrack network. This
certification program entails a comprehensive evaluation of our security
program, including extensive testing of our website’s perimeter defenses. As a
result of this process, recommendations are made and implemented. The
certification program requires continual monitoring and adherence to critical
security policies and practices.
Customer
Development and Retention
Sales
Our sales resources are focused on four primary areas: dealers,
lenders, aftermarket providers, and other industry providers. Our sales
resources strive to increase the number of products and services purchased or
used by existing customers and also to sell products and services to new
customers. Our dealer sales resources focus on selling our subscription-based
products and services to dealers through field sales and telesales efforts, and
also support the implementation of subscription-based and transaction-based
products for dealers. Lender relationships are managed by a team that also
focuses on adding more lenders to our DealerTrack credit application network and
increasing the use of our eContracting and eDocs solutions. Relationships with
our aftermarket providers are managed by a team that also focuses on adding more
aftermarket providers to the network. Relationships with other providers
(including automotive manufacturers) are managed across various areas of our
organization.
Training
We believe that training is important to enhancing the DealerTrack
brand and reputation and increasing utilization of our products and services.
Training is conducted via telephone, the Internet and in person at the
dealership. In training our dealers, we emphasize utilizing our network to help
them increase profitability and efficiencies.
Marketing
Our marketing strategy is to establish our brand as the leading
provider of on-demand software solutions for dealers, lenders, OEM’s,
aftermarket providers and other industry providers. Our marketing approach is to
employ multiple off-line and on-line channels, targeted at key executives and
other decision makers within the automotive retail industry, such
as:
|
|
•
|
advertising in automotive trade
magazines and other
periodicals;
|
|
|
•
|
public relations through press
releases and publication of news and thought leadership
articles;
|
|
|
•
|
direct marketing employing mail
and e-mail delivered to buyers and influencers in dealer and lender
markets;
|
|
|
•
|
participation in industry
events;
|
|
|
•
|
employing our website to offer
services, and provide product and company
information;
|
|
|
•
|
search marketing to increase
visibility in search engine result pages;
and
|
|
|
•
|
promotions and sponsorships on
national and regional
levels.
|
9
Customer
Service
We believe superior customer support is important to retaining and
expanding our customer base. We have a comprehensive technical support program
to assist our customers in maximizing the value they get from our products and
services and solving any problems or issues. We provide telephone support,
e-mail support and online information and consulting services about our products
and services. Our customer service group handles general customer inquiries,
such as questions about resetting passwords, how to subscribe to products and
services, the status of product subscriptions and how to use our products and
services, and is available to customers by telephone, e-mail or over the web.
Our technical support specialists are extensively trained in the use of our
products and services.
Customers
Our primary customers are dealers and lenders. Our network of
lenders includes national and regional prime, near prime and non-prime lenders;
regional and local banks, captive lenders and credit unions. As of
December 31, 2009, we had approximately 17,000 active dealers and over 800
lenders active in our network. The subscription agreements with our dealers
typically run for one to three years, with one-year automatic extensions, except
for our U.S. DMS agreements, which have more flexible terms. Our initial
agreements with our lender customers typically run for two years, with one-year
automatic extensions. No customer represented more than 10% of our revenue for
the year ended December 31, 2009.
Competition
The market for our solutions in the U.S. automotive retail industry
is highly competitive, fragmented and subject to changing technology, shifting
customer needs and frequent introductions of new products and services. Our
current principal competitors include:
|
•
|
web-based automotive finance
credit application processors, including AppOne, CUDL, Finance Express,
Open Dealer Exchange, and
RouteOne;
|
|
•
|
proprietary finance credit
application processing systems, including those used and provided to
dealers by American Honda Finance Corp., Volkswagen Credit and BMW
Financial Services;
|
|
•
|
dealer management system
providers, including ADP, Inc. and The Reynolds and Reynolds
Company;
|
|
•
|
automotive retail sales desking
providers, including ADP, Inc. and Market Scan Information Systems,
Inc.;
|
|
•
|
vehicle configuration providers,
including Autodata Solutions Company, R.L. Polk & Co. and JATO
Dynamics, Inc.;
|
|
•
|
providers of services related to
aftermarket products, including MenuVantage and the StoneEagle
Group;
|
|
•
|
providers of inventory analytic
tools, including First Look, LLC and vAuto, Inc.,
and;
|
|
•
|
providers
of compliance solutions; including Compli and the three credit reporting
agencies.
|
DealerTrack
also competes with warranty and insurance providers, as well as software
providers, among others, in the market for menu-selling products and services.
Some of our competitors may be able to devote greater resources to the
development, promotion and sale of their products and services than we can to
ours, which could allow them to respond more quickly than we can to new
technologies and changes in customer needs. In particular, RouteOne, a joint
venture formed and controlled by Chrysler Financial Corporation (CFC), Ford
Motor Credit Corporation (FMCC), General Motors Acceptance Corporation (GMAC)
and Toyota Financial Services (TFS). RouteOne has relationships with CFC, FMCC
and TFS and other affiliated captive lenders that are not part of our network
and had an exclusive relationship with GMAC until February 10, 2010, when we
entered into a strategic relationship with GMAC. Under the terms of the
agreement, GMAC will be listed as a financing option on the DealerTrack credit
application processing network. GMAC will be available to General Motors and
Chrysler dealers, as well as dealers of other manufacturers that GMAC elects to
do business with. GMAC will continue to accept credit applications through
the RouteOne system. Additionally, on January 21, 2009, ADP, Inc. and Reynolds,
announced a joint venture, Open Dealer Exchange, who may have the ability to
build on its joint venture partner’s relationships in providing DMS software to
over 80% of U.S. franchised dealers. Our ability to remain competitive will
depend to a great extent upon our ability to execute our growth strategy, as
well as our ongoing performance in the areas of product development and customer
support.
10
Government
Regulation
The indirect automotive financing and automotive retail industries
are subject to extensive and complex federal and state regulations. Our
customers, such as banks, finance companies, savings associations, credit unions
and other lenders, and automotive dealers, operate in markets that are subject
to rigorous regulatory oversight and supervision. Our customers must ensure that
our products and services work within the extensive and evolving regulatory
requirements applicable to them, including those under the Consumer Credit
Protection Act, the Gramm-Leach-Bliley Act (the “GLB Act”), the FACT Act of
2003, the Federal Reserve Board’s regulations relating to consumer protection
and privacy, the Interagency Guidelines Establishing Information Security
Standards, the Interagency Guidance on Response Programs for Unauthorized Access
to Customer Information and Customer Notice, the Federal Trade Commission’s
(“FTC”) Privacy Rule, Safeguards Rule, and Consumer Report Information Disposal
Rule, Regulation AB, the regulations of the Federal Reserve Board, the Fair
Credit Reporting Act (“FCRA”) and other state and local laws and regulations. In
addition, entities such as the Federal Deposit Insurance Corporation, the Office
of the Comptroller of the Currency, the Office of Thrift Supervision, the
National Credit Union Administration and the FTC have the authority to
promulgate rules and regulations that may impact our customers, which could
place additional demands on us.
The role of our products and services in assisting our customers’
compliance with these requirements depends on a variety of factors, including
the particular functionality, interactive design, and classification of the
customer. We are not a party to the actual transactions that occur in our
network. Our lender, aftermarket provider and automotive dealer customers must
assess and determine what applicable laws and regulations require of them and
are responsible for ensuring that their use of our product and services conform
to their regulatory needs.
Consumer Privacy and Data Security Laws
Consumer privacy and data security laws on the federal and state
levels govern the privacy and security of consumer information generally and may
apply to our business in our capacity as a service provider for regulated
financial institutions and automotive dealers that are subject to the GLB Act
and applicable regulations, including the FTC’s Privacy Rule, Safeguards Rule
and Consumer Report Information Disposal Rule.
These laws and regulations restrict our customers’ ability to share
nonpublic personal consumer information with non-affiliated companies, as well
as with affiliates under certain circumstances. They also require certain
standards for information security plans and operations, including standards for
consumer information protection and disposal, and notices to consumers in the
event of certain security breaches. If we, a lender, an aftermarket provider or
a dealer experience a security breach resulting in unauthorized access to
consumer information provided through our network, we may be subject to claims
from such consumers or enforcement actions by state or federal regulatory
authorities.
Legislation is pending on the federal level and in most states that
could impose additional duties on us relating to the collection, use or
disclosure of consumer information, as well as obligations to secure that
information. Currently, 46 states have laws mandating notices to affected
consumers in the event of an actual or suspected unauthorized access to or use
of information contained within our system. In December 2009, the U.S. House of
Representatives passed a bill that would provide for a uniform national notice
policy for security breaches. The FTC and federal banking regulators have also
issued regulations requiring regulated financial institutions to obtain certain
assurances and contractual protections relating to the security and disposal of
information maintained by service providers such as us.
While we believe our current business model is consistent with
existing laws and regulations, emerging case law and regulatory enforcement
initiatives, as well as the passage of new laws and regulations, may limit our
ability to use information to develop additional revenue streams in the
future.
Fair Credit Reporting Act
The FCRA imposes limitations on the collection, distribution and
use of consumer report information and imposes various requirements on providers
and users of consumer reports and any information contained in such reports.
Among other things, the FCRA limits the use and transfer of information that
qualifies as a consumer report, and imposes requirements on providers of
information to credit reporting agencies and resellers of consumer reports with
respect to ensuring the accuracy and completeness of the information and
assisting consumers who dispute information in their consumer reports or seek to
obtain information involving theft of their identity. The communication or use
of consumer report information in violation of the FCRA could, among other
things, result in a provider of information or reseller of consumer reports
being deemed a consumer reporting agency, which would subject the provider or
reseller to all of the compliance requirements applicable to consumer reporting
agencies contained in the FCRA and applicable regulations. Willful violations of
the FCRA can result in statutory and punitive damages. A new regulation
requiring creditors to give risk-based pricing notices to certain consumers
whose credit score precluded them from getting the best terms for credit will
take effect on January 1, 2011.
State Laws and Regulations
The GLB Act and the FCRA contain provisions that preempt some state
laws to the extent the state laws seek to regulate the distribution and use of
consumer information. The GLB Act does not limit states’ rights to enact privacy
legislation that provides greater protections to consumers than those provided
by the GLB Act. The FCRA generally prohibits states from imposing any
requirements with respect only to certain specified matters and it is possible
that some state legislatures or agencies may limit the ability of businesses to
disclose consumer information beyond the limitations provided for in the GLB Act
or the FCRA. For example, almost all states permit consumers to “freeze” their
credit bureau files under certain circumstances and the three national credit
bureaus (Equifax, Experian and TransUnion) now give this right to all customers.
Our automotive dealer customers remain subject to the laws of their respective
states in such matters as consumer protection and unfair and deceptive trade
practices. Recently, certain states have passed laws requiring specific security
protections for maintaining or transmitting the personal information of state
residents.
11
Revised Uniform Commercial Code Section 9-105, E-SIGN and UETA
In the United States, the enforceability of electronic transactions
is primarily governed by the Electronic Signatures in Global and National
Commerce Act, a federal law enacted in 2000 that largely preempts inconsistent
state law, and the Uniform Electronic Transactions Act, a uniform state law that
was finalized by the National Conference of Commissioners on Uniform State Laws
in 1999 and has been adopted by almost every state. Case law has generally
upheld the use of electronic signatures in commercial transactions and in
consumer transactions where proper notice is provided and the consumer consents
to transact business electronically are obtained. The Revised Uniform Commercial
Code Section 9-105 (“UCC 9-105”) provides requirements to perfect security
interests in electronic chattel paper. These laws impact the degree to which the
lenders in our network use our electronic contracting (eContracting) product. We
believe that our eContracting product enables the perfection of a security
interest in electronic chattel paper by meeting the transfer of “control”
requirements of UCC 9-105. Certain of our financial institution clients have
received third-party legal opinions to this effect. However, this issue has not
been challenged in any legal proceeding. If a court were to find that our
eContracting product is not sufficient to perfect a security interest in
electronic chattel paper, or if existing laws were to change, our business,
prospects, financial condition and results of operations could be materially
adversely affected. Federal and state regulatory requirements imposed on our
lender customers, such as the SEC’s Regulation AB relating to servicers of
asset backed securities, may also result in our incurring additional expenses to
facilitate lender compliance regarding the use of our eContracting
product.
Internet Regulation
We are subject to federal, state and local laws applicable to
companies conducting business on the Internet. Today, there are relatively few
laws specifically directed towards online services. However, due to the
increasing popularity and use of the Internet and online services, laws and
regulations may be adopted with respect to the Internet or online services
covering issues such as online contracts, user privacy, freedom of expression,
pricing, fraud liability, content and quality of products and services,
taxation, advertising, intellectual property rights and information security.
Proposals currently under consideration with respect to Internet regulation by
federal, state, local and foreign governmental organizations include, but are
not limited to, the following matters: on-line content, user privacy,
restrictions on email and wireless device communications, data security
requirements, taxation, access charges and so-called “net neutrality”, liability
for third-party activities such as unauthorized database access, and
jurisdiction. Moreover, we do not know how existing laws relating to these
issues will be applied to the Internet and whether federal preemption of state
laws will apply.
Intellectual
Property
Our success depends, in large part, on our intellectual property
and other proprietary rights. We rely on a combination of patent, copyright,
trademark and trade secret laws, employee and third-party non-disclosure
agreements and other methods to protect our intellectual property and other
proprietary rights. In addition, we license technology from third
parties.
We have been issued a number of utility patents in the United
States and have patent applications pending in the United States, Canada and
Europe, including patents that relate to a system and method for credit
application processing and routing. We have both registered and unregistered
copyrights on aspects of our technology. We have a U.S. federal registration for
the mark “DealerTrack.” We also have U.S. federal registrations and pending
registrations for several additional marks we use and claim common law rights in
other marks we use. We also have filed some of these marks in foreign
jurisdictions. The duration of our various trademark registrations varies by
mark and jurisdiction of registration. In addition, we rely, in some
circumstances, on trade secrets law to protect our technology, in part by
requiring confidentiality agreements from our vendors, corporate partners,
employees, consultants, advisors and others.
Industry
Trends
We are
impacted by trends in both the automotive industry and the credit finance
markets. Our financial results are impacted by trends in the number
of dealers serviced and the level of indirect financing and leasing by our
participating lender customers, special promotions by automobile manufacturers
and the level of indirect financing and leasing by captive finance companies not
available in our network. The United States and global economies are currently
undergoing a period of economic uncertainty, and the financing environment,
automobile industry and stock markets are experiencing high levels of
volatility. The tightening of the credit markets has caused a significant
decline in the number of lending relationships between the various lenders and
dealers available through our network as dealers and financing sources have
exited the market, as well as reduced the total number of vehicles financed.
Purchases of new automobiles are typically discretionary for consumers and have
been, and may continue to be, affected by negative trends in the economy,
including the cost of energy and gasoline, the availability and cost of credit,
the declining residential and commercial real estate markets, reductions in
business and consumer confidence, stock market volatility and increased
unemployment. 2008 and 2009 have been the worst years for selling vehicles since
1982 and while automobile sales are expected to increase in 2010, they will
remain low as compared to historical levels. As a result of reduced car sales
and the general economic environment, two major automobile manufacturers,
Chrysler and General Motors have filed and emerged from bankruptcy in the past
year. This has had a significant impact on their franchised dealers both in
terms of dealer closing and the financial viability of their remaining dealers.
Toyota has suffered significant recalls that have limited its ability to sell
new vehicles for a period of time and potentially decreased the value of Toyota
used vehicles, whose impact on its dealer base remains to be seen. Additionally,
the impact of the
federal government’s Cash for Clunkers program, which occurred during the third
quarter of 2009, continued to be felt by us during the fourth quarter with
respect to both new and used car sales. The approximately 700,000 in
auto sales from the program resulted in a slight pull forward of new car
demand from the fourth quarter into the third quarter and a sharp decline in
used car sales during the fourth quarter due in large part to the fact that cars
traded in for the Cash for Clunkers program had to be destroyed, not resold, and
therefore supply of used cars was reduced. In addition, the supply of used
cars was negatively affected as some dealers faced cash flow issues due to the
difficulty in collecting the $3 billion in Cash for Clunker
program reimbursements from the government in a timely fashion, and were
therefore unable to buy as many used cars at auction. Together, these
factors have meaningfully impacted our transaction volume and subscription
cancellations compared to historical levels. We expect to continue to experience
challenges due to the ongoing adverse outlook for the credit markets and
automobile sales. In addition, volatility in our stock price and declines in our
market capitalization could impair the carrying value of our goodwill and other
long-lived assets. As a result, we may be required to write-off some of our
goodwill or long-lived assets if these conditions worsen for a period of
time.
12
Due to
the economic downturn, there has been continued automotive dealer consolidation
and the number of franchised automotive dealers declined in 2008 and further
declined in 2009. General Motors (GM), which filed for bankruptcy on June 1,
2009, has stated that it notified approximately 1,124 dealers prior to their
bankruptcy filing that one or more of their franchise licenses would be
terminated by October 2010 and there are industry reports that approximately an
additional 450 dealers may be terminated. In addition, GM announced on September
30, 2009 that it would shut down its Saturn division by next year after efforts
to sell the brand failed. There are approximately 350 Saturn dealerships in the
United States. Chrysler, which filed for bankruptcy on May 1, 2009, had
announced dealer reduction as a major aim, and 789 of its dealerships’ franchise
agreements were terminated on June 9, 2009. We cannot predict if the reduction
of GM’s and Chrysler franchises will be limited to the dealers that have
received notice to date. In addition, while Chrysler closures were made public,
GM has yet to publicly release the specific dealers impacted. While recent
federal legislation allowing for terminated GM and Chrysler dealers to seek
reinstatement may reduce the impact of the bankruptcies on the GM and Chrysler
franchised dealers on our business, it is unknown what, if any, effect such
legislation will have. As a result of these factors, we cannot predict the
timing and impact these dealership reductions will have on our subscription
products. As of December 31, 2009, approximately 1,522 Chrysler dealers and
2,905 GM dealers, which include 181 Saturn dealers, had subscriptions for one or
more of our products. The elimination by GM and Chrysler of dealers with
subscription products has led to an increase in cancellations and will most
likely result in additional cancellations of those subscriptions and
corresponding loss of revenue. Further, a reduction in the number of automotive
dealers reduces the number of opportunities we have to sell our subscription
products. Additionally, dealers who close their businesses may not pay the
amounts owed to us, resulting in an increase in our bad debt
expense.
Employees
As of December 31, 2009, we had approximately 1,200 employees.
None of our employees is represented by a labor union. We have not experienced
any work stoppages and believe that our relations with our employees are
good.
Item 1A. Risk
Factors
You should
carefully consider the following risk factors, as well as the more detailed
descriptions of our business elsewhere in this Annual Report on Form 10-K . The risks described below are not
the only ones we face. Additional risks not presently known to us or that we
currently deem immaterial may also materially adversely affect our business,
prospects, financial condition or results of operations. Our business,
prospects, financial condition or results of operations could be materially and
adversely affected by the following:
Economic trends that affect the automotive retail industry or the indirect
automotive financing industry may have a negative effect on our
business.
Economic trends that negatively affect the automotive retail
industry or the indirect automotive financing industry may adversely affect our
business by further reducing the amount of indirect automobile financing
transactions that we earn revenue on, the number of lender or automotive dealer
customers that subscribe to our products and services or money that our
customers spend on our products and services. Purchases of new automobiles are
typically discretionary for consumers and have been, and may continue to be,
affected by negative trends in the economy, including the cost of energy and
gasoline, the availability and cost of credit, the declining residential and
commercial real estate markets, reductions in business and consumer confidence,
stock market volatility and increased unemployment. A reduction in the number of
automobiles purchased by consumers could continue to adversely affect our lender
and dealer customers and lead to a reduction in transaction volumes and in
spending by these customers on our subscription products and services. New car
sales declined significantly in 2009 and are projected to only increase slightly
in 2010. Additionally, a certain number of our lender customers are
dependent on continued access to the capital markets, which have contracted as
of late, in order to fund their lending activities. These negative trends may
result in our lenders further reducing the number of automobile dealers that
they service or the number of contracts that they make which could result in a
reduction in the number of credit applications that are processed through our
network. Additionally, due to the economic downturn, there has been
continued automotive dealer consolidation and the number of franchised
automotive dealers declined in 2009 and is projected to further decline in 2010.
A bankruptcy filing by a major automobile manufacturer would further accelerate
this consolidation trend. To the extent that these dealers have subscription
products, the consolidation will result in cancellation of those products.
Further, a reduction in the number of automotive dealers reduces the number of
opportunities we have to sell our subscription products. Additionally, dealers
who close their businesses may choose to not pay those amounts owed to us,
resulting in an increase in our bad debt.
Any such
reductions in transactions or subscriptions or an increase in our bad debt could
have a material adverse effect on our business, prospects, financial condition
and results of operations.
13
We
may be unable to continue to compete effectively in our industry.
Competition in the automotive retail technology industry is
intense. The indirect automotive retail finance industry is highly fragmented
and is served by a variety of entities, including DMS providers, web-based
automotive finance credit application processors, the proprietary credit
application processing systems of the lender affiliates of automobile
manufacturers, automotive retail sales desking providers and vehicle
configuration providers. DealerTrack also competes with warranty and insurance
providers, as well as software providers, among others, in the market for DMS,
menu-selling products and services, compliance products and inventory analytics.
Some of our competitors have longer operating histories, greater name
recognition and significantly greater financial, technical, marketing and other
resources than we do. Many of these competitors also have longstanding
relationships with dealers and may offer dealers other products and services
that we do not provide. As a result, these companies may be able to respond more
quickly to new or emerging technologies and changes in customer demands or to
devote greater resources to the development, promotion and sale of their
products and services than we can to ours. We expect the market to continue to
attract new competitors and new technologies, possibly involving alternative
technologies that are more sophisticated and cost-effective than our technology.
There can be no assurance that we will be able to compete successfully against
current or future competitors or that competitive pressures we face will not
materially adversely affect our business, prospects, financial condition and
results of operations.
We
may face increased competition from AppOne, CUDL, Finance Express, Open Dealer
Exchange and RouteOne.
ADP, Inc. and Reynolds and Reynolds, the two largest providers of
DMS systems, have recently formed Open Dealer Exchange as a joint venture to
compete with our online portal application business. Open Dealer Exchange
plans to leverage its owners’ penetration of the DMS space to better integrate
the loan origination process into the dealer's transactional, point-of-sale
system, thereby giving them a competitive advantage. Additionally, our network
of lenders does not include the captive lenders affiliated with Chrysler LLC,
Ford Motor Company, General Motors Corporation or Toyota Motor Corporation,
which have formed RouteOne to operate as a direct competitor of ours to serve
their respective franchised dealers. RouteOne has the ability to offer its
dealers access to captive or other lenders that are not in our network. RouteOne
was launched in November 2003, and officially re-launched in
July 2004. A significant number of independent lenders, including many of
the independent lenders in our network, are participating on the RouteOne credit
application processing and routing portal. If either Open Dealer Exchange or
RouteOne increases the number of independent lenders on its credit application
processing and routing portal and/or offers products and services that better
address the needs of our customers or offer our customers a lower-cost
alternative, and/or our dealer customers faster portals, our business,
prospects, financial condition and results of operations could be materially
adversely affected. In addition, if a substantial amount of our current
customers migrate from our network to Open Dealer Exchange or RouteOne, our
ability to sell additional products and services to, or earn transaction
services revenue from, these customers could diminish. We believe that both Open
Dealer Exchange and RouteOne have repeatedly approached certain of our largest
lender customers seeking to have them join their credit application processing
and routing portal. In addition, CU Direct Corporation, through its CUDL portal,
has directly targeted credit unions, which comprise a large number of our lender
customers. Finance Express and AppOne have targeted the independent dealer
channel.
Some
vendors of software products used by automotive dealers, including certain of
our competitors, are designing their software and using financial or other
incentives to make it more difficult for our customers to use our products and
services.
Currently,
some software vendors, including some of our competitors, have designed their
software systems in order to make it difficult to integrate with third-party
products and services such as ours and others have announced their intention to
do so. Some software vendors also use financial or other incentives to encourage
their customers to purchase such vendors’ products and services. These obstacles
could make it more difficult for us to compete with these vendors and could have
a material adverse effect on our business, prospects, financial condition and
results of operations. Further, we have agreements in place with various
third-party software providers to facilitate integration between their software
and our network, and we cannot assure you that each of these agreements will
remain in place or that during the terms of these agreements these third parties
will not increase the cost or level of difficulty in maintaining integration
with their software. Certain of these agreements are currently in a wind-down
period and while we continue to negotiate with these providers, there is no
guarantee that we will be able to enter into a new agreement once the wind-down
period ends. Additionally, we integrate certain of our solutions and
services with other third parties’ software programs. These third parties may
design or utilize their software in a manner that makes it more difficult for us
to continue to integrate our solutions and services in the same manner, or at
all. These developments could have a material adverse effect on our business,
prospects, financial condition and results of operations.
14
Our
systems and network may be subject to security breaches, interruptions, failures
and/or other errors or may be harmed by other events beyond our
control.
Our
systems may be subject to security breaches.
Our success depends on the confidence of dealers, lenders,
the major credit reporting agencies and our other network participants in our
ability to transmit confidential information securely over the Internet and
operate our computer systems and operations without significant disruption or
failure. We transmit substantial amounts of confidential information, including
non-public personal information, over the Internet. Moreover, even if our
security measures are adequate, concerns over the security of transactions
conducted on the Internet and commercial online services, which may be
heightened by any well-publicized compromise of security, may deter customers
from using our products and services. If our security measures are breached and
unauthorized access is obtained to confidential information, our network may be
perceived as not being secure and our customers may curtail or stop using our
network or other systems. Any failure by, or lack of confidence in, our secure
online products and services could have a material adverse effect on our
business, prospects, financial condition and results of operations.
Despite our focus on Internet security, we may not be able to stop
unauthorized attempts to gain access to or disrupt the transmission of
communications among our network participants. Advances in computer
capabilities, new discoveries in the field of cryptography, or other events or
developments could result in a compromise or breach of the algorithms used by
our products and services to protect certain data contained in our databases and
the information being transferred.
Although we generally limit warranties and liabilities relating to
security in our customer contracts, third parties may seek to hold us liable for
any losses suffered as a result of unauthorized access to their confidential
information or non-public personal information. We may not have limited our
warranties and liabilities sufficiently or have adequate insurance to cover
these losses. We may be required to expend significant capital and other
resources to protect against security breaches or to alleviate the problems
caused. Our security measures may not be sufficient to prevent security
breaches, and failure to prevent security breaches could have a material adverse
effect on our business, prospects, financial condition and results of
operations.
Our
network may be vulnerable to interruptions or failures.
From time to time, we have experienced, and may experience in the
future, network slowdowns and interruptions. These network slowdowns and
interruptions may interfere with our ability to do business. Although we
regularly back up data and take other measures to protect against data loss and
system failures, there is still risk that we may lose critical data or
experience network failures. Such failures or disruptions may result in lost
revenue opportunities for our customers, which could result in litigation
against us or a loss of customers. This could have a material adverse effect on
our business, prospects, financial condition and results of
operations.
Undetected errors
in our software may harm our operations.
Our software may contain undetected errors, defects or bugs. Although we have
not suffered significant harm from any errors, defects or bugs to date, we may
discover significant errors, defects or bugs in the future that we may not be
able to correct or correct in a timely manner. Our products and services are
integrated with products and systems developed by third parties. Complex
third-party software programs may contain undetected errors, defects or bugs
when they are first introduced or as new versions are released. It is possible
that errors, defects or bugs will be found in our existing or future products
and services or third-party products upon which our products and services are
dependent, with the possible results of delays in, or loss of market acceptance
of, our products and services, diversion of our resources, injury to our
reputation, increased service and warranty expenses and payment of
damages.
Our
systems may be harmed by events beyond our control.
Our computer systems and operations are vulnerable to damage or
interruption from natural disasters, such as fires, floods and hurricanes, power
outages, telecommunications failures, terrorist attacks, network service outages
and disruptions, “denial of service” attacks, computer viruses, break-ins,
sabotage and other similar events beyond our control. The occurrence of a
natural disaster or unanticipated problems at our facilities in the New York
metropolitan area or at any third-party facility we utilize, such as our
disaster recovery center in Waltham, Massachusetts, could cause interruptions or
delays in our business, loss of data or could render us unable to provide our
products and services. In addition, the failure of a third-party facility to
provide the data communications capacity required by us, as a result of human
error, bankruptcy, natural disaster or other operational disruption, could cause
interruptions to our computer systems and operations. The occurrence of any or
all of these events could have a material adverse effect on our business,
prospects, financial condition and results of operations.
Our
failure or inability to execute any element of our business strategy could
adversely affect our operations.
Our business, prospects, financial condition and results of operations depend on
our ability to execute our business strategy, which includes the following key
elements:
|
|
•
|
expanding
our customer base;
|
|
|
•
|
selling additional products and
services to our existing
customers;
|
|
|
•
|
expanding our offerings;
and
|
15
|
•
|
pursuing acquisitions and
strategic alliances.
|
We may not succeed in implementing a portion or all of our business
strategy and, even if we do succeed, our strategy may not have the favorable
impact on operations that we anticipate. Our success depends on our ability to
leverage our distribution channel and value proposition for dealers, lenders and
other service and information providers, offer a broad array of solutions,
provide convenient, high-quality products and services, maintain our
technological position and implement other elements of our business
strategy.
We may not be able to effectively manage the expansion of our
operations or achieve the rapid execution necessary to fully avail ourselves of
the market opportunity for our products and services. If we are unable to
adequately implement our business strategy, our business, prospects, financial
condition and results of operations could be materially adversely
affected.
Our revenue, operating results and profitability will vary from quarter to
quarter, which may result in volatility in our stock price.
Our revenue, operating results and profitability have varied in the
past and are likely to continue to vary significantly from quarter to quarter.
This may lead to volatility in our stock price. These variations are due to
several factors related to the number of transactions we process and to the
number of subscriptions to our products and services, including:
|
|
•
|
the
volume of new and used automobiles financed or leased by our participating
lender customers;
|
|
|
•
|
the
timing, size and nature of our subscriptions and any cancellations
thereof;
|
|
|
•
|
automobile manufacturers or their
captive lenders offering special incentive programs such as discount
pricing or low cost
financing;
|
|
|
•
|
the timing of acquisitions or
divestitures of businesses, products and
services;
|
|
|
•
|
unpredictable sales
cycles;
|
|
|
•
|
product and price competition
regarding our products and services and those of our participating
lenders;
|
|
|
•
|
changes in our operating
expenses;
|
|
|
•
|
the
seasonality of car sales;
|
|
|
•
|
the timing of introduction and
market acceptance of new products, services or product enhancements by us
or our competitors;
|
|
|
•
|
foreign currency
fluctuations;
|
|
|
•
|
personnel changes;
and
|
|
|
•
|
fluctuations
in economic and financial market
conditions.
|
As a result of these fluctuations, we believe that period-to-period
comparisons of our results of operations are not necessarily meaningful. We
cannot assure you that future revenue and results of operations will not vary
substantially from quarter to quarter. It is also possible that in future
quarters, our results of operations will be below the expectations of equity
research analysts, investors or our announced guidance. In any of these cases,
the price of our stock could be materially adversely affected.
We
may be unable to develop and bring products and services in development and new
products and services to market in a timely manner.
Our
success depends in part upon our ability to bring to market the products and
services that we have in development and offer new products and services that
meet changing customer needs. The time, expense and effort associated with
developing and offering these new products and services may be greater than
anticipated. The length of the development cycle varies depending on the nature
and complexity of the product, the availability of development, product
management and other internal resources, and the role, if any, of strategic
partners. If we are unable to develop and bring additional products and services
to market in a timely manner, we could lose market share to competitors who are
able to offer these additional products and services, which could also
materially adversely affect our business, prospects, financial condition and
results of operations.
16
We
are subject, directly and indirectly, to extensive and complex federal and state
regulation and new regulations and/or changes to existing regulations may
adversely affect our business.
The indirect automotive financing
and automotive retail industries are subject to extensive and complex federal
and state regulation.
We are directly and indirectly subject to various laws and
regulations. Federal laws and regulations governing privacy and security of
consumer information generally apply in the context of our business to our
clients and to us as a service provider that certain regulations obligate our
clients to monitor. These include the Gramm-Leach-Bliley Act (“GLB Act”) and
regulations implementing its information safeguarding requirements, the
Interagency Guidelines Establishing Information Security Standards, the
Interagency Guidance on Response Programs for Unauthorized Access to Customer
Information and Customer Notice, the Junk Fax Prevention Act of 2005, the
CAN-SPAM Act of 2003, and the Federal Trade Commission’s Privacy Rule,
Safeguards Rule, Consumer Report Information Disposal Rule, and “Red Flags
Rule,” as well as the Fair Credit Reporting Act (“FCRA”). If we, or a lender or
dealer discloses or uses consumer information provided through our system in
violation of these or other laws, or engage in other prohibited conduct, we may
be subject to claims or enforcement actions by state or federal regulators. We
cannot predict whether such claims or enforcement actions will arise or the
extent to which, if at all, we may be held liable. Such claims or enforcement
actions could have a material adverse effect on our business prospects,
financial condition and results of operations.
A
majority of states have passed, or are currently contemplating, consumer
protection, privacy, and data security laws or regulations that may relate to
our business. The FCRA contains certain provisions that explicitly preempt some
state laws to the extent the state laws seek to regulate certain specified
areas, including the responsibilities of persons furnishing information to
consumer reporting agencies. Unlike the FCRA, however, the GLB Act does not
limit the ability of the states to enact privacy legislation that provides
greater protections to consumers than those provided by the GLB Act. Some state
legislatures or regulatory agencies have imposed, and others may impose, greater
restrictions on the disclosure of consumer information than are already
contained in the GLB Act and its implementing regulations, the Interagency
Guidelines or the FTC’s rules. Any such legislation or regulation could
adversely impact our ability to provide our customers with the products and
services they require and that are necessary to make our products and services
attractive to them.
In 2009,
the Obama Administration supported the establishment of a federal Consumer
Financial Protection Agency (“CFPA”) as part of its financial regulatory reform
package. As proposed, the CFPA could have jurisdictional authority over
the Company as a service provider for regulated financial institutions. At
present, the CFPA has been passed by the U.S. House of Representatives but not
the U.S. Senate.
If a
federal or state government or agency imposes additional legislative and/or
regulatory requirements on us or our customers, or prohibits or limits our
activities as currently conducted, we may be required to modify or terminate our
products and services in that jurisdiction in a manner which could undermine our
attractiveness or availability to dealers and/or lenders doing business in that
jurisdiction.
The
use of our electronic contracting product by lenders is governed by relatively
new laws.
In the United States, the enforceability of electronic transactions
is primarily governed by the Electronic Signatures in Global and National
Commerce Act, a federal law enacted in 2000 that largely preempts inconsistent
state law, and the Uniform Electronic Transactions Act, a uniform state law that
was finalized by the National Conference of Commissioners on Uniform State Laws
in 1999 and has now been adopted by every state. Case law has generally upheld
the use of electronic signatures in commercial transactions and in consumer
transactions where proper notice is provided and consumer consent to conducting
business electronically is obtained. UCC 9-105 provides requirements to perfect
security interests in electronic chattel paper. These laws impact the degree to
which the lenders in our network use our electronic contracting product. We
believe that our electronic contracting product enables the perfection of a
security interest in electronic chattel paper by meeting the transfer of
“control” requirements of UCC 9-105. Certain of our financial institution
clients have received third-party legal opinions to that effect. However, this
issue has not been challenged in any legal proceeding. If a court were to find
that our electronic contracting product is not sufficient to perfect a security
interest in electronic chattel paper, or if existing laws were to change, our
business, prospects, financial condition and results of operations could be
materially adversely affected. Federal and state regulatory requirements imposed
on our lender customers, such as the SEC’s Regulation AB relating to
servicers of asset backed securities, may also result in our incurring
additional expenses to facilitate lender compliance regarding the use of our
electronic contracting product.
New
legislation or changes in existing legislation may adversely affect our
business.
Our ability to conduct, and our cost of conducting, business may be
adversely affected by a number of legislative and regulatory proposals
concerning aspects of the Internet, which are currently under consideration by
federal, state, local and foreign governments and various courts. These
proposals include, but are not limited to, the following matters: on-line
content, user privacy, taxation, access charges, and so-called “net-neutrality”
liability of third-party activities and jurisdiction. Moreover, we do not know
how existing laws relating to these or other issues will be applied to the
Internet. The adoption of new laws or the application of existing laws could
decrease the growth in the use of the Internet, which could in turn decrease the
demand for our products and services, increase our cost of doing business or
otherwise have a material adverse effect on our business, prospects, financial
condition and results of operations. Furthermore, government restrictions on
Internet content or anti-“net neutrality” legislation could slow the growth of
Internet use and decrease acceptance of the Internet as a communications and
commercial medium and thereby have a material adverse effect on our business,
prospects, financial condition and results of operations.
17
We
utilize certain key technologies from, and integrate our network with, third
parties and may be unable to replace those technologies if they become obsolete,
unavailable or incompatible with our products or services.
Our proprietary software is designed to work in conjunction with
certain software and hardware from third-party vendors, including Microsoft,
IBM, Oracle and eOriginal. Any significant interruption in the supply of such
third-party software or hardware could have a material adverse effect on our
ability to offer our products unless and until we can replace the functionality
provided by these products and services. In addition, we are dependent upon
these third parties’ ability to enhance their current products, develop new
products on a timely and cost-effective basis and respond to emerging industry
standards and other technological changes. There can be no assurance that we
would be able to replace the functionality provided by the third-party software
currently incorporated into our products or services in the event that such
technologies becomes obsolete or incompatible with future versions of our
products or services or is otherwise not adequately maintained or updated. Any
delay in or inability to replace any such functionality could have a material
adverse effect on our business, prospects, financial condition and results of
operations. Furthermore, delays in the release of new and upgraded versions of
third-party software products could have a material adverse effect on our
business, prospects, financial condition and results of operations.
Our
business operations may be disrupted if our planned Enterprise Resource Planning
system (ERP) implementation is not successful
We are contemplating the conversion of our various business
information systems to a single ERP. We plan to commit significant
resources to this conversion and it is expected to be phased in over multiple
years. The conversion process is extremely complex, in part, because of
the wide range of processes and the multiple legacy systems that must be
integrated. We will be using a controlled project plan that we believe
will provide an adequate allocation of resources. However, such a plan, or
a divergence from it, may result in cost overruns, project delays, or business
interruptions. During the conversion process, we may be limited in our
ability to integrate any business that we may want to acquire. Failure to
properly or adequately address these issues could result in significant costs or
impact our ability to perform necessary business operations which could have a
material adverse effect on our business, prospects, financial condition and
results of operations.
We
may be unable to adequately protect, and we may incur significant costs in
defending, our intellectual property and other proprietary rights.
Our success depends, in large part, on our ability to protect our
intellectual property and other proprietary rights. We rely upon a combination
of trademark, trade secret, copyright, patent and unfair competition laws, as
well as license agreements and other contractual provisions, to protect our
intellectual property and other proprietary rights. In addition, we attempt to
protect our intellectual property and proprietary information by requiring
certain of our employees and consultants to enter into confidentiality,
non-competition and assignment of inventions agreements. To the extent that our
intellectual property and other proprietary rights are not adequately protected,
third parties might gain access to our proprietary information, develop and
market products and services similar to ours, or use trademarks similar to ours.
Existing U.S. federal and state intellectual property laws offer only limited
protection. Moreover, the laws of Canada, and any other foreign countries in
which we may market our products and services in the future, may afford little
or no effective protection of our intellectual property. If we resort to legal
proceedings to enforce our intellectual property rights or to determine the
validity and scope of the intellectual property or other proprietary rights of
others, the proceedings could be burdensome and expensive, and we may not
prevail. The failure to adequately protect our intellectual property and other
proprietary rights, or manage costs associated with enforcing those rights,
could have a material adverse effect on our business, prospects, financial
condition and results of operations.
We own the Internet domain names “dealertrack.com,” “alg.com,”
“chrome.com,” “dealeraccess.com” and certain other domain names. The regulation
of domain names in the United States and foreign countries may change.
Regulatory bodies could establish additional top-level domains, appoint
additional domain name registrars or modify the requirements for holding domain
names, any or all of which may dilute the strength of our domain names. We may
not acquire or maintain our domain names in all of the countries in which our
websites may be accessed or for any or all of the top-level domain names that
may be introduced. The relationship between regulations governing domain names
and laws protecting intellectual property rights is unclear. Therefore, we may
not be able to prevent third parties from acquiring domain names that infringe
or otherwise decrease the value of our trademarks and other intellectual
property rights.
A
license agreement we have with a lender customer restricts our ability to
utilize the technology licensed under this agreement beyond the automotive
finance industry.
An affiliate of JPMorgan claims certain proprietary rights with
respect to certain technology developed as of February 1, 2001. We have an
exclusive, perpetual, irrevocable, royalty-free license throughout the world to
use this technology in connection with the sale, leasing and financing of
automobiles only, and the right to market, distribute and sub-license this
technology solely to automotive dealerships, consumers and lenders in connection
with the sale, leasing and financing of automobiles only. The license agreement
defines “automobile” as a passenger vehicle or light truck, snowmobiles,
recreational vehicles, motorcycles, boats and other watercraft and commercial
vehicles and excludes manufactured homes. We may be limited in our ability to
utilize the licensed technology beyond the automotive finance
industry.
Claims
that we or our technologies infringe upon the intellectual property or other
proprietary rights of a third party may require us to incur significant costs,
enter into royalty or licensing agreements or develop or license substitute
technology.
We may in the future be subject to claims that our technologies in
our products and services infringe upon the intellectual property or other
proprietary rights of a third party. In addition, the vendors providing us with
technology that we use in our own technology could become subject to similar
infringement claims. Although we believe that our products and services do not
infringe any intellectual property or other proprietary rights, we cannot assure
you that our products and services do not, or that they will not in the future,
infringe intellectual property or other proprietary rights held by others. Any
claims of infringement could cause us to incur substantial costs defending
against the claim, even if the claim is without merit, and could distract our
management from our business. Moreover, any settlement or adverse judgment
resulting from the claim could require us to pay substantial amounts, or obtain
a license to continue to use the products and services that is the subject of
the claim, and/or otherwise restrict or prohibit our use of the technology.
There can be no assurance that we would be able to obtain a license on
commercially reasonable terms from the third party asserting any particular
claim, if at all, that we would be able to successfully develop alternative
technology on a timely basis, if at all, or that we would be able to obtain a
license from another provider of suitable alternative technology to permit us to
continue offering, and our customers to continue using, the products and
services. In addition, we generally provide in our customer agreements for
certain products and services that we will indemnify our customers against
third-party infringement claims relating to technology we provide to those
customers, which could obligate us to pay damages if the products and services
were found to be infringing. Infringement claims asserted against us, our
vendors or our customers may have a material adverse effect on our business,
prospects, financial condition and results of operations.
18
We
could be sued for contract or product liability claims, and such lawsuits may
disrupt our business, divert management’s attention or have an adverse effect on
our financial results.
We provide guarantees to subscribers of certain of our products and
services that the data they receive through these products and services will be
accurate. Additionally, general errors, defects or other performance problems in
our products and services could result in financial or other damages to our
customers or consumers. There can be no assurance that any limitations of
liability set forth in our contracts would be enforceable or would otherwise
protect us from liability for damages. We maintain general liability insurance
coverage, including coverage for errors and omissions in excess of the
applicable deductible amount. There can be no assurance that this coverage will
continue to be available on acceptable terms or in sufficient amounts to cover
one or more large claims, or that the insurer will not deny coverage for any
future claim. The successful assertion of one or more large claims against us
that exceeds available insurance coverage, or the occurrence of changes in our
insurance policies, including premium increases or the imposition of large
deductible or co-insurance requirements, could have a material adverse effect on
our business, prospects, financial condition and results of operations.
Furthermore, litigation, regardless of its outcome, could result in substantial
cost to us and divert management’s attention from our operations. Any contract
liability claim or litigation against us could, therefore, have a material
adverse effect on our business, prospects, financial condition and results of
operations. In addition, some of our products and services are business-critical
for our dealer and lender customers and a failure or inability to meet a
customer’s expectations could seriously damage our reputation and affect our
ability to retain existing business or attract new business.
We
have made strategic acquisitions in the past and intend to do so in the future.
If we are unable to find suitable acquisitions or partners or to achieve
expected benefits from such acquisitions or partnerships, there could be a
material adverse effect on our business, prospects, financial condition and
results of operations.
Since
2001, we have acquired numerous businesses, including, most recently, our
acquisition of certain assets from JM Dealer Services, Inc., including AAX, in
January 2009. As part of our ongoing business strategy to expand product
offerings and acquire new technology, we frequently engage in discussions with
third parties regarding, and enter into agreements relating to, possible
acquisitions, strategic alliances and joint ventures. There may be significant
competition for acquisition targets in our industry, or we may not be able to
identify suitable acquisition candidates or negotiate attractive terms for
acquisitions. If we are unable to identify future acquisition opportunities,
reach agreement with such third parties or obtain the financing necessary to
make such acquisitions, we could lose market share to competitors who are able
to make such acquisitions, which could have a material adverse effect on our
business, prospects, financial condition and results of operations.
Even if
we are able to complete acquisitions or enter into alliances and joint ventures
that we believe will be successful, such transactions are inherently risky.
Significant risks to these transactions include the following:
|
•
|
integration and restructuring
costs, both one-time and
ongoing;
|
|
•
|
maintaining sufficient controls,
policies and
procedures;
|
|
•
|
diversion of management’s
attention from ongoing business
operations;
|
|
•
|
establishing new informational,
operational and financial systems to meet the needs of our
business;
|
|
•
|
losing key employees, customers
and vendors;
|
|
•
|
failing to achieve anticipated
synergies, including with respect to complementary products or services;
and
|
|
•
|
unanticipated and unknown
liabilities.
|
If we are
not successful in completing acquisitions in the future, we may be required to
reevaluate our acquisition strategy. We also may incur substantial expenses and
devote significant management time and resources in seeking to complete
acquisitions. In addition, we could use substantial portions of our available
cash to pay all or a portion of the purchase prices of future acquisitions. If
we do not achieve the anticipated benefits of our acquisitions as rapidly to the
extent anticipated by our management and financial or industry analysts, and
others may not perceive the same benefits of the acquisition as we do. If these
risks materialize, our stock price could be materially adversely
affected.
Any
acquisitions that we complete may dilute your ownership interest in us, may have
adverse effects on our business, prospects, financial condition and results of
operations and may cause unanticipated liabilities.
Future
acquisitions may involve the issuance of our equity securities as payment, in
part or in full, for the businesses or assets acquired. Any future issuances of
equity securities would dilute our existing stockholders’ ownership interests.
Future acquisitions may also decrease our earnings or earnings per share and the
benefits derived by us from an acquisition might not outweigh or might not
exceed the dilutive effect of the acquisition. We also may incur additional
indebtedness, have future impairment of assets, or suffer adverse tax and
accounting consequences in connection with any future acquisitions.
19
We
may not successfully integrate recent or future acquisitions.
The
integration of acquisitions involves a number of risks and presents financial,
managerial and operational challenges. We may have difficulty, and may incur
unanticipated expenses related to, integrating management and personnel from
these acquired entities with our management and personnel. Failure to
successfully integrate recent acquisitions or future acquisitions could have a
material adverse effect on our business, prospects, financial condition and
results of operations.
We
are dependent on our key management, direct sales force and technical personnel
for continued success.
Our company has grown significantly in size and scope in recent
years, and our management remains concentrated in a small number of key
employees. Our future success depends to a meaningful extent on our executive
officers and other key employees, including members of our direct sales force
and technology staff, such as our software developers and other senior technical
personnel. We rely primarily on our direct sales force to sell subscription
products and services to automotive dealers. We may need to hire additional
sales, customer service, integration and training personnel in the near-term and
beyond if we are to achieve revenue growth in the future. The loss of the
services of any of these individuals or group of individuals could have a
material adverse effect on our business, prospects, financial condition and
results of operations.
Competition for qualified personnel in the technology industry is
intense and we compete for these personnel with other technology companies that
have greater financial and other resources than we do. Our future success will
depend in large part on our ability to attract, retain and motivate highly
qualified personnel, and there can be no assurance that we will be able to do
so. Any difficulty in hiring or retaining needed personnel, or increased costs
related thereto could have a material adverse effect on our business, prospects,
financial condition and results of operations.
We
may need additional capital in the future, which may not be available to us, and
if we raise additional capital, it may dilute our stockholders’ ownership in
us.
We may need to raise additional funds through public or private
debt or equity financings in order to meet various objectives, such
as:
|
|
•
|
acquiring businesses, customer,
technologies, products and
services;
|
|
|
•
|
taking advantage of growth
opportunities, including more rapid
expansion;
|
|
|
•
|
making capital improvements to
increase our capacity;
|
|
|
•
|
developing new services or
products; and
|
|
|
•
|
responding to competitive
pressures.
|
Any debt
incurred by us could impair our ability to obtain additional financing for
working capital, capital expenditures or further acquisitions. Covenants
governing any debt we incur would likely restrict our ability to take specific
actions, including our ability to pay dividends or distributions on, or redeem
or repurchase our capital stock, enter into transactions with affiliates, merge,
consolidate or sell our assets or make capital expenditure investments. In
addition, the use of a substantial portion of the cash generated by our
operations to cover debt service obligations and any security interests we grant
on our assets could limit our financial and business flexibility.
Any
additional capital raised through the sale of equity, or convertible debt
securities may dilute our stockholders’ respective ownership percentages in us.
Furthermore, any additional debt or equity financing we may need may not be
available on terms favorable to us, or at all. If future financing is not
available or is not available on acceptable terms, we may not be able to raise
additional capital, which could significantly limit our ability to implement our
business plan. In addition, we may issue securities, including debt securities
that may have rights, preferences and privileges senior to our common
stock.
Our
lender customers may elect to use competing third-party services, either in
addition to or instead of our network.
Our lender customers continue to receive credit applications and
purchase retail installment sales and lease contracts directly from their dealer
customers through traditional indirect financing methods, including via
facsimile and other electronic means of communication, in addition to using our
network. Many of our lender customers are involved in other ventures as
participants and/or as equity holders, and such ventures or newly created
ventures may compete with us and our network now and in the future. Continued
use of alternative methods to ours by these lender customers may have a material
adverse effect on our business, prospects, financial condition and results of
operations.
20
Some
provisions in our certificate of incorporation and by-laws may deter third
parties from acquiring us.
Our fifth
amended and restated certificate of incorporation and our amended and restated
by-laws contain provisions that may make the acquisition of our company more
difficult without the approval of our board of directors, including, but not
limited to, the following:
|
|
•
|
our board of directors is
classified into three classes, each of which serves for a staggered
three-year term;
|
|
|
•
|
only our board of directors may
call special meetings of our
stockholders;
|
|
|
•
|
we have authorized undesignated
preferred stock, the terms of which may be established and shares of which
may be issued without stockholder
approval;
|
|
|
•
|
our stockholders have only
limited rights to amend our by-laws;
and
|
|
|
•
|
we require advance notice for
stockholder proposals.
|
These
anti-takeover defenses could discourage, delay or prevent a transaction
involving a change in control of our company. These provisions could also
discourage proxy contests and make it more difficult for you and other
stockholders to elect directors of your choosing and cause us to take other
corporate actions you desire. In addition, because our board of directors is
responsible for appointing the members of our management team, these provisions
could in turn affect any attempt by our stockholders to replace current members
of our management team.
In
addition, we are subject to Section 203 of the Delaware General Corporation
Law which, subject to certain exceptions, prohibits “business combinations”
between a publicly-held Delaware corporation and an “interested stockholder,”
which is generally defined as a stockholder who becomes a beneficial owner of
15% or more of a Delaware corporation’s voting stock, for a three-year period
following the date that such stockholder became an interested stockholder.
Section 203 could have the effect of delaying, deferring or preventing a
change in control of our company that our stockholders might consider to be in
their best interests.
If
our intangible assets, such as trademarks and goodwill, become impaired we may
be required to record a significant non-cash charge to earnings which would
negatively impact our results of operations.
Under
accounting principles generally accepted in the United States, we review our
intangible assets, including our trademarks licenses and goodwill, for
impairment annually in the fourth quarter of each fiscal year, or more
frequently if events or changes in circumstances indicate the carrying value of
our intangible assets may not be fully recoverable. The carrying value of our
intangible assets may not be recoverable due to factors such as a decline in our
stock price and market capitalization, reduced estimates of future cash flows,
including those associated with the specific brands to which intangibles relate,
or slower growth rates in our industry. Estimates of future cash flows are based
on a long-term financial outlook of our operations and the specific brands to
which the intangible assets relate. However, actual performance in the near-term
or long-term could be materially different from these forecasts, which could
impact future estimates and the recorded value of the intangibles. For example,
a significant, sustained decline in our stock price and market capitalization
may result in impairment of certain of our intangible assets, including
goodwill, and a significant charge to earnings in our financial statements
during the period in which an impairment is determined to exist. For ten
days between October 24, 2008 and November 21, 2008, the day of January 21, 2009
and for six trading days between March 3, 2009 and March 10, 2009, our market
capitalization dropped below the carrying value of our consolidated net
assets. Despite the fact that our market capitalization was below our book
value for twelve days we do not believe that there has been an impairment based
on the duration and depth of the market decline as well as an implied control
premium. A control premium is the amount that a buyer is willing to pay
over the current market price of a company as indicated by the market
capitalization, in order to acquire a controlling interest. The premium is
justified by the expected synergies, such as the expected increase in cash flow
resulting from the cost savings and revenue enhancements .However, due to
the ongoing uncertainty in market conditions, which may continue to negatively
impact our market capitalization, we will continue to monitor and evaluate the
carrying value of our goodwill. In the event we had to reduce the carrying
value of our goodwill, any such impairment charge could materially reduce our
results of operations.
The
price of our common stock may be volatile, particularly given the economic
downturn and volatility in domestic and international stock
markets.
The
trading price of our common stock may fluctuate substantially. Factors that
could cause fluctuations in the trading price of our common stock include, but
are not limited to:
|
|
•
|
price and volume fluctuations in
the overall stock market from time to
time;
|
|
|
•
|
actual or anticipated changes in
our earnings or fluctuations in our operating results or in the
expectations of equity research
analysts;
|
|
|
•
|
trends in the automotive and
automotive finance
industries;
|
|
|
•
|
catastrophic
events;
|
21
|
|
•
|
fluctuations
in the credit markets, including the pricing and availability of
credit;
|
|
|
•
|
loss of one or more significant
customers or strategic
alliances;
|
|
|
•
|
significant acquisitions,
strategic alliances, joint ventures or capital commitments by us or our
competitors;
|
|
|
•
|
legal or regulatory matters,
including legal decisions affecting the indirect automotive finance
industry or involving the enforceability or order of priority of security
interests of electronic chattel paper affecting our electronic contracting
product; and
|
|
|
•
|
additions or departures of key
employees.
|
The stock
market in general, the NASDAQ Global Market, and the market for technology
companies in particular, have experienced extreme price and volume fluctuations.
These fluctuations have often been unrelated or disproportionate to operating
performance. These forces reached unprecedented levels in the second half
of 2008 through the first quarter of 2009, resulting in the bankruptcy or
acquisition of, or government assistance to, several major domestic and
international financial institutions and a material decline in economic
conditions. In particular, the U.S. equity markets experienced significant price
and volume fluctuations that have affected the market prices of equity
securities of many technology companies. These broad market and industry factors
could materially and adversely affect the market price of our stock, regardless
of our actual operating performance.
In the
past, following periods of volatility in the market price of a company’s
securities, securities class action litigation has often been brought against
that company. Due to the potential volatility of our stock price, we may
therefore be the target of securities litigation in the future. Securities
litigation could result in substantial costs and divert management’s attention
and resources from our business.
Item 1B. Unresolved Staff
Comments
None.
Item 2. Properties
Our
corporate headquarters are located in Lake Success, New York, where we lease
approximately 75,000 square feet of office space. Our principal offices are
located in Santa Barbara, California; Portland, Oregon; Wilmington, Ohio;
Mississauga, Ontario; Dallas, Texas; Memphis, Tennessee; and South Jordan, Utah.
We lease all of the office space for our principle offices.
We
believe our existing facilities are adequate to meet our current
requirements.
Item 3. Legal
Proceedings
From time
to time, we are a party to litigation matters arising in connection with the
normal course of our business, none of which is expected to have a material
adverse effect on us. In addition to the litigation matters arising in
connection with the normal course of our business, we are party to the
litigation described below.
DealerTrack, Inc. v.
Finance Express et al., CV-06-2335; DealerTrack Inc. v. RouteOne and
Finance Express et al., CV-06-6864; and DealerTrack Inc. v. RouteOne and
Finance Express et al., CV-07-215
On
April 18, 2006, we filed a Complaint and Demand for Jury Trial against
David Huber, Finance Express LLC (Finance Express), and three of their unnamed
dealer customers in the United States District Court for the Central District of
California, Civil Action No. CV-06-2335 AG (FMOx). The complaint sought
declaratory and injunctive relief, as well as damages, against the defendants
for infringement of the U.S. Patent No. 5,878,403 (the ’403 Patent)
Patent and the 6,587,841 (the ’841 Patent). Finance Express denied infringement
and challenged the validity and enforceability of the
patents-in-suit.
On
October 27, 2006, we filed a Complaint and Demand for Jury Trial against
RouteOne, David Huber and Finance Express in the United States District Court
for the Central District of California, Civil Action No. CV-06-6864 (SJF).
The complaint sought declaratory and injunctive relief as well as damages
against the defendants for infringement of the ’403 Patent and the ’841 Patent.
On November 28, 2006 and December 4, 2006, respectively, defendants
RouteOne, David Huber and Finance Express filed their answers. The defendants
denied infringement and challenged the validity and enforceability of the
patents-in-suit.
On
February 20, 2007, we filed a Complaint and Demand for Jury Trial against
RouteOne LLC (RouteOne), David Huber and Finance Express in the United States
District Court for the Central District of California, Civil Action
No. CV-07-215 (CWx). The complaint sought declaratory and injunctive relief
as well as damages against the defendants for infringement of U.S. Patent
No. 7,181,427 (the ’427 Patent). On April 13, 2007 and April 17,
2007, respectively, defendants RouteOne, David Huber and Finance Express filed
their answers. The defendants denied infringement and challenged the validity
and enforceability of the ’427 Patent.
22
The
DealerTrack, Inc. v. Finance Express et al., CV-06-2335 action, the DealerTrack
Inc. v. RouteOne and Finance Express et al., CV-06-6864 action and the
DealerTrack v. RouteOne and Finance Express et al., CV-07-215 action,
described above, were consolidated by the court. A hearing on claims
construction, referred to as a “Markman ” hearing, was held
on September 25, 2007. Fact and expert discovery and motions for summary
judgment have substantially been completed.
On
July 21, 2008 and September 30, 2008, the court issued summary
judgment orders disposing of certain issues and preserving other issues for
trial.
On
July 8, 2009, the court held Claims 1-4 of DealerTrack’s patent
7,181,427 was invalid for failure to comply with a standard required by the
recently decided case in the Court of Appeals of the Federal Circuit of In re
Bilski. On August 11, 2009, the court entered into a judgment granting
summary judgment. On September 8 , 2009, DealerTrack filed a notice of
appeal in the United States Court of Appeals for the Federal Circuit in regards
to the finding of non-infringement of patent 6,587,841, the invalidity of patent
7,181,427, and the claim construction order to the extent that it was relied
upon to find the judgments of non-infringement and invalidity. On October 29,
2009, the Federal Circuit granted a motion to stay briefing until the
disposition of In re Bilski.
We
believe that the potential liability from all current litigations will not have
a material effect on our financial position or results of operations when
resolved in a future period.
Item 4. Submission of
Matters to a Vote of Security Holders
No
matters were submitted to a vote of our security holders during the fourth
quarter of the year covered by this Annual Report on Form 10-K.
PART
II
Item 5. Market for
Registrant’s Common Equity, Related Stockholder Matters and Issuer Purchases of
Equity Securities
Market
Information
As of
January 31, 2010, there were 28 holders of record of our common stock. Our
common stock is listed and traded on the NASDAQ Global Market under the symbol
“TRAK”. The following table sets forth the range of high and low sales prices
for the common stock in each quarter of 2009 and 2008, as reported by the NASDAQ
Global Market.
|
High
|
Low
|
|||||||
|
Year
Ended December 31, 2009
|
||||||||
|
Fourth
Quarter
|
$ | 19.69 | $ | 15.86 | ||||
|
Third
Quarter
|
$ | 21.80 | $ | 14.94 | ||||
|
Second
Quarter
|
$ | 17.94 | $ | 12.71 | ||||
|
First
Quarter
|
$ | 14.50 | $ | 9.27 | ||||
|
Year
Ended December 31, 2008
|
||||||||
|
Fourth
Quarter
|
$ | 16.79 | $ | 8.84 | ||||
|
Third
Quarter
|
$ | 20.82 | $ | 13.66 | ||||
|
Second
Quarter
|
$ | 22.72 | $ | 14.08 | ||||
|
First
Quarter
|
$ | 34.07 | $ | 15.22 | ||||
Dividend
Policy
We have
not paid any cash dividends on our common stock and currently intend to retain
any future earnings for use in our business.
23
Repurchases
From
time to time, in connection with the vesting of restricted common stock under
our incentive award plans, we may receive shares of our common stock from
certain restricted common stockholders in consideration of the tax withholdings
due upon the vesting of restricted common stock.
|
Total
|
Maximum
|
|||||||||||||||
|
Number
of
|
Number
|
|||||||||||||||
|
Shares
|
of
Shares
|
|||||||||||||||
|
Purchased
|
That
|
|||||||||||||||
|
as
Part of
|
May
Yet be
|
|||||||||||||||
|
Total
Number
|
Average
Price
|
Publicly
|
Purchased
|
|||||||||||||
|
of
Shares
|
Paid
per
|
Announced
|
Under
the
|
|||||||||||||
|
Period
|
Purchased
|
Share
|
Program
|
Program
|
||||||||||||
|
October 2009
|
1,295 | $ | 19.06 | n/a | n/a | |||||||||||
|
November 2009
|
129 | $ | 18.01 | n/a | n/a | |||||||||||
|
December 2009
|
— | $ | — | n/a | n/a | |||||||||||
The
selected consolidated financial data as of December 31, 2009 and 2008 and
for each of the three years in the period ended December 31, 2009 have been
derived from our consolidated financial statements and related notes thereto
included elsewhere herein, which have been audited by PricewaterhouseCoopers
LLP, an independent registered public accounting firm. The selected historical
consolidated financial data as of December 31, 2007, 2006 and
December 31, 2005 and for each of the two years in the period ended
December 31, 2006 have been derived from our audited consolidated financial
statements and related notes thereto, which are not included in this filing, and
which have also been audited by PricewaterhouseCoopers LLP.
We
completed acquisitions during the periods presented below, the operating results
of which have been included in our historical results of operations from the
respective acquisition dates. These acquisitions have significantly affected our
revenue, results of operations and financial condition. Accordingly, the results
of operations for the periods presented may not be comparable due to these
acquisitions.
The
following selected consolidated financial data should be read in conjunction
with “Management’s Discussion and Analysis of Financial Condition and Results of
Operations” in Part II, Item 7 in this Annual Report on Form 10-K and
“Financial Statements and Supplementary Data” in Part II, Item 8 in
this Annual Report on Form 10-K.”
|
Year
Ended December 31,
|
||||||||||||||||||||
|
2009
|
2008
|
2007
|
2006
|
2005
|
||||||||||||||||
|
(In
thousands, except per share and share amounts)
|
||||||||||||||||||||
|
Consolidated
Statements of Operations Data:
|
||||||||||||||||||||
|
Net
revenue
|
$ | 225,626 | $ | 242,706 | $ | 233,845 | $ | 173,272 | $ | 120,219 | ||||||||||
|
(Loss)
income from operations
|
(10,950 | ) | 7,052 | 27,531 | 20,739 | 9,831 | ||||||||||||||
|
(Loss)
income before benefit (provision) for income taxes
|
(7,853 | ) | 5,697 | 32,786 | 26,133 | 8,528 | ||||||||||||||
|
Net
(loss) income
|
$ | (4,334 | ) | $ | 1,736 | $ | 19,752 | $ | 19,336 | $ | 4,468 | |||||||||
|
Basic
net (loss) income per share applicable to common stockholders
(1)
|
$ | (0.11 | ) | $ | 0.04 | $ | 0.49 | $ | 0.53 | $ | 0.17 | |||||||||
|
Diluted
net (loss) income per share applicable to common
stockholders (1)
|
$ | (0.11 | ) | $ | 0.04 | $ | 0.47 | $ | 0.51 | $ | 0.13 | |||||||||
|
Weighted
average common stock outstanding (basic)
|
39,524,544 | 40,461,896 | 39,351,138 | 36,064,796 | 2,290,439 | |||||||||||||||
|
Weighted
average common stock outstanding (diluted)
|
39,524,544 | 41,538,379 | 40,886,482 | 37,500,164 | 3,123,524 | |||||||||||||||
24
|
As
of December 31,
|
||||||||||||||||||||
|
2009
|
2008
|
2007
|
2006
|
2005
|
||||||||||||||||
|
(In
thousands)
|
||||||||||||||||||||
|
Consolidated
Balance Sheets Data:
|
||||||||||||||||||||
|
Cash
and cash equivalents, short-term and long-term investments
|
$ | 202,964 | $ | 203,198 | $ | 220,144 | $ | 171,195 | $ | 103,264 | ||||||||||
|
Working
capital (2)
|
191,894 | 197,797 | 222,810 | 168,817 | 101,561 | |||||||||||||||
|
Total
assets
|
472,327 | 437,215 | 482,926 | 321,513 | 220,615 | |||||||||||||||
|
Capital
lease obligations (short and long-term), due to acquirees (short and
long-term), deferred revenue (short and long-term) and other long-term
liabilities
|
13,398 | 17,272 | 15,888 | 13,269 | 13,251 | |||||||||||||||
|
Retained
earnings (accumulated deficit)
|
15,924 | 20,258 | 18,522 | (1,230 | ) | (20,566 | ) | |||||||||||||
|
Total
stockholders’ equity
|
420,886 | 396,220 | 438,362 | 284,337 | 186,671 | |||||||||||||||
|
(1)
|
Earnings
per share data for the years ended December 31, 2008, 2007, 2006 and 2005
have been retroactively adjusted to conform to the provisions of ASC Topic
260, Earnings Per
Share, which did not have a significant impact on our historical
earnings per share calculation. For further information, please refer to
Note 2 in the accompanying notes to the consolidated financial statements
included in this Annual Report on Form 10-K.
|
||
|
(2)
|
Working
capital is defined as current assets less current
liabilities.
|
||
You should read the following
discussion and analysis of our financial condition and results of operations in
conjunction with our consolidated financial statements and related notes
thereto. In addition, you should read the sections entitled “Cautionary
Statements Relating to Forward-Looking Statements” and “Risk Factors” in
Part 1, Item 1 and Item 1A, respectively, in this Annual Report
on Form 10-K
.
Overview
DealerTrack’s
intuitive and high-value software solutions enhance efficiency and profitability
for all major segments of the automotive retail industry, including dealers,
lenders, OEMs, agents and aftermarket providers. We believe our solution set for
dealers is the industry’s most comprehensive. DealerTrack operates the
industry’s largest online credit application network, connecting approximately
17,000 dealers with over 800 lenders. Our DMS provides dealers with
easy-to-use tools with real-time data access that will streamline any automotive
business. With our inventory management solution (DealerTrack AAX), dealers get
better data along with the tools to make smarter, more profitable inventory
decisions. Our sales and F&I solution enables dealers to streamline the
entire sales process, quickly structuring all types of deals from a single
integrated platform. DealerTrack’s compliance solution helps dealers meet legal
and regulatory requirements and protect their hard-earned assets. DealerTrack’s
family of companies also includes data, accessories and consulting services
providers, ALG and Chrome.
We
are a Delaware corporation formed in August 2001. We are organized as a
holding company and conduct a substantial amount of our business through our
subsidiaries including Automotive Lease Guide (alg), Inc., Chrome Systems, Inc.,
DealerTrack Aftermarket Services, Inc., DealerTrack Canada, Inc., DealerTrack
Digital Services, Inc., DealerTrack, Inc., and DealerTrack Systems,
Inc.
We
monitor our performance as a business using a number of measures that are not
found in our consolidated financial statements. These measures include the
number of active dealers, lenders, and active lender to dealership relationships
in the DealerTrack network, the number of subscribing dealers in the DealerTrack
network, the number of transactions processed, average transaction price and the
average monthly subscription revenue per subscribing dealership. We believe that
improvements in these metrics will result in improvements in our financial
performance over time. We also view the acquisition and successful integration
of acquired companies as important milestones in the growth of our business as
these acquired companies bring new products to our customers and expand our
technological capabilities. We believe that successful acquisitions will also
lead to improvements in our financial performance over time. In the near term,
however, the purchase accounting treatment of acquisitions can have a negative
impact on our statement of operations as the depreciation and amortization
expenses associated with acquired assets, as well as particular intangibles
(which tend to have a relatively short useful life), can be substantial in the
first several years following an acquisition. As a result, we monitor our EBITDA
and other business statistics as a measure of operating performance in addition
to net income (loss) and the other measures included in our consolidated
financial statements.
25
The
following is a table consisting of non-GAAP financial measures and certain other
business statistics that management is continually monitoring (only amounts in
thousands, are adjusted EBITDA, adjusted net income, capital expenditure data
and transactions processed):
|
Year
Ended December 31,
|
||||||||||||
|
2009
|
2008
|
2007
|
||||||||||
|
Non-GAAP
Financial Measures and Other Business Statistics:
|
||||||||||||
|
Adjusted
EBITDA (Non-GAAP) (1)
|
$ | 34,438 | $ | 47,912 | $ | 66,257 | ||||||
|
Adjusted
net income (Non-GAAP) (1)
|
$ | 19,967 | $ | 34,714 | $ | 44,323 | ||||||
|
Capital
expenditures, software and website development costs
|
$ | 21,336 | $ | 16,783 | $ | 15,068 | ||||||
|
Active
dealers in our network as of end of the year (2)
|
16,690 | 19,652 | 22,043 | |||||||||
|
Active
lenders in our network as of end of year (3)
|
823 | 733 | 536 | |||||||||
|
Active
lender to dealer relationships (4)
|
118,209 | 156,437 | 226,314 | |||||||||
|
Subscribing
dealers in our network as of end of the year (5)
|
13,852 | 14,342 | 13,209 | |||||||||
|
Transactions
processed (6)
|
51,402 | 79,655 | 90,869 | |||||||||
|
Average
transaction price (7)
|
$ | 1.84 | $ | 1.66 | $ | 1.62 | ||||||
|
Average
monthly subscription revenue per subscribing dealership
(8)
|
$ | 678 | $ | 550 | $ | 474 | ||||||
|
(1)
|
Adjusted EBITDA is a
non-GAAP financial measure that represents GAAP net (loss) income before
interest (income) expense, taxes, depreciation and amortization, GMAC
contra-revenue and may exclude certain items such as: impairment charges,
restructuring charges, acquisition-related earn-out compensation expense
and professional service fees, or realized gains or (losses) on
securities. Adjusted net income is a non-GAAP financial measure that
represents GAAP net (loss) income excluding stock-based compensation
expense, the amortization of acquired identifiable intangibles, GMAC
contra-revenue and may also exclude certain items, such as: impairment
charges, restructuring charges, acquisition-related earn-out compensation
expense and professional service fees, or realized gains or (losses) on
securities. These adjustments to adjusted net income are shown before
taxes. We present adjusted EBITDA and adjusted net income because we
believe that these non-GAAP financial measures provide useful information
with respect to the performance of our fundamental business activities and
is also frequently used by securities analysts, investors and other
interested parties in the evaluation of comparable companies. We rely on
adjusted EBITDA and adjusted net income as a primary measure to review and
assess the operating performance of our company and management team in
connection with our executive compensation plan incentive
payments.
|
Adjusted
EBITDA and adjusted net income have limitations as an analytical tool and you
should not consider it in isolation, or as a substitute for analysis of our
results as reported under Generally Accepted Accounting Principles (GAAP). Some
of these limitations are:
|
•
|
Adjusted
EBITDA and adjusted net income do not reflect our cash expenditures or
future requirements for capital expenditures or contractual
commitments;
|
||
|
•
|
Adjusted
EBITDA and adjusted net income do not reflect changes in, or cash
requirements for, our working capital needs;
|
||
|
•
|
Although
depreciation and amortization are non-cash charges, the assets being
depreciated and amortized will often have to be replaced in the future,
and adjusted EBITDA and adjusted net income do not reflect any cash
requirements for such replacements;
|
||
|
•
|
Non-cash
compensation is and will remain a key element of our overall long-term
incentive compensation package, although we exclude it as an expense when
evaluating our ongoing performance for a particular
period;
|
||
|
•
|
Adjusted
EBITDA and adjusted net income do not reflect the impact of certain cash
charges resulting from matters we consider not to be indicative of our
ongoing operations; and
|
||
|
•
|
Other
companies may calculate adjusted EBITDA and adjusted net income
differently than we do, limiting its usefulness as a comparative
measure.
|
Because
of these limitations, adjusted EBITDA and adjusted net income should not be
considered as a measure of discretionary cash available to us to invest in the
growth of our business. We compensate for these limitations by relying primarily
on our GAAP results and using adjusted EBITDA and adjusted net income only as a
supplement to our GAAP results. Adjusted EBITDA and adjusted net income are a
measure of our performance that is not required by, or presented in accordance
with, GAAP. Adjusted EBITDA and adjusted net income are not a measurement of our
financial performance under GAAP and should not be considered as an alternative
to net income, operating income or any other performance measures derived in
accordance with GAAP or as an alternative to cash flow from operating activities
as a measure of our liquidity.
The
following table sets forth the reconciliation of adjusted EBITDA, a non-GAAP
financial measure, to net (loss) income, our most directly comparable financial
measure in accordance with GAAP (in thousands):
|
Year Ended December 31,
|
||||||||||||
|
2009
|
2008
|
2007
|
||||||||||
|
GAAP
net (loss) income
|
$ | (4,334 | ) | $ | 1,736 | $ | 19,752 | |||||
|
Interest
income
|
(1,081 | ) | (4,720 | ) | (5,606 | ) | ||||||
|
Interest
expense
|
221 | 324 | 355 | |||||||||
|
(Benefit)
provision for income taxes
|
(3,519 | ) | 3,961 | 13,034 | ||||||||
|
Depreciation
of property and equipment and amortization of capitalized software and
website costs
|
14,719 | 13,295 | 10,262 | |||||||||
|
Amortization
of acquired identifiable intangibles
|
20,341 | 26,781 | 28,217 | |||||||||
|
EBITDA
(Non-GAAP)
|
26,347 | 41,377 | 66,014 | |||||||||
|
Restructuring
costs
|
6,686 | — | — | |||||||||
|
Acquisition
related professional fees
|
2,407 | 579 | 243 | |||||||||
|
Realized
(gain) loss on securities
|
(1,393 | ) | 5,956 | — | ||||||||
|
Reversal
of pre-acquisition accrued contingency
|
(609 | ) | — | — | ||||||||
|
Acquisition
related earn-out compensation expense
|
1,000 | — | — | |||||||||
|
Adjusted
EBITDA (Non-GAAP)
|
$ | 34,438 | $ | 47,912 | $ | 66,257 | ||||||
26
The
following table sets forth the reconciliation of adjusted net income, a non-GAAP
financial measure, to net (loss) income, our most directly comparable financial
measure in accordance with GAAP (in thousands):
|
Year Ended December 31,
|
||||||||||||
|
2009
|
2008
|
2007
|
||||||||||
|
GAAP
net (loss) income
|
$ | (4,334 | ) | $ | 1,736 | $ | 19,752 | |||||
|
Adjustments:
|
||||||||||||
|
Amortization
of acquired identifiable intangibles
|
20,341 | 26,781 | 28,217 | |||||||||
|
Restructuring
costs (including stock-based compensation)
|
6,686 | — | — | |||||||||
|
Acquisition
related professional fees
|
2,407 | 579 | 243 | |||||||||
|
Realized
(gain) loss on securities (non-taxable)
|
(1,393 | ) | 5,956 | — | ||||||||
|
Reversal
of pre-acquisition accrued contingency (non-taxable)
|
(609 | ) | — | — | ||||||||
|
Acquisition
related earn-out compensation expense ($0.4 million deductible for tax
purposes)
|
1,000 | — | — | |||||||||
|
Amended
state tax returns – benefits (non-taxable)
|
(1,070 | ) | — | — | ||||||||
|
Stock-based
compensation (excluding restructuring costs)
|
13,104 | 13,991 | 10,906 | |||||||||
|
Tax
impact of adjustments (9)
|
(16,165 | ) | (14,329 | ) | (14,795 | ) | ||||||
|
Adjusted
net income (Non-GAAP)
|
$ | 19,967 | $ | 34,714 | $ | 44,323 | ||||||
|
(2)
|
We
consider a dealer to be active as of a date if the dealer completed at
least one revenue-generating credit application processing transaction
using the DealerTrack network during the most recently ended calendar
month.
|
||
|
(3)
|
We
consider a lender to be active in our network as of a date if it is
accepting credit application data electronically from dealers in the
DealerTrack network, including lenders visible to dealers through drop
down menus.
|
||
|
(4)
|
Each
lender to dealer relationship represents a pair between an active U.S.
lender and an active U.S. dealer.
|
||
|
(5)
|
Represents
the number of dealerships with a current subscription in the DealerTrack
or DealerTrack Canada networks at the end of a given
period.
|
||
|
(6)
|
Represents
revenue-generating transactions processed in the DealerTrack, DealerTrack
Digital Services and DealerTrack Canada networks at the end of a given
period.
|
||
|
(7)
|
Represents
the average revenue earned per transaction processed in the DealerTrack,
DealerTrack Digital Services and DealerTrack Canada networks during a
given period.
|
||
|
(8)
|
Represents
net subscription revenue divided by average subscribing dealers for a
given period in the DealerTrack and DealerTrack Canada
networks.
|
||
|
(9)
|
The
tax impact of adjustments for the twelve months ended December 31, 2009,
are based on a U.S. effective tax rate of 37.8% applied to taxable
adjustments other than amortization of acquired identifiable intangibles
which is based on a blended effective tax rate of 37.0%. The tax impact of
adjustments for the twelve months ended December 31, 2008, are based on a
U.S. effective tax rate of 34.8% applied to taxable adjustments other than
amortization of acquired identifiable intangibles which is based on a
blended effective tax rate of 34.6%. The tax impact of adjustments for the
twelve months ended December 31, 2007, are based on a U.S. effective tax
rate of 35.9% applied to taxable adjustments other than amortization of
acquired identifiable intangibles which is based on a blended effective
tax rate of 38.2%.
|
||
Revenue
Transaction Services
Revenue. Transaction services revenue consists of revenue earned from our
lender customers for each credit application or contract that dealers submit to
them. We also earn transaction services revenue from lender customers for each
financing contract executed via our electronic contracting and digital contract
processing solutions, as well as for any portfolio residual value analyses we
perform for them. We also earn transaction services revenue from dealers or
other service and information providers, such as aftermarket providers,
accessory providers, and credit report providers, for each fee-bearing product
accessed by dealers.
Subscription Services
Revenue. Subscription services revenue consists of revenue earned from
our customers (typically on a monthly basis) for use of our subscription or
license-based products and services. Our subscription services enable dealer
customers to manage their dealership data and operations, compare various
financing and leasing options and programs, sell insurance and other aftermarket
products, analyze inventory, and execute financing contracts
electronically.
Other Revenue. Other revenue
consists of revenue primarily earned through forms programming, data conversion
and training and start up fees from our DMS solution, shipping commissions
earned from our digital contract business and consulting and analytical revenue
earned from ALG.
Operating
Expenses
Cost of Revenue. Cost
of revenue primarily consists of expenses related to running our network
infrastructure (including Internet connectivity, hosting expenses, and data
storage), amortization expense on acquired intangible assets, capitalized
software and website development costs, compensation and related benefits for
network and technology development personnel, amounts paid to third parties
pursuant to contracts under which a portion of certain revenue is owed to those
third parties (revenue share) and direct costs for data licenses and direct
costs (printing, binding, and delivery) associated with our residual value
guides. Cost of revenue also includes hardware costs associated with our DMS
product offering, and compensation, related benefits and travel expenses
associated with DMS installation personnel.
Product Development
Expenses. Product development expenses consist primarily of compensation
and related benefits, consulting fees and other operating expenses associated
with our product development departments. The product development departments
perform research and development, as well as enhance and maintain existing
products.
Selling, General and
Administrative Expenses. Selling, general and administrative expenses
consist primarily of compensation and related benefits, facility costs and
professional services fees for our sales, marketing, customer service and
administrative functions.
We
allocate overhead such as occupancy and telecommunications charges, and
depreciation expense based on headcount, as we believe this to be the most
accurate measure. As a result, a portion of general overhead expenses is
reflected in our cost of revenue and each operating expense
category.
27
We
allocated the restructuring costs related to our January 5, 2009 realignment of
our workforce and business to the appropriate cost of revenue and operating
expense categories based on each of the terminated employees respective
functions. For further information, please refer to Note 16 in the accompanying
notes to the consolidated financial statements included in this Annual Report on
Form 10-K.
Acquisitions
and Related Amortization Expense
We
have grown our business since inception through a combination of organic growth
and acquisitions. The operating results of each business acquired have been
included in our consolidated financial statements from the respective dates of
acquisition.
On
January 23, 2009, we acquired the AAX suite of inventory management solutions
and other assets from JM Dealer Services, Inc., a subsidiary of JM Family
Enterprises, Inc., for a purchase price of $30.9 million in cash, net of a $1.7
million purchase price adjustment. We expensed approximately $0.5 million of
professional fees associated with the acquisition. For further information,
please refer to Note 4 in the accompanying notes to the consolidated financial
statements included in this Annual Report on Form 10-K.
On
August 1, 2007, we completed the purchase of all of the outstanding shares
of AutoStyleMart, Inc. (ASM), for a purchase price of $4.0 million in cash
(including direct acquisition costs of $0.2 million). ASM is a provider of
accessories-related solutions to automotive dealerships. Under the terms of the
merger agreement, we have future contingent payment obligations of up to
$11.0 million based upon the achievement of certain operational targets
from February 2008 through February 2011. As of December
31, 2009, we determined that certain operational conditions were probable of
being achieved and recorded a liability of $1.0 million. The additional
consideration of $1.0 million was deemed compensation for services, as payment
was contingent on certain former stockholders remaining employees or consultants
of DealerTrack for a certain period. The $1.0 million was recorded as a selling,
general and administrative expense for the year ended December 31, 2009. As of
December 31, 2009, it has been determined that the operational targets related
to the remaining $10.0 million in contingent payment obligations are not yet
probable of being achieved. Any amounts deemed probable in the future will also
be recorded as a selling, general and administrative expense.
On
June 6, 2007, we completed the purchase of all of the outstanding shares of
Arkona, Inc. (Arkona), for a cash purchase price of approximately
$60.0 million (including direct acquisition costs of approximately
$1.0 million). Arkona is a provider of on-demand dealer management systems
for automotive dealerships.
On
February 1, 2007, we completed the purchase of all of the outstanding
shares of Curomax Corporation and its subsidiaries (Curomax) pursuant to a
shares purchase agreement, dated as of January 16, 2007, for an adjusted cash
purchase price of approximately $40.7 million (including direct acquisition
and restructuring costs of approximately $1.6 million). Curomax is a
provider of an Internet-based credit application and contract processing network
in Canada. Under the terms of merger agreement, we had future contingent payment
obligations of up to $1.8 million in cash based upon the achievement of
certain operational targets over the subsequent twenty-four months. As of
December 31, 2008, we determined that certain operational conditions had been
met and as such, recorded a liability and additional goodwill of approximately
$1.8 million. The additional consideration of $1.8 million was paid in the first
quarter of 2009.
Our
acquisitions have been recorded under the purchase method of accounting,
pursuant to which the total purchase price, is allocated to the net assets
acquired based upon estimates of the fair value of those assets. Any excess
purchase price is allocated to goodwill. Amortization expense relating to
intangible assets is recorded as a cost of revenue.
Critical
Accounting Policies and Estimates
Our
management’s discussion and analysis of our financial condition and results of
our operations is based on our consolidated financial statements, which have
been prepared in accordance with GAAP. The preparation of these consolidated
financial statements requires management to make estimates and judgments that
affect the amounts reported for assets, liabilities, revenue, expenses and the
disclosure of contingent liabilities.
Our
critical accounting policies are those that we believe are both important to the
portrayal of our financial condition and results of operations and that involve
difficult, subjective or complex judgments, often as a result of the need to
make estimates about the effect of matters that are inherently uncertain. The
estimates are based on historical experience and on various assumptions about
the ultimate outcome of future events. Our actual results may differ from these
estimates if unforeseen events occur or should the assumptions used in the
estimation process differ from actual results.
We
believe the following critical accounting policies affect our more significant
judgments and estimates used in the preparation of our consolidated financial
statements:
28
Revenue
Recognition
Transaction Services
Revenue. Transaction services revenue consists of revenue earned from our
lender customers for each credit application or contract that dealers submit to
them. We also earn transaction services revenue from lender customers for each
financing contract executed via our electronic contracting and digital contract
processing solutions, as well as for any portfolio residual value analyses we
perform for them. We also earn transaction services revenue from dealers or
other service and information providers, such as aftermarket providers,
accessory providers, and credit report providers, for each fee-bearing product
accessed by dealers.
We
offer our web-based service to lenders for the electronic receipt of credit
application data and contract data for automobile financing transactions in
consideration for a transaction fee. This service is sold based upon contracts
that include fixed or determinable prices and that do not include the right of
return or other similar provisions or significant post service obligations.
Credit application and digital and electronic contracting processing revenue is
recognized on a per transaction basis, after customer receipt and when
collectability is reasonably assured. Set-up fees charged to the lenders for
establishing connections, if any, are recognized ratably over the expected
customer relationship period of four years.
Our
credit report service provides our dealer customers the ability to access credit
reports from several major credit reporting agencies or resellers online. We
sell this service based upon contracts with the customer or credit report
provider, as applicable, that include fixed or determinable prices and that do
not include the right of return or other similar provisions or other significant
post-service obligations. We recognize credit report revenue on a per
transaction basis, when services are rendered and when collectability is
reasonably assured. We offer these credit reports on both a reseller and an
agency basis. We recognize revenue from all but one provider of credit reports
on a net basis due to the fact that we are not considered the primary obligor,
and recognize revenue on a gross basis with respect to one of the providers as
we have the risk of loss and are considered the primary obligor in the
transaction.
Subscription Services
Revenue. Subscription services revenue consists of revenue earned from
our customers (typically on a monthly basis) for use of our subscription or
license-based products and services. Our subscription services enable dealer
customers to manage their dealership data and operations, compare various
financing and leasing options and programs, sell insurance and other aftermarket
products, analyze inventory, and execute financing contracts electronically.
These subscription services are typically sold based upon contracts that include
fixed or determinable prices and that do not include the right of return or
other similar provisions or significant post service obligations. We recognize
revenue from such contracts ratably over the contract period. We recognize
set-up fees, if any, ratably over the expected customer relationship of three
years. For contracts that contain two or more products or services, we recognize
revenue in accordance with the above policy using relative fair
value.
Other
Revenue. Other revenue consists of revenue primarily earned
through training and start up fees from our DMS solution, shipping commissions
earned from our digital contract business and consulting and analytical revenue
earned from ALG.
Our
revenue is presented net of a provision for sales credits, which are estimated
based on historical results, and established in the period in which services are
provided.
Allowance
for Doubtful Accounts
We
maintain an allowance for doubtful accounts for estimated losses resulting from
the inability of our customers to make required payments. The amount of the
allowance account is based on historical experience and our analysis of the
accounts receivable balance outstanding. While credit losses have historically
been within our expectations when the provisions are established, we cannot
guarantee that we will continue to experience the same credit loss rates that we
have in the past. If the financial condition of our customers were to
deteriorate, resulting in their inability to make payments, additional
allowances may be required which would result in an additional expense in the
period that this determination was made.
Software
and Website Development Costs and Amortization
We
capitalize costs of materials, consultants and payroll and payroll-related costs
incurred by employees involved in developing internal use computer software.
Costs incurred during the preliminary project and post-implementation stages are
charged to expense. Software and website development costs are amortized on a
straight-line basis over estimated useful lives ranging from two to four years.
We perform periodic reviews to ensure that unamortized software and website
costs remain recoverable from future revenue. Capitalized software and website
development costs, net were $21.2 million and $12.7 million as of
December 31, 2009 and 2008, respectively. Amortization expense totaled
$7.6 million, $7.4 million and $6.2 million for the years ended
December 31, 2009, 2008 and 2007, respectively.
Goodwill,
Other Intangibles and Long-lived Assets
We
record as goodwill the excess of purchase price over the fair value of the
tangible and identifiable intangible assets acquired. Goodwill is tested
annually for impairment as well as whenever events or circumstances change that
would make it more likely than not that an impairment may have occurred.
Goodwill is tested for impairment using a two-step approach. The first step
tests for potential goodwill impairment by comparing the fair value of our one
reporting unit to our carrying. If the fair value of the reporting unit is less
than its carrying value the second step is to record an impairment loss to the
extent that the implied fair value of the goodwill of the reporting unit is less
than its carrying value.
29
Goodwill
is required to be assessed at the operating segment or lower level. We
determined that the components of our one operating segment have similar
economic characteristics, nature of products, distribution, shared resources and
type of customer such that the components should be aggregated into a single
reporting unit for purposes of performing the impairment test for goodwill. We
perform our annual impairment analysis as of the first day of the fourth
quarter. The evaluation of impairment involves comparing the current estimated
fair value of our reporting unit to the carrying value, including goodwill. We
estimate the fair value of or reporting unit by primarily using a market
capitalization approach, and also looking at the outlook for the business. The
results of our most recent annual assessments performed on October 1, 2009 and
2008 did not indicate any impairment of our goodwill.
Subsequent
to our October 1, 2008 goodwill impairment test, our market capitalization was
impacted by the volatility in the U.S. equity markets. For ten days
between October 24, 2008 and November 21, 2008, the day of January 21, 2009 and
for six trading days between March 3, 2009 and March 10, 2009, our market
capitalization was on average approximately 5% below the approximately $405
million carrying value of our consolidated net assets, as of October 1,
2008. The periods between October 24, 2008 and November 21, 2008 and
March 3, 2009 to March 10, 2009 coincided with the overall stock market’s low
periods for 2008, and 2009, respectively.
Despite
the fact that our market capitalization traded below our book value for a brief
period of time, we believed that there had not been an impairment anytime during
2009 or 2008, based on the limited duration and depth of the market decline. In
addition, there was no factoring of an implied control premium. A
control premium is the amount that a buyer is willing to pay over the current
market price of a company as indicated by the market capitalization, in order to
acquire a controlling interest. The premium is justified by the
expected synergies, such as the expected increase in cash flow resulting from
the cost savings and revenue enhancements. As of December 31, 2008, our
market capitalization was approximately $475 million compared to our book value,
including goodwill, of approximately $396 million. As of October 1, 2009, our
market capitalization was approximately $750 million compared to our book value,
including goodwill, of approximately $418 million.
We
evaluate our long-lived assets, including property and equipment and
finite-lived intangible assets for potential impairment on an individual asset
basis or at the lowest level asset grouping for which cash flows can be
separately identified. Intangible asset impairments are assessed whenever
changes in circumstances could indicate that the carrying amounts of those
productive assets exceed their projected undiscounted cash flows. When it is
determined that impairment exists, the related asset group is written down to
its estimated fair market value. The determination of future cash flows and the estimated
fair value of long-lived assets, involve significant estimates on the part of
management. In order to estimate the fair value of a long-lived asset, we may
engage a third party to assist with the valuation.
Our
process for assessing potential triggering events may include, but is not
limited to, analysis of the following:
|
|
§
|
any
sustained decline in the company's stock price below book
value;
|
|
|
§
|
results
of our goodwill impairment test;
|
|
|
§
|
sales
and operating trends affecting products and
groupings;
|
|
|
§
|
the
impact on current and future operating results related to industry
statistics including fluctuation of lending relationships between
financing sources and automobile dealers, actual and projected annual
vehicle sales, the number of dealers within our
network;
|
|
|
§
|
any
losses of key acquired customer relationships;
and
|
|
|
§
|
changes
to or obsolescence of acquired technology, data, and
trademarks.
|
We expect
to continue to experience challenges due to the ongoing adverse outlook for the
credit markets and automobile sales. If events and circumstances were to
continue we may be required to write-off some of our goodwill or long-lived
intangible assets and we could incur a significant non-cash charge to our income
statement.
We also
evaluate the remaining useful life of our long-lived assets on a periodic basis
to determine whether events or circumstances warrant a revision to the remaining
estimated amortization period.
As
discussed in Note 6 of our consolidated financial statements included in this
Annual Report on Form 10-K, during the fourth quarter of 2008, as a result of a
specific event, we recorded an impairment of an intangible asset of
approximately $1.9 million to cost of revenue.
Business
Combinations
In
December 2007, the FASB issued principles and standards which retained the
previous fundamentals of accounting for business combinations, but revised
certain principles, including the definition of a business, the recognition and
measurement of assets acquired and liabilities assumed in a business
combination, the accounting for goodwill, and financial statement disclosure. We
have adopted the revised business combination standards as of January 1, 2009.
The recently adopted business combination standards were applied to our 2009
acquisition of AAX. For further information on the AAX acquisition, please refer
to Note 4 in the accompanying notes to the consolidated financial statements
included in this Annual Report on Form 10-K
Income
Taxes
We
account for income taxes in accordance with the provisions of ASC Topic 740,
Accounting for Income
Taxes, which requires deferred tax assets and liabilities to be
recognized for the future tax consequences attributable to differences between
the consolidated financial statement carrying amounts of assets and liabilities
and their respective tax bases and operating loss and tax credit carryforwards.
Deferred tax assets and liabilities are measured using enacted tax rates
expected to apply to taxable income in the years in which those temporary
differences are expected to be reversed. Deferred tax assets are reduced by a
valuation allowance when, in the opinion of management, it is more likely than
not that some portion or all of the deferred tax assets will not be
realized.
30
The
total liability for the uncertain tax positions recorded in our balance sheet in
accrued other liabilities as of December 31, 2009 and December 31, 2008, was
$0.8 million and $0.5 million, respectively. Interest and penalties, if
any, related to tax positions taken in our tax returns are recorded in interest
expense and general and administrative expenses, respectively, in our
consolidated statement of operations. As of December 31, 2009 and December 31,
2008, we have accrued interest and penalties related to tax positions taken on
our tax returns of approximately $47,000 and $28,000, respectively.
Retail
Sales Tax
The
Ontario Ministry of Revenue (the Ministry) has conducted a retail sales tax
field audit on the financial records of our Canadian subsidiary, DealerTrack
Canada, Inc. (formerly known as DealerAccess Canada, Inc.), for the period from
March 1, 2001 through May 31, 2003. We received a formal assessment
from the Ministry indicating unpaid Ontario retail sales tax totaling
approximately $0.2 million, plus interest. Although we are disputing the
Ministry’s findings, the assessment, including interest, has been paid in order
to avoid potential future interest and penalties.
As part
of the purchase agreement dated December 31, 2003 between us and Bank of
Montreal for the purchase of 100% of the issued and outstanding capital stock of
DealerAccess, Inc., Bank of Montreal agreed to indemnify us specifically for
this potential liability for all sales tax periods prior to January 1,
2004. The potential sales tax liability for the period covered by this
indemnification is now closed due to the statutory expiration of the periods
open for audit by the Ministry. To date, all amounts paid to the Ministry by us
for this assessment have been reimbursed by the Bank of Montreal under this
indemnity.
We
undertook a comprehensive review of the audit findings of the Ministry using
external tax experts. Our position has been that our lender revenue transactions
are not subject to Ontario retail sales tax. We filed a formal Notice of
Objection with the Ministry on December 12, 2005. We received a letter
dated November 2, 2007 from an appeals officer of the Ministry stating that
the assessment was, in his opinion, properly raised and his intention was to
recommend his confirmation to senior management of the Ministry. The officer
agreed, however, to defer his recommendation for a period of thirty business
days to enable us to submit any additional information not yet provided. We
submitted additional information to the Ministry to support our position that
the services are not subject to sales tax.
We
received a letter dated December 21, 2007 from the Ministry stating that no
change should be made to the appeals officer’s opinion. The letter further
stated that we had ninety days from the date of the letter to file a Notice of
Appeal with the Superior Court of Justice. A Notice of Appeal was filed on our
behalf on March 18, 2008 to challenge the assessment because we did not
believe these services are subject to sales tax. On December 15, 2008, the
Ministry filed its response to our Notice of Appeal. The response reiterates the
Ministry’s position that the transactions are subject to Ontario retail sales
tax. The parties have completed the discovery process and we expect this matter
will be heard by the Superior Court in 2010. We have not accrued any related
sales tax liability for the period subsequent to May 31, 2003 for these
lender revenue transactions. This appeal is supported by the financial
institutions whose source revenue transactions were subject to the assessment.
These financial institutions have agreed to participate in the cost of the
litigation.
In the
event we are obligated to charge sales tax for this type of transaction, we
believe this Canadian subsidiary’s contractual arrangements with its lender
customers obligate these customers to pay all sales taxes that are levied or
imposed by any taxing authority by reason of the transactions contemplated under
the particular contractual arrangement. In the event of any failure to pay such
amounts by our customers, we would be required to pay the obligation, which
could range from $5.2 million (CAD) to $5.8 million (CAD), including
penalties and interest.
Stock-Based
Compensation
We have
four types of stock-based compensation programs: stock options, restricted stock
units, restricted common stock, and an employee stock purchase plan
(ESPP).
The
following summarizes stock-based compensation expense recognized for the three
years ended December 31, 2009, 2008 and 2007 (in thousands):
|
Year Ended December 31,
|
||||||||||||
|
2009
|
2008
|
2007
|
||||||||||
|
Stock
options
|
$
|
10,475
|
$
|
8,331
|
$
|
6,333
|
||||||
|
Restricted
common stock
|
4,599
|
5,361
|
4,260
|
|||||||||
|
Restricted
stock units
|
1,855
|
—
|
—
|
|||||||||
|
ESPP
|
60
|
299
|
313
|
|||||||||
|
Total
stock-based compensation expense
|
$
|
16,989
|
$
|
13,991
|
$
|
10,906
|
||||||
31
Stock-based
compensation cost is measured at the grant date based on the fair value of the
award, and recognized as an expense over the requisite service period net of an
estimated forfeiture rate. Determining the appropriate fair value model and
calculating the fair value of the share-based payment awards require the input
of highly subjective assumptions, including the expected life, expected stock
price volatility, and the number of expected options, restricted stock units, or
restricted common stock that will be forfeited prior to the completion of the
vesting requirements. We use the Black-Scholes and binomial lattice-based
valuation pricing models to value our stock-based awards.
Due to
our limited public company history, for the years ended December 31, 2009,
2008 and 2007, the expected volatility and for the year ended December 31,
2009, the expected life of an option grants were determined based on the
expected volatility and expected lives of similar entities whose shares are
publicly traded, except for the expected volatility and expected life
assumptions utilized for awards granted in September 2009 under the Stock Option
Exchange Program (SOEP) and the Long-Term Incentive Plan (LTIP). For the years
ended December 31, 2008 and 2007, the expected lives of options were determined
based on the “simplified” method under the provisions of ASC Topic 718-10, Compensation – Stock
Compensation.
For
options granted in September 2009 under the SOEP, we began estimating our
expected volatility using a time-weighted average of our historical volatility
in combination with the historical volatility of similar entities whose common
shares are publicly traded. We expect to apply this volatility
methodology to future option grants. The expected life under the SOEP
was determined by an independent third party by means of Monte-Carlo simulations
of future stock price based upon “in-the-money”, vesting schedule, contractual
term, current life to date and applied an annual termination rate (after
vesting) to the outstanding options in the simulation to reflect the probability
of exercise behavior. Stock-based compensation expenses related to
the SOEP will be amortized over the new vesting schedule of 25% six months from
the grant date, 25% twelve months from the grant date and 1/48 each month
thereafter.
Awards
granted under the LTIP consisted of 455,000 shares of restricted common stock
(net of cancellations). Each individual’s total award was allocated 50% to
achieving earnings before interest, taxes, depreciation and amortization, as
adjusted to reflect any future acquisitions (EBITDA Performance Award) and 50%
to the market value of our common stock (Market Value Award). The awards were to
be earned upon our achievement of EBITDA and market-based targets for the fiscal
years 2007, 2008 and 2009, but would not vest unless the grantee remains
continuously employed in active service until January 31, 2010. If an
EBITDA Performance Award or Market Value Award was not earned in an earlier
year, it could have been earned upon achievement of that target in a subsequent
year. The awards were subject to acceleration in full upon a change in control.
We valued the EBITDA Performance Award and the Market Value Award using the
Black-Scholes and binomial lattice-based valuation pricing models, respectively.
The total fair value of the entire EBITDA Performance Award was
$6.0 million (prior to estimated forfeitures), of which, in 2007, we began
expensing the amount associated with the 2007 award as it was deemed probable
that the threshold for the year ending December 31, 2007 would be met. The
EBITDA target for 2007 was achieved. As of December 31, 2009, no amounts were
expensed related to the EBITDA Performance Awards for 2008 and 2009 as the
targets were not achieved. The total value of the entire Market Value Award was
$2.5 million (including estimated forfeitures), which was expensed on a
straight-line basis from the date of grant over the applicable service period.
As long as the service condition was satisfied, the expense was not reverseable,
even if the market conditions were not satisfied. During the year ended December
31, 2009, 96,667 shares of long-term performance equity awards were cancelled
and the vesting of 38,333 shares of long-term performance equity awards were
accelerated due to the departure of certain executive officers, most of which
were in connection with the realignment of our workforce and business as
discussed in Note 16. On January 31, 2010, 151,697 shares of long-term
performance equity awards vested relating to the 2007 EBITDA Performance Award
and the 2007 Market Value Award and the remaining 303,303 shares of long-term
performance equity awards were cancelled as the 2008 and 2009 EBITDA and Market
Value targets were not achieved.
Other
assumptions required for estimating fair value with Black-Scholes model are the
expected risk-free interest rate and the expected dividend yield. The
risk-free interests used were the actual U.S. Treasury zero-coupon rates for
bonds matching our expected life of an option on the date of
grant. The expected dividend yield is not applicable as we have not
paid any dividends and current intend to retain any future earnings for use in
our business.
Options
granted generally (SOEP and LTIP exceptions noted above) vest over a period of
four years from the vesting commencement date (three years for directors), and
expire seven years from the date of grant, except for stock options granted
prior to July 11, 2007, which expire ten years from the date of grant and
terminate, to the extent unvested, on the date of termination of employment, and
to the extent vested, generally at the end of the three-month period following
termination of employment, except in the case of executive officers, who under
certain conditions have a twelve-month period following termination of
employment to exercise.
Application
of alternative assumptions could produce significantly different estimates of
the fair value of stock-based compensation and consequently, the related amounts
recognized in our consolidated statements of operations.
As
of December 31, 2009, there was $9.3 million, $5.9 million, and
$5.1 million of unamortized stock-based compensation expense related to
stock options, restricted common stock units, and restricted common stock
awards, respectively. The unamortized stock-based compensation expense related
to stock options and restricted common stock units is expected to be recognized
on a straight line basis over a weighted average remaining period of
1.8076 years and 3.1215 years, respectively. Of the $5.1 million of
unamortized stock-based compensation expense related to restricted common stock
awards, $2.1 million is expected to be recognized on a straight-line basis
over a weighted average remaining period of 0.5384 years. The remaining
$3.0 million of unamortized stock-based compensation expense related to
restricted common stock awards relates to the long-term incentive equity awards,
of which $0.1 million relates to the Market Value Awards and $2.9 million
relates to the EBITDA Performance Awards. Of the $3.0 million of unamortized
stock-based compensation expense related to the long-term incentive equity
awards, $2.9 million will not be expensed due to the cancellation of 303,303
awards on January 31, 2010.
32
Fair
Value Measurements
Fair
value is defined as the exit price, or the amount that would be received to sell
an asset or paid to transfer a liability in an orderly transaction between
market participants at the measurement date. Inputs used to measure fair value
are prioritized into a three-level fair value hierarchy. This hierarchy requires
entities to maximize the use of observable inputs and minimize the use of
unobservable inputs. The three levels of inputs used to measure fair values are
as follows:
|
|
·
|
Level
1 – Quoted prices (unadjusted) in active markets that are accessible at
the measurement date for assets or liabilities. The fair value hierarchy
gives the highest priority to Level 1
inputs.
|
|
|
·
|
Level
2 – Observable prices that are based on inputs not quoted on active
markets, but corroborated by market
data.
|
|
|
·
|
Level
3 – Unobservable inputs are used when little or no market data is
available. The fair value hierarchy gives the lowest priority to Level 3
inputs.
|
We have
segregated all financial assets that are measured at fair value on a recurring
basis into the most appropriate level within the fair value hierarchy based on
the inputs used to determine the fair value at the measurement date in the table
below.
Financial
assets measured at fair value on a recurring basis include the following as of
December 31, 2009 and 2008 (in thousands):
|
As of December 31, 2009
|
Quoted Prices in
Active Markets
(Level 1)
|
Significant Other
Observable
Inputs
(Level 2)
|
Significant
Unobservable
Inputs
(Level 3)
|
December 31,
2009
|
||||||||||||
|
Cash
equivalents (1)
|
$ | 127,608 | $ | — | $ | — | $ | 127,608 | ||||||||
|
Short-term
investments (2)
|
1,484 | — | — | 1,484 | ||||||||||||
|
Long-term
investments (3)
|
— | — | 3,971 | 3,971 | ||||||||||||
|
Total
|
$ | 129,092 | $ | — | $ | 3,971 | $ | 133,063 | ||||||||
|
As of December 31, 2008
|
Quoted Prices in
Active Markets
(Level 1)
|
Significant Other
Observable
Inputs
(Level 2)
|
Significant
Unobservable
Inputs
(Level 3)
|
December 31,
2008
|
||||||||||||
|
Cash
equivalents (1)
|
$ | 124,497 | $ | — | $ | — | $ | 124,497 | ||||||||
|
Short-term
investments (2)(4)
|
42,490 | 860 | — | 43,350 | ||||||||||||
|
Long-term
investments (3)(4)
|
— | 2,842 | 1,550 | 4,392 | ||||||||||||
|
Total
|
$ | 166,987 | $ | 3,702 | $ | 1,550 | $ | 172,239 | ||||||||
|
|
(1)
|
Cash
equivalents consist primarily of money market funds with original maturity
dates of three months or less, for which we determine fair value through
quoted market prices.
|
|
(2)
|
As
of December 31, 2009, Level 1 short-term investments include investments
in tax-advantaged preferred securities. As of December 31, 2008, Level 1
short-term investments consisted primarily of corporate bonds and
municipal notes with maturity dates of one year or less, for which we
determined fair value through quoted market
prices.
|
|
(3)
|
Level
3 long-term investments as of December 31, 2009 and 2008 include a $1.6
million, or 0.3% of total assets, auction rate security (ARS) invested in
a tax-exempt state government obligation that was valued at par. Our
intent is not to hold the ARS invested in tax-exempt state government
obligations to maturity, but rather to use the interest reset feature to
provide liquidity. However, should the marketplace auctions continue to
fail we may hold the security to maturity. We have classified this as
long-term due to the maturity date of the security being in 2011, coupled
with ongoing failed auctions in the
marketplace.
|
Level 3
long-term investments as of December 31, 2009 also include $2.4 million, or 0.5%
of total assets, of tax-advantaged preferred stock of a financial institution.
It is uncertain whether we will be able to liquidate these securities within the
next twelve months; as such we have classified them as long-term on our
consolidated balance sheets. Due to the lack of observable market quotes we
utilized valuation models that rely exclusively on Level 3 inputs including
those that are based on expected cash flow streams, including assessments of
counterparty credit quality, default risk underlying the security, discount
rates and overall capital market liquidity.
33
|
(4)
|
As
of December 31, 2008, Level 2 short-term and long-term investments of $3.7
million (net of impairment charge) consisted of ARS invested in
tax-advantaged preferred stock trusts in which the underlying equities are
preferred stock. Based upon our assessment we reduced the fair value of
the investments in the preferred stock trusts from $9.6 million to $3.7
million and recorded an other-than-temporary charge of $6.0 million to
earnings and an unrealized gain of $0.1 million to stockholders’ equity
during the year ended December 31, 2008. These ARS were associated with
failed auctions.
|
The
change in the carrying amount of Level 3 investments for the years ended
December 31, 2008 and 2009 is as follows (in thousands):
|
Balance
as of January 1, 2008
|
$ | — | ||
|
Reclassification
from Level 1 investments to Level 3 investments
|
169,580 | |||
|
Reclassification
from Level 3 investments to Level 2 investments
|
(3,936 | ) | ||
|
Net
sales of auction rate securities
|
(158,430 | ) | ||
|
Other-than-temporary
impairment included in net income
|
(5,664 | ) | ||
|
Balance
as of December 31, 2008
|
1,550 | |||
|
Reclassification
from Level 2 investments to Level 3 investments (5)
|
1,360 | |||
|
Realized
gain on securities included in the statement of operations
(5)
|
716 | |||
|
Unrealized
gain on securities recorded in other comprehensive income
(5)
|
345 | |||
|
Balance
as of December 31, 2009
|
$ | 3,971 |
|
(5)
|
During
2009 our investments in ARS invested in certain tax-advantaged preferred
stock trusts held as of December 31, 2008 dissolved and the trustees
distributed the underlying preferred stock instruments. As a result of
these conversions we measured the fair value of the Level 3 long-term
tax-advantaged preferred stock on the distribution date and determined
that the value increased from December 31, 2008 and as a result we
recorded a realized gain in the statement of operations of $0.7 million
from $1.4 million to $2.1 million. Subsequent to the trust dissolution
through December 31, 2009 we re-measured the fair value and determined
that the value had increased and recorded a gain in other comprehensive
income of $0.3 million on the increased fair value. The total
value of the tax-advantaged preferred stock of a financial institution
included in the $4.0 million of Level 3 long-term investments as of
December 31, 2009 is $2.4 million.
|
We review
the fair value of our short-term and long-tem investments for impairment in
accordance with ASC Topic 320, Investments – Debt and Equity
Securities. A temporary impairment charge results in an
unrealized loss being recorded in the other comprehensive income component of
stockholders’ equity. It occurs if a loss in an investment is determined to be
temporary in nature and we have the ability and intent to hold the investment
until a recovery in market value takes place. Such an unrealized loss does not
reduce our net income for the applicable accounting period because the loss is
not viewed as other-than-temporary. An impairment charge is recorded against
earnings to the extent we determine that there is a loss of fair value that is
other-than-temporary. For the year end December 31, 2008, we determined that the
significant reduction in fair value related to our preferred stock trusts ARS
was other-than-temporary and we recorded an impairment charge in our
consolidated statements of operations based on a variety of factors, including
the significant decline in fair value indicated for the individual investments
and the adverse market conditions impacting ARS.
Realignment
of Workforce and Business
On
January 5, 2009, we announced a realignment of our workforce and business aimed
at sharpening our focus on high growth opportunities and to reflect current
market conditions. We reduced our workforce by approximately 90 people, or 8% of
our total employees, including several executive and senior-level positions. As
a result of the realignment, we incurred total restructuring costs during the
three months ended March 31, 2009 of approximately $6.7 million, including
approximately $3.9 million of net non-cash compensation expense.
The table
below sets forth the significant cash components and activity associated with
the realignment of workforce and business under the restructuring program for
the year ended December 31, 2009 (in thousands):
|
Balance as of
January 1, 2009
|
Charges
|
Cash Payments
|
Balance as of
December 31, 2009
|
|||||||||||||
|
Severance
|
$ | — | $ | 2,683 | $ | 2,683 | $ | — | ||||||||
|
Other
benefits
|
— | 156 | 156 | — | ||||||||||||
|
Total
|
$ | — | $ | 2,839 | $ | 2,839 | $ | — | ||||||||
34
Results
of Operations
The
following table sets forth, for the periods indicated, the selected consolidated
statements of operations:
|
Year Ended December 31,
|
||||||||||||||||||||||||
|
2009
|
2008
|
2007
|
||||||||||||||||||||||
|
$ Amount
|
% of Net
Revenue
|
$ Amount
|
% of Net
Revenue
|
$ Amount
|
% of Net
Revenue
|
|||||||||||||||||||
|
(In
thousands, except percentages)
|
||||||||||||||||||||||||
|
Consolidated
Statements of Operations:
|
||||||||||||||||||||||||
|
Net
revenue
|
$ | 225,626 | 100.0 | % | $ | 242,706 | 100.0 | % | $ | 233,845 | 100.0 | % | ||||||||||||
|
Operating
expenses:
|
||||||||||||||||||||||||
|
Cost
of revenue (1)
|
113,875 | 50.5 | 113,731 | 46.9 | 99,631 | 42.6 | ||||||||||||||||||
|
Product
development (1)
|
13,994 | 6.2 | 11,658 | 4.8 | 9,808 | 4.2 | ||||||||||||||||||
|
Selling,
general and administrative (1)
|
108,707 | 48.2 | 110,265 | 45.4 | 96,875 | 41.4 | ||||||||||||||||||
|
Total
operating expenses
|
236,576 | 104.9 | 235,654 | 97.1 | 206,314 | 88.2 | ||||||||||||||||||
|
(Loss)
income from operations
|
(10,950 | ) | (4.9 | ) | 7,052 | 2.9 | 27,531 | 11.8 | ||||||||||||||||
|
Interest
income
|
1,081 | 0.5 | 4,720 | 1.9 | 5,606 | 2.4 | ||||||||||||||||||
|
Interest
expense
|
(221 | ) | (0.1 | ) | (324 | ) | (0.1 | ) | (355 | ) | (0.2 | ) | ||||||||||||
|
Other
income, net
|
844 | 0.4 | 205 | 0.1 | 4 | — | ||||||||||||||||||
|
Realized
gain (loss) on securities
|
1,393 | 0.6 | (5,956 | ) | (2.4 | ) | — | — | ||||||||||||||||
|
(Loss)
income before benefit (provision) for income taxes
|
(7,853 | ) | (3.5 | ) | 5,697 | 2.4 | 32,786 | 14.0 | ||||||||||||||||
|
Benefit
(provision) for income taxes, net
|
3,519 | 1.6 | (3,961 | ) | (1.7 | ) | (13,034 | ) | (5.6 | ) | ||||||||||||||
|
Net
(loss) income
|
$ | (4,334 | ) | (1.9 | )% | $ | 1,736 | 0.7 | % | $ | 19,752 | 8.4 | % | |||||||||||
(1)
Stock-based compensation expense recorded for the years ended December 31, 2009,
2008 and 2007 was classified as follows:
|
Year Ended December 31,
|
||||||||||||||||||||||||
|
2009
|
2008
|
2007
|
||||||||||||||||||||||
|
$ Amount
|
% of Net
Revenue
|
$ Amount
|
% of Net
Revenue
|
$ Amount
|
% of Net
Revenue
|
|||||||||||||||||||
|
(In
thousands, except percentages)
|
||||||||||||||||||||||||
|
Cost
of revenue
|
$ | 2,354 | 1.0 | % | $ | 2,497 | 1.0 | % | $ | 2,022 | 0.9 | % | ||||||||||||
|
Product
development
|
755 | 0.3 | 712 | 0.3 | 589 | 0.3 | ||||||||||||||||||
|
Selling,
general and administrative
|
13,880 | 6.2 | 10,782 | 4.4 | 8,295 | 3.5 | ||||||||||||||||||
35
Years
Ended December 31, 2009 and 2008
Revenue
|
Year
Ended December 31,
|
||||||||
|
2009
|
2008
|
|||||||
|
(in
thousands)
|
||||||||
|
Transaction
services revenue
|
$
|
94,406
|
$
|
132,419
|
||||
|
Subscription
services revenue
|
114,931
|
94,690
|
||||||
|
Other
|
16,289
|
15,597
|
||||||
|
Total
net revenue
|
$
|
225,626
|
$
|
242,706
|
||||
Total
net revenue decreased $17.1 million, or 7%, to $225.6 million for the
year ended December 31, 2009 from $242.7 million for the year ended
December 31, 2008.
Transaction Services
Revenue. Transaction services revenue decreased $38.0 million, or
29%, to $94.4 million for the year ended December 31, 2009 from
$132.4 million for the year ended December 31, 2008. The decrease was
primarily due to a 35% decline in the volume of transactions processed through
the DealerTrack network to 51.4 million for the year ended
December 31, 2009 from 79.7 million for the year ended
December 31, 2008, which was impacted by the 24% decrease in our number of
lender to dealer relationships (LDRs) to 118,209 at December 31, 2009 from
156,437 as of December 31, 2008. The decrease in LDRs is primarily due to
lenders continuing to exit the auto financing market, lenders limiting the
number of dealers they lend through and dealership closings. The 35% decrease in
transaction volume resulted in a $47.0 million reduction in revenue for the year
ended December 31, 2009. The tightening of the credit market together with the
continual decline in vehicle sales and captive lenders, and in particular
captives not on the DealerTrack network, increased market share while
independent finance companies and credit unions lost share collectively, has
meaningfully impacted our transaction volume compared to historical levels. The
revenue decline of $47.0 million related to the decrease in transaction volume
was offset by a $9.5 million increase due to an increase in the average
transaction price to $1.84 as of December 31, 2009 from $1.66 as of
December 31, 2008. A contributing factor to the increase in average
transaction price was the 12% increase in lender customers active in our network
to 823 as of December 31, 2009 from 733 as of December 31, 2008. The
additional 90 lender customers added are generally lower transaction volume
customers with higher price per application tiers. Also, with overall lower
transaction volumes, our existing lenders were generally in higher transaction
price tiers.
Subscription Services
Revenue. Subscription services revenue increased $20.2 million, or
21%, to $114.9 million for the year ended December 31, 2009 from
$94.7 million for the year ended December 31, 2008. Subscription
services revenue growth was due to a 23% increase in the average
monthly spend per subscribing dealer to $678 for the year ended December 31,
2009 from $550 for the year ended December 31, 2008. The increase in average
monthly spend per subscribing dealer was positively impacted by the acquisition
of AAX, the success of our DMS solution, our ability to cross sell existing
customers and by the cancellation of a disproportionate number of lower priced
subscriptions as dealerships consolidated. These factors contributed $18.0
million to the increase in subscription services revenue, which includes
$14.3 million related to acquired customers.
Other Revenue. Other revenue
increased $0.7 million, or 4%, to $16.3 million for the year ended December
31, 2009 from $15.6 million for the year ended December 31, 2008. The $0.7
million increase was primarily resulting from an approximately $1.7 million
increase in forms programming, data conversion and training revenue from our DMS
business, offset by a decrease of $0.4 million in revenue associated with our
SCS business which we exited in February 2009, coupled with a decrease in ALG
consulting and analytical revenue of $0.5 million.
Operating
Expenses
|
Year
Ended December 31,
|
||||||||
|
2009
|
2008
|
|||||||
|
(in
thousands)
|
||||||||
|
Cost
of revenue
|
$
|
113,875
|
$
|
113,731
|
||||
|
Product
development
|
13,994
|
11,658
|
||||||
|
Selling,
general and administrative
|
108,707
|
110,265
|
||||||
|
Total
cost of revenue and operating expenses
|
$
|
236,576
|
$
|
235,654
|
||||
36
Cost of Revenue. Cost
of revenue increased $0.1 million to $113.8 million for the year ended
December 31, 2009 from $113.7 million for the year ended
December 31, 2008. The $0.1 million increase was primarily the result
of increased compensation and related benefit costs of $2.5 million due to
increased bonus and other discretionary compensation, which includes $0.4
million of severance and benefit expense resulting from the realignment of our
workforce and business on January 5, 2009 (for further information regarding the
realignment of our workforce and business, please refer to Note 16 in the
accompanying notes to the consolidated financial statement included in this
Annual Report on Form 10-K), increased technology expense of $1.9 million
which includes hosting expenses, technology support, and other consulting
expenses, $0.6 million in software amortization and depreciation charges, $3.5
million in third party costs related to our Compliance and Inventory Management
solutions, $0.9 million in compensation related to an increase in installation
headcount and hardware costs associated with our DMS product offering, and $0.4
million in costs due to opening of a second processing facility in Memphis,
Tennessee for our eDocs solution, offset by a decrease in amortization of
intangible assets of approximately $6.6 million resulting from fully
amortized acquired intangibles and an increase in amortization of intangible
assets during the year ended December 31, 2008 of approximately $1.9 million
related to an impaired application processing contract with DHL where the
remaining amortization was accelerated and recorded to cost of revenue (for
further information regarding this impairment charge, please refer to Note
6 in the accompanying notes to the consolidated financial statements
included in this Annual Report on Form 10-K) , a decrease in revenue share of
$2.1 million, a decrease in cost of revenue for eContracting of $0.5 million due
to a decrease in revenue, and a decrease of $0.3 million in marketing expenses
due to continued cost containment efforts.
Product Development Expenses.
Product development expenses increased $2.3 million, or 20%, to $14.0 million
for the year ended December 31, 2009 from $11.7 million for the year
ended December 31, 2008. The $2.3 million increase was primarily a result
of increased compensation and related benefit costs of $1.9 million due
primarily to increased bonus and other discretionary compensation, including
$0.2 million of severance and benefit expense resulting from the realignment of
our workforce and business on January 5, 2009.
Selling, General and Administrative
Expenses. Selling, general and administrative expenses decreased $1.6
million, or 1%, to $108.7 million for the year ended December 31, 2009 from
$110.3 million for year ended December 31, 2008. The $1.6 million
decrease in selling, general and administrative expenses was primarily the
result of a decrease in professional fees of $6.6 million related primarily to
litigation, a decrease in marketing and travel related expenses of
$1.9 million due to continued cost containment efforts, a decrease in
general and administrative expenses of $2.8 million primarily due to a decrease
in bad debt expense, a decrease in accounting and other professional fees of
$1.1 million, and a decrease of $0.6 million in public company costs related
primarily to recruiting fees paid in 2008 to search for a new member for the
board of directors, reduced compliance costs as a result of hiring internal
resources and a decrease in printing related costs, offset by increased
compensation and related benefit costs of approximately $3.6 million
primarily due to increased bonus and other discretionary compensation, including
$2.2 million of severance and benefit expense resulting from the realignment of
our workforce and business, $3.1 million in increased stock-based
compensation expense related to the realignment of our workforce and business on
January 5, 2009, $0.6 million in depreciation expense, $2.2 million of
professional fees primarily due to an increase in deal-related costs resulting
from the acquisition of AAX and another potential acquisition we decided not to
complete, $0.5 million in occupancy due to the AAX acquisition (for further
information on the AAX acquisition, please refer to Note 4 in the accompanying
notes to the consolidated financial statements included in this Annual Report on
Form 10-K), $0.8 million in selling and an increase of $1.0 million of
contingent earn-out compensation expense relating to AutoStyleMart acquisition
(for further information on the AutoStyleMart earn-out, please refer to Note 4
in the accompanying notes to the consolidated financial statements included in
this Annual Report on Form 10-K).
Interest
Income
|
Year
Ended December 31,
|
||||||||
|
2009
|
2008
|
|||||||
|
(in
thousands)
|
||||||||
|
Interest
Income
|
$ | 1,081 | $ | 4,720 | ||||
Interest
income decreased $3.6 million to $1.1 million for the year ended
December 31, 2009 from $4.7 million for the year ended
December 31, 2008. The $3.6 million decrease is primarily related to the
decrease in our weighted average interest rate to approximately 0.69% for the
year ended December 31, 2009 from approximately 2.38% for the year ended
December 31, 2008.
Other
Income, net
|
Year
Ended December 31,
|
||||||||
|
2009
|
2008
|
|||||||
|
(in
thousands)
|
||||||||
|
Other
Income, net
|
$
|
844
|
$
|
205
|
||||
Other
income increased $0.6 million to $0.8 million for the year ended
December 31, 2009 from $0.2 million for the year ended
December 31, 2008. The $0.6 million increase is primarily due to a reversal
of an Arkona pre-acquisition sales tax liability. The contingency was resolved
subsequent to the close of the purchase accounting allocation period, as such,
the $0.6 million was recorded as other income in the 2009 statement of
operations. For further information on the Arkona acquisition, please refer to
Note 4 in the accompanying notes to the consolidated financial statements
included in this Annual Report on Form 10-K.
37
Realized
Gain (Loss) on Securities
|
Year
Ended December 31,
|
||||||||
|
2009
|
2008
|
|||||||
|
(in
thousands)
|
||||||||
|
Realized
gain (loss) on securities
|
$
|
1,393
|
$
|
(5,956
|
)
|
|||
For the
year ended December 31, 2009, the realized gain of $1.4 million is primarily due
to the sale of a preferred security during the second quarter of
2009.
We
measured the fair value of our auction rate securities at each of the quarters
in 2008, and determined in the third and fourth quarters of 2008 that the
valuation of certain of our auction rate securities had significantly declined
from the previously reported amounts. As a result we recognized a $6.0 million
impairment charge during the year ended December 31, 2008. For further
information regarding this impairment charge, please refer to Note 3 in the
accompanying notes to the consolidated financial statements included in this
Annual Report on Form 10-K.
Benefit
(Provision) for Income Taxes, Net
|
Year
Ended December 31,
|
||||||||
|
2009
|
2008
|
|||||||
|
(in
thousands)
|
||||||||
|
Benefit
(provision) for income taxes, net
|
$
|
3,519
|
$
|
(3,961
|
)
|
|||
The
benefit for income taxes for the year ended December 31, 2009 of
$3.5 million consisted primarily of $5.5 million of federal income tax
benefit and $1.6 million of state income tax benefit, offset by $3.6 million of
tax expense for our Canadian subsidiary. Included in our state income tax
benefit for the year ended December 31, 2009 is $1.1 million, net of reserves of
$0.3 million, for refunds receivable due to the filing of amended tax returns
for certain states. This has a 13.6% impact on the effective tax rate
for the year ended December 31, 2009. The provision for income taxes
for the year ended December 31, 2008 of $4.0 million consisted primarily of $0.7
million of federal tax expense, $0.6 million of state income tax benefit, and
$3.9 million of tax expense for our Canadian subsidiary. Included in tax expense
for our Canadian subsidiary for the year ended December 31, 2009 and 2008 is
$0.7 million and $1.2 million, respectively, for a permanent item relating
to intangible amortization. These amounts have an 8.9% and 20.2% impact on the
effective tax rate for the year ended December 31, 2009 and 2008, respectively.
Our effective tax rate for the year ended December 31, 2009 is 44.8% compared
with 69.5% for the year ended December 31, 2008. The primary reason for the
variation in tax rates is the impairment loss on auction rate securities
recorded during the year ended December 31, 2008. No tax benefit is
recorded with respect to the impairment loss recorded on the auction rate
securities. If such securities were sold and the losses were realized
for tax purposes, the losses on such sales would be capital
losses. Capital losses generally may only be used to offset income
from capital gains. Since we do not anticipate any capital gains in
the foreseeable future, no tax benefit is recorded with respect to the
impairment losses as it is not more likely than not that tax benefits would
ultimately be realized from such losses. A full valuation allowance has been
booked for the losses. Had it not been for the significant tax rate variation
resulting from the impact of the impairment losses, our effective tax rate for
the year ended December 31, 2008 would have been 34.0%. The primary reason for
the increase in tax rate in 2009 compared to the 2008 rate excluding the impact
of the impairment losses is the impact of filing the amended income tax returns
offset by the impact of rate changes on deferred taxes, tax return true-ups,
effect of foreign repatriation, and a decrease in tax exempt or tax preferred
income as a percentage of overall pre-tax income.
In the
event that the future income streams that we currently project do not
materialize, we may be required to record a valuation allowance. Any increase in
a valuation allowance would result in a charge that would adversely impact our
operation performance.
Years
Ended December 31, 2008 and 2007
Revenue
|
Year
Ended December 31,
|
||||||||
|
2008
|
2007
|
|||||||
|
(in
thousands)
|
||||||||
|
Transaction
services revenue
|
$
|
132,419
|
$
|
147,312
|
||||
|
Subscription
services revenue
|
94,690
|
75,061
|
||||||
|
Other
|
15,597
|
11,472
|
||||||
|
Total
net revenue
|
$
|
242,706
|
$
|
233,845
|
||||
Total
net revenue increased $8.9 million, or 4%, to $242.7 million for the
year ended December 31, 2008 from $233.8 million for the year ended
December 31, 2007.
38
Transaction Services
Revenue. Transaction services revenue decreased $14.9 million, or
10%, to $132.4 million for the year ended December 31, 2008 from
$147.3 million for the year ended December 31, 2007. The decrease was
primarily due to a 12% decline in the volume of transactions processed
through the DealerTrack network to 79.7 million for the year ended
December 31, 2008 from 90.9 million for the year ended
December 31, 2007, which was impacted by the 31% decrease in our number of
LDRs to 156,437 at December 31, 2008 from 226,314 at December 31, 2007. The
decrease in LDRs is primarily due to lenders continuing to exit the auto
financing market, lenders limiting the number of dealers they lend through and
dealership closings. The 12% decrease in transaction volume resulted in an $18.2
million reduction in revenue for the year ended December 31, 2008. The
tightening of the credit market together with the continual decline in vehicle
sales, has meaningfully impacted our transaction volume compared to historical
levels. The revenue decline of $18.2 million related to the decrease in
transaction volume was offset by a $3.4 million increase due to the increase in
the average transaction price to $1.66 as of December 31, 2008 from $1.62
as of December 31, 2007. A contributing factor to the increase in average
transaction price was the 37% increase in lender customers active in our network
to 733 as of December 31, 2008 from 536 as of December 31, 2007. The
additional 197 lender customers added are generally lower transaction volume
customers with higher price per application tiers. Also, with overall lower
transaction volumes, our existing lenders were generally in higher transaction
price tiers.
Subscription Services
Revenue. Subscription services revenue increased $19.6 million, or
26%, to $94.7 million for the year ended December 31, 2008 from
$75.1 million for the year ended December 31, 2007. Subscription
services revenue growth was due to a 16% increase in the average
monthly spend per subscribing dealer to $550 for the year ended December 31,
2008 from $474 for the year ended December 31, 2007. The increase in average
monthly spend per subscribing dealer was positively impacted by the success of
our DMS solutions, our ability to cross sell existing customers and by the
cancellation of a disproportionate number of lower priced subscriptions as
dealerships consolidate. These factors contributed $19.5 million to the increase
in revenue, which includes $5.1 million related to acquisitions. In
addition to the $19.5 million increase in subscription service revenue is an
increase of $4.3 million related to Chrome subscription revenue offset by a
decrease of $1.4 million in ALG and other subscription revenue.
Other Revenue. Other revenue
increased $4.1 million, or 36%, to $15.6 million for the year ended
December 31, 2008 from $11.5 million for the year ended December 31, 2007. The
$4.1 million increase was primarily resulting from an approximately $5.4 million
increase in installation revenue from our DMS business acquired in June 2007,
offset by a decrease in other revenue from SCS of $1.3 million.
Operating
Expenses
|
Year
Ended December 31,
|
||||||||
|
2008
|
2007
|
|||||||
|
(in
thousands)
|
||||||||
|
Cost
of revenue
|
$
|
113,731
|
$
|
99,631
|
||||
|
Product
development
|
11,658
|
9,808
|
||||||
|
Selling,
general and administrative
|
110,265
|
96,875
|
||||||
|
Total
cost of revenue and operating expenses
|
$
|
235,654
|
$
|
206,314
|
||||
Cost of Revenue. Cost
of revenue increased $14.1 million, or 14%, to $113.7 million for the
year ended December 31, 2008 from $99.6 million for the year ended
December 31, 2007. The $14.1 million increase was primarily the result
of increased software amortization and depreciation charges of
$2.1 million, coupled with increased compensation and related benefit costs
of $6.2 million and increased occupancy and telecommunications costs of $0.6
million due to headcount additions and salary increases, $2.4 million in
technology expense which includes hosting expenses, technology support, and
other consulting expenses, $2.1 million in cost of revenue from our DMS
business, $0.5 million in increased stock-based compensation expense due to
additional stock options and restricted common stock awards granted since
December 31, 2007, an increase in amortization of intangible assets of
approximately $1.9 million related to an impaired application processing
contract with DHL where the remaining amortization was accelerated and recorded
to cost of revenue (for further information regarding this impairment charge,
please refer to Note 6 in the accompanying notes to the consolidated financial
statements included in this Annual Report on Form 10-K), offset by a decrease in
amortization of intangible assets of approximately $3.3 million resulting from
fully amortized acquired intangibles.
Product Development Expenses.
Product development expenses increased $1.9 million, or 19%, to
$11.7 million for the year ended December 31, 2008 from
$9.8 million for the year ended December 31, 2007. The
$1.9 million increase was primarily a result of increased compensation and
related benefit costs of $1.4 million and occupancy and telecommunications costs
of $0.2 million, both due to overall headcount additions and salary increases,
and increased depreciation expense of $0.2 million.
Selling, General and
Administrative Expenses. Selling, general and administrative expenses
increased $13.4 million, or 14%, to $110.3 million for the year ended
December 31, 2008 from $96.9 million for year ended December 31,
2007. The $13.4 million increase in selling, general and administrative
expenses was primarily the result of increased compensation and related benefit
costs of approximately $6.6 million due to headcount additions and salary
increases, $4.9 million in increased professional fees related primarily to
pending litigation, $2.5 million in increased stock-based compensation
expense due to additional stock options and restricted common stock awards
granted since December 31, 2007 and $0.8 million in increased depreciation
expense, offset by a decrease in marketing expenses of $1.0
million.
39
Interest
Income
|
Year
Ended December 31,
|
||||||||
|
2008
|
2007
|
|||||||
|
(in
thousands)
|
||||||||
|
Interest
Income
|
$
|
4,720
|
$
|
5,606
|
||||
Interest
income decreased $0.9 million to $4.7 million for the year ended
December 31, 2008 from $5.6 million for the year ended
December 31, 2007. The $0.9 million decrease is primarily related to
the decrease in our cash balance attributable to the repurchase of 3.0 million
shares of common stock for an aggregate price of approximately $49.8 million,
and the decrease in our weighted average interest rate to approximately 2.38%
for the year ended December 31, 2008 from approximately 3.99% for the year ended
December 31, 2007.
Realized
Loss on Securities
|
Year
Ended December 31,
|
||||||||
|
2008
|
2007
|
|||||||
|
(in
thousands)
|
||||||||
|
Realized
loss on securities
|
$
|
(5,956
|
)
|
$
|
—
|
|||
Due to
the continued decline in the auction rate securities market we measured the fair
value of our auction rate securities at each of the quarters in 2008, and
determined in the third and fourth quarters of 2008 that the valuation of
certain of our auction rate securities had significantly declined from the
previously reported amounts. As a result we recognized a $6.0 million impairment
charge during the year ended December 31, 2008. For further information
regarding this impairment charge, please refer to Note 3 in the accompanying
notes to the consolidated financial statements included in this Annual Report on
Form 10-K.
Provision
for Income Taxes, Net
|
Year
Ended December 31,
|
||||||||
|
2008
|
2007
|
|||||||
|
(in
thousands)
|
||||||||
|
Provision
for income taxes, net
|
$
|
(3,961
|
)
|
$
|
(13,034
|
)
|
||
The
provision for income taxes for the year ended December 31, 2008 of
$4.0 million consisted primarily of $0.7 million of federal tax
expense, $0.6 of state income tax benefit, and $3.9 million of tax expense
for our Canadian subsidiary. The provision for income taxes for the year ended
December 31, 2007 of $13.0 million consisted primarily of
$8.3 million of federal tax expense, $2.1 million of state and local
income taxes, $0.5 million of adjustments due primarily to the changes in
the New York State tax rate, and $2.1 million of tax expense for our Canadian
subsidiaries. Included in tax expense for our Canadian subsidiary for the year
ended December 31, 2008 and 2007 is $1.2 million and $1.1 million, respectively,
for a permanent item relating to intangible amortization. These amounts have a
20.2% and 3.4% impact on the effective tax rate for the year ended December 31,
2008 and 2007, respectively. Our effective tax rate for the year ended December
31, 2008 is 69.5% compared with 39.8% for the year ended December 31,
2007. The primary reason for the variation in tax rates is the
impairment loss on auction rate securities recorded during the year ended
December 31, 2008. No tax benefit is recorded with respect to the
impairment loss recorded on the auction rate securities. If such
securities were sold and the losses were realized for tax purposes, the losses
on such sales would be capital losses. Capital losses generally may
only be used to offset income from capital gains. Since we do not
anticipate any capital gains in the foreseeable future, no tax benefit is
recorded with respect to the impairment losses as it is not more likely than not
that tax benefits would ultimately be realized from such losses. A full
valuation allowance has been booked for the losses. Had it not been for the
significant tax rate variation resulting from the impact of the impairment
losses, our effective tax rate for the year ended December 31, 2008 would have
been 34.0 % compared with 39.8% for the year ended December 31, 2007. The
primary reason for the reduction in tax rate are the impact of rate changes on
deferred taxes, tax return true-ups, and an increase in tax exempt or tax
preferred income as a percentage of overall pre-tax income. The rate reduction
attributable to tax return true-ups is primarily the result of state and local
tax reductions due to planning initiatives.
In the
event that the future income streams that we currently project do not
materialize, we may be required to record a valuation allowance. Any increase in
a valuation allowance would result in a charge that would adversely impact our
operation performance.
40
Quarterly
Results of Operations
The
following table presents our unaudited quarterly consolidated results of
operations for each of the eight quarters ended December 31, 2009. The
unaudited quarterly consolidated information has been prepared substantially on
the same basis as our audited consolidated financial statements. You should read
the following tables presenting our quarterly consolidated results of operations
in conjunction with our audited consolidated financial statements for our full
years and the related notes. This table includes all adjustments, consisting
only of normal recurring adjustments, that we consider necessary for the fair
statement of our consolidated financial position and operating results for the
quarters presented. The operating results for any quarters are not necessarily
indicative of the operating results for any future period.
|
First
|
Second
|
Third
|
Fourth
|
|||||||||||||
|
Quarter
(3)
|
Quarter
|
Quarter
|
Quarter
|
|||||||||||||
|
(Unaudited)
|
||||||||||||||||
|
(In
thousands, except for share and per share data)
|
||||||||||||||||
|
2009
|
||||||||||||||||
|
Net
revenue
|
$
|
55,700
|
$
|
57,870
|
$
|
58,809
|
$
|
53,247
|
||||||||
|
Gross
profit
|
26,579
|
29,018
|
30,144
|
26,010
|
||||||||||||
|
Operating
(loss) income
|
(9,871
|
)
|
224
|
1,282
|
(2,585
|
)
|
||||||||||
|
Net
(loss) income
|
(5,625
|
)
|
2,187
|
(215
|
)
|
(681
|
)
|
|||||||||
|
Basic
net (loss) income per share applicable to common stockholders
(1)
|
$
|
(0.14
|
)
|
$
|
0.05
|
$
|
(0.01
|
)
|
$
|
(0.02
|
)
|
|||||
|
Diluted
net (loss) income per share applicable to common stockholders
(1)
|
$
|
(0.14
|
)
|
$
|
0.05
|
$
|
(0.01
|
)
|
$
|
(0.02
|
)
|
|||||
|
Weighted
average common stock outstanding (basic)
|
39,095,730
|
39,499,313
|
39,705,553
|
39,787,985
|
||||||||||||
|
Weighted
average shares common stock outstanding (diluted)
|
39,095,730
|
40,458,174
|
39,705,553
|
39,787,985
|
||||||||||||
|
First
|
Second
|
Third
|
Fourth
|
|||||||||||||
|
Quarter
|
Quarter
|
Quarter
(4)
|
Quarter
(5)
|
|||||||||||||
|
(Unaudited)
|
||||||||||||||||
|
(In
thousands, except for share and per share data)
|
||||||||||||||||
|
2008
|
||||||||||||||||
|
Net
revenue
|
$
|
64,308
|
$
|
63,181
|
$
|
60,525
|
$
|
54,692
|
||||||||
|
Gross
profit
|
35,696
|
35,302
|
32,585
|
25,392
|
||||||||||||
|
Operating
income (loss)
|
2,822
|
4,208
|
3,056
|
(3,034
|
)
|
|||||||||||
|
Net
income (loss)
|
2,338
|
3,066
|
(2,603
|
)
|
(1,065
|
)
|
||||||||||
|
Basic
net income (loss) per share applicable to common stockholders (1)
(2)
|
$
|
0.05
|
$
|
0.07
|
$
|
(0.07
|
)
|
$
|
(0.03
|
)
|
||||||
|
Diluted
net income (loss) per share applicable to common stockholders (1)
(2)
|
$
|
0.05
|
$
|
0.07
|
$
|
(0.07
|
)
|
$
|
(0.03
|
)
|
||||||
|
Weighted
average common stock outstanding (basic)
|
41,637,585
|
41,505,451
|
39,769,935
|
38,963,048
|
||||||||||||
|
Weighted
average shares common stock outstanding (diluted)
|
42,805,884
|
42,609,342
|
39,769,935
|
38,963,048
|
||||||||||||
|
(1)
|
The addition of earnings per
share by quarter may not equal total earnings per share for the
year.
|
|
(2)
|
Earnings
per share data for each of the quarters in the year ended December 31,
2008 have been retroactively adjusted to conform to the provisions of ASC
Topic 260, Earnings Per
Share, which did not have a significant impact on our historical
earnings per share calculations. For further information, please refer to
Note 2 in the accompanying notes to the consolidated financial
statements included in this Annual Report on Form
10-K.
|
|
(3)
|
Included
in the first quarter of 2009 net loss is a restructuring cost of
approximately $6.7 million, including approximately $3.9 million of net
non-cash compensation expense, related to the realignment of our workforce
and business on January 5, 2009. For further information, please refer to
Note 16 in the accompanying notes to the consolidated financial statements
included in this Annual Report on Form
10-K.
|
|
(4)
|
Included in the third quarter of
2008 net loss is an impairment charge of $5.7 million, related to the
significant decline in certain auction rate securities. For further
information, please refer to Note 3 in the accompanying notes
to the consolidated financial statements included in this Annual Report on
Form 10-K.
|
41
|
(5)
|
Included
in the fourth quarter of 2008 net loss is an impairment charge of $0.3
million, related to the significant decline in certain auction rate
securities, as described in Note 3 in the accompanying notes to the
consolidated financial statements included in this Annual Report on Form
10-K, and a charge of $1.9 million, related to the impairment of an
application processing contract with DHL, as described in Note 6 in the
accompanying notes to the consolidated financial statements included in
this Annual Report on Form 10-K.
|
Our
liquidity requirements will continue to be for working capital, acquisitions,
capital expenditures and general corporate purposes. Our capital expenditures,
software and website development costs for the year ended December 31, 2009
were $21.3 million, of which $18.4 million was in cash. We expect to
finance our future liquidity needs through working capital and cash flows from
operations, however future acquisitions or other strategic initiatives may
require us to incur or seek additional financing.
As
of December 31, 2009, we had $197.5 million of cash and cash
equivalents, $1.5 million in short-term investments, $4.0 million in non-current
investments and $191.9 million in working capital, as compared to
$155.5 million of cash and cash equivalents, $43.3 million in short-term
investments, $4.4 million in non-current investments and $197.8 million in
working capital as of December 31, 2008.
Reductions
in interest rates and changes in investments could materially impact our
interest income and may negatively impact future reported operating results and
earnings per share.
Based on
our available cash and other investments, we do not currently anticipate a lack
of liquidity caused by failed auctions will have a material adverse effect on
our operating cash flows. For further information regarding our auction rate
securities, please refer to Note 3 in the accompanying notes to the
consolidated financial statements included in this Annual Report on Form
10-K.
As of
December 31, 2008, $25.2 million remained in our stock repurchase program. No
additional stock repurchases were made during 2009 and the program was
terminated on March 31, 2009.
On
January 23, 2009, we acquired the AAX ® suite of inventory management solutions
and other assets from JM Dealer Services, Inc., a subsidiary of JM Family
Enterprises, Inc., for a purchase price of $30.9 million in cash, net of a $1.7
million purchase price adjustment. We expensed approximately $0.5 million of
professional fees associated with the acquisition. For further information,
please refer to Note 4 in the accompanying notes to the consolidated
financial statements included in this Annual Report on Form 10-K.
Under the
terms of the merger agreement with AutoStyleMart, Inc., we have future
contingent payment obligations of up to $11.0 million based upon the achievement
of certain operational targets from February 2008 through February 2011. As of
December 31, 2009, we determined that certain operational targets were probable
of being achieved and recorded a liability of $1.0 million. The additional
consideration of $1.0 million was deemed compensation for services, as payment
was contingent on certain former stockholders remaining employees or consultants
of DealerTrack for a certain period. The $1.0 million was recorded as a selling,
general and administrative expense for the year ended December 31, 2009. As of
December 31, 2009, it has been determined that the operational targets relating
to the remaining $10.0 million in contingent payment obligations are not yet
probable of being achieved. Any future amounts deemed probable in the future
will also be recorded as a selling, general and administrative
expense.
Under the
terms of the merger agreement with Curomax Corporation, we had future contingent
payment obligations of up to $1.8 million in cash based upon the achievement of
certain operational targets over the subsequent twenty-four months. As of
December 31, 2008, we determined that certain operational conditions have been
met and as such, recorded a liability and additional goodwill of approximately
$1.8 million. The additional consideration of $1.8 million was paid out in the
first quarter of 2009.
In
connection with the purchase of Automotive Lease Guide (ALG) on May 25, 2005, we
have a contractual agreement with the seller to pay an additional $0.8 million
per year for 2006 through 2010. There was additional contingent consideration of
up to $11.3 million that could be paid contingent upon future increases in
revenue of ALG and another one of our subsidiaries through December 2009. The
total amount of consideration that has been paid or accrued as of December 31,
2009 was $3.1 million. The additional purchase price consideration was recorded
as goodwill on our consolidated balance sheet.
On
February 10, 2010, DealerTrack, Inc., a subsidiary of DealerTrack Holdings, Inc.
(DealerTrack) entered into a strategic relationship with GMAC. Under the
terms of the agreement, GMAC will be listed as a financing option on the
DealerTrack credit application processing network and DealerTrack has agreed to
make a one-time payment to GMAC of $15.0 million payable upon GMAC becoming
available to substantially all dealers that it does business with who are on the
DealerTrack U.S. network. The one-time $15.0 million payment will be
recorded ratably as a reduction to revenue over an estimated period of five
years. GMAC will be available to General Motors and Chrysler dealers, as
well as dealers of other manufacturers that GMAC elects to do business with.
GMAC will continue to accept credit applications through the RouteOne
system.
42
|
Year
Ended December 31,
|
||||||||||||
|
2009
|
2008
|
2007
|
||||||||||
|
(in
thousands)
|
||||||||||||
|
Net
cash provided by operating activities
|
$
|
45,467
|
$
|
61,494
|
$
|
56,926
|
||||||
|
Net
cash (used in) provided by investing activities
|
(8,283
|
)
|
94,874
|
(168,725
|
)
|
|||||||
|
Net
cash provided by (used in) financing activities
|
2,109
|
(47,816
|
)
|
114,216
|
||||||||
Operating
Activities
Net cash
provided by operating activities of $45.5 million for the year ended
December 31, 2009 was primarily attributable to net loss of $4.3 million,
which includes depreciation and amortization of $35.1 million, stock-based
compensation expense of $17.0 million, an increase to the provision for doubtful
accounts and sales credits of $7.7 million, an increase in accounts payable and accrued
expenses of $3.0 million, a decrease in prepaid expenses and other current
assets of $3.7 million, partially offset by a deferred tax benefit of $7.3
million, an increase in accounts receivable of $6.3 million due to an increase
in subscription revenues and the acquisition of AAX , a stock-based compensation
windfall tax benefit of $0.7 million, a gain of $1.4 million realized on the
sale or conversion of securities, a decrease in other long-term liabilities of
$0.6 million, and a $0.6 million reversal of an Arkona pre-acquisition sales tax
liability contingency resolved subsequent to the close of the purchase
accounting allocation period. Net cash provided
by operating activities of $61.5 million for the year ended December 31,
2008 was primarily attributable to net income of $1.7 million, which
includes depreciation and amortization of $40.1 million, stock-based
compensation expense of $14.0 million, an increase to the provision for doubtful
accounts and sales credits of $9.6 million, an impairment recognized on
auction rate securities of $6.0 million (for further information regarding this
impairment charge, please refer to Note 3 in the accompanying notes to the
consolidated financial statements included in this Annual Report on Form 10-K),
an increase to deferred revenue and other current liabilities of
$1.7 million, and an increase in other long-term liabilities of $1.5
million, partially offset by decreases in accounts payable and accrued expenses
of $6.7 million, a deferred tax benefit of $2.1 million, a stock-based
compensation windfall tax benefit of $0.4 million, an increase in prepaid
expenses and other current assets of $2.9 million, and an increase in accounts
receivable of $1.6 million. Net cash provided by operating activities of
$56.9 million for the year ended December 31, 2007 was primarily
attributable to net income of $19.8 million, which includes depreciation
and amortization of $38.5 million, stock-based compensation expense of
$10.9 million, an increase to the provision for doubtful accounts and sales
credits of $6.8 million, an increase in accounts payable and accrued
expenses of $3.9 million and an increase to deferred revenue and other
current liabilities of $0.6 million, partially offset by a deferred tax
benefit of $4.6 million, a stock-based compensation windfall tax benefit of
$7.0 million, an increase in accounts receivable (including related party)
of $11.0 million due to an overall increase in revenue.
Investing
Activities
Net
cash used in investing activities of $8.3 million for the year ended December
31, 2009 was primarily attributable to the sale of short-term investments of
$44.6 million offset by the payment for the acquisition of AAX business and
intangible assets of $30.9 million, the payment of the Curomax additional
purchase consideration of $1.8 million, the payment of ALG additional purchase
consideration of $1.9 million, capital expenditures of $5.4 million, capitalized
software and website development costs of $13.0 million. Net cash provided by
investing activities of $94.9 million for the year ended December 31, 2008
was primarily attributable to the net sale of investments of $115.8 million
offset by capital expenditures of $6.5 million, capitalized software and
website development costs of $8.6 million, and the payment for net assets
acquired of $6.0 million. Net cash used in investing activities of $168.7
million for the year ended December 31, 2007 was primarily attributable to
capital expenditures of $7.2 million, capitalized software and website
development costs of $6.5 million, payment for net assets acquired of
$109.6 million, and the net purchase of short-term investments of
$45.5 million.
Financing
Activities
Net
cash provided by financing activities of $2.1 million for the year ended
December 31, 2009 was primarily attributable to net proceeds received from the
exercise of employee stock options of $2.2 million, employee stock purchases
under our employee stock purchase plan of $0.9 million, and a stock-based
compensation windfall tax benefit of $0.7 million, partially offset by payment
for shares surrendered for taxes of $0.4 million related to restricted stock
vesting, principal payments on notes payable of $0.8 million, and principal
payments on capital lease obligations of $0.4 million. Net cash used in
financing activities of $47.8 million for the year ended December 31, 2008
was primarily attributable to the repurchase of 3.0 million shares of common
stock for an aggregate price of approximately $49.8 million, offset by net
proceeds received from employee stock purchases under our employee stock
purchase plan of $1.7 million and the exercise of employee stock options of
$1.0 million. Net cash provided by financing activities of $114.2 million for
the year ended December 31, 2007 was primarily attributable to the receipt
of cash proceeds from our public offering of $102.2 million, the exercise
of employee stock options of $4.0 million, net proceeds received from
employee stock purchases under our employee stock purchase plan of
$1.8 million, and stock-based compensation windfall tax benefit of
$7.0 million, offset by principal payments on note payable and capital
lease obligations of $0.7 million.
43
Contractual
Obligations
The
following table summarizes our contractual obligations as of December 31,
2009:
|
Less
Than
|
After
|
|||||||||||||||||||
|
Total
|
1
Year
|
1-3
Years
|
4-5
Years
|
5
Years
|
||||||||||||||||
|
(In
thousands)
|
||||||||||||||||||||
|
Operating
lease obligations
|
$ | 28,934 | $ | 4,952 | $ | 8,361 | $ | 6,069 | $ | 9,552 | ||||||||||
|
Capital
lease obligations
|
762 | 466 | 296 | — | — | |||||||||||||||
|
Payments
due to acquirees
|
2,888 | 2,888 | — | — | — | |||||||||||||||
|
Total
contractual cash obligation
|
$ | 32,584 | $ | 8,306 | $ | 8,657 | $ | 6,069 | $ | 9,552 | ||||||||||
Payments
due to acquirees are non-interest bearing and fixed in nature.
Pursuant
to employment or severance agreements with certain employees, we have a
commitment to pay severance of approximately $4.2 million as of December
31, 2009, in the event of termination without cause, as defined in the
agreements, as well as certain potential gross-up payments to the extent any
such severance payment would constitute an excess parachute payment under the
Internal Revenue Code. We also have a commitment to pay additional severance of
approximately $1.9 million as of December 31, 2009, if there is a change in
control.
Under the
terms of the merger agreement with AutoStyleMart, Inc., we have future
contingent payment obligations of up to $11.0 million based upon the
achievement of certain operational targets from February 2008 through
February 2011. As of December 31, 2009,
we determined that certain operational conditions were probable of being
achieved and recorded a liability in accrued expenses of $1.0 million. The
additional consideration of $1.0 million was deemed a contingent earn-out
compensation expense for services on certain former stockholders remaining
employees or consultants of DealerTrack for a certain period. The $1.0 million
was recorded as a selling, general and administrative expense for the year ended
December 31, 2009. As of December 31, 2009, it has been determined
that the operational targets related to the remaining $10.0 million in
contingent payment obligations are not yet probable of being achieved. Any
future amounts deemed probable will also be recorded as a selling, general and
administrative expense.
In
connection with the purchase of Automotive Lease Guide on May 25, 2005, we have
a contractual agreement with the seller to pay an additional $0.8 million per
year for 2006 through 2010. There was additional contingent consideration of up
to $11.3 million that could be paid contingent upon future increases in revenue
of ALG and another one of our subsidiaries through December 2009. The total
amount of contingent consideration remaining to be paid as of December 31, 2009
was $1.1 million. The additional purchase price consideration was
recorded as goodwill on our consolidated balance sheet.
On
February 10, 2010, DealerTrack, Inc., a subsidiary of DealerTrack Holdings, Inc.
(DealerTrack) entered into a strategic relationship with GMAC. Under the
terms of the agreement, GMAC will be listed as a financing option on the
DealerTrack credit application processing network and DealerTrack has agreed to
make a one-time payment to GMAC of $15.0 million payable upon GMAC becoming
available to substantially all dealers that it does business with who are on the
DealerTrack U.S. network. The one-time $15.0 million payment will be
recorded ratably as a reduction to revenue over an estimated period of five
years. GMAC will be available to General Motors and Chrysler dealers, as
well as dealers of other manufacturers that GMAC elects to do business with.
GMAC will continue to accept credit applications through the RouteOne
system.
Off-Balance
Sheet Arrangements
We
do not have any off-balance sheet arrangements or relationships with
unconsolidated entities or financial partnerships, such as entities often
referred to as structured finance or special purpose entities, which are
typically established for the purpose of facilitating off-balance sheet
arrangements or other contractually narrow or limited purposes.
Effects
of Inflation
Our
monetary assets, consisting primarily of cash and cash equivalents, receivables
and long-term investments, and our non-monetary assets, consisting primarily of
intangible assets and goodwill, are not affected significantly by inflation. We
believe that replacement costs of equipment, furniture and leasehold
improvements will not materially affect our operations. However, the rate of
inflation affects our expenses, which may not be readily recoverable in the
prices of products and services we offer.
44
Recent
Accounting Pronouncements
In
October 2009, the Financial Accounting Standards Board (FASB) issued Revenue
Recognition guidance around Multiple-Deliverable Revenue Arrangements, a
consensus of the FASB Emerging Issues Task Force. This guidance modifies the
fair value requirements of Revenue Recognition-Multiple Element Arrangements by
allowing the use of the “best estimate of selling price” in addition to VSOE and
VOE (now referred to as third-party evidence or TPE) for determining the selling
price of a deliverable. A vendor is now required to use its best estimate of the
selling price when VSOE or TPE of the selling price cannot be determined. In
addition, the residual method of allocating arrangement consideration is no
longer permitted. The final consensus is effective for fiscal years beginning
after June 15, 2010. Companies will have the option of adopting the guidance
retrospectively or prospectively for new or materially modified agreements.
Early adoption is permitted as of the beginning of an entity’s fiscal year. We
are currently evaluating the impact of this guidance on our consolidated
financial statements.
In June
2009, the FASB issued the The
FASB
Accounting Standards Codification™ (the Codification) which
became the single authoritative U.S. accounting and reporting standards
applicable for all nongovernmental entities, with the exception of
guidance issued by the Securities and Exchange Commission (SEC). The
Codification does not change current U.S. GAAP, but changes the referencing of
financial standards, and is intended to simplify user access to authoritative
U.S. GAAP by providing all the authoritative literature related to a particular
topic in one place. The Codification is effective for interim and annual periods
ending after September 15, 2009, and was effective for our third quarter of
2009. At that time, all references made to U.S. GAAP used the new Codification
numbering system prescribed by the FASB.
The
Codification does not change or alter existing U.S. GAAP and did not have any
impact on our consolidated financial position, cash flows, or results of
operations.
In June
2009, the FASB issued a new standard which modified how a company determines
when it is required to consolidate an entity and is based on, among other
things, an entity’s purpose and design, a company’s ability to direct the
activities of the entity that most significantly impact the entity’s economic
performance, and the obligation to absorb losses or the right to receive
benefits from the entity that could potentially be significant to the variable
interest entity. This new standard requires an ongoing reassessment of whether a
company is the primary beneficiary of a variable interest entity and also
requires additional disclosures about a company’s involvement in variable
interest entities and any significant changes in risk exposure due to that
involvement. This standard is effective for fiscal years beginning after
November 15, 2009. We are currently evaluating the impact of this guidance on
our consolidated financial statements.
Foreign
Currency Exposure
We
only have operations located in, and provide services to, customers in the
United States and Canada. Our earnings are affected by fluctuations in the value
of the U.S. dollar as compared with the Canadian dollar. Our exposure is
mitigated, in part, by the fact that we incur certain operating costs in the
same foreign currency in which revenue is denominated. The foreign currency
exposure that does exist is limited by the fact that the majority of
transactions are paid according to our standard payment terms, which are
generally short-term in nature.
Interest
Rate Exposure
As
of December 31, 2009, we had cash, cash equivalents, short-term investments
and long-term investments of $203.0 million invested in money market
instruments, municipal notes, tax-exempt state government obligations and tax
advantaged preferred securities. Such investments are subject to interest rate
and credit risk. Our general policy of investing in securities with original
maturities of three months or less minimizes our interest and credit
risk.
Reductions
in interest rates and changes in investments could materially impact our
interest income and may negatively impact future reported operation results and
earnings per share. An interest rate fluctuation of 1% would have an effect of
approximately $1.1 million, or $0.03 per share, on future reported operating
results.
45
Item 8. Financial
Statements and Supplementary Data
INDEX
TO FINANCIAL STATEMENTS AND FINANCIAL STATEMENT SCHEDULE
|
Page
|
||||
|
DEALERTRACK
HOLDINGS, INC.:
|
|
|||
|
Report
of Independent Registered Public Accounting
Firm
|
47
|
|||
|
Consolidated
Balance Sheets
|
48
|
|||
|
Consolidated
Statements of Operations
|
49
|
|||
|
Consolidated
Statements of Cash Flows
|
50
|
|||
|
Consolidated
Statements of Stockholders’ Equity and Comprehensive
Income
|
51
|
|||
|
Notes
to Consolidated Financial Statements
|
54
|
|||
|
Schedule II
— Valuation and Qualifying Accounts
|
78
|
|||
46
Report
of Independent Registered Public Accounting Firm
To the
Board of Directors and Stockholders of DealerTrack Holdings, Inc.:
In our
opinion, the consolidated financial statements listed in the accompanying index
present fairly, in all material respects, the financial position of DealerTrack
Holdings, Inc. and its subsidiaries at December 31, 2009 and 2008, and the
results of their operations and their cash flows for each of the three years in
the period ended December 31, 2009 in conformity with accounting principles
generally accepted in the United States of America. In addition, in our opinion,
the financial statement schedule listed in the accompanying index presents
fairly, in all material respects, the information set forth therein when read in
conjunction with the related consolidated financial statements. Also in our
opinion, the Company maintained, in all material respects, effective internal
control over financial reporting as of December 31, 2009, based on criteria
established in Internal
Control — Integrated Framework issued by the Committee of Sponsoring
Organizations of the Treadway Commission (COSO). The Company’s management is
responsible for these financial statements and the financial statement schedule,
for maintaining effective internal control over financial reporting and for its
assessment of the effectiveness of internal control over financial reporting,
included in Management’s Report on Internal Control Over Financial Reporting
appearing under Part II, Item 9A in this Annual Report on Form 10-K.
Our responsibility is to express opinions on these financial statements, on the
financial statement schedule, and on the Company’s internal control over
financial reporting based on our integrated audits. We conducted our audits in
accordance with the standards of the Public Company Accounting Oversight Board
(United States). Those standards require that we plan and perform the audits to
obtain reasonable assurance about whether the financial statements are free of
material misstatement and whether effective internal control over financial
reporting was maintained in all material respects. Our audits of the financial
statements included examining, on a test basis, evidence supporting the amounts
and disclosures in the financial statements, assessing the accounting principles
used and significant estimates made by management, and evaluating the overall
financial statement presentation. Our audit of internal control over financial
reporting included obtaining an understanding of internal control over financial
reporting, assessing the risk that a material weakness exists, and testing and
evaluating the design and operating effectiveness of internal control based on
the assessed risk. Our audits also included performing such other procedures as
we considered necessary in the circumstances. We believe that our audits provide
a reasonable basis for our opinions.
A
company’s internal control over financial reporting is a process designed to
provide reasonable assurance regarding the reliability of financial reporting
and the preparation of financial statements for external purposes in accordance
with generally accepted accounting principles. A company’s internal control over
financial reporting includes those policies and procedures that (i) pertain
to the maintenance of records that, in reasonable detail, accurately and fairly
reflect the transactions and dispositions of the assets of the company;
(ii) provide reasonable assurance that transactions are recorded as
necessary to permit preparation of financial statements in accordance with
generally accepted accounting principles, and that receipts and expenditures of
the company are being made only in accordance with authorizations of management
and directors of the company; and (iii) provide reasonable assurance
regarding prevention or timely detection of unauthorized acquisition, use, or
disposition of the company’s assets that could have a material effect on the
financial statements.
Because
of its inherent limitations, internal control over financial reporting may not
prevent or detect misstatements. Also, projections of any evaluation of
effectiveness to future periods are subject to the risk that controls may become
inadequate because of changes in conditions, or that the degree of compliance
with the policies or procedures may deteriorate.
|
/s/
PricewaterhouseCoopers LLP
|
New York,
New York
February 24,
2010
47
DEALERTRACK
HOLDINGS, INC.
CONSOLIDATED
BALANCE SHEETS
|
December 31,
|
||||||||
|
2009
|
2008
|
|||||||
|
(In thousands,
|
||||||||
|
except share and per share
|
||||||||
|
amounts)
|
||||||||
|
ASSETS
|
||||||||
|
Current
assets
|
||||||||
|
Cash
and cash equivalents
|
$ | 197,509 | $ | 155,456 | ||||
|
Short-term
investments
|
1,484 | 43,350 | ||||||
|
Accounts
receivable, net of allowances of $2,677 and $1,848 as of December 31,
2009 and 2008, respectively
|
17,478 | 18,462 | ||||||
|
Prepaid
expenses and other current assets
|
6,844 | 9,624 | ||||||
|
Deferred
tax assets
|
2,776 | 2,195 | ||||||
|
Restricted
cash
|
— | 142 | ||||||
|
Total
current assets
|
226,091 | 229,229 | ||||||
|
Long-term
investments
|
3,971 | 4,392 | ||||||
|
Property
and equipment, net
|
13,514 | 13,448 | ||||||
|
Software
and website developments costs, net
|
21,158 | 12,705 | ||||||
|
Intangible
assets, net
|
41,604 | 44,405 | ||||||
|
Goodwill
|
134,747 | 114,886 | ||||||
|
Restricted
cash
|
250 | 250 | ||||||
|
Deferred
taxes and other long-term assets
|
30,992 | 17,900 | ||||||
|
Total
assets
|
$ | 472,327 | $ | 437,215 | ||||
|
LIABILITIES
AND STOCKHOLDERS’ EQUITY
|
||||||||
|
Current
liabilities
|
||||||||
|
Accounts
payable
|
$ | 3,919 | $ | 4,488 | ||||
|
Accrued
compensation and employee benefits
|
11,717 | 7,850 | ||||||
|
Accrued
liabilities — other
|
11,324 | 11,385 | ||||||
|
Deferred
revenues
|
4,992 | 5,609 | ||||||
|
Due
to acquirees
|
1,820 | 1,740 | ||||||
|
Capital
leases payable
|
425 | 360 | ||||||
|
Total
current liabilities
|
34,197 | 31,432 | ||||||
|
Capital
leases payable — long-term
|
281 | 454 | ||||||
|
Due
to acquirees — long-term
|
— | 682 | ||||||
|
Deferred
tax liabilities — long-term
|
11,083 | 2,477 | ||||||
|
Deferred
revenue and other long-term liabilities
|
5,880 | 5,950 | ||||||
|
Total
liabilities
|
51,441 | 40,995 | ||||||
|
Commitments
and contingencies (Note 14)
|
||||||||
|
Stockholders’
equity
|
||||||||
|
Preferred
stock, $0.01 par value; 10,000,000 shares authorized and no shares issued
and outstanding at December 31, 2009 and 2008,
respectively
|
— | — | ||||||
|
Common
stock, $0.01 par value; 175,000,000 shares authorized; 43,469,945 shares
issued and 40,430,330 shares outstanding at December 31, 2009; and
42,841,737 shares issued and 39,833,616 shares outstanding at
December 31, 2008
|
435 | 428 | ||||||
|
Treasury
stock, at cost, 3,039,615 and 3,008,121 shares as of December 31,
2009 and 2008, respectively
|
(50,440 | ) | (50,061 | ) | ||||
|
Additional
paid-in capital
|
448,816 | 428,771 | ||||||
|
Deferred
stock-based compensation
|
— | (446 | ) | |||||
|
Accumulated
other comprehensive income
|
6,151 | (2,730 | ) | |||||
|
Retained
earnings
|
15,924 | 20,258 | ||||||
|
Total
stockholders’ equity
|
420,886 | 396,220 | ||||||
|
Total
liabilities and stockholders’ equity
|
$ | 472,327 | $ | 437,215 | ||||
The
accompanying notes are an integral part of these financial
statements.
48
DEALERTRACK
HOLDINGS, INC.
CONSOLIDATED
STATEMENTS OF OPERATIONS
|
Year Ended December 31,
|
||||||||||||
|
2009
|
2008
|
2007
|
||||||||||
|
(In thousands, except per share and share amounts)
|
||||||||||||
|
Revenue
|
||||||||||||
|
Net
revenue
|
$ | 225,626 | $ | 242,706 | $ | 233,845 | ||||||
|
Operating
expenses :
|
||||||||||||
|
Cost
of revenue (1)
|
113,875 | 113,731 | 99,631 | |||||||||
|
Product
development (1)
|
13,994 | 11,658 | 9,808 | |||||||||
|
Selling,
general and administrative (1)
|
108,707 | 110,265 | 96,875 | |||||||||
|
Total
operating expenses
|
236,576 | 235,654 | 206,314 | |||||||||
|
(Loss)
income from operations
|
(10,950 | ) | 7,052 | 27,531 | ||||||||
|
Interest
income
|
1,081 | 4,720 | 5,606 | |||||||||
|
Interest
expense
|
(221 | ) | (324 | ) | (355 | ) | ||||||
|
Other
income, net
|
844 | 205 | 4 | |||||||||
|
Realized gain (loss)
on securities (Note 3)
|
1,393 | (5,956 | ) | — | ||||||||
|
(Loss)
income before benefit (provision) for income taxes
|
(7,853 | ) | 5,697 | 32,786 | ||||||||
|
Benefit
(provision) for income taxes, net
|
3,519 | (3,961 | ) | (13,034 | ) | |||||||
|
Net
(loss) income
|
$ | (4,334 | ) | $ | 1,736 | $ | 19,752 | |||||
|
Basic
net (loss) income per share applicable to common stockholders
(2)
|
$ | (0.11 | ) | $ | 0.04 | $ | 0.49 | |||||
|
Diluted
net (loss) income per share applicable to common stockholders
(2)
|
$ | (0.11 | ) | $ | 0.04 | $ | 0.47 | |||||
|
Weighted
average common stock outstanding (basic)
|
39,524,544 | 40,461,896 | 39,351,138 | |||||||||
|
Weighted
average common stock outstanding (diluted)
|
39,524,544 | 41,538,379 | 40,886,482 | |||||||||
|
(1)
|
Stock-based
compensation expense recorded for the years ended December 31, 2009, 2008
and 2007 was classified as follows:
|
|
Year Ended December 31,
|
||||||||||||
|
2009 (3)
|
2008
|
2007
|
||||||||||
|
(In thousands)
|
||||||||||||
|
Cost
of revenue
|
$ | 2,354 | $ | 2,497 | $ | 2,022 | ||||||
|
Product
development
|
755 | 712 | 589 | |||||||||
|
Selling,
general and administrative
|
13,880 | 10,782 | 8,295 | |||||||||
|
(2)
|
Earnings
per share data presented for the years ended December 31, 2008 and 2007
have been retroactively adjusted to conform to the provisions of ASC Topic
260,Earnings Per
Share, which did not have a significant impact on our historical
earnings per share calculation. For further information, please refer to
Note 2.
|
|
(3)
|
Included
in stock-based compensation expense for the year ended December 31, 2009
was $3.9 million of stock-based compensation expense related to the
realignment of our workforce and business on January 5, 2009. For further
information, please refer to Note
16.
|
The
accompanying notes are an integral part of these financial
statements
49
DEALERTRACK
HOLDINGS, INC.
CONSOLIDATED
STATEMENTS OF CASH FLOWS
|
Year Ended December 31,
|
||||||||||||
|
2009
|
2008
|
2007
|
||||||||||
|
(In thousands)
|
||||||||||||
|
Operating
activities:
|
||||||||||||
|
Net
(loss) income
|
$ | (4,334 | ) | $ | 1,736 | $ | 19,752 | |||||
|
Adjustments
to reconcile net (loss) income to net cash provided by operating
activities:
|
||||||||||||
|
Depreciation
and amortization
|
35,059 | 40,076 | 38,479 | |||||||||
|
Deferred
tax benefit
|
(7,262 | ) | (2,051 | ) | (4,631 | ) | ||||||
|
Stock-based
compensation expense
|
16,989 | 13,991 | 10,906 | |||||||||
|
Provision
for doubtful accounts and sales credits
|
7,698 | 9,639 | 6,767 | |||||||||
|
(Gain) loss
on sale of property and equipment
|
(184 | ) | — | 17 | ||||||||
|
Reversal
of pre-acquisition accrued contingency
|
(609 | ) | — | |||||||||
|
Amortization
of bond premium
|
56 | 132 | — | |||||||||
|
Amortization
of deferred interest
|
152 | 178 | 187 | |||||||||
|
Deferred
compensation
|
300 | 264 | 294 | |||||||||
|
Amortization
of bank financing costs
|
— | 30 | 122 | |||||||||
|
Stock-based
compensation windfall tax benefit
|
(673 | ) | (418 | ) | (6,995 | ) | ||||||
|
Realized
(gain) loss on securities
|
(1,393 | ) | 5,956 | — | ||||||||
|
Changes
in operating assets and liabilities, net of effects of
acquisitions:
|
||||||||||||
|
Accounts
receivable
|
(6,342 | ) | (1,634 | ) | (10,973 | ) | ||||||
|
Prepaid
expenses and other current assets
|
3,725 | (2,928 | ) | (1,286 | ) | |||||||
|
Accounts
payable and accrued expenses
|
3,025 | (6,678 | ) | 3,905 | ||||||||
|
Deferred
revenue and other current liabilities
|
14 | 1,650 | 567 | |||||||||
|
Other
long-term liabilities
|
(642 | ) | 1,501 | 19 | ||||||||
|
Deferred
rent
|
145 | 473 | 86 | |||||||||
|
Other
long-term assets
|
(257 | ) | (423 | ) | (290 | ) | ||||||
|
Net
cash provided by operating activities
|
45,467 | 61,494 | 56,926 | |||||||||
|
Investing
activities:
|
||||||||||||
|
Capital
expenditures
|
(5,360 | ) | (6,502 | ) | (7,189 | ) | ||||||
|
Restricted
cash
|
142 | 149 | — | |||||||||
|
Purchase
of investments
|
— | (549,159 | ) | (554,445 | ) | |||||||
|
Sale
of investments
|
44,569 | 664,932 | 508,980 | |||||||||
|
Capitalized
software and website development costs
|
(13,021 | ) | (8,560 | ) | (6,474 | ) | ||||||
|
Proceeds
from sale of property and equipment
|
109 | 3 | 8 | |||||||||
|
Payment
for acquisition of business and intangible assets, net of acquired
cash
|
(34,722 | ) | (5,989 | ) | (109,605 | ) | ||||||
|
Net
cash (used in) provided by investing activities
|
(8,283 | ) | 94,874 | (168,725 | ) | |||||||
|
Financing
activities:
|
||||||||||||
|
Principal
payments on capital lease obligations
|
(414 | ) | (742 | ) | (229 | ) | ||||||
|
Proceeds
from the exercise of employee stock options
|
2,202 | 951 | 4,009 | |||||||||
|
Proceeds
from employee stock purchase plan
|
875 | 1,691 | 1,779 | |||||||||
|
Purchase
of treasury stock
|
(379 | ) | (49,922 | ) | (108 | ) | ||||||
|
Proceeds
from public offerings, net of expenses
|
— | — | 102,192 | |||||||||
|
Principal
payments on notes payable
|
(848 | ) | (212 | ) | (422 | ) | ||||||
|
Stock-based
compensation windfall tax benefit
|
673 | 418 | 6,995 | |||||||||
|
Net
cash provided by (used in) financing activities
|
2,109 | (47,816 | ) | 114,216 | ||||||||
|
Net
increase in cash and cash equivalents
|
39,293 | 108,552 | 2,417 | |||||||||
|
Effect
of exchange rate changes on cash and cash equivalents
|
2,760 | (3,660 | ) | 1,067 | ||||||||
|
Cash
and cash equivalents, beginning of year
|
155,456 | 50,564 | 47,080 | |||||||||
|
Cash
and cash equivalents, end of year
|
$ | 197,509 | $ | 155,456 | $ | 50,564 | ||||||
|
Year Ended December 31,
|
||||||||||||
|
2009
|
2008
|
2007
|
||||||||||
|
(In thousands)
|
||||||||||||
|
Supplemental
disclosure:
|
||||||||||||
|
Cash
paid for:
|
||||||||||||
|
Income
taxes
|
$ | 4,961 | $ | 6,995 | $ | 15,308 | ||||||
|
Interest
|
60 | 128 | 153 | |||||||||
|
Non-cash
investing and financing activities:
|
||||||||||||
|
Asset
sale through note receivable
|
500 | — | — | |||||||||
|
Assets
acquired under capital leases
|
307 | — | 219 | |||||||||
|
Acquisition
of capitalized software through note payable
|
— | 867 | — | |||||||||
|
Accrued
capitalized hardware, software and fixed assets
|
2,515 | 795 | 1,186 | |||||||||
|
Payable
for acquired intangible assets
|
— | 500 | — | |||||||||
|
Deferred
compensation reversal to equity
|
300 | 264 | 360 | |||||||||
|
Capitalized
stock-based compensation
|
133 | 59 | — | |||||||||
The
accompanying notes are an integral part of these financial
statements.
50
DEALERTRACK
HOLDINGS, INC.
CONSOLIDATED
STATEMENTS OF STOCKHOLDERS’ EQUITY AND
COMPREHENSIVE
INCOME
|
Accumulated
|
Retained
|
||||||||||||||||||||||||||||||||||||||||||
|
Common Stock,
|
Additional
|
Deferred
|
Other
|
Earnings
|
Total
|
||||||||||||||||||||||||||||||||||||||
|
Preferred Stock
|
Common Stock
|
In Treasury
|
Paid-In
|
Stock-Based
|
Comprehensive
|
(Accumulated
|
Stockholders’
|
Comprehensive
|
|||||||||||||||||||||||||||||||||||
|
Shares
|
Amount
|
Shares
|
Amount
|
Shares
|
Amount
|
Capital
|
Compensation
|
Income (Loss)
|
Deficit)
|
Equity
|
Income
|
||||||||||||||||||||||||||||||||
|
(In thousands, except share amounts)
|
|||||||||||||||||||||||||||||||||||||||||||
|
Balance
as of January
1, 2007
|
—
|
$
|
—
|
39,358,769
|
$
|
393
|
1,219
|
$
|
(31
|
)
|
$
|
289,490
|
$
|
(4,322
|
)
|
$
|
37
|
$
|
(1,230
|
)
|
$
|
284,337
|
|||||||||||||||||||||
|
Exercise
of stock options
|
—
|
—
|
633,320
|
6
|
—
|
—
|
4,003
|
—
|
—
|
—
|
4,009
|
||||||||||||||||||||||||||||||||
|
Directors
deferred compensation stock units
|
—
|
—
|
8,133
|
—
|
—
|
—
|
294
|
—
|
—
|
—
|
294
|
||||||||||||||||||||||||||||||||
|
Officers
deferred compensation stock units
|
—
|
—
|
2,177
|
—
|
—
|
—
|
66
|
—
|
—
|
—
|
66
|
||||||||||||||||||||||||||||||||
|
Issuances
of common stock under employee stock purchase plan
|
—
|
—
|
59,202
|
2
|
—
|
—
|
1,777
|
—
|
—
|
—
|
1,779
|
||||||||||||||||||||||||||||||||
|
Compensation
expense related to the employee stock purchase plan
|
—
|
—
|
—
|
—
|
—
|
—
|
314
|
—
|
—
|
—
|
314
|
||||||||||||||||||||||||||||||||
|
Tax
benefit from the exercise of stock options and restricted common
stock
|
—
|
—
|
—
|
—
|
—
|
—
|
6,995
|
—
|
—
|
—
|
6,995
|
||||||||||||||||||||||||||||||||
|
Foreign
currency translation adjustment
|
—
|
—
|
—
|
—
|
—
|
—
|
—
|
—
|
8,144
|
—
|
8,144
|
8,144
|
|||||||||||||||||||||||||||||||
|
Treasury
stock
|
—
|
—
|
—
|
—
|
2,983
|
(108
|
)
|
—
|
—
|
—
|
(108
|
)
|
|||||||||||||||||||||||||||||||
|
Issuance
of restricted common stock grants
|
—
|
—
|
235,725
|
2
|
—
|
—
|
(2
|
)
|
—
|
—
|
—
|
—
|
|||||||||||||||||||||||||||||||
|
Stock-based
compensation expense (APB 25)
|
—
|
—
|
—
|
—
|
—
|
—
|
—
|
1,729
|
—
|
—
|
1,729
|
||||||||||||||||||||||||||||||||
|
Stock-based
compensation expense (FAS 123(R))
|
—
|
—
|
—
|
—
|
—
|
—
|
4,604
|
—
|
—
|
—
|
4,604
|
||||||||||||||||||||||||||||||||
|
Restricted
common stock-based compensation expense (APB 25)
|
—
|
—
|
—
|
—
|
—
|
—
|
—
|
397
|
—
|
—
|
397
|
||||||||||||||||||||||||||||||||
|
Restricted
common stock-based compensation expense (FAS 123(R))
|
—
|
—
|
—
|
—
|
—
|
—
|
3,862
|
—
|
—
|
—
|
3,862
|
||||||||||||||||||||||||||||||||
|
Options
and restricted share cancellations
|
—
|
—
|
(40,401
|
)
|
—
|
—
|
—
|
(140
|
)
|
140
|
—
|
—
|
—
|
||||||||||||||||||||||||||||||
|
Issuance
of common stock — public offering
|
—
|
—
|
2,300,000
|
23
|
—
|
—
|
102,169
|
—
|
—
|
—
|
102,192
|
||||||||||||||||||||||||||||||||
|
Other
|
—
|
—
|
—
|
—
|
—
|
—
|
(4
|
)
|
—
|
—
|
—
|
(4
|
)
|
||||||||||||||||||||||||||||||
|
Net
income
|
—
|
—
|
—
|
—
|
—
|
—
|
—
|
—
|
—
|
19,752
|
19,752
|
19,752
|
|||||||||||||||||||||||||||||||
|
Comprehensive
income
|
$
|
27,896
|
|||||||||||||||||||||||||||||||||||||||||
|
Balance
as of December 31, 2007
|
—
|
$
|
—
|
42,556,925
|
$
|
426
|
4,202
|
$
|
(139
|
)
|
$
|
413,428
|
$
|
(2,056
|
)
|
$
|
8,181
|
$
|
18,522
|
$
|
438,362
|
||||||||||||||||||||||
51
|
Accumulated
|
Retained
|
|||||||||||||||||||||||||||||||||||||||||||||||
|
Common Stock,
|
Additional
|
Deferred
|
Other
|
Earnings
|
Total
|
|||||||||||||||||||||||||||||||||||||||||||
|
Preferred
Stock
|
Common Stock
|
In Treasury
|
Paid-In
|
Stock-Based
|
Comprehensive
|
(Accumulated
|
Stockholders’
|
Comprehensive
|
||||||||||||||||||||||||||||||||||||||||
|
Shares
|
Amount
|
Shares
|
Amount
|
Shares
|
Amount
|
Capital
|
Compensation
|
Income (Loss)
|
Deficit)
|
Equity
|
Income
|
|||||||||||||||||||||||||||||||||||||
|
(In thousands, except share amounts)
|
||||||||||||||||||||||||||||||||||||||||||||||||
|
Exercise of stock options
|
— | — | 102,182 | 1 | — | — | 950 | — | — | — | 951 | |||||||||||||||||||||||||||||||||||||
|
Directors
deferred compensation stock units
|
— | — | 17,638 | — | — | — | 264 | — | — | — | 264 | |||||||||||||||||||||||||||||||||||||
|
Issuances
of common stock under employee stock purchase plan
|
— | — | 123,587 | 1 | — | — | 1,690 | — | — | — | 1,691 | |||||||||||||||||||||||||||||||||||||
|
Compensation
expense related to the employee stock purchase plan
|
— | — | — | — | — | — | 299 | — | — | — | 299 | |||||||||||||||||||||||||||||||||||||
|
Tax
benefit from the exercise of stock options and restricted common
stock
|
— | — | — | — | — | — | (1 | ) | — | — | — | (1 | ) | |||||||||||||||||||||||||||||||||||
|
Foreign
currency translation adjustment
|
— | — | — | — | — | — | — | — | (10,926 | ) | — | (10,926 | ) | (10,926 | ) | |||||||||||||||||||||||||||||||||
|
Treasury
stock
|
— | — | — | — | 3,003,919 | (49,922 | ) | — | — | — | (49,922 | ) | ||||||||||||||||||||||||||||||||||||
|
Unrealized
gain on auction rate securities
|
— | — | — | — | — | — | — | — | 15 | — | 15 | 15 | ||||||||||||||||||||||||||||||||||||
|
Issuance
of restricted common stock grants
|
— | — | 49,357 | — | — | — | — | — | — | — | ||||||||||||||||||||||||||||||||||||||
|
Stock-based
compensation expense (APB 25)
|
— | — | — | — | — | — | — | 1,196 | — | — | 1,196 | |||||||||||||||||||||||||||||||||||||
|
Stock-based
compensation expense (FAS 123(R))
|
— | — | — | — | — | — | 7,191 | — | — | — | 7,191 | |||||||||||||||||||||||||||||||||||||
|
Restricted
common stock-based compensation expense (APB 25)
|
— | — | — | — | — | — | — | 342 | — | — | 342 | |||||||||||||||||||||||||||||||||||||
|
Restricted
common stock-based compensation expense (FAS 123(R))
|
— | — | — | — | — | — | 5,022 | — | — | — | 5,022 | |||||||||||||||||||||||||||||||||||||
|
Options
and restricted share cancellations
|
— | — | (7,952 | ) | — | — | — | (72 | ) | 72 | — | — | — | |||||||||||||||||||||||||||||||||||
|
Net
income
|
— | — | — | — | — | — | — | — | — | 1,736 | 1,736 | 1,736 | ||||||||||||||||||||||||||||||||||||
|
Comprehensive
income
|
$ | 18,721 | ||||||||||||||||||||||||||||||||||||||||||||||
|
Balance
as of December 31, 2008
|
— | $ | — | 42,841,737 | $ | 428 | 3,008,121 | $ | (50,061 | ) | $ | 428,771 | $ | (446 | ) | $ | (2,730 | ) | $ | 20,258 | $ | 396,220 | ||||||||||||||||||||||||||
52
|
Accumulated
|
Retained
|
|||||||||||||||||||||||||||||||||||||||||||||||
|
Common Stock,
|
Additional
|
Deferred
|
Other
|
Earnings
|
Total
|
|||||||||||||||||||||||||||||||||||||||||||
|
Preferred Stock
|
Common Stock
|
In Treasury
|
Paid-In
|
Stock-Based
|
Comprehensive
|
(Accumulated
|
Stockholders’
|
Comprehensive
|
||||||||||||||||||||||||||||||||||||||||
|
Shares
|
Amount
|
Shares
|
Amount
|
Shares
|
Amount
|
Capital
|
Compensation
|
Income (Loss)
|
Deficit)
|
Equity
|
Income
|
|||||||||||||||||||||||||||||||||||||
|
(In thousands, except share amounts)
|
||||||||||||||||||||||||||||||||||||||||||||||||
|
Exercise
of stock options
|
— | — | 592,964 | 6 | — | — | 2,196 | — | — | — | 2,202 |
|
||||||||||||||||||||||||||||||||||||
|
Directors
deferred compensation stock units
|
— | — | 18,097 | — | — | — | 300 | — | — | — | 300 |
|
||||||||||||||||||||||||||||||||||||
|
Issuances
of common stock under employee stock purchase plan
|
— | — | 61,595 | 1 | — | — | 874 | — | — | — | 875 |
|
||||||||||||||||||||||||||||||||||||
|
Compensation
expense related to the employee stock purchase plan
|
— | — | — | — | — | — | 60 | — | — | — | 60 |
|
||||||||||||||||||||||||||||||||||||
|
Foreign
currency translation adjustment
|
— | — | — | — | — | — | — | — | 7,928 | — | 7,928 | 7,928 | ||||||||||||||||||||||||||||||||||||
|
Treasury
stock
|
— | — | — | — | 31,494 | (379 | ) | — | — | — | (379 | ) | ||||||||||||||||||||||||||||||||||||
|
Unrealized
gain on auction rate securities
|
— | — | — | — | — | — | — | — | 953 | — | 953 | 953 | ||||||||||||||||||||||||||||||||||||
|
Issuance
of restricted common stock grants
|
— | — | 61,243 | 1 | — | — | (1 | ) | — | — | — | — | ||||||||||||||||||||||||||||||||||||
|
Stock-based
compensation expense (APB 25)
|
— | — | — | — | — | — | — | 280 | — | — | 280 | |||||||||||||||||||||||||||||||||||||
|
Stock-based
compensation expense (FAS 123(R))
|
— | — | — | — | — | — | 10,314 | — | — | — | 10,314 | |||||||||||||||||||||||||||||||||||||
|
Restricted
common stock-based compensation expense (APB 25)
|
— | — | — | — | — | — | — | 118 | — | — | 118 | |||||||||||||||||||||||||||||||||||||
|
Restricted
common stock-based compensation expense (FAS 123(R))
|
— | — | — | — | — | — | 6,350 | — | — | — | 6,350 | |||||||||||||||||||||||||||||||||||||
|
Options
and restricted share cancellations
|
— | — | (105,691 | ) | (1 | ) | — | — | (48 | ) | 48 | — | — | (1 | ) | |||||||||||||||||||||||||||||||||
|
Net
(loss)
|
— | — | — | — | — | — | — | — | — | (4,334 | ) | (4,334 | ) | (4,334 | ) | |||||||||||||||||||||||||||||||||
|
Comprehensive
income
|
$ | 23,268 | ||||||||||||||||||||||||||||||||||||||||||||||
|
Balance
as of December 31, 2009
|
— | $ | — | 43,469,945 | $ | 435 | 3,039,615 | $ | (50,440 | ) | $ | 448,816 | $ | — | $ | 6,151 | $ | 15,924 | $ | 420,886 | ||||||||||||||||||||||||||||
The
accompanying notes are an integral part of these financial
statements.
53
DEALERTRACK
HOLDINGS, INC.
NOTES
TO CONSOLIDATED FINANCIAL STATEMENTS
1.
Business Description
DealerTrack’s
intuitive and high-value software solutions enhance efficiency and profitability
for all major segments of the automotive retail industry, including dealers,
lenders, OEMs, agents and aftermarket providers. We believe our solution set for
dealers is the industry’s most comprehensive. DealerTrack operates the
industry’s largest online credit application network, connecting approximately
17,000 dealers with over 800 lenders. Our dealer management system (DMS)
provides dealers with easy-to-use tools with real-time data access that will
streamline any automotive business. With our inventory management solution,
DealerTrack AAX, dealers get better data along with the tools to make smarter,
more profitable inventory decisions. Our sales and finance & insurance
(F&I) solution enables dealers to streamline the entire sales process,
quickly structuring all types of deals from a single integrated platform.
DealerTrack’s compliance solution helps dealers meet legal and regulatory
requirements and protect their hard-earned assets. DealerTrack’s family of
companies also includes data, accessories and consulting services providers,
Automotive Lease Guide (ALG) and Chrome Systems (Chrome).
2.
Summary of Significant Accounting Policies
The
consolidated financial statements of DealerTrack Holdings, Inc. have been
prepared in accordance with accounting principles generally accepted in the
United States of America.
Basis of
Presentation
The
accompanying consolidated financial statements include the accounts of
DealerTrack Holdings, Inc. and its wholly-owned subsidiaries. All intercompany
transactions and balances have been eliminated.
Use of
Estimates
The preparation of consolidated financial statements in conformity with
accounting principles generally accepted in the United States of
America require management to make estimates and assumptions that
affect the reported amounts and the disclosure of contingent amounts in our
consolidated financial statements and the accompanying notes. Actual results
could differ from those estimates.
On
an on-going basis, we evaluate our estimates, including those related to the
accounts receivable allowance, the fair value of financial assets, acquired
intangible assets, goodwill, and other assets and liabilities; the useful lives
of intangible assets, property and equipment, capitalized software and website
development costs; assumptions used to calculate stock-based compensation
including volatility, expected term and forfeiture; and income taxes, among
others. We base our estimates on historical experience and on other various
assumptions that are believed to be reasonable, the results of which form the
basis for making judgments about the carrying values of assets and
liabilities.
Revenue
Recognition
Transaction Services
Revenue. Transaction services revenue consists of revenue earned from our
lender customers for each credit application or contract that dealers submit to
them. We also earn transaction services revenue from lender customers for each
financing contract executed via our electronic contracting and digital contract
processing solutions, as well as for any portfolio residual value analyses we
perform for them. We also earn transaction services revenue from dealers or
other service and information providers, such as aftermarket providers, and
credit report providers, for each fee-bearing product accessed by
dealers.
We
offer web-based service to lenders for the electronic receipt of credit
application data and contract data for automotive financing transactions in
consideration for a transaction fee. This service is sold based upon contracts
that include fixed or determinable prices and that do not include the right of
return or other similar provisions or significant post service obligations.
Credit application and digital and electronic contracting processing revenue is
recognized on a per transaction basis, after customer receipt and when
collectability is reasonably assured. Set-up fees charged to the lenders for
establishing connections, if any, are recognized ratably over the expected
customer relationship period of four years.
Our
credit report service provides our dealer customers the ability to access credit
reports from several major credit reporting agencies or resellers online. We
sell this service based upon contracts with the customer or report provider, as
applicable, that include fixed or determinable prices and that does not include
the right of return or other similar provisions or other significant post
service obligations. We recognize credit report revenue on a per transaction
basis, when services are rendered and when collectability is reasonably assured.
We offer these credit reports on both a reseller and an agency basis. We
recognize revenue from all but one provider of credit reports on a net basis due
to the fact that we are not considered the primary obligor, and recognize
revenue on a gross basis with respect to one of the providers as we have the
risk of loss and are considered the primary obligor in the
transaction.
Subscription Services
Revenue. Subscription services revenue consists of revenue earned from
our customers (typically on a monthly basis) for use of our subscription or
license-based products and services. Some of these subscription services enable
dealer customers to manage their dealership data and operations, compare various
financing and leasing options and programs, sell insurance and other aftermarket
products, analyze inventory and execute financing contracts electronically.
These subscription services are typically sold based upon contracts that include
fixed or determinable prices and that do not include the right of return or
other similar provisions or significant post service obligations. We recognize
revenue from such contracts ratably over the contract period. We recognize
set-up fees, if any, ratably over the expected customer relationship of three
years. For contracts that contain two or more products or services, we recognize
revenue in accordance with the above policy using relative fair
value.
54
Other Revenue.
Other revenue consists of revenue primarily earned through training and
start up fees from our DMS solution, shipping commissions earned from our
digital contract business and consulting and analytical revenue earned from
ALG.
Our
revenue is presented net of a provision for sales credits, which is estimated
based on historical results, and established in the period in which services are
provided.
Shipping Costs
Shipping
charges billed to customers are included in net revenue, and the related
shipping costs are included in cost of revenue.
Cash and
Cash Equivalents
Cash
and cash equivalents consist of cash and highly liquid investments purchased
with original maturity of three months or less.
Short-term
and long-term Investments
Short-term
and long-term investments as of December 31, 2009 consist of auction rate
securities that are invested in tax-exempt state government obligations and
tax-advantaged preferred securities. Short-term and long-term investments as of
December 31, 2008 consist of corporate bonds, municipal notes, and auction rate
securities (ARS) that are invested in tax-exempt state government obligations
and tax-advantaged preferred securities. We classify investment securities as
available for sale, and as a result, report the investments at fair value. For
the years ended December 31, 2009, 2008 and 2007, there were unrealized gains of
$1.0 million, $15,000, and $0 included in accumulated other comprehensive
income, respectively. For further information regarding the fair value
measurements of our investments, please refer to Note 3.
Translation of Non-U.S. Currencies
We
have maintained business operations in Canada since January 1, 2004. The
translation of assets and liabilities denominated in foreign currency into U.S.
dollars is made at the prevailing rate of exchange at the balance sheet date.
Revenue, costs and expenses are translated at the average exchange rates during
the period. Translation adjustments are reflected in accumulated other
comprehensive income on our consolidated balance sheets, while gains and losses
resulting from foreign currency transactions are included in our consolidated
statements of operations. Amounts resulting from foreign currency transactions
included in our statement of operations were not material for the years ended
December 31, 2009, 2008 and 2007.
Allowance
for Doubtful Accounts
We
maintain an allowance for doubtful accounts for estimated losses resulting from
the inability of our customers to make required payments. The amount of the
allowance account is based on historical experience and our analysis of the
accounts receivable balance outstanding. While credit losses have historically
been within our expectations and the provisions established, we cannot guarantee
that we will continue to experience the same credit loss rates that we have in
the past. If the financial condition of our customers were to deteriorate,
resulting in their inability to make payments, additional allowances may be
required which would result in an additional expense in the period that this
determination was made.
Property,
Equipment and Depreciation
Property
and equipment are stated at cost less accumulated depreciation, which is
provided for by charges to income over the estimated useful lives of the assets
using the straight-line method. Maintenance and repairs are charged to operating
expenses as incurred. Upon sale or other disposition, the applicable amounts of
asset cost and accumulated depreciation are removed from the accounts and the
net amount, less proceeds from disposal, is charged or credited to
income.
Software and Website Development Costs and Amortization
We
capitalize costs of materials, consultants and payroll and payroll-related costs
incurred by employees involved in developing internal use computer software.
Costs incurred during the preliminary project and post-implementation stages are
charged to expense. Software and website development costs are amortized on a
straight-line basis over estimated useful lives ranging from two to four years.
We perform periodic reviews to ensure that unamortized software and website
costs remain recoverable from future revenue. Capitalized software and website
development costs, net were $21.2 million and $12.7 million as of
December 31, 2009 and 2008, respectively. Amortization expense totaled
$7.6 million, $7.4 million and $6.2 million for the years ended
December 31, 2009, 2008 and 2007, respectively.
Goodwill,
Other Intangibles and Long-lived Assets
We
record as goodwill the excess of purchase price over the fair value of the
tangible and identifiable intangible assets acquired. Goodwill is tested
annually for impairment as well as whenever events or circumstances change that
would make it more likely than not that an impairment may have occurred.
Goodwill is tested for impairment using a two-step approach. The first step
tests for potential goodwill impairment by comparing the fair value of our one
reporting unit to its carrying value. If the fair value of the reporting unit is
less than its carrying value the second step is to record an impairment loss to
the extent that the implied fair value of the goodwill of the reporting unit is
less than its carrying value.
55
Goodwill
is required to be assessed at the operating segment or lower level. We
determined that the components of our one operating segment have similar
economic characteristics, nature of products, distribution, shared resources and
type of customer such that the components should be aggregated into a single
reporting unit for purposes of performing the impairment test for goodwill. We
perform our annual impairment analysis as of the first day of the fourth
quarter. The evaluation of impairment involves comparing the current estimated
fair value of our reporting unit to the carrying value, including goodwill. We
estimate the fair value of our reporting unit by primarily using a market
capitalization approach, and also looking at the outlook for the business. The
results of our most recent annual assessments performed on October 1, 2009 and
2008 did not indicate any impairment of our goodwill.
Subsequent
to our October 1, 2008 goodwill impairment test, our market capitalization was
impacted by the volatility in the U.S. equity markets. For ten days
between October 24, 2008 and November 21, 2008, the day of January 21, 2009 and
for six trading days between March 3, 2009 and March 10, 2009, our market
capitalization was on average approximately 5% below the approximately $405
million carrying value of our consolidated net assets, as of October 1, 2008.
The periods between October 24, 2008 and November 21, 2008 and March 3, 2009 to
March 10, 2009 coincided with the overall stock market’s low periods for 2008,
and 2009, respectively.
Despite the fact that our market capitalization traded below our book value for
a brief period of time, we believed that there had not been an impairment
anytime during 2009 or 2008, based on the limited duration and depth of the
market decline. In addition, there was no factoring of an implied control
premium. A control premium is the amount that a buyer is willing to pay
over the current market price of a company as indicated by the market
capitalization, in order to acquire a controlling interest. The premium is
justified by the expected synergies, such as the expected increase in cash flow
resulting from the cost savings and revenue enhancements. As of December 31,
2008, our market capitalization was approximately $475 million compared to our
book value, including goodwill, of approximately $396 million. As of October 1,
2009, our market capitalization was approximately $750 million compared to our
book value, including goodwill, of approximately $418 million.
We
evaluate our long-lived assets, including property and equipment and
finite-lived intangible assets for potential impairment on an individual asset
basis or at the lowest level asset grouping for which cash flows can be
separately identified. Intangible asset impairments are assessed whenever
changes in circumstances could indicate that the carrying amounts of those
productive assets exceed their projected undiscounted cash flows. When it is
determined that impairment exists, the related asset group is written down to
its estimated fair market value. The determination of future cash flows and the estimated
fair value of long-lived assets, involve significant estimates on the part of
management. In order to estimate the fair value of a long-lived asset, we may
engage a third party to assist with the valuation.
Our
process for assessing potential triggering events may include, but is not
limited to, analysis of the following:
|
|
§
|
any
sustained decline in the company's stock price below book
value;
|
|
|
§
|
results
of our goodwill impairment test;
|
|
|
§
|
sales
and operating trends affecting products and
groupings;
|
|
|
§
|
the
impact on current and future operating results related to industry
statistics including fluctuation of lending relationships between
financing sources and automobile dealers, actual and projected annual
vehicle sales, the number of dealers within our
network;
|
|
|
§
|
any
losses of key acquired customer relationships;
and
|
|
|
§
|
changes
to or obsolescence of acquired technology, data, and
trademarks.
|
We
expect to continue to experience challenges due to the ongoing adverse outlook
for the credit markets and automobile sales. If events and circumstances were to
continue we may be required to write-off some of our goodwill or long-lived
assets and could incur a significant non-cash charge to our income
statement.
We
also evaluate the remaining useful life of our long-lived assets on a periodic
basis to determine whether events or circumstances warrant a revision to the
remaining estimated amortization period.
As
discussed in Note 6 of our consolidated financial statements, during the fourth
quarter of 2008, as a result of a specific event, we recorded and impairment of
an intangible asset of approximately $1.9 million to cost of
revenue.
Income Taxes
We
account for income taxes in accordance with the provisions of ASC Topic 740,
Accounting for Income
Taxes, which requires deferred tax assets and liabilities to be
recognized for the future tax consequences attributable to differences between
the consolidated financial statement carrying amounts of assets and liabilities
and their respective tax bases and operating loss and tax credit carryforwards.
Deferred tax assets and liabilities are measured using enacted tax rates
expected to apply to taxable income in the years in which those temporary
differences are expected to be reversed. Deferred tax assets are reduced by a
valuation allowance when, in the opinion of management, it is more likely than
not that some portion or all of the deferred tax assets will not be
realized.
The
total liability for the uncertain tax positions recorded in our balance sheet in
accrued other liabilities as of December 31, 2009 and December 31, 2008, was
$0.8 million and $0.5 million, respectively. Interest and penalties, if
any, related to tax positions taken in our tax returns are recorded in interest
expense and general and administrative expenses, respectively, in our
consolidated statement of operations. As of December 31, 2009 and December 31,
2008, we have accrued interest and penalties related to tax positions taken on
our tax returns of approximately $47,000 and $38,000,
respectively.
56
Advertising Expenses
We
expense the cost of advertising and promoting our services as incurred. Such
costs are included in selling, general and administrative expenses in the
consolidated statements of operations and totaled $1.3 million,
$1.4 million and $1.7 million for the years ended December 31,
2009, 2008 and 2007, respectively.
Concentration of Credit Risk
Our
assets that are exposed to concentrations of credit risk consist primarily of
cash, cash equivalents, short-term and long-term investments and receivables
from clients. We place our cash, cash equivalents, short-term investments and
long-term investments with financial institutions. We regularly evaluate the
creditworthiness of the issuers in which we invest. Our trade receivables are
spread over many customers. We maintain an allowance for uncollectible accounts
receivable based on expected collectability and perform ongoing credit
evaluations of customers’ financial condition. As of December 31, 2009 and
2008 no customer accounted for more than 10% of our accounts receivable. For the
three years ended December 31, 2009 no customer accounted for more than 10%
of our revenue.
Our
revenue is generated from customers associated with the automotive
industry.
Net (Loss)
Income per Share
Effective
January 1, 2009, we adopted ASC Topic 260-10-45, Earnings Per Share (ASC Topic
260). Under ASC Topic 260, unvested share-based payment awards that contain
rights to receive non-forfeitable dividends (whether paid or unpaid) are
participating securities, and should be included in the two-class method of
computing earnings per share. Our nonvested restricted common stock, which
includes our long-term incentive equity awards, are considered participating
securities since the share-based awards contain a non-forfeitable right to
dividends irrespective of whether the awards ultimately vest and, therefore,
have been included in the denominator of both the basic and diluted earnings per
share calculations. Basic earnings per share is calculated by dividing net
(loss) income, adjusted for amounts allocated to participating securities under
two-class method, by the weighted average number of common shares outstanding
during the period. Diluted earnings per share is calculated by dividing net
income, adjusted for amounts allocated to participating securities under
two-class method, by the weighted average number of common shares outstanding,
assuming dilution, during the period. All prior-periods earnings per share data
presented have been adjusted retroactively to conform to the provision of ASC
Topic 260, which did not have a significant impact on our historical earnings
per share calculations.
The
following table sets forth the computation of basic and diluted net (loss)
income per share (in thousands, except share and per share
amounts):
|
Year Ended December 31,
|
||||||||||||
|
2009
|
2008
|
2007
|
||||||||||
|
Numerator:
|
||||||||||||
|
Net
(loss) income
|
$
|
(4,334
|
)
|
$
|
1,736
|
$
|
19,752
|
|||||
|
Net
income allocated to participating securities under two-class
method
|
—
|
(36
|
)
|
(447
|
)
|
|||||||
|
Net
(loss) income applicable to common stockholders
|
$
|
(4,334
|
)
|
$
|
1,700
|
$
|
19,305
|
|||||
|
Denominator:
|
||||||||||||
|
Weighted
average common stock outstanding (basic)
|
39,524,544
|
40,461,896
|
39,351,138
|
|||||||||
|
Common
equivalent shares from options to purchase common stock and restricted
common stock units (1)
|
—
|
1,076,483
|
1,535,344
|
|||||||||
|
Weighted
average common stock outstanding (diluted)
|
39,524,544
|
41,538,379
|
40,886,482
|
|||||||||
|
Basic
net (loss) income per share applicable to common stockholders
(2)
|
$
|
(0.11
|
)
|
$
|
0.04
|
$
|
0.49
|
|||||
|
Diluted
net (loss) income per share applicable to common stockholders
(2)
|
$
|
(0.11
|
)
|
$
|
0.04
|
$
|
0.47
|
|||||
57
The
following is a summary of the weighted securities outstanding during the
respective periods that have been excluded from the diluted net (loss) income
per share calculation because the effect would have been
antidilutive:
|
Year Ended December 31,
|
||||||||||||
|
2009
|
2008 (2)
|
2007 (2)
|
||||||||||
|
Stock
options
|
4,292,789 | 2,252,509 | 478,421 | |||||||||
|
Restricted
stock units
|
629,041 | — | — | |||||||||
|
Total
|
4,921,830 | 2,252,509 | 478,421 | |||||||||
|
(1)
|
Our restricted common stock units
are not considered participating securities since they do not contain a
non-forfeitable right to dividends and have, therefore, not been included
in the denominator for basic earnings per share
calculations.
|
|
(2)
|
Earnings
per share data for the years ended December 31, 2008 and 2007 have been
retroactively adjusted to conform to the provisions of ASC Topic 260,
which did not have a significant impact on our historical earnings per
share calculation.
|
Stock-Based Compensation
We have four types of stock-based compensation programs: stock options,
restricted stock units, restricted common stock, and an employee stock purchase
plan (ESPP).
The following summarizes stock-based compensation expense recognized for
the three years ended December 31, 2009, 2008 and 2007 (in
thousands):
|
Year Ended December 31,
|
||||||||||||
|
2009
|
2008
|
2007
|
||||||||||
|
Stock
options
|
$ | 10,475 | $ | 8,331 | $ | 6,333 | ||||||
|
Restricted
common stock (1)
|
4,599 | 5,361 | 4,260 | |||||||||
|
Restricted
stock units
|
1,855 | — | — | |||||||||
|
ESPP
|
60 | 299 | 313 | |||||||||
|
Total
stock-based compensation expense (2)
|
$ | 16,989 | $ | 13,991 | $ | 10,906 | ||||||
|
(1)
|
The
expense recorded to restricted common stock includes expense related to
the EBITDA Performance Award and the Market Value Award for the years
ended December 31, 2009, 2008 and 2007 as follows (in
thousands):
|
|
Year Ended December 31,
|
||||||||||||
|
2009
|
2008
|
2007
|
||||||||||
|
EBITDA
Performance Award
|
$ | 486 | $ | 682 | $ | 640 | ||||||
|
Market
Value Award
|
258 | 750 | 717 | |||||||||
|
Total
|
$ | 744 | $ | 1,432 | $ | 1,357 | ||||||
|
(2)
|
Included
in stock-based compensation expense for the year ended December 31, 2009
was $3.9 million of stock-based compensation expense related to the
realignment of our workforce and business on January 5, 2009. For further
information about the realignment of our workforce and business, please
refer to Note 16.
|
Stock-based compensation cost is measured at the grant date based on the fair
value of the award, and recognized as an expense over the requisite service
period, net of an estimated forfeiture rate. Determining the appropriate fair
value model and calculating the fair value of the share-based payment awards
require the input of highly subjective assumptions, including the expected life,
expected stock price volatility, and the number of expected options, restricted
stock units, or restricted common stock that will be forfeited prior to the
completion of the vesting requirements. We use the Black-Scholes and binomial
lattice-based valuation pricing models to value our stock-based
awards.
58
Due
to our limited public company history, for the years ended December 31, 2009,
2008 and 2007, the expected volatility and for the year ended December 31, 2009,
the expected life of option grants were determined based on the expected
volatility and expected lives of similar entities whose shares are publicly
traded, except for the expected volatility and expected life assumptions
utilized for awards granted in September 2009 under the Stock Option Exchange
Program (SOEP) and the Long-Term Incentive Plan (LTIP). For the years ended
December 31, 2008 and 2007, the expected lives of options were determined based
on the “simplified” method under the provisions of ASC Topic 718-10, Compensation – Stock
Compensation.
For
options granted in September 2009 under the SOEP, we began estimating our
expected volatility using a time-weighted average of our historical volatility
in combination with the historical volatility of similar entities whose common
shares are publicly traded. We expect to apply this volatility methodology
to future option grants. The expected life under the SOEP was determined
by an independent third party by means of Monte-Carlo simulations of future
stock price based upon “in-the-money”, vesting schedule, contractual term,
current life to date and applied an annual termination rate (after vesting) to
the outstanding options in the simulation to reflect the probability of exercise
behavior. Stock-based compensation expenses related to the SOEP will be
amortized over the new vesting schedule of 25% six months from the grant date,
25% twelve months from the grant date and 1/48 each month
thereafter.
Awards granted under the LTIP consisted of 455,000 shares of restricted common
stock (net of cancellations). Each individual’s total award was allocated 50% to
achieving earnings before interest, taxes, depreciation and amortization, as
adjusted to reflect any future acquisitions (EBITDA Performance Award) and 50%
to the market value of our common stock (Market Value Award). The awards were to
be earned upon our achievement of EBITDA and market-based targets for the fiscal
years 2007, 2008 and 2009, but would not vest unless the grantee remained
continuously employed in active service until January 31, 2010. If an
EBITDA Performance Award or Market Value Award was not earned in an earlier
year, it could have been earned upon achievement of that target in a subsequent
year. The awards were subject to acceleration in full upon a change in control.
We valued the EBITDA Performance Award and the Market Value Award using the
Black-Scholes and binomial lattice-based valuation pricing models, respectively.
The total fair value of the entire EBITDA Performance Award was
$6.0 million (prior to estimated forfeitures), of which, in 2007, we began
expensing the amount associated with the 2007 award as it was deemed probable
that the threshold for the year ending December 31, 2007 would be met. The
EBITDA target for 2007 was achieved. As of December 31, 2009, no amounts were
expensed related to the EBITDA Performance Awards for 2008 and 2009 as the
targets were not achieved. The total value of the entire Market Value Award was
$2.5 million (including estimated forfeitures), which was expensed on a
straight-line basis from the date of grant over the applicable service period.
As long as the service condition was satisfied, the expense was not reverseable,
even if the market conditions were not satisfied. During the year ended December
31, 2009, 96,667 shares of long-term performance equity awards were cancelled
and the vesting of 38,333 shares of long-term performance equity awards were
accelerated due to the departure of certain executive officers, most of which
were in connection with the realignment of our workforce and business as
discussed in Note 16. For the year ended December 31, 2009, we reversed
approximately $0.5 million of stock-based compensation expense related to the
cancelled shares and recorded stock-based compensation expense of approximately
$0.2 million related to the accelerated shares. On January 31, 2010, 151,697
shares of long-term performance equity awards vested relating to the 2007 EBITDA
Performance Award and the 2007 Market Value Award and the remaining 303,303
shares of long-term performance equity awards were cancelled as the 2008 and
2009 EBITDA and Market Value targets were not achieved.
Other assumptions required for estimating fair value with Black-Scholes model
are the expected risk-free interest rate and the expected dividend yield.
The risk-free interests used were the actual U.S. Treasury zero-coupon rates for
bonds matching our expected life of an option on the date of grant. The
expected dividend yield is not applicable as we have not paid any dividends and
current intend to retain any future earnings for use in our
business.
Options granted generally (SOEP and LTIP exceptions noted above) vest over a
period of four years from the vesting commencement date (three years for
directors), and expire seven years from the date of grant, except for stock
options granted prior to July 11, 2007, which expire ten years from the date of
grant and terminate, to the extent unvested, on the date of termination of
employment, and to the extent vested, generally at the end of the three-month
period following termination of employment, except in the case of executive
officers, who under certain conditions have a twelve-month period following
termination of employment to exercise.
Application
of alternative assumptions could produce significantly different estimates of
the fair value of stock-based compensation and consequently, the related amounts
recognized in our consolidated statements of operations.
For the year ended December 31, 2009, 2008, and 2007, the fair market value
of each option grant has been estimated on the date of grant using the
Black-Scholes Option Pricing Model with the following assumptions:
|
Year Ended December 31,
|
||||||||||||
|
2009
|
2008
|
2007
|
||||||||||
|
Expected
life (in years)
|
4.18 – 4.47 | 4.33 – 4.47 | 4.33 – 6.25 | |||||||||
|
Risk-free
interest rate
|
1.62 – 2.12 | % | 2.35 – 3.14 | % | 3.09 – 4.76 | % | ||||||
|
Expected
volatility
|
48.6 – 51.6 | % | 47 – 48.6 | % | 47 | % | ||||||
|
Expected
dividend yield
|
0 | % | 0 | % | 0 | % | ||||||
|
Weighted-average
fair value of options granted
|
$ | 5.79 | $ | 9.61 | $ | 16.47 | ||||||
59
The fair value of the EBITDA Performance Award for the years ended
December 31, 2007 and 2006 has been estimated on the date of grant using a
Black-Scholes valuation pricing model with the following weighted-average
assumptions
|
July 21, 2007
|
November 2, 2006
|
August 2, 2006
|
||||||||||
|
Expected
volatility
|
47.00 | % | 40.00 | % | 40.00 | % | ||||||
|
Expected
dividend yield
|
0.00 | % | 0.00 | % | 0.00 | % | ||||||
|
Expected
life (in years)
|
2.37 | 3.16 | 3.42 | |||||||||
|
Risk-free
interest rate
|
4.43 | % | 4.91 | % | 4.99 | % | ||||||
|
Weighted-average
fair value of EBITDA Performance Award
|
$ | 38.01 | $ | 25.39 | $ | 18.95 | ||||||
The
number of shares of restricted common stock that management expects to be earned
for the Market Value Award for the years ended December 31, 2007 and 2006
has been estimated on the date of grant using a binomial lattice-based valuation
pricing model with the following weighted-average assumptions:
|
July 21, 2007
|
November 2, 2006
|
August 2, 2006
|
||||||||||
|
Expected
volatility
|
47.00 | % | 40.00 | % | 40.00 | % | ||||||
|
Expected
dividend yield
|
0.00 | % | 0.00 | % | 0.00 | % | ||||||
|
Expected
life (in years)
|
2.37 | 1.16-3.16 | 1.41-3.42 | |||||||||
|
Risk-free
interest rate
|
4.43 | % | 4.55-4.91 | % | 4.83-4.99 | % | ||||||
|
Weighted-average
fair value of Market Value Award
|
$ | 29.77 | $ | 15.86 | $ | 7.49 | ||||||
Recent
Accounting Pronouncements
In
October 2009, the Financial Accounting Standards Board (FASB) issued Revenue
Recognition guidance around Multiple-Deliverable Revenue Arrangements, a
consensus of the FASB Emerging Issues Task Force. This guidance modifies the
fair value requirements of Revenue Recognition-Multiple Element Arrangements by
allowing the use of the “best estimate of selling price” in addition to VSOE and
VOE (now referred to as third-party evidence or TPE) for determining the selling
price of a deliverable. A vendor is now required to use its best estimate of the
selling price when VSOE or TPE of the selling price cannot be determined. In
addition, the residual method of allocating arrangement consideration is no
longer permitted. The final consensus is effective for fiscal years beginning
after June 15, 2010. Companies will have the option of adopting the guidance
retrospectively or prospectively for new or materially modified agreements.
Early adoption is permitted as of the beginning of an entity’s fiscal year. We
are currently evaluating the impact of this guidance on our consolidated
financial statements.
In June
2009, the FASB issued the The
FASB
Accounting Standards Codification™ (the Codification) which
became the single authoritative U.S. accounting and reporting standards
applicable for all nongovernmental entities, with the exception of
guidance issued by the Securities and Exchange Commission (SEC). The
Codification does not change current U.S. GAAP, but changes the referencing of
financial standards, and is intended to simplify user access to authoritative
U.S. GAAP by providing all the authoritative literature related to a particular
topic in one place. The Codification is effective for interim and annual periods
ending after September 15, 2009, and was effective for our third quarter of
2009. At that time, all references made to U.S. GAAP used the new Codification
numbering system prescribed by the FASB. The
Codification does not change or alter existing U.S. GAAP and did not have any
impact on our consolidated financial statements.
In June
2009, the FASB issued a new standard which modified how a company determines
when it is required to consolidate an entity and is based on, among other
things, an entity’s purpose and design, a company’s ability to direct the
activities of the entity that most significantly impact the entity’s economic
performance, and the obligation to absorb losses or the right to receive
benefits from the entity that could potentially be significant to the variable
interest entity. This new standard requires an ongoing reassessment of whether a
company is the primary beneficiary of a variable interest entity and also
requires additional disclosures about a company’s involvement in variable
interest entities and any significant changes in risk exposure due to that
involvement. This standard is effective for fiscal years beginning after
November 15, 2009. We are currently evaluating the impact of this guidance on
our consolidated financial statements.
3.
Fair Value Measurements
Fair
value is defined as the exit price, or the amount that would be received to sell
an asset or paid to transfer a liability in an orderly transaction between
market participants at the measurement date. Inputs used to measure fair value
are prioritized into a three-level fair value hierarchy. This hierarchy requires
entities to maximize the use of observable inputs and minimize the use of
unobservable inputs. The three levels of inputs used to measure fair values are
as follows:
|
|
·
|
Level
1 – Quoted prices (unadjusted) in active markets that are accessible at
the measurement date for assets or liabilities. The fair value hierarchy
gives the highest priority to Level 1
inputs.
|
|
|
·
|
Level
2 – Observable prices that are based on inputs not quoted on active
markets, but corroborated by market
data.
|
60
|
|
·
|
Level
3 – Unobservable inputs are used when little or no market data is
available. The fair value hierarchy gives the lowest priority to Level 3
inputs.
|
We have
segregated all financial assets that are measured at fair value on a recurring
basis into the most appropriate level within the fair value hierarchy based on
the inputs used to determine the fair value at the measurement date in the table
below.
Financial
assets measured at fair value on a recurring basis include the following as of
December 31, 2009 and 2008 (in thousands):
|
As of December 31, 2009
|
Quoted Prices in
Active Markets
(Level 1)
|
Significant Other
Observable
Inputs
(Level 2)
|
Significant
Unobservable
Inputs
(Level 3)
|
December 31,
2009
|
||||||||||||
|
Cash
equivalents (1)
|
$ | 127,608 | $ | — | $ | — | $ | 127,608 | ||||||||
|
Short-term
investments (2)
|
1,484 | — | — | 1,484 | ||||||||||||
|
Long-term
investments (3)
|
— | — | 3,971 | 3,971 | ||||||||||||
|
Total
|
$ | 129,092 | $ | — | $ | 3,971 | $ | 133,063 | ||||||||
|
As of December 31, 2008
|
Quoted Prices in
Active Markets
(Level 1)
|
Significant Other
Observable
Inputs
(Level 2)
|
Significant
Unobservable
Inputs
(Level 3)
|
December 31,
2008
|
||||||||||||
|
Cash
equivalents (1)
|
$ | 124,497 | $ | — | $ | — | $ | 124,497 | ||||||||
|
Short-term
investments (2)(4)
|
42,490 | 860 | — | 43,350 | ||||||||||||
|
Long-term
investments (3)(4)
|
— | 2,842 | 1,550 | 4,392 | ||||||||||||
|
Total
|
$ | 166,987 | $ | 3,702 | $ | 1,550 | $ | 172,239 | ||||||||
|
(1)
|
Cash
equivalents consist primarily of money market funds with original maturity
dates of three months or less, for which we determine fair value through
quoted market prices.
|
|
(2)
|
As
of December 31, 2009, Level 1 short-term investments include investments
in tax-advantaged preferred securities. As of December 31, 2008, Level 1
short-term investments consisted primarily of corporate bonds and
municipal notes with maturity dates of one year or less, for which we
determined fair value through quoted market
prices.
|
|
(3)
|
Level
3 long-term investments as of December 31, 2009 and 2008 include a $1.6
million, or 0.3% of total assets, auction rate security (ARS) invested in
a tax-exempt state government obligation that was valued at par. Our
intent is not to hold the ARS invested in tax-exempt state government
obligations to maturity, but rather to use the interest reset feature to
provide liquidity. However, should the marketplace auctions continue to
fail we may hold the security to maturity. We have classified this as
long-term due to the maturity date of the security being in 2011, coupled
with ongoing failed auctions in the
marketplace.
|
Level 3
long-term investments as of December 31, 2009 also include $2.4 million, or 0.5%
of total assets, of tax-advantaged preferred stock of a financial institution.
It is uncertain whether we will be able to liquidate these securities within the
next twelve months; as such we have classified them as long-term on our
consolidated balance sheets. Due to the lack of observable market quotes we
utilized valuation models that rely exclusively on Level 3 inputs including
those that are based on expected cash flow streams, including assessments of
counterparty credit quality, default risk underlying the security, discount
rates and overall capital market liquidity.
|
(4)
|
As
of December 31, 2008, Level 2 short-term and long-term investments of $3.7
million (net of impairment charge) consisted of ARS invested in
tax-advantaged preferred stock trusts in which the underlying equities are
preferred stock. Based upon our assessment we reduced the fair value of
the investments in the preferred stock trusts form $9.6 million to $3.7
million and recorded an other-than-temporary charge of $6.0 million to
earnings and an unrealized gain of $0.1 million to stockholders’ equity
during the year ended December 31, 2008. These ARS were associated with
failed auctions.
|
61
The
change in the carrying amount of Level 3 investments for the years ended
December 31, 2008 and 2009 is as follows (in thousands):
|
Balance
as of January 1, 2008
|
$
|
—
|
||
|
Reclassification
from Level 1 investments to Level 3 investments
|
169,580
|
|||
|
Reclassification
from Level 3 investments to Level 2 investments
|
(3,936
|
)
|
||
|
Net
sales of auction rate securities
|
(158,430
|
)
|
||
|
Other-than-temporary
impairment included in net income
|
(5,664
|
)
|
||
|
Balance
as of December 31, 2008
|
1,550
|
|||
|
Reclassification
from Level 2 investments to Level 3 investments (5)
|
1,360
|
|||
|
Realized
gain on securities included in the statement of operations
(5)
|
716
|
|||
|
Unrealized
gain on securities recorded in other comprehensive income
(5)
|
345
|
|||
|
Balance
as of December 31, 2009
|
$
|
3,971
|
|
(5)
|
During
2009 our investments in ARS invested in certain tax-advantaged preferred
stock trusts held as of December 31, 2008 dissolved and the trustees
distributed the underlying preferred stock instruments. As a result of
these conversions we measured the fair value of the Level 3 long-term
tax-advantaged preferred stock on the distribution date and determined
that the value increased from December 31, 2008 and as a result we
recorded a realized gain in the statement of operations of $0.7 million
from $1.4 million to $2.1 million. Subsequent to the trust dissolution
through December 31, 2009 we re-measured the fair value and determined
that the value had increased and recorded a gain in other comprehensive
income of $0.3 million on the increased fair value. The total value
of the tax-advantaged preferred stock of a financial institution included
in the $4.0 million of Level 3 long-term investments as of December 31,
2009 is $2.4 million.
|
We review
the fair value of our short-term and long-tem investments for impairment in
accordance with ASC Topic 320, Investments – Debt and Equity
Securities. A temporary impairment charge results in an unrealized
loss being recorded in the other comprehensive income component of stockholders’
equity. It occurs if a loss in an investment is determined to be temporary in
nature and we have the ability and intent to hold the investment until a
recovery in market value takes place. Such an unrealized loss does not reduce
our net income for the applicable accounting period because the loss is not
viewed as other-than-temporary. An impairment charge is recorded against
earnings to the extent we determine that there is a loss of fair value that is
other-than-temporary. For the year end December 31, 2008, we determined that the
significant reduction in fair value related to our preferred stock trusts ARS
was other-than-temporary and we recorded an impairment charge in our
consolidated statements of operations based on a variety of factors, including
the significant decline in fair value indicated for the individual investments
and the adverse market conditions impacting ARS.
4.
Business Combinations
AAX
Acquisition
On
January 23, 2009, we acquired the AAX ® suite of inventory management solutions
and other assets, including without limitation all of the capital stock of AAX
(collectively, AAX), from JM Dealer Services, Inc., a subsidiary of JM Family
Enterprises, Inc. (seller), for a purchase price of $30.9 million (net of a
purchase price adjustment of $1.7 million, which is discussed below). We
expensed approximately $0.5 million of professional fees associated with
this acquisition, which is classified in selling, general and administrative
expenses.
This
acquisition was recorded under the purchase method of accounting, resulting in
the total purchase price being allocated to the assets acquired and liabilities
assumed according to their estimated fair values at the date of acquisition as
follows (in thousands):
|
Current
assets
|
$
|
489
|
||
|
Property
and equipment
|
1,035
|
|||
|
Intangible
assets
|
16,639
|
|||
|
Goodwill
|
15,348
|
|||
|
Total
assets acquired
|
33,511
|
|||
|
Total
liabilities assumed
|
(2,636
|
)
|
||
|
Net
assets acquired
|
$
|
30,875
|
The
liabilities assumed includes a $2.3 million deferred tax liability that relates
primarily to the future amortization of certain acquired
intangibles.
62
We
allocated the amounts of intangible assets and goodwill based on fair value as
follows: approximately $7.4 million of the purchase price has been allocated to
customer contracts (weighted-average useful life is 6.5 years), $6.2 million to
acquired technology and database (weighted-average useful life is 4.2 years),
$2.0 million to the AAX trade name (seven year useful life), and $1.0 million to
a non-compete agreement (four year useful life). The useful life for each
of the above acquired long-term intangible assets was determined based on the
period which the asset is expected to contribute directly or indirectly to our
future cash flows. We recorded approximately $15.3 million in goodwill, which
represents the remainder of the excess of the purchase price over the fair value
of the net assets acquired. The allocated value of goodwill primarily relates to
the acquired workforce and the anticipated synergies resulting from combining
AAX with our current inventory management solution, and $13.0 million of the
goodwill recorded is deductible for tax purposes.
Certain
acquired intangibles in our AAX acquisition are being amortized using an
accelerated method of amortization. In determining amortization expense
under our accelerated method for any given period, we calculate the expected
cash flows for that period that were used in determining the acquired value of
the asset and divide that amount by the total expected cash flows over the
estimated life of the asset. We multiply that percentage by the initial
carrying value of the asset to arrive at the amortization expense for that
period. Based on the nature of the asset and how the asset is valued in
purchase accounting, we believe that this method better approximates the
distribution of cash flows generated by the acquired intangible asset. We
will continue to use the straight line method for certain intangible assets if
there is no better pattern in which the asset’s economic benefits are consumed
or otherwise used up.
The
results of AAX were included in our consolidated statement of operations from
the date of acquisition. AAX revenue since the date of acquisition was $18.4
million. We are unable to provide AAX earnings since acquisition since we do not
have stand-alone earnings reporting for AAX.
Other AAX deal
terms
Service
Credits
A
condition of the purchase agreement gives the seller the right to service
credits of $2.5 million, which may be applied against fees that are charged in
connection with their purchase of any future products or services of
DealerTrack. These service credits expire on January 23, 2013. No revenue
will be recorded for services provided under the service credits.
Purchase
Price Adjustment
A
condition of the purchase agreement provided that the seller and its affiliates
would reimburse us $1.7 million for certain lost tax deductions due to the
structuring of the transaction. The purchase price reimbursement has been
recorded as a receivable in purchase accounting and was collected on October 1,
2009.
There is
a contingency in the purchase arrangement that could have required the seller to
reimburse a portion of the purchase price to DealerTrack if certain customers
canceled their subscriptions based on certain factors. We believed the
probability for this contingency to occur was remote. As such, no value
was ascribed to this contingency in purchase accounting. The contingency period
was amended during the third quarter 2009 to expire September 30, 2009 instead
of October 31, 2009.
Unaudited
Pro Forma Summary of Operations
The
accompanying unaudited pro forma summary presents our consolidated results of
operations as if the acquisition of AAX had been completed as of the beginning
of each period presented. The pro forma information does not necessarily reflect
the actual results that would have been achieved, nor is it necessarily
indicative of our future consolidated results.
|
Year Ended December 31,
|
||||||||
|
2009
|
2008
|
|||||||
|
(in thousands, except share and per share
amounts)
|
||||||||
|
(Unaudited)
|
||||||||
|
Net
revenue
|
$ | 227,209 | $ | 268,789 | ||||
|
Net
loss
|
$ | (4,559 | ) | $ | (3,601 | ) | ||
|
Basic
net loss per share applicable to common stockholders
|
$ | (0.12 | ) | $ | (0.09 | ) | ||
|
Diluted
net loss per share applicable to common stockholders
|
$ | (0.12 | ) | $ | (0.09 | ) | ||
63
AutoSytleMart,
Inc. (ASM) Acquisition
On
August 1, 2007, we completed the purchase of all of the outstanding shares of
ASM, for a purchase price of $4.0 million in cash (including direct acquisition
costs of $0.2 million). ASM is a provider of accessories-related solutions to
automotive dealerships. Under the terms of the merger agreement, we have a
future contingent payment obligation of up to $11.0 million based upon the
achievement of certain operational targets from February 2008 through February
2011. As of December 31, 2009, we determined that certain operational conditions
were probable of being achieved and recorded a liability of $1.0 million. The
additional consideration of $1.0 million was deemed compensation for services,
as payment was contingent on certain former stockholders remaining employees or
consultants of DealerTrack for a certain period. The $1.0 million was recorded
as a selling, general and administrative expense for the year ended December 31,
2009. As of December 31, 2009, it has been determined that the operational
targets related to the remaining $10.0 million in contingent payment obligations
are not yet probable of being achieved. Any amounts deemed probable in the
future will also be recorded as a selling, general and administrative expense.
Quarterly, we will re-assess the probability of the achievement of the
operational targets.
This
acquisition was recorded under the purchase method of accounting, resulting in
the total purchase price being allocated to the assets acquired and liabilities
assumed according to their estimated fair values at the date of acquisition as
follows (in thousands):
|
Current
assets
|
$
|
69
|
||
|
Property
and equipment
|
32
|
|||
|
Intangible
assets
|
4,126
|
|||
|
Goodwill
|
808
|
|||
|
Total
assets acquired
|
5,035
|
|||
|
Total
liabilities assumed
|
(1,018
|
)
|
||
|
Net
assets acquired
|
$
|
4,017
|
The
liabilities assumed includes a $1.4 million deferred tax liability that
relates to the future amortization of acquired intangibles offset by a
$1.0 million deferred tax asset that relates primarily to acquired net
operating loss carryovers.
We
allocated the amounts of intangibles and goodwill based on fair value as
follows: approximately $3.7 million of the purchase price has been
allocated to purchased technology and $0.4 million to non-compete
agreements. These intangibles are being amortized on a straight line basis over
four to five years based on each intangible’s estimated useful life. We also
recorded approximately $0.8 million in goodwill, which represents the
remainder of the excess of the purchase price over the fair value of the net
assets acquired.
The
results of AutoStyleMart were included in our consolidated statements of
operations from the date of acquisition.
Arkona,
Inc. (Arkona) Acquisition
On
June 6, 2007, we completed the purchase of all of the outstanding shares of
Arkona for a cash purchase price of approximately $60.0 million (including
direct acquisition costs of approximately $1.0 million). This acquisition
expands our product suite with an on-demand dealership management system that
can be utilized by franchised, independent and other specialty retail
dealers.
This
acquisition was recorded under the purchase method of accounting, resulting in
the total purchase price being allocated to the assets acquired and liabilities
assumed according to their estimated fair values at the date of acquisition as
follows (in thousands):
|
Current
assets
|
$
|
2,842
|
||
|
Property
and equipment
|
2,065
|
|||
|
Other
assets
|
191
|
|||
|
Intangible
assets
|
25,660
|
|||
|
Goodwill
|
39,091
|
|||
|
Total
assets acquired
|
69,849
|
|||
|
Total
liabilities assumed
|
(9,876
|
)
|
||
|
Net
assets acquired
|
$
|
59,973
|
The
liabilities assumed includes a $9.3 million deferred tax liability that
relates primarily to the future amortization of acquired intangibles offset by a
$4.5 million deferred tax asset that relates primarily to acquired net operating
loss carryovers. Additionally, the liabilities assumed include approximately a
$2.8 million sales tax liability, which had been reduced by $0.8 million
for the year ended December 31, 2008. For the year ended
December 31, 2009, we reversed an additional $0.6 million of the pre-acquisition
sales tax liability. The contingency was resolved subsequent to the close of the
purchase accounting allocation period and, as such, the $0.6 million was
recorded as other income in the 2009 statement of operations.
64
We
allocated the amounts of intangible assets and goodwill based on fair value
appraisals as follows: approximately $14.7 million of the purchase price
has been allocated to purchased technology (five year life), $9.2 million
to customer contracts (four year life) and $1.8 million to non-compete
agreements (one and three year lives). These estimated intangibles are being
amortized on a straight line basis over each intangible’s estimated useful life.
We also recorded approximately $39.1 million in goodwill, which represents
the remainder of the excess of the purchase price over the fair value of the net
assets acquired.
The
results of Arkona were included in our consolidated statements of operations
from the date of acquisition.
Curomax
Corporation and its subsidiaries (Curomax) Acquisition
On
February 1, 2007, we completed the purchase of all of the outstanding
shares of Curomax pursuant to a shares purchase agreement, dated as of
January 16, 2007, for an adjusted cash purchase price of approximately
$40.7 million (including direct acquisition and restructuring costs of
approximately $1.6 million). Curomax is a provider of an Internet-based
credit application and contract processing network in Canada. Under the terms of
the share purchase agreement, we had future contingent payment obligations of
approximately $1.8 million in cash to be paid out based upon the
achievement of certain operational objectives over the subsequent twenty-four
months. As of December 31, 2008, we had determined that certain operational
conditions had been met and as such, recorded a liability and additional
goodwill of approximately $1.8 million which was paid in the first quarter of
2009.
This
acquisition was recorded under the purchase method of accounting, resulting in
the total purchase price being allocated to the assets acquired and liabilities
assumed according to their estimated fair values at the date of acquisition as
follows (in thousands):
|
Current
assets
|
$
|
1,925
|
||
|
Property
and equipment
|
339
|
|||
|
Intangible
assets
|
21,670
|
|||
|
Goodwill
|
21,929
|
|||
|
Total
assets acquired
|
45,863
|
|||
|
Total
liabilities assumed
|
(5,154
|
)
|
||
|
Net
assets acquired
|
$
|
40,709
|
The
liabilities assumed includes a $3.9 million deferred tax liability that
relates primarily to the future amortization of acquired intangibles offset by a
$0.3 million deferred tax asset that relates primarily to acquired net operating
loss carryovers.
We
allocated the amounts to intangible assets and goodwill based on fair value
appraisals as follows: approximately $17.2 million of the purchase price
has been allocated to customer contracts (four year life), $0.8 million to
purchased technology (one and two year lives) and $3.7 million to
non-compete agreements (two year lives). These intangibles are being amortized
on a straight-line basis over each intangible’s estimated useful life. We also
recorded approximately $21.9 million in goodwill, which represents the
remainder of the excess of the purchase price over the fair value of the net
assets acquired.
The
results of Curomax were included in our consolidated statements of operations
from the date of acquisition. On January 1, 2008, Curomax Corporation was
amalgamated into DealerTrack Canada, Inc.
Automotive
Lease Guide (ALG) Purchase Price Adjustment
In
connection with the purchase of Automotive Lease Guide on May 25, 2005, we have
a contractual agreement with the seller to pay an additional $0.8 million per
year for 2006 through 2010. There was additional contingent consideration of up
to $11.3 million that could be paid contingent upon future increases in revenue
of ALG and another one of our subsidiaries through December 2009. The total
amount of contingent consideration paid or accrued as of December 31, 2009 was
$3.1 million. The additional purchase price consideration was recorded as
goodwill on our consolidated balance sheet.
65
5.
Property and Equipment
Property
and equipment are recorded at cost and consist of the following (dollars in
thousands):
|
Estimated
Useful
|
December 31,
|
|||||||||||
|
Life (Years)
|
2009
|
2008
|
||||||||||
|
Computer
equipment
|
3 - 5 | $ | 22,662 | $ | 20,431 | |||||||
|
Office
equipment
|
5 | 3,550 | 2,896 | |||||||||
|
Furniture
and fixtures
|
5 | 3,343 | 3,068 | |||||||||
|
Leasehold
improvements
|
5 -11 | 3,188 | 1,233 | |||||||||
|
Total
property and equipment, gross
|
32,743 | 27,628 | ||||||||||
|
Less:
Accumulated depreciation and amortization
|
(19,229 | ) | (14,180 | ) | ||||||||
|
Total
property and equipment, net
|
$ | 13,514 | $ | 13,448 | ||||||||
Depreciation
and amortization expense related to property and equipment for the years ended
December 31, 2009, 2008 and 2007, was $7.1 million, $5.9 million
and $4.1 million, respectively, and is calculated on a straight line basis
over the estimated useful life of the asset.
6.
Intangible Assets
The
gross book value, accumulated amortization and amortization periods of the
intangible assets were as follows (dollars in thousands):
|
December 31, 2009
|
December 31, 2008
|
|||||||||||||||||||
|
Gross
|
Gross
|
Amortization
|
||||||||||||||||||
|
Book
|
Accumulated
|
Book
|
Accumulated
|
Period
|
||||||||||||||||
|
Value
|
Amortization
|
Value
|
Amortization
|
(Years)
|
||||||||||||||||
|
Customer
contracts
|
$
|
40,352
|
$
|
(24,769
|
)
|
$
|
33,673
|
$
|
(17,289
|
)
|
2-7
|
|||||||||
|
Database
|
13,825
|
(10,945
|
)
|
13,333
|
(8,818
|
)
|
3-6
|
|||||||||||||
|
Trade
names
|
12,510
|
(6,924
|
)
|
10,500
|
(5,469
|
)
|
5-10
|
|||||||||||||
|
Technology
|
27,170
|
(11,110
|
)
|
22,684
|
(7,209
|
)
|
1-5
|
|||||||||||||
|
Non-compete
agreement
|
6,585
|
(5,090
|
)
|
10,697
|
(7,697
|
)
|
2-5
|
|||||||||||||
|
Total
|
$
|
100,442
|
$
|
(58,838
|
)
|
$
|
90,887
|
$
|
(46,482
|
)
|
||||||||||
Amortization
expense related to intangibles for the years ended December 31, 2009, 2008,
and 2007, was $20.3 million, $26.8 million, and $28.2 million,
respectively.
Amortization
expense that will be charged to income for the subsequent five years and
thereafter is estimated, based on the December 31, 2009 book value, as
follows (in thousands):
|
2010
|
$
|
19,211
|
||
|
2011
|
10,363
|
|||
|
2012
|
5,476
|
|||
|
2013
|
3,439
|
|||
|
2014
|
2,177
|
|||
|
Thereafter
|
938
|
|||
|
Total
|
$
|
41,604
|
On
November 10, 2008, we entered into a perpetual license agreement for certain CRM
technology components with AutoNation Holding Corp, Inc. for $3.0 million. The
entire $3.0 million was allocated to the fair value of the technology acquired
and will be amortized to cost of revenue over its useful life.
During May 2006, as a part of our acquisition of Global Fax, LLC we recorded an
intangible asset related to an application processing contract with DHL of $4.4
million. During
the fourth quarter of 2008, we were notified by DHL that they would be
cancelling their contract and as such management concluded that this asset was
impaired and accelerated the remaining amortization of approximately $1.9
million to cost of revenue.
66
7.
Goodwill
The changes in the carrying amount of goodwill for the year ended December 31,
2009 is as follows (in thousands):
|
Balance
as of January 1, 2009
|
$
|
114,886
|
||
|
Acquisition
of AAX (Note 4)
|
15,348
|
|||
|
Impact
of change in Canadian dollar exchange rate
|
3,587
|
|||
|
Exit
from SCS business (Note 17)
|
(200
|
)
|
||
|
Purchase
price adjustment – ALG (Note 4)
|
1,126
|
|||
|
Balance
as of December 31, 2009
|
$
|
134,747
|
||
The changes in the carrying amount of goodwill for the year ended December
31, 2008 is as follows (in thousands):
|
Balance
as of January 1, 2008
|
$
|
117,702
|
||
|
Purchase
price adjustments — Curomax (Note 4)
|
1,799
|
|||
|
Impact
of change in Canadian dollar exchange rate
|
(4,610
|
)
|
||
|
Purchase
price adjustments – ALG (Note 4)
|
1,139
|
|||
|
Purchase
price adjustments – Arkona (Note 4)
|
(836
|
)
|
||
|
Other
|
(308
|
)
|
||
|
Balance
as of December 31, 2008
|
$
|
114,886
|
||
8.
Accrued Liabilities - Other
Following
is a summary of the components of other accrued liabilities (in
thousands):
|
December 31,
|
||||||||
|
2009
|
2008
|
|||||||
|
Customer
deposits
|
$ | 2,357 | $ | 2,749 | ||||
|
Professional
fees
|
2,197 | 1,158 | ||||||
|
Revenue
share
|
1,284 | 1,700 | ||||||
|
Sales
taxes
|
883 | 1,511 | ||||||
|
Software
licenses
|
1,408 | 1,341 | ||||||
|
Accrued
Curomax contingent consideration (Note 4)
|
— | 1,837 | ||||||
|
Other
|
3,195 | 1,089 | ||||||
|
Total
accrued liabilities - other
|
$ | 11,324 | $ | 11,385 | ||||
9.
401(k) Plan
Our 401(k) plan covers substantially all employees meeting certain age
requirements in accordance with section 401(k) of the Internal Revenue Code.
Under the provisions of the 401(k) plan, we have the ability to make matching
contributions equal to a percentage of the employee’s voluntary contribution, as
well as an additional matching contribution at year end and a nonelective
contribution. Effective April 1, 2009, we discontinued new matching
contributions to the plan. At December 31, 2009, the Company elected to make a
1% matching contribution on eligible earnings under the 401(k) plan. Effective
January 1, 2010 the Company reinstated the employer matching contributions to
the 401(k) plan. Contributions under such plans for the years ended
December 31, 2009, 2008 and 2007 were $1.3 million, $2.0 million
and $1.6 million, respectively.
67
10.
Income Taxes
The
components of our (loss) income before income taxes are as follows (in
thousands):
|
Year Ended December 31,
|
||||||||||||
|
2009
|
2008
|
2007
|
||||||||||
|
United
States
|
$
|
(16,676
|
)
|
$
|
(2,467
|
)
|
$
|
29,433
|
||||
|
Canada
|
8,823
|
8,164
|
3,353
|
|||||||||
|
Total
(loss) income before taxes
|
$
|
(7,853
|
)
|
$
|
5,697
|
$
|
32,786
|
|||||
The
(benefit) provision for income taxes consists of the following (in
thousands):
|
Year Ended December 31,
|
||||||||||||
|
2009
|
2008
|
2007
|
||||||||||
|
Current
tax:
|
||||||||||||
|
Federal
|
$
|
383
|
$
|
2,440
|
$
|
14,123
|
||||||
|
State
and local
|
(1,066
|
)
|
290
|
2,373
|
||||||||
|
Canada
|
4,426
|
3,283
|
1,169
|
|||||||||
|
Total
current tax
|
3,743
|
6,013
|
17,665
|
|||||||||
|
Deferred
tax:
|
||||||||||||
|
Federal
|
(5,915
|
)
|
(1,783
|
)
|
(5,757
|
)
|
||||||
|
State
and local
|
(498
|
)
|
(913
|
)
|
179
|
|||||||
|
Canada
|
(849
|
)
|
644
|
947
|
||||||||
|
Total
deferred tax
|
(7,262
|
)
|
(2,052
|
)
|
(4,631
|
)
|
||||||
|
(Benefit)
provision for income taxes, net
|
$
|
(3,519
|
)
|
$
|
3,961
|
$
|
13,034
|
|||||
Deferred
income taxes reflect the net tax effects of temporary differences between the
carrying amounts of assets and liabilities for financial reporting purposes and
the amounts used for income tax purposes using enacted tax rates in effect in
the year in which the differences are expected to reverse.
68
Deferred
tax assets and liabilities as of December 31, 2009 and 2008 consisted of
the amounts shown below:
|
December
31,
|
||||||||
|
2009
|
2008
|
|||||||
|
Deferred
tax assets:
|
||||||||
|
Net
operating loss carryforwards
|
$
|
3,363
|
$
|
4,465
|
||||
|
Depreciation
and amortization
|
77
|
—
|
||||||
|
Deferred
compensation
|
15,438
|
11,053
|
||||||
|
Acquired
intangibles
|
4,973
|
5,650
|
||||||
|
Tax
credits
|
1,367
|
—
|
||||||
|
Impairment
loss
|
1,135
|
2,171
|
||||||
|
Other
|
4,290
|
2,021
|
||||||
|
30,643
|
25,360
|
|||||||
|
Deferred
tax liabilities:
|
||||||||
|
Acquired
Intangibles
|
(738
|
)
|
(1,299
|
)
|
||||
|
Capitalized
software and website development
|
(3,564
|
)
|
(2,076
|
)
|
||||
|
Depreciation
and amortization
|
—
|
(864
|
)
|
|||||
|
Tax
credits
|
—
|
(100
|
)
|
|||||
|
Other
|
(1,088
|
)
|
(1,144
|
)
|
||||
|
25,253
|
19,877
|
|||||||
|
Deferred
tax asset valuation allowance
|
(3,862
|
)
|
(3,322
|
)
|
||||
|
Total
Deferred tax assets, net
|
$
|
21,391
|
$
|
16,555
|
||||
As
required by ASC Topic 740, Income Taxes, (ASC Topic 740)
the conclusion that it is more likely than not that the net deferred tax asset
of approximately $21.4 million and $16.6 million at December 31,
2009 and 2008, respectively, would be realized was based on careful evaluation
of the nature and weight of all of the available positive and negative evidence
in accordance with generally accepted accounting principles. In reaching our
conclusion, we balanced the weight of both the negative and positive evidence
including cumulative losses; recent positive earnings; the expected level of
future earnings; the length of the carry forward periods applicable to the
deferred tax assets; and the change in business activity in recent years as
compared to the initial years of operation.
The
Company’s deferred tax assets as of December 31, 2009 have been reduced in
accordance with ASC 718. As such, foreign tax credit carryforwards which were
increased due to excess tax benefits from the exercise of stock options are not
recorded as deferred tax assets. Instead such amounts will be recorded as an
addition to stockholders’ equity and will reduce current taxes payable if
and when the carryovers are utilized. Deferred tax assets and the related
valuation allowance in the above presentation have been reduced by the $1.3
million effect resulting from excess tax deductions from stock
options.
We have
state net operating losses which expire in various times and amounts through
2027. For the year ended December 31, 2009, we had a valuation allowance
which may not be utilized of $3.9 million , of which approximately $1.1 million
represents an allowance against our state net operating losses, $1.5 million
represents an allowance against our impairment loss for auction rate securities,
and $1.3 million represents an allowance against our Foreign Tax Credits.
Capital losses generally may only be used to offset income from capital
gains. Since we do not anticipate any capital gains in the
foreseeable future, no tax benefit is recorded with respect to the impairment
losses as it is not likely that tax benefits would ultimately be realized from
such losses. For the year ended December 31, 2008, approximately $1.1
million of the $3.3 million represents a valuation allowance against our state
net operating losses, which may not be utilized, and $2.2 million of the $3.3
million represents a valuation allowance against our impairment loss for auction
rate securities, which may not be utilized.
As of
December 31, 2009 and 2008, we had U.S. federal net operating loss
carryforwards of $6.3 million and $9.2 million, respectively. These
loss carryforwards are subject to limitation under Section 382 of the
Internal Revenue Code. These losses are available to reduce future taxable
income and expire in varying amounts beginning in 2022.
As of
December 31, 2009 and 2008, we had U.S. federal foreign tax credit carryovers of
$1.3 million and $0.1 million respectively. These credits are available to
offset future federal income tax subject to limitation and expire in varying
amounts beginning in 2018.
As of
December 31, 2008, all Canadian net operating loss carryforwards from prior
periods were fully utilized.
69
The
difference in income tax expense between the amount computed using the statutory
federal income tax rate and our effective tax rate is primarily due to state
taxes and tax exempt income from investments. The effect of change in tax rate
for 2009 and 2008 is primarily due to state taxes, differences in foreign tax
rates, benefits derived from tax exempt income, effects of foreign repatriation
and changes in earnings mix. The effect of change in tax rate for 2008 and 2007
is primarily due to state taxes, differences in foreign tax rates and the
benefits derived from tax exempt income.
|
Year
Ended December 31,
|
||||||||||||
|
2009
|
2008
|
2007
|
||||||||||
|
Pre-tax
book income
|
35.0
|
%
|
35.0
|
%
|
35.0
|
%
|
||||||
|
State
taxes
|
2.3
|
(2.7
|
)
|
3.5
|
||||||||
|
Foreign
rate differential
|
(6.2
|
)
|
18.8
|
2.8
|
||||||||
|
Deferred
tax rate adjustment
|
2.2
|
(7.9
|
)
|
1.5
|
||||||||
|
Valuation
allowance and other
|
11.5
|
26.3
|
(3.1
|
)
|
||||||||
|
Total
|
44.8
|
%
|
69.5
|
%
|
39.7
|
%
|
||||||
We do not
provide for deferred taxes on the temporary differences related to investments
in foreign subsidiaries since such profits are considered to be permanently
invested.
We do not
expect any significant increase or decrease in our unrecognized tax benefits
within the next 12 months. We have adopted the revisions of generally accepted
accounting principles, now included in ASC Topic 740 with respect to accounting
for uncertain tax positions. ASC Topic 740 specifies the way public companies
are to account for uncertainty in income taxes and prescribes the methodology
for recognizing, reversing, and measuring the tax benefits of a tax position
taken, or expected to be taken, in a tax return. Our adoption of ASC Topic 740
did not result in any change to the level of our liability for uncertain tax
positions, and there was no adjustment to our retained earnings for the
cumulative effect of an accounting change.
We file a
consolidated US income tax return and tax returns in various state and local
jurisdictions. Certain of our subsidiaries also file income tax returns in
Canada. The Internal Revenue Service (IRS) has concluded a review of our
consolidated federal income tax return for the periods ended December 31, 2006
and December 31, 2007 with no income tax adjustments. The IRS completed an
examination of DealerTrack Systems, Inc. (f/k/a Arkona, Inc.) for the period
ended March 31, 2006 (pre-acquisition period). The federal audit was concluded
with no income tax adjustments. All of our other significant taxing
jurisdictions are closed for years prior to 2006.
Interest
and penalties, if any, related to tax positions taken in our tax returns are
recorded in interest expense and general and administrative expenses,
respectively, in our consolidated statement of operations. At December 31, 2007,
no amounts were accrued for interest and penalties related to tax positions
taken on our tax returns. At December 31, 2009 and December 31, 2008, we accrued
interest and penalties related to tax positions taken on our tax returns of
approximately $47,000 and $38,000, respectively.
A
year-over-year reconciliation of our liability for uncertain tax positions is as
follows (dollars in millions):
|
Balance
January 1, 2009
|
$ | 0.5 | ||
|
Additions
|
0.4 | |||
|
Statue
expiration
|
(0.1 | ) | ||
|
Payments
|
— | |||
|
Balance
December 31, 2009
|
$ | 0.8 | ||
|
Balance
January 1, 2008
|
$ | 0.1 | ||
|
Additions
|
0.4 | |||
|
Payments
|
— | |||
|
Balance
December 31, 2008
|
$ | 0.5 | ||
|
Balance
January 1, 2007
|
$ | 0.4 | ||
|
Additions
|
— | |||
|
Payments
|
(0.3 | ) | ||
|
Balance
December 31, 2007
|
$ | 0.1 |
70
As of
December 31, 2009, approximately $0.5 million of the liability for
uncertain tax positions recorded in our balance sheet would affect our effective
rate upon resolution of the uncertain tax positions.
11.
Stock Option and Deferred Compensation Plans
Third Amended and Restated 2005
Incentive Award Plan
On June
17, 2009, our stockholders approved a proposal to amend and restate our Second
Amended and Restated Incentive Award Plan (2005 Plan) to, among other things,
increase the aggregate number of shares authorized for issuance under the 2005
Plan by 4,855,847 shares. After giving effect to these additional shares there
is an aggregate of 14,105,847 shares of common stock that have been reserved for
issuance pursuant to the 2005 Plan. As of December 31, 2009, 5,430,632
shares were available for future issuance. Options granted generally vest over a
period of four years from the vesting commencement date (three years for
directors), and expire seven years from the date of grant (as defined by the
plan document), except for stock options granted prior to July 11, 2007,
which expire ten years from the date of grant (as defined by the plan document)
and terminate, to the extent unvested, on the date of termination of employment,
and to the extent vested, generally at the end of the three-month period
following termination of employment, except in the case of executive officers,
who under certain conditions have a twelve-month period following termination of
employment to exercise.
Our
stockholders also approved a proposal to amend our 2005 Plan to allow for a
one-time stock option exchange program. For further information regarding the
stock option exchange program, please refer to Note 12.
|
Number
of
|
Weighted-Average
|
|||||||
|
Shares
|
Exercise
Price
|
|||||||
|
Balance
as of January 1, 2009
|
4,733,349 | $ | 16.0616 | |||||
|
Options
Granted
|
1,188,907 | $ | 14.1923 | |||||
|
Options
Exercised
|
(592,964 | ) | $ | 3.7129 | ||||
|
Options
Forfeited
|
(483,367 | ) | $ | 26.2041 | ||||
|
Options
Expired
|
(411,083 | ) | $ | 27.9625 | ||||
|
Balance
as of December 31, 2009
|
4,434,842 | $ | 15.0110 | |||||
|
Vested
and unvested expected to vest as of December 31, 2009
|
1,489,077 | $ | 17.3361 | |||||
The
intrinsic value of the stock options exercised during the years ended December
31, 2009, 2008 and 2007 was approximately $6.1 million, $1.1 million,
and $18.9 million, respectively. The intrinsic value of the stock options vested
and unvested expected to vest at December 31, 2009 was approximately $5.2
million. The weighted average remaining contractual term for options vested and
unvested expected to vest at December 31, 2009 was
5.8491 years.
The
following table summarizes information concerning currently outstanding and
exercisable options as of December 31, 2009:
|
Options Outstanding
|
Options Exercisable
|
|||||||||||||||||||||||||||||||
|
|
Weighted-
|
Weighted-
|
||||||||||||||||||||||||||||||
|
|
Average
|
Weighted-
|
Aggregate
|
Average
|
Weighted-
|
Aggregate
|
||||||||||||||||||||||||||
|
Exercise
|
Number
of
|
Remaining
|
Average
|
Intrinsic
|
Remaining
|
Average
|
Intrinsic
|
|||||||||||||||||||||||||
|
Price
|
Shares
|
Contractual
|
Exercise
|
Value
|
Number
|
Contractual
|
Exercise
|
Value
|
||||||||||||||||||||||||
|
Range
|
Outstanding
|
Life in Years
|
Price
|
(’000)
|
Exercisable
|
Life in Years
|
Price
|
(’000)
|
||||||||||||||||||||||||
|
$2.80
— $47.98
|
4,434,842 | 4.9138 | $ | 15.0110 | $ | 26,425 | 2,855,556 | 4.3962 | $ | 13.7253 | $ | 20,990 | ||||||||||||||||||||
The
aggregate intrinsic value in the table above represents the total pre-tax
intrinsic value, based on our closing stock price of $18.79 for the year ended
December 31, 2009.
We have
granted restricted common stock awards and restricted common stock units to
certain employees and directors under the 2005 Incentive Award Plan. The awards
are generally subject to an annual cliff vest of four years from the date of
grant (one year for directors).
71
A summary
of the status of the non-vested shares of restricted common stock awards as of
December 31, 2009 and changes during the year ended December 31, 2009,
is presented below:
|
Restricted Common Stock
|
||||||||
|
Weighted
|
||||||||
|
Number
of
|
Average
Grant
|
|||||||
|
Shares
|
Date Fair Value
|
|||||||
|
Non-vested
as of January 1, 2009
|
883,175 | $ | 14.3609 | |||||
|
Awards
granted
|
61,243 | $ | 15.4300 | |||||
|
Awards
vested
|
(217,859 | ) | $ | 21.3881 | ||||
|
Awards
canceled/expired/forfeited
|
(105,691 | ) | $ | 12.4730 | ||||
|
Non-vested
as of December 31, 2009
|
620,868 | $ | 12.3219 | |||||
The total
fair value for restricted common stock awards that vested during the year ended
December 31, 2009, 2008 and 2007 was $2.9 million, $2.7 million, and $2.5
million, respectively.
A summary
of the status of the non-vested shares of restricted common stock units as of
December 31, 2009 and changes during the year ended December 31, 2009,
is presented below:
|
Restricted Common Stock
Units
|
||||||||
|
Weighted
|
||||||||
|
Number
of
|
Average
Grant
|
|||||||
|
Shares
|
Date Fair Value
|
|||||||
|
Non-vested
as of January 1, 2009
|
— | $ | — | |||||
|
Awards
granted
|
715,775 | $ | 12.0253 | |||||
|
Awards
vested
|
— | $ | — | |||||
|
Awards
canceled/expired/forfeited
|
(31,850 | ) | $ | 11.7600 | ||||
|
Non-vested
as of December 31, 2009
|
683,925 | $ | 12.0376 | |||||
As of
December 31, 2009, there was $9.3 million, $5.9 million, and
$5.1 million of unamortized stock-based compensation expense related to
stock options, restricted common stock units, and restricted common stock
awards, respectively. The unamortized stock-based compensation expense related
to stock options and restricted common stock units is expected to be recognized
on a straight line basis over a weighted average remaining period of
1.8076 years and 3.1215 years, respectively. Of the $5.1 million of
unamortized stock-based compensation expense related to restricted common stock
awards, $2.1 million is expected to be recognized on a straight-line basis
over a weighted average remaining period of 0.5384 years. The remaining
$3.0 million of unamortized stock-based compensation expense related to
restricted common stock awards relates to the long-term incentive equity awards,
of which $0.1 million relates to the Market Value Awards and $2.9 million
relates to the EBITDA Performance Awards. Of the $3.0 million of unamortized
stock-based compensation expense related to the long-term incentive equity
awards, $2.9 million will not be expensed due to the cancellation of 303,303
awards on January 31, 2010.
Employee
Stock Purchase Plan
The total
number of shares of common stock reserved under the ESPP is 1,500,000 and the
total number of shares available for future issuance as of December 31,
2009 under the ESPP is 1,213,479. For employees eligible to participate on the
first date of an offering period, the purchase price of shares of common stock
under the ESPP will be 95% of the fair market value of the shares on the last
day of the offering period, which is the date of purchase. Effective April 1,
2009, the discount was reduced from 15% to 5%. As of December 31, 2009,
286,521 shares of common stock were issued under the ESPP.
Employees’
Deferred Compensation Plan
The
Employees’ Deferred Compensation Plan is a non-qualified retirement plan. The
Employees’ Deferred Compensation Plan allows a select group of our management to
elect to defer certain bonuses that would otherwise be payable to the employee.
Amounts deferred under the Employees’ Deferred Compensation Plan are general
liabilities of ours and are represented by bookkeeping accounts maintained on
behalf of the participants. Such accounts are deemed to be invested in share
units that track the value of our common stock. Distributions will generally be
made to a participant following the participant’s termination of employment or
other separation from service, following a change of control if so elected, or
over a fixed period of time elected by the participant prior to the deferral.
Distributions will generally be made in the form of shares of our common stock.
As of December 31, 2009, 2,177 deferred stock units were recorded under a
memo account and 147,823 shares of common stock are reserved and available for
distribution under the Employees’ Deferred Compensation Plan.
72
Directors’
Deferred Compensation Plan
The
Directors’ Deferred Compensation Plan is a non-qualified retirement plan that
allows each board member to elect to defer certain fees that would otherwise be
payable to the director. Amounts deferred under the Directors’ Deferred
Compensation Plan are general liabilities of ours and are represented by
bookkeeping accounts maintained on behalf of the participants. Such accounts are
deemed to be invested in share units that track the value of our common stock.
Distributions will generally be made to a participant following the
participant’s termination of service following a change of control if so
elected, or over a fixed period of time elected by the participant prior to the
deferral. Distributions will generally be made in the form of shares of our
common stock. As of December 31, 2009, 58,785 deferred stock units were
recorded under a memo account and 16,215 shares of common stock are reserved and
available for distribution under the Directors’ Deferred Compensation
Plan.
Long
Term Incentive Equity Awards
Awards
granted under the LTIP, consisted of 455,000 shares of restricted common stock
(net of cancellations). Each individual’s total award was allocated 50% to
achieving earnings before interest, taxes, depreciation and amortization, as
adjusted to reflect any future acquisitions (EBITDA Performance Award) and 50%
to the market value of our common stock (Market Value Award). The awards are
earned upon our achievement of EBITDA and market-based targets for the fiscal
years 2007, 2008 and 2009, but will not vest unless the grantee remains
continuously employed in active service until January 31, 2010. If an
EBITDA Performance Award or Market Value Award is not earned in an earlier year,
it can be earned upon achievement of that target in a subsequent year. The
awards will accelerate in full upon a change in control.
During
the year ended December 31, 2009, 96,667 shares of long-term performance equity
awards were cancelled and the vesting of 38,333 shares of long-term performance
equity awards were accelerated due to the departure of certain executive
officers, most of which were in connection with the realignment of our workforce
and business as discussed in Note 16. For the year ended December 31, 2009, we
reversed approximately $0.5 million of stock-based compensation expense related
to the cancelled shares and recorded stock-based compensation expense of
approximately $0.2 million related to the accelerated shares.
On
January 31, 2010, 151,697 shares of long-term performance equity awards vested
relating to the 2007 EBITDA Performance Award and the 2007 Market Value Award
and the remaining 303,303 shares of long-term performance equity awards were
cancelled as the 2008 and 2009 EBITDA and Market Value targets were not
achieved.
On August
7, 2009, the Company commenced a tender offer to its employees (excluding
executive officers and members of the board of directors) to exchange
outstanding options to purchase shares of our common stock granted prior to
August 7, 2008, that have an exercise price per share greater than $22.82
(Eligible Options) for a lesser number of new options to purchase shares of the
Company’s common stock with an exercise price equal to the closing price of our
common stock on the Nasdaq Global Select Market on the date of grant, subject to
certain conditions. The exchange offer expired on September 3, 2009 and pursuant
to the exchange offer, 571,763 Eligible Options were tendered, representing 64%
of the total Eligible Options qualified for the exchange. On September 4, 2009,
we granted an aggregate of 435,247 stock options in exchange for the Eligible
Options surrendered. The incremental fair value stock-based compensation expense
related to the 435,247 exchanged stock options is approximately $54,000. The
incremental expense of $54,000 will be amortized over the new vesting schedule
of 25% six months from the new grant date, 25% twelve months from the new grant
date, and 1/48 from the new options date each month thereafter. We adopted the
pooling method of accounting, whereby we are recognizing the unamortized
stock-based compensation expense of the original award plus the incremental
expense of the new grant over the new vesting schedule.
13.
Stock Repurchase Program
On March
18, 2008, the board of directors approved a stock repurchase program under which
we were authorized to spend up to $75.0 million to repurchase shares of our
common stock. The stock repurchase program expired on March 31, 2009. From
inception of the program through its expiration, we repurchased approximately
3.0 million shares of common stock for an aggregate price of approximately $49.8
million. There were no repurchases during 2009.
73
14.
Commitments and Contingencies
Operating
Leases
We lease
our office space and various office equipment under cancelable and noncancelable
operating leases which expire on various dates through October 15, 2018. In
general, leases relating to real estate include rent escalations clauses
relating to increases in operating costs. Some leases also include renewal
options of up to 5 years. For the years ended December 31, 2009, 2008 and
2007 the total operating lease expense was $5.5 million, $5.0 million
and $4.6 million, respectively.
Future
minimum rental payments under the noncancelable operating leases are as follows
(in thousands):
|
Years
Ending December 31,
|
||||
|
2010
|
$
|
4,952
|
||
|
2011
|
4,370
|
|||
|
2012
|
3,991
|
|||
|
2013
|
3,416
|
|||
|
2014
|
2,653
|
|||
|
Thereafter
|
9,552
|
|||
|
$
|
28,934
|
The
following is an analysis of the leased property under capital leases by major
property class (in thousands):
|
December
31,
|
||||||||
|
2009
|
2008
|
|||||||
|
Computer
equipment
|
$
|
1,591
|
$
|
1,486
|
||||
|
Furniture
and fixtures
|
197
|
203
|
||||||
|
1,788
|
1,689
|
|||||||
|
Less:
Accumulated depreciation
|
(1,229
|
)
|
(870
|
)
|
||||
|
$
|
559
|
$
|
819
|
|||||
|
Years
Ending December 31,
|
||||
|
2010
|
$
|
466
|
||
|
2011
|
231
|
|||
|
2012
|
65
|
|||
|
Total
minimum lease payments
|
762
|
|||
|
Less:
Amount representing taxes, included in total minimum lease
payments
|
(27
|
)
|
||
|
Net
minimum lease payments
|
735
|
|||
|
Less:
Amount representing interest
|
(55
|
)
|
||
|
Present
value of net minimum lease payments
|
$
|
680
|
||
74
Retail
Sales Tax
The
Ontario Ministry of Revenue (the Ministry) has conducted a retail sales tax
field audit on the financial records of our Canadian subsidiary, DealerTrack
Canada, Inc. (formerly known as DealerAccess Canada, Inc.), for the period from
March 1, 2001 through May 31, 2003. We received a formal assessment
from the Ministry indicating unpaid Ontario retail sales tax totaling
approximately $0.2 million, plus interest. Although we are disputing the
Ministry’s findings, the assessment, including interest, has been paid in order
to avoid potential future interest and penalties.
As part
of the purchase agreement dated December 31, 2003 between us and Bank of
Montreal for the purchase of 100% of the issued and outstanding capital stock of
DealerAccess, Inc., Bank of Montreal agreed to indemnify us specifically for
this potential liability for all sales tax periods prior to January 1,
2004. The potential sales tax liability for the period covered by this
indemnification is now closed due to the statutory expiration of the periods
open for audit by the Ministry. To date, all amounts paid to the Ministry by us
for this assessment have been reimbursed by the Bank of Montreal under this
indemnity.
We
undertook a comprehensive review of the audit findings of the Ministry using
external tax experts. Our position has been that our lender revenue transactions
are not subject to Ontario retail sales tax. We filed a formal Notice of
Objection with the Ministry on December 12, 2005. We received a letter
dated November 2, 2007 from an appeals officer of the Ministry stating that
the assessment was, in his opinion, properly raised and his intention was to
recommend his confirmation to senior management of the Ministry. The officer
agreed, however, to defer his recommendation for a period of thirty business
days to enable us to submit any additional information not yet provided. We
submitted additional information to the Ministry to support our position that
the services are not subject to sales tax.
We
received a letter dated December 21, 2007 from the Ministry stating that no
change should be made to the appeals officer’s opinion. The letter further
stated that we had ninety days from the date of the letter to file a Notice of
Appeal with the Superior Court of Justice. A Notice of Appeal was filed on our
behalf on March 18, 2008 to challenge the assessment because we did not
believe these services are subject to sales tax. On December 15, 2008, the
Ministry filed its response to our Notice of Appeal. The response reiterates the
Ministry’s position that the transactions are subject to Ontario retail sales
tax. The parties have completed the discovery process and we expect this matter
will be heard by the Superior Court in 2010. We have not accrued any related
sales tax liability for the period subsequent to May 31, 2003 for these
lender revenue transactions. This appeal is supported by the financial
institutions whose source revenue transactions were subject to the assessment.
These financial institutions have agreed to participate in the cost of the
litigation.
In the
event we are obligated to charge sales tax for this type of transaction, we
believe this Canadian subsidiary’s contractual arrangements with its lender
customers obligate these customers to pay all sales taxes that are levied or
imposed by any taxing authority by reason of the transactions contemplated under
the particular contractual arrangement. In the event of any failure to pay such
amounts by our customers, we would be required to pay the obligation, which
could range from $5.2 million (CAD) to $5.8 million (CAD), including
penalties and interest.
Commitments
Pursuant
to employment or severance agreements with certain employees, we had a
commitment to pay severance of approximately $4.2 million as of
December 31, 2009 and $5.4 million as of December 31, 2008, in
the event of termination without cause, as defined in the agreements, as well as
certain potential gross-up payments to the extent any such severance payment
would constitute an excess parachute payment under the Internal Revenue Code. We
also have a commitment to pay additional severance of $1.9 million as of
December 31, 2009 and $2.9 million as of December 31, 2008, if there is a change
in control.
We are a
party to a variety of agreements pursuant to which we may be obligated to
indemnify the other party with respect to breach of contract, infringement and
other matters. Typically, these obligations arise in the context of agreements
entered into by us, under which we customarily agree to hold the other party
harmless against losses arising from breaches of representations, warranties
and/or covenants. In these circumstances, payment by us is generally conditioned
on the other party making a claim pursuant to the procedures specified in the
particular agreement, which procedures typically allow us to challenge the other
party’s claims. Further, our obligations under these agreements may be limited
to indemnification of third-party claims only and limited in terms of time
and/or amount. In some instances, we may have recourse against third parties for
certain payments made by us.
It is not
possible to predict the maximum potential amount of future payments under these
or similar agreements due to the conditional nature of our obligations and the
unique facts and circumstances involved in each particular agreement. To date,
we have not been required to make any such payment. We believe that if we were
to incur a loss in any of these matters, it is not probable that such loss would
have a material effect on our business or financial condition.
From time
to time, we are a party to litigation matters arising in connection with the
normal course of our business, none of which is expected to have a material
adverse effect on us. In addition to the litigation matters arising in
connection with the normal course of our business, we are party to the
litigation described below.
DealerTrack, Inc. v.
Finance Express et al., CV-06-2335; DealerTrack Inc. v. RouteOne and
Finance Express et al., CV-06-6864; and DealerTrack Inc. v. RouteOne and
Finance Express et al., CV-07-215
75
On
April 18, 2006, we filed a Complaint and Demand for Jury Trial against
David Huber, Finance Express LLC (Finance Express), and three of their unnamed
dealer customers in the United States District Court for the Central District of
California, Civil Action No. CV-06-2335 AG (FMOx). The complaint sought
declaratory and injunctive relief, as well as damages, against the defendants
for infringement of the U.S. Patent No. 5,878,403 (the ’403 Patent)
Patent and the 6,587,841 (the ’841 Patent). Finance Express denied infringement
and challenged the validity and enforceability of the
patents-in-suit.
On
October 27, 2006, we filed a Complaint and Demand for Jury Trial against
RouteOne, David Huber and Finance Express in the United States District Court
for the Central District of California, Civil Action No. CV-06-6864 (SJF).
The complaint sought declaratory and injunctive relief as well as damages
against the defendants for infringement of the ’403 Patent and the ’841 Patent.
On November 28, 2006 and December 4, 2006, respectively, defendants
RouteOne, David Huber and Finance Express filed their answers. The defendants
denied infringement and challenged the validity and enforceability of the
patents-in-suit.
On
February 20, 2007, we filed a Complaint and Demand for Jury Trial against
RouteOne LLC (RouteOne), David Huber and Finance Express in the United States
District Court for the Central District of California, Civil Action
No. CV-07-215 (CWx). The complaint sought declaratory and injunctive relief
as well as damages against the defendants for infringement of U.S. Patent
No. 7,181,427 (the ’427 Patent). On April 13, 2007 and April 17,
2007, respectively, defendants RouteOne, David Huber and Finance Express filed
their answers. The defendants denied infringement and challenged the validity
and enforceability of the ’427 Patent.
The
DealerTrack, Inc. v. Finance Express et al., CV-06-2335 action, the DealerTrack
Inc. v. RouteOne and Finance Express et al., CV-06-6864 action and the
DealerTrack v. RouteOne and Finance Express et al., CV-07-215 action,
described above, were consolidated by the court. A hearing on claims
construction, referred to as a “Markman ” hearing, was held
on September 25, 2007. Fact and expert discovery and motions for summary
judgment have substantially been completed.
On
July 21, 2008 and September 30, 2008, the court issued summary
judgment orders disposing of certain issues and preserving other issues for
trial.
On
July 8, 2009, the court held Claims 1-4 of DealerTrack’s patent
7,181,427 was invalid for failure to comply with a standard required by the
recently decided case in the Court of Appeals of the Federal Circuit of In re
Bilski. On August 11, 2009, the court entered into a judgment granting
summary judgment. On September 8 , 2009, DealerTrack filed a notice of
appeal in the United States Court of Appeals for the Federal Circuit in regards
to the finding of non-infringement of patent 6,587,841, the invalidity of patent
7,181,427, and the claim construction order to the extent that it was relied
upon to find the judgments of non-infringement and invalidity. On October 29,
2009, the Federal Circuit granted a motion to stay briefing until the
disposition of In re Bilski.
We
believe that the potential liability from all current litigations will not have
a material effect on our financial position or results of operations when
resolved in a future period.
15.
Segment Information
The
segment information provided in the table below is being reported consistent
with our method of internal reporting. Operating segments are defined as
components of an enterprise for which separate financial information is
available that is evaluated regularly by the chief operating decision maker in
deciding how to allocate resources and in assessing performance. The chief
operating decision maker reviews information at a consolidated level, as such we
have one reportable segment. For enterprise-wide disclosure, we are organized
primarily on the basis of service lines. Revenue earned outside of the United
States for the years ended December 31, 2009, 2008 and 2007 is
approximately 11%, 11% and 10% of our revenue, respectively.
|
Year
Ended December 31,
|
||||||||||||
|
2009
|
2008
|
2007
|
||||||||||
|
Transaction
services revenue
|
$
|
94,406
|
$
|
132,419
|
$
|
147,312
|
||||||
|
Subscription
services revenue
|
114,931
|
94,690
|
75,061
|
|||||||||
|
Other
|
16,289
|
15,597
|
11,472
|
|||||||||
|
Total
net revenue
|
$
|
225,626
|
$
|
242,706
|
$
|
233,845
|
||||||
76
16.
Realignment of Workforce and Business
On
January 5, 2009, we announced a realignment of our workforce and business aimed
at sharpening our focus on high growth opportunities and to reflect current
market conditions. We reduced our workforce by approximately 90 people, or 8% of
our total employees, including several executive and senior-level positions. As
a result of the realignment, we incurred total restructuring costs during the
three months ended March 31, 2009 of approximately $6.7 million, including
approximately $3.9 million of net non-cash compensation expense.
The table
below sets forth the significant cash components and activity associated with
the realignment of workforce and business under the restructuring program for
the year ended December 31, 2009 (in thousands):
|
Balance as of
January 1, 2009
|
Charges
|
Cash Payments
|
Balance as of
December 31, 2009
|
|||||||||||||
|
Severance
|
$ | — | $ | 2,683 | $ | 2,683 | $ | — | ||||||||
|
Other
benefits
|
— | 156 | 156 | — | ||||||||||||
|
Total
|
$ | — | $ | 2,839 | $ | 2,839 | $ | — | ||||||||
17.
Exit from SCS Business
On
February 14, 2009, DealerTrack exited its SCS business in a transaction with a
former senior executive of the company who left the organization in January 2009
as part of the realignment of our workforce. The SCS business, which accounted
for approximately $1.9 million of revenue in 2008, is an administration system
used by aftermarket providers as their back-end origination solution. The SCS
entity was and will continue to be funded through owner contributions and
through ongoing operations. DealerTrack recorded a gain of approximately $0.2
million upon sale which is classified as a contra expense in selling, general
and administrative expenses for the twelve months ended December 31,
2009.
If the
purchaser of the business goes through a change of control prior to February 14,
2014, we can earn up to $2.0 million in contingent purchase price from this
transaction. If the purchaser does not undergo a change of control by
February 14, 2014, the purchaser will pay DealerTrack a one time payment of $0.5
million. These contingent payments accrue interest at an annual compound
interest rate of 12 month LIBOR plus 3%. As of December 31, 2009, DealerTrack’s
maximum exposure is approximately $0.4 million. As of December 31, 2009, we have
recorded a long-term receivable of approximately $0.4 million, which represents
the present value of the expected future contingent payments.
The newly
formed company is a variable interest entity (VIE), as defined in ASC Topic
810-10-25-20 through ASC Topic 810-10-25-30, which provides a framework for
identifying VIEs and determining when a company should include the assets,
liabilities, non controlling interests and results of activities of a VIE in its
consolidated financial statements. The primary beneficiary is the
party that consolidates a VIE based on its assessment that it will absorb a
majority of the expected losses or expected residual returns of the entity, or
both. We have determined that we are not the primary beneficiary of the newly
formed entity described above and, therefore, have not included the assets and
liabilities or results of operations in our consolidated financial statements.
The significant assumptions and judgments used in determining whether we are the
primary beneficiary included the fair value of the note receivable from the SCS
entity and the fair value of the SCS entity. Unfavorable changes to the fair
values could result in consolidation of the SCS entity. We will assess the need
for consolidation on a quarterly basis.
18.
Subsequent Events
We
evaluated subsequent events through February 24, 2010, the date on which this
Annual Report on Form 10-K was filed with the SEC. There were no events or
transactions occurring during this subsequent event reporting period that
require recognition or disclosure in the financial statements, except as noted
below:
Strategic
Agreement with General Motors Acceptance Corporation (GMAC)
On
February 10, 2010, DealerTrack, Inc., a subsidiary of DealerTrack Holdings, Inc.
(DealerTrack) entered into a strategic relationship with GMAC. Under the
terms of the agreement, GMAC will be listed as a financing option on the
DealerTrack credit application processing network and DealerTrack has agreed to
make a one-time payment to GMAC of $15.0 million payable upon GMAC becoming
available to substantially all dealers that it does business with who are on the
DealerTrack U.S. network. The one-time $15.0 million payment will be
recorded ratably as a reduction to revenue over an estimated period of five
years. GMAC will be available to General Motors and Chrysler dealers, as
well as dealers of other manufacturers that GMAC elects to do business with.
GMAC will continue to accept credit applications through the RouteOne
system.
77
VALUATION
AND QUALIFYING ACCOUNTS
|
Balance
at
|
Additions
|
Balance
at
|
||||||||||||||||||
|
Beginning
of
|
Charged
to
|
Other
|
End
of
|
|||||||||||||||||
|
Description
|
Period
|
Expenses
|
Deductions
|
Adjustments
|
Period
|
|||||||||||||||
|
(In
thousands)
|
||||||||||||||||||||
|
As
of December 31, 2009:
|
||||||||||||||||||||
|
Allowance
for doubtful accounts
|
$ | 948 | $ | 2,127 | $ | (2,319 | ) | $ | — | $ | 756 | |||||||||
|
Allowance
for sales credits
|
900 | 5,571 | (4,550 | ) | — | 1,921 | ||||||||||||||
|
Deferred
tax valuation allowance
|
3,322 | 1,246 | (488 | ) | (218 | ) | 3,862 | (1) | ||||||||||||
|
As
of December 31, 2008:
|
||||||||||||||||||||
|
Allowance
for doubtful accounts
|
$ | 1,730 | $ | 4,225 | $ | (5,007 | ) | $ | — | $ | 948 | |||||||||
|
Allowance
for sales credits
|
885 | 5,414 | (5,399 | ) | — | 900 | ||||||||||||||
|
Deferred
tax valuation allowance
|
954 | 141 | — | 2,227 | 3,322 | (2) | ||||||||||||||
|
As
of December 31, 2007:
|
||||||||||||||||||||
|
Allowance
for doubtful accounts
|
$ | 1,884 | $ | 3,620 | $ | (3,883 | ) | $ | 109 | $ | 1,730 | |||||||||
|
Allowance
for sales credits
|
2,523 | 3,147 | (4,785 | ) | — | 885 | ||||||||||||||
|
Deferred
tax valuation allowance
|
214 | 109 | — | 631 | 954 | (3) | ||||||||||||||
|
(1)
|
For
the year ended December 31, 2009, the deferred tax valuation allowance was
increased by $0.5 million consisting of an increase of $1.2 million due to
an increase in unrealizable foreign tax credit carryovers, offset by a
decrease of $0.5 million due to a decrease in deferred tax assets related
to auction rate securities and $0.2 million decrease related to state and
local net operating loss carryovers.
|
|
|
(2)
|
For
the year ended December 31, 2008, the deferred tax valuation allowance was
increased by $2.2 million primarily due to realized loss on auction rate
securities and was further increased by expenses in various
states.
|
|
|
(3)
|
For
the year ended December 31, 2007, the deferred tax valuation
allowance was increased by $0.6 million primarily due to acquisitions
during 2007 and was further increased by expenses in various
states.
|
|
Disclosure
Controls and Procedures
We
carried out an evaluation under the supervision and with the participation of
our management, including our chief executive officer and chief financial
officer, of the effectiveness of the design and operation of our disclosure
controls and procedures, as such term is defined in Rules 13a- 15(e) and
15d- 15(e) under the Exchange Act. In designing and evaluating our disclosure
controls and procedures, we and our management recognize that any controls and
procedures, no matter how well designed and operated, can provide only
reasonable assurance of achieving the desired control objectives, and our
management necessarily was required to apply its judgment in evaluating and
implementing possible controls and procedures. Based upon that evaluation, our
chief executive officer and chief financial officer have concluded that, as of
the end of the period covered by this Annual Report on Form 10-K, our disclosure
controls and procedures were effective at the reasonable assurance
level.
Changes
in Internal Control Over Financial Reporting
There
were no changes in our internal control over financial reporting during the
quarter ended December 31, 2009 that have materially affected, or are
reasonably likely to materially affect, our internal control over financial
reporting.
78
Management’s
Annual Report on Internal Control Over Financial Reporting
Our
management is responsible for establishing and maintaining adequate internal
control over financial reporting, as such term is defined in
Rules 13a-15(f) and 15d-15(f) under the Exchange Act. Our internal control
over financial reporting is a process designed to provide reasonable assurance
regarding the reliability of financial reporting and the preparation of
financial statements for external purposes in accordance with accounting
principles generally accepted in the United States of America. Because of its
inherent limitations, internal control over financial reporting may not prevent
or detect misstatements. In addition, projections of any evaluation of
effectiveness to future periods are subject to the risk that controls may become
inadequate because of changes in conditions and that the degree of compliance
with the policies or procedures may deteriorate. Management assessed the
effectiveness of our internal control over financial reporting as of
December 31, 2009. In making this assessment, management used the criteria
set forth in the Internal Control-Integrated Framework issued by the Committee
of Sponsoring Organizations of the Treadway Commission (COSO). Management’s
assessment was reviewed with the Audit Committee of our Board of
Directors.
Based on
its assessment of internal control over financial reporting, our management has
concluded that, as of December 31, 2009, our internal control over
financial reporting was effective.
The
effectiveness of our internal control over financial reporting as of
December 31, 2009 has been audited by PricewaterhouseCoopers LLP, an
independent registered accounting firm, as stated in their report which appears
herein.
PART
III
Anything
herein to the contrary notwithstanding, in no event whatsoever are the sections
entitled “Nominating and Compensation Committee Report on Executive
Compensation” and “Audit Committee Report” to be incorporated by reference
herein from our proxy statement in connection with our annual meeting of
stockholders expected to be held in the second quarter of 2010.
The
information required to be furnished pursuant to this item will be set forth
under the captions “Proposal One: Election of Directors,” “Executive Officers”
and “Section 16(a) Beneficial Ownership Reporting Compliance” in the Proxy
Statement to be filed with the SEC no later than 120 days after the close
of our fiscal year ended December 31, 2009. If the Proxy Statement is not
filed with the SEC by such time, such information will be included in an
amendment to this Annual Report by such time.
The
information required to be furnished pursuant to this item will be set forth
under the caption “Executive Compensation” in the Proxy Statement to be filed
with the SEC no later than 120 days after the close of our fiscal year
ended December 31, 2009. If the Proxy Statement is not filed with the SEC
by such time, such information will be included in an amendment to this Annual
Report on Form 10-K by such time.
Item 12. Security
Ownership of Certain Beneficial Owners and Management and Related Stockholder
Matters
The
information required to be furnished pursuant to this item will be set forth
under the caption “Security Ownership of Certain Beneficial Owners and
Management” in the Proxy Statement to be filed with the SEC no later than
120 days after the close of our fiscal year ended December 31, 2009.
If the Proxy Statement is not filed with the SEC by such time, such information
will be included in an amendment to this Annual Report on Form 10-K by such
time.
The
information required to be furnished pursuant to this item will be set forth
under the caption “Certain Relationships and Transactions” in the Proxy
Statement to be filed with the SEC no later than 120 days after the close
of our fiscal year ended December 31, 2009. If the Proxy Statement is not
filed with the SEC by such time, such information will be included in an
amendment to this Annual Report on Form 10-K by such time.
The
information required to be furnished pursuant to this item will be set forth
under the caption “Principal Accountant Fees and Services” in the Proxy
Statement to be filed with the SEC no later than 120 days after the close
of our fiscal year ended December 31, 2009. If the Proxy Statement is not
filed with the SEC by such time, such information will be included in an
amendment to this Annual Report on Form 10-K by such time.
79
PART
IV
(a) The
following documents are included in “Financial Statements and Supplementary
Data” in Part II, Item 8 of this Annual Report on Form
10-K:
(1) Financial
Statements:
Report of
Independent Registered Public Accounting Firm
Consolidated
Balance Sheets as of December 31, 2009 and 2008
Consolidated
Statements of Operations for the three years ended December 31,
2009
Consolidated
Statements of Cash Flows for the three years ended December 31,
2009
Consolidated
Statements of Stockholders’ Equity and Comprehensive Income for each of the
three years ended December 31, 2009
Notes to
Consolidated Financial Statements
(2) Financial
Statement Schedule — Schedule II
|
Number
|
Description
|
|
|
3.1
(4)
|
Form
of Fifth Amended and Restated Certificate of Incorporation of DealerTrack
Holdings, Inc.
|
|
|
3.2 (4)
|
Form
of Amended and Restated By-laws of DealerTrack Holdings,
Inc.
|
|
|
4.1
(1)
|
Fourth
Amended and Restated Registration Rights Agreement, dated as of
March 19, 2003, among DealerTrack Holdings, Inc. and the stockholders
of DealerTrack Holdings, Inc. party thereto.
|
|
|
4.2
(3)
|
Form
of Certificate of Common Stock.
|
|
|
10.1
(3)
|
License
Agreement, made and entered into as of February 1, 2001, by and
between The Chase Manhattan Bank and J.P. Morgan Partners (23A SBIC
Manager), Inc.
|
|
|
10.2
(3)
|
Asset
Purchase Agreement, dated as of May 25, 2005, by and among Santa
Acquisition Corporation, Automotive Lease Guide (alg), LLC, Automotive
Lease Guide (alg) Canada, Inc., Douglas W. Aiken, John A. Blair and
Raj Sundaram.
|
|
|
10.3
(9)
|
Amended
and Restated Senior Executive Employment Agreement, dated as of
August 8, 2007, by and between Mark F. O’Neil and DealerTrack
Holdings, Inc.
|
|
|
10.4
(10)
|
Amendment
No. 1 To Amended and Restated Senior Executive Employment Agreement,
dated December 31, 2008, by and between Mark F. O’Neil and
DealerTrack Holdings, Inc.
|
|
|
10.5
(11)
|
Amendment
No. 2 to Amended and Restated Executive Employment Agreement dated
November 3, 2009 between DealerTrack Holdings, Inc. and Mark F.
O’Neil
|
|
|
10.6
*
|
Amended
and Restated Senior Executive Employment Agreement, dated as of
August 8, 2007, by and between Richard McLeer and DealerTrack
Holdings, Inc.
|
|
|
10.7
*
|
Amendment
No. 1 To Amended and Restated Senior Executive Employment Agreement,
dated December 31, 2008, by and between Richard McLeer and
DealerTrack Holdings, Inc.
|
|
|
10.8
*
|
Amendment
No. 2 to Amended and Restated Executive Employment Agreement dated
November 3, 2009 between DealerTrack Holdings, Inc. and Richard
McLeer
|
|
|
10.9
*
|
Amended
and Restated Senior Executive Employment Agreement, dated as of
August 8, 2007, by and between Rick G. Von Pusch and DealerTrack
Holdings, Inc.
|
|
|
10.10*
|
Amendment
No. 1 To Amended and Restated Senior Executive Employment Agreement,
dated December 31, 2008, by and between Rick G. Von Pusch and
DealerTrack Holdings, Inc.
|
80
|
Number
|
Description
|
|
|
10.11
*
|
Amendment
No. 2 to Amended and Restated Executive Employment Agreement dated
November 3, 2009 between DealerTrack Holdings, Inc. and Rick G. Von
Pusch
|
|
|
10.12
(9)
|
Amended
and Restated Senior Executive Employment Agreement, dated as of
August 8, 2007, by and between Eric D. Jacobs and DealerTrack
Holdings, Inc.
|
|
|
10.13
(10)
|
Amendment
No. 1 To Amended and Restated Senior Executive Employment Agreement,
dated December 31, 2008, by and between Eric D. Jacobs and
DealerTrack Holdings, Inc.
|
|
|
10.14
(11)
|
Amendment
No. 2 to Amended and Restated Executive Employment Agreement dated
November 3, 2009 between DealerTrack Holdings, Inc. and Eric D.
Jacobs.
|
|
|
10.15
(9)
|
Amended
and Restated Senior Executive Employment Agreement, dated as of
August 8, 2007, by and between Raj Sundaram and DealerTrack Holdings,
Inc.
|
|
|
10.16
(10)
|
Amendment
No. 1 To Amended and Restated Senior Executive Employment Agreement,
dated December 31, 2008, by and between Raj Sundaram and DealerTrack
Holdings, Inc.
|
|
|
10.17
(11)
|
Amendment
No. 2 to Amended and Restated Executive Employment Agreement dated
November 4, 2009 between DealerTrack Holdings, Inc. and Rajesh
Sundaram
|
|
|
10.18
(8)
|
Unfair
Competition and Nonsolicitation Agreement, dated as of May 25, 2005,
by and between Raj Sundaram and Automotive Lease Guide (alg),
Inc.
|
|
|
10.19
(8)
|
Amendment
No. 1 to Unfair Competition and Nonsoliciation Agreement, made as of
August 21, 2006, by and between Automotive Lease Guide (alg), Inc.
and Raj Sundaram.
|
|
|
10.20
(9)
|
Amended
and Restated Senior Executive Employment Agreement, dated as of
August 8, 2007, by and between Robert Cox and DealerTrack Holdings,
Inc.
|
|
|
10.21
(10)
|
Amendment
No. 1 To Amended and Restated Senior Executive Employment Agreement,
dated December 31, 2008, by and between Robert Cox and DealerTrack
Holdings, Inc.
|
|
|
10.22
(11)
|
Severance
Agreement and General Release between DealerTrack Holdings, Inc. and
Robert Cox dated March 2, 2009.
|
|
|
10.23
(1)
|
2001
Stock Option Plan of DealerTrack Holdings, Inc., effective as of
August 10, 2001.
|
|
|
10.24
(1)
|
First
Amendment to 2001 Stock Option Plan of DealerTrack Holdings, Inc.,
effective as of December 28, 2001.
|
|
|
10.25
(1)
|
Second
Amendment to 2001 Stock Option Plan of DealerTrack Holdings, Inc.,
effective as of March 19, 2003.
|
|
|
10.26
(1)
|
Third
Amendment to 2001 Stock Option Plan of DealerTrack Holdings, Inc.,
effective as of January 30, 2004.
|
|
|
10.27
(6)
|
Fourth
Amendment to 2001 Stock Option Plan of DealerTrack Holdings, Inc.
effective as of February 10, 2006.
|
|
|
10.28
*
|
Third
Amended and Restated 2005 Incentive Award Plan, effective as of
June 17, 2009.
|
|
|
10.29
(7)
|
Amendment
to Asset Purchase Agreement, dated October 18, 2006, by and among
Santa Acquisition Corporation, Automotive Lease Guide (alg), LLC,
Automotive Lease Guide (alg) Canada, Inc., Douglas W. Aiken, John A. Blair
and Raj Sundaram.
|
|
|
10.30
(5)
|
Form
of Stock Option Agreement.
|
|
|
10.31
(5)
|
Form
of Restricted Stock Agreement.
|
|
|
10.32
(10)
|
Form
of Restricted Stock Unit Agreement.
|
|
|
10.33
(1)
|
Senior
Executive Incentive Bonus Plan, effective as of May 26,
2005.
|
81
|
Number
|
Description
|
|
|
10.34
(8)
|
Stock
Ownership and Retention Program, adopted May 26,
2005.
|
|
|
10.35
(1)
|
Employee
Stock Purchase Plan, adopted May 26, 2005.
|
|
|
10.36
(1)
|
Directors’
Deferred Compensation Plan, effective as of June 30,
2005.
|
|
|
10.37
(9)
|
First
Amendment to DealerTrack Holdings, Inc. Directors’ Deferred Compensation
Plan effective as of January 1, 2007.
|
|
|
10.38
(1)
|
Employees’
Deferred Compensation Plan, effective as of June 30,
2005.
|
|
|
10.39
(9)
|
First
Amendment to DealerTrack Holdings, Inc. Employees’ Deferred Compensation
Plan effective as of January 1, 2007.
|
|
|
10.40
(1)
|
401(k)
Plan, effective as of January 1, 2001, as amended.
|
|
|
10.41
(2)
|
Lease
Agreement, dated as of August 5, 2004, between iPark Lake Success,
LLC and DealerTrack, Inc.
|
|
|
14.1
(6)
|
Code
of Business Conduct and Ethics.
|
|
|
21.1
*
|
List
of Subsidiaries.
|
|
|
23.1
*
|
Consent
of PricewaterhouseCoopers LLP.
|
|
|
31.1
*
|
Certification
of Mark F. O’Neil pursuant to Rule 13a-14(a) and 15d-14(a), as
adopted pursuant to Section 302 of the Sarbanes-Oxley Act of
2002.
|
|
|
31.2
*
|
Certification
of Eric D. Jacobs pursuant to Rule 13a-14(a) and 15d-14(a), as
adopted pursuant to Section 302 of the Sarbanes-Oxley Act of
2002.
|
|
|
32.1
*
|
Certification
of Mark F. O’Neil and Eric D. Jacobs pursuant to 18 U.S.C.
Section 1350, as adopted pursuant to Section 906 of the
Sarbanes-Oxley Act of 2002.
|
|
*
|
Filed
herewith.
|
|
(1)
|
Incorporated
by reference to our Registration Statement on Form S-1 (File
No. 333-126944) filed July 28, 2005.
|
|
(2)
|
Incorporated
by reference to Amendment No. 1 to our Registration Statement on Form
S-1 (File No. 333-126944) filed September 22,
2005.
|
|
(3)
|
Incorporated
by reference to Amendment No. 2 to our Registration Statement on Form
S-1 (File No. 333-126944) filed October 12, 2005.
|
|
(4)
|
Incorporated
by reference to Amendment No. 3 to our Registration Statement on Form
S-1 (File No. 333-126944) filed October 24, 2005.
|
|
(5)
|
Incorporated
by reference to our Quarterly Report on Form 10-Q filed May 12,
2006.
|
|
(6)
|
Incorporated
by reference to our Annual Report on Form 10-K filed March 30,
2006.
|
|
(7)
|
Incorporated
by reference to our Quarterly Report on Form 10-Q filed November 14,
2006.
|
|
(8)
|
Incorporated
by reference to our Annual Report on Form 10-K filed March 16,
2007.
|
|
(9)
|
Incorporated
by reference to our Quarterly Report on Form 10-Q filed August 9,
2007.
|
|
(10)
|
Incorporated
by reference to our Annual Report on Form 10-K filed on February 24,
2009.
|
|
(11)
|
Incorporated
by reference to our Quarterly Report on Form 10-Q filed November 5,
2009.
|
82
DealerTrack
hereby files as part of this Form 10-K the exhibits listed in Item 15(a)
(3) above. Exhibits which are incorporated herein by reference can be
inspected and copied at the public reference rooms maintained by the SEC in
Washington, D.C., New York, New York, and Chicago, Illinois. Please call the SEC
at 1-800-SEC-0330 for further information on the public reference rooms. SEC
filings are also available to the public from commercial document retrieval
services and at the Website maintained by the SEC at http://www.sec.gov.
Pursuant
to the requirements of Section 13 or 15(d) of the Securities Exchange Act
of 1934, as amended, the Registrant has duly caused this report to be signed on
its behalf by the undersigned thereunto duly authorized.
Date: February 24,
2010
|
DealerTrack
Holdings, Inc.
(Registrant)
|
|||
|
By:
|
/s/
Eric D. Jacobs
|
||
|
Eric
D. Jacobs
|
|||
|
Senior
Vice President, Chief Financial and Administrative Officer (Duly
Authorized Officer and Principal Financial Officer)
|
|||
SIGNATURES
Pursuant to the requirements of
the Securities Exchange Act of 1934, as amended, this report has been signed
below by the following persons on behalf of the registrant and in the capacities
and on the dates indicated.
|
Signature
|
Title
|
Date
|
||
|
/s/
Mark F. O’Neil
|
Chairman
of the Board, President and Chief Executive
|
February 24,
2010
|
||
|
Mark
F. O’Neil
|
Officer (principal executive officer) | |||
|
/s/
Eric D. Jacobs
|
Senior
Vice President, Chief Financial and
|
February 24,
2010
|
||
|
Eric
D. Jacobs
|
Administrative
Officer (principal financial and
accounting
officer)
|
|||
|
/s/
Mary Cirillo-Goldberg
|
Director
|
February 24,
2010
|
||
|
Mary
Cirillo-Goldberg
|
||||
|
/s/ Ann B.
Lane
|
Director
|
February 24,
2010
|
||
|
Ann
B. Lane
|
||||
|
/s/
John J. McDonnell, Jr.
|
Director
|
February 24,
2010
|
||
|
John
J. McDonnell, Jr.
|
||||
|
/s/
James David Power III
|
Director
|
February 24,
2010
|
||
|
James
David Power III
|
||||
|
/s/
Howard L. Tischler
|
Director
|
February 24,
2010
|
||
|
Howard
L. Tischler
|
||||
|
/s/
Barry Zwarenstein
|
Director
|
February 24,
2010
|
||
|
Barry
Zwarenstein
|
||||
|
/s/
James Foy
|
Director
|
February 24,
2010
|
||
|
James
Foy
|
83
EXHIBIT
INDEX TO ANNUAL REPORT ON FORM 10-K
|
Number
|
Description
|
|
|
3.1
(4)
|
Form
of Fifth Amended and Restated Certificate of Incorporation of DealerTrack
Holdings, Inc.
|
|
|
3.2 (4)
|
Form
of Amended and Restated By-laws of DealerTrack Holdings,
Inc.
|
|
|
4.1
(1)
|
Fourth
Amended and Restated Registration Rights Agreement, dated as of
March 19, 2003, among DealerTrack Holdings, Inc. and the stockholders
of DealerTrack Holdings, Inc. party thereto.
|
|
|
4.2
(3)
|
Form
of Certificate of Common Stock.
|
|
|
10.1
(3)
|
License
Agreement, made and entered into as of February 1, 2001, by and
between The Chase Manhattan Bank and J.P. Morgan Partners (23A SBIC
Manager), Inc.
|
|
|
10.2
(3)
|
Asset
Purchase Agreement, dated as of May 25, 2005, by and among Santa
Acquisition Corporation, Automotive Lease Guide (alg), LLC, Automotive
Lease Guide (alg) Canada, Inc., Douglas W. Aiken, John A. Blair and
Raj Sundaram.
|
|
|
10.3
(9)
|
Amended
and Restated Senior Executive Employment Agreement, dated as of
August 8, 2007, by and between Mark F. O’Neil and DealerTrack
Holdings, Inc.
|
|
|
10.4
(10)
|
Amendment
No. 1 To Amended and Restated Senior Executive Employment Agreement,
dated December 31, 2008, by and between Mark F. O’Neil and
DealerTrack Holdings, Inc.
|
|
|
10.5
(11)
|
Amendment
No. 2 to Amended and Restated Executive Employment Agreement dated
November 3, 2009 between DealerTrack Holdings, Inc. and Mark F.
O’Neil
|
|
|
10.6
*
|
Amended
and Restated Senior Executive Employment Agreement, dated as of
August 8, 2007, by and between Richard McLeer and DealerTrack
Holdings, Inc.
|
|
|
10.7
*
|
Amendment
No. 1 To Amended and Restated Senior Executive Employment Agreement,
dated December 31, 2008, by and between Richard McLeer and
DealerTrack Holdings, Inc.
|
|
|
10.8
*
|
Amendment
No. 2 to Amended and Restated Executive Employment Agreement dated
November 3, 2009 between DealerTrack Holdings, Inc. and Richard
McLeer
|
|
|
10.9
*
|
Amended
and Restated Senior Executive Employment Agreement, dated as of
August 8, 2007, by and between Rick G. Von Pusch and DealerTrack
Holdings, Inc.
|
|
|
10.10*
|
Amendment
No. 1 To Amended and Restated Senior Executive Employment Agreement,
dated December 31, 2008, by and between Rick G. Von Pusch and
DealerTrack Holdings, Inc.
|
|
|
10.11
*
|
Amendment
No. 2 to Amended and Restated Executive Employment Agreement dated
November 3, 2009 between DealerTrack Holdings, Inc. and Rick G. Von
Pusch
|
|
|
10.12
(9)
|
Amended
and Restated Senior Executive Employment Agreement, dated as of
August 8, 2007, by and between Eric D. Jacobs and DealerTrack
Holdings, Inc.
|
|
|
10.13
(10)
|
Amendment
No. 1 To Amended and Restated Senior Executive Employment Agreement,
dated December 31, 2008, by and between Eric D. Jacobs and
DealerTrack Holdings, Inc.
|
|
|
10.14
(11)
|
Amendment
No. 2 to Amended and Restated Executive Employment Agreement dated
November 3, 2009 between DealerTrack Holdings, Inc. and Eric D.
Jacobs.
|
84
|
Number
|
Description
|
|
|
10.15
(9)
|
Amended
and Restated Senior Executive Employment Agreement, dated as of
August 8, 2007, by and between Raj Sundaram and DealerTrack Holdings,
Inc.
|
|
|
10.16
(10)
|
Amendment
No. 1 To Amended and Restated Senior Executive Employment Agreement,
dated December 31, 2008, by and between Raj Sundaram and DealerTrack
Holdings, Inc.
|
|
|
10.17
(11)
|
Amendment
No. 2 to Amended and Restated Executive Employment Agreement dated
November 4, 2009 between DealerTrack Holdings, Inc. and Rajesh
Sundaram
|
|
|
10.18
(8)
|
Unfair
Competition and Nonsolicitation Agreement, dated as of May 25, 2005,
by and between Raj Sundaram and Automotive Lease Guide (alg),
Inc.
|
|
|
10.19
(8)
|
Amendment
No. 1 to Unfair Competition and Nonsoliciation Agreement, made as of
August 21, 2006, by and between Automotive Lease Guide (alg), Inc.
and Raj Sundaram.
|
|
|
10.20
(9)
|
Amended
and Restated Senior Executive Employment Agreement, dated as of
August 8, 2007, by and between Robert Cox and DealerTrack Holdings,
Inc.
|
|
|
10.21
(10)
|
Amendment
No. 1 To Amended and Restated Senior Executive Employment Agreement,
dated December 31, 2008, by and between Robert Cox and DealerTrack
Holdings, Inc.
|
|
|
10.22
(11)
|
Severance
Agreement and General Release between DealerTrack Holdings, Inc. and
Robert Cox dated March 2, 2009.
|
|
|
10.23
(1)
|
2001
Stock Option Plan of DealerTrack Holdings, Inc., effective as of
August 10, 2001.
|
|
|
10.24
(1)
|
First
Amendment to 2001 Stock Option Plan of DealerTrack Holdings, Inc.,
effective as of December 28, 2001.
|
|
|
10.25
(1)
|
Second
Amendment to 2001 Stock Option Plan of DealerTrack Holdings, Inc.,
effective as of March 19, 2003.
|
|
|
10.26
(1)
|
Third
Amendment to 2001 Stock Option Plan of DealerTrack Holdings, Inc.,
effective as of January 30, 2004.
|
|
|
10.27
(6)
|
Fourth
Amendment to 2001 Stock Option Plan of DealerTrack Holdings, Inc.
effective as of February 10, 2006.
|
|
|
10.28
*
|
Third
Amended and Restated 2005 Incentive Award Plan, effective as of
June 17, 2009.
|
|
|
10.29
(7)
|
Amendment
to Asset Purchase Agreement, dated October 18, 2006, by and among
Santa Acquisition Corporation, Automotive Lease Guide (alg), LLC,
Automotive Lease Guide (alg) Canada, Inc., Douglas W. Aiken, John A. Blair
and Raj Sundaram.
|
|
|
10.30
(5)
|
Form
of Stock Option Agreement.
|
|
|
10.31
(5)
|
Form
of Restricted Stock Agreement.
|
|
|
10.32
(10)
|
Form
of Restricted Stock Unit Agreement.
|
|
|
10.33
(1)
|
Senior
Executive Incentive Bonus Plan, effective as of May 26,
2005.
|
|
|
10.34
(8)
|
Stock
Ownership and Retention Program, adopted May 26,
2005.
|
|
|
10.35
(1)
|
Employee
Stock Purchase Plan, adopted May 26, 2005.
|
|
|
10.36
(1)
|
Directors’
Deferred Compensation Plan, effective as of June 30,
2005.
|
|
|
10.37
(9)
|
First
Amendment to DealerTrack Holdings, Inc. Directors’ Deferred Compensation
Plan effective as of January 1, 2007.
|
|
|
10.38
(1)
|
Employees’
Deferred Compensation Plan, effective as of June 30,
2005.
|
85
|
Number
|
Description
|
|
|
10.39
(9)
|
First
Amendment to DealerTrack Holdings, Inc. Employees’ Deferred Compensation
Plan effective as of January 1, 2007.
|
|
|
10.40
(1)
|
401(k)
Plan, effective as of January 1, 2001, as amended.
|
|
|
10.41
(2)
|
Lease
Agreement, dated as of August 5, 2004, between iPark Lake Success,
LLC and DealerTrack, Inc.
|
|
|
14.1
(6)
|
Code
of Business Conduct and Ethics.
|
|
|
21.1
*
|
List
of Subsidiaries.
|
|
|
23.1
*
|
Consent
of PricewaterhouseCoopers LLP.
|
|
|
31.1
*
|
Certification
of Mark F. O’Neil pursuant to Rule 13a-14(a) and 15d-14(a), as
adopted pursuant to Section 302 of the Sarbanes-Oxley Act of
2002.
|
|
|
31.2
*
|
Certification
of Eric D. Jacobs pursuant to Rule 13a-14(a) and 15d-14(a), as
adopted pursuant to Section 302 of the Sarbanes-Oxley Act of
2002.
|
|
|
32.1
*
|
Certification
of Mark F. O’Neil and Eric D. Jacobs pursuant to 18 U.S.C.
Section 1350, as adopted pursuant to Section 906 of the
Sarbanes-Oxley Act of 2002.
|
|
*
|
Filed
herewith.
|
|
(1)
|
Incorporated
by reference to our Registration Statement on Form S-1 (File
No. 333-126944) filed July 28, 2005.
|
|
(2)
|
Incorporated
by reference to Amendment No. 1 to our Registration Statement on Form
S-1 (File No. 333-126944) filed September 22,
2005.
|
|
(3)
|
Incorporated
by reference to Amendment No. 2 to our Registration Statement on Form
S-1 (File No. 333-126944) filed October 12, 2005.
|
|
(4)
|
Incorporated
by reference to Amendment No. 3 to our Registration Statement on Form
S-1 (File No. 333-126944) filed October 24, 2005.
|
|
(5)
|
Incorporated
by reference to our Quarterly Report on Form 10-Q filed May 12,
2006.
|
|
(6)
|
Incorporated
by reference to our Annual Report on Form 10-K filed March 30,
2006.
|
|
(7)
|
Incorporated
by reference to our Quarterly Report on Form 10-Q filed November 14,
2006.
|
|
(8)
|
Incorporated
by reference to our Annual Report on Form 10-K filed March 16,
2007.
|
|
(9)
|
Incorporated
by reference to our Quarterly Report on Form 10-Q filed August 9,
2007.
|
|
(10)
|
Incorporated
by reference to our Annual Report on Form 10-K filed on February 24,
2009.
|
|
(11)
|
Incorporated
by reference to our Quarterly Report on Form 10-Q filed November 5,
2009.
|
86