Attached files
Table of Contents
UNITED STATES
SECURITIES AND EXCHANGE COMMISSION
Washington, D.C. 20549
FORM 10-K
ANNUAL REPORT PURSUANT TO SECTION 13 OR 15(d) OF
THE SECURITIES EXCHANGE ACT OF 1934
| For the fiscal year ended December 31, 2009 | Commission file number 1-10585 |
CHURCH & DWIGHT CO., INC.
(Exact name of registrant as specified in its charter)
| Delaware | 13-4996950 | |
| (State or other jurisdiction of incorporation or organization) |
(I.R.S. Employer Identification No.) |
469 North Harrison Street, Princeton, N.J. 08543
(Address of principal executive offices)
Registrant’s telephone number, including area code: (609) 683-5900
Securities registered pursuant to Section 12(b) of the Act:
| Title of each class |
Name of each exchange on which registered | |
| Common Stock, $1 par value | New York Stock Exchange |
Securities registered pursuant to Section 12(g) of the Act: None
Indicate by check mark if the registrant is a well-known seasoned issuer, as defined in Rule 405 of the Securities Act. Yes x No ¨
Indicate by check mark if the registrant is not required to file reports pursuant to Section 13 or 15(d) of the Act. Yes ¨ No x
Indicate by check mark whether the registrant (1) has filed all reports required to be filed by Section 13 or 15(d) of the Securities Exchange Act of 1934 during the preceding twelve months (or for such shorter period that the registrant was required to file such reports), and (2) has been subject to such filing requirements for the past 90 days. Yes x No ¨
Indicate by check mark whether the registrant has submitted electronically and posted on its corporate Web site, if any, every Interactive Data File required to be submitted and posted pursuant to Rule 405 of Regulation S-T during the preceding 12 months (or for such shorter period that the registrant was required to submit and post such files). Yes ¨ No ¨
Indicate by check mark if disclosure of delinquent filers pursuant to Item 405 of Regulation S-K is not contained herein, and will not be contained, to the best of registrant’s knowledge, in definitive proxy or information statements incorporated by reference in Part III of this Form 10-K or any amendment to this Form 10-K Yes ¨ No x
Indicate by check mark whether the registrant is a large accelerated filer, an accelerated filer, a non-accelerated filer, or a smaller reporting company. See the definitions of “large accelerated filer,” “accelerated filer” and “smaller reporting company” in Rule 12b-2 of the Exchange Act.
Large accelerated filer x Accelerated filer ¨ Non-accelerated filer ¨ Smaller reporting company ¨
Indicate by check mark whether the registrant is a shell company (as defined in Rule 12b-2 of the Exchange Act). Yes ¨ No x
The aggregate market value of the voting and non-voting common equity held by non-affiliates as of June 26, 2009 (the last business day of the registrant’s most recently completed second fiscal quarter) was approximately $3.9 billion. For purposes of making this calculation only, the registrant included all directors, executive officers and beneficial owners of more than ten percent of the Common Stock of the Company as affiliates. The aggregate market value is based on the closing price of such stock on the New York Stock Exchange on June 26, 2009.
As of February 19, 2010, there were 70,643,720 shares of Common Stock outstanding.
Documents Incorporated by Reference
Certain provisions of the registrant’s definitive proxy statement to be filed not later than April 30, 2010 are incorporated by reference in Items 10 through 14 of Item III of this Annual Report on Form 10-K.
Table of Contents
CAUTIONARY NOTE ON FORWARD-LOOKING INFORMATION
This Annual Report contains forward-looking statements, including, among others, statements relating to short- and long-term financial objectives, sales and earnings growth, earnings per share, margin improvement, price increases, marketing spending, the Orajel Acquisition, assets held for sale, the Company’s hedge programs, increases in research and development and product development spending, interest rate collars and swap agreements, the impact of currency fluctuations, the effective tax rate, unrecognized tax benefits, pension plan contributions, the completion of the York, Pennsylvania laundry detergent and warehouse facility, capital expenditures relating to the new facility, facility restructuring charges, the closing of the Company’s facilities in North Brunswick, New Jersey, the sufficiency of cash flow to meet capital expenditure needs, the ability of the Company to comply with financial covenants, the effect of the credit environment on liquidity and the Company’s ability to renew the accounts receivable facility. These statements represent the intentions, plans, expectations and beliefs of the Company, and are subject to risks, uncertainties and other factors, many of which are outside the Company’s control and could cause actual results to differ materially from such forward-looking statements. Important factors that could cause actual results to differ materially from those in the forward-looking statements include a decline in market growth and consumer demand (including the effect of political, economic and marketplace conditions and events on consumer demand); unanticipated increases in raw material and energy prices; adverse developments affecting the financial condition of major customers; competition; the impact of retailer actions in response to changes in consumer demand and the economy, including increasing shelf space of private label products; consumer reaction to new product introductions and features; disruptions in the banking system and financial markets and the outcome of contingencies, including litigation, pending regulatory proceedings and environmental remediation.
The Company undertakes no obligation to publicly update any forward-looking statements, whether as a result of new information, future events or otherwise. You are advised, however, to consult any further disclosures we make on related subjects in our filings with the U.S. Securities and Exchange Commission.
Table of Contents
PART I
| Item |
Page | |||
| 1. |
Business | 1 | ||
| 1A. |
Risk Factors | 10 | ||
| 1B. |
Unresolved Staff Comments | 17 | ||
| 2. |
Properties | 18 | ||
| 3. |
Legal Proceedings | 19 | ||
| 4. |
Submission of Matters to a Vote of Security Holders | 19 | ||
| PART II | ||||
| 5. |
20 | |||
| 6. |
21 | |||
| 7. |
Management’s Discussion and Analysis of Financial Condition and Results of Operations |
22 | ||
| 7A. |
39 | |||
| 8. |
40 | |||
| 9. |
Changes in and Disagreements With Accountants on Accounting and Financial Disclosure |
85 | ||
| 9A. |
85 | |||
| 9B. |
85 | |||
| PART III | ||||
| 10. |
Directors, Executive Officers and Corporate Governance | 86 | ||
| 11. |
Executive Compensation | 86 | ||
| 12. |
Security Ownership of Certain Beneficial Owners and Management and Related Stockholder Matters |
86 | ||
| 13. |
Certain Relationships and Related Transactions, and Director Independence | 86 | ||
| 14. |
Principal Accounting Fees and Services | 86 | ||
| PART IV | ||||
| 15. |
Exhibits, Financial Statement Schedules | 87 | ||
Table of Contents
PART I
| ITEM 1. | BUSINESS |
GENERAL
The Company, founded in 1846, develops, manufactures and markets a broad range of household, personal care and specialty products. The Company focuses its marketing efforts principally on its eight “power brands.” These well-recognized brand names include ARM & HAMMER, (used in multiple product categories such as baking soda, carpet deodorization and laundry detergent), TROJAN Condoms, XTRA laundry detergent, OXICLEAN pre-wash laundry additive, NAIR depilatories, FIRST RESPONSE home pregnancy and ovulation test kits, ORAJEL oral analgesics and SPINBRUSH battery-operated toothbrushes. The Company’s business is divided into three primary segments, Consumer Domestic, Consumer International and Specialty Products. The Consumer Domestic segment includes the eight power brands and other household and personal care products such as SCRUB FREE, KABOOM, ORANGE GLO and BRILLO cleaning products, ANSWER home pregnancy and ovulation test kits, ARRID antiperspirant, CLOSE-UP and AIM toothpastes. The Consumer International segment primarily sells a variety of personal care products, some of which use the same brands as our domestic product lines, in international markets, including France, the United Kingdom, Canada, Mexico, Australia, Brazil and China. The Specialty Products segment is the largest U.S. producer of sodium bicarbonate, which it sells together with other specialty inorganic chemicals for a variety of industrial, institutional, medical and food applications. This segment also sells a range of animal nutrition and specialty cleaning products. In 2009, the Consumer Domestic, Consumer International and Specialty Products segments represented approximately 74%, 16% and 10%, respectively, of the Company’s net sales.
All domestic brand “rankings” contained in this report are based on dollar share rankings from AC Nielsen FDM excluding Wal-Mart for the 52 weeks ending December 26, 2009. Foreign brand “rankings” are derived from several sources.
2009 DEVELOPMENTS
In the fourth quarter of 2009, the Company completed construction and started manufacturing at its integrated laundry detergent manufacturing plant and distribution center in York, Pennsylvania. In conjunction with the opening of the new facility, the Company closed its existing laundry detergent manufacturing plant and distribution facility in North Brunswick, New Jersey. The North Brunswick facility was comprised of five separate buildings, which had resulted in inefficiencies and could not accommodate expansion to address expected future growth.
In September 2009, the Company and Abbott Laboratories, Inc. (“Abbott”) agreed to settle patent infringement litigation. As part of the settlement, Abbott paid $27 million to the Company. The Company recognized a pre-tax gain, net of legal expenses, of $20.0 million as of September 2009, which is reflected in the results of the Consumer Domestic segment.
In June 2009, the Company sold certain non-core personal care product lines that it initially acquired from Del Laboratories, Inc., a subsidiary of Coty, Inc., in July 2008. (This acquisition, through which the Company also acquired the Orajel brand of analgesics, is referred to in this report as the “Orajel Acquisition”.) The non-core product lines were sold for approximately $30 million, net of fees, which approximated book value. The results of these product lines were included in both the Consumer Domestic and Consumer International Segments during the period from July 2008 until the completion of the sale in June 2009.
1
Table of Contents
FINANCIAL INFORMATION ABOUT SEGMENTS
As noted above, the Company’s business is organized into three reportable segments, Consumer Domestic, Consumer International and Specialty Products (“SPD”). These segments are based on differences in the nature of products and organizational and ownership structures. The businesses of these segments generally are not seasonal, although the Consumer Domestic and Consumer International segments are affected by sales of SPINBRUSH battery-operated toothbrushes, which typically are higher during the fall, in advance of the holiday season, and sales of the depilatories and waxes product group, which typically are higher in the spring and summer months. Information concerning the net sales, operating income and identifiable assets of each of the segments is set forth in Note 20 to the consolidated financial statements included in this report and in “Management’s Discussion and Analysis of Financial Condition and Results of Operations,” which is Item 7 of this report.
CONSUMER PRODUCTS
Consumer Domestic
Principal Products
The Company’s founders first marketed baking soda in 1846 for use in home baking. Today, this product has a wide variety of uses in the home, including as a refrigerator and freezer deodorizer, scratch-free cleaner and deodorizer for kitchen surfaces and cooking appliances, bath additive, dentifrice, cat litter deodorizer and swimming pool pH stabilizer. The Company specializes in baking soda-based products, as well as other products which use the same raw materials or technology or are sold in the same markets. In addition, this segment includes other deodorizing and household cleaning products, as well as laundry and personal care products. The following table sets forth the principal products of the Company’s Consumer Domestic segment.
| Type of Product |
Key Brand Names | |
| Household |
ARM & HAMMER Pure Baking Soda | |
| ARM & HAMMER Carpet & Room Deodorizers | ||
| ARM & HAMMER Cat Litter Deodorizer | ||
| ARM & HAMMER Clumping Cat Litters | ||
| BRILLO Soap Pads | ||
| SCRUB FREE Bathroom Cleaners | ||
| CLEAN SHOWER Daily Shower Cleaner | ||
| CAMEO Aluminum & Stainless Steel Cleaner | ||
| SNO BOL Toilet Bowl Cleaner | ||
| ARM & HAMMER and XTRA Powder and Liquid Laundry Detergents | ||
| XTRA and NICE’N FLUFFY Fabric Softeners | ||
| ARM & HAMMER FRESH’N SOFT Fabric Softeners | ||
| DELICARE Fine Fabric Wash | ||
| ARM & HAMMER Super Washing Soda | ||
| OXICLEAN Detergent and Cleaning Solution | ||
| KABOOM Cleaning Products | ||
| ORANGE GLO Cleaning Products | ||
| Personal Care |
ARM & HAMMER Toothpastes | |
| SPINBRUSH Battery-operated Toothbrushes | ||
| MENTADENT Toothpaste, Toothbrushes | ||
| AIM Toothpaste | ||
| PEPSODENT Toothpaste | ||
| CLOSE-UP Toothpaste | ||
| PEARL DROPS Toothpolish and Toothpaste | ||
| RIGIDENT Denture Adhesive | ||
| ARM & HAMMER Deodorants & Antiperspirants | ||
2
Table of Contents
| Type of Product |
Key Brand Names | |
| ARRID Antiperspirants | ||
| LADY’S CHOICE Antiperspirants | ||
| TROJAN Condoms | ||
| NATURALAMB Condoms | ||
| CLASS ACT Condoms | ||
| FIRST RESPONSE Home Pregnancy and Ovulation Test Kits | ||
| ANSWER Home Pregnancy and Ovulation Test Kits | ||
| NAIR Depilatories, Lotions, Creams and Waxes | ||
| CARTERS LITTLE PILLS Laxative | ||
| ORAJEL Oral Analgesics |
Household Products
In 2009, household products constituted approximately 64% of the Company’s Domestic Consumer sales and approximately 47% of the Company’s total sales.
The ARM & HAMMER trademark was adopted in 1867. ARM & HAMMER Baking Soda remains the leading brand of baking soda in terms of consumer recognition of the brand name and reputation for quality and value. The deodorizing properties of baking soda have led to the development of several household products. For example, the Company markets ARM & HAMMER FRIDGE FRESH, a refrigerator deodorizer equipped with both a baking soda filter to keep food tasting fresher and an indicator to tell the consumer when the product needs to be replaced. In addition, ARM & HAMMER Carpet and Room Deodorizer is the number two brand in the domestic carpet and room deodorizer market.
The Company’s laundry detergents constitute its largest consumer business, measured by net sales. The Company markets its ARM & HAMMER brand laundry detergents, in both powder and liquid forms, as value products, priced at a discount from products identified by the Company as market leaders. The Company markets its XTRA laundry detergent in both powder and liquid at a slightly lower price than ARM & HAMMER brand laundry detergents. Although the powder laundry detergent segment continued its long-term steady decline throughout 2009, ARM & HAMMER powder maintained its position as the leading powder detergent value brand by dollar share. The Company also markets XTRA SCENTSATIONS, a highly fragranced and concentrated liquid laundry detergent. The Company also markets OXICLEAN pre-wash laundry additive. OXICLEAN is the number one brand in the laundry pre-wash additives market in the U.S. The Company markets ARM & HAMMER plus OXICLEAN liquid and powder laundry detergents, combining the benefits of these two powerful laundry detergent products.
The Company’s laundry products also include fabric softener sheets that prevent static cling and soften and freshen clothes. The Company markets ARM & HAMMER FRESH ‘N SOFT liquid fabric softener and offers another liquid fabric softener, NICE’N FLUFFY, at a slightly lower price enabling the Company to compete at several price points. In 2009, the Company launched ARM & HAMMER Total 2-in-1 Dryer Cloths, a fabric softener sheet used in the clothes dryer that delivers liquid-like softening, freshening and static control.
The Company markets a line of cat litter products, including ARM & HAMMER SUPER SCOOP clumping cat litter. Line extensions of SUPER SCOOP include ARM & HAMMER Multi-Cat cat litter, designed for households with more than one cat, ARM & HAMMER ODOR ALERT cat litter, with crystals that change color when activated, and ARM & HAMMER ESSENTIALS clumping cat litter, a corn-based scoopable litter made for consumers who prefer to use products made from natural ingredients. The Company intends to continue to innovate and offer new products under the ARM & HAMMER brand in the household and pet care categories.
The Company markets a line of household cleaning products including CLEAN SHOWER daily shower cleaner, SCRUB FREE bathroom cleaners and SNO BOL toilet bowl cleaner. The Company also markets KABOOM bathroom cleaner and ORANGE GLO household cleaning products.
3
Table of Contents
Personal Care Products
The Company entered the personal care business using the unique strengths of its ARM & HAMMER trademark and baking soda technology, and has expanded its presence through its acquisition of antiperspirants, oral care products, depilatories, reproductive health products and oral analgesics. The personal care market is highly innovative and is characterized by a continuous flow of new products and line extensions and intense competition, requiring heavy advertising and promotion. In 2009, Personal Care Products constituted approximately 36% of the Company’s Consumer Domestic sales and approximately 27% of the Company’s total sales.
ARM & HAMMER Baking Soda, when used as a dentifrice, whitens and polishes teeth, removes plaque and leaves the mouth feeling fresh and clean. These properties led to the development of a complete line of sodium bicarbonate-based dentifrice products which are marketed and sold nationally primarily under the ARM & HAMMER DENTAL CARE brand name.
The Company also manufactures in the United States and markets in the United States (including Puerto Rico) and Canada, CLOSE-UP, PEPSODENT and AIM toothpaste, which are priced at a discount from the market leaders, and the MENTADENT brand of toothpaste and toothbrushes.
In 2008, the Company purchased and began marketing ORAJEL oral analgesics. In 2009, the Company added two new ORAJEL products to its portfolio, BABY ORAJEL Cooling Cucumber Teething Gel and BABY ORAJEL Tooth and Gum Cleanser.
The Company markets SPINBRUSH battery-operated toothbrushes in the United States (including Puerto Rico), the United Kingdom, Canada, China and Australia. In 2009, the SPINBRUSH battery-operated toothbrush was the number one brand of battery-operated toothbrushes in the United States. The Company also markets SPINBRUSH Pro-Select toothbrushes, a two speed version of SPINBRUSH, and SPINBRUSH Pro-Recharge, a rechargeable toothbrush offering up to one week of power brushes between charges. In 2009, the company introduced SPINBRUSH Sonic, a reasonably priced high speed battery-operated toothbrush which competes with much more expensive “sonic” toothbrushes.
The Company’s deodorant and antiperspirant products are marketed under the ARM & HAMMER, ARRID and LADY’S CHOICE brand names.
Condoms are recognized as highly reliable contraceptives as well as an effective means of reducing the risk of sexually transmitted diseases (“STDs”). The TROJAN condom brand has been in use for more than 80 years. In 2009, the brand continued its market share leadership in the United States with the launch of the new Ecstasy product line and continued success of such products as EXTENDED PLEASURE, HER PLEASURE, TWISTED PLEASURE, SHARED PLEASURE, MAGNUM WITH WARM SENSATIONS, a unique lubricant system which warms the skin on contact for enhanced pleasure, TROJAN Ultra Thin condoms and an expanded line of vibrating rings. The Company also launched a series of vibrating products under the TROJAN name.
In 2009, FIRST RESPONSE continues to be the number one brand in the home pregnancy and ovulation test kit business category. The Company also markets FIRST RESPONSE Rapid Result test kit, designed to tell a woman if she is pregnant within one minute after taking the test and ANSWER, which competes in the value segment of the home pregnancy and ovulation test kit market. In 2009, the Company launched an at-home female fertility test under the FIRST RESPONSE brand name.
The NAIR depilatory brand is the number one brand in the United States, with innovative products that address consumer needs for quick, complete and longer-lasting hair removal. The Company offers a full array of depilatory products ranging for women, men and teens under the NAIR brand name.
4
Table of Contents
Consumer International
The Consumer International segment markets and sells a variety of personal care products, over-the-counter and household products in international markets, including France, the United Kingdom, Canada, Mexico, Australia, Brazil and China.
Total Consumer International sales represented approximately 16% of the Company’s consolidated net sales in 2009. Canada, France and the United Kingdom accounted for 36%, 20% and 16%, respectively, of the Company’s international net sales in this segment in 2009. No other country in which the Company operates accounts for more than 10% of its total international net sales in this segment, and no brand accounts for more than approximately 10% of total international net sales.
Certain of the Company’s international product lines are similar to its domestic product lines. The Company markets depilatories and waxes, home pregnancy and ovulation test kits and oral care products in most of its international markets. For example, the Company markets waxes and depilatory products in France, the United Kingdom, Canada, Mexico, Brazil and Australia, and TROJAN condoms in Canada, Mexico and China.
The Company has expanded distribution of ARM & HAMMER products internationally by selling ARM & HAMMER laundry and pet care products in Canada and ARM & HAMMER laundry care products in Mexico. The Company also markets SPINBRUSH battery-operated toothbrushes, primarily in the United Kingdom, Canada, China, Australia and Japan, and OXICLEAN, KABOOM and ORANGE GLO products primarily in Mexico and Canada.
The Company sells PEARL DROPS products in Europe, Canada and Australia and STERIMAR nasal hygiene products in a number of markets in Europe, Latin America, Canada and Australia.
COMPETITION FOR CONSUMER DOMESTIC AND CONSUMER INTERNATIONAL
The Company competes in the oral care, personal care and deodorizing markets using the strengths of its trademarks and technologies. These are highly innovative markets, characterized by a continuous flow of new products and line extensions, and requiring heavy advertising and promotion.
The domestic condom market is highly concentrated in product offerings with a limited number of competitors. The market is divided between premium brands and price brands, with companies competing on the basis of quality, innovation and price.
The domestic depilatories and waxes market is highly concentrated with a limited number of competitors. Products compete based on their functionality, innovation and price.
Internationally, the Company’s products compete in similar competitive categories.
Many of the Company’s competitors are large companies, including The Procter & Gamble Company, Sun Products Corporation, The Clorox Company, Colgate-Palmolive Company, S.C. Johnson & Son, Inc., Henkel AG & Co. KGaA, Reckitt Benckiser Group plc, Johnson & Johnson, Inverness Medical Innovations, Inc. and SSL International plc. Many of these companies have greater financial resources than the Company and have the capacity to outspend the Company if they attempt to gain market share.
Consumer products, particularly those that are value-priced, such as laundry and household cleaning products, are subject to significant price competition. From time to time, the Company may need to reduce the prices for some of its products to respond to competitive and customer pressures and to maintain market share.
Product introductions typically involve heavy marketing costs in the year of launch, and the Company usually is not able to determine whether the new products and line extensions will be successful until a period of time has elapsed following the introduction of the new products or the extension of the product line.
5
Table of Contents
Because of the competitive environment facing retailers, the Company faces pricing pressure from customers, particularly the high-volume retail store customers, who have increasingly sought to obtain pricing concessions or better trade terms. These concessions or terms could reduce the Company’s margins. Furthermore, if the Company is unable to maintain price or trade terms acceptable to its trade customers, the customers could increase product purchases from competitors and reduce purchases from the Company, which would harm the Company’s sales and profitability.
DISTRIBUTION FOR CONSUMER DOMESTIC
Products in the Consumer Domestic segment are primarily marketed throughout the United States through a broad distribution platform that includes supermarkets, mass merchandisers, wholesale clubs, drugstores, convenience stores, pet specialty stores and dollar stores. The Company employs a sales force based regionally throughout the United States. In each market, the sales force utilizes the services of independent food brokers, who represent our products in the Food, Pet, Dollar and Club classes of trade. The Company’s products are stored in Company plants and public warehouses and are either delivered by independent trucking companies or picked up by customers.
DISTRIBUTION FOR CONSUMER INTERNATIONAL
The Company’s Consumer International distribution network reflects capacity and cost considerations in the markets served. In Canada, Mexico and Australia, finished goods are warehoused internally and shipped directly to customers through independent freight carriers. In the United Kingdom, Brazil and China, all product distribution is subcontracted to professional distribution companies. In France, distribution of consumer products to mass markets is handled internally while distribution of OTC products to pharmacies and professional diagnostics to laboratories is handled by outside agencies.
Specialty Products (SPD)
Principal Products
The Company’s SPD segment focuses on sales to businesses and participates in three product areas: Specialty Chemicals, Animal Nutrition and Specialty Cleaners. The following table sets forth the principal products of the Company’s SPD segment.
| Type of Product |
Key Brand Names | |
| Specialty Chemicals |
ARM & HAMMER Performance Grade Sodium Bicarbonate | |
| ARMAND PRODUCTS Potassium Carbonate and Potassium Bicarbonate(1) | ||
| Animal Nutrition |
ARM & HAMMER Feed Grade Sodium Bicarbonate | |
| MEGALAC Rumen Bypass Fat | ||
| SQ-810 Natural Sodium Sesquicarbonate | ||
| BIO-CHLOR and FERMENTEN Rumen Fermentation Enhancers | ||
| DCAD Plus Feed Grade Potassium Carbonate(2) | ||
| MEGALAC R, Omega 3 & Omega 6 Essential Fatty Acids MEGAMINE-L, Rumen Bypass Lysine | ||
| Specialty Cleaners |
Commercial & Professional Cleaners and Deodorizers | |
| ARMAKLEEN Aqueous Cleaners(3) | ||
| ARMEX Blast Media(3) | ||
| (1) | Manufactured and marketed by Armand Products Company, an entity in which the Company holds a 50% joint venture interest. |
| (2) | Manufactured for the Company by Armand Products Company. |
| (3) | Distributed in North America by The ArmaKleen Company, an entity in which the Company holds a 50% joint venture interest. |
6
Table of Contents
Specialty Chemicals
The Company’s specialty chemicals business primarily encompasses the manufacture, marketing and sale of sodium bicarbonate in a range of grades and granulations for use in industrial markets. In industrial markets, sodium bicarbonate is used by other manufacturing companies as a leavening agent for commercial baked goods, as an antacid in pharmaceuticals, as a carbon dioxide release agent in fire extinguishers, as an alkaline agent in swimming pool chemicals, and as a buffer in kidney dialysis.
The Company’s 99.5% owned Brazilian subsidiary, Quimica Geral do Nordeste (“QGN”), is South America’s leading provider of sodium bicarbonate.
The Company and Occidental Petroleum Corporation are equal partners in a joint venture, Armand Products Company, which manufactures and markets potassium carbonate and potassium bicarbonate for sale in domestic and international markets. The potassium-based products are used in a wide variety of applications, including agricultural products, specialty glass and ceramics, and potassium silicates. Armand Products also manufactures for the Company a potassium carbonate-based animal feed additive for sale in the dairy industry.
Animal Nutrition Products
A special grade of sodium bicarbonate, as well as sodium sesquicarbonate, is sold to the animal feed market as a feed additive for use by dairymen as a buffer, or antacid, for dairy cattle. The Company also markets and sells DCAD Plus feed grade potassium carbonate, which is manufactured by the Armand Products Company as a feed additive into the animal feed market.
The Company manufactures, markets and sells MEGALAC rumen bypass fat, a nutritional supplement made from natural oils, which enables cows to maintain energy levels during the period of high milk production, resulting in improved milk yields and minimized weight loss. The product and the trademark MEGALAC are licensed under a long-term license agreement from a British company, Volac Ltd.
The Company also manufactures, markets and sells BIO-CHLOR and FERMENTEN, a range of specialty feed ingredients for dairy cows, which improve rumen feed efficiency and help increase milk production.
Specialty Cleaners
The Company also provides a line of cleaning and deodorizing products for use in commercial and industrial applications such as office buildings, hotels, restaurants and other facilities.
The Company and Safety-Kleen Corporation are equal partners in a joint venture, The ArmaKleen Company, which was formed to build a specialty cleaning products business based on the Company’s technology and Safety-Kleen’s sales and distribution organization. In North America, this joint venture distributes the Company’s proprietary product line of aqueous cleaners along with the Company’s ARMEX blast media line, which is designed for the removal of a wide variety of surface coatings. The Company continues to pursue opportunities to build this industrial cleaning business using the Company’s aqueous-based technology as well as the ARMEX blast media line of products.
COMPETITION FOR SPD
Competition within the specialty chemicals and animal nutrition product lines is intense. The specialty chemicals business operates in a competitive environment influenced by capacity utilization, buyers’ leverage and the impact of raw material and energy costs. Product introductions typically involve introductory costs in the year of launch, and the Company usually is not able to determine whether new products and line extensions will be successful until some time following the introduction of new products or the extension of the product lines.
7
Table of Contents
DISTRIBUTION FOR SPD
SPD markets sodium bicarbonate and other chemicals to industrial and agricultural customers primarily throughout the United States and Canada. Distribution is accomplished through a dedicated sales force supplemented by manufacturer’s representatives and the sales personnel of independent distributors throughout the country. The Company’s products in this segment are located in Company plants and public warehouses and are either delivered by independent trucking companies or picked up by customers at the Company’s facilities.
RAW MATERIALS AND SOURCES OF SUPPLY
The Company manufactures sodium bicarbonate for both its consumer and specialty products businesses at its plants located at Green River, Wyoming and Old Fort, Ohio. The primary source of soda ash, a basic raw material used by the Company in the production of sodium bicarbonate is the mineral trona, which is found in abundance in southwestern Wyoming near the Company’s Green River plant. The Company has adequate trona reserves under mineral leases to support the Company’s sodium bicarbonate requirements for the foreseeable future.
The Company is party to a partnership agreement with General Chemical Corporation, which mines and processes trona reserves in Wyoming. Through the partnership and related supply and services agreements, the Company fulfills a substantial amount of its soda ash requirements, enabling the Company to achieve some of the economies of an integrated business capable of producing sodium bicarbonate and related products from the basic raw material. The Company also has an agreement for the supply of soda ash from another company. The partnership agreement and other supply agreements between the Company and General Chemical are terminable upon two years notice by either company. The Company believes that alternative sources of supply are available.
The Company believes that ample sources of raw materials are available for all of its other major products. Detergent chemicals are used in a variety of the Company’s products and are available from a number of sources. Bottles, paper products and clay are available from multiple suppliers, although the Company chooses to source most of these materials from single sources under long-term supply agreements in order to gain favorable pricing. The Company also uses a palm oil fraction in its rumen bypass fats products. Alternative sources of supply are available in case of disruption or termination of the supply agreements.
Continuing a trend that began in 2005, the cost of raw materials in 2009 began at historical highs, although by the end of 2009 the cost of many of these raw materials retreated from these highs. As a result, the cost of surfactants, diesel fuel, corrugated paper and oil-based raw and packaging materials used in the household and specialty products businesses were all lower at the end of 2009 than the 2008 average. Moreover, the price of palm fatty acid distillate (PFAD), which generally fluctuates with the price of global vegetable oil, was on average at the same level as 2008 but had fallen by the end of 2009. The Company also benefitted in 2009 from savings realized in cost improvement programs. Despite a second half reduction in the cost of most commodities, some commodities continued to rise in price. Additional increases in the prices of certain raw materials could materially impact the Company’s costs and financial results if the Company is unable to pass such costs along in the form of price increases to its customers.
The Company utilizes the services of third party contract manufacturers for certain products, including SPINBRUSH battery-operated toothbrushes that are made by two contract manufacturers located in China since the brand was acquired in October 2005.
PATENTS AND TRADEMARKS
The Company’s trademarks (identified throughout this report in capitalized letters), including ARM & HAMMER, are registered with the United States Patent and Trademark Office and also with the trademark offices of many foreign countries. The ARM & HAMMER trademark has been used by the Company since 1867, and is a valuable asset and important to the successful operation of the Company’s business. The Company’s
8
Table of Contents
other valuable trademarks include TROJAN, NAIR, ORAJEL, FIRST RESPONSE, MENTADENT, CLOSE-UP, AIM, PEPSODENT, XTRA, BRILLO, ARRID, KABOOM, ORANGE GLO, SCRUB FREE, OXICLEAN, CLEAN SHOWER and SPINBRUSH. United States trademark registrations have a term of 10 years and are renewable every 10 years so long as the trademarks are used in the regular course of trade. The Company’s portfolio of trademarks represent substantial goodwill in the businesses using the trademarks.
United States patents are currently granted for a term of 20 years from the date the patent application is filed. Although the Company actively seeks and maintains a number of patents, no single patent is considered significant to the business as a whole.
In conjunction with the 2005 SPINBRUSH acquisition from Procter & Gamble, the Company received a royalty free license to use the Crest tradename until October 29, 2009 and Procter & Gamble agreed to refrain from using the Crest tradename on battery-operated toothbrushes for two years thereafter. The Company completed its transition plan to remove the Crest tradename from its SPINBRUSH products prior to termination of the license. The Company retained its position in 2009 as the number one brand in battery-operated toothbrushes but cannot predict the long-term effect that the loss of the tradename will have on SPINBRUSH sales and profitability.
CUSTOMERS AND ORDER BACKLOG
In each of the years ended December 31, 2009, 2008 and 2007, net sales to the Company’s largest customer, Wal-Mart Stores, Inc. and its affiliates were 22% of the Company’s total consolidated net sales. The time between receipt of orders and shipment is generally short, and as a result, backlog is not significant.
RESEARCH & DEVELOPMENT
The Company conducts research and development activities primarily at its Princeton and Cranbury facilities in New Jersey. The Company devotes significant resources and attention to product development, process technology and basic research to develop differentiated products with new and distinctive features and to provide increased convenience and value to its customers. To increase its innovative capabilities, the Company engages outside contractors for general research and development in activities beyond its core areas of expertise. The Company spent $55.1 million, $51.2 million and $49.8 million on research and development activities in 2009, 2008 and 2007, respectively.
GOVERNMENT REGULATION
Some of the Company’s products are subject to regulation under the Food, Drug and Cosmetic Act, which is administered by the Food and Drug Administration and the Insecticide, Fungicide and Rodenticide Act and the Toxic Substances Control Act, which are administered by the Environmental Protection Agency. The Company also is subject to regulation by the Federal Trade Commission in connection with the content of its labeling, advertising, promotion, trade practices and other matters. The Company’s relationship with certain union employees may be overseen by the National Labor Relations Board. The Company’s activities also are regulated by various agencies of the states, localities and foreign countries in which the Company sells its products.
ENVIRONMENTAL MATTERS
The Company’s operations are subject to federal, state and local regulations governing air emissions, wastewater discharges, and solid and hazardous waste management activities. The Company endeavors to take actions necessary to comply with such regulations. These steps include periodic environmental audits of each Company facility. The audits, conducted by independent engineering firms with expertise in environmental compliance, include site visits at each location, as well as a review of documentary information, to determine compliance with such federal, state and local regulations. The Company believes that its compliance with existing environmental regulations will not have a material adverse effect on the Company’s earnings or competitive position. No material capital expenditures relating to environmental control or remediation are presently anticipated.
9
Table of Contents
GEOGRAPHIC AREAS
Approximately 81%, 78% and 78% of the Company’s net sales in 2009, 2008 and 2007, respectively, were to customers in the United States. Approximately 95%, 94% and 92% of the Company’s long-lived assets were located in the United States at December 31, 2009, 2008 and 2007, respectively. Other than the United States, no one country accounts for more than 6% of consolidated net sales and 3% of total assets.
EMPLOYEES
At December 31, 2009, the Company had approximately 3,700 employees. The Company is party to a labor contract with the United Industrial Workers of North America at its London, Ohio plant, which expires on November 30, 2010, and with the International Machinists Union at its Colonial Heights, Virginia plant, which expires May 31, 2010. Internationally, the Company employs union employees in France, Brazil and New Zealand. The Company believes that its relations with both its union and non-union employees are satisfactory.
CLASSES OF SIMILAR PRODUCTS
The Company’s operations, exclusive of unconsolidated entities, constitute three reportable segments, Consumer Domestic, Consumer International and Specialty Products (SPD). The table set forth below shows the percentage of the Company’s net sales contributed by each group of similar products marketed by the Company during 2009, 2008 and 2007.
| % of Net Sales | |||||||||
| 2009 | 2008 | 2007 | |||||||
| Consumer Domestic |
|||||||||
| Household Products |
47 | % | 45 | % | 45 | % | |||
| Personal Care Products |
27 | % | 26 | % | 25 | % | |||
| Consumer International |
16 | % | 17 | % | 18 | % | |||
| Specialty Products |
10 | % | 12 | % | 12 | % | |||
The table above reflects consolidated net sales, exclusive of net sales of unconsolidated entities.
PUBLIC INFORMATION
The Company maintains a web site at www.churchdwight.com and makes available free of charge on this web site the Company’s annual reports on Form 10-K, quarterly reports on Form 10-Q, current reports on Form 8-K and amendments to those reports filed or furnished pursuant to Section 13(a) or 15(d) of the Securities Exchange Act of 1934, as amended, as soon as reasonably practicable after the Company electronically files these materials with, or furnishes them to, the Securities and Exchange Commission. Also available on the Company’s website are the Company’s Corporate Governance Guidelines, charters for the Audit, Compensation & Organization and Governance & Nominating Committees of the Company’s Board of Directors and the Company’s Code of Conduct. Each of the foregoing is also available in print free of charge and may be obtained upon written request to: Church & Dwight Co., Inc., 469 North Harrison Street, Princeton, New Jersey 08543, attention: Secretary. The information presented in the Company’s web site is not a part of this report and the reference to the Company’s web site is intended to be an inactive textual reference only.
| ITEM 1A. | RISK FACTORS |
The following risks and uncertainties, as well as others described elsewhere in this report, could materially adversely affect our business, results of operations and financial condition:
| • | Economic conditions could adversely affect our business. |
Uncertainty about current global economic conditions has affected demand for many products. Factors that can affect demand include rates of unemployment, consumer confidence, health care costs, fuel and other energy
10
Table of Contents
costs and other economic factors affecting consumer spending behavior. While the Company’s products generally are consumer staples that should be less vulnerable to decreases in discretionary spending than other products, they may become subject to increasing price competition as recessionary conditions continue. Moreover, some of our products, such as laundry additives and battery-operated toothbrushes, are more likely to be affected by consumer decisions to control spending.
Some of our customers, including mass merchandisers, supermarkets, drugstores, convenience stores, wholesale clubs, pet specialty stores and dollar stores have experienced declining financial performance, which could affect their ability to pay amounts due to us on a timely basis or at all. In response, we regularly conduct a review of the financial strength of our key customers. As appropriate, we modify customer credit limits, which may have an adverse impact on future sales. We also regularly conduct a similar review of our suppliers to assess both their financial viability and the importance of their products to our operations. Where appropriate, we intend to identify alternate sources of materials and services. To date, we have not experienced a material adverse impact from economic conditions affecting our customers or suppliers. However, a continued economic decline that adversely affects our suppliers and customers could adversely affect our operations and sales.
The banking system and financial markets have experienced severe disruption, including, among other things, bank failures and consolidations, severely diminished liquidity and credit availability, rating downgrades, declines in asset valuations, and fluctuations in foreign currency exchange rates. These conditions present the following risks to us, among others:
| • | We are dependent on the continued financial viability of the financial institutions that participate in the syndicate that is obligated to fund our $100 million revolving credit agreement. In addition, our credit agreement includes an “accordion” feature that enables us to increase the principal amount of our term loan by $250 million. If one or more participating institutions are unable to honor their funding commitments, the cash availability under our revolving credit agreement may be curtailed. |
| • | We are dependent on the continued financial viability of the bank that administers and makes available a “backstop” line of credit under our accounts receivable securitization facility. The facility currently provides for maximum funding of $115 million. Under the securitization facility, we sell from time to time throughout the term of the related agreements (which are renewed annually), our trade accounts receivable to a wholly-owned, consolidated, special purpose finance subsidiary. The finance subsidiary in turn sells on an ongoing basis, to a commercial paper issuer affiliated with the bank, an undivided interest in the pool of accounts receivable. The bank’s backstop line of credit enables us to borrow from the bank in the event the commercial paper issuer is unable to sell commercial paper backed by the accounts receivable. We recently renewed the securitization facility, which now expires in February 2011. |
We have not been notified of any circumstances that would prevent any participating financial institution from funding our revolving credit agreement, or term loan accordion feature, or from participating in our securitization facility in February 2011. However, under current or future circumstances, such constraints may exist. Although we believe that our operating cash flows, together with our access to the credit markets, provide us with significant discretionary funding capacity, the inability of one or more institutions to fund the credit facilities or participate in our securitization facility could have a material adverse effect on our liquidity and operations.
| • | If our trade customers discontinue or reduce distribution of our products or increase private label products, our sales may decline, adversely affecting our financial performance. |
The economic crisis has caused many of our trade customers to more critically analyze the number of brands they sell which may result in their reduction or discontinuance of certain of our product lines, particularly those products that are not number one or two in their category. If this occurs and we are unable to improve distribution for those products at other trade customers, our Company’s results could be adversely affected.
11
Table of Contents
In addition, many of our trade customers sell products under their own private label brands which compete with products that we sell. As consumers look for opportunities to decrease discretionary spending during these difficult economic times, our trade customers may discontinue or reduce distribution of our products to encourage those consumers to purchase their less expensive private label products. To the extent some of our products are discontinued or are adversely affected by our trade customers’ actions to increase shelf space for their private label products, we are focusing our efforts on improving distribution with other customers. Our results could be adversely affected if our efforts are not effective.
| • | If the reputation of one or more of our leading brands erodes our financial results could suffer. |
Our financial success is directly dependent on the success of our brands, particularly the ARM & HAMMER and TROJAN brands. The success of these brands can suffer if our marketing plans or product initiatives do not have the desired impact on a brand’s image or its ability to attract consumers. Further, our results could be adversely affected if one of our leading brands suffers damage to its reputation due to real or perceived quality issues.
| • | We have recently developed and commenced sales of a number of new products and line extensions, but if they do not gain widespread customer acceptance or if they cause sales of our existing products to decline, our financial performance could decline. |
We introduced new consumer product line extensions, such as TROJAN ECSTASY condoms, NAIR Exfoliator with Microbeads, BABY ORAJEL Cooling Cucumber Teething Gel, BABY ORAJEL Tooth and Gum Cleanser, ARM & HAMMER Total 2-in-1 Dryer Cloths and OXICLEAN Max Force, a concentrated stain remover. The development and introduction of new products involves substantial research, development and marketing expenditures, which we may be unable to recover if the new products do not gain widespread market acceptance. In addition, if sales generated by new products result in a concomitant decline in sales of our existing products, our financial performance could be harmed.
| • | We may discontinue products or product lines which could result in returns, asset write-offs and shutdown costs. We also may engage in product recalls that would reduce our cash flow and earnings. |
From time to time, we have discontinued certain products and product lines, which resulted in returns from customers, asset write-offs and shutdown costs. We may suffer similar adverse consequences in the future to the extent we discontinue products that do not meet expectations or no longer satisfy consumer demand. Moreover, product quality defects or safety concerns could result in product recalls. Product returns or recalls, write-offs or shutdown costs would reduce sales, cash flow and earnings.
| • | We face intense competition in a mature industry and we may be required to increase expenditures and accept lower profit margins to preserve or maintain our market share. Unless the markets in which we compete grow substantially, a loss of market share will result in reduced sales levels and declining operating results. |
During 2009, approximately 81% of our sales were generated in U.S. markets. U.S. markets for consumer products are considered mature and commonly characterized by high household penetration, particularly with respect to our most significant product categories, such as laundry detergents, deodorizers, household cleaning products, toothpastes, antiperspirants and deodorants. Our unit sales growth in domestic markets will depend on increased use of our products by consumers, product innovation and our ability to capture market share from competitors. We may not succeed in implementing strategies to increase domestic revenues.
The consumer products industry, particularly the laundry detergent, personal care and air deodorizer categories, is intensely competitive. To protect existing market share or to capture increased market share, we
12
Table of Contents
may need to increase expenditures for promotions and advertising and to introduce and establish new products. Increased expenditures may not prove successful in maintaining or enhancing market share and could result in lower sales and profits. Many of our competitors are large companies, including The Procter & Gamble Company, Sun Products Corporation, The Clorox Company, Colgate-Palmolive Company, Henkel AG & Co. KGaA, SSL International plc, Reckitt Benckiser Group plc, Johnson & Johnson, Inverness Medical Innovations, Inc. and S.C. Johnson & Son, Inc. Many of these companies have greater financial resources than we do, and, therefore, have the capacity to outspend us should they attempt to gain market share. If we lose market share and the markets in which we compete do not grow, our sales levels and operating results will decline.
| • | Loss of the “Crest” tradename on our SPINBRUSH products could cause sales of that brand to decline. |
In conjunction with the 2005 SPINBRUSH acquisition from Procter & Gamble, the Company received a royalty free license to use the Crest tradename until October 29, 2009 and Procter & Gamble agreed to refrain from using the Crest tradename on battery-operated toothbrushes for two years thereafter. We completed the transition plan to remove the Crest tradename from its SPINBRUSH products prior to termination of the license. SPINBRUSH retained its position in 2009 as the number one brand in battery-operated toothbrushes, but we cannot predict the long-term effect of the loss of the tradename will have on SPINBRUSH sales and profitability.
| • | Providing price concessions or trade terms that are acceptable to our trade customers, or the failure to do so, could adversely affect our sales and profitability. |
Consumer products, particularly those that are value-priced like many of our products, are subject to significant price competition. From time to time, we may need to reduce the prices for some of our products, or increase prices by an amount that does not cover manufacturing cost increases, to respond to competitive and customer pressures and to maintain market share. Any reduction in prices, or inability to raise prices sufficiently to cover manufacturing cost increases, in response to these pressures would harm profit margins. In addition, if our sales volumes fail to grow sufficiently to offset any reduction in margins, our results of operations would suffer.
Because of the competitive environment facing retailers, many of our trade customers, particularly our high-volume retail store customers, have increasingly sought to obtain pricing concessions or better trade terms. To the extent we provide concessions or better trade terms, our margins are reduced. Further, if we are unable to maintain terms that are acceptable to our trade customers, these trade customers could reduce purchases of our products and increase purchases of products from our competitors, which would harm our sales and profitability.
| • | Reductions in inventory by our trade customers, including as a result of consolidations in the retail industry, could adversely affect orders for our products in periods during which the reduction results. |
From time to time our retail customers have reduced inventory levels in managing their working capital requirements. Any reduction in inventory levels by our retail customers would result in reduced orders and harm our operating results for the financial periods affected by the reductions. In particular, continued consolidation within the retail industry could potentially reduce inventory levels maintained by our retail customers, which could result in reduced orders and adversely affect our results of operations for the financial periods affected by the reductions.
| • | A continued shift in the retail market from food and drug stores to club stores and mass merchandisers could cause our sales to decline. |
Our performance also depends upon the general health of the economy and of the retail environment in particular and could be significantly harmed by changes affecting retailing and by the financial difficulties of
13
Table of Contents
retailers. Industry wide, consumer products such as those marketed by us are increasingly being sold by club stores and mass merchandisers, while sales of consumer products by food and drug stores comprise a smaller proportion of the total volume of consumer products sold. Sales of our products are stronger in the food and drug channels of trade and not as strong in the club stores and mass merchandisers. Although we have taken steps to improve sales by club stores and mass merchandisers, if we are not successful in further improving sales to these channels, and the current trend continues, our financial condition and operating results could suffer.
| • | Loss of any of our principal customers could significantly decrease our sales and profitability. |
Wal-Mart, including its affiliate Sam’s Club, is our largest customer, accounting for approximately 22% of net sales in each of the years 2009, 2008 and 2007. Our top three Consumer Domestic customers accounted for approximately 32% of net sales in 2009, 31% of net sales in 2008 and 30% of net sales in 2007. The loss of or a substantial decrease in the volume of purchases by Wal-Mart or any of our other top customers would harm our sales and profitability.
| • | Our substantial indebtedness could adversely affect our financial condition and ability to operate our businesses and repay the indebtedness. |
As of December 31, 2009, we had $816.3 million of total consolidated indebtedness. This level of indebtedness could (i) limit our ability to borrow money to fund working capital, capital expenditures, acquisitions, debt service requirements and other financing needs and (ii) make us more vulnerable to a downturn in our business, or industry, or in the economy. In the event of a general increase in interest rates, our interest expense would increase because a substantial portion of our indebtedness, including all of the indebtedness under our senior credit facilities, bears interest at floating rates. To reduce the impact of interest rate fluctuations on some of our indebtedness, we have entered into hedge agreements covering a notional amount of $250 million as of December 31, 2009. Our failure to service our indebtedness or obtain additional financing as needed could have a material adverse effect on our business operating results and financial condition. The terms of our subordinated notes and agreement relating to our principal credit facilities place a limit on the amount of certain cash payments we can make. This limitation includes the amount we can pay in dividends on our common stock. As long as we are not in default under the subordinated notes or the agreement, we do not anticipate that the limitation will have an effect on our ability to pay dividends at the current rate.
| • | We may make acquisitions that result in dilution to our current stockholders or increase our indebtedness, or both. In addition, acquisitions that are not properly integrated or are otherwise unsuccessful could strain or divert our resources. |
We have made several acquisitions in recent years, including businesses previously operated by Del Pharmaceuticals, Inc. and Orange Glo International, Inc., the SPINBRUSH battery-operated toothbrush brand, a skin care brand in South America, and the former consumer products businesses of Carter-Wallace, Inc., and may make additional acquisitions or substantial investments in complementary businesses or products in the future. Any future acquisitions or investments would entail various risks, including the difficulty of assimilating the operations and personnel of the acquired businesses or products, the potential disruption of our ongoing business and, generally, our potential inability to obtain the desired financial and strategic benefits from the acquisition or investment. The risks associated with assimilation are increased to the extent we acquire businesses that have operations or sources of supply outside of the United States and Canada, such as the SPINBRUSH business, for which products are manufactured by third party contract manufacturers in China, and the skin care brand in South America, for which products are manufactured locally by third parties. These factors could harm our financial condition and operating results. Any future acquisitions or investments could result in substantial cash expenditures, the issuance of new equity by us or the incurrence of additional debt and contingent liabilities. In addition, any potential acquisitions or investments, whether or not ultimately completed, could divert the attention of management and divert other resources from other matters that are critical to our operations.
14
Table of Contents
| • | Our condom product line could suffer if the spermicide N-9 is proved or perceived to be harmful. |
Our distribution of condoms under the TROJAN and other trademarks is regulated by the U.S. Food and Drug Administration (“FDA”). Certain of our condoms, and similar condoms sold by our competitors, contain the spermicide nonoxynol-9 (“N-9”). Some interested groups have issued reports that N-9 should not be used rectally or for multiple daily acts of vaginal intercourse. In late 2008, the FDA issued final labeling guidance for latex condoms but excluded N-9 lubricated condoms from the guidance. While we await further FDA guidance on N-9 lubricated condoms we believe that our present labeling for condoms with N-9 is compliant with the overall objectives of the FDA’s guidance, and that condoms with N-9 will remain a viable contraceptive choice for those couples who wish to use them. However, we cannot predict the nature of the labeling that ultimately will be required by the FDA. If the FDA or state governments eventually promulgate rules that prohibit or restrict the use of N-9 in condoms (such as new labeling requirements), we could incur costs from obsolete products, packaging or raw materials, and sales of condoms could decline, which, in turn, could decrease our earnings.
| • | Our manufacturing and other facilities may be subject to disruption from events beyond our control. |
Operations at our manufacturing facilities may be subject to disruption for a variety of reasons, including work stoppages, acts of war, terrorism, pandemics, fire, earthquake, flooding or other natural disasters. If a major disruption were to occur, it could result in harm to people or the natural environment, delays in shipments of products to customers or suspension of operations.
| • | Price increases in raw and packaging materials or energy costs could erode our profit margins, which could harm operating results, and efforts to hedge against raw material price increases may adversely affect our operating results due to price declines. |
Increases in the prices of raw materials such as surfactants, which are cleaning agents, palm oil, paper products and bottles, or increases in energy costs, could significantly affect our profit margins. In particular, during the past few years, we have experienced extraordinary price increases for raw and packaging materials, diesel fuel and energy costs. Concerns about the adequacy of oil supply, in the face of increasing demand, continued to affect pricing. We use surfactants and bottles in the manufacture and marketing of laundry and household cleaning products. We use paper products for packaging in many of our consumer and specialty chemical products. We use palm oil in certain of our animal nutrition products. We have attempted to address these price increases through cost reduction programs and price increases of our own products, entering into pre-buying arrangements with certain suppliers and hedge agreements for diesel fuel costs. If raw material price increases continue to occur, we may not be able to fully offset those price increases. This could harm our financial condition and operating results.
We use hedge agreements to mitigate the volatility of diesel fuel prices and related fuel surcharges. The hedge agreements are designed to add stability to our product costs, enabling us to make pricing decisions and lessen the economic impact of abrupt changes in diesel fuel prices over the term of the contract. However, in periods of declining fuel prices the hedge agreements can have the effect of increasing our expenditures for fuel.
| • | We are subject to various government regulations in the countries in which we operate that could adversely affect our business. |
The manufacturing, processing, formulation, packaging, labeling and advertising of our products are subject to regulation by federal agencies, including the FDA, the Federal Trade Commission (“FTC”) and the Consumer Product Safety Commission. In addition, our operations are subject to the oversight of the Environmental Protection Agency, the Occupational Safety and Health Administration and the National Labor Relations Board. Our activities are also regulated by various agencies of the states, localities and foreign countries in which our products are sold.
15
Table of Contents
In particular, the FDA regulates the safety, manufacturing, labeling and distribution of condoms, home pregnancy and ovulation test kits, and over-the-counter pharmaceuticals. The FDA also exercises a somewhat less rigorous oversight over cosmetic products such as depilatories. In addition, under a memorandum of understanding between the FDA and the FTC, the FTC has jurisdiction with regard to the promotion and advertising of these products, and the FTC regulates the promotion and advertising of our other products as well. As part of its regulatory authority, the FDA may periodically conduct inspections of the physical facilities, machinery, processes and procedures that we use to manufacture regulated products and may observe compliance issues that would require us to make certain changes in our manufacturing facilities and processes. We may be required to make additional expenditures to address these issues or possibly stop selling certain products until a compliance issue has been remediated. As a result, our business could be adversely affected.
Our international operations, including the production of over-the-counter drug products, are subject to regulation in each of the foreign jurisdictions in which we manufacture or market goods. Changes in product standards or manufacturing requirements in any of these jurisdictions could require us to make certain modifications to our operations or product formulations, or to cease manufacturing certain products completely. The effect of the regulatory environment in foreign countries on our over-the-counter (“OTC”) and medical devices may affect our ability to market and to make competitive claims for our products. As a result, our international business could be adversely affected.
| • | We are subject to risks related to our international operations that could adversely affect our results of operations. |
Our international operations subject us to risks customarily associated with foreign operations, including:
| • | currency fluctuations; |
| • | import and export license requirements; |
| • | trade restrictions; |
| • | changes in tariffs and taxes; |
| • | restrictions on repatriating foreign profits back to the United States; and |
| • | difficulties in staffing and managing international operations. |
In all foreign jurisdictions in which we operate, we are subject to laws and regulations that govern foreign investment, foreign trade and currency exchange transactions. These laws and regulations may limit our ability to repatriate cash as dividends or otherwise to the United States and may limit our ability to convert foreign currency cash flow into U.S. dollars. Outside the United States, sales and costs are denominated in a variety of currencies, including the Euro, British pound, Brazilian real, Canadian dollar, Mexican peso, Chinese yuan and Australian dollar. A weakening of the currencies in which sales are generated relative to the currencies in which costs are denominated would decrease operating profits and cash flow.
| • | Environmental matters create potential liability risks. |
We must comply with various environmental laws and regulations in the jurisdictions in which we operate, including those relating to the handling and disposal of solid and hazardous wastes and the remediation of contamination associated with the use and disposal of hazardous substances. A release of such substances due to accident or an intentional act could result in substantial liability to governmental authorities or to third parties. We have incurred, and will continue to incur, capital and operating expenditures and other costs in complying with environmental laws and regulations. It is possible that we could become subject to additional environmental liabilities in the future that could have a material adverse effect on our results of operations or financial condition. During 2009, one of our international facilities discharged chemicals into the environment. We currently are developing a formal remediation plan, and based on available information we have, accrued approximately $3 million for remediation and related costs. However, we cannot assure that additional costs will not be incurred in connection with this matter.
16
Table of Contents
| • | Product liability claims could adversely affect the Company’s sales and operating results. |
We may be required to pay for losses or injuries actually or purportedly caused by its products. Claims could be based on allegations that, among other things, our products contain contaminants, provide inadequate instructions regarding their use, or inadequate warnings concerning interactions with other substances. Product liability claims also could result in negative publicity that could harm our sales and operating results. In addition, if one of our products is found to be defective, we could be required to recall it, which could result in adverse publicity and significant expenses. Although we maintain product liability insurance coverage, potential product liability claims may exceed the amount of insurance coverage or may be excluded under the terms of the policy.
| • | Failure to effectively utilize or successfully assert intellectual property rights could materially adversely affect our competitiveness. |
We rely on trademark, trade secret, patent and copyright laws to protect our intellectual property rights. We cannot be sure that these intellectual property rights will be effectively utilized or, if necessary, successfully asserted. There is a risk that we will not be able to obtain and perfect our own intellectual property rights, or, where appropriate, license from others intellectual property rights necessary to support new product introductions. We cannot be sure that these rights, if obtained, will not be invalidated, circumvented or challenged in the future. In addition, even if such rights are obtained in the United States, the laws of some of the other countries in which our products are or may be sold do not protect intellectual property rights to the same extent as the laws of the United States. Our failure to perfect or successfully assert intellectual property rights could make us less competitive and could have a material adverse effect on our business, operating results and financial condition.
| • | A failure of a key information technology system could adversely affect our ability to conduct business. |
We rely extensively on information technology systems, some of which are managed by third-party service providers, to interact with internal personnel and external customers and suppliers, and other persons. These interactions include, but are not limited to, ordering and managing materials from suppliers, converting materials to finished products, shipping product to customers, processing transactions, summarizing and reporting results of operations, complying with regulatory, legal or tax requirements, and other processes necessary to manage our business. Our systems could be damaged or cease to function properly due to any number of causes, including catastrophic events, power outages, and security breaches. Although we have business continuity plans in place to address service interruptions, if our business continuity plans do not provide effective alternative processes on a timely basis, we may suffer interruptions in our ability to manage operations which may adversely affect our business.
| • | Resolutions of tax disputes may impact our earnings and cash flow. |
Significant judgment is required in determining our effective tax rate and in evaluating its tax positions. We provide for uncertain tax positions when such tax positions do not meet the recognition thresholds or measurement standards prescribed by Financial Accounting Standards Board (“FASB”) Accounting Standards Codification (“ASC”) Subtopic 740-10, Income Taxes. Changes to uncertain tax positions, including related interest and penalties, impact our effective tax rate. When particular tax matters arise, a number of years may elapse before such matters are audited and finally resolved. Favorable resolution of such matters could be recognized as a reduction to our effective tax rate in the year of resolution. Unfavorable resolution of any tax matter could increase the effective tax rate. Any resolution of a tax issue may require the use of cash in the year of resolution. For additional information, refer to the information set forth in Note 13—Income Taxes of the Notes to Consolidated Financial Statements.
| ITEM 1B. | UNRESOLVED STAFF COMMENTS |
Not applicable.
17
Table of Contents
| ITEM 2. | PROPERTIES. |
The Company’s executive offices and primary research and development facilities are owned by the Company and are located on 22 acres of land in Princeton, New Jersey. These facilities include approximately 127,000 square feet of office and laboratory space. The Company also owns a 36,000 square foot research and development facility in Cranbury, New Jersey. In addition, the Company leases space in three buildings adjacent to its Princeton facility that contain approximately 140,000 square feet of office space under three leases, of which two expire in 2012, and one expires in 2022. The Company also leases regional sales offices in various locations throughout the United States, Brazil and China.
The Company and its consolidated subsidiaries also own or lease other facilities as set forth in the following table:
| Location |
Products Manufactured |
Approximate Area (Sq. Feet) | ||
| Owned: |
||||
| Manufacturing facilities |
||||
| York, Pennsylvania |
Liquid laundry detergent | 450,000 | ||
| Harrisonville, Missouri |
Liquid laundry detergent and fabric softener | 360,000 | ||
| Green River, Wyoming |
Sodium bicarbonate and various consumer products | 273,000 | ||
| Lakewood, New Jersey |
Various consumer products | 250,000 | ||
| Colonial Heights, Virginia |
Condoms | 220,000 | ||
| Old Fort, Ohio |
Sodium bicarbonate, rumen bypass fats and various consumer products | 208,000 | ||
| Montreal, Canada |
Personal care products | 157,000 | ||
| Camaçari, Bahia, Brazil |
Sodium bicarbonate and other products | 120,000 | ||
| London, Ohio |
Soap pads and fabric softener sheets | 114,000 | ||
| Feira de Santana, Bahia, Brazil |
Barium carbonate and other products | 106,000 | ||
| Folkestone, England |
Personal care products | 78,000 | ||
| Madera, California |
Rumen bypass fats and related products | 50,000 | ||
| Itapura, Bahia, Brazil |
Barite | 35,000 | ||
| New Plymouth, New Zealand |
Condom processing | 31,000 | ||
| Oskaloosa, Iowa |
Animal nutrition products | 27,000 | ||
| Warehouses |
||||
| York, Pennsylvania |
— | 650,000 | ||
| Harrisonville, Missouri |
— | 150,000 | ||
| Green River, Wyoming |
— | 101,000 | ||
| Camaçari, Bahia, Brazil |
— | 39,200 | ||
| Itapura, Bahia, Brazil |
— | 19,600 | ||
| Feira de Santana, Bahia, Brazil |
— | 13,100 | ||
| Leased: |
||||
| Manufacturing facilities |
||||
| North Brunswick, New Jersey(1) |
— | 360,000 | ||
| Folkestone, England |
Personal care products | 21,500 | ||
| Warehouses |
||||
| North Brunswick, New Jersey(2) |
— | 525,000 | ||
| North Brunswick, New Jersey(3) |
— | 156,000 | ||
| North Brunswick, New Jersey(5) |
— | 130,275 | ||
| North Brunswick, New Jersey(4) |
— | 173,000 | ||
| Fostoria, Ohio |
— | 125,000 | ||
| Grandview, Missouri |
— | 304,285 | ||
| Mississauga, Canada(6) |
— | 123,000 | ||
| Barcelona, Spain(7) |
— | 20,000 |
18
Table of Contents
| Location |
Products Manufactured |
Approximate Area (Sq. Feet) | ||
| Folkestone, England |
— | 65,000 | ||
| Revel, France |
— | 35,500 | ||
| Mexico City, Mexico |
— | 27,500 | ||
| Sydney, Australia |
— | 24,900 | ||
| Feira de Santana, Bahia, Brazil |
— | 21,700 | ||
| Diadema, SP, Brazil |
— | 13,000 | ||
| Atlanta, Georgia |
— | 23,071 | ||
| Offices |
||||
| Barcelona, Spain(7) |
— | 85,000 | ||
| Levallois, France |
— | 21,600 | ||
| Mississauga, Canada |
— | 17,000 | ||
| Dover, England |
— | 9,400 |
| (1) | Lease expires in 2015. |
| (2) | Lease expires in 2010. |
| (3) | Lease expires in 2011. |
| (4) | Lease expires in 2010. |
| (5) | Lease expires in 2010, being subleased. |
| (6) | Lease expires in 2022, subject to two five-year extensions at the option of the Company. |
| (7) | In Barcelona, Spain, the Company leases an 85,000 square foot facility in which manufacturing operations ceased in the first quarter 2006. The Company has subleased 57,000 square feet of the plant to a third party. |
In conjunction with the opening of the new facility in York, Pennsylvania, the Company closed its leased buildings in North Brunswick and has subleased one of these leased buildings. It is attempting to sublease or assign all buildings to third parties.
In Syracuse, New York, the Company owns a 21 acre site which includes a group of connected buildings. This facility was closed in 2001 and a portion of the facility is now leased to a third party.
Armand Products Company, a joint venture in which the Company owns a 50% interest, operates a potassium carbonate manufacturing plant located in Muscle Shoals, Alabama. This facility contains approximately 53,000 square feet of space and has a production capacity of 103,000 tons of potassium carbonate per year.
The Company’s 99.5% owned Brazilian subsidiary, QGN, has its administrative headquarters in Rio de Janeiro.
The Old Fort, Ohio plant has a production capacity for sodium bicarbonate of 280,000 tons per year. The Green River plant has a production capacity for sodium bicarbonate of 200,000 tons per year.
The Company believes that its operating and administrative facilities are adequate and suitable for the conduct of its business. The Company also believes that its production facilities are suitable for current manufacturing requirements for its consumer and specialty products businesses. In addition, the facilities possess a capacity sufficient to accommodate the Company’s estimated increases in production requirements over the next several years, based on its current product lines.
| ITEM 3. | LEGAL PROCEEDINGS |
The Company, in the ordinary course of its business, is the subject of, or party to, various pending or threatened legal actions. The Company believes that any liability ultimately arising from these actions will not have a material adverse effect on its financial condition or results of operation, including cash flows.
| ITEM 4. | SUBMISSION OF MATTERS TO A VOTE OF SECURITY HOLDERS |
Not applicable.
19
Table of Contents
PART II
| ITEM 5. | MARKET FOR THE REGISTRANT’S COMMON EQUITY, RELATED STOCKHOLDER MATTERS AND ISSUER PURCHASES OF EQUITY SECURITIES |
| 2009 | 2008 | |||||||||||||||||
| Common Stock Price Range and Dividends |
Low | High | Dividend | Low | High | Dividend | ||||||||||||
| 1st Quarter |
$ | 45.41 | $ | 56.15 | $ | 0.09 | $ | 50.00 | $ | 56.67 | $ | 0.08 | ||||||
| 2nd Quarter |
$ | 49.27 | $ | 58.50 | $ | 0.09 | $ | 52.74 | $ | 58.43 | $ | 0.08 | ||||||
| 3rd Quarter |
$ | 52.52 | $ | 61.14 | $ | 0.14 | $ | 48.71 | $ | 65.54 | $ | 0.09 | ||||||
| 4th Quarter |
$ | 54.54 | $ | 62.42 | $ | 0.14 | $ | 47.59 | $ | 64.09 | $ | 0.09 | ||||||
| Full Year |
$ | 45.41 | $ | 62.42 | $ | 0.46 | $ | 47.59 | $ | 65.54 | $ | 0.34 | ||||||
Based on composite trades reported by the New York Stock Exchange.
Approximate number of holders of Church & Dwight’s Common Stock as of December 31, 2009: 1,800
The following graph compares the yearly change in the cumulative total stockholder return on the Company Common Stock for the past five fiscal years with the cumulative total return of the S&P 500 Index and the S&P 500 Household Products Index described more fully below. The returns are indexed to a value of $100 at December 31, 2004. Dividend reinvestment has been assumed.
Comparison of Cumulative Five-Year Total Return among Company, S&P 500 Index and the S&P 500 Household Products Index(1) Line Graph
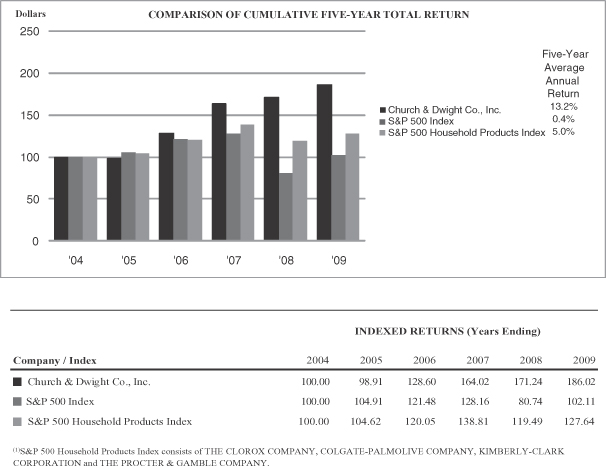
20
Table of Contents
| ITEM 6. | SELECTED FINANCIAL DATA |
The following selected historical consolidated financial data should be read in conjunction with “Management’s Discussion and Analysis of Financial Condition and Results of Operations” and the Company’s audited consolidated financial statements and related notes to those statements included in this report. The selected historical consolidated financial data for the periods presented have been derived from the Company’s audited consolidated financial statements.
CHURCH & DWIGHT CO., INC. AND SUBSIDIARIES
FIVE-YEAR FINANCIAL REVIEW
(Dollars in millions, except per share data)
| 2009(1) | 2008(1) | 2007(1) | 2006(1) | 2005(1) | ||||||||||||
| Operating Results |
||||||||||||||||
| Net Sales |
$ | 2,520.9 | 2,422.4 | 2,220.9 | 1,945.7 | 1,736.5 | ||||||||||
| Marketing |
$ | 353.6 | 294.1 | 256.7 | 216.7 | 183.4 | ||||||||||
| Research & Development |
$ | 55.1 | 51.2 | 49.8 | 44.7 | 38.7 | ||||||||||
| Income from Operations(2,3) |
$ | 412.9 | 340.3 | 305.0 | 252.1 | 212.8 | ||||||||||
| % of Sales |
16.4 | % | 14.1 | % | 13.7 | % | 13.0 | % | 12.3 | % | ||||||
| Net Income attributable to Church & Dwight Co., Inc.(2,3) |
$ | 243.5 | 195.2 | 169.0 | 138.9 | 122.9 | ||||||||||
| Net Income per Share-Basic |
$ | 3.46 | 2.88 | 2.57 | 2.14 | 1.92 | ||||||||||
| Net Income per Share-Diluted |
$ | 3.41 | 2.78 | 2.46 | 2.07 | 1.83 | ||||||||||
| Financial Position |
||||||||||||||||
| Total Assets |
$ | 3,118.4 | 2,801.4 | 2,532.5 | 2,334.2 | 1,962.1 | ||||||||||
| Total Debt |
$ | 816.3 | 856.1 | 856.0 | 933.3 | 756.5 | ||||||||||
| Total Stockholders’ Equity |
$ | 1,601.8 | 1,331.7 | 1,080.5 | 864.2 | 697.1 | ||||||||||
| Total Debt as a % of Total Capitalization |
34 | % | 39 | % | 44 | % | 52 | % | 52 | % | ||||||
| Other Data |
||||||||||||||||
| Average Common Shares Outstanding-Basic |
70,379 | 67,870 | 65,840 | 64,856 | 63,857 | |||||||||||
| Cash Dividends Paid |
$ | 32.3 | 23.1 | 19.7 | 16.9 | 15.3 | ||||||||||
| Cash Dividends Paid per Common Share |
$ | 0.46 | 0.34 | 0.30 | 0.26 | 0.24 | ||||||||||
| Stockholders’ Equity per Common Share |
$ | 22.76 | 19.62 | 16.41 | 13.32 | 10.91 | ||||||||||
| Additions to Property, Plant & Equipment |
$ | 135.4 | 98.3 | 48.9 | 47.6 | 37.7 | ||||||||||
| Depreciation & Amortization |
$ | 85.4 | 71.4 | 56.7 | 51.7 | 44.2 | ||||||||||
| Employees at Year-End |
3,664 | 3,530 | 3,682 | 3,655 | 3,662 | |||||||||||
| (1) | Period to period comparisons of the data presented above are impacted by the effect of acquisitions and divestitures made by the Company. For further explanation of the impact of the acquisition occurring in 2008, reference should be made to Note 6 to the consolidated financial statements and for the impact of divestitures occurring in 2008 reference should be made to Note 9 of such financial statements, which are included in Item 8 of this report. |
| (2) | Includes in 2009 a pre-tax charge of $11.8 million ($7.3 million after-tax), in 2008 a pre-tax charge of $11.3 million ($6.9 million after-tax), in 2007 a pre-tax charge of $10.6 million ($6.6 million after-tax), and in 2006 a pre-tax charge of $10.3 million ($6.4 million after-tax) relating to stock option based compensation. |
| (3) | 2009 includes a pre-tax Abbott Litigation Settlement net gain of $20 million ($12.0 million after-tax), and the North Brunswick, New Jersey shutdown pre-tax charge of $25.5 million ($15.6 million after-tax). |
21
Table of Contents
| ITEM 7 | MANAGEMENT’S DISCUSSION AND ANALYSIS OF FINANCIAL CONDITION AND RESULTS OF OPERATIONS |
Management’s Discussion and Analysis of Financial Condition and Results of Operations should be read in conjunction with the Company’s consolidated financial statements.
OVERVIEW
The Company develops, manufactures and markets a broad range of consumer and specialty products. It recognizes revenues and profits from selling its products under a variety of brands to supermarkets, drug stores and mass merchandisers that sell the products to consumers. The Company also sells its products to industrial customers and distributors. The Company focuses its marketing efforts principally on its eight “power brands.” These well-recognized brand names include ARM & HAMMER, (used in multiple product categories such as baking soda, carpet deodorization and laundry detergent), TROJAN condoms, XTRA laundry detergent, OXICLEAN pre-wash laundry additive, NAIR depilatories, FIRST RESPONSE home pregnancy and ovulation test kits, ORAJEL oral analgesics and SPINBRUSH battery-operated toothbrushes. The Company’s business is divided into three primary segments, Consumer Domestic, Consumer International and Specialty Products. The Consumer Domestic segment includes the eight power brands and other household and personal care products such as SCRUB FREE, KABOOM, ORANGE GLO and BRILLO cleaning products, ANSWER home pregnancy and ovulation test kits, ARRID antiperspirant, CLOSE-UP and AIM toothpastes. The Consumer International segment primarily sells a variety of personal care products, some of which use the same brand names as our domestic product lines, in international markets, including France, the United Kingdom, Canada, Mexico, Australia, Brazil and China. The Specialty Products segment is the largest U.S. producer of sodium bicarbonate, which it sells together with other specialty inorganic chemicals for a variety of industrial, institutional, medical and food applications. This segment also sells a range of animal nutrition and specialty cleaning products. In 2009, the Consumer Domestic, Consumer International and Specialty Products segments represented approximately 74%, 16% and 10%, respectively, of the Company’s net sales.
In the fourth quarter of 2009, the Company completed construction of its integrated laundry detergent manufacturing plant and distribution center in York, Pennsylvania. In conjunction with the opening of the new facility, the Company closed its existing laundry detergent manufacturing plant and distribution facility in North Brunswick, New Jersey. The North Brunswick facility was comprised of five separate buildings, which had resulted in significant inefficiencies and could not accommodate expansion to address expected future growth.
In September 2009, the Company and Abbott Laboratories, Inc. (“Abbott”) agreed to settle patent infringement litigation. As part of the settlement, Abbott paid $27 million to the Company. The Company recognized a pre-tax gain, net of legal expenses, of $20.0 million as of September 2009, which is reflected in the results of the Consumer Domestic segment.
In June 2009, the Company sold certain non-core personal care product lines acquired in the Orajel Acquisition for approximately $30 million, net of fees, which approximated book value. The results of these product lines were included in both the Consumer Domestic and Consumer International Segments during the period from July 2008 until the completion of the sale in June 2009.
Continuing a trend that began in 2005, the cost of raw materials in 2009 began at historical highs, although by the end of 2009 the cost of many of these raw materials retreated from these highs. As a result the cost of surfactants, diesel fuel, corrugated paper and oil-based raw and packaging materials used in the household and specialty products businesses were all lower at the end of 2009 than the 2008 average. Moreover, the price of palm fatty acid distillate (PFAD), which generally fluctuates with the price of global vegetable oil, was on average at the same level as 2008 but had fallen by the end of 2009. The Company also benefitted in 2009 from savings realized in cost improvement programs. Despite a second half reduction in the cost of most commodities, some commodities continued to rise in price, such as soda ash. Additional increases in the prices of certain raw materials could further materially impact the Company’s costs and financial results if the Company is unable to pass such costs along in the form of price increases to its customers.
22
Table of Contents
The Company operates in highly competitive consumer product markets, in which cost efficiency, new product offerings and innovation are critical to success. The consumer products markets are particularly mature in North America and are characterized by high household penetration, particularly with respect to the Company’s most significant product categories such as laundry detergents and oral care. Furthermore, because of ongoing retail sector consolidation and the competitive environment facing retailers, the Company faces pricing pressure from these customers, particularly the high-volume retail store customers, which increasingly have sought to obtain pricing concessions or better trade terms. To protect its existing market share or to capture additional market share, the Company increased expenditures for promotions and advertising and introduced new products and line extensions. In order to fund the additional marketing expenses, the Company has and continues to pursue ongoing cost cutting initiatives. As a result of its acquisitions and cost improvement initiatives, the Company has been able to lower its overall unit costs and increase the productivity of its various manufacturing facilities.
Uncertainty about current global economic conditions has affected demand for many products. Factors that can affect demand include rates of unemployment, consumer confidence, health care costs, fuel and other energy costs and other economic factors affecting consumer spending behavior. While the Company’s products generally are consumer staples that should be less vulnerable to decreases in discretionary spending than other products, they may become subject to increasing price competition as recessionary conditions continue. Moreover, some of our products, such as laundry additives and battery-operated toothbrushes, are more likely to be affected by consumer decisions to control spending.
Some of our customers, including mass merchandisers, supermarkets, drugstores, convenience stores, wholesale clubs, pet specialty stores and dollar stores have experienced declining financial performance, which could affect their ability to pay amounts due to us on a timely basis or at all. In response, we regularly conduct a review of the financial strength of our key customers. As appropriate, we modify customer credit limits, which may have an adverse impact on future sales. We also regularly conduct a similar review of our suppliers to assess both their financial viability and the importance of their products to our operations. Where appropriate, we intend to identify alternate sources of materials and services. To date, we have not experienced a material adverse impact from economic conditions affecting our customers or suppliers. However, a continued economic decline that adversely affects our suppliers and customers could adversely affect our operations and sales.
In addition many of our trade customers sell products under their own private label brand that compete with products that we sell. As consumers look for opportunities to decrease discretionary spending during current difficult economic times, our trade customers may discontinue or reduce distribution of our products to encourage those consumers to purchase their less expensive private label products. To offset the adverse effect that results when some of our products are discontinued or are adversely affected by our trade customers’ actions to increase shelf space for their private label products, we focus our efforts on improving distribution with other customers. Our results could be adversely affected if these efforts are not effective.
During 2009, one of the Company’s international facilities discharged chemicals into the environment. The Company currently is developing a formal remediation plan, and based on available information, accrued approximately $3 million for remediation and related costs. However, we cannot assure that additional costs will not be incurred in connection with this matter.
SIGNIFICANT ACCOUNTING POLICIES AND ESTIMATES
The Company’s Consolidated Financial Statements have been prepared in accordance with accounting principles generally accepted in the United States of America (GAAP). The preparation of these financial statements requires management to make estimates and assumptions that affect the reported amounts of assets, liabilities, revenue and expenses, and related disclosure of contingent assets and liabilities. By their nature, these judgments are subject to uncertainty. They are based on our historical experience, our observation of trends in industry, information provided by our customers and information available from other outside sources, as appropriate. The Company’s significant accounting policies and estimates are described below.
23
Table of Contents
Revenue Recognition and Promotional and Sales Return Reserves
Virtually all of the Company’s revenue represents sales of finished goods inventory and is recognized when delivered or picked up by our customers. The reserves for consumer and trade promotion liabilities and sales returns are established based on our best estimate of the amounts necessary to settle future and existing claims on products sold as of the balance sheet date. Promotional reserves are provided for sales incentives, such as coupons to consumers, and sales incentives provided to customers (such as slotting, cooperative advertising, incentive discounts based on volume of sales and other arrangements made directly with customers). All such costs are netted against sales. Slotting costs are recorded when the product is delivered to the customer. Cooperative advertising costs are recorded when the customer places the advertisement for the Company’s products. Discounts relating to price reduction arrangements are recorded when the related sale takes place. Costs associated with end-aisle or other in-store displays are recorded when product that is subject to the promotion is sold. The Company relies on historical experience and forecasted data to determine the required reserves. For example, the Company uses historical experience to project coupon redemption rates to determine reserve requirements. Based on the total face value of Consumer Domestic coupons redeemed over the past several years, if the actual rate of redemptions were to deviate by 0.1% from the rate for which reserves are accrued in the financial statements, an approximately $1.7 million difference in the reserve required for coupons would result. With regard to other promotional reserves and sales returns, the Company uses experience-based estimates, customer and sales organization inputs and historical trend analysis in arriving at the reserves required. If the Company’s estimates for promotional activities and sales returns were to change by 10% the impact to promotional spending and sales return accruals would be approximately $5.5 million. While management believes that its promotional and sales returns reserves are reasonable and that appropriate judgments have been made, estimated amounts could differ materially from actual future obligations. During the twelve months ended December 31, 2009, 2008 and 2007, the Company reduced promotion liabilities by approximately $7.8 million, $4.0 million and $5.4 million, respectively, based on a change in estimate as a result of actual experience and updated information.
Impairment of goodwill, trademarks and other intangible assets and property, plant and equipment
Carrying values of goodwill, trademarks and other indefinite lived intangible assets are reviewed periodically for possible impairment in accordance with Financial Accounting Standards Board (“FASB”) Accounting Standards Codification (“ASC”) Topic 350, Intangibles—Goodwill and Other. The Company’s impairment review is based on a discounted cash flow approach that requires significant judgment with respect to unit volume, revenue and expense growth rates, and the selection of an appropriate discount rate. Management uses estimates based on expected trends in making these assumptions. With respect to goodwill, impairment occurs when the carrying value of the reporting unit exceeds the discounted present value of cash flows for that reporting unit. For trademarks and other intangible assets, an impairment charge is recorded for the difference between the carrying value and the net present value of estimated future cash flows, which represents the estimated fair value of the asset. The Company uses its judgment in assessing whether assets may have become impaired between annual valuations. Indicators such as unexpected adverse economic factors, unanticipated technological change, distribution losses, or competitive activities and acts by governments and courts may indicate that an asset has become impaired.
The Company recognized tradename impairment charges within selling, general and administrative expenses for the three year period ended December 31, 2009 as follows:
| (In millions) |
2009 | 2008 | 2007 | ||||||
| Segments: |
|||||||||
| Consumer Domestic |
$ | — | $ | 1.9 | $ | — | |||
| Consumer International |
— | 3.8 | 4.2 | ||||||
| Total |
$ | — | $ | 5.7 | $ | 4.2 | |||
24
Table of Contents
The tradename impairment charges recorded in 2008 were a result of management’s decision to exit a business, a potential change of a brand’s name, lost distribution at key customer accounts and reduced profitability. The impairment charges in 2007 are also due to lost distribution at key customer accounts and reduced profitability. The amount of the impairment charge was determined by comparing the estimated fair value of the asset to its carrying amount. Fair value was estimated based on a “relief from royalty” discounted cash flow method, which contains numerous variables that are subject to change as business conditions change, and therefore could impact fair values in the future. Under this method, the owner of an intangible asset must determine the arm’s length royalty that likely would have been charged if the owner had to license that asset from a third party. The Company determined that the remaining carrying value of all tradenames was recoverable based upon the forecasted cash flows and profitability of the brands.
Property, plant and equipment and other long-lived assets are reviewed whenever events or changes in circumstances occur that indicate possible impairment in accordance with ASC Subtopic 360, Property, Plant and Equipment. The Company’s impairment review is based on an undiscounted cash flow analysis at the lowest level at which cash flows of the long-lived assets are largely independent of other groups of Company assets and liabilities. The analysis requires management judgment with respect to changes in technology, the continued success of product lines, and future volume, revenue and expense growth rates. The Company conducts annual reviews to identify idle and underutilized equipment, and reviews business plans for possible impairment implications. Impairment occurs when the carrying value of the asset exceeds the future undiscounted cash flows. When an impairment is indicated, the estimated future cash flows are then discounted to determine the estimated fair value of the asset and an impairment charge is recorded for the difference between the carrying value and the net present value of estimated future cash flows.
The Company recognized charges related to equipment obsolescence, which occurs in the ordinary course of business, and plant impairment charges during the three year period ended December 31, 2009 as follows:
| (In millions) |
2009 | 2008 | 2007 | ||||||
| Segments: |
|||||||||
| Consumer Domestic |
$ | 3.2 | $ | 3.4 | $ | 2.8 | |||
| Consumer International |
— | 0.1 | 0.4 | ||||||
| Specialty Products |
6.9 | 0.1 | 0.1 | ||||||
| Total |
$ | 10.1 | $ | 3.6 | $ | 3.3 | |||
In 2009, the Company recorded a plant asset impairment charge of approximately $6.9 million, representing the carrying value of the related assets, associated with one of its international subsidiaries. The Company measured the impairment charge using the discounted cash flow method. This subsidiary manufactures some products that compete with imports priced in U.S. dollars. As the dollar has weakened, it has been necessary to lower prices in the local currency to stay competitive, leading to negative cash flows, which is the key input under the discounted cash flow method. The charge is included in cost of sales in the Specialty Products Division segment income statement. The $3.2 million charge recorded in the Consumer Domestic Segment in 2009 is primarily a result of a lack of acceptance of certain products by our key customers that resulted in a decline of forecasted future cash flows and reduced profitability. The charges in 2008 and 2007 are due to the idling of certain equipment. The estimates and assumptions used in connection with impairment analyses are consistent with the business plans and estimates that the Company uses to manage its business operations. Nevertheless, future outcomes may differ materially from management’s estimates. If the Company’s products fail to achieve estimated volume and pricing targets, market conditions unfavorably change or other significant estimates are not realized, then the Company’s revenue and cost forecasts may not be achieved, and the Company may be required to recognize additional impairment charges.
25
Table of Contents
Inventory valuation
When appropriate, the Company writes down the carrying value of its inventory to the lower of cost or market (net realizable value, which reflects any costs to sell or dispose). The Company identifies any slow moving, obsolete or excess inventory to determine whether an adjustment is needed. The determination of whether inventory items are slow moving, obsolete or in excess of needs requires estimates and assumptions about the future demand for the Company’s products, technological changes, and new product introductions. In addition, the Company’s allowance for obsolescence may be impacted by the reduction of the number of stock keeping units (“SKUs”). The Company evaluates its inventory levels and expected usage on a periodic basis and records adjustments as required. Adjustments to inventory to reflect a reduction in net realizable value were $8.8 million at December 31, 2009, and $10.7 million at December 31, 2008.
Valuation of pension and postretirement benefit costs
The Company’s pension and postretirement benefit costs are developed from actuarial valuations. Inherent in these valuations are key assumptions provided by the Company to its actuaries, including the discount rate and expected long-term rate of return on plan assets. Material changes in the Company’s pension and postretirement benefit costs may occur in the future due to changes in these assumptions as well as fluctuations in plan assets.
The discount rate is subject to change each year, consistent with changes in applicable high-quality, long-term corporate bond indices. Based on the expected duration of the benefit payments for the Company’s pension plans and postretirement plans, the Company refers to an applicable index and expected term of benefit payments to select a discount rate at which it believes the pension benefits could be effectively settled. Based on the published rate as of December 31, 2009 that matched estimated cash flows for the plans, the Company used a discount rate of 5.75% for its domestic plan. The Company’s weighted average discount rate for all pension plans as of December 31, 2009 is 5.76% as compared to 6.58% used at December 31, 2008.
The expected long-term rate of return on pension plan assets is selected by taking into account a historical trend, the expected duration of the projected benefit obligation for the plans, the asset mix of the plans, and known economic and market conditions at the time of valuation. Based on these factors, the Company’s weighted average expected long-term rate of return for 2009 was 6.72%, a decrease of almost 50 basis points from the 7.21% rate used in 2008. A 50 basis point change in the expected long-term rate of return would result in less than a $0.6 million change in pension expense for 2010.
As noted above, changes in assumptions used by management may result in material changes in the Company’s pension and postretirement benefit costs. In 2009, other comprehensive income reflected a $5.7 million increase in pension plan obligations and a $0.5 million decrease for postretirement benefit plans. The changes are primarily related to the change in discount rates for all plans.
The Company made cash contributions of approximately $7.4 million to its defined benefit pension plans in 2009. The Company estimates it will be required to make cash contributions to its pension plans of approximately $1.8 million in 2010.
On January 27, 2010, the Company’s Board of Directors approved the termination, effective April 15, 2010, of the domestic defined benefit pension plan, under which approximately 766 participants, including 46 active employees, have accrued benefits. The Company anticipates completing the termination of this plan in late 2010 or early 2011, once regulatory approvals are obtained. To effect the termination, the Company estimates, based on December 31, 2009 valuations, that it will be required to contribute approximately $11 million to $14 million to the plan, primarily to enable the plan to purchase annuities to provide for accrued benefits. The Company estimates that a one-time expense of approximately $20 million to $23 million will be incurred when the annuities are purchased. This expense is primarily attributable to pension settlement accounting rules that require accelerated recognition of actuarial losses that previously were to be amortized over the expected benefit lives of participants. The contributions and expense are subject to change based on the valuations at the actual date of settlement.
26
Table of Contents
Income Taxes
Income taxes are accounted for under the asset and liability method. Deferred tax assets and liabilities are recognized to reflect the future tax consequences attributable to the differences between the financial statement carrying amounts of existing assets and liabilities and their respective tax bases, and operating loss and tax credit carryforwards. Deferred tax assets and liabilities are measured using enacted tax rates expected to apply to taxable income in the years in which the differences are expected to be recovered or settled. Management provides a valuation allowance against deferred tax assets for amounts which are not considered “more likely than not” to be realized. The Company records liabilities for potential assessments in various tax jurisdictions under ASC Subtopic 740-10, Income Taxes. The liabilities relate to tax return positions that, although supportable by the Company, may be challenged by the tax authorities. The Company adjusts this liability as a result of changes in tax legislation, interpretations of laws by courts, rulings by tax authorities, changes in estimates and the expiration of the statute of limitations. Many of the judgments involved in adjusting the liability involve assumptions and estimates that are highly uncertain and subject to change. In this regard, settlement of any issue, or an adverse determination in litigation, with a taxing authority could require the use of cash and result in an increase in our annual tax rate. Conversely, favorable resolution of an issue with a taxing authority would be recognized as a reduction to our annual tax rate. The Company’s policy for recording interest associated with income tax examinations is to record interest as a component of Income before Income Taxes.
New Accounting Pronouncements
In June 2009, the Financial Accounting Standards Board (“FASB”) issued FASB Accounting Standards Codification (“ASC”) Topic 105, Generally Accepted Accounting Principles. Topic 105 establishes the FASB Accounting Standards Codification (the “ASC”) as the source of authoritative accounting principles recognized by the FASB to be applied by nongovernmental entities in the preparation of financial statements in conformity with generally accepted accounting principles (GAAP). ASC Topic 105 is effective for interim and annual periods ending after September 15, 2009. The Company adopted ASC Topic 105 in the third quarter of 2009 and, accordingly, updated GAAP references are to the Codification. The Codification is not intended to change or alter existing GAAP and adoption of the Codification had no impact on our consolidated financial position or results of operations.
In June 2009, the FASB amended ASC Subtopic 810-10, Consolidation. The amendments (1) require an enterprise to perform an analysis to determine whether the enterprise’s variable interest or interests give it a controlling financial interest in a variable interest entity (which would result in the enterprise being deemed the primary beneficiary of that entity and, therefore, obligated to consolidate the variable interest entity in its financial statements); (2) require ongoing reassessments of whether an enterprise is the primary beneficiary of a variable interest entity; (3) revise guidance for determining whether an entity is a variable interest entity; and (4) require enhanced disclosures that will provide more transparent information about an enterprise’s involvement with a variable interest entity. The Subtopic is effective for the first annual reporting period beginning after November 15, 2009 and for interim periods within that first annual reporting period. The Company is currently evaluating the impact of this standard on its consolidated financial statements.
In May 2009, the FASB issued ASC Subtopic 855-10, Subsequent Events, which provides general standards of accounting for and disclosure of subsequent events. ASC Subtopic 855-10 clarifies that public companies must evaluate, as of each reporting period (i.e. interim and annual), events or transactions that occur after the balance sheet date through the date that the financial statements are issued. It also requires public companies to disclose the date through which subsequent events have been evaluated and whether that is the date on which the financial statements were issued. ASC Subtopic 855-10 became effective prospectively for interim or annual financial periods ending after June 15, 2009. The Company adopted ASC Subtopic 855-10 in the second quarter of 2009 (see Note 21 to the consolidated financial statements included in this report).
27
Table of Contents
In April 2009, the FASB amended ASC Subtopic 825-10, Financial Instruments, which requires quarterly disclosure of information about the fair value of financial instruments. The Company adopted ASC Subtopic 825-10 effective as of the second quarter of 2009.
In December 2008, the FASB amended ASC Subtopic 715-20, Compensation—Retirement Benefits: Defined Benefit. ASC Subtopic 715-20, as so amended, requires employers to disclose information about fair value measurements of plan assets that are similar to the disclosures about fair value measurements required by ASC Subtopic 820-10, Fair Value Measurements and Disclosures. The Company adopted ASC Subtopic 715-20 with respect to the Company’s annual financial statements for 2009.
In March 2008, the FASB issued ASC Subtopic 815-10, Derivatives and Hedging. This subtopic requires enhanced disclosures about (i) how and why the Company uses derivative instruments, (ii) how the Company accounts for derivative instruments and related hedged items under Subtopic 815-20, Derivatives and Hedging: Hedging, and (iii) how derivative instruments and related hedged items affect the Company’s financial results. The Company adopted this subtopic on January 1, 2009. See Note 3 to the consolidated financial statements included in this report for additional information regarding the Company’s risk management activities, including use of derivative instruments and hedging activities.
In December 2007, the FASB revised ASC Topic 805, Business Combinations. The revised Topic requires use of the acquisition method of accounting, defines the acquirer as the entity that obtains control of one or more businesses in the business combination, establishes the acquisition date as the date the acquirer obtains control and broadens the scope of the Topic to all transactions and other events in which one entity obtains control over one or more other businesses. The Company adopted ASC Topic 805 on January 1, 2009 and the Topic did not have an impact on the Company’s consolidated financial statements.
RESULTS OF OPERATIONS FOR THE YEARS ENDED DECEMBER 31, 2009, 2008 AND 2007
The discussion of results of operations at the consolidated level presented below is followed by a more detailed discussion of results of operations by segment. The discussion of the Company’s consolidated results of operations and segment operating results is presented on a historical basis for the years ending December 31, 2009, 2008, and 2007. The segment discussion also addresses certain product line information. The Company’s reporting units are consistent with its reportable segments.
Consolidated results
2009 compared to 2008
Net Sales
Net sales for the year ended December 31, 2009 were $2,520.9 million, $98.5 million or approximately 4% above 2008 net sales. Foreign exchange rate fluctuations reduced sales in 2009 by 2%. Of the increase, approximately 2% is due to sales in the first half of 2009 of products acquired in connection with the July 2008 Orajel Acquisition. The balance of the increase in net sales is due primarily to higher prices and improved sales mix of approximately 3% and higher volumes of approximately 2%. These factors were offset in part by the reduction in sales resulting from the divestiture in the first quarter of 2008 of Brotherton Speciality Products Ltd. (“Brotherton”), a former United Kingdom subsidiary that was included in the Company’s Specialty Products Division, the third quarter 2009 divestiture of certain non-core product lines acquired in the Orajel Acquisition and the third quarter 2008 divestiture of the Company’s consumer products subsidiary in Spain.
Operating Costs
The Company’s gross profit was $1,101.0 million in 2009, a $129.3 million increase as compared to 2008. Gross margin increased 360 basis points to 43.7% as compared to 40.1% in 2008. The increase in gross margin reflects lower commodity costs, the impact of price increases instituted in 2008, the benefits of cost reduction
28
Table of Contents
programs and the higher margins associated with sales of products related to the Orajel Acquisition. The gross profit increase was partially offset by increased costs related to the planned closing of the Company’s North Brunswick, New Jersey manufacturing and warehousing facility, a fixed asset impairment charge of $6.9 million at an international subsidiary in 2009, and the impact of foreign exchange rate fluctuations.
Marketing expenses for 2009 were $353.6 million, an increase of $59.5 million or 20% as compared to 2008. The increased marketing spending included expenditures in support of ARM & HAMMER liquid laundry detergent, OXICLEAN powder and liquid laundry additives, TROJAN condoms and vibrating products, SPINBRUSH battery-operated toothbrushes, ARM & HAMMER baking soda and ARM & HAMMER DENTAL CARE, and expenditures for products acquired in the Orajel Acquisition, partially offset by the effect of foreign exchange rates.
Selling, general and administrative expenses (“SG&A”) were $354.5 million in 2009, an increase of $17.3 million as compared to 2008. The increase in SG&A in 2009 reflects increases in compensation and information systems costs, as well as higher amortization and operating costs related to the Orajel Acquisition, partially offset by lower international costs due in part to favorable foreign exchange rate fluctuations. In addition, 2008 SG&A reflected charges related to the divestiture of the Spain subsidiary and the associated asset impairment charges of $5.7 million, offset by the $3.0 million gain on the divestiture of Brotherton.
The consolidated statement of income for 2009 reflects the $20.0 million pre-tax gain, net of legal expenses, recognized by the Company in connection with the settlement of its litigation against Abbott Laboratories (see Note 18 to the consolidated financial statements included in this report for further information).
Other Income and Expenses
In 2009, equity in earnings of affiliates was $12.1 million as compared to $11.3 million in 2008. The changes primarily reflect improved profitability of Armand Products Company.
Other income was approximately $1.5 million in 2009 as compared to other expense of $3.2 million in 2008. The changes in both years principally reflect foreign exchange rate fluctuations.
Interest expense for 2009 decreased $11.4 million compared to 2008. The decline was due to lower interest rates compared to the prior year. Investment earnings of $1.3 million were lower due to a significant decline in interest rates.
Taxation
The 2009 tax rate was 37.9% as compared to 36.7% in 2008. The 2009 tax rate reflects higher U.S. taxable income, which carries a higher effective tax rate than our foreign entities. The 2008 tax rate reflects a tax benefit of $4.0 million related to the divestiture of the subsidiary in Spain, partially offset by non-deductible losses in Company owned life insurance.
Consolidated results
2008 compared to 2007
Net Sales
Net Sales for the year ended December 31, 2008 were $2,422.4 million, an increase of $201.5 million or 9.1% above 2007 net sales. Of the increase, 1.6% is due to sales of products acquired in the Orajel Acquisition, partially offset by the loss of sales due to the divestiture in the first quarter of 2008 of Brotherton Speciality Products, Ltd. (“Brotherton”), a United Kingdom Specialty Products subsidiary and the third quarter 2008 divestiture of the Company’s consumer products subsidiary in Spain. Foreign exchange did not have a material impact for the full 2008 year. The remainder of the increase is approximately equally attributable to higher volumes and higher selling prices.
29
Table of Contents
Operating Costs
The Company’s gross profit was $971.7 million during 2008, a $103.8 million increase as compared to 2007. Gross margin increased 100 basis points to 40.1% as compared to 39.1% in 2007. The increase in gross margin reflects price increases, cost reduction programs, the effect of the liquid laundry detergent concentration, the higher margins associated with the sales of products relating to the Orajel Acquisition, and the completion of the manufacturing synergies relating to the businesses acquired from Orange Glo International, Inc. (“OGI”) in 2006. These factors were partially offset by higher commodity costs and hedging losses due to declining diesel prices. In addition, the gross profit increase was partially offset by $10.2 million related to the decision to close an existing manufacturing facility (see Note 10 to the consolidated financial statements included in this report).
Marketing expenses for 2008 were $294.1 million, an increase of $37.4 million as compared to 2007. The increase principally was directed to acquired businesses and certain household products.
Selling, general and administrative expenses (“SG&A”) for 2008 were $337.3 million, an increase of $31.1 million as compared to 2007, but unchanged as a percent of net sales. The primary reasons for the increase in SG&A were operating expenses related to the Orajel Acquisition, $5.7 million of tradename impairment charges, exit costs associated with selling the Company’s subsidiary in Spain, higher legal costs including litigation against Abbott Laboratories (see Note 18 of the notes to the consolidated financial statements included in this report), higher research and development costs in support of new products and higher selling expenses in support of higher sales. The current year increase was partially offset by the $3.0 million gain recorded on the divestiture of Brotherton. The prior year results include a $3.3 million gain on the sale of certain property owned by the Company’s Canadian subsidiary and intangible asset impairment charges of $4.2 million.
Other Income and Expenses
In 2008, equity in earnings of affiliates was $11.3 million as compared to $8.2 million in 2007, primarily associated with improved profitability of Armand Products.
Other expense was approximately $3.2 million in 2008 as compared to other income of $2.5 million in 2007. The changes in both years principally reflect foreign exchange rate fluctuations.
Interest expense in 2008 decreased by $11.9 million as compared to 2007. The decline was due to lower interest rates and lower average debt outstanding compared to the prior year. In July 2008, the Company incurred additional indebtedness as a result of the Orajel Acquisition; however, this indebtedness was offset by reductions in indebtedness resulting from the conversion of all but a nominal amount of the Company’s convertible debt into common stock in the third quarter of 2008, the reduction of most of the outstanding amounts under of the Company’s accounts receivable securitization facility and mandatory repayments under the Company’s term loan.
Taxation
The 2008 tax rate was 36.7% as compared to 36.2% in 2007. The 2008 tax rate reflects higher U.S. taxable income, a higher state tax rate and non-deductible losses in Company owned life insurance, partially offset by a tax benefit of $4.0 million related to the divestiture of the subsidiary in Spain. The 2007 tax rate reflects a charge of $3.2 million, relating to a valuation allowance on deferred tax assets for one of the Company’s foreign subsidiaries and also reflects a $1.8 million benefit due to the reduction of tax liabilities in the U.K. and Australia.
30
Table of Contents
Segment results for 2009, 2008 and 2007
The Company operates three reportable segments: Consumer Domestic, Consumer International and Specialty Products Division (“SPD”). These segments are determined based on differences in the nature of products and organizational and ownership structures. The Company also has a Corporate segment.
| Segment |
Products | |
| Consumer Domestic | Household and personal care products | |
| Consumer International | Primarily personal care products | |
| SPD | Specialty chemical products | |
The Corporate segment income consists of equity in earnings of affiliates. The Company had 50% ownership interests in Armand Products Company (“Armand”) and The ArmaKleen Company (“ArmaKleen”) as of December 31, 2009. The Company’s 50% ownership interest in Esseco U.K. LLP (“Esseco”) was divested in the first quarter of 2008 as part of the sale of Brotherton. The Company’s equity in earnings of Armand and ArmaKleen for the twelve months ended December 31, 2009 and December 31, 2008, and Esseco for the two months ended February 29, 2008 (prior to the sale of Brotherton), is included in the Corporate segment.
Some of the subsidiaries that are included in the Consumer International segment manufacture and sell personal care products to the Consumer Domestic segment. These sales are eliminated from the Consumer International segment results set forth below.
The domestic results of operations for the OGI business and the businesses acquired in the Orajel Acquisition are included in the Consumer Domestic segment. The results of operations for the foreign operations of the OGI business and the businesses acquired in the Orajel Acquisition are included in the Consumer International segment. Segment sales and income before taxes and minority interest for each of the three years ended December 31, 2009, 2008 and 2007 were as follows:
| (In thousands) |
Consumer Domestic |
Consumer International(3) |
SPD | Corporate | Total | ||||||||||
| Net Sales(1) |
|||||||||||||||
| 2009 |
$ | 1,881,748 | $ | 393,696 | $ | 245,478 | $ | — | $ | 2,520,922 | |||||
| 2008 |
1,716,801 | 420,192 | 285,405 | — | 2,422,398 | ||||||||||
| 2007 |
1,563,895 | 398,521 | 258,524 | — | 2,220,940 | ||||||||||
| Income Before Income Taxes(2) |
|||||||||||||||
| 2009 |
$ | 325,633 | $ | 38,562 | $ | 15,991 | $ | 12,050 | $ | 392,236 | |||||
| 2008 |
236,956 | 34,635 | 25,335 | 11,334 | 308,260 | ||||||||||
| 2007 |
205,688 | 34,656 | 16,351 | 8,236 | 264,931 | ||||||||||
| (1) | Intersegment sales from Consumer International to Consumer Domestic, which are not reflected in the table, were $3.0 million, $5.2 million and $5.0 million for the years ended December 31, 2009, December 31, 2008 and December 31, 2007, respectively. |
| (2) | In determining Income before Income Taxes, interest expense, investment earnings, and other income (expense) were allocated among the segments based upon each segment’s relative operating profit. |
| (3) | As of January 1, 2008, the Company modified its organizational structure, resulting in a change in classification of certain Consumer Domestic export sales to Consumer International. Therefore, 2007 results have been restated to reflect a reclassification in sales of $10.2 million for the twelve months ended December 31, 2007, from the Consumer Domestic segment to the Consumer International segment. In addition, Income before Income Taxes of $1.5 million for the twelve months ended December 31, 2007, has been reclassified from the Consumer Domestic segment to the Consumer International segment. |
31
Table of Contents
Product line revenues for external customers for the years ended December 31, 2009, 2008 and 2007 were as follows:
| (In thousands) |
2009 | 2008 | 2007 | ||||||
| Household Products |
$ | 1,196,474 | $ | 1,081,440 | $ | 991,141 | |||
| Personal Care Products |
685,274 | 635,361 | 572,754 | ||||||
| Total Consumer Domestic |
1,881,748 | 1,716,801 | 1,563,895 | ||||||
| Total Consumer International |
393,696 | 420,192 | 398,521 | ||||||
| Total SPD |
245,478 | 285,405 | 258,524 | ||||||
| Total Consolidated Net Sales |
$ | 2,520,922 | $ | 2,422,398 | $ | 2,220,940 | |||
Consumer Domestic
2009 compared to 2008
Consumer Domestic net sales in 2009 were $1,881.7 million, an increase of $164.9 million or 9.6% compared to net sales of $1,716.8 million in 2008. Of the increase, approximately 2% reflects first half of 2009 sales of products acquired in connection with the July 2008 Orajel Acquisition. The increase also is attributable to higher volumes and higher prices and improved sales mix. At a product line level, sales of XTRA liquid laundry detergent, ARM & HAMMER liquid laundry detergent, OXICLEAN laundry additive, ARM & HAMMER SUPER SCOOP cat litter and ARM & HAMMER powder laundry detergent were all higher than in 2008. The higher prices are principally a result of the May 2008 price increase on ARM & HAMMER powder laundry detergent and the October 2008 price increase on liquid laundry detergents, toothpaste and battery-operated toothbrushes.
Consumer Domestic Income before Income Taxes for 2009 was $325.6 million, an $88.6 million increase as compared to 2008. The 2009 increase is due to higher profits relating to higher net sales, lower commodity costs, the $20.0 million gain, net of legal expenses, recognized by the Company in connection with the settlement of its litigation against Abbott Laboratories (see Note 18 to the consolidated financial statements included in this report), and lower allocated interest expense, partially offset by accelerated depreciation and other expenses associated with the Company’s 2009 shutdown of its North Brunswick, New Jersey facility (see Note 10 to the consolidated financial statements included in this report), and increased marketing and SG&A costs. In addition, the results for 2009 also reflect the incremental effect of the Orajel acquisition, which occurred in July 2008.
2008 compared to 2007
Consumer Domestic net sales in 2008 were $1,716.8 million, an increase of $152.9 million or 9.8% as compared to 2007 sales of $1,563.9 million. Of the increase, approximately 3% relates to sales of products acquired in the Orajel Acquisition, with the remainder mostly attributable to higher unit volumes and the balance due to higher prices. At a product line level, sales of XTRA liquid laundry detergent, ARM & HAMMER liquid laundry detergent, OXICLEAN laundry additive, ARM & HAMMER powder laundry detergent and ARM & HAMMER SUPER SCOOP cat litter were all higher than in 2007. Consumer Domestic net sales also benefited from February 2008 price increases on condoms and baking soda and the May 2008 price increases on ARM & HAMMER powder laundry detergent. The Company also implemented several price increases in the United States during the fourth quarter of 2008, including ARM & HAMMER Liquid Laundry Detergent, XTRA Liquid Laundry Detergent, OXICLEAN Powder, SPINBRUSH and ARM & HAMMER Dental Care. These increases were partially offset by lower sales of KABOOM household cleaner, certain toothpaste brands and antiperspirants.
Consumer Domestic Income before Income Taxes for 2008 was $237.0 million, a $31.3 million increase as compared to 2007. The impact of higher net sales, synergies related to the manufacturing integration of the OGI business, the shift to concentrated liquid laundry detergent, the Orajel Acquisition and lower allocated interest
32
Table of Contents
expense, was partially offset by accelerated depreciation and other expenses associated with the Company’s planned 2009 shutdown of its North Brunswick New Jersey facility (see Note 10 to the consolidated financial statements included in this report), higher commodity, marketing and SG&A costs and hedging losses due to declining diesel prices.
Consumer International
2009 compared to 2008
Consumer International net sales in 2009 were $393.7 million, a decrease of $26.5 million or 6.3% as compared to 2008. This decrease reflects the approximately 10% impact of unfavorable foreign exchange rate fluctuations, and approximately 2% due to the divestiture of the Company’s subsidiary in Spain. This decline was partially offset by higher volumes, higher prices and improved sales mix in Canada, Australia, the United Kingdom, Mexico and Brazil, and increased U.S. exports.
Consumer International income before income taxes was $38.6 million in 2009, an increase of $3.9 million compared to 2008. This increase is due to higher income associated with higher unit volume and favorable sales mix partially offset by higher marketing and SG&A expenses and the effect of foreign exchange rate fluctuations. In addition, 2008 income before income taxes reflected charges related to the sale of the subsidiary in Spain.
2008 compared to 2007
Consumer International net sales were $420.2 million in 2008, an increase of $21.7 million or approximately 5.4% as compared to 2007. The increase includes the impact of favorable foreign exchange rates of 1.5%, higher unit volumes in Canada, England, Australia and higher U.S. exports, partially offset by lower sales in France and the impact of divesting the subsidiary in Spain.
Consumer International Income before Income Taxes was $34.6 million in 2008, unchanged as compared to 2007. Offsetting the favorable net sales performance and lower allocated interest expense were asset impairment charges of $5.9 million, severance and contract termination costs in one of the Company’s European subsidiaries, increased tradename amortization expense as a result of the recharacterization of certain indefinite lived assets to finite lived assets (see Note 5 to the consolidated financial statements included in this report) and the $3.5 million pre-tax loss on the sale of the Company’s Spanish subsidiary in 2008. In addition, 2007 reflects a gain of $3.3 million on the sale of certain property owned by the Company’s Canadian subsidiary.
Specialty Products
2009 compared to 2008
Specialty Products net sales were $245.5 million for 2009, a decrease of $39.9 million, or 14.0% as compared to 2008. Volumes declined in the animal nutrition business primarily due to the continued lower U.S. milk prices which has depressed the dairy market, thus reducing the cash flow of dairy farmers. The decrease in net sales also reflects the approximately 2% impact of unfavorable foreign exchange rate fluctuations, as well as the impact of the sale of Brotherton during the first quarter of 2008. These factors were partially offset by higher prices and favorable sales mix of approximately 7% primarily of certain specialty chemical products.
Specialty Products Income before Income Taxes for 2009 was $16.0 million, a decrease of $9.3 million as compared to 2008. The decline in income in 2009 reflects the asset impairment charge and environmental remediation charge at one of the Company’s international subsidiaries totaling approximately $9.9 million, and lower income due to lower volumes. The results for 2008 included a $3.0 million gain associated with the sale of Brotherton.
33
Table of Contents
2008 compared to 2007
Specialty Products net sales were $285.4 million in 2008, an increase of $26.9 million or 10.4% as compared to 2007. This increase is principally due to higher prices. The animal nutrition sales increase also reflects a pricing surcharge on certain products first applied during 2007 to recover extraordinary cost increases for a key raw material. Partially offsetting the sales increase was the impact of divesting the Company’s Brotherton subsidiary.
Specialty Products Income before Income Taxes was $25.3 million in the 2008, an increase of $9.0 million as compared to 2007. The increase is principally the result of profits on higher net sales and the $3.0 million gain on the sale of Brotherton, partially offset by higher raw material costs for certain animal nutrition and specialty chemical products and higher SG&A.
Liquidity and capital resources
As of December 31, 2009, the Company had $447.1 million in cash, $85.0 million available through its $115.0 million accounts receivable securitization facility, approximately $96 million available under its $100.0 million revolving credit facility and a $250.0 million accordion feature that enables the Company to increase the principal amount of its term loan. To enhance the safety of its cash resources, the Company invests its cash primarily in government agency money market funds.
The Company renewed its accounts receivable securitization facility in February 2010. This facility has been renewed annually in the past, and the Company anticipates that this facility will be renewed in February 2011.
The Company believes that its ability to access the sources of cash described above has not been adversely affected by recent economic events. Therefore, the Company currently does not anticipate that the credit environment will have a material adverse effect on its ability to address its current and forecasted liquidity requirements. The Company anticipates that its cash from operations, along with its current borrowing capacity, will be sufficient to meet its capital expenditure program costs, mandatory debt repayment schedule of $184.1 million in 2010, and minimum pension funding requirements, including funding for the anticipated termination of the domestic plan (discussed under—“Significant Accounting Policies and Estimates—Valuation of Pension and Postretirement Benefit Costs”), over the next twelve months and pay its common stock dividend at its current rate. On July 29, 2009, the Company’s Board of Directors declared an increase in the regular quarterly dividend from $0.09 to $0.14 per share, equivalent to an annual dividend of $0.56 per share. The higher dividend raised the Company’s annualized dividend payments from $25 million to $39 million.
The current economic environment presents risks that could have adverse consequences on the Company’s liquidity. (See “Economic conditions could adversely affect our business” under “Risk Factors” in Item 1A.) However, the Company does not currently anticipate that the potential adverse developments addressed in those risk factors will occur. In addition, the Company does not anticipate that current economic conditions will adversely affect its ability to comply with the financial covenants in its principal credit facilities because the Company currently is, and anticipates that it will continue to be, in compliance with the minimum interest coverage ratio requirement and the maximum leverage ratio requirement. These ratios are discussed in more detail in this section under “Adjusted EBITDA.”
Net Debt
The Company had outstanding total debt of $816.3 million and cash of $447.1 million (of which approximately $75.9 million resides in foreign subsidiaries) at December 31, 2009. Total debt less cash (“net debt”) was $369.2 million at December 31, 2009. This compares to total debt of $856.1 million and cash of $198.0 million, resulting in net debt of $658.1 million at December 31, 2008.
34
Table of Contents
Cash Flow Analysis
| (In thousands) |
Year Ending December 31, | |||||||||||
| 2009 | 2008 | 2007 | ||||||||||
| Net cash provided by operating activities |
$ | 400,949 | $ | 336,167 | $ | 248,677 | ||||||
| Net cash (used in) investing activities |
$ | (104,140 | ) | $ | (466,161 | ) | $ | (42,522 | ) | |||
| Net cash (used in) provided by financing activities |
$ | (58,315 | ) | $ | 87,222 | $ | (73,619 | ) | ||||
Net Cash Provided by Operating Activities—The Company’s net cash provided by operating activities in 2009 increased $64.8 million to $401.0 million as compared to 2008. The increase was primarily due to higher net income, higher deferred income taxes, higher depreciation and non-cash compensation expense, and favorable changes in working capital (exclusive of cash), and higher equity earnings from affiliates. In addition, cash flow from operations in 2008 was reduced by the gain recorded on the sale of Brotherton (see Note 9).
For the year ended December 31, 2009, the components of working capital that significantly affected operating cash flow are as follows:
Accounts receivable decreased $6.2 million due to the timing of cash receipts.
Inventories increased $10.6 million primarily to support higher anticipated sales and a temporary increase due to the start-up of the York, Pennsylvania plant.
Accounts payable and other accrued expenses increased $12.7 million primarily due to higher accruals for marketing expenditures, incentive and profit sharing compensation, and exit costs associated with the North Brunswick facility.
Income taxes payable increased $17.4 million due to higher tax expense associated with increased earnings and the timing of payments.
Other liabilities increased $10.0 million due to additional deferred compensation and the appreciation in value of participant account balances relating to compensation previously deferred.
Net Cash Used in Investing Activities—Net cash used in investing activities during 2009 was $104.1 million, reflecting $135.4 million of property, plant and equipment expenditures (including approximately $85 million for the York, Pennsylvania facility, discussed in the following paragraph), partially offset by approximately $30.1 million of proceeds received from the sale of certain personal care product lines initially acquired in the Orajel Acquisition and a $1.3 million payment received on an outstanding note receivable.
In the fourth quarter of 2009, the Company completed construction of its integrated laundry detergent manufacturing plant and distribution center in York, Pennsylvania. In conjunction with the opening of the new facility, the Company closed its existing laundry detergent manufacturing plant and distribution facility in North Brunswick, New Jersey. The North Brunswick facility was comprised of five separate buildings, which had resulted in significant inefficiencies and could not accommodate expansion to address expected future growth. Capital expenditures to build the York plant and distribution center, were $51 million in 2008 and $85 million in 2009.
Net Cash Used in Financing Activities—Net cash used in financing activities during 2009 was $58.3 million. This reflects a net decrease in debt of $40.6 million resulting from mandatory payments on the Term Loan of $71.5 million and payments of cash dividends of $32.3 million. These cash decreases were partially offset by an increase in short term borrowings of $29.0 million associated with the Company’s accounts receivable securitization facility, and proceeds of and tax benefits from stock option exercises aggregating $15.0 million. See “Market Risk” below for management’s discussion of interest rate risk.
35
Table of Contents
The Company called for redemption on August 15, 2008 (the “Redemption Date”) all of its outstanding 5.25% Senior Convertible Debentures due 2033 (the “Debentures”) at 101.50% of the principal amount of the Debentures plus accrued and unpaid interest to the Redemption Date. In lieu of surrendering the Debentures for cash redemption, holders could elect to convert their Debentures into shares of the Company’s common stock at the conversion rate of 32.26 shares of the Company’s common stock per $1,000 principal amount of Debentures (equivalent to a conversion price of $31.00 per share). Holders of $99.9 million principal amount of the Debentures that were outstanding when the Debentures were called for redemption converted their Debentures into 3,222,293 shares of Company common stock, and on the Redemption Date, the Company redeemed the remaining nominal principal amount of Debentures for cash.
On December 23, 2005, the Company entered into an amended and restated credit agreement (the “Credit Agreement”) with a number of banks and other financial institutions. The Credit Agreement initially provided for a five year term loan in a principal amount of $300.0 million, subject to an increase by up to an additional $250.0 million through an accordion feature upon the satisfaction of certain conditions, and continued, until May 2009, the existing multi-currency revolving credit and letter of credit facility in an aggregate principal amount of up to $100.0 million (the “Revolving Credit”.) On August 7, 2006, the Credit Agreement was amended and increased by $250.0 million, which the Company used to fund the acquisition of the OGI business while maintaining the $250 million accordion feature. On June 3, 2008, the Company again amended its Credit Agreement, increasing the principal amount by $250 million, which was used to fund the Orajel Acquisition, while maintaining the $250 million accordion feature. Other matters addressed in the June 2008 amendment included, among other things, an extension of the term of the Revolving Credit from May 28, 2009 to August 31, 2012, and addition of other capital expenditure related provisions associated with the new plant construction in York, Pennsylvania. Specifically, permitted annual capital expenditures were $100.0 million in 2008 and $200.0 million in 2009, and are $100.0 million, thereafter. The obligations of the Company under the Credit Agreement are secured by substantially all of the assets of the Company. The term loan and the Revolving Credit bear interest under one of two rate options, selected by the Company, equal to (a) either (i) a eurocurrency rate (adjusted for any reserve requirements) (“Eurocurrency Rate”) or (ii) the greater of the prime rate, the secondary market rate for three-month certificates of deposit (adjusted for any reserve requirements) plus the applicable FDIC assessment rate plus 1.0%, or the federal funds effective rate plus 0.5% (“Alternate Base Rate”), plus (b) an applicable margin. On the closing date of the June 2008 amendment, and at December 31, 2009, the applicable margin was (a) 0.75% for the Eurocurrency rate and (b) 0% for the alternate rate. The Company’s Revolving Credit is available for general corporate purposes. See Note 12 to the consolidated financial statement for additional information.
Adjusted EBITDA
Adjusted EBITDA is a component of the financial covenants contained in, and is defined in, the Credit Agreement. Financial covenants include a leverage ratio (total debt to Adjusted EBITDA) and an interest coverage ratio (Adjusted EBITDA to total interest expense), which if not met, could result in an event of default and trigger the early termination of the Credit Agreement. Adjusted EBITDA may not be comparable to similarly titled measures used by other entities and should not be considered as an alternative to cash flows from operating activities, which is determined in accordance with accounting principles generally accepted in the United States. The leverage ratio during the twelve months ended December 31, 2009 was 1.6, which is below the maximum of 3.25 permitted under the Credit Agreement, and the interest coverage ratio for the twelve months ending December 31, 2009 was 14.3, which is above the minimum of 3.0 permitted under the Credit Agreement. The Company’s obligations under the Credit Agreement are secured by substantially all of the assets of the Company.
36
Table of Contents
The reconciliation of Net Cash Provided by Operating Activities (the most directly comparable GAAP financial measure) to Adjusted EBITDA for 2009 is as follows:
| (In millions) |
||||
| Net Cash Provided by Operating Activities |
$ | 400.9 | ||
| Interest Expense |
35.6 | |||
| Current Income Tax Provision |
125.6 | |||
| Excess Tax Benefit on Stock Options Exercised |
5.0 | |||
| Change in Working Capital and Other Liabilities |
(35.4 | ) | ||
| Investment Income |
(1.3 | ) | ||
| Patent litigation settlement, net |
(20.0 | ) | ||
| Other |
(1.7 | ) | ||
| Adjusted EBITDA (per Credit Agreement) |
$ | 508.6 | ||
Commitments as of December 31, 2009
The table below summarizes the Company’s material contractual obligations and commitments as of December 31, 2009.
| (In thousands) |
Payments Due by Period | ||||||||||||||
| Total | 2010 | 2011 to 2012 |
2013 to 2014 |
After 2014 | |||||||||||
| Short & Long-Term Debt |
|||||||||||||||
| Syndicated Financing Loans |
$ | 531,402 | $ | 184,054 | $ | 347,348 | $ | — | $ | — | |||||
| Senior Subordinated Notes |
250,000 | — | 250,000 | — | — | ||||||||||
| Securitization of A/R Facility |
30,000 | 30,000 | — | — | — | ||||||||||
| Debt due to International Banks |
4,895 | 4,895 | — | — | — | ||||||||||
| 816,297 | 218,949 | 597,348 | — | — | |||||||||||
| Interest on Fixed Rate Debt(1) |
45,000 | 15,000 | 30,000 | — | — | ||||||||||
| Interest Rate Hedges(2) |
9,340 | 5,640 | 3,700 | — | — | ||||||||||
| Operating Lease Obligations |
93,692 | 21,673 | 30,551 | 17,934 | 23,534 | ||||||||||
| Other Long-Term Liabilities |
|||||||||||||||
| Letters of Credit and Performance Bonds(3) |
3,811 | 3,811 | — | — | — | ||||||||||
| Pension Contributions(4) |
1,800 | 1,800 | — | — | — | ||||||||||
| Purchase Obligations(5) |
106,250 | 58,652 | 46,074 | 1,524 | — | ||||||||||
| Total |
$ | 1,076,190 | $ | 325,525 | $ | 707,673 | $ | 19,458 | $ | 23,534 | |||||
| (1) | Represents interest on the Company’s 6% senior subordinated notes due in 2012. The Company did not include interest expense on its variable rate debt as it cannot predict future interest rates. |
| (2) | Represents the payments required on the Company’s interest rate swap and the floor of the Company’s interest rate collar. |
| (3) | Letters of credit with several banks guarantee payment for items such as insurance claims in the event of the Company’s insolvency and one year of rent on a warehouse. Performance Bonds are principally for required municipal property improvements. |
| (4) | Pension contributions are based on actuarial assessments of government regulated employer funding requirements per plan. These requirements are not projected beyond one year since they fluctuate with the change in plan assets, assumptions and demographics. The funding requirements for the planned termination of the domestic pension plan are not estimable at this time. |
| (5) | The Company has outstanding purchase obligations with suppliers at the end of 2009 for raw, packaging and other materials and services in the normal course of business. These purchase obligation amounts represent only those items which are based on agreements that are enforceable and legally binding and do not represent total anticipated purchases. |
37
Table of Contents
The Company has excluded from the table above uncertain tax liabilities as defined in ASC Subtopic 740-10, Income Taxes due to the uncertainty of the amount per period of payment. As of December 31, 2009, the Company has gross uncertain tax liabilities, including interest, of $46.4 million (see Note 13 to the consolidated financial statements included in this report).
Off-Balance Sheet Arrangements
The Company does not have off-balance sheet financing or unconsolidated special purpose entities.
OTHER ITEMS
Market risk
Concentration of Risk
In each of the years ended December 31, 2009, 2008 and 2007, net sales to the Company’s largest customer, Wal-Mart Stores, Inc. and its affiliates were 22% of the Company’s total consolidated net sales.
Interest Rate Risk
The Company had outstanding total debt at December 31, 2009 of $816.3 million, of which $250.0 million or 31% carries a fixed rate of interest. The remaining debt balance primarily is comprised of $531.4 million in term loans under the Company’s principal credit facilities, $30.0 million outstanding under a receivables purchase agreement and $4.9 million in international debt.
The Company entered into two cash flow hedge zero cost collar agreements, each covering a notional amount of $100.0 million, to reduce the impact of interest rate fluctuations on a portion of its term loan indebtedness. One agreement was effective as of September 29, 2006, and expires on September 31, 2011, and the other effective as of December 29, 2006, and expired on December 31, 2009. The hedge agreements each have a cap of 6.50% and a floor of 3.57%. The Company recorded a charge to interest expense of $5.5 million in 2009 with respect to the hedge agreements. The Company estimates it will recognize approximately $2.7 million in interest expense under the remaining hedge agreement in 2010. Changes in the fair value of the cash flow hedge agreement are recorded in Accumulated Other Comprehensive Income on the balance sheet. The Company has no immediate plans to replace the interest rate collar that matured on December 31, 2009.
In addition, the Company entered into interest rate swap hedge agreements covering a notional amount of $150.0 million, effective as of June 26, 2009, to reduce the impact of interest rate fluctuations on a portion of its term loan indebtedness. The interest rate swap hedge agreements have terms of two years and a fixed rate of 1.38%. The Company estimates it will recognize approximately $0.7 million in interest expense under the interest rate swap hedge agreements in 2010. Changes in the fair value of interest rate swap hedge agreements are recorded in Accumulated Other Comprehensive Income on the balance sheet. See Note 3 to the consolidated financial statements included in this report for additional information regarding the Company’s cash flow hedge zero cost collar and interest rate swap hedge agreements.
The weighted average interest rate on all Company borrowings at December 31, 2009, giving effect to the cash flow hedge zero cost collar and interest rate swap agreements and excluding deferred financing costs and commitment fees, was approximately 3.2%.
If the variable rate on the Company’s floating rate debt outstanding on December 31, 2009 were to change by 100 basis points from the December 31, 2009 level, annual interest expense associated with the floating rate debt would change by approximately $3.2 million.
38
Table of Contents
Diesel Fuel Hedge
The Company uses independent freight carriers to deliver its products. These carriers charge the Company a basic rate per mile that is subject to a mileage surcharge for diesel fuel price increases. In July 2008 and April 2009, in response to increasing fuel prices and a concomitant increase in mileage surcharges, the Company entered into agreements with two financial counterparties to hedge approximately 13% of its notional diesel fuel requirements for 2010. The Company uses the hedge agreements to mitigate the volatility of diesel fuel prices and related fuel surcharges, and not to speculate in the future price of diesel fuel. The hedge agreements are designed to add stability to the Company’s product costs, enabling the Company to make pricing decisions and lessen the economic impact of abrupt changes in diesel fuel prices over the term of the contract.
Because the diesel hedge agreements do not qualify for hedge accounting under ASC Subtopic 815-20, Derivatives and Hedging: Hedging—General, the Company is required to mark the agreements to market throughout the life of the agreements and record changes in fair value in the consolidated statement of income. The loss recorded, net of deferred taxes, as a result of changes in the fair value of the diesel fuel hedge agreements, was immaterial for the year ended December 31, 2009. If future diesel prices were to change by $0.10 per gallon, the impact on the 2010 earnings due to the hedge agreements would be approximately $0.2 million.
Foreign Currency
The Company is subject to exposure from fluctuations in foreign currency exchange rates, primarily U.S. Dollar/Euro, U.S. Dollar/British Pound, U.S. Dollar/Canadian Dollar, U.S. Dollar/Mexican Peso, U.S. Dollar/Australian Dollar, U.S. Dollar/Brazilian Real and U.S. Dollar/Chinese Yuan.
The Company, from time to time, enters into forward exchange contracts to hedge anticipated but not yet committed sales or purchases denominated in the U.S. Dollar, Canadian dollar, British pound and Euro. During the fourth quarter of 2008 and the twelve months of 2009, the Company’s Canadian subsidiary entered into forward exchange contracts to protect the Company from the risk that, due to changes in currency exchange rates, it would be adversely affected by net cash outflows. The last of the contracts expire by the end of August 2010. The notional amount of the unexpired contracts as of December 31, 2009 totaled U.S. $20.0 million. The contracts qualified for hedge accounting in accordance with ASC Subtopic 815-20, and therefore, changes in the fair value were marked to market and recorded as Other Comprehensive Income (Loss). The other comprehensive loss recorded, net of deferred taxes, as a result of changes in fair value of the forward exchange contracts, was approximately $0.7 million for the year ended December 31, 2009.
Equity Derivatives
The Company has entered into equity derivative contracts of its own stock in order to minimize the impact on earnings resulting from fluctuations in the liability to plan participants, as a result of changes in quoted fair values, with respect to contributions designated by the participants for notional investments in Company stock under the Company’s deferred compensation plan.
See Note 2 to the consolidated financial statements included in this report for additional information regarding the reported changes in fair values for derivative instruments.
| ITEM 7A. | QUANTITATIVE AND QUALITATIVE DISCLOSURES ABOUT MARKET RISK |
This information appears under the heading “Market Risk” in the “Management’s Discussion and Analysis” section. Refer to page 38 of this annual report on Form 10-K.
39
Table of Contents
| ITEM 8. | FINANCIAL STATEMENTS AND SUPPLEMENTARY DATA |
MANAGEMENT’S REPORT ON INTERNAL CONTROL OVER FINANCIAL REPORTING
Management of Church & Dwight Co., Inc (the “Company”) is responsible for establishing and maintaining adequate internal control over financial reporting. Internal control over financial reporting is a process designed to provide reasonable assurance regarding the reliability of financial reporting and the preparation of financial statements for external purposes in accordance with generally accepted accounting principles. A company’s internal control over financial reporting includes those policies and procedures that pertain to the maintenance of records that, in reasonable detail, accurately and fairly reflect the transactions and dispositions of the assets of the company; provide reasonable assurance that transactions are recorded as necessary to permit preparation of financial statements in accordance with generally accepted accounting principles, and that receipts and expenditures of the company are being made only in accordance with authorizations of management and directors of the company; and provide reasonable assurance regarding prevention or timely detection of unauthorized acquisition, use, or disposition of the company’s assets that could have a material effect on the financial statements.
Because of its inherent limitations, internal control over financial reporting may not prevent or detect misstatements. Also, projections of any evaluation of effectiveness to future periods are subject to the risk that controls may become inadequate because of changes in conditions, or that the degree of compliance with the policies or procedures may deteriorate.
Management evaluated the Company’s internal control over financial reporting as of December 31, 2009. In making this assessment, management used the framework established in Internal Control-Integrated Framework issued by the Committee of Sponsoring Organizations of the Treadway Commission (COSO). As a result of this assessment and based on the criteria in the COSO framework, management has concluded that, as of December 31, 2009, the Company’s internal control over financial reporting was effective.
The Company’s independent registered public accounting firm, Deloitte & Touche LLP, have audited the Company’s internal control over financial reporting. Their opinions on the effectiveness of the Company’s internal control over financial reporting and on the Company’s consolidated financial statements and financial statement schedules appear on pages 41 and 42 of this annual report on Form 10-K.
| /S/ JAMES R. CRAIGIE |
/S/ MATTHEW T. FARRELL | |||
| James R. Craigie | Matthew T. Farrell | |||
| Chairman and Chief Executive Officer | Chief Financial Officer |
February 24, 2010
40
Table of Contents
REPORT OF INDEPENDENT REGISTERED PUBLIC ACCOUNTING FIRM
To the Board of Directors and Stockholders of
Church & Dwight Co., Inc.
Princeton, New Jersey
We have audited the accompanying consolidated balance sheets of Church & Dwight Co., Inc. and subsidiaries (the “Company”) as of December 31, 2009 and 2008, and the related consolidated statements of income, stockholders’ equity, and cash flows for each of the three years in the period ended December 31, 2009. Our audits also included the financial statement schedule listed in the Index at Item 15. These financial statements and financial statement schedule are the responsibility of the Company’s management. Our responsibility is to express an opinion on the financial statements and financial statement schedule based on our audits.
We conducted our audits in accordance with the standards of the Public Company Accounting Oversight Board (United States). Those standards require that we plan and perform the audit to obtain reasonable assurance about whether the financial statements are free of material misstatement. An audit includes examining, on a test basis, evidence supporting the amounts and disclosures in the financial statements. An audit also includes assessing the accounting principles used and significant estimates made by management, as well as evaluating the overall financial statement presentation. We believe that our audits provide a reasonable basis for our opinion.
In our opinion, such consolidated financial statements present fairly, in all material respects, the financial position of Church & Dwight Co., Inc. and subsidiaries at December 31, 2009 and 2008, and the results of their operations and their cash flows for each of the three years in the period ended December 31, 2009, in conformity with accounting principles generally accepted in the United States of America. Also, in our opinion, such financial statement schedule, when considered in relation to the basic consolidated financial statements taken as a whole, presents fairly, in all material respects, the information set forth therein.
We have also audited, in accordance with the standards of the Public Company Accounting Oversight Board (United States), the Company’s internal control over financial reporting as of December 31, 2009, based on the criteria established in Internal Control—Integrated Framework issued by the Committee of Sponsoring Organizations of the Treadway Commission and our report dated February 24, 2010 expressed an unqualified opinion on the Company’s internal control over financial reporting.
Deloitte & Touche LLP
Parsippany, NJ
February 24, 2010
41
Table of Contents
REPORT OF INDEPENDENT REGISTERED PUBLIC ACCOUNTING FIRM
To the Board of Directors and Stockholders of
Church & Dwight Co., Inc.
Princeton, New Jersey
We have audited the internal control over financial reporting of Church & Dwight Co., Inc. and subsidiaries (the “Company”) as of December 31, 2009, based on criteria established in Internal Control—Integrated Framework issued by the Committee of Sponsoring Organizations of the Treadway Commission. The Company’s management is responsible for maintaining effective internal control over financial reporting and for its assessment of the effectiveness of internal control over financial reporting, included in the accompanying Management’s Report on Internal Control Over Financial Reporting. Our responsibility is to express an opinion on the Company’s internal control over financial reporting based on our audit.
We conducted our audit in accordance with the standards of the Public Company Accounting Oversight Board (United States). Those standards require that we plan and perform the audit to obtain reasonable assurance about whether effective internal control over financial reporting was maintained in all material respects. Our audit included obtaining an understanding of internal control over financial reporting, assessing the risk that a material weakness exists, testing and evaluating the design and operating effectiveness of internal control based on the assessed risk, and performing such other procedures as we considered necessary in the circumstances. We believe that our audit provides a reasonable basis for our opinion.
A company’s internal control over financial reporting is a process designed by, or under the supervision of, the company’s principal executive and principal financial officers, or persons performing similar functions, and effected by the company’s board of directors, management, and other personnel to provide reasonable assurance regarding the reliability of financial reporting and the preparation of financial statements for external purposes in accordance with generally accepted accounting principles. A company’s internal control over financial reporting includes those policies and procedures that (1) pertain to the maintenance of records that, in reasonable detail, accurately and fairly reflect the transactions and dispositions of the assets of the company; (2) provide reasonable assurance that transactions are recorded as necessary to permit preparation of financial statements in accordance with generally accepted accounting principles, and that receipts and expenditures of the company are being made only in accordance with authorizations of management and directors of the company; and (3) provide reasonable assurance regarding prevention or timely detection of unauthorized acquisition, use, or disposition of the company’s assets that could have a material effect on the financial statements.
Because of the inherent limitations of internal control over financial reporting, including the possibility of collusion or improper management override of controls, material misstatements due to error or fraud may not be prevented or detected on a timely basis. Also, projections of any evaluation of the effectiveness of the internal control over financial reporting to future periods are subject to the risk that the controls may become inadequate because of changes in conditions, or that the degree of compliance with the policies or procedures may deteriorate.
In our opinion, the Company maintained, in all material respects, effective internal control over financial reporting as of December 31, 2009, based on the criteria established in Internal Control—Integrated Framework issued by the Committee of Sponsoring Organizations of the Treadway Commission.
We have also audited, in accordance with the standards of the Public Company Accounting Oversight Board (United States), the consolidated financial statements and financial statement schedule as of and for the year ended December 31, 2009 of the Company and our report dated February 24, 2010 expressed an unqualified opinion on those financial statements and financial statement schedule.
Deloitte & Touche LLP
Parsippany, NJ
February 24, 2010
42
Table of Contents
CHURCH & DWIGHT CO., INC. AND SUBSIDIARIES
CONSOLIDATED STATEMENTS OF INCOME
| Year Ended December 31, | ||||||||||||
| (Dollars in thousands, except per share data) |
2009 | 2008 | 2007 | |||||||||
| Net Sales |
$ | 2,520,922 | $ | 2,422,398 | $ | 2,220,940 | ||||||
| Cost of sales |
1,419,932 | 1,450,680 | 1,353,042 | |||||||||
| Gross Profit |
1,100,990 | 971,718 | 867,898 | |||||||||
| Marketing expenses |
353,588 | 294,130 | 256,743 | |||||||||
| Selling, general and administrative expenses |
354,510 | 337,256 | 306,121 | |||||||||
| Patent litigation settlement, net |
(20,000 | ) | — | — | ||||||||
| Income from Operations |
412,892 | 340,332 | 305,034 | |||||||||
| Equity in earnings of affiliates |
12,050 | 11,334 | 8,236 | |||||||||
| Investment earnings |
1,325 | 6,747 | 8,084 | |||||||||
| Other income (expense), net |
1,537 | (3,208 | ) | 2,469 | ||||||||
| Interest expense |
(35,568 | ) | (46,945 | ) | (58,892 | ) | ||||||
| Income before Income Taxes |
392,236 | 308,260 | 264,931 | |||||||||
| Income taxes |
148,715 | 113,078 | 95,900 | |||||||||
| Net Income |
243,521 | 195,182 | 169,031 | |||||||||
| Noncontrolling interest |
(12 | ) | 8 | 6 | ||||||||
| Net Income attributable to Church & Dwight Co., Inc. |
$ | 243,533 | $ | 195,174 | $ | 169,025 | ||||||
| Weighted average shares outstanding—Basic |
70,379 | 67,870 | 65,840 | |||||||||
| Weighted average shares outstanding—Diluted |
71,477 | 71,116 | 70,312 | |||||||||
| Net income per share—Basic |
$ | 3.46 | $ | 2.88 | $ | 2.57 | ||||||
| Net income per share—Diluted |
$ | 3.41 | $ | 2.78 | $ | 2.46 | ||||||
| Cash dividends per share |
$ | 0.46 | $ | 0.34 | $ | 0.30 | ||||||
See Notes to Consolidated Financial Statements.
43
Table of Contents
CHURCH & DWIGHT CO., INC. AND SUBSIDIARIES
CONSOLIDATED BALANCE SHEETS
| (Dollars in thousands, except share and per share data) |
December 31, 2009 |
December 31, 2008 |
||||||
| Assets |
||||||||
| Current Assets |
||||||||
| Cash and cash equivalents |
$ | 447,143 | $ | 197,999 | ||||
| Accounts receivable, less allowances of $5,782 and $5,427 |
222,158 | 211,194 | ||||||
| Inventories |
216,870 | 198,893 | ||||||
| Deferred income taxes |
20,432 | 15,107 | ||||||
| Prepaid expenses |
11,444 | 10,234 | ||||||
| Other current assets |
10,218 | 31,694 | ||||||
| Total Current Assets |
928,265 | 665,121 | ||||||
| Property, Plant and Equipment, Net |
455,636 | 384,519 | ||||||
| Equity Investment in Affiliates |
12,815 | 10,061 | ||||||
| Tradenames and Other Intangibles |
794,891 | 810,173 | ||||||
| Goodwill |
838,078 | 845,230 | ||||||
| Other Assets |
88,761 | 86,334 | ||||||
| Total Assets |
$ | 3,118,446 | $ | 2,801,438 | ||||
| Liabilities and Stockholders’ Equity |
||||||||
| Current Liabilities |
||||||||
| Short-term borrowings |
$ | 34,895 | $ | 3,248 | ||||
| Accounts payable and accrued expenses |
332,450 | 310,622 | ||||||
| Current portion of long-term debt |
184,054 | 71,491 | ||||||
| Income taxes payable |
15,633 | 1,760 | ||||||
| Total Current Liabilities |
567,032 | 387,121 | ||||||
| Long-term Debt |
597,347 | 781,402 | ||||||
| Deferred Income Taxes |
201,256 | 171,981 | ||||||
| Deferred and Other Long Term Liabilities |
112,440 | 93,430 | ||||||
| Pension, Postretirement and Postemployment Benefits |
38,599 | 35,799 | ||||||
| Total Liabilities |
1,516,674 | 1,469,733 | ||||||
| Commitments and Contingencies |
||||||||
| Stockholders’ Equity |
||||||||
| Preferred Stock-$1.00 par value |
||||||||
| Authorized 2,500,000 shares, none issued |
— | — | ||||||
| Common Stock-$1.00 par value |
||||||||
| Authorized 300,000,000 shares, issued 73,213,775 shares |
73,214 | 73,214 | ||||||
| Additional paid-in capital |
276,099 | 252,129 | ||||||
| Retained earnings |
1,275,117 | 1,063,928 | ||||||
| Accumulated other comprehensive income (loss) |
10,078 | (20,454 | ) | |||||
| Common stock in treasury, at cost: |
||||||||
| 2,664,312 shares in 2009 and 3,140,931 shares in 2008 |
(32,925 | ) | (37,304 | ) | ||||
| Total Church & Dwight Co., Inc. Stockholders’ Equity |
1,601,583 | 1,331,513 | ||||||
| Noncontrolling interest |
189 | 192 | ||||||
| Total Stockholders’ Equity |
1,601,772 | 1,331,705 | ||||||
| Total Liabilities and Stockholders’ Equity |
$ | 3,118,446 | $ | 2,801,438 | ||||
See Notes to Consolidated Financial Statements.
44
Table of Contents
CHURCH & DWIGHT CO., INC. AND SUBSIDIARIES
CONSOLIDATED STATEMENTS OF CASH FLOW
| Year Ended December 31, | ||||||||||||
| (Dollars in thousands) |
2009 | 2008 | 2007 | |||||||||
| Cash Flow From Operating Activities |
||||||||||||
| Net Income |
$ | 243,533 | $ | 195,174 | $ | 169,025 | ||||||
| Adjustments to reconcile net income to net cash provided by operating activities: |
||||||||||||
| Depreciation expense |
56,921 | 45,600 | 35,827 | |||||||||
| Amortization expense |
28,431 | 25,804 | 20,844 | |||||||||
| Equity in earnings of affiliates |
(12,050 | ) | (11,334 | ) | (8,236 | ) | ||||||
| Distributions from unconsolidated affiliates |
9,296 | 11,019 | 7,074 | |||||||||
| Deferred income taxes |
23,145 | 15,155 | 16,519 | |||||||||
| Asset impairment charges and other asset write-offs |
12,182 | 11,460 | 7,463 | |||||||||
| Gain on sale of assets |
— | (4,184 | ) | (3,325 | ) | |||||||
| Non cash compensation expense |
12,734 | 12,414 | 11,416 | |||||||||
| Unrealized foreign exchange loss (gain) and other |
(3,706 | ) | 6,436 | (2,203 | ) | |||||||
| Change in assets and liabilities: |
||||||||||||
| Accounts receivable |
6,201 | 26,473 | (6,902 | ) | ||||||||
| Inventories |
(10,552 | ) | 2,443 | (13,758 | ) | |||||||
| Prepaid expenses |
(431 | ) | (1,354 | ) | 1,061 | |||||||
| Accounts payable and accrued expenses |
12,724 | 10,040 | 5,247 | |||||||||
| Income taxes payable |
17,408 | 5,131 | 11,775 | |||||||||
| Excess tax benefit on stock options exercised |
(4,970 | ) | (6,299 | ) | (7,681 | ) | ||||||
| Other liabilities |
10,083 | (7,811 | ) | 4,531 | ||||||||
| Net Cash Provided By Operating Activities |
400,949 | 336,167 | 248,677 | |||||||||
| Cash Flow From Investing Activities |
||||||||||||
| Proceeds from sale of assets |
30,125 | 15,616 | 7,213 | |||||||||
| Additions to property, plant and equipment |
(135,379 | ) | (98,319 | ) | (48,876 | ) | ||||||
| Acquisitions (net of cash acquired) |
— | (383,372 | ) | (211 | ) | |||||||
| Return of capital from equity affiliates |
— | — | 1,250 | |||||||||
| Proceeds from note receivable |
1,324 | 1,263 | — | |||||||||
| Contingent acquisition payments |
(781 | ) | (1,009 | ) | (1,257 | ) | ||||||
| Change in other long-term assets |
571 | (340 | ) | (641 | ) | |||||||
| Net Cash Used In Investing Activities |
(104,140 | ) | (466,161 | ) | (42,522 | ) | ||||||
| Cash Flow From Financing Activities |
||||||||||||
| Long-term debt borrowings |
— | 250,000 | — | |||||||||
| Long-term debt repayment |
(71,491 | ) | (38,176 | ) | (90,052 | ) | ||||||
| Short-term debt borrowings, net |
30,910 | (111,752 | ) | 14,654 | ||||||||
| Bank overdrafts |
— | — | (1,979 | ) | ||||||||
| Proceeds from stock options exercised |
10,029 | 12,724 | 16,069 | |||||||||
| Excess tax benefit on stock options exercised |
4,970 | 6,299 | 7,681 | |||||||||
| Payment of cash dividends |
(32,344 | ) | (23,114 | ) | (19,746 | ) | ||||||
| Purchase of treasury stock |
(389 | ) | (403 | ) | (246 | ) | ||||||
| Deferred financing costs |
— | (8,356 | ) | — | ||||||||
| Net Cash (Used In) Provided by Financing Activities |
(58,315 | ) | 87,222 | (73,619 | ) | |||||||
| Effect of exchange rate changes on cash and cash equivalents |
10,650 | (9,038 | ) | 6,797 | ||||||||
| Net Change In Cash and Cash Equivalents |
249,144 | (51,810 | ) | 139,333 | ||||||||
| Cash and Cash Equivalents at Beginning of Period |
197,999 | 249,809 | 110,476 | |||||||||
| Cash and Cash Equivalents at End of Period |
$ | 447,143 | $ | 197,999 | $ | 249,809 | ||||||
See Notes to Consolidated Financial Statements.
45
Table of Contents
CHURCH & DWIGHT CO., INC. AND SUBSIDIARIES
CONSOLIDATED STATEMENTS OF CASH FLOW—(Continued)
| Year Ended December 31, | ||||||||||
| 2009 | 2008 | 2007 | ||||||||
| Cash paid during the year for: |
||||||||||
| Interest (net of amounts capitalized) |
$ | 29,893 | $ | 43,325 | $ | 55,522 | ||||
| Income taxes |
$ | 106,052 | $ | 89,024 | $ | 64,120 | ||||
| Supplemental disclosure of non-cash investing activities: |
||||||||||
| Property, plant and equipment expenditures included in Accounts Payable |
$ | 4,843 | $ | 3,774 | $ | 983 | ||||
| Acquisitions in which liabilities were assumed are as follows: |
||||||||||
| Fair value of assets |
$ | — | $ | 391,100 | $ | — | ||||
| Purchase price |
— | (383,372 | ) | — | ||||||
| Liabilities assumed |
$ | — | $ | 7,728 | $ | — | ||||
During the third quarter of 2008, 3.2 million shares of the Company’s common stock were issued upon the conversion of $99.9 million of convertible debentures.
See Notes to Consolidated Financial Statements.
46
Table of Contents
CHURCH & DWIGHT CO., INC. AND SUBSIDIARIES
CONSOLIDATED STATEMENTS OF STOCKHOLDERS’ EQUITY
Years Ended December 31, 2009, 2008 and 2007
| (In thousands) |
Number of Shares | Amounts | |||||||||||||||||||||||||||||||||
| Common Stock |
Treasury Stock |
Common Stock |
Treasury Stock |
Additional Paid-In Capital |
Retained Earnings |
Accumulated Other Comprehensive Income (Loss) |
Total Church & Dwight Co., Inc. Stockholders’ Equity |
Non- controlling Interest |
Total Stockholders’ Equity |
||||||||||||||||||||||||||
| January 1, 2007 |
69,991 | (4,630 | ) | $ | 69,991 | $ | (48,836 | ) | $ | 90,399 | $ | 740,130 | $ | 12,153 | $ | 863,837 | $ | 317 | $ | 864,154 | |||||||||||||||
| Net income |
— | — | — | — | — | 169,025 | — | 169,025 | 6 | 169,031 | |||||||||||||||||||||||||
| Translation adjustments |
— | — | — | — | — | — | 21,034 | 21,034 | (129 | ) | 20,905 | ||||||||||||||||||||||||
| Defined benefit plans, net of taxes of $3,698 |
— | — | — | — | — | — | 7,029 | 7,029 | — | 7,029 | |||||||||||||||||||||||||
| Interest rate agreements, net of taxes of $709 |
— | — | — | — | — | — | (1,088 | ) | (1,088 | ) | — | (1,088 | ) | ||||||||||||||||||||||
| ASC 740-10 adoption adjustment |
— | — | — | — | — | 2,459 | — | 2,459 | — | 2,459 | |||||||||||||||||||||||||
| Cash dividends |
— | — | — | — | — | (19,746 | ) | — | (19,746 | ) | — | (19,746 | ) | ||||||||||||||||||||||
| Stock purchases |
— | (5 | ) | — | (246 | ) | — | — | — | (246 | ) | — | (246 | ) | |||||||||||||||||||||
| Stock based compensation expense and stock option plan transactions, including related income tax benefits of $10,064 |
— | 876 | — | 6,366 | 30,326 | — | — | 36,692 | — | 36,692 | |||||||||||||||||||||||||
| Other stock issuances |
— | 11 | — | 92 | 1,177 | — | — | 1,269 | — | 1,269 | |||||||||||||||||||||||||
| December 31, 2007 |
69,991 | (3,748 | ) | $ | 69,991 | $ | (42,624 | ) | $ | 121,902 | $ | 891,868 | $ | 39,128 | $ | 1,080,265 | $ | 194 | $ | 1,080,459 | |||||||||||||||
| Net income |
— | — | — | — | — | 195,174 | — | 195,174 | 8 | 195,182 | |||||||||||||||||||||||||
| Translation adjustments |
— | — | — | — | — | — | (47,508 | ) | (47,508 | ) | (10 | ) | (47,518 | ) | |||||||||||||||||||||
| Defined benefit plans, net of taxes of $5,736 |
— | — | — | — | — | — | (8,623 | ) | (8,623 | ) | — | (8,623 | ) | ||||||||||||||||||||||
| Interest rate agreements, net of taxes of $2,221 |
— | — | — | — | — | — | (3,499 | ) | (3,499 | ) | — | (3,499 | ) | ||||||||||||||||||||||
| Foreign exchange contracts, net of taxes of $22 |
— | — | — | — | — | — | 48 | 48 | — | 48 | |||||||||||||||||||||||||
| Cash dividends |
— | — | — | — | — | (23,114 | ) | — | (23,114 | ) | — | (23,114 | ) | ||||||||||||||||||||||
| Convertible bond redemption |
3,223 | — | 3,223 | — | 96,662 | — | — | 99,885 | — | 99,885 | |||||||||||||||||||||||||
| Stock purchases |
— | (7 | ) | — | (403 | ) | — | — | — | (403 | ) | — | (403 | ) | |||||||||||||||||||||
| Stock based compensation expense and stock option plan transactions, including related income tax benefits of $7,458 |
— | 597 | — | 5,572 | 25,918 | — | — | 31,490 | — | 31,490 | |||||||||||||||||||||||||
| Directors’ deferred compensation plan |
— | — | — | — | 6,683 | — | — | 6,683 | — | 6,683 | |||||||||||||||||||||||||
| Other stock issuances |
— | 17 | — | 151 | 964 | — | — | 1,115 | — | 1,115 | |||||||||||||||||||||||||
| December 31, 2008 |
73,214 | (3,141 | ) | $ | 73,214 | $ | (37,304 | ) | $ | 252,129 | $ | 1,063,928 | $ | (20,454 | ) | $ | 1,331,513 | $ | 192 | $ | 1,331,705 | ||||||||||||||
47
Table of Contents
CHURCH & DWIGHT CO., INC. AND SUBSIDIARIES
CONSOLIDATED STATEMENTS OF STOCKHOLDERS’ EQUITY—(Continued)
Years Ended December 31, 2009, 2008 and 2007
| (In thousands) |
Number of Shares | Amounts | |||||||||||||||||||||||||||||||||
| Common Stock |
Treasury Stock |
Common Stock |
Treasury Stock |
Additional Paid-In Capital |
Retained Earnings |
Accumulated Other Comprehensive Income (Loss) |
Total Church & Dwight Co., Inc. Stockholders’ Equity |
Non- controlling Interest |
Total Stockholders’ Equity |
||||||||||||||||||||||||||
| Net income |
— | — | — | — | — | 243,533 | — | 243,533 | (12 | ) | 243,521 | ||||||||||||||||||||||||
| Translation adjustments |
— | — | — | — | — | — | 34,120 | 34,120 | 9 | 34,129 | |||||||||||||||||||||||||
| Derivative agreements, net of tax benefits of $798 |
— | — | — | — | — | — | 1,138 | 1,138 | — | 1,138 | |||||||||||||||||||||||||
| Defined benefit plans, net of taxes of $849 |
— | — | — | — | — | — | (4,726 | ) | (4,726 | ) | — | (4,726 | ) | ||||||||||||||||||||||
| Cash dividends |
— | — | — | — | — | (32,344 | ) | — | (32,344 | ) | — | (32,344 | ) | ||||||||||||||||||||||
| Stock purchases |
— | (7 | ) | — | (389 | ) | — | — | — | (389 | ) | — | (389 | ) | |||||||||||||||||||||
| Stock based compensation expense and stock option plan transactions, including related income tax benefits of $5,833 |
— | 469 | — | 4,619 | 23,084 | — | — | 27,703 | — | 27,703 | |||||||||||||||||||||||||
| Other stock issuances |
— | 15 | — | 149 | 886 | — | — | 1,035 | — | 1,035 | |||||||||||||||||||||||||
| December 31, 2009 |
73,214 | (2,664 | ) | $ | 73,214 | $ | (32,925 | ) | $ | 276,099 | $ | 1,275,117 | $ | 10,078 | $ | 1,601,583 | $ | 189 | $ | 1,601,772 | |||||||||||||||
See Notes to Consolidated Financial Statements.
48
Table of Contents
CHURCH & DWIGHT CO., INC. AND SUBSIDIARIES
NOTES TO CONSOLIDATED FINANCIAL STATEMENTS
1. Significant Accounting Policies
Business
The Company develops, manufactures and markets a broad range of consumer and specialty products. It recognizes revenues and profits from selling its products, under a variety of brand names, including ARM & HAMMER and TROJAN, to supermarkets, drug stores and mass merchandisers that sell the products to consumers. The Company also sells its products to industrial customers and distributors.
Basis of Presentation
The accompanying Consolidated Financial Statements are presented in accordance with accounting principles generally accepted in the United States of America. The accompanying Consolidated Financial Statements include the accounts of the Company and its majority-owned subsidiaries. The Company accounts for equity investments on the cost method for those investments in which it does not control nor have the ability to exert significant influence over the investee, which generally is when the Company has less than a 20 percent ownership interest. In circumstances where the Company has greater than a 20 percent ownership interest and has the ability to exercise significant influence but does not control the investee, the investment is accounted for under the equity method. As a result, the Company accounts for its 50 percent interest in its Armand Products Company joint venture (“Armand”) and The ArmaKleen Company joint venture (“ArmaKleen”) under the equity method of accounting. Armand and ArmaKleen are specialty chemical businesses, and the Company’s 50 percent portion of their equity earnings is reported in the Company’s corporate segment, as described in Note 20. Neither of these entities are considered a significant subsidiary; therefore, summarized financial statement data is not presented.
Fiscal Calendar
The Company’s fiscal year begins on January 1st and ends on December 31st. Quarterly periods are based on a 4 weeks—4 weeks—5 weeks methodology. As a result, the first quarter can include a partial or expanded week in the first four week period of the quarter. Similarly, the last five week period in the fourth quarter could include a partial or expanded week. Certain subsidiaries operating outside of North America are included for periods beginning and ending one month prior to the period presented, which enables timely processing of consolidating results. There were no material intervening events that occurred with respect to these subsidiaries in the one month period ending December 31, 2009.
Use of Estimates
The preparation of financial statements in conformity with generally accepted accounting principles requires management to make estimates and assumptions that affect the reported amounts of assets and liabilities and disclosure of contingent gains and losses at the date of the financial statements and reported amounts of revenue and expenses during the reporting period. Management makes estimates regarding inventory valuation, promotional and sales returns reserves, the carrying amount of goodwill and other intangible assets, the realization of deferred tax assets, tax reserves, liabilities related to pensions and other postretirement benefit obligations and other matters that affect the reported amounts and other disclosures in the financial statements. Estimates are based on judgment and available information. Therefore, actual results could differ materially from those estimates, and it is possible that changes in such estimates could occur in the near term.
Revenue Recognition
Revenue is recognized when finished goods are delivered to our customers or when finished goods are picked up by a customer or a customer’s carrier.
49
Table of Contents
CHURCH & DWIGHT CO., INC. AND SUBSIDIARIES
NOTES TO CONSOLIDATED FINANCIAL STATEMENTS—(Continued)
Promotional and Sales Returns Reserves
The Company conducts extensive promotional activities, primarily through the use of off-list discounts, slotting, co-op advertising, periodic price reduction arrangements, and end-aisle and other in-store displays. All such costs are netted against sales. Slotting costs are recorded when the product is delivered to the customer. Cooperative advertising costs are recorded when the customer places the advertisement for the Company’s products. Discounts relating to price reduction arrangements are recorded when the related sale takes place. Costs associated with end-aisle or other in-store displays are recorded when the revenue from the product that is subject to the promotion is recognized. The reserves for sales returns and consumer and trade promotion liabilities are established based on the Company’s best estimate of the amounts necessary to settle future and existing obligations for such items with respect to products sold as of the balance sheet date. The Company uses historical trend experience and coupon redemption provider input in arriving at coupon reserve requirements, and uses forecasted appropriations, customer and sales organization inputs, and historical trend analysis in determining the reserves for other promotional activities and sales returns.
Cost of Sales, Marketing and Selling, General and Administrative Expenses
Cost of sales include costs related to the manufacture of the Company’s products, including raw material costs, inbound freight costs, direct labor, and indirect plant costs such as plant supervision, receiving, inspection, maintenance labor and materials, depreciation, taxes and insurance, purchasing, production planning, operations management, logistics, freight to customers, warehousing costs, internal transfer freight costs and plant impairment charges.
Marketing expenses include costs for advertising (excluding the costs of cooperative advertising programs, which are reflected in net sales), costs for coupon insertion (mainly the cost of printing and distribution), consumer promotion costs (such as on-shelf advertisements and floor ads), public relations, package design expense and market research costs.
Selling, general and administrative expenses include costs related to functions such as sales, corporate management, marketing administration and legal, among others. Such costs include salary compensation related costs (such as benefits, profit sharing, deferred compensation and employer contributions to savings plans); travel and entertainment related expenses; trade show expenses; insurance; professional and other consulting fees; costs related to temporary staff; staff relocation costs; and non-capitalizable software related costs.
Foreign Currency Translation
Financial statements of foreign subsidiaries are translated into U.S. dollars in accordance with Financial Accounting Standards Board (“FASB”) Accounting Standards Codification (“ASC”) Subtopic 830-30, Translation of Financial Statements. Unrealized gains and losses related to currency translation are recorded in Accumulated Other Comprehensive Income (Loss). Gains and losses on foreign currency transactions are recorded in the Consolidated Statements of Income.
Cash Equivalents
Cash equivalents consist of highly liquid short-term investments, which mature within three months of original maturity date.
Inventories
Inventories are valued at the lower of cost or market. Approximately 23% and 24% of the inventory at December 31, 2009 and 2008 were determined utilizing the last-in, first-out (LIFO) method. The cost of
50
Table of Contents
CHURCH & DWIGHT CO., INC. AND SUBSIDIARIES
NOTES TO CONSOLIDATED FINANCIAL STATEMENTS—(Continued)
substantially all inventory in the Company’s Specialty Products segment as well as domestic inventory sold under the ARM & HAMMER and BRILLO trademarks in the Consumer Domestic segment is determined utilizing the LIFO method. The cost of the remaining inventory is determined using the first-in, first-out (“FIFO”) method. The Company identifies any slow moving, obsolete or excess inventory to determine whether an adjustment is required to establish a new carrying value. The determination of whether inventory items are slow moving, obsolete or in excess of needs requires estimates and assumptions about the future demand for the Company’s products, technological changes, and new product introductions. The estimates as to the future demand used in the valuation of inventory involve judgments regarding the ongoing success of the Company’s products. The Company evaluates its inventory levels and expected usage on a periodic basis and records adjustments as required. Adjustments to reflect inventory at net realizable value were $8.8 million at December 31, 2009, and $10.7 million at December 31, 2008.
Property, Plant and Equipment
Property, plant and equipment is stated at cost. Depreciation is recorded using the straight-line method over the estimated useful lives of the respective assets. Estimated useful lives for building and improvements, machinery and equipment, and office equipment range from 9-40, 3-20 and 3-10 years, respectively. Routine repairs and maintenance are expensed when incurred. Leasehold improvements are depreciated over a period no longer than the lease term, except when the lease renewal has been determined to be reasonably assured and failure to renew the lease results in an economic penalty to the Company.
Property, plant and equipment are reviewed whenever events or changes in circumstances indicate that possible impairment exists. The Company’s impairment review is based on an undiscounted cash flow analysis at the lowest level at which cash flows of the long-lived assets are largely independent of other groups of Company assets and liabilities. The analysis requires management judgment with respect to changes in technology, the continued success of product lines, and future volume, revenue and expense growth rates. The Company conducts annual reviews to identify idle and underutilized equipment, and reviews business plans for possible impairment. Impairment occurs when the carrying value of the asset exceeds the future undiscounted cash flows. When an impairment is indicated, the estimated future cash flows are then discounted to determine the estimated fair value of the asset and an impairment charge is recorded for the difference between the carrying value and the net present value of estimated future cash flows.
Software
The Company accounts for software in accordance with ASC Subtopic 350-40, Internal-Use Software. The subtopic requires companies to capitalize certain costs of developing computer software. Amortization is recorded using the straight-line method over the estimated useful lives of the software, which is estimated to be no longer than 5 years.
Fair Value of Financial Instruments
Certain financial instruments are required to be recorded at fair value. The estimated fair values of such financial instruments (including investment securities and derivatives) have been determined using market information and valuation methodologies. Changes in assumptions or estimation methods could affect the fair value estimates. Other financial instruments, including cash equivalents and short-term debt are recorded at cost, which approximates fair value. Additional information regarding our risk management activities, including derivative instruments and hedging activities are separately disclosed.
51
Table of Contents
CHURCH & DWIGHT CO., INC. AND SUBSIDIARIES
NOTES TO CONSOLIDATED FINANCIAL STATEMENTS—(Continued)
Goodwill and Other Intangible Assets
The Company accounts for goodwill and other intangible assets in accordance with ASC Subtopic 350-20, Goodwill, and ASC Subtopic 350-30, General Intangibles Other Than Goodwill. Under these subtopics, goodwill and intangible assets with indefinite useful lives are not amortized but are reviewed for impairment at least annually. Intangible assets with finite lives are amortized over their estimated useful lives using the straight-line method and reviewed for impairment in accordance with ASC Subtopic 360-10, Property, Plant and Equipment. See the Property, Plant and Equipment section of this Note 1, above.
Research and Development
The Company incurred research and development expenses in the amount of $55.1 million, $51.2 million and $49.8 million in 2009, 2008 and 2007, respectively. These expenses are included in selling, general and administrative expenses.
Earnings Per Share (“EPS”)
Basic EPS is calculated based on income available to common shareholders and the weighted-average number of shares outstanding during the reported period. Diluted EPS includes additional dilution from potential common stock issuable pursuant to the exercise of stock options outstanding. The following table sets forth a reconciliation of the weighted average number of common shares outstanding to the weighted average number of shares outstanding on a diluted basis:
| (In thousands) |
2009 | 2008 | 2007 | |||
| Weighted average common shares outstanding—basic |
70,379 | 67,870 | 65,840 | |||
| Dilutive effect of stock options |
1,098 | 1,236 | 1,242 | |||
| Dilutive effect of convertible debt(1) |
— | 2,010 | 3,230 | |||
| Weighted average common shares outstanding—diluted |
71,477 | 71,116 | 70,312 | |||
| Antidilutive stock options outstanding |
1,106 | 444 | 629 | |||
| (1) | All but a nominal portion of the Company’s outstanding convertible debentures were converted into common stock in the third quarter of 2008. |
Employee Stock Based Compensation
Employee Stock Based Compensation is measured and recognized under ASC Subtopic 718-10, Compensation—Stock Compensation. The subtopic requires the determination of fair value of share-based compensation at the grant date and the recognition of the related expense over the required employee service period in which the share-based compensation vests. In 2009, the Company recorded a pre-tax charge of $11.8 million associated with the fair-value of unvested stock options, of which $10.5 million was included in selling, general and administrative expenses and $1.3 million in cost of goods sold.
Comprehensive Income
Comprehensive income consists of net income, foreign currency translation adjustments, changes in the fair value of certain derivative financial instruments designated and qualifying as cash flow hedges, and defined benefit plan adjustments, and is presented in the Consolidated Statements of Changes in Stockholders’ Equity and addressed in Note 16.
52
Table of Contents
CHURCH & DWIGHT CO., INC. AND SUBSIDIARIES
NOTES TO CONSOLIDATED FINANCIAL STATEMENTS—(Continued)
Income Taxes
Income taxes are accounted for under the asset and liability method. Deferred tax assets and liabilities are recognized to reflect the future tax consequences attributable to the differences between the financial statement carrying amounts of existing assets and liabilities and their respective tax bases, and operating loss and tax credit carryforwards. Deferred tax assets and liabilities are measured using enacted tax rates expected to apply to taxable income in the years in which the differences are expected to be recovered or settled. Management provides a valuation allowance against deferred tax assets for amounts which are not considered “more likely than not” to be realized. The Company records liabilities for potential assessments in various tax jurisdictions under ASC Subtopic 740-10, Income Taxes. The liabilities relate to tax return positions that, although supportable by the Company, may be challenged by the tax authorities. The Company adjusts this liability as a result of changes in tax legislation, interpretations of laws by courts, rulings by tax authorities, changes in estimates and the expiration of the statute of limitations. Many of the judgments involved in adjusting the liability involve assumptions and estimates that are highly uncertain and subject to change. In this regard, settlement of any issue, or an adverse determination in litigation, with a taxing authority could require the use of cash and result in an increase in our annual tax rate. Conversely, favorable resolution of an issue with a taxing authority would be recognized as a reduction to our annual tax rate. The Company’s policy for recording interest associated with income tax examinations is to record interest as a component of Income before Income Taxes.
New Accounting Pronouncements Adopted
In June 2009, the FASB issued ASC Topic 105, Generally Accepted Accounting Principles. Topic 105 establishes the FASB Accounting Standards Codification (the “Codification”) as the source of authoritative accounting principles recognized by the FASB to be applied by nongovernmental entities in the preparation of financial statements in conformity with generally accepted accounting principles (GAAP). ASC Topic 105 is effective for interim and annual periods ending after September 15, 2009. The Company adopted ASC Topic 105 in the third quarter of 2009 and, accordingly, updated GAAP references are to the Codification. The Codification is not intended to change or alter existing GAAP and adoption of the Codification had no impact on our consolidated financial position or results of operations.
In May 2009, the FASB issued ASC Subtopic 855-10, Subsequent Events, which provides general standards of accounting for and disclosure of subsequent events. ASC Subtopic 855-10 clarifies that public companies must evaluate, as of each reporting period (i.e. interim and annual), events or transactions that occur after the balance sheet date through the date that the financial statements are issued. It also requires public companies to disclose the date through which subsequent events have been evaluated and whether that is the date on which the financial statements were issued. ASC Subtopic 855-10 became effective prospectively for interim or annual financial periods ending after June 15, 2009. The Company adopted ASC Subtopic 855-10 in the second quarter of 2009 (see Note 21).
In April 2009, the FASB amended ASC Subtopic 825-10, Financial Instruments. ASC Subtopic 825-10, as so amended, requires quarterly disclosure of information about the fair value of financial instruments within the scope of ASC Subtopic 825-10. The Company adopted ASC Subtopic 825-10 effective as of the second quarter of 2009. See Note 2 for disclosures relating to the fair value of financial instruments.
In December 2008, the FASB amended ASC Subtopic 715-20, Compensation—Retirement Benefits: Defined Benefit Plans – General. ASC Subtopic 715-20, as so amended, requires employers to disclose information about fair value measurements of plan assets that are similar to the disclosures about fair value measurements required by ASC Subtopic 820-10, Fair Value Measurements and Disclosures. The Company adopted ASC Subtopic 715-20 with respect to the Company’s annual financial statements for 2009.
53
Table of Contents
CHURCH & DWIGHT CO., INC. AND SUBSIDIARIES
NOTES TO CONSOLIDATED FINANCIAL STATEMENTS—(Continued)
In March 2008, the FASB issued ASC Subtopic 815-10, Derivatives and Hedging. This subtopic requires enhanced disclosures about (i) how and why the Company uses derivative instruments, (ii) how the Company accounts for derivative instruments and related hedged items under Subtopic 815-20, Derivatives and Hedging: Hedging—General, and (iii) how derivative instruments and related hedged items affect the Company’s financial results. The Company adopted this subtopic on January 1, 2009. See Note 3 for additional information regarding the Company’s risk management activities, including derivative instruments and hedging activities.
In December 2007, the FASB revised ASC Topic 805, Business Combinations. The revised Topic requires use of the acquisition method of accounting, defines the acquirer as the entity that obtains control of one or more businesses in the business combination, establishes the acquisition date as the date the acquirer obtains control and broadens the scope of the Topic to all transactions and other events in which one entity obtains control over one or more other businesses. The Company adopted ASC Topic 805 on January 1, 2009, and the Topic did not have a material impact on the Company’s consolidated financial statements.
2. Fair Value Measurements
ASC Subtopic 820-10, Fair Value Measurements and Disclosures establishes a hierarchy that prioritizes the inputs (generally, assumptions that market participants would use in pricing an asset or liability) used to measure fair value based on the quality and reliability of the information provided by the inputs, as follows:
Level 1: Quoted market prices in active markets for identical assets or liabilities.
Level 2: Observable market based inputs or unobservable inputs that are corroborated by market data.
Level 3: Unobservable inputs that are not corroborated by market data.
The following table summarizes the carrying amounts and fair values of certain Company assets and liabilities:
| December 31, 2009 |
December 31, 2008 | |||||
| (In thousands) |
(Level 2) | (Level 2) | ||||
| Assets |
||||||
| Equity Derivatives |
$ | 1,452 | $ | — | ||
| Foreign exchange contracts |
— | 353 | ||||
| Diesel fuel contract |
596 | — | ||||
| $ | 2,048 | $ | 353 | |||
| Liabilities |
||||||
| Foreign exchange contracts |
$ | 743 | $ | — | ||
| Diesel fuel contract |
343 | 4,541 | ||||
| Interest rate collars and swaps |
5,120 | 7,862 | ||||
| $ | 6,206 | $ | 12,403 | |||
The fair value of the equity derivatives is based on the quoted market prices of the Company stock at end of each reporting period.
The fair value of the foreign exchange contracts are based on observable forward rates in commodity quoted intervals for the full term of the contract.
The fair value of the diesel fuel contracts is based on home heating oil future prices for the duration of the contract.
54
Table of Contents
CHURCH & DWIGHT CO., INC. AND SUBSIDIARIES
NOTES TO CONSOLIDATED FINANCIAL STATEMENTS—(Continued)
The fair value for the interest rate collars and swaps was derived using the forward three month LIBOR curve for the duration of the respective collars and swaps and a credit valuation adjustment relating to the credit risk of the counterparty.
The following table presents the carrying amounts and estimated fair values of the Company’s financial instruments at December 31, 2009 and December 31, 2008. The accounting guidance for ASC Topic 825, Financial Instruments defines the fair value as the price that would be received to sell an asset or paid to transfer a liability in an orderly transaction between market participants at the measurement date.
| December 31, 2009 | December 31, 2008 | |||||||||||
| (In thousands) |
Carrying Amount |
Fair Value |
Carrying Amount |
Fair Value | ||||||||
| Financial Assets: |
||||||||||||
| Current portion of note receivable |
$ | 1,388 | $ | 1,388 | $ | 1,324 | $ | 1,324 | ||||
| Long-term note receivable |
954 | 991 | 2,342 | 2,450 | ||||||||
| Financial Liabilities: |
||||||||||||
| Short-term borrowings |
34,895 | 34,895 | 3,248 | 3,248 | ||||||||
| Current portion of long-term debt |
184,054 | 178,045 | 71,491 | 66,708 | ||||||||
| 6% Senior subordinated note debt |
250,000 | 254,688 | 250,000 | 240,250 | ||||||||
| Long-term bank debt |
347,347 | 328,686 | 531,402 | 495,849 | ||||||||
The following methods and assumptions were used to estimate the fair value of each class of financial instruments reflected in the Consolidated Balance Sheets:
Note Receivable
The fair value of the note receivable reflects what management believes is the appropriate interest factor at December 31, 2009 and December 31, 2008, respectively, based on similar risks in the market.
Short-term Borrowings
The carrying amounts of the Company’s accounts receivable securitization (see Note 12) and unsecured lines of credit equal fair value because of short maturities and variable interest rates.
Long-term Bank Debt, Current Portion of Long-term Debt
The Company determines fair value based upon the prevailing value of equivalent financing.
Senior Subordinated Note Debt
The Company determines fair value of its senior subordinated notes based upon their quoted market value.
3. Derivative Instruments and Risk Management
Changes in interest rates, foreign exchange rates, the price of the Company’s common stock and commodity prices expose the Company to market risk. The Company manages these risks by the use of derivative instruments, such as cash flow hedges, diesel hedge contracts, equity derivatives and foreign exchange forward contracts. The Company does not use derivatives for trading or speculative purposes.
55
Table of Contents
CHURCH & DWIGHT CO., INC. AND SUBSIDIARIES
NOTES TO CONSOLIDATED FINANCIAL STATEMENTS—(Continued)
On January 1, 2009, the Company adopted amendments to ASC Subtopic 815-10, Derivatives and Hedging. ASC Subtopic 815-10, as so amended, requires enhanced disclosure of derivatives and hedging activities on an interim and annual basis. The guidance seeks to improve the transparency of financial reporting through enhanced disclosures on: (a) how and why an entity uses derivative instruments; (b) how derivative instruments and related hedged items are accounted for; and (c) how derivative instruments and related hedged items affect an entity’s financial position, financial performance, and cash flows.
The designation of a derivative instrument as a hedge and its ability to meet the hedge accounting criteria articulated in ASC Subtopic 815-20, Derivatives and Hedging: Hedging—General determines how the change in fair value of the derivative instrument will be reflected in the Consolidated Financial Statements. A derivative qualifies for hedge accounting if, at inception, the derivative is expected to be highly effective in offsetting the cash flows or fair value of the hedged interest rate, commodity price, foreign exchange rate or other variable, and the documentation standards of ASC Subtopic 815-20 are fulfilled at the time the Company enters into the derivative contract. A hedge is designated as a cash flow hedge, fair value hedge, or a net investment in foreign operations hedge based on the type of exposure being hedged. The asset or liability value of the derivative will change in tandem with its fair value. Changes in fair value, for the effective portion of qualifying hedges, are recorded in other comprehensive income (“OCI”). The derivative’s gain or loss is reclassified from OCI to match the timing of the hedged underlying’s cash flows effect on earnings.
The Company reviews the effectiveness of its hedging instruments on a quarterly basis. If the Company determines that a derivative instrument is no longer highly effective, it recognizes in current period earnings the hedge ineffectiveness and discontinues hedge accounting with respect to the derivative instrument. Changes in fair value for derivatives not designated as hedges or those not qualifying for hedge accounting are recognized in current period earnings. Upon termination of cash flow hedges, the Company reclassifies gains and losses from other comprehensive income based on the timing of the underlying cash flows, unless the termination results from the failure of the intended transaction to occur in the expected timeframe. Such untimely transactions require immediate recognition in earnings of gains and losses previously recorded in other comprehensive income.
During 2009, the Company used derivative instruments to mitigate risk, some of which were designated as hedging instruments under ASC Subtopic 815-20, as indicated below.
Derivatives Designated as Hedging Instruments
Cash Flow Hedges
The Company entered into two cash flow hedge zero cost collar agreements, each covering a notional amount of $100.0 million, to reduce the impact of interest rate fluctuations on a portion of its term loan indebtedness. One agreement was effective as of September 29, 2006, and expires on September 31, 2011, and the other was effective as of December 29, 2006, and expired on December 31, 2009. The hedge agreements each have a cap of 6.50% and a floor of 3.57%. The Company recorded a charge to interest expense of $5.5 million in 2009 with respect to these hedge agreements. The Company estimates it will recognize approximately $2.7 million in interest expense under the remaining hedge agreement in 2010. Changes in the fair value of cash flow hedge agreements are recorded in Accumulated Other Comprehensive Income on the balance sheet. The Company has no immediate plans to replace the interest rate collar that matured on December 31, 2009.
In addition, the Company entered into interest rate swap hedge agreements covering a notional amount of $150.0 million, effective as of June 26, 2009, to reduce the impact of interest rate fluctuations on a portion of its term loan indebtedness. These interest rate swap hedge agreements have terms of two years and a fixed rate of
56
Table of Contents
CHURCH & DWIGHT CO., INC. AND SUBSIDIARIES
NOTES TO CONSOLIDATED FINANCIAL STATEMENTS—(Continued)
1.38%. Changes in the fair value of interest rate swap hedge agreements are recorded in Accumulated Other Comprehensive Income on the balance sheet. The Company estimates it will recognize approximately $0.7 million in interest expense under the interest rate swap hedge agreements in 2010.
Foreign Currency
The Company is subject to exposure from fluctuations in foreign currency exchange rates, primarily U.S. Dollar/Euro, U.S. Dollar/British Pound, U.S. Dollar/Canadian Dollar, U.S. Dollar/Mexican Peso, U.S. Dollar/Australian Dollar, U.S. Dollar/Brazilian Real and U.S. Dollar/Chinese Yuan.
The Company, from time to time, enters into forward exchange contracts to hedge anticipated but not yet committed sales or purchases denominated in the U.S. Dollar, Canadian dollar, British pound and Euro. During the fourth quarter of 2008 and the twelve months of 2009, the Company’s Canadian subsidiary entered into forward exchange contracts to protect the Company from the risk that, due to changes in currency exchange rates, it would be adversely affected by net cash outflows. The last of the contracts expire by the end of August 2010. The notional amount of the unexpired contracts as of December 31, 2009 totaled U.S. $20.0 million. The contracts qualified as foreign currency cash flow hedges, and, therefore, changes in the fair value through the end of 2009 were marked to market and recorded as Other Comprehensive Income (Loss). The changes in fair values are summarized in the tables below for each reported period.
Derivatives not Designated as Hedging Instruments
Diesel Fuel Hedges
The Company uses independent freight carriers to deliver its products. These carriers charge the Company a basic rate per mile that is subject to a mileage surcharge for diesel fuel price increases. In July 2008 and April 2009, in response to increasing fuel prices and a concomitant increase in mileage surcharges, the Company entered into agreements with two financial counterparties to hedge approximately 13% of its notional diesel fuel requirements for 2010. The Company uses the hedge agreements to mitigate the volatility of diesel fuel prices and related fuel surcharges, and not to speculate in the future price of diesel fuel. The hedge agreements are designed to add stability to the Company’s product costs, enabling the Company to make pricing decisions and lessen the economic impact of abrupt changes in diesel fuel prices over the term of the contract.
Because the diesel hedge agreements do not qualify for hedge accounting under ASC Subtopic 815-20, Derivatives and Hedging: Hedging—General, the Company is required to mark the agreements to market throughout the life of the agreements and record changes in fair value in the consolidated statement of income. The loss recorded, net of deferred taxes, as a result of changes in the fair value of the diesel fuel hedge agreements, was immaterial for the year ended December 31, 2009. If future diesel prices were to change by $0.10 per gallon, the impact on the 2010 earnings due to the change in fair value of the hedge agreements would be approximately $0.2 million.
Equity Derivatives
The Company has entered into equity derivative contracts covering its own stock in order to minimize the impact on earnings resulting from fluctuations in the liability to participants in its Executive Deferred Compensation Plan, as a result of changes in quoted fair values, with respect to contributions designated by the participants for notional investments in Company stock. The contracts are settled in cash.
57
Table of Contents
CHURCH & DWIGHT CO., INC. AND SUBSIDIARIES
NOTES TO CONSOLIDATED FINANCIAL STATEMENTS—(Continued)
The following tables summarize the fair value of our derivative instruments and the effect of derivative instruments on our Consolidated Statements of Income and on comprehensive income:
| Fair Value at December 31, |
||||||||||
| (In millions) |
Balance Sheet Location |
2009 |
2008 |
|||||||
| Derivatives designated as hedging instruments under ASC Subtopic 815-20 |
||||||||||
| Asset Derivatives |
||||||||||
| Foreign exchange contracts |
Accounts receivable | $ | — | $ | 0.4 | |||||
| Total assets |
$ | — | $ | 0.4 | ||||||
| Liability Derivatives |
||||||||||
| Interest rate collars and swaps |
Deferred and other long-term liabilities | $ | 5.1 | $ | 7.9 | |||||
| Foreign exchange contracts |
Accounts payable and accrued expenses | 0.7 | — | |||||||
| Total liabilities |
$ | 5.8 | $ | 7.9 | ||||||
| Derivatives not designated as hedging instruments under ASC Subtopic 815-20 |
||||||||||
| Asset Derivatives |
||||||||||
| Diesel fuel contract |
Other current assets | $ | 0.6 | $ | — | |||||
| Equity derivatives |
Accounts receivable | 1.5 | — | |||||||
| Total assets |
$ | 2.1 | $ | — | ||||||
| Liability Derivatives |
||||||||||
| Equity derivatives |
Accounts payable and accrued expenses | $ | — | $ | 0.1 | |||||
| Diesel fuel contract |
Accounts payable and accrued expenses | 0.3 | 4.5 | |||||||
| Total liabilities |
$ | 0.3 | $ | 4.6 | ||||||
| Amount of Gain (Loss) for the Year ended December 31, |
||||||||||
| (In millions) |
Income Statement Location |
2009 |
2008 |
|||||||
| Derivatives not designated as hedging instruments under ASC Subtopic 815-20 |
||||||||||
| Equity derivatives |
Selling, general and administrative expenses | $ | 0.9 | $ | 0.2 | |||||
| Diesel fuel contracts |
Cost of sales | 0.5 | (4.5 | ) | ||||||
| Total gain (loss) recognized in income |
$ | 1.4 | $ | (4.3 | ) | |||||
| Amount of Gain from Derivatives for the Year ended December 31, |
||||||||||
| (In millions) |
2009 |
2008 |
||||||||
| Derivatives in ASC Subtopic 815-20 cash flow hedging relationship |
||||||||||
| Foreign exchange contracts (net of taxes) |
Other comprehensive income (loss) | $ | (0.6 | ) | $ | — | ||||
| Interest rate swap (net of taxes) |
Other comprehensive income (loss) | (0.5 | ) | — | ||||||
| Interest rate collars (net of taxes) |
Other comprehensive income (loss) | 2.2 | (3.5 | ) | ||||||
| Total gain (loss) recognized in OCI |
$ | 1.1 | $ | (3.5 | ) | |||||
58
Table of Contents
CHURCH & DWIGHT CO., INC. AND SUBSIDIARIES
NOTES TO CONSOLIDATED FINANCIAL STATEMENTS—(Continued)
The amount of gain (loss) reclassified from other comprehensive income for derivative income was immaterial for the years ended December 31, 2009 and December 31, 2008.
4. Inventories
Inventories consist of the following:
| (In thousands) |
December 31, 2009 |
December 31, 2008 | ||||
| Raw materials and supplies |
$ | 57,305 | $ | 52,850 | ||
| Work in process |
9,141 | 9,147 | ||||
| Finished goods |
150,424 | 136,896 | ||||
| Total |
$ | 216,870 | $ | 198,893 | ||
Inventories valued on the last-in, first-out (“LIFO”) method totaled $50.8 million and $47.9 million at December 31, 2009 and 2008, respectively, and would have been approximately $6.7 million and $11.1 million higher, respectively, had they been valued using the first-in, first-out (“FIFO”) method. The amount of LIFO liquidations in 2009 and 2008 were immaterial.
5. Property, Plant and Equipment
Property, Plant and Equipment (“PP&E”) consist of the following:
| (In thousands) |
December 31, 2009 |
December 31, 2008 | ||||
| Land |
$ | 25,930 | $ | 25,659 | ||
| Buildings and improvements |
226,783 | 143,590 | ||||
| Machinery and equipment |
444,235 | 421,012 | ||||
| Office equipment and other assets |
30,106 | 41,169 | ||||
| Software |
48,395 | 36,729 | ||||
| Mineral rights |
1,521 | 1,146 | ||||
| Construction in progress |
29,293 | 60,949 | ||||
| 806,263 | 730,254 | |||||
| Less accumulated depreciation and amortization |
350,627 | 345,735 | ||||
| Net Property, Plant and Equipment |
$ | 455,636 | $ | 384,519 | ||
| (In thousands) |
2009 | 2008 | 2007 | |||||||||
| Depreciation and amortization on PP&E |
$ | 56,921 | $ | 45,600 | $ | 35,827 | ||||||
| Interest charges capitalized (in construction in progress) |
$ | (2,389 | ) | $ | (729 | ) | $ | (764 | ) | |||
During the second quarter of 2008, the Company announced that it would close its North Brunswick, New Jersey facility in 2009 and, accordingly, has been recording accelerated depreciation charges on those facilities in the Consumer Domestic Segment. The accelerated depreciation charges of $16.2 million and $8.1 million for the twelve months ended December 31, 2009 and December 31, 2008, respectively (see Note 10), are included in cost of sales.
In 2009, capitalized interest charges are higher due to the construction of a laundry detergent manufacturing plant and distribution center in York, Pennsylvania through the first nine months of 2009.
59
Table of Contents
CHURCH & DWIGHT CO., INC. AND SUBSIDIARIES
NOTES TO CONSOLIDATED FINANCIAL STATEMENTS—(Continued)
The Company recognized charges related to equipment obsolescence, which occur in the ordinary course of business, and plant impairment charges during the three year period ended December 31, 2009 as follows:
| (In millions) |
2009 | 2008 | 2007 | ||||||
| Segments: |
|||||||||
| Consumer Domestic |
$ | 3.2 | $ | 3.4 | $ | 2.8 | |||
| Consumer International |
— | 0.1 | 0.4 | ||||||
| Specialty Products |
6.9 | 0.1 | 0.1 | ||||||
| Total |
$ | 10.1 | $ | 3.6 | $ | 3.3 | |||
In 2009, the Company recorded a plant asset impairment charge of approximately $6.9 million, representing the carrying value of the related assets, associated with one of its international subsidiaries. The Company measured the impairment charge using the discounted cash flow method. This subsidiary manufactures some products that compete with imports priced in U.S. dollars. As the dollar has weakened, it has been necessary to lower prices in the local currency to stay competitive, leading to negative cash flows, which is the key input under the discounted cash flow method. The charge is included in cost of sales in the Specialty Products Division segment income statement. The $3.2 million charge recorded in the Consumer Domestic Segment in 2009 is primarily a result of a lack of acceptance for certain products by our key customers that resulted in a decline of forecasted future cash flows and reduced profitability. The Company’s fair value measurement input is considered a Level 3 input, under ASC Subtopic 820-10, Fair Value Measurements and Disclosures.
During 2008, the Company sold its Specialty Products subsidiary in the United Kingdom and its Consumer Products subsidiary in Spain (See Note 9). In August 2007, the Company sold certain property owned by its Canadian subsidiary for $7.2, net of selling costs, that had a net book value of $3.9 million. The gain on sale was included as a reduction of selling, general and administrative expenses and is included in the Consumer International segment. The table below summarizes the net book value of property, plant and equipment sold during the three-year period ending December 31, 2009:
| (In millions) |
2009 | 2008 | 2007 | ||||||
| Segments: |
|||||||||
| Consumer International |
$ | — | $ | 1.6 | $ | 3.9 | |||
| Specialty Products |
— | 6.0 | — | ||||||
| Total |
$ | — | $ | 7.6 | $ | 3.9 | |||
60
Table of Contents
CHURCH & DWIGHT CO., INC. AND SUBSIDIARIES
NOTES TO CONSOLIDATED FINANCIAL STATEMENTS—(Continued)
6. Acquisitions
On July 7, 2008, the Company purchased substantially all of the assets and certain liabilities of Del Pharmaceuticals, Inc. from Coty, Inc. (the “Orajel Acquisition”) for cash consideration of $383.4 million including fees. Products acquired from Del Pharmaceuticals, Inc. include the Orajel brand of oral analgesics and various other over-the-counter brands. The following table provides information regarding the fair value of assets acquired in the Orajel Acquisition:
| (In millions) |
Fair Value of Assets Acquired |
|||
| Current assets |
$ | 56.0 | ||
| Property, plant and equipment |
0.6 | |||
| Tradenames and other intangibles |
184.0 | |||
| Goodwill |
150.5 | |||
| Total assets |
391.1 | |||
| Current liabilities |
(7.7 | ) | ||
| Net assets |
$ | 383.4 | ||
The Company finalized its purchase price allocation relating to the Orajel Acquisition in the second quarter of 2009. The results of the businesses acquired in the Orajel Acquisition are included in both the Consumer Domestic and Consumer International segments.
7. Goodwill and Other Intangibles
The following table provides information related to the carrying value of all intangible assets excluding goodwill:
| December 31, 2009 | Amortization Period (Years) |
December 31, 2008 | ||||||||||||||||||||
| (In thousands) |
Gross Carrying Amount |
Accumulated Amortization |
Net | Gross Carrying Amount |
Accumulated Amortization |
Net | ||||||||||||||||
| Amortizable intangible assets: |
||||||||||||||||||||||
| Tradenames |
$ | 118,373 | $ | (46,721 | ) | $ | 71,652 | 3-20 | $ | 115,976 | $ | (38,648 | ) | $ | 77,328 | |||||||
| Customer Relationships |
241,640 | (37,205 | ) | 204,435 | 15-20 | 241,640 | (24,045 | ) | 217,595 | |||||||||||||
| Patents/Formulas |
27,370 | (18,084 | ) | 9,286 | 4-20 | 27,220 | (14,977 | ) | 12,243 | |||||||||||||
| Non Compete Agreement |
1,143 | (918 | ) | 225 | 10 | 1,143 | (807 | ) | 336 | |||||||||||||
| Total |
$ | 388,526 | $ | (102,928 | ) | $ | 285,598 | $ | 385,979 | $ | (78,477 | ) | $ | 307,502 | ||||||||
| Indefinite lived intangible assets—Carrying value |
||||||||||||||||||||||
| Tradenames |
$ | 509,293 | $ | 502,671 | ||||||||||||||||||
Intangible amortization expense amounted to $24.2 million for 2009, $21.8 million for 2008 and $18.0 million in 2007. The increase for 2009 principally reflects customer relationship amortization related to the Orajel Acquisition. The Company estimates that intangible amortization expense will be approximately $23.0 million in each of the next five years.
61
Table of Contents
CHURCH & DWIGHT CO., INC. AND SUBSIDIARIES
NOTES TO CONSOLIDATED FINANCIAL STATEMENTS—(Continued)
The Company recognized tradename impairment charges within selling, general and administrative expenses during the three year period ended December 31, 2009 as follows:
| (In millions) |
2009 | 2008 | 2007 | ||||||
| Segments: |
|||||||||
| Consumer Domestic |
$ | — | $ | 1.9 | $ | — | |||
| Consumer International |
— | 3.8 | 4.2 | ||||||
| Total |
$ | — | $ | 5.7 | $ | 4.2 | |||
The tradename impairment charges recorded in 2008 were a result of management’s decision to exit a business, a potential change of a brand’s name, lost distribution at key customer accounts and reduced profitability. The impairment charges in 2007 are also due to lost distribution at key customer accounts and reduced profitability. The amount of the impairment charge was determined by comparing the estimated fair value of the asset to its carrying amount. Fair value was estimated based on a “relief from royalty” discounted cash flow method, which contains numerous variables that are subject to change as business conditions change, and therefore could impact fair values in the future. Under this method, the owner of an intangible asset must determine the arm’s length royalty that likely would have been charged if the owner had to license that asset from a third party. The Company determined that the remaining carrying value of all tradenames was recoverable based upon the forecasted cash flows and profitability of the related brands.
The changes in the carrying amount of goodwill for the year ended December 31, 2009 are as follows:
| (In thousands) |
Consumer Domestic |
Consumer International |
Specialty Products |
Total | |||||||||||
| Balance December 31, 2007 |
$ | 633,030 | $ | 33,224 | $ | 22,588 | $ | 688,842 | |||||||
| Goodwill associated with the Orajel acquisition (see Note 6) |
154,512 | — | — | 154,512 | |||||||||||
| Subsidiary Divestiture (see Note 9) |
— | — | (971 | ) | (971 | ) | |||||||||
| Additional contingent consideration |
974 | — | — | 974 | |||||||||||
| Other |
— | 3,262 | (1,389 | ) | 1,873 | ||||||||||
| Balance December 31, 2008 |
788,516 | 36,486 | 20,228 | 845,230 | |||||||||||
| Adjustments to the Orajel Acquisition purchase price allocation(1) |
(3,929 | ) | — | — | (3,929 | ) | |||||||||
| Additional contingent consideration |
700 | — | — | 700 | |||||||||||
| Other(2) |
(3,923 | ) | — | — | (3,923 | ) | |||||||||
| Balance December 31, 2009 |
$ | 781,364 | $ | 36,486 | $ | 20,228 | $ | 838,078 | |||||||
| (1) | Changes in the carrying amount of goodwill associated with the Orajel Acquisition primarily reflect adjustments to the fair values of net assets acquired. |
| (2) | Reflects goodwill associated with assets held for sale. |
The Company performed its annual goodwill impairment test as of April 1, 2009, and no adjustments were required.
8. Assets Held for Sale
The Company has made available for sale in 2009 certain brands and other productive assets. The aggregate value of these assets is approximately $8.8 million. In connection with this action, the Company recorded a $2.0
62
Table of Contents
CHURCH & DWIGHT CO., INC. AND SUBSIDIARIES
NOTES TO CONSOLIDATED FINANCIAL STATEMENTS—(Continued)
million asset impairment charge in the Consumer Domestic segment as the estimated net sale proceeds are expected to be less than the assets carrying value. Subsequent to December 31, 2009, the Company closed on one of the transactions, received net proceeds of $3.8 million, and will recognize a gain of approximately $1.0 million in the first quarter of 2010 related to the transaction.
In the fourth quarter of 2008, the Company made available for sale certain non core personal care product lines acquired in the Orajel Acquisition. The results of these product lines were included in both the Consumer Domestic and Consumer International Segments. In June 2009, the Company sold these product lines for approximately $30 million, net of fees, which approximated the book value of related assets.
9. Sale of Subsidiaries
On August 29, 2008, the Company sold its Consumer International subsidiary in Spain for $6.0 million. The transaction resulted in a pre-tax charge of $3.5 million, which was recorded in selling, general and administrative expenses for the Consumer International Segment. As a result of the sale, a $4.0 million tax benefit also was recorded as a reduction to tax expense.
On February 29, 2008, the Company sold its wholly-owned British subsidiary, Brotherton Speciality Products Ltd. (“Brotherton”), for $11.2 million, net of fees. The sale resulted in a pre-tax gain of $3.0 million, which was recorded as a reduction of selling, general and administrative (“SG&A”) expenses in the Specialty Products Division segment.
10. Restructuring and Related Activities
North Brunswick Plant Shutdown
In the fourth quarter of 2009, the Company completed construction and started operations in its integrated laundry detergent manufacturing plant and distribution center in York, Pennsylvania. In conjunction with the opening of the new facility, the Company closed its existing laundry detergent manufacturing plant and distribution facility in North Brunswick, New Jersey. The North Brunswick facility was comprised of five separate buildings, which had resulted in significant inefficiencies and could not accommodate expansion to address expected future growth.
The following table summarizes the cash costs relating to the closing of the North Brunswick complex, which have been included in cost of sales for the Consumer Domestic segment:
| (In millions) |
Severance Liability |
Contract Termination Costs Liability |
Other Exit and Disposal Costs Liability |
Total Cash Costs |
||||||||||||
| Balance at December 31, 2008 |
$ | 1.9 | $ | — | $ | — | $ | 1.9 | ||||||||
| Costs incurred and charged to expenses |
1.1 | 6.3 | 1.9 | 9.3 | ||||||||||||
| Costs paid or settled |
(0.3 | ) | (0.6 | ) | (1.0 | ) | (1.9 | ) | ||||||||
| Balance at December 31, 2009 |
$ | 2.7 | $ | 5.7 | $ | 0.9 | $ | 9.3 | ||||||||
| Total expected costs for closing the Plant |
$ | 3.0 | $ | 9.1 | $ | 2.0 | $ | 14.1 | ||||||||
The Company is providing severance and transition benefits to approximately 230 affected former employees from the North Brunswick complex. Substantially all of the $2.7 million in remaining severance payments will be made in 2010.
63
Table of Contents
CHURCH & DWIGHT CO., INC. AND SUBSIDIARIES
NOTES TO CONSOLIDATED FINANCIAL STATEMENTS—(Continued)
The contract termination costs include costs that will continue to be incurred under the lease agreements for the remaining terms without economic benefit to the Company, such as, remaining lease rentals, offset by assumed sublease rental income.
The other exit and disposal costs include estimated site restoration costs. These costs are expensed when incurred.
The Company has been recording accelerated depreciation charges on the North Brunswick facilities in the Consumer Domestic Segment. The non-cash accelerated depreciation charges of $16.2 million and $8.1 million for the twelve months ended December 31, 2009 and December 31, 2008, respectively, are included in cost of sales.
To build the plant and distribution center at York, Pennsylvania, the Company spent approximately $51 million in 2008 and approximately $85 million in 2009, and expects to spend approximately $5 million in 2010. The costs were funded using the Company’s existing credit facilities and available cash.
Canada Reorganization
During the fourth quarter of 2007, the Company announced an internal reorganization of certain functions relating to its Canadian subsidiary. Certain employees engaged in these functions were terminated and an agreement was reached with one of the subsidiary’s distributors to terminate its distribution contract. The total cost of the employee and contract terminations was approximately $3.5 million and was charged to the Consumer International segment. All the severance payments and contract termination fees were paid 2008.
11. Accounts Payable and Accrued Expenses
Accounts payable and accrued expenses consist of the following:
| (In thousands) |
2009 | 2008 | ||||
| Trade accounts payable |
$ | 177,778 | $ | 186,998 | ||
| Accrued marketing and promotion costs |
77,722 | 62,915 | ||||
| Accrued wages and related costs |
48,077 | 35,651 | ||||
| Accrued profit sharing |
17,342 | 12,848 | ||||
| Other accrued current liabilities |
11,531 | 12,210 | ||||
| Total |
$ | 332,450 | $ | 310,622 | ||
12. Short-Term Borrowings and Long-Term Debt
Short-term borrowings and long-term debt consist of the following:
| (In thousands) |
2009 | 2008 | ||||
| Short-term borrowings |
||||||
| Securitization of accounts receivable |
$ | 30,000 | $ | 1,000 | ||
| Various debt due to international banks |
4,895 | 2,248 | ||||
| Total short-term borrowings |
$ | 34,895 | $ | 3,248 | ||
| Long-term debt |
||||||
| Term Loan facility |
$ | 531,401 | $ | 602,893 | ||
| 6% Senior subordinated notes |
250,000 | 250,000 | ||||
| Total long-term debt |
781,401 | 852,893 | ||||
| Less: current maturities |
184,054 | 71,491 | ||||
| Net long-term debt |
$ | 597,347 | $ | 781,402 | ||
64
Table of Contents
CHURCH & DWIGHT CO., INC. AND SUBSIDIARIES
NOTES TO CONSOLIDATED FINANCIAL STATEMENTS—(Continued)
The long-term debt principal payments required to be made are as follows:
| (In thousands) |
|||
| Due by December 2010 |
$ | 184,054 | |
| Due by December 2011 |
150,685 | ||
| Due by December 2012 |
446,662 | ||
| $ | 781,401 | ||
Securitization:
In 2003, the Company entered into a receivables purchase agreement with an issuer of receivables-backed commercial paper in order to refinance a portion of its primary credit facility and to lower its financing costs by accessing the commercial paper market. Under this arrangement, the Company sold, and has agreed to sell from time to time throughout the term of the agreement (which is renewed annually), its trade accounts receivable to a wholly-owned, consolidated, special purpose finance subsidiary, Harrison Street Funding LLC, a Delaware limited liability company (“Harrison”). Harrison in turn sold, and has agreed to sell on an ongoing basis, to the commercial paper issuer an undivided interest in the pool of accounts receivable. The receivables assets and the short-term borrowings of Harrison are included in the consolidated financial statements of the Company. The maximum amount that can be borrowed is $115.0 million.
During 2009, the Company increased the borrowings under its accounts receivable securitization facility by a net amount of $30.0 million. In February 2010, the accounts receivable securitization facility was renewed with a new maturity date of February 2011.
Credit Agreement:
On December 23, 2005, the Company entered into an amended and restated credit agreement (the “Credit Agreement”) with a number of banks and other financial institutions. The Credit Agreement initially provided for a five year term loan A in a principal amount of $300.0 million, subject to an increase by up to an additional $250.0 million through an accordion feature upon the satisfaction of certain conditions, and continued, until May 2009, the existing multi-currency revolving credit and letter of credit facility in an aggregate principal amount of up to $100.0 million (the “Revolving Credit”.) On August 7, 2006, the Credit Agreement was amended and increased by $250.0 million, which the Company used to fund the OGI acquisition while maintaining the $250 million accordion feature. On June 3, 2008, the Company again amended its Credit Agreement, increasing the principal amount by $250 million, which was used to fund the Orajel Acquisition while maintaining the $250 million accordion feature. Other matters addressed in the June 2008 amendment included, among other things, Revolving Credit from May 28, 2009 to August 31, 2012, and addition of other capital expenditure related provisions associated with the new plant construction in York, Pennsylvania. Specifically, permitted annual capital expenditures were $100.0 million in 2008, $200.0 million in 2009, and are $100.0 million, thereafter. The obligations of the Company under the Credit Agreement are secured by substantially all of the assets of the Company. The term loan and the Revolving Credit bear interest under one of two rate options, selected by the Company, equal to (a) either (i) a eurocurrency rate (adjusted for any reserve requirements) (“Eurocurrency Rate”) or (ii) the greater of the prime rate, the secondary market rate for three-month certificates of deposit (adjusted for any reserve requirements) plus the applicable FDIC assessment rate plus 1.0%, or the federal funds effective rate plus 0.5% (“Alternate Base Rate”), plus (b) an applicable margin. On the closing date of the June 2008 amendment and at December 31, 2009, the applicable margin was (a) 0.75% for the Eurocurrency rate and (b) 0% for the alternate rate. The Company’s Revolving Credit is available for general corporate purposes, which has not been drawn against.
65
Table of Contents
CHURCH & DWIGHT CO., INC. AND SUBSIDIARIES
NOTES TO CONSOLIDATED FINANCIAL STATEMENTS—(Continued)
Senior Subordinated Debt:
On December 22, 2004, the Company issued $250.0 million of 6.0% senior subordinated notes due December 15, 2012 (“Notes”) with interest paid semi-annually. The Notes were issued at par and the Company received $225.0 million of proceeds that were used to redeem $218.6 million of the notes issued by Armkel, LLC, a joint venture in which the Company had a 50 percent interest until the Company acquired the other 50 percent interest in 2004, and the balance was used to make voluntary bank debt repayments. In the event that one or more domestic subsidiaries of the Company have annual revenues (other than intercompany revenues) or total assets (other than intercompany receivables) of $100,000 or more, the notes will be guaranteed by such subsidiary or subsidiaries. As of December 31, 2009, no subsidiaries were guarantors. The notes are redeemable at the Company’s option, in whole or in part, at specified redemption prices, together with accrued and unpaid interest, if any, to the date of redemption.
The terms of the subordinated note and credit agreement place a limit on the amount of certain cash payments the Company can make. This limitation includes the amount the Company can pay in dividends on its common stock. As long as the Company is not in default under either agreement, the Company does not anticipate that the limitation will affect its ability to pay dividends at the current rate.
Other Debt:
The Company’s Brazilian subsidiary, Quimica Geral do Nordeste S.A (“QGN”), has lines of credit that enable it to borrow in its local currency. Amounts available under the lines of credit total $6.0 million, of which approximately $4.9 and $2.2 million were outstanding as of December 31, 2009 and 2008, respectively. The various lines of credit will expire before December 31, 2010. The weighted average interest rate on these borrowings at December 31, 2009 was approximately 13.1%. QGN’s debt is subject to various interest rates that are determined by several local inflation indexes.
13. Income Taxes
The components of income before taxes are as follows:
| (in thousands) |
2009 | 2008 | 2007 | ||||||
| Domestic |
$ | 364,205 | $ | 266,058 | $ | 219,265 | |||
| Foreign |
28,031 | 42,202 | 45,666 | ||||||
| Total |
$ | 392,236 | $ | 308,260 | $ | 264,931 | |||
The following table summarizes the provision for U.S. federal, state and foreign income taxes:
| (in thousands) |
2009 | 2008 | 2007 | ||||||||
| Current: |
|||||||||||
| U.S. federal |
$ | 93,794 | $ | 68,469 | $ | 51,153 | |||||
| State |
18,758 | 12,402 | 12,608 | ||||||||
| Foreign |
13,018 | 17,052 | 15,620 | ||||||||
| 125,570 | 97,923 | 79,381 | |||||||||
| Deferred: |
|||||||||||
| U.S. federal |
18,182 | 9,576 | 11,497 | ||||||||
| State |
7,178 | 10,954 | 4,025 | ||||||||
| Foreign |
(2,215 | ) | (5,375 | ) | 997 | ||||||
| 23,145 | 15,155 | 16,519 | |||||||||
| Total provision |
$ | 148,715 | $ | 113,078 | $ | 95,900 | |||||
66
Table of Contents
CHURCH & DWIGHT CO., INC. AND SUBSIDIARIES
NOTES TO CONSOLIDATED FINANCIAL STATEMENTS—(Continued)
Deferred tax assets (liabilities) consist of the following at December 31:
| (in thousands) |
2009 | 2008 | ||||||
| Deferred tax assets: |
||||||||
| Accounts receivable |
$ | 8,550 | $ | 9,709 | ||||
| Deferred compensation |
37,671 | 29,876 | ||||||
| Pension |
14,198 | 17,774 | ||||||
| Reserves |
37,268 | 31,124 | ||||||
| Tax credit carryforwards/other tax attributes |
9,997 | 8,026 | ||||||
| Net operating loss carryforwards |
10,779 | 9,340 | ||||||
| Total gross deferred tax assets |
118,463 | 105,849 | ||||||
| Valuation allowances |
(3,286 | ) | (2,193 | ) | ||||
| Total deferred tax assets |
115,177 | 103,656 | ||||||
| Deferred tax liabilities: |
||||||||
| Goodwill |
(101,000 | ) | (86,325 | ) | ||||
| Tradenames and other intangibles |
(105,936 | ) | (97,264 | ) | ||||
| Property, plant and equipment |
(64,379 | ) | (53,615 | ) | ||||
| Total deferred tax liabilities |
(271,315 | ) | (237,204 | ) | ||||
| Net deferred tax liability |
$ | (156,138 | ) | $ | (133,548 | ) | ||
The difference between tax expense and the tax that would result from the application of the federal statutory rate is as follows:
| (in thousands) |
2009 | 2008 | 2007 | |||||||||
| Statutory rate |
35 | % | 35 | % | 35 | % | ||||||
| Tax that would result from use of the federal statutory rate |
$ | 137,283 | $ | 107,891 | $ | 92,726 | ||||||
| State and local income tax, net of federal effect |
16,859 | 15,182 | 10,810 | |||||||||
| Varying tax rates of foreign affiliates |
384 | (3,096 | ) | (1,850 | ) | |||||||
| Benefit from domestic manufacturing deduction |
(5,098 | ) | (4,476 | ) | (3,018 | ) | ||||||
| Other |
(713 | ) | (2,423 | ) | (2,768 | ) | ||||||
| Recorded tax expense |
$ | 148,715 | $ | 113,078 | $ | 95,900 | ||||||
| Effective tax rate |
37.9 | % | 36.7 | % | 36.2 | % | ||||||
At December 31, 2009, foreign subsidiaries of the Company had net operating loss carryforwards of approximately $42 million. Approximately half of the net operating loss carryforwards expire on various dates through December 31, 2018. The remaining net operating loss carryforwards are not subject to expiration.
We believe that it is more likely than not that the benefit from certain foreign net operating loss carryforwards will not be realized. In recognition of this risk, we have provided a valuation allowance of $3.3 million and $2.2 million at December 31, 2009 and 2008, respectively, on the deferred tax asset relating to these foreign net operating loss carryforwards.
The Company has undistributed earnings of foreign subsidiaries of approximately $137 million at December 31, 2009 for which deferred taxes have not been provided. These earnings, which are considered to be permanently reinvested, would be subject to U.S. tax if they were remitted as dividends. It is not practicable to determine the deferred tax liability on these earnings.
67
Table of Contents
CHURCH & DWIGHT CO., INC. AND SUBSIDIARIES
NOTES TO CONSOLIDATED FINANCIAL STATEMENTS—(Continued)
The Company has recorded liabilities in connection with uncertain tax positions. The accounting guidance prescribes a minimum recognition threshold a tax position is required to meet in order for the tax benefit to be recognized in the financial statements.
A reconciliation of the beginning and ending amount of unrecognized tax benefits is as follows:
| (in millions) |
2009 | 2008 | 2007 | |||||||||
| Unrecognized tax benefits at January 1 |
$ | 35.5 | $ | 27.8 | $ | — | ||||||
| Unrecognized tax benefits upon adoption of ASC 740-10 |
— | — | 18.5 | |||||||||
| Gross increases—tax positions in current period |
4.1 | 8.0 | 7.4 | |||||||||
| Gross increases—tax positions in prior period |
10.1 | 0.5 | 2.1 | |||||||||
| Gross decreases—tax positions in prior period |
(6.2 | ) | (0.7 | ) | — | |||||||
| Settlements |
(3.7 | ) | — | (0.1 | ) | |||||||
| Lapse of statute of limitations |
(0.2 | ) | (0.1 | ) | (0.1 | ) | ||||||
| Unrecognized tax benefits at December 31 |
$ | 39.6 | $ | 35.5 | $ | 27.8 | ||||||
Included in the balance of unrecognized tax benefits at December 31, 2009, 2008 and 2007, are $19.9 million, $16.7 million and $11.3 million, respectively, of tax benefits that, if recognized, would affect the effective tax rate. Also included in the balance of unrecognized tax benefits at December 31, 2009, 2008 and 2007, are $19.7 million, $18.8 million and $16.5 million, respectively, of tax benefits that, if recognized, would result in adjustments to balance sheet tax accounts, primarily deferred taxes.
The Company is subject to U.S. federal income tax as well as the income tax in multiple state and international jurisdictions. Substantially all material federal, state, and international income tax matters have been effectively concluded for years through 2003. The tax years 2004 through 2008 are currently under audit by the U.S. Internal Revenue Service and several state taxing authorities. In addition, certain statutes of limitations are scheduled to expire in the near future. It is reasonably possible that a decrease of approximately $24.7 million in the unrecognized tax benefits may occur within the next twelve months related to the settlement of these audits or the lapse of applicable statutes of limitations. Of this amount, $16.2 million would result in adjustments to balance sheet tax accounts, primarily deferred taxes and would not affect the effective tax rate.
The Company’s policy for recording interest associated with income tax examinations is to record interest as a component of Income before Income Taxes. Interest paid or received is recorded in interest expense or interest income, respectively, in the statement of income. During the twelve months ended December 31, 2009, December 31, 2008 and December 31, 2007, the Company recognized approximately $1.9 million, $2.5 million, and $1.5 million, respectively, in interest expense associated with uncertain tax positions. As of December 31, 2009 and December 31, 2008, the Company had $6.8 million and $5.2 million, respectively, in accrued interest expense related to unrecognized tax benefits.
14. Benefit Plans
Defined Benefit Retirement Plans
The Company has defined benefit pension plans covering certain employees. Pension benefits to retired employees are based upon their length of service and a percentage of qualifying compensation during the final years of employment. The Company’s funding policy is consistent with federal/statutory funding requirements. The Company also maintains unfunded plans, which provide medical benefits for eligible domestic retirees and their dependents and employees in Canada. The cost of such benefits is recognized during the employee’s active working career.
68
Table of Contents
CHURCH & DWIGHT CO., INC. AND SUBSIDIARIES
NOTES TO CONSOLIDATED FINANCIAL STATEMENTS—(Continued)
The Company records the valuation of its defined benefit plans in accordance with ASC Subtopic 715-20, Compensation—Retirement Benefits: Defined Benefit Plans—General. The Subtopic requires employers to recognize the funded status of a benefit plan in the balance sheet, which is a long-term liability for the Company. Any previously unrecognized gains or losses are now recorded in the equity section of the balance sheet within accumulated other comprehensive income.
The following table provides information on the status of the defined benefit plans at December 31:
| (In thousands) |
Pension Plans | Nonpension Postretirement Plans |
||||||||||||||
| 2009 | 2008 | 2009 | 2008 | |||||||||||||
| Change in Benefit Obligation: |
||||||||||||||||
| Benefit obligation at beginning of year |
$ | 104,864 | $ | 136,057 | $ | 21,556 | $ | 21,670 | ||||||||
| Adjustment to prior year obligation |
— | (667 | ) | — | — | |||||||||||
| Service cost |
1,604 | 2,180 | 295 | 479 | ||||||||||||
| Interest cost |
6,749 | 7,527 | 1,246 | 1,253 | ||||||||||||
| Plan participants’ contributions |
327 | 378 | 195 | 209 | ||||||||||||
| Actuarial (gain) loss |
17,291 | (14,615 | ) | (431 | ) | (298 | ) | |||||||||
| Settlements |
(280 | ) | — | — | — | |||||||||||
| Effects of exchange rate changes |
6,436 | (16,182 | ) | 497 | (629 | ) | ||||||||||
| Benefits paid |
(7,227 | ) | (9,814 | ) | (1,057 | ) | (1,128 | ) | ||||||||
| Benefit obligation at end of year |
$ | 129,764 | $ | 104,864 | $ | 22,301 | $ | 21,556 | ||||||||
| Change in Plan Assets: |
||||||||||||||||
| Fair value of plan assets at beginning of year |
$ | 90,840 | $ | 122,273 | $ | — | $ | — | ||||||||
| Adjustment to prior balance |
— | (105 | ) | — | — | |||||||||||
| Actual return on plan assets (net of expenses) |
16,899 | (21,422 | ) | — | — | |||||||||||
| Employer contributions |
7,377 | 14,569 | 862 | 919 | ||||||||||||
| Plan participants’ contributions |
327 | 378 | 195 | 209 | ||||||||||||
| Effects of exchange rate changes |
5,549 | (15,039 | ) | — | — | |||||||||||
| Benefits paid |
(7,227 | ) | (9,814 | ) | (1,057 | ) | (1,128 | ) | ||||||||
| Fair value of plan assets at end of year |
$ | 113,765 | $ | 90,840 | $ | — | $ | — | ||||||||
| Funded status at end of year, recorded in Pension and Postretirement Benefits |
$ | (15,999 | ) | $ | (14,024 | ) | $ | (22,301 | ) | $ | (21,556 | ) | ||||
| Amounts Recognized in Accumulated Other Comprehensive Income: |
||||||||||||||||
| Prior Service Credit |
$ | 2,784 | $ | (10 | ) | $ | 228 | $ | 279 | |||||||
| Actuarial Loss |
18,348 | 15,446 | (721 | ) | (300 | ) | ||||||||||
| Net Loss (Income) Recognized in Accumulated Other Comprehensive Income |
$ | 21,132 | $ | 15,436 | $ | (493 | ) | $ | (21 | ) | ||||||
Amounts recognized in the statement of financial position consist of:
| Pension Plans | Nonpension Postretirement Plans |
|||||||||||||||
| (In thousands) |
2009 | 2008 | 2009 | 2008 | ||||||||||||
| Pension and Postretirement Benefits |
$ | (15,999 | ) | $ | (14,024 | ) | $ | (22,301 | ) | $ | (21,556 | ) | ||||
| Accumulated other comprehensive loss (income) |
21,132 | 15,436 | (493 | ) | (21 | ) | ||||||||||
| Net amount recognized at end of year |
$ | 5,133 | $ | 1,412 | $ | (22,794 | ) | $ | (21,577 | ) | ||||||
| Accumulated benefit obligation |
$ | 122,035 | $ | 97,169 | $ | — | $ | — | ||||||||
69
Table of Contents
CHURCH & DWIGHT CO., INC. AND SUBSIDIARIES
NOTES TO CONSOLIDATED FINANCIAL STATEMENTS—(Continued)
In 2009, the change in accumulated other comprehensive loss (income) was a $5.7 million increase in pension plan obligations and a $0.5 million decrease for postretirement benefit plans. The changes are primarily related to the change in discount rates for all plans.
Weighted-average assumptions used to determine benefit obligations as of December 31:
| Pension Plans | Nonpension Postretirement Plans |
|||||||||||
| 2009 | 2008 | 2009 | 2008 | |||||||||
| Discount Rate |
5.76 | % | 6.58 | % | 5.80 | % | 6.42 | % | ||||
| Rate of Compensation increase |
4.26 | % | 4.20 | % | — | — | ||||||
Net Pension and Net Postretirement Benefit Costs consisted of the following components:
| Pension Costs | Nonpension Postretirement Costs | |||||||||||||||||||||||
| (In thousands) |
2009 | 2008 | 2007 | 2009 | 2008 | 2007 | ||||||||||||||||||
| Components of Net Periodic Benefit Cost: |
||||||||||||||||||||||||
| Service cost |
$ | 1,604 | $ | 2,180 | $ | 2,712 | $ | 295 | $ | 476 | $ | 530 | ||||||||||||
| Interest cost |
6,749 | 7,527 | 7,144 | 1,237 | 1,237 | 1,204 | ||||||||||||||||||
| Expected return on plan assets |
(6,254 | ) | (8,213 | ) | (7,694 | ) | — | — | — | |||||||||||||||
| Amortization of prior service cost |
426 | 15 | 15 | 51 | 38 | 38 | ||||||||||||||||||
| Recognized actuarial (gain) loss |
1,432 | 7 | 206 | (4 | ) | (3 | ) | (3 | ) | |||||||||||||||
| Net deferrals |
— | (38 | ) | (40 | ) | (7 | ) | — | — | |||||||||||||||
| Settlement (gain) loss |
(767 | ) | 73 | (52 | ) | — | — | — | ||||||||||||||||
| Net periodic benefit cost |
$ | 3,190 | $ | 1,551 | $ | 2,291 | $ | 1,572 | $ | 1,748 | $ | 1,769 | ||||||||||||
In 2010, amounts in accumulated other comprehensive income expected to be recognized in the income statement are estimated to be losses of approximately $3.0 million and $0.0 million for pension and postretirement plans, respectively.
Weighted-average assumptions used to determine net periodic benefit cost for years ended December 31:
| Pension Plans | Nonpension Postretirement Plans |
|||||||||||||||||
| 2009 | 2008 | 2007 | 2009 | 2008 | 2007 | |||||||||||||
| Discount Rate |
6.61 | % | 6.04 | % | 5.36 | % | 6.48 | % | 6.15 | % | 5.67 | % | ||||||
| Rate of Compensation increase |
4.07 | % | 4.47 | % | 4.40 | % | — | — | — | |||||||||
| Expected long-term rate of return on plan assets |
6.72 | % | 7.21 | % | 7.19 | % | — | — | — | |||||||||
The Company’s pension and postretirement benefit costs are developed from actuarial valuations. These valuations reflect key assumptions provided by the Company to its actuaries, including the discount rate and expected long-term rate of return on plan assets. Material changes in the Company’s pension and postretirement benefit costs may occur in the future due to changes in these assumptions.
On January 27, 2010, the Company’s Board of Directors approved the termination, effective April 15, 2010, of the domestic defined benefit pension plan, under which approximately 766 participants, including 46 active employees, have accrued benefits. The Company anticipates completing the termination of this plan in late 2010 or early 2011, once regulatory approvals are obtained. To effect the termination, the Company estimates, based on
70
Table of Contents
CHURCH & DWIGHT CO., INC. AND SUBSIDIARIES
NOTES TO CONSOLIDATED FINANCIAL STATEMENTS—(Continued)
December 31, 2009 valuations, that it will be required to contribute approximately $11 million to $14 million to the plan, primarily to enable the plan to purchase annuities to provide for accrued benefits. The Company estimates that a one-time expense of approximately $20 million to $23 million will be incurred when the annuities are purchased. This expense is primarily attributable to pension settlement accounting rules that require accelerated recognition of actuarial losses that were to be amortized over the expected benefit lives of participants. The contributions and expense are subject to change based on the valuations at the actual date of settlement.
The discount rate is subject to change each year, consistent with changes in applicable high-quality, long-term corporate bond indices. Based on the expected duration of the benefit payments for the Company’s pension plans and postretirement plans, the Company refers to an applicable index and expected term of the benefit payments to select a discount rate at which it believes the pension benefits could be effectively settled.
The expected long-term rate of return on pension plan assets is selected by taking into account a historical trend, the expected duration of the projected benefit obligation for the plans, the asset mix of the plans, and known economic and market conditions at the time of valuation. A 50 basis point change in the expected long-term rate of return would result in an approximate $0.6 million change in pension expense for 2010.
The Company’s investment policy is designed to provide flexibility in the asset mix based on management’s assessment of economic conditions, with an overall objective of realizing maximum rates of return appropriately balanced to minimize market risks. Our long-term strategic goal is to maintain an asset mix consisting of approximately 60% equity securities and 40% debt/guaranteed investment securities.
The fair values of Company’s pension plan assets at December 31, 2009 by asset category are as follows:
| Fair Value Measurements at December 31, 2009 | ||||||||||||
| (In thousands) |
Total | Quoted Prices in Active Markets for Identical |
Significant Observable Inputs |
Significant Unobservable Inputs | ||||||||
| (Level 1) | (Level 2) | (Level 3) | ||||||||||
| Asset Category |
||||||||||||
| Cash & Cash Equivalents |
$ | 2,034 | $ | 2,034 | $ | — | $ | — | ||||
| Equity Securities: |
||||||||||||
| U.S. companies |
9,248 | 9,248 | — | — | ||||||||
| International companies |
3,895 | 3,895 | — | — | ||||||||
| Equity Securities—Mutual Funds(a) |
26,854 | 14,068 | 12,786 | — | ||||||||
| Money Market Funds |
1,487 | — | 1,487 | — | ||||||||
| Bond Funds |
12,284 | 3,217 | 9,067 | — | ||||||||
| Fixed Income Fund(b) |
18,299 | 206 | — | 18,093 | ||||||||
| Government Fixed Income Securities |
8,667 | 43 | 8,624 | — | ||||||||
| Global Multi-strategy Fund(c) |
26,606 | — | — | 26,606 | ||||||||
| Insurance Investment Contract(d) |
4,341 | — | — | 4,341 | ||||||||
| Other |
50 | 50 | — | — | ||||||||
| Total |
$ | 113,765 | $ | 32,761 | $ | 31,964 | $ | 49,040 | ||||
| (a) | The equity securities represent mutual funds held by the pension plans in the United States and Canada and include both domestic and international equity securities. |
| (b) | The fixed income fund is comprised of investments for the pension plan in the United States and its fair value is based on a contractual formula which uses a Barclays bond index as a benchmark. |
| (c) | The global multi-strategy fund constitutes investments for the pension plan in the United Kingdom. The fund is a fund of funds invested in a series of diverse international equity funds and fixed income funds. |
| (d) | The insurance investment contract is in the form of an insurance policy that is held by the pension plan in the United Kingdom. The investment of the underlying assets is in various managed funds. |
71
Table of Contents
CHURCH & DWIGHT CO., INC. AND SUBSIDIARIES
NOTES TO CONSOLIDATED FINANCIAL STATEMENTS—(Continued)
Fair Value Measurements Using Significant Unobservable Inputs (Level 3 Investments):
| (In thousands) |
Fixed Income Fund |
Global Multi- strategy Fund |
Insurance Investment Contract |
Total | ||||||||||||
| Investments |
||||||||||||||||
| Beginning balance at January 1, 2009 |
$ | 12,881 | $ | 19,250 | $ | 4,173 | $ | 36,304 | ||||||||
| Service Fees |
(105 | ) | — | — | (105 | ) | ||||||||||
| Net realized and unrealized gain (loss) |
866 | 5,750 | (109 | ) | 6,507 | |||||||||||
| Purchases, sales, and settlements |
(104 | ) | (22 | ) | — | (126 | ) | |||||||||
| Transfers in and/or out |
4,555 | — | — | 4,555 | ||||||||||||
| Effects of exchange rate changes |
— | 1,628 | 277 | 1,905 | ||||||||||||
| Ending balance at December 31, 2009 |
$ | 18,093 | $ | 26,606 | $ | 4,341 | $ | 49,040 | ||||||||
The Company made cash contributions of approximately $7.4 million to its pension plans in 2009. The Company estimates it will be required to make cash contributions to its pension plans of approximately $1.8 million in 2010.
The following benefit payments are expected to be paid from the defined benefit plans:
| (In thousands) |
Pension Plans |
Nonpension Postretirement Plans | ||||
| 2010 |
$ | 7,736 | $ | 1,114 | ||
| 2011 |
7,434 | 1,200 | ||||
| 2012 |
7,626 | 1,274 | ||||
| 2013 |
7,793 | 1,344 | ||||
| 2014 |
7,771 | 1,436 | ||||
| 2015-2019 |
41,678 | 8,552 | ||||
The accumulated postretirement benefit obligation has been determined by application of the provisions of the Company’s medical plans including established maximums and sharing of costs, relevant actuarial assumptions and health-care cost trend rates projected at approximately 10.0% for 2009 and decreasing to an ultimate rate of approximately 5.0% in 2029. The Company has a maximum annual benefit based on years of service for those participants over 65 years of age.
The following chart shows the effect of a 1% change in healthcare cost trends:
| (in thousands) |
2009 | 2008 | ||||||
| Effect of 1% increase in health-care cost trend rates on: |
||||||||
| Postretirement benefit obligation |
$ | 1,842 | $ | 1,723 | ||||
| Total of service cost and interest cost component |
163 | 152 | ||||||
| Effect of 1% decrease in health-care cost trend rates on: |
||||||||
| Postretirement benefit obligation |
(1,607 | ) | (1,520 | ) | ||||
| Total of service cost and interest cost component |
(143 | ) | (131 | ) | ||||
Other Benefit Plans
The Company also maintains a defined contribution profit sharing plan for domestic salaried and certain hourly employees. Amounts charged to earnings for this plan were $17.3 million, $12.8 million and $12.4 million in 2009, 2008 and 2007, respectively. The higher expense in 2009 is due to the improved Company performance.
72
Table of Contents
CHURCH & DWIGHT CO., INC. AND SUBSIDIARIES
NOTES TO CONSOLIDATED FINANCIAL STATEMENTS—(Continued)
The Company also has a domestic employee 401K savings plan. The Company matches 50% of each employee’s contribution up to a maximum of 6% of the employee’s earnings. The Company’s matching contributions to the savings plan were $3.5 million, $3.3 million and $2.9 million in 2009, 2008 and 2007, respectively.
The Company has an employee stock purchase plan which permits employees to purchase the Company’s common stock at a 15% discount to the prevailing market price. No more than $25 thousand can be purchased by any one employee during a plan year. The 15% discount is included in selling, general and administrative expenses. Total expenses for 2009, 2008 and 2007 were $0.5 million, $0.5 million and $0.4 million, respectively.
Deferred Compensation Plans
The Company maintains a deferred compensation plan into which certain members of management are eligible to defer a maximum of 85% of their regular compensation (i.e. salary) and incentive bonus. The amounts deferred under this plan are credited with earnings or losses based upon changes in values of notional investments elected by the plan participant. The investment options available include notional investments in various stock, bond and money market accounts as well as Company Common Stock. Each plan participant is fully vested in the amounts he/she defers. The plan also functions as an “excess” plan, and Profit Sharing contributions that cannot otherwise be contributed to the qualified Savings and Profit Sharing Plan due to limitations under Department of Treasury regulations are credited to this plan. The vesting of those contributions mirrors the vesting schedule in the qualified plan.
The liability to plan participants for contributions designated for notional investment in Company stock is based on the quoted fair value of the Company’s stock plus any dividends credited. The Company uses cash-settled hedging instruments to minimize the cost related to the volatility of Company stock. At December 31, 2009 and 2008, the amount of the Company’s liability was to $47.9 million and $38.8 million, respectively and the funded balances amounted to $36.9 million and $33.2 million, respectively. The amounts charged to earnings, including the effect of the hedges, totaled $1.6 million, $1.2 million, and $2.1 million in 2009, 2008 and 2007, respectively.
Non-employee members of the Company’s Board of Directors are eligible to defer up to 100% of their directors’ compensation into a similar plan; however, the only option for investment is Company stock. Directors are always 100% vested in their account balance.
The Company amended the directors’ deferred compensation plan during the second quarter of 2008 to provide that compensation deferrals credited to a director’s account will be settled in the Company’s stock. Previously, compensation deferrals consisted of notional investments in Company stock that settled exclusively in cash. This change resulted in a $6.6 million reclassification of the value of the underlying stock from long term liabilities to equity. Subsequent changes in the fair value of the Company’s stock are not recognized. Subsequent directors’ deferred compensation will increase stockholders’ equity. The shares related to the stock settlement obligation are reflected in the weighted average number of basic and diluted shares used for the EPS calculations.
In 2009, the Company placed approximately 120 thousand shares of Company stock from shares held as Treasury Stock in a rabbi trust to protect the interest of the plan participants in the event of a change of control.
73
Table of Contents
CHURCH & DWIGHT CO., INC. AND SUBSIDIARIES
NOTES TO CONSOLIDATED FINANCIAL STATEMENTS—(Continued)
15. Stock Based Compensation Plans
a. Stock Option Plans
The Company has options outstanding under four equity compensation plans. Under the Omnibus Equity Plan, the Company may grant options and other stock-based awards to employees and directors. Under the 1983 Stock Option Plan and the Stock Award Plan, the Company granted options to key management employees. Under the Stock Option Plan for Directors, the Company granted options to non-employee directors. Following adoption of the Omnibus Equity Plan by stockholders in 2008, no further grants may be made under the other plans. Options outstanding under the plans are issued at market value on the date of grant, vest on the third anniversary of the date of grant and must be exercised within ten years of the date of grant. If, upon termination of a participant’s employment (other than a termination for cause), a participant is at least 55 years old, has at least 5 years of service, and the sum of the participant’s age and years of service is at least 65, the participant may exercise any stock options granted in 2007 or later within a period of three years from the date of termination or, if earlier, the date such stock options otherwise would have expired, subject to specified conditions. A total of 10.5 million shares of the Company’s common stock is authorized for issuance upon the exercise of stock options. Issuances of Common Stock to satisfy employee option exercises are currently made from treasury stock.
Stock option transactions for the three years ended December 31, 2009 were as follows:
| Options | Weighted- Average Exercise Price | |||||
| Outstanding at January 1, 2007 |
4,578,811 | $ | 25.61 | |||
| Grants |
616,450 | 49.01 | ||||
| Exercised |
(875,839 | ) | 18.37 | |||
| Cancelled |
(88,100 | ) | 37.49 | |||
| Outstanding at December 31, 2007 |
4,231,322 | 30.24 | ||||
| Grants |
671,033 | 55.72 | ||||
| Exercised |
(596,883 | ) | 21.14 | |||
| Cancelled |
(47,724 | ) | 38.25 | |||
| Outstanding at December 31, 2008 |
4,257,748 | 35.42 | ||||
| Granted |
709,550 | 54.08 | ||||
| Exercised |
(467,802 | ) | 21.15 | |||
| Cancelled |
(51,250 | ) | 50.05 | |||
| Outstanding at December 31, 2009 |
4,448,246 | $ | 39.70 | |||
December 31, 2009, 2008 and 2007, options to purchase 2,531,146 shares, 2,103,646 shares and 2,120,207 shares were exercisable, respectively.
74
Table of Contents
CHURCH & DWIGHT CO., INC. AND SUBSIDIARIES
NOTES TO CONSOLIDATED FINANCIAL STATEMENTS—(Continued)
The table below summarizes information relating to options outstanding and exercisable at December 31, 2009.
| Options Outstanding | Options Exercisable | |||||||||||
| Range of Exercise Prices |
Outstanding as of 12/31/2009 |
Weighted Average Remaining Contractual Life |
Weighted Average Exercise Price |
Exercisable as of 12/31/2009 |
Weighted Average Exercise Price | |||||||
| $ 5.01 - $15.00 |
68,653 | 0.3 | $ | 11.14 | 68,653 | $ | 11.14 | |||||
| $15.01 - $25.00 |
692,783 | 2.6 | $ | 20.55 | 692,783 | $ | 20.55 | |||||
| $25.01 - $35.00 |
602,560 | 4.5 | $ | 30.30 | 602,560 | $ | 30.30 | |||||
| $35.01 - $45.00 |
1,167,150 | 5.8 | $ | 35.53 | 1,167,150 | $ | 35.53 | |||||
| $45.01 - $55.00 |
1,266,700 | 8.5 | $ | 51.76 | — | — | ||||||
| $55.01 - $65.00 |
650,400 | 8.4 | $ | 55.82 | — | — | ||||||
| 4,448,246 | 6.2 | $ | 39.70 | 2,531,146 | $ | 29.52 | ||||||
The table above represents the Company’s estimate of options fully vested and expected to vest. Expected forfeitures are not material and, therefore, are not reflected in the table above.
The following table provides information regarding the intrinsic value of stock options exercised, stock compensation expense related to the stock options, fair value of stock options and assumptions used in determining fair value:
| 2009 | 2008 | 2007 | ||||||||||
| Intrinsic Value of Stock Options Exercised (in millions) |
$ | 16.4 | $ | 21.4 | $ | 26.7 | ||||||
| Stock Compensation Expense Related to Stock Option Awards (in millions) |
$ | 11.8 | $ | 11.3 | $ | 10.6 | ||||||
| Issued Stock Options (in thousands) |
710 | 671 | 616 | |||||||||
| Weighted Average Fair Value of Stock Options issued (per share) |
$ | 14.83 | $ | 16.55 | $ | 16.87 | ||||||
| Fair Value of Stock Options Issued (in millions) |
$ | 10.5 | $ | 11.1 | $ | 10.4 | ||||||
| Assumptions Used: |
||||||||||||
| Risk-free interest rate |
3.2 | % | 3.7 | % | 5.0 | % | ||||||
| Expected life in Years |
6.4 | 6.6 | 6.3 | |||||||||
| Expected volatility |
21.9 | % | 22.5 | % | 25.0 | % | ||||||
| Dividend Yield |
0.7 | % | 0.6 | % | 0.6 | % | ||||||
The fair value of stock options is based upon the Black Scholes option pricing model. The Company determined the options’ life based on historical exercise behavior and determined the options’ expected volatility and dividend yield based on the historical changes in stock price and dividend payments. The risk free interest rate is based on the yield of an applicable term Treasury instrument.
As of December 31, 2009, there was a fair value of $8.6 million related to unamortized stock option compensation expense, which is expected to be recognized over a weighted-average period of approximately one year. The Company’s Consolidated Statements of Cash Flow reflects an add back to Net Cash Provided by Operating Activities of $12.7 million and $12.4 million in 2009 and 2008, respectively, for non cash compensation expense, primarily stock option expense. Net Cash Provided by (Used in) Financing Activities includes $5.0 million and $6.3 million in 2009 and 2008, respectively, of excess tax benefits on stock option exercised. The total tax benefit for 2009, 2008 and 2007 was $5.8, $7.5 and $10.1 million, respectively.
75
Table of Contents
CHURCH & DWIGHT CO., INC. AND SUBSIDIARIES
NOTES TO CONSOLIDATED FINANCIAL STATEMENTS—(Continued)
b. Restricted Stock Plan
During 2005, the Company instituted a program under which officers who, during a specified period of time, elect to receive up to 50% of their annual incentive compensation in shares of the Company’s common stock or stock equivalents, or otherwise increase their share ownership or ownership of certain interests deemed to be stock equivalents, will be awarded restricted shares having a fair market value of 20% of the amount of stock and stock equivalents that an officer elects to receive or otherwise acquires. The restricted shares vest on the third anniversary of the date of grant. During the three year vesting period, officers holding these shares will have voting rights and receive dividends either in cash or through reinvestment in additional shares.
Activity for the three years ended December 31, are as follows:
| 2009 | 2008 | 2007 | |||||||
| Shares issued (in thousands) |
5 | 5 | 3 | ||||||
| Total value granted (in millions) |
$ | 0.3 | $ | 0.3 | $ | 0.2 | |||
| Compensation expense (in millions) |
$ | 0.4 | $ | 0.5 | $ | 0.8 | |||
16. Comprehensive Income
Comprehensive income is defined as net income and other changes in stockholders’ equity from transactions and other events from sources other than stockholders. The components of changes in accumulated other comprehensive income (loss) are as follows:
| (In thousands) |
Foreign Currency Adjustments |
Defined Benefit Plans |
Derivative Agreements |
Accumulated Other Comprehensive Income (Loss) |
||||||||||||
| Balance January 1, 2007 |
$ | 19,301 | $ | (6,973 | ) | $ | (175 | ) | $ | 12,153 | ||||||
| Comprehensive income changes during the year |
21,034 | 7,029 | (1,088 | ) | 26,975 | |||||||||||
| Balance December 31, 2007 |
40,335 | 56 | (1,263 | ) | 39,128 | |||||||||||
| Comprehensive income changes during the year |
(47,508 | ) | (8,623 | ) | (3,451 | ) | (59,582 | ) | ||||||||
| Balance December 31, 2008 |
(7,173 | ) | (8,567 | ) | (4,714 | ) | (20,454 | ) | ||||||||
| Comprehensive income changes during the year |
34,120 | (4,726 | ) | 1,138 | 30,532 | |||||||||||
| Balance December 31, 2009 |
$ | 26,947 | $ | (13,293 | ) | $ | (3,576 | ) | $ | 10,078 | ||||||
The following table provides information related to the Company’s comprehensive income for the three years ended December 31, 2009:
| Twelve Months Ended December 31, | ||||||||||||
| (In thousands) |
2009 | 2008 | 2007 | |||||||||
| Net Income |
$ | 243,521 | $ | 195,182 | $ | 169,031 | ||||||
| Other Comprehensive Income, net of tax: |
||||||||||||
| Foreign Exchange Translation Adjustments |
34,129 | (47,518 | ) | 20,905 | ||||||||
| Defined Benefit Plan Adjustments |
(4,726 | ) | (8,623 | ) | 7,029 | |||||||
| Derivative Agreements |
1,138 | (3,451 | ) | (1,088 | ) | |||||||
| Comprehensive Income attributable to Church & Dwight Co., Inc. |
274,062 | 135,590 | 195,877 | |||||||||
| Comprehensive Income attributable to the noncontrolling interest |
3 | 2 | 123 | |||||||||
| Comprehensive Income |
$ | 274,065 | $ | 135,592 | $ | 196,000 | ||||||
76
Table of Contents
CHURCH & DWIGHT CO., INC. AND SUBSIDIARIES
NOTES TO CONSOLIDATED FINANCIAL STATEMENTS—(Continued)
17. Commitments, Contingencies and Guarantees
a. Rent expense amounted to $20.5 million in 2009, $22.2 million in 2008 and $17.2 million in 2007. The Company is obligated for minimum annual rentals under non-cancelable long-term operating leases as follows:
| (in thousands) |
|||
| 2010 |
$ | 21,673 | |
| 2011 |
17,857 | ||
| 2012 |
12,694 | ||
| 2013 |
9,339 | ||
| 2014 |
8,595 | ||
| 2015 and thereafter |
23,534 | ||
| Total future minimum lease commitments |
$ | 93,692 | |
The Company also has capital lease obligations at certain of its foreign subsidiaries. The commitments on these obligations are immaterial.
b. In December 1981, the Company formed a partnership with a supplier of raw materials that mines and processes sodium-based mineral deposits. The Company purchases the majority of its sodium-based raw material requirements from the partnership. This agreement terminates upon two years’ written notice by either company. The Company has an annual commitment to purchase 240,000 tons of sodium-based raw materials at the prevailing market price. The Company is not engaged in any other material transactions with the partnership or the Company’s partner.
c. Our distribution of condoms under the TROJAN and other trademarks is regulated by the U.S. Food and Drug Administration (“FDA”). Certain of our condoms, and similar condoms sold by our competitors, contain the spermicide nonoxynol-9 (“N-9”). Some interested groups have issued reports that N-9 should not be used rectally or for multiple daily acts of vaginal intercourse. In late 2008, the FDA issued final labeling guidance for latex condoms but excluded N-9 lubricated condoms from the guidance. While we await further FDA guidance on N-9 lubricated condoms we believe that our present labeling for condoms with N-9 is compliant with the overall objectives of the FDA’s guidance, and that condoms with N-9 will remain a viable contraceptive choice for those couples who wish to use them. However, we cannot predict the nature of the labeling that ultimately will be required by the FDA. If the FDA or state governments eventually promulgate rules that prohibit or restrict the use of N-9 in condoms (such as new labeling requirements), we could incur costs from obsolete products, packaging or raw materials, and sales of condoms could decline, which, in turn, could decrease our operating income.
d. As of December 31, 2009, the Company had commitments to acquire approximately $106.3 million of raw material, packaging supplies and services from its vendors at market prices. The packaging supplies are in either a converted or non-converted status. These commitments enable the Company to respond quickly to changes in customer orders or requirements.
e. The Company has $3.4 million of outstanding letters of credit drawn on several banks which guarantee payment for such things as insurance claims in the event of the Company’s insolvency. In addition, the Company guarantees the payment of rent on a leased facility in Spain. The lease expires in November 2012, and the accumulated monthly payments from December 31, 2009 through the remainder of the lease term will amount to approximately $2.2 million. Approximately two thirds of the rental space is subleased to a third party.
77
Table of Contents
CHURCH & DWIGHT CO., INC. AND SUBSIDIARIES
NOTES TO CONSOLIDATED FINANCIAL STATEMENTS—(Continued)
f. In connection with the Company’s acquisition of Unilever’s oral care brands in the United States and Canada in October 2003, the Company is required to make additional performance-based payments of a minimum of $5.0 million and a maximum of $12.0 million over the eight year period following the acquisition. The Company made cash payments of $0.8 million, and accrued a payment of $0.2 million in 2009. The payment and accrual were accounted for as additional purchase price. The Company has paid approximately $9.8 million, exclusive of the $0.2 million accrual, in additional performance-based payments since the acquisition.
g. During 2009, one of the Company’s international facilities discharged chemicals into the environment. The Company is currently developing a formal remediation plan, and based on available information, accrued approximately $3 million for remediation and related costs. However, we cannot assure that additional costs will not be incurred in connection with this matter.
h. The Company, in the ordinary course of its business, is the subject of, or a party to, various pending or threatened legal actions. The Company believes that any ultimate liability arising from these actions will not have a material adverse effect on its financial position, results of operations and cash flows.
18. Litigation Settlements
Abbott Laboratories
In April 2005, the Company filed suit against Abbott Laboratories, Inc. (“Abbott”) in the United States District Court for the District of New Jersey claiming infringement of certain patents resulting from Abbott’s manufacture and sale of its Fact Plus pregnancy diagnostic test kits. Following a trial in February 2008, the jury found that the Company’s patents were valid and willfully infringed by Abbott during the period from April 1999 through September 2003 and awarded damages to the Company in the amount of $14.6 million. On June 23, 2008, the District Court issued an opinion finding that Abbott’s conduct had been willful and doubled the damages awarded to the Company to $29.2 million, and on July 23, 2009 the District Court issued an opinion adding prejudgment interest in the sum of $8.8 million and costs of $51 thousand to the judgment, bringing the total judgment to over $38 million. Abbott filed an appeal. In a separate action commenced in July 2007, Abbott sued the Company in the United States District Court for the Northern District of Illinois for infringement of certain patents for which Abbott was an exclusive licensee. On September 17, 2009, the Company and Abbott agreed to settle the litigation. As part of the settlement, Abbott paid $27 million to the Company on October 2, 2009, after which the New Jersey and Illinois actions were both dismissed with prejudice. The Company recognized a gain, net of legal expenses, of $20.0 million as of September 2009, which is reflected in the results of the Consumer Domestic segment.
Andes Trading
On October 26, 2005, a New Jersey state court jury rendered a $15.0 million verdict against the Company. The verdict followed a trial involving a claim against the Company by Andes Trading de Mexico S.A., alleging that the Company breached a purported agreement granting the plaintiff exclusive distribution rights in Mexico with respect to the Company’s consumer products. Shortly after the verdict was rendered, the Company filed a motion for a new trial and for remittitur of the verdict. On December 9, 2005, the court granted the motion in part and denied it in part. The court reduced the damages to $9.8 million which was accrued in 2005, but did not grant the Company’s request for new trial. Subsequent to the court’s ruling, the Company and the plaintiff each appealed the ruling. In March 2007, the appeals court affirmed the lower court’s verdict. The Company chose not to appeal the decision of the appeals court and, on April 11, 2007, paid $10.4 million, including accrued interest, to settle this litigation.
78
Table of Contents
CHURCH & DWIGHT CO., INC. AND SUBSIDIARIES
NOTES TO CONSOLIDATED FINANCIAL STATEMENTS—(Continued)
19. Related Party Transactions
The following summarizes the balances and transactions between the Company and each of two 50% owned entities, Armand Products Company (“Armand”) and The ArmaKleen Company (“ArmaKleen”):
| Armand Year Ended December 31, |
ArmaKleen Year Ended December 31, | |||||||||||||||||
| (In millions) |
2009 | 2008 | 2007 | 2009 | 2008 | 2007 | ||||||||||||
| Purchases by Company |
$ | 9.9 | $ | 15.0 | $ | 9.6 | $ | — | $ | — | $ | — | ||||||
| Sales by Company |
$ | — | $ | — | $ | — | $ | 4.9 | $ | 5.2 | $ | 5.0 | ||||||
| Outstanding Accounts Receivable |
$ | — | $ | — | $ | 1.3 | $ | 0.5 | $ | 0.7 | $ | 1.1 | ||||||
| Outstanding Accounts Payable |
$ | 2.3 | $ | 1.0 | $ | 0.8 | $ | — | $ | — | $ | — | ||||||
| Administration & Management Oversight Services(1) |
$ | 1.7 | $ | 1.6 | $ | 1.6 | $ | 2.7 | $ | 2.7 | $ | 3.0 | ||||||
| (1) | Billed by Company and recorded as a reduction of selling, general and administrative expenses. |
20. Segments
Segment Information
The Company operates three reportable segments: Consumer Domestic, Consumer International and Specialty Products Division (“SPD”). These segments are determined based on differences in the nature of products and organizational and ownership structures. The Company also has a Corporate segment.
Segment revenues are derived from the sale of the following products:
| Segment |
Products | |
| Consumer Domestic | Household and personal care products | |
| Consumer International | Primarily personal care products | |
| Specialty Products | Specialty chemical products | |
The Corporate segment income consists of equity in earnings of affiliates. The Company had 50% ownership interests in Armand Products Company (“Armand”) and The ArmaKleen Company (“ArmaKleen”) as of December 31, 2009. The Company’s 50% ownership interest in Esseco U.K. LLP (“Esseco”) was divested in the first quarter of 2008 as part of the sale of Brotherton. The Company’s equity in earnings of Armand and ArmaKleen for the years ended December 31, 2009 and December 31, 2008, and Esseco for the for the year ended December 31, 2007 and the two months ended February 29, 2008 (prior to the sale of Brotherton) is included in the Corporate segment.
Some of the subsidiaries that are included in the Consumer International segment manufacture and sell personal care products to the Consumer Domestic segment. These sales are eliminated from the Consumer International segment results set forth below.
79
Table of Contents
CHURCH & DWIGHT CO., INC. AND SUBSIDIARIES
NOTES TO CONSOLIDATED FINANCIAL STATEMENTS—(Continued)
The following table presents selected financial information relating to the Company’s segments for each of the three years in the period ended December 31, 2009. All amounts are presented in thousands.
| Consumer Domestic(3) |
Consumer International(3) |
SPD | Corporate(1) | As Reported | ||||||||||||||||
| Net sales |
||||||||||||||||||||
| 2009 |
$ | 1,881,748 | $ | 393,696 | $ | 245,478 | $ | — | $ | 2,520,922 | ||||||||||
| 2008 |
1,716,801 | 420,192 | 285,405 | — | 2,422,398 | |||||||||||||||
| 2007 |
1,563,895 | 398,521 | 258,524 | — | 2,220,940 | |||||||||||||||
| Gross profit |
||||||||||||||||||||
| 2009 |
890,836 | 183,670 | 58,319 | (31,835 | ) | 1,100,990 | ||||||||||||||
| 2008 |
740,489 | 193,971 | 62,589 | (25,331 | ) | 971,718 | ||||||||||||||
| 2007 |
652,387 | 185,556 | 53,693 | (23,738 | ) | 867,898 | ||||||||||||||
| Marketing Expenses |
||||||||||||||||||||
| 2009 |
287,036 | 64,266 | 2,286 | — | 353,588 | |||||||||||||||
| 2008 |
229,358 | 62,191 | 2,581 | — | 294,130 | |||||||||||||||
| 2007 |
189,391 | 64,845 | 2,507 | — | 256,743 | |||||||||||||||
| Selling, General and Administrative Expenses |
||||||||||||||||||||
| 2009 |
270,154 | 77,524 | 38,667 | (31,835 | ) | 354,510 | ||||||||||||||
| 2008 |
239,535 | 92,082 | 30,970 | (25,331 | ) | 337,256 | ||||||||||||||
| 2007 |
218,299 | 79,804 | 31,756 | (23,738 | ) | 306,121 | ||||||||||||||
| Patent Litigation Settlement, net |
||||||||||||||||||||
| 2009 |
(20,000 | ) | — | — | — | (20,000 | ) | |||||||||||||
| 2008 |
— | — | — | — | — | |||||||||||||||
| 2007 |
— | — | — | — | — | |||||||||||||||
| Income From Operations |
||||||||||||||||||||
| 2009 |
353,646 | 41,880 | 17,366 | — | 412,892 | |||||||||||||||
| 2008 |
271,596 | 39,698 | 29,038 | — | 340,332 | |||||||||||||||
| 2007 |
244,697 | 40,907 | 19,430 | — | 305,034 | |||||||||||||||
| Equity In Earnings of Affiliates |
||||||||||||||||||||
| 2009 |
— | — | — | 12,050 | 12,050 | |||||||||||||||
| 2008 |
— | — | — | 11,334 | 11,334 | |||||||||||||||
| 2007 |
— | — | — | 8,236 | 8,236 | |||||||||||||||
| Interest Expense(2) |
||||||||||||||||||||
| 2009 |
30,464 | 3,608 | 1,496 | — | 35,568 | |||||||||||||||
| 2008 |
37,464 | 5,476 | 4,005 | — | 46,945 | |||||||||||||||
| 2007 |
47,526 | 7,615 | 3,751 | — | 58,892 | |||||||||||||||
| Investment Earnings(2) |
||||||||||||||||||||
| 2009 |
1,135 | 134 | 56 | — | 1,325 | |||||||||||||||
| 2008 |
5,384 | 787 | 576 | — | 6,747 | |||||||||||||||
| 2007 |
6,524 | 1,045 | 515 | — | 8,084 | |||||||||||||||
| Other Income & Expense(2) |
||||||||||||||||||||
| 2009 |
1,316 | 156 | 65 | — | 1,537 | |||||||||||||||
| 2008 |
(2,560 | ) | (374 | ) | (274 | ) | — | (3,208 | ) | |||||||||||
| 2007 |
1,993 | 319 | 157 | — | 2,469 | |||||||||||||||
80
Table of Contents
CHURCH & DWIGHT CO., INC. AND SUBSIDIARIES
NOTES TO CONSOLIDATED FINANCIAL STATEMENTS—(Continued)
| Consumer Domestic(3) |
Consumer International(3) |
SPD | Corporate(1) | As Reported | ||||||
| Income Before Income Taxes |
||||||||||
| 2009 |
325,633 | 38,562 | 15,991 | 12,050 | 392,236 | |||||
| 2008 |
236,956 | 34,635 | 25,335 | 11,334 | 308,260 | |||||
| 2007 |
205,688 | 34,656 | 16,351 | 8,236 | 264,931 | |||||
| Identifiable Assets |
||||||||||
| 2009 |
2,494,909 | 350,012 | 179,552 | 93,973 | 3,118,446 | |||||
| 2008 |
2,257,100 | 292,130 | 160,435 | 91,773 | 2,801,438 | |||||
| 2007 |
1,877,924 | 384,674 | 185,768 | 84,124 | 2,532,490 | |||||
| Capital Expenditures |
||||||||||
| 2009 |
125,117 | 4,636 | 5,626 | — | 135,379 | |||||
| 2008 |
90,283 | 4,081 | 3,955 | — | 98,319 | |||||
| 2007 |
38,762 | 7,914 | 2,200 | — | 48,876 | |||||
| Depreciation & Amortization |
||||||||||
| 2009 |
67,877 | 6,959 | 6,474 | 4,042 | 85,352 | |||||
| 2008 |
57,186 | 6,262 | 4,733 | 3,223 | 71,404 | |||||
| 2007 |
40,831 | 5,751 | 8,026 | 2,063 | 56,671 | |||||
| (1) | The Corporate segment reflects the following: |
| (A) | The administrative costs of the production planning and logistics functions are included in segment Selling, General and Administrative expenses but are elements of Cost of Sales in the Company’s Consolidated Statements of Income. Such amounts were $31.8 million, $25.3 million, and $23.7 million for 2009, 2008 and 2007, respectively. |
| (B) | Equity in earnings of affiliates from Armand Products and The Armakleen Company. |
| (C) | Corporate assets include note receivable, domestic deferred income taxes and the Company’s investment in unconsolidated affiliates. |
| (2) | In determining Income before Income Taxes, interest expense, investment earnings, and other income (expense) were allocated to the segments based upon each segment’s relative operating profit. |
| (3) | As of January 1, 2008, the Company modified its organizational structure, resulting in a change in classification of certain Consumer Domestic export sales to Consumer International. Therefore, 2007 results have been restated to reflect a reclassification in sales of $10.2 million for the twelve months ended December 31, 2007 , from the Consumer Domestic segment to the Consumer International segment. In addition, Income before Income Taxes of $1.5 million for the twelve months ended December 31, 2007 has been reclassified from the Consumer Domestic segment to the Consumer International segment. |
Other than the differences noted in footnotes (1) and (2) above, the accounting policies followed by each of the segments, including intersegment transactions, are substantially consistent with the accounting policies set forth in Note 1.
Intersegment sales from Consumer International to Consumer Domestic, which are not reflected in the table, were $3.0 million, $5.2 million and $5.0 million for the twelve months ended December 31, 2009, December 31, 2008 and December 31, 2007, respectively.
81
Table of Contents
CHURCH & DWIGHT CO., INC. AND SUBSIDIARIES
NOTES TO CONSOLIDATED FINANCIAL STATEMENTS—(Continued)
Product line revenues from external customers for each of the three years were as follows:
| (In thousands) |
2009 | 2008 | 2007 | ||||||
| Household Products |
$ | 1,196,474 | $ | 1,081,440 | $ | 991,141 | |||
| Personal Care Products |
685,274 | 635,361 | 572,754 | ||||||
| Total Consumer Domestic |
1,881,748 | 1,716,801 | 1,563,895 | ||||||
| Total Consumer International |
393,696 | 420,192 | 398,521 | ||||||
| Total SPD |
245,478 | 285,405 | 258,524 | ||||||
| Total Consolidated Net Sales |
$ | 2,520,922 | $ | 2,422,398 | $ | 2,220,940 | |||
Household Products include deodorizing and cleaning products and laundry products. Personal Care Products include condoms, pregnancy kits, oral care and skin care products.
Geographic Information
Approximately 81%, 78% and 78% of the net sales reported in the accompanying consolidated financial statements in 2009, 2008 and 2007, respectively were to customers in the United States. Approximately 95%, 94% and 92% of long-lived assets were located in the U.S. at December 31, 2009, 2008 and 2007, respectively. Other than the United States, no one country accounts for more than 6% of consolidated net sales and 3.3% of total assets.
Customers
A group of three Consumer Domestic customers accounted for approximately 32% of consolidated net sales in 2009, of which a single customer (Wal-Mart Stores, Inc.) accounted for approximately 22%. A group of three Consumer Domestic customers accounted for approximately 31% of consolidated net sales in 2008, of which Wal-Mart accounted for approximately 22%. A group of three Consumer Domestic customers accounted for approximately 30% of consolidated net sales in 2007 of which Wal-Mart accounted for approximately 22%.
21. Subsequent Events
The Company evaluated events that occurred after the balance sheet date through February 24, 2010, the date when the financial statements were issued. The following material events were identified:
| • | The Company closed on one of the transactions recorded in assets held for sale—See Note 8. |
| • | The Board of Directors of the Company approved the termination of its domestic pension plan—See Note 14. |
82
Table of Contents
CHURCH & DWIGHT CO., INC. AND SUBSIDIARIES
NOTES TO CONSOLIDATED FINANCIAL STATEMENTS—(Continued)
Unaudited Quarterly Financial Information
The unaudited quarterly results of operations are prepared in conformity with generally accepted accounting principles and reflect all adjustments that are, in the opinion of management, necessary for a fair presentation of the results of operations for the periods presented. Adjustments are of a normal, recurring nature, except as discussed in the accompanying notes. Due to rounding differences, quarterly net income per share may not add precisely to the annual amounts.
| (in thousands, except per share data) |
First Quarter |
Second Quarter |
Third Quarter |
Fourth Quarter |
Full Year | ||||||||||
| 2009 |
|||||||||||||||
| Net Sales |
$ | 580,867 | $ | 623,119 | $ | 646,157 | $ | 670,779 | $ | 2,520,922 | |||||
| Gross Profit |
249,358 | 281,551 | 284,885 | 285,196 | 1,100,990 | ||||||||||
| Income from Operations |
104,660 | 99,002 | 117,901 | 91,329 | 412,892 | ||||||||||
| Equity in Earnings of Affiliates |
2,705 | 3,993 | 2,704 | 2,648 | 12,050 | ||||||||||
| Net Income attributable to Church & Dwight |
62,569 | 58,156 | 70,028 | 52,780 | 243,533 | ||||||||||
| Net Income per Share-Basic |
$ | 0.89 | $ | 0.83 | $ | 0.99 | $ | 0.75 | $ | 3.46 | |||||
| Net Income per Share-Diluted |
$ | 0.88 | $ | 0.81 | $ | 0.98 | $ | 0.74 | $ | 3.41 | |||||
| 2008 |
|||||||||||||||
| Net Sales |
$ | 552,867 | $ | 593,959 | $ | 630,672 | $ | 644,900 | $ | 2,422,398 | |||||
| Gross Profit |
224,106 | 242,480 | 251,094 | 254,038 | 971,718 | ||||||||||
| Income from Operations |
92,762 | 81,883 | 85,548 | 80,139 | 340,332 | ||||||||||
| Equity in Earnings of Affiliates |
2,380 | 2,152 | 2,443 | 4,359 | 11,334 | ||||||||||
| Net Income attributable to Church & Dwight |
56,191 | 45,765 | 48,989 | 44,229 | 195,174 | ||||||||||
| Net Income per Share-Basic |
$ | 0.85 | $ | 0.69 | $ | 0.72 | $ | 0.63 | $ | 2.88 | |||||
| Net Income per Share-Diluted |
$ | 0.81 | $ | 0.66 | $ | 0.69 | $ | 0.62 | $ | 2.78 | |||||
| 2007 |
|||||||||||||||
| Net Sales |
$ | 514,335 | $ | 546,472 | $ | 580,438 | $ | 579,695 | $ | 2,220,940 | |||||
| Gross Profit |
199,876 | 216,693 | 229,407 | 221,922 | 867,898 | ||||||||||
| Income from Operations |
82,143 | 76,550 | 88,615 | 57,726 | 305,034 | ||||||||||
| Equity in Earnings of Affiliates |
2,260 | 1,760 | 1,797 | 2,419 | 8,236 | ||||||||||
| Net Income attributable to Church & Dwight |
45,099 | 40,533 | 51,716 | 31,677 | 169,025 | ||||||||||
| Net Income per Share-Basic |
$ | 0.69 | $ | 0.62 | $ | 0.78 | $ | 0.48 | $ | 2.57 | |||||
| Net Income per Share-Diluted |
$ | 0.66 | $ | 0.59 | $ | 0.75 | $ | 0.46 | $ | 2.46 | |||||
In the third and fourth quarters of 2009, the Company recorded fixed asset impairment charges of $4.4 million and $2.5 million, respectively, relating to the carrying value of assets associated with one of its international subsidiaries. These charges are associated with products that compete with imports priced in U.S. dollars. As the dollar has weakened, it has been necessary to lower prices in the local currency to stay competitive, leading to negative cash flows.
In the third quarter of 2009, the Company recorded a pre-tax gain of $20 million, net of expenses, related to the patent infringement legal settlement with Abbott.
In connection with the shutdown of its North Brunswick, New Jersey facility, the Company recorded accelerated depreciation charges of approximately $4 million in each of the four quarters of 2009, and in the fourth quarter also recorded a $7.2 million charge associated with operating leases no longer in use.
83
Table of Contents
CHURCH & DWIGHT CO., INC. AND SUBSIDIARIES
NOTES TO CONSOLIDATED FINANCIAL STATEMENTS—(Continued)
In the first quarter of 2008, the Company sold its United Kingdom subsidiary, which resulted in a pre-tax gain of $3.0 million, and the Company recorded an asset impairment charge of $5.6 million due to its decision to exit a business.
In the fourth quarter of 2008 and 2007, the Company recorded impairments of intangible assets of $2.2 million and $4.2 million, respectively. These impairments were a result of lost distribution at key customer accounts and to a lesser extent lost profitability.
In the fourth quarter of 2007, the Company recorded a $3.5 million charge associated with the reorganization of its Canadian subsidiary.
84
Table of Contents
| ITEM 9. | CHANGES IN AND DISAGREEMENTS WITH ACCOUNTANTS ON ACCOUNTING AND FINANCIAL DISCLOSURE |
Not applicable.
| ITEM 9A. | CONTROLS AND PROCEDURES |
a) Evaluation of Disclosure Controls and Procedures
The Company’s management, with the participation of the Company’s Chief Executive Officer and Chief Financial Officer, evaluated the effectiveness of the Company’s disclosure controls and procedures at the end of the period covered by this report. Based on that evaluation, the Chief Executive Officer and Chief Financial Officer concluded that the Company’s disclosure controls and procedures as of the end of the period covered by this report are functioning effectively to provide reasonable assurance that the information required to be disclosed by the Company in reports filed under the Securities Exchange Act of 1934 is (i) recorded, processed, summarized and reported within the time periods specified in the SEC’s rules and forms, and (ii) accumulated and communicated to the Company’s management, including the Chief Executive Officer and Chief Financial Officer, as appropriate to allow timely decisions regarding the disclosure.
b) Management’s Report on Internal Control Over Financial Reporting
Our management’s report on internal control over financial reporting is set forth in Item 8 of this annual report on Form 10-K and is incorporated by reference herein. Our independent registered public accounting firm has issued an audit report on the effectiveness of the Company’s internal control over financial reporting, which is set forth in Item 8 of this Annual Report on Form 10-K.
c) Change in Internal Control over Financial Reporting
No change in the Company’s internal control over financial reporting occurred during the Company’s most recent fiscal quarter that has materially affected, or is reasonably likely to materially affect, the Company’s internal control over financial reporting.
| ITEM 9B. | OTHER INFORMATION |
Not applicable.
85
Table of Contents
PART III
| ITEM 10. | DIRECTORS, EXECUTIVE OFFICERS AND CORPORATE GOVERNANCE |
Information required by this item is incorporated by reference to the Company’s definitive proxy statement which will be filed with the Commission not later than 120 days after the close of the fiscal year covered by this report.
| ITEM 11. | EXECUTIVE COMPENSATION |
Information required by this item is incorporated by reference to the Company’s definitive proxy statement which will be filed with the Commission not later than 120 days after the close of the fiscal year covered by this report.
| ITEM 12. | SECURITY OWNERSHIP OF CERTAIN BENEFICIAL OWNERS AND MANAGEMENT AND RELATED STOCKHOLDER MATTERS |
Information required by this item is incorporated by reference to the Company’s definitive proxy statement which will be filed with the Commission not later than 120 days after the close of the fiscal year covered by this report.
| ITEM 13. | CERTAIN RELATIONSHIPS AND RELATED TRANSACTIONS, AND DIRECTOR INDEPENDENCE |
Information required by this item is incorporated by reference to the Company’s definitive proxy statement which will be filed with the Commission not later than 120 days after the close of the fiscal year covered by this report.
| ITEM 14. | PRINCIPAL ACCOUNTING FEES AND SERVICES |
Information required by this item is incorporated by reference to the Company’s definitive proxy statement which will be filed with the Commission not later than 120 days after the close of the fiscal year covered by this report.
86
Table of Contents
PART IV
| ITEM 15. | EXHIBITS, FINANCIAL STATEMENT SCHEDULES |
(a) 1. Financial Statements and Schedule
The following Consolidated Financial Statements included in Item 8 of this Form 10-K:
| Consolidated Statements of Income for each of the three years in the period ended December 31, 2009 |
43 | |
| Consolidated Balance Sheets as of December 31, 2009 and 2008 |
44 | |
| 45 | ||
| 47 | ||
| 49 | ||
| II-1 | ||
(a) 3. Exhibits
Unless otherwise noted, the file number for all Company filings with the Securities and Exchange Commission referenced below is 1-10585.
| (3) |
(a) | Restated Certificate of Incorporation of the Company, as amended, incorporated by reference to Exhibit 3.2 to the Company’s quarterly report on Form 10-Q for the quarter ended April 1, 2005. | ||||
| (b) | By-laws of the Company as amended, incorporated by reference to Exhibit 3.1 to the Company’s current report on Form 8-K filed on February 3, 2009. | |||||
| (4) |
(a) | Indenture, dated December 22, 2004, by and between Church & Dwight Co., Inc. and The Bank of New York, as trustee, incorporated by reference to Exhibit 4.1 of the Company’s current report on Form 8-K dated December 27, 2004. Includes form of the Company’s 6% Senior Subordinated Notes. | ||||
| (10) |
(a) | Asset Purchase Agreement, dated as of March 28, 2008, by and between Church & Dwight Co., Inc. and Del Pharmaceuticals, Inc., incorporated by reference to Exhibit 10.1 to the Company’s quarterly report on Form 10-Q for the quarter ended September 26, 2008. | ||||
| (b) | Purchase and Sale Agreement, dated January 16, 2003, by and between Church & Dwight Co., Inc. and Harrison Street Funding LLC, incorporated by reference to Exhibit 5.1 to the Company’s current report on Form 8-K filed on January 30, 2003. | |||||
| (c) | Receivables Purchase Agreement, dated January 16, 2003, by and between Harrison Street Funding, LLC, Church & Dwight Co., Inc., Market Street Funding Corporation and PNC Bank, incorporated by reference to Exhibit 5.2 to the Company’s current report on Form 8-K filed on January 30, 2003. | |||||
| (d) | First Amendment to the Receivables Purchase Agreement, dated September 26, 2003, by and between Harrison Street Funding, LLC, Church & Dwight Co., Inc., Market Street Funding Corporation and PNC Bank, incorporated by reference to Exhibit 10(c) to the Company’s annual report on Form 10-K for the year ended December 31, 2005. | |||||
| (e) | Second Amendment to the Receivables Purchase Agreement, dated July 20, 2004, by and between Harrison Street Funding, LLC, Church & Dwight Co., Inc., Market Street Funding Corporation and PNC Bank, incorporated by reference to Exhibit 10(e) to the Company’s annual report on Form 10-K for the year ended December 31, 2004. | |||||
87
Table of Contents
| (f) | Third Amendment to the Receivables Purchase Agreement, dated April 12, 2006, by and between Harrison Street Funding, LLC, Church & Dwight Co., Inc., Market Street Funding Corporation and PNC Bank. Incorporated by reference to Exhibit 10(f) to the Company’s annual report on Form 10-K for the year ended December 31, 2008. | |||||
| (g) | Fourth Amendment to the Receivables Purchase Agreement, dated March 15, 2007, by and between Harrison Street Funding, LLC, Church & Dwight Co., Inc., Market Street Funding Corporation and PNC Bank. Incorporated by reference to Exhibit 10(g) to the Company’s annual report on Form 10-K for the year ended December 31, 2008. | |||||
| (h) | Fifth Amendment to the Receivables Purchase Agreement, dated April 10, 2007, by and between Harrison Street Funding, LLC, Church & Dwight Co., Inc., Market Street Funding Corporation and PNC Bank. Incorporated by reference to Exhibit 10(h) to the Company’s annual report on Form 10-K for the year ended December 31, 2008. | |||||
| (i) | Sixth Amendment to the Receivables Purchase Agreement, dated February 17, 2009, by and between Harrison Street Funding, LLC, Church & Dwight Co., Inc., Market Street Funding Corporation and PNC Bank. Incorporated by reference to Exhibit 10(i) to the Company’s annual report on Form 10-K for the year ended December 31, 2008. | |||||
| • |
(j) | Seventh Amendment to the Receivables Purchase Agreement, dated February 16, 2010, by and between Harrison Street Funding, LLC, Church & Dwight Co., Inc., Market Street Funding Corporation and PNC Bank. | ||||
| (k) | Amended and Restated Credit Agreement, dated December 23, 2005, by and between Church & Dwight Co., Inc., several banks and other financial institutions, The Bank of Nova Scotia, Bank of America, N.A. and National City Bank, each as a documentation agent, Citicorp North America, Inc., as syndication agent, and J.P. Morgan Chase Bank, N.A., as administrative agent, incorporated by reference to Exhibit 99.1 to the Company’s current report on Form 8-K filed on January 9, 2006. | |||||
| (l) | Amendment, dated August 17, 2006, to the Amended and Restated Credit Agreement, dated December 23, 2005, by and between Church & Dwight Co., Inc. and The Bank of Nova Scotia, Bank of America, N.A. and National City Bank, each as a documentation agent, Citicorp North America, Inc. as syndication agent, and J.P. Morgan Chase Bank, N.A., as administrative agent, incorporated by reference to Exhibit 10(a) to the Company’s annual report on Form 10-K for the year ended December 31, 2006. | |||||
| (m) | Amendment, dated June 3, 2008, to the Amended and Restated Credit Agreement, dated December 23, 2005, by and between Church & Dwight Co., Inc. and The Bank of Nova Scotia, Bank of America, N.A. and National City Bank, each as a documentation agent, Citicorp North America, Inc. as syndication agent, and J.P. Morgan Chase Bank, N.A., as administrative agent, incorporated by reference to Exhibit 99.1 to the Company’s current report on Form 8-K filed on June 3, 2008. | |||||
| *(n) | Church & Dwight Co., Inc. Executive Deferred Compensation Plan, effective as of June 1, 1997, incorporated by reference to Exhibit 10(f) to the Company’s annual report on Form 10-K for the year ended December 31, 1997. | |||||
| *(o) | Church & Dwight Co., Inc. Executive Deferred Compensation Plan II, effective as of January 1, 2009. Incorporated by reference to Exhibit 10(n) to the Company’s annual report on Form 10-K for the year ended December 31, 2008. | |||||
| *(p) | Amended and Restated Deferred Compensation Plan for Directors effective as of May 1, 2008 incorporated by reference to Exhibit 10.5 to the Company’s quarterly report on Form 10-Q for the quarter ended March 28, 2008. | |||||
88
Table of Contents
| *(q) | The Stock Option Plan for Directors, effective as of January 1, 1991, incorporated by reference to Exhibit 10(j) to the Company’s annual report on Form 10-K for the year ended December 31, 2005. | |||||
| *(r) | Compensation Plan for Directors, effective May 1, 2008, incorporated by reference to Exhibit 10.4 to the Company’s quarterly report on Form 10-Q for the quarter ended March 28, 2008. | |||||
| *(s) | The Church & Dwight Co., Inc. Stock Award Plan as amended, incorporated by reference to Exhibit 10 to the Company’s quarterly report on Form 10-Q for the quarter ended June 29, 2007. | |||||
| *(t) | Employment Agreement, dated June 11, 2004, by and between Church & Dwight Co., Inc. and James R. Craigie incorporated by reference to an Exhibit 10(s) to the Company’s annual report on Form 10-K for the year ended December 31, 2004. | |||||
| *(u) | Employment Agreement, dated June 1, 2002, by and between Armkel, LLC and Adrian Huns incorporated by reference to an Exhibit 10(u) to the Company’s annual report on Form 10-K for the year ended December 31, 2004. | |||||
| *(v) | Employment Agreement, dated January 3, 2002, by and between Church & Dwight Co., Inc. and Joseph A. Sipia, Jr., incorporated by reference to Exhibit 10(j) to the Company’s annual report on Form 10-K for the year ended December 31, 2001. | |||||
| *(w) | Employment Agreement, dated July 16, 2004, by and between Church & Dwight Co., Inc. and Louis H. Tursi, incorporated by reference to an Exhibit 10(w) to the Company’s annual report on Form 10-K for the year ended December 31, 2004. | |||||
| *(x) | Employment Agreement, dated August 23, 2006, by and between the Company and Matthew T. Farrell, incorporated by reference to Exhibit 10.1 to the Company’s quarterly report on Form 10-Q for the quarter ended September 29, 2006. | |||||
| *(y) | Form of Change in Control and Severance Agreement, dated September 19, 2006, by and between Church & Dwight Co., Inc. and each of the Company’s executive officers, with the exception of James R. Craigie, incorporated by reference to Exhibit 10(t) to the Company’s annual report on Form 10-K for the year ended December 31, 2006. | |||||
| *(z) | Change in Control and Severance Agreement, dated September 19, 2006, by and between Church & Dwight Co., Inc. and James R. Craigie, incorporated by reference to Exhibit 10(t) to the Company’s annual report on Form 10-K for the year ended December 31, 2007. | |||||
| *(aa) | Church & Dwight Co., Inc., Omnibus Equity Compensation Plan, incorporated by reference to Exhibit A to the Company’s Proxy Statement for its 2008 Annual Meeting of Shareholders, filed on March 28, 2008. | |||||
| • |
(11) |
Computation of earnings per share | ||||
| • |
(12) |
Computation of ratios of earnings to fixed charges. | ||||
| • |
(21) |
List of the Company’s subsidiaries. | ||||
| • |
(23.1) |
Consent of Independent Registered Public Accounting Firm. | ||||
| • |
(31.1) |
Certification of the Chief Executive Officer of the Company pursuant to Rule 13a-14(a) under the Securities Exchange Act. | ||||
| • |
(31.2) |
Certification of the Chief Financial Officer of the Company pursuant to Rule 13a-14(a) under the Securities Exchange Act. | ||||
89
Table of Contents
| • |
(32.1) |
Certification of the Chief Executive Officer of the Company pursuant to Rule 13a-14(b) under the Exchange Act and 18 U.S.C. Section 1350. | ||||
| • |
(32.2) |
Certification of the Chief Financial Officer of the Company pursuant to Rule 13a-14(b) under the Exchange Act and 18 U.S.C. Section 1350. | ||||
| • | Indicates documents filed herewith. |
| * | Constitutes management contract or compensatory plan or arrangement required to be filed as an exhibit to this Form 10-K. |
90
Table of Contents
SIGNATURES
Pursuant to the requirements of Section 13 or 15(d) of the Securities Exchange Act of 1934, the Registrant has duly caused this report to be signed on its behalf by the undersigned, thereunto duly authorized, on February 24, 2010.
| CHURCH & DWIGHT CO., INC. | ||
| By: |
/s/ JAMES R. CRAIGIE | |
| James R. Craigie | ||
| Chairman and Chief Executive Officer | ||
91
Table of Contents
Pursuant to the requirements of the Securities Exchange Act of 1934, this report has been signed below by the following persons on behalf of the Registrant and in the capacities and on the dates indicated.
| /s/ T. ROSIE ALBRIGHT T. Rosie Albright |
Director | February 24, 2010 | ||
| /s/ JAMES R. CRAIGIE James R. Craigie |
Chairman and Chief Executive Officer |
February 24, 2010 | ||
| /s/ ROBERT A. DAVIES, III Robert A. Davies, III |
Director | February 24, 2010 | ||
| /s/ ROSINA B. DIXON Rosina B. Dixon |
Director | February 24, 2010 | ||
| /s/ BRADLEY C. IRWIN Bradley C. Irwin |
Director | February 24, 2010 | ||
| /s/ J. RICHARD LEAMAN, JR. J. Richard Leaman, Jr. |
Director | February 24, 2010 | ||
| /s/ ROBERT D. LEBLANC Robert D. LeBlanc |
Director | February 24, 2010 | ||
| /s/ JEFFREY A. LEVICK Jeffrey A. Levick |
Director | February 24, 2010 | ||
| /s/ RAVI K. SALIGRAM Ravi K. Saligram |
Director | February 24, 2010 | ||
| /s/ ROBERT K. SHEARER Robert K. Shearer |
Director | February 24, 2010 | ||
| /s/ ART WINKLEBLACK Art Winkleblack |
Director | February 24, 2010 | ||
| /s/ MATTHEW T. FARRELL Matthew T. Farrell |
Executive Vice President and Chief Financial Officer (Principal Financial Officer) |
February 24, 2010 | ||
| /s/ STEVEN J. KATZ Steven J. Katz |
Vice President and Controller (Principal Accounting Officer) | February 24, 2010 | ||
92
Table of Contents
CHURCH & DWIGHT CO., INC AND SUBSIDIARIES
SCHEDULE II—Valuation and Qualifying Accounts
| Beginning Balance |
Additions | Deductions | Foreign Exchange |
Ending Balance | |||||||||||||||||
| Charged to Expenses |
Acquired | Amounts Written Off |
|||||||||||||||||||
| Allowance for Doubtful Accounts |
|||||||||||||||||||||
| 2009 |
$ | 5,427 | $ | 549 | $ | — | $ | (311 | ) | $ | 117 | $ | 5,782 | ||||||||
| 2008 |
4,548 | 2,130 | 113 | (1,230 | ) | (134 | ) | 5,427 | |||||||||||||
| 2007 |
2,258 | 2,623 | — | (456 | ) | 123 | 4,548 | ||||||||||||||
| Allowance for Cash Discounts |
|||||||||||||||||||||
| 2009 |
$ | 4,277 | $ | 48,589 | $ | — | $ | (48,762 | ) | $ | 32 | $ | 4,136 | ||||||||
| 2008 |
3,978 | 44,696 | 167 | (44,525 | ) | (39 | ) | 4,277 | |||||||||||||
| 2007 |
3,838 | 40,924 | — | (40,809 | ) | 25 | 3,978 | ||||||||||||||
| Sales Returns and Allowances |
|||||||||||||||||||||
| 2009 |
$ | 19,783 | $ | 43,486 | $ | (3,069 | ) | $ | (50,032 | ) | $ | 88 | $ | 10,256 | |||||||
| 2008 |
11,588 | 51,645 | 6,870 | (50,151 | ) | (169 | ) | 19,783 | |||||||||||||
| 2007 |
12,528 | 43,621 | — | (44,694 | ) | 133 | 11,588 | ||||||||||||||
II-1