Attached files
Table of Contents
UNITED STATES
SECURITIES AND EXCHANGE COMMISSION
Washington, D.C. 20549
FORM 10-K
(Mark One)
| x | ANNUAL REPORT PURSUANT TO SECTION 13 OR 15(d) OF THE SECURITIES EXCHANGE ACT OF 1934 |
For the fiscal year ended December 31, 2009
or
| ¨ | TRANSITION REPORT PURSUANT TO SECTION 13 OR 15(d) OF THE SECURITIES EXCHANGE ACT OF 1934 |
For the transition period from to
Commission File Number: 001-34088
Brink’s Home Security Holdings, Inc.
(Exact name of registrant as specified in its charter)
| Virginia | 80-0188977 | |
| (State or other jurisdiction of incorporation or organization) |
(I.R.S. Employer Identification No.) |
8880 Esters Boulevard, Irving, TX 75063
(Address of principal executive offices) (Zip Code)
(972) 871-3500
(Registrant’s telephone number, including area code)
Securities registered pursuant to Section 12(b) of the Act:
| Title of each class |
Name of each exchange on which registered | |
| Common Stock, no par value | New York Stock Exchange |
Securities registered pursuant to section 12(g) of the Act: None
(Title of class)
Indicate by check mark if the registrant is a well-known seasoned issuer, as defined in Rule 405 of the Securities Act. Yes x No ¨
Indicate by check mark if the registrant is not required to file reports pursuant to Section 13 or Section 15(d) of the Act. Yes ¨ No x
Indicate by check mark whether the registrant: (1) has filed all reports required to be filed by Section 13 or 15(d) of the Securities Exchange Act of 1934 during the preceding 12 months (or for such shorter period that the registrant was required to file such reports), and (2) has been subject to such filing requirements for the past 90 days. Yes x No ¨
Indicate by check mark whether the registrant has submitted electronically and posted on its corporate Web site, if any, every Interactive Data File required to be submitted and posted pursuant to Rule 405 of Regulation S-T (§232.405 of this chapter) during the preceding 12 months (or for such shorter period that the registrant was required to submit and post such files). Yes ¨ No ¨
Indicate by check mark if disclosure of delinquent filers pursuant to Item 405 of Regulation S-K (§ 229.405 of this chapter) is not contained herein, and will not be contained, to the best of registrant’s knowledge, in definitive proxy or information statements incorporated by reference in Part III of this Form 10-K or any amendment to this Form 10-K. ¨
Indicate by check mark whether the registrant is a large accelerated filer, an accelerated filer, a non-accelerated filer, or a smaller reporting company. See the definitions of “large accelerated filer,” “accelerated filer” and “smaller reporting company” in Rule 12b-2 of the Exchange Act. (Check one):
| Large accelerated filer | x | Accelerated filer | ¨ | |||
| Non-accelerated filer | ¨ | Smaller reporting company | ¨ | |||
Indicate by check mark whether the registrant is a shell company (as defined in Rule 12b-2 of the Exchange Act). Yes ¨ No x
As of June 30, 2009, the aggregate market value of the voting and non-voting common equity held by non-affiliates was $1,292,671,261. For purposes of this calculation, the registrant has assumed that stockholders that are not officers or directors of the registrant are not affiliates of the registrant.
As of February 23, 2010, there were issued and outstanding 45,872,480 shares of common stock.
Documents incorporated by reference: Part III incorporates information by reference from portions of the Registrant’s definitive 2010 Proxy Statement.
Table of Contents
BRINK’S HOME SECURITY HOLDINGS, INC.
FORM 10-K
FOR THE YEAR ENDED DECEMBER 31, 2009
TABLE OF CONTENTS
Table of Contents
PART I
| ITEM 1. | BUSINESS |
Overview
Brink’s Home Security Holdings, Inc., which was incorporated in Virginia in 2008, is a full service provider of residential and business security systems. We conduct business in one operating segment primarily through our operating subsidiary, Broadview Security, Inc. (“Broadview Security”), which markets, installs, services, and monitors security alarm systems throughout North America. We serve approximately 1.4 million customers in the United States and two Canadian provinces. We have developed a reputation for reliability and superior service by making high quality and affordable monitored alarm systems widely available to homeowners and businesses. We believe we are the second largest provider of security alarm monitoring services for residential and commercial properties in North America.
As used in this Report, (a) references to “Holdings,” “Company,” “we,” “us” and “our” refer to Brink’s Home Security Holdings, Inc. and its consolidated subsidiaries, including Broadview Security, after the spin-off transaction described below, and (b) references to the “Company” on a historical basis, prior to the spin-off, refer to Brink’s Home Security, Inc. and its consolidated subsidiaries, in each case unless the context requires otherwise.
Recent Developments
On January 18, 2010, we announced that we signed a definitive agreement and plan of merger (“Merger Agreement”) to be merged into a wholly-owned subsidiary of Tyco International Ltd (“Tyco”) in a transaction valued at approximately $2.0 billion (the “Merger”). Under the terms of the Merger Agreement, for each share of our common stock outstanding, our shareholders will generally have the right to receive, at the election of the shareholder, (a) 42.50 in cash (subject to proration to reflect an overall cap on the amount of cash to be paid by Tyco), (b) a combination of $12.75 in cash and a fraction of a Tyco share equal to $29.75 divided by the volume weighted-average price of Tyco’s shares on the New York Stock Exchange (“NYSE”) during the 10-trading day period ending on the fourth full day prior to the closing date, subject to collar between $32.97 and $40.29, or (c) Tyco shares equal to $42.50 divided by the volume weighted-average price detailed in (b) above, subject to the same collar. The Merger is subject to customary closing conditions, various regulatory approvals and approval of our shareholders. We currently expect the Merger to close in the second or third quarter of calendar year 2010. Upon closing of the Merger, we anticipate that Broadview Security will be combined with Tyco’s ADT security business under the ADT brand.
History of Our Business
Broadview Security, formerly Brink’s Home Security, Inc., was incorporated in Delaware in 1983 as a wholly owned subsidiary of The Brink’s Company (“BCO”) to address the growing home security market. Broadview Security became a wholly-owned subsidiary of Holdings upon completion of the spin-off transaction described below.
On September 12, 2008, the Board of Directors of BCO approved the separation of BCO into two independent, publicly traded companies through the distribution of 100% of the common stock of Brink’s Home Security, a wholly-owned subsidiary of BCO, to shareholders of BCO (the “Spin-off”). To effect the Spin-off, BCO transferred all outstanding shares of Brink’s Home Security to Holdings, another wholly owned subsidiary of BCO, through a series of transactions pursuant to a Separation and Distribution Agreement between BCO and Holdings. On October 31, 2008, BCO distributed all of the shares of Holdings to the stockholders of BCO at a ratio of one share of Holdings common stock for each share of BCO common stock held by each such holder as of the record date of October 21, 2008. On November 3, 2008, after completion of the Spin-off, we began trading “regular way” as an independent public company on the NYSE under the symbol “CFL”, reflecting our corporate mission of creating “Customers For Life.”
In connection with the Spin-off, we entered into a Brand Licensing Agreement with a subsidiary of BCO. Under the agreement, we are entitled to use certain BCO trademarks for no more than three years from the Spin-off date. We announced Broadview Security as our new brand name on June 30, 2009 and have begun the process to transition away from our heritage name. The change was a name change only. The corporate structure and management of the Company remain the same. We began marketing efforts in July 2009 to promote brand awareness through advertisements via television media, internet, direct mail, yellow pages, and messaging to our existing subscriber base (the “Brand Introduction”). The Brand Introduction also includes costs to create the new brand, convert building signage, re-decal our vehicle fleet, issue new technician uniforms, change customer yard signs, and other similar brand conversion activities. We monitor the awareness, perception, and acceptance of the Broadview Security brand name periodically to guide us on the method, extent, and duration of the Brand Introduction and to determine if we will cease to use our heritage brand name prior to the termination of the Brand Licensing Agreement with BCO on October 31, 2011. Future spending on the Brand Introduction and use of our heritage name is contingent on the outcome of the Merger.
3
Table of Contents
Business Fundamentals
We serve a geographically diverse customer base of approximately 1.4 million subscribers located throughout the United States and Western Canada. Our primary customers are residents of single-family homes, which comprise more than 93% of our subscriber base. The majority of new customers are generated organically through our internal sales force, while the remainder is acquired through our authorized dealer program and, to a lesser extent, through partnerships with leading home builders.
We view our business as having two key activities: managing our existing customer base and acquiring new customers. We operate our business with the goal of retaining customers for long periods of time to recoup the initial investment in new subscribers, achieving cash flow break-even in approximately four years. Management of the existing subscriber base is focused on low customer attrition, or customer disconnect rate, which has ranged from 7.0% to 8.2% annually over the past three years.
The predictability of our revenues has enabled us to generate stable cash flow from operations, a substantial portion of which is reinvested each year, at our discretion, to grow the subscriber base. Our ending subscriber base grew 4.4% in 2009, as compared to 6.3% growth in 2008. Growing the subscriber base requires significant upfront cash investment, consisting primarily of direct materials and labor to install the security systems, direct sales costs, indirect sales costs, marketing costs, and administrative costs related to installation activities. For the last few years, our average total upfront cash outlay for a new customer security system installed by one of our field offices, including amounts expensed and capitalized, has ranged from approximately $1,350 to $1,700. This amount does not take into account upfront installation fees collected from customers, which, on average, have ranged from $250 to $340. Including these payments, our net cash cost per new installation in recent periods has ranged from $1,100 to $1,360. The economics of our installation business varies slightly depending on the customer acquisition channel.
On average, each of our existing subscribers pays us approximately $33 per month in recurring cash revenue. The average recurring cash revenue per customer has grown consistently each year as new customers acquired have higher average cash revenue rates. In 2009, the average cash revenue per customer grew 4.5%. We use the cash margin generated on that revenue to offset the initial investment made in new subscribers. Our focus on keeping customer disconnect rates low is fundamental to the success of our economic model.
We are subject to a certain level of seasonality in our operations. Since more household moves take place during the second and third quarters of each year, our disconnect rate and related non-cash expenses are typically higher in those quarters than in the first and fourth quarters. There is a slight seasonal effect on our new customer installation volume and related cash expenses incurred in investment in new subscribers; however, other factors, such as the level of marketing expense, can offset that effect of seasonality.
See Item 7, “Management’s Discussion and Analysis of Financial Condition and Results of Operations” and Note 14 – Geographic Information, for more information regarding monthly recurring revenue, subscriber growth, disconnect rates, adjusted EBITDA from recurring services, adjusted cash invested in new subscribers, and financial information about geographic areas over the past three years.
Marketing and Sales
To grow the subscriber base and to create brand awareness, we market our security systems through national television advertisements, internet advertising, yellow pages, direct mail, alliances with other consumer-based companies, inbound telemarketing, and sales specialists in both Company field offices and our dealer network. Our “direct response” marketing efforts are designed to generate and direct telephone calls and internet traffic into our centralized inbound telemarketing sales group. In addition, on a localized basis, we participate in many different types of local events to promote our services to prospective customers, including home shows, family expos, retail events, and various industry trade shows and meetings. Our marketing efforts primarily focus on credit worthy homeowners that are desirous of security monitoring services.
4
Table of Contents
Sales are generally closed over the telephone by the centralized sales group or by field sales personnel during on-site consultations with prospective customers. Our reliance on strict standards for our internal sales force and our dealers enables us to better control the sales process from inception to installation and manage the quality of customer service over the life of the contract. Other sales distribution channels include:
| • | our field sales force, which self-generates additional sales from prospective residential and commercial customers; |
| • | our authorized dealer network, which cost-effectively extends our reach into new geographic areas by aligning with select independent security installers; strategic alliances with other service companies, including home inspection firms, which target new home owners early in the home buying process; |
| • | our new housing construction customer acquisition (“Builder”) division. Builder, which partners with large national and regional homebuilders to install home security systems, home networking, communications, and home theater and entertainment systems, directly for the owners of new homes and homes under construction; |
| • | and our national account team, which generates sales from commercial clients with multiple locations. |
Although our business is concentrated in residential security, we also market and sell security systems and monitoring services to the commercial market. We believe that expansion of our commercial customer base is a significant growth opportunity for us. Commercial security customers represented approximately 5% of our total customer base as of December 31, 2009. Although we have recently focused on developing the commercial mid-market, historically our commercial business has consisted of primarily small business clients. We are continuing to develop additional capabilities and geographic reach in commercial security to expand beyond small business into more sophisticated, complex installations and services. During 2009, commercial installation volume, representing approximately 7% of total new customer installations, decreased by 10% from prior year due to the economic downturn.
Services and Products
Monitoring services are generally governed by our standard Protective Service Agreement. Under this agreement, the customer pays the initial installation fee and is then obligated to make monthly payments for the remainder of the initial contract term. The standard term for our Protective Service Agreement is three years, which automatically renews for additional one year periods unless cancelled by either party, except in six states where state law requires the renewal period to be month-to-month. If a customer cancels the contract prior to the end of the initial or roll-over contract term or is otherwise in default, we have the right under the contract to receive from the customer an amount equal to all remaining monthly payments.
Monitoring services are generally billed monthly in advance. Approximately 47% of our subscribers pay us through automated payment methods. We periodically adjust the standard monthly monitoring rate charged to new subscribers. From time to time, we also may adjust the monthly rates of our existing subscribers who have completed their initial contract terms.
In addition to monitoring service, we provide technical service to our subscriber base for routine maintenance and installation of additional equipment. More than half of the subscriber base is enrolled in a service plan which generates incremental recurring monthly revenues. Service contracts comprise the majority of service revenue, with on-call service fees constituting the balance of service revenue.
Generally, we retain ownership of the security equipment used in our monitoring services. However, certain products, installed primarily through our Builder and commercial distribution channels, may be sold directly to the customer. These products include video surveillance equipment, access control, commercial fire alarm systems, wiring for home communications networks, home theater systems, intercom, multi-room sound systems and some security systems.
We select, install and service high quality security products. Our customized control panel is manufactured by a third party to our rigorous specifications. This enhanced control panel and its family of related peripheral components are capable of supporting the vast majority of residential applications and a significant number of commercial applications. We offer a wide variety of high quality detection sensors which communicate with our control panel. These include motion detectors, glass break detectors, perimeter door and window sensors, and smoke and carbon monoxide detectors.
The majority of our subscribers use standard land-line telephone service as the primary communication method for alarm signals from their sites. However, the capability to provide alternative communication methods from a subscriber’s control panel to our central monitoring stations has become increasingly important. We currently offer a variety of alternate alarm communication methods including cellular, digital radio and broadband internet.
5
Table of Contents
Field Operations
We operate 67 field offices located throughout the United States and Western Canada, from which locations we provide services for pre-defined ZIP code-based territories including sales calls, security system installations, and field service and repair. Our technical staff of approximately 1,100 technicians provides installation and service support from our field office locations. We have approximately 500 field sales consultants, each of whom completes comprehensive centralized training prior to conducting customer sales presentations. We staff our field offices to efficiently and effectively make sales calls, install security systems, and provide service support based on near-term activity forecasts for each market.
Dealer Network
To expand our geographic coverage and leverage our national advertising, we have an extensive dealer network, which consists of approximately 248 authorized dealers operating in over 40 states. In 2009, our dealer network accounted for 27% of new customer installations and 14% of the total subscriber base. We purchase newly installed security systems and related monitoring contracts from our dealers. We conduct thorough due diligence on each dealer to ensure reliability and consistent high quality installations. Authorized dealers are generally required to adhere to the same high quality standards for both installation and service support as Company-owned field offices. Subscribers secured by our dealers are geographically diverse and are primarily single-family homeowners.
We provide dealers with a full range of services designed to assist them in all aspects of their business including sales opportunities, sales and technician training, detailed weekly account summaries, sales support materials, and discounts on security system hardware and installation supplies purchased through our third-party distributor.
Typically, we have a right of first refusal to purchase sites and related customer relationships sold by authorized dealers, but are not obligated to acquire these sites. Subscriber contracts typically have an initial term of three years and automatically renew on an annual basis. If a contract is canceled during an initial guarantee period, generally 12 to 18 months, the dealer is required to reactivate the site and contract, or refund the purchase price. To help ensure the dealers’ obligations, we typically withhold a portion of the purchase price for each site.
Monitoring Facilities and Services
We have two monitoring facilities located in Irving, Texas and Knoxville, Tennessee. We employ approximately 700 customer care and monitoring professionals who have completed extensive initial training and continue to receive ongoing training. Both facilities hold Underwriters’ Laboratories (“UL”) listings as protective signaling services stations. UL specifications for monitoring centers cover building integrity, back-up computer and power systems, staffing, and standard operating procedures. Many jurisdictions have laws requiring that security alarms for certain buildings be monitored by UL-listed facilities. In addition, a UL listing is required by insurers of certain commercial customers as a condition of coverage. In the event of an emergency at one of our two monitoring facilities (e.g., fire, tornado, major interruption in telephone or computer service, or any other event affecting the functionality of the facility), all monitoring operations can be automatically transferred to the other facility. Additionally, many non-operator employees at each facility are cross-trained as operators, should there be a short-term or emergency need for additional monitoring operators.
Both of our monitoring facilities operate 24 hours a day on a year-round basis. Incoming alarm signals are routed via an internal communications network to the next available operator in either facility. Operators are quickly updated with information including the name and location of the customer and site, and the nature of the alarm signal. Depending upon the type of service specified by the customer contract, operators respond to emergency-related alarms by calling the customer by telephone (for verification purposes) and relaying information to local fire or police departments, as necessary. Additional action may be taken by the operators as needed, depending on the specific situation.
Customer Care
We maintain a service culture aimed at creating “Customers for Life,” the basis for our stock market ticker “CFL,” because developing customer loyalty and retention are critical to our long-term success. We take a disciplined approach to selecting the right customers and providing high quality customer service. The customer selection process focuses on evaluating the customer’s ability to honor the standard three-year contract through pre-sale credit evaluation. To maintain our high standard of customer service, we provide high quality training to call center employees, field employees, and dealer personnel. We also continually measure and monitor key operating and financial metrics. We have received awards for our monitoring and customer service, including six consecutive years of recognition by J.D. Power and Associates for delivering “An Outstanding Customer Service Experience” for call center operations and customer satisfaction excellence.
6
Table of Contents
Our employees are trained to provide high quality service through prompt handling of calls and quick resolution of most subscriber issues. We use a customized information system that quickly and accurately provides our customer care specialists with technical and administrative information regarding customers and their security systems, including detailed account and site history. This system enables our personnel to resolve most customer issues with a single contact. Our emphasis on customer service results in fewer false alarms, more satisfied customers, and better customer retention rates. Customer care specialists answer non-emergency telephone calls regarding service, billing and alarm activation issues. Our two monitoring centers provide telephone and Internet coverage 24 hours a day on a year-round basis. To ensure that technical service requests are handled promptly and professionally, all requests are routed through our customer contact centers. Customer care specialists help customers resolve minor service and operating issues related to security systems. In many cases, the customer care specialist is able to remotely resolve technical issues by downloading data directly into the alarm panel at the site. When an issue is not correctable from the customer contact center, our specialist can schedule a field technician service appointment during the same telephone call.
Suppliers
We do not manufacture the equipment used in our security systems. Equipment is purchased from a limited number of suppliers and distributors. We maintain minimal inventories of equipment at each field office. Safety stock on certain key items is maintained by third-party distributors to cover minor supply chain disruptions. We do not anticipate any major interruptions in our supply chain.
Industry Trends and Competition
The monitored security industry has historically been growing steadily, with revenue growth at an estimated compounded annual rate of 7% over the 2004-2008 timeframe. We have grown revenue at an average annual rate of 11% over the 2004-2008 timeframe. This time period includes the housing correction that began in 2006. We believe the factors driving this growth include heightened security concerns about crime rates, an aging and wealthier population, an increase in dual income households, an increase in business travel, and changes in personal time away from the home.
The security monitoring industry is highly fragmented, with the top five companies comprising only about 40% of the total market. Remaining competitors include more than 10,000 local and regional companies, the vast majority of which generate annual revenue of less than $500,000. We believe our primary competitors with national scope include:
| • | ADT Security Services, Inc., a wholly owned subsidiary of Tyco International, Ltd. |
| • | Protection One, Inc. |
| • | Monitronics International, Inc. |
| • | Stanley Security Solutions, a part of The Stanley Works |
We generally are recognized as the second largest provider of monitored security services to residential and commercial properties in North America. The North American monitored residential and commercial security industry was estimated to have revenues of approximately $14 billion in 2008. We believe that security industry penetration of U.S. Households is relatively low, estimated to be from 17% to 22%, providing significant opportunity for future growth and increased market share. We believe the differentiating factors contributing to our growth over the past several years are our high quality customers, centralized training to all field personnel and dealer representatives, standardized security systems, and service culture aimed at creating “Customers for Life.” At an estimated $8 billion, the commercial market is larger than the estimated $6 billion residential market, but commercial customers comprise only about 5% of our subscriber base.
Success in the residential and commercial markets depends on a variety of factors including company reputation, market visibility, service quality, product quality, price, and the ability to identify and solicit prospective customers. There is substantial competitive pressure on installation fees and monitoring rates. Several significant competitors offer installation prices that match or are lower than our prices. Other competitors charge significantly more for installation but may charge less for monitoring. We believe that our monitoring and service rates are competitive compared to rates offered by other major security companies.
7
Table of Contents
Employees
As of December 31, 2009, we employed approximately 3,400 people, and we believe our employee relations are good.
Government Regulation and Other Regulatory Matters
Our U.S. operations are subject to various federal, state and local consumer protection laws, licensing laws, and other laws and regulations. Most states have licensing laws that apply specifically to the alarm industry. In certain jurisdictions, we must obtain licenses or permits in order to comply with standards governing employee selection, training and business conduct. Our Canadian operations are subject to the national laws of Canada, and the provincial laws of British Columbia and Alberta.
Our business relies primarily on the use of standard fixed-wireline telephone service to transmit alarm signals. Fixed-wireline telephone companies, the cost of telephone lines, and the type of equipment used in telephone line transmission are regulated by the federal and state governments. The Federal Communications Commission and state public utilities’ commissions regulate the operation and use of wireless telephone and radio frequencies.
Our advertising and sales practices are regulated by the U.S. Federal Trade Commission and state consumer protection laws. In addition, we are subject to certain administrative requirements and laws of the jurisdictions in which we operate. These laws and regulations include restrictions on the manner in which we promote the sale of our security alarm services and require us to provide purchasers of our services with rescission rights.
Some local government authorities have adopted or are considering various measures aimed at reducing false alarms. Such measures include requiring permits for individual alarm systems, revoking such permits following a specified number of false alarms, imposing fines on alarm customers or alarm monitoring companies for false alarms, limiting the number of times police will respond to alarms at a particular location after a specified number of false alarms, and requiring additional verification of an alarm signal before the police respond.
The alarm industry is also subject to requirements imposed by various insurance, approval, and listing and standards organizations. Depending upon the type of customer, security service provided, and requirements of the applicable local governmental jurisdiction, adherence to the requirements and standards of such organizations is mandatory in some instances and voluntary in others.
There can be no assurance that new or revised laws will not impact our business, as change in regulation could have a material and adverse effect on us. New or revised regulations could require us to alter our business practices in a manner that we may deem to be unacceptable which could slow our growth opportunities. The failure to comply with such regulations could result in the imposition of material fines, penalties, or injunctions.
Available Information
We maintain internet websites under the names www.broadviewsecurity.com and www.brinkshomesecurity.com. We make available, free of charge, our annual reports on Form 10-K, quarterly reports on Form 10-Q, current reports on Form 8-K, and amendments to those reports, on our websites as soon as reasonably practicable after providing such reports to the SEC.
We file annual reports on Form 10-K, quarterly reports on Form 10-Q, current reports on Form 8-K, proxy statements, and other documents with the Securities and Exchange Commission (“SEC”) under the Securities Exchange Act, as amended. The public may read and copy any materials that we file with the SEC at the SEC’s Public Reference Room at 450 Fifth Street, N.W., Washington DC 20549. The public may obtain information on the operation of the Public Reference Room by calling the SEC at 1-800-SEC-0330. Also, the SEC maintains an internet website that contains reports, proxy and information statements, and other information regarding issuers, including Brink’s Home Security Holdings, Inc., that file electronically with the SEC. The public can obtain any document we file with the SEC at www.sec.gov. Information contained on, or connected to, our websites is not incorporated by reference into this Form 10-K and should not be considered part of this report or any other filing that we make with the SEC.
8
Table of Contents
| ITEM 1A. | RISK FACTORS |
We are exposed to risks in the operation of our business. Some of these risks are common to all companies doing business in the industry in which we operate and some are unique to our business. These risk factors should be considered carefully when evaluating our business. The occurrence of one or more of these events could significantly and adversely affect our business, prospects, financial condition, and results of operations or cash flows.
RISKS RELATED TO COMPLETION OF THE MERGER
The pendency of the Merger could materially, adversely affect our future business and operations or result in a loss of our employees or dealers.
In connection with the pending Merger with Tyco, it is possible that some customers, suppliers and other persons with whom we have a business relationship may delay or defer certain business decisions, which could negatively impact our revenues, earnings and cash flows, and the market price of our common stock, regardless of whether the Merger is completed. Similarly, our current and prospective employees or dealers operating in our dealer network may experience uncertainty about their future roles with us following the completion of the Merger, which may materially adversely affect our ability to attract and retain key employees or dealers. In addition, the Merger Agreement restricts our ability to take certain specified actions without the consent of Tyco until the Merger occurs. These restrictions may prevent us from pursuing attractive business opportunities that may arise prior to the completion of the Merger.
The Merger may adversely impact the tax-free status of our spin-off from BCO, which could result in material liabilities to us under the tax matters agreement with BCO.
Although we believe that the Merger will not adversely impact the tax-free status of our spin-off from BCO, it is possible that the Internal Revenue Service (the “IRS”) may assert that the Merger would cause the spin-off to be treated as a taxable transaction for U.S. federal income tax purposes to BCO. If the IRS were to be successful in any such contention, or if for any other reason we were to take actions that would cause the spin-off to be treated as a taxable transaction, under the tax matters agreement entered into between us and BCO at the time of the spin-off, we would be obligated to indemnify BCO as a result of the failure of the tax-free status of the spin-off to be preserved, which would result in material liabilities to us.
If the Merger is not completed, our ongoing business may be adversely affected and we will be subject to several risks and consequences, including the following:
| • | we may be required, under certain circumstances, to pay Tyco a termination fee of either $45.0 million or $87.5 million under the Merger Agreement; |
| • | we will be required to pay certain costs relating to the Merger, whether or not the Merger is completed, such as legal, accounting, financial advisor, and printing fees; |
| • | under the Merger Agreement, we are subject to certain restrictions on the conduct of our business prior to completing the Merger which may adversely affect our ability to execute our business strategies; and |
| • | matters relating to the Merger may require our management team to commit substantial time and resources, which could otherwise have been devoted to other opportunities that may have been beneficial to us. |
In addition, if the Merger is not completed, we may experience negative reactions from the financial markets and from our customers, employees or dealers. We also could be subject to litigation related to any failure to complete the Merger or to enforcement proceedings commenced against us to perform our obligations under the Merger Agreement.
The proposed Merger is subject to the receipt of consents and approvals from government entities that may impose conditions that could have an adverse effect on us or could delay or prevent the completion of the Merger.
Completion of the Merger is conditioned upon, among other things, the expiration or termination of the required waiting period under the Hart-Scott-Rodino Antitrust Improvements Act of 1976. The reviewing authorities may not permit the Merger at all or may impose restrictions or conditions on the completion of the Merger. There is no assurance that we will obtain these necessary governmental approvals to complete the Merger. In addition, any delay in the completion of the Merger from the failure to obtain such approvals could diminish the anticipated benefits of the Merger or result in additional transaction costs, loss of revenue or other effects associated with uncertainty about the proposed Merger.
9
Table of Contents
OTHER RISK FACTORS
We are subject to contractual limitations on the use of certain BCO trademarks which have required us to develop a new brand for our business.
Prior to the Spin-off, we operated as a subsidiary of BCO, and marketed our products and services using BCO’s brand name and logos. In connection with the Spin-off, we entered into a Brand Licensing Agreement with a subsidiary of BCO that grants us the right to use certain trademarks, in the United States, Canada and Puerto Rico in connection with the provision of certain products and services. These rights will extend for a period no longer than three years (that is, until October 31, 2011), subject to certain terms and conditions, after which we will no longer have the right to use BCO’s brand name. In addition, following the expiration of a five-year non-compete agreement between us and BCO on October 31, 2013, BCO will be able to operate a separate alarm monitoring business using their brand name in the United States, Canada and Puerto Rico.
We have incurred and may continue to incur significant expense in connection with building recognition of our new brand.
On June 30, 2009, we announced our new brand name, Broadview Security. In doing so, we have incurred costs associated with developing our new brand and will incur substantial costs in building recognition of our new brand. There is uncertainty regarding the timing, duration and the amount of the total expenses that may be incurred in the brand building effort. These expenses are dependent, among other things, on general economic and strategic marketing decisions that will be made during the transition to the new brand, and are therefore subject to change.
Our new brand may not achieve similar brand recognition as our heritage brand, which could adversely affect our business and profitability.
As we continue to develop the Broadview Security brand name for potential and existing customers, there is some risk that the volume of new installations and the disconnect rate could be negatively impacted. Despite our efforts, we may not be successful in achieving an acceptable level of recognition of our new brand. If we are not successful in achieving recognition for our new brand, our competitive position may be weakened and we may lose market share.
If our Spin-off from BCO were to lose its tax-free status due to actions taken by us, we would be required to indemnify BCO for certain liabilities under our Tax Matters Agreement with BCO.
BCO received a private letter ruling from the IRS to the effect that, among other things, the Spin-off qualified for tax-free treatment under Section 355 of the Internal Revenue Code. The ruling was based upon representations by BCO that necessary conditions had been satisfied, and any inaccuracy in such representations could invalidate the ruling. If the IRS were to determine that the Spin-off does not qualify for tax-free treatment under Section 355 of the Code, then a U.S. holder that received our shares in the Spin-off would be treated as having received a distribution to the extent of the fair market value of the shares received on the Spin-off date. That distribution would be treated as taxable dividend income to the extent of such holder’s ratable share of the current and accumulated earnings and profits of BCO, if any. Any amount that exceeds such share of earnings and profits of BCO would be treated first as a tax-free return of capital to the extent of the U.S. holder’s adjusted tax basis in its shares of common stock of BCO (thus reducing such adjusted tax basis) with any remaining amounts being treated as capital gains.
Generally, taxes resulting from the Spin-off failing to qualify for tax-free treatment for U.S. Federal income tax purposes would be imposed on BCO and BCO’s shareholders. Under the Tax Matters Agreement, however, we would be required to indemnify BCO and its affiliates against all tax-related liabilities caused by such failure to the extent those liabilities arose as a result of an action taken by us or our affiliates or otherwise resulted from any breach of any representation, covenant or obligation of us or our affiliates under the Tax Matters Agreement or any other agreement entered into by us in connection with the Spin-off.
We are contingently responsible for certain of BCO’s contingent and other corporate liabilities.
As a former subsidiary of BCO, we are jointly and severally liable with BCO, and with certain other current and former subsidiaries of BCO, for two kinds of health benefits for employees of BCO former coal operations. First, we and BCO are jointly and severally liable for the ongoing provision of postretirement health benefits. To fund the considerable costs of these benefits, BCO established a Voluntary Employees’ Beneficiary Associate trust (“VEBA”). It is possible that the VEBA may be underfunded, in which case we and BCO could be required to provide additional funding. Second, we are jointly and severally liable to pay certain postretirement health premiums through September 2010. Although we continue to be jointly and severally liable with BCO for these liabilities and expenses, BCO has agreed to indemnify us for any and all costs relating to these liabilities and expenses. However, it is possible that BCO will be unwilling or unable to make these payments in which case we could be required to do so.
10
Table of Contents
As a former subsidiary of BCO, and with certain other current and former subsidiaries of BCO, we have a joint and several liability with BCO to the IRS for the consolidated federal income taxes of the BCO group relating to the taxable periods ending on or prior to the Spin-off. Although we continue to be jointly and severally liable with BCO for this liability under the Tax Matters Agreement, BCO has agreed to indemnify us for amounts relating to this liability to the extent not attributable to our liabilities. However, it is possible that BCO will be unwilling or unable to make these payments in which case we could be required to do so. Under the Tax Matters Agreement, we are required to indemnify BCO and its affiliates for tax liabilities attributable to us and resulting from audit adjustments for taxable periods during which we were a member of the BCO consolidated group.
We are susceptible to downturns in the housing market and consumer discretionary income, which may inhibit our ability to sustain subscriber base growth rates.
Demand for alarm monitoring services is affected by the turnover in the housing market. Downturns in the rate of the sale of new and existing homes, which we believe drives a substantial portion of our new customer volume in any given year, would reduce opportunities to make sales of new security systems and services and reduce opportunities to take over existing security systems. With the extended slowdown in housing sales and the deterioration in the overall consumer environment, our new installation growth rate has progressively slowed during the last three years. We sustained a decline in new customer installations in 2009 as compared to 2008 and 2007. In addition, because of personal economic circumstances, current security alarm customers may decide to disconnect our services in an effort to reduce their monthly spending and may default on their remaining contractual obligations to us. Our long-term revenue growth rate depends on installations exceeding disconnects. If the housing market downturn is prolonged, our revenues and cash flow may be adversely affected. If the general economic downturn is prolonged, this could lead to an increase in customer disconnects and defaults, and may also adversely affect our revenues and cash flow.
Our financial results may be negatively impacted by recent financial events.
Recent financial events have resulted in the consolidation, failure or near failure of a number of institutions in the banking, insurance and investment banking industries and have substantially reduced the ability of companies to obtain financing. These events have also led to a substantial reduction in stock market valuations and job losses, and could have a number of different effects on our business, including:
| • | a reduction in consumer spending, which could result in increased customer disconnects and/or a reduction in new customer additions; |
| • | a negative impact on the ability of our existing customers to timely pay their obligations to us, thus reducing our cash flow; |
| • | an increased likelihood that one or more of our banking institutions may be unable or unwilling to honor its commitments under our revolving credit facility; and |
| • | restricted access to capital markets that may limit our ability to take advantage of business opportunities, such as acquisitions. |
Other events or conditions may arise directly or indirectly from financial events that could negatively impact our business.
We rely on a significant number of our subscribers remaining with us as customers for long periods of time.
We incur significant upfront cash costs for each new subscriber. It requires a substantial amount of time for us to receive cash payments (net of our recurring cash costs) from a particular subscriber that are sufficient to offset this upfront cost, with that period currently averaging approximately four years. Accordingly, our long-term profitability is dependent on our subscribers remaining with us as customers for long periods of time. This requires that we minimize our rate of subscriber disconnects, or attrition. Factors that can increase disconnects include customers who relocate and do not reconnect, problems with our service quality, an economic slowdown and the affordability of our service. If we fail to keep our subscribers for a sufficiently long period of time, our financial position and results of operations could be adversely affected.
Shifts in our customers’ choice of telecommunications services and equipment could adversely impact our business and require significant capital expenditures.
Certain elements of our operating model have historically relied on our customers’ continued selection and use of traditional land-line telecommunications to transmit alarm signals to our monitoring centers. There is a growing trend for customers to switch to the exclusive use of cell-phone, satellite, or internet communication technology in their homes and businesses, and we anticipate telecommunication providers to permanently switch from land-line to broadband communications in the future. The use of communications other than land-line would require customers to upgrade to alternative, and often more expensive, technologies to transmit alarm signals, which generally result in increased recurring revenues for us. This, however, could increase our customer attrition rates, slow down our new subscriber rates, or reduce our ability to attract a sufficient volume of new customers. In the future, we may not be able to successfully implement new technologies or adapt existing technologies to changing market demands. If we are unable to adapt timely to changing technologies, market conditions, or customer preferences, it could adversely affect our business.
11
Table of Contents
We operate in a highly competitive industry.
The monitored security alarm industry is subject to significant competition and pricing pressures. We experience competitive pricing pressures on both installation fees and monitoring rates. Several significant competitors offer installation fees that match or are lower than our prices. Other competitors charge significantly more for installation but, in many cases, less for monitoring. Competitive pressure on monitoring and service fees is significant. We believe that the monitoring and service fees we offer are generally competitive with rates offered by other major security companies. Continued pricing pressure could adversely impact our customer base or pricing structure and have an adverse effect on our results of operations.
We also face potential competition from improvements in self-monitoring systems, which enable customers to monitor their home environment without third-party involvement. Advances in self-monitoring systems could progress to the point where we could be at a competitive disadvantage. Similarly, it is possible that one or more of our competitors could develop a significant technical advantage over us that allows them to provide additional service or better quality service or to lower their price, which could put us at a competitive disadvantage. Either development could adversely affect our growth and results of operations.
We may pursue additional customer acquisition channels and strategic alliances, which may cause operating margins to suffer.
We may expand our presence in the commercial alarm installation and monitoring market. We may also continue to evaluate other business opportunities, including expanding our services, adding customer acquisition channels, and forming new alliances with companies to market our security systems and services. This could result in our cost of investment in new subscribers growing at a faster rate than installations and related recurring revenue. Additionally, any new alliances or customer acquisition channels could have higher cost structures than our current arrangements, which could reduce operating margins and require more working capital. In the event that working capital requirements exceeded operating cash flow, we might be required to draw on our credit facility or pursue other external financing, which may not be readily available.
We rely on third party providers for the components of our security systems and any failure or interruption in products or services provided by these third parties could harm our ability to operate our business.
The components for the security systems that we install are manufactured by third parties. We are therefore susceptible to interruptions in supply and to the receipt of components that do not meet our high standards. Any financial or other difficulties our providers face may have negative effects on our business. We exercise little control over our suppliers, which increases our vulnerability to problems with the products and services they provide. Any interruption in supply could cause delays in installations and repairs and the loss of current and potential customers. Also, if a previously installed component were found to be defective, we might not be able to recover the costs associated with its repair or replacement, and the diversion of technical personnel to address such an issue could affect subscriber, revenue, and profit growth.
An interruption to our monitoring facilities from a disaster could adversely affect our business.
A disruption to our monitoring facilities could disrupt our ability to provide alarm monitoring services and serve our customers which could have a material adverse effect on our business. The disruption could occur for many reasons, including fire, natural disasters, weather, disease, transportation interruption, or terrorism. However, these risks are mitigated through the existence of our two fully redundant monitoring facilities. In the event of an emergency at one of our two monitoring facilities, all monitoring operations can be quickly transferred to the other facility. Additionally, many non-operator employees at each facility are cross-trained as monitoring operators, should there be a short-term or emergency need for additional monitoring operators. Both facilities hold Underwriters’ Laboratories (“UL”) listings as protective signaling services stations and maintain certain standards of building integrity and power backup, among other safeguards.
12
Table of Contents
We are exposed to greater risks of liability for employee acts or omissions, or system failure, than may be inherent in other businesses.
If a subscriber believes that he or she has suffered harm to person or property due to an actual or alleged act or omission of one of our employees or security system failure, he or she may pursue legal action against us, and the cost of defending the legal action and of any judgment could be substantial. Substantially all of our customer contracts contain provisions limiting our liability; however, in the event of litigation with respect to such matters, it is possible that these limitations may be deemed not applicable.
We carry insurance of various types, including general liability and professional liability insurance in amounts we consider adequate and customary for our industry. Some of our insurance policies, and the laws of some states, may limit or prohibit insurance coverage for punitive or certain other types of damages, or liability arising from gross negligence. If we incur increased losses related to employee acts or omissions, or system failure, or if we are unable to obtain adequate insurance coverage at reasonable rates, or if we are unable to receive reimbursements from insurance carriers, our financial condition and results of operations could be adversely affected.
We could be assessed penalties for false alarms.
Some local governments impose assessments, fines, penalties and limitations on either subscribers or the alarm companies for false alarms. A few municipalities have adopted ordinances under which both permit and alarm dispatch fees are charged directly to the alarm companies. Our alarm service contracts generally allow us to pass these charges on to customers. If more local governments were to impose assessments, fines or penalties, our customers might find these additional charges prohibitive and the growth of our subscriber base could be adversely affected. Further, to the extent we are unable to pass assessments, fines and penalties on to our customers, our operating results could be adversely affected.
Police departments could refuse to respond to calls from monitored security service companies.
Police departments in a limited number of U.S. cities do not respond to calls from monitored security service companies, either as a matter of policy or by local ordinance. We have offered affected customers the option of receiving response from private guard companies, in most cases through contracts with us, which increases the overall cost to customers. If more police departments were to refuse to respond or be prohibited from responding to calls from monitored security service companies, our ability to attract and retain subscribers could be negatively impacted and our results of operations and cash flow could be adversely affected.
Our business operates in a regulated industry.
Our operations and employees are subject to various U.S. federal, state and local consumer protection, licensing and other laws and regulations. Most states in which we operate have licensing laws directed specifically toward the monitored security services industry. Our business relies heavily upon wireline telephone service to communicate signals. Wireline telephone companies are currently regulated by both the federal and state governments. Our Canadian operation is subject to the laws of Canada, British Columbia and Alberta.
Changes in laws or regulations could require us to change the way we operate, which could increase costs or otherwise disrupt operations. In addition, failure to comply with any applicable laws or regulations could result in substantial fines or revocation of our operating permits and licenses. If laws and regulations were to change or we failed to comply, our business, financial condition and results of operations could be materially and adversely affected.
FORWARD-LOOKING INFORMATION
This Annual Report on Form 10-K contains “forward-looking statements” within the meaning of Section 27A of the Securities Act of 1933, as amended, and Section 21E of the Securities Exchange Act of 1934, as amended (which Sections were adopted as part of the Private Securities Litigation Reform Act of 1995). Statements preceded by, followed by or that otherwise include the words “believe,” “anticipate,” “estimate,” “expect,” “intend,” “plan,” “project,” “prospects,” “outlook,” and similar words or expressions, or future or conditional verbs such as “will,” “should,” “would,” “may,” and “could” are generally forward-looking in nature and not historical facts. These forward looking statements involve known and unknown risks, uncertainties and other factors which may cause our actual results, performance or achievements to be materially different from any anticipated results, performance or achievements. Except as required by law, we disclaim any intention, and undertake no obligation, to revise any forward-looking statements, whether as a result of new information, a future event, or otherwise. These risks, uncertainties and contingencies, many of which are beyond our control, include, but are not limited to risks related to the Merger, risks inherent in the Spin-off from our former parent corporation, the demand for our products and services, the ability to identify and execute further cost and operational improvements and efficiencies in our core business, the actions of competitors, our ability to successfully build and market a new brand, our ability to identify strategic opportunities and integrate them successfully, our ability to maintain subscriber growth, the number of household moves, the level of home sales or new home construction, potential instability in housing credit markets, our ability to cost-effectively develop or incorporate new systems or technology in a timely manner, our ability to balance the cost of acquiring customers with the profit from serving existing customers, our ability to keep disconnect rates relatively low, the availability and cost of capital, and general business conditions.
13
Table of Contents
Certain of these factors and other factors, risk and uncertainties are discussed in Part I, Item 1A of this Annual Report on Form 10-K. Other unknown or unpredictable factors may also cause actual results to differ materially from those projected by the forward looking statements. Most of these factors are difficult to anticipate and may be beyond our control. You should consider the areas of risk described above, and also consider those set forth in Part I, Item 1A of this Annual Report on Form 10-K, in connection with considering any forward looking statements that may be made by us in this report.
| ITEM 1B. | UNRESOLVED STAFF COMMENTS |
None.
| ITEM 2. | PROPERTIES |
We have 74 leased field offices and other facilities located throughout the U.S. and one leased office in British Columbia, Canada. Our headquarters are located in Irving, Texas in a facility we own. This owned facility houses some of our administrative and technical support personnel. Additional personnel are located in portions of three nearby buildings in office spaces that are leased. Our headquarters also serve as one of our two central monitoring facilities. The second monitoring and service center, which we also own, is located near Knoxville, Tennessee.
The following table discloses our leased and owned facilities as of December 31, 2009.
| Facilities | ||||||
| Region |
Leased | Owned | Total | |||
| U. S. |
73 | 2 | 75 | |||
| Canada |
1 | — | 1 | |||
| Total |
74 | 2 | 76 | |||
| ITEM 3. | LEGAL PROCEEDINGS |
The Company is involved in various lawsuits and claims in the ordinary course of business. The Company has recorded accruals for losses that are considered probable and reasonably estimable associated with these matters. The Company believes that the ultimate disposition of these matters will not have a material adverse effect on its liquidity or financial position; however, losses from these matters or changes in estimates of losses for these matters may result in income or expense in any one accounting period that is material in comparison to the earnings of that period.
In April 2009, a Michigan state circuit court jury rendered a verdict against the Company for $4.2 million pertaining to claims made by a terminated employee of the Company. On July 7, 2009, the trial court entered judgment in favor of the plaintiff for $4.7 million. This amount included approximately $0.5 million in pre-judgment interest and attorney fees. After post-trial proceedings, on September 25, 2009, the trial court entered a revised judgment in the amount of approximately $3.5 million. The amount of the revised judgment has been included in other accrued liabilities as of December 31, 2009. On October 16, 2009, the Company filed an appeal seeking reversal of the judgment or in the alternative a new trial, based on various alleged points of error by the trial court. In connection with the appeal, the trial court ordered a stay of execution on the judgment which requires the Company to post an appeal bond. The Company has filed its initial appeal brief but no date has yet been set for oral argument.
| ITEM 4. | SUBMISSION OF MATTERS TO A VOTE OF SECURITY HOLDERS |
None.
14
Table of Contents
PART II
| ITEM 5. | MARKET FOR REGISTRANT’S COMMON EQUITY, RELATED SHAREHOLDER MATTERS AND ISSUER PURCHASES OF EQUITY SECURITIES |
Market Information and Holders
Our common stock began trading “regular way” on the New York Stock Exchange under the symbol “CFL” on November 3, 2008. As of February 23, 2010, there were approximately 2003 holders of record of our common stock.
The table below sets forth for each of the quarters indicated the reported high and low sales prices for our common stock on the New York Stock Exchange for the period from November 3, 2008 through December 31, 2009.
| High | Low | |||||
| 2008: |
||||||
| Fourth Quarter (Beginning November 3, 2008) |
$ | 23.10 | $ | 13.15 | ||
| 2009: |
||||||
| First Quarter |
$ | 25.36 | $ | 19.27 | ||
| Second Quarter |
31.30 | 21.79 | ||||
| Third Quarter |
32.42 | 26.51 | ||||
| Fourth Quarter |
34.11 | 29.89 | ||||
Dividend Policy
We have not paid any cash dividends on our common stock since the Spin-off. Any change in our dividend policy will be made at the discretion of our Board of Directors and will depend on a number of factors, including future earnings, capital requirements, contractual restrictions, financial condition, future prospects and any other factors our Board of Directors may deem relevant.
The payment of cash dividends are subject to the restrictions and limitations in the credit agreement governing our unsecured revolving credit facility. In addition, the Merger Agreement restricts our ability to pay dividends to holders of our common stock without Tyco’s consent.
Equity Compensation Plan Information
The following table sets forth information about our common stock that may be issued upon the exercise of options, warrants and rights under all of our existing equity compensation plans as of December 31, 2009.
| Plan Category |
Number of Securities to be Issued upon Exercise of Outstanding Options, RSU’s, DSU’s, and Deferred Compensation (a) |
Weighted-Average Exercise Price of Outstanding Options (b) |
Number of Securities Remaining Available for Future Issuance Under Equity Compensation Plans (Excluding Securities Reflected in Column (a)) (c) | |||
| Equity compensation plans |
1,506,966 (2) | $23.66 (3) | 931,249 (4) |
| (1) | Includes common shares to be issued as awards under The Brink’s Home Security 2008 Equity Incentive Plan (“2008 Equity Plan”), Non-Employee Directors’ Equity Plan, Key Employees’ Deferred Compensation Program, and the Directors’ Stock Accumulation Plan. See Note 10 – Share-Based Compensation Plans to the consolidated financial statements for additional information regarding these equity compensation plans. There have been no repurchases of common stock under the Company’s plans as of December 31, 2009. |
| (2) | Included within the number of securities to be issued upon exercise are 857,436 unvested options as of December 31, 2009. |
| (3) | Does not include deferred compensation units, units under the Directors’ Stock Accumulation Plan, restricted stock units, and deferred stock units. |
| (4) | The 2008 Equity Plan provides for a maximum of 1,000,000 common shares to be issued as awards plus the aggregate number of shares subject to converted awards. The Non-Employee Directors’ Equity Plan provides for a maximum of the sum of 500,000 shares to be issued as awards, the aggregate number of shares subject to the converted options, and the aggregate number of shares subject to the replacement deferred stock units. Restricted stock units are counted against the limit as two shares for every one share covered by the award under each of these plans. The Directors’ Stock Accumulation Plan provides for a maximum of 100,000 common shares to be issued as awards. The Key Employees’ Deferred Compensation Program does not have a limit on the number of shares to be issued as awards. |
15
Table of Contents
Performance Graph
The following graph compares the relative performance of the our common stock, the Standard & Poor’s Midcap 400 Stock Index and the Standard & Poor’s Midcap 400 GICS Specialized Consumer Services Sub-Index. This graph covers the period from November 3, 2008 (the first trade date immediately following the Spin-off), through December 31, 2009.
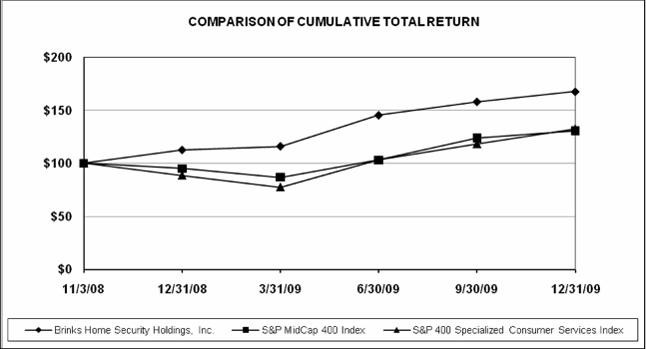
| Company/Index |
Nov. 3, 2008 |
Dec. 31, 2008 |
Mar. 31, 2009 |
Jun. 30, 2009 |
Sep. 30, 2009 |
Dec. 31, 2009 | ||||||||||||
| Brink’s Home Security Holdings, Inc. |
$ | 100.00 | $ | 112.58 | $ | 116.08 | $ | 145.40 | $ | 158.14 | $ | 167.64 | ||||||
| S&P MidCap 400 Index |
100.00 | 95.13 | 86.90 | 103.19 | 123.81 | 130.69 | ||||||||||||
| S&P 400 Specialized Consumer Services Index |
100.00 | 88.56 | 77.50 | 103.20 | 118.32 | 132.58 | ||||||||||||
In each case, the data above assumes a $100 investment immediately following November 3, 2008, the first trading day following the Spin-off, and reinvestment of all dividends, if any.
| ITEM 6. | SELECTED FINANCIAL DATA |
The selected historical financial data and operating statistics presented below reflect financial information prepared with the Company’s historical financial results. For periods prior to the Spin-off on October 31, 2008, the financial information includes allocations of certain BCO corporate expenses and higher royalty rate charges. See Note 1- Description of Business, The Spin-off, Basis of Presentation, and Significant Accounting Policies and Note 2 – Transactions with Related Parties to the consolidated financial statements for further discussion regarding the Spin-off and BCO related costs.
The data below should be read in conjunction with our audited consolidated financial statements and accompanying notes, included in Item 8 herein, and “Management’s Discussion and Analysis of Financial Condition and Results of Operations” as seen in Item 7. The financial information below may not be indicative of our future performance and, for periods prior to the Spin-off, does not necessarily reflect what the financial position and results of operations would have been had we operated as a separate, stand-alone entity.
16
Table of Contents
Five Years in Review
| (in millions, except where indicated) | December 31, | |||||||||||||||||||
| 2009 | 2008 | 2007 | 2006 | 2005 | ||||||||||||||||
| Statement of Income Data |
||||||||||||||||||||
| Revenues |
$ | 565.1 | $ | 532.3 | $ | 484.4 | $ | 439.0 | $ | 392.1 | ||||||||||
| Operating profit |
101.4 | 94.0 | 73.0 | 63.2 | 57.1 | |||||||||||||||
| Net income |
62.7 | 57.1 | 44.2 | 36.3 | 36.0 | |||||||||||||||
| Earnings per Share(a) |
||||||||||||||||||||
| Basic (per share) |
$ | 1.37 | $ | 1.25 | $ | 0.96 | $ | 0.79 | $ | 0.79 | ||||||||||
| Diluted (per share) |
1.36 | 1.25 | 0.96 | 0.79 | 0.78 | |||||||||||||||
| Diluted weighted average common shares outstanding |
46.0 | 45.8 | 45.9 | 45.9 | 45.9 | |||||||||||||||
| Balance Sheet Data |
||||||||||||||||||||
| Cash and cash equivalents |
$ | 113.2 | $ | 63.6 | $ | 3.3 | $ | 2.6 | $ | 3.4 | ||||||||||
| Property and equipment, net |
710.1 | 659.3 | 606.0 | 536.7 | 467.7 | |||||||||||||||
| Total assets |
970.6 | 876.9 | 763.7 | 689.4 | 605.0 | |||||||||||||||
| Shareholders’ equity |
523.4 | 482.0 | 405.5 | 357.6 | 318.9 | |||||||||||||||
| Cash Flow data |
||||||||||||||||||||
| Cash flow from operating activities |
$ | 240.1 | $ | 224.0 | $ | 183.7 | $ | 155.9 | $ | 119.1 | ||||||||||
| Cash flow from investing activities |
(192.1 | ) | (177.8 | ) | (175.8 | ) | (163.9 | ) | (162.2 | ) | ||||||||||
| Cash flow from financing activities |
1.4 | 14.2 | (7.3 | ) | 7.2 | 45.2 | ||||||||||||||
| Key Performance Measures |
||||||||||||||||||||
| Monthly recurring revenue(b) |
$ | 44.2 | $ | 40.5 | $ | 37.2 | $ | 33.1 | $ | 29.1 | ||||||||||
| Ending number of subscribers (in thousands) |
1,359.0 | 1,301.6 | 1,223.9 | 1,124.9 | 1,018.8 | |||||||||||||||
| Ending subscriber base growth (percentage)(c) |
4.4 | 6.3 | 8.8 | 10.4 | 10.6 | |||||||||||||||
| Average number of subscribers (in thousands) |
1,334.5 | 1,267.5 | 1,176.1 | 1,072.5 | 972.8 | |||||||||||||||
| Average subscriber base growth (percentage) |
5.3 | 7.8 | 9.7 | 10.2 | 11.1 | |||||||||||||||
| Disconnect rate (percentage)(d) |
8.2 | 7.5 | 7.0 | 6.4 | 7.2 | |||||||||||||||
| Adjusted EBITDA from recurring services (e) |
$ | 341.5 | $ | 318.3 | $ | 286.3 | $ | 255.4 | $ | 233.1 | ||||||||||
| Adjusted cash invested in new subscribers(f) |
$ | (257.3 | ) | $ | (248.5 | ) | $ | (237.5 | ) | $ | (217.6 | ) | $ | (204.4 | ) | |||||
| (a) | For 2009, basic earnings per share (“EPS”) was computed by dividing net income by the weighted average number of common shares outstanding during the year. Diluted EPS was calculated in a similar manner but included the dilutive effect of stock options and restricted stock units outstanding during the year. For periods prior to the Spin-off, no common stock of Holdings and none of Holdings’ equity awards were outstanding. Basic and diluted earnings per share were computed on a pro forma basis using the average number of shares of the Company’s common stock outstanding from October 31, 2008 to December 31, 2008. The number of diluted shares used in the calculation was based on the number of shares of the Company’s common stock outstanding plus the estimated potential dilution that could have occurred if options and restricted stock units granted under the Company’s equity-based compensation arrangements were exercised or converted into the Company’s common stock. |
| (b) | Monthly recurring revenue (“MRR”), a non-GAAP measure, is calculated based on the number of subscribers at period end multiplied by the average fee per subscriber earned in the last month of the period for contractual monitoring and maintenance services as discussed under the caption “Key Performance Measures — Monthly Recurring Revenues.” |
| (c) | Calculated based on period ending subscribers. |
| (d) | Calculated as a ratio, the numerator of which is customer cancellations, on an annualized basis, and the denominator of which is the average number of customers during the period. Customer relocations, reactivations and dealer charge backs of contract cancellations are excluded from the calculation. |
| (e) | Adjusted EBITDA from recurring services, a non-GAAP measure, is normalized as if the royalty rate had been 1.25% of net revenues, instead of the royalty rate of approximately 7% of revenues charged by BCO before the Spin-off, for all periods presented. Upfront royalty expense is excluded from this metric. This measure is discussed under the caption “Key Performance Measures — Adjusted EBITDA from Recurring Services.” |
| (f) | Adjusted cash invested in new subscribers, a non-GAAP measure, represents cash used to acquire new subscribers during the period and excludes costs related to the Brand Introduction. This measure is discussed in “Key Performance Measures — Adjusted Cash Invested in New Subscribers.” |
17
Table of Contents
| ITEM 7. | MANAGEMENT’S DISCUSSION AND ANALYSIS OF FINANCIAL CONDITION AND RESULTS OF OPERATIONS |
Introduction
The following discussion, which presents the results of Brink’s Home Security Holdings, Inc. and its consolidated subsidiaries, should be read in conjunction with the accompanying consolidated financial statements and notes thereto for the years ended December 31, 2009 and 2008, and each of the years in the three-year period ended December 31, 2009, along with the five-year financial summary and operating statistics presented in Part II, Item 6, “Selected Financial Data,” the risk factors discussed in Part I, Item 1A, “Risk Factors,” and the cautionary statement regarding forward-looking information.
As used in this Report, (a) references to “Holdings,” “Company,” “we,” “us,” and “our” refer to Brink’s Home Security Holdings, Inc. and its consolidated subsidiaries, including Broadview Security, Inc. (“Broadview Security,” formerly named Brink’s Home Security, Inc.), after the spin-off transaction described below, and (b) references to the “Company” on a historical basis, prior to the spin-off transaction, refer to Brink’s Home Security and its consolidated subsidiaries, in each case unless the context requires otherwise.
This discussion is intended to provide the reader with information that will assist in understanding our financial statements, the changes in certain key items in those financial statements from period to period, and the primary factors that accounted for those changes, how operating results affect our financial condition and results of our operations of the Company as a whole, and how certain accounting principles and estimates affect our financial statements. Unless otherwise indicated, all references to earnings per share (“EPS”) are on a diluted basis.
Recent Developments
On January 18, 2010, we signed a definitive agreement and plan of merger (“Merger Agreement”) to be merged into a wholly-owned subsidiary of Tyco International Ltd (“Tyco”) in a transaction valued at approximately $2.0 billion (the “Merger”). The Merger is subject to customary closing conditions, various regulatory approvals and approval of our shareholders. We currently expect the Merger to close in the second or third quarter of calendar year 2010. Upon closing of the Merger, we anticipate that Broadview Security will be combined with Tyco’s ADT security business under the ADT brand. Refer to Part 1, Item 1, Business, for further discussion of the Merger. The uncertainty of this pending transaction and the ultimate resolution may significantly impact our operations and continuation of historical trends in future periods as it becomes more difficult to reasonably estimate trends affecting our company, capital resource needs, and other items that may vary depending on the timing or completion of the proposed transaction.
History
On September 12, 2008, the Board of Directors of The Brink’s Company (“BCO”) approved the separation of BCO into two independent, publicly traded companies through the spin-off of the Company to shareholders of BCO (the “Spin-off”). To affect the Spin-off, BCO transferred all outstanding shares of Brink’s Home Security, Inc. to Holdings, another wholly-owned subsidiary of BCO, through a series of transactions pursuant to a Separation and Distribution Agreement between BCO and Holdings. On October 31, 2008, BCO distributed all of the shares of Holdings to the stockholders of BCO at a ratio of one share of Holdings common stock for each share of BCO common stock held by each such holder as of the record date of October 21, 2008. On November 3, 2008, after completion of the Spin-off, our stock began trading “regular way” as an independent public company on the New York Stock Exchange under the symbol “CFL”, reflecting our corporate mission of creating “Customers For Life.”
As a condition of the Spin-off, we are required to change the name of the Company prior to October 31, 2011. We announced Broadview Security as our new brand name on June 30, 2009 and have begun the process to transition away from our heritage name. The change was a name change only. The corporate structure and management of the Company remain the same.
We began marketing efforts in July 2009 to promote brand awareness through advertisements via television media, internet, direct mail, yellow pages, and messaging to our existing subscriber base (“Brand Introduction”). The Brand Introduction also includes costs to create the new brand, convert building signage, re-decal our vehicle fleet, issue new technician uniforms, change customer yard signs, and other similar brand conversion activities. We monitor the awareness, perception, and acceptance of the Broadview Security brand name periodically to guide us on the method, extent, and duration of the Brand Introduction.
18
Table of Contents
Overview
We provide monitored security alarm services in North America for owner-occupied single-family residences and commercial properties. We typically install and own the on-site security alarm systems and charge fees to monitor and service the systems. We attribute our success to our focus on quality service, customer retention, and a disciplined approach to growth. We believe our business is a premium provider of services in the markets that we serve.
We have grown consistently over the past several years due to our ability to attract and retain customers by providing quality services while operating as efficiently as possible. Revenues are fairly predictable as most monitoring service revenues are governed by initial three-year monitoring contracts that generally include recurring one-year renewal clauses. Over the past three years, recurring revenues have been approximately 90% of total revenues. Our primary customers are residents of single-family homes which comprise approximately 93% of our subscriber base. We have limited exposure to new home construction with 5% of new subscribers in 2009 being generated from our new home construction customer acquisition channel (“Builder”), which partners with selected major homebuilders in the United States. Our small but growing presence in the commercial market includes is approximately 5% of our total subscriber base. The remaining subscribers reside in multi-family sites.
The business environment in which we operate can change quickly. We must quickly adapt to changes in the competitive landscape and local market conditions. To be successful, we must be able to balance, on a market-by-market basis, the effects of changing demand on the utilization of our resources. We operate on a centralized basis, but allow enough flexibility so local field management can adjust operations to the particular circumstances of its market.
We measure financial performance on a long-term basis. We create value by focusing on yielding solid returns on capital, growing our revenues and earnings, and generating cash flows sufficient to fund our growth.
Factors Affecting Operating Results
We view our business as having two key activities: acquiring new customers and managing our existing customer base. We manage our business around these two activities, and many of our performance metrics are focused on one or both of these activities. We view success in our business as being dependent upon successfully balancing our efforts against both activities. We focus on investing wisely in subscriber growth that will generate positive future returns to shareholders and on generating substantial current profit on the recurring services we provide to our existing customers.
We employ a consistent and disciplined economic decision-making framework to evaluate our existing customer acquisition channels and to prioritize growth opportunities based on the expected cash flows over the life of the customer relationship. This framework takes into account three key elements of cash flow: net customer acquisition cost, ongoing recurring customer cash flow and the annualized customer attrition or disconnect rate. In our evaluations of opportunities, we consider the full range of costs incurred in the customer relationship life cycle, including administrative costs and non-security capital expenditures not directly related to acquiring or servicing customers.
We have historically focused our marketing efforts on “direct response” advertising, projecting a range of advertising messages across multiple media channels to attract the attention of potential customers when they are in the “buying mode.” Potential customers are receptive to initiating security alarm service generally as the result of a major change in personal circumstance, such as a household or business relocation, an increase in (or the perception of an increase in) local criminal activity, or a change in family circumstance (such as the birth of a child, divorce, or death of a spouse) or other lifestyle change (such as increased travel by the head of household). Our marketing efforts are designed to direct potential customers into one of our customer acquisition channels where we qualify the potential customers and attempt to sell them an appropriate level of service to meet their needs. In order to increase efficiency and effectiveness of our customer acquisition efforts, we focus on controlling initial marketing, sales and installation costs by matching sales representative staffing levels with the number of sales leads, and the size of the technician workforce with available installation volume. We monitor the net customer acquisition cost across our customer acquisition channels closely and control both the cash invested in new subscribers (all costs, regardless of whether expensed, capitalized, or deferred) and the investment in new subscribers expensed as a period cost, offsetting a significant portion of our profit from recurring services in arriving at our operating profit in any given period.
19
Table of Contents
Under our standard Protective Service Agreement with residential customers, the customer pays the initial installation fees and is then obligated to make monthly payments throughout the contract term. The standard term for our Protective Service Agreement is three years, which automatically renews for additional one year periods unless cancelled by either party, except in six states where state law requires the renewal period to be month-to-month. If a customer cancels the contract prior to the end of the contract term, or is otherwise in default, we have the right under the contract to receive from the customer an amount equal to all monthly payments remaining under the contractual term.
The process in our Builder channel differs from our traditional customer acquisition model. Working directly with major national, regional, and local home builders, the Builder channel markets and installs residential security systems and a variety of low-voltage security, home networking, communications, and entertainment options into homes under construction. The Builder channel currently conducts business with approximately 160 residential home builders in the United States. The Builder activation process consists of three phases: the “pre-wire” phase of early construction wiring for security systems and potential non-security low-voltage applications in certain markets; the “trim-out” phase in which security system (and in some cases other low-voltage) components are installed in houses as they near completion; and the activation phase in which monitored security service contracts are entered into with homeowners. In 2009, Builder accounted for approximately 5% of our new subscribers.
Once we have acquired a customer, we then strive to keep customer service and monitoring costs as low as possible without detracting from our ability to provide high quality service levels. As our cash break-even point is generally not reached until sometime during the fourth year of service, we focus strongly on providing consistent high quality service at all “customer touch points.”
We have reported strong growth in revenues and operating profit for many years due to our ability to attract and retain customers through brand reputation and quality service while operating as efficiently as possible consistent with the desired level of service. We believe customer retention is driven by our disciplined customer selection practices and our provision of high customer service levels. In order to obtain customers who are less likely to disconnect, we seek to attract customers with acceptable credit scores and the willingness to pay reasonable upfront fees. Once there is an agreement to install a monitored alarm system, we provide a high quality installation followed by continuing high quality customer service and alarm monitoring. We believe our disconnect rate benefits from our consistency in following this strategy. We have retained a significant percentage of customers for fifteen years or more, and we have some customers who have been with us since we began operations more than 26 years ago.
Seasonality
Our business is subject to a certain level of seasonality in our operations. Since more household moves take place during the second and third quarters of each year, our disconnect rate and related non-cash expenses are typically higher in those quarters than in the first and fourth quarters. There is a slight seasonal effect on our new customer installation volume and related cash expenses incurred in investment in new subscribers; however, other factors, such as the level of marketing expense, can offset that effect of seasonality.
Trends, Risks and Uncertainties of Our Business
Brand Introduction. We have incurred costs associated with developing our new brand. There is uncertainty in regards to the timing, duration, and amount of expense to be incurred in the rebranding.
Besides the cost of the rebranding effort, there is a risk that the new brand will not be able to attract prospective customers as effectively as our heritage brand has historically. This could reduce our installation growth rate compared to what we have experienced in our past. Lower installation volume could reduce the future growth rates in operating profit and net income. However, these risks may be mitigated depending on the outcome of the Merger or the concurrent use of our heritage name with our new brand during the initial phases of the new brand launch.
Market size and future. We believe, based on a report from IMS Research and United States Census Bureau statistics, that 17% to 22% of U.S. households currently have monitored security systems. There is uncertainty as to what the ultimate penetration rate of security systems in U.S. households may be; however, we believe that there is still significant opportunity for growth in all geographic markets.
U.S. economy and home sales. Due to continued weakness in the housing market and increasing unemployment rates, our new installation growth rate slowed beginning in 2006 and continued through 2009. Our long-term revenue growth rate depends on installations exceeding disconnects. If the housing market downturn is prolonged, our revenues may not grow at the same rate as in the past. Our Builder channel activity, in particular, is dependent on new housing construction. Future new housing production is very difficult to predict given current disruption in the credit and housing markets and overall economic conditions.
20
Table of Contents
Technology. The majority of our security systems installed in customers’ homes use traditional fixed-line telecommunications to transmit alarm signals to our monitoring centers. We believe that fixed-line telecommunications technology is the most reliable technology currently available for transmitting security system data. There is a growing trend in our market for customers to exclusively use cell-phone or internet communication technology in their homes. While we provide the capability for our customers to use these alternative communications technologies to transmit alarm signals, these services are currently not as reliable as traditional fixed-line telephone service. Communication reliability is important to our long-term business model.
Competition. Our industry is competitive. We compete with a number of national, regional, and local providers of security services. Our competitors may be able to take advantage of our rebranding transition to increase their market share, and potentially to attract some of our current customers to their service.
Key Performance Measures
The success of our business model depends on recurring contractual revenues and cash flows from our ongoing subscriber base. Key drivers of recurring contractual revenues are subscriber growth and continuous focus on existing customer retention. It is important to minimize subscriber cancellations as the majority of costs associated with a subscriber are incurred at installation. It currently takes approximately four years to recover our initial cash investment in a new subscriber. We use some of the cash flows from the ongoing subscriber base to finance the costs necessary to grow the subscriber base. We continually balance the current cost of growth with the future benefit of recurring contractual revenues. The recurring nature of our net operating cash flows tend to buffer, but not eliminate, the impact of negative trends in the general economy. In evaluating our results, we review the following key performance indicators:
Monthly Recurring Revenue (“MRR”) is a non-GAAP measure that is used to evaluate performance. MRR measures the amount of recurring revenues from subscriber fees and is calculated based on the number of subscribers at period end multiplied by the average fee per subscriber received in the last month of the period for contracted monitoring and maintenance services. On page 28, MRR is described in greater detail and is accompanied by a reconciliation of MRR to revenue, its closest GAAP counterpart.
Subscriber Growth — Growth of our subscriber base is crucial to drive MRR expansion and to leverage our costs of operations. Despite a challenging housing market and generally weak economic conditions, our ending subscriber base has continued to grow as presented in the table on page 27.
Customer Retention — Success of our economic model is highly dependent on customer retention. We believe our disconnect rate is the lowest among the major monitored security service companies. Our low disconnect rate driven in part by our discipline in acquiring new customers with acceptable credit backgrounds and by providing high quality equipment, installation, monitoring, and customer service.
Subscriber disconnects stem from three primary sources including account write-offs, household and business moves, and disconnects due to customer initiated cancellations for reasons other than moves. Another factor that can from time to time increase the disconnect rate is cancellation of multi-family contracts, as each contract may contain numerous individual subscriber sites.
Profit from Recurring Services — Profit from recurring services reflects the monthly monitoring and service fees generated from the existing subscriber base, including the amortization of deferred revenues, net of general and administrative expenses, including royalty expense. This measure excludes the results of operations related to investment in new subscribers, a separate non-GAAP measure defined below. Non-cash impairment charges resulting from subscriber contract cancellations and depreciation and amortization expenses, including the amortization of deferred subscriber acquisition costs, are also charged to recurring services. Profit from recurring services is affected by the size of the subscriber base, the amount of operational costs, depreciation, the level of subscriber cancellations, and changes in the average monthly monitoring fee per subscriber. Profit from recurring services is considered to be an important non-GAAP component of our operating profit. This component of operating profit allows investors and others to understand the amount of operating income generated from active security systems. See the “Reconciliation of Non-GAAP Measures” section for the reconciliation of profit from recurring services to its closest GAAP counterpart, net income.
21
Table of Contents
Investment in New Subscribers — Investment in new subscribers is the net expense incurred to add to the subscriber base every year, which is primarily marketing and selling expenses including Brand Introduction costs, net of security system asset capitalization, and net of sales acquisition cost deferrals. The amount of the investment in new subscribers charged to income may be influenced by several factors, including the volume of new subscriber installations and the level of costs incurred to attract new subscribers, which can vary by customer acquisition channel. As a result, increases in the rate of investment (the addition of new subscribers) may have a negative effect on current operating profit, but a positive impact on long-term operating profit, cash flow, and economic value. Investment in new subscribers is considered to be an important non-GAAP component of our operating profit. This component of operating profit allows investors and others to understand the amount of net expenses associated with the installation of new subscribers. See the “Reconciliation of Non-GAAP Measures” section for the reconciliation of investment in new subscribers to its closest GAAP counterpart, net income.
Adjusted EBITDA from Recurring Services — Adjusted EBITDA from recurring services is a non-GAAP measure that we use to convey profits generated from the subscriber base adjusted for certain non-cash items including asset impairment charges, depreciation of fixed assets, amortization of deferred charges, and amortization of deferred revenue. We believe EBITDA from Recurring Services is useful to provide investors with information about operating profits, adjusted for significant non-cash items, generated from the existing customer base, which can be used to support the investment in new subscribers portion of our operations. This measure excludes the results of operations related to investment in new subscribers, a separate non-GAAP measure defined above. In deriving this non-GAAP measure, we reflect the go-forward 1.25% royalty rate in adjusted EBITDA from recurring services for all periods presented. Historically, we paid our former parent company a royalty of 7% on revenues in the United States and 3% on revenues in Canada. On November 1, 2008, the royalty rate changed to approximately 1.25% of revenues and will continue to be calculated on that basis until the earlier of when we cease to use certain BCO trademarks or the expiration of the license agreement on October 31, 2011. See the “Reconciliation of Non-GAAP Measures” section for the reconciliation of adjusted EBITDA from recurring services to its closest GAAP counterpart, net income.
Adjusted Cash Invested in New Subscribers — Adjusted cash invested in new subscribers is a non-GAAP measure that we use to convey the total cash invested to acquire new subscribers or move existing subscribers without regard to the accounting treatment of the various cash components. It is comprised of primarily capitalized security system costs, marketing and selling expenses, and deferred subscriber acquisition costs (current year payments) less deferred revenue from new subscribers (current year receipts). This measure is adjusted to exclude costs related to the Brand Introduction. See the “Reconciliation of Non-GAAP Measures” section for the reconciliation of adjusted cash invested in new subscribers to its closest GAAP counterpart, net income.
22
Table of Contents
RESULTS OF OPERATIONS
| ($ in millions, except EPS, disconnect rate, subscriber growth rate, and subscriber data) | December 31, | |||||||||||
| 2009 | 2008 | 2007 | ||||||||||
| Revenues |
$ | 565.1 | $ | 532.3 | $ | 484.4 | ||||||
| Cost of revenues |
274.3 | 287.0 | 271.9 | |||||||||
| Selling, general and administrative expenses |
190.9 | 150.9 | 144.3 | |||||||||
| Total costs and expenses |
465.2 | 437.9 | 416.2 | |||||||||
| Other operating income, net |
1.5 | (0.4 | ) | 4.8 | ||||||||
| Operating profit |
101.4 | 94.0 | 73.0 | |||||||||
| Interest expense, net |
(0.1 | ) | (0.6 | ) | (1.0 | ) | ||||||
| Income before income taxes |
101.3 | 93.4 | 72.0 | |||||||||
| Income tax expense |
38.6 | 36.3 | 27.8 | |||||||||
| Net income |
$ | 62.7 | $ | 57.1 | $ | 44.2 | ||||||
| Diluted EPS |
$ | 1.36 | $ | 1.25 | $ | 0.96 | ||||||
| Weighted average shares assuming dilution(a) |
46.0 | 45.8 | 45.9 | |||||||||
| Key Performance Indicators |
||||||||||||
| Monthly recurring revenue(b) |
$ | 44.2 | $ | 40.5 | $ | 37.2 | ||||||
| Subscriber growth |
||||||||||||
| Ending number of subscribers (in thousands) |
1,359.0 | 1,301.6 | 1,223.9 | |||||||||
| Ending subscriber base growth (percentage)(c) |
4.4 | 6.3 | 8.8 | |||||||||
| Average number of subscribers (in thousands) |
1,334.5 | 1,267.5 | 1,176.1 | |||||||||
| Average subscriber growth rate (percentage) |
5.3 | 7.8 | 9.7 | |||||||||
| Disconnect rate (percentage)(d) |
8.2 | 7.5 | 7.0 | |||||||||
| Profit from recurring services(e) |
$ | 223.9 | $ | 195.3 | $ | 168.9 | ||||||
| Investment in new subscribers(f) |
$ | (122.5 | ) | $ | (101.3 | ) | $ | (95.9 | ) | |||
| Adjusted EBITDA from recurring services (using 1.25% royalty rate)(g) |
$ | 341.5 | $ | 318.3 | $ | 286.3 | ||||||
| Adjusted cash invested in new subscribers(h) |
$ | (257.3 | ) | $ | (248.5 | ) | $ | (237.5 | ) | |||
| (a) | See Note 15 – Earnings per Share in the notes to the consolidated financial statements for explanation of the calculation of diluted earnings per share. |
| (b) | Monthly recurring revenue (“MRR”), a non-GAAP measure, is calculated based on the number of subscribers at period end multiplied by the average fee per subscriber earned in the last month of the period for contractual monitoring and maintenance services. This measure is reconciled below under the caption “Reconciliation of Non-GAAP Measures.” |
| (c) | Calculated based on period ending subscribers. |
| (d) | Calculated as a ratio, the numerator of which is customer cancellations, on an annualized basis, and the denominator of which is the average number of customers during the period. Customer relocations, reactivations, and dealer charge backs of contract cancellations are excluded from the calculation. |
| (e) | Profit from recurring services, a non-GAAP measure, reflects operating profit generated from the existing subscriber base including the amortization of deferred revenues and deferred acquisition costs as these amounts are recognized over time and are unrelated to generating new subscribers in the current period as discussed under the caption “Key Performance Measures — Profit from Recurring Services.” This measure is reconciled below in the “Reconciliation of Non-GAAP Measures” section. |
| (f) | Investment in new subscribers, a non-GAAP measure, is net expense (primarily marketing and selling expenses, including Brand Introduction costs) incurred to add new subscribers to the subscriber base as discussed under the caption “Key Performance Measures — Investment in New Subscribers.” This measure is reconciled below in the “Reconciliation of Non-GAAP Measures” section. |
| (g) | Adjusted EBITDA from recurring services, a non-GAAP measure, is calculated as if the royalty rate had been approximately 1.25% of revenues for all periods presented. The royalty rate will remain at approximately 1.25% of revenues until the earlier of when we cease to use of certain BCO trademarks or the expiration of the license agreement on October 31, 2011. This measure is reconciled below in the “Reconciliation of Non-GAAP Measures” section. |
| (h) | Adjusted cash invested in new subscribers, a non-GAAP measure, represents cash used to acquire new subscribers during the period and excludes costs related to the Brand Introduction. This measure is reconciled below in the “Reconciliation of Non-GAAP Measures” section. |
23
Table of Contents
2009 Compared to 2008
Revenues
Revenues increased $32.8 million or 6.2% to $565.1 million in 2009 from $532.3 million in 2008. The increase was primarily due to the 5.3% growth in the average subscriber base during 2009. Additionally, MRR per ending subscriber increased 4.5% over the prior year. The increase in MRR was the result of incremental new product and service offerings to existing customers, bringing on new customers at higher monthly rates, and price increases to certain existing customers. These increases were partially offset by a decline of approximately $4.8 million in pre-wire and trim-out revenues from our new housing construction customer acquisition channel (“Builder”) and the effect of a $3.1 million accounting correction benefiting 2008 revenue as described in Note 1 – Description of Business, The Spin-off, Basis of Presentation, and Significant Accounting Policies in the notes to the consolidated financial statements.
Cost of Revenues
Cost of revenues decreased $12.7 million or 4.4% to $274.3 million in 2009 from $287.0 million in the prior year. The decrease was due primarily to the decline in the royalty rate charged to us by our former parent for use of certain trademarks. The rate was approximately 7% of revenues through October 31, 2008, and was thereafter reduced to approximately 1.25% of revenues. The royalty rate change and the offsetting increase in revenue volume resulted in a net decrease in royalty expense of $24.6 million in 2009 compared to the prior year. Additionally, cost of revenues declined approximately $7.1 million due to lower expenses stemming from lower levels of activity in the Builder channel. The decline was partially offset by a $9.8 million increase in impairment charges related to subscriber disconnects, an increase in security system depreciation of $5.2 million, resulting from the increased subscriber base, and other increased costs to support the larger subscriber base. Cost of revenues was 48.5% of revenues in 2009 and 53.9% in the prior year. Had the royalty rate been approximately 1.25% of revenues for all of 2008, cost of revenues in that year would have been $262.0 million or 49.2% of revenues. Refer to “Reconciliation of Non-GAAP Measures” section for further analysis on the impact of the royalty rate on cost of revenues.
Selling, General, and Administrative Expenses
Selling, General, and Administrative Expenses (“SG&A”) increased by $40.0 million or 26.5% to $190.9 million in 2009 from $150.9 million in the prior year. The increase was primarily due to $20.6 million expense related to Brand Introduction costs, $4.6 million increase in account servicing costs related to customer retention efforts, $4.1 million incremental litigation expense, $2.3 million increased advertising costs targeted to drive sales opportunities, and $1.1 million of expense related to the Merger. SG&A was 33.8% of revenues in 2009 and 28.3% in the prior comparable period. Excluding Brand Introduction costs, SG&A would have been $170.3 million or 30.1% of revenues in 2009. Refer to “Reconciliation of Non-GAAP Measures” section for further analysis on the impact of Brand Introduction costs on operating profit.
Operating Profit
Operating profit increased $7.4 million or 7.9% to $101.4 million in 2009 from $94.0 million in the prior comparable period, driven primarily by the decrease in the royalty rate and higher profits from recurring services on our larger subscriber base. These improvements were partially offset primarily by Brand Introduction costs and increased impairment charges related to more customer disconnects. Operating margin was 17.9% in 2009 compared to 17.7% in 2008. Excluding Brand Introduction costs, operating profit would have been $122.0 million or 21.6% of revenue in 2009. Had the royalty rate been approximately 1.25% of revenues in 2008, operating profit in 2008 would have been $119.0 million, or 22.4% of revenue. Refer to “Reconciliation of Non-GAAP Measures” section for further analysis on the impact of the royalty rate change and Brand Introduction costs on operating profit.
Provision for Income Taxes
Provision for income taxes increased by $2.3 million to $38.6 million in 2009 from $36.3 million in the prior year due to growth in income before income taxes.
Net Income and Earnings Per Share
In 2009, we reported net income of $62.7 million, or $1.36 per diluted share, compared to $57.1 million, or $1.25 per pro forma share, in the prior year. As previously discussed, 2009 benefited from the decrease in the royalty expense and higher net profit from the larger subscriber base partially offset by Brand Introduction costs, and increased impairment costs related to more subscriber disconnects. Net income for 2009 decreased $12.8 million, net of tax, due to Brand Introduction costs. The impact of Brand Introduction on diluted earnings per share was $0.28. Refer to “Reconciliation of Non-GAAP Measures” section for further analysis on the impact of the royalty rate change and the Brand Introduction costs on net income.
24
Table of Contents
Monthly Recurring Revenue
MRR increased $3.7 million or 9.1% as of December 31, 2009 from prior year primarily as the result of the 4.4% increase in the size of the ending subscriber base and a 4.5% increase in average recurring revenue per ending subscriber. The increase in MRR per subscriber was due to adding new subscribers at higher monthly monitoring rates, price increases, disconnecting customers having generally lower monthly recurring rates, and growth in additional chargeable services provided to both new and existing subscribers.
Subscriber Growth
During 2009, the subscriber base grew by 57.4 thousand subscribers, achieving ending subscriber growth of 4.4% as compared to the prior year. The highest growth in our subscriber base was achieved in the authorized dealer subscriber acquisition channel. While housing and overall market conditions are expected to remain challenging into 2010, we believe installations will continue to exceed disconnects, leading to sustained subscriber growth in the mid-single digit range in 2010.
Disconnect Rate
The annualized disconnect rate for 2009 increased to 8.2% from 7.5% in 2008, driven primarily by an increase in customer requested cancellations, with the most significant increase in customers indicating cancellation were for financial reasons. An increase in customer disconnects resulting from account write-offs was offset by a decrease in multifamily disconnects during 2009 relative to prior year.
Profit from Recurring Services
Profit from recurring services increased $28.6 million or 14.6% to $223.9 million during 2009 from $195.3 million in the prior year. The increase was due primarily to the decrease in the royalty rate of $21.7 million and higher net profits from our larger subscriber base, partially offset by higher impairment charges related to customer disconnects, account servicing costs, and depreciation expense.
Investment in New Subscribers
Investment in new subscribers increased $21.2 million to $122.5 million in 2009 from $101.3 million in the prior year. The increases were primarily the result of $20.6 million incurred for the Brand Introduction during 2009, an increase in general advertising and selling costs, and a decrease in Builder channel revenue offset by a decrease in costs in the Builder channel.
Adjusted EBITDA from Recurring Services
Adjusted EBITDA from recurring services increased $23.2 million or 7.3% to $341.5 million in 2009 from $318.3 million in the prior year. The increase was primarily the result of subscriber base growth and higher monthly recurring revenue, partially offset by higher account servicing costs.
Adjusted Cash Invested in New Subscribers
Adjusted cash invested in new subscribers increased $8.8 million or 3.5% to $257.3 million in 2009 from $248.5 million in the prior year. These increases were primarily due to increased advertising and selling costs, higher materials costs, and an increase in the average cost of accounts acquired from our authorized dealers. Materials costs increased due primarily to an increase in the installation of wireless product. We anticipate that this additional investment will be recovered in the future through increases in adjusted EBITDA from recurring services.
2008 Compared to 2007
Revenues
Revenues increased $47.9 million or 9.9% to $532.3 million in 2008 from $484.4 million in 2007. The increase was primarily due to 7.8% growth in the average subscriber base and 3% higher average monitoring rates, partially offset by an 18% decline in Builder pre-wire and trim-out revenues. The larger subscriber base and higher average monitoring and service rates also contributed to an 8.9% increase in MRR for 2008 as compared to 2007.
25
Table of Contents
Cost of Revenues
Cost of revenues increased by $15.1 million or 5.6% to $287.0 million in 2008 from $271.9 million in 2007, which was due primarily to the growth in the subscriber base partially offset by the decline in the royalty rate from approximately 7% of revenues to 1.25% of net revenues beginning November 1, 2008. This decrease in the royalty rate reduced cost of revenues by $5.1 million. Cost of revenues were 53.9% of revenues in 2008 compared to 56.1% in 2007. Had the royalty rate been 1.25% of net revenues for both years, cost of revenues would have been $262.0 million in 2008 as compared to $244.8 million in 2007, an increase of 7.0%. Cost of revenues as adjusted for royalty expense of 1.25% of net revenues for both years would have been 49.2% in 2008 as compared to 50.5% in 2007. Refer to “Reconciliation of Non-GAAP Measures” section for further analysis on the impact of the change in royalty rate on cost of revenues.
Selling, General, and Administrative Expenses
SG&A increased by $6.6 million or 4.6% to $150.9 million in 2008 from $144.3 million in 2007. The increase was primarily due to increased spending in several functional areas, as we continued to invest in our capabilities to service commercial customers. In addition, automobile reimbursement costs increased for sales employees during 2008 as compared to 2007, and administrative costs increased as we entered into our credit facility, and staffed corporate functions required as a result of the Spin-off. These increases were partially offset by a decrease of $3.9 million in BCO allocated overhead costs prior to the Spin-off in 2008 as compared to 2007. Selling, general and administrative expenses were 28.3% of revenues in 2008 compared to 29.8% in 2007.
Operating Profit
Operating profit increased $21.0 million or 28.8% to $94.0 million in 2008 compared to $73.0 million in 2007, driven primarily by higher profits from recurring services on our larger subscriber base and a decrease in the royalty rate from approximately 7% of revenues before the Spin-off to 1.25% of net revenues after the Spin-off. Had the royalty rate been 1.25% of net revenue for both years, operating profit would have been $119.0 million in 2008 as compared to $100.2 million in 2007, an increase of 18.8%. Refer to “Reconciliation of Non-GAAP Measures” section for further analysis on the impact of the change in royalty rate on operating profit.
Provision for Income Taxes
Provision for income taxes increased by $8.6 million to $36.3 million in 2008 compared to $27.8 million in 2007 due to growth in income before income taxes.
Net Income and Earnings Per Share
For 2008, we reported net income of $57.1 million, or $1.25 per diluted share, compared to $44.2 million, or $0.96 per pro forma share, for 2007. As previously discussed, the 2008 results benefited from a decrease in the royalty rate charged by BCO from approximately 7% of revenues to 1.25% of net revenues beginning November 1, 2008. Refer to “Reconciliation of Non-GAAP Measures” section for further analysis on the impact of the change in royalty rate on net income.
Monthly Recurring Revenue
MRR increased $3.3 million or 8.9% from 2008 to 2007 primarily as the result of the increase in the size of the subscriber base and the increase in recurring revenue per subscriber. The increase in MRR per subscriber is the result of adding new subscribers at higher monthly recurring rates, increasing prices charged to selected portions of the existing subscriber base, and providing additional services to both new and existing subscribers.
Subscriber Growth
As of December 31, 2008, the number of ending subscribers grew 77.7 thousand or 6.3% compared to 8.8% growth in 2007. Subscriber growth is driven by installations partially offset by subscriber disconnects. During 2008, installations slowed and disconnects increased. Installations grew across most sales acquisition channels, with the exception of multi-family and Builder channels. The subscriber base grew during the year due to the number of installations (173.1 thousand in 2008) continuing to exceed the number of net disconnects (95.4 thousand in 2008).
26
Table of Contents
Disconnect Rate
The annualized disconnect rate for 2008 increased to 7.5%, up from 7.0% in 2007. The increase in the disconnect rate was primarily due to an increase in customer-requested cancellations, with the most significant increase in customers indicating cancellations were for financial reasons. Household moves were a major driver of disconnects, however net cancellations due to moves were down slightly as a percent of the subscriber base in 2008 as compared to 2007. Disconnects resulting from account write-offs were flat year over year.
Profit from Recurring Services
Profit from recurring services increased $26.4 million or 15.6% to $195.3 million during 2008 from $168.9 million in 2007. The increase was due primarily to higher profits from recurring services from our larger subscriber base and a decrease in the royalty rate subsequent to the Spin-off.
Investment in New Subscribers
Investment in new subscribers increased $5.4 million to $101.3 million in 2008 from $95.9 million in 2007 primarily due to increased spending in several functional areas, as we continued to invest in our capabilities to service commercial customers.
Adjusted EBITDA from Recurring Services
This measure increased by 11.2% to $318.3 million in 2008 as compared to $286.3 million in 2007. The increase was primarily the result of the increase in the size of the subscriber base and the increase in recurring revenue per subscriber.
Adjusted Cash Invested in New Subscribers
Adjusted cash invested in new subscribers increased $11.0 million or 4.6% to $248.5 million in 2008 from $237.5 million in 2007. This increase was primarily due to increased spending to invest in our capabilities to service commercial customers, higher materials costs, and an increase in the average cost of accounts acquired from our authorized dealers.
Supplemental Information
Subscriber Activity
| December 31, | |||||||||||||||
| %Change | |||||||||||||||
| (Subscriber activity in thousands, rates in percentages) | 2009 | 2008 | 2007 | 2009 | 2008 | ||||||||||
| Number of subscribers: |
|||||||||||||||
| Beginning of period |
1,301.6 | 1,223.9 | 1,124.9 | ||||||||||||
| Installations(a) |
166.5 | 173.1 | 180.8 | (3.8 | ) | (4.3 | ) | ||||||||
| Disconnects(a),(b) |
(109.1 | ) | (95.4 | ) | (81.8 | ) | 14.4 | 16.6 | |||||||
| End of period |
1,359.0 | 1,301.6 | 1,223.9 | 4.4 | 6.3 | ||||||||||
| Average number of subscribers |
1,334.5 | 1,267.5 | 1,176.1 | 5.3 | 7.8 | ||||||||||
| Annualized disconnect rate(c) |
8.2 | 7.5 | 7.0 | ||||||||||||
| Disconnect rate, excluding multifamily disconnects(d) |
8.0 | 7.1 | 6.6 | ||||||||||||
| (a) | Customers who move from one location and then initiate a new monitoring agreement at a new location, totaling 21.1 thousand, 22.8 thousand, and 26.4 thousand for the years ended 2009, 2008, and 2007, respectively, are not included in either installations or disconnects. Dealer accounts cancelled and charged back to the dealer during the specified contract term are excluded from installations and disconnects. |
| (b) | Inactive sites that are returned to active service, which we call system takeovers, reduce disconnects and were 26.8 thousand, 26.2 thousand, and 26.9 thousand for the years ended 2009, 2008, and 2007, respectively. |
| (c) | The annualized disconnect rate is a ratio. The numerator is the number of customer cancellations during the period multiplied by the appropriate ratio for the twelve month period. The denominator is the average number of customers during the period. The gross number of customer cancellations is reduced for customers who move from one location and then initiate a new monitoring agreement at a new location, disconnected accounts charged back to the dealers because the customers cancelled service during the specified contractual term, and inactive sites that are returned to active service during the period. |
| (d) | Disconnect rate as defined in Note (c), excluding multifamily account cancellations. |
27
Table of Contents
Reconciliation of Non-GAAP Measures
Operating Results Adjusted for Brand Introduction Costs and Royalty Rate
Our results of operations include costs related to our Brand Introduction, incurred primarily in 2009, and royalty expense that is charged to us by BCO for the use of certain trademarks. The royalty rate utilized for the months January through October 2008 and year ended December 31, 2007 was approximately 7% of revenues in the United States and 3% of revenues outside of the United States. However, for November and December 2008 and the year ended December 31, 2009, the royalty rate used was approximately 1.25% of revenues for both within and outside the United States. For comparability of financial results, we present operating results adjusted by Brand Introduction costs and the 1.25% royalty rate for 2009. This supplemental non-GAAP information should be reviewed in conjunction with our historical condensed consolidated statements of income.
The table below reconciles operating results adjusted by the 1.25% royalty rate and Brand Introduction costs to GAAP operating results for 2009, 2008, and 2007.
| (in millions, except EPS) | December 31, | |||||||||||
| 2009 | 2008 | 2007 | ||||||||||
| Non-GAAP operating profit |
$ | 122.0 | $ | 119.0 | $ | 100.2 | ||||||
| Brand Introduction |
(20.6 | ) | — | — | ||||||||
| Adjustment to royalty rate |
— | (25.0 | ) | (27.2 | ) | |||||||
| GAAP operating profit |
$ | 101.4 | $ | 94.0 | $ | 73.0 | ||||||
| Non-GAAP net income |
$ | 75.5 | $ | 72.4 | $ | 60.9 | ||||||
| Brand Introduction |
(20.6 | ) | — | — | ||||||||
| Adjustment to royalty rate |
— | (25.0 | ) | (27.2 | ) | |||||||
| Tax effect of adjustments |
7.8 | 9.7 | 10.5 | |||||||||
| GAAP net income |
$ | 62.7 | $ | 57.1 | $ | 44.2 | ||||||
| Non-GAAP earnings per share — diluted |
$ | 1.64 | $ | 1.58 | $ | 1.33 | ||||||
| Brand Introduction |
(0.45 | ) | — | — | ||||||||
| Adjustment to royalty rate |
— | (0.54 | ) | (0.60 | ) | |||||||
| Tax effect of adjustments |
0.17 | 0.21 | 0.23 | |||||||||
| GAAP earnings per share — diluted |
$ | 1.36 | $ | 1.25 | $ | 0.96 | ||||||
Monthly Recurring Revenues
MRR is a non-GAAP measure used to evaluate performance. We believe the presentation of MRR is useful to investors because the measure is widely used in the industry to assess the amount of recurring revenues from subscriber, monitoring, and other service fees. This supplemental non-GAAP information should be reviewed in conjunction with our historical consolidated statements of income.
The table below reconciles monthly recurring revenues, a non-GAAP measure, to revenues, its closest GAAP counterpart.
| (in millions) | December 31, | ||||||||
| 2009 | 2008 | 2007 | |||||||
| Monthly recurring revenues (“MRR”)(a) |
$ | 44.2 | $ | 40.5 | $ | 37.2 | |||
| Amounts excluded from MRR: |
|||||||||
| Amortization of deferred revenue(b) |
3.3 | 3.6 | 2.8 | ||||||
| Other revenues(c) |
1.2 | 1.4 | 1.6 | ||||||
| Revenues on a GAAP basis: |
|||||||||
| December |
48.7 | 45.5 | 41.6 | ||||||
| January — November |
516.4 | 486.8 | 442.8 | ||||||
| Reported GAAP January — December Revenue |
$ | 565.1 | $ | 532.3 | $ | 484.4 | |||
| (a) | MRR is calculated based on the number of subscribers at period end multiplied by the average fee per subscriber received in the last month of the period for contracted monitoring and maintenance services. |
28
Table of Contents
| (b) | Includes amortization of deferred revenue related to active subscriber accounts and recognition of deferred revenue related to subscriber accounts that disconnect. |
| (c) | Other revenues are not pursuant to monthly contractual billings, including but not limited to revenue from commercial product sales, on-call service revenue, and pre-wire and trim-out revenue from the Builder channel. Other revenues also include terminated contract penalty billings for breached contracts, pass-through revenue (alarm permit fees, false alarm fines, etc.), and partial month revenues recognized from customers who disconnected during the last month of the period and are therefore not included in MRR. This amount is reduced for adjustments recorded against revenue (primarily customer goodwill credits and other billing adjustments), and for the amount included in MRR for new customers added during the last month of the period for those portions of the month for which revenues were not recognized for such customers. |
Profit from Recurring Services and Investment in New Subscribers
Profit from recurring services and investment in new subscribers are non-GAAP measures used to evaluate performance. We believe the presentation of these measures is useful to investors as it reflects the ongoing profit generated from the subscriber base and the net expenses incurred to acquire new subscribers. This supplemental non-GAAP information should be reviewed in conjunction with our historical consolidated statements of income.
The table below reconciles profit from recurring services and investment in new subscribers for the years ended December 31, 2009, 2008, and 2007 to net income, their closest GAAP counterpart.
| (in millions) | December 31, | |||||||||||
| 2009 | 2008 | 2007 | ||||||||||
| Profit from recurring services(a) |
$ | 223.9 | $ | 195.3 | $ | 168.9 | ||||||
| Investment in new subscribers(b) |
(122.5 | ) | (101.3 | ) | (95.9 | ) | ||||||
| Interest expense |
(0.1 | ) | (0.6 | ) | (1.0 | ) | ||||||
| Provision for income taxes |
(38.6 | ) | (36.3 | ) | (27.8 | ) | ||||||
| Net income |
$ | 62.7 | $ | 57.1 | $ | 44.2 | ||||||
| (a) | Reflects operating profit generated from the existing subscriber base including the amortization of deferred revenues and deferred acquisition costs as these amounts are recognized over time and are unrelated to generating new subscribers in the current period. |
| (b) | Primarily marketing and selling expenses, including the Brand Introduction costs of $20.6 million for 2009, net of the deferral of subscriber acquisition costs (primarily a portion of sales commissions and related costs) incurred in the acquisition of new subscribers. This metric also includes operating expenses related to the Builder channel. |
Adjusted EBITDA from Recurring Services and Adjusted Cash Invested in New Subscribers
Adjusted EBITDA from recurring services and adjusted cash invested in new subscribers are measures used to monitor our operating performance. This supplemental non-GAAP information should be reviewed in conjunction with our historical consolidated statements of income and cash flow.
The table below reconciles adjusted EBITDA from recurring services and adjusted cash invested in new subscribers for years ended December 31, 2009, 2008, and 2007 to net income, their closest GAAP counterpart.
| (in millions) | December 31, | |||||||||||
| 2009 | 2008 | 2007 | ||||||||||
| Adjusted EBITDA from recurring services |
$ | 341.5 | $ | 318.3 | $ | 286.3 | ||||||
| Adjustment to royalty rate(a) |
— | (21.7 | ) | (23.5 | ) | |||||||
| Depreciation and amortization |
(91.2 | ) | (85.3 | ) | (77.7 | ) | ||||||
| Impairment charges from subscriber disconnects |
(65.9 | ) | (56.5 | ) | (50.4 | ) | ||||||
| Amortization of deferred revenue |
39.5 | 40.5 | 34.2 | |||||||||
| Profit from recurring services |
223.9 | 195.3 | 168.9 | |||||||||
| Adjusted cash invested in new subscribers |
(257.3 | ) | (248.5 | ) | (237.5 | ) | ||||||
| Deferred revenue from new subscribers (current year receipts) |
(39.8 | ) | (44.3 | ) | (47.4 | ) | ||||||
| Deferred subscriber acquisition costs (current year payments) |
21.8 | 23.1 | 23.8 | |||||||||
| Security system capital expenditures(b) |
173.4 | 168.4 | 165.2 | |||||||||
| Brand Introduction(c) |
(20.6 | ) | — | — | ||||||||
| Investment in new subscribers |
(122.5 | ) | (101.3 | ) | (95.9 | ) | ||||||
| Interest expense |
(0.1 | ) | (0.6 | ) | (1.0 | ) | ||||||
| Provision for income taxes |
(38.6 | ) | (36.3 | ) | (27.8 | ) | ||||||
| Net income |
$ | 62.7 | $ | 57.1 | $ | 44.2 | ||||||
29
Table of Contents
| (a) | Our results of operations include a royalty expense that was charged to us by our former parent company for use of certain trademarks. The rate utilized prior to the Spin-off on October 31, 2008 was approximately 7% of revenues in the United States and 3% of revenues outside of the United States. However, for periods after the Spin-off, the rate used was approximately 1.25% of revenues for both within and outside the United States. For comparison purposes, the current royalty rate of 1.25% was used for the first ten months of 2008 and the year ended December 31, 2007. The royalty adjustment excludes a portion of royalty expense allocated to investment in new subscribers ($3.3 million for 2008 and $3.7 million for 2007) to arrive at adjusted EBITDA from recurring services. |
| (b) | Amount excludes non-security system capital expenditures of $13.7 million, $9.4 million, and $12.6 million for the years ended December 31, 2009, 2008, and 2007, respectively. |
| (c) | Brand Introduction expenses are excluded from adjusted cash invested in new subscribers. |
LIQUIDITY AND CAPITAL RESOURCES
Liquidity and Capital Resources
At December 31, 2009, our balance of cash and cash equivalents is $113.2 million. In addition, we have $5.0 million invested in short-term certificates of deposit. As of December 31, 2009, we believe our liquidity risks are minimal. With our available resources, we make substantial investments in new subscriber sites with the intention of recouping this investment and generating recurring cash flow over time. We believe our cash flows from operations will be sufficient to satisfy future working capital, capital expenditures, and financing requirements for the foreseeable future. However, our ability to generate positive cash flows from operations is dependent on general economic conditions, competitive pressures, and other business and risk factors described elsewhere in this Form 10-K.
In February 2009, the U.S. Congress passed and the President signed a stimulus package that contains a provision for bonus depreciation for federal income tax purposes on certain types of capital assets placed in service in 2009. This provision substantially reduced our requirement to make federal tax payments during 2009, deferring cash payments for most of our 2009 tax liability into subsequent years, beginning in 2010. At the current time, for such periods that we remain a separate reporting entity for federal tax purposes, we anticipate our cash payments for income taxes during 2010 will approximate our provision for income taxes for the year.
Pursuant to the Tax Matters Agreement (“TMA”), BCO elected several tax accounting method changes that were implemented in BCO’s U.S. Federal 2008 consolidated tax return, which included our operating results prior to the Spin-off, filed in September 2009. As a result of these elections, our current deferred tax assets decreased by $16.5 million and noncurrent deferred tax liabilities increased by $10.8 million. These elections change the timing and amount of deductions in future tax returns, possibly impacting our future cash tax payments. Under current tax law, we do not anticipate a significant increase in future cash tax payments due to these elections provided we continue to grow our subscriber base and continue to defer substantial amounts of installation revenue collected from subscribers. See Note 2 – Transactions with Related Parties in the notes to the consolidated financial statements for further information.
In October 2008, we entered into a credit agreement (as amended, supplemented or otherwise modified from time to time, the “Credit Agreement”) that provides for a $75 million unsecured revolving credit facility provided by a bank group led by JPMorgan Chase Bank, N.A (the “Credit Facility”). A portion of the Credit Facility, up to $15 million, may be used to issue letters of credit. Additionally, the Credit Facility has an expansion feature providing an option to increase the commitment by up to $50 million, under certain conditions. We believe that the lenders that are parties to the Credit Agreement are capable of meeting any borrowing requests we may make in the foreseeable future. We intend to use the proceeds of the Credit Facility, as necessary, to support our working capital needs, the growth of the business, and for other general corporate purposes. For the year ended December 31, 2009, no borrowings have been made under the Credit Facility, but we have used the Credit Facility to issue letters of credit totaling $4.3 million.
The Credit Agreement requires us to satisfy various customary affirmative and negative covenants including: a leverage ratio and fixed charge coverage ratio. As of December 31, 2009, we were in compliance with the Credit Agreement’s requirement of no more than 2.5 to 1.0 leverage ratio. We were also in compliance with the Credit Agreement’s requirement of at least a fixed charge ratio of 2.0 to 1.0. See Note 12 – Credit Agreement in the notes to our consolidated financial statements for further information regarding the Credit Agreement and the Credit Facility.
30
Table of Contents
In order for us to comply with certain operating covenants included in the Merger Agreement, and as contemplated by the Merger Agreement, we entered into an amendment and received a limited consent and waiver to the Credit Agreement.
Based upon the balance of cash and cash equivalents at December 31, 2009, the availability of funds under the Credit Facility, and cash inflows from operations, we believe we have sufficient liquidity to pursue our plans for subscriber growth and to execute the Brand Introduction as necessary.
Summary Cash Flow Information
Cash flows from operations include cash received from monthly recurring revenue and upfront installation fees received from customers less cash costs to monitor subscribers (including cash corporate costs and cash taxes paid) and certain costs, principally marketing and selling costs, associated with new customer installations. Cash used in investing activities is primarily spent on capital expenditures consisting of equipment, labor, and overhead costs incurred to install security systems for new subscribers and on costs to purchase newly installed security systems from authorized dealers. Prior to the Spin-off, cash flows from financing activities were primarily related to distributions from and contributions to BCO. See Note 2 – Transactions with Related Parties in the notes to the consolidated financial statements for a discussion of our ongoing relationship with BCO after the Spin-off.
The following table shows selected information from our statement of cash flows for the periods presented.
| (in millions) | December 31, | |||||||||||
| 2009 | 2008 | 2007 | ||||||||||
| Cash flows from: |
||||||||||||
| Operating activities |
$ | 240.1 | $ | 224.0 | $ | 183.7 | ||||||
| Investing activities |
(192.1 | ) | (177.8 | ) | (175.8 | ) | ||||||
| Cash flows available for financing activities |
$ | 48.0 | $ | 46.2 | $ | 7.9 | ||||||
| Financing activities |
$ | 1.4 | $ | 14.2 | $ | (7.3 | ) | |||||
2009 Compared to 2008
Cash Flow from Operating Activities
Operating cash flow increased by $16.1 million to $240.1 million in 2009 from $224.0 million in 2008, primarily due to the positive effects of a larger subscriber base of approximately $23.2 million. Operating cash flow also increased approximately $24.6 million as a result of the reduction in the royalty rate from the prior year. Additionally, operating cash flow increased due to an increase in deferred income taxes and corresponding reduction of cash tax payments resulting from electing bonus depreciation for federal tax purposes for certain types of capital assets placed in service during the year. These increases to cash flow were partially offset by increased uses of cash including Brand Introduction payments of approximately $20.6 million and increased income tax payments of $5.5 million.
Cash Flow from Investing Activities
Investing cash outflows increased by $14.3 million to $192.1 million in 2009 from $177.8 million in the prior year. Non-security system capital expenditures increased to $13.7 million in 2009 compared to $9.4 million in the prior year primarily due to the expansion of, and improvements to, our facilities and upgrades in telecommunication and computer equipment. Capital expenditures for security systems increased by $5.0 million to $173.4 million in 2009 relative to the prior year. The majority of our capital expenditures are for equipment, labor, overhead costs incurred to install security systems for new subscribers, and costs to purchase new sites from authorized dealers. The average capital expenditure per new customer site, including new sites installed for existing customers who relocated, increased by $67 to $924 in 2009 from $857 in the prior year due primarily to an increase in security system assets acquired from dealers. Security assets acquired from dealers have higher average capitalized costs. Furthermore, we purchased $5.0 million in certificates of deposit in 2009 which increased cash flow used in investing activity.
Cash Flow from Financing Activities
During 2009, financing activities were minimal and consisted of proceeds from stock option exercises. Cash flows from financing activities of $14.2 million in 2008 were primarily contributions to BCO resulting from positive net cash flow from operating and investing activities prior to Spin-off.
31
Table of Contents
2008 Compared to 2007
Cash Flow from Operating Activities
Operating cash flow increased by $40.3 million to $224.0 million in 2008 compared to $183.7 million in 2007 primarily due to the positive effects of a larger subscriber base, lower installation volume, and a reduction in the royalty rate. New security system installations declined by 4.3% from approximately 180.8 thousand in 2007 to approximately 173.1 thousand in 2008. Additionally, operating cash flow increased due to an increase in deferred income taxes resulting from electing bonus depreciation for federal tax purposes for certain types of capital assets placed in service during the year.
Cash Flow from Investing Activities
Investing cash outflows increased by $2.0 million to $177.8 million in 2008 compared to 2007. Gross capital expenditure spending was the same in both years; however, in 2007, we received $2.0 million in insurance proceeds that reduced investing cash outflows. Capital expenditures are primarily for equipment, labor and overhead costs incurred to install security systems for new subscribers, and costs to purchase new sites from dealers. New customer sites added to the subscriber base, including new sites installed for existing customers who relocated, before the effect of disconnects were approximately 196.5 thousand sites as compared to 207.8 thousand sites in 2007. The average capital expenditure per new customer site increased by $62 to $857 in 2008 as compared to $795 in 2007.
Cash Flow from Financing Activities
Cash flows from financing activities increased $21.5 million to $14.2 million in 2008 from a $7.3 million outflow in 2007. Prior to the Spin-off, cash flows from financing activities consisted primarily of contributions to and distributions from BCO resulting from operating and investing activities. As of October 31, 2008, BCO contributed $50 million cash to us as a condition of the Spin-off. In 2008, before the Spin-off, we distributed $32.2 million in cash to BCO generated from positive cash flows before financing.
Off Balance Sheet Transactions
We have operating leases that are described in the notes to our consolidated financial statements. See Note 7 – Operating Lease in the notes to the consolidated financial statements for operating leases that have residual value guarantees. We use operating leases to lower our cost of financing. We believe operating leases are an important component of our capital structure.
In connection with the Spin-off, we have been indemnified by BCO for all liabilities related to BCO’s former coal operations and certain tax liabilities under the Tax Matters Agreement. Refer to Note 13 — Commitments and Contingencies for further information regarding indemnification of BCO’s coal liabilities and Note 6 — Income Taxes in the notes to our consolidated financial statements for further information.
Contractual Obligations
The following table reflects our contractual obligations as of December 31, 2009.
| (in millions) | Estimated Payments Due by Period | ||||||||||||||||||||
| 2010 | 2011 | 2012 | 2013 | 2014 | Later Years |
Total | |||||||||||||||
| Contractual obligations |
|||||||||||||||||||||
| Operating lease obligations |
$ | 8.7 | $ | 7.3 | $ | 5.2 | $ | 3.4 | $ | 1.3 | $ | 0.2 | $ | 26.1 | |||||||
| Uncertain tax positions(a) |
5.4 | 5.4 | |||||||||||||||||||
| Purchase obligations |
2.4 | 2.4 | |||||||||||||||||||
| Total(b) |
$ | 16.5 | $ | 7.3 | $ | 5.2 | $ | 3.4 | $ | 1.3 | $ | 0.2 | $ | 33.9 | |||||||
| (a) | We have accrued for uncertain tax positions, pursuant to accounting guidance, in the amount of $5.4 million in 2009. The expected timing of the cash settlement for the $5.4 million is currently not reasonably estimable. |
| (b) | Net deferred income tax liabilities have been excluded from this table. We are unable to estimate the timing of income tax payments due to the inherent uncertainties of this obligation. |
Inflation
We believe that inflation has not materially affected our operations.
32
Table of Contents
CRITICAL ACCOUNTING POLICIES AND ESTIMATES
The application of accounting policies necessarily involves judgment and, in certain instances, the use of estimates and assumptions. Different amounts could be reported under different conditions or using different assumptions. We believe that the accounting policies used to develop estimates that are the most critical to understanding and evaluating our reported results relate to: revenue recognition, security systems capitalization, deferred subscriber acquisition costs, long-lived asset valuation, useful lives of security systems, allowance for doubtful accounts, and income taxes.
Historically, actual results have not differed materially from estimates.
We have discussed the development and selection of the critical accounting policies with our Audit and Finance Committee of our Board of Directors. The Audit and Finance Committee has reviewed our disclosures relating to these policies in this section of our Annual Report. For a description of all of our significant accounting policies see Note 1 – Description of Business, The Spin-off, Basis of Presentation, and Significant Accounting Policies in the notes to our consolidated financial statements.
Revenue Recognition
Major components of our revenue include contractual monitoring and service revenues, non-refundable installation fees, including connection fees, additional equipment installation fees, sales of equipment without an extended contractual relationship, and other services. We defer certain revenues associated with customer acquisition.
We recognize contractual monitoring and service revenue monthly as we provide services pursuant to the terms of subscriber contracts which have contract prices that are fixed and determinable. The subscriber’s ability to meet the contract terms is assessed, including payment terms, before entering into the contract. Generally, we defer revenues associated with installation fees and recognize them using the straight-line method over the life of the customer relationship, which we currently estimate to be 15 years. We recognize revenues associated with the sale of products for which there is no attached extended contractual relationship when the products are delivered. We recognize revenues from services not covered by the terms of subscriber contracts as those services are rendered.
Unamortized balances of deferred revenue resulting from installation fees and the associated deferred cost in the event the related security system asset is disconnected and considered for impairment is immediately recognized, as described in “Deferred Subscriber Acquisition Costs.”
Sales taxes collected from customers and remitted to governmental authorities are not included in revenues in our consolidated statements of income.
Security Systems Capitalization
We retain ownership of most security systems installed at subscriber locations. Capitalized costs related to security systems that are installed using Company employees and subcontractors include equipment and materials used in the installation process, direct labor required to install the equipment at subscriber sites, and other costs associated with the installation process. Other costs include the cost of vehicles used for installations and the portion of telecommunication, facilities, and administrative costs incurred primarily at our branches that are associated with the installation process. We estimate the other costs to be capitalized by allocating branch costs between installation activities and service activities. The portion of costs related to service activities is expensed while the portion of costs related to installation is capitalized. Estimates are re-evaluated periodically. While the relationship between installation and service activities fluctuates, such fluctuations have historically been insignificant and are not expected to materially change in the future. No corporate general and administrative or overhead costs are capitalized. In 2009, direct labor and other costs represented approximately 67% of the amounts capitalized, while equipment and materials represented approximately 33% of amounts capitalized. Security system assets acquired from third party dealers are capitalized at the contractually determined purchase price.
Deferred Subscriber Acquisition Costs
We incur marketing and selling costs to obtain new subscribers. Certain subscriber acquisition costs are deferred, primarily incremental direct selling costs. Substantially all deferred subscriber acquisition costs consist of incremental sales compensation and fringe benefits and referral fees paid which are directly related to successful subscriber acquisition efforts. The amount of deferred commissions is based on the percentage of successful sales to total sales efforts. We expense all marketing costs and indirect selling costs as current period costs.
33
Table of Contents
For most installations, subscriber acquisition costs are less than deferred installation fees and are amortized using a straight-line method over the 15 year estimated life of the customer relationship. Estimated lives of the customer relationship are based on our ongoing annual analysis of subscriber and site retention. When a security system asset is identified for possible impairment, any unamortized deferred subscriber acquisition costs related to that installation are immediately recognized.
For subscribers acquired through our Builder channel activities, there are no deferred revenues. Subscriber acquisition costs are deferred for these activities and amortized using a straight-line method over the three-year initial monitoring contract term. We evaluate recoverability of the deferred acquisition costs by comparing the cost incurred to the expected cash to be received under the initial term of the related monitoring contract less estimated incremental costs to monitor the site. Because the expected net cash flows from the initial monitoring contract significantly exceed the deferred subscriber acquisition costs, we believe that the deferred subscriber acquisition costs are recoverable. Deferred subscriber acquisition costs of a Builder channel activation typically is approximately one-third of the minimum contractual revenues from the initial monitoring contract.
Historically, the relationship of deferred subscriber acquisition costs to the expected initial monitoring contract revenues has not changed materially and material changes in the foreseeable future are not expected.
Long-Lived Asset Valuation
At December 31, 2009, we had net property and equipment of $710.1 million, including $1,012.5 million related to security systems. Long-lived assets, including security systems, are reviewed for impairment when events or changes in circumstances indicate the carrying value of an asset may not be recoverable. Impairment is indicated when the estimated total undiscounted cash flows associated with the asset or group of assets is less than the carrying value. If impairment is indicated, an adjustment is made to write the asset down to its fair value, and a loss is recorded as the difference between the carrying value and fair value.
Impairment charges for security systems are recorded in cost of revenues based on the carrying value of security systems estimated to be permanently impaired during the period. The carrying value is the remaining net book value associated with a security system that has been disconnected. The number of permanently impaired security systems are estimated based on the actual disconnects during the period less an estimated number of those sites that will reconnect within a reasonable period in the future. The estimate of sites that will reconnect within a reasonable period in the future is analyzed and updated on an ongoing basis using actual historical data. The actual reconnect rate has not fluctuated materially over the past five years. For the sites that are expected to be reconnected within a reasonable period, the undiscounted cash flows expected to result from the reactivations exceed the carrying value of the security system assets, and accordingly, no impairment is recorded for those assets. Should the estimate of future reconnection materially change, our impairment charges could be affected.
Deferred installation revenues and deferred subscriber acquisition costs are associated with the subscriber relationship as opposed to the underlying physical asset. The carrying value of deferred installation fees and the associated carrying value of deferred acquisition costs are immediately recognized in the event of subscriber contract cancellation.
Useful Lives of Security Systems
Most security system assets are depreciated using the straight-line method over the 15 year estimated economic useful lives of the assets. At least annually, economic useful lives of security system assets are re-evaluated based upon our ongoing analysis of all pertinent factors, including observation of sites remaining in active service, historical disconnect and reconnect data, and assessment of the estimated technological life of the installed systems. Economic useful life of these security system assets are estimated primarily based on actual observations of the percentage of security system assets that remain in active status as the installed systems age over time. The percentage relationships have remained relatively stable over time. The percentage relationships are not expected to change materially in the foreseeable future.
Security systems at multi-family locations are depreciated using the straight-line method over the initial term of the related monitoring contracts, which range from three to ten years.
34
Table of Contents
Allowance for Doubtful Accounts
The allowance for doubtful accounts is our best estimate of the amount of probable credit losses on existing accounts receivable. The allowance is based on historical write-off experience. The allowance for doubtful accounts is reviewed quarterly. Account balances are charged off against the allowance after all means of collection have been exhausted and the potential for recovery is considered remote. Total allowance for uncollectible accounts receivable as of December 31, 2009 was $6.0 million, representing approximately 14.1% of the total accounts receivable. At December 31, 2008, the total allowance for doubtful accounts was $4.9 million, which was approximately 11.9% of the total accounts receivable.
Income Taxes
Deferred tax assets or liabilities are recorded to reflect the future tax consequences of temporary differences between the financial reporting basis of assets and liabilities and their tax basis at each year-end. These amounts are adjusted, as appropriate, to reflect enacted changes in tax rates expected to be in effect when the temporary differences reverse.
In the ordinary course of business, there may be many transactions and calculations where the ultimate tax outcome is uncertain. The calculation of tax liabilities involves dealing with uncertainties in the application of complex tax laws. We recognize potential liabilities for anticipated tax audit issues based on an estimate of the ultimate resolution of whether additional taxes may be due. Although we believe the estimates are reasonable, no assurance can be given that the final outcome of these matters will not be different than what is reflected in the historical income tax provisions and accruals.
As part of our financial process, we must assess the likelihood that deferred tax assets can be recovered. If recovery is not likely, the provision for taxes must be increased by recording a reserve in the form of a valuation allowance for the deferred tax assets that are estimated not to be ultimately recoverable. In this process, certain relevant criteria are evaluated including the existence of deferred tax liabilities that can be used to absorb deferred tax assets and taxable income in future years. Judgment regarding future taxable income may change due to future market conditions, changes in U.S. tax laws and other factors. These changes, if any, may require material adjustments to these deferred tax assets and an accompanying reduction or increase in net income in the period when such determinations are made.
We were included in BCO’s consolidated federal and state income tax returns prior to the Spin-off and will file stand-alone returns for subsequent periods. However, the provision for income taxes in the consolidated financial statements has been determined for pre Spin-off periods as if we had filed our own income tax returns separate and apart from BCO for those periods.
See below for the schedule of effective tax rates and the provision for income taxes:
| Provision for income taxes (in millions) |
Effective tax rate (in percentages) | ||||||||||||||
| Years Ended December 31, | 2009 | 2008 | 2007 | 2009 | 2008 | 2007 | |||||||||
| $ | 38.6 | $ | 36.3 | $ | 27.8 | 38.1 | 38.9 | 38.6 | |||||||
New Accounting Standards
In September 2009, the Financial Accounting Standards Board (“FASB”) issued authoritative guidance for the accounting for revenue arrangements with multiple deliverables. The guidance establishes a selling price hierarchy for determining the selling price of a deliverable. The selling price used for each deliverable will be based on vendor-specific objective evidence if available, third-party evidence if vendor-specific objective evidence is not available, or estimated selling price if neither vendor-specific evidence nor third-party evidence is available. The guidance requires arrangements under which multiple revenue generating activities to be performed be allocated at inception. The residual method under the existing accounting guidance has been eliminated. The guidance expands the disclosure requirements related to multiple-deliverable revenue arrangements. The guidance becomes effective for revenue arrangements entered into or materially modified beginning in fiscal 2011, with early adoption permitted. The guidance applies on a prospective basis unless the Company specifically elects to apply the guidance retrospectively. The Company does not expect the guidance to have an impact on its financial position, results of operations, or cash flows.
Effective in the fourth quarter of 2009, the Company adopted an amendment issued by the FASB to the accounting standards related to the measurement of liabilities that are recognized or disclosed at fair value on a recurring basis. This standard clarifies how a company should measure the fair value of liabilities and that restrictions preventing the transfer of a liability should not be considered as a factor in the measurement of liabilities within the scope of this standard. The adoption of this guidance did not have a material effect on the Company’s results of operations, financial position, or cash flow.
35
Table of Contents
In June 2009, the FASB issued authoritative guidance which established the FASB Accounting Standards Codification as the source of authoritative U.S. GAAP recognized by the FASB to be applied to nongovernmental entities, and rules and interpretive releases of the Securities and Exchange Commission (“SEC”) as authoritative U.S. GAAP for SEC registrants. The Codification supersedes all the existing non-SEC accounting and reporting standards upon its effective date and, subsequently, the FASB will not issue new standards in the form of Statements, FASB Staff Positions or Emerging Issues Task Force Abstracts. The guidance is not intended to change or alter existing U.S. GAAP. The guidance became effective for the Company in the third quarter of 2009. The guidance did not have an impact on the Company’s financial position, results of operations or cash flows. All references to previous numbering of FASB Statements, FASB Staff Positions or Emerging Issues Task Force Abstracts have been removed from the financial statements and accompanying footnotes
Effective June 30, 2009, the Company adopted a newly issued accounting standard related to accounting for, and disclosure of, subsequent events in its consolidated financial statements. This standard provides the authoritative guidance for subsequent events that was previously addressed only in United States auditing standards. This standard establishes general accounting for, and disclosure of, events that occur after the balance sheet date, but before financial statements are issued or are available to be issued and requires the Company to disclose the date through which it has evaluated subsequent events and whether that was the date the financial statements were issued or available to be issued. This standard does not apply to subsequent events or transactions that are within the scope of other applicable U.S. GAAP that provide different guidance on the accounting treatment for subsequent events or transactions. The adoption of this standard in the second quarter of 2009 did not have a material impact on the Company’s consolidated financial statements. The Company evaluated all events or transactions that occurred after December 31, 2009 up through February 24, 2010, the date financial statements are issued. During this period, the Company did not have any material recognizable subsequent events, except as disclosed in Note 17 – Subsequent Events in the notes to the consolidated financial statements.
In June 2008, the FASB issued guidance that related to unvested share-based payment awards that contain non-forfeitable rights to dividends or dividend equivalents (whether paid or unpaid). These awards are participating securities and should be included in the computation of earnings per share under the two-class method. The adoption of this guidance in the first quarter of 2009 did not have a material impact on the calculation or reporting of the Company’s earnings per share.
In December 2007, the FASB issued guidance that established requirements for an acquirer to record assets acquired, liabilities assumed, and any related noncontrolling interest related to the acquisition of a controlled subsidiary, measured at fair value as of the acquisition date. The adoption of this guidance in the first quarter of 2009 did not have a material effect on the Company’s results of operations and financial position.
In December 2007, the FASB issued guidance to establish accounting and reporting standards for the noncontrolling interest in a subsidiary, and for the deconsolidation of a subsidiary. Specifically, this guidance clarifies that noncontrolling interests in a subsidiary should be reported as equity in the consolidated financial statements. The adoption of this guidance in the first quarter of 2009 did not have a material effect on the Company’s results of operations and financial position.
| ITEM 7A. | QUANTITATIVE AND QUALITATIVE DISCLOSURES ABOUT MARKET RISK |
Foreign Currency Risk
Our operations include activities in the United States and Canada. These operations expose us to a variety of market risks, including the effects of changes in commodity prices and foreign currency exchange rates. These financial and commodity exposures are monitored as an integral part of our overall risk management program.
The market risk exposure sensitivity analysis is based on the facts and circumstances in effect at December 31, 2009. Actual results will be determined by a number of factors that are not under our control and could vary materially from those disclosed.
We have exposure to the effects of foreign currency exchange rate fluctuations on the results of our Canadian operations. Our Canadian operations use the Canadian dollar to conduct business, but our consolidated results are reported in U.S. dollars.
We are exposed periodically to the foreign currency rate fluctuations that affect transactions not denominated in the functional currency of our domestic and foreign operations. We do not use derivative financial instruments to hedge investments in foreign subsidiaries since such investments are long-term in nature.
36
Table of Contents
The following table shows the financial statement effects of a hypothetical simultaneous 10% appreciation in the U.S. dollar from year-end 2009 levels against the Canadian dollar.
Hypothetical Effects
| (in millions) | Amount | ||||
| Translation of 2009 earnings into U.S. dollars |
$ | 0.2 | |||
| Transactional exposures |
0.8 | ||||
| Translation of net assets of Canadian subsidiary |
0.6 | ||||
Interest Rate Risk
During 2008, we entered into the Credit Agreement that provides for the $75 million Credit Facility. The pricing on the Credit Facility is based on, generally at our discretion, the greater of the Prime Rate or the Federal Funds Rate plus one-half of one percent, or LIBOR, plus an adjustment based on our leverage ratio, as defined by the Credit Agreement. As of December 31, 2009, we have not drawn on the Credit Facility, although we have used the Credit Facility to issue letters of credit totaling $4.3 million.
37
Table of Contents
| ITEM 8. | FINANCIAL STATEMENTS AND SUPPLEMENTARY DATA |
BRINK’S HOME SECURITY HOLDINGS, INC.
CONSOLIDATED FINANCIAL STATEMENTS
FOR THE YEAR ENDED DECEMBER 31, 2009
38
Table of Contents
REPORT OF INDEPENDENT REGISTERED PUBLIC ACCOUNTING FIRM
The Board of Directors and Shareholders
Brink’s Home Security Holdings, Inc.:
We have audited the accompanying consolidated balance sheets of Brink’s Home Security Holdings, Inc. and subsidiaries (“Company”) as of December 31, 2009 and 2008, and the related consolidated statements of income and comprehensive income, shareholders’ equity, and cash flows for each of the years in the three-year period ended December 31, 2009. These consolidated financial statements are the responsibility of the Company’s management. Our responsibility is to express an opinion on these consolidated financial statements based on our audits.
We conducted our audits in accordance with the standards of the Public Company Accounting Oversight Board (United States). Those standards require that we plan and perform the audit to obtain reasonable assurance about whether the financial statements are free of material misstatement. An audit includes examining, on a test basis, evidence supporting the amounts and disclosures in the financial statements. An audit also includes assessing the accounting principles used and significant estimates made by management, as well as evaluating the overall financial statement presentation. We believe that our audits provide a reasonable basis for our opinion.
In our opinion, the consolidated financial statements referred to above present fairly, in all material respects, the financial position of the Company as of December 31, 2009 and 2008, and the results of their operations and their cash flows for each of the years in the three-year period ended December 31, 2009, in conformity with U.S. generally accepted accounting principles.
We also have audited, in accordance with the standards of the Public Company Accounting Oversight Board (United States), Brink’s Home Security Holdings, Inc.’s internal control over financial reporting as of December 31, 2009, based on criteria established in Internal Control - Integrated Framework, issued by the Committee of Sponsoring Organizations of the Treadway Commission, and our report dated February 24, 2010 expressed an unqualified opinion on the effectiveness of the Company’s internal control over financial reporting.
/s/ KPMG LLP
Dallas, Texas
February 24, 2010
39
Table of Contents
REPORT OF INDEPENDENT REGISTERED PUBLIC ACCOUNTING FIRM
The Board of Directors and Shareholders
Brink’s Home Security Holdings, Inc.:
We have audited Brink’s Home Security Holdings, Inc.’s internal control over financial reporting as of December 31, 2009, based on criteria established in Internal Control—Integrated Framework issued by the Committee of Sponsoring Organizations of the Treadway Commission (“COSO”). Brink’s Home Security Holdings, Inc.’s management (the “Company”) is responsible for maintaining effective internal control over financial reporting and for its assessment of the effectiveness of internal control over financial reporting, included in the accompanying Management’s Annual Report on Internal Control over Financial Reporting. Our responsibility is to express an opinion on the Company’s internal control over financial reporting based on our audit.
We conducted our audit in accordance with the standards of the Public Company Accounting Oversight Board (United States). Those standards require that we plan and perform the audit to obtain reasonable assurance about whether effective internal control over financial reporting was maintained in all material respects. Our audit included obtaining an understanding of internal control over financial reporting, assessing the risk that a material weakness exists, and testing and evaluating the design and operating effectiveness of internal control based on the assessed risk. Our audit also included performing such other procedures as we considered necessary in the circumstances. We believe that our audit provides a reasonable basis for our opinion.
A company’s internal control over financial reporting is a process designed to provide reasonable assurance regarding the reliability of financial reporting and the preparation of financial statements for external purposes in accordance with U.S. generally accepted accounting principles. A company’s internal control over financial reporting includes those policies and procedures that (1) pertain to the maintenance of records that, in reasonable detail, accurately and fairly reflect the transactions and dispositions of the assets of the company; (2) provide reasonable assurance that transactions are recorded as necessary to permit preparation of financial statements in accordance with U.S. generally accepted accounting principles, and that receipts and expenditures of the company are being made only in accordance with authorizations of management and directors of the company; and (3) provide reasonable assurance regarding prevention or timely detection of unauthorized acquisition, use, or disposition of the company’s assets that could have a material effect on the financial statements.
Because of its inherent limitations, internal control over financial reporting may not prevent or detect misstatements. Also, projections of any evaluation of effectiveness to future periods are subject to the risk that controls may become inadequate because of changes in conditions, or that the degree of compliance with the policies or procedures may deteriorate.
In our opinion, Brink’s Home Security Holdings, Inc. maintained, in all material respects, effective internal control over financial reporting as of December 31, 2009, based on criteria established in Internal Control—Integrated Framework issued by COSO.
We also have audited, in accordance with the standards of the Public Company Accounting Oversight Board (United States), the consolidated balance sheets of Brink’s Home Security Holdings, Inc. and subsidiaries as of December 31, 2009 and 2008, and the related consolidated statements of income and comprehensive income, shareholders’ equity, and cash flows for each of the years in the three-year period ended December 31, 2009, and our report dated February 24, 2010 expressed an unqualified opinion on those consolidated financial statements.
/s/ KPMG LLP
Dallas, Texas
February 24, 2010
40
Table of Contents
BRINK’S HOME SECURITY HOLDINGS, INC.
and subsidiaries
Consolidated Balance Sheets
| (In millions, except share amounts) | December 31, | |||||||
| 2009 | 2008 | |||||||
| ASSETS |
||||||||
| Current assets: |
||||||||
| Cash and cash equivalents |
$ | 113.2 | $ | 63.6 | ||||
| Certificates of deposit |
5.0 | — | ||||||
| Accounts receivable (net of allowance of $6.0 and $4.9 million as of December 31, 2009 and December 31, 2008, respectively) |
36.5 | 36.3 | ||||||
| Prepaid expenses and other |
11.4 | 9.2 | ||||||
| Deferred income taxes |
9.9 | 24.8 | ||||||
| Total current assets |
176.0 | 133.9 | ||||||
| Property and equipment, net |
710.1 | 659.3 | ||||||
| Deferred subscriber acquisition costs, net |
84.5 | 83.7 | ||||||
| Total Assets |
$ | 970.6 | $ | 876.9 | ||||
| LIABILITIES AND SHAREHOLDERS’ EQUITY |
||||||||
| Current liabilities: |
||||||||
| Accounts payable |
$ | 24.4 | $ | 20.4 | ||||
| Payroll and other employee liabilities |
12.6 | 15.5 | ||||||
| Other accrued liabilities |
20.4 | 19.2 | ||||||
| Deferred revenue |
46.6 | 43.2 | ||||||
| Total current liabilities |
104.0 | 98.3 | ||||||
| Deferred revenue |
182.2 | 181.0 | ||||||
| Deferred income taxes |
149.4 | 104.8 | ||||||
| Other liabilities |
11.6 | 10.8 | ||||||
| Total liabilities |
447.2 | 394.9 | ||||||
| Commitments and contingencies (see Note 13) |
||||||||
| Shareholders’ Equity: |
||||||||
| Preferred stock, $10 par value, 2.0 million shares authorized, no shares issued |
$ | — | $ | — | ||||
| Common stock, no par value, 170 million shares authorized, 45.8 million shares issued and outstanding for December 31, 2009 and December 31, 2008 |
— | — | ||||||
| Additional paid-in capital |
60.3 | 54.5 | ||||||
| Retained earnings |
464.8 | 428.9 | ||||||
| Accumulated other comprehensive loss |
(1.7 | ) | (1.4 | ) | ||||
| Total shareholders’ equity |
523.4 | 482.0 | ||||||
| Total Liabilities and Shareholders’ Equity |
$ | 970.6 | $ | 876.9 | ||||
41
Table of Contents
BRINK’S HOME SECURITY HOLDINGS, INC.
and subsidiaries
Consolidated Statements of Income and Comprehensive Income
| (In millions, except per share data) | Years Ended December 31, | |||||||||||
| 2009 | 2008 | 2007 | ||||||||||
| Revenues |
$ | 565.1 | $ | 532.3 | $ | 484.4 | ||||||
| Expenses: |
||||||||||||
| Cost of revenues |
274.3 | 287.0 | 271.9 | |||||||||
| Selling, general and administrative expenses |
190.9 | 150.9 | 144.3 | |||||||||
| Total expenses |
465.2 | 437.9 | 416.2 | |||||||||
| Other operating income (expense), net |
1.5 | (0.4 | ) | 4.8 | ||||||||
| Operating profit |
101.4 | 94.0 | 73.0 | |||||||||
| Interest expense, net |
(0.1 | ) | (0.6 | ) | (1.0 | ) | ||||||
| Income before income taxes |
101.3 | 93.4 | 72.0 | |||||||||
| Provision for income taxes |
38.6 | 36.3 | 27.8 | |||||||||
| Net income |
$ | 62.7 | $ | 57.1 | $ | 44.2 | ||||||
| Other Comprehensive Income |
||||||||||||
| Other comprehensive income (loss) – foreign currency translation adjustments arising during the period |
(0.3 | ) | 0.5 | (0.6 | ) | |||||||
| Comprehensive income |
$ | 62.4 | $ | 57.6 | $ | 43.6 | ||||||
| Earnings per common share (see Note 15) |
||||||||||||
| Basic |
$ | 1.37 | $ | 1.25 | $ | 0.96 | ||||||
| Diluted |
$ | 1.36 | $ | 1.25 | $ | 0.96 | ||||||
| Weighted average common shares outstanding (see Note 15) |
||||||||||||
| Basic |
45.9 | 45.8 | 45.8 | |||||||||
| Diluted |
46.0 | 45.8 | 45.9 | |||||||||
42
Table of Contents
BRINK’S HOME SECURITY HOLDINGS, INC.
and subsidiaries
Consolidated Statements of Shareholders’ Equity
| (In millions, except share amounts) | Common Shares |
Common Stock |
Additional Paid-In Capital |
Retained Earnings |
Accumulated Other Comprehensive Loss |
Total | ||||||||||||||||
| Balance as of December 31, 2006 |
2.0 | $ | 2.0 | $ | 1.8 | $ | 355.1 | $ | (1.3 | ) | $ | 357.6 | ||||||||||
| Net income |
— | — | 44.2 | — | 44.2 | |||||||||||||||||
| Other comprehensive income |
— | — | — | (0.6 | ) | (0.6 | ) | |||||||||||||||
| Adoption of accounting guidance related to uncertain tax positions (see Note 1 and 6) |
— | — | 4.3 | — | 4.3 | |||||||||||||||||
| Balance as of December 31, 2007 |
2.0 | 2.0 | 1.8 | 403.6 | (1.9 | ) | 405.5 | |||||||||||||||
| Net income |
— | — | 57.1 | — | 57.1 | |||||||||||||||||
| Other comprehensive income |
— | — | — | 0.5 | 0.5 | |||||||||||||||||
| Reclassification of par value upon issuance of no-par common stock at Spin-off |
(2.0 | ) | (2.0 | ) | 2.0 | — | — | — | ||||||||||||||
| Contribution of cash from BCO at Spin-off (see Note 2) |
— | 50.0 | — | — | 50.0 | |||||||||||||||||
| Deemed dividend to BCO at Spin-off (see Note 2) |
— | — | (31.8 | ) | — | (31.8 | ) | |||||||||||||||
| Disbursement of 45.8 million no-par common shares to shareholders of BCO |
45.8 | — | — | — | — | — | ||||||||||||||||
| Share-based compensation expense |
— | 0.7 | — | — | 0.7 | |||||||||||||||||
| Balance as of December 31, 2008 |
45.8 | — | 54.5 | 428.9 | (1.4 | ) | 482.0 | |||||||||||||||
| Net income |
— | — | 62.7 | — | 62.7 | |||||||||||||||||
| Other comprehensive income |
— | — | — | (0.3 | ) | (0.3 | ) | |||||||||||||||
| Share-based compensation expense |
— | 4.4 | — | — | 4.4 | |||||||||||||||||
| Proceeds from exercise of stock awards |
— | — | 1.2 | — | — | 1.2 | ||||||||||||||||
| Excess tax benefit of stock options exercised |
— | 0.2 | — | — | 0.2 | |||||||||||||||||
| Adjustment to deemed dividend to BCO at Spin-off (see Note 2) |
— | — | (26.8 | ) | — | (26.8 | ) | |||||||||||||||
| Balance as of December 31, 2009 |
45.8 | $ | — | $ | 60.3 | $ | 464.8 | $ | (1.7 | ) | $ | 523.4 | ||||||||||
43
Table of Contents
BRINK’S HOME SECURITY HOLDINGS, INC.
and subsidiaries
Consolidated Statements of Cash Flows
| (In millions) | Years Ended December 31, | |||||||||||
| 2009 | 2008 | 2007 | ||||||||||
| Cash flows from operating activities: |
||||||||||||
| Net income |
$ | 62.7 | $ | 57.1 | $ | 44.2 | ||||||
| Adjustments to reconcile net income to net cash provided by operating activities: |
||||||||||||
| Depreciation and amortization |
91.2 | 85.3 | 77.7 | |||||||||
| Impairment charges from subscriber disconnects |
65.9 | 56.5 | 50.4 | |||||||||
| Amortization of deferred revenue |
(39.5 | ) | (40.5 | ) | (34.2 | ) | ||||||
| Deferred income taxes |
32.1 | 40.6 | 9.6 | |||||||||
| Share-based compensation |
4.4 | 0.7 | — | |||||||||
| Provision for uncollectible accounts receivable |
12.1 | 11.6 | 10.6 | |||||||||
| Other operating, net |
(1.5 | ) | 2.0 | (1.4 | ) | |||||||
| Loss on disposal of assets |
0.2 | — | — | |||||||||
| Change in operating assets and liabilities: |
||||||||||||
| Accounts receivable |
(12.4 | ) | (9.8 | ) | (8.8 | ) | ||||||
| Accounts payable and accrued liabilities |
8.2 | (0.7 | ) | 10.0 | ||||||||
| Deferral of subscriber acquisition costs |
(21.8 | ) | (23.1 | ) | (23.8 | ) | ||||||
| Deferral of revenue from new subscribers |
39.8 | 44.3 | 47.4 | |||||||||
| Prepaid expenses and other current assets |
(2.0 | ) | (0.2 | ) | (0.2 | ) | ||||||
| Other, net |
0.7 | 0.2 | 2.2 | |||||||||
| Net cash provided by operating activities |
240.1 | 224.0 | 183.7 | |||||||||
| Cash flows from investing activities: |
||||||||||||
| Capital expenditures |
(187.1 | ) | (177.8 | ) | (177.8 | ) | ||||||
| Purchase of certificates of deposit |
(5.0 | ) | — | — | ||||||||
| Insurance proceeds |
— | — | 2.0 | |||||||||
| Net cash used in investing activities |
(192.1 | ) | (177.8 | ) | (175.8 | ) | ||||||
| Cash flows from financing activities: |
||||||||||||
| Proceeds from exercise of stock options |
1.2 | — | — | |||||||||
| Excess tax benefit from exercise of stock options |
0.2 | — | — | |||||||||
| Change in cash overdrafts |
— | (3.6 | ) | (0.8 | ) | |||||||
| Net distributions to related parties |
— | (32.2 | ) | (6.5 | ) | |||||||
| Cash received from BCO as a result of the Spin-off |
— | 50.0 | — | |||||||||
| Net cash provided by (used in) financing activities |
1.4 | 14.2 | (7.3 | ) | ||||||||
| Effect of exchange rate changes on cash |
0.2 | (0.1 | ) | 0.1 | ||||||||
| Cash and cash equivalents: |
||||||||||||
| Net increase |
49.6 | 60.3 | 0.7 | |||||||||
| Balance at beginning of period |
63.6 | 3.3 | 2.6 | |||||||||
| Balance at end of period |
$ | 113.2 | $ | 63.6 | $ | 3.3 | ||||||
| Supplemental cash flow disclosure of non-cash financing activities: |
||||||||||||
| Transfer of net assets and liabilities to BCO |
$ | — | $ | (151.6 | ) | $ | — | |||||
| Deemed dividend to BCO at Spin-off (see Note 2) |
26.8 | 31.8 | — | |||||||||
| Supplemental cash flow information: |
||||||||||||
| Cash paid for: |
||||||||||||
| Interest |
$ | 0.3 | $ | 0.6 | $ | 0.4 | ||||||
| Income taxes, net: |
||||||||||||
| Paid to related parties |
— | — | 16.9 | |||||||||
| Paid to taxing jurisdictions |
6.5 | 1.0 | 1.5 | |||||||||
44
Table of Contents
BRINK’S HOME SECURITY HOLDINGS, INC.
and subsidiaries
NOTES TO CONSOLIDATED FINANCIAL STATEMENTS
Note 1 - Description of Business, The Spin-off, Basis of Presentation and Significant Accounting Policies
Description of Business
Broadview Security, Inc. (“Broadview Security”) changed its name from Brink’s Home Security, Inc. on July 1, 2009. Broadview Security was incorporated in Delaware in 1983 and became a wholly-owned subsidiary of Brink’s Home Security Holdings, Inc. (“Holdings”), a Virginia corporation, on October 31, 2008, upon completion of the spin-off transaction described below. Holdings and its consolidated subsidiaries, including Broadview Security, are collectively referred to in this report as the “Company” or “Holdings,” unless otherwise indicated. Historically, the “Company” also refers to Broadview Security prior to the spin-off transaction.
The Company conducts business in one segment. Management evaluates performance and allocates resources based on cash flows and operating profit or loss of the Company as a whole. The Company markets, installs, services, and monitors security alarm systems for approximately 1.4 million customers in the United States and two Canadian provinces. Based on revenues, the Company believes it is the second largest provider of security alarm monitoring services for residential and commercial properties in North America. The Company’s primary customers are residents of single-family homes, which comprise approximately 93% of the Company’s subscriber base.
Subsequent Event
See Note 17 – Subsequent Events for discussion regarding the Company’s merger agreement (the “Merger”) with Tyco International Ltd (“Tyco”).
The Spin-off
On September 12, 2008, the Board of Directors of The Brink’s Company (“BCO”) approved the separation of BCO into two independent, publicly traded companies through the spin-off of the Company to shareholders of BCO. To effect the separation, BCO transferred all outstanding shares of Brink’s Home Security, Inc. through a series of transactions to Holdings, another wholly-owned subsidiary of BCO, which prior to these transactions had no independent assets or operations, and distributed the shares of Holdings to BCO’s shareholders.
Distribution of Holdings’ common stock to the stockholders of BCO occurred on October 31, 2008, at a ratio of one share of Holdings’ common stock for each share of BCO’s common stock held by each such holder as of the record date of October 21, 2008 (“the Spin-off”). Immediately following the Spin-off, Holdings’ common stock began trading “regular way” on the New York Stock Exchange under the symbol “CFL,” reflecting its corporate mission of creating “Customers For Life.” See Note 2 – Transactions with Related Parties for a description of transition services and other agreements entered into between the Company and BCO.
Basis of Presentation
The accompanying consolidated financial statements include the balances and results of operations of the Company and its wholly-owned subsidiaries and have been prepared in accordance with accounting principles generally accepted in the United States of America (“U.S. GAAP”). All intercompany balances and transactions have been eliminated in consolidation. The preparation of financial statements in conformity with U.S. GAAP requires management to make estimates and assumptions that affect the amounts reported in the financial statements and the accompanying notes. Actual results could differ from these estimates.
The consolidated financial statements for the periods preceding the Spin-off date have been prepared using the Company’s historical results of operations and historical basis in the assets and liabilities. Prior to the Spin-off, the historical financial statements included allocations of certain BCO corporate expenses. Those expenses were allocated to the Company based on the most relevant allocation method for the service provided. Management believes such allocations were reasonable; however, they may not be indicative of the actual expense that would have been incurred had the Company been operating as an independent company for the periods prior to the Spin-off. The charges for these functions are included in selling, general, and administrative expenses in the consolidated statements of income.
45
Table of Contents
BRINK’S HOME SECURITY HOLDINGS, INC.
and subsidiaries
NOTES TO CONSOLIDATED FINANCIAL STATEMENTS—(Continued)
The consolidated financial statements for the period preceding October 31, 2008, may not be indicative of the Company’s future performance and may not reflect what its consolidated results of operations, financial position, and cash flows would have been had the Company operated as an independent company during the periods presented. To the extent that an asset, liability, revenue, or expense is directly associated with the Company, it is reflected in the accompanying consolidated financial statements. Refer to Note 2 – Transactions with Related Parties for further information regarding allocated expenses.
Cash and Cash Equivalents
Cash and cash equivalents include cash on hand, demand deposits, and investments with original maturities of three months or less.
Trade Accounts Receivable
Trade accounts receivable are recorded at the invoiced amount and do not bear interest. The allowance for doubtful accounts is the Company’s best estimate of the amount of probable credit losses on the Company’s existing accounts receivable. The Company determines the allowance based on historical write-off experience. The Company reviews its allowance for doubtful accounts quarterly. Account balances are charged off against the allowance after all means of collection have been exhausted and the potential for recovery is considered remote.
Property and Equipment
The Company retains ownership of most security systems installed at subscriber locations. Costs for those systems are capitalized and depreciated over the estimated lives of the assets. Costs capitalized as part of security systems include equipment and materials used in the installation process, direct labor required to install the equipment at subscriber sites, and other costs associated with the installation process. These other costs include the cost of vehicles used for installation purposes and the portion of telecommunication, facilities and administrative costs incurred primarily at the Company’s field offices that are associated with the installation process. In 2009, direct labor and other costs represented approximately 67% of the amount capitalized, while equipment and materials represented approximately 33% of amount capitalized. The Company acquires ownership of some security system assets from third-party dealers. These security system assets are capitalized at the contractually determined purchase price.
Most security system assets are depreciated using the straight-line method over the 15 year estimated economic useful lives of the assets. At least annually, economic useful life of security systems are re-evaluated based upon ongoing analysis of all pertinent factors, including sites remaining in active service, historical disconnect and reconnect data, and assessment of the estimated technological life of the installed systems. The economic useful life of these security system assets is primarily based on the percentage of security system assets that remain in active status as the installed systems age over time. The percentage relationships have remained relatively stable over time. The Company does not expect the percentage relationships to change materially in the foreseeable future. In addition to regular straight-line depreciation expense each period, the Company charges to expense the carrying value of security systems estimated to be permanently disconnected based on each period’s actual disconnect and historical reconnect experience.
Property and equipment are recorded at cost. Depreciation is calculated principally on the straight-line method based on the estimated useful lives of individual assets or classes of assets.
Leasehold improvements are recorded at cost. Amortization is calculated principally on the straight-line method over the lesser of the estimated useful life of the leasehold improvement or lease term. Renewal periods are included in the lease term when the renewal is determined to be reasonably assured.
| Estimated Useful Lives |
Years | |
| Buildings |
22.5 to 30 | |
| Building leasehold improvements |
3 to 10 | |
| Security systems |
3 to 15 | |
| Capitalized software |
5 | |
| Other machinery and equipment |
5 to 10 |
Expenditures for routine maintenance and repairs on property and equipment are charged to expense. Major renewals, betterments, and modifications are capitalized and amortized over the lesser of the remaining life of the asset or, if applicable, the lease term.
46
Table of Contents
BRINK’S HOME SECURITY HOLDINGS, INC.
and subsidiaries
NOTES TO CONSOLIDATED FINANCIAL STATEMENTS—(Continued)
Part of the costs related to the development or purchase of internal-use software is capitalized and amortized over the estimated useful life of the software. Costs that are capitalized include external direct costs of materials and services to develop or obtain the software, and internal costs, including compensation and employee benefits for employees directly associated with a software development project.
Revenue Recognition
Major components of revenue for the Company include revenues associated with contractual monitoring and service revenues, non-refundable installation fees including connection fees, additional equipment installation fees, sales of equipment without an extended contractual relationship, and other services.
The Company recognizes contractual monitoring and service revenue ratably as it provides services pursuant to the terms of subscriber contracts, which have contract prices that are fixed and determinable. The Company does not include sales taxes it collects from customers and remits to governmental authorities in revenues in its consolidated statements of income. The Company assesses a subscriber’s ability to meet the contract terms, including payment terms, before entering into a contract. The Company generally defers revenues associated with installation fees and recognizes them using the straight-line method over the life of the customer relationship, which it estimates to be 15 years. The Company recognizes revenues associated with the sale of products for which there is no attached extended contractual relationship when the products are delivered. The Company recognizes revenues from services not covered by the terms of subscriber contracts as those services are rendered.
The Company immediately recognizes in earnings any unamortized balance of deferred revenue resulting from installation fees and the associated deferred costs in the event that the related security system asset is disconnected and considered for impairment, as described in “Deferred Subscriber Acquisition Costs” seen below. Deferred installation fees recognized at subscriber disconnect were $21.7 million, $22.8 million and $17.8 million for the years ended December 31, 2009, 2008, and 2007, respectively.
Deferred Subscriber Acquisition Costs
The Company incurs marketing and selling costs to obtain new subscribers. The Company defers certain subscriber acquisition costs, primarily incremental direct selling costs. Substantially all deferred subscriber acquisition costs consist of incremental sales compensation and fringe benefits, and referral fees paid which are directly related to successful subscriber acquisition efforts. The amount of commissions deferred is based on the percentage of successful sales to total sales efforts. The Company expenses all marketing costs and indirect selling costs as period costs.
For most installations, subscriber acquisition costs are less than deferred installation fees and are amortized using a straight-line method over the 15 year estimated life of the customer relationship. The Company bases the estimated life of the customer relationship on its ongoing annual analysis of subscriber and site retention. When a security system asset is identified for disconnection and possible impairment, the Company immediately recognizes any unamortized deferred subscriber acquisition costs related to that installation.
For subscribers acquired through the Company’s new housing construction customer acquisition channel (“Builder”), formerly referred to as Brink’s Home Technologies, there are no deferred revenues. The Company defers subscriber acquisition costs for these activities and amortizes these deferred costs using a straight-line method over the three-year initial monitoring contract term.
Accumulated amortization of deferred subscriber acquisition costs were $39.3 million and $45.1 million at December 31, 2009 and 2008 respectively. The Company recorded impairment charges for deferred subscriber acquisition costs totaling $9.3 million, $9.6 million, and $7.7 million for the years ended December 31, 2009, 2008, and 2007, respectively. These charges are included in cost of revenues.
Impairment from Subscriber Disconnects
Long-lived assets, including security systems, are reviewed for impairment when events or changes in circumstances indicate the carrying value of an asset may not be recoverable. Impairment is indicated when the estimated recoverable undiscounted cash flows associated with the asset or group of assets is less than the carrying value. If impairment exists, an adjustment is made to write the asset down to its fair value, and a loss is recorded as the difference between the actual net book value of the asset and its fair value.
47
Table of Contents
BRINK’S HOME SECURITY HOLDINGS, INC.
and subsidiaries
NOTES TO CONSOLIDATED FINANCIAL STATEMENTS—(Continued)
The Company records impairment charges for security systems each period based on the carrying value of security systems estimated to be permanently disconnected during the period. The carrying value is the actual remaining net book value associated with the security systems estimated to be disconnected. The Company estimates the number of permanently disconnected security systems based on the actual disconnects during the period less an estimated number of those sites that will reconnect within a reasonable period in the future. The estimate of sites that will reconnect within a reasonable period in the future is analyzed on an ongoing basis based on historical data. For the sites that are expected to be reconnected within a reasonable period, the undiscounted cash flows expected to result from the reactivations exceed the carrying value of the security systems assets, and accordingly, no impairment is recorded for those assets. Should the estimate of future reconnection experience change, the Company’s impairment charges would be affected.
The Company recorded impairment charges for disconnected security systems amounting to $56.6 million, $46.9 million, and $42.6 million for the years ended December 31, 2009, 2008, and 2007, respectively. These charges are included in cost of revenues.
Advertising and Marketing Expense
The Company expenses advertising and marketing expenses when incurred. Television media production costs are expensed upon the first broadcast of the respective advertisement. Media broadcast advertising costs and printed materials and other advertising costs are expensed as incurred. These expenses totaled $58.6 million, $42.1 million, and $41.7 million for the years ended December 31, 2009, 2008, and 2007, respectively, and are included in selling, general and administrative expenses.
Income Taxes
Deferred tax assets or liabilities are recorded to reflect the future tax consequences of temporary differences between the financial reporting basis of assets and liabilities and their tax basis at each year-end. These amounts are adjusted, as appropriate, to reflect enacted changes in tax rates expected to be in effect when the temporary differences reverse. Management periodically reviews recorded deferred tax assets to determine if it is more likely than not that they will be realized. If management determines it is more likely than not that a deferred tax asset will not be realized, an offsetting valuation allowance is recorded, reducing earnings and the deferred tax asset in that period. The Company was included in BCO’s consolidated federal and state income tax returns prior to Spin-off and will file stand-alone returns for subsequent periods. However, the provision for income taxes in the consolidated financial statements prior to the Spin-off was determined as if the Company filed its own income tax returns separate and apart from BCO. See Note 6 – Income Taxes for further information on income taxes.
Foreign Currency Translation
The Company’s consolidated financial statements are reported in U.S. dollars. A small portion of the Company’s business is transacted in Canadian dollars. The Company’s Canadian subsidiary maintains its records in Canadian dollars. The assets and liabilities are translated into U.S. dollars using rates of exchange at the balance sheet date and translation adjustments are recorded in other comprehensive income. Revenues and expenses are translated at average rates of exchange in effect during the year. Transaction gains and losses related to changes in the foreign currency are included in “Other” income or expense in the consolidated statements of income. See Note 8 – Other Operating Income, net for the amount of foreign currency transaction gain or loss.
Concentration of Credit Risks
Financial instruments which potentially subject the Company to concentrations of credit risks are principally cash and cash equivalents and accounts receivables. Cash and cash equivalents are held by major financial institutions. The large number and geographic diversity of its customers limits the Company’s concentration of risk with respect to accounts receivable.
Accounting Correction
In the second quarter of 2008, an adjustment was made to correct amounts previously reported for prior annual periods for the write-off of deferred subscriber acquisition costs and deferred revenue associated with the termination of customer relationships. This adjustment resulted in an increase to operating profit of $2.4 million as of the quarter ended June 30, 2008. However, through further analysis in the fourth quarter, additional adjustments were made. The cumulative adjustment from the accounting correction for the year ended 2008 resulted in year-to-date increased revenues of $3.1 million, decreased impairment charges from subscriber disconnects, a component of cost of revenues, of $0.5 million, and an increase to operating profit of $3.6 million. These items were not material to the Company’s financial position or results of operations, and had no impact on cash flow.
48
Table of Contents
BRINK’S HOME SECURITY HOLDINGS, INC.
and subsidiaries
NOTES TO CONSOLIDATED FINANCIAL STATEMENTS—(Continued)
Use of Estimates
In accordance with U.S. GAAP, management of the Company has made a number of estimates and assumptions relating to the reporting of assets, liabilities, and the disclosure of contingent assets and liabilities to prepare these consolidated financial statements. Actual results could differ materially from these estimates. The most significant estimates used by management are used in the processes of revenue recognition, security system capitalization, deferred subscriber acquisition costs, long-lived asset valuations, useful lives of security systems, the allowance for doubtful accounts, and income taxes.
New Accounting Standards
In September 2009, the Financial Accounting Standards Board (“FASB”) issued authoritative guidance for the accounting for revenue arrangements with multiple deliverables. The guidance establishes a selling price hierarchy for determining the selling price of a deliverable. The selling price used for each deliverable will be based on vendor-specific objective evidence if available, third-party evidence if vendor-specific objective evidence is not available, or estimated selling price if neither vendor-specific evidence nor third-party evidence is available. The guidance requires arrangements under which multiple revenue generating activities to be performed be allocated at inception. The residual method under the existing accounting guidance has been eliminated. The guidance expands the disclosure requirements related to multiple-deliverable revenue arrangements. The guidance becomes effective for revenue arrangements entered into or materially modified beginning in fiscal 2011, with early adoption permitted. The guidance applies on a prospective basis unless the Company specifically elects to apply the guidance retrospectively. The Company does not expect that the guidance will have a material impact on its financial position, results of operations or cash flows.
Effective in the fourth quarter of 2009, the Company adopted an amendment issued by FASB related to the measurement of liabilities that are recognized or disclosed at fair value on a recurring basis. This standard clarifies how a company should measure the fair value of liabilities and restrictions that may prevent the transfer of a liability should not be considered as a factor in the measurement of liabilities within the scope of this standard. The adoption of this guidance did not have a material effect on the Company’s results of operations, financial position, or cash flow.
In June 2009, the FASB issued authoritative guidance which established the FASB Accounting Standards Codification as the source of authoritative U.S. GAAP recognized by the FASB to be applied to nongovernmental entities, and rules and interpretive releases of the Securities and Exchange Commission (“SEC”) as authoritative U.S. GAAP for SEC registrants. The Codification supersedes all the existing non-SEC accounting and reporting standards upon its effective date and, subsequently, the FASB will not issue new standards in the form of Statements, FASB Staff Positions or Emerging Issues Task Force Abstracts. The guidance is not intended to change or alter existing U.S. GAAP. The guidance became effective for the Company in the third quarter of 2009. The guidance did not have an impact on the Company’s financial position, results of operations or cash flows. All references to previous numbering of FASB Statements, FASB Staff Positions or Emerging Issues Task Force Abstracts have been removed from the financial statements and accompanying footnotes
Effective June 30, 2009, the Company adopted a newly issued accounting standard related to accounting for, and disclosure of, subsequent events in its consolidated financial statements. This standard provides the authoritative guidance for subsequent events that was previously addressed only in United States auditing standards. This standard establishes general accounting for, and disclosure of, events that occur after the balance sheet date, but before financial statements are issued or are available to be issued and requires the Company to disclose the date through which it has evaluated subsequent events and whether that was the date the financial statements were issued or available to be issued. This standard does not apply to subsequent events or transactions that are within the scope of other applicable U.S. GAAP that provide different guidance on the accounting treatment for subsequent events or transactions. The adoption of this standard in the second quarter of 2009 did not have a material impact on the Company’s consolidated financial statements.
In June 2008, the FASB issued guidance that related to unvested share-based payment awards that contain non-forfeitable rights to dividends or dividend equivalents (whether paid or unpaid). These awards are participating securities and should be included in the computation of earnings per share under the two-class method. The adoption of this guidance in the first quarter of 2009 did not have a material impact on the calculation or reporting of the Company’s earnings per share.
In December 2007, the FASB issued guidance that established requirements for an acquirer to record assets acquired, liabilities assumed, and any related noncontrolling interest related to the acquisition of a controlled subsidiary, measured at fair value as of the acquisition date. The adoption of this guidance in the first quarter of 2009 did not have a material effect on the Company’s results of operations and financial position.
49
Table of Contents
BRINK’S HOME SECURITY HOLDINGS, INC.
and subsidiaries
NOTES TO CONSOLIDATED FINANCIAL STATEMENTS—(Continued)
In December 2007, the FASB issued guidance to establish accounting and reporting standards for the noncontrolling interest in a subsidiary, and for the deconsolidation of a subsidiary. Specifically, this guidance clarifies that noncontrolling interests in a subsidiary should be reported as equity in the consolidated financial statements. The adoption of this guidance in the first quarter of 2009 did not have a material effect on the Company’s results of operations and financial position.
Note 2 – Transactions with Related Parties
Allocation of BCO’s General and Administrative Corporate Expenses
For periods prior to the Spin-off, the accompanying consolidated financial statements include allocations of certain BCO corporate expenses for services provided to the Company including certain treasury, accounting, tax, legal, internal audit, human resources, investor relations, general management, real estate, insurance, risk management, and other functions, such as board of directors and other centrally managed employee benefit arrangements. The Company recorded allocated costs of $4.1 million and $8.0 million for 2008 and 2007, respectively, within selling, general, and administrative expenses.
Receivable from and Payable to Related Parties
Prior to the Spin-off, BCO provided the Company with funds for its operating cash when needed. Any excess funds were advanced to BCO. Intercompany accounts were maintained for such borrowings that occurred between the Company and its parent. For purposes of the statements of cash flows, the Company reflected intercompany activity with BCO as a financing activity. Interest expense under this arrangement was $0.2 million and $0.7 million for 2008 and 2007, respectively. Interest expense incurred by the Company associated with its payable to related parties other than BCO was $0.1 million and $0.3 million for 2008 and 2007, respectively. There was no interest expense of this nature recorded for 2009.
Non-cash Transactions
At Spin-off, the Company transferred to BCO net assets of a wholly-owned subsidiary in the amount of $139.2 million. Additionally, the Company transferred other operating assets and liabilities in the net amount of $12.4 million. These two items comprise the $151.6 million non-cash transfer of net assets and liabilities to BCO at the Spin-off. The net effect of the $50.0 million cash received from BCO and the elimination of the net intercompany payables resulted in a deemed dividend to BCO in the amount of $31.8 million, a non-cash transaction, reducing retained earnings at the Spin-off date. As a result of a tax transaction described below and other tax adjustments, the deemed non-cash dividend was increased by $26.8 in the last half of 2009.
Allocation of Income Tax Expense
For the periods prior to the Spin-off, the Company and its U.S. subsidiaries were included in the consolidated U.S. Federal income tax return filed by BCO. BCO’s consolidated tax provision and actual cash payments for U.S. federal and state income taxes were allocated to the Company in accordance with BCO’s tax allocation policy.
In accordance with the Tax Matters Agreement between the Company and BCO (the “TMA”), BCO is, in general, responsible for all taxes reported on any joint return through the date of Spin-off, which may include the Company for periods prior to the Spin-off. In September 2009, pursuant to the TMA, BCO elected several tax accounting method changes related to the Company’s operations, primarily involving the timing of deductions for deferred installation fees and deferred monitoring revenue. These elections were implemented in BCO’s U.S. Federal 2008 consolidated tax return which includes operating results of the Company’s domestic U.S. subsidiary for the period January 1, 2008 through October 31, 2008. These elections decreased the carrying value of certain deferred tax assets and increased the carrying value of certain deferred tax liabilities which were allocated to the Company at the Spin-off and have subsequently been carried on the Company’s consolidated balance sheet. As a result of these elections made by BCO, the Company has decreased its current deferred tax assets by $16.5 million and increased its noncurrent deferred tax liabilities by $10.8 million, with an offsetting reduction in retained earnings to increase the amount of the deemed dividend recorded as a non-cash transaction related to the Spin-off as of December 31, 2009.
50
Table of Contents
BRINK’S HOME SECURITY HOLDINGS, INC.
and subsidiaries
NOTES TO CONSOLIDATED FINANCIAL STATEMENTS—(Continued)
Brand License Agreement
Historically, the Company had a brand license agreement with a subsidiary of BCO that allowed the Company to use BCO’s trademarks for certain products and services for a royalty fee based on approximately 7.0% of revenues. Since the Spin-off, the royalty rate the Company paid to BCO for the use of certain trademarks has decreased to approximately 1.25% of revenues pursuant to the Brand Licensing Agreement between BCO and the Company. The royalty rate will continue to be approximately 1.25% of revenues until the earlier of October 31, 2011, or when the Company ceases active use of the trademarks. The Company announced its new brand name, Broadview Security, on June 30, 2009 and is in the process of transitioning away from its heritage name. Royalty expense was $6.9 million, $31.5 million, and $33.2 million for 2009, 2008, and 2007, respectively, and is included in cost of revenues.
Transition Services and Other Agreements Related to the Spin-off from BCO
Following the Spin-off, the Company has operated independently from BCO, and has no ownership interest in BCO. As a part of the Spin-off, the Company entered into certain agreements, including the Separation and Distribution Agreement, the TMA, the Employee Matters Agreement, the Brand Licensing Agreement, and the Transition Services Agreement (the “TSA”). In order to govern the ongoing relationships between the Company and BCO after the Spin-off and to provide mechanisms for an orderly transition, the Company and BCO agreed to certain non-compete and non-solicitation arrangements. Also, the Company and BCO agreed to indemnify each other against certain liabilities arising from their respective businesses. The specified services that the Company can receive, as requested from BCO, include tax, legal, accounting, treasury, investor relations, insurance and risk management, and human resources. The services are paid for by the Company, as set forth in the TSA. The TSA provides for terms ranging from 6 to 18 months for such services. The Company incurred less than $0.1 million in expense for services provided by BCO pursuant to the TSA for each of the years ended December 31, 2009 and 2008.
The following table presents the Company’s accounts receivable and allowance for doubtful accounts:
| (in millions) | December 31, | |||||||
| 2009 | 2008 | |||||||
| Trade |
$ | 42.5 | $ | 40.5 | ||||
| Other |
— | 0.7 | ||||||
| Total accounts receivable |
42.5 | 41.2 | ||||||
| Allowance for doubtful accounts |
(6.0 | ) | (4.9 | ) | ||||
| Accounts receivable, net |
$ | 36.5 | $ | 36.3 | ||||
| (in millions) | December 31, | |||||||||||
| 2009 | 2008 | 2007 | ||||||||||
| Allowance for doubtful accounts: |
||||||||||||
| Beginning of the year |
$ | 4.9 | $ | 4.4 | $ | 4.7 | ||||||
| Provision for uncollectable accounts receivable |
12.1 | 11.6 | 10.6 | |||||||||
| Write offs less recoveries |
(11.0 | ) | (11.1 | ) | (10.9 | ) | ||||||
| End of the year |
$ | 6.0 | $ | 4.9 | $ | 4.4 | ||||||
Note 4 - Property and Equipment, net
The following table presents the Company’s property and equipment, net:
| (in millions) | December 31, | |||||||
| 2009 | 2008 | |||||||
| Land |
$ | 2.5 | $ | 2.5 | ||||
| Buildings |
15.5 | 15.5 | ||||||
| Leasehold improvements |
6.1 | 3.4 | ||||||
| Security systems |
1,012.5 | 925.6 | ||||||
| Capitalized software |
21.8 | 24.2 | ||||||
| Computers and office equipment |
51.9 | 43.9 | ||||||
| 1,110.3 | 1,015.1 | |||||||
| Accumulated depreciation and amortization |
(400.2 | ) | (355.8 | ) | ||||
| Property and equipment, net |
$ | 710.1 | $ | 659.3 | ||||
51
Table of Contents
BRINK’S HOME SECURITY HOLDINGS, INC.
and subsidiaries
NOTES TO CONSOLIDATED FINANCIAL STATEMENTS—(Continued)
The following table presents depreciation and amortization expense:
| (in millions) | December 31, | ||||||||
| 2009 | 2008 | 2007 | |||||||
| Property and equipment |
$ | 79.2 | $ | 72.8 | $ | 65.6 | |||
| Deferred subscriber acquisition costs |
12.0 | 12.5 | 12.1 | ||||||
| Total depreciation and amortization |
$ | 91.2 | $ | 85.3 | $ | 77.7 | |||
Note 5 - Other Accrued Liabilities
The following table presents the Company’s other accrued liabilities:
| (in millions) | December 31, | |||||
| 2009 | 2008 | |||||
| Taxes, except income taxes |
$ | 4.5 | $ | 4.5 | ||
| Workers’ compensation and other claims |
2.6 | 4.6 | ||||
| Customer deposits |
5.8 | 6.1 | ||||
| Legal accrual |
3.5 | 1.1 | ||||
| Insurance reserve |
2.2 | 2.0 | ||||
| Other |
1.8 | 0.9 | ||||
| Other accrued liabilities |
$ | 20.4 | $ | 19.2 | ||
Prior to the Spin-off, in most states the Company had been included in BCO’s consolidated federal and state income tax returns. However, the provision for income taxes in the Company’s consolidated financial statements for all periods prior to the Spin-off was determined as if the Company filed its own income tax returns separate and apart from BCO. Subsequent to the Spin-off, the Company will file stand-alone federal and state income tax returns.
The Company entered into the TMA with BCO, which governs BCO’s and the Company’s respective rights, responsibilities and obligations with respect to tax liabilities and benefits, the preparation and filing of tax returns, the control of audits, and other tax matters. The TMA generally allocates responsibility for consolidated tax liabilities to BCO for periods prior to the Spin-off and for stand-alone tax liabilities to the Company both prior to and subsequent to the Spin-off (see Note 2 – Transactions with Related Parties).
The TMA provides that the Company is required to indemnify BCO and its affiliates against all tax-related liabilities caused by the failure of the Spin-off to qualify for tax-free treatment for United States federal income tax purposes to the extent these liabilities arise as a result of any action taken by Holdings or any of Holdings’ subsidiaries following the Spin-off or otherwise result from any breach of any covenant under the TMA or any other agreement entered into by the Company in connection with the Spin-off. Though valid as between the parties, the TMA is not binding on the Internal Revenue Service. In connection with the Merger, the Company and Tyco entered into an agreement with BCO whereby BCO consented to the assignment of the TMA to Tyco.
The following table presents a summary of income taxes:
| (in millions) | December 31, | |||||||||||
| 2009 | 2008 | 2007 | ||||||||||
| Net income before taxes |
||||||||||||
| U.S. |
$ | 98.7 | $ | 93.9 | $ | 70.4 | ||||||
| Foreign |
2.6 | (0.5 | ) | 1.6 | ||||||||
| $ | 101.3 | $ | 93.4 | $ | 72.0 | |||||||
| Income tax expense (benefit) Current |
||||||||||||
| U.S. Federal |
$ | (17.8 | ) | $ | (7.8 | ) | $ | 16.5 | ||||
| State |
1.4 | 3.5 | 1.7 | |||||||||
| $ | (16.4 | ) | $ | (4.3 | ) | $ | 18.2 | |||||
| Deferred |
||||||||||||
| U.S. Federal |
$ | 52.8 | $ | 39.5 | $ | 7.9 | ||||||
| State |
2.2 | 1.1 | 1.7 | |||||||||
| $ | 55.0 | $ | 40.6 | $ | 9.6 | |||||||
| $ | 38.6 | $ | 36.3 | $ | 27.8 | |||||||
| Comprehensive provision for income taxes allocable to |
||||||||||||
| Net income |
$ | 38.6 | $ | 36.3 | $ | 27.8 | ||||||
| Shareholders’ equity |
— | — | (4.3 | ) | ||||||||
| $ | 38.6 | $ | 36.3 | $ | 23.5 | |||||||
52
Table of Contents
BRINK’S HOME SECURITY HOLDINGS, INC.
and subsidiaries
NOTES TO CONSOLIDATED FINANCIAL STATEMENTS—(Continued)
Rate Reconciliation
The following table reconciles the difference between the actual tax provision and the amounts obtained by applying the statutory U.S. Federal income tax rate of 35% in each year to income before income taxes.
| (in millions) | December 31, | ||||||||
| 2009 | 2008 | 2007 | |||||||
| Income tax expense computed at 35% statutory rate |
$ | 35.4 | $ | 32.8 | $ | 25.2 | |||
| Increases in taxes due to: |
|||||||||
| State income taxes, net |
2.2 | 3.0 | 2.2 | ||||||
| Other |
1.0 | 0.5 | 0.4 | ||||||
| Actual income tax expense |
$ | 38.6 | $ | 36.3 | $ | 27.8 | |||
The components of the net deferred tax assets and (liabilities) are as follows:
| (in millions) | December 31, | |||||||
| 2009 | 2008 | |||||||
| Deferred tax assets |
||||||||
| Deferred revenue |
$ | 53.5 | $ | 85.0 | ||||
| Workers’ compensation and other claims |
1.6 | 1.8 | ||||||
| Pension and other post-retirement benefits |
— | 0.2 | ||||||
| Other assets and liabilities |
15.8 | 13.7 | ||||||
| Net operating loss carry forwards |
1.6 | 2.3 | ||||||
| Tax credits |
1.5 | 0.3 | ||||||
| Subtotal |
74.0 | 103.3 | ||||||
| Total deferred tax assets |
$ | 74.0 | $ | 103.3 | ||||
| Deferred tax liabilities |
||||||||
| Property and equipment, net |
$ | 183.4 | $ | 154.0 | ||||
| Prepaid assets |
29.1 | 28.5 | ||||||
| Prepaid insurance |
1.0 | — | ||||||
| Other assets and miscellaneous |
— | 0.8 | ||||||
| Total deferred tax liabilities |
$ | 213.5 | $ | 183.3 | ||||
| Net deferred tax liabilities |
$ | (139.5 | ) | $ | (80.0 | ) | ||
| Included in: |
||||||||
| Current assets |
$ | 9.9 | $ | 24.8 | ||||
| Noncurrent liabilities |
(149.4 | ) | (104.8 | ) | ||||
| Net deferred tax liabilities |
$ | (139.5 | ) | $ | (80.0 | ) | ||
Valuation allowances
A valuation allowance is recognized if, based on the weight of available evidence, it is more-likely-than-not that some portion, or all, of the deferred tax asset will not be realized. Based on the Company’s historical and expected future taxable earnings, and consideration of available tax-planning strategies, management believes it is more likely than not that the Company will realize the benefit of the existing deferred tax assets, net of valuation allowances, at December 31, 2009.
53
Table of Contents
BRINK’S HOME SECURITY HOLDINGS, INC.
and subsidiaries
NOTES TO CONSOLIDATED FINANCIAL STATEMENTS—(Continued)
| (in millions) | December 31, | ||||||||||
| 2009 | 2008 | 2007 | |||||||||
| Valuation allowances: |
|||||||||||
| Beginning of year |
$ | — | $ | 0.4 | $ | 0.9 | |||||
| Changes in deferred taxes charged to net income |
— | (0.2 | ) | (0.6 | ) | ||||||
| Foreign currency exchange effects |
— | (0.2 | ) | 0.1 | |||||||
| End of year |
$ | — | $ | — | $ | 0.4 | |||||
The above valuation allowance for deferred tax assets was related to the Company’s Canadian operations. In 2008, the Company determined that it was more likely than not that the benefit of these deferred tax assets would be realized and, thus, adjusted the valuation allowance accordingly. In 2009, it is still more likely than not that the benefit of these deferred tax assets will be realized.
Undistributed Foreign Earnings
As of December 31, 2009, the Company has not recorded U.S. Federal deferred income taxes, on the excess of the tax basis over the financial statement carrying amount of its investment in the Company’s Canadian operations.
Net Operating Losses
The gross amount of Canadian net operating loss carryforwards as of December 31, 2009 was $4.3 million. The tax benefit of the Canadian net operating loss carryforwards as of December 31, 2009 was $1.4 million and expires in years 2027 — 2028.
Uncertain Tax Positions
The Company adopted the recognition, measurement, and disclosure guidance for the accounting of uncertain income tax positions on January 1, 2007 which clarified the accounting for derecognition, measurement, classification, interest and penalties, accounting in interim periods, disclosure, and transition. This guidance also provided a minimum recognition threshold for a tax position before being recognized in the financial statements.
A reconciliation of the beginning and ending amount of unrecognized tax benefits follows:
| (in millions) | Amount | |||
| Balance at January 1, 2009 |
$ | 4.6 | ||
| Reclassification of deferred tax asset |
0.8 | |||
| Increases related to prior year tax positions |
0.3 | |||
| Increases related to current year tax positions |
0.2 | |||
| Lapse of statute |
(0.5 | ) | ||
| Balance at December 31, 2009 |
$ | 5.4 | ||
The total amount of unrecognized tax benefits (excluding penalty accruals) at December 31, 2009 was $5.4 million. $4.6 million of the unrecognized tax benefits at December 31, 2009, if recognized, would impact the effective tax rate.
The Company recognizes accrued interest and penalties related to unrecognized tax benefits in income tax expense. Interest and penalties included in income tax expense amounted to $0.1 million in 2009, $0.1 million in 2008, and $0.3 million in 2007. The Company had accrued penalties and interest of $1.0 million at December 31, 2009 and $1.1 million at December 31, 2008.
The Company files income tax returns in various U.S. states and Canada. The Company was included in BCO’s U.S. Federal consolidated income tax returns prior to the Spin-off. With few exceptions, as of December 31, 2009, the Company was no longer subject to U.S. Federal, state and local, or non-U.S. income tax examinations by tax authorities for years prior to 2003. The Company does not anticipate that the total amount of unrecognized tax benefits will significantly increase or decrease during the year ending December 31, 2010.
54
Table of Contents
BRINK’S HOME SECURITY HOLDINGS, INC.
and subsidiaries
NOTES TO CONSOLIDATED FINANCIAL STATEMENTS—(Continued)
The Company leases facilities, vehicles, computers, and other equipment under long-term operating leases with varying terms. Most of the operating leases contain renewal and/or purchase options. The Company from time to time expects that, in the normal course of business, the majority of operating leases will be renewed or replaced by other leases.
As of December 31, 2009, future minimum lease payments under noncancellable operating leases with initial or remaining lease terms in excess of one year are included below.
| (in millions) |
Facilities | Vehicles | Machinery & Equipment |
Total | ||||||||
| 2010 |
$ | 4.5 | $ | 4.0 | $ | 0.2 | $ | 8.7 | ||||
| 2011 |
3.9 | 3.2 | 0.2 | 7.3 | ||||||||
| 2012 |
3.3 | 1.8 | 0.1 | 5.2 | ||||||||
| 2013 |
2.6 | 0.8 | — | 3.4 | ||||||||
| 2014 |
1.3 | — | — | 1.3 | ||||||||
| Later years |
0.2 | — | — | 0.2 | ||||||||
| $ | 15.8 | $ | 9.8 | $ | 0.5 | $ | 26.1 | |||||
The table above includes lease payments for the initial accounting lease term and all renewal periods for most vehicles under operating leases used in the Company’s operations. If the Company were to not renew these leases, it would be subject to a residual value guarantee. The Company’s maximum residual value guarantee is $6.7 million at December 31, 2009. If the Company continues to renew the leases and pay all lease payments for the vehicles that have been included in the above table, this residual value guarantee will reduce to zero at the end of the final renewal period.
Net rent expense amounted to $9.5 million in 2009, $10.8 million in 2008, and $11.2 million in 2007.
Note 8 – Other Operating Income, net
| (in millions) | December 31, | |||||||||
| 2009 | 2008 | 2007 | ||||||||
| Royalty income from a third party |
$ | — | $ | 1.5 | $ | 1.4 | ||||
| Foreign currency transaction gains (losses), net |
1.5 | (1.9 | ) | 0.9 | ||||||
| Hurricane Katrina insurance settlement gains |
— | — | 2.3 | |||||||
| Other |
— | — | 0.2 | |||||||
| Total |
$ | 1.5 | $ | (0.4 | ) | $ | 4.8 | |||
Pursuant to the Spin-off, two million shares outstanding of $1 par value common stock in the Company were distributed as a stock dividend to BCO, the Company’s then sole shareholder. Holdings was established with authorized capital stock consisting of 170 million shares of common stock, no par value, and two million shares of preferred stock, $10.00 par value per share. On the Spin-off date of October 31, 2008, BCO contributed the stock of Brink’s Home Security to Holdings, and then distributed approximately 45.8 million no par shares of Holdings as a stock dividend on BCO’s common stock to all BCO’s shareholders of record as of October 21, 2008.
Zero shares of preferred stock and 45,837,520 shares of common stock in Holdings were issued and outstanding as of December 31, 2009.
Note 10 – Share-Based Compensation Plans
The Company’s share-based compensation plans are designed to encourage employees and non-employee directors to remain with the Company and to align compensation incentives with interests of the Company’s shareholders. The plans are administered by the compensation committee, which is comprised of four Board of Director members, who may issue rules and regulations for administration of the plan.
55
Table of Contents
BRINK’S HOME SECURITY HOLDINGS, INC.
and subsidiaries
NOTES TO CONSOLIDATED FINANCIAL STATEMENTS—(Continued)
Effective January 1, 2006, the Company utilized the modified prospective transition method to account for its shared-based payment awards. Under this transition method the compensation cost recognized beginning January 1, 2006 includes compensation cost for (i) all share-based payments granted prior to, but not yet vested as of January 1, 2006, based on the estimated grant-date fair value and (ii) all share-based payments granted subsequent to December 31, 2005 based on the estimated grant-date fair value. Compensation cost is generally recognized ratably over the requisite service period or period to retirement eligibility, if shorter.
Share-based Compensation Expense
Total share-based compensation expense recognized in 2009, 2008, and 2007 was $4.4 million, $2.7 million and $1.9 million, respectively. The Company has recognized a related tax benefit associated with its share-based compensation arrangements during 2009 of $0.2 million. No excess tax benefit was recognized in prior years. All share-based compensation expense is included in selling, general and administrative expenses for all periods. Compensation expense is recognized net of estimated forfeitures. Forfeitures are estimated based on the historical termination behaviors and actual forfeitures.
Unrecognized compensation for outstanding unvested share-based awards of $2.3 million at December 31, 2009 will be recognized as compensation expense over a weighted average remaining period of 1.7 years.
Award Modification and Replacement at Spin-off
In connection with the Spin-off, BCO’s share-based awards held by Company employees and newly appointed non-employee directors were converted to and replaced with, respectively, equivalent share-based awards of Holdings. The conversion rate was the ratio of the Company’s fair market value of stock to the fair market value of BCO stock on the date of conversion. The number of shares and the exercise price were equitably adjusted to preserve the intrinsic value of the award as of immediately prior to the Spin-off. The conversion was accounted for as a modification and resulted in a $0.6 million aggregate increase in the fair value of option awards held by 18 employees and non-employee directors. To effect comparability across periods, the number of award units, per share value, and exercise price information for periods prior to the Spin-off were adjusted by the conversion ratio.
Share-based Plans
2008 Equity Incentive Plan (“2008 Equity Plan”) permits grants of stock options, restricted stock, stock appreciation rights (“SARs”), performance stock and other share-based awards to employees. In addition to the awards converted in the Spin-off, 1,000,000 shares have been authorized under the 2008 Plan. Any shares covered by an award other than options, SARs, and converted awards are counted against this limit as two shares for every one share awarded under these plans. No awards will be granted after the termination of the plans, the tenth year after the Spin-off, unless extended by shareholder approval. The maximum contractual term of an option or SAR is six years from the grant date. The 2008 Plan awards may be subject to requisite service periods as determined by the compensation committee at the time of the grant. Through December 31, 2009, only stock options have been granted under the 2008 Plan.
The Company provides share-based awards to directors through the Non-Employee Directors’ Equity Plan (the “Directors’ Plan”). This plan permits grants of stock options, restricted stock, SARs, and other share based awards to members of the Board of Directors who are not full or part time officers or employees of the Company. In addition to the awards replaced in the Spin-off, 500,000 shares have been authorized under the Directors’ Plan. Any shares covered by an award other than options, SARs, and replaced awards are counted against this limit as two shares for every one share awarded under these plans. No awards will be granted after the termination of the plans, the tenth year after the Spin-off, unless extended by shareholder approval. The maximum contractual term of an option or SAR is six years from the grant date. Deferred and restricted share units do not expire. The Directors’ Plan may be subject to requisite service periods as determined by the compensation committee at the time of the grant. As of December 31, 2009, only stock options and restricted stock units have been granted under the plan.
Each non-employee director under the Directors’ Stock Accumulation Plan (“DSAP”) is allocated DSAP units equal to 50% of the annual retainer. Awards for up to 100,000 shares are authorized under the DSAP. No awards will be granted after the termination of the plans, the tenth year after the Spin-off, unless extended by shareholder approval. The number of units granted annually is based on the average of the high and low share price of the Company’s common stock on the grant date.
56
Table of Contents
BRINK’S HOME SECURITY HOLDINGS, INC.
and subsidiaries
NOTES TO CONSOLIDATED FINANCIAL STATEMENTS—(Continued)
Under the Key Employees’ Deferred Compensation Program (“Key Employee Program”), certain employees may defer a portion of their compensation including performance bonuses. The Company provides incentive for participation by matching a portion of employees’ contributions. Shares issuable under the Key Employee Program are unlimited. No awards will be granted after the termination of the plans, the tenth year after the Spin-off, unless extended by shareholder approval. Employees become 50% vested in the match portion after three years of participation in the program, 75% vested after four years and fully vested after five years. The employee deferrals, matching contributions, and dividend equivalents are subsequently converted into units based on the average of the high and low price of the Company’s common stock in the deferral period. Units credited to the employee’s account will be distributed subsequent to termination of employment or upon termination of the Program.
All distributions under the plans will be settled with new shares of the Company’s common stock.
Share Unit Activity
The distribution of restricted stock units and other share units will be such that one unit equals one share of the Company’s common stock.
The fair value of restricted stock units and other share unit awards is determined based on the stock price on the date of grant. For non-vested share units, the fair value of the award on the grant date is amortized to expense over the period of vesting, typically one year. Share units issued with no substantive vesting requirement are expensed immediately.
The table below summarizes the activity for non-vested share units awarded to directors under the Directors’ Plan and DSAP for the year ended December 31, 2009.
| Number of Shares (in thousands) |
Weighted Average Grant Date Fair Value |
Aggregate Intrinsic Value (in millions) | |||||||
| Non-vested as of January 1, 2009 |
40 | $ | 19.10 | $ | 0.9 | ||||
| Granted |
19 | 28.34 | |||||||
| Vested |
(40 | ) | 19.10 | ||||||
| Non-vested as of December 31,2009 |
19 | $ | 28.34 | $ | 0.6 | ||||
| Total outstanding director share units at December 31, 2009 |
30 | $ | 28.35 | $ | 1.0 | ||||
| Outstanding vested director share units at December 31, 2009 |
11 | $ | 28.37 | $ | 0.3 | ||||
The aggregate intrinsic value of director share units converted to shares of the Company’s stock was $1.0 million as of the date that each unit converted. The aggregate fair value of share units that vested during 2009 was $0.8 million. Directors were awarded 19,000 and 40,000 share units in 2009 and 2008, respectively. The weighted average fair value of units granted to directors was $28.34 and $19.10 in 2009 and 2008, respectively.
The table below summarizes the activity for share units awarded under the Key Employee Deferred Compensation Program for the year ended December 31, 2009.
| Number of Shares (in thousands) |
Weighted Average Grant Date Fair Value |
Aggregate Intrinsic Value (in millions) | |||||||
| Outstanding as of December 31, 2008 (a) |
42 | $ | 21.64 | $ | 0.9 | ||||
| Granted |
38 | 25.71 | |||||||
| Forfeited |
(1 | ) | 24.23 | ||||||
| Outstanding as of December 31,2009 (a) |
79 | $ | 23.58 | $ | 2.6 | ||||
| Outstanding vested share units at December 31,2009 (a) |
78 | $ | 23.53 | $ | 2.5 | ||||
| (a) | The weighted average grant date fair value of units outstanding includes the replacement units issued at Spin-off valued on the date of the Spin-off. |
While under the BCO’s Key Employees’ Deferred Compensation Program, participants were permitted to elect to receive a one-time lump-sum distribution of vested share units. Accordingly, each participant who made this election by December 31, 2007 received his or her distribution on February 15, 2008 in the form of BCO’s common stock. Any undistributed portion of a participant’s account remained credited to his or her account and was converted to the Company’s program at the Spin-off date. The aggregate intrinsic value of the share units converted to shares of BCO’s common stock on February 15, 2008 was $8.8 million.
57
Table of Contents
BRINK’S HOME SECURITY HOLDINGS, INC.
and subsidiaries
NOTES TO CONSOLIDATED FINANCIAL STATEMENTS—(Continued)
Option Activity
The table below summarizes the option activity in all plans for the year ended December 31, 2009.
| Shares (in thousands) |
Weighted Average Exercise Price Per Share |
Weighted Average Remaining Contractual Term (in years) |
Aggregate Intrinsic Value (in millions) | ||||||||
| Outstanding at December 31, 2008 |
1,150 | $ | 24.42 | ||||||||
| Granted |
325 | 21.19 | |||||||||
| Exercised |
(45 | ) | 25.73 | ||||||||
| Forfeited |
(32 | ) | 23.20 | ||||||||
| Outstanding at December 31, 2009 |
1,398 | $ | 23.66 | ||||||||
| Options of the Company, as of December 31, 2009: |
|||||||||||
| Exercisable |
561 | $ | 25.00 | 3.3 | $ | 4.3 | |||||
| Expected to vest in future periods (a) |
783 | $ | 22.91 | 4.8 | $ | 7.6 | |||||
| (a) | An estimate of expected forfeitures is included in the estimated options expected to vest in future periods. |
Total fair value of options that became vested during the year ended December 31, 2009 was $1.7 million.
The intrinsic value of a stock option is the difference between the market price of the shares underlying the option and the exercise price of the option. The total intrinsic value of options exercised by the Company’s employees for the years ended December 31, 2009, 2008, and 2007 was $0.3 million, $1.6 million and $3.3 million, respectively.
Method and Assumptions Used to Estimate Fair Value of Options
All share-based payments to employees, including grants of stock options, are recognized in the financial statements based on their fair value. The fair value of each stock option award on the grant date was estimated using the Black-Scholes option-pricing model with the following assumptions: expected dividend yield, expected stock price volatility, weighted-average risk-free interest rate, and weighted average expected life of the options.
The Company’s expected volatility assumption used in the Black-Scholes option-pricing model was based on peer group volatility. The expected life assumption is based on the simplified method since historical share option exercise experience of the Company does not provide a reasonable basis upon which to estimate expected term. The simplified method is based on the vesting period and contractual term for each vesting tranche of awards. The mid-point between the vesting date and the expiration date is used as the expected term under this method. The risk-free interest rate used in the Black-Scholes model is based on the implied yield curve available on U.S. Treasury zero-coupon issues at the date of grant with a remaining term equal to the Company’s expected term assumption. The Company has not declared or paid a cash dividend and has no current plans to pay cash dividends.
The weighted average assumptions in the Black-Scholes option pricing model are shown below for the year ended December 31, 2007 and the period from January to October 2008, prior to the Spin-off, and the period from November to December 2008 and the year ended December 31, 2009, subsequent to the Spin-off.
58
Table of Contents
BRINK’S HOME SECURITY HOLDINGS, INC.
and subsidiaries
NOTES TO CONSOLIDATED FINANCIAL STATEMENTS—(Continued)
| Options Granted | ||||||||||||||||
| 2009 | Nov. – Dec. 2008 |
Jan. – Oct. 2008 (c) |
2007 (c) | |||||||||||||
| Number of shares underlying options, in thousands |
325 | 282 | 263 | 245 | ||||||||||||
| Weighted-average exercise price per share |
$ | 21.19 | $ | 19.06 | $ | 28.79 | $ | 28.58 | ||||||||
| Assumptions used to estimate fair value: |
||||||||||||||||
| Expected dividend yield: |
||||||||||||||||
| Weighted-average |
n/a | (a) | n/a | (a) | 0.60 | % | 0.60 | % | ||||||||
| Range |
n/a | (a) | n/a | (a) | 0.60 | % | 0.60 | % | ||||||||
| Expected volatility: |
||||||||||||||||
| Weighted-average |
34 | % (b) | 34 | % (b) | 26 | % | 26 | % | ||||||||
| Range |
34 | % (b) | 34 | % (b) | 26 | % | 26 | % | ||||||||
| Risk-free interest rate: |
||||||||||||||||
| Weighted-average |
1.8 | % | 1.4 | % | 2.7 | % | 4.9 | % | ||||||||
| Range |
1.8 | % | 1.4 | % | 2.4%-3.0 | % | 4.9 | % | ||||||||
| Expected term in years: |
||||||||||||||||
| Weighted-average |
4.5 | 4.5 | 3.2 | 3.2 | ||||||||||||
| Range |
3-6 | 3-6 | 2.1-4.1 | 2.1-4.1 | ||||||||||||
| Weighted-average fair value estimates at grant date: |
||||||||||||||||
| In millions |
$ | 2.2 | $ | 1.6 | $ | 1.6 | $ | 1.6 | ||||||||
| Fair value per share |
$ | 6.75 | $ | 5.74 | $ | 5.92 | $ | 6.58 | ||||||||
| (a) | Options granted by the Company assumed a zero expected dividend yield as the Company has not declared any dividends as of December 31, 2009. |
| (b) | Expected stock price volatility for stock options granted subsequent to the Spin-off was calculated based on the historical volatility from the stock of a composite of peers, derived from exchange traded options on that same composite of peers. The average expected life was based on the simplified method under SEC Staff Accounting Bulletin 110, Share-based Payment, for newly public companies. The risk-free interest rate was based on U.S. Treasury zero-coupon issues with a remaining term equal to the expected life assumed at the date of grant. |
| (c) | The weighted average grant date fair value and the number of share units granted have been adjusted by the conversion ratio at Spin-off. |
In connection with the Spin-off on October 31, 2008, BCO transferred to the Company’s 401(k) plan an amount equal to the account balances of the Company’s employees and former employees in the BCO 401(k) plan. Each of the Company’s participating employees was credited for all service accrued with BCO prior to such transfer for all purposes under the Company’s 401(k) plan.
The Company’s 401(k) plan allows eligible employees to contribute a portion of their pretax income in accordance with specified guidelines. The Company matches $1.25 for each $1.00 an employee contributes to the plan up to 5% of salary. The Company recognized costs of $7.2 million, $6.0 million, and $6.2 million for the years ended December 31, 2009, 2008, and 2007, respectively, related to the contributions made by the Company to the BCO and the Company’s 401(k) plans.
As of the Spin-off date, BCO retained all assets and liabilities arising out of or relating to the qualified and non-qualified BCO defined benefit pension plans, and will make required payments under such plans to the Company’s current or former employees. For purposes of the vesting provisions of the BCO defined benefit pension plans, Company employees continued to be treated as employees of BCO while employed by the Company following the Spin-off.
On October 21, 2008, the Company entered into a credit agreement (as amended, supplemented or otherwise modified from time to time, the “Credit Agreement”) that provides for a four-year unsecured $75 million revolving credit facility with a syndicate of lenders led by JPMorgan Chase Bank, N.A. as the administrative agent (“Credit Facility”). The Company has the option, under certain conditions, to increase the commitment by up to $50 million, not to exceed $125 million in the aggregate. The Credit Facility is available for general corporate purposes, including the issuance of letters of credit of up to $15 million.
The Credit Agreement includes a requirement that the Company maintain: (i) a Leverage Ratio (as defined in the Credit Agreement) of no more than 2.5 to 1.0 as of the last day of each fiscal quarter, measured on a trailing four-quarters basis, and (ii) a Fixed Charge Coverage Ratio (as defined in the Credit Agreement) of at least 2.0 to 1.0 for the same trailing four quarter period. At December 31, 2009, the Company is in compliance with the requirements of the Credit Agreement.
The pricing on the Credit Facility is based on, generally at the Company’s discretion, the greater of the Prime Rate or the Federal Funds Rate plus one-half of one percent, or LIBOR, plus an adjustment based on the Company’s leverage ratio, as defined in the Credit Agreement. The Company is charged a commitment fee between 0.25% and 0.35% on the unused portion of the facility, tiered based on the Company’s leverage ratio.
As of December 31, 2009, no funds have been drawn under the Credit Facility, but the Company has used the Credit Facility to issue letters of credit totaling $4.3 million.
59
Table of Contents
BRINK’S HOME SECURITY HOLDINGS, INC.
and subsidiaries
NOTES TO CONSOLIDATED FINANCIAL STATEMENTS—(Continued)
In order for us to comply with certain operating covenants included in the Merger Agreement, and as contemplated by the Merger Agreement, we entered into an amendment and received a limited consent and waiver to the Credit Agreement.
Note 13 – Commitments and Contingencies
Joint and Several Liability with The Brink’s Company
Under the Coal Industry Retiree Health Benefit Act of 1992, as amended (the “Health Benefit Act”), BCO and its majority-owned subsidiaries at July 20, 1992, including certain material subsidiaries of the Company, are jointly and severally liable with certain of BCO’s other current and former subsidiaries for health care coverage obligations provided for by the Health Benefit Act. A Voluntary Employees’ Beneficiary Associate trust has been established by BCO to pay for these liabilities, although the trust may not have sufficient funds to satisfy the obligations. The unfunded portion of these obligations is estimated to be approximately $250.0 million as of December 31, 2009. The Company entered into an agreement with BCO in which BCO agreed to indemnify the Company for any and all liabilities and expenses related to BCO’s former coal operations, including any health care coverage obligations.
Legal Proceedings
The Company is involved in various lawsuits and claims in the ordinary course of business. The Company has recorded accruals for losses that are considered probable and reasonably estimable associated with these matters. The Company believes that the ultimate disposition of these matters will not have a material adverse effect on its liquidity or financial position; however, losses, or changes in estimates of losses, from these matters may result in income or expense in any one accounting period that is material in comparison to the earnings of that period.
In April 2009, a Michigan state circuit court jury rendered a verdict against the Company for $4.2 million pertaining to claims made by a terminated employee of the Company. On July 7, 2009, the trial court entered judgment in favor of the plaintiff for $4.7 million. This amount included approximately $0.5 million in pre-judgment interest and attorney fees. After post-trial proceedings, on September 25, 2009, the trial court entered a revised judgment in the amount of $3.5 million. The amount of the revised judgment has been included in other accrued liabilities as of December 31, 2009. On October 16, 2009, the Company filed an appeal seeking reversal of the judgment or in the alternative a new trial, based on various alleged points of error by the trial court. In connection with the appeal, the trial court ordered a stay of execution on the judgment which requires the Company to post an appeal bond. The Company has filed its initial appeal brief but no date has yet been set for oral argument.
Note 14 – Geographic Information
Revenues by country for the years ended December 31, 2009, 2008, and 2007 were as follows:
| (in millions) | December 31, | ||||||||
| 2009 | 2008 | 2007 | |||||||
| United States |
$ | 557.5 | $ | 524.3 | $ | 477.1 | |||
| Canada |
7.6 | 8.0 | 7.3 | ||||||
| Total |
$ | 565.1 | $ | 532.3 | $ | 484.4 | |||
No single customer represents more than 10% of total revenue.
As of December 31, 2009 and 2008, long-lived assets, consisting of property and equipment, net, and deferred subscriber acquisition costs, net, by country were as follows:
| (in millions) | December, 31 | |||||
| 2009 | 2008 | |||||
| United States |
$ | 780.9 | $ | 730.9 | ||
| Canada |
13.7 | 12.1 | ||||
| Total |
$ | 794.6 | $ | 743.0 | ||
Net liabilities related to the Canadian operations totaled $0.6 million as of December 31, 2009 and $2.2 million at December 31, 2008.
60
Table of Contents
BRINK’S HOME SECURITY HOLDINGS, INC.
and subsidiaries
NOTES TO CONSOLIDATED FINANCIAL STATEMENTS—(Continued)
For periods after the Spin-off, basic earnings per share (“EPS”) was computed by dividing net income by the weighted average number of common shares outstanding for December 31, 2009. Diluted EPS was calculated in a similar manner but included the dilutive effect of stock options and restricted stock units outstanding during the year. For the year ended December 31, 2009, 0.5 million anti-dilutive shares were excluded from the calculation of diluted earnings per share.
For 2008, basic earnings per share is computed on a pro forma basis by dividing net income by the weighted average number of common shares outstanding during the two month post Spin-off period beginning November 1, 2008 and ending December 31, 2008. Diluted EPS is calculated in a similar manner, but includes the dilutive effect of actual stock options, restricted stock units, and other equity-based awards outstanding as of December 31, 2008. To the extent these securities are anti-dilutive, they are excluded from the calculation of diluted earnings per share. The dilutive impact for 2008 was not material.
Prior to the Spin-off, no common stock of Holdings and none of Holdings’ equity awards were outstanding for those periods. Basic and diluted earnings per share for the years ended December 31, 2007 were computed on a pro forma basis using the average number of shares of the Company’s common stock outstanding from November 1, 2008 to December 31, 2008. The number of diluted shares used in the calculation for 2007 is based on the pro forma number of shares of the Company’s common stock outstanding plus the estimated potential dilution that could have occurred if options granted under the Company’s equity-based compensation arrangements were exercised or converted into the Company’s common stock.
| (in millions, except EPS) | December 31, | ||||||||
| 2009 | 2008 | 2007 | |||||||
| Earnings: |
|||||||||
| Net income |
$ | 62.7 | $ | 57.1 | $ | 44.2 | |||
| Shares: |
|||||||||
| Weighted average common shares outstanding (a) |
45.9 | 45.8 | 45.8 | ||||||
| Adjustment for assumed dilution — Stock options and restricted stock awards |
0.1 | — | 0.1 | ||||||
| Weighted average common shares outstanding and common stock equivalents |
46.0 | 45.8 | 45.9 | ||||||
| Earnings per share: |
|||||||||
| Basic |
$ | 1.37 | $ | 1.25 | $ | 0.96 | |||
| Diluted |
1.36 | 1.25 | 0.96 | ||||||
| (a) | Weighted average common shares outstanding include shares of common stock and vested share units outstanding during the year. |
Note 16 – Selected Quarterly Financial Data (unaudited)
| (in millions, except per share data) | 2009 | 2008 | ||||||||||||||||||||||
| 1st | 2nd | 3rd | 4th | 1st | 2nd | 3rd | 4th | |||||||||||||||||
| Revenues |
$ | 136.0 | $ | 140.0 | $ | 143.7 | $ | 145.4 | $ | 127.8 | $ | 133.9 | $ | 135.4 | $ | 135.2 | ||||||||
| Cost of Revenues |
65.2 | 67.9 | 71.7 | 69.5 | 69.9 | 72.9 | 76.3 | 67.9 | ||||||||||||||||
| Selling, general, and administrative expenses |
45.5 | 45.4 | 51.3 | 48.7 | 36.7 | 36.1 | 36.9 | 41.2 | ||||||||||||||||
| Operating profit |
25.1 | 27.5 | 21.3 | 27.5 | 21.2 | 25.3 | 22.8 | 24.7 | ||||||||||||||||
| Net income |
15.2 | 16.6 | 13.1 | 17.8 | 12.8 | 15.5 | 14.0 | 14.8 | ||||||||||||||||
| Basic earnings per share |
$ | 0.33 | $ | 0.36 | $ | 0.29 | $ | 0.39 | $ | 0.28 | $ | 0.34 | $ | 0.31 | $ | 0.32 | ||||||||
| Diluted earnings per share |
0.33 | 0.36 | 0.28 | 0.39 | 0.28 | 0.34 | 0.30 | 0.32 | ||||||||||||||||
61
Table of Contents
BRINK’S HOME SECURITY HOLDINGS, INC.
and subsidiaries
NOTES TO CONSOLIDATED FINANCIAL STATEMENTS—(Continued)
On January 18, 2010, we signed the Merger Agreement to be merged into a wholly-owned subsidiary of Tyco in a transaction valued at approximately $2.0 billion. Under the terms of the Merger Agreement, for each share of our common stock outstanding, our shareholders will generally have the right to receive, at the election of the shareholder, (a) 42.50 in cash (subject to proration to reflect an overall cap on the amount of cash to be paid by Tyco), (b) a combination of $12.75 in cash and a fraction of a Tyco share equal to $29.75 divided by the volume weighted-average price of Tyco’s shares on the New York Stock Exchange during the 10-trading day period ending on the fourth full day prior to the closing date, subject to collar between $32.97 and $40.29, or c) Tyco shares equal to $42.50 divided by the volume weighted-average price detailed in (b) above, subject to the same collar. The Merger is subject to customary closing conditions, various regulatory approvals and approval of our shareholders. We currently expect the Merger to close in the second or third quarter of calendar year 2010. Upon closing of the Merger, we anticipate that Broadview Security will be combined with Tyco’s ADT security business under the ADT brand.
On February 19, 2010, certain employees were granted 209,000 stock options with an exercise price of $41.23 per share and an estimated aggregate fair value of $3.0 million. These options, granted under the 2008 Equity Plan, will vest ratably each year over three years and will not vest upon change of control resulting from the Merger.
The Company evaluated all events or transactions that occurred after December 31, 2009 through February 24, 2010, the date and time of transmission of its financial statements.
62
Table of Contents
| ITEM 9. | CHANGES IN AND DISAGREEMENTS WITH ACCOUNTANTS ON ACCOUNTING AND FINANCIAL DISCLOSURE |
None.
| ITEM 9A. | CONTROLS AND PROCEDURES |
Evaluation of Disclosure Controls and Procedures
Pursuant to Rule 13a-15(b) under the Securities Exchange Act of 1934, the Company carried out an evaluation, with the participation of the Company’s management, including the oversight of the Company’s Chief Executive Officer and Chief Financial Officer, of the effectiveness of the Company’s disclosure controls and procedures (as defined under Rule 13a-15(e) under the Securities Exchange Act of 1934) as of the end of the period covered by this report. Based upon that evaluation, the Company’s Chief Executive Officer and Chief Financial Officer concluded that the Company’s disclosure controls and procedures are effective in ensuring that information required to be disclosed by the Company in the reports that it files or submits under the Securities Exchange Act of 1934, is recorded, processed, summarized and reported, within the time periods specified in the SEC’s rules and forms, and that such information is accumulated and communicated to management, including the Company’s Chief Executive Officer and Chief Financial Officer, as appropriate, to allow timely decisions regarding required disclosure.
Management’s Annual Report on Internal Control over Financial Reporting
Company management is responsible for establishing and maintaining adequate internal control over financial reporting. The Company’s internal controls over financial reporting are designed to provide reasonable assurance regarding the reliability of financial reporting and the preparation of financial statements for external purposes in accordance with generally accepted accounting principles in the United States.
Because of its inherent limitations, internal control over financial reporting may not prevent or detect misstatements. Also, projections of any evaluation of effectiveness to future periods are subject to the risk that controls may become inadequate because of changes in conditions or that the degree or compliance with the policies or procedures may deteriorate.
Under supervision and with participation of management, including the CEO and CFO, the Company conducted an evaluation of the effectiveness of internal control over financial reporting as of December 31, 2009. In conducting this evaluation, management used the criteria set forth by the Committee of Sponsoring Organizations of the Treadway Commission (“COSO”) in Internal Control — Integrated Framework. Based on the Company’s evaluation using criteria set by COSO, the Company management concluded internal control over financial reporting was effective as of December 31, 2009.
The effectiveness of internal control over financial reporting as of December 31, 2009 has been audited by KPMG LLP, the Company’s independent registered public accounting firm, who also audited the Company’s consolidated financial statements.
Changes in Internal Control Over Financial Reporting
Before the Spin-off, the Company relied on certain financial information and resources of BCO to manage certain aspects of the Company’s business and report results. These included investor relations, corporate communications, accounting, tax, legal, human resources, benefit plan administration, benefit plan reporting, general management, real estate, treasury, insurance and risk management, and oversight functions, such as Board of Directors and internal audit which includes Sarbanes Oxley compliance. In conjunction with the Company’s separation from BCO, the Company enhanced its own financial, administrative, and other support systems. The Company expanded its internal accounting, reporting, legal, and internal auditing departments and reformed its policies and systems, as needed, to meet all regulatory requirements on a stand-alone basis. While, most of these changes in staffing, policies and systems were accomplished prior to December 31, 2008, certain changes were completed during the year ended December 31, 2009.
Other than those noted above, there were no changes in the Company’s internal control over financial reporting during the year ended December 31, 2009 that have materially affected, or are reasonably likely to materially affect, the Company’s internal control over financial reporting.
63
Table of Contents
| ITEM 9B. | OTHER INFORMATION |
None.
PART III
| ITEM 10. | DIRECTORS, EXECUTIVE OFFICERS, AND CORPORATE GOVERNANCE |
The Company has adopted a Business Code of Ethics that applies to all of the directors, officers, and employees (including the Chief Executive Officer, Chief Financial Officer and Controller) and has posted the Code on the Company’s website. The Company intends to satisfy the disclosure requirement under Item 5.05 of Form 8-K relating to amendments or waivers from any provision of the Business Code of Ethics applicable to the Chief Executive Officer, Chief Financial Officer, and Controller by posting this information on the Company’s website at http://www.investors.broadviewsecurity.com.
The remainder of the information required by Item 10 is incorporated by reference to the Company’s definitive proxy statement pursuant to Regulation 14A or will be part of an amendment to this Form 10-K, in either case to be filed within 120 days after December 31, 2009.
| ITEM 11. | EXECUTIVE COMPENSATION |
The information required by Item 11 is incorporated by reference to the Company’s definitive proxy statement pursuant to Regulation 14A or will be part of an amendment to this 10-K, in either case to be filed within 120 days after December 31, 2009.
| ITEM 12. | SECURITY OWNERSHIP OF CERTAIN BENEFICIAL OWNERS AND MANAGEMENT AND RELATED SHAREHOLDER MATTERS |
The information required by Item 12 is incorporated by reference to the Company’s definitive proxy statement pursuant to Regulation 14A or will be part of an amendment to this Form 10-K, in either case to be filed within 120 days after December 31, 2009.
| ITEM 13. | CERTAIN RELATIONSHIPS AND RELATED TRANSACTIONS AND DIRECTOR INDEPENDENCE |
The information required by Item 13 is incorporated by reference to the Company’s definitive proxy statement pursuant to Regulation 14A or will be part of an amendment to this Form 10-K, in either case to be filed within 120 days after December 31, 2009.
| ITEM 14. | PRINCIPAL ACCOUNTANT FEES AND SERVICES |
The information required by Item 14 is incorporated by reference to the Company’s definitive proxy statement pursuant to Regulation 14A or will be part of an amendment to this Form 10-K, in either case to be filed within 120 days after December 31, 2009.
PART IV
| ITEM 15. | EXHIBITS AND FINANCIAL STATEMENT SCHEDULES |
Financial Statement Schedules
The financial statements included in this report are listed on page 38 of this report. Schedules for which provision is made in the applicable accounting regulations of the Securities and Exchange Commission are either not required under the related instructions or inapplicable.
Exhibits
The exhibits required to be furnished pursuant to Item 15 are listed in the Exhibit Index filed herewith, which Exhibit Index is incorporated herein by reference.
64
Table of Contents
SIGNATURES
Pursuant to the requirements of Section 13 or 15(d) of the Securities Exchange Act of 1934, the Registrant has duly caused this report to be signed on its behalf by the undersigned, thereunto duly authorized.
| Brink’s Home Security Holdings, Inc. | ||
| Registrant | ||
| By | /S/ ROBERT B. ALLEN | |
| Robert B. Allen (Director, President and Chief Executive Officer) | ||
February 24, 2010
Pursuant to the requirements of the Securities Exchange Act of 1934, this report has been signed below by the following persons on behalf of the Registrant and in the capacities and on the dates indicated.
| Signatures |
Title |
Date | ||
| JOHN S. BRINZO* | Director |
February 24, 2010 | ||
| LAWRENCE J. MOSNER* | Director |
February 24, 2010 | ||
| CARL S. SLOANE* | Chairman |
February 24, 2010 | ||
| CARROLL R. WETZEL, JR.* | Director |
February 24, 2010 | ||
| MICHAEL S. GILLILAND* | Director |
February 24, 2010 | ||
| /S/ ROBERT B. ALLEN Robert B. Allen |
Director, President and Chief Executive Officer (principal executive officer) |
February 24, 2010 | ||
| /S/ STEPHEN C. YEVICH Stephen C. Yevich |
Executive Vice President and Chief Financial Officer (principal financial officer and principal accounting officer) |
February 24, 2010 | ||
| *By | /S/ JOHN S. DAVIS | |
| (John S. Davis, Attorney-in-Fact) |
65
Table of Contents
EXHIBIT INDEX
| Exhibit |
Description | |
| 2.1 | Agreement and Plan of Merger, dated as of January 18, 2010, between the Registrant, Tyco International Ltd., Barricade Merger Sub, Inc. and ADT Security Services, Inc. (Incorporated herein by reference to Exhibit 2.1 to the Registrant’s Current Report on Form 8-K filed January 19, 2010). | |
| 2.2 | Separation and Distribution Agreement between the Registrant and The Brink’s Company dated as of October 31, 2008. (Incorporated herein by reference to Exhibit 2.1 to the Registrant’s Amendment No. 3 on Form 10 Registration Statement filed September 25, 2008). | |
| 3.1 | Amended and Restated Articles of Incorporation of the Registrant. (Incorporated herein by reference to Exhibit 3.1 to the Registrant’s Amendment No. 3 to Form 10 filed September 25, 2008). | |
| 3.2 | Amended and Restated Bylaws of the Registrant. (Incorporated herein by reference to Exhibit 3(ii) to the Registrant’s Current Report on Form 8-K filed November 19, 2009). | |
| 10.1 | Transition Services Agreement between the Registrant and The Brink’s Company dated as of October 31, 2008. (Incorporated herein by reference to Exhibit 10.1 to the Registrant’s Amendment No. 3 to Form 10 Registration Statement filed September 25, 2008). | |
| 10.2 | Brand Licensing Agreement between the Registrant and Brink’s Network, Incorporated dated as of October 31, 2008. (Incorporated herein by reference to Exhibit 10.3 to the Registrant’s Amendment No. 3 to Form 10 Registration Statement filed September 25, 2008). | |
| 10.3 | Non-Competition and Non-Solicitation Agreement between the Registrant and The Brink’s Company dated as of October 31, 2008. (Incorporated herein by reference to Exhibit 10.5 to the Registrant’s Amendment No. 3 to Form 10 Registration Statement filed September 25, 2008). | |
| 10.4 | Employee Matters Agreement between the Registrant and The Brink’s Company dated as of October 31, 2008. (Incorporated herein by reference to Exhibit 10.4 to the Registrant’s Amendment No. 1 to Form 10 Registration Statement filed July 18, 2008). | |
| 10.5 | Tax Matters Agreement between the Registrant and The Brink’s Company dated as of October 31, 2008. (Incorporated herein by reference to Exhibit 10.2 to the Registrant’s Amendment No. 2 to Form 10 filed August 14, 2008). | |
| 10.6* | Key Employees’ Deferred Compensation Program, dated as of October 31, 2008. (Incorporated herein by reference to Exhibit 10.7 to the Registrant’s Amendment No. 1 to Form 10 Registration Statement filed July 18, 2008). | |
| 10.7* | Management Performance Improvement Plan, dated as of October 31, 2008. (Incorporated herein by reference to Exhibit 10.8 to the Registrant’s Amendment No. 1 to Form 10 Registration Statement filed July 18, 2008). | |
| 10.8* | Key Employees Incentive Plan, dated as of October 31, 2008. (Incorporated herein by reference to Exhibit 10.11 to the Registrant’s Amendment No. 1 to Form 10 Registration Statement filed July 18, 2008) | |
66
Table of Contents
| 10.9* | Directors’ Stock Incentive Plan, dated as of October 31, 2008. (Incorporated herein by reference to Exhibit 10.10 to the Registrant’s Amendment No. 1 to Form 10 Registration Statement filed July 18, 2008). | |
| 10.10* | Plan for Deferral of Directors’ Fees, dated as of October 31, 2008. (Incorporated herein by reference to Exhibit 10.12 to the Registrant’s Amendment No. 1 to Form 10 Registration Statement filed July 18, 2008). | |
| 10.11 | Form of Change in Control Agreement entered into by the Registrant with certain of its executives. (Incorporated herein by reference to Exhibit 10.1 to the Registrant’s Current Report on Form 8-K filed December 11, 2009). | |
| 10.12* | 2008 Equity Incentive Plan, dated as of October 31, 2008. (Incorporated herein by reference to Exhibit 10.6 to the Registrant’s Amendment No. 3 to Form 10 Registration Statement filed September 25, 2008). | |
| 10.13* | Non-Employee Directors’ Equity Plan, dated as of October 31, 2008. (Incorporated herein by reference to Exhibit 10.9 to the Registrant’s Amendment No. 3 to Form 10 Registration Statement filed September 25, 2008). | |
| 10.14* | Directors’ Stock Accumulation Plan, dated as of October 31, 2008. (Incorporated herein by reference to Exhibit 10.1 to the Registrant’s Amendment No. 3 to Form 10 Registration Statement filed September 25, 2008). | |
| 10.15 | Form of Indemnification Agreement entered into by the Registrant with its directors and officers. (Incorporated herein by reference to Exhibit 10.14 to the Registrant’s Amendment No. 3 to Form 10 Registration Statement filed September 25, 2008). | |
| 10.16 | $75,000,000 Credit Agreement among the Registrant, as Borrower, Bank of America, N.A., Compass Bank, and Wachovia Bank, National Association as Lenders, JPMorgan Chase Bank, N.A., individually and as Administrative Agent, and Wells Fargo Bank, N.A. as Lender and Syndication Agent, dated as of October 21, 2008. (Incorporated herein by reference to Exhibit 10.1 to the Registrant’s Current Report on Form 8-K filed October 23, 2008). | |
| 10.17* | Form of Option Agreement for options granted under 2008 Equity Incentive Plan. (Incorporated herein by reference to Exhibit 10.17 to the Registrant’s Current Report on Form 10-K filed March 31, 2009). | |
| 10.18* | Form of Award Agreement for restricted stock units granted under Non-Employee Directors’ Equity Plan. (Incorporated herein by reference to Exhibit 10.18 to the Registrant’s Current Report on Form 10-K filed March 31, 2009). | |
| 10.19* | Form of Award Agreement for deferred stock units granted under Non-Employee Directors’ Equity Plan. (Incorporated herein by reference to Exhibit 10.19 to the Registrant’s Current Report on Form 10-K filed March 31, 2009). | |
| 10.20 | First Amendment, Limited Consent and Waiver to Credit Agreement, between the Registrant, the Lender’s party thereto, JPMorgan Chase Bank, N.A. as Administrative Agent, and Wells Fargo Bank, N.A. as Syndication Agent, Dated February 17, 2010. | |
| 21 | Current List of Subsidiaries of Registrant. | |
| 23 | Consent of Independent Registered Public Accounting Firm. | |
67
Table of Contents
| 24 | Powers of Attorney. | |
| 31.1 | Certification of the Chief Executive Officer pursuant to Section 302 of the Sarbanes-Oxley Act of 2002. | |
| 31.2 | Certification of the Chief Financial Officer pursuant to Section 302 of the Sarbanes-Oxley Act of 2002. | |
| 32.1 | Certification of the Chief Executive Officer pursuant to 18 U.S.C. Section 1350, as adopted pursuant to Section 906 of the Sarbanes-Oxley Act of 2002. | |
| 32.2 | Certification of the Chief Financial Officer pursuant to 18 U.S.C. Section 1350, as adopted pursuant to Section 906 of the Sarbanes-Oxley Act of 2002. | |
| * | Management contract or compensatory plan or arrangement. |
68