Attached files
Table of Contents
Index to Financial Statements
UNITED STATES
SECURITIES AND EXCHANGE COMMISSION
WASHINGTON, D.C. 20549
FORM 10-K
| x | ANNUAL REPORT PURSUANT TO SECTION 13 OR 15(d) OF THE SECURITIES | |
| EXCHANGE ACT OF 1934 | ||
| For the fiscal year ended: December 31, 2009 | ||
| OR | ||
| ¨ | TRANSITION REPORT PURSUANT TO SECTION 13 OR 15(d) OF THE SECURITIES | |
| EXCHANGE ACT OF 1934 |
For the transition period from to
Commission file number: 0-20750
STERLING BANCSHARES, INC.
(Exact name of registrant as specified in its charter)
| Texas | 74-2175590 | |
| (State or other jurisdiction of incorporation or organization) |
(I.R.S. Employer Identification No.) | |
| 10260 Westheimer | ||
| Houston, Texas | 77042 | |
| (Address of principal executive offices) | (Zip Code) | |
(713) 466-8300
(Registrant’s telephone number, including area code)
Securities registered pursuant to Section 12(b) of the Act:
| Common Stock, $1 par value | NASDAQ Global Select Market | |
| (Title of each class) | (Name of each exchange on which registered) |
Securities registered pursuant to Section 12(g) of the Act: None
Indicate by check mark if the registrant is a well-known seasoned issuer, as defined in Rule 405 of the Securities Act. Yes ¨ No x
Indicate by check mark if the registrant is not required to file reports pursuant to Section 13 or Section 15(d) of the Exchange Act. Yes ¨ No x
Indicate by check mark whether the registrant (1) has filed all reports required to be filed by Section 13 or 15(d) of the Securities Exchange Act of 1934 during the preceding 12 months (or for such shorter period that the registrant was required to file such reports), and (2) has been subject to such filing requirements for the past 90 days. Yes x No ¨
Indicate by check mark whether the registrant has submitted electronically and posted on its corporate Web site, if any, every Interactive Data File required to be submitted and posted pursuant to Rule 405 of Regulation S-T during the preceding 12 months (or for such shorter period that the registrant was required to submit and post such files). Yes ¨ No ¨
Indicate by check mark if disclosure of delinquent filers pursuant to Item 405 of Regulation S-K is not contained herein, and will not be contained, to the best of registrant’s knowledge, in definitive proxy or information statements incorporated by reference in Part III of this Form 10-K or any amendment to this Form 10-K. ¨
Indicate by check mark whether the registrant is a large accelerated filer, an accelerated filer, a non-accelerated filer, or a smaller reporting company. See the definitions of “large accelerated filer,” “accelerated filer,” and “smaller reporting company” in Rule 12b-2 of the Exchange Act.
Large accelerated filer ¨ Accelerated filer x Non-accelerated filer ¨ Smaller reporting company ¨
Indicate by check mark whether the registrant is a shell company (as defined in Rule 12b-2 of the Exchange Act). Yes ¨ No x
As of June 30, 2009, the last business day of the registrant’s most recently completed second quarter fiscal quarter, aggregate market value of the registrant’s common stock held by non-affiliates of the registrant was $503,983,750 based on the closing sale price of $6.33 on such date as reported on the National Association of Securities Dealers Automated Quotation System Global Select Market. For purposes of this calculation, affiliates are defined as all directors and executive officers.
As of February 8, 2010, there were 81,790,969 shares of the registrant’s common stock, $1.00 par value, outstanding.
DOCUMENTS INCORPORATED BY REFERENCE
| Document |
Parts Into Which Incorporated | |
| Proxy Statement for the Annual Meeting of Shareholders to be held April 26, 2010. | Part III, Items 10, 11, 12, 13 and 14 |
Table of Contents
Index to Financial Statements
2009 ANNUAL REPORT ON FORM 10-K
TABLE OF CONTENTS
| PART I. |
||||
| ITEM 1. | 2 | |||
| ITEM 1A. | 13 | |||
| ITEM 1B. | 17 | |||
| ITEM 2. | 18 | |||
| ITEM 3. | 18 | |||
| ITEM 4. | 18 | |||
| PART II. |
||||
| ITEM 5. | 19 | |||
| ITEM 6. | 21 | |||
| ITEM 7. | Management’s Discussion and Analysis of Financial Condition and Results of Operations |
22 | ||
| ITEM 7A. | 54 | |||
| ITEM 8. | 54 | |||
| ITEM 9. | Changes in and Disagreements with Accountants on Accounting and Financial Disclosure |
54 | ||
| ITEM 9A. | 54 | |||
| ITEM 9B | 57 | |||
| PART III. |
||||
| ITEM 10. | 57 | |||
| ITEM 11. | 57 | |||
| ITEM 12. | Security Ownership of Certain Beneficial Owners and Management and Related Stockholder Matters |
57 | ||
| ITEM 13. | Certain Relationships and Related Transactions, and Director Independence |
57 | ||
| ITEM 14. | 57 | |||
| PART IV. |
||||
| ITEM 15. |
Exhibits, Financial Statement Schedules | 58 | ||
| 64 | ||||
1
Table of Contents
Index to Financial Statements
PART I
The disclosures in this item are qualified by the section entitled “Forward-Looking Statements” in Management’s Discussion and Analysis of Financial Condition and Results of Operations included in Item 7 of this report.
In this filing, we may refer to Sterling Bancshares, Inc., on a parent-only basis, as “Sterling Bancshares” and to Sterling Bank as the “Bank.” Sterling Bancshares, the Bank and other subsidiaries of both may be collectively referred to as the “Company,” “we,” “our,” and “us.”
Overview
For more than 35 years, Sterling Bancshares, Inc. and Sterling Bank have served the banking needs of small to medium-sized businesses. We provide a broad array of financial services to Texas businesses and consumers through 58 banking centers in the greater metropolitan areas of Houston, San Antonio, Dallas and Fort Worth, Texas.
Sterling Bancshares was incorporated under the laws of the State of Texas in 1980 and became the parent bank holding company of Sterling Bank in 1981. Sterling Bank was chartered in 1974 under the laws of the State of Texas. Our principal executive offices are located at 10260 Westheimer, Houston, Texas, 77042 and our telephone number is (713) 466-8300.
At December 31, 2009, we had consolidated total assets of $4.9 billion, total loans of $3.2 billion, total deposits of $4.1 billion, and shareholders’ equity of $541 million. On February 8, 2008, the Company completed its acquisition of ten branches located in the Dallas and Fort Worth, Texas areas from First Horizon National Corp. (“First Horizon”). The results of operations for this acquisition have been included in our financial results since February 8, 2008.
Business Banking Strategy. We provide a broad range of financial products and services to all our constituencies within the small to medium-sized business segments and consumers through our full service banking centers. Our bankers exercise limited authority over credit and pricing decisions, subject to a concurrence process and loan committee approval for larger credits. This approach, coupled with continuity of service by the same staff members, enables us to create lasting relationships by meeting all of the banking needs of our business customers including the business owners, their employees and their families. This emphasis on relationship banking, together with a conservative approach to lending, are important factors in our success and growth.
We provide a wide array of consumer and commercial banking services, including: demand, savings and time deposits; commercial, real estate and consumer loans; merchant credit card services; letters of credit; and cash and asset management services. In addition, we facilitate sales of brokerage, mutual fund, alternative financing and insurance products through third-party vendors. Bank deposits are insured up to applicable limits by the Deposit Insurance Fund (“DIF”) of the Federal Deposit Insurance Corporation (“FDIC”).
We offer an extensive scope of services which include our Treasury Management, specialized lending (including energy lending) and Private Client Services groups. We offer services to other financial institutions through our Correspondent Banking group. The Bank’s Capital Markets group is involved in purchases of government guaranteed loans and wholesale real estate lending activities. These additional services enable the Bank to be a more comprehensive financial resource dedicated to helping small to medium-sized businesses meet their financial services needs.
Our primary lending focus is commercial loans and owner-occupied real estate loans to businesses with annual revenues of $100 million or less. Typically, our customers have financing requirements between $50 thousand and $5 million. The Bank’s lending focus allows for greater diversity and granularity in the loan portfolio, less competition from larger banks, and better pricing opportunities.
2
Table of Contents
Index to Financial Statements
We maintain a strong community orientation by, among other things, supporting the active participation of our officers and employees in local charitable, civic, school, religious and community development activities. Each banking center may also appoint selected customers to a business development board that assists in introducing prospective customers to us and in developing or improving products and services to meet customer needs. Our lending and investing activities are funded primarily by core deposits. This stable source of funding comes to us by developing strong banking relationships with customers through our broad product offering, competitive pricing, convenience and service. Approximately 28% of our total deposits are noninterest-bearing demand deposits.
Certain operational and support functions that are transparent to customers have been centralized. This has allowed us to improve consistency and cost efficiencies in the delivery of products and services by each banking center. Centralized functions include services such as data processing, bookkeeping, accounting and finance, loan administration, loan review, legal, compliance, treasury, risk management and internal auditing. Credit policy and administration, strategic planning, marketing and other administrative services also are provided centrally. Our banking centers work closely with our operational and support functions to develop new products and services and to introduce enhancements to existing products and services.
Company Growth Strategy
Our growth strategy has been concentrated on increasing our banking presence in major metropolitan areas in Texas. We have grown through a combination of internal growth, acquisitions and the opening of new banking centers. Sterling was founded as a Houston bank, with a loan portfolio that was primarily secured by Houston real estate, but over the years we have been able to diversify our loan portfolio geographically and expand our product offering. Over the years we have expanded into new markets such as Dallas, Fort Worth, San Antonio and the Texas Hill Country. We regularly evaluate opportunities to acquire banks and other financial services companies that complement our existing business, expand our market coverage and enhance our product offerings.
Acquisitions have been important to our growth. As of December 31, 2009, we have completed five acquisitions since 2005. We have accomplished these acquisitions without substantially altering our balance sheet in a way that would impact the long-term value of our franchise. We continue to seek acquisitions as they become available and prove to be aligned with our business banking philosophy.
During the fourth quarter of 2009, we announced the termination of the purchase and assumption agreement entered into by Sterling Bank and First Banks, Inc. (“First Bank”) on August 7, 2009, regarding the proposed acquisition of certain assets and assumption of certain liabilities by Sterling Bank from First Bank, without penalty to either party. This was a mutual decision after it was determined that the transaction could not be completed by December 31, 2009, as contemplated by the purchase and assumption agreement.
On February 8, 2008, we completed the acquisition of ten banking centers located in the Dallas and Fort Worth, Texas, areas from First Horizon. In addition to these ten banking centers, we also acquired three pieces of land for possible future banking center expansion. This transaction allowed us to achieve a critical presence in Dallas, Texas and gain entry into the growing Fort Worth, Texas market.
On June 28, 2007, we completed the acquisition of MBM Advisors, Inc. (“MBM Advisors”) an independent investment advisory and pension administration/consulting firm with approximately $700 million in assets under management at the time of acquisition. MBM Advisors specializes in providing full-services in the design, administration, investment management, and communication of retirement plans with an office in Houston, Texas. The acquisition of MBM Advisors provided for increased opportunities to serve the owners of small and medium-sized businesses and their employees while enhancing our noninterest income.
On March 30, 2007, we completed the acquisition of Partners Bank. Partners Bank was a privately held bank with approximately $191 million in assets and four banking centers in the Houston area. The Partners Bank acquisition enabled us to fill out our footprint in the Northeast Houston area.
3
Table of Contents
Index to Financial Statements
On September 29, 2006, we completed the acquisition of Kerrville, Texas-based BOTH, Inc. and its subsidiary bank, Bank of the Hills (“BOTH”). BOTH had assets of approximately $328 million and five banking centers in the San Antonio/Kerrville area, which further enhanced our geographic position in this area of Texas.
On September 30, 2005, we completed the acquisition of Dallas, Texas-based Prestonwood Bancshares, Inc. (“Prestonwood”), and its subsidiary bank, The Oaks Bank & Trust Company (“The Oaks Bank”). The Oaks Bank had assets of approximately $128 million and operated five banking centers in Dallas. This acquisition doubled our size in both assets and locations in the Dallas area.
For further information on these acquisitions, refer to Note 2, Acquisitions and Divestitures, in the Notes to Consolidated Financial Statements.
Competition
The financial services industry is highly competitive. There are a number of new banking competitors who have entered, or greatly expanded their presence in Texas—particularly in the Houston, San Antonio, Dallas and Fort Worth, Texas markets in which we operate. We experience significant competition in attracting and retaining deposits and making loans, as well as in providing other financial services in each of our markets. Product pricing, customer convenience and service capabilities, and breadth of product lines are significant competitive factors. We also experience significant competition in attracting and retaining qualified banking professionals.
Our most direct competition for loans comes from other banks. Our most direct competition for deposits comes from other banks, savings institutions and credit unions doing business in our markets. We also experience competition from nonbanking sources, including mutual funds, corporate and governmental debt securities and other investment alternatives offered within and outside of our primary markets. Many of our competitors are much larger in total assets and capitalization, have greater access to capital markets and offer a broader range of financial products and services.
Supervision and Regulation
Bank holding companies and banks are extensively regulated under federal and state laws. This regulation is intended primarily for the protection of depositors and the DIF and not for the benefit of shareholders or creditors. A summary description of the material laws and regulations that relate to our operations is included below. These descriptions are not intended to be complete and are qualified in their entirety by reference to such statutes and regulations.
Regulatory Oversight. Sterling Bancshares and its second tier holding company, Sterling Bancorporation, LLC, are bank holding companies registered under the Bank Holding Company Act of 1956, as amended (the “BHCA”), and are subject to supervision and regulation by the Federal Reserve Board. Federal laws subject bank holding companies to particular restrictions on the types of activities in which they may engage, and to a range of supervisory requirements and activities, including regulatory enforcement actions for violations of laws and policies. In addition, Texas law authorizes the Texas Department of Banking to supervise and regulate a holding company controlling a state bank. Further, our securities are registered with the Securities and Exchange Commission (“SEC”) under the Securities Act of 1933, as amended (the “Securities Act”) and are subject to the reporting obligations pursuant to the Securities Exchange Act of 1934, as amended (the “Exchange Act”). As such, we are subject to the information, proxy solicitation, insider trading and other requirements and restrictions of the Exchange Act. We are also subject to the provisions of the Sarbanes-Oxley Act of 2002, which primarily addresses corporate governance, internal controls and disclosure matters.
Sterling Bank is a Texas-chartered banking association and its deposits are insured, up to applicable limits, by the DIF of the FDIC. Sterling Bank is subject to supervision and regulation by both the Texas Department of Banking and the FDIC, and may be subject to special restrictions, supervisory requirements and potential
4
Table of Contents
Index to Financial Statements
enforcement actions. Sterling Bank is not a member of the Federal Reserve System; however, through its regulation of the Company, the Federal Reserve Board also has supervisory authority that indirectly affects Sterling Bank. Sterling Bank is a member of the Federal Home Loan Bank of Dallas and, therefore, is subject to compliance with its requirements.
Federal and state banking agencies require Sterling Bancshares and Sterling Bank to prepare annual reports on financial condition and to conduct an annual audit of our financial operations and affairs in compliance with minimum standards and procedures. Sterling Bank, and in some cases Sterling Bancshares and our nonbank affiliates, must undergo regular on-site examinations by the appropriate banking agency. The cost of examinations may be assessed against the examined institution as the agency deems necessary and appropriate. The FDIC has developed a method for insured depository institutions, such as Sterling Bank, to provide supplemental disclosure of the estimated fair market value of assets and liabilities, to the extent feasible and practicable, in any balance sheet, financial statement, report of condition or any other report. The federal banking agencies prescribe, by regulation, standards for all insured depository institutions and holding companies regarding, among other things, the following:
| • | Internal controls; |
| • | Information systems and audit systems; |
| • | Loan documentation; |
| • | Credit underwriting; |
| • | Interest rate risk exposure; and |
| • | Asset quality. |
Bank Holding Company Activities. Under the BHCA, Sterling Bancshares is generally permitted to engage in, and may acquire direct or indirect control of more than 5% of the voting shares of any company engaged in, certain limited activities, including (i) banking; (ii) managing and controlling banks; (iii) furnishing or performing services for its subsidiaries; or (iv) any other activity which the Federal Reserve Board determines to be incidental or closely related to banking or managing or controlling banks. Examples of activities the Federal Reserve Board has determined to be so closely related to banking as to be a proper incident to the business of banking, include:
| • | factoring accounts receivable; |
| • | making, acquiring, brokering or servicing loans and usual related activities; |
| • | leasing personal or real property; |
| • | operating a nonbank depository institution, such as a savings association; |
| • | trust company functions; |
| • | financial and investment advisory activities; |
| • | conducting discount securities brokerage activities; |
| • | underwriting and dealing in government obligations and money instruments; |
| • | providing specified management consulting and counseling activities; |
| • | performing selected data processing services and support services; |
| • | acting as agent or broker in selling credit life insurance and other types of insurance in connection with credit transactions; and |
| • | performing selected insurance underwriting activities. |
5
Table of Contents
Index to Financial Statements
Bank holding companies may also elect to become financial holding companies and engage in an expanded list of financial activities if they meet certain requirements relating to capitalization and management. A bank holding company must file an election with the Federal Reserve Board along with a certification that all of its depository institution subsidiaries are “well capitalized” and “well managed” in order to become a financial holding company. Among the permitted activities for financial holding companies are those activities that are financial in nature or incidental or complementary to financial activities, including securities underwriting and dealing, insurance underwriting and merchant banking investments in commercial and financial companies. The Federal Reserve Board, in consultation with the Department of the Treasury, may approve additional financial activities. We have not filed an election to be a financial holding company.
The Federal Reserve Board has the authority to order a bank holding company or its subsidiaries to terminate any activity or to require divestiture of ownership or control of a subsidiary in the event that it has reasonable cause to believe that the activity or continued ownership or control poses a serious risk to the financial safety, soundness or stability of the bank holding company or any of its bank subsidiaries.
Anti-Money Laundering; USA PATRIOT Act. Financial institutions must maintain anti-money laundering programs that include established internal policies, procedures and controls; a designated compliance officer; an ongoing employee training program; and testing of the program by an independent audit function. Financial institutions are prohibited from entering into specified financial transactions and account relationships and must meet enhanced standards for due diligence and “knowing your customer” in their dealings with foreign financial institutions and foreign customers. Financial institutions must take reasonable steps to conduct enhanced scrutiny of account relationships to guard against money laundering and to report any suspicious transactions.
The Uniting and Strengthening America by Providing Appropriate Tools Required to Intercept and Obstruct Terrorism Act of 2001 (the “USA PATRIOT Act”) is intended to strengthen U.S. law enforcement’s and the intelligence community’s ability to work cohesively to combat terrorism on a variety of fronts. Its impact is significant and wide-ranging and has substantially increased the Company’s anti-money laundering obligations. Examples of obligations imposed on financial institutions by the USA PATRIOT Act include: (i) requiring standards for customer identification and verification at account opening; (ii) increased cooperation with regulators and law enforcement entities in identifying parties who may be involved in terrorism or money laundering; (iii) reports and filings to Treasury’s Financial Crimes Enforcement Network for certain transactions exceeding $10,000 in value; and (iv) filing Suspicious Activity Reports if the institution believes a consumer may be violating U.S. laws and regulations. Bank regulators regularly examine institutions for compliance with these obligations and are required to consider an institution’s compliance with these obligations as part of its regulatory review of applications. Failure of a financial institution to maintain and implement adequate programs to combat these matters, or to comply with all of the relevant laws or regulations, could have serious legal and reputational consequences for the institution.
Safety and Soundness Standards. The Financial Institutions Reform, Recovery and Enforcement Act of 1989 (“FIRREA”) expanded the Federal Reserve Board’s authority to prohibit activities of bank holding companies and their non-banking subsidiaries which represent unsafe and unsound banking practices or which constitute violations of laws or regulations. Notably, FIRREA increased the amount of civil monetary penalties that the Federal Reserve Board can assess for certain activities conducted on a knowing and reckless basis, if those activities cause a substantial loss to a depository institution. The penalties can be as high as $1 million per day. FIRREA also expanded the scope of individuals and entities against which such penalties may be assessed.
The federal agencies that regulate banks and savings associations jointly issued guidelines for safe and sound banking operations as required by Section 132 of the Federal Deposit Insurance Corporation Improvement Act (“FDICIA”). The Interagency Guidelines Prescribing Standards for Safety and Soundness identify the fundamental standards that the federal banking agencies follow when evaluating the operational and managerial standards at insured institutions related to: (i) internal controls, information systems and internal audit systems; (ii) loan documentation; (iii) credit underwriting; (iv) interest rate risk exposure; and (v) asset growth. The
6
Table of Contents
Index to Financial Statements
agencies must also prescribe standards for asset quality, earnings, stock valuation, compensation, fees and benefits. An institution’s performance will be evaluated against these standards during the regulators’ periodic on-site examinations.
Temporary Liquidity Guarantee Program. On November 21, 2008, the FDIC adopted the final rule for the implementation of the Temporary Liquidity Guarantee Program (“TLGP”). The TLGP has two primary components: the Debt Guarantee Program, by which the FDIC will guarantee the payment of certain newly issued senior unsecured debt, and the Transaction Account Guarantee Program, by which the FDIC will guarantee in full certain noninterest-bearing transaction accounts. The Debt Guarantee Program temporarily guarantees all newly issued senior unsecured debt up to prescribed limits issued by participating entities on or after October 13, 2008, through October 31, 2009. The guarantee does not extend beyond June 30, 2012 or in some cases, December 31, 2012. Senior unsecured debt includes, without limitation, federal funds purchased, promissory notes, commercial paper, unsubordinated unsecured notes, U.S. dollar-denominated certificates of deposit standing to the credit of a bank, and U.S. dollar-denominated bank deposits in an international banking facility of an insured depository institution. The Transaction Account Guarantee Program provides full FDIC deposit insurance coverage for noninterest-bearing transaction deposit accounts, Negotiable Order of Withdrawal (“NOW”) accounts paying less than 0.50% interest per annum for which the depository institution at which the account is held has committed to maintain the interest rate at or below 0.50% and Interest on Lawyers Trust Accounts held at participating FDIC-insured institutions through June 30, 2010.
Coverage under the TLGP was available until November 13, 2008 without charge. Currently, the fee assessment for coverage of senior unsecured debt ranges from 50 basis points to 100 basis points per annum, depending on the initial maturity of the debt and subject to certain adjustments. Prior to December 31, 2009, the fee assessment for deposit insurance coverage on the Transaction Account Guarantee Program was a 10 basis point annual surcharge on amounts in covered accounts exceeding $250,000. After December 31, 2009, those institutions that have not opted out of the Transaction Account Guarantee Program extension will be charged an assessment rate ranging from 15 to 25 basis points, depending on the institution’s risk category. As of December 31, 2009, we are participating in the Transaction Account Guarantee Program; however, we are no longer participating in the debt guarantee program and therefore had no debt outstanding with the FDIC.
Dividend Restrictions. Under the laws of the State of Texas, Sterling Bancshares, as a for-profit business corporation, may not make distributions that violate its certificate of formation. A Texas Corporation is also prohibited from making a distribution if the corporation would be insolvent after the distribution or the distribution exceeds Sterling Bancshares’ “distribution limit”, as that term is defined by state law. Additionally, the Federal Reserve Board’s general policy provides that bank holding companies should pay cash dividends on common stock only out of income available over the past year and only if prospective earnings retention is consistent with the organization’s expected future needs and financial condition. This policy provides that bank holding companies should not maintain a level of cash dividends that undermines the bank holding company’s ability to serve as a source of strength to its banking subsidiaries. Under Federal Reserve Board policy, a bank holding company is expected to act as a source of financial strength to each of its banking subsidiaries and commit resources to their support. Such support may be required at times when, absent this Federal Reserve Board policy, a bank holding company may not be inclined to provide it.
A primary source of funds for Sterling Bancshares’ payment of dividends to our shareholders are dividends and fees from Sterling Bank and our nonbank affiliates. Various federal and state statutory provisions and regulations limit the amount of dividends that Sterling Bank may pay. FDICIA generally prohibits a depository institution from making a capital distribution, including payment of a dividend, or paying a management fee to its holding company if the institution would thereafter be undercapitalized. In addition, federal and state banking regulations applicable to Sterling Bancshares and Sterling Bank require minimum levels of capital which limit the amounts available for payment of dividends.
7
Table of Contents
Index to Financial Statements
On December 12, 2008, as part of the Troubled Asset Relief Program (“TARP”) Capital Purchase Program, the Company entered into a Securities Purchase Agreement (the “Purchase Agreement”) with the United States Department of the Treasury (the “U.S. Treasury”). Pursuant to the Purchase Agreement, Sterling Bancshares was not permitted to increase common stock dividends above the amount of the last quarterly cash dividend per share declared prior to October 14, 2008 without the initial approval of the U.S. Treasury until the third anniversary of the investment unless all of the Series J Preferred Stock purchased by the U.S. Treasury has been redeemed or transferred. During the second quarter of 2009, Sterling Bancshares fully redeemed the $125 million Series J preferred stock that it sold to the U.S. Treasury in December, 2008, and these limitations are no longer applicable.
Capital Adequacy Requirements. The Federal Reserve Board monitors the capital adequacy of bank holding companies using risk-based capital adequacy guidelines to evaluate their capital adequacy. The Bank is subject to similar requirements promulgated by the FDIC and the Texas Department of Banking. Under the guidelines, issued by the state and federal banking regulators, specific categories of assets and certain off-balance sheet assets such as letters of credit are assigned different risk weights, based generally on the perceived credit risk of the asset. These risk weights are multiplied by corresponding asset balances to determine a “risk-weighted” asset base. In addition, the guidelines define each of the capital components. Total capital is defined as the sum of core capital elements (“Tier 1”) and supplemental capital elements (“Tier 2”), with Tier 2 being limited to 100% of Tier 1. For bank holding companies, Tier 1 capital includes, with certain restrictions, common shareholders’ equity, noncumulative perpetual preferred stock and related surplus, a limited amount of cumulative perpetual preferred stock, and a limited amount of cumulative perpetual stock and minority interest in equity accounts of consolidated subsidiaries, less goodwill and other intangible assets. Tier 2 capital includes, with certain limitations, perpetual preferred stock not meeting the Tier 1 definition, mandatory convertible securities, term subordinated debt, and allowances for loan and lease losses, less certain required deductions. All bank holding companies are required to maintain Tier 1 Capital of at least 4% of risk-weighted assets and off-balance sheet items. Total Capital (the sum of Tier 1 and Tier 2 Capital) of at least 8% of risk-weighted assets and off-balance sheet items and Tier 1 Capital of at least 3% of adjusted quarterly average assets.
A minimum Tier 1 leverage ratio is used as an additional tool to evaluate the capital adequacy of banks and bank holding companies. Tier 1 leverage ratio is defined to be Tier 1 capital divided by its average total consolidated assets. Certain highly rated institutions may maintain a minimum leverage ratio of 3.0% Tier 1 capital to total average assets while others are required to maintain a leverage ratio of 4.0% to 5.0%. The Texas Department of Banking’s policy requires state chartered banks to maintain a leverage ratio of at least 6%.
Corrective Measures for Capital Deficiencies. The federal banking regulators are required to take “prompt corrective action” with respect to capital-deficient institutions. Agency regulations define, for each capital category, the levels at which institutions are “well capitalized,” “adequately capitalized,” “undercapitalized,” “significantly undercapitalized” and “critically undercapitalized.” A “well capitalized” bank has a total risk-based capital ratio of 10.0% or higher; a Tier 1 risk-based capital ratio of 6.0% or higher; a leverage ratio of 5.0% or higher; and is not subject to any written agreement, order or directive requiring it to maintain a specific capital ratio for any capital measure. An “adequately capitalized” bank has a total risk-based capital ratio of 8.0% or higher; a Tier 1 risk-based capital ratio of 4.0% or higher; a leverage ratio of 4.0% or higher (3.0% or higher if the bank was rated a composite 1 under the CAMELS rating system in its most recent examination report and is not experiencing significant growth). A bank is “undercapitalized” if it fails to meet any one of the ratios required to be adequately capitalized. The Company believes that as of December 31, 2009, the Bank was “well capitalized” based on the guidelines and ratios for purposes of the FDIC’s prompt corrective action regulations. The regulations permit the appropriate federal banking regulator to downgrade an institution to the next lower category if the regulator determines (i) after notice and hearing or response, that the institution is in an unsafe or unsound condition, or (ii) that the institution has received and not corrected a less-than-satisfactory rating for any of the categories of asset quality, management, earnings or liquidity in its most recent examination.
In addition to requiring undercapitalized institutions to submit a capital restoration plan, agency regulations contain broad restrictions on certain activities of undercapitalized institutions including asset growth, acquisition,
8
Table of Contents
Index to Financial Statements
branch establishment and expansion into new lines of business. With certain exceptions, an insured depository institution is prohibited from making capital distributions, including dividends, and is prohibited from paying management fees to control persons if the institution would be undercapitalized after any such distribution or payment.
As an institution’s capital decreases, the FDIC’s enforcement powers become more severe. A significantly undercapitalized institution is subject to mandated capital raising activities, restrictions on interest rates paid and transactions with affiliates, removal of management and other restrictions. The FDIC has only very limited discretion in dealing with a critically undercapitalized institution and is virtually required to appoint a receiver or conservator.
Banks with risk-based capital and leverage ratios below the required minimums may also be subject to certain administrative actions, including the termination of deposit insurance upon notice and hearing, or a temporary suspension of insurance without a hearing in the event the institution has no tangible capital.
As part of an informal agreement that Sterling Bank entered into with its regulators, we have agreed to submit a capital management plan to our regulators. For additional information on our capital management plans and certain other provisions of this agreement, see “Management’s Discussion and Analysis of Financial Condition and Results of Operations—Capital and Liquidity.”
Imposition of Liability for Undercapitalized Subsidiaries. A bank holding company that fails to meet the applicable risk-based capital standards will be at a disadvantage. For example, Federal Reserve Board policy discourages the payment of dividends by a bank holding company from borrowed funds as well as payments that would adversely affect capital adequacy. Failure to meet the capital guidelines may result in the issuance of supervisory or enforcement actions by the Federal Reserve Board. FDICIA requires bank regulators to take “prompt corrective action” to resolve problems associated with insured depository institutions whose capital declines below certain levels.
Acquisitions by Bank Holding Companies. Under the BHCA and the Change in Bank Control Act, and regulations promulgated thereunder, Federal Reserve Board approval is necessary prior to any person or company acquiring control of a bank or bank holding company, subject to certain exceptions. Control is conclusively presumed to exist if an individual or company acquires 25% or more of any class of voting securities, and presumed to exist, subject to rebuttal, if a person acquires 10% or more, but less than 25%, of any class of voting securities and either the company has registered securities under Section 12 of the Exchange Act or no other person owns a greater percentage of that class of voting securities immediately after the transaction. The BHCA requires a bank holding company to obtain the prior approval of the Federal Reserve Board before it acquires all or substantially all of the assets of any bank, or ownership or control of more than 5% of any class of voting shares of any bank.
Community Reinvestment Act. The Community Reinvestment Act of 1977 (“CRA”) and the regulations promulgated by the FDIC to implement the CRA are intended to ensure that banks meet the credit needs of their service area, including low and moderate income communities and individuals, consistent with safe and sound banking practices. The CRA regulations also require the banking regulatory authorities to evaluate a bank’s record in meeting the needs of its service area when considering applications to establish new offices or consummate any merger or acquisition transaction. Under FIRREA, the federal banking agencies are required to rate each insured institution’s performance under CRA and to make such information publicly available. In the case of an acquisition by a bank holding company, the CRA performance records of the banks involved in the transaction are reviewed as part of the processing of the acquisition application. A CRA rating other than “outstanding” or “satisfactory” can substantially delay or block a transaction. Based upon our most recent CRA examination, the Bank has a satisfactory CRA rating.
Permissible Activities for State-Chartered Institutions. The Texas Constitution provides that a Texas-chartered bank has the same rights and privileges that are granted to national banks domiciled in Texas. The Texas Finance
9
Table of Contents
Index to Financial Statements
Code also contains provisions that expand the powers of Texas-chartered banks. Under these provisions, a Texas-chartered bank may, with limited exceptions, perform any act, own any property, and offer any product or service that is permissible for any depository institution organized under federal law or the laws of any state, unless (i) prohibited by the FDICIA, or (ii) the Commissioner of the Texas Banking Department finds that the activity would adversely affect the safety and soundness of the bank. However, FDICIA provides that no state bank or subsidiary thereof may engage as principal in any activity not permitted for national banks, unless the institution complies with applicable capital requirements and the FDIC determines that the activity poses no significant risk to the DIF.
Branching. Texas law provides that a Texas-chartered bank can establish a branch anywhere in Texas provided that the branch is approved in advance by the Commissioner of the Texas Department of Banking. The branch must also be approved by the FDIC, which considers a number of factors, including financial history, capital adequacy, earnings prospects, character of management, needs of the community, and consistency with corporate powers.
Restrictions on Transactions with Affiliates and Insiders. Transactions between the Bank and its nonbanking affiliates, including Sterling Bancshares, are subject to Section 23A of the Federal Reserve Act. An affiliate of a bank is any company or entity that controls, is controlled by, or is under common control with the bank. In general, Section 23A imposes a limit on the amount of such transactions, and also requires certain levels of collateral for loans to affiliated parties. It also limits the amount of advances to third parties which are collateralized by the securities or obligations of the Bank or its nonbanking affiliates.
Affiliate transactions are also subject to Section 23B of the Federal Reserve Act which generally requires that certain other transactions between the Bank and its affiliates be on terms substantially the same, or at least as favorable to the Bank, as those prevailing at that time for comparable transactions with or involving other non-affiliated persons.
The restrictions on loans to directors, executive officers, principal shareholders and their related interests (collectively, the “insiders”) contained in the Federal Reserve Act and Regulation O apply to all insured institutions and their subsidiaries and holding companies. These restrictions include limits on loans to one borrower and conditions that must be met before such a loan can be made. There is also an aggregate limitation on all loans to insiders and their related interests. These loans cannot exceed the institution’s total unimpaired capital and surplus, and the FDIC may determine that a lesser amount is appropriate. Insiders are subject to enforcement actions for knowingly accepting loans in violation of applicable restrictions.
Brokered Deposit Restrictions. FIRREA and FDICIA generally limit institutions that are not well capitalized from accepting brokered deposits. In general, undercapitalized institutions may not solicit, accept or renew brokered deposits. Adequately capitalized institutions may not solicit, accept or renew brokered deposits unless they obtain a waiver from the FDIC. Even in that event, the institution must comply with rate limitations imposed by the Federal Deposit Insurance Act.
Restrictions on Subsidiary Banks. Dividends paid by the Bank provided substantially all of Sterling Bancshares’ net cash flow during 2009 and will continue to do so in the foreseeable future. Under federal law, a bank may not pay a dividend that results in an “undercapitalized” situation.
Other requirements under Texas law affecting the operation of subsidiary banks include requirements relating to maintenance of reserves against deposits, restrictions on the nature and amount of loans that may be made and the interest that may be charged thereon and limitations relating to investments and other activities.
Examinations. The FDIC periodically examines and evaluates insured banks. FDIC examinations are conducted annually. The Texas Banking Commissioner also conducts examinations annually, unless additional examinations are deemed necessary to safeguard the interests of shareholders, depositors and creditors.
10
Table of Contents
Index to Financial Statements
Audit Reports. The Company must submit annual audit reports prepared by an independent registered public accounting firm to federal and state regulators. In some instances, the audit report of the institution’s holding company can be used to satisfy this requirement. In addition, financial statements prepared in accordance with generally accepted accounting principles in the United States of America, management’s certifications concerning responsibility for the financial statements, internal controls and compliance with legal requirements designated by the FDIC, and an attestation by the independent registered public accounting firm relating to the internal controls must be submitted. For institutions with total assets of more than $3 billion, an independent registered public accounting firm may be required to review quarterly financial statements. FDICIA requires that independent audit committees be formed, consisting solely of outside directors. Committees must include members with experience in banking or financial management, must have access to outside counsel, and must not include representatives of large customers.
Deposit Insurance Assessments. The Bank must pay assessments to the FDIC for federal deposit insurance protection. The FDIC has adopted a risk-based assessment system as required by FDICIA. Under this system, insured depository institutions pay insurance premiums at rates based on their risk classification. Institutions assigned to higher-risk classifications pay assessments at higher rates than institutions that pose a lower risk. An institution’s risk classification is assigned based on its capital levels and the level of supervisory concern the institution poses to the regulators. In addition, the FDIC can impose special assessments in certain instances. The FDIC may adjust the assessment rate schedule twice a year without seeking prior public comment, but only within a range of five cents per $100 above or below the premium schedule adopted. The FDIC can make changes in the rate schedule outside the five-cent range above or below the current schedule only after a full rulemaking with opportunity for public comment.
The deposit insurance initial base assessment rates currently range from 12 basis points on deposits (for a financial institutions in Risk Category I) to 45 basis points on deposits (for financial institutions in Risk Category IV), but may be higher under certain conditions. After adjustments, the total base assessment rates range from 7 basis points for Risk Category I financial institutions) to 77.5 basis points (for Risk Category IV financial institutions). In addition, the FDIC collects The Financing Corporation (“FICO”) deposit assessments on assessable deposits. FICO assessments are set quarterly, and in 2009 ranged from 1.14 basis points in the first quarter to 1.02 basis points in the fourth quarter.
In the second quarter of 2009, the FDIC levied a special assessment on all insured depository institutions totaling five basis points of each institution’s total assets less Tier 1 capital. The special assessment was part of the FDIC’s efforts to rebuild the DIF. In September 2009, the FDIC passed a rule that required all insured depository institutions, with limited exceptions, to prepay their estimated quarterly assessments in December 2009 for the fourth quarter of 2009 and for all of 2010, 2011 and 2012. This prepayment was approximately $24.0 million for the Bank and will be expensed based upon the regular quarterly assessments.
On January 12, 2010, the FDIC’s Board of Directors approved an Advance Notice of Proposed Rulemaking (the “ANPR”) entitled “Incorporating Executive Compensation Criteria into the Risk Assessment System.” The ANPR requests comment on ways in which the FDIC can amend its risk-based deposit insurance assessment system to account for risks posed by certain employee compensation programs. The FDIC’s goal is to provide an incentive for insured depository institutions to adopt compensation programs that align employee interest with the long-term interests of the institution and its stakeholders, including the FDIC. In order to accomplish this goal, the FDIC would adjust an insured depository institution’s assessment rate in a manner commensurate with the risks presented by the institution’s compensation program. Examples of compensation program features that meet the FDIC’s goal include: (i) providing significant portions of performance-based compensation in the form of restricted, non-discounted company stock to those employees whose activities present a significant risk to the institution; (ii) vesting significant awards of company stock over multiple years and subject to some form of claw-back mechanism to account for the outcome of risks assumed in earlier periods; and (iii) administering the program through a board committee composed of independent directors with input from independent compensation professionals.
11
Table of Contents
Index to Financial Statements
Expanded Enforcement Authority. Federal banking agencies have broad enforcement powers, including the power to terminate deposit insurance, impose substantial fines and other civil and criminal penalties, and appoint a conservator or receiver. Failure to comply with applicable laws, regulations, and supervisory agreements could subject the Bank and its affiliates, as well as officers and directors, to administrative sanctions and potentially substantial civil penalties.
Effect on Economic Environment. The policies of regulatory authorities, including the monetary policy of the Federal Reserve Board, have a significant effect on the operating results of bank holding companies and their subsidiaries. Among the means available to the Federal Reserve Board to affect the money supply are open market operations in U.S. government securities, changes in the discount rate on member bank borrowings and changes in reserve requirements against member bank deposits. These means are used in varying combinations to influence overall growth and distribution of bank loans, investments and deposits, and their use may affect interest rates charged on loans or paid for deposits. Federal Reserve Board monetary policies have materially affected the operating results of commercial banks in the past and are expected to continue to do so in the future.
Supervision and Regulation—Consumer Laws and Regulations. Banks are also subject to certain consumer laws and regulations that are designed to protect consumers in transactions with banks. Among the more prominent of such laws and regulations are the Truth in Lending Act, the Truth in Savings Act, the Electronic Funds Transfer Act, the Expedited Funds Availability Act, the Equal Credit Opportunity Act, the Fair Credit Reporting Act, the Fair Housing Act and consumer privacy protection provisions of the Gramm-Leach-Bliley Act. These laws and regulations mandate certain disclosure requirements and regulate the manner in which financial institutions must deal with consumers. With respect to consumer privacy, the Gramm-Leach-Bliley Act generally prohibits disclosure of customer information to non-affiliated third parties unless the customer has been given the opportunity to object and has not objected to such disclosure. Financial institutions are further required to disclose their privacy policies to customers annually.
Proposed Legislation and Regulatory Action. Rules and statutes are frequently promulgated and enacted that contain wide-ranging proposals for altering the structures, regulations and competitive relationships of financial institutions. Included among current proposals are discussions around the restructuring of the regulatory framework in which the Company and the Bank operate. For example, during the fourth quarter of 2009, the U.S. House of Representatives approved the Wall Street Reform and Consumer Protection Act of 2009 (“H.R. 4173”). As adopted, H.R. 4173 would potentially impact many aspects of our structure and operations. Examples of some of the changes contained in the H.R. 4173 include (i) amendments to the Federal Deposit Insurance Act to establish deposit assessments on total assets less tangible equity, rather than total deposits; (ii) provisions providing shareholders of public companies to have a non-binding “say on pay” vote; and (iii) the creation of a new federal regulator, the Consumer Financial Protection Agency, with enforcement authority for many of the statutes included in the section immediately above entitled, “Supervision and Regulation—Consumer Laws and Regulations.” We cannot predict whether or in what form any proposed regulation or statute will be adopted or the extent to which our business may be affected by any new regulation or statute.
TARP Capital Purchase Program. On December 12, 2008, as part of the TARP Capital Purchase Program, the Company issued the U.S. Treasury Preferred Shares and a ten-year warrant (the “Warrant”) to purchase up to 2.6 million shares of the Company’s common stock for an aggregate purchase price of $125 million. The enactment of the American Recovery and Reinvestment Act of 2009 (“ARRA”) permitted the Company, with the approval of the Secretary of the U.S. Treasury, to redeem the Preferred Shares without completing an equity offering. During the second quarter of 2009, the Company fully redeemed the Preferred Shares that it sold to the U.S. Treasury in December 2008. The Company was approved to pay the funds back without any conditions from regulators. Under the ARRA, the U.S. Treasury was to liquidate the Warrant at the current market price. At December 31, 2009, the Warrant to purchase 2.6 million shares of the Company’s common stock was still outstanding with the U.S. Treasury.
12
Table of Contents
Index to Financial Statements
Employees
The Company had 1,012 full time equivalent employees as of December 31, 2009. None of our employees are represented by collective bargaining agreements and the Company considers its employee relations to be good. In 2009, Sterling Bank was named as one of the best places to work in Houston by the Houston Business Journal.
Available Information
Under the Exchange Act, Sterling Bancshares is required to file annual, quarterly and current reports, proxy statements and other information with the SEC. You may read a copy of any document we file with the SEC at the SEC’s Public Reference Room at 100 F Street, N.E., Washington, D.C. 20549. Please call the SEC at 1-800-SEC-0330 for further information about the Public Reference Room. The SEC maintains a web site at http://www.sec.gov that contains reports, proxy and information statements, and other information we file electronically with the SEC.
We make available, free of charge through our web site, our reports on Forms 10-K, 10-Q and 8-K, and amendments to those reports, as soon as reasonably practicable after such reports are filed with the SEC. Additionally, we have adopted and posted on our web site a Code of Ethics for Senior Financial Officers that applies to our principal executive officer and our principal financial and accounting officer. Our web site also includes the charters for our Audit Committee and Corporate Governance and Nominating Committee. The address for our web site is http://www.banksterling.com. The information contained on or accessible from our website does not constitute a part of this report and is not incorporated by reference herein. We will also provide a printed copy of any of these aforementioned documents free of charge upon request.
Risks, Uncertainties and Other Factors That May Affect Our Future Results
Our profitability depends significantly on geographic economic conditions in the markets in which we operate.
Our success depends primarily on the general economic conditions of the nation, the Houston metropolitan area and, to a lesser extent, that of the San Antonio, Dallas and Fort Worth, Texas metropolitan areas. Unlike larger banks that are more geographically diversified, we provide banking and financial services to customers primarily in the market areas in which we operate. The local economic conditions of these areas have a significant impact on our commercial, real estate and construction loans, the ability of the borrowers to repay these loans and the value of the collateral securing these loans. A significant decline in general economic conditions, such as inflation, recession, acts of terrorism, an outbreak of hostilities, unemployment and other factors beyond our control will impact these local economic conditions and will negatively affect the financial results of our banking operations. In addition, Houston remains largely dependent on the energy industry. A downturn in the energy industry and energy-related business could adversely affect our results of operations and financial condition.
General downward economic trends, reduced availability of commercial credit and increasing unemployment have negatively impacted the credit performance of commercial and consumer credit, resulting in additional charge-offs. Concerns over the stability of the financial markets and the economy have resulted in decreased lending by financial institutions to their customers and to each other. This market turmoil and tightening of credit has led to increased commercial and consumer defaults, lack of customer confidence, increased market volatility and widespread reduction in general business activity. Financial institutions have experienced decreased access to certain funding sources. The resulting economic pressure on consumers and businesses and the lack of confidence in the financial markets may adversely affect our business, financial condition, results of operations, and stock price. Our ability to assess the creditworthiness of customers and to estimate the losses inherent in our credit exposure is made more complex by these difficult market and economic conditions.
We rely on a small to medium-sized business market.
Our business development and marketing strategy primarily targets the banking and financial needs of small to medium-sized businesses with credit needs of under $5 million. These small to medium-sized businesses
13
Table of Contents
Index to Financial Statements
represent a major sector of the Houston and national economies. If general economic conditions negatively impact this economic sector in the metropolitan areas in which we operate, our results of operations and financial condition will be significantly affected. Our lending focuses on providing commercial and owner-occupied real estate loans to businesses. Because our loan portfolio contains a significant number of commercial and industrial, construction and commercial real estate loans with relatively large balances, the deterioration of one or a few of these loans could cause a significant increase in non-performing loans. An increase in non-performing loans could result in a net loss of earnings from these loans, an increase in the provision for possible loan losses and an increase in loan charge-offs, all of which could have a material adverse effect on our financial condition and results of operations.
If our allowance for credit losses is not sufficient to cover actual loan losses, our financial condition and results of operations may be adversely affected.
Our loan customers may not repay their loans according to the terms of these loans, and the collateral securing the payment of these loans may be insufficient to assure repayment. We may experience significant credit losses that could have a material adverse effect on our operating results. We make various assumptions and judgments about the collectability of our loan portfolio, including the creditworthiness of our borrowers and the value of the real estate and other assets serving as collateral for the repayment of many of our loans. In determining the size of the allowance, we rely on our experience and our evaluation of economic conditions and make various assumptions and estimates based on our experience and evaluation. If our assumptions prove to be incorrect, our current allowance may not be sufficient to cover future loan losses and adjustments may be necessary to allow for different economic conditions or adverse developments in our loan portfolio. Significant additions to our allowance would materially decrease our net income.
Furthermore, our federal and state regulators periodically review our allowance for credit losses and may require us to increase our provision for credit losses or recognize further loan charge-offs, based on judgments different than those we make. Any increase in our allowance or charge-offs as required by these regulatory agencies could have a negative affect on us.
If our nonperforming assets increase, our earnings will suffer.
At December 31, 2009, our nonperforming assets totaled approximately $119 million, or 2.42%, of total assets compared to nonperforming assets of $93.3 million, or 1.84% of total assets at December 31, 2008. Our nonperforming assets adversely affect our net income in various ways. We do not record interest income on nonaccrual loans or other real estate owned. We must reserve for probable losses, which is established through a current period charge to the provision for credit losses as well as from time to time, as appropriate, write-downs of the value of properties in our other real estate owned portfolio to reflect changing market values. Additionally, there are legal fees associated with the resolution of problem assets as well as carrying costs such as taxes, insurance and maintenance related to our other real estate owned. Further, the resolution of nonperforming assets requires the active involvement of management, which can distract them from more profitable activity. Finally, if our estimate for the recorded allowance for credit losses proves to be incorrect and our allowance is inadequate, we will have to increase the allowance accordingly and as a result our earnings may be adversely affected.
If we sell any of our loans or loan portfolios, or liquidate any collateral underlying our loans, we may suffer losses and our financial condition and results of operations may be affected.
We regularly evaluate certain of our individual loans and loan portfolios in the context of our ongoing assessment of our asset portfolios, and based on those evaluations we may determine to sell certain loans or loan portfolios. If we decide to sell any loans or loan portfolios, we may incur losses (and possibly material losses given current market conditions) if the sale prices we receive for such loans or loan portfolios are less than our carrying values for such loans or loan portfolios (inclusive of any allowance for credit losses). If we incur any losses as a result of any such sales, our financial condition and results of operations may be adversely affected (and possibly materially affected). Similarly, if we are required to, or otherwise decide to liquidate the collateral
14
Table of Contents
Index to Financial Statements
securing any of our real estate-related loans, or any of our other real estate owned, in a period of reduced real estate values, and the sales prices we receive for the sale of such real estate is less than the carrying value reflected on our balance sheet, we may incur losses and our financial condition and results of operations may be adversely affected.
Fluctuations in interest rates could reduce our profitability.
We realize income primarily from the difference between interest earned on loans and securities and the interest paid on deposits and borrowings. We expect that we will periodically experience “gaps” in the interest rate sensitivities of our assets and liabilities, meaning that either our interest-bearing liabilities will be more sensitive to changes in market interest rates than our interest-earning assets, or vice versa. In either event, if market interest rates should move contrary to our position, this “gap” will work against us, and our earnings may be negatively affected.
We are unable to predict fluctuations of market interest rates, which are affected by the following factors:
| • | general economic conditions including inflation, recession, or a rise in unemployment; |
| • | policies of various governmental and regulatory agencies; |
| • | tightening money supply; |
| • | international disorder; and |
| • | instability in domestic and foreign financial markets. |
Our asset/liability management strategy, which is designed to address the risk from changes in market interest rates and the shape of the yield curve, may not prevent changes in interest rates from having a material adverse effect on our results of operations and financial condition.
Our investment securities portfolio is subject to credit risk, market risk, and liquidity risk.
Our investment securities portfolio has risks beyond our control that can significantly influence the fair value of the securities it contains. These factors include, but are not limited to, rating agency downgrades of the securities, defaults of the issuers of the securities, lack of market pricing of the securities, and continued instability in the credit markets. The current lack of market activity and the illiquidity of the securities have, in certain circumstances, required us to base our fair market valuation on unobservable inputs. Any change in current accounting principles or interpretations of these principles could impact our assessment of fair value and thus our determination of other than temporary impairment of the securities in our investment securities portfolio. If these securities are determined to be other than temporarily impaired, we would be required to write down the securities, which could adversely affect our earnings and regulatory capital ratios.
We are subject to liquidity risks.
Market conditions could negatively affect the level or cost of liquidity available to us, which would affect our ongoing ability to accommodate liability maturities and deposit withdrawals, meet contractual obligations, and fund asset growth and new business transactions at a reasonable cost, in a timely manner, and without adverse consequences. Core deposits are Sterling Bank’s primary source of funding. A significant decrease in Sterling Bank’s core deposits, an inability to obtain alternative funding to the core deposits, or a substantial, unexpected, or prolonged change in the level or cost of liquidity could have a negative effect on our business and financial condition.
Competition with other financial institutions could adversely affect our profitability.
We face vigorous competition from banks and other financial institutions, including savings institutions, finance companies and credit unions. A number of these banks and other financial institutions have substantially greater
15
Table of Contents
Index to Financial Statements
resources and lending limits, larger branch systems and a wider array of banking services. To a limited extent, we also compete with other providers of financial services, such as money market mutual funds, brokerage firms, consumer finance companies and insurance companies. This competition may reduce or limit our margins on financial services, reduce our market share and adversely affect our results of operations and financial condition. Additionally, we face competition primarily from other banks in attracting, developing and retaining qualified banking professionals.
We may not be able to maintain our historical growth rate which may adversely impact our results of operations and financial condition.
We have initiated internal growth programs, completed various acquisitions and opened additional banking centers in the past few years. We may not be able to sustain our historical rate of growth or may not even be able to grow at all. We may not be able to obtain the financing necessary to fund additional growth and may not be able to find suitable candidates for acquisition. Various factors, such as economic conditions and competition, may impede or prohibit the opening of new banking centers. Further, our inability to attract and retain experienced bankers may adversely affect our internal growth. A significant decrease in our historical rate of growth may adversely impact our results of operations and financial condition.
We may be unable to complete acquisitions, and once complete, may not be able to integrate our acquisitions successfully.
Our growth strategy includes our desire to acquire other financial institutions. We may not be able to complete any future acquisitions and, if completed, we may not be able to successfully integrate the operations, management, products and services of the entities we acquire. We may not realize expected cost savings or make revenue enhancements. Following each acquisition, we must expend substantial managerial, operating, financial and other resources to integrate these entities. In particular, we may be required to install and standardize adequate operational and control systems, deploy or modify equipment, implement marketing efforts in new as well as existing locations and employ and maintain qualified personnel. Our failure to successfully integrate the entities we acquire into our existing operations may adversely affect our financial condition and results of operations.
An impairment in the carrying value of our goodwill could negatively impact our earnings and capital.
Goodwill is initially recorded at fair value and is not amortized, but is reviewed for impairment at least annually or more frequently if events or changes in circumstances indicate that the carrying value may not be recoverable. Given the current economic environment and conditions in the financial markets, we could be required to evaluate the recoverability of goodwill prior to our normal annual assessment if we experience disruption in our business, unexpected significant declines in our operating results, or sustained market capitalization declines. These types of events and the resulting analyses could result in goodwill impairment charges in the future. These non-cash impairment charges could adversely affect our results of operations in future periods, and could also significantly impact certain financial ratios and limit our ability to obtain financing or raise capital in the future. A goodwill impairment charge does not adversely affect any of our regulatory capital ratios nor our tangible capital ratio. We performed an interim evaluation of our goodwill balance during the first and fourth quarters of 2009 and an annual goodwill impairment assessment as of September 30, 2009. Based on our analyses, we concluded that the fair value of our reporting units exceeded the carrying value of our assets and liabilities and, therefore, goodwill was not considered impaired at December 31, 2009.
The impact of recently enacted legislation and government programs to stabilize the financial markets and of recent legislative and regulatory initiatives cannot be predicted at this time, and it may significantly impact our financial condition, operations, capital position and ability to pursue opportunities.
We are subject to extensive regulation, supervision and examination by federal and state banking authorities. Any change in applicable regulations or federal or state legislation could have a substantial impact on us and our
16
Table of Contents
Index to Financial Statements
operations. In addition, regulators have significant discretion and power to prevent or remedy unsafe or unsound practices or violations of laws by banks and bank holding companies in the performance of their supervisory and enforcement duties. The exercise of this regulatory discretion and power may have a negative impact on us, by imposing significant restrictions on our existing business or on our ability to develop any new business, requiring us to raise additional capital in the future, restricting or reducing our dividends or requiring us to dispose of certain assets and liabilities within a prescribed period of time.
Under the Emergency Economic Stabilization Act of 2008 (the “EESA”), the U.S. Treasury has the authority to, among other things, invest in financial institutions for the purpose of stabilizing and providing liquidity to the U.S. financial markets. Pursuant to this authority, the U.S. Treasury announced the TARP Capital Purchase Program, to increase the flow of credit to businesses and consumers and to support the economy.
We expect that future rulemaking under the EESA and the ARRA will be forthcoming from the U.S. Treasury which could impact our operations. Congress has held hearings on implementation of the TARP Capital Purchase Program and the use of funds and may adopt further legislation impacting the Company and other financial institutions such as by changing lending practices that legislators believe led to the current economic situation. Furthermore, the U.S. Treasury is required to issue rules interpreting and implementing the executive compensation provisions of the ARRA. Although it is unclear what, if any, additional legislation will be enacted into law or rules will be issued, certain laws or rules may be enacted or imposed administratively by the U.S. Treasury that could restrict the Company’s operations or increase governmental oversight of its businesses and its corporate governance practices. The Special Inspector General for TARP has requested information from the TARP Capital Purchase Program participants, including a description of past and anticipated uses of the TARP Capital Purchase Program funds and plans for addressing executive compensation requirements under the TARP Capital Purchase Program. It is unclear at this point what the ramifications of such disclosure are or may be in the future.
The recent economic and political environment has led to legislative and regulatory initiatives, both enacted and proposed, that may significantly impact the Company. For example, Congress is currently considering a variety of proposals that would make far reaching changes to the financial regulatory system and significantly affect the financial services industry, including: greater powers to regulate risk across the financial system; a new Financial Services Oversight Council chaired by the U.S. Treasury Secretary; a Consumer Financial Protection Agency; potential limits on the scope of federal preemption of state laws as applied to national banks; and changes in the regulatory agencies. Current regulatory initiatives may change certain capital levels that financial institutions are required to maintain. For example, as a result of our periodic enterprise-wide stress testing, we may be required to raise additional capital based on projected economic conditions. The risks noted above create significant uncertainty for us and the financial services industry in general. There can be no assurance as to whether or when any of the parts of the Administration’s plan or other proposals will be enacted, and if adopted, what the final initiatives will be. The legislative and regulatory initiatives could have a significant adverse impact on the financial markets generally, including the extreme levels of volatility and limited credit availability currently being experienced and could require us to change certain of our business practices, impose additional costs on us, limit the products that we offer, result in significant loss of revenue, limit our ability to pursue business opportunities, cause business disruptions, impact the value to assets that we hold or otherwise adversely affect our business, results of operations or financial condition. The long-term impact of these initiatives on our business practices and revenues will depend upon the successful implementation of our strategies, consumer behavior, and competitors’ responses to such initiatives, all of which are difficult to predict.
ITEM 1B. Unresolved Staff Comments
None.
17
Table of Contents
Index to Financial Statements
Our principal executive offices are located at 10260 Westheimer, Houston, Texas, 77042, in space leased by the Company. We operate the following locations:
| Owned | Leased | Total | ||||
| Banking centers in the Houston metropolitan area |
3 | 26 | 29 | |||
| Banking centers in the San Antonio area |
4 | 9 | 13 | |||
| Banking centers in the Dallas metropolitan area |
2 | 14 | 16 | |||
| Central department offices |
1 | 3 | 4 | |||
| Total |
10 | 52 | 62 | |||
The Company has options to renew leases at most locations.
In 2007, we entered into a lease agreement to consolidate our central and corporate offices at one central location in Houston, Texas. This move will be completed during the next year as the timing of the move is aligned with the renewals and expirations of our existing leases.
From time to time, the Company is a party to various legal proceedings incident to its business. Currently, neither Sterling Bancshares nor any of its subsidiaries are involved in any material legal proceedings.
ITEM 4. Submission of Matters to a Vote of Security Holders
No matters were submitted to a vote of security holders during the fourth quarter of 2009.
18
Table of Contents
Index to Financial Statements
PART II
ITEM 5. Market for Registrant’s Common Equity, Related Shareholder Matters and Issuer Purchases of Equity Securities
Common Stock Market Prices and Dividends
Our stock trades through the NASDAQ Global Select Market System under the symbol “SBIB.” In 2006, Sterling was named to the NASDAQ Global Select Market Composite Index which is a market capitalization weighted index that measures all NASDAQ domestic and international based common type stocks listed on the Global Select tier of The NASDAQ Stock Market. The following table sets forth the high and low closing sales prices per share of Sterling Bancshares’ common stock and the dividends paid thereon for each quarter of the last two years. This information has been restated to reflect all stock splits occurring prior to the issuance of this report.
| Sales Price Per Share | Dividend | ||||||||
| High | Low | ||||||||
| 2009 |
|||||||||
| First quarter |
$ | 7.37 | $ | 4.46 | $ | 0.055 | |||
| Second quarter |
7.98 | 6.06 | 0.055 | ||||||
| Third quarter |
8.55 | 6.07 | 0.055 | ||||||
| Fourth quarter |
7.32 | 4.55 | 0.015 | ||||||
| High | Low | Dividend | |||||||
| 2008 |
|||||||||
| First quarter |
$ | 11.46 | $ | 8.50 | $ | 0.055 | |||
| Second quarter |
11.19 | 8.51 | 0.055 | ||||||
| Third quarter |
14.01 | 6.80 | 0.055 | ||||||
| Fourth quarter |
11.91 | 5.18 | 0.055 | ||||||
On January 26, 2010, the Board of Directors declared a quarterly cash dividend of $0.015 per share payable on February 19, 2010, to shareholders of record on February 5, 2010. However, there can be no assurance that we will continue to pay cash dividends on our common stock in the future or the amount or frequency of any such dividend. The payment of future dividends is dependent on many factors that we regularly consider, including our future earnings, capital requirements and financial condition as well as our discussions and agreements with our banking regulators.
For information on the ability of the Bank to pay dividends and make loans to Sterling Bancshares, see “Management’s Discussion and Analysis of Financial Condition and Results of Operations—Financial Condition—Interest Rate Sensitivity and Liquidity” and Note 20 to the Consolidated Financial Statements.
As of February 8, 2010, there were 81,790,969 shares of the Company’s common stock outstanding held by 917 shareholders of record. The closing price per share of common stock on December 31, 2009, the last trading day of the Company’s fiscal year, was $5.13. The number of beneficial shareholders is unknown.
Recent Sales of Unregistered Securities
The Company did not issue any shares which were exempt from the registration under the Securities Act of 1933 pursuant to Section 3(a)(9) thereunder during 2009.
Issuer Repurchases of Equity Securities
On July 30, 2007, the Company’s Board of Directors amended its existing common stock repurchase program (the “Repurchase Program”) originally adopted by the Board of Directors on April 26, 2005. The aggregate number of shares originally approved by the Board of Directors for repurchase under the Repurchase Program remains
19
Table of Contents
Index to Financial Statements
unchanged at 3.8 million shares. The Company may repurchase shares of common stock from time to time in the open market or through privately negotiated transactions from available cash or other borrowings. During the fourth quarter of 2009, there were no purchases of the Company’s equity securities registered pursuant to Section 12 of the Exchange Act. The Company does not plan to utilize the option to repurchase shares of common stock during 2010.
Securities Authorized for Issuance Under Equity Compensation Plans
Please read Item 12. Security Ownership of Certain Beneficial Owners and Management and Related Stockholder Matters for information regarding securities authorized for issuance under equity compensation plans.
Performance Graph
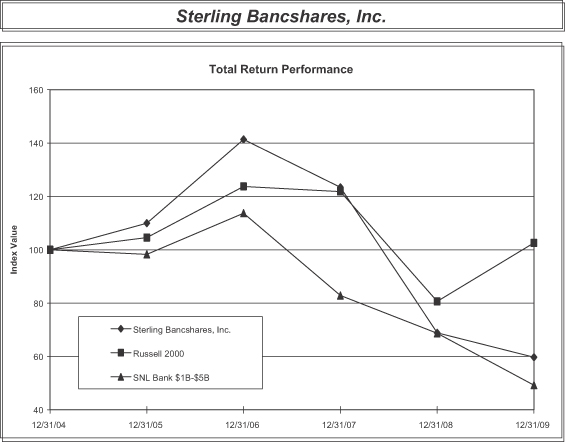
| Period Ending | ||||||||||||
| Index |
12/31/04 | 12/31/05 | 12/31/06 | 12/31/07 | 12/31/08 | 12/31/09 | ||||||
| Sterling Bancshares, Inc. |
100.00 | 110.00 | 141.36 | 123.44 | 68.85 | 59.70 | ||||||
| Russell 2000 |
100.00 | 104.55 | 123.76 | 121.82 | 80.66 | 102.58 | ||||||
| SNL Bank $1B-$5B |
100.00 | 98.29 | 113.74 | 82.85 | 68.72 | 49.26 | ||||||
Source: SNL Financial LC © 2009
20
Table of Contents
Index to Financial Statements
Composite of Cumulative Total Return (1) Russell 2000, SNL Financial LC $1 Billion—$5 Billion Asset Bank Index (2)
The performance graph above compares the yearly percentage change in the cumulative total shareholder return on the Company’s common stock against the cumulative total return indices of the Russell 2000 Index and the SNL Financial LC $1 Billion—$5 Billion Asset Bank Index for the period between December 31, 2004 and December 31, 2009. The historical stock price performance for the Company’s stock shown on the graph above is not necessarily indicative of future stock performance. The information on the Company’s common stock has been adjusted to reflect the three-for-two split (effected as a stock dividend) that was implemented in 2006.
There can be no assurance the Company’s stock performance will continue into the future with the same or similar trends depicted in the graph above. The Company will not make or endorse any predictions as to future stock performance.
| (1) | Assumes that the value of the investment in the Company, and each index, was $100 on December 31, 2004 and that all dividends were reinvested. |
| (2) | The SNL Financial LC $1 billion-to-$5 billion Asset Bank Index is comprised of all publicly traded banking institutions with more than $1 billion and less than $5 billion in total assets as of December 31, 2009. |
ITEM 6. Selected Financial Data
| Year Ended December 31, | ||||||||||||||||||||
| 2009 | 2008 | 2007 | 2006 | 2005 | ||||||||||||||||
| (Dollars and shares in thousands, except for per share amounts) | ||||||||||||||||||||
| Income Statement Data: |
||||||||||||||||||||
| Net interest income |
$ | 191,709 | $ | 198,084 | $ | 185,624 | $ | 171,806 | $ | 150,230 | ||||||||||
| Provision for credit losses |
87,631 | 29,917 | 3,820 | 4,058 | 14,371 | |||||||||||||||
| Noninterest income |
35,895 | 41,027 | 36,220 | 31,217 | 26,959 | |||||||||||||||
| Noninterest expense |
163,184 | 153,210 | 139,354 | 131,186 | 110,646 | |||||||||||||||
| Income (loss) before income taxes |
(23,211 | ) | 55,984 | 78,670 | 67,779 | 52,172 | ||||||||||||||
| Net income (loss) |
(12,974 | ) | 38,619 | 52,962 | 45,840 | 36,222 | ||||||||||||||
| Net income (loss) applicable to common shareholders |
(22,316 | ) | 38,221 | 52,962 | 45,840 | 36,222 | ||||||||||||||
| Balance Sheet Data (at period-end): |
||||||||||||||||||||
| Total assets |
$ | 4,937,048 | $ | 5,079,979 | $ | 4,535,909 | $ | 4,117,559 | $ | 3,726,859 | ||||||||||
| Total loans |
3,245,051 | 3,793,814 | 3,418,284 | 3,132,567 | 2,699,362 | |||||||||||||||
| Allowance for loan losses |
74,732 | 49,177 | 34,446 | 32,027 | 31,230 | |||||||||||||||
| Total securities |
1,069,061 | 805,396 | 656,776 | 573,614 | 618,998 | |||||||||||||||
| Trading assets |
— | — | — | — | 28,515 | |||||||||||||||
| Total deposits |
4,094,951 | 3,819,137 | 3,673,711 | 3,334,611 | 2,838,143 | |||||||||||||||
| Other borrowed funds |
97,245 | 408,586 | 197,147 | 220,675 | 392,850 | |||||||||||||||
| Subordinated debt |
77,338 | 78,335 | 48,694 | 46,135 | 46,238 | |||||||||||||||
| Junior subordinated debt |
82,734 | 82,734 | 82,734 | 56,959 | 82,475 | |||||||||||||||
| Shareholders’ equity |
540,533 | 643,139 | 480,259 | 409,285 | 334,472 | |||||||||||||||
| Common Share Data: |
||||||||||||||||||||
| Earnings (loss) per common share (1): |
||||||||||||||||||||
| Basic shares |
$ | (0.28 | ) | $ | 0.52 | $ | 0.73 | $ | 0.67 | $ | 0.53 | |||||||||
| Diluted shares |
$ | (0.28 | ) | $ | 0.52 | $ | 0.72 | $ | 0.66 | $ | 0.53 | |||||||||
| Shares used in computing earnings (loss) per common share: |
||||||||||||||||||||
| Basic shares |
78,696 | 73,177 | 72,659 | 68,834 | 67,932 | |||||||||||||||
| Diluted shares |
78,696 | 73,488 | 73,126 | 69,533 | 68,642 | |||||||||||||||
| End of period common shares outstanding |
81,853 | 73,260 | 73,159 | 71,001 | 68,001 | |||||||||||||||
| Book value per common share at period-end |
$ | 6.60 | $ | 7.17 | $ | 6.56 | $ | 5.76 | $ | 4.92 | ||||||||||
| Cash dividends paid per common share |
$ | 0.180 | $ | 0.220 | $ | 0.210 | $ | 0.186 | $ | 0.160 | ||||||||||
| Common stock dividend payout ratio |
(106.36 | )% | 41.72 | % | 28.77 | % | 27.99 | % | 30.00 | % | ||||||||||
21
Table of Contents
Index to Financial Statements
| Year Ended December 31, | |||||||||||||||
| 2009 | 2008 | 2007 | 2006 | 2005 | |||||||||||
| Selected Performance Ratios and Other Data: |
|||||||||||||||
| Return on average common equity |
(4.01 | )% | 7.60 | % | 11.77 | % | 12.66 | % | 11.07 | % | |||||
| Return on average assets |
(0.26 | )% | 0.80 | % | 1.22 | % | 1.18 | % | 1.02 | % | |||||
| Tax equivalent net interest margin (2) |
4.22 | % | 4.55 | % | 4.77 | % | 4.90 | % | 4.66 | % | |||||
| Efficiency ratio (3) |
69.17 | % | 63.04 | % | 61.84 | % | 63.79 | % | 61.61 | % | |||||
| Full-time equivalent employees |
1,012 | 1,116 | 1,042 | 1,074 | 1,014 | ||||||||||
| Number of banking centers |
58 | 59 | 49 | 45 | 40 | ||||||||||
| Liquidity and Capital Ratios: |
|||||||||||||||
| Average loans to average deposits |
88.83 | % | 101.31 | % | 91.93 | % | 95.85 | % | 97.67 | % | |||||
| Period-end shareholders’ equity to total assets |
10.95 | % | 12.66 | % | 10.59 | % | 9.94 | % | 8.97 | % | |||||
| Average shareholders’ equity to average assets |
11.92 | % | 10.50 | % | 10.38 | % | 9.33 | % | 9.19 | % | |||||
| Period-end tangible capital to total tangible assets |
7.48 | % | 9.32 | % | 6.79 | % | 6.74 | % | 6.76 | % | |||||
| Tier 1 capital to risk weighted assets |
11.61 | % | 12.14 | % | 9.05 | % | 8.64 | % | 9.99 | % | |||||
| Total capital to risk weighted assets |
14.41 | % | 14.94 | % | 11.10 | % | 10.72 | % | 12.36 | % | |||||
| Tier 1 leverage ratio (Tier 1 capital to average assets) |
8.89 | % | 10.57 | % | 8.59 | % | 8.14 | % | 9.11 | % | |||||
| Asset Quality Ratios: |
|||||||||||||||
| Period-end allowance for credit losses to period-end loans |
2.39 | % | 1.34 | % | 1.03 | % | 1.05 | % | 1.20 | % | |||||
| Period-end allowance for loan losses to period-end loans |
2.30 | % | 1.30 | % | 1.01 | % | 1.02 | % | 1.16 | % | |||||
| Period-end allowance for loan losses to nonperforming loans |
72.86 | % | 56.21 | % | 170.41 | % | 281.27 | % | 142.99 | % | |||||
| Nonperforming loans to period-end loans |
3.16 | % | 2.31 | % | 0.59 | % | 0.36 | % | 0.81 | % | |||||
| Nonperforming assets to period-end assets |
2.42 | % | 1.84 | % | 0.53 | % | 0.32 | % | 0.60 | % | |||||
| Net charge-offs to average loans |
1.72 | % | 0.40 | % | 0.09 | % | 0.20 | % | 0.51 | % | |||||
| (1) | The calculation of diluted earnings per share excludes: 1,603,428; 837,381; 550,505; 139,025; and 167,663 shares for years 2009, 2008, 2007, 2006 and 2005 respectively, which were antidilutive. |
| (2) | Taxable-equivalent basis assuming a 35% tax rate. The Company presents net interest income on a tax-equivalent basis. Accordingly, net interest income from tax-exempt securities and loans is presented in the net interest income results on a basis comparable to taxable securities and loans. This non-GAAP financial measure allows management to assess the comparability of net interest income arising from both taxable and tax-exempt sources. |
| (3) | The efficiency ratio is calculated by dividing noninterest expense less acquisition costs, hurricane related costs, an employee severance payment, and trust preferred securities debt issuance costs by tax equivalent basis net interest income plus noninterest income less net gain (loss) on investment securities. |
ITEM 7. Management’s Discussion and Analysis of Financial Condition and Results of Operations
Forward-Looking Statements
This Annual Report on Form 10-K, other periodic reports filed by us under the Exchange Act, and other written or oral statements made by or on behalf of the Company contain certain statements relating to future events and our future results which constitute forward-looking statements under the Private Securities Litigation Reform Act of 1995. These “forward-looking statements” are typically identified by words such as “expects,” “anticipates,” “intends,” “plans,” “believes,” “seeks,” “estimates,” or words of similar meaning, or future or conditional verbs such as “should,” “could,” or “may.”
22
Table of Contents
Index to Financial Statements
Forward-looking statements reflect our expectation or predictions of future conditions, events or results based on information currently available and involve risks and uncertainties that may cause actual results to differ materially from those in such statements. These risks and uncertainties include, but are not limited to, the risks identified in Item 1A of this report and the following:
| • | general business and economic conditions in the markets we serve could adversely affect, among other things, real estate prices, the job market, and consumer and business confidence which could lead to decreases in the demand for loans, deposits and other financial services that we provide and increases in loan delinquencies and defaults; |
| • | changes or volatility in the capital markets, interest rates and market prices may adversely impact the value of securities, loans, deposits and other financial instruments and the interest rate sensitivity of our balance sheet as well as our liquidity; |
| • | our liquidity requirements could be adversely affected by changes in our assets and liabilities; |
| • | our investment securities portfolio is subject to credit risk, market risk, and liquidity risk as well as changes in the estimates we use to value certain of the securities in our portfolio; |
| • | the effect of legislative or regulatory developments including changes in laws concerning taxes, banking, securities, insurance and other aspects of the financial securities industry; |
| • | competitive factors among financial services organizations, including product and pricing pressures and our ability to attract, develop and retain qualified banking professionals; |
| • | the effect of changes in accounting policies and practices, as may be adopted by the Financial Accounting Standards Board, the Securities and Exchange Commission, the Public Company Accounting Oversight Board and other regulatory agencies; and |
| • | the effect of fiscal and governmental policies of the United States federal government. |
Forward-looking statements speak only as of the date of this report. We do not undertake to update forward-looking statements to reflect circumstances or events that occur after the date of this report or to reflect the occurrence of unanticipated events except as required by federal securities laws.
Overview
“Management’s Discussion and Analysis of Financial Condition and Results of Operations” analyzes major elements of our Consolidated Financial Statements and provides insight into important areas of management’s focus. This introduction highlights selected information in this report and may not contain all of the information that is important to you. For a more complete understanding of trends, events, commitments, liquidity, capital resources and critical accounting estimates, you should carefully read this entire report.
During 2009, we experienced one of the worst recessions that this country has seen, and as such, our results have been directly impacted by higher nonperforming assets and increased credit costs through elevated provisions and loan losses. Further negatively impacting our year-end results were historically low interest rates and low loan demand, both placing pressure on our net interest margin.
Highlights for 2009 include a strong period-end deposit growth of 7.2% over the prior year. We decreased our period-end loan to deposit ratio from 99.3% at December 31, 2008, to 79.2% at December 31, 2009. In addition, during 2009, we continued to diligently analyze our loan portfolio and aggressively place loans on nonperforming status when appropriate. We increased our period-end allowance for credit losses to period-end loans from 1.34% at December 31, 2008, to 2.39% at December 31, 2009.
In 2010, our focus will be serving the needs of our customers and managing risk and capital. Going forward, we will continue to actively identify negative trends within our portfolio, and take actions necessary to minimize future loan losses and strengthen our balance sheet and capital. We will continue to position Sterling Bank for future growth and increased profitability.
23
Table of Contents
Index to Financial Statements
Various legislative and regulatory reforms have been proposed that may affect our operations in 2010. For example, on December 11, 2009, the U.S. House of Representatives approved the Wall Street Reform and Consumer Protection Act of 2009 (H.R. 4173). Some of the proposed changes contained in the H.R. 4173 include: (i) amendments to the Federal Deposit Insurance Act to establish deposit assessments on total assets less tangible equity, rather than total deposits; (ii) provisions providing for shareholders of public companies to have a non-binding “say on pay” vote; and (iii) the creation of a new federal regulator, the Consumer Financial Protection Agency, with enforcement authority for many of the statutes applicable to the financial products and services we offer our customers. Another provision of H.R. 4173 allows the FDIC, as receiver, to reduce the amount of any secured claim by a maximum of 10 percent to satisfy amounts owed to the United States or the DIF during the resolution of the assets and liabilities of an insured depository institution. This provision could increase the costs of borrowing and our interaction with our creditors. It is widely expected that the U.S. Senate will present a financial regulatory reform bill in 2010, although the exact scope of the provisions of that bill are not known at this time.
Recent regulatory reforms proposed by our federal regulators include changes to the manner in which the FDIC sets deposit insurance assessments. The recent Advance Notice of Proposed Rulemaking seeks comments on the FDIC’s use of an insured depository institution’s employee compensation programs as a factor in setting assessment rates for the institution. We provide stock-based compensation to some of our employees, which may be reviewed by the FDIC in setting our assessment rates. In the event that the FDIC determines that our compensation program increases the risk-profile of our institutions, we may face increased deposit assessments.
The President of the United States recently announced proposals that would limit the size of financial institutions as well as the scope of activities in which they may engage. Few details have been provided with respect to these proposals, and it is unlikely that we would be significantly impacted by the market concentration limitations given our relative size. Limitations on our ability to engage in proprietary trading operations may impact our business operations; however, additional guidance is expected regarding these reform proposals.
Critical Accounting Policies
An understanding of our accounting policies is important to an understanding of our reported results. Accounting policies are described in detail in Note 1 to the Consolidated Financial Statements in this Annual Report of Form 10-K. Certain of our accounting policies are considered to be critical because they involve subjective judgment, estimation by management or are particularly complex in their nature.
Fair value of Financial Instruments. We determine the fair market values of our financial instruments based on the fair value hierarchy established which requires an entity to maximize the use of observable inputs and minimize the use of unobservable inputs when measuring fair value.
There are three levels of inputs that may be used to measure fair value. Level 1 inputs include quoted market prices, where available. If such quoted market prices are not available Level 2 inputs are used. These inputs are based upon internally developed models that primarily use observable market-based parameters. Level 3 inputs are unobservable inputs which are typically based on an entity’s own assumptions, as there is little, if any, related market activity. Our assessment of the significance of a particular input to the fair value measurement in its entirety requires judgment, and considers factors specific to the asset or liability.
Allowance for Credit Losses. The allowance for credit losses is a valuation allowance for probable losses incurred on loans and binding commitments. Losses are charged to the allowance when the loss actually occurs or when a determination is made that a probable loss has occurred. Recoveries are credited to the allowance at the time of recovery. Throughout the year, management estimates the probable level of losses to determine whether the allowance for credit losses is adequate to absorb losses inherent in the existing portfolio. Based on these estimates, an amount is charged to the provision for credit losses and credited to the allowance for credit losses in order to adjust the allowance to a level determined to be adequate to absorb losses. Management’s judgment as to the level of probable losses on existing loans involves the consideration of current economic
24
Table of Contents
Index to Financial Statements
conditions and their estimated effects on specific borrowers; an evaluation of the existing relationships among loans, potential credit losses and the present level of the allowance; results of examinations of the loan portfolio by regulatory agencies; and management’s internal review of the loan portfolio. In determining the collectability of certain loans, management also considers the fair value of any underlying collateral. The amount ultimately realized may differ from the carrying value of these assets because of economic, operating or other conditions beyond our control. Please refer to the subsequent discussion of “Allowance for Credit Losses” below as well as in Note 1 to the Consolidated Financial Statements for additional insight into management’s approach and methodology in estimating the allowance for credit losses. Due to the variability in the drivers of the assumptions made in this process, estimates of our loan portfolio’s inherent risks and overall collectability change with changes in the economy, individual industries, and individual borrowers’ or counterparties’ ability and willingness to repay their obligations. The degree to which any particular assumption affects the allowance for credit losses depends on the severity of the change and its relationship to the other assumptions.
Key judgments used in determining the allowance for credit losses include: (i) risk ratings for pools of loans which are stratified by loan type, (ii) market and collateral values and discount rates for individually evaluated loans, (iii) loan type classifications for consumer and commercial loans and commercial real estate loans, (iv) loss rates used for each loan type, (v) adjustments made to assess current events and conditions, (vi) considerations regarding domestic economic uncertainty, and (vii) overall credit conditions.
The process of determining the level of the allowance for credit losses requires a high degree of judgment. It is possible that others, given the same information, may at any point in time reach different reasonable conclusions.
Goodwill and Other Intangibles. Goodwill and intangible assets that have indefinite useful lives are subject to at least an annual impairment test and more frequently if a triggering event occurs or circumstances change between annual tests that would more likely than not reduce the fair value of our reporting units below their carrying amount. Other intangible assets consist primarily of core deposits and other intangibles. Intangible assets with definite useful lives are amortized on an accelerated basis over the years expected to be benefited, which we believe is approximately 10 years. An intangible asset subject to amortization shall be tested for recoverability whenever events or changes in circumstances, such as a significant or adverse change in the business climate that could affect the value of the intangible asset, indicate that its carrying amount may not be recoverable. An impairment loss is recorded to the extent the carrying amount of the intangible asset exceeds its fair value.
Our annual evaluation is performed as of September 30 of each year. As a result of a decrease in the market price of our stock to a level below book value, we performed interim evaluations of our goodwill during the first and fourth quarters of 2009.
The goodwill impairment test involves a two-step process. Under the first step, goodwill is assigned to reporting units for purposes of impairment testing. Reporting units used for the goodwill impairment test include our banking subsidiary, Sterling Bank, and MBM Advisors a wholly owned subsidiary of Sterling Bank that provides investment advisory and pension administration/consulting services. The estimation of fair value of each reporting unit is compared with its carrying value including the allocated goodwill. At December 31, 2009, our goodwill totaled $173 million of which $165 million, or 95%, was allocated to Sterling Bank. If the estimated fair value of a reporting unit is less than its carrying value including goodwill, the second step is performed to measure the amount of impairment, if any. Goodwill impairment exists when the implied fair value of goodwill derived under step two is less than its carrying value.
To determine the fair value of the reporting units under step one of the impairment test, both an income approach and market approach was utilized. The income approach was based on projected cash flows derived from assumptions of balance sheet and income statement activity. Value was then derived by present valuing the projected cash flows using an appropriate risk-adjusted discount rate based on a market participant’s cost of equity. Value under the market approach was based on applying various market capitalization pricing multiples, such as price to tangible book, price to earnings and other relevant metrics, observed from comparable companies
25
Table of Contents
Index to Financial Statements
to the reporting unit. The results of the income and market approach were weighted to arrive at the final estimation of fair value for the reporting unit. As the ability to identify truly comparable companies lessened given the fluctuations in market capitalization across the banking industry, we believed that a heavier weighting on the income approach was more appropriate during the fourth quarter of 2009.
The aggregate fair values of the reporting units as determined under step one of the impairment test were compared to market capitalization as an assessment of the reasonableness of the estimated fair values of the reporting units. For each of the impairment tests performed, the comparison between the aggregate fair values and market capitalization indicated an implied premium which was within the range of control premiums observed in the marketplace.
For the impairment test performed during the fourth quarter of 2009, the Sterling Bank reporting unit did not pass the first step of the impairment test, and therefore, we conducted the second step of the impairment test. The second step required a comparison of the implied fair value of goodwill to the carrying amount of goodwill and was based on information that was as of November 30, 2009.
To determine the implied fair value of goodwill, the fair value of Sterling Bank (as determined in step one) was allocated to all assets and liabilities of the reporting unit including any recognized or unrecognized intangible assets in a manner similar to a purchase price allocation. Key valuations were the assessment of core deposit and trade name intangible assets and the loan portfolio. The valuation of the loan portfolio resulted in an overall discount which we believe was supported by transactions occurring in the marketplace and was consistent with the “exit price” principle of fair value. The fair value of Sterling Bank’s goodwill exceeded its carrying value by an estimated 12% as of November 30, 2009; therefore; we determined there was no impairment of goodwill as of that date.
Based on our annual goodwill impairment review at September 30, 2009, and our additional goodwill step two impairment evaluation performed during the fourth quarter of 2009, management does not believe any of our goodwill is impaired as of December 31, 2009.
In light of the overall instability of the economy, the continued volatility in the financial markets, the downward pressure on bank stock prices and expectations of financial performance for the banking industry, including the reporting units, our estimates of fair value may be subject to change or adjustment and we may determine that goodwill impairment charges may be necessary. Estimates of fair value are determined based on a complex model using cash flows and company comparisons. If management’s estimates of future cash flows are inaccurate, the fair value determined could be inaccurate and impairment may not be recognized in a timely manner. If the company’s market capitalization declines or remains below book value, the company may update its valuation analysis to determine whether goodwill is impaired. No assurance can be given that goodwill will not be written down in future periods.
Derivative Instruments and Hedging Activities. We may designate a derivative as either an accounting hedge of the fair value of a recognized fixed rate asset or an unrecognized firm commitment (“fair value” hedge) or an accounting hedge of a forecasted transaction or of the variability of future cash flows of a floating rate asset or liability (“cash flow” hedge). All derivatives are recorded as other assets or other liabilities on the balance sheet at their respective fair values. To the extent a hedge is considered effective, changes in the fair value of a derivative that is designated and qualifies as a cash flow hedge are recorded in other comprehensive income, net of income taxes. For all hedge relationships, ineffectiveness resulting from differences between the changes in fair value or cash flows of the hedged item and changes in fair value of the derivative are recognized as other income in the results of operations.
Stock-based Compensation. The Company’s stock-based compensation policy applies to all forms of stock-based compensation including stock options, restricted stock units, shares acquired under the Employee Stock Purchase Plan and performance based phantom units. All stock-based compensation is accounted for under the
26
Table of Contents
Index to Financial Statements
fair value method as required by generally accepted accounting principles in the United States. The expense associated with stock-based compensation is recognized over the vesting period of each individual arrangement. The fair value of each stock option award is estimated on the date of grant using a Black-Scholes-Merton option valuation model. The fair value of restricted stock and phantom stock units is based on the fair value at the date of grant using the current market price on the grant date. The fair value of each performance based share unit is estimated based on expected performance goals being attained. Compensation expense associated with the Employee Stock Purchase Plan is determined using a Black-Scholes-Merton option pricing formula. Please refer to Note 1 to the Consolidated Financial Statements for further information. Disclosures of stock-based compensation are also included in Note 15 to the Consolidated Financial Statements.
Results of Operations
Performance Summary. Net loss applicable to common shareholders for the year ended December 31, 2009 was $22.3 million, or $0.28 per diluted common share which included total preferred dividends of $9.3 million or $0.12 per diluted common share related to the preferred stock issued and redeemed under the U.S. Treasury’s Troubled Assets Relief Program. Net loss before preferred stock dividends for the year ended December 31, 2009, was $13.0 million, or $0.16 per diluted common share. Net income available to common shareholders was $38.2 million, or $0.52 per diluted common share for 2008, and $53.0 million, or $0.72 per diluted common share for 2007.
The net loss before preferred stock dividends for 2009 was due primarily to an increase in the provision for credit losses of $57.7 million and increased FDIC assessments of $6.3 million due in part to a one-time special FDIC insurance assessment of $2.3 million. Net income for 2008 decreased $14.3 million or 27.1% compared to 2007 due primarily to an increase in the provision for credit losses of $26.1 million.
A banking institution’s return on average assets and return on average common equity are two commonly used industry measures of performance. Return on average assets (“ROA”) measures net income in relation to average total assets and is an indicator of a company’s ability to employ its resources profitably. For 2009, our ROA was (0.26)%, as compared to 0.80% and 1.22% for 2008 and 2007, respectively.
Return on average common equity (“ROE”) measures net income after preferred dividends in relation to average common equity and is an indicator of a company’s return to its common shareholders. For 2009, our ROE was (4.01)%, as compared to 7.60% and 11.77% for 2008 and 2007, respectively.
Net Interest Income. Net interest income represents the amount by which interest income on interest-earning assets, including loans and securities, exceeds interest paid on interest-bearing liabilities, including deposits and borrowings. Net interest income is our principal source of earnings. Interest rate fluctuations, as well as changes in the amount and type of earning assets and liabilities, combine to affect net interest income.
The Federal Reserve Board significantly influences market interest rates, including rates offered for loans and deposits by many financial institutions. Generally, when the Federal Open Market Committee (“FOMC”) of the Federal Reserve Board changes the target overnight interest rate charged by banks, the market responds with a similar change in the prime lending rate. Our loan portfolio is impacted significantly by changes in short-term interest rates. From June 2006 until September of 2007, overnight interest rates remained consistent at 5.25%. Beginning in September 2007, the FOMC decreased overnight interest rates by 500 basis points to 0.25% at December 31, 2008. Rates remained at this historically low level throughout 2009. This significant decline in interest rates has negatively impacted our net interest income and margin during 2008 and 2009.
27
Table of Contents
Index to Financial Statements
Certain average balances, together with the total dollar amounts of interest income and expense and the average tax equivalent interest yield/rates are included below (in thousands):
| Year Ended December 31, | ||||||||||||||||||||||||||||||
| 2009 | 2008 | 2007 | ||||||||||||||||||||||||||||
| Average Balance |
Interest | Average Yield/ Rate |
Average Balance |
Interest | Average Yield/ Rate |
Average Balance |
Interest | Average Yield/ Rate |
||||||||||||||||||||||
| Interest-earning assets: |
||||||||||||||||||||||||||||||
| Loans held for sale (1) |
$ | 11,335 | $ | 156 | 1.37 | % | $ | 71,050 | $ | 4,696 | 6.61 | % | $ | 62,232 | $ | 4,982 | 8.01 | % | ||||||||||||
| Loans held for investment (1): |
||||||||||||||||||||||||||||||
| Taxable |
3,532,002 | 200,860 | 5.69 | % | 3,583,762 | 236,259 | 6.59 | % | 3,221,523 | 254,931 | 7.91 | % | ||||||||||||||||||
| Non-taxable (2) |
5,089 | 306 | 6.01 | % | 3,637 | 294 | 8.09 | % | 3,344 | 265 | 7.92 | % | ||||||||||||||||||
| Securities: |
||||||||||||||||||||||||||||||
| Taxable |
820,887 | 36,417 | 4.44 | % | 620,506 | 29,660 | 4.78 | % | 523,589 | 23,849 | 4.55 | % | ||||||||||||||||||
| Non-taxable (2) |
98,278 | 5,262 | 5.35 | % | 97,328 | 5,116 | 5.26 | % | 92,928 | 4,699 | 5.06 | % | ||||||||||||||||||
| Deposits in financial institutions |
86,673 | 154 | 0.18 | % | 510 | 10 | 1.92 | % | 734 | 35 | 4.78 | % | ||||||||||||||||||
| Other interest-earning assets |
28,703 | 80 | 0.28 | % | 8,642 | 165 | 1.91 | % | 17,457 | 770 | 4.41 | % | ||||||||||||||||||
| Total interest-earning assets |
4,582,967 | 243,235 | 5.31 | % | 4,385,435 | 276,200 | 6.30 | % | 3,921,807 | 289,531 | 7.38 | % | ||||||||||||||||||
| Noninterest-earning assets: |
||||||||||||||||||||||||||||||
| Cash and due from banks |
57,556 | 101,711 | 108,603 | |||||||||||||||||||||||||||
| Premises and equipment, net |
49,763 | 40,297 | 25,768 | |||||||||||||||||||||||||||
| Other assets |
370,902 | 364,306 | 311,413 | |||||||||||||||||||||||||||
| Allowance for loan losses |
(56,257 | ) | (38,377 | ) | (33,306 | ) | ||||||||||||||||||||||||
| Total noninterest-earning assets |
421,964 | 467,937 | 412,478 | |||||||||||||||||||||||||||
| Total assets |
$ | 5,004,931 | $ | 4,853,372 | $ | 4,334,285 | ||||||||||||||||||||||||
| Interest-bearing liabilities: |
||||||||||||||||||||||||||||||
| Deposits: |
||||||||||||||||||||||||||||||
| Demand and savings |
$ | 1,757,305 | $ | 16,024 | 0.91 | % | $ | 1,416,594 | $ | 17,285 | 1.22 | % | $ | 1,304,168 | $ | 29,217 | 2.24 | % | ||||||||||||
| Certificates and other time |
1,105,055 | 24,051 | 2.18 | % | 1,107,735 | 37,443 | 3.38 | % | 1,191,393 | 55,691 | 4.67 | % | ||||||||||||||||||
| Other borrowed funds |
207,766 | 1,897 | 0.91 | % | 542,413 | 11,607 | 2.14 | % | 134,349 | 6,829 | 5.08 | % | ||||||||||||||||||
| Subordinated debt |
77,643 | 3,325 | 4.28 | % | 62,128 | 4,474 | 7.20 | % | 46,521 | 4,649 | 9.99 | % | ||||||||||||||||||
| Junior subordinated debt |
82,734 | 4,486 | 5.42 | % | 82,734 | 5,731 | 6.93 | % | 76,802 | 6,239 | 8.12 | % | ||||||||||||||||||
| Total interest-bearing liabilities |
3,230,503 | 49,783 | 1.54 | % | 3,211,604 | 76,540 | 2.38 | % | 2,753,233 | 102,625 | 3.73 | % | ||||||||||||||||||
| Noninterest-bearing sources: |
||||||||||||||||||||||||||||||
| Demand deposits |
1,132,469 | 1,086,727 | 1,080,099 | |||||||||||||||||||||||||||
| Other liabilities |
45,530 | 45,396 | 50,975 | |||||||||||||||||||||||||||
| Total noninterest-bearing liabilities |
1,177,999 | 1,132,123 | 1,131,074 | |||||||||||||||||||||||||||
| Shareholders’ equity |
596,429 | 509,645 | 449,978 | |||||||||||||||||||||||||||
| Total liabilities and shareholders’ equity |
$ | 5,004,931 | $ | 4,853,372 | $ | 4,334,285 | ||||||||||||||||||||||||
| Tax equivalent net interest income and margin (2) (3) |
193,452 | 4.22 | % | 199,660 | 4.55 | % | 186,906 | 4.77 | % | |||||||||||||||||||||
| Non-GAAP to GAAP Reconciliation: |
||||||||||||||||||||||||||||||
| Tax Equivalent Adjustment: |
||||||||||||||||||||||||||||||
| Loans |
97 | 92 | 77 | |||||||||||||||||||||||||||
| Securities |
1,646 | 1,484 | 1,205 | |||||||||||||||||||||||||||
| Total tax equivalent adjustment |
1,743 | 1,576 | 1,282 | |||||||||||||||||||||||||||
| Net Interest Income |
$ | 191,709 | $ | 198,084 | $ | 185,624 | ||||||||||||||||||||||||
| (1) | For the purpose of calculating loan yields, average loan balances include nonaccrual loans with no related interest income. |
| (2) | Taxable-equivalent basis assuming a 35% tax rate. Net interest income is presented on a tax-equivalent basis. Accordingly, net interest income from tax-exempt securities and loans is presented in the net interest income results on a basis comparable to taxable securities and loans. This non-GAAP financial measure allows management to assess the comparability of net interest income arising from both taxable and tax-exempt sources. |
| (3) | The net interest margin is equal to net interest income divided by average total interest-earning assets. |
28
Table of Contents
Index to Financial Statements
The following table shows the portions of the net change in tax equivalent interest income and expense due to changes in volume or rate. The changes in tax equivalent interest income due to both rate and volume in the analysis have been allocated proportionately to the volume or rate changes (in thousands):
| 2009 vs. 2008 Increase (Decrease) Due to Changes in: |
2008 vs. 2007 Increase (Decrease) Due to Changes in: |
|||||||||||||||||||||||
| Volume | Rate | Total | Volume | Rate | Total | |||||||||||||||||||
| Interest-earning assets: |
||||||||||||||||||||||||
| Loans held for sale |
$ | (2,343 | ) | $ | (2,197 | ) | $ | (4,540 | ) | $ | 656 | $ | (942 | ) | $ | (286 | ) | |||||||
| Loans held for investment: |
||||||||||||||||||||||||
| Taxable |
(3,306 | ) | (32,093 | ) | (35,399 | ) | 26,366 | (45,038 | ) | (18,672 | ) | |||||||||||||
| Non-taxable (1) |
121 | (109 | ) | 12 | 33 | (4 | ) | 29 | ||||||||||||||||
| Securities: |
||||||||||||||||||||||||
| Taxable |
9,009 | (2,252 | ) | 6,757 | 4,601 | 1,210 | 5,811 | |||||||||||||||||
| Non-taxable (1) |
(251 | ) | 397 | 146 | 496 | (79 | ) | 417 | ||||||||||||||||
| Deposits in financial institutions |
160 | (16 | ) | 144 | (9 | ) | (16 | ) | (25 | ) | ||||||||||||||
| Other interest-earning assets |
116 | (201 | ) | (85 | ) | (288 | ) | (317 | ) | (605 | ) | |||||||||||||
| Total tax equivalent interest income |
3,506 | (36,471 | ) | (32,965 | ) | 31,855 | (45,186 | ) | (13,331 | ) | ||||||||||||||
| Interest-bearing liabilities: |
||||||||||||||||||||||||
| Deposits: |
||||||||||||||||||||||||
| Demand and savings |
3,680 | (4,941 | ) | (1,261 | ) | 2,312 | (14,244 | ) | (11,932 | ) | ||||||||||||||
| Certificates and other time |
(735 | ) | (12,657 | ) | (13,392 | ) | (3,740 | ) | (14,508 | ) | (18,248 | ) | ||||||||||||
| Other borrowed funds |
(5,047 | ) | (4,663 | ) | (9,710 | ) | 10,639 | (5,861 | ) | 4,778 | ||||||||||||||
| Subordinated debt |
953 | (2,102 | ) | (1,149 | ) | 1,311 | (1,486 | ) | (175 | ) | ||||||||||||||
| Junior subordinated debt |
1 | (1,246 | ) | (1,245 | ) | 451 | (959 | ) | (508 | ) | ||||||||||||||
| Total interest expense |
(1,148 | ) | (25,609 | ) | (26,757 | ) | 10,973 | (37,058 | ) | (26,085 | ) | |||||||||||||
| Tax equivalent net interest income (1) |
$ | 4,654 | $ | (10,862 | ) | $ | (6,208 | ) | $ | 20,882 | $ | (8,128 | ) | $ | 12,754 | |||||||||
| (1) | Taxable-equivalent basis assuming a 35% tax rate. Net interest income is presented on a tax-equivalent basis. Accordingly, net interest income from tax-exempt securities and loans is presented in the net interest income results on a basis comparable to taxable securities and loans. This non-GAAP financial measure allows management to assess the comparability of net interest income arising from both taxable and tax-exempt sources. |
Tax equivalent net interest income decreased $6.2 million or 3.1% for 2009 compared to 2008. Our tax equivalent net interest margin was 4.22% for 2009 compared to 4.55% for 2008. The decline in net interest income and margin during 2009 was due, in part, to the significant decline in short-term interest rates and an increase in nonperforming assets. Our average nonperforming assets were approximately $114 million during 2009, which was 107% higher than our average nonperforming assets during 2008. Additionally, changes in the mix of interest-earning assets and liabilities influence our net interest income and margin. During 2008, we had a larger percentage of interest-earning assets invested in higher-yielding loans as compared to 2009. Average loans as a percentage of average interest-earning assets decreased from 83% in 2008 to 77% in 2009 while average securities increased from 16% of average interest-earning assets in 2008 to 20% in 2009.
Tax equivalent net interest income increased $12.8 million or 6.8% for 2008 compared to 2007. This increase in net interest income was primarily due to a decline in interest expense resulting from a decrease in average cost of funds on deposits and the utilization of lower cost borrowings. The rate paid on interest-bearing liabilities decreased 135 basis points for 2008 compared to 2007. Our tax equivalent net interest margin was 4.55% for 2008 compared to 4.77% for 2007. This decline in net interest margin was due, in part, to increased competition for deposits, an increase in nonperforming assets and the significant decline in short-term interest rates that began
29
Table of Contents
Index to Financial Statements
in late 2007. Due to the increased competition for demand deposits during 2008, we utilized short-term borrowings to fund asset growth. The negative impact of the decline in short-term interest rates was partially mitigated by the work we have done in the past two years to position our balance sheet to be more neutral to movements in short-term interest rates including the interest rate hedge that was established in 2006 and the strategic decision to allow certain higher-cost certificates of deposit to be replaced with lower cost borrowings.
Total tax equivalent interest income decreased $33.0 million or 11.9% for 2009 compared to 2008 due to a decrease in interest income on loans. Interest income on loans decreased $39.9 million for 2009 compared to 2008 due to a decline in average loans of $110 million for 2009 compared to 2008 and a decrease in yield earned of 92 basis points. The decrease in yield was due to a combination of the decline in interest rates that began in late 2007 and an increase in nonperforming loans during 2008 and 2009. For the purpose of calculating loan yields, average loan balances include nonaccrual loans with no related interest income. On average, nonaccrual loans increased approximately $53.0 million in 2009 compared to 2008. Interest forgone on nonaccrual loans was $5.3 million for 2009 compared to $3.6 million for 2008 resulting in a reduction in net interest margin of four basis points for 2009. The decrease in yield was partially offset by additional interest income from the interest rate hedge that we purchased in 2006 which provided additional interest income of $2.9 million for 2009 compared to 2008.
Total tax equivalent interest income decreased $13.3 million or 4.6% for 2008 compared to 2007 due to a decrease in interest income on loans. Interest income on loans decreased $18.9 million for 2008 compared to 2007 due to a decrease in yield earned of 133 basis points for 2008. This decrease in yield was due to the decline in interest rates that began in late 2007 and an increase in nonperforming loans during 2008. The decrease in yield was partially offset by additional interest income from the interest rate hedge that we purchased in 2006 which provided additional interest income of $10.3 million for 2008 compared to 2007. In addition, the decline in interest income resulting from decreases in interest rates was partially offset by an increase in average total loans of $371 million or 11.3% for 2008.
Tax equivalent interest income on securities increased $6.9 million for 2009 compared to 2008, and $6.2 million for 2008 compared to 2007 due to an increase in the average securities portfolio and yield earned. Average securities increased $201 million for 2009 compared to 2008, and $101 million for 2008 compared to 2007. Tax equivalent yield earned on securities decreased 31 basis points for 2009 compared to 2008, and increased 21 basis points for 2008 compared to 2007. During 2009, we increased our securities as a percentage of interest-earning assets. Average securities increased from 16% of average interest-earning assets in 2007 and 2008 to 20% in 2009. We increased securities as a percentage of interest-earning assets to further diversify our interest-earning asset portfolio and further utilize excess liquidity. We made this decision in part to support our interest income stream in light of the economic conditions having a negative impact on interest earnings from our loan portfolio.
Net interest income and margin were also impacted by an increase in the use of lower yielding interest-earning cash during 2009. Average interest-earning cash deposits in other financial institutions increased $86.2 million for 2009 compared to 2008. The average yield on these deposits was 0.18% for 2009.
Total interest expense decreased $26.8 million for 2009 compared to 2008 due primarily to a decline in interest rates. The average rate paid on interest-bearing liabilities was 1.54% for 2009 compared to 2.38% in 2008. Interest expense on interest-bearing deposits decreased $14.7 million for 2009 compared to 2008 due to a decrease in rate paid of 77 basis points for 2009 compared to 2008. This was offset by an increase in average interest-bearing deposits of $338 million or 13.4% for 2009 compared to 2008. Interest expense on other borrowed funds decreased $9.7 million for 2009 compared to 2008. This decrease was due to a decrease in average borrowings of $335 million or 61.7% and a decrease in rate paid on borrowings of 123 basis points.
Total interest expense decreased $26.1 million for 2008 compared to 2007 due to a decline in interest rates and the utilization of lower cost borrowings. The decline in interest rates was offset by an increase in average interest-bearing liabilities for 2008 of $458 million or 16.6% compared to 2007. This decrease in interest expense
30
Table of Contents
Index to Financial Statements
for 2008 was primarily due to a decrease in interest expense on deposits of $30.2 million compared to 2007. The reduction in short-term interest rates that began in late 2007 contributed to a decrease in the average rate paid on all interest-bearing deposits of 123 basis points for 2008 compared to 2007.
Beginning in the fourth quarter of 2007 and throughout 2008, we made the strategic decision to allow some of our higher cost time deposits to mature and be replaced by lower cost borrowings. Average other borrowings increased $408 million for 2008 compared to 2007. These borrowings provided additional funding at a rate of 2.14% for 2008, a decrease in funding costs of 294 basis points over 2007. Overall, interest expense on other borrowings increased $4.8 million for 2008 compared to 2007.
Our net interest margin will continue to be under slight pressure due to the low interest rate environment, which we expect to continue in the near term, assuming we are able to maintain our pricing strategies related to loans and deposits. Additional pressure will be placed on our margin due to the unwinding of our $250 million interest rate collar, in 2009, which resulted in gains that were recorded in other comprehensive income and will be amortized relatively evenly over the original remaining term, which ends August 1, 2010. This will account for approximately $2.3 million a quarter in interest income and will decrease the margin by 15 to 20 basis points in the third and fourth quarters of 2010.
Provision for Credit Losses. The provision for credit losses is determined by management as the amount to be added to the allowance for credit losses to bring the allowance to a level which, in management’s estimate, is necessary to absorb probable losses within the existing loan portfolio. The provision for credit losses for 2009 was $87.6 million as compared to $29.9 million for 2008 and $3.8 million for 2007. See the section captioned “Allowance for Credit Losses” elsewhere in this discussion for further analysis of the provision for credit losses.
Noninterest Income. Noninterest income consisted of the following (in thousands):
| 2009 | 2008 | 2007 | |||||||||
| Customer service fees |
$ | 15,431 | $ | 15,771 | $ | 14,327 | |||||
| Other-than-temporary impairment loss on securities |
(14 | ) | (722 | ) | — | ||||||
| Net gain (loss) on sale of securities |
(1,792 | ) | 478 | 3 | |||||||
| Wealth management fees |
7,953 | 8,984 | 5,662 | ||||||||
| Net gain (loss) on loans |
(1,160 | ) | 200 | 1,991 | |||||||
| Bank-owned life insurance |
3,585 | 3,664 | 3,738 | ||||||||
| Debit card income |
2,351 | 2,479 | 2,330 | ||||||||
| Federal Home Loan Bank stock dividends |
47 | 480 | 604 | ||||||||
| Other |
9,494 | 9,693 | 7,565 | ||||||||
| Total |
$ | 35,895 | $ | 41,027 | $ | 36,220 | |||||
Total noninterest income decreased $5.1 million or 12.5% for 2009 compared to 2008, and increased $4.8 million or 13.3% for 2008 compared to 2007. Details of the changes in the various components of noninterest income are discussed below:
Customer service fees decreased $340 thousand for 2009 compared to 2008. This decrease was primarily due to lower transaction activity. Customer service fees increased $1.4 million for 2008 compared to 2007. This increase was partly attributable to the lower earnings credit rate on our commercial accounts on analysis, which is a direct result of lower short-term interest rates.
We recorded a $14 thousand credit-related OTTI on a held-to-maturity debt security during the second quarter of 2009, based on its cash flow analysis. This security was issued in 2007 and was backed by hybrid adjustable-rate residential mortgage loans. As of the date of OTTI, this security was rated triple-A by Standard and Poor’s (“S&P”) and single-B by Fitch Ratings, Ltd. (“Fitch”) (Moody’s Investor Service (“Moody’s”) does not rate this
31
Table of Contents
Index to Financial Statements
security). As of the date of OTTI, the Company did not intend to sell the security, and it was not more likely than not that the Company would be required to sell the investment before recovery of its remaining amortized cost basis. Therefore, for 2009 the amount of the credit-related OTTI of $14 thousand, was recognized in earnings and the amount of the noncredit-related impairment of $2.7 million, was recognized in other comprehensive income as of June 30, 2009. We recorded an OTTI loss of $722 thousand during 2008 on certain interest-only securities. These securities are tied to underlying government guaranteed loans and are subject to prepayment and interest rate fluctuations. Given the length of time these securities had been in an unrealized loss position, current prepayment factors for the underlying loan and management’s inability to determine when a full recovery of the value may occur, management considered these securities to be other than temporarily impaired. There were no OTTI losses recorded in 2007.
Net losses on the sale of securities for 2009 of $1.8 million were due to realized losses of $7.1 million recorded on the sale of certain private-label CMO’s. During the fourth quarter of 2009, we sold five private-label CMO’s that were classified as held-to-maturity. The decision to sell these securities in 2009 was due to the significant credit downgrading of the securities which caused these securities to be classified as “substandard” assets by management. The credit rating on these securities declined from primarily AAA ratings in 2008 to credit ratings ranging from B3 to CC in 2009. Throughout 2009, we monitored these securities noting a significant decline in the credit ratings in under a year. In addition, the underlying performance of these securities had continued to deteriorate as delinquencies continued to increase. Given these credit downgrades, the current economic uncertainty along with the increasing levels of delinquencies being reported for all residential mortgage loans, we believed there was additional risk associated with holding these securities until maturity. These securities had a carrying value of $24.1 million at the time of sale. These losses were partially offset by realized gains of $5.3 million on the sale of available-for-sale investments with a cost basis of $96.0 million which were sold as part of our ongoing portfolio management.
Wealth management fees decreased $1.0 million for 2009 compared to 2008. This decrease was due primarily to a decline in investment management fees which are assessed based on the market value of managed assets. Our total assets under management have decreased over the prior year due to recent market conditions. Wealth management fees increased $3.3 million for 2008 compared to 2007. This increase was due primarily to the addition of MBM Advisors in June 2007. MBM Advisors is an investment advisory and pension administration/consulting firm providing full-services in the design, administration, investment management, and communication of retirement plans. Our wealth management group provides customized solutions for high net worth customers by integrating financial services with traditional banking products and services such as private banking, money management, full-service brokerage, financial planning, personal and institutional trust and retirement services, as well as insurance and risk management services.
Net losses on loans for 2009 of $1.2 million were due primarily to realized losses on the sale of certain nonperforming commercial real estate loans. During the fourth quarter of 2009, we sold $8.4 million of substandard and nonperforming commercial real estate loans resulting in a loss of $1.4 million. Loans held for sale at December 31, 2009 included approximately $9.9 million of nonperforming commercial real estate. We recorded a lower of cost or market adjustment of $251 thousand during 2009 related to these loans. Losses on commercial real estate loans were offset by approximately $500 thousand in gains from the sale of residential mortgage loans originated by the Company.
Net gain on loans decreased $1.8 million for 2008 compared to 2007. This decrease was primarily due to a decline in loan sale activity. During 2008, the Company sold approximately $10.3 million of performing commercial real estate loans that were originally acquired as held for investment compared to $45.5 million for 2007. These sales resulted in net gains of $203 thousand for 2008 compared to $1.4 million for 2007. These loans were sold as part of our ongoing management of the size, concentrations and risk profile of the loan portfolio. Loans held for sale at December 31, 2007, included certain commercial real estate loans and SBA guaranteed loans originated by the Bank. Due to current market conditions in 2008, $112 million of these loans were no
32
Table of Contents
Index to Financial Statements
longer classified as held for sale and were transferred to held for investment. We recorded a lower of cost or market adjustment of $266 thousand during 2008 related to these loans. There were no lower of cost or market adjustments recorded for 2007.
Other noninterest income decreased $199 thousand for 2009 compared to 2008 due primarily to a decrease in other lending fees of approximately $2.0 million. The decrease in other lending fees was offset by $2.1 million in gains recorded as a result of the cash flow hedge ineffectiveness during 2009. Other noninterest income increased $2.1 million for 2008 compared to 2007. This increase was due primarily to an increase in other lending fees of $2.0 million. In addition, we received $323 thousand from the mandatory redemption of some of our shares of VISA Inc., related to Visa Inc’s initial public offering during 2008.
We anticipate moderate growth in our noninterest income for 2010, primarily as a result of capital market conditions improving through 2010 which would result in higher wealth management fees.
Noninterest Expense. The following table shows the detail of noninterest expense (in thousands):
| 2009 | 2008 | 2007 | ||||||||
| Salaries and employee benefits |
$ | 86,930 | $ | 85,253 | $ | 81,039 | ||||
| Occupancy |
23,826 | 21,782 | 18,366 | |||||||
| Technology |
9,850 | 9,794 | 8,843 | |||||||
| Professional fees |
4,702 | 4,707 | 4,159 | |||||||
| Postage, delivery and supplies |
2,866 | 3,672 | 3,611 | |||||||
| Marketing |
1,930 | 2,545 | 1,809 | |||||||
| Core deposits and other intangibles amortization |
2,247 | 2,328 | 2,137 | |||||||
| Acquistion costs |
1,134 | 562 | 920 | |||||||
| FDIC insurance assessments |
8,830 | 2,525 | 410 | |||||||
| Net losses (gains) and carrying costs of other real estate owned and foreclosed property |
3,085 | 40 | (92 | ) | ||||||
| Other |
17,784 | 20,002 | 18,152 | |||||||
| Total |
$ | 163,184 | $ | 153,210 | $ | 139,354 | ||||
Total noninterest expense for 2009 increased $10.0 million compared to 2008 due primarily to increased FDIC insurance assessments. Total noninterest expense increased $13.9 million for 2008 compared to 2007 due primarily to three acquisitions completed since the first quarter of 2007, resulting in additional noninterest expense of $8.1 million for 2008. Details of the changes in various components of noninterest expense are discussed below:
Salaries and employee benefits for 2009 increased $1.7 million compared to 2008. This increase was primarily due to one-time severance charges of $2.1 million recorded during the second quarter of 2009 as part of our ongoing company-wide expense reduction initiative. Additional increases were due to a decrease in cost deferrals related to lending activities and increases in employee benefits, including deferred compensation and additional employer matches due to changes in our 401(k) Plan. This increase was partially offset by the reversal of $1.7 million of stock-based compensation expense related to certain performance based stock awards that are not expected to be fully earned at this time because the Company’s performance fell below the threshold performance metrics specified in the respective stock awards. Salaries and employee benefits for 2008 increased $4.2 million compared to 2007. This increase was primarily due to three acquisitions completed since March of 2007. These acquisitions have resulted in additional salaries and benefits expense of approximately $4.5 million for 2008 compared to 2007. Additionally, in 2008, we incurred $485 thousand of severance and salary costs related to the restructuring of our SBA unit and exiting the small ticket leasing business. These decisions were based on decreased opportunities in these areas due to market conditions.
Occupancy expense increased $2.0 million for 2009 compared to 2008. This increase was due primarily to the consolidation of our central and corporate offices into one central location in Houston. We expect to complete
33
Table of Contents
Index to Financial Statements
this move during 2010 as the timing of the move is aligned with the renewals and expirations of our existing leases. In addition, during 2009 we opened two new banking centers in Houston. Occupancy expense increased $3.4 million for 2008 compared to 2007. Since the third quarter of 2006, we have added 19 banking centers in conjunction with the BOTH, Partners Bank and First Horizon branch acquisitions.
Technology expense increased $56 thousand for 2009 compared to 2008 and $951 thousand for 2008 compared to 2007. The increase for 2008 was due, in part, to three acquisitions completed since March 2007 which resulted in additional expense of approximately $238 thousand for 2008. Additionally, in 2008 depreciation expense increased due to hardware and customer products added including an upgrade in the Bank’s deposit system.
During 2009, we recorded $1.1 million of acquisition-related expenses in connection with the First Bank branch acquisition that was expected to close during the fourth quarter of 2009. During the fourth quarter of 2009, we announced the termination of the purchase and assumption agreement entered into by Sterling Bank with First Bank on August 7, 2009, without penalty to either party. This was a mutual decision after it was determined that the transaction could not be completed by December 31, 2009, as contemplated by the agreement. Beginning in 2009, acquisition-related costs are expensed as incurred and include all acquirer expenses including investment banking, legal, accounting, valuation, and other professional or consulting services fees. Under the accounting guidance in effect prior to 2009, these costs were allocated to the assets acquired and liabilities assumed. We recorded $562 thousand and $920 thousand in acquisition-related expenses for 2008 and 2007, respectively. Acquisition expenses for 2008 and 2007 include retention bonuses and data processing costs related to the conversion of computer systems.
We have chosen to participate in the FDIC’s Temporary Liquidity Guarantee Program which allows funds in noninterest-bearing transaction deposit accounts to be fully FDIC-insured. FDIC insurance premiums increased $6.3 million for 2009 compared to 2008 and $2.1 million for 2008 compared to 2007. These increases were due to increased FDIC assessment rates and higher average deposits. In addition, we recorded a special FDIC assessment of $2.3 million during the second quarter of 2009 as the FDIC levied a special assessment to all insured depository institutions totaling five basis points of each institution’s total assets less Tier 1 capital. The special assessment was part of the FDIC’s efforts to rebuild the DIF. In September 2009, the FDIC passed a rule that required all insured depository institutions, with limited exceptions, to prepay their estimated quarterly assessments in December 2009 for the fourth quarter of 2009 and for all of 2010, 2011 and 2012. This prepayment was approximately $23.9 million and will be expensed based on the regular quarterly assessments.
Net losses and carrying costs on other real estate and foreclosed property was $3.1 million for 2009 and $40 thousand for 2008. Losses on other real estate owned and foreclosed property during 2009 were due primarily to increased real estate foreclosures due to weaker economic conditions that have resulted in declines in property values.
Other noninterest expense was $17.8 million for 2009, down $2.2 million from 2008. This decrease can be attributed to our ongoing company-wide expense reduction plan as we have identified additional ways to reduce expenses in areas within the bank, which include consolidating certain banking centers, cutting vendor costs, and eliminating unnecessary service agreements. These actions are all part of building and maintaining a long-term sustainable cost discipline throughout the entire organization. Other noninterest expense was $20.0 million for 2008, up $1.9 million compared to 2007. This increase was due, in part, to three acquisitions completed since March of 2007. In addition, we incurred approximately $800 thousand in Hurricane Ike related expenses during 2008.
If current economic conditions continue or even worsen during 2010, we expect that noninterest expense will increase as a result of net losses and carrying costs on other real estate owned and foreclosed property. We believe any such losses will be offset by the continuation of our company-wide expense reduction plan. We also expect to see benefits in 2010 from some of the noninterest expenses we incurred in 2009 as part of this reduction plan, including lower salary expenses.
34
Table of Contents
Index to Financial Statements
Income Taxes. We recorded a tax benefit of $10.2 million from federal and state income taxes during 2009. We provided $17.4 million and $25.7 million for federal and state income taxes for 2008 and 2007. The effective tax rate for 2009 was 44% reflecting a tax benefit resulting from a net loss and the proportion of nontaxable income relative to total income. The effective tax rates for 2008 and 2007 were approximately 31% and 33%, respectively. The amount of federal income tax and the corresponding effective tax rate is influenced by the amount of taxable income as well as nontaxable income and expense. During 2008 and 2007, we revised our estimate to remove contingent liabilities totaling $619 thousand and $98 thousand, respectively, related to the expiration of previous tax contingencies. These reductions resulted in lower effective tax rates during these periods.
Financial Condition
At December 31, 2009, total assets were $4.9 billion, a decrease of $143 million, or 2.8%, from December 31, 2008. The decrease in total assets was primarily attributable to the $549 million decrease in total loans from December 31, 2008 to December 31, 2009.
Average total assets in 2009 increased $152 million, or 3.1%, from 2008 primarily due to the $201 million increase in average securities from December 31, 2008 to December 31, 2009.
At December 31, 2009, total liabilities were $4.4 billion, a decrease of $40.3 million from December 31, 2008. The decrease in total liabilities was attributable to the $311 million decrease in other borrowed funds which was partially offset by a $276 million increase in total deposits from December 31, 2008 to December 31, 2009.
Average total liabilities for 2009 increased $45.9 million, or 4.1% from 2008. The increase in average total liabilities was attributable to the $384 million increase in average deposits.
Loans Held for Investment. The following table summarizes our loan portfolio by type, excluding loans held for sale, as of December 31 (dollars in thousands):
| 2009 | 2008 | 2007 | 2006 | 2005 | ||||||||||||||||||||||||||
| Amount | % | Amount | % | Amount | % | Amount | % | Amount | % | |||||||||||||||||||||
| Commercial and industrial |
$ | 795,789 | 24.6 | % | $ | 1,093,942 | 28.8 | % | $ | 912,604 | 27.3 | % | $ | 824,494 | 26.8 | % | $ | 738,061 | 27.4 | % | ||||||||||
| Real estate: |
||||||||||||||||||||||||||||||
| Commercial |
1,667,038 | 51.6 | % | 1,763,712 | 46.5 | % | 1,387,014 | 41.5 | % | 1,336,465 | 43.4 | % | 1,221,610 | 45.4 | % | |||||||||||||||
| Construction |
360,444 | 11.1 | % | 545,303 | 14.4 | % | 714,600 | 21.4 | % | 597,985 | 19.4 | % | 438,454 | 16.3 | % | |||||||||||||||
| Residential |
344,807 | 10.7 | % | 309,622 | 8.2 | % | 226,033 | 6.8 | % | 209,163 | 6.8 | % | 190,701 | 7.1 | % | |||||||||||||||
| Consumer/other |
52,124 | 1.6 | % | 63,883 | 1.7 | % | 75,626 | 2.3 | % | 79,642 | 2.6 | % | 72,937 | 2.7 | % | |||||||||||||||
| Foreign loans |
13,071 | 0.4 | % | 15,828 | 0.4 | % | 23,960 | 0.7 | % | 30,096 | 1.0 | % | 29,245 | 1.1 | % | |||||||||||||||
| Total |
$ | 3,233,273 | 100.0 | % | $ | 3,792,290 | 100.0 | % | $ | 3,339,837 | 100.0 | % | $ | 3,077,845 | 100.0 | % | $ | 2,691,008 | 100.0 | % | ||||||||||
At December 31, 2009, loans held for investment were $3.2 billion, a decrease of $559 million or 14.7% over loans held for investment at December 31, 2008. The decline in loans during 2009 was due, in part, to principal reductions in energy, construction and development and nonowner-occupied commercial real estate loans. These loans decreased 41%, 34% and 5%, respectively, for 2009 compared to the prior year. These decreases were due to our decision to reduce our exposure to these types of loans, and slowing demand resulting from customer decisions to defer new projects, reduce inventory positions, and pay down lines of credit. At December 31, 2008, loans held for investment were $3.8 billion, an increase of $452 million or 13.5% over loans held for investment at December 31, 2007. Loans held for investment acquired as a result of the First Horizon branch acquisition on February 8, 2008 totaled $54.6 million. In addition, due to current market conditions, $112 million of loans classified as held for sale at December 31, 2007, were transferred into the held for investment classification in 2008. The remaining increase during 2008 in loans was due to internal loan growth.
During the fourth quarter of 2008, we reclassified certain construction and development loans in order to more precisely reflect our loan classifications based on their most current status. Based on our review, we reclassified
35
Table of Contents
Index to Financial Statements
approximately $200 million from construction and development loans into the commercial real estate and residential real estate loan categories of approximately $180 million and $20 million, respectively. These loans were classified as construction and development loans before the construction was completed and had not been adjusted to reflect the change in status on the loan.
Our primary lending focus is commercial loans and owner-occupied real estate loans to businesses with annual revenues of $100 million or less. Typically, our customers have financing requirements between $50 thousand and $5 million. The Bank’s legal lending limit was $106 million at December 31, 2009 and was not exceeded by any single loan relationship. At December 31, 2009, commercial real estate loans and commercial and industrial loans were 51.6% and 24.6%, respectively, of loans held for investment. At December 31, 2008, commercial real estate loans and commercial and industrial loans were 46.5% and 28.8%, respectively, of loans held for investment.
We make commercial loans primarily to small and medium-sized businesses and to professionals. Our commercial loan products include revolving lines of credit, letters of credit, working capital loans, loans to finance accounts receivable and inventory and equipment finance leases. Commercial loans typically have floating rates of interest and are for varying terms (generally not exceeding three years). In most instances, these loans are personally guaranteed by the business owner and are secured by accounts receivable, inventory and/or other business assets. In addition to the commercial loans secured solely by non-real estate business assets, we make commercial loans that are secured by owner-occupied real estate, as well as other business assets.
Commercial mortgage loans are often secured by first liens on real estate, typically have floating interest rates, and are most often amortized over a 15-year period with balloon payments due at the end of three to five years. In underwriting commercial mortgage loans, we give consideration to the property’s operating history, future operating projections, current and projected occupancy, location and physical condition. The underwriting analysis also includes credit checks, appraisals and a review of the financial condition of the borrower.
We also make loans to finance the construction of residential and nonresidential properties, such as retail shopping centers and commercial office buildings. Generally, construction loans are secured by first liens on real estate and have floating interest rates. We conduct periodic inspections, either directly or through an architect or other agent, prior to approval of periodic draws on these loans. Underwriting guidelines similar to those described above are also used in our construction lending activities. Construction and development loans were $360 million at December 31, 2009, a decrease of $185 million since December 31, 2008. This decrease was due to lower customer demand and our efforts to reduce our exposure to those types of loans in the current environment.
The following table summarizes our commercial, construction and multifamily residential real estate loan portfolios, excluding foreign loans, by the type of property securing the credit (dollars in thousands). Multifamily residential real estate is included in the residential mortgage real estate loan category.
| Property type: |
||||||
| Office and office warehouse |
$ | 427,215 | 20.7 | % | ||
| Retail |
358,842 | 17.3 | % | |||
| Acquisition and land development |
227,510 | 11.0 | % | |||
| Hospitality |
303,097 | 14.7 | % | |||
| 1-4 family |
78,518 | 3.8 | % | |||
| Industrial warehouse |
84,194 | 4.1 | % | |||
| Multfamily residential |
54,964 | 2.7 | % | |||
| Other |
534,130 | 25.7 | % | |||
| Total |
$ | 2,068,470 | 100.0 | % | ||
The Bank makes automobile, boat, home improvement and other loans to consumers. These loans are primarily made to customers who have other business relationships with us.
36
Table of Contents
Index to Financial Statements
The following table presents loan maturities of the total loan portfolio excluding residential mortgage and consumer loans at December 31, 2009 (in thousands). The table also presents the portion of loans that have fixed interest rates or variable interest rates that reprice at various intervals over the life of the loan.
| Due in One Year or Less |
Due After One Year Through Five Years |
Due After Five Years |
Total | |||||||||
| Commercial and industrial |
$ | 539,736 | $ | 212,706 | $ | 43,347 | $ | 795,789 | ||||
| Real estate—commercial |
225,121 | 804,373 | 637,544 | 1,667,038 | ||||||||
| Real estate—construction |
165,090 | 120,225 | 75,129 | 360,444 | ||||||||
| Foreign loans |
8,825 | 1,486 | 2,522 | 12,833 | ||||||||
| Total loans |
$ | 938,772 | $ | 1,138,790 | $ | 758,542 | $ | 2,836,104 | ||||
| Loans with a fixed interest rate |
$ | 187,065 | $ | 779,227 | $ | 212,914 | $ | 1,179,206 | ||||
| Loans with a floating interest rate |
751,707 | 359,563 | 545,628 | 1,656,898 | ||||||||
| Total loans |
$ | 938,772 | $ | 1,138,790 | $ | 758,542 | $ | 2,836,104 | ||||
As of December 31, 2009, there was no concentration of loans to any one type of industry exceeding 10% of total loans nor were there any loans classified as highly leveraged transactions. Our largest concentrations are in our hospitality and energy portfolios.
At December 31, 2009, our hospitality portfolio totaled $303 million which represents approximately 9.3% of total loans held for investment up from $284 million or 7.4% of total loans held for investment at December 31, 2008. The hospitality industry is a several billion dollar industry that primarily depends on the availability of leisure time and disposable income as well as business activity. The majority of the portfolio consists of mid-priced hotels and motels, most of which are nationally flagged properties in major Metropolitan Statistical Areas. There are no resort-type or luxury properties included within this portfolio. In underwriting these property types, appraisals provide valuation for lending purposes of land and buildings only. Although no new loans were added to the portfolio during 2009, there were some properties that were in the construction phase during the year, resulting in an increase in the outstanding loans at December 31, 2009.
At December 31, 2009, our energy lending portfolio totaled $262 million at December 31, 2009, which represents 8.1% of total loans held for investment down from $442 million or 11.7% of total loans held for investment at December 31, 2008. This reduction in energy loans as a percentage of our total loans was a result of our concerted effort to reduce our energy loan portfolio to within our internal industry concentration guidelines during 2009. The petroleum industry is usually divided into three major components: upstream, midstream and downstream. The upstream oil sector is a term commonly used to refer to the searching for and the recovery and production of crude oil and natural gas. The upstream oil sector is also known as the exploration and production sector. The composition of the collateral of our upstream energy portfolio, at December 31, 2009, consists of 52% gas reserves and 48% oil reserves. These reserve-based loans represent approximately 70% of our energy portfolio. Our remaining energy portfolio consists of well-secured loans to companies that would be classified as midstream energy companies. A midstream energy company is a company that processes and transports crude oil and natural gas. The energy lending group participates in shared national credits which are defined by banking regulators as credits of more than $20.0 million and with three or more non-affiliated banks as participants. The energy lending group is the only group that consistently participates in shared national credits.
Our Capital Markets and SBA group originated, co-originated or purchased first-lien, commercial real estate mortgage loans referred by other financial institutions nationwide. This loan portfolio consists of $359 million in commercial real estate with collateral outside of Texas, with $111 million in California. The average-sized loan within this portfolio is $1.0 million with the largest loan being approximately $4.0 million. Over half of these
37
Table of Contents
Index to Financial Statements
loans are secured by owner-occupied facilities. These loans generally have low loan-to-value ratios (below 60%) and approximately 50% of these loans have a U.S. Small Business Administration second lien behind our first lien. The loans without SBA second liens were underwritten with similar collateral and equity requirements. We utilize real estate appraisers familiar with the geographic region in which the property is located in evaluating all loans. These appraisals are reviewed by a third-party appraisal review vendor for accuracy and compliance with our underwriting standards and banking regulations. We have not originated these types of loans since early 2008 as market conditions for these types of loans began to change. We saw deterioration in this portfolio in 2009 as $33.1 million of loans at December 31, 2009, of which $9.9 million were classified as held for sale, were nonperforming up from $16.0 million at December 31, 2008. As a result of this deterioration, we charged-off approximately $18.0 million against the allowance for credit losses associated with this loan portfolio during 2009. This portfolio also includes $34.1 million in loans that were classified as restructured-accruing at December 31, 2009 and an additional $16.0 million were 30 to 89 days past due as of December 31, 2009.
The following table summarizes our out-of-state capital markets and SBA commercial real estate loan portfolio by the type of property securing the credit. Property type concentrations are stated as a percentage of year-end total capital markets and SBA commercial real estate loans as of December 31, 2009 (dollars in thousands):
| Property type: |
||||||
| Office and office warehouse |
$ | 87,946 | 24.5 | % | ||
| Retail |
68,865 | 19.2 | % | |||
| Hospitality |
86,709 | 24.1 | % | |||
| Industrial warehouse |
25,323 | 7.0 | % | |||
| Multfamily residential |
4,888 | 1.4 | % | |||
| Other |
85,502 | 23.8 | % | |||
| Total |
$ | 359,233 | 100.0 | % | ||
At December 31, 2009, loans held for investment were 79.0% of deposits and 65.5% of total assets. Loans held for investment were 99.3% of deposits and 74.7% of total assets at December 31, 2008.
We expect loan growth to continue to be a challenge in 2010. Accordingly, we are anticipating total loans to decline by approximately 3% to 5% in 2010. We expect to see a decrease in nonowner-occupied commercial real estate and construction and development loans due to lower customer demand and our efforts to adjust our loan mix. We intend to grow mortgage, consumer, commercial and industrial and owner-occupied commercial real estate loans in 2010. Additionally, we expect total energy loans to stabilize in 2010 and do not expect the significant decrease that we experienced during 2009 within that portfolio.
Loans Held for Sale. Loans held for sale totaled $11.8 million at December 31, 2009, as compared with $1.5 million at December 31, 2008. Loans held for sale at December 31, 2009, consist of $10.8 million commercial real estate and $1.0 million of residential mortgage loans. Loans are classified as held for sale when management has positively determined that the loans will be sold in the foreseeable future and we have the ability to do so. The classification may be made upon origination or subsequent to the origination or purchase. Once a decision has been made to sell loans not previously classified as held for sale, such loans are transferred into the held for sale classification and carried at the lower of cost or fair value.
During the third quarter of 2009, management transferred $20.9 million in net book value commercial real estate loans from our national SBA/commercial real estate portfolio to held for sale. Management charged-off a portion of these loans against the related allowance for credit losses upon reclassification. We sold $8.4 million of the loans in the fourth quarter of 2009 resulting in a net loss of $1.4 million. Of the remaining $10.8 million commercial real estate loans classified as held for sale as of December 31, 2009, $9.9 million were considered nonperforming loans. In addition, during the third quarter of 2009, we also transferred a $16 million energy relationship to held for sale as management had entered into a definitive agreement to sell these loans. For additional information refer to the noninterest income previous discussion regarding the details of this sale during the fourth quarter of 2009.
38
Table of Contents
Index to Financial Statements
During the years ended December 31, 2008 and 2007, the Company sold approximately $10.3 million and $45.5 million, respectively, of performing commercial real estate loans that were originally acquired as held for investment. These sales resulted in net gains of $203 thousand and $1.4 million during 2008 and 2007, respectively. These loans were sold as part of the Company’s ongoing management of the size, concentrations and risk profile of the loan portfolio.
Securities. The carrying amount of securities we held at December 31 is shown below (dollars in thousands):
| 2009 | 2008 | 2007 | ||||||||||||||||
| Amount | % | Amount | % | Amount | % | |||||||||||||
| Available-for-Sale |
||||||||||||||||||
| Obligations of the U.S. Treasury and other U.S. government agencies |
$ | 56,487 | 6.7 | % | $ | 1,774 | 0.3 | % | $ | 11,601 | 2.4 | % | ||||||
| Obligations of states of the U.S. and political subdivisions |
1,270 | 0.2 | % | 1,358 | 0.2 | % | 1,714 | 0.4 | % | |||||||||
| Mortgage-backed securities and collateralized mortgage obligations |
774,012 | 91.4 | % | 616,028 | 97.3 | % | 448,779 | 94.1 | % | |||||||||
| Other securities |
14,447 | 1.7 | % | 14,197 | 2.2 | % | 14,596 | 3.1 | % | |||||||||
| Total |
$ | 846,216 | 100.0 | % | $ | 633,357 | 100.0 | % | $ | 476,690 | 100.0 | % | ||||||
| Held-to-Maturity |
||||||||||||||||||
| Obligations of states of the U.S. and political subdivisions |
$ | 101,091 | 45.4 | % | $ | 95,910 | 55.7 | % | $ | 96,593 | 53.6 | % | ||||||
| Mortgage-backed securities and collateralized mortgage obligations |
121,754 | 54.6 | % | 76,129 | 44.3 | % | 83,493 | 46.4 | % | |||||||||
| Total |
$ | 222,845 | 100.0 | % | $ | 172,039 | 100.0 | % | $ | 180,086 | 100.0 | % | ||||||
At December 31, 2009, securities totaled $1.1 billion, an increase of $264 million, or 32.7%, from $805 million at December 31, 2008. We increased securities as a percentage of interest-earning assets to further diversify our interest-earning asset portfolio and further utilize excess liquidity. We made this decision in part to support our interest income stream in light of the economic conditions having a negative impact on our interest earnings from our loan portfolio. These securities represented 21.7% and 15.9% of total assets as of December 31, 2009 and 2008, respectively.
Net unrealized gains on the available-for-sale securities were $12.3 million at December 31, 2009 as compared to $6.2 million at December 31, 2008.
39
Table of Contents
Index to Financial Statements
The carrying amount of securities at December 31, 2009, by contractual maturity is shown below (dollars in thousands):
| Due in One Year or Less |
Due after One Year through Five Years |
Due After Five Years through Ten Years |
Due After Ten Years |
Total | |||||||||||||||||||||||
| Amount | Weighted Average Yield |
Amount | Weighted Average Yield |
Amount | Weighted Average Yield |
Amount | Weighted Average Yield |
||||||||||||||||||||
| Available-for-Sale |
|||||||||||||||||||||||||||
| Obligations of the U.S. |
$ |
32,457 |
2.64 |
% |
$ |
24,030 |
3.02 |
% |
$ |
— |
— |
|
$ |
— |
— |
|
$ |
56,487 | |||||||||
| Obligations of states of the U.S. and political subdivisions |
361 | 4.99 | % | 909 | 4.04 | % | — | — | — | — | 1,270 | ||||||||||||||||
| Mortgage-backed securities and collateralized mortgage obligations |
31,599 | 4.91 | % | 525,043 | 3.94 | % | 183,541 | 3.81 | % | 33,829 | 3.20 | % | 774,012 | ||||||||||||||
| Other securities |
14,447 | 4.34 | % | — | — | — | — | — | — | 14,447 | |||||||||||||||||
| Total |
$ | 78,864 | 3.87 | % | $ | 549,982 | 3.90 | % | $ | 183,541 | 3.81 | % | $ | 33,829 | 3.20 | % | $ | 846,216 | |||||||||
| Held-to-Maturity |
|||||||||||||||||||||||||||
| Obligations of states of the U.S. and political subdivisions |
$ | 11,946 | 3.30 | % | $ | 48,342 | 3.61 | % | $ | 32,714 | 3.72 | % | $ | 8,089 | 3.88 | % | $ | 101,091 | |||||||||
| Mortgage-backed securities and collateralized mortgage obligations |
1,061 | 3.19 | % | 31,065 | 3.92 | % | 4,661 | 3.29 | % | 84,967 | 3.91 | % | 121,754 | ||||||||||||||
| Total |
$ | 13,007 | 3.30 | % | $ | 79,407 | 3.73 | % | $ | 37,375 | 3.67 | % | $ | 93,056 | 3.91 | % | $ | 222,845 | |||||||||
The tax equivalent book yield on our securities portfolio for 2009 was 4.0%. The weighted-average life of the portfolio was approximately 4.1 years, and the modified duration was approximately 3.6 years at December 31, 2009. The tax equivalent book yield on our securities portfolio for 2008 and 2007 was 4.9% and 4.6%, respectively. The weighted-average life of the portfolio was approximately 3.6 years, and the modified duration was approximately 3.0 years at December 31, 2008.
We did not own the securities of any one issuer (other than the U.S. government and its agencies) of which the aggregate adjusted cost exceeded 10% of consolidated shareholders’ equity at December 31, 2009.
We review investment securities on an ongoing basis for the presence of OTTI with formal reviews performed quarterly. Net OTTI losses on individual investment securities are recognized as a realized loss through earnings when it is more likely than not that we will not collect all of the contractual cash flows or we are unable to hold the securities to recovery.
For debt securities that are considered other-than-temporarily impaired and that we do not intend to sell and will not be required to sell prior to recovery of our amortized cost basis, we separate OTTI into the amount that is credit-related and the amount that is due to all other factors. The credit loss component is recognized in earnings and is the difference between a security’s amortized cost basis and the present value of expected future cash flows discounted at the security’s effective interest rate. The amount due to all other factors is recognized in other comprehensive income.
During the second quarter of 2009, we recorded a $2.7 million OTTI on one held-to-maturity CMO security which included $14.0 thousand of credit-related OTTI and $2.7 million recorded directly to other comprehensive income for the noncredit-related impairment amount. During the second half of 2009 this security was further downgraded to a CC rating. The continued credit deterioration of this security combined with an increase in the number and amount of other below investment grade securities within our securities portfolio contributed to our decision to sell this security during the fourth quarter of 2009.
40
Table of Contents
Index to Financial Statements
During the fourth quarter of 2009, the Bank sold five private-label CMO’s that were classified as held-to-maturity resulting in a total realized loss of $7.1 million. The decision to sell these securities in 2009 was due to the significant credit downgrading of the securities which caused these securities to be classified as “substandard” assets by management. The credit rating on these securities declined from primarily AAA ratings in 2008 to credit ratings ranging from B3 to CC in 2009. Throughout 2009, we monitored these securities noting a significant decline in the credit ratings in under a year. In addition, the underlying performance of these securities had continued to deteriorate as delinquencies continued to increase. Given these credit downgrades, the current economic uncertainty along with the increasing levels of delinquencies being reported for all residential mortgage loans, we believed there was additional risk associated with holding these securities until maturity. These securities had a carrying value of $24.1 million at the time of sale.
During the fourth quarter of 2009, we also sold $96.0 million of our available-for-sale securities portfolio for a gain of $5.3 million. These securities were sold as part of our ongoing portfolio management.
We intend to incrementally and opportunistically add to the securities portfolio in order to further utilize excess liquidity in 2010.
Deposits. Our lending and investing activities are funded primarily by deposits, approximately 79% of which were core deposits at December 31, 2009. Core deposits exclude brokered deposits and time deposits over $100,000. These “jumbo” deposits are characteristically more sensitive to changes in interest rates and, thus we do not consider these a part of our core funding.
Total deposits as of December 31, 2009 increased $276 million to $4.1 billion, up 7.2% compared to $3.8 billion at December 31, 2008. The increase in deposits was primarily concentrated in our interest-bearing demand deposits which increased $481 million or 31.5% for 2009 compared to 2008. The growth in interest-bearing demand deposits was due in part to the addition of our corresponding banking group which was added in 2007, as well as growth in our high-yield money market accounts. The growth in interest-bearing demand deposits was offset by a decrease in certificates of deposits which decreased $225 million or 19.2% for 2009 compared to 2008. Approximately 72.1% of deposits at December 31, 2009 were interest-bearing. The percentage of interest-bearing demand and noninterest-bearing demand deposits to total deposits as of December 31, 2009 was 49.0% and 27.9%, respectively, and our loan to deposit ratio at December 31, 2009 was 79.2%.
The average balances and weighted average rates paid on deposits for each of the past three years ended December 31 are presented below (dollars in thousands):
| 2009 | 2008 | 2007 | ||||||||||||||||
| Average Balance |
Average Rate |
Average Balance |
Average Rate |
Average Balance |
Average Rate |
|||||||||||||
| Noninterest-bearing demand deposits |
$ | 1,132,469 | $ | 1,086,727 | $ | 1,080,099 | ||||||||||||
| Interest-bearing demand and savings deposits |
1,757,306 | 0.91 | % | 1,416,594 | 1.22 | % | 1,304,168 | 2.24 | % | |||||||||
| Time deposits |
916,972 | 2.33 | % | 978,579 | 3.46 | % | 1,065,147 | 4.72 | % | |||||||||
| Brokered certificates of deposit |
188,083 | 1.43 | % | 129,156 | 2.79 | % | 126,246 | 4.31 | % | |||||||||
| Total deposits |
$ | 3,994,830 | 1.40 | % | $ | 3,611,056 | 2.17 | % | $ | 3,575,660 | 3.40 | % | ||||||
Average total deposits increased $384 million in 2009 compared to 2008. The increase during 2009 was due to internal deposit growth. The changes in deposit mix and interest rates decreased the average cost of funds for deposits by 77 basis points in 2009.
Average total deposits increased $35.4 million in 2008 compared to 2007. The increase during 2008 was primarily attributable to the deposits acquired in the First Horizon branch acquisition on February 8, 2008. The changes in deposit mix and interest rates decreased the average cost of funds for deposits by 123 basis points in 2008.
41
Table of Contents
Index to Financial Statements
Average brokered certificates of deposit totaled $188 million in 2009, $129 million in 2008 and $126 million in 2007. We utilize brokered deposits together with other borrowed funds as a source of funding for our lending and investment activities.
The maturities of time deposits of $100 thousand or more at December 31, 2009 are shown below (in thousands):
| Three months or less |
$ | 327,371 | |
| Over three through six months |
85,486 | ||
| Over six through twelve months |
170,870 | ||
| Thereafter |
51,977 | ||
| $ | 635,704 | ||
In 2010, we will continue to focus on adjusting our deposit mix and interest rates to decrease our cost of funds. We anticipate continuing to grow our noninterest-bearing and interest-bearing demand deposit base while maintaining our time deposits and brokered certificates of deposits, assuming that economic conditions in 2010 permit us to do so while continuing to maintain a strong deposit franchise. While we anticipate being able to grow deposits in 2010, our successes will greatly depend upon our competition, the behavior of the economy and the overall interest rate environment. We will continue to strive to strengthen and build our customer relationships, including encouraging all of our customers to use Sterling Bank as their primary depository institution.
Other Borrowed Funds. Deposits are the primary source of funds for our lending, investment and general business activities. Details of other borrowed funds are as follows (dollars in thousands):
| For the Year Ended December 31, | ||||||||||||
| 2009 | 2008 | 2007 | ||||||||||
| Federal Home Loan Bank advances |
||||||||||||
| Balance outstanding at period-end |
$ | 40,500 | $ | 212,500 | $ | 187,500 | ||||||
| Weighted average interest rate at period-end |
2.95 | % | 0.79 | % | 2.91 | % | ||||||
| Maximum outstanding at any month-end |
$ | 222,500 | $ | 638,000 | $ | 190,000 | ||||||
| Daily average balance |
68,396 | 435,804 | 104,338 | |||||||||
| Weighted average interest rate for the period |
2.15 | % | 2.21 | % | 5.05 | % | ||||||
| Repurchase agreements |
||||||||||||
| Balance outstanding at period-end |
$ | 55,695 | $ | 59,936 | $ | 422 | ||||||
| Weighted average interest rate at period-end |
0.00 | % | 1.04 | % | 2.50 | % | ||||||
| Maximum outstanding at any month-end |
$ | 61,967 | $ | 67,288 | $ | 5,055 | ||||||
| Daily average balance |
59,583 | 51,129 | 1,383 | |||||||||
| Weighted average interest rate for the period |
0.27 | % | 1.79 | % | 1.99 | % | ||||||
| Federal funds purchased |
||||||||||||
| Balance outstanding at period-end |
$ | 1,050 | $ | 36,150 | $ | 9,225 | ||||||
| Weighted average interest rate at period-end |
0.25 | % | 0.50 | % | 4.40 | % | ||||||
| Maximum outstanding at any month-end |
$ | 46,325 | $ | 80,200 | $ | 36,225 | ||||||
| Daily average balance |
28,390 | 47,828 | 28,627 | |||||||||
| Weighted average interest rate for the period |
0.39 | % | 2.11 | % | 5.35 | % | ||||||
| Treasury Auction Facility |
||||||||||||
| Balance outstanding at period-end |
$ | — | $ | 100,000 | $ | — | ||||||
| Weighted average interest rate at period-end |
0.00 | % | 0.42 | % | — | |||||||
| Maximum outstanding at any month-end |
$ | 150,000 | $ | 100,000 | $ | — | ||||||
| Daily average balance |
51,397 | 7,650 | — | |||||||||
| Weighted average interest rate for the period |
0.30 | % | 0.42 | % | — | |||||||
42
Table of Contents
Index to Financial Statements
As of December 31, 2009, we had $97.2 million in other borrowings compared to $409 million at December 31, 2008, a decrease of $311 million. This decline in borrowings was the result of an increase in total deposits. Our primary source of other borrowings is the Federal Home Loan Bank (“FHLB”). These borrowings are collateralized by mortgage loans, certain pledged securities, FHLB stock and any funds on deposit with the FHLB. FHLB advances are available to Sterling Bank under a security and pledge agreement. At December 31, 2009, we had total funds of $1.2 billion available under this agreement of which $40.5 million was outstanding with an average interest rate of 2.95%. At December 31, 2009, we had $40.0 million of FHLB advances that mature in eight years and $500 thousand of FHLB advances with a remaining maturity of less than one year. We utilize these borrowings to meet liquidity needs. Maturing advances are replaced by drawing on available cash, making additional borrowings or through increased customer deposits.
Securities sold under agreements to repurchase represent the purchase of interests in securities by banking customers and structured repurchase agreements with other financial institutions. At December 31, 2009 and 2008, we had securities sold under agreements to repurchase with banking customers of $5.7 million and $9.9 million, respectively. Structured repurchase agreements totaled $50.0 million at December 31, 2009 and 2008, and consisted of agreements with two separate financial institutions totaling $25.0 million, each that will mature in 2015. These repurchase agreements bear interest at a rate equal to LIBOR less 100 basis points and reset quarterly until the first quarter of 2010 at which time the rate will become fixed at 3.88% and 3.50%, respectively. The rate on these repurchase agreements was zero at December 31, 2009. The rate on these repurchase agreements was 1.22% and 0.87%, respectively, at December 31, 2008.
Treasury Auction Facilities (“TAF”) are term funds auctioned to depository institutions by the Federal Reserve Board. Each TAF auction is for a fixed amount, with the rate determined by the auction process (subject to a minimum bid rate). All advances must be fully collateralized. At December 31, 2009, there were no TAF borrowings outstanding. At December 31, 2008, we had $100 million of TAF borrowings outstanding at a rate 0.42%.
We have federal funds purchased at correspondent banks that typically mature within one to 90 days. As of December 31, 2009 and 2008, federal funds outstanding with correspondent banks were $1.1 million and $36.2 million, respectively, and payable upon demand.
Junior Subordinated Debt/Company Obligated Mandatorily Redeemable Trust Preferred Securities. As of December 31, 2009, we had the following issues of trust preferred securities outstanding and junior subordinated debt owed to trusts (dollars in thousands):
| Description |
Issuance Date | Trust Preferred Securities Outstanding |
Interest Rate |
Junior Subordinated Debt Owed To Trusts |
Final Maturity Date | |||||||
| Statutory Trust One |
August 30, 2002 | $ | 20,000 | 3-month LIBOR plus 3.45% |
$ | 20,619 | August 30, 2032 | |||||
| Capital Trust III |
September 26, 2002 | 31,250 | 8.30% Fixed | 32,217 | September 26, 2032 | |||||||
| BOTH Capital Trust I |
June 30, 2003 | 4,000 | 3-month LIBOR plus 3.10% |
4,124 | July 7, 2033 | |||||||
| Capital Trust IV |
March 26, 2007 | 25,000 | 3-month LIBOR plus 1.60% |
25,774 | June 15, 2037 | |||||||
| Total |
$ | 80,250 | $ | 82,734 | ||||||||
Each of the trusts is a statutory business trust organized for the sole purpose of issuing trust securities and investing the proceeds thereof in junior subordinated debentures of Sterling Bancshares. The preferred trust securities of each trust represent preferred beneficial interests in the assets of the respective trusts and are subject to mandatory redemption upon payments of the junior subordinated debentures held by the trust. The common
43
Table of Contents
Index to Financial Statements
securities of each trust are wholly-owned by Sterling Bancshares. Each trust’s ability to pay amounts due on the trust preferred securities is solely dependent upon Sterling Bancshares making payments on the related junior subordinated debentures. Sterling Bancshares’ obligations under the junior subordinated debentures and other relevant trust agreements, in aggregate, constitute a full and unconditional guarantee by Sterling Bancshares of each respective trust’s obligations under the trust securities issued by each respective trust.
Each issuance of trust preferred securities outstanding is mandatorily redeemable 30 years after issuance and is callable beginning five years after issuance if certain conditions are met (including the receipt of appropriate regulatory approvals). The trust preferred securities may be prepaid earlier upon the occurrence and continuation of certain events including a change in their tax status or regulatory capital treatment. In each case, the redemption price is equal to 100% of the face amount of the trust preferred securities, plus the accrued and unpaid distributions thereon through the redemption date.
Trust preferred securities are included in the Company’s Tier 1 capital for regulatory capital purposes pursuant to guidance from the Federal Reserve.
Subordinated Debt. In April 2003, we raised approximately $50.0 million through a private offering of subordinated unsecured notes. These subordinated notes bear interest at a fixed rate of 7.375% and mature on April 15, 2013. Interest payments are due semi-annually. The subordinated notes may not be redeemed or called prior to their maturity. Debt issuance costs of approximately $1.0 million are being amortized over the ten-year term of the notes on a straight-line basis. In June 2003, we entered into an interest rate swap agreement in which the Bank swapped the fixed rate to a floating rate. Under the terms of the swap agreement, we receive a fixed coupon rate of 7.375% and pay a variable interest rate equal to the three-month LIBOR that is reset on a quarterly basis, plus 3.62%. This swap is designated as a fair-value hedge that qualifies for the “shortcut method” of accounting. If the swap were to become ineffective the change in the fair value would be reflected in our statement of income.
On June 30, 2008, the Bank entered into a subordinated note in the aggregate principal amount of $25.0 million. The subordinated note bears interest at a rate equal to LIBOR plus 2.50% and will be reset quarterly. The unpaid principal balance plus all accrued and unpaid interest on the subordinated debt shall be due and payable on September 15, 2018. The Bank may prepay the subordinated debt without penalty on any interest payment date on or after September 15, 2013.
Asset Quality
Risk Elements. We have several systems and procedures in place to assist in managing the overall quality of the loan portfolio. In addition to established underwriting guidelines and approval processes, we monitor delinquency levels for any negative or adverse trends. We also perform reviews of the loan portfolios on a regular basis to identify troubled loans and to assess their overall probability of collection.
Ongoing portfolio reviews are conducted by our internal loan review department under an established loan review program. We target a loan review penetration of at least 60-70% annually of the total commercial and real estate loan portfolios.
Through the loan review process, we maintain an internally classified loan list, which, along with the delinquency list of loans, helps us assess the overall quality of the loan portfolios and the adequacy of the allowance for credit losses. Loans on this list are classified as substandard, doubtful or loss based on probability of repayment, collateral valuation and related collectability.
Loans classified as “substandard” have clear and defined weaknesses such as highly leveraged positions, unfavorable financial ratios, uncertain repayment sources or poor financial condition, which may jeopardize the loan’s recoverability. Loans classified as “doubtful” have characteristics similar to substandard loans but with an increased risk that a loss may occur or that at least a portion of the loan may require a charge-off if liquidated at
44
Table of Contents
Index to Financial Statements
present. Although loans classified as substandard do not duplicate loans classified as doubtful, both substandard and doubtful loans include some loans that are delinquent at least 30 days or are on nonaccrual status. Loans classified as “loss” are those loans that are in the process of being charged off.
Our classified loan list is also used to identify loans that are considered nonperforming. Nonperforming loans are loans which have been categorized by management as nonaccrual because collection of interest is doubtful. Our nonperforming and past due loans are substantially collateralized by assets, with any excess of loan balances over collateral values specifically allocated in the allowance for loan losses. On an ongoing basis, we receive updated appraisals on loans secured by real estate, particularly those categorized as nonperforming loans and potential problem loans. In those instances where updated appraisals reflect reduced collateral values, an evaluation of the borrower’s overall financial condition is made within a short time following receipt of the appraisal to determine the need, if any, for possible write-downs or appropriate additions to the allowance for loan losses.
Potential problem loans are substandard loans that are not considered nonperforming but where information known by management indicates that the borrower may be unable to comply with the present terms.
In cases where a borrower experiences financial difficulty but is current on their payments and we make certain concessionary modifications to contractual terms, the loan is classified as a restructured-accruing loan. Most restructured-accruing loans are the result of providing certain borrowers a temporary reduction in their payments for a three to six month period. These reductions are generally in the form of a partial or interest only payment. We typically do not extend payment maturities, reduce interest rates or forgive principal or interest.
If management determines that it is in the best interest of the Company and the borrower, it will restructure a loan that has already been classified as nonaccrual. Nonaccrual loans that are restructured remain on nonaccrual for a period of at least six months to demonstrate that the borrower can meet the restructured terms. However, performance prior to the restructuring, or significant events that coincide with the restructuring, are included in assessing whether the borrower can meet the new terms and may result in the loan being returned to accrual at the time of restructuring or after a shorter performance period. If the borrower’s ability to meet the revised payment schedule is uncertain, the loan remains classified as a nonaccrual loan.
In addition to the internally classified loan list and delinquency list of loans, we maintain a separate “watch list” which further aids in monitoring the loan portfolios. Watch list loans show warning elements, deficiencies that require attention in the short run, or where pertinent ratios of the loan account have weakened to a point where more frequent monitoring is warranted. These loans do not have all the characteristics of a classified loan (substandard or doubtful) but do show weakened elements as compared with those of a satisfactory credit.
45
Table of Contents
Index to Financial Statements
Nonperforming assets consisted of the following (in thousands):
| 2009 | 2008 | 2007 | 2006 | 2005 | ||||||||||||||||
| Nonperforming loans: |
||||||||||||||||||||
| Loans held for sale: |
||||||||||||||||||||
| Real estate: |
||||||||||||||||||||
| Commercial |
$ | 9,896 | $ | — | $ | — | $ | — | $ | — | ||||||||||
| Total loans held for sale |
9,896 | — | — | — | — | |||||||||||||||
| Loans held for investment: |
||||||||||||||||||||
| Commercial and industrial |
5,832 | 35,855 | 7,903 | 5,156 | 6,323 | |||||||||||||||
| Real estate: |
||||||||||||||||||||
| Commercial |
62,363 | 36,953 | 8,221 | 4,252 | 10,517 | |||||||||||||||
| Construction |
12,398 | 8,706 | 1,887 | 424 | 1,319 | |||||||||||||||
| Residential |
11,778 | 5,607 | 1,825 | 1,163 | 3,129 | |||||||||||||||
| Consumer/other |
297 | 370 | 378 | 392 | 553 | |||||||||||||||
| Loans held for investment |
92,668 | 87,491 | 20,214 | 11,387 | 21,841 | |||||||||||||||
| Total nonperforming loans |
102,564 | 87,491 | 20,214 | 11,387 | 21,841 | |||||||||||||||
| Foreclosed assets: |
||||||||||||||||||||
| Real estate acquired by foreclosure |
16,763 | 5,625 | 3,683 | 1,465 | 460 | |||||||||||||||
| Other repossessed assets |
38 | 154 | 152 | 404 | 137 | |||||||||||||||
| Total foreclosed assets |
16,801 | 5,779 | 3,835 | 1,869 | 597 | |||||||||||||||
| Total nonperforming assets |
$ | 119,365 | $ | 93,270 | $ | 24,049 | $ | 13,256 | $ | 22,438 | ||||||||||
| Restructured-accruing |
$ | 69,857 | $ | — | $ | — | $ | — | $ | — | ||||||||||
| Accruing loans past due 90 days or more |
$ | 41 | $ | 8,448 | $ | 1,304 | $ | 2,731 | $ | 162 | ||||||||||
| Nonperforming loans to period-end loans |
3.16 | % | 2.31 | % | 0.59 | % | 0.36 | % | 0.81 | % | ||||||||||
| Nonperforming assets to period-end assets |
2.42 | % | 1.84 | % | 0.53 | % | 0.32 | % | 0.60 | % | ||||||||||
Nonperforming assets were $119 million at December 31, 2009, compared to $93.3 million at December 31, 2008. Nonperforming loans at December 31, 2008, included loans related to SemGroup, an energy customer that was in the process of going through Chapter 11 bankruptcy. Total exposure to SemGroup at December 31, 2008, totaled $29.2 million, and represented approximately 35% of our total nonperforming loans. The loans associated with this relationship were sold during the fourth quarter of 2009. A discussion of this relationship is included in the section captioned “Allowance for Credit Losses” below. Excluding the SemGroup relationship, nonaccrual loans increased $44.3 million at December 31, 2009 compared to 2008. The largest of these loans is an $8.0 million multi-use land development loan that is not performing as agreed. The increase in nonperforming assets during 2009 was due to weakness in most types of commercial real estate due to the slowdown in the economy.
Foreclosed assets represent property acquired as the result of borrower defaults on loans. Foreclosed assets are recorded at estimated fair value, less estimated selling costs, at the time of foreclosure. Write-downs occurring at foreclosure are charged against the allowance for possible loan losses. Real estate acquired by foreclosure was $16.8 million at December 31, 2009, an increase of $11.1 million compared to December 31, 2008. Approximately, $13.0 million of real estate acquired by foreclosure was related to commercial income producing property. We expect to transition more nonperforming loans into foreclosed assets over the next few quarters as we should have continued success in gaining control of collateral through foreclosure and then selling the real estate.
Potential problem loans were $188 million at December 31, 2009 compared to $83.3 million at December 31, 2008. The increase in potential problem loans during 2009 is due to the efforts of our credit administration, loan
46
Table of Contents
Index to Financial Statements
review, and special assets groups – as well as all of our lending personnel, to identify and remove problem credits from our portfolio. The largest increase in potential problem loans is related to three borrowers with loans totaling $51.0 million. The outstanding balance of these loans was reduced by $13.5 million, subsequent to December 31, 2009, due to payments received. These loans are commercial in nature and span a variety of industries. These borrowers are all paying as agreed, however, weaknesses in these companies’ operating performance has caused heightened attention to these credits. Additionally, potential problem loans at December 31, 2009, included $51.9 million of loans that we have classified as restructured-accruing.
Restructured-accruing loans were $69.9 million at December 31, 2009. Restructured-accruing loans at December 31, 2009, included $33.1 million of loans that were originated as part of our Capital Markets and SBA group. During 2009, we have granted certain borrowers minor concessions in the form of temporary payment reductions. We believe these payment reductions are a practical and customary business practice and can help a quality borrower get through a challenging time or difficult temporary situation. These concessions better protect the bank’s interests by improving the borrower’s ability to repay its loan in full. Due to the prolonged economic downturn, we have determined that it is appropriate to report all modifications that result in even the slightest accommodation as a restructured loan.
Accruing loans 90 days past due or more were $41 thousand and $8.4 million at December 31, 2009 and 2008, respectively. The balance at December 31, 2008 consists primarily of two loans that were well-secured and in the process of collection.
Allowance for Credit Losses. The allowance for credit losses is a valuation allowance consisting of the allowance for loan losses and the allowance for unfunded lending commitments. It is established through charges to earnings in the form of a provision for credit losses and is reduced by net charge-offs.
Based on an evaluation of the loan portfolio, management presents a quarterly review of the allowance for credit losses to the Bank’s Board of Directors, indicating any changes in the allowance since the last review and any recommendations as to adjustments in the allowance. In making our evaluation, we consider the industry diversification of the commercial loan portfolio and the effect of changes in the local real estate market on collateral values. We also consider the results of recent regulatory examinations, our history of credit experience and our ongoing internal credit reviews.
The allowance for credit losses and the related provision for credit losses are determined based on the historical credit loss experience, changes in the loan portfolio, including size, mix and risk of the individual loans, and current economic conditions. Our allowance for credit losses consists of two components including a specific reserve on individual loans that are considered impaired and a component based upon probable but unidentified losses inherent in the loan portfolio.
For purposes of computing specific loss components of the allowance, larger impaired loans are evaluated individually and smaller impaired loans are evaluated as a pool using historical credit loss experience for the respective loan type and internal risk ratings of the loans or loan pools. We typically review all loans $250 thousand and greater for individual impairment. If an individually evaluated loan is considered impaired, a specific valuation allowance is allocated through an increase to the allowance for credit losses, if necessary, so that the loan is reported net, at the present value of estimated future cash flows using the loan’s existing rate or at the fair value of the collateral. Impaired loans or portions thereof, are charged-off when deemed uncollectible. A loan is impaired when, based on current information, it is probable that a creditor will be unable to collect all amounts due according to the contractual terms of the loan agreement. Impairment is evaluated in total for smaller-balance loans of a similar nature and on an individual loan basis for other loans. The identification of loans that may be impaired is based on our loan review process whereby we maintain an internally classified loan list. Loans on this listing are classified as substandard, doubtful or loss based on probability of repayment, collateral valuation and related collectability. Once a loan is classified, the loan is analyzed to determine if it is impaired and, if impaired, the need to specifically allocate a portion of the allowance for possible loan losses to
47
Table of Contents
Index to Financial Statements
the loan. Additionally, loans restructured in a troubled debt restructuring are considered impaired. Loans are classified as troubled debt restructurings if we grant a concession for economic or legal reasons related to the borrower’s deteriorated financial position that we would not otherwise have granted. If after review, a specific valuation allowance is not assigned to the loan, and the loan is not considered to be impaired, the loan is included with a pool of similar loans that is assigned a historical valuation allowance calculated based on historical loss experience.
The portion of the allowance for credit losses related to probable but unidentified losses inherent in the loan portfolio is based on a calculated historical loss ratio and certain qualitative risk factors. We calculate the historical loss ratio for pools of similar loans with similar characteristics based on the proportion of actual charge-offs experienced to the average loans in the pool. These loan pools are divided by risk rating and loan type including commercial and industrial loans, commercial real estate loans, consumer loans and 1-4 family residential mortgages. The historical loss ratios are updated quarterly based on actual charge-off experience. This historical loss ratio is then applied to the outstanding period-end loan pools. For years prior to 2009, management used a twelve quarter loss period with a heavier weighting applied to the most recent four quarters. Due to the economic uncertainty during 2009 and increased charge-offs, management now considers the latest five quarters to be the most relevant historical loss period for inclusion in the general allowance. Management expects to continue to use the latest five quarters as the most relevant historical loss period in 2010 and possibly beyond 2010, until such time as management believes that economic conditions indicate that a different loss period is more relevant.
In addition to the calculated historical loss ratio, general valuation allowances are based on general economic conditions and other qualitative risk factors. The qualitative factors include, among other things: (i) changes in lending policies and procedures; (ii) changes in national and local economic and business conditions and developments; (iii) changes in the nature and volume of the loan/lease portfolio; (iv) changes in the experience, ability and depth of lending management and staff; (v) changes in the trend or the volume and severity of past due and classified loans/leases; (vi) trends in the volume of nonaccrual loans, troubled debt restructurings, delinquencies and other loan/lease modifications; (vii) changes in the quality of the Bank’s loan review system and the degree of oversight by the Bank’s board of directors; (viii) the existence and effect of any concentrations of credit, and changes in the level of such concentrations; and (ix) the effect of external factors such as competition and legal and regulatory requirements on the level of estimated credit losses in the Bank’s current loan/lease portfolio. During 2009, management increased these qualitative factors due to the significant and prolonged economic uncertainty.
48
Table of Contents
Index to Financial Statements
The following table presents an analysis of the allowance for credit losses and other related data (dollars in thousands):
| Year Ended December 31, | ||||||||||||||||||||
| 2009 | 2008 | 2007 | 2006 | 2005 | ||||||||||||||||
| Allowance for loan losses at January 1 |
$ | 49,177 | $ | 34,446 | $ | 32,027 | $ | 31,230 | $ | 29,406 | ||||||||||
| Charge-offs: |
||||||||||||||||||||
| Commercial and industrial |
22,068 | 9,408 | 3,267 | 4,372 | 12,410 | |||||||||||||||
| Real estate, mortgage and construction |
40,253 | 5,241 | 1,066 | 3,879 | 1,768 | |||||||||||||||
| Consumer/other |
1,589 | 1,959 | 1,629 | 1,199 | 1,535 | |||||||||||||||
| Total charge-offs |
63,910 | 16,608 | 5,962 | 9,450 | 15,713 | |||||||||||||||
| Recoveries: |
||||||||||||||||||||
| Commercial and industrial |
1,713 | 1,392 | 1,829 | 3,205 | 1,773 | |||||||||||||||
| Real estate, mortgage and construction |
789 | 117 | 47 | 79 | 711 | |||||||||||||||
| Consumer/other |
530 | 640 | 1,189 | 507 | 268 | |||||||||||||||
| Total recoveries |
3,032 | 2,149 | 3,065 | 3,791 | 2,752 | |||||||||||||||
| Net charge-offs |
60,878 | 14,459 | 2,897 | 5,659 | 12,961 | |||||||||||||||
| Allowance for credit losses associated with acquired institutions |
— | — | 1,496 | 2,152 | 761 | |||||||||||||||
| Provision for loan losses |
86,433 | 29,190 | 3,820 | 4,304 | 14,024 | |||||||||||||||
| Allowance for loan losses at December 31 |
$ | 74,732 | $ | 49,177 | $ | 34,446 | $ | 32,027 | $ | 31,230 | ||||||||||
| Allowance for unfunded loan commitments at January 1 |
1,654 | 927 | 927 | 1,173 | 826 | |||||||||||||||
| Provision for losses on unfunded loan commitments |
1,198 | 727 | — | (246 | ) | 347 | ||||||||||||||
| Allowance for unfunded loan commitments at December 31 |
2,852 | 1,654 | 927 | 927 | 1,173 | |||||||||||||||
| Total allowance for credit losses at December 31 |
$ | 77,584 | $ | 50,831 | $ | 35,373 | $ | 32,954 | $ | 32,403 | ||||||||||
| Ratios: |
||||||||||||||||||||
| Allowance for loan losses to period end loans |
2.30 | % | 1.30 | % | 1.01 | % | 1.02 | % | 1.16 | % | ||||||||||
| Net charge-offs to average loans |
1.72 | % | 0.40 | % | 0.09 | % | 0.20 | % | 0.51 | % | ||||||||||
| Allowance for loan losses to period-end nonperforming loans |
72.86 | % | 56.21 | % | 170.41 | % | 281.27 | % | 142.99 | % | ||||||||||
The allowance for loan losses at December 31, 2009 was $74.7 million and represented 2.30% of total loans compared to $49.2 million or 1.30% of total loans at December 31, 2008. The allowance for loan losses at December 31, 2009 was 72.86% of nonperforming loans, up from 56.21% at December 31, 2008. The allowance for unfunded lending commitments was $2.9 million at December 31, 2009 and $1.7 million at December 31, 2008. The increase in the allowance for loan losses during 2009 was due in part to higher levels of charge-offs and increases in both nonperforming and classified loans.
Net charge-offs were $60.9 million or 1.72% of average loans for 2009 compared to $14.5 million or 0.40% of average loans during 2008. Beginning in the third quarter of 2009, we took steps to significantly reduce our total nonperforming loans and increase our allowance for loan losses. The actions included the charge-off of certain collateral-based nonperforming loans, the transfer of certain nonperforming loans to held for sale, and the charge-off and subsequent sale of the SemGroup relationship. There were no loans outstanding to SemGroup as of December 31, 2009. During the third quarter of 2009, we recorded write-downs of certain collateral-based impaired loans to their underlying collateral value resulting in net charge-offs of $15.9 million. Additionally, during the third quarter of 2009 we transferred $20.9 million in remaining net book value commercial real estate loans from the national SBA/commercial real estate portfolio to held for sale. As a result of this transfer, we recorded an additional provision for loan losses and related charge-offs of approximately $12.0 million during the third quarter of 2009 to reflect these loans at their market value. Also, during 2009, we recorded total charge-offs of $11.6 million related to the SemGroup relationship.
49
Table of Contents
Index to Financial Statements
SemGroup was an energy customer that was in the process of going through Chapter 11 bankruptcy. This borrower was part of a shared national credit totaling approximately $2.4 billion. Total exposure to SemGroup as of December 31, 2008, was $29.2 million. While completing our analysis of the allowance for credit losses for the quarter ended June 30, 2008, we were notified that this borrower was in the process of filing for Chapter 11 bankruptcy protection. Due to the announced bankruptcy and the significance of this relationship to us, we immediately placed the loan on nonaccrual as of June 30, 2008. We recorded a total provision for credit losses of $4.3 million for this relationship during 2008. During the first quarter of 2009, the borrower announced its intentions to liquidate its various business units through direct sales and auctions and submitted an analysis of the expected sales proceeds of the various business units. After analyzing the information as submitted through the bankruptcy proceedings and the new direction of the bankruptcy, management determined an additional $5.3 million provision was prudent bringing the total amount reserved on this relationship to $9.6 million, approximately 36% of the amount of debt outstanding at March 31, 2009.
During the second quarter of 2009, the borrower filed its plan of reorganization with the Bankruptcy court which included firm estimates of each creditor’s losses as well as the remaining assets of the company. As such, we recorded a charge-off of $9.6 million, the entire allowance for credit losses related to this loan. During the fourth quarter of 2009, we entered into an agreement to sell this loan. As such, we reclassified this relationship to loans held for sale at September 30, 2009 and recorded an additional provision for credit losses and related charge-off of $2.0 million to record the loan at its agreed upon sales price of $16.0 million. This sale was completed during the fourth quarter of 2009.
The provision for credit losses was $87.6 million for 2009 as compared to $29.9 million for 2008. The increase in the provision for credit losses during 2009 was due in part to the previously discussed increase in charge-offs of $46.4 million. Additionally, during the third quarter of 2009, we reassessed certain estimates used in determining the adequacy of our allowance for loan losses. The application of these accounting estimates resulted in an additional $15.0 million in provision for credit losses in the third quarter of 2009.
The provision for credit losses for 2008 was $29.9 million as compared to $3.8 million for 2007. This increase in provision was due, in part, to the SemGroup borrowing relationship which resulted in additional provision of approximately $4.3 million in 2008. Additionally, we recorded approximately $2.7 million in provision for credit losses related to Hurricane Ike. Approximately $220 million of outstanding loans were identified as having collateral located in the identified Hurricane Evacuation Zones near the coast which were the most severely affected areas.
The following table shows the allocation of the allowance for loan losses among various categories of loans. The allocation is made for analytical purposes and is not necessarily indicative of the categories in which future loan losses may occur. The total allowance is available to absorb losses from any category of loans.
| December 31, | ||||||||||||||||||||||||||||||
| 2009 | 2008 | 2007 | 2006 | 2005 | ||||||||||||||||||||||||||
| Amount |
% of loans Held for |
Amount |
% of loans |
Amount |
% of loans |
Amount |
% of loans |
Amount |
% of loans |
|||||||||||||||||||||
| (dollars in thousands) | ||||||||||||||||||||||||||||||
| Balance of allowance for loan losses at end of period applicable to: |
||||||||||||||||||||||||||||||
| Commercial and industrial |
$ | 14,122 | 25 | % | $ | 15,173 | 29 | % | $ | 12,887 | 28 | % | $ | 12,101 | 28 | % | $ | 6,429 | 28 | % | ||||||||||
| Real estate, mortgage and construction |
56,040 | 73 | % | 26,212 | 69 | % | 17,645 | 70 | % | 16,769 | 70 | % | 8,738 | 69 | % | |||||||||||||||
| Consumer/other |
2,766 | 2 | % | 4,988 | 2 | % | 2,851 | 2 | % | 2,262 | 2 | % | 730 | 3 | % | |||||||||||||||
| Unallocated |
1,804 | N/A | 2,804 | N/A | 1,063 | N/A | 895 | N/A | 15,333 | N/A | ||||||||||||||||||||
| Total |
$ | 74,732 | 100 | % | $ | 49,177 | 100 | % | $ | 34,446 | 100 | % | $ | 32,027 | 100 | % | $ | 31,230 | 100 | % | ||||||||||
50
Table of Contents
Index to Financial Statements
The increase in the allowance for loan losses for real estate, mortgage and construction loans was primarily due to the deterioration in our commercial real estate portfolio. In 2010, we expect to see continued pressure on nonowner-occupied commercial real estate due to increased vacancy rates and downward pressure on rental rates.
Interest Rate Sensitivity
We manage interest rate risk by positioning the balance sheet to maximize net interest income while maintaining an acceptable level of risk, remaining mindful of the relationship between profitability, liquidity and interest rate risk. The overall interest rate risk position and strategies for the management of interest rate risk are reviewed by senior management, the Asset/Liability Management Committee and our Board of Directors on an ongoing basis.
We measure interest rate risk using a variety of methodologies including, but not limited to, dynamic simulation analysis and static balance sheet rate shocks. Dynamic simulation analysis is the primary tool used to measure interest rate risk and allows us to model the effects of non-parallel movements in multiple yield curves, changes in borrower and depositor behaviors, changes in loan and deposit pricing, and changes in loan and deposit portfolio compositions and growth rates over a 24-month horizon.
We utilize static balance sheet rate shocks to estimate the potential impact on net interest income of changes in interest rates under various rate scenarios. This analysis estimates a percentage of change in these metrics from the stable rate base scenario versus alternative scenarios of rising and falling market interest rates by instantaneously shocking a static balance sheet. The following table summarizes the simulated change over a 12-month horizon as of December 31, 2009 and 2008:
| Changes in Interest Rates (Basis Points) |
Increase (Decrease) in Net Interest Income |
||
| December 31, 2009 |
|||
| +300 |
8.73 | % | |
| +200 |
6.75 | % | |
| +100 |
3.76 | % | |
| Base |
0.00 | % | |
| -100 |
(6.36 | )% | |
| December 31, 2008 |
|||
| +300 |
3.90 | % | |
| +200 |
4.13 | % | |
| +100 |
2.86 | % | |
| Base |
0.00 | % | |
| -100 |
(4.92 | )% |
Each rate scenario reflects unique prepayment and repricing assumptions. Because of uncertainties related to customer behaviors, loan and deposit pricing levels, competitor behaviors, and socio-economic factors that could affect the shape of the yield curve, this analysis is not intended to and does not provide a precise forecast of the affect actual changes in market rates will have on us. The interest rate sensitivity analysis includes assumptions that: (i) the composition of our interest sensitive assets and liabilities existing at year end will remain constant over the measurement period; and (ii) changes in market rates are parallel and instantaneous across the yield curve regardless of duration or repricing characteristics of specific assets or liabilities. Further, this analysis does not contemplate any actions that we might undertake in response to changes in market factors. Accordingly, this analysis is not intended to and does not provide a precise forecast of the effect actual changes in market rates will have on us.
51
Table of Contents
Index to Financial Statements
Off-Balance Sheet Arrangements, Commitments, Guarantees and Contractual Obligations
Our potential obligations associated with commitments to extend credit and outstanding letters of credit as of December 31, 2009 are summarized below (in thousands):
| Less than One Year |
1-3 Years | 3-5 Years |
Over 5 Years |
Total | |||||||||||
| Commitments to extend credit |
$ | 391,519 | $ | 221,110 | $ | 41,592 | $ | 49,886 | $ | 704,107 | |||||
| Letters of credit |
31,422 | 13,330 | 10,560 | — | 55,312 | ||||||||||
| Bankers acceptances |
985 | — | — | — | 985 | ||||||||||
| Total |
$ | 423,926 | $ | 234,440 | $ | 52,152 | $ | 49,886 | $ | 760,404 | |||||
Since commitments associated with letters of credit and lending and financing arrangements may expire unused, the amounts shown do not necessarily reflect the actual future cash funding requirements. See Note 19 to the Consolidated Financial Statements for additional discussion of financial instruments with off-balance sheet risk, including a discussion of the nature, business purpose and importance of off-balance sheet arrangements.
Our future contractual cash payments are as follows (in thousands):
| Less than One Year |
1-3 Years |
3-5 Years |
Over 5 Years |
Total | |||||||||||
| Junior subordinated debt |
$ | — | $ | — | $ | — | $ | 82,734 | $ | 82,734 | |||||
| Subordinated debt |
— | — | 50,000 | 25,000 | 75,000 | ||||||||||
| Interest expense related to long-term debt |
6,696 | 13,392 | 10,049 | 76,766 | 106,903 | ||||||||||
| Operating leases |
8,479 | 17,089 | 15,315 | 70,597 | 111,480 | ||||||||||
| Certificates and other time deposits |
854,877 | 85,678 | 5,724 | — | 946,279 | ||||||||||
| Total |
$ | 870,052 | $ | 116,159 | $ | 81,088 | $ | 255,097 | $ | 1,322,396 | |||||
The amount shown above for subordinated debt represents our contractual obligation. The subordinated debt is reflected in the consolidated balance sheet at its fair value. As discussed earlier, the Bank entered into an interest rate swap designated as a fair-value hedge of the subordinated debt. See Note 13 in the Consolidated Financial Statements for further information.
Interest expense obligations on junior subordinated debt and on subordinated debt are calculated based on the stated contractual interest rates. Interest expense on variable rate junior subordinated debt and on subordinated debt is calculated based on the current 3-month LIBOR rate. See Notes 11 and 12 in the Consolidated Financial Statements for further information.
Capital and Liquidity
Capital—At December 31, 2009, shareholders’ equity totaled $541 million or 11.0% of total assets, as compared to $643 million or 12.7% of total assets at December 31, 2008. Our risk-based capital ratios together with the minimum capital amounts and ratios as of December 31, 2009 were as follows (dollars in thousands):
| Actual | For Capital Adequacy Purposes |
|||||||||||
| Amount | Ratio | Amount | Ratio | |||||||||
| Total Capital (to Risk Weighted Assets) |
$ | 526,919 | 14.4 | % | $ | 292,569 | 8.0 | % | ||||
| Tier 1 Capital (to Risk Weighted Assets) |
424,409 | 11.6 | % | 146,284 | 4.0 | % | ||||||
| Tier 1 Capital (to Average Assets) |
424,409 | 8.9 | % | 191,045 | 4.0 | % | ||||||
52
Table of Contents
Index to Financial Statements
During 2008, we received $125 million in capital from the U.S. Treasury as the result of our participation in the U.S. Treasury’s Capital Purchase Program. During 2009, we fully redeemed the $125 million preferred stock that we sold to the U.S. Treasury in December of 2008. See Note 20 in the Consolidated Financial Statements for further discussion of regulatory capital requirements.
Additionally, during 2009, we issued 8.3 million shares of our common stock through a public stock offering, which resulted in net proceeds of approximately $54.6 million, after deducting underwriting fees and estimated offering expenses.
In the current economic environment, we regularly assess our ability to maintain and build our regulatory capital levels. In making this assessment, we take into account a variety of factors, including our views as to the duration of the recession and the consequent impact on our markets and the real estate market in particular, our provisioning for and charge-off of nonperforming assets, the liquidity needs of our organization, the capital levels of our peer institutions, and our ability to access the capital markets.
We also take into account our discussions and agreements with the FDIC and our other regulators. As part of an informal agreement that Sterling Bank entered into on January 26, 2010, with the FDIC and the Texas Department of Banking, we have agreed to prepare and submit to such regulatory agencies a capital management plan that will reflect Sterling Bank’s plans to maintain for the next three years minimum regulatory capital levels that are currently unspecified. We intend to propose minimum capital levels in excess of the minimum requirements to remain well capitalized but below our regulatory capital levels at December 31, 2009, which, based on our discussions with the FDIC, we believe will be acceptable to the FDIC. Additionally, although not required to, we have agreed to provide the FDIC and the Texas Department of Banking advance notice of any dividend payments we would propose to make from Sterling Bank to Sterling Bancshares. We currently have available at the holding company sufficient liquidity to continue our current dividend payments and meet all of our other holding company only obligations for approximately 12 months without the payment of any dividends from Sterling Bank to Sterling Bancshares.
Our informal agreement with the FDIC and the Texas Department of Banking also includes provisions requiring us to perform certain reviews of our personnel, policies, procedures and practices, none of which we believe will have a material impact on the operations of Sterling Bank or Sterling Bancshares. If we are unable to maintain the regulatory capital levels that we propose in our capital management plan or if we fail to adequately resolve any other matters that any of our regulators may require us to address in the future, we could become subject to more stringent supervisory actions.
Liquidity—The objectives of our liquidity management are to maintain our ability to meet day-to-day deposit withdrawals and other payment obligations, to raise funds to support asset growth, to maintain reserve requirements and otherwise operate on an ongoing basis. We strive to manage a liquidity position sufficient to meet operating requirements while maintaining an appropriate balance between assets and liabilities to meet the expectations of our shareholders. In recent years, our liquidity needs have primarily been met by growth in deposits including brokered certificates of deposit. In addition to deposits, we have access to funds from correspondent banks and from the Federal Home Loan Bank, supplemented by amortizing securities and loan portfolios.
Sterling Bancshares must provide for its own liquidity and fund its own obligations. The primary source of Sterling Bancshares’ revenues is from dividends declared by Sterling Bank. There are statutory and regulatory provisions that could limit the ability of the Bank to pay dividends to Sterling Bancshares. As discussed above, we are in the process of developing a capital management plan that we will submit to our banking regulators. That capital management plan will reflect a variety of operational factors including our plans for dividend payments from Sterling Bank to Sterling Bancshares and from Sterling Bancshares to our shareholders. Although not required to, we have agreed to give our regulators advance notice of any dividend payments we would propose to make from Sterling Bank to Sterling Bancshares. Sterling Bancshares has sufficient liquidity to continue our current dividend payments and meet our other parent-only obligations for 12 months without the payment of any dividends from Sterling Bank.
53
Table of Contents
Index to Financial Statements
On July 30, 2007, our Board of Directors amended its existing common stock repurchase program originally adopted by the Board on April 26, 2005. The aggregate number of shares originally approved by the Board for repurchase under the Program remains unchanged at 3,750,000 shares.
| ITEM 7A. | Quantitative and Qualitative Disclosures about Market Risk |
For information regarding the market risk of our financial instruments, see “Management’s Discussion and Analysis of Financial Condition and Results of Operations—Interest Rate Sensitivity.” Our principal market risk exposure is to interest rates.
| ITEM 8. | Financial Statements and Supplementary Data |
Refer to the index included on page F-1 and the Consolidated Financial Statements that begin on page F-3 of this Annual Report on Form 10-K.
| ITEM 9. | Changes in and Disagreements with Accountants on Accounting and Financial Disclosure |
None.
| ITEM 9A. | Controls and Procedures |
The Company’s Chief Executive Officer (the “CEO”) and Chief Financial Officer (the “CFO”), after evaluating the effectiveness of the Company’s disclosure controls and procedures, as defined in Rule 13a-15(e) of the Exchange Act have concluded that, as of the end of the fiscal year covered by this Annual Report on Form 10-K, the Company’s disclosure controls and procedures were effective to provide reasonable assurances that information required to be disclosed in the reports filed or submitted under such Act is recorded, processed, summarized and reported within the time periods specified in the SEC’s rules and forms and such information is accumulated and communicated to management, including the CEO and the CFO, as appropriate, to allow timely decisions regarding required disclosures.
There were no other changes in the Company’s internal control over financial reporting (as defined in Rule 13a-15(f) under the Securities Exchange Act of 1934) during the most recent fiscal quarter that materially affected, or are reasonably likely to materially affect, the Company’s internal control over financial reporting.
54
Table of Contents
Index to Financial Statements
MANAGEMENT’S REPORT ON INTERNAL CONTROL OVER FINANCIAL REPORTING AND COMPLIANCE WITH DESIGNATED LAWS AND REGULATIONS
Management’s Report on Internal Control over Financial Reporting
Management of Sterling Bancshares, Inc. and subsidiaries (the “Company”) is responsible for preparing the Company’s annual financial statements. Management is also responsible for establishing and maintaining adequate internal control over financial reporting. The Company’s internal control over financial reporting is a process designed under the supervision of the Company’s CEO and CFO to provide reasonable assurance regarding the reliability of financial reporting and the preparation of the Company’s financial statements for external purposes in accordance with generally accepted accounting principles. All internal control systems, no matter how well designed, have inherent limitations. Therefore, even those systems determined to be effective can provide only reasonable assurance with respect to financial statement preparation and presentation.
As of December 31, 2009, management assessed the effectiveness of the Company’s internal control over financial reporting based on the criteria for effective internal control over financial reporting established in Internal Control—Integrated Framework, issued by the Committee of Sponsoring Organizations of the Treadway Commission. This assessment included controls over the preparation of the schedules equivalent to the basic financial statements in accordance with the instructions for the Consolidated Financial Statements for Bank Holding Companies (Form FRY-9C) to meet the reporting requirements of Section 112 of the Federal Deposit Insurance Corporation Improvement Act. Based on the assessment, management determined that the Company maintained effective internal control over financial reporting as of December 31, 2009, based on those criteria.
Deloitte & Touche LLP, the independent registered public accounting firm that audited the Company’s consolidated financial statements included in this Annual Report on Form 10-K, has issued an attestation report on the effectiveness of the Company’s internal control over financial reporting as of December 31, 2009. The report is included in this Item under the heading “Report of Independent Registered Public Accounting Firm.”
Compliance with Designated Laws and Regulations
Management is also responsible for ensuring compliance with the federal laws and regulations concerning loans to insiders and the federal and state laws and regulations concerning dividend restrictions, both of which are designated by the Federal Deposit Insurance Corporation (FDIC) as safety and soundness laws and regulations.
Management assessed its compliance with the designated safety and soundness laws and regulations and has maintained records of its determinations and assessments as required by the FDIC. Based on this assessment, management believes that the Company has complied, in all material respects, with the designated safety and soundness laws and regulations for the year ended December 31, 2009.

|
| J. Downey Bridgwater Chairman, President and Chief Executive Officer |

|
| Zach L. Wasson Executive Vice President and Chief Financial Officer |
55
Table of Contents
Index to Financial Statements
REPORT OF INDEPENDENT REGISTERED PUBLIC ACCOUNTING FIRM
To the Board of Directors and Shareholders of
Sterling Bancshares, Inc.
Houston, Texas
We have audited the internal control over financial reporting of Sterling Bancshares, Inc. and subsidiaries (the “Bank”) as of December 31, 2009, based on criteria established in Internal Control—Integrated Framework issued by the Committee of Sponsoring Organizations of the Treadway Commission. Because management’s assessment and our audit were conducted to meet the reporting requirements of Section 112 of the Federal Deposit Insurance Corporation Improvement Act (FDICIA), management’s assessment and our audit of the Bank’s internal control over financial reporting included controls over the preparation of the schedules equivalent to the basic financial statements in accordance with the instructions for the Consolidated Financial Statements for Bank Holding Companies (Form FR Y-9C). The Bank’s management is responsible for maintaining effective internal control over financial reporting and for its assessment of the effectiveness of internal control over financial reporting, included in the accompanying Management’s Report on Internal Control over Financial Reporting and Compliance with Designated Laws and Regulations. Our responsibility is to express an opinion on the Bank’s internal control over financial reporting based on our audit.
We conducted our audit in accordance with the standards of the Public Company Accounting Oversight Board (United States). Those standards require that we plan and perform the audit to obtain reasonable assurance about whether effective internal control over financial reporting was maintained in all material respects. Our audit included obtaining an understanding of internal control over financial reporting, assessing the risk that a material weakness exists, testing and evaluating the design and operating effectiveness of internal control based on the assessed risk, and performing such other procedures as we considered necessary in the circumstances. We believe that our audit provides a reasonable basis for our opinion.
A company’s internal control over financial reporting is a process designed by, or under the supervision of, the company’s principal executive and principal financial officers, or persons performing similar functions, and effected by the company’s board of directors, management, and other personnel to provide reasonable assurance regarding the reliability of financial reporting and the preparation of financial statements for external purposes in accordance with generally accepted accounting principles. A company’s internal control over financial reporting includes those policies and procedures that (1) pertain to the maintenance of records that, in reasonable detail, accurately and fairly reflect the transactions and dispositions of the assets of the company; (2) provide reasonable assurance that transactions are recorded as necessary to permit preparation of financial statements in accordance with generally accepted accounting principles, and that receipts and expenditures of the company are being made only in accordance with authorizations of management and directors of the company; and (3) provide reasonable assurance regarding prevention or timely detection of unauthorized acquisition, use, or disposition of the company’s assets that could have a material effect on the financial statements.
Because of the inherent limitations of internal control over financial reporting, including the possibility of collusion or improper management override of controls, material misstatements due to error or fraud may not be prevented or detected on a timely basis. Also, projections of any evaluation of the effectiveness of the internal control over financial reporting to future periods are subject to the risk that the controls may become inadequate because of changes in conditions, or that the degree of compliance with the policies or procedures may deteriorate.
In our opinion, the Bank maintained, in all material respects, effective internal control over financial reporting as of December 31, 2009, based on the criteria established in Internal Control—Integrated Framework issued by the Committee of Sponsoring Organizations of the Treadway Commission. We have not examined and, accordingly, we do not express an opinion or any other form of assurance on management’s statement referring to compliance with laws and regulations.
We have also audited, in accordance with the standards of the Public Company Accounting Oversight Board (United States), the financial statements as of and for the year ended December 31, 2009 of the Bank and our report dated February 23, 2010 expressed an unqualified opinion on those financial statements.

Houston, Texas
February 23, 2010
56
Table of Contents
Index to Financial Statements
| ITEM 9B. | Other Information |
None.
PART III
| ITEM 10. | Directors, Executive Officers and Corporate Governance |
The information required by this Item as to the directors and executive officers is hereby incorporated by reference from the information appearing under the captions “Election of Directors,” “Information about the Board of Directors, Committees of the Board, and Committees of the Bank,” “Executive Officers and Other Significant Employees,” “Section 16(a) Beneficial Ownership Reporting Compliance” and “Corporate Governance and Nominating Committee” in the Company’s definitive proxy statement to be filed with the SEC pursuant to the Exchange Act within 120 days of year end. The information required by this Item as to the Code of Ethics for Senior Financial Officers is herby incorporated by reference from “Item 1—Business—Available Information” of this report.
| ITEM 11. | Executive Compensation |
The information required by this Item as to the management of the Company is hereby incorporated by reference from the information appearing under the caption “Compensation Discussion and Analysis,” “Summary Compensation Table,” “Grants of Plan-Based Awards,” “Summary of 2009 Compensation Decisions,” “Outstanding Equity Awards at Fiscal Year-End,” “Option Exercises and Stock Vested,” “Nonqualified Deferred Compensation,” “Potential Payments Upon Termination of Change in Control,” “Director Compensation,” “Compensation Committee Interlocks and Insider Participation,” and “Report of the Human Resources Programs Committee” in the Company’s definitive proxy statement to be filed with the SEC pursuant to the Exchange Act within 120 days of year end. Notwithstanding the foregoing, in accordance with the instructions to Item 407 of Regulation S-K, the information contained in the Company’s definitive proxy statement under the subheading “Report of the Human Resources Programs Committee” shall be deemed Furnished, and not Filed, in this Form 10-K, and shall not be incorporated by reference into any Filing under the Securities Act or the Exchange Act as a result of Furnishing, except to the extent the Company specifically incorporates it by reference.
| ITEM 12. | Security Ownership of Certain Beneficial Owners and Management and Related Stockholder Matters |
The information required by this Item as to the ownership by management and others of securities of the Company is hereby incorporated by reference from the information appearing under the captions “Security Ownership of Certain Beneficial Owners and Management” and “Equity Compensation Plan Information” in the Company’s definitive proxy statement to be filed with the SEC pursuant to the Securities Exchange Act of 1934 within 120 days of year end.
| ITEM 13. | Certain Relationships and Related Transactions, and Director Independence |
The information required by this Item as to certain business relationships and transactions with management and other related parties of the Company is hereby incorporated by reference to such information appearing under the captions “Certain Transactions with Related Persons,” and “Director Independence” in the Company’s definitive proxy to be filed with the SEC pursuant to the Exchange Act within 120 days of year end.
| ITEM 14. | Principal Accounting Fees and Services |
The information required by this Item as to disclosures regarding accounting fees and services is hereby incorporated by reference to such information appearing under the caption “Independent Registered Public Accounting Firm’s Fees” in the Company’s definitive proxy to be filed with the SEC pursuant to the Exchange Act within 120 days of year end.
57
Table of Contents
Index to Financial Statements
PART IV
| ITEM 15. | Exhibits, Financial Statement Schedules |
(a) List of documents filed as part of this report
| 1. | Consolidated Financial Statements. The following Consolidated Financial Statements and Report of Independent Registered Public Accounting Firm are included in this Annual Report on Form 10-K. |
| F-2 | ||
| CONSOLIDATED FINANCIAL STATEMENTS: |
||
| F-3 | ||
| F-4 | ||
| F-5 | ||
| F-6 | ||
| F-7 | ||
| 2. | Consolidated Financial Statement Schedules. These schedules are omitted as the required information is inapplicable or the information is presented in the consolidated financial statements or related notes. |
| 3. | Exhibits. |
| Exhibit No. |
||
| 1.1 | Underwriting Agreement, dated May 6, 2009, by and between Sterling Bancshares, Inc. and Morgan Stanley & Co. Incorporated, as representative of the several underwriters named in Schedule II of the Underwriting Agreement. [Incorporated by reference to Exhibit 1.1 of the Company’s Current Report on Form 8-K filed on May 11, 2009 (File No. 0-20750).] | |
| 2.1 | Agreement and Plan of Merger Dated July 7, 2005 by and among Sterling Bancshares, Inc., SBPB, Inc., and Prestonwood Bancshares, Inc. [Incorporated by reference to Exhibit 10.1 of the Company’s Quarterly Report on Form 10-Q filed on November 8, 2005 (File No. 000-20750).] | |
| 2.2 | Agreement and Plan of Merger dated July 25, 2006 between Sterling Bancshares, Inc. and BOTH, Inc. [Incorporated by reference to Exhibit 2.1 of the Company’s Current Report on Form 8-K filed on July 26, 2006.] | |
| 2.3 | Agreement and Plan of Merger dated January 24, 2007 between Sterling Bancshares, Inc., Sterling Bank and Partners Bank of Texas. [Incorporated by reference to Exhibit 2.1 of the Company’s Current Report on Form 8-K filed on January 25, 2007.] | |
| 2.4 | Share Exchange Agreement dated May 3, 2007, among the Company, MBM Advisors and the shareholders of MBM Advisors. [Incorporated by reference to Exhibit 2.1 to the Company’s Current Report on Form 8-K filed on May 4, 2007 (File No. 000-20750).] | |
| 3.1 | Restated and Amended Articles of Incorporation of the Company effective August 13, 2007. [Incorporated by reference to Exhibit 3.1 of the Company’s Current Report on Form 8-K filed on August 19, 2007 (File No. 000-20750).] | |
| 3.2 | Amended and Restated Bylaws of Sterling Bancshares, Inc. (as of October 29, 2007). [Incorporated by reference to Exhibit 3.1 of the Company’s Current Report on Form 8-K filed on October 30, 2007 (File No. 000-20750).] | |
| 3.3 | Certificate of Designations of Fixed Rate Cumulative Preferred Stock, Series J, of Sterling Bancshares, Inc. [Incorporated by reference to Exhibit 3.1 to the Company’s Current Report on Form 8-K filed on December 15, 2008 (File No. 0-20750).] | |
58
Table of Contents
Index to Financial Statements
| Exhibit No. |
||
| 3.4 | First Amendment to the Amended and Restated Bylaws of Sterling Bancshares, Inc. [Incorporated by reference to Exhibit 3.1 of the Company’s Quarterly Report on Form 10-Q filed on August 6, 2009 (File No. 000-20750).] | |
| 4.1 | Preferred Securities Guarantee Agreement dated March 21, 2001. [Incorporated by reference to Exhibit 4.2 of the Company’s Current Report on Form 8-K filed on March 21, 2001 (File No. 000-20750).] | |
| 4.2 | Indenture dated March 21, 2001. [Incorporated by reference to Exhibit 4.4 of the Company’s Current Report on Form 8-K filed on March 21, 2001 (File No. 000-20750).] | |
| 4.3 | First Supplemental Indenture dated March 21, 2001. [Incorporated by reference to Exhibit 4.5 of the Company’s Current Report on Form 8-K filed on March 21, 2001 (File No. 000-20750).] | |
| 4.4 | Indenture dated August 30, 2002. [Incorporated by reference to Exhibit 4.4 of the Company’s Current Report on Form 8-K filed on September 12, 2002 (File No. 000-20750).] | |
| 4.5 | Junior Subordinated Deferrable Interest Debenture due August 30, 2032. [Incorporated by reference to Exhibit 4.6 of the Company’s Current Report on Form 8-K filed on September 12, 2002 (File No. 000-20750).] | |
| 4.6 | Guarantee Agreement dated August 30, 2002. [Incorporated by reference to Exhibit 4.6 of the Company’s Current Report on Form 8-K filed on September 12, 2002 (File No. 000-20750).] | |
| 4.7 | Preferred Securities Guarantee Agreement dated September 26, 2002. [Incorporated by reference to Exhibit 4.2 of the Company’s Current Report on Form 8-K dated September 26, 2002 (File No. 000-20750).] | |
| 4.8 | Second Supplemental Indenture dated September 26, 2002. [Incorporated by reference to Exhibit 4.9 of the Company’s Current Report on Form 8-K dated September 26, 2002 (File No. 000-20750).] | |
| 4.9 | 8.30% Junior Subordinated Deferrable Interest Debenture due September 26, 2032. [Incorporated by reference to Exhibit 4.8 of the Company’s Current Report on Form 8-K dated September 26, 2002 (File No. 000-20750).] | |
| 4.10 | Fiscal and Paying Agency Agreement dated April 10, 2003 between Sterling Bank and Deutsche Bank Trust Company Americas. [Incorporated by reference to Exhibit 4.1 of the Company’s Current Report on Form 8-K filed April 15, 2003 (File No. 000-20750).] | |
| 4.11 | Form of Global Certificate representing Sterling Bank’s 7.375% Subordinated Notes due 2013. [Incorporated by reference to Exhibit 4.2 of the Company’s Current Report on Form 8-K filed April 15, 2003 (File No. 000-20750).] | |
| 4.12 | Amended and Restated Declaration of Trust by and among Sterling Bancshares, Inc., as sponsor, Wilmington Trust Company, as institutional trustee and Delaware trustee, and the administrators named therein, dated as of March 26, 2007. [Incorporated by reference to Exhibit 4.1 to the Company’s Current Report on Form 8-K filed on March 30, 2007 (File No. 000-20750).] | |
| 4.13 | Indenture by and between Sterling Bancshares, Inc., as issuer, and Wilmington Trust Company, as trustee, dated as of March 26, 2007. [Incorporated by reference to Exhibit 4.2 to the Company’s Current Report on Form 8-K filed on March 30, 2007 (File No. 000-20750).] | |
59
Table of Contents
Index to Financial Statements
| Exhibit No. |
|||||
| 4.14 | Guarantee Agreement by and between Sterling Bancshares, Inc., as guarantor, and Wilmington Trust Company, as guarantee trustee, dated as of March 26, 2007. [Incorporated by reference to Exhibit 4.3 to the Company’s Current Report on Form 8-K filed on March 30, 2007 (File No. 000-20750).] | ||||
| 4.15 | Form of Capital Securities Certificate of Sterling Bancshares Capital Trust IV, dated March 26, 2007. [Incorporated by reference to Exhibit 4.4 to the Company’s Current Report on Form 8-K filed on March 30, 2007 (File No. 000-20750).] | ||||
| 4.16 | Sterling Bancshares, Inc. Deferred Compensation Plan (as Amended and Restated). [Incorporated by reference to Exhibit 4.6 to the Company’s Registration Statement on Form S-8 filed August 29, 2007 (File No. 333-145774 ).] | ||||
| 4.17 | Form of Stock Certificate for the Series J Preferred Stock. [Incorporated by reference to Exhibit 4.1 to the Company’s Current Report on Form 8-K filed on December 15, 2008 (File No. 0-20750).] | ||||
| 4.18 | Warrant to Purchase 2,615,557 Shares of Common Stock of Sterling Bancshares, Inc. [Incorporated by reference to Exhibit 4.2 to the Company’s Current Report on Form 8-K filed on December 15, 2008 (File No. 0-20750).] | ||||
| 10.1 | *** | 1994 Incentive Stock Option Plan of the Company. [Incorporated by reference to Exhibit 10.1 of the Company’s Annual Report on Form 10-K for the year ended December 31, 1994.] | |||
| 10.2 | 1994 Employee Stock Purchase Plan of the Company. [Incorporated by reference to Exhibit 10.2 of the Company’s Annual Report on Form 10-K for the year ended December 31, 1994.] | ||||
| 10.3 | *** | 1984 Incentive Stock Option Plan of the Company. [Incorporated by reference to Exhibit 10.1 of the Company’s Registration Statement on Form S-1, effective October 22, 1992 (Registration No. 33-51476).] | |||
| 10.4 | *** | 1995 Non-Employee Director Stock Compensation Plan. [Incorporated by reference to Exhibit 4.3 of the Company’s Registration Statement on Form S-8 (File No. 333-16719).] | |||
| 10.5 | *** | Employment Agreement between Sterling Bancshares, Inc. and J. Downey Bridgwater executed on December 20, 2007, and effective as of January 1, 2007. [Incorporated by reference to Exhibit 10.1 of the Company’s Current Report on Form 8-K filed on December 26, 2007 (File No. 000-207500).] | |||
| 10.6 | *** | Amended and Restated Employment Agreement between Sterling Bancshares, Inc. and J. Downey Bridgwater executed on December 29, 2008, and effective as of January 1, 2007. [Incorporated by reference to Exhibit 10.1 of the Company’s Current Report on Form 8-K filed on December 29, 2008 (File No. 0-20750).] | |||
| 10.7 | *** | Amended and restated Sterling Bancshares, Inc. 2003 Stock Incentive and Compensation Plan effective April 30, 2007. [Incorporated by reference to Exhibit 10.1 of the Company’s Current Report on Form 8-K filed on August 14, 2007. (File No. 000-207500).] | |||
| 10.8 | *** | Form of Severance and Non-Competition Agreements between Sterling Bancshares, Inc., Sterling Bank and the following named executive officers: | |||
| Wanda S. Dalton |
Travis Jaggers | ||||
| James W. Goolsby, Jr. |
Graham B. Painter | ||||
| [Incorporated by reference to Exhibit 10.2 of the Company’s Quarterly Report on Form 10-Q filed on August 5, 2004 (File No. 000-207501).] | |||||
60
Table of Contents
Index to Financial Statements
| Exhibit No. |
|||
| 10.9 | *** | Form of Restricted Stock Agreement. [Incorporated by reference to Exhibit 10.1 of the Company’s Current Report on Form 8-K filed on February 4, 2005 (File No. 000-207500).] | |
| 10.10 | *** | Form of Incentive Stock Agreement. [Incorporated by reference to Exhibit 10.2 of the Company’s Current Report on Form 8-K filed on February 4, 2005 (File No. 000-207500).] | |
| 10.11 | *** | Severance and Non-Competition Agreement between Sterling Bancshares, Inc., Sterling Bank and Allen Brown executed and effective as of December 1, 2004. [Incorporated by reference to Exhibit 10.1 of the Company’s Current Report on Form 8-K filed on December 7, 2004 (File No. 000-207500).] | |
| 10.12 | *** | Short Term Incentive Program for Shared Services. [Incorporated by reference to Exhibit 10.14 of the Company’s Annual Report on Form 10-K for the year ended December 31, 2004.] | |
| 10.13 | *** | Short Term Incentive Program for Bank Offices. [Incorporated by reference to Exhibit 10.15 of the Company’s Annual Report on Form 10-K for the year ended December 31, 2004.] | |
| 10.14 | *** | Severance and Non-Competition Agreement dated effective January 1, 2005, by and among Sterling Bancshares, Inc., Sterling Bank and Robert S. Smith. [Incorporated by reference to Exhibit 10.1 of the Company’s Current Report on Form 8-K filed on January 13, 2005 (File No. 000-207500).] | |
| 10.15 | *** | Non-Compete Agreement between Sterling Bancshares, Inc. and Max W. Wells dated July 7, 2005. [Incorporated by reference to Exhibit 10.2 of the Company’s Quarterly Report on Form 10-Q filed on November 8, 2005 (File No. 000-207500).] | |
| 10.16 | *** | Summary Description of Non-Employee Director compensation. [Incorporated by reference to Exhibit 10.2 of the Company’s Current Report on Form 8-K filed on April 29, 2005 (File No. 000-207500).] | |
| 10.17 | *** | Summary of Named Executive Officer Compensation. [Incorporated by reference to Exhibit 10.1 of the Company’s Current Report on Form 8-K filed on April 29, 2005 (File No. 000-207500).] | |
| 10.18 | Purchase and Sale Agreement, dated November 13, 2006, between Sterling Bank and First States Group, L.P. [Incorporated by reference to Exhibit 10.1 of the Company’s Current Report on Form 8-K filed on November 17, 2006.] | ||
| 10.19 | *** | Form of Phantom Share Agreement. [Incorporated by reference to Exhibit 10.6 of the Company’s Current Report on Form 8-K filed on August 15, 2006.] | |
| 10.20 | *** | Severance and Non-Competition Agreement between Sterling Bancshares, Inc., a Texas corporation, and Deborah Dinsmore, dated February 24, 2006. [Incorporated by reference to Exhibit 10.1 of the Company’s Current Report on Form 8-K filed on February 28, 2006.] | |
| 10.21 | *** | Severance and Non-Competition Agreement between Sterling Bancshares, Inc., a Texas corporation, and C. Wallis McMath, Jr., dated March 1, 2006. [Incorporated by reference to Exhibit 10.1 of the Company’s Current Report on Form 8-K filed on March 6, 2006.] | |
| 10.22 | *** | Severance and Non-Competition Agreement between Sterling Bancshares, Inc., a Texas corporation, and Zach L. Wasson dated December 4, 2006. [Incorporated by reference to Exhibit 10.1 of the Company’s Current Report on Form 8-K filed on December 6, 2006.] | |
61
Table of Contents
Index to Financial Statements
| Exhibit No. |
|||
| 10.23 | Placement Agreement by and among Sterling Bancshares, Inc., Sterling Bancshares Capital Trust IV, FTN Financial Capital Markets and Keefe, Bruyette & Woods, Inc., dated March 14, 2007. [Incorporated by reference to Exhibit 10.1 to the Company’s Current Report on Form 8-K filed on March 30, 2007 (File No. 000-20750).] | ||
| 10.24 | Long-Term Incentive (LTI) Stock Performance Program. [Incorporated by reference to Exhibit 10.1 to the Company’s Current Report on Form 8-K filed on September 5. 2007 (File No. 000-20750).] | ||
| 10.25 | Letter Agreement, dated December 12, 2008, including Securities Purchase Agreement – Standard Terms incorporated by reference therein, by and between Sterling Bancshares, Inc. and the United States Department of Treasury. [Incorporated by reference to Exhibit 10.1 to the Company’s Current Report on Form 8-K filed on December 15, 2008 (File No. 0-20750).] | ||
| 10.26 | Form of Letter Agreement executed by Senior Executive Officers. [Incorporated by reference to Exhibit 10.2 to the Company’s Current Report on Form 8-K filed on December 15, 2008 (File No. 0-20750).] | ||
| 10.27 | Form of Waiver executed by Senior Executive Officers. [Incorporated by reference to Exhibit 10.3 to the Company’s Current Report on Form 8-K filed on December 15, 2008 (File No. 0-20750).] | ||
| 10.28 | Redemption Letter Agreement, dated May 5, 2009, by and between Sterling Bancshares, Inc. and the United States Department of the Treasury. [Incorporated by reference to Exhibit 10.1 to the Company’s Current Report on Form 8-K filed on May 5, 2009 (File No. 0-20750).] | ||
| 10.29 | Purchase and Assumption Agreement, dated August 7, 2009, by and between Sterling Bank and First Bank. [Incorporated by reference to Exhibit 10.1 to the Company’s Current Report on Form 8-K filed on August 10, 2009 (File No. 0-20750).] | ||
| 10.30 | *** | Severance and Release Agreement between Sterling Bancshares, Inc. and John A. Rossitto dated October 20, 2009. [Incorporated by reference to Exhibit 10.1 of the
Company’s Current Report on Form 8-K filed on October 20, 2009 (File No. 000-207500).] | |
| 10.31 | Termination of Purchase and Assumption Agreement, entered effective December 28, 2009, by and between Sterling Bank and First Bank. [Incorporated by reference to Exhibit 10.1 to the Company’s Current Report on Form 8-K filed on December 29, 2009 (File No. 0-20750).] | ||
| 10.32 | *** | Irrevocable Waiver executed by J. Downey Bridgwater, President and Chief Executive Officer of Sterling Bancshares, Inc., dated as of December 29, 2009. [Incorporated by reference to Exhibit 10.1 to the Company’s Current Report on Form 8-K filed on December 29, 2009 (File No. 0-20750).] | |
| 10.33 | *** | Voluntary Separation and Release Agreement dated effective December 31, 2009, by and between Sterling Bancshares, Inc. and Sonny B. Lyles. [Incorporated by reference to Exhibit 10.1 of the Company’s Current Report on Form 8-K filed on January 4, 2010 (File No. 000-207500).] | |
| 21.1 | * | Subsidiaries of the Company. | |
| 23.1 | * | Consent of Deloitte & Touche LLP, Independent Registered Public Accounting Firm. | |
| 31.1 | * | Certification of J. Downey Bridgwater, Chairman, President and Chief Executive Officer, as required pursuant to Section 302 of the Sarbanes-Oxley Act of 2002. | |
62
Table of Contents
Index to Financial Statements
| Exhibit No. |
|||
| 31.2 | * | Certification of Zach L. Wasson, Executive Vice President and Chief Financial Officer, as required pursuant to Section 302 of the Sarbanes-Oxley Act of 2002. | |
| 32.1 | ** | Certification pursuant to 18 U.S.C. Section 1350, as adopted pursuant to Section 906 of the Sarbanes-Oxley Act of 2002. | |
| 32.2 | ** | Certification pursuant to 18 U.S.C. Section 1350, as adopted pursuant to Section 906 of the Sarbanes-Oxley Act of 2002. | |
| * | As filed herewith. |
| ** | As furnished herewith. |
| *** | Management Compensation Agreement. |
63
Table of Contents
Index to Financial Statements
Pursuant to the requirements of Section 13 or 15(d) of the Securities Exchange Act of 1934, the registrant has duly caused this report to be signed on its behalf by the undersigned, thereunto duly authorized.
| STERLING BANCSHARES, INC. | ||||||
| DATE: February 23, 2010 |
by |
/S/ J. DOWNEY BRIDGWATER | ||||
| J. Downey Bridgwater Chairman, President and Chief Executive Officer | ||||||
Pursuant to the requirements of the Securities Exchange Act of 1934, this report has been signed below by the following persons on behalf of the registrant in the capacity indicated on this the 23rd day of February, 2010.
| SIGNATURE |
TITLE |
SIGNATURE |
TITLE | |||
| /S/ J. DOWNEY BRIDGWATER J. Downey Bridgwater |
Chairman, President, and Chief Executive Officer (Principal Executive Officer) | /S/ GLENN H. JOHNSON Glenn H. Johnson |
Director | |||
| /S/ ZACH L. WASSON Zach L. Wasson |
Executive Vice President and Chief Financial Officer (Principal Financial and Accounting Officer) | /S/ R. BRUCE LABOON R. Bruce LaBoon |
Director | |||
| /S/ DAVID L. HATCHER David L. Hatcher |
Lead Director | /S/ SHELDON I. OSTER Sheldon I. Oster |
Director | |||
| /S/ EDWARD R. BARDGETT Edward R. Bardgett |
Director | /S/ RAIMUNDO RIOJAS E. Raimundo Riojas E. |
Director | |||
| /S/ GEORGE BEATTY, JR. George Beatty, Jr. |
Director | /S/ ROLAND RODRIGUEZ Roland Rodriguez |
Director | |||
| /S/ ANAT BIRD Anat Bird |
Director | /S/ DAN C. TUTCHER Dan C. Tutcher |
Director | |||
| /S/ BRUCE J. HARPER Bruce J. Harper |
Director | /S/ ELIZABETH C. WILLIAMS Elizabeth C. Williams |
Director | |||
| /S/ BERNARD A. HARRIS, JR., MD Bernard A. Harris, Jr., MD |
Director | |||||
64
Table of Contents
Index to Financial Statements
EXHIBIT TABLE
| Exhibit No. |
||
| 1.1 | Underwriting Agreement, dated May 6, 2009, by and between Sterling Bancshares, Inc. and Morgan Stanley & Co. Incorporated, as representative of the several underwriters named in Schedule II of the Underwriting Agreement. [Incorporated by reference to Exhibit 1.1 of the Company’s Current Report on Form 8-K filed on May 11, 2009 (File No. 0-20750).] | |
| 2.1 | Agreement and Plan of Merger Dated July 7, 2005 by and among Sterling Bancshares, Inc., SBPB, Inc., and Prestonwood Bancshares, Inc. [Incorporated by reference to Exhibit 10.1 of the Company’s Quarterly Report on Form 10-Q filed on November 8, 2005 (File No. 000-20750).] | |
| 2.2 | Agreement and Plan of Merger dated July 25, 2006 between Sterling Bancshares, Inc. and BOTH, Inc. [Incorporated by reference to Exhibit 2.1 of the Company’s Current Report on Form 8-K filed on July 26, 2006.] | |
| 2.3 | Agreement and Plan of Merger dated January 24, 2007 between Sterling Bancshares, Inc., Sterling Bank and Partners Bank of Texas. [Incorporated by reference to Exhibit 2.1 of the Company’s Current Report on Form 8-K filed on January 25, 2007.] | |
| 2.4 | Share Exchange Agreement dated May 3, 2007, among the Company, MBM Advisors and the shareholders of MBM Advisors. [Incorporated by reference to Exhibit 2.1 to the Company’s Current Report on Form 8-K filed on May 4, 2007 (File No. 000-20750).] | |
| 3.1 | Restated and Amended Articles of Incorporation of the Company effective August 13, 2007. [Incorporated by reference to Exhibit 3.1 of the Company’s Current Report on Form 8-K filed on August 19, 2007 (File No. 000-20750).] | |
| 3.2 | Amended and Restated Bylaws of Sterling Bancshares, Inc. (as of October 29, 2007). [Incorporated by reference to Exhibit 3.1 of the Company’s Current Report on Form 8-K filed on October 30, 2007 (File No. 000-20750).] | |
| 3.3 | Certificate of Designations of Fixed Rate Cumulative Preferred Stock, Series J, of Sterling Bancshares, Inc. [Incorporated by reference to Exhibit 3.1 to the Company’s Current Report on Form 8-K filed on December 15, 2008 (File No. 0-20750).] | |
| 3.4 | First Amendment to the Amended and Restated Bylaws of Sterling Bancshares, Inc. [Incorporated by reference to Exhibit 3.1 of the Company’s Quarterly Report on Form 10-Q filed on August 6, 2009 (File No. 000-20750).] | |
| 4.1 | Preferred Securities Guarantee Agreement dated March 21, 2001. [Incorporated by reference to Exhibit 4.2 of the Company’s Current Report on Form 8-K filed on March 21, 2001 (File No. 000-20750).] | |
| 4.2 | Indenture dated March 21, 2001. [Incorporated by reference to Exhibit 4.4 of the Company’s Current Report on Form 8-K filed on March 21, 2001 (File No. 000-20750).] | |
| 4.3 | First Supplemental Indenture dated March 21, 2001. [Incorporated by reference to Exhibit 4.5 of the Company’s Current Report on Form 8-K filed on March 21, 2001 (File No. 000-20750).] | |
| 4.4 | Indenture dated August 30, 2002. [Incorporated by reference to Exhibit 4.4 of the Company’s Current Report on Form 8-K filed on September 12, 2002 (File No. 000-20750).] | |
| 4.5 | Junior Subordinated Deferrable Interest Debenture due August 30, 2032. [Incorporated by reference to Exhibit 4.6 of the Company’s Current Report on Form 8-K filed on September 12, 2002 (File No. 000-20750).] | |
| 4.6 | Guarantee Agreement dated August 30, 2002. [Incorporated by reference to Exhibit 4.6 of the Company’s Current Report on Form 8-K filed on September 12, 2002 (File No. 000-20750).] | |
65
Table of Contents
Index to Financial Statements
| Exhibit No. |
||
| 4.7 | Preferred Securities Guarantee Agreement dated September 26, 2002. [Incorporated by reference to Exhibit 4.2 of the Company’s Current Report on Form 8-K dated September 26, 2002 (File No. 000-20750).] | |
| 4.8 | Second Supplemental Indenture dated September 26, 2002. [Incorporated by reference to Exhibit 4.9 of the Company’s Current Report on Form 8-K dated September 26, 2002 (File No. 000-20750).] | |
| 4.9 | 8.30% Junior Subordinated Deferrable Interest Debenture due September 26, 2032. [Incorporated by reference to Exhibit 4.8 of the Company’s Current Report on Form 8-K dated September 26, 2002 (File No. 000-20750).] | |
| 4.10 | Fiscal and Paying Agency Agreement dated April 10, 2003 between Sterling Bank and Deutsche Bank Trust Company Americas. [Incorporated by reference to Exhibit 4.1 of the Company’s Current Report on Form 8-K filed April 15, 2003 (File No. 000-20750).] | |
| 4.11 | Form of Global Certificate representing Sterling Bank’s 7.375% Subordinated Notes due 2013. [Incorporated by reference to Exhibit 4.2 of the Company’s Current Report on Form 8-K filed April 15, 2003 (File No. 000-20750).] | |
| 4.12 | Amended and Restated Declaration of Trust by and among Sterling Bancshares, Inc., as sponsor, Wilmington Trust Company, as institutional trustee and Delaware trustee, and the administrators named therein, dated as of March 26, 2007. [Incorporated by reference to Exhibit 4.1 to the Company’s Current Report on Form 8-K filed on March 30, 2007 (File No. 000-20750).] | |
| 4.13 | Indenture by and between Sterling Bancshares, Inc., as issuer, and Wilmington Trust Company, as trustee, dated as of March 26, 2007. [Incorporated by reference to Exhibit 4.2 to the Company’s Current Report on Form 8-K filed on March 30, 2007 (File No. 000-20750).] | |
| 4.14 | Guarantee Agreement by and between Sterling Bancshares, Inc., as guarantor, and Wilmington Trust Company, as guarantee trustee, dated as of March 26, 2007. [Incorporated by reference to Exhibit 4.3 to the Company’s Current Report on Form 8-K filed on March 30, 2007 (File No. 000-20750).] | |
| 4.15 | Form of Capital Securities Certificate of Sterling Bancshares Capital Trust IV, dated March 26, 2007. [Incorporated by reference to Exhibit 4.4 to the Company’s Current Report on Form 8-K filed on March 30, 2007 (File No. 000-20750).] | |
| 4.16 | Sterling Bancshares, Inc. Deferred Compensation Plan (as Amended and Restated). [Incorporated by reference to Exhibit 4.6 to the Company’s Registration Statement on Form S-8 filed August 29, 2007 (File No. 333-145774 ).] | |
| 4.17 | Form of Stock Certificate for the Series J Preferred Stock. [Incorporated by reference to Exhibit 4.1 to the Company’s Current Report on Form 8-K filed on December 15, 2008 (File No. 0-20750).] | |
| 4.18 | Warrant to Purchase 2,615,557 Shares of Common Stock of Sterling Bancshares, Inc. [Incorporated by reference to Exhibit 4.2 to the Company’s Current Report on Form 8-K filed on December 15, 2008 (File No. 0-20750).] | |
| 10.1*** | 1994 Incentive Stock Option Plan of the Company. [Incorporated by reference to Exhibit 10.1 of the Company’s Annual Report on Form 10-K for the year ended December 31, 1994.] | |
| 10.2 | 1994 Employee Stock Purchase Plan of the Company. [Incorporated by reference to Exhibit 10.2 of the Company’s Annual Report on Form 10-K for the year ended December 31, 1994.] | |
| 10.3*** | 1984 Incentive Stock Option Plan of the Company. [Incorporated by reference to Exhibit 10.1 of the Company’s Registration Statement on Form S-1, effective October 22, 1992 (Registration No. 33-51476).] | |
66
Table of Contents
Index to Financial Statements
| Exhibit No. |
||||
| 10.4*** | 1995 Non-Employee Director Stock Compensation Plan. [Incorporated by reference to Exhibit 4.3 of the Company’s Registration Statement on Form S-8 (File No. 333-16719).] | |||
| 10.5*** | Employment Agreement between Sterling Bancshares, Inc. and J. Downey Bridgwater executed on December 20, 2007, and effective as of January 1, 2007. [Incorporated by reference to Exhibit 10.1 of the Company’s Current Report on Form 8-K filed on December 26, 2007 (File No. 000-207500).] | |||
| 10.6*** | Amended and Restated Employment Agreement between Sterling Bancshares, Inc. and J. Downey Bridgwater executed on December 29, 2008, and effective as of January 1, 2007. [Incorporated by reference to Exhibit 10.1 of the Company’s Current Report on Form 8-K filed on December 29, 2008 (File No. 0-20750).] | |||
| 10.7*** | Amended and restated Sterling Bancshares, Inc. 2003 Stock Incentive and Compensation Plan effective April 30, 2007. [Incorporated by reference to Exhibit 10.1 of the Company’s Current Report on Form 8-K filed on August 14, 2007. (File No. 000-207500).] | |||
| 10.8*** | Form of Severance and Non-Competition Agreements between Sterling Bancshares, Inc., Sterling Bank and the following named executive officers: | |||
| Wanda S. Dalton |
Travis Jaggers | |||
| James W. Goolsby, Jr. |
Graham B. Painter | |||
| [Incorporated by reference to Exhibit 10.2 of the Company’s Quarterly Report on Form 10-Q filed on August 5, 2004 (File No. 000-207501).] | ||||
| 10.9*** | Form of Restricted Stock Agreement. [Incorporated by reference to Exhibit 10.1 of the Company’s Current Report on Form 8-K filed on February 4, 2005 (File No. 000-207500).] | |||
| 10.10*** | Form of Incentive Stock Agreement. [Incorporated by reference to Exhibit 10.2 of the Company’s Current Report on Form 8-K filed on February 4, 2005 (File No. 000-207500).] | |||
| 10.11*** | Severance and Non-Competition Agreement between Sterling Bancshares, Inc., Sterling Bank and Allen Brown executed and effective as of December 1, 2004. [Incorporated by reference to Exhibit 10.1 of the Company’s Current Report on Form 8-K filed on December 7, 2004 (File No. 000-207500).] | |||
| 10.12*** | Short Term Incentive Program for Shared Services. [Incorporated by reference to Exhibit 10.14 of the Company’s Annual Report on Form 10-K for the year ended December 31, 2004.] | |||
| 10.13*** | Short Term Incentive Program for Bank Offices. [Incorporated by reference to Exhibit 10.15 of the Company’s Annual Report on Form 10-K for the year ended December 31, 2004.] | |||
| 10.14*** | Severance and Non-Competition Agreement dated effective January 1, 2005, by and among Sterling Bancshares, Inc., Sterling Bank and Robert S. Smith. [Incorporated by reference to Exhibit 10.1 of the Company’s Current Report on Form 8-K filed on January 13, 2005 (File No. 000-207500).] | |||
| 10.15*** | Non-Compete Agreement between Sterling Bancshares, Inc. and Max W. Wells dated July 7, 2005. [Incorporated by reference to Exhibit 10.2 of the Company’s
Quarterly Report on Form 10-Q filed on November 8, 2005 (File No. 000-207500).] | |||
| 10.16*** | Summary Description of Non-Employee Director compensation. [Incorporated by reference to Exhibit 10.2 of the Company’s Current Report on Form 8-K filed on April 29, 2005 (File No. 000-207500).] | |||
| 10.17*** | Summary of Named Executive Officer Compensation. [Incorporated by reference to Exhibit 10.1 of the Company’s Current Report on Form 8-K filed on April 29, 2005 (File No. 000-207500).] | |||
67
Table of Contents
Index to Financial Statements
| Exhibit No. |
||
| 10.18 | Purchase and Sale Agreement, dated November 13, 2006, between Sterling Bank and First States Group, L.P. [Incorporated by reference to Exhibit 10.1 of the Company’s Current Report on Form 8-K filed on November 17, 2006.] | |
| 10.19*** | Form of Phantom Share Agreement. [Incorporated by reference to Exhibit 10.6 of the Company’s Current Report on Form 8-K filed on August 15, 2006.] | |
| 10.20*** | Severance and Non-Competition Agreement between Sterling Bancshares, Inc., a Texas corporation, and Deborah Dinsmore, dated February 24, 2006. [Incorporated by reference to Exhibit 10.1 of the Company’s Current Report on Form 8-K filed on February 28, 2006.] | |
| 10.21*** | Severance and Non-Competition Agreement between Sterling Bancshares, Inc., a Texas corporation, and C. Wallis McMath, Jr., dated March 1, 2006. [Incorporated by reference to Exhibit 10.1 of the Company’s Current Report on Form 8-K filed on March 6, 2006.] | |
| 10.22*** | Severance and Non-Competition Agreement between Sterling Bancshares, Inc., a Texas corporation, and Zach L. Wasson dated December 4, 2006. [Incorporated by reference to Exhibit 10.1 of the Company’s Current Report on Form 8-K filed on December 6, 2006.] | |
| 10.23 | Placement Agreement by and among Sterling Bancshares, Inc., Sterling Bancshares Capital Trust IV, FTN Financial Capital Markets and Keefe, Bruyette & Woods, Inc., dated March 14, 2007. [Incorporated by reference to Exhibit 10.1 to the Company’s Current Report on Form 8-K filed on March 30, 2007 (File No. 000-20750).] | |
| 10.24 | Long-Term Incentive (LTI) Stock Performance Program. [Incorporated by reference to Exhibit 10.1 to the Company’s Current Report on Form 8-K filed on September 5. 2007 (File No. 000-20750).] | |
| 10.25 | Letter Agreement, dated December 12, 2008, including Securities Purchase Agreement – Standard Terms incorporated by reference therein, by and between Sterling Bancshares, Inc. and the United States Department of Treasury. [Incorporated by reference to Exhibit 10.1 to the Company’s Current Report on Form 8-K filed on December 15, 2008 (File No. 0-20750).] | |
| 10.26 | Form of Letter Agreement executed by Senior Executive Officers. [Incorporated by reference to Exhibit 10.2 to the Company’s Current Report on Form 8-K filed on December 15, 2008 (File No. 0-20750).] | |
| 10.27 | Form of Waiver executed by Senior Executive Officers. [Incorporated by reference to Exhibit 10.3 to the Company’s Current Report on Form 8-K filed on December 15, 2008 (File No. 0-20750).] | |
| 10.28 | Redemption Letter Agreement, dated May 5, 2009, by and between Sterling Bancshares, Inc. and the United States Department of the Treasury. [Incorporated by reference to Exhibit 10.1 to the Company’s Current Report on Form 8-K filed on May 5, 2009 (File No. 0-20750).] | |
| 10.29 | Purchase and Assumption Agreement, dated August 7, 2009, by and between Sterling Bank and First Bank. [Incorporated by reference to Exhibit 10.1 to the Company’s Current Report on Form 8-K filed on August 10, 2009 (File No. 0-20750).] | |
| 10.30*** | Severance and Release Agreement between Sterling Bancshares, Inc. and John A. Rossitto dated October 20, 2009. [Incorporated by reference to Exhibit 10.1 of the Company’s Current Report on Form 8-K filed on October 20, 2009 (File No. 000-207500).] | |
| 10.31 | Termination of Purchase and Assumption Agreement, entered effective December 28, 2009, by and between Sterling Bank and First Bank. [Incorporated by reference to Exhibit 10.1 to the Company’s Current Report on Form 8-K filed on December 29, 2009 (File No. 0-20750).] | |
68
Table of Contents
Index to Financial Statements
| Exhibit No. |
||
| 10.32*** | Irrevocable Waiver executed by J. Downey Bridgwater, President and Chief Executive Officer of Sterling Bancshares, Inc., dated as of December 29, 2009. [Incorporated by reference to Exhibit 10.1 to the Company’s Current Report on Form 8-K filed on December 29, 2009 (File No. 0-20750).] | |
| 10.33*** | Voluntary Separation and Release Agreement dated effective December 31, 2009, by and between Sterling Bancshares, Inc. and Sonny B. Lyles. [Incorporated by reference to Exhibit 10.1 of the Company’s Current Report on Form 8-K filed on January 4, 2010 (File No. 000-207500).] | |
| 21.1* | Subsidiaries of the Company. | |
| 23.1* | Consent of Deloitte & Touche LLP, Independent Registered Public Accounting Firm. | |
| 31.1* | Certification of J. Downey Bridgwater, Chairman, President and Chief Executive Officer, as required pursuant to Section 302 of the Sarbanes-Oxley Act of 2002. | |
| 31.2* | Certification of Zach L. Wasson, Executive Vice President and Chief Financial Officer, as required pursuant to Section 302 of the Sarbanes-Oxley Act of 2002. | |
| 32.1** | Certification pursuant to 18 U.S.C. Section 1350, as adopted pursuant to Section 906 of the Sarbanes-Oxley Act of 2002. | |
| 32.2** | Certification pursuant to 18 U.S.C. Section 1350, as adopted pursuant to Section 906 of the Sarbanes-Oxley Act of 2002. | |
| * | As filed herewith. |
| ** | As furnished herewith. |
| *** | Management Compensation Agreement. |
69
Table of Contents
Index to Financial Statements
TABLE OF CONTENTS
| Page | ||
| F-2 | ||
| CONSOLIDATED FINANCIAL STATEMENTS: |
||
| F-3 | ||
| F-4 | ||
| F-5 | ||
| F-6 | ||
| F-7 | ||
F-1
Table of Contents
Index to Financial Statements
REPORT OF INDEPENDENT REGISTERED PUBLIC ACCOUNTING FIRM
To the Board of Directors and Shareholders of
Sterling Bancshares, Inc.
Houston, Texas
We have audited the accompanying consolidated balance sheets of Sterling Bancshares, Inc. and subsidiaries (the “Bank”) as of December 31, 2009 and 2008, and the related consolidated statements of income, shareholders’ equity, and cash flows for each of the three years in the period ended December 31, 2009. These financial statements are the responsibility of the Company’s management. Our responsibility is to express an opinion on these financial statements based on our audits.
We conducted our audits in accordance with the standards of the Public Company Accounting Oversight Board (United States). Those standards require that we plan and perform the audit to obtain reasonable assurance about whether the financial statements are free of material misstatement. An audit includes examining, on a test basis, evidence supporting the amounts and disclosures in the financial statements. An audit also includes assessing the accounting principles used and significant estimates made by management, as well as evaluating the overall financial statement presentation. We believe that our audits provide a reasonable basis for our opinion.
In our opinion, such consolidated financial statements present fairly, in all material respects, the financial position of Sterling Bancshares, Inc. and subsidiaries as of December 31, 2009 and 2008, and the results of their operations and their cash flows for each of the three years in the period ended December 31, 2009, in conformity with accounting principles generally accepted in the United States of America.
We have also audited, in accordance with the standards of the Public Company Accounting Oversight Board (United States), the Company’s internal control over financial reporting as of December 31, 2009, based on the criteria established in Internal Control—Integrated Framework issued by the Committee of Sponsoring Organizations of the Treadway Commission and our report dated February 23, 2010 expressed an unqualified opinion on the Bank’s internal control over financial reporting.
Houston, Texas
February 23, 2010
F-2
Table of Contents
Index to Financial Statements
STERLING BANCSHARES, INC. AND SUBSIDIARIES
CONSOLIDATED BALANCE SHEETS
DECEMBER 31, 2009 AND 2008
(In thousands, except share amounts)
| 2009 | 2008 | |||||||
| ASSETS |
||||||||
| Cash and cash equivalents |
$ | 246,215 | $ | 113,163 | ||||
| Available-for-sale securities, at fair value |
846,216 | 633,357 | ||||||
| Held-to-maturity securities, at amortized cost |
222,845 | 172,039 | ||||||
| Loans held for sale |
11,778 | 1,524 | ||||||
| Loans held for investment |
3,233,273 | 3,792,290 | ||||||
| Total loans |
3,245,051 | 3,793,814 | ||||||
| Allowance for loan losses |
(74,732 | ) | (49,177 | ) | ||||
| Loans, net |
3,170,319 | 3,744,637 | ||||||
| Premises and equipment, net |
48,816 | 46,875 | ||||||
| Real estate acquired by foreclosure |
16,763 | 5,625 | ||||||
| Goodwill |
173,210 | 173,210 | ||||||
| Core deposits and other intangibles, net |
11,626 | 13,874 | ||||||
| Accrued interest receivable |
16,502 | 19,428 | ||||||
| Other assets |
184,536 | 157,771 | ||||||
| TOTAL ASSETS |
$ | 4,937,048 | $ | 5,079,979 | ||||
| LIABILITIES AND SHAREHOLDERS’ EQUITY |
||||||||
| LIABILITIES: |
||||||||
| Deposits: |
||||||||
| Noninterest-bearing demand |
$ | 1,144,133 | $ | 1,123,746 | ||||
| Interest-bearing demand |
2,004,539 | 1,523,969 | ||||||
| Certificates and other time |
946,279 | 1,171,422 | ||||||
| Total deposits |
4,094,951 | 3,819,137 | ||||||
| Other borrowed funds |
97,245 | 408,586 | ||||||
| Subordinated debt |
77,338 | 78,335 | ||||||
| Junior subordinated debt |
82,734 | 82,734 | ||||||
| Accrued interest payable and other liabilities |
44,247 | 48,048 | ||||||
| Total liabilities |
4,396,515 | 4,436,840 | ||||||
| COMMITMENTS AND CONTINGENCIES |
— | — | ||||||
| SHAREHOLDERS’ EQUITY: |
||||||||
| Preferred stock, $1 par value, 1,000,000 shares authorized, no shares issued or outstanding at December 31, 2009, 125,198 shares issued and outstanding at December 31, 2008 |
— | 118,012 | ||||||
| Common stock, $1 par value, 150,000,000 shares authorized, 83,720,767 and 75,127,636 issued and 81,853,266 and 73,260,136 outstanding at December 31, 2009 and 2008, respectively |
83,721 | 75,128 | ||||||
| Capital surplus |
170,848 | 121,918 | ||||||
| Retained earnings |
295,909 | 332,009 | ||||||
| Treasury stock, at cost, 1,867,500 shares held at December 31, 2009 and 2008 |
(21,399 | ) | (21,399 | ) | ||||
| Accumulated other comprehensive income, net of tax |
11,454 | 17,471 | ||||||
| Total shareholders’ equity |
540,533 | 643,139 | ||||||
| TOTAL LIABILITIES AND SHAREHOLDERS’ EQUITY |
$ | 4,937,048 | $ | 5,079,979 | ||||
See notes to consolidated financial statements.
F-3
Table of Contents
Index to Financial Statements
STERLING BANCSHARES, INC. AND SUBSIDIARIES
CONSOLIDATED STATEMENTS OF INCOME
FOR THE YEARS ENDED DECEMBER 31, 2009, 2008, AND 2007
(In thousands, except per share amounts)
| 2009 | 2008 | 2007 | |||||||||
| Interest income: |
|||||||||||
| Loans, including fees |
$ | 201,225 | $ | 241,157 | $ | 260,101 | |||||
| Securities: |
|||||||||||
| Taxable |
36,417 | 29,660 | 23,849 | ||||||||
| Non-taxable |
3,616 | 3,632 | 3,494 | ||||||||
| Deposits in financial institutions |
154 | 10 | 35 | ||||||||
| Other earning assets |
80 | 165 | 770 | ||||||||
| Total interest income |
241,492 | 274,624 | 288,249 | ||||||||
| Interest expense: |
|||||||||||
| Demand and savings deposits |
16,024 | 17,285 | 29,217 | ||||||||
| Certificates and other time deposits |
24,051 | 37,443 | 55,691 | ||||||||
| Other borrowed funds |
1,897 | 11,607 | 6,829 | ||||||||
| Subordinated debt |
3,325 | 4,474 | 4,649 | ||||||||
| Junior subordinated debt |
4,486 | 5,731 | 6,239 | ||||||||
| Total interest expense |
49,783 | 76,540 | 102,625 | ||||||||
| Net interest income |
191,709 | 198,084 | 185,624 | ||||||||
| Provision for credit losses |
87,631 | 29,917 | 3,820 | ||||||||
| Net interest income after provision for credit losses |
104,078 | 168,167 | 181,804 | ||||||||
| Noninterest income: |
|||||||||||
| Customer service fees |
15,431 | 15,771 | 14,327 | ||||||||
| Net gain (loss) on sale of securities |
(1,792 | ) | 478 | 3 | |||||||
| Other-than-temporary impairment loss on securities: |
|||||||||||
| Impairment loss on securities |
(2,690 | ) | (722 | ) | — | ||||||
| Noncredit-related loss recognized in other comprehensive income |
2,676 | — | — | ||||||||
| Net impairment loss on securities |
(14 | ) | (722 | ) | — | ||||||
| Wealth management fees |
7,953 | 8,984 | 5,662 | ||||||||
| Other |
14,317 | 16,516 | 16,228 | ||||||||
| Total noninterest income |
35,895 | 41,027 | 36,220 | ||||||||
| Noninterest expense: |
|||||||||||
| Salaries and employee benefits |
86,930 | 85,253 | 81,039 | ||||||||
| Occupancy |
23,826 | 21,782 | 18,366 | ||||||||
| Technology |
9,850 | 9,794 | 8,843 | ||||||||
| Professional fees |
4,702 | 4,707 | 4,159 | ||||||||
| Postage, delivery and supplies |
2,866 | 3,672 | 3,611 | ||||||||
| Marketing |
1,930 | 2,545 | 1,809 | ||||||||
| Core deposits and other intangibles amortization |
2,247 | 2,328 | 2,137 | ||||||||
| Acquisition costs |
1,134 | 562 | 920 | ||||||||
| FDIC insurance assessments |
8,830 | 2,525 | 410 | ||||||||
| Other |
20,869 | 20,042 | 18,060 | ||||||||
| Total noninterest expense |
163,184 | 153,210 | 139,354 | ||||||||
| Income (loss) before income taxes |
(23,211 | ) | 55,984 | 78,670 | |||||||
| Income tax provision (benefit) |
(10,237 | ) | 17,365 | 25,708 | |||||||
| Net income (loss) |
$ | (12,974 | ) | $ | 38,619 | $ | 52,962 | ||||
| Preferred stock dividends |
9,342 | 398 | — | ||||||||
| Net income (loss) applicable to common shareholders |
$ | (22,316 | ) | $ | 38,221 | $ | 52,962 | ||||
| Earnings (loss) per common share: |
|||||||||||
| Basic |
$ | (0.28 | ) | $ | 0.52 | $ | 0.73 | ||||
| Diluted |
$ | (0.28 | ) | $ | 0.52 | $ | 0.72 | ||||
See notes to consolidated financial statements.
F-4
Table of Contents
Index to Financial Statements
STERLING BANCSHARES, INC. AND SUBSIDIARIES
CONSOLIDATED STATEMENTS OF SHAREHOLDERS’ EQUITY
FOR THE YEARS ENDED DECEMBER 31, 2009, 2008, AND 2007
(In thousands)
| Preferred Stock | Common Stock | Capital Surplus |
Retained Earnings |
Treasury Stock | Accumulated Other Comprehensive income/(loss) |
Total | |||||||||||||||||||||||||||||||
| Shares | Amount | Shares | Amount | Shares | Amount | ||||||||||||||||||||||||||||||||
| BALANCE AT DECEMBER 31, 2006 |
— | $ | — | 71,938 | $ | 71,938 | $ | 80,927 | $ | 272,179 | (938 | ) | $ | (10,902 | ) | $ | (4,857 | ) | $ | 409,285 | |||||||||||||||||
| Comprehensive income: |
|||||||||||||||||||||||||||||||||||||
| Net income |
52,962 | 52,962 | |||||||||||||||||||||||||||||||||||
| Net change in unrealized gains and losses on available-for-sale securities, net of taxes of $2,641 |
4,903 | 4,903 | |||||||||||||||||||||||||||||||||||
| Net change in unrealized gains and losses on effective cash flow hedging derivatives, net of taxes of $2,967 |
5,510 | 5,510 | |||||||||||||||||||||||||||||||||||
| Total comprehensive income |
63,375 | ||||||||||||||||||||||||||||||||||||
| Issuance of common stock under incentive compensation plans |
628 | 628 | 4,237 | 4,865 | |||||||||||||||||||||||||||||||||
| Common stock issued for vested restricted stock, net of shares forfeited |
77 | 77 | (77 | ) | — | ||||||||||||||||||||||||||||||||
| Stock-based compensation expense |
1,738 | 1,738 | |||||||||||||||||||||||||||||||||||
| Issuance of common stock in connection with the purchase of Partners Bank of Texas |
2,345 | 2,345 | 24,176 | 26,521 | |||||||||||||||||||||||||||||||||
| Shares held in Rabbi Trust |
(62 | ) | (62 | ) | (634 | ) | (696 | ) | |||||||||||||||||||||||||||||
| Repurchase of common stock |
(830 | ) | (9,591 | ) | (9,591 | ) | |||||||||||||||||||||||||||||||
| Common stock dividends paid |
(15,238 | ) | (15,238 | ) | |||||||||||||||||||||||||||||||||
| BALANCE AT DECEMBER 31, 2007 |
— | — | 74,926 | 74,926 | 110,367 | 309,903 | (1,768 | ) | (20,493 | ) | 5,556 | 480,259 | |||||||||||||||||||||||||
| Comprehensive income: |
|||||||||||||||||||||||||||||||||||||
| Net income |
38,619 | 38,619 | |||||||||||||||||||||||||||||||||||
| Net change in unrealized gains and losses on available-for-sale securities, net of taxes of $3,032 |
5,631 | 5,631 | |||||||||||||||||||||||||||||||||||
| Net change in unrealized gains and losses on effective cash flow hedging derivatives, net of taxes of $3,299 |
6,126 | 6,126 | |||||||||||||||||||||||||||||||||||
| Less: Reclassification adjustment for losses included in net income, net of taxes of $85 |
158 | 158 | |||||||||||||||||||||||||||||||||||
| Total comprehensive income |
50,534 | ||||||||||||||||||||||||||||||||||||
| Issuance of preferred stock: |
|||||||||||||||||||||||||||||||||||||
| Preferred stock, at fair value |
125,198 | 117,945 | 117,945 | ||||||||||||||||||||||||||||||||||
| Detachable warrants, at fair value |
7,253 | 7,253 | |||||||||||||||||||||||||||||||||||
| Preferred stock dividend and amortization of preferred stock discount |
— | 67 | (398 | ) | (331 | ) | |||||||||||||||||||||||||||||||
| Issuance of common stock under incentive compensation plans |
158 | 158 | 884 | 1,042 | |||||||||||||||||||||||||||||||||
| Common stock issued for vested restricted stock, net of shares forfeited |
63 | 63 | (63 | ) | — | ||||||||||||||||||||||||||||||||
| Stock-based compensation expense |
3,643 | 3,643 | |||||||||||||||||||||||||||||||||||
| Shares held in Rabbi Trust |
(19 | ) | (19 | ) | (166 | ) | (185 | ) | |||||||||||||||||||||||||||||
| Repurchase of common stock |
(100 | ) | (906 | ) | (906 | ) | |||||||||||||||||||||||||||||||
| Common stock dividends paid |
(16,115 | ) | (16,115 | ) | |||||||||||||||||||||||||||||||||
| BALANCE AT DECEMBER 31, 2008 |
125,198 | 118,012 | 75,128 | 75,128 | 121,918 | 332,009 | (1,868 | ) | (21,399 | ) | 17,471 | 643,139 | |||||||||||||||||||||||||
| Comprehensive loss: |
|||||||||||||||||||||||||||||||||||||
| Net loss |
(12,974 | ) | (12,974 | ) | |||||||||||||||||||||||||||||||||
| Net change in unrealized gains and losses on available-for-sale securities, net of taxes of $4,001 |
7,431 | 7,431 | |||||||||||||||||||||||||||||||||||
| Net change in unrealized gains and losses on effective cash flow hedging derivatives, net of taxes of $5,374 |
(9,981 | ) | (9,981 | ) | |||||||||||||||||||||||||||||||||
| Less: Reclassification adjustment for gains on available-for-sale included in net income, net of taxes of $1,867 |
(3,467 | ) | (3,467 | ) | |||||||||||||||||||||||||||||||||
| Total comprehensive loss |
(18,991 | ) | |||||||||||||||||||||||||||||||||||
| Preferred stock redemption, accelerated dividend and amortization of preferred stock discount |
(125,198 | ) | (118,012 | ) | (7,186 | ) | (125,198 | ) | |||||||||||||||||||||||||||||
| Issuance of common stock |
8,280 | 8,280 | 46,282 | 54,562 | |||||||||||||||||||||||||||||||||
| Issuance of common stock under incentive compensation plans and related tax effects |
260 | 260 | 192 | 452 | |||||||||||||||||||||||||||||||||
| Common stock issued for vested restricted stock |
63 | 63 | (63 | ) | — | ||||||||||||||||||||||||||||||||
| Stock-based compensation expense |
2,572 | 2,572 | |||||||||||||||||||||||||||||||||||
| Shares held in Rabbi Trust |
(10 | ) | (10 | ) | (53 | ) | (63 | ) | |||||||||||||||||||||||||||||
| Preferred stock dividends paid |
(2,156 | ) | (2,156 | ) | |||||||||||||||||||||||||||||||||
| Common stock dividends paid |
(13,784 | ) | (13,784 | ) | |||||||||||||||||||||||||||||||||
| BALANCE AT DECEMBER 31, 2009 |
— | $ | — | 83,721 | $ | 83,721 | $ | 170,848 | $ | 295,909 | (1,868 | ) | $ | (21,399 | ) | $ | 11,454 | $ | 540,533 | ||||||||||||||||||
See notes to consolidated financial statements.
F-5
Table of Contents
Index to Financial Statements
STERLING BANCSHARES, INC. AND SUBSIDIARIES
CONSOLIDATED STATEMENTS OF CASH FLOWS
FOR THE YEARS ENDED DECEMBER 31, 2009, 2008, AND 2007
(In thousands)
| Year Ended | ||||||||||||
| 2009 | 2008 | 2007 | ||||||||||
| CASH FLOWS FROM OPERATING ACTIVITIES: |
||||||||||||
| Net income (loss) |
$ | (12,974 | ) | $ | 38,619 | $ | 52,962 | |||||
| Adjustments to reconcile net income (loss) to net cash provided by operating activities: |
||||||||||||
| Amortization and accretion of premiums and discounts on securities, net |
2,109 | 1,578 | 2,194 | |||||||||
| Net (gain) loss on securities |
1,792 | (478 | ) | (3 | ) | |||||||
| Other-than-temporary impairment loss on securities |
14 | 722 | — | |||||||||
| Net gain on trading assets |
— | — | (2 | ) | ||||||||
| Net gain on loans |
1,160 | (200 | ) | (1,991 | ) | |||||||
| Provision for credit losses |
87,631 | 29,917 | 3,820 | |||||||||
| Writedowns, less gains on sale, of real estate acquired by foreclosure |
3,085 | (40 | ) | (254 | ) | |||||||
| Depreciation and amortization |
10,499 | 10,646 | 9,056 | |||||||||
| Proceeds from principal paydowns of trading securities |
— | — | 1 | |||||||||
| Proceeds from the sale of trading securities |
— | — | 13,137 | |||||||||
| Purchases of trading assets |
— | — | (13,136 | ) | ||||||||
| Deferred income tax benefit |
(13,498 | ) | (8,367 | ) | (1,659 | ) | ||||||
| Stock-based compensation expense (net of tax benefit recognized) |
2,016 | 2,647 | 1,244 | |||||||||
| Excess tax benefits from share-based payment arrangements |
(37 | ) | (24 | ) | (372 | ) | ||||||
| Net decrease in loans held for sale |
278 | 9,366 | 977 | |||||||||
| Net loss (gain) on sale of bank assets |
156 | (146 | ) | (717 | ) | |||||||
| Net (increase) decrease in accrued interest receivable and other assets |
(20,640 | ) | (2,321 | ) | 4,701 | |||||||
| Net (decrease) increase in accrued interest payable and other liabilities |
(3,840 | ) | (2,967 | ) | 158 | |||||||
| Net cash provided by operating activities |
57,751 | 78,952 | 70,116 | |||||||||
| CASH FLOWS FROM INVESTING ACTIVITIES: |
||||||||||||
| Proceeds from the maturities or calls and paydowns of held-to-maturity securities |
22,867 | 16,219 | 14,775 | |||||||||
| Proceeds from the sale of held-to-maturity securities |
21,244 | — | — | |||||||||
| Proceeds from the maturities or calls and paydowns of available-for-sale securities |
197,445 | 105,644 | 86,189 | |||||||||
| Proceeds from the sale of available-for-sale securities |
106,639 | 28,398 | 2,600 | |||||||||
| Purchases of available-for-sale securities |
(510,887 | ) | (283,580 | ) | (139,681 | ) | ||||||
| Purchases of held-to-maturity securities |
(102,088 | ) | (8,218 | ) | (30,689 | ) | ||||||
| Net decrease (increase) in loans held for investment |
442,383 | (364,984 | ) | (198,802 | ) | |||||||
| Proceeds from sale of loans originated as held for investment |
23,098 | 12,712 | 49,909 | |||||||||
| Purchase of bank-owned life insurance |
— | (13,875 | ) | — | ||||||||
| Proceeds from sale of real estate acquired by foreclosure |
6,743 | 5,839 | 1,080 | |||||||||
| Purchase of Partners Bank of Texas (including transaction costs) |
— | — | (25,319 | ) | ||||||||
| Cash and cash equivalents acquired with Partners Bank of Texas |
— | — | 33,324 | |||||||||
| Purchase of MBM Advisors, Inc. (including transaction costs) |
— | — | (6,900 | ) | ||||||||
| Cash and cash equivalents acquired with MBM Advisors, Inc. |
— | — | 104 | |||||||||
| Payment of earnout obligations related to the acquisition of MBM Advisors, Inc. |
— | (2,222 | ) | — | ||||||||
| Cash and cash equivalents acquired with First Horizon National Corp. branch acquisition |
— | 15,301 | — | |||||||||
| Net change in interest-bearing deposits in financial institutions |
— | — | 198 | |||||||||
| Proceeds from sale of premises and equipment |
55 | 168 | 428 | |||||||||
| Purchase of premises and equipment |
(10,969 | ) | (16,464 | ) | (8,730 | ) | ||||||
| Net cash provided by (used in) investing activities |
196,530 | (505,062 | ) | (221,514 | ) | |||||||
| CASH FLOWS FROM FINANCING ACTIVITIES: |
||||||||||||
| Net increase in deposit accounts |
275,814 | 60,132 | 173,334 | |||||||||
| Net (decrease) increase in other borrowed funds |
(311,341 | ) | 161,439 | (68,242 | ) | |||||||
| Proceeds from issuance of subordinated debt |
— | 25,000 | — | |||||||||
| Proceeds from issuance of long-term borrowings |
— | 50,000 | 40,000 | |||||||||
| Issuance of trust preferred securities |
— | — | 25,774 | |||||||||
| Proceeds from issuance of common stock under incentive compensation plans |
900 | 1,016 | 4,580 | |||||||||
| Proceeds from issuance of common stock, net of expenses |
54,562 | — | — | |||||||||
| Repurchase of common stock for Rabbi Trust |
(63 | ) | (156 | ) | — | |||||||
| Repurchase of common stock |
— | (935 | ) | (10,287 | ) | |||||||
| Excess tax benefits from share-based payment arrangements |
37 | 24 | 372 | |||||||||
| Proceeds from issuance of preferred stock |
— | 125,198 | — | |||||||||
| Redemption of preferred stock |
(125,198 | ) | — | — | ||||||||
| Preferred stock dividends paid |
(2,156 | ) | — | — | ||||||||
| Common stock dividends paid |
(13,784 | ) | (16,115 | ) | (15,238 | ) | ||||||
| Net cash (used in) provided by financing activities |
(121,229 | ) | 405,603 | 150,293 | ||||||||
| NET INCREASE (DECREASE) IN CASH AND CASH EQUIVALENTS |
133,052 | (20,507 | ) | (1,105 | ) | |||||||
| CASH AND CASH EQUIVALENTS: |
||||||||||||
| Beginning of period |
113,163 | 133,670 | 134,775 | |||||||||
| End of period |
$ | 246,215 | $ | 113,163 | $ | 133,670 | ||||||
| Supplemental information: |
||||||||||||
| Income taxes paid |
$ | 13,500 | $ | 26,625 | $ | 23,250 | ||||||
| Interest paid |
52,863 | 79,304 | 104,973 | |||||||||
| Noncash investing and financing activities— |
||||||||||||
| Acquisition of real estate through foreclosure of collateral |
20,966 | 7,741 | 3,044 | |||||||||
| Transfer of loans from held for investment to held for sale |
36,693 | — | — | |||||||||
| Transfer of loans from held for sale to held for investment |
— | 112,129 | 36,094 | |||||||||
| Acquisition of Partners Bank of Texas |
||||||||||||
| Common stock issued |
— | — | 26,521 | |||||||||
| Acquisition of MBM Advisors, Inc. |
||||||||||||
| Payable to MBM Advisors, Inc. shareholders |
— | — | 4,442 | |||||||||
See notes to consolidated financial statements.
F-6
Table of Contents
Index to Financial Statements
STERLING BANCSHARES, INC. AND SUBSIDIARIES
NOTES TO CONSOLIDATED FINANCIAL STATEMENTS
FOR THE YEARS ENDED DECEMBER 31, 2009, 2008 AND 2007
| 1. | ORGANIZATION AND SUMMARY OF SIGNIFICANT ACCOUNTING AND REPORTING POLICIES |
Organization—Sterling Bancshares, Inc. (“Sterling Bancshares” and together with its subsidiaries, the “Company”), headquartered in Houston, Texas, is a bank holding company that has served the banking needs of small to medium-sized businesses for over 35 years. The Company provides commercial and consumer banking services in the greater metropolitan areas of Houston, San Antonio, Dallas and Fort Worth, Texas through the 58 banking centers of Sterling Bank (the “Bank”), a banking association chartered under the laws of the state of Texas.
Summary of Significant Accounting and Reporting Policies—The accounting and reporting policies of the Company conform to accounting principles generally accepted in the United States of America and the prevailing practices within the financial services industry. A summary of significant accounting policies follows:
Basis of Presentation—The consolidated financial statements include the accounts of Sterling Bancshares and its subsidiaries. Intercompany transactions have been eliminated in consolidation. Operations are managed and financial performance is evaluated on a company-wide basis. Accordingly, all of the Company’s banking operations are considered by management to be aggregated in one reportable operating segment. Because the overall banking operations comprise the vast majority of the consolidated operations, no separate segment disclosures are presented.
The Company has evaluated subsequent events through February 23, 2010, the date the financial statements were issued.
Use of Estimates—The preparation of financial statements requires management to make estimates and assumptions that affect the reported amounts in the financial statements. Actual results could differ from those estimates. Material estimates that are particularly susceptible to significant change in the near term relate to the determination of the allowance for credit losses, the fair values of financial instruments, the valuation of foreclosed real estate, deferred tax assets, goodwill and other intangibles, and stock-based compensation.
Securities—Securities classified as held-to-maturity are carried at amortized cost, adjusted for the amortization of premiums and the accretion of discounts. Management does not intend to sell the securities and it is not more likely than not that the Company will be required to sell the securities before recovery of their amortized cost basis. Under certain circumstances (including the deterioration of the issuer’s creditworthiness or a change in tax law or statutory or regulatory requirements), these securities may be sold or transferred to another portfolio.
For debt securities where the Company has determined that an other-than-temporary impairment (“OTTI”) exists and the Company does not intend to sell the security or if it is not more likely than not that the Company will be required to sell the security before recovery of its amortized cost basis, the impairment is separated into the amount that is credit-related and the amount due to all other factors. The credit-related impairment is recognized in earnings, and is the difference between a security’s amortized cost basis and the present value of expected future cash flows discounted at the security’s effective interest rate. For debt securities classified as held-to-maturity, the amount of noncredit-related impairment recognized in other comprehensive income is accreted over the remaining life of the debt security as an increase in the carrying value of the security.
F-7
Table of Contents
Index to Financial Statements
STERLING BANCSHARES, INC. AND SUBSIDIARIES
NOTES TO CONSOLIDATED FINANCIAL STATEMENTS—(Continued)
FOR THE YEARS ENDED DECEMBER 31, 2009, 2008 AND 2007
Securities classified as available-for-sale are carried at fair value. Unrealized gains and losses are excluded from earnings and reported, net of tax, as accumulated comprehensive income or loss until realized. Declines in the fair value of individual securities below their cost that are determined to be other-than-temporary would result in writedowns, as a realized loss, of the individual securities to their fair value. In evaluating other-than-temporary impairment losses, management considers several factors including the severity and the duration of time that the fair value has been less than cost, the credit quality of the issuer, and the intent and ability of the Company to hold the security until recovery of the fair value. Securities within the available-for-sale portfolio may be used as part of the Company’s asset and liability management strategy and may be sold in response to changes in interest rate risk, prepayment risk or other factors.
Premiums and discounts are amortized and accreted to operations using the level-yield method of accounting, adjusted for prepayments as applicable. The specific identification method of accounting is used to compute gains or losses on the sales of securities. Interest earned on these assets is included in interest income.
Loans Held for Sale—Loans held for sale are carried at the lower of aggregate cost or market value. Premiums, discounts and loan fees (net of certain direct loan origination costs) on loans held for sale are deferred until the related loans are sold or repaid. Gains or losses on loan sales are recognized at the time of sale and determined using the specific identification method.
Loans are classified as held for sale when management has positively determined that the loans will be sold in the foreseeable future and the Company has the ability to do so. The classification may be made upon origination or subsequent to the origination or purchase. Once a decision has been made to sell loans not previously classified as held for sale, such loans are transferred into the held for sale classification and carried at the lower of cost or fair value.
Loans Held for Investment—Loans held for investment are stated at the principal amount outstanding, net of the unearned discount and net deferred loan fees or costs. Interest income for loans is recognized principally by the simple interest method.
The Company provides equipment financing to its customers through a variety of lease arrangements. Direct financing leases are included in loans held for investment and carried at the aggregate of lease payments receivable plus estimated residual value of the leased property, less unearned income.
A loan is defined as impaired when, based on current information and events, it is probable that the Company will be unable to collect all amounts due, both interest and principal, according to the contractual terms of the loan agreement. If an individually evaluated loan is considered impaired, a specific valuation allowance is allocated through an increase to the allowance for credit losses, if necessary, so that the loan is reported net, at the present value of estimated future cash flows using the loan’s existing rate or at the fair value of the collateral. Impaired loans, or portions thereof, are charged-off when deemed uncollectible. Interest payments on impaired loans are typically applied to principal unless collectability of the principal amount is reasonably assured, in which case interest is recognized in income.
Loans are classified as a restructured-accruing loan in cases where a borrower experiences financial difficulty but is current on their payments and the Company makes certain concessionary modifications to contractual terms. Restructured loans typically involve a modification of terms such as a reduction of the
F-8
Table of Contents
Index to Financial Statements
STERLING BANCSHARES, INC. AND SUBSIDIARIES
NOTES TO CONSOLIDATED FINANCIAL STATEMENTS—(Continued)
FOR THE YEARS ENDED DECEMBER 31, 2009, 2008 AND 2007
stated interest rate or face amount of the loan, a reduction of accrued interest, or an extension of the maturity date(s) at a stated interest rate lower than the current market rate for a new loan with similar risk.
Generally, a nonaccrual loan that is restructured remains on nonaccrual for a period of six months to demonstrate that the borrower can meet the restructured terms. However, performance prior to the restructuring, or significant events that coincide with the restructuring, are included in assessing whether the borrower can meet the new terms and may result in the loan being returned to accrual at the time of restructuring or after a shorter performance period. If the borrower’s ability to meet the revised payment schedule is uncertain, the loan remains classified as a nonaccrual loan.
Nonperforming Loans and Past Due Loans—Nonperforming loans are loans which have been categorized by management as nonaccrual because collection of interest is doubtful.
When the payment of principal or interest on a loan is delinquent for 90 days, or earlier in some cases, the loan is placed on nonaccrual status unless the loan is in the process of collection and the underlying collateral fully supports the carrying value of the loan. If the decision is made to continue accruing interest on the loan, periodic reviews are made to evaluate the appropriateness of its accruing status. When a loan is placed on nonaccrual status, all accrued but unpaid interest is charged to operations. Generally, any payments received on nonaccrual loans are applied first to outstanding loan amounts and next to the recovery of charged-off loan amounts. Any excess is treated as a recovery of lost interest.
Allowance for Credit Losses—The allowance for credit losses is a valuation allowance for losses incurred on loans and binding loan commitments. The allowance for losses on unfunded loan commitments is included in other liabilities. The allowance for credit losses is established through charges to earnings in the form of a provision for credit losses and is reduced by net charge-offs.
Throughout the year, management estimates the probable level of losses to determine whether the allowance for credit losses is adequate to absorb inherent losses in the existing portfolio. Based on these estimates, an amount is charged to the provision for credit losses and credited to the allowance for credit losses in order to adjust the allowance to a level determined to be adequate to absorb losses.
Management’s judgment as to the level of probable inherent losses on existing loans involves the consideration of current and anticipated economic conditions and their potential effects on specific borrowers; an evaluation of the existing relationships among loans, potential credit losses and the present level of the allowance; results of examinations of the loan portfolio by regulatory agencies; and management’s internal review of the loan portfolio. In determining the collectibility of certain loans, management also considers the fair value of any underlying collateral. The amount ultimately realized may differ from the carrying value of these assets because of economic, operating or other conditions beyond the Company’s control.
Estimates of credit losses involve an exercise of judgment. While it is reasonably possible that in the near term the Company may sustain losses which are substantial relative to the allowance for credit losses, it is the judgment of management that the allowance for credit losses reflected in the Consolidated Balance Sheets is adequate to absorb probable losses that exist in the current loan portfolio.
Premises and Equipment—Land is carried at cost. Premises and equipment are stated at cost, less accumulated depreciation and amortization. Depreciation expense is computed primarily using the straight-
F-9
Table of Contents
Index to Financial Statements
STERLING BANCSHARES, INC. AND SUBSIDIARIES
NOTES TO CONSOLIDATED FINANCIAL STATEMENTS—(Continued)
FOR THE YEARS ENDED DECEMBER 31, 2009, 2008 AND 2007
line method over the estimated useful lives (ranging from three to forty years) of the assets. Leasehold improvements are amortized using the straight-line method over the periods of the leases or the estimated useful lives, whichever is shorter.
The Company evaluates for impairment its long-lived assets to be held and used, and long-lived assets to be disposed of, whenever events or changes in circumstances indicate that the carrying amount of an asset may not be recoverable. Impairment is determined using the undiscounted operating cash flows estimated over the remaining useful life of the related long-lived asset and the eventual disposal. In the event of impairment, the asset is written down to its fair market value. Assets to be disposed of are recorded at the lower of net book value or fair market value less cost to sell and are classified as assets held for sale on the consolidated balance sheet at the date management commits to a plan of disposal.
Goodwill and Other Intangibles—Intangible assets consist primarily of core deposits and customer relationships. Intangible assets with definite useful lives are amortized on an accelerated basis over their estimated lives. Goodwill and intangible assets that have indefinite useful lives are subject to at least an annual impairment test and more frequently if a triggering event occurs. The goodwill impairment test involves a two-step process. Goodwill is assigned to reporting units for purposes of impairment testing. Reporting units used for the goodwill impairment testing include our banking operations and MBM Advisors, Inc. (“MBM Advisors”). Under the first step, the estimation of fair value of the reporting units is compared with its carrying value including goodwill. If step one indicates a potential impairment, the second step is performed to measure the amount of impairment, if any. Goodwill impairment exists when the implied fair value of goodwill is less than its carrying value. The implied fair value of goodwill is determined by allocating the fair value of the reporting units in a manner similar to a purchase price allocation. As part of its impairment analysis, the Company uses a variety of methodologies in determining the fair value of the reporting units, including cash flow analyses that are consistent with the assumptions management believes hypothetical marketplace participants would use.
Real Estate Acquired by Foreclosure—The Company records real estate acquired by foreclosure at fair value less estimated costs to sell. Adjustments are made to reflect declines in value subsequent to acquisition, if any, below the recorded amounts. Required developmental costs associated with foreclosed property under construction are capitalized and considered in determining the fair value of the property. Operating expenses of such properties and gains and losses on their disposition are included in noninterest expense.
Derivative Financial Instruments—The Company’s interest rate risk management strategy includes hedging the repricing characteristics of certain assets and liabilities so as to mitigate adverse effects on the Company’s net interest margin and cash flows from changes in interest rates. The Company uses certain derivative instruments to add stability to the Company’s net interest income and to manage the Company’s exposure to interest rate movements.
The Company may designate a derivative as either an accounting hedge of the fair value of a recognized fixed rate asset or an unrecognized firm commitment (“fair value” hedge) or an accounting hedge of a forecasted transaction or of the variability of future cash flows of a floating rate asset or liability (“cash flow” hedge). All derivatives are recorded as other assets or other liabilities on the balance sheet at their respective fair values. To the extent a hedge is considered effective, changes in the fair value of a derivative that is designated and qualifies as a cash flow hedge are recorded in other comprehensive income, net of income taxes. For all hedge relationships, ineffectiveness resulting from differences between the changes in fair value or cash flows of the hedged item and changes in fair value of the derivative are recognized as other income in the results of operations.
F-10
Table of Contents
Index to Financial Statements
STERLING BANCSHARES, INC. AND SUBSIDIARIES
NOTES TO CONSOLIDATED FINANCIAL STATEMENTS—(Continued)
FOR THE YEARS ENDED DECEMBER 31, 2009, 2008 AND 2007
The Company estimates the fair value of its interest rate derivatives using a standardized methodology that nets the discounted expected future cash receipts and cash payments (based on observable market inputs). These future net cash flows, however, are susceptible to change due primarily to fluctuations in interest rates. As a result, the estimated values of these derivatives will typically change over time as cash is received and paid and also as market conditions change. As these changes take place, they may have a positive or negative impact on our estimated valuations.
Fair Value Measurements—The Company determines the fair market values of its financial instruments based on the fair value hierarchy established which requires an entity to maximize the use of observable inputs and minimize the use of unobservable inputs when measuring fair value. Therefore, fair value measurements are determined based on the assumptions that market participants would use in pricing the asset or liability and establishes a fair value hierarchy. The fair value hierarchy consists of three levels of inputs that may be used to measure fair value.
Income Taxes—Sterling Bancshares files a consolidated federal income tax return with its subsidiaries. Each entity in the consolidated group computes income taxes as if it filed a separate return and remits to, or is reimbursed by Sterling Bancshares based on the portion of taxes currently due or refundable.
Deferred income taxes are accounted for by applying statutory tax rates in effect at the balance sheet date to differences between the book basis and the tax basis of assets and liabilities. The resulting deferred tax assets and liabilities are adjusted to reflect changes in enacted tax laws or rates. The Company has established, and periodically reviews and re-evaluates, an estimated contingent tax liability on its consolidated balance sheet to provide for the possibility of adverse outcomes in tax matters.
Realization of net deferred tax assets is based upon the level of historical income and on estimates of future taxable income. Although realization is not assured, management believes it is more likely than not that all of the net deferred tax assets will be realized.
Stock-based Compensation—The Company’s stock-based compensation policy applies to all forms of stock-based compensation including stock options, restricted stock units, shares acquired under the Employee Stock Purchase Plan and performance based phantom units. All stock-based compensation is accounted for under the fair value method as required by generally accepted accounting principles in the United States. The expense associated with stock-based compensation is recognized over the vesting period of each individual arrangement.
The fair value of each stock option award is estimated on the date of grant using a Black-Scholes-Merton option valuation model. The fair value of restricted stock and phantom stock units is based on the current market price on the date of grant. The fair value of each performance based share unit is estimated based on expected performance goals being attained. Compensation expense associated with the Employee Stock Purchase Plan is determined using a Black-Scholes-Merton option pricing formula.
Profit Sharing Plan—The Company has a profit sharing plan that covers substantially all employees. Contributions to the plan are accrued and paid only when the Bank records predetermined earnings per share performance and achieves a minimum return on average assets consistent with the approved plan year budget.
Cash and Cash Equivalents—Cash and cash equivalents include cash, due from banks and federal funds sold. Generally, federal funds are invested for one-day periods.
F-11
Table of Contents
Index to Financial Statements
STERLING BANCSHARES, INC. AND SUBSIDIARIES
NOTES TO CONSOLIDATED FINANCIAL STATEMENTS—(Continued)
FOR THE YEARS ENDED DECEMBER 31, 2009, 2008 AND 2007
Earnings Per Common Share—Earnings per common share (“EPS”) are presented under two formats: basic EPS and diluted EPS. Basic EPS is computed by dividing net income available to common shareholders (after deducting dividends on preferred stock) by the weighted average number of shares outstanding during the year excluding nonvested stock. Diluted EPS is computed by dividing net income available to common shareholders (after deducting dividends on preferred stock) by the weighted average number of shares outstanding and nonvested stock adjusted for the incremental shares issuable upon exercise of outstanding stock options and warrants. Diluted EPS excludes common stock equivalents whose effect is anti-dilutive.
Comprehensive Income—Comprehensive income includes all changes in equity during the period presented that result from transactions and other economic events other than transactions with shareholders. The Company reports comprehensive income in the consolidated statements of shareholders’ equity.
New Accounting Guidance—In June 2009, the Financial Accounting Standards Board (“FASB”) issued Accounting Standards Codification (“ASC”) 105 Generally Accepted Accounting Principles. The ASC is the official source of authoritative United States Generally Accepted Accounting Principles (“GAAP”) superseding existing FASB, American Institute of Certified Public Accountants, Emerging Issues Task Force, and related literature. Rules and interpretive releases of the Securities and Exchange Commission (“SEC”) under the authority of federal securities laws are also sources of authoritative GAAP for SEC registrants. All other accounting literature is considered non-authoritative. The switch to the ASC affects the way companies refer to GAAP in financial statements and accounting policies. ASC 105 became effective during the third quarter of 2009 and did not have a significant impact on the Company’s financial statements.
Business Combinations: On January 1, 2009, new authoritative accounting guidance under ASC 805 Business Combinations became applicable to the Company’s accounting for business combinations closing on or after January 1, 2009. ASC 805 requires the acquiring entity in a business combination to recognize the assets acquired and liabilities assumed in the transaction; establishes the acquisition-date fair value as the measurement objective for all assets acquired and liabilities assumed; and requires the acquirer to disclose to investors and other users all of the information they need to evaluate and understand the nature and financial effect of the business combination. Assets acquired and liabilities assumed in a business combination that arise from contingencies should be recognized at fair value on the acquisition date if fair value can be determined during the measurement period. If fair value cannot be determined, companies should typically account for the acquired contingencies using existing accounting guidance. ASC 805 will apply to future acquisitions by the Company subsequent to January 1, 2009.
Derivatives and Hedging: ASC 815 Derivatives and Hedging amends and expands the disclosure requirements for derivatives and hedging activities to provide greater transparency about (i) how and why an entity uses derivative instruments, (ii) how derivative instruments and related hedged items are accounted for under ASC 815 and its related interpretations, and (iii) how derivative instruments and related hedged items affect an entity’s financial position, results of operations and cash flows. To meet those objectives, the new authoritative accounting guidance requires qualitative disclosures about objectives and strategies for using derivatives, quantitative disclosures about fair value amounts of gains and losses on derivative instruments and disclosures about credit-risk-related contingent features in derivative agreements. The new authoritative accounting guidance under ASC 815 became effective for the Company on January 1, 2009 and the required disclosures are reported in Note 13—Derivative Financial Instruments.
Fair Value Measurement and Disclosures: ASC 820 Fair Value Measurement and Disclosures affirms that the fair value measurement objective when a market is not active is the price that would be received by the
F-12
Table of Contents
Index to Financial Statements
STERLING BANCSHARES, INC. AND SUBSIDIARIES
NOTES TO CONSOLIDATED FINANCIAL STATEMENTS—(Continued)
FOR THE YEARS ENDED DECEMBER 31, 2009, 2008 AND 2007
holder of the financial asset in an orderly transaction (an exit price notion) that is not a forced liquidation or distressed sale at the measurement date. Additionally, in determining fair value for a financial asset, the use of a reporting entity’s own assumptions about future cash flows and appropriately risk-adjusted discount rates is acceptable when relevant observable inputs are not available. Broker (or pricing service) quotes may be an appropriate input when measuring fair value, but they are not necessarily determinative if an active market does not exist for the financial asset. ASC 820 provides additional guidance when the volume and level of activity for the asset or liability have significantly decreased and includes guidance on identifying circumstances that indicate a transaction is not orderly. The Company adopted ASC 820 during the quarter ended June 30, 2009. ASC 820 did not have a significant impact on the Company’s financial condition and results of operations. The enhanced disclosures related to ASC 820 are included in Note 21—Disclosures about Fair Value of Financial Instruments.
Investments – Debt and Equity Securities: ASC 320 Investments—Debt and Equity Securities amends the other-than-temporary impairment guidance in GAAP for debt securities to make the guidance more operational and to improve the presentation and disclosure of other-than-temporary impairments on debt and equity securities in the financial statements. ASC 320 requires an entity to recognize the credit component of an other-than- temporary impairment of a debt security in earnings and the noncredit component in other comprehensive income when the entity does not intend to sell the security and it is not more likely than not that the entity will be required to sell the security prior to recovery. ASC 320 became effective for interim and annual reporting periods ending after June 15, 2009. The Company adopted ASC 320 during the quarter ended June 30, 2009. The expanded disclosures and discussion of other-than-temporarily impaired debt securities related to ASC 320 are included in Note 3—Securities.
Financial Instruments: ASC 825 Financial Instruments requires expanded disclosures about fair value of financial instruments for interim reporting periods of publicly traded companies as well as in annual financial statements. The expanded disclosure requirements for ASC 825 are included in Note 21—Disclosures about Fair Value of Financial Instruments.
Earnings Per Share: ASC 260 Earnings Per Share provides that unvested share-based payment awards that contain nonforfeitable rights to dividends or dividend equivalents (whether paid or unpaid) that are participating securities and shall be included in the computation of earnings per share pursuant to the two-class method. The Company does not have unvested share-based payment awards that contain rights to dividends or dividend equivalents that are participating securities.
Subsequent Events: ASC 855 Subsequent Events addresses events which occur after the balance sheet date but before the issuance of financial statements. Under ASC 855, an entity must record the effects of subsequent events that provide evidence about conditions that existed at the balance sheet date and must disclose but not record the effects of subsequent events which provide evidence about conditions that did not exist at the balance sheet date. The Company adopted ASC 855 and has included the required disclosures above.
Transfers and Servicing: ASC 860 Transfers and Servicing improves the relevance, representational faithfulness, and comparability of the information that a reporting entity provides in its financial statements about a transfer of financial assets; the effects of a transfer on its financial position, financial performance, and cash flows; and a transferor’s continuing involvement, if any, in transferred financial assets. ASC 860 is effective for annual reporting periods that begin after November 15, 2009, for interim periods within the first annual reporting period and for interim and annual reporting periods thereafter, with early adoption prohibited. ASC 860 must be applied to transfers occurring on or after the effective date. The adoption of ASC 860 did not have a significant impact on the Company’s financial condition and results of operations.
F-13
Table of Contents
Index to Financial Statements
STERLING BANCSHARES, INC. AND SUBSIDIARIES
NOTES TO CONSOLIDATED FINANCIAL STATEMENTS—(Continued)
FOR THE YEARS ENDED DECEMBER 31, 2009, 2008 AND 2007
Consolidation: ASC 810 Consolidation improves financial reporting by enterprises involved with variable interest entities and any significant changes in risk exposure due to that involvement as well as its affect on the entity’s financial statements. ASC 810 is effective as of the beginning of each reporting entity’s first annual reporting period that begins after November 15, 2009, for interim periods within the first annual reporting period, and for interim and annual reporting periods thereafter, with earlier adoption prohibited. The adoption of ASC 810 did not have a significant impact on the Company’s financial condition and results of operations.
| 2. | ACQUISITIONS AND DIVESTITURES |
Acquisitions. During the third quarter of 2009, the Bank entered into a definitive purchase and assumption agreement to acquire approximately $500 million in deposits and 19 Texas bank branches from First Bank Inc. (“First Bank”), a Missouri state-chartered bank. In addition, the Bank would purchase approximately $230 million of performing business and consumer-related Texas-based loans from First Bank. During the fourth quarter of 2009, the Company and First Bank terminated this agreement, without penalty to either party. This was a mutual decision after it was determined that the transaction could not be completed by December 31, 2009, as contemplated by the purchase and assumption agreement.
On February 8, 2008, the Company acquired ten branches located in the Dallas and Fort Worth, Texas areas from First Horizon National Corp. (“First Horizon”). This transaction was accounted for using the purchase method of accounting in which the excess of the purchase price over the estimated fair value of the net assets acquired was recorded as goodwill. In addition to these ten bank branches, the Company also agreed to acquire land from First Horizon for possible future Sterling banking centers in Lewisville, Arlington and Fort Worth, Texas. This transaction allowed the Company to achieve a critical presence in Dallas, Texas and an entry into the growing Fort Worth, Texas market. The Company acquired approximately $85.9 million in total assets and assumed deposit accounts of approximately $85.3 million for a premium of $1.7 million. Assets consisted of approximately $54.0 million in loans, $10.9 million in premises and equipment and $15.9 million in cash and other assets. The assets and liabilities have been recorded at fair value based on market conditions and risk characteristics at the acquisition date. Excess cost over tangible net assets acquired totaled $5.3 million, of which $231 thousand and $5.1 million have been allocated to core deposits and goodwill, respectively, all of which is expected to be deductible for tax purposes. The results of operations for this acquisition have been included in the Company’s financial results since February 8, 2008.
On June 28, 2007, the Company acquired MBM Advisors. MBM Advisors was an independent investment advisory and pension administration/consulting firm with approximately $700 million in assets under management at the time of acquisition and provided full-services in the design, administration, investment management, and communication of retirement plans with offices in both Houston and Dallas, Texas. The acquisition of MBM Advisors provides for increased opportunities to serve the owners of small and medium-sized businesses and their employees while enhancing noninterest income. The Company entered into a share exchange agreement with MBM Advisors and the shareholders of MBM Advisors in which the Company paid the shareholders an aggregate amount in cash equal to $6.0 million on the date of merger. An unconditional guaranteed cash payment of $3.0 million, payable over a three year earn-out period was recorded as part of the purchase price at the estimated net present value. The agreement includes an earn-out which is contingent upon maintaining or achieving specified earnings levels in future periods. When the contingency is resolved and additional consideration is distributable, the Company records the fair value of the consideration issued as an additional cost of the acquisition. The Company recorded $2.6 million for 2007 as part of the earn-out as an additional cost of the acquisition. There was no earn-out recorded for 2008
F-14
Table of Contents
Index to Financial Statements
STERLING BANCSHARES, INC. AND SUBSIDIARIES
NOTES TO CONSOLIDATED FINANCIAL STATEMENTS—(Continued)
FOR THE YEARS ENDED DECEMBER 31, 2009, 2008 AND 2007
or 2009. At December 31, 2009, the remaining maximum amount of future payments the Company could be required to make under contingent payment provisions was approximately $4.4 million in the form of cash. This acquisition was accounted for using the purchase method of accounting in which the excess of the purchase price over the estimated fair value of the net assets acquired was recorded as goodwill of $7.9 million, all of which is expected to be deductible for tax purposes. The results of operations for this acquisition have been included in the Company’s financial results since the third quarter of 2007.
On March 30, 2007, the Company acquired Partners Bank of Texas (“Partners Bank”). Partners Bank was a privately held bank which operated four banking offices in the Houston area. The completion of the acquisition of Partners Bank has enabled the Company to fill out its footprint in Northeast Houston. As of March 30, 2007, Partners Bank had assets of approximately $191 million, loans of $142 million and deposits of $166 million. The purchase price of $52.3 million consisted of $26.5 million of the Company’s common stock (2.3 million shares), cash totaling approximately $25.5 million and $264 thousand in acquisition-related costs. The shares of the Company’s common stock issued in the transaction were valued at the average of the closing price of the Company’s common stock for the ten trading days immediately before the fifth trading day before March 30, 2007. This acquisition was accounted for using the purchase method of accounting in which the excess of the purchase price over the estimated fair value of the net assets acquired was recorded as goodwill of $30.1 million, none of which is expected to be deductible for tax purposes. The results of operations for this acquisition have been included in the Company’s financial results since the second quarter of 2007.
| 3. | SECURITIES |
The amortized cost and fair value of securities are as follows (in thousands):
| December 31, 2009 | |||||||||||||
| Amortized Cost |
Gross Unrealized Gains |
Gross Unrealized Losses |
Fair Value | ||||||||||
| Available-for-Sale |
|||||||||||||
| Obligations of the U.S. Treasury and other U.S. government agencies |
$ | 56,417 | $ | 139 | $ | (69 | ) | $ | 56,487 | ||||
| Obligations of states of the U.S. and political subdivisions |
1,235 | 35 | — | 1,270 | |||||||||
| Mortgage-backed securities and collateralized mortgage obligations |
762,337 | 14,578 | (2,903 | ) | 774,012 | ||||||||
| Other securities |
13,915 | 660 | (128 | ) | 14,447 | ||||||||
| Total |
$ | 833,904 | $ | 15,412 | $ | (3,100 | ) | $ | 846,216 | ||||
| Held-to-Maturity |
|||||||||||||
| Obligations of states of the U.S. and political subdivisions |
$ | 101,091 | $ | 3,479 | $ | (80 | ) | $ | 104,490 | ||||
| Mortgage-backed securities and collateralized mortgage obligations |
121,754 | 281 | (4,185 | ) | 117,850 | ||||||||
| Total |
$ | 222,845 | $ | 3,760 | $ | (4,265 | ) | $ | 222,340 | ||||
F-15
Table of Contents
Index to Financial Statements
STERLING BANCSHARES, INC. AND SUBSIDIARIES
NOTES TO CONSOLIDATED FINANCIAL STATEMENTS—(Continued)
FOR THE YEARS ENDED DECEMBER 31, 2009, 2008 AND 2007
| December 31, 2008 | |||||||||||||
| Amortized Cost |
Gross Unrealized Gains |
Gross Unrealized Losses |
Fair Value | ||||||||||
| Available-for-Sale |
|||||||||||||
| Obligations of the U.S. Treasury and other U.S. government agencies |
$ | 1,749 | $ | 25 | $ | — | $ | 1,774 | |||||
| Obligations of states of the U.S. and political subdivisions |
1,331 | 27 | — | 1,358 | |||||||||
| Mortgage-backed securities and collateralized mortgage obligations |
608,811 | 8,487 | (1,270 | ) | 616,028 | ||||||||
| Other securities |
15,252 | — | (1,055 | ) | 14,197 | ||||||||
| Total |
$ | 627,143 | $ | 8,539 | $ | (2,325 | ) | $ | 633,357 | ||||
| Held-to-Maturity |
|||||||||||||
| Obligations of states of the U.S. and political subdivisions |
$ | 95,910 | $ | 1,930 | $ | (228 | ) | $ | 97,612 | ||||
| Mortgage-backed securities and collateralized mortgage obligations |
76,129 | 86 | (9,967 | ) | 66,248 | ||||||||
| Total |
$ | 172,039 | $ | 2,016 | $ | (10,195 | ) | $ | 163,860 | ||||
Expected maturities of securities will differ from contractual maturities because borrowers may have the right to call or prepay obligations with or without call or prepayment penalties. The contractual maturities of securities at December 31, 2009 are shown below (in thousands):
| Available-for-Sale | Held-to-Maturity | |||||||||||
| Amortized Cost |
Fair Value | Amortized Cost |
Fair Value | |||||||||
| Due in one year or less |
$ | 32,853 | $ | 32,817 | $ | 11,946 | $ | 12,072 | ||||
| Due after one year through five years |
24,799 | 24,940 | 48,342 | 50,561 | ||||||||
| Due after five years through ten years |
— | — | 32,714 | 33,598 | ||||||||
| Due after ten years |
— | — | 8,089 | 8,259 | ||||||||
| Mortgage-backed securities and collateralized mortgage obligations |
762,337 | 774,012 | 121,754 | 117,850 | ||||||||
| Other securities |
13,915 | 14,447 | — | — | ||||||||
| Total |
$ | 833,904 | $ | 846,216 | $ | 222,845 | $ | 222,340 | ||||
The Company does not own securities of any one issuer (other than the U.S. government and its agencies) for which the aggregate adjusted cost exceeds 10% of consolidated shareholders’ equity at December 31, 2009.
Securities with carrying values totaling $242 million and fair values totaling $251 million were pledged to secure public deposits at December 31, 2009.
F-16
Table of Contents
Index to Financial Statements
STERLING BANCSHARES, INC. AND SUBSIDIARIES
NOTES TO CONSOLIDATED FINANCIAL STATEMENTS—(Continued)
FOR THE YEARS ENDED DECEMBER 31, 2009, 2008 AND 2007
Gross Unrealized Losses and Fair Value
The following table shows the gross unrealized losses and fair value of securities by length of time that individual securities in each category had been in a continuous loss position (in thousands). Debt securities on which we have taken only credit-related OTTI write-downs are categorized as being “less than 12 months” or “more than 12 months” in a continuous loss position based on the point in time that the fair value declined to below the cost basis and not the period of time since the OTTI write-down.
| December 31, 2009 | ||||||||||||||||||||
| Less than 12 Months | More than 12 Months | |||||||||||||||||||
| Amortized Cost |
Gross Unrealized Losses |
Fair Value | Amortized Cost |
Gross Unrealized Losses |
Fair Value | |||||||||||||||
| Available-for-Sale |
||||||||||||||||||||
| Obligations of the U.S. Treasury and other U.S. government agencies |
$ | 17,492 | $ | (69 | ) | $ | 17,423 | $ | — | $ | — | $ | — | |||||||
| Obligations of states of the U.S. and political subdivisions |
— | — | — | — | — | — | ||||||||||||||
| Mortgage-backed securities and collateralized mortgage obligations |
214,750 | (2,201 | ) | 212,549 | 4,282 | (702 | ) | 3,580 | ||||||||||||
| Other securities |
— | — | — | 12,089 | (128 | ) | 11,961 | |||||||||||||
| Total |
$ | 232,242 | $ | (2,270 | ) | $ | 229,972 | $ | 16,371 | $ | (830 | ) | $ | 15,541 | ||||||
| Held-to-Maturity |
||||||||||||||||||||
| Obligations of states of the U.S. and political subdivisions |
$ | 4,985 | $ | (80 | ) | $ | 4,905 | $ | — | $ | — | $ | — | |||||||
| Mortgage-backed securities and collateralized mortgage obligations |
82,385 | (960 | ) | 81,425 | 29,991 | (3,225 | ) | 26,766 | ||||||||||||
| Total |
$ | 87,370 | $ | (1,040 | ) | $ | 86,330 | $ | 29,991 | $ | (3,225 | ) | $ | 26,766 | ||||||
| December 31, 2008 | ||||||||||||||||||||
| Less than 12 Months | More than 12 Months | |||||||||||||||||||
| Amortized Cost |
Gross Unrealized Losses |
Fair Value | Amortized Cost |
Gross Unrealized Losses |
Fair Value | |||||||||||||||
| Available-for-Sale |
||||||||||||||||||||
| Obligations of the U.S. Treasury and other U.S. government agencies |
$ | — | $ | — | $ | — | $ | — | $ | — | $ | — | ||||||||
| Obligations of states of the U.S. and political subdivisions |
— | — | — | — | — | — | ||||||||||||||
| Mortgage-backed securities and collateralized mortgage obligations |
83,184 | (603 | ) | 82,581 | 33,961 | (667 | ) | 33,294 | ||||||||||||
| Other securities |
3,152 | (483 | ) | 2,669 | 12,100 | (572 | ) | 11,528 | ||||||||||||
| Total |
$ | 86,336 | $ | (1,086 | ) | $ | 85,250 | $ | 46,061 | $ | (1,239 | ) | $ | 44,822 | ||||||
| Held-to-Maturity |
||||||||||||||||||||
| Obligations of states of the U.S. and political subdivisions |
$ | 13,392 | $ | (228 | ) | $ | 13,164 | $ | — | $ | — | $ | — | |||||||
| Mortgage-backed securities and collateralized mortgage obligations |
39,557 | (5,506 | ) | 34,051 | 30,499 | (4,461 | ) | 26,038 | ||||||||||||
| Total |
$ | 52,949 | $ | (5,734 | ) | $ | 47,215 | $ | 30,499 | $ | (4,461 | ) | $ | 26,038 | ||||||
F-17
Table of Contents
Index to Financial Statements
STERLING BANCSHARES, INC. AND SUBSIDIARIES
NOTES TO CONSOLIDATED FINANCIAL STATEMENTS—(Continued)
FOR THE YEARS ENDED DECEMBER 31, 2009, 2008 AND 2007
For all security types discussed below where no OTTI is considered necessary at December 31, 2009, the Company does not intend to sell the securities and it is not more likely than not that the Company will be required to sell the securities before recovery of their amortized cost basis.
Obligations of the U.S. Treasury and other U.S. government agencies: The agency securities consist of discount notes and medium-term notes issued by the Federal Home Loan Bank (“FHLB”), Federal Home Loan Mortgage Corporation (“FHLMC”), and Federal National Mortgage Association (“FNMA”). These securities are fixed rate and may be callable at the option of the issuer. They were purchased at premiums or discounts. They have maturity dates up to seven years and have contractual cash flows guaranteed by agencies of the U.S. Government. The decline in fair value was generally attributable to interest rates and not credit quality. As such, no OTTI is considered necessary for these securities at December 31, 2009.
Obligations of states of the U.S. and political subdivisions: The municipal bonds are largely comprised of General Obligation (GO) bonds issued by school districts or municipalities. These bonds have fixed-rates and maturities of 15 years or less. During 2008, there were credit rating downgrades announced with regard to most of the insurers of the Company’s municipal bonds. These insurers provide a credit enhancement for the vast majority of municipal bond securities owned by the Company. Despite these downgrades, the municipal bonds owned by the Company are all considered to be investment grade due either to the underlying credit rating of the issuer or the current credit rating of the insurer. These securities will continue to be monitored as part of our ongoing impairment analysis, but are expected to perform as agreed, even if the nationally recognized statistical ratings organizations (“NRSROs”) further reduce the credit rating of the bond insurers.
Mortgage-backed securities and collateralized mortgage obligations (“CMO”): The agency mortgage-backed securities are comprised largely of fixed and variable rate residential mortgage-backed securities issued by the Government National Mortgage Association (“GNMA”), FNMA, or FHLMC. They have maturity dates of up to 40 years and have contractual cash flows guaranteed by agencies of the U.S. Government. The decline in fair value was generally attributable to changes in interest rates and not credit quality. As such, no OTTI was considered necessary for these securities at December 31, 2009, except as discussed below.
Other securities: These securities include certain interest-only securities, which are tied to underlying government guaranteed loans and are subject to prepayment and interest rate fluctuations. In addition, this category of securities includes a Community Reinvestment Act oriented mutual fund. The Company does not intend to sell these securities, and it is not more likely than not that the Company will be required to sell the securities before a recovery of their amortized cost basis. As such, no OTTI is considered necessary for these securities at December 31, 2009.
Other-Than-Temporarily Impaired Debt Securities
Declines in the fair value of individual securities below their amortized cost are assessed to determine whether the impairment is other-than-temporary. The initial indication of OTTI for both debt and equity securities is the duration and length of time the market value has been below cost. Additionally, the Company considers recent events specific to the issuer, including investment downgrades by rating agencies and economic conditions within its industry, and whether it is more likely than not that the Company will be required to sell the security before a recovery in value.
For debt securities, the Company assesses whether OTTI is present when it is probable that the Company will be unable to collect all amounts due according to the contractual terms of the security. When assessing
F-18
Table of Contents
Index to Financial Statements
STERLING BANCSHARES, INC. AND SUBSIDIARIES
NOTES TO CONSOLIDATED FINANCIAL STATEMENTS—(Continued)
FOR THE YEARS ENDED DECEMBER 31, 2009, 2008 AND 2007
whether the entire amortized cost basis of the security will be recovered, the Company compares the present value of cash flows expected to be collected from the security with the amortized cost basis of the security. If present value of cash flows expected to be collected is less than the amortized cost basis of the security, the entire amortized cost basis of the security will not be recovered (that is, a credit loss exists), and an OTTI is considered to have occurred.
Held-to-Maturity (HTM) Debt Securities
For debt securities where the Company has determined that an OTTI exists and the Company does not intend to sell the security or if it is not more likely than not that the Company will be required to sell the security before recovery of its amortized cost basis, the impairment is separated into the amount that is credit-related and the amount due to all other factors. The credit-related impairment is recognized in earnings, and is the difference between a security’s amortized cost basis and the present value of expected future cash flows discounted at the security’s effective interest rate. For debt securities classified as held-to-maturity, the amount of noncredit-related impairment recognized in other comprehensive income is accreted over the remaining life of the debt security as an increase in the carrying value of the security.
The Company recorded a $14.0 thousand credit-related OTTI during the second quarter of 2009 on one held-to-maturity debt security, based on its cash flow analysis. This security was issued in 2007 and was backed by hybrid adjustable-rate residential mortgage loans. At June 30, 2009, the date of OTTI, this security had an amortized cost basis of $7.3 million and a fair value of $4.4 million. As of the date of OTTI, this security was rated triple-A by Standard and Poor’s (“S&P”) and single-B by Fitch Ratings, Ltd. (“Fitch”) (Moody’s Investor Service (“Moody’s”) does not rate this security). At June 30, 2009, the Company did not have an intent to sell the security, and it was not more likely than not that the Company would be required to sell the investment before recovery of its remaining amortized cost basis. Therefore, at the date of impairment the amount of the credit-related OTTI, $14.0 thousand, was recognized in earnings and the amount of the noncredit-related impairment of $2.7 million, was recognized in other comprehensive income. During 2009, $355 thousand of noncredit-related impairment that was recognized previously in other comprehensive income was accreted as an increase in the carrying value of the security. Subsequent to June 30, 2009, this security was further downgraded to a CC rating. The continued credit deterioration of this security combined with an increase in the number and amount of below investment grade securities within the Company’s security portfolio contributed to the Company’s decision to sell this security during the fourth quarter of 2009. As a result, the remaining unamortized noncredit-related impairment of $2.5 million that was previously recorded in other comprehensive income was recognized as a realized loss on sale of securities. The Company did not recognize any further OTTI losses during 2009.
As of December 31, 2009, the Company owned 12 Private Label CMOs with a total amortized cost basis of $33.6 million as of December 31, 2009 and these securities are carried as held-to-maturity. The unrealized losses on the Company’s Private Label CMO portfolio as of December 31, 2009 are generally attributable to the widespread deterioration in economic and credit market conditions over the last 24 months. All of the Company’s Private Label CMO securities are backed by residential mortgage loans and were rated in the highest available investment grade category at the time of their purchase. They continue to be rated by one or more of the following NRSROs: Moody’s, S&P and/or Fitch. As of December 31, 2009, 8 of the 12 Private Label CMOs owned by the Company have been downgraded by one grade or more by at least one of the NRSROs. All of the 8 downgraded securities, were rated “investment grade” (BBB or the Moody’s equivalent rating or higher), as of December 31, 2009.
F-19
Table of Contents
Index to Financial Statements
STERLING BANCSHARES, INC. AND SUBSIDIARIES
NOTES TO CONSOLIDATED FINANCIAL STATEMENTS—(Continued)
FOR THE YEARS ENDED DECEMBER 31, 2009, 2008 AND 2007
The Company regularly reviews various credit quality metrics relating to individual Private Label CMOs, such as the ratio of credit enhancement to expected losses along with the ratio of credit enhancement to severely delinquent loans (loans 60 days or more delinquent). For certain securities, the Company develops more detailed loss projections by more specifically evaluating the residential mortgage loans collateralizing the security along with expected default rates and loss severities. Based upon this analysis, a cash flow analysis is conducted of the security to determine if the Company will recover its entire amortized cost basis in the security.
Because the Company currently expects to recover the entire amortized cost basis of these 16 Private Label CMOs and because the Company does not intend to sell the securities and it is not more likely than not that the Company will be required to sell the securities before recovery of their amortized cost basis, the Company does not consider any of its Private Label CMOs to be other-than-temporarily impaired at December 31, 2009.
Available-for-Sale (AFS) Securities
During the third quarter of 2008, the Company recorded a $722 thousand OTTI loss on certain interest-only strips within the available-for-sale category. These securities are tied to an underlying government guaranteed loan and are subject to prepayment and interest rate fluctuations. For available-for-sale securities, there was no OTTI recorded during the year ended December 31, 2009.
Realized Gains and Losses on Sales of Securities
HTM Debt Securities
During the fourth quarter of 2009, the Bank sold five private-label CMO’s including one CMO that we recorded an OTTI impairment on during the second quarter of 2009 resulting in a realized loss of $7.1 million. The decision to sell these securities in the fourth quarter of 2009 was due to the significant credit downgrading of the securities during 2009 which caused these securities to be classified as “substandard” assets by management. The credit rating on these securities declined from primarily AAA ratings in 2008 to credit ratings ranging from B3 to CC in 2009. Throughout 2009, the Company monitored these securities noting a significant decline in the credit ratings in under a year. In addition, the underlying performance of these securities had continued to deteriorate as delinquencies continued to increase. Given these credit downgrades, the current economic uncertainty along with the increasing levels of delinquencies being reported for all residential mortgage loans, the Company believed there was additional risk associated with holding these securities until maturity. These securities had a carrying value of $24.1 million at the time of sale.
The following table shows the gross realized gains and losses on the sales of held-to-maturity securities (in thousands).
| December 31, | ||||||||||
| 2009 | 2008 | 2007 | ||||||||
| Proceeds from sales and calls |
$ | 21,244 | $ | — | $ | — | ||||
| Gross realized gains |
14 | — | — | |||||||
| Gross realized losses |
(7,140 | ) | — | — | ||||||
F-20
Table of Contents
Index to Financial Statements
STERLING BANCSHARES, INC. AND SUBSIDIARIES
NOTES TO CONSOLIDATED FINANCIAL STATEMENTS—(Continued)
FOR THE YEARS ENDED DECEMBER 31, 2009, 2008 AND 2007
Available-for-Sale (AFS) Securities
The following table shows the gross realized gains on the sales of available-for-sale securities (in thousands).
| December 31, | |||||||||
| 2009 | 2008 | 2007 | |||||||
| Proceeds from sales and calls |
$ | 106,639 | $ | 28,398 | $ | 2,600 | |||
| Gross realized gains |
5,334 | 478 | 3 | ||||||
| Gross realized losses |
— | — | — | ||||||
| 4. | LOANS |
The loan portfolio is classified by major type as follows (in thousands):
| December 31, | ||||||
| 2009 | 2008 | |||||
| Loans held for sale |
||||||
| Real estate: |
||||||
| Commercial |
$ | 10,698 | $ | 697 | ||
| Residential mortgage |
1,080 | 827 | ||||
| Total loans held for sale |
11,778 | 1,524 | ||||
| Loans held for investment |
||||||
| Domestic |
||||||
| Commercial and industrial |
795,789 | 1,093,942 | ||||
| Real estate: |
||||||
| Commercial |
1,667,038 | 1,763,712 | ||||
| Construction |
360,444 | 545,303 | ||||
| Residential mortgage |
344,807 | 309,622 | ||||
| Consumer/other |
52,124 | 63,883 | ||||
| Foreign loans |
||||||
| Commercial and industrial |
10,752 | 13,577 | ||||
| Other loans |
2,319 | 2,251 | ||||
| Total loans held for investment |
3,233,273 | 3,792,290 | ||||
| Total loans |
$ | 3,245,051 | $ | 3,793,814 | ||
F-21
Table of Contents
Index to Financial Statements
STERLING BANCSHARES, INC. AND SUBSIDIARIES
NOTES TO CONSOLIDATED FINANCIAL STATEMENTS—(Continued)
FOR THE YEARS ENDED DECEMBER 31, 2009, 2008 AND 2007
Loan maturities and rate sensitivity of the loans held for investment, excluding residential mortgage and consumer loans, at December 31, 2009 were as follows (in thousands):
| Due in One Year or Less |
Due After One Year Through Five Years |
Due After Five Years |
Total | |||||||||
| Commercial and industrial |
$ | 539,736 | $ | 212,706 | $ | 43,347 | $ | 795,789 | ||||
| Real estate—commercial |
225,121 | 804,373 | 637,544 | 1,667,038 | ||||||||
| Real estate—construction |
165,090 | 120,225 | 75,129 | 360,444 | ||||||||
| Foreign loans |
8,825 | 1,486 | 2,522 | 12,833 | ||||||||
| Total loans |
$ | 938,772 | $ | 1,138,790 | $ | 758,542 | $ | 2,836,104 | ||||
| Loans with a fixed interest rate |
$ | 187,065 | $ | 779,227 | $ | 212,914 | $ | 1,179,206 | ||||
| Loans with a floating interest rate |
751,707 | 359,563 | 545,628 | 1,656,898 | ||||||||
| Total loans |
$ | 938,772 | $ | 1,138,790 | $ | 758,542 | $ | 2,836,104 | ||||
The loan portfolio consists of various types of loans with approximately 90% outstanding to borrowers located in the Houston, San Antonio, Dallas and Fort Worth, Texas metropolitan areas.
As of December 31, 2009, there was no concentration of loans to any one type of industry exceeding 10% of total loans nor were there any loans classified as highly leveraged transactions. The Company’s largest industry concentrations were in the hospitality and energy portfolios which were $303 million or 9.3% and $262 million or 8.1% of total loans held investment, respectively, as of December 31, 2009.
Loans that management has the intent and ability to hold for the foreseeable future or until maturity are reported in the balance sheet as loans held for investment stated at the principal amount outstanding adjusted for charge-offs, the allowance for loan losses, deferred fees or costs and unamortized premiums or discounts. Loans are classified as held for sale when management has positively determined that the loans will be sold in the foreseeable future and the Company has the ability to do so. The classification may be made upon origination or subsequent to the origination or purchase. Once a decision has been made to sell loans not previously classified as held for sale, such loans are transferred into the held for sale classification and carried at the lower of cost or fair value.
During the third quarter of 2009, the Company transferred $20.9 million in net book value commercial real estate loans to held for sale. The Company charged-off a portion of these loans against the related allowance for credit losses upon reclassification. Subsequent to the transfer, the Company sold $8.4 million of these loans for a net loss of $1.4 million. Additionally, during the third quarter of 2009, the Company entered into a definitive agreement to sell a nonperforming energy relationship totaling $29.2 million for a sales price of $16.0 million. This relationship was originally classified as held for investment. Upon execution of the sales agreement, the Company transferred these loans to the held for sale classification and charged-off the associated allowance for loan losses. This transaction closed during the fourth quarter of 2009.
During the year ended December 31, 2008, the Company sold approximately $10.3 million of performing commercial real estate loans that were originally acquired as held for investment. These sales resulted in net gains of $203 thousand during 2008. These loans were sold as part of the Company’s ongoing management
F-22
Table of Contents
Index to Financial Statements
STERLING BANCSHARES, INC. AND SUBSIDIARIES
NOTES TO CONSOLIDATED FINANCIAL STATEMENTS—(Continued)
FOR THE YEARS ENDED DECEMBER 31, 2009, 2008 AND 2007
of the size, concentrations and risk profile of the loan portfolio. At December 31, 2007, loans held for sale previously included certain commercial real estate loans and SBA loans originated by the Bank. Due to current market conditions, in September of 2008, $112 million of these loans were no longer classified as held for sale and were transferred to held for investment. The Company recorded a lower of cost or market adjustment of $266 thousand for 2008 related to these loans.
In the ordinary course of business, the Company has granted loans to certain directors, officers and their affiliates. In the opinion of management, all transactions entered into between the Bank and such related parties have been and are in the ordinary course of business, made on the same terms and conditions as similar transactions with unaffiliated persons.
An analysis of activity with respect to these related-party loans is as follows (in thousands):
| Year Ended December 31, |
||||||||
| 2009 | 2008 | |||||||
| Beginning balance |
$ | 2,100 | $ | 2,189 | ||||
| New loans |
240 | — | ||||||
| Repayments |
(199 | ) | (89 | ) | ||||
| Ending balance |
$ | 2,141 | $ | 2,100 | ||||
A loan is impaired when, based on current information and events, it is probable that a creditor will be unable to collect all amounts due according to the contractual terms of the loan agreement. The recorded investment in individually assessed impaired loans was $74.0 million at December 31, 2008 of which $66.3 million required specific reserves totaling $13.0 million. The recorded investment in individually assessed impaired loans was $150 million at December 31, 2009 of which $104 million required specific reserves of $11.6 million. The Company has no further significant commitments to lend additional funds to these borrowers. Impaired loans at December 31, 2009 included $9.9 million of loans classified as held for sale. During the year ended December 31, 2009, $1.8 million of interest was received on impaired loans. No interest on impaired loans was received for the years ended December 31, 2008 and 2007.
When management doubts a borrower’s ability to meet payment obligations, which typically occurs when principal or interest payments are more than 90 days past due, the loans are placed on nonaccrual status. Nonperforming loans of $103 million and $87.5 million at December 31, 2009 and 2008, respectively, have been categorized by management as nonaccrual loans. Interest foregone on nonaccrual loans was approximately $5.3 million, $3.6 million and $1.9 million, respectively, for the years ended December 31, 2009, 2008 and 2007.
At December 31, 2009, loans restructured as part of a troubled debt restructuring totaled approximately $90.8 million of which $20.0 million were considered nonaccrual. Generally, a nonaccrual loan that is restructured remains on nonaccrual for a period of six months to demonstrate that the borrower can meet the restructured terms.
Accruing loans 90 days past due or more were $41 thousand and $8.4 million at December 31, 2009 and 2008, respectively.
F-23
Table of Contents
Index to Financial Statements
STERLING BANCSHARES, INC. AND SUBSIDIARIES
NOTES TO CONSOLIDATED FINANCIAL STATEMENTS—(Continued)
FOR THE YEARS ENDED DECEMBER 31, 2009, 2008 AND 2007
| 5. | ALLOWANCE FOR CREDIT LOSSES |
An analysis of activity in the allowance for credit losses is as follows (in thousands):
| Year Ended December 31, | ||||||||||||
| 2009 | 2008 | 2007 | ||||||||||
| Allowance for Credit Losses |
||||||||||||
| Allowance for loan losses at beginning of period |
$ | 49,177 | $ | 34,446 | $ | 32,027 | ||||||
| Loans charged-off |
63,910 | 16,608 | 5,962 | |||||||||
| Loan recoveries |
(3,032 | ) | (2,149 | ) | (3,065 | ) | ||||||
| Net loans charged-off |
60,878 | 14,459 | 2,897 | |||||||||
| Allowance for loan losses associated with acquired institutions |
— | — | 1,496 | |||||||||
| Provision for loan losses |
86,433 | 29,190 | 3,820 | |||||||||
| Allowance for loan losses at end of period |
74,732 | 49,177 | 34,446 | |||||||||
| Allowance for unfunded loan commitments at beginning of period |
1,654 | 927 | 927 | |||||||||
| Provision for losses on unfunded loan commitments |
1,198 | 727 | — | |||||||||
| Allowance for unfunded loan commitments at end of period |
2,852 | 1,654 | 927 | |||||||||
| Total allowance for credit losses |
$ | 77,584 | $ | 50,831 | $ | 35,373 | ||||||
Net charge-offs were $60.9 million or 1.72% of average loans for 2009 compared to $14.5 million or 0.40% of average loans during 2008 and $2.9 million or 0.09% of average loans during 2007.
| 6. | PREMISES AND EQUIPMENT |
Premises and equipment are summarized as follows (in thousands):
| December 31, | ||||||||
| 2009 | 2008 | |||||||
| Land |
$ | 9,838 | $ | 9,688 | ||||
| Buildings and improvements |
40,049 | 36,540 | ||||||
| Furniture, fixtures and equipment |
59,082 | 58,304 | ||||||
| 108,969 | 104,532 | |||||||
| Less accumulated depreciation and amortization |
(60,153 | ) | (57,657 | ) | ||||
| Total |
$ | 48,816 | $ | 46,875 | ||||
Depreciation and amortization of premises and equipment totaled $8.3 million in 2009, $8.3 million in 2008 and $6.9 million in 2007.
F-24
Table of Contents
Index to Financial Statements
STERLING BANCSHARES, INC. AND SUBSIDIARIES
NOTES TO CONSOLIDATED FINANCIAL STATEMENTS—(Continued)
FOR THE YEARS ENDED DECEMBER 31, 2009, 2008 AND 2007
| 7. | GOODWILL AND OTHER INTANGIBLES |
Goodwill totaled $173 million at December 31, 2009 and 2008. During the first quarter of 2008, goodwill increased $5.1 million due to the acquisition of First Horizon. This increase was offset by final purchase accounting adjustments related to prior acquisitions.
Goodwill and intangible assets that have indefinite useful lives are subject to at least an annual impairment test and more frequently if a triggering event occurs or circumstances change between annual tests that would more likely than not reduce the fair value of our reporting units below their carrying amount. Other intangible assets consist primarily of core deposits and other intangibles. Intangible assets with definite useful lives are amortized on an accelerated basis over the years expected to be benefited, which we believe is approximately 10 years. An intangible asset subject to amortization shall be tested for recoverability whenever events or changes in circumstances, such as a significant or adverse change in the business climate that could affect the value of the intangible asset, indicate that its carrying amount may not be recoverable. An impairment loss is recorded to the extent the carrying amount of the intangible asset exceeds its fair value.
Our annual evaluation is performed as of September 30 of each year. As a result of a decrease in the market price of our stock to a level below book value, we performed interim evaluations of our goodwill during the first and fourth quarters of 2009.
The goodwill impairment test involves a two-step process. Under the first step, goodwill is assigned to reporting units for purposes of impairment testing. Reporting units used for the goodwill impairment testing include our banking subsidiary, Sterling Bank, and MBM Advisors a wholly owned subsidiary of Sterling Bank that provides investment advisory and pension administration/consulting services. The estimation of fair value of each reporting unit is compared with its carrying value including the allocated goodwill. At December 31, 2009, our goodwill totaled $173 million of which $165 million, or 95%, was allocated to Sterling Bank. If the estimated fair value of a reporting unit is less than its carrying value including goodwill, the second step is performed to measure the amount of impairment, if any. Goodwill impairment exists when the implied fair value of goodwill derived under step two is less than its carrying value.
To determine the fair value of the reporting units under step one of the impairment test, both an income approach and market approach was utilized. The income approach was based on projected cash flows derived from assumptions of balance sheet and income statement activity. Value was then derived by present valuing the projected cash flows using an appropriate risk-adjusted discount rate based on a market participant’s cost of equity. Value under the market approach was based on applying various market capitalization pricing multiples, such as price to tangible book, price to earnings, etc., observed from comparable companies to the reporting unit.
The results of the income and market approach were weighted to arrive at the final estimation of fair value for the reporting unit. As the ability to identify truly comparable companies lessened given the fluctuations in market capitalization across the banking industry, we believed that a heavier weighting on the income approach was more appropriate during the fourth quarter of 2009.
The aggregate fair values of the reporting units as determined under step one of the impairment test were compared to market capitalization as an assessment of the reasonableness of the estimated fair values of the
F-25
Table of Contents
Index to Financial Statements
STERLING BANCSHARES, INC. AND SUBSIDIARIES
NOTES TO CONSOLIDATED FINANCIAL STATEMENTS—(Continued)
FOR THE YEARS ENDED DECEMBER 31, 2009, 2008 AND 2007
reporting units. For each of the impairment tests performed, the comparison between the aggregate fair values and market capitalization indicated an implied premium which was within the range of control premiums observed in the marketplace.
For the impairment test performed during the fourth quarter of 2009, the Sterling Bank reporting unit did not pass the first step of the impairment test, and therefore, we conducted the second step of the impairment testing. The second step required a comparison of the implied fair value of goodwill to the carrying amount of goodwill and was based on information that was as of November 30, 2009.
To determine the implied fair value of goodwill, the fair value of Sterling Bank (as determined in step one) was allocated to all assets and liabilities of the reporting unit including any recognized or unrecognized intangible assets in a manner similar to a purchase price allocation. Key valuations were the assessment of core deposit and trade name intangible assets and the loan portfolio. The valuation of the loan portfolio resulted in an overall discount which we believe was supported by transactions occurring in the marketplace and was consistent with the “exit price” principle of fair value. The fair value of Sterling Bank’s goodwill exceeded its carrying value by an estimated 12% as of November 30, 2009; therefore; we determined there was no impairment of goodwill as of that date.
Based on our annual goodwill impairment review at September 30, 2009 and our additional goodwill step two impairment evaluation performed during the fourth quarter of 2009, management does not believe any of our goodwill is impaired as of December 31, 2009.
In light of the overall instability of the economy, the continued volatility in the financial markets, the downward pressure on bank stock prices and expectations of financial performance for the banking industry, including the reporting units, our estimates of fair value may be subject to change or adjustment and we may determine that goodwill impairment charges may be necessary. Estimates of fair value are determined based on a complex model using cash flows and company comparisons. If management’s estimates of future cash flows are inaccurate, the fair value determined could be inaccurate and impairment may not be recognized in a timely manner. If the company’s market capitalization declines or remains below book value, the company may update its valuation analysis to determine whether goodwill is impaired. No assurance can be given that goodwill will not be written down in future periods.
F-26
Table of Contents
Index to Financial Statements
STERLING BANCSHARES, INC. AND SUBSIDIARIES
NOTES TO CONSOLIDATED FINANCIAL STATEMENTS—(Continued)
FOR THE YEARS ENDED DECEMBER 31, 2009, 2008 AND 2007
Other intangible assets totaled $11.6 million at December 31, 2009 including $8.8 million related to core deposits and $2.8 million related to customer relationships. Other intangible assets totaled $13.9 million at December 31, 2008, including $10.7 million related to core deposits and $3.2 million related to customer relationships. The changes in intangibles related to core deposits and customer relationships during 2008 were related to the First Horizon branch acquisition, net of amortization. Core deposits and other intangibles are amortized on an accelerated basis over their estimated useful lives of 10 years. The total amortization expense related to intangible assets was $2.2 million and $2.3 million for the years ended December 31, 2009 and 2008, respectively. The projected amortization for core deposits and other intangibles as of December 31, 2009, is as follows (in thousands):
| 2010 |
$ | 2,149 | |
| 2011 |
2,011 | ||
| 2012 |
1,801 | ||
| 2013 |
1,695 | ||
| 2014 |
1,584 | ||
| Thereafter |
2,386 | ||
| Total |
$ | 11,626 | |
| 8. | BANK OWNED LIFE INSURANCE |
The Company purchases bank owned life insurance (“BOLI”) policies on the lives of certain officers and is the owner and beneficiary of the policies. These policies provide funding for long-term retirement and other employee benefits costs. The recorded balance of BOLI was $99.1 million and $95.5 million at December 31, 2009 and 2008, respectively. At December 31, 2009 and 2008, approximately $26.6 million and $25.0 million, respectively, of BOLI funds were held in separate accounts with investments in U.S. government, mortgage-backed and corporate debt securities. The cash surrender value of the life insurance policies contained in separate accounts is further supported by a stable value wrap agreement, which protects against changes in the fair value of the investments. BOLI policies are recorded within other assets in the Consolidated Balance Sheets at each policy’s respective cash surrender value, including the value of the stable value wrapper, with changes recorded in noninterest income in the Consolidated Statements of Income.
| 9. | DEPOSITS |
Included in certificates and other time deposits are individual amounts of $100,000 or more including brokered certificate of deposits. The remaining maturities of these deposits as of December 31, 2009, are as follows (in thousands):
| Three months or less |
$ | 327,371 | |
| Over three through six months |
85,486 | ||
| Over six through twelve months |
170,870 | ||
| Thereafter |
51,977 | ||
| $ | 635,704 | ||
Interest expense for certificates of deposit in excess of $100,000 was approximately $15.4 million, $26.7 million, and $41.3 million for the years ended December 31, 2009, 2008 and 2007, respectively.
F-27
Table of Contents
Index to Financial Statements
STERLING BANCSHARES, INC. AND SUBSIDIARIES
NOTES TO CONSOLIDATED FINANCIAL STATEMENTS—(Continued)
FOR THE YEARS ENDED DECEMBER 31, 2009, 2008 AND 2007
At December 31, 2009, the Bank had $86.1 million in brokered certificates of deposits that were in excess of $100,000, of which $86.0 million will mature in 2010. The remaining balance of these deposits was $100 thousand and will mature in 2011.
There are no major concentrations of deposits.
| 10. | OTHER BORROWED FUNDS |
Other borrowed funds are summarized as follows (in thousands):
| December 31, | ||||||
| 2009 | 2008 | |||||
| Federal Home Loan Bank advances |
$ | 40,500 | $ | 212,500 | ||
| Repurchase agreements |
55,695 | 59,936 | ||||
| Federal funds purchased |
1,050 | 36,150 | ||||
| Treasury auction facility |
— | 100,000 | ||||
| Total |
$ | 97,245 | $ | 408,586 | ||
Federal Home Loan Bank Advances—The Company has an available line of credit with the Federal Home Loan Bank (“FHLB”) of Dallas, which allows the Company to borrow on a collateralized basis. At December 31, 2009, the Company had total funds of $1.2 billion available under this agreement of which $40.5 million was outstanding with an average interest rate of 2.95%. At December 31, 2009, the Company had $40.0 million of FHLB advances that mature in eight years and $500 thousand of FHLB advances with a remaining maturity of less than one year. These borrowings are collateralized by mortgage loans, certain pledged securities, FHLB stock owned by the Company and any funds on deposit with the FHLB. The Company utilizes these borrowings to meet liquidity needs. Maturing advances are replaced by drawing on available cash, making additional borrowings or through increased customer deposits.
Securities Sold Under Agreements to Repurchase—Securities sold under agreements to repurchase represent the purchase of interests in securities by banking customers and structured repurchase agreements with other financial institutions. Securities sold under agreements to repurchase are stated at the amount of cash received in connection with the transaction. Repurchase agreements with banking customers are settled on the following business day, while structured repurchase agreements with other financial institutions will have varying terms. All securities sold under agreements to repurchase are collateralized by certain pledged securities. The securities underlying the structured repurchase agreements are held in safekeeping by the purchasing financial institution. At December 31, 2009 and 2008, the Company had securities sold under agreements to repurchase with banking customers of $5.7 million and $9.9 million, respectively. Structured repurchase agreements totaled $50.0 million at December 31, 2009 and 2008 and consisted of agreements with two separate financial institutions totaling $25.0 million, each that will mature in 2015. These repurchase agreements bear interest at a rate equal to LIBOR less 100 basis points and reset quarterly until the first quarter of 2010 at which time the rate will become fixed at 3.88% and 3.50%, respectively. The rate on these repurchase agreements was zero at December 31, 2009. The rate on these repurchase agreements was 1.22% and 0.87%, respectively, at December 31, 2008. The Company may be required to provide additional collateral based on the fair value of the underlying securities.
Federal Funds Purchased—The Company has federal funds purchased at correspondent banks. As of December 31, 2009 and 2008, federal funds outstanding with correspondent banks were $1.1 million and
F-28
Table of Contents
Index to Financial Statements
STERLING BANCSHARES, INC. AND SUBSIDIARIES
NOTES TO CONSOLIDATED FINANCIAL STATEMENTS—(Continued)
FOR THE YEARS ENDED DECEMBER 31, 2009, 2008 AND 2007
$36.2 million, respectively, and payable upon demand. These funds typically mature within one to ninety days.
Treasury Auction Facility—Treasury Auction Facilities (“TAF”) are term funds auctioned to depository institutions by the Federal Reserve Board. Each TAF auction is for a fixed amount, with the rate determined by the auction process (subject to a minimum bid rate). All advances must be fully collateralized. At December 31, 2009, there were no TAF borrowings outstanding. At December 31, 2008, the Company had $100 million of TAF borrowings outstanding at a rate of 0.42%.
| 11. | JUNIOR SUBORDINATED DEBT/COMPANY MANDATORILY REDEEMABLE TRUST PREFERRED SECURITIES |
As of December 31, 2009, the Company had the following issues of trust preferred securities outstanding and junior subordinated debt owed to trusts (dollars in thousands):
| Description |
Issuance Date | Trust Preferred Securities Outstanding |
Interest Rate |
Junior Subordinated Debt Owed To Trusts |
Final Maturity Date | |||||||
| Statutory Trust One |
August 30, 2002 | $ | 20,000 | 3-month LIBOR plus 3.45% |
$ | 20,619 | August 30, 2032 | |||||
| Capital Trust III |
September 26, 2002 | 31,250 | 8.30% Fixed | 32,217 | September 26, 2032 | |||||||
| BOTH Capital Trust I |
June 30, 2003 | 4,000 | 3-month LIBOR plus 3.10% |
4,124 | July 7, 2033 | |||||||
| Capital Trust IV |
March 26, 2007 | 25,000 | 3-month LIBOR plus 1.60% |
25,774 | June 15, 2037 | |||||||
| Total |
$ | 80,250 | $ | 82,734 | ||||||||
Each of the trusts is a statutory business trust organized for the sole purpose of issuing trust securities and investing the proceeds thereof in junior subordinated debentures of Sterling Bancshares. The preferred trust securities of each trust represent preferred beneficial interests in the assets of the respective trusts and are subject to mandatory redemption upon payments of the junior subordinated debentures held by the trust. The common securities of each trust are wholly-owned by Sterling Bancshares. Each trust’s ability to pay amounts due on the trust preferred securities is solely dependent upon Sterling Bancshares making payment on the related junior subordinated debentures. Sterling Bancshares’ obligations under the junior subordinated debentures and other relevant trust agreements, in aggregate, constitute a full and unconditional guarantee by Sterling Bancshares of each respective trust’s obligations under the trust securities issued by each respective trust.
Each issuance of trust preferred securities outstanding is mandatorily redeemable 30 years after issuance and is callable beginning five years after issuance if certain conditions are met (including the receipt of appropriate regulatory approvals). The trust preferred securities may be prepaid earlier upon the occurrence and continuation of certain events including a change in their tax status or regulatory capital treatment. In
F-29
Table of Contents
Index to Financial Statements
STERLING BANCSHARES, INC. AND SUBSIDIARIES
NOTES TO CONSOLIDATED FINANCIAL STATEMENTS—(Continued)
FOR THE YEARS ENDED DECEMBER 31, 2009, 2008 AND 2007
each case, the redemption price is equal to 100% of the face amount of the trust preferred securities, plus the accrued and unpaid distributions thereon through the redemption date.
The trust preferred securities issued under Statutory Trust One, BOTH Capital Trust I, and Capital Trust IV bear interest on a floating rate that resets quarterly. As of December 31, 2009, the floating rate on these securities was 3.70%, 3.38% and 1.85%, respectively, compared to 4.91%, 7.92% and 3.60%, respectively, at December 31, 2008.
| 12. | SUBORDINATED DEBT |
During April 2003, the Bank raised approximately $50.0 million through a private offering of subordinated unsecured notes. These subordinated notes bear interest at a fixed rate of 7.375% and mature on April 15, 2013. Interest payments are due semi-annually. The subordinated notes may not be redeemed or called prior to their maturity. Debt issuance costs of approximately $1.0 million are being amortized over the ten-year term of the notes on a straight-line basis. In June 2003, the Bank entered into an interest rate swap agreement with a notional amount of $50.0 million in which the Bank swapped the fixed rate to a floating rate (discussed in Note 13).
On June 30, 2008, the Bank entered into a subordinated note in the aggregate principal amount of $25.0 million. The subordinated note bears interest at a rate equal to LIBOR plus 2.50% and resets quarterly. The unpaid principal balance plus all accrued and unpaid interest on the subordinated debt shall be due and payable on September 15, 2018. The Bank may prepay the subordinated debt without penalty on any interest payment date on or after September 15, 2013. As of December 31, 2009, the floating rate was 2.75% on the subordinated note compared to 4.50% at December 31, 2008.
| 13. | DERIVATIVE FINANCIAL INSTRUMENTS |
The Company’s interest rate risk management strategy includes hedging the repricing characteristics of certain assets and liabilities so as to mitigate adverse effects on the Company’s net interest margin and cash flows from changes in interest rates. The Company uses certain derivative instruments to add stability to the Company’s net interest income and to manage the Company’s exposure to interest rate movements.
The Company may designate a derivative as either an accounting hedge of the fair value of a recognized fixed rate asset or an unrecognized firm commitment (“fair value” hedge), or an accounting hedge of a forecasted transaction or of the variability of future cash flows of a floating rate asset or liability (“cash flow” hedge). All derivatives are recorded as other assets or other liabilities on the balance sheet at their respective fair values. To the extent a hedge is considered effective, changes in the fair value of a derivative that is designated and qualifies as a cash flow hedge is recorded in other comprehensive income, net of income taxes. For all hedge relationships, ineffectiveness resulting from differences between the changes in fair value or cash flows of the hedged item and changes in fair value of the derivative are recognized as other noninterest income.
The Company estimates the fair value of its interest rate derivatives using a standardized methodology that nets the discounted expected future cash receipts and cash payments (based on observable market inputs). These future net cash flows, however, are susceptible to change due primarily to fluctuations in interest rates. As a result, the estimated values of these derivatives will typically change over time as cash is
F-30
Table of Contents
Index to Financial Statements
STERLING BANCSHARES, INC. AND SUBSIDIARIES
NOTES TO CONSOLIDATED FINANCIAL STATEMENTS—(Continued)
FOR THE YEARS ENDED DECEMBER 31, 2009, 2008 AND 2007
received and paid and also as market conditions change. As these changes take place, they may have a positive or negative impact on the Company’s estimated valuations.
The table below presents the fair value of the Company’s derivative financial instruments as well as their classification on the Consolidated Balance Sheets (in thousands):
| December 31, 2009 | December 31, 2008 | |||||||||||||||||
| Notional Amount |
Fair Value | Notional Amount |
Fair Value | |||||||||||||||
| Other Assets |
Other Liabilities |
Other Assets |
Other Liabilities | |||||||||||||||
| Derivatives designated as hedging instruments: |
||||||||||||||||||
| Fair value hedge of interest rate risk: |
||||||||||||||||||
| Interest rate swap |
$ | 50,000 | $ | 2,357 | $ | — | $ | 50,000 | $ | 3,361 | $ | — | ||||||
| Cash flow hedge of interest rate risk: |
||||||||||||||||||
| Interest rate floor and collar |
— | — | — | 363,000 | 20,967 | — | ||||||||||||
| Total derivatives designated as hedging instruments |
$ | 50,000 | $ | 2,357 | $ | — | $ | 413,000 | $ | 24,328 | $ | — | ||||||
Fair Value Hedges of Interest Rate Risk
The Company is exposed to changes in the fair value of certain of its fixed-rate obligations due to changes in interest rates. In June 2003, the Bank entered into an interest rate swap agreement with a notional amount of $50.0 million; this swap is designated as a fair value hedge of the Company’s $50.0 million in subordinated debentures and qualifies for the “short-cut” method of accounting. Under the terms of the swap agreement, the Bank receives a fixed coupon rate of 7.375% and pays a variable interest rate equal to the three-month LIBOR that is reset on a quarterly basis, plus 3.62%.
For derivatives designated and that qualify as fair value hedges, the gain or loss on the derivative as well as the offsetting loss or gain on the hedged item are recognized in earnings. As the fair value hedge qualifies for the “short-cut” method, the gain or loss on the derivative exactly offsets the loss or gain on the hedged item, resulting in zero net earnings impact.
The table below presents the effect of the Company’s fair value derivative financial instruments on the Consolidated Statements of Income (in thousands):
| Amount of Gain or (Loss) Recognized in Income on Derivative |
Amount of Gain or (Loss) Recognized in Income on Hedged Item |
||||||||||||||||||||
| Interest expense Year Ended December 31, |
Interest expense Year Ended December 31, |
||||||||||||||||||||
| 2009 | 2008 | 2007 | 2009 | 2008 | 2007 | ||||||||||||||||
| Fair value hedge of interest rate risk: |
|||||||||||||||||||||
| Interest rate swap |
$ | (1,003 | ) | $ | 4,634 | $ | 2,553 | $ | 1,003 | $ | (4,634 | ) | $ | (2,553 | ) | ||||||
The Company recognized a net reduction to interest expense of $1.4 million and a net addition to interest expense of $3 thousand and $853 thousand for the years ended December 31, 2009, 2008, and 2007, respectively, related to the Company’s fair value hedge.
F-31
Table of Contents
Index to Financial Statements
STERLING BANCSHARES, INC. AND SUBSIDIARIES
NOTES TO CONSOLIDATED FINANCIAL STATEMENTS—(Continued)
FOR THE YEARS ENDED DECEMBER 31, 2009, 2008 AND 2007
Cash Flow Hedges of Interest Rate Risk
The Company’s objectives in using interest rate derivatives are to add stability to interest income and expense and to manage its exposure to interest rate movements. To accomplish this objective, the Company uses interest rate floors and collars as part of its interest rate risk management strategy. Interest rate floors designated as cash flow hedges involve the receipt of variable-rate amounts from a counterparty if interest rates fall below the strike rate on the contract in exchange for an up front premium. Interest rate collars designated as cash flow hedges involve the payments of variable-rate amounts if interest rates rise above the cap strike rate on the contract and receipts of variable-rate amounts if interest rates fall below the floor strike rate on the contract. During 2006, the Company purchased a prime interest rate floor with a notional amount of $113 million and a strike rate of 8.00% and a prime interest rate collar contract with a notional amount of $250 million and an 8.42% interest rate cap and an 8.00% interest rate floor. These contracts were designated as cash flow hedges of the monthly interest receipts from a portion of the Company’s portfolio of prime-based variable-rate loans. During the third quarter of 2009, the Company’s interest rate floor matured, and the Company terminated its interest rate collar; accordingly, the Company does not have any derivatives designated as cash flow hedges of interest rate risk as of December 31, 2009.
The effective portion of changes in the fair value of derivatives designated and that qualify as cash flow hedges is recorded in other comprehensive income and is subsequently reclassified into earnings in the period that the hedged forecasted transaction affects earnings. During the years ended December 31, 2009, 2008 and 2007, such derivatives were used to hedge the forecasted variable cash inflows associated with existing pools of prime-based loan assets. The ineffective portion of the change in fair value of the derivatives is recognized directly in earnings. During the year ended December 31, 2009, the Company recognized a gain of $2.1 million for hedge ineffectiveness attributable to the aggregate principal amount of the designated loan pools falling below the notional amount. There was no hedge ineffectiveness during 2008 or 2007.
The amount reported in other comprehensive income related to the gain on the terminated collar will be reclassified to interest income, as interest payments are received on the Company’s variable-rate assets. As of December 31, 2009, the Company estimates that approximately $5.3 million will be reclassified as an increase to interest income during the next twelve months.
The table below presents the effect of the Company’s cash flow derivative financial instruments on the Consolidated Statements of Income (in thousands):
| Amount of Gain or (Loss) Recognized in OCI on Derivative (Effective Portion) |
Amount of Gain Reclassified from OCI into Income (Effective Portion) |
Amount of Gain or (Loss) Recognized in Income on Derivative (Ineffective Portion and Amount Excluded from Effectiveness Testing) | ||||||||||||||||||||||||||||||||||
| Year Ended December 31, |
Year Ended December 31, | Year Ended December 31, | ||||||||||||||||||||||||||||||||||
| 2009 | 2008 | 2007 | 2009 | 2009 | 2008 | 2008 | 2007 | 2007 | 2009 | 2008 | 2007 | |||||||||||||||||||||||||
| Interest income |
Other noninterest income |
Interest income |
Other noninterest income |
Interest income |
Other noninterest income |
Other noninterest income | ||||||||||||||||||||||||||||||
| Cash flow hedge of interest rate risk |
||||||||||||||||||||||||||||||||||||
| Interest rate floor and collar |
$ | 399 | $ | 19,750 | $ | 8,731 | $ | 13,267 | $ | 2,488 | $ | 10,325 | $ | — | $ | 255 | $ | — | $ | 120 | $ | — | $ | — | ||||||||||||
F-32
Table of Contents
Index to Financial Statements
STERLING BANCSHARES, INC. AND SUBSIDIARIES
NOTES TO CONSOLIDATED FINANCIAL STATEMENTS—(Continued)
FOR THE YEARS ENDED DECEMBER 31, 2009, 2008 AND 2007
The Company has agreements with certain of its derivative counterparties that contain a provision where if the Company defaults on any of its indebtedness, including default where repayment of the indebtedness has not accelerated by the tender, then the Company could also be declared in default on its derivative obligations. As of December 31, 2009, the Company did not have any derivatives that were in a net liability position related to these agreements.
| 14. | INCOME TAXES |
The components of the provision (benefit) for income taxes are as follows (in thousands):
| Year Ended December 31, | ||||||||||||
| 2009 | 2008 | 2007 | ||||||||||
| Current income tax expense |
$ | 3,261 | $ | 25,732 | $ | 27,367 | ||||||
| Deferred income tax benefit |
(13,498 | ) | (8,367 | ) | (1,659 | ) | ||||||
| Income tax provision (benefit) |
$ | (10,237 | ) | $ | 17,365 | $ | 25,708 | |||||
The income tax provision or benefit differs from the amount computed by applying the federal income tax statutory rate of 35% to income from continuing operations as follows (in thousands):
| Year Ended December 31, | ||||||||||||
| 2009 | 2008 | 2007 | ||||||||||
| Taxes calculated at statutory rate |
$ | (8,124 | ) | $ | 19,594 | $ | 27,535 | |||||
| Increase (decrease) resulting from: |
||||||||||||
| Release of reserves |
— | (689 | ) | (98 | ) | |||||||
| Tax-exempt interest income |
(1,268 | ) | (1,229 | ) | (1,126 | ) | ||||||
| Tax-exempt income from bank owned life insurance |
(1,133 | ) | (1,162 | ) | (1,185 | ) | ||||||
| Other, net |
288 | 851 | 582 | |||||||||
| Income tax provision (benefit) |
$ | (10,237 | ) | $ | 17,365 | $ | 25,708 | |||||
Significant deferred tax assets and liabilities at December 31 were as follows (in thousands):
| 2009 | 2008 | |||||
| Deferred tax assets: |
||||||
| Depreciable assets |
$ | 3,782 | $ | 4,388 | ||
| Allowance for credit losses |
26,880 | 17,516 | ||||
| Deferred compensation |
1,762 | 1,726 | ||||
| Real estate acquired by foreclosure |
973 | 24 | ||||
| Nonaccrual loans |
2,016 | 1,281 | ||||
| Stock-based compensation |
1,058 | 897 | ||||
| Other |
415 | 605 | ||||
| Total deferred tax assets |
36,886 | 26,437 | ||||
F-33
Table of Contents
Index to Financial Statements
STERLING BANCSHARES, INC. AND SUBSIDIARIES
NOTES TO CONSOLIDATED FINANCIAL STATEMENTS—(Continued)
FOR THE YEARS ENDED DECEMBER 31, 2009, 2008 AND 2007
| 2009 | 2008 | |||||
| Deferred tax liabilities: |
||||||
| Intangibles |
3,022 | 3,672 | ||||
| Net unrealized gain on available-for-sale securities |
4,309 | 2,175 | ||||
| Deferred loan origination costs |
1,473 | 1,742 | ||||
| Unrealized gain on cash flow hedge |
— | 7,232 | ||||
| Prepaid expenses |
1,137 | 1,194 | ||||
| Other |
673 | 390 | ||||
| Total deferred tax liabilities |
10,614 | 16,405 | ||||
| Net deferred tax assets |
$ | 26,272 | $ | 10,032 | ||
Deferred tax assets and liabilities are recorded within other assets and liabilities in the Consolidated Balance Sheets. As of December 31, 2009 and 2008, the Company had unrecognized tax benefits of $290 thousand and $265 thousand, respectively. The unrecognized tax benefit of $290 thousand has no impact on the effective tax rate.
A reconciliation of the beginning and ending amounts of the unrecognized tax benefit is listed below (in thousands):
| 2009 | 2008 | ||||||
| Beginning balance at January 1 |
$ | 265 | $ | 619 | |||
| Increases due to new contingencies |
25 | 265 | |||||
| Decreases due to lapse of applicable statue of limitations |
— | (619 | ) | ||||
| Ending balance at December 31 |
$ | 290 | $ | 265 | |||
The Company’s policy is that it recognizes interest and penalties as a component of income tax expense. As of December 31, 2009, the Company had accrued interest and penalties of $25 thousand.
The Company files income tax returns in the U.S. federal jurisdiction and various state jurisdictions. During the years ended December 31, 2008 and 2007, the Company revised its estimate to remove contingent liabilities totaling $619 thousand and $98 thousand, respectively, related to the expiration of previous tax contingencies and refunds received, including the filing of various state tax returns related to the Company’s mortgage banking segment which was sold in 2003. There were no contingent liabilities removed during the year ended December 31, 2009.
| 15. | EMPLOYEE BENEFITS |
Profit sharing plan—Through December 31, 2009, the Company’s profit sharing plan included substantially all employees. The profit sharing contribution is made at the discretion of the Board of Directors. Total contributions to the profit sharing plan were limited to 5% of the Company’s pre-tax net income, subject to Internal Revenue Service limitations. During 2008, there was no profit sharing contribution as the Company did not achieve the minimum performance metrics required for earnings per share and return on average assets. Earnings per share and return on average assets are the profit sharing plan metrics that were adopted in 2007. The profit sharing plan was terminated in 2009 upon approval of the Board of Directors. Through December 31, 2008, the Company also matched employee 401(k)
F-34
Table of Contents
Index to Financial Statements
STERLING BANCSHARES, INC. AND SUBSIDIARIES
NOTES TO CONSOLIDATED FINANCIAL STATEMENTS—(Continued)
FOR THE YEARS ENDED DECEMBER 31, 2009, 2008 AND 2007
contributions at 50% of the first 6% of eligible compensation that an employee may elect to defer. The Company match fully vests after four years of service. In 2009, the 401(k) plan was revised to provide a Company match of 100% of the first 5% of eligible compensation. Employee contributions to the 401(k) plan accounts are optional. Contributions to the 401(k) are accrued and funded currently. In 2009 and 2008, the matching expense for the 401(k) was $2.5 million and $1.5 million, respectively. Total profit sharing and 401(k) matching contribution expenses were $2.5 million for 2009, $1.5 million for 2008, and $4.0 million for 2007.
Stock-based compensation—The 2003 Stock Incentive and Compensation Plan (the “2003 Stock Plan”), which has been approved by the shareholders, permits the grant of unrestricted stock units, restricted stock units, phantom stock awards, stock appreciation rights or stock options. On August 31, 2007, the Board of Directors of the Company approved and adopted the Long-Term Incentive Stock Performance Program (the “Program”) pursuant to which the Human Resources Programs Committee of the Board of Directors (the “Committee) may award equity-based awards to employees who are actively employed by the Company. All awards made under the 2003 Stock Plan vest over a three year period. Certain share awards granted under previous shareholder-approved plans are still outstanding and unvested at December 31, 2009. Options are granted to officers and employees at grant dates determined by the Committee. These options have exercise prices equal to the fair market value of the common stock at the date of grant, vest ratably over a three or four-year period and must be exercised within ten years from the date of grant. Certain awards provide for accelerated vesting if there is a change in control (as defined in the 2003 Stock Plan).
Total stock-based compensation expense that was charged against income was $2.6 million, $3.6 million and $1.7 million for 2009, 2008 and 2007, respectively. The total income tax benefit recognized in the income statement for share-based compensation arrangements was $556 thousand, $751 thousand and $407 thousand for 2009, 2008 and 2007, respectively.
Cash received for exercises under all share-based payment arrangements during 2009, 2008 and 2007 was $900 thousand, $1.0 million and $4.2 million, respectively.
The Company issues new shares upon the exercise of all share-based payment arrangements.
Stock options—Options are granted to officers and employees as determined by the Committee. These options have exercise prices equal to the fair market value of the Company’s common stock at the date of grant, vest ratably over a three or four-year period and must be exercised within ten years from the date of grant. Certain awards provide for accelerated vesting if there is a change in control (as defined in the 2003 Stock Plan). The fair value of each option award is estimated on the date of grant using a Black-Scholes-Merton option valuation model. The Black-Scholes-Merton formula assumes that option exercises occur at the end of an option’s contractual term, and that expected volatility, expected dividends, and risk-free interest rates are constant over the option’s term. The Black-Scholes-Merton formula is adjusted to take into account certain characteristics of employee share options and similar instruments that are not consistent with the model’s assumptions. Because of the nature of the formula, those adjustments take the form of weighted-average assumptions about those characteristics. The expected term represents the period of time that options granted are expected to be outstanding. The risk-free interest rate of the option is based on the U.S. Treasury zero-coupon with a remaining term equal to the expected term used in the assumption model.
F-35
Table of Contents
Index to Financial Statements
STERLING BANCSHARES, INC. AND SUBSIDIARIES
NOTES TO CONSOLIDATED FINANCIAL STATEMENTS—(Continued)
FOR THE YEARS ENDED DECEMBER 31, 2009, 2008 AND 2007
The historical volatility is a measure of fluctuations in the Company’s share price. The fair value of options was estimated using the following weighted-average assumptions:
| 2009 | 2008 | 2007 | |||||||
| Expected term (years) |
5.04 | 5.00 | 3.80 | ||||||
| Risk-free interest rate |
2.03 | % | 3.03 | % | 3.65 | % | |||
| Historical volatility |
46.67 | % | 29.70 | % | 21.69 | % | |||
| Dividend yield |
3.29 | % | 2.11 | % | 1.46 | % |
A summary of changes in outstanding stock options as of December 31, 2009 is as follows:
| Shares (In thousands) |
Weighted Average Exercise Price |
Weighted Average Remaining Contractual Term (In years) |
Aggregate Intrinsic Value (In thousands) | ||||||||
| Shares under option, beginning of period |
1,282 | $ | 9.42 | ||||||||
| Shares granted |
383 | 6.53 | |||||||||
| Shares forfeited or expired |
(186 | ) | 8.77 | ||||||||
| Shares exercised |
(87 | ) | 5.11 | ||||||||
| Shares under option, end of period |
1,392 | $ | 8.99 | 6.62 | $ | 22 | |||||
| Shares exercisable, end of period |
741 | $ | 9.54 | 4.85 | $ | 22 | |||||
The weighted average grant-date fair value of the options granted during the years ended December 31, 2009, 2008 and 2007 was $2.22, $2.83 and $3.31, respectively. The total intrinsic value of options exercised during the years ended December 31, 2009, 2008 and 2007 was $174 thousand, $164 thousand and $1.2 million, respectively.
Share awards—A summary of the status of the Company’s nonvested share awards as of December 31, 2009 is presented below (shares in thousands):
| Shares (in thousands) |
Weighted Average Grant-Date Fair Value | |||||
| Nonvested share awards, beginning of year |
480 | $ | 10.89 | |||
| Shares granted |
265 | 7.04 | ||||
| Shares forfeited |
(53 | ) | 9.64 | |||
| Shares vested |
(182 | ) | 11.24 | |||
| Nonvested share awards, end of year |
510 | $ | 8.89 | |||
As of December 31, 2009, there was $2.4 million of total unrecognized compensation expense related to nonvested share-based compensation arrangements. That cost is expected to be recognized over a weighted average period of 1.48 years. The total fair value of shares vested during the year ended December 31, 2009
F-36
Table of Contents
Index to Financial Statements
STERLING BANCSHARES, INC. AND SUBSIDIARIES
NOTES TO CONSOLIDATED FINANCIAL STATEMENTS—(Continued)
FOR THE YEARS ENDED DECEMBER 31, 2009, 2008 AND 2007
was $2.0 million. Included in the Program are certain grants of performance-based share awards whose vesting is contingent on the Company obtaining certain performance metrics. These performance metrics include an earnings per share growth versus the Company’s peer banks and a return on assets performance versus the Company’s peer banks. The Company records the performance-based share awards assuming performance metrics will be obtained. During 2009, the Company revised its estimates for performance-based share awards granted in 2007 to reflect a 50% performance obtainment. As a result, the Company reversed $640 thousand of stock-based compensation expense related to these 2007 performance-based share awards. Performance-based share awards granted in 2008 and 2009 were expensed assuming all performance metrics will be obtained. If performance measures are not met the expense for those awards not earned will be reversed.
On December 20, 2007, the Company entered into a new employment agreement with its chief executive officer (“CEO”). This agreement replaced the existing agreement, in which the CEO was awarded 187,500 Performance Restricted Share Units (“PRSUs”), to be earned based on specified performance metrics. The total value of this stock grant was based on the current market price on the date of grant. Under the revised agreement, the new performance metrics include an earnings per share growth versus the Company’s peer banks and a return on assets performance versus the Company’s peer banks. In addition, the vesting period changed from four years to three years. The Company records the performance-based share awards assuming performance metrics will be obtained. The Company recorded compensation expense of $701 thousand in 2008 related to the PRSUs granted under the new agreement. During 2009, the Company revised its estimate and determined that the CEO had earned 50% of the PRSUs awarded in 2007. As a result, the Company reversed $1.1 million of stock-based compensation expense related to the unearned awards. Although entitled to the vested and earned 50% of the PRSUs, the CEO elected not to accept the award. The CEO and the Company agreed to an irrevocable waiver on receipt and rights to the stock awards. Because the CEO was entitled to the PRSUs, the Company did not reverse the stock-based compensation expense related to the earned portion of the PRSUs. As such, the deferred tax asset associated with the earned PRSUs was written off against surplus in December 2009 with no income statement impact.
Stock purchase plan—The Company offers the 2004 Employee Stock Purchase Plan (the “Purchase Plan”) effective July 1, 2004, which superceded the 1994 Employee Stock Purchase Plan to eligible employees. An aggregate of 2.3 million shares of Company common stock may be issued under the Purchase Plan subject to adjustment upon changes in capitalization. The Purchase Plan is a compensatory benefit plan to all employees who are employed for more than 20 hours per week and meet minimum length-of-service requirements of three months. The Purchase Plan is subscribed through payroll deductions which may not exceed 10% of the eligible employee’s compensation. The purchase price for shares available under the Purchase Plan is 90% of the lower of the fair market value on either the first or last day of each quarter. Compensation expense associated with the Purchase Plan was determined using a Black-Scholes-Merton option pricing formula. Assumptions used in this formula were the same as disclosed above for incentive stock options except that an expected term of three months was used. During 2009, 84,674 shares were subscribed for through payroll deductions under the Purchase Plan compared to 69,998 shares for 2008 and 46,672 shares for 2007.
Deferred compensation plans—In 1996, the Company adopted the Sterling Bancshares, Inc. Deferred Compensation Plan (the “Deferred Compensation Plan”). The Deferred Compensation Plan enabled eligible participants, including certain executives, to make and receive contributions on a tax deferred basis. Additionally, the Deferred Compensation Plan, which was amended and restated effective January 1, 2001, allowed officers to make an election to defer up to 90% of their base salary, annual bonus, and/or special
F-37
Table of Contents
Index to Financial Statements
STERLING BANCSHARES, INC. AND SUBSIDIARIES
NOTES TO CONSOLIDATED FINANCIAL STATEMENTS—(Continued)
FOR THE YEARS ENDED DECEMBER 31, 2009, 2008 AND 2007
bonus awards, if any, prior to the beginning of each calendar year. Any deferred amounts became unfunded liabilities of the Company. The Company paid a specified rate of return to the participants of the Deferred Compensation Plan as determined by the Human Resources Programs Committee. The Committee used the year-to-date, 10-year average Treasury rate as a guide in determining the effective interest rate for each year. For 2007, the interest rate paid was 5.30%. The Company recorded compensation expense of $118 thousand related to this plan for 2007.
On August 1, 2007, the Board of Directors approved an Amended and Restated Deferred Compensation Plan (“Amended Deferred Compensation Plan”) for Sterling Bancshares, Inc. which was effective for compensation periods beginning in September 2007. In connection with the Amended Deferred Compensation plan, the Company established a Rabbi Trust which was funded by the Company in order to satisfy the Company’s contractual liability to pay benefits under the terms of the Amended Deferred Compensation plan. Plan assets are invested generally in the same investments available to the participants of the 401(k) plan, including Sterling Bancshares, Inc. stock. The Rabbi Trust is subject to the claims of the Company’s creditors.
At December 31, 2009 and 2008, investments held in the Rabbi Trust of $3.8 million and $2.7 million, respectively, were included in other assets on the Company’s Consolidated Balance Sheet. Investment funds held by the trust are accounted for as trading securities and therefore, unrealized gains and losses associated with these investments are included in the Company’s Statements of Income within other noninterest income. The Company had realized losses of $198 thousand on plan assets which were deducted from the plan assets during 2009. Plan assets that are invested in the Company’s common stock are included as a reduction of the Company’s shareholder equity. The funded Amended Deferred Compensation Plan liabilities totaling $4.3 million and $3.2 million are included in other liabilities at December 31, 2009 and 2008, respectively. An increase to compensation expense of $263 thousand was recorded during 2009 as a result of changes in the plan liabilities.
The Company also has unfunded defined benefit deferred compensation agreements for certain former management as the result of prior acquisitions. At both December 31, 2009 and 2008, these deferred compensation agreements have an estimated benefit obligation of $1.8 million which were included in other liabilities. These retirement agreements provide for varying monthly benefits ranging from ten years to the life of the participant.
| 16. | SHAREHOLDERS’ EQUITY |
Common stock—During the second quarter of 2009, the Company issued 8.3 million shares of its common stock through a public stock offering, which resulted in net proceeds of approximately $54.6 million, after deducting underwriting fees and estimated offering expenses.
Treasury stock—On April 25, 2005, the Company’s Board of Directors authorized the repurchase of up to 2.5 million shares of common stock, not to exceed 500 thousand shares in any calendar year. On January 29, 2007, the Company’s Board of Directors authorized an increase in the number of shares to be repurchased to adjust for the three-for-two stock split approved by the Board of Directors on October 30, 2006. On July 30, 2007, the Company’s Board of Directors amended its existing common stock repurchase program (the “Repurchase Program”). The amendment increased by 750 thousand shares the total number of shares that may be repurchased by the Company under the Repurchase Program in the fiscal year 2007. The aggregate
F-38
Table of Contents
Index to Financial Statements
STERLING BANCSHARES, INC. AND SUBSIDIARIES
NOTES TO CONSOLIDATED FINANCIAL STATEMENTS—(Continued)
FOR THE YEARS ENDED DECEMBER 31, 2009, 2008 AND 2007
number of shares originally approved by the Board of Directors for repurchase under the Repurchase Program remains unchanged at 3.8 million shares. The Company may repurchase shares of common stock from time to time in the open market or through privately negotiated transactions from available cash or other borrowings. In 2008, the Company repurchased 100 thousand shares at an average cost per share of $9.06, for a total purchase price of $906 thousand. There were no shares repurchased during 2009.
Preferred stock—On December 12, 2008, as part of the TARP Capital Purchase Program, the Company entered into a Securities Purchase Agreement with the U.S. Treasury, pursuant to which the Company for a purchase price of $125 million in cash (i) sold 125,198 shares of the Company’s Fixed Rate Cumulative Perpetual Preferred Stock, Series J and (ii) issued a Warrant to purchase 2.6 million shares of the Company’s common stock, for a price of $7.18 per share. The Series J Preferred Stock is nonvoting and qualified as Tier 1 Capital. The preferred stock dividend reduced earnings available to common shareholders and was computed at an annual rate of 5% per year.
During the second quarter of 2009, the Company fully redeemed the $125 million Series J preferred stock that was sold to the U.S. Treasury in December of 2008. The Company was approved to pay the funds back without any condition from regulators. As a result of the redemption, the Company recorded a one-time $7.5 million charge in the form of an accelerated deemed dividend to account for the difference between the amount at which the preferred stock sale had been initially recorded and its redemption price. At December 31, 2009, the Warrant to purchase 2.6 million shares of the Company’s common stock was still outstanding with the U.S. Treasury.
| 17. | EARNINGS (LOSS) PER COMMON SHARE |
Earnings (loss) per common share was computed based on the following (in thousands, except per share amounts):
| Year Ended December 31, | ||||||||||
| 2009 | 2008 | 2007 | ||||||||
| Net income (loss) applicable to common shareholders |
$ | (22,316 | ) | $ | 38,221 | $ | 52,962 | |||
| Basic: |
||||||||||
| Weighted average shares outstanding |
78,696 | 73,177 | 72,659 | |||||||
| Diluted: |
||||||||||
| Add incremental shares for: |
||||||||||
| Assumed exercise of outstanding options and nonvested share awards |
— | 311 | 467 | |||||||
| Total |
78,696 | 73,488 | 73,126 | |||||||
| Earnings (loss) per common share |
||||||||||
| Basic |
$ | (0.28 | ) | $ | 0.52 | $ | 0.73 | |||
| Diluted |
$ | (0.28 | ) | $ | 0.52 | $ | 0.72 | |||
The incremental shares for the assumed exercise of the outstanding options were determined by application of the treasury stock method. The calculation of diluted earnings (loss) per common share excludes 1,603,428, 837,381, and 550,505 options and nonvested share awards outstanding during 2009, 2008, and 2007, respectively, which were antidilutive. Options and nonvested share awards have been excluded from the computation of diluted loss per share for the year ended December 31, 2009, as the effect would have
F-39
Table of Contents
Index to Financial Statements
STERLING BANCSHARES, INC. AND SUBSIDIARIES
NOTES TO CONSOLIDATED FINANCIAL STATEMENTS—(Continued)
FOR THE YEARS ENDED DECEMBER 31, 2009, 2008 AND 2007
been antidilutive. In addition, the calculation excludes the Warrant issued to the U.S. Treasury in December 2008 to purchase 2.6 million shares of common stock, which was antidilutive.
| 18. | COMMITMENTS AND CONTINGENCIES |
Leases—A summary as of December 31, 2009, of noncancelable future operating lease commitments is as follows (in thousands):
| 2010 |
$ | 8,479 | |
| 2011 |
8,812 | ||
| 2012 |
8,277 | ||
| 2013 |
8,197 | ||
| 2014 |
7,118 | ||
| Thereafter |
70,597 | ||
| Total |
$ | 111,480 | |
In 2007, the Company entered into a lease agreement to consolidate its central and corporate offices at one central location in Houston, Texas. This move will be completed over the next year as the timing of the move is aligned with the remaining renewals and expirations of our existing leases.
The Company leases certain office facilities and equipment under operating leases. Rent expense under all noncancelable operating lease obligations, net of income from noncancelable subleases aggregated, was approximately $11.7 million, $10.5 million and $9.0 million for 2009, 2008 and 2007, respectively.
Litigation—The Company has been named as a defendant in various legal actions arising in the normal course of business. In the opinion of management, after reviewing such claims with outside counsel, resolution of these matters will not have a material adverse impact on the consolidated financial statements.
Severance and non-competition agreements—The Company has previously entered into severance and non-competition agreements with its CEO and certain other executive officers. Under these agreements, upon a termination of employment under the circumstances described in the agreements, each would receive: (i) two years’ base pay; (ii) an annual bonus for two years in an amount equal to the highest annual bonus paid to the respective executive officer during the three years preceding termination or change in control (as defined in the agreement); (iii) continued eligibility for Company perquisites, welfare and life insurance benefit plans, to the extent permitted, and in the event participation is not permitted, payment of the cost of such welfare benefits for a period of two years following termination of employment; (iv) payment of up to $20 thousand in job placement fees; and (v) to the extent permitted by law or the applicable plan, accelerated vesting and termination of all forfeiture provisions under all benefit plans, options, restricted stock grants or other similar awards. The agreement with the Company’s CEO expired in accordance with its terms on December 31, 2009, and was not renewed. The Company does anticipate entering into a new agreement with the CEO in 2010.
| 19. | FINANCIAL INSTRUMENTS WITH OFF-BALANCE SHEET RISK |
The Company is a party to various financial instruments with off-balance sheet risk in the normal course of business to meet the financial needs of its customers. These financial instruments include commitments to extend credit and standby letters of credit. These instruments involve, to varying degrees, elements of credit and interest rate risk in excess of the amounts recognized in the Consolidated Balance Sheets. The Company’s exposure to credit loss in the event of nonperformance by the other party to the financial
F-40
Table of Contents
Index to Financial Statements
STERLING BANCSHARES, INC. AND SUBSIDIARIES
NOTES TO CONSOLIDATED FINANCIAL STATEMENTS—(Continued)
FOR THE YEARS ENDED DECEMBER 31, 2009, 2008 AND 2007
instrument for commitments to extend credit is represented by the contractual or notional amount of these instruments. The Company uses the same credit policies in making these commitments and conditional obligations as it does for on-balance sheet instruments.
The following is a summary of the various financial instruments entered into by the Company (in thousands):
| December 31, | ||||||
| 2009 | 2008 | |||||
| Commitments to extend credit |
$ | 704,107 | $ | 870,088 | ||
| Standby and commercial letters of credit |
55,312 | 104,079 | ||||
Commitments to extend credit are agreements to lend to a customer as long as there is no violation of any condition established in the contract. Commitments generally have fixed expiration dates or other termination clauses and may require payment of a fee. Since many of the commitments are expected to expire without being fully drawn upon, the total commitment amounts disclosed above do not necessarily represent future cash requirements. The Company evaluates each customer’s creditworthiness on a case-by-case basis. The amount of collateral obtained, if considered necessary by the Company, upon extension of credit, is based on management’s credit evaluation of the customer.
Standby and commercial letters of credit are conditional commitments issued by the Company to guarantee the performance of a customer to a third party. In the event of nonperformance by the customers, the Company has rights to the underlying collateral, which can include commercial real estate, physical plant and property, inventory, receivables, cash and marketable securities. The credit risk to the Company in issuing letters of credit is essentially the same as that involved in extending loan facilities to its customers.
| 20. | REGULATORY MATTERS |
Capital requirements—The Company is subject to various regulatory capital requirements administered by the state and federal banking agencies. Any institution that fails to meet its minimum capital requirements is subject to actions by regulators that could have a direct material effect on its financial statements. Under the capital adequacy guidelines and the regulatory framework for prompt corrective action, the Bank must meet specific capital guidelines based on the Bank’s assets, liabilities, and certain off-balance sheet items as calculated under regulatory accounting practices. The Company’s capital amount and classification under the regulatory framework for prompt corrective action are also subject to qualitative judgments by the regulators.
To meet the capital adequacy requirements, Sterling Bancshares and the Bank must maintain minimum capital amounts and ratios as defined in the regulations. Management believes, as of December 31, 2009 and 2008, that Sterling Bancshares and the Bank met all capital adequacy requirements to which they are subject.
The most recent notification from the regulatory banking agencies categorized Sterling Bank as “well capitalized” under the regulatory capital framework for prompt corrective action and there have been no events since that notification that management believes have changed the Bank’s category.
During the fourth quarter of 2008, the Company received $125 million in capital from the U.S. Treasury as the result of its participation in the TARP Capital Purchase Program. During the second quarter of 2009, the
F-41
Table of Contents
Index to Financial Statements
STERLING BANCSHARES, INC. AND SUBSIDIARIES
NOTES TO CONSOLIDATED FINANCIAL STATEMENTS—(Continued)
FOR THE YEARS ENDED DECEMBER 31, 2009, 2008 AND 2007
Company fully redeemed the $125 million Series J preferred stock that it sold to the U.S. Treasury in December 2008 (discussed in Note 16).
During 2009, the Company issued 8.3 million shares of its common stock through a public stock offering, which resulted in net proceeds of approximately $54.6 million, after deducting underwriting fees and estimated offering expenses.
In the current economic environment, the Company regularly assesses its ability to maintain and build its regulatory capital levels. In making this assessment, the Company takes into account a variety of factors, including its views as to the duration of the recession and the consequent impact on its markets and the real estate markets in particular, the Company’s provisioning for and charge-off of nonperforming assets, the liquidity needs of its organization, the capital levels of its peer institutions, and its ability to access the capital markets.
The Company also take into account its discussions and agreements with the Federal Deposit Insurance Corporation (“FDIC”) and its other regulators. As part of an informal agreement that Sterling Bank entered into on January 26, 2010, with the FDIC and the Texas Department of Banking, the Company has agreed to prepare and submit to such regulatory agencies a capital management plan that will reflect Sterling Bank’s plans to maintain for the next three years minimum regulatory capital levels that are currently unspecified. The Company intends to propose minimum capital levels in excess of the minimum requirements to remain well capitalized but below its regulatory capital levels at December 31, 2009, which, based on its discussions with the FDIC, the Company believes will be acceptable to the FDIC. Additionally, although not required to, the Company has agreed to provide the FDIC and the Texas Department of Banking advance notice of any dividend payments it would propose to make from Sterling Bank to Sterling Bancshares. The Company currently has available at the holding company sufficient liquidity to continue its current dividend payments and meet all of its other holding company only obligations for approximately 12 months without the payment of any dividends from Sterling Bank to Sterling Bancshares.
The Company’s informal agreement with the FDIC and the Texas Department of Banking also includes provisions requiring the Company to perform certain reviews of its personnel, policies, procedures and practices, none of which the Company believes will have a material impact on the operations of Sterling Bank or Sterling Bancshares. If the Company is unable to maintain the regulatory capital levels that it proposes in its capital management plan or if it fails to adequately resolve any other matters that any of its regulators may require the Company to address in the future, the Company could become subject to more stringent supervisory actions.
The Company’s informal agreement with the FDIC and the Texas Department of Banking does not include any other provision that it believes will have a material impact on the operations of the Company.
F-42
Table of Contents
Index to Financial Statements
STERLING BANCSHARES, INC. AND SUBSIDIARIES
NOTES TO CONSOLIDATED FINANCIAL STATEMENTS—(Continued)
FOR THE YEARS ENDED DECEMBER 31, 2009, 2008 AND 2007
The Company’s consolidated and the Bank’s capital ratios are presented in the following table:
| Actual | For Capital Adequacy Purposes |
To Be Categorized as Well Capitalized Under Prompt Corrective Action Provisions |
||||||||||||||||
| Amount | Ratio | Amount | Ratio | Amount | Ratio | |||||||||||||
| (In thousands, except percentage amounts) | ||||||||||||||||||
| Consolidated: |
||||||||||||||||||
| As of December 31, 2009: |
||||||||||||||||||
| Total capital (to risk weighted assets) |
$ | 526,919 | 14.4 | % | $ | 292,569 | 8.0 | % | N/A | N/A | ||||||||
| Tier 1 capital (to risk weighted assets) |
424,409 | 11.6 | % | 146,284 | 4.0 | % | N/A | N/A | ||||||||||
| Tier 1 capital (to average assets) |
424,409 | 8.9 | % | 191,045 | 4.0 | % | N/A | N/A | ||||||||||
| As of December 31, 2008: |
||||||||||||||||||
| Total capital (to risk weighted assets) |
$ | 632,015 | 14.9 | % | $ | 338,491 | 8.0 | % | N/A | N/A | ||||||||
| Tier 1 capital (to risk weighted assets) |
513,518 | 12.1 | % | 169,245 | 4.0 | % | N/A | N/A | ||||||||||
| Tier 1 capital (to average assets) |
513,518 | 10.6 | % | 194,316 | 4.0 | % | N/A | N/A | ||||||||||
| Sterling Bank: |
||||||||||||||||||
| As of December 31, 2009: |
||||||||||||||||||
| Total capital (to risk weighted assets) |
$ | 513,792 | 14.1 | % | $ | 292,309 | 8.0 | % | $ | 365,386 | 10.0 | % | ||||||
| Tier 1 capital (to risk weighted assets) |
411,322 | 11.3 | % | 146,154 | 4.0 | % | 219,232 | 6.0 | % | |||||||||
| Tier 1 capital (to average assets) |
411,322 | 8.6 | % | 190,915 | 4.0 | % | 238,644 | 5.0 | % | |||||||||
| As of December 31, 2008: |
||||||||||||||||||
| Total capital (to risk weighted assets) |
$ | 627,695 | 14.9 | % | $ | 338,224 | 8.0 | % | $ | 422,780 | 10.0 | % | ||||||
| Tier 1 capital (to risk weighted assets) |
509,198 | 12.0 | % | 169,112 | 4.0 | % | 253,668 | 6.0 | % | |||||||||
| Tier 1 capital (to average assets) |
509,198 | 10.5 | % | 194,180 | 4.0 | % | 242,725 | 5.0 | % | |||||||||
Trust preferred securities are included in the Company’s Tier 1 capital for regulatory purposes pursuant to guidance from the Federal Reserve. Changes to existing guidance will become applicable on March 31, 2011 and will limit the aggregate amount of trust preferred securities and certain other capital elements to 25% of Tier 1 capital, net of goodwill. At December 31, 2009, the entire amount of the $80.3 million of trust preferred securities outstanding would count as Tier 1 capital. The excess amount of trust preferred securities not qualifying for Tier 1 capital may be included in Tier 2 capital. This amount is limited to 50% of Tier 1 capital. Additionally, the final rules provide that trust preferred securities no longer qualify for Tier 1 capital within five years of their maturity. Under the final transitioned rules, there would not be a material impact on the Company’s consolidated capital ratios at December 31, 2009.
Dividend restrictions—Dividends paid by the Bank are subject to certain restrictions imposed by regulatory agencies. As discussed above, the Company is in the process of developing a capital management plan that it will submit to its banking regulators. That capital management plan will reflect a variety of operational factors including its plans for dividend payments from the Bank to Sterling Bancshares and from Sterling Bancshares to its shareholders. Although not required to, the Company has agreed to give its regulators advance notice of any dividend payments it would propose to make from Sterling Bank to Sterling Bancshares. The Company has sufficient liquidity to continue its current dividend payments and meet our other parent-only obligations for 12 months without the payment of any dividends from the Bank.
F-43
Table of Contents
Index to Financial Statements
STERLING BANCSHARES, INC. AND SUBSIDIARIES
NOTES TO CONSOLIDATED FINANCIAL STATEMENTS—(Continued)
FOR THE YEARS ENDED DECEMBER 31, 2009, 2008 AND 2007
| 21. | DISCLOSURES ABOUT FAIR VALUE OF FINANCIAL INSTRUMENTS |
The Company measures fair value based on the assumptions that market participants would use in pricing the asset or liability and establishes a fair value hierarchy. The fair value hierarchy consists of three levels of inputs that may be used to measure fair value as follows:
Level 1—Inputs that utilize quoted prices (unadjusted) in active markets for identical assets or liabilities that the Company has the ability to access. Level 1 assets and liabilities include debt and equity securities that are traded in an active exchange market, as well as certain U.S. Treasury securities that are highly liquid and are actively traded in over-the-counter markets.
Level 2—Inputs other than those quoted prices included in Level 1 that are observable for the asset or liability, either directly or indirectly. These inputs may include quoted prices for similar assets and liabilities in active markets, as well as inputs that are observable for the asset or liability (other than quoted prices), such as interest rates and yield curves that are observable at commonly quoted intervals. Level 2 assets and liabilities include available-for-sale securities with quoted prices that are traded less frequently than exchange-traded instruments and derivative contracts whose value is determined using a pricing model with inputs that are observable in the market or can be derived principally from or corroborated by observable market data. Available-for-sale and held-to-maturity securities are valued using observable data that may include dealer quotes, market spreads, cash flows, the U.S. Treasury yield curve, prepayment speeds, credit information and the bond’s terms and conditions, among other things. Derivative valuations utilize certain Level 3 inputs, such as estimates of current credit spreads to evaluate the likelihood of default by the Company and its counterparties. The significance of the impact of these credit valuation adjustments on the overall valuation of derivative positions are not significant to the overall valuation and result in all derivative valuations being classified in Level 2 of the fair value hierarchy.
Level 3—Inputs that are unobservable inputs for the asset or liability, which are typically based on an entity’s own assumptions, as there is little, if any, related market activity. In instances where the determination of the fair value measurement is based on inputs from different levels of the fair value hierarchy, the level in the fair value hierarchy within which the entire fair value measurement falls is based on the lowest level input that is significant to the fair value measurement in its entirety. The Company’s assessment of the significance of a particular input to the fair value measurement in its entirety requires judgment, and considers factors specific to the asset or liability. This category includes certain interest-only strip securities where independent pricing information was not able to be obtained for a significant portion of the underlying assets and loans held for sale.
We use fair value to measure certain assets and liabilities on a recurring basis when fair value is the primary measure for accounting. This is done primarily for available-for-sale securities and derivatives.
F-44
Table of Contents
Index to Financial Statements
STERLING BANCSHARES, INC. AND SUBSIDIARIES
NOTES TO CONSOLIDATED FINANCIAL STATEMENTS—(Continued)
FOR THE YEARS ENDED DECEMBER 31, 2009, 2008 AND 2007
The table below presents the Company’s assets and liabilities measured at fair value on a recurring basis aggregated by the level in the fair value hierarchy within which those measurements fall (in thousands).
| Balance at December 31, 2009 |
Quoted Prices in Active Markets for Identical Instruments (Level 1) |
Significant Other Observable Inputs (Level 2) |
Significant Unobservable Inputs (Level 3) | |||||||||
| Financial assets: |
||||||||||||
| Available-for-sale securities |
$ | 846,216 | $ | — | $ | 843,731 | $ | 2,485 | ||||
| Interest rate swap |
2,357 | — | 2,357 | — | ||||||||
| Balance at December 31, 2008 |
Quoted Prices in Active Markets for Identical Instruments (Level 1) |
Significant Other Observable Inputs (Level 2) |
Significant Unobservable Inputs (Level 3) | |||||||||
| Financial assets: |
||||||||||||
| Available-for-sale securities |
$ | 633,357 | $ | — | $ | 630,841 | $ | 2,516 | ||||
| Cash flow hedges |
20,967 | — | 20,967 | — | ||||||||
| Interest rate swap |
3,361 | — | 3,361 | — | ||||||||
The table below presents a reconciliation for assets measured at fair value on a recurring basis using significant unobservable inputs (Level 3) and summarizes gains and losses due to changes in fair value. Level 3 available-for-sale securities include certain interest-only strips which are valued based on certain observable inputs such as interest rates and credit spreads, as well as unobservable inputs such as estimated net charge-off and prepayment rates.
| Level 3 Instruments | ||||||||
| Fair Value Measurements Using Significant Unobservable Inputs |
||||||||
| Available-for-Sale Securities | ||||||||
| Year Ended December 31, 2009 | Year Ended December 31, 2008 | |||||||
| Balance at beginning of period |
$ | 2,516 | $ | 3,586 | ||||
| Total gains or losses for the period included in: |
||||||||
| Noninterest income |
— | (722 | ) | |||||
| Other comprehensive income |
739 | 78 | ||||||
| Purchases, issuances, settlements and amortization |
(770 | ) | (426 | ) | ||||
| Transfers in and/or out of Level 3 |
— | — | ||||||
| Balance at end of period |
$ | 2,485 | $ | 2,516 | ||||
| Net unrealized losses included in net income for the period relating to assets held at the end of period |
$ | — | $ | (722 | ) | |||
Certain financial assets are measured at fair value on a nonrecurring basis; that is, the instruments are not measured at fair value on an ongoing basis but are subject to fair value adjustments in certain circumstances (for example, when there is evidence of impairment). Fair value is used on a nonrecurring basis to measure certain assets when applying lower of cost or market accounting or when adjusting carrying values. Assets measured on a nonrecurring basis include held-to-maturity debt securities, impaired loans, other real estate
F-45
Table of Contents
Index to Financial Statements
STERLING BANCSHARES, INC. AND SUBSIDIARIES
NOTES TO CONSOLIDATED FINANCIAL STATEMENTS—(Continued)
FOR THE YEARS ENDED DECEMBER 31, 2009, 2008 AND 2007
owned, other repossessed assets and loans held for sale. Assets measured at fair value on a nonrecurring basis are summarized below.
Impaired loans are reported at the fair value of the underlying collateral if repayment is expected solely from the collateral. Collateral values are estimated using Level 2 inputs based on observable market data or Level 3 inputs based on customized discounting criteria. During the year ended December 31, 2009, individually assessed impaired loans over $250 thousand were remeasured and reported at fair value through a specific valuation allowance allocation of the allowance for possible loan losses based upon the fair value of the underlying collateral. Individually assessed impaired loans with a carrying value of $112 million were reduced by a specific valuation allowance or charged-down to their fair value of $72.7 million during the year ended December 31, 2009.
The Company recorded additions to other real estate owned and other repossessed assets of $15.0 million and $37.5 thousand, respectively, which were outstanding at December 31, 2009. The fair value of a foreclosed asset, upon initial recognition, is estimated using Level 2 inputs within the fair value hierarchy based on observable market data and Level 3 inputs based on customized discounting criteria. In connection with the measurement and initial recognition of the foregoing foreclosed assets, the Company recognized charge-offs through the allowance for loan losses. Foreclosed assets totaling $9.7 million were remeasured at fair value subsequent to initial recognition. In connection with the remeasurement, the Company recorded a loss on other real estate owned of $2.3 million and on other repossessed assets of $30.9 thousand for the year ended December 31, 2009.
During the second quarter of 2009, the Company recorded a $14.0 thousand credit-related OTTI on one held-to-maturity debt security with an amortized cost basis of $7.3 million based on its cash flow analysis using Level 2 inputs within the fair value hierarchy. This security was subsequently sold in the fourth quarter of 2009 for a realized loss of $2.0 million.
As of December 31, 2009, the Company had a balance of $11.8 million in loans held for sale. Loans held for sale are considered a Level 3 input within the fair value hierarchy based on current investor market pricing from investors in these types of loans.
During the second quarter of 2009, the Company fully redeemed the $125 million Series J preferred stock that it sold to the U.S. Treasury in December 2008. In 2008, the Company sold 125,198 preferred shares and issued a Warrant to purchase 2.6 million shares of the Company’s common stock. The proceeds from the TARP Capital Purchase Program were allocated between the preferred stock and the Warrant based on relative fair values. The Series J preferred stock was determined using Level 3 inputs based on similar types of securities. The fair value of the Series J preferred stock was determined based on assumptions regarding the discount rate (market rate) on the preferred stock which was estimated to be approximately 11% at the date of issuance. The discount on the Series J preferred stock was accreted to par value using a constant effective yield of 6.4% over a five-year term, which is the expected life of the preferred stock. The fair value of the Warrant was determined based on Level 2 inputs using the Black-Scholes-Merton option pricing model which incorporated assumptions at the date of issuance including the Company’s common stock price of $5.68, a dividend yield of 3.87%, stock price volatility of 45% and risk-free interest rate of 2.77%.
The Company did not record any liabilities at fair value for which measurement of the fair value was made on a nonrecurring basis at December 31, 2009.
F-46
Table of Contents
Index to Financial Statements
STERLING BANCSHARES, INC. AND SUBSIDIARIES
NOTES TO CONSOLIDATED FINANCIAL STATEMENTS—(Continued)
FOR THE YEARS ENDED DECEMBER 31, 2009, 2008 AND 2007
The following is a summary of the carrying values and estimated fair values of certain financial instruments (in thousands):
| December 31, | ||||||||||||
| 2009 | 2008 | |||||||||||
| Carrying Amount |
Estimated Fair Value |
Carrying Amount |
Estimated Fair Value | |||||||||
| Financial assets: |
||||||||||||
| Held-to-maturity securities |
$ | 222,845 | $ | 222,340 | $ | 172,039 | $ | 163,860 | ||||
| Loans held for sale |
11,778 | 11,778 | 1,524 | 1,524 | ||||||||
| Loans held for investment, net of allowance |
3,158,541 | 2,998,569 | 3,743,113 | 3,835,965 | ||||||||
| Financial liabilities: |
||||||||||||
| Time deposits |
946,279 | 946,897 | 1,171,422 | 1,175,389 | ||||||||
| Other borrowed funds |
97,245 | 95,368 | 408,586 | 399,879 | ||||||||
| Subordinated debt |
77,338 | 72,889 | 78,335 | 78,335 | ||||||||
| Junior subordinated debt |
82,734 | 54,414 | 82,734 | 82,734 | ||||||||
The summary above excludes financial assets and liabilities for which carrying value approximates fair value. For financial assets, these include cash and short-term investments. In addition, the fair values of loan commitments and letters of credit are excluded from the summary above as these items are not significant. The Company’s lending commitments have variable interest rates and are funded at current market rates on the date they are drawn upon; therefore, the fair value of these commitments would approximate their carrying value, if drawn upon. For financial liabilities, these include demand, savings, and money market deposits. The estimated fair value of demand, savings, and money market deposits is the amount payable on demand at the reporting date because the accounts have no stated maturity and the customer has the ability to withdraw funds immediately. Also excluded from the summary are financial instruments recorded at fair value on a recurring basis, as previously described.
Held-to-Maturity Securities—These securities are classified within Level 2 of the fair value hierarchy. Securities are valued based on quoted prices in an active market when available. If quoted market prices are not available for the specific security, then fair values are estimated by using pricing models, quoted prices of securities with similar characteristics or discounted cash flows. In certain cases where there is limited activity or less transparency around inputs to the valuation, securities can be classified within Level 3 of the valuation hierarchy. These securities would be valued based on certain observable inputs such as interest rates and credit spreads, as well as unobservable inputs such as estimated net charge-off and prepayment rates.
Loans Held for Sale—Fair value equals quoted market prices, if available. If a quoted market price is not available, the fair value is estimated by discounting the future cash flows using the current rates at which similar loans would be made to borrowers with similar credit ratings and for the same original maturities or the fair value of the collateral if the loan is collateral dependent. When assumptions are made using significant unobservable inputs, such loans are classified within Level 3 of the fair value hierarchy.
Loans Held for Investment—The fair value of loans is estimated by discounting the future cash flows on ‘pass’ grade loans using the LIBOR yield curve adjusted by a factor which reflects the credit and interest rate risk inherent in the loan. These future cash flows are then reduced by the estimated ‘life-of-the-loan’
F-47
Table of Contents
Index to Financial Statements
STERLING BANCSHARES, INC. AND SUBSIDIARIES
NOTES TO CONSOLIDATED FINANCIAL STATEMENTS—(Continued)
FOR THE YEARS ENDED DECEMBER 31, 2009, 2008 AND 2007
aggregate credit losses in the loan portfolio. These adjustments for lifetime future credit losses are highly judgmental because the Company does not have a validated model to estimate lifetime losses on large portions of its loan portfolio. The estimate of lifetime credit losses was increased during 2009 because of more recent loss experience and the expectation of a prolonged cycle of economic weakness. Additionally, during 2009 the Company applied a liquidity spread to the discount rate due to a deterioration in the market for loan sales. Impaired loans are not included in this credit adjustment as they are already considered to be held at fair value. Loans, other than those held for sale, are not normally purchased and sold by the Company, and there are no active trading markets for most of this portfolio.
Time Deposits—The fair value of time deposits is estimated by discounting future cash flows using the LIBOR yield curve plus a spread to represent current rates at which similar deposits would be priced.
Other Borrowed Funds—Fair value is generally estimated based on the discounted cash flow method using the LIBOR yield curve plus credit spread, adjusted for an estimate of the Company’s credit quality. Contractual cash flows are discounted using rates currently offered for new borrowings with similar remaining maturities and, as such, these discount rates include the Company’s current spread levels.
Subordinated Debt—The fair value of subordinated debt is estimated by discounting future cash flows using the LIBOR yield curve plus a spread to represent current rates at which similar subordinated debt would be priced.
Junior Subordinated Debt—The fair value of junior subordinated debt is estimated by discounting future cash flows using the LIBOR yield curve plus a spread to represent current rates at which similar junior subordinated debt would be priced.
These fair value disclosures represent the Company’s estimates based on relevant market information and information about the financial instruments. Fair value estimates are based on judgments regarding future expected loss experience, current economic conditions, risk characteristics of the various instruments, and other factors. These estimates are subjective in nature and involve uncertainties and matters of significant judgment and therefore cannot be determined with precision. Changes in the above methodologies and assumptions could significantly affect the estimates.
F-48
Table of Contents
Index to Financial Statements
STERLING BANCSHARES, INC. AND SUBSIDIARIES
NOTES TO CONSOLIDATED FINANCIAL STATEMENTS—(Continued)
FOR THE YEARS ENDED DECEMBER 31, 2009, 2008 AND 2007
| 22. | SELECTED QUARTERLY FINANCIAL DATA (UNAUDITED) |
The table below sets forth unaudited financial information for each quarter of the last two years (in thousands, except per share amounts):
| 2009 | 2008 | |||||||||||||||||||||||||
| Fourth Quarter |
Third Quarter |
Second Quarter |
First Quarter |
Fourth Quarter |
Third Quarter |
Second Quarter |
First Quarter | |||||||||||||||||||
| Interest income |
$ | 57,672 | $ | 59,934 | $ | 61,422 | $ | 62,464 | $ | 67,286 | $ | 68,314 | $ | 68,452 | $ | 70,572 | ||||||||||
| Interest expense |
10,892 | 12,083 | 12,854 | 13,954 | 16,910 | 18,846 | 18,208 | 22,576 | ||||||||||||||||||
| Net interest income |
46,780 | 47,851 | 48,568 | 48,510 | 50,376 | 49,468 | 50,244 | 47,996 | ||||||||||||||||||
| Provision for credit losses |
11,000 | 56,131 | 11,500 | 9,000 | 7,500 | 10,100 | 8,167 | 4,150 | ||||||||||||||||||
| Net interest income after provision for credit losses |
35,780 | (8,280 | ) | 37,068 | 39,510 | 42,876 | 39,368 | 42,077 | 43,846 | |||||||||||||||||
| Noninterest income |
5,491 | 9,113 | 10,493 | 10,798 | 9,641 | 9,801 | 10,870 | 10,715 | ||||||||||||||||||
| Noninterest expense |
39,490 | 40,075 | 44,021 | 39,598 | 39,117 | 38,997 | 37,708 | 37,388 | ||||||||||||||||||
| Income (loss) before income taxes |
1,781 | (39,242 | ) | 3,540 | 10,710 | 13,400 | 10,172 | 15,239 | 17,173 | |||||||||||||||||
| Income tax provision (benefit) |
45 | (14,518 | ) | 933 | 3,303 | 3,787 | 3,082 | 4,932 | 5,564 | |||||||||||||||||
| Net income (loss) |
$ | 1,736 | $ | (24,724 | ) | $ | 2,607 | $ | 7,407 | $ | 9,613 | $ | 7,090 | $ | 10,307 | $ | 11,609 | |||||||||
| Preferred stock dividends |
— | — | 7,458 | 1,884 | 398 | — | — | — | ||||||||||||||||||
| Net income (loss) applicable to common shareholders |
$ | 1,736 | $ | (24,724 | ) | $ | (4,851 | ) | $ | 5,523 | $ | 9,215 | $ | 7,090 | $ | 10,307 | $ | 11,609 | ||||||||
| Earnings (loss) per common share: |
||||||||||||||||||||||||||
| Basic |
$ | 0.02 | $ | (0.30 | ) | $ | (0.06 | ) | $ | 0.08 | $ | 0.13 | $ | 0.10 | $ | 0.14 | $ | 0.16 | ||||||||
| Diluted |
$ | 0.02 | $ | (0.30 | ) | $ | (0.06 | ) | $ | 0.08 | $ | 0.13 | $ | 0.10 | $ | 0.14 | $ | 0.16 | ||||||||
F-49
Table of Contents
Index to Financial Statements
STERLING BANCSHARES, INC. AND SUBSIDIARIES
NOTES TO CONSOLIDATED FINANCIAL STATEMENTS—(Continued)
FOR THE YEARS ENDED DECEMBER 31, 2009, 2008 AND 2007
| 23. | PARENT-ONLY FINANCIAL STATEMENTS |
STERLING BANCSHARES, INC.
(Parent Company Only)
CONDENSED BALANCE SHEETS
DECEMBER 31, 2009 AND 2008
(In thousands)
| 2009 | 2008 | |||||||
| ASSETS |
||||||||
| Cash and cash equivalents |
$ | 13,116 | $ | 3,825 | ||||
| Accrued interest receivable and other assets |
1,661 | 2,304 | ||||||
| Investment in subsidiaries |
607,702 | 719,074 | ||||||
| Investment in Sterling Bancshares Capital Trusts |
2,484 | 2,484 | ||||||
| TOTAL ASSETS |
$ | 624,963 | $ | 727,687 | ||||
| LIABILITIES AND SHAREHOLDERS’ EQUITY |
||||||||
| LIABILITIES: |
||||||||
| Accrued interest payable and other liabilities |
$ | 1,696 | $ | 1,814 | ||||
| Junior subordinated debt |
82,734 | 82,734 | ||||||
| Total liabilities |
84,430 | 84,548 | ||||||
| COMMITMENTS AND CONTINGENCIES |
||||||||
| SHAREHOLDERS’ EQUITY: |
||||||||
| Preferred stock |
— | 118,012 | ||||||
| Common stock |
83,721 | 75,128 | ||||||
| Capital surplus |
170,848 | 121,918 | ||||||
| Retained earnings |
295,909 | 332,009 | ||||||
| Treasury stock |
(21,399 | ) | (21,399 | ) | ||||
| Accumulated other comprehensive gain, net of tax |
11,454 | 17,471 | ||||||
| Total shareholders’ equity |
540,533 | 643,139 | ||||||
| TOTAL LIABILITIES AND SHAREHOLDERS’ EQUITY |
$ | 624,963 | $ | 727,687 | ||||
F-50
Table of Contents
Index to Financial Statements
STERLING BANCSHARES, INC. AND SUBSIDIARIES
NOTES TO CONSOLIDATED FINANCIAL STATEMENTS—(Continued)
FOR THE YEARS ENDED DECEMBER 31, 2009, 2008 AND 2007
STERLING BANCSHARES, INC.
(Parent Company Only)
CONDENSED STATEMENTS OF INCOME
FOR THE YEARS ENDED DECEMBER 31, 2009, 2008 AND 2007
(In thousands)
| 2009 | 2008 | 2007 | ||||||||
| REVENUES: |
||||||||||
| Dividends received from bank subsidiaries |
$ | 21,400 | $ | 15,995 | $ | 25,495 | ||||
| Interest income on time deposits |
9 | — | — | |||||||
| Other income |
118 | 173 | 191 | |||||||
| Total revenues |
21,527 | 16,168 | 25,686 | |||||||
| EXPENSES: |
||||||||||
| Interest expense: |
||||||||||
| Junior subordinated debt |
4,487 | 5,731 | 6,239 | |||||||
| General and administrative |
2,134 | 1,429 | 2,509 | |||||||
| Total expenses |
6,621 | 7,160 | 8,748 | |||||||
| Income before equity in undistributed earnings of subsidiaries and income taxes |
14,906 | 9,008 | 16,938 | |||||||
| Equity in undistributed earnings (loss) of subsidiaries |
(30,156 | ) | 27,163 | 33,026 | ||||||
| Income (loss) before income tax benefit |
(15,250 | ) | 36,171 | 49,964 | ||||||
| Income tax benefit |
2,276 | 2,448 | 2,998 | |||||||
| Net income (loss) |
$ | (12,974 | ) | $ | 38,619 | $ | 52,962 | |||
F-51
Table of Contents
Index to Financial Statements
STERLING BANCSHARES, INC. AND SUBSIDIARIES
NOTES TO CONSOLIDATED FINANCIAL STATEMENTS—(Continued)
FOR THE YEARS ENDED DECEMBER 31, 2009, 2008 AND 2007
STERLING BANCSHARES, INC.
(Parent Company Only)
CONDENSED STATEMENTS OF CASH FLOWS
FOR THE YEARS ENDED DECEMBER 31, 2009, 2008 AND 2007
(In thousands)
| 2009 | 2008 | 2007 | ||||||||||
| CASH FLOWS FROM OPERATING ACTIVITIES: |
||||||||||||
| Net income (loss) |
$ | (12,974 | ) | $ | 38,619 | $ | 52,962 | |||||
| Adjustments to reconcile net income (loss) to net cash provided by operating activities: |
||||||||||||
| Equity in undistributed (earnings) loss of subsidiary |
30,156 | (27,163 | ) | (33,026 | ) | |||||||
| Change in operating assets and liabilities: |
||||||||||||
| Accrued interest receivable and other assets |
644 | 356 | 3,153 | |||||||||
| Accrued interest payable and other liabilities |
(118 | ) | 73 | 8 | ||||||||
| Net cash provided by operating activities |
17,708 | 11,885 | 23,097 | |||||||||
| CASH FLOWS FROM INVESTING ACTIVITIES: |
||||||||||||
| Payments for investments in and advances to subsidiaries |
(50,000 | ) | (125,198 | ) | — | |||||||
| Sale or repayment of investments in and advances to subsidiaries |
125,198 | — | — | |||||||||
| Purchase of Partners Bank of Texas |
— | — | (25,319 | ) | ||||||||
| Net cash provided by (used in) investing activities |
75,198 | (125,198 | ) | (25,319 | ) | |||||||
| CASH FLOWS FROM FINANCING ACTIVITIES: |
||||||||||||
| Repurchase of common stock |
(63 | ) | (1,091 | ) | (10,387 | ) | ||||||
| Proceeds from issuance of common stock |
57,586 | 4,685 | 4,952 | |||||||||
| Proceeds from issuance of preferred stock |
— | 125,198 | — | |||||||||
| Redemption of preferred stock |
(125,198 | ) | — | — | ||||||||
| Payments of cash dividends |
(15,940 | ) | (16,115 | ) | (15,238 | ) | ||||||
| Proceeds from the issuance of Statutory Trust IV |
— | — | 25,774 | |||||||||
| Net cash (used in) provided by financing activities |
(83,615 | ) | 112,677 | 5,101 | ||||||||
| NET INCREASE (DECREASE) IN CASH AND CASH EQUIVALENTS |
9,291 | (636 | ) | 2,879 | ||||||||
| CASH AND CASH EQUIVALENTS AT BEGINNING OF YEAR |
3,825 | 4,461 | 1,582 | |||||||||
| CASH AND CASH EQUIVALENTS AT END OF YEAR |
$ | 13,116 | $ | 3,825 | $ | 4,461 | ||||||
F-52