Attached files
UNITED STATES
SECURITIES AND EXCHANGE COMMISSION
WASHINGTON, D.C. 20549
FORM 10-K
| x | ANNUAL REPORT PURSUANT TO SECTION 13 OR 15(d) OF THE SECURITIES EXCHANGE ACT OF 1934 |
For the fiscal year ended December 31, 2009
OR
| ¨ | TRANSITION REPORT PURSUANT TO SECTION 13 OR 15(d) OF THE SECURITIES EXCHANGE ACT OF 1934 |
For the transition period from to
Commission file number 001-33302
SWITCH & DATA FACILITIES COMPANY, INC.
(Exact name of registrant as specified in its charter)
| Delaware | 59-3641081 | |
| (State or other jurisdiction of incorporation or organization) | (I.R.S. Employer Identification No.) |
1715 North Westshore Boulevard. Suite 650 Tampa, FL 33607
(Address of principal executive offices) (ZIP Code)
(813) 207-7700
(Registrant’s telephone number, including area code)
Securities registered pursuant to Section 12(b) of the Act:
| Title of each class |
Name of each exchange on which registered | |
| Common Stock, $0.0001 | Nasdaq Global Market |
Securities registered pursuant to Section 12(g) of the Act: None
Indicate by check mark if the registrant is a well-known seasoned issuer as defined in Rule 405 of the Securities Act. ¨ Yes x No
Indicate by check mark if the registrant is not required to file reports pursuant to Section 13 or Section 15(d) of the Act. ¨ Yes x No
Indicate by check mark whether the registrant (1) has filed all reports required to be filed by Section 13 or 15(d) of the Securities Exchange Act of 1934 during the preceding 12 months (or for such shorter period that the registrant was required to file such reports), and (2) has been subject to such filing requirements for the past 90 days. x Yes ¨ No
Indicate by check mark whether the registrant has submitted electronically and posted on its corporate Website, if any, every Interactive Data File required to be submitted and posted pursuant to Rule 405 of Regulation S-T (§ 232.405 of this chapter) during the preceding 12 months (or for such shorter period that the registrant was required to submit and post such files). ¨ Yes ¨ No
Indicate by check mark if disclosure of delinquent filers pursuant to Item 405 of Regulation S-K is not contained herein, and will not be contained, to the best of registrant’s knowledge, in definitive proxy or information statements incorporated by reference in Part III of this Form 10-K or any amendment to this Form 10-K. ¨
Indicate by check mark whether the registrant is a large accelerated filer, an accelerated filer, a non-accelerated filer or a smaller reporting company. See the definitions of “large accelerated filer,” “accelerated filer” and “smaller reporting company” in Rule 12b-2 of the Exchange Act.
Large accelerated filer ¨ Accelerated filer x
Non-accelerated filer ¨ (Do not check if a smaller reporting company) Smaller reporting company ¨
Indicate by check mark whether the registrant is a shell company (as defined in Rule 12b-2 of the Act). ¨ Yes x No
The aggregate market value of the registrant’s common stock held by non-affiliates, based on the closing price of the registrant’s common stock as reported on the Nasdaq Global Market on the last business day of the registrant’s most recently completed second fiscal quarter was approximately $197,969,028. For purposes of this calculation, it has been assumed that all the registrant’s shares of the registrant’s common stock held by directors, executive officers, and stockholders beneficially owning five percent or more of the registrant’s common stock are held by affiliates. The treatment of these persons as affiliates for purposes of this calculation is not conclusive as to whether such persons are, in fact, affiliates of the registrant.
As of February 15, 2010, a total of 34,748,163 shares of the registrant’s common stock were outstanding.
Documents Incorporated by Reference
Part III—Portions of the registrant’s definitive Proxy Statement for the Annual Meeting of Stockholders to be filed with Securities and Exchange Commission within 120 days after the end of our 2009 fiscal year. Except as expressly incorporated by reference, the registrant’s Proxy Statement shall not be deemed to be a part of this report on Form 10-K.
The words “Switch and Data,” “we,” “our,” “ours,” “us,” and the “Company” refer to Switch & Data Facilities Company, Inc., together with its subsidiaries, except where the context otherwise requires. This Annual Report on Form 10-K contains certain statements that are, or may be deemed to be, forward-looking statements within the meaning of Section 27A of the Securities Act of 1933, as amended (the “Securities Act”), and Section 21E of the Securities Exchange Act of 1934,as amended (the “Exchange Act”), and are made in reliance upon the protections provided by such acts for forward-looking statements. These forward-looking statements (such as when we describe what “will,” “may,” or “should” occur, what we “plan,” “intend,” “estimate,” “believe,” “expect,” or “anticipate” will occur, and other similar statements) include, but are not limited to, statements regarding future sales and operating results, future prospects, anticipated benefits of proposed (or future) acquisitions and new data centers, growth, the capabilities and capacities of business operations, any financial or other guidance and all statements that are not based on historical fact, but rather reflect our current expectations concerning future results and events. We make certain assumptions when making forward-looking statements, any of which could prove inaccurate, including, but not limited to, statements about our future operating results and business plans. Therefore, we can give no assurance that the results implied by these forward-looking statements will be realized. Furthermore, the inclusion of forward-looking information should not be regarded as a representation by the Company or any other person that future events, plans or expectations contemplated by the Company will be achieved. The ultimate correctness of these forward-looking statements is dependent upon a number of known and unknown risks and events, and is subject to various uncertainties and other factors that may cause our actual results, performance or achievements to be different from any future results, performance or achievements expressed or implied by these statements. The following important factors, among others, could affect future results and events, causing those results and events to differ materially from those expressed or implied in our forward-looking statements:
| • | our pending merger with and into Equinix, Inc. (“Equinix”); |
| • | business conditions and growth or declines in our industry, our customers’ industries and the general economy; |
| • | variability of operating results; |
| • | our ability to complete capital expenditure projects on time and on budget; |
| • | the availability and cost of sufficient electrical power and cooling capacity; |
| • | the non-renewal of any of our data center leases; |
| • | the variability of customer requirements; |
| • | other economic, business, and competitive factors affecting our customers, our industry and business generally; |
| • | seasonality; and |
| • | other factors that we may not have currently identified or quantified. |
For a further list and description of various risks, relevant factors and uncertainties that could cause future results or events to differ materially from those expressed or implied in our forward-looking statements, see the “Risk Factors” and “Management’s Discussion and Analysis of Financial Condition and Results of Operations” sections contained in this document. Given these risks and uncertainties, the reader should not place undue reliance on these forward-looking statements.
All forward-looking statements included in this Annual Report on Form 10-K are made only as of the date of this Annual Report on Form 10-K, and we do not undertake any obligation to publicly update or correct any forward-looking statements to reflect events or circumstances that subsequently occur, or which we hereafter become aware. You should read this document and the documents that we incorporate by reference into this Annual Report on Form 10-K completely and with the understanding that our actual future results may be materially different from what we expect. We may not update these forward-looking statements, even if our situation changes in the future. All forward-looking statements attributable to us are expressly qualified by these cautionary statements.
2
| ITEM 1. | BUSINESS |
PENDING MERGER WITH EQUINIX
On October 21, 2009, we entered into an Agreement and Plan of Merger (the “Merger Agreement”) with Equinix and Sundance Acquisition Corporation, a wholly-owned subsidiary of Equinix (“Merger Sub”). Pursuant to the terms of the Merger Agreement and subject to the satisfaction or waiver of the conditions therein, Merger Sub will merge with and into us, with us surviving as a wholly-owned subsidiary of Equinix (the “Merger”).
Subject to the terms and conditions of the Merger Agreement, at the effective time of and as a result of the Merger, each of our outstanding shares of common stock (other than dissenting shares and shares held by us as treasury stock or owned by Equinix) will be converted into merger consideration that will consist of 0.19409 shares of Equinix’s common stock, $19.06 in cash or a combination of shares of Equinix’s common stock and cash. Under the Merger Agreement, our stockholders had the opportunity to elect whether they would prefer to receive 0.19409 shares of Equinix’s common stock or $19.06 in cash for each share of our common stock that they hold.
As of 5:00 p.m. Eastern time on January 29, 2010, the election deadline, holders of 7,186,295 shares of our common stock (approximately 21%) had elected to receive $19.06 in cash, and holders of 23,009,358 shares of our common stock (approximately 67%) had elected to receive 0.19409 shares of Equinix common stock, for each share of their Switch and Data common stock. Approximately 12% of our outstanding common stock made no election. Our stockholders, who made an election prior to 5:00 p.m. Eastern time on January 29, 2010, may revoke their elections at any time prior to 5:00 p.m. Eastern time on the date that is two business days preceding the Merger’s closing date by delivering to the exchange agent a written notice of revocation. Accordingly, the election results described above are preliminary and may change as a result of such revocations. Shares of our common stock as to which an election has been revoked after the election deadline will be deemed non-electing shares, and no new election as to such shares may be made after the election deadline.
The Merger Agreement further provides that the overall consideration to be paid by Equinix in the Merger will consist 80% of Equinix common stock and 20% of cash. Accordingly, in the event that holders of more than 80% of our common stock elect to receive Equinix common stock or holders of more than 20% of our common stock elect to receive cash, the Merger Agreement provides that the merger consideration will be pro-rated to achieve these proportions. At the effective time of and as a result of the Merger, each of our outstanding shares of common stock will be canceled and extinguished.
While our stockholders voted on January 29, 2010 to approve the Merger, completion of the Merger remains subject to the expiration or termination of the waiting period imposed by the Hart-Scott-Rodino Antitrust Improvement Act of 1976, as amended (the “HSR Act”), and the satisfaction or waiver of the other closing conditions specified in the Merger Agreement. We currently expect the Merger to close in the second quarter of 2010. We will announce the Merger’s expected closing date by issuing a press release and filing that press release on Form 8-K with the Securities and Exchange Commission (the “SEC”) no later than five business days before the expected closing date. On January 6, 2010, Equinix received a Request for Additional Information (commonly referred to as a “second request”) from the Antitrust Division of the Department of Justice in connection with the Antitrust Division’s review of the Merger. This second request extends the waiting period imposed by the HSR Act until 30 days after Equinix has substantially complied with the second request unless that period is extended voluntarily by Equinix or terminated sooner by the Antitrust Division.
Additional information regarding the Merger is provided in the Current Report on Form 8-K that we filed with the SEC on October 22, 2009, as well as subsequent SEC filings.
OVERVIEW
Switch and Data is a premier provider of network-neutral data centers that house, power, and interconnect the Internet. Leading global content companies, communications service providers, and enterprises rely on Switch and Data to interconnect to customers and exchange network traffic. We have built a reputation for
3
world-class service, delivered across the broadest colocation footprint and richest network of interconnections in North America. We operate 34 sites in the U.S. and Canada, provide one of the highest customer satisfaction scores in the industry, and are home to PAIX®—one of the world’s first commercial Internet exchanges.
In our data centers, we provide network-neutral interconnection and colocation services. Our network-neutral data centers are specifically designed to house the networking and computing equipment our customers use to aggregate and distribute data and digital media content. These data centers provide colocation services including space, security, and redundant power and cooling, thus allowing customers to avoid the costs of building and maintaining their own data centers. As a network-neutral provider, we do not own or operate our own network, and, as a result, our interconnection services enable our customers to switch network traffic through direct connections with each other or through peering connections with multiple parties. Approximately 22,300 cross connects currently exist between our customers, creating a dense network effect, which provides an incentive for our existing customers to remain and grow within our data centers and is a differentiating factor in attracting new customers. This network effect, combined with our broad geographic footprint, contributes to the growth of our customer base and revenue, which we believe will increase our operating cash flow due to the fixed nature of certain of our operating costs.
Our diverse customer base includes some of the world’s largest network providers, service providers, and content providers. Our network provider customers, who are global telecommunication carriers and Internet service providers, include AT&T, Level 3 Communications, Japan Telecom, and Telmex. Our content provider customers include Apple, CBS Corporation, and Microsoft. Our service provider customers include Adobe, Akamai, Limelight Networks, and Verisign.
We believe our broad geographic footprint represents a competitive advantage in that we have data centers in 17 of the 20 largest metropolitan service areas in the U.S., which is the broadest of any of our network-neutral competitors. Our presence in these markets enables us to serve customers in locations where Internet traffic is most concentrated and to serve customers who require a presence in multiple markets. As of December 31, 2009, of our top 100 customers, 79 utilize our services in multiple markets.
Several favorable industry trends are driving demand for our network-neutral interconnection and colocation services. These trends include growth in Internet traffic driven by increasing broadband penetration and a proliferation of broadband intensive applications such as video, gaming, and online music; an increasing need for advanced networking technology provided through reliable and secure infrastructure; the growing trend of outsourcing data center functions to benefit from cost savings, improved service quality, 24 x 7 support, and a skilled workforce; and a growing need for business continuity and disaster recovery services. Each of these trends requires an infrastructure that needs to be housed and connected in physical data centers. We believe that our competitive strengths (including our broad network-neutral geographic footprint, our robust data centers and operational excellence, and our engineering and networking expertise) position us well to capitalize on the growing demand for interconnection and colocation services.
INDUSTRY
Overview
Cisco predicts that global Internet protocol (“IP”) traffic is expected to quintuple by 2013. Growth in Internet traffic is being driven by increasing broadband penetration, the proliferation of bandwidth intensive services, the rise in online usage and the maturity of online business models, among other factors. According to a Pew research report, a combination of more subscribers and more content will drive 41% traffic growth each year for broadband operators through 2013. Broadband penetration increases as consumers experience the benefits of broadband access, such as richer content, online video, online gaming, Voice over Internet Protocol, and online music. Increasing broadband penetration leads to new and more expansive bandwidth intensive services by providers who benefit from and deliver their content through the services provided in network-neutral data centers.
4
The various networks that constitute the Internet initially connected with each other at public network access points. The network access points were established by non-profit organizations and government entities, but eventually became owned and managed by telecommunications carriers. As Internet traffic increased, the network access points were unable to scale due to underinvestment by the telecommunications carriers that owned them. Therefore, certain network providers left the network access points and began to connect directly by establishing fiber optic links between their data centers. However, these links were expensive to build, maintain and upgrade, and eventually led to the creation of commercial, network-neutral Internet exchanges, and network-neutral interconnection and colocation data centers.
Colocation Services
Growth in Internet traffic continues to increase demand for colocation services. A colocation data center is typically located in close proximity to telecommunications service providers and houses networking and computing equipment such as switches, routers, fiber optic transmission gear, and servers for businesses that need to connect with each other and the Internet. The highly controlled environment required for this equipment is characterized by a redundant power infrastructure, reinforced floors, sophisticated security and monitoring; and reliable heating, ventilation, and air-conditioning systems. Due to the high cost of building and maintaining colocation data centers, businesses often outsource these services to colocation service providers.
There are two primary types of colocation services: network-neutral and network-specific.
Network-Neutral Colocation. Network-neutral colocation services allow customers to locate their equipment in a data center which offers interconnection to multiple telecommunications service providers. Neutrality enables customers to select the most cost effective and reliable network providers and Internet service providers at each colocation data center.
Network-Specific Colocation. Network-specific colocation services are typically offered by service providers who own or manage networks. These service providers typically encourage or require customers to utilize their own networks.
Interconnection Services
Interconnection and Internet exchange services enable businesses to exchange network traffic through direct connections with each other or through peering connections with multiple businesses. Direct connections are provided through a variety of media including fiber optic, Ethernet, or coaxial cabling. Peering connections are provided over a shared switch fabric at an Internet exchange data center. Growth in Internet traffic is leading to increasing demand for interconnection services, as network providers, service providers and other Internet-dependent businesses require additional connectivity to efficiently exchange increasing amounts of network traffic primarily driven by rich media and IP-centric applications. Online content providers, and providers of other bandwidth-intensive services, in particular, require high densities of interconnections and scalability of a service provider’s interconnection infrastructure in order to optimize their services. For these businesses, direct interconnection with each other as well as with multiple network providers within a data center reduces transit costs, increases the performance of their services, and reduces their time to market.
Industry Trends
Several industry trends are leading to increasing demand for high–quality, network-neutral interconnection and colocation services.
Growth in Internet Traffic. Internet traffic continues to grow and the Internet has become an integral part of people’s daily lives. According to Comscore, 31.0 billion online videos were watched by U.S. Internet users during November 2009, a 144% increase over a year ago. Netpop Research concluded that 92% of Chinese and
5
76% of U.S. broadband users actively contribute to social media sites. Websites, such as Facebook, YouTube, and LinkedIn have become increasingly important to a large percentage of the population. Nielsen Soundscan reported that during 2009, 40% of all music purchases were digital, as over 1 billion digital tracks (up 8.3% from the prior year) and 76.4 million digital albums (up 16.1%) were purchased online. Strategic Analytics predicts the global revenues from online games will increase at a 25.2% compound annual growth rate to $11.8 billion in 2011. In the past year, it has also become clear that visual networking applications are often used concurrently with other applications and sometimes even other visual networking applications, as the visual network becomes a persistent backdrop that remains “on” while the user multitasks or is engaged elsewhere (i.e. multi-tasking with multiple internet applications). We believe the growth in demand for these bandwidth intensive services represents a significant opportunity for providers of network-neutral interconnection and colocation services.
Demand Greater than Supply. According to Tier1 Research, demand in the global multi-tenant datacenter market increased by 14% in 2008, while supply increased only 6%. Data Center vacancy rates are expected to reach an all-time low in 2010 as available space is absorbed.
Increasing Power and Cooling Requirements. Networking and computing equipment manufacturers are reducing the size of the equipment they manufacture while increasing the processing capacity of this equipment. Reduced size has not translated into reduced energy consumption or heat generation, although it has allowed customers to place more equipment in a given area. As a result, customers of colocation services are requiring more power and cooling infrastructure for their networking and computing equipment. We believe only those interconnection and colocation service providers that have the capital, expertise, and experience to scale their infrastructure will be able to meet customers’ increasing power and cooling requirements.
Adoption of Advanced Networking Technology. As broadband penetration increases and telecommunications carriers upgrade to next-generation digital networks, new Internet-based services are being developed for both consumers and businesses. These services typically require more bandwidth and feature networking technologies, such as 10 Gigabit switching, that enable more efficient interconnections through higher packet transfer rates. We believe that network-neutral interconnection service providers who are able to deploy advanced networking technology within their data centers will benefit from this trend.
Growing Awareness of Business Continuity and Disaster Recovery Planning. We believe a growing awareness of business continuity and disaster recovery planning is leading businesses to store an increasing amount of data in secure, off-site data centers that enable them to access this data in real-time. Interconnection and colocation service providers address this need through the use of highly secure and redundant data centers.
OUR COMPETITIVE STRENGTHS
We believe that our competitive strengths position us well to capitalize on the growing demand for our services.
Network-Neutral Business Model
We do not own or operate our own network, and therefore we do not compete with telecommunications service providers including network service providers and Internet service providers. As such, our customers are able to connect directly to their choice of multiple network providers and Internet service providers in an open and competitive marketplace. We believe this enables our customers to reduce network transit costs, improve the performance of their services, and compress their time to market.
High Network Densities
We have approximately 22,300 cross connects between our customers. These interconnections represent one of the highest network densities in our industry, as measured by interconnections per cabinet. We believe our high network
6
densities create a network effect, which provides an incentive for existing customers to remain within our data centers and for new customers to interconnect. We are able to leverage these network densities in our new data centers by connecting to our existing data centers in a given market.
Broad Network-Neutral Geographic Footprint
Our geographic footprint includes 34 data centers in North America. This footprint includes data centers in 17 of the 20 largest metropolitan service areas in the U.S., more than any of our network-neutral competitors. Our presence in these markets enables us to serve customers in locations where Internet traffic is most concentrated and to serve customers who require a broad geographic footprint.
Robust Data Centers and Operational Excellence
We believe our ability to meet high service levels is attributable primarily to the quality of our data centers, our proven operational disciplines tied to methods and procedures, and the capabilities of our operations personnel. Our data centers and operations personnel address our customers’ infrastructure needs, including security, cooling, and redundant power. As a result, we are able to provide a 99.999% uptime guarantee as part of our service-level agreements with our customers.
Engineering and Networking Expertise
We have significant engineering and networking expertise evidenced by our heritage of owning and operating PAIX, one of the first commercial Internet exchanges. This expertise enables us to design data centers and Internet exchange points which proactively address the evolving needs of our customers.
OUR SERVICES
We provide network-neutral interconnection and colocation services and certain other services to our customers.
Colocation Services
Our data centers provide our customers with a reliable, secure and climate controlled environment for their networking and computing equipment. Our colocation services include flexible space options, redundant power and cooling systems, physical security, other sophisticated systems for fire suppression and water leak detection and technical support. Each data center is staffed with highly trained and experienced technicians.
Colocation Space. Our colocation space includes secure cabinets, racks, and cages. We provide colocation space for an initial installation fee and a recurring monthly fee per cabinet, rack, or cage space.
Power. We provide both alternating current and direct current power circuits at various amperages. These power circuits are backed up by both batteries and electric generators. We provide power for an initial installation fee and a recurring monthly fee based on size and type of circuit.
Network-Neutral Interconnection Services
Our network-neutral interconnection services provide our customers with two primary options to exchange network traffic: (1) direct connections with each other utilizing our cross connect services, or (2) peering connections with multiple customers utilizing our Internet exchange services.
Cross Connect Services. Cross connect services enable one-to-one interconnections between customers within a data center, reduce network costs and lower network latency. These services allow customers to connect
7
their networks through a direct physical connection in a meet-me-room. Cross connect services are offered through a variety of media including fiber optic, Ethernet, or coaxial cabling, for an initial installation fee and a recurring monthly fee per connection.
Internet Exchange Services. Internet exchange services enable one-to-many interconnections between customers over a shared network fabric within a data center, reduce network costs, and lower network latency. We offer these services in six of our markets including the San Francisco Bay area, New York Metro area, Seattle, Dallas, Atlanta, and the Northern Virginia area. We provide Internet exchange services at port speeds ranging from 100 megabits per second to 10 gigabits per second for an initial installation fee and a recurring monthly fee.
SingleCNXT®. Our SingleCNXT® service is the resale of Internet access through Internet service providers who connect directly with customers in our data centers. We offer SingleCNXT as an accommodation to certain customers that desire a single point of contact for colocation and Internet access services. We provide SingleCNXT for an initial installation fee and a recurring monthly fee based on the amount of bandwidth committed or used.
Other Services
TechSmart Technical Support Services. TechSmart® technical support services are provided by our technicians, who are available 24 hours per day, 365 days per year. These services include remote hands, equipment installation and maintenance, circuit testing, tape swaps, equipment rebooting, and power cycling. We charge customers for these services on an hourly basis or under contractual arrangements for a certain number of hours of technical support per month.
8
OUR CUSTOMERS
Our customers include those entities that depend on and reach their customers through and with IP and network-centric services. We primarily categorize our customers as network providers, service providers, or content providers. Network providers offer access to communication networks and offer point-to-point or other network connectivity across a metro, region, or country. Service providers include companies that offer their customers access over networks to applications and related services that their customers would otherwise have to host on their own premises and companies that offer their customers a network optimized to deliver specific content, such as Web pages, transaction-based Web sites, streaming media, and real-time video or audio. Content providers include companies that provide communications media, such as video, on-line gaming, Internet protocol television, and other rich content over the Internet to a multitude of users on a myriad of network devices. For the years ended December 31, 2007, 2008, and 2009, no single customer represented more than 10% of our total revenue.
Selected customers include:
| Network Providers |
Service Providers |
Content Providers | ||
| AT&T |
Adobe | AOL | ||
| AboveNet |
Akamai | Apple | ||
| Cogent |
Amazon | CBS Corporation | ||
| Cox Communications |
DirecTV | Electronic Arts | ||
| Japan Telecom |
edgecast | |||
| Level 3 Communications |
Limelight Networks | Forbes.com | ||
| NTT America |
Shaw Business Solutions | Microsoft | ||
| Telmex |
Syniverse | Wikimedia | ||
| Time Warner Cable |
Verisign | YouTube | ||
| Verizon |
Vmware, Inc. | Yahoo! |
The majority of our customer agreements are structured as master or umbrella service agreements that contain all of the general terms and conditions including, provisions for payment, termination, confidentiality, notice, indemnity, and limitation of liability. The master service agreements also incorporate a “Policies and Procedures” document that contains additional customer requirements including installation, insurance, and security.
The terms of legacy master service agreements automatically renew for as long as there are underlying service orders for service. The master service agreements do not contain any specific services or terms of specific services as such terms are generally set forth in separate service orders. Each service order sets forth the type of service, the length of the service term, and the monthly and or one-time charge for the services. Space, power, and peering ports are generally sold for one- to three- year terms. Certain products, such as cross connects, are typically sold on a month-to-month basis.
New master service agreements are for a fixed term with specific service and price agreements.
SALES AND MARKETING
Sales
We use a multi-channel approach to sales. Our sales organization includes senior managers and sales representatives, which are organized into three sales groups: (1) national account management; (2) inside sales; and (3) indirect sales. Our national account management group focuses on our largest customers and developing business with new target accounts. Our inside sales group is responsible for customers that are not covered by our national account management group. This group is the primary destination for new customer leads. Our indirect sales group is responsible for developing and managing relationships with third-party sales partners, which sell our services as part of a broader services solution.
9
Marketing
Our marketing organization is focused on leading and supporting our sales efforts through a comprehensive approach, including creating service solutions and implementing channel marketing initiatives. We support new service development and delivery by providing updates on the competitive landscape including pricing, evolving customer needs, technological advancements, and industry trends. Our brand is actively promoted in North America through targeted public relations campaigns, sponsorship of key industry forums, and participation in relevant industry conferences where we can access key customer decision makers. Our channel marketing effort is responsible for developing demand generation campaigns and for creating selling tools and collateral for targeted sales campaigns.
COMPETITION
The market for our services is highly competitive and we compete primarily based on available capacity, network density, quality of service, location, and price. We are unable to estimate our market share in total or within a particular market because many of our current competitors are privately-held or are divisions of publicly-held companies that do not segregate information specific to our industry in their publicly available disclosures. As a result, we are unable to provide market share information for our industry. Even if we were able to provide current market share information for our industry, such information may become inaccurate after a short period of time due to other entities’ exit from, and entrance into, our market.
Relative to us, some of our competitors possess longer operating histories, greater financial resources (which enable, or may enable, such competitors to adopt aggressive pricing policies), a greater presence in our markets and other markets around the world, a greater ability to differentiate their respective data centers and services and greater brand name recognition.
Our competitors include the following service providers:
Network-Neutral Interconnection and Colocation Service Providers
Network-neutral interconnection and colocation service providers, including Equinix,Terremark, Telx, and Coresite offer services that are similar to ours, including interconnection services, Internet exchange services, and colocation services.
U.S.-Based Telecommunications Carriers
U.S.-based telecommunications carriers, which include AT&T and Verizon, typically provide interconnection services through a single owned network and generally require bandwidth capacity minimums as part of their pricing structures. We believe these competitors operate colocation data centers primarily to help sell their core telecommunications and Internet access services. They are generally national or regional, with widespread brand recognition and significant financial resources.
Managed Service Providers, Web Hosting Companies, Internet Service Providers and Others
Managed service providers, such as InterNAP and Savvis, generally require customers to purchase their Internet access and managed services directly from them. Some web hosting companies and Internet service providers, such as NaviSite, also provide colocation services as part of their offerings. Other companies like Dupont Fabros and Digital Realty Trust provide a multitude of services from data center construction to ongoing data center management. Unlike some of our competitors, we do not own or operate our own network and we do not provide managed services such as data storage, web hosting services, network connectivity and information technology support services to our customers.
10
INTELLECTUAL PROPERTY
We consider certain of our processes, systems, methodologies, databases, software, and trademarks to be proprietary. We rely on a combination of trade secret, copyright, trademark and other laws, license agreements and non-disclosure, non-competition, and other contractual provisions and technical measures to protect our proprietary and intellectual property rights. We consider our trademarks “SWITCH AND DATA,” “PAIX,” “TECHSMART,” “MetroPAIX,” and “SINGLECNXT” to be materially important to our business, and these trademarks are renewable for their statutory terms.
EMPLOYEES
As of December 31, 2009, we employed 365 persons in the U.S. and 11 in Canada. Of the total employees, 79 were employed in engineering and central operations, 84 were employed in sales and marketing, and 73 were employed in management, finance, construction, and IT. Also, we had 140 employees at our data centers.
We believe our relations with our employees are good. Our employees are not represented by a labor union and are not covered by a collective bargaining agreement.
GEOGRAPHIC INFORMATION
The information regarding revenue and long-lived assets set forth in Note 14—“Segment Information” to the Consolidated Financial Statements, is hereby incorporated by reference into this Part I, Item 1.
ADDITIONAL INFORMATION
We file annual, quarterly, special reports, proxy statements and other information with the SEC. You may read and copy any documents that we have filed with the SEC at the SEC’s Public Reference Room at 100 F Street, N.E., Washington, D.C. 20549. Please call the SEC at 1-800-SEC-0330 for further information on the public reference room. Our SEC filings are also available to the public at the SEC’s website at http://www.sec.gov. In addition, we make available free of charge all of the annual, quarterly and special reports, proxy statements, Section 16 insider reports on Form 3, Form 4 and Form 5 and amendments to these reports and other information we file with the SEC, at our Internet website, http://www.switchanddata.com under “Investor Relations”. Our board committee charters and code of ethics are also available on our website and in print to any stockholder who requests them. We do not intend for information contained in our website to be part of this Annual Report on Form 10-K.
| ITEM 1A. RISK | FACTORS |
RISKS RELATED TO THE MERGER WITH EQUINIX
The following outlines potential risks related to the Merger.
Failure to complete the Merger with Equinix could materially and adversely affect us.
The Merger is conditioned upon the receipt of regulatory approvals and other closing conditions. There can be no assurance that these conditions will be met or waived, that the necessary approvals will be obtained, or that we will be able to successfully consummate the Merger as currently contemplated under the Merger Agreement or at all. If the Merger is not consummated, we will not realize the potential benefits of the Merger, including any synergies that could result from our combining with Equinix and, under certain circumstances, we may have to pay a termination fee to Equinix in the amount of approximately $26.8 million.
11
Obtaining required approvals and satisfying closing conditions may delay or prevent completion of the Merger.
Completion of the Merger is conditioned upon the receipt of certain governmental authorizations, consents, orders and approvals, including the expiration or termination of the applicable waiting period, and any extension of the waiting period, under the HSR Act. On January 6, 2010, Equinix received a Request for Additional Information (commonly referred to as a “second request”) from the Antitrust Division of the Department of Justice in connection with the Antitrust Division’s review of the Merger. This second request extends the waiting period imposed by the HSR Act until 30 days after Equinix has substantially complied with the second request unless that period is extended voluntarily by Equinix or terminated sooner by the Antitrust Division. The Merger is now expected to close in the second quarter of 2010.
Although there is currently no contemplation that this will occur, the necessary governmental authorizations, consents, orders and approvals may impose conditions on, or require divestitures relating to, the divisions, operations or assets of Equinix or us. To the extent required, these conditions or divestitures may jeopardize or delay completion of the Merger or may reduce the anticipated benefits of the Merger. In addition, in the event that the Department of Justice requires a divestiture, Equinix will not be required to close the Merger. Further, no assurance can be given that the required authorizations, consents and approvals will be obtained or that the required conditions to closing will be satisfied, and, if all required authorizations, consents and approvals are obtained and the conditions are satisfied, no assurance can be given as to the terms, conditions and timing of the authorizations, consents and approvals.
The pending Merger may disrupt our normal business operations and the Merger Agreement imposes certain restrictions on our activities until the closing.
Our customers may seek to modify or terminate existing agreements, and prospective customers may delay entering into new agreements as a result of the announcement of the Merger. Our ability to attract new employees and retain our existing employees may be harmed by uncertainties associated with the Merger. In addition, the Merger Agreement limits certain of our activities that are considered as other than in the ordinary course of business, including capital expenditures, acquisitions and investments, the ability to incur additional indebtedness and the settlement of certain claims, among others. Some of these restrictions may cause particular long-term damage if the Merger does not close. For example, the restrictions on our ability to raise capital and expand certain of our facilities may leave us at a competitive disadvantage in certain markets, if the Merger does not close, because of a lack of supply and space.
The Merger Agreement restricts our ability to pursue alternatives to the Merger.
The Merger Agreement precludes us from, directly or indirectly soliciting, initiating, or knowingly encouraging the submission of any takeover proposal or participating in any discussions or negotiations regarding, or furnishing to any person any information in connection with, or otherwise cooperating in any way that could reasonably lead to, any third party takeover proposal. In connection with the termination of the Merger Agreement, we will be required to pay Equinix a termination fee of $26.8 million in certain circumstances involving a change in our board of directors’ recommendation of the Merger to our stockholders. These restrictions could discourage a potential third-party acquirer from considering or proposing a transaction, or could reduce the price that a potential third-party acquirer would be willing to pay, because of the added cost of the termination fee.
RISKS RELATED TO OUR BUSINESS
The following outlines potential risks related to our business.
We have incurred substantial losses in the past and may continue to incur losses in the future.
While we earned net income of $0.4 million for the year ended December 31, 2009, we have incurred annual losses in prior years. Also, we did not generate positive net cash flow from operations until 2003. As of December 31, 2009, we had an accumulated deficit of $224.1 million. Despite our recent achievement of profitability, given the competitive and evolving nature of the industry in which we operate, we may not be able to sustain or increase profitability on a quarterly or annual basis.
12
The current economic conditions in the U.S. economy continue to affect our business.
Since late 2007, global consumer confidence has eroded amidst concerns over declining asset values, potential inflation, volatility in energy costs, geopolitical issues, the availability and cost of credit, high unemployment, and the stability and solvency of financial institutions, financial markets, businesses, and sovereign nations. These concerns have slowed economic growth and resulted in a recession in the U.S. If these economic conditions continue or worsen, a number of negative effects on our business could result, including customers or potential customers reducing or delaying orders, the inability of customers to obtain credit, and the insolvency of one or more customers. Any of these effects could impact our ability to collect receivables, increase our need for cash, and ultimately decrease our net revenue and profitability.
Our operating results have fluctuated historically and could continue to fluctuate in the future which could affect our ability to maintain our current market position or expand.
Our operating results have fluctuated in the past and may continue to fluctuate in the future as a result of a variety of factors, many of which are beyond our control, including the following:
| • | changes in general economic conditions and specific market conditions in the telecommunications and Internet-related industries; |
| • | demand for colocation and interconnection services; |
| • | competition from other suppliers of the services we offer; |
| • | our access to capital and ability to fund capital expenditure projects; |
| • | our ability to complete capital expenditure projects on time and on budget; |
| • | the timing and magnitude of operating expenses, capital expenditures, and expenses related to sales and marketing; |
| • | the cost and availability of power and cooling capacity; |
| • | the mix of our current services; |
| • | the financial condition and credit risk of our customers; and |
| • | our acquisition of additional data centers. |
Any of the foregoing factors could have a material adverse effect on our business, results of operations, and financial condition. Although we have experienced growth in revenues and income in recent quarters, this growth rate is not necessarily indicative of future operating results. A relatively large portion of our expenses are fixed, particularly with respect to lease and personnel expenses, depreciation and amortization expenses, and interest expense. Therefore, our results of operations are sensitive to fluctuations in revenues and the speed at which we complete data center expansions. As such, comparisons to prior periods should not be relied upon as indications of our future performance.
We may not be able to secure additional financing to meet our long-term capital needs.
We may require additional financing to fund our planned long-term capital expenditures beyond 2010. We may not be able to secure additional debt or equity financing on favorable terms, or at all, at the time when we need such funding. If we are unable to raise additional funds, or unable to raise additional funds on favorable terms, we may not be able to pursue our growth strategy, or we may have to delay such strategy and our business could suffer. If we raise additional funds through further issuances of equity or convertible debt securities, our existing stockholders could suffer significant dilution in their percentage ownership of our company, and any new equity securities we issue could have rights, preferences, and privileges senior to those of holders of our common stock. In addition, any debt financing that we may secure could have restrictive covenants, which may make it more difficult for us to obtain additional capital and to pursue business opportunities, including potential expansions and acquisitions.
13
We have debt obligations which include restrictive covenants that limit our flexibility to manage our business; failure to comply with these covenants could trigger an acceleration of our outstanding indebtedness.
On March 27, 2008, we entered into a Fourth Amended and Restated Credit Agreement with an effective date of March 28, 2008. Such agreement provided for (i) a $120.0 million term loan (the “Term Loan”), (ii) a $22.5 million delayed draw term loan which was to be funded at the option the Company no later than March 27, 2009 (the “Delayed Draw Term Loan”), (iii) a $15.0 million revolving loan (the “Revolver”) to be used for loans and letters of credit, and (iv) the option to request an incremental term loan before March 27, 2009 of up to $50.0 million (the “Incremental Term Loan”) subject to the willingness of the lenders to make such loan. The Delayed Draw Term Loan was drawn down on January 5, 2009. On September 4, 2009, we entered into the First Amendment to the Fourth Amended and Restated Credit Agreement (as amended, the “Credit Facility”) which, among other things, provided the Company with an additional delayed draw term loan of up to $100.0 million (the “Additional Delayed Draw Term Loan”). The Credit Facility is guaranteed by the Company’s restricted subsidiaries, and is secured by substantially all of the assets of the Company and its restricted subsidiaries. As of December 31, 2009, $120.0 million was outstanding under the Term Loan, $22.5 million was outstanding under the Delayed Draw Term Loan, and a $1.4 million letter of credit was outstanding under the Revolver, and no borrowings had occurred under any Additional Delayed Draw Term Loan. The Incremental Term Loan expired unused on March 27, 2009. The Credit Facility requires that we comply with covenants, including various financial covenants, which among other things, restrict our ability to incur additional debt, pay dividends and make other restricted payments, sell assets, enter into affiliate transactions and take other actions. If we are unable to meet the terms of the financial covenants or if we breach any of the other covenants, a default subject to customary cure rights, could result under the Credit Facility. We have in the past violated certain covenants, under our previous credit facility, including several violations in 2006 that were subsequently waived by our lenders. A default, if not cured within any applicable cure period or waived by our lenders, could result in the acceleration of outstanding indebtedness and the exercise of remedies against the collateral and otherwise. If we are unable to generate sufficient cash to repay our debt obligations when they become due and payable, we will have to refinance such obligations, or otherwise we will not be able to repay our debt and our assets may be foreclosed upon. If new financing is made available, the terms may not be favorable to us and our business may be adversely affected.
Inflation may adversely affect our business operations in the future.
Given the current macroeconomic environment, the recently adopted stimulus package and other proposed spending measures may lead to inflationary conditions in our cost base, particularly resulting in an increase in our leases, utilities and personnel related expenses. This may harm our margins and profitability if we are unable to increase prices or reduce costs enough to offset the effects of inflation in our cost base.
Turmoil in the financial markets may negatively impact our liquidity and our ability to obtain financing, and may also cause a decrease in demand for our services.
Our liquidity and our ability to obtain financing may be negatively impacted if one of our lenders under the Credit Facility, or another financial institution, experiences liquidity issues. In such an event, we may not be able to draw on all, or a substantial portion, of the remaining funds under the Credit Facility. Also, if we attempt to obtain future financing in addition to the Credit Facility or as a replacement for the Credit Facility, credit market turmoil could negatively impact our ability to obtain such financing which could have an impact on our ability to react to changing economic and business conditions. In addition, credit market turmoil could negatively impact certain of our customers which could then lead to a decrease in demand for our services.
Our ability to optimize the utilization of our data centers is limited by the availability and cost of sufficient electrical power and cooling capacity.
The availability of an adequate supply of electrical power and cooling capacity, and the infrastructure to deliver that power and cooling, is critical to our ability to provide our services. Even though physical space may be available in a data center, the demand for electrical power may exceed our designed capacity. We may be unable to meet the increasing power and cooling needs of our customers if our customer power use does not
14
match our expectations or our customers further increase their use of high density electrical power equipment, such as blade servers. In addition, the amount of sellable space within our data centers is reduced to the extent that we house generators and batteries to provide back-up power. Further, certain of the leases for our data centers also contain provisions that limit the supply of electrical power and cooling capacity to such data centers, as a result of which our ability to reach full utilization may be constrained in these data centers. If the availability of power limits our ability to fully utilize the space within our data centers, we may be unable to accept new customers at our data centers and our revenue growth will decline or we may incur additional costs to increase the power supply or acquire space at an additional data center.
We face certain risks in collecting our trade accounts receivable.
We generate a significant amount of trade accounts receivable sales from our customers. Delays or defaults in payments owed to us could have a material adverse effect on our financial condition and results of operations. Factors that could cause a delay or default include business failures, turmoil in the financial and credit markets, sluggish or recessionary U.S. economic conditions, our exposure to customers in high-risk sectors, and declines in the credit worthiness of our customers.
We are exposed to intangible asset risk; specifically, our goodwill may become impaired.
As of December 31, 2009, we have $36.0 million of goodwill recorded on our Consolidated Balance Sheet. A significant and sustained decline in our stock price and market capitalization, a significant decline in our expected future cash flows, a significant adverse change in the business climate or slower growth rates could result in the need to perform an impairment analysis under generally accepted accounting principles in future periods. If we were to conclude a write down of our goodwill is necessary, then we would record the appropriate charge, which could result in material charges that are adverse to our operating results and financial position. See “Management’s Discussion and Analysis of Financial Condition and Results of Operations – Estimates and Critical Accounting Policies – Goodwill and Other Intangible Assets” for further details.
The high utilization of our data centers may limit our ability to grow in certain key markets, and we may be unable to expand our existing data centers or locate and secure suitable sites for additional data centers.
Our data centers have reached high rates of utilization in many of our key markets. Our ability to meet the growing needs of our existing customers and to attract new customers in these key markets depends on our ability to add additional capacity by incrementally expanding our existing data centers or by locating and securing additional data centers in these markets. Such additional data centers must meet specific infrastructure requirements such as access to multiple telecommunications carriers, a significant supply of electrical power, high ceilings, and the ability to sustain heavy floor loading. In many markets, the supply of data centers with these characteristics is limited and subject to high demand. If we are unable to expand our capacity in a timely and cost-effective manner, our business and results of operations may be adversely affected.
If we continue to invest in our expansion efforts, we may not have sufficient customer demand in the future to realize expected returns on these investments.
If we continue to expand our product capacity in existing markets, we will be required to commit substantial operational and financial resources to new and expanded data centers, generally six to eighteen months in advance of placing customers in such data centers. We may not have sufficient customer demand in those markets to support these new and expanded data centers once they are built. In addition, unanticipated technological changes or excess capacity in the colocation market could negatively affect customer demand for our data centers. If any of these events were to occur, it could make it difficult for us to realize expected or reasonable returns on these investments and could have a material adverse effect on our operating results.
Our potential construction of additional data center space could involve significant risks to our business.
Construction involves substantial planning and allocation of company resources. Construction also requires us to carefully select and rely on the experience of one or more general contractors and associated subcontractors
15
during the construction process. Should a general contractor or significant subcontractor experience financial or other problems during the construction process, we could experience significant delays, increased costs to complete the project and other negative impacts to our expected returns. Site selection is also a critical factor in our expansion plans, and there may not be suitable properties available in our markets with the necessary combination of high power capacity and fiber connectivity.
We do not own the buildings in which our data centers are located. Instead, we lease our data center space, and the non-renewal of leases could be a significant risk to our ongoing operations.
We would incur significant costs if we were forced to vacate one of our data centers due to the high costs of relocating the equipment in our data centers and installing the necessary infrastructure in a new data center. In addition, if we were forced to vacate a data center, we could lose customers that chose our services based on our location. Our landlords could attempt to evict us for reasons beyond our control. Further, we may be unable to maintain good working relationships with our landlords, which would adversely affect our customer service and could result in the loss of current customers.
In addition, our business would be harmed by our inability to renew leases at favorable terms. Most of our leases provide renewal options with rent set at then-prevailing market rates. We expect the prevailing market rates will be higher than present rates. To maintain the operating profitability associated with our present cost structure, we must increase revenues within existing data centers to offset the anticipated increase in lease payments at the end of the original and renewal terms. Failure to increase revenue sufficiently to offset these projected higher costs would adversely impact our operating income.
Additionally, seven of our leases do not contain renewal options. Renewing these leases at favorable terms will be critical to continuing those operations. Even those leases which contain renewal options do not ensure long-term operations at those data centers.
If our contracts with our customers are not renewed or are terminated, our business could be substantially harmed.
Our customer contracts for space and power typically have terms of one to three years. Interconnection services are typically provided either on a month-to-month basis or over a one year term. Our customers may elect to not renew these contracts. Furthermore, our customer contracts are terminable for cause if we breach a material provision of the contract, including the failure to provide power or connectivity for extended periods of time, or violate applicable laws or regulations. We may face increased competition and pricing pressure as our customer contracts become subject to renewal. Our customers may negotiate renewal of their contracts at lower rates, for fewer services or for shorter terms. If we are unable to successfully renew our customer contracts on their current terms, or if our customer contracts are terminated, our business could suffer.
Any failure of our physical infrastructure or services could lead to significant costs and disruptions that could reduce our revenues, harm our business reputation, and have a material adverse effect on our financial results.
Our business depends on providing customers with highly reliable service. The services we provide are subject to failure resulting from numerous factors, including:
| • | human error; |
| • | power loss; |
| • | improper building maintenance by the landlords of the buildings in which our data centers are located; |
| • | physical or electronic security breaches; |
| • | fire, earthquake, hurricane, flood, and other natural disasters; |
| • | water damage; |
16
| • | the effect of war, terrorism, and any related conflicts or similar events worldwide; and |
| • | sabotage and vandalism. |
Problems at one or more of our data centers, whether or not within our control, could result in service interruptions or equipment damage. We have service level commitment obligations to substantially all of our customers. As a result, service interruptions or equipment damage in our data centers could result in credits for service interruptions to these customers. We have at times in the past given credits to our customers as a result of service interruptions due to equipment failures. We cannot assume that our customers will accept these credits as compensation in the future. Also, service interruptions and equipment failures may expose us to additional legal liability and impair our brand image. We depend on our landlords and other third-party providers to properly maintain the buildings in which our data centers are located. Improper maintenance by such landlords and third parties increases the risk of service interruptions and equipment damage.
Certain of our data centers, particularly those in California, Florida and the Pacific Northwest, are located in areas particularly susceptible to natural disasters such as earthquakes, hurricanes, and tornadoes. The occurrence of any natural disaster could shut down one or more of our data centers and result in a material adverse effect upon our results of operations. Moreover, we may not have adequate property or liability insurance to cover catastrophic events.
We may not be able to compete successfully against current and future competitors.
We compete with network-neutral data center operators, including U.S.-based telecommunications carriers and Internet service providers, managed service providers, and web hosting companies. Many of our competitors have longer operating histories and significantly greater financial, technical, marketing, and other resources than us, and some have a greater presence in our markets and in other markets across the U.S. and around the world.
Because of their greater financial resources, some of our competitors have the ability to adopt aggressive pricing policies. As a result, we may suffer from pricing pressure that would adversely affect our ability to generate revenues and adversely affect our operating results. In addition, certain of these competitors currently offer interconnection and colocation services in the same markets where we have data centers, and other competitors may start doing so in the future. Some of these competitors may also provide our current and potential customers with additional benefits, including one-stop shopping options through bundled services, and may do so in a manner that is more attractive to our potential customers than our services. These competitors may be able to provide bundled services at prices lower than our cost structure allows. If, as a result of such efficiencies, these competitors are able to adopt aggressive pricing policies, our ability to generate revenues would be materially and adversely affected.
In addition, our competitors may operate more successfully or form alliances to acquire significant market share. Once businesses locate their networking and computing equipment in competitors’ data centers, it may be difficult to convince them to relocate to our data centers. Furthermore, a business that has already invested substantial resources in such arrangements may be reluctant or slow to replace, or reduce its existing services by becoming our customer.
Finally, we may also experience competition from our landlords. Rather than leasing available space in our buildings to us or other large single tenants, they may decide to convert the space instead to smaller units designed for multi-tenant use. Landlords may enjoy a cost advantage in providing services similar to those provided by us, and this could also reduce the amount of space available to us for expansion in the future.
If we fail to differentiate our data centers and services from the services provided by our current or future competitors, we may not be able to compete successfully and our business and results of operation may be adversely affected.
17
We are dependent upon third-party suppliers for power and certain other services, and we are vulnerable to service failures of our third-party suppliers and to price increases by such suppliers.
We generally do not control the amount of power our customers draw from their installed circuits. We rely on third parties to provide power, and we cannot ensure that these third parties will deliver such power in adequate quantities or on a consistent basis. If the amount of power available to us is inadequate to support our customer requirements or delivery of power does not occur in a timely manner, we may be unable to provide our services to our customers and our operating results and cash flow may be materially and adversely affected. In addition, our data centers are susceptible to power shortages and planned or unplanned power outages caused by these shortages. We attempt to limit exposure to power shortages by using backup generators and batteries. Power outages, which may last beyond our backup and alternative power arrangements, would harm our customers and our business. In the past, a limited number of our customers have experienced temporary losses of power. We could incur financial obligations in connection with a loss of power. In addition, any loss of services or equipment damage could reduce the confidence of our customers in our services and could consequently impair our ability to attract and retain customers, which would adversely affect both our ability to generate revenues and our operating results.
We are dependent upon third-party suppliers for the resale of Internet access and other services, and we have no control over the quality and reliability of the services provided by these suppliers. In the past, some of these providers have experienced significant system failures. Users of our services may in the future experience difficulties due to service failures unrelated to our systems and services. If for any reason these suppliers fail to provide certain services to us, our business, financial condition and results of operations could be adversely affected.
We depend upon a limited number of network provider customers in certain of our data centers, and the loss of one or more of these customers in those data centers could adversely affect business.
Because we do not own or operate our own network, we depend upon network providers to colocate and/or interconnect as customers in our data centers and contribute to the network density that attracts our other customers. In several of our smaller data centers we have agreements with only a limited number of network providers. In these small market data centers, we expect that we will continue to rely upon a smaller number of network provider customers to maintain network density within those data centers. Our agreements with these network providers will expire over a one to three year period if not renewed. A loss of one or more of these customers could have a material and adverse effect on the operations of one or more of our data centers, which could in turn have a material and adverse effect on our overall results of operations.
Our ability to grow depends on a diverse customer base, and our failure to develop and maintain a diverse customer base could harm our business and adversely affect our results of operations.
Our ability to grow is dependent on developing and maintaining a diverse customer base, consisting of a variety of businesses, including telecommunications carriers, Internet service providers, and enterprises. We believe creating a diverse customer base in each data center will generate incremental interconnection revenues in the long-term and increase our overall revenues. Attracting and retaining these customers will depend on many factors, including the presence of multiple telecommunications carriers in our data centers, the mix of services offered by us, our overall customer diversity, the operating reliability and security of our data centers, and our ability to market our services effectively across different customer segments. If we fail to develop and maintain a diverse customer base, our business and results of operations may be adversely affected.
We may make future acquisitions, which could include integration and other risks that could harm our business.
We may acquire complementary businesses, product or service lines, and technologies in the future. We cannot assure you that we will be able to (1) identify future strategic acquisitions; (2) consummate these potential acquisitions on favorable terms; if at all, or (3) if consummated, successfully integrate the operations and
18
management of future acquisitions. To finance these acquisitions, we may incur additional debt and issue additional shares of our stock, which will dilute existing stockholders’ ownership interests in us and may adversely affect our business and operations.
Specific challenges we have encountered in our prior acquisitions include the following:
| • | unexpected capital expenditures to improve the condition of the acquired equipment so as to achieve the desired level of quality of service; |
| • | additional capital expenditures because of less product availability than expected; |
| • | loss of customers; and |
| • | difficulties in maintaining uniform procedures, policies, and controls. |
Future acquisitions may expose us to the challenges set forth above and other risks such as:
| • | Financial risks, such as (1) the payment of a purchase price that exceeds the future value that we may realize from the acquired operations and businesses; (2) an increase in our expenses and working capital requirements, which could reduce our return on invested capital; (3) potential known and unknown liabilities of the acquired businesses; (4) costs associated with integrating acquired businesses, operations, or technologies; (5) the dilutive effect of the issuance of additional equity securities; (6) the incurrence of additional debt; (7) the financial impact of valuing goodwill and other intangible assets involved in any acquisitions, potential future impairment write-downs of goodwill and indefinite life intangibles and the amortization of other intangible assets; and (8) possible adverse tax and accounting effects. |
| • | Operating risks, such as (1) the diversion of management’s attention to the assimilation of the businesses, operations, or technologies to be acquired; (2) the risk that the acquired businesses, operations, or technologies will fail to maintain the quality of services that we have historically provided; (3) the need to implement financial and other systems and add management resources; (4) the need to maintain customer, supplier or other favorable business relationships of acquired operations and restructure or terminate unfavorable relationships; (5) the potential for deficiencies in internal controls of the acquired operations; (6) an inability to attract and retain employees necessary to support the acquired businesses; (7) unforeseen difficulties (including any unanticipated liabilities) in the acquired operations; and (8) the impact on us of any unionized work force we may acquire or any labor disruptions that might occur. |
We have a long sales cycle that may have a material adverse effect on our business, financial condition, and results of operations. The sales cycle may lengthen even more due to the current macroeconomic environment.
A customer’s decision to license rack, cabinet, or cage space in one of our data centers and to purchase interconnection services typically involves a significant commitment of our time and resources. Many customers are reluctant to commit to purchasing our colocation and interconnection services until they are confident that our data center has adequate available carrier connections and network density. As a result, we may experience a long sales cycle for our services. Furthermore, we may expend significant time and resources in pursuing a particular sale or customer that does not generate revenue. Delays due to the length of our sales cycle or costs incurred that do not result in sales may have a material adverse effect on our business, financial condition, and results of operations.
Our success depends upon retaining the services of our management team and other key employees.
We are highly dependent on our management team and other key employees. We expect that our continued success will depend upon the efforts and abilities of members of our management team and other key employees. Our success also depends upon our ability to identify, develop, and retain qualified employees. The loss of one or more of our management or other key employees could have a material adverse effect on our business.
19
Our brand is not as well known as that of some of our competitors. Failure to develop and maintain brand recognition could harm our ability to compete effectively.
Many of our competitors are large telecommunications service providers that promote their brands with significantly larger budgets than we have for brand promotion. If we fail to develop and maintain brand recognition through sales and marketing efforts and a reputation for high quality service, we may be unable to attract new customers and risk losing existing customers to competitors with better known brands.
We have not been successful in attracting customers in several regional markets and have closed several data centers.
We maintain a presence in select regional markets across the U.S. and, in several of those markets, we have not been successful in attracting customers to our data centers. We have also exited certain markets. In connection with our exit from these markets and in other markets, we have taken significant asset impairment and discontinuation charges. Our failure to attract sufficient customers in our remaining regional markets could cause us to close one or more of our data centers and lose customers which may adversely affect our business.
We could incur substantial costs as a result of compliance, or the failure to comply, with environmental laws.
We are subject to various environmental and health and safety laws and regulations, including those relating to the generation, storage, handling, and disposal of hazardous substances and wastes. Certain of these laws and regulations impose liability, without regard to fault or the lawfulness of the disposal activity, for the entire cost of the investigation and cleanup of contaminated sites on current and former owners and operators of real property and persons who have disposed of or released hazardous substances at any location. Our data centers contain tanks for the storage of diesel fuel and significant quantities of lead acid batteries to provide back-up power. We maintain an environmental compliance program that includes the implementation of required technical and operational procedures designed to minimize the potential for leaks and spills, maintenance of records, and manufacturers’ recommended preventative maintenance. However, we cannot guarantee that these systems will remain free from leaks or that the use of these systems will not result in spills. Any leak or spill of hazardous materials could result in interruptions to our operations and expenditures that could have a material adverse effect on our business, financial condition, and results of operations. Moreover, hazardous substances or regulated materials of which we are not aware may be present at data centers we operate and lease. To the extent any such contaminants are discovered at our data centers, we may be responsible under applicable laws, regulations, or leases for any required removal or cleanup at substantial cost. In addition, non-compliance with or liabilities under existing environmental or health and safety laws and regulations, or the adoption of more stringent requirements in the future, could result in fines, penalties, third-party claims, and other costs that could be material.
In addition, from time to time new regulations are enacted, or existing requirements are changed, and it is difficult to anticipate how such new regulations and changes will be implemented and enforced. While we believe that we will be able to comply with such new regulations and changes, we may experience negative consequences from these new regulations and changes, including, but not limited to, supply shortages or delays, increased raw material and component costs, accelerated obsolescence of certain of our raw materials, components and products and the need to modify or create new designs for our existing and future products.
In addition, as global warming issues become more prevalent, the U.S. and foreign governments are beginning to respond to these issues. This increasing governmental focus on global warming may result in new environmental regulations that may negatively affect us, our suppliers and our customers. This could cause us to incur additional direct costs in complying with any new environmental regulations, as well as increased indirect costs resulting from our customers, suppliers or both incurring additional compliance costs that get passed on to us. These costs may adversely impact our operations and financial condition.
Fluctuations in Canadian exchange rates could harm our results of operations
We have a data center located in Toronto, Canada. We may experience gains and losses resulting from fluctuations in Canadian currency exchange rates. Fluctuating foreign currency exchange rates have a direct
20
impact on how our international results of operations translate into U.S. dollars. During 2009, the U.S. dollar was generally weaker relative to the Canadian dollar. This adversely impacted our results of operations as amounts in Canadian dollars translated into fewer U.S. dollars. To the extent the U.S. dollar weakens further, this will continue to have an unfavorable impact on our consolidated financial position and results of operations including the amount of revenue that we report in future periods. For additional information on foreign currency risk, refer to our discussion of foreign currency risk in “Quantitative and Qualitative Disclosures About Market Risk” included in Part II, Item 7A of this Annual Report on Form 10-K.
Increases in property taxes could adversely affect our business, financial condition and results of operations.
Our data centers are subject to state and local real property taxes. The state and local real property taxes on our data centers may increase as property tax rates change and as the value of the properties are assessed or reassessed by taxing authorities. Many state and local governments are facing budget deficits, which may cause them to increase assessments or taxes. If property taxes increase, our business, financial condition and operating results could be adversely affected.
Certain of our stockholders have significant control.
Several of our stockholders each hold voting control over greater than 10% of our outstanding common stock. In addition, these stockholders are not prohibited from buying shares of our stock in public or private transactions. As a result, each of these stockholders is able to exercise significant control over all matters requiring stockholder approval, including the election of directors and approval of significant corporate transactions, which could prevent or delay a third party from acquiring or merging with us.
We may be vulnerable to security breaches which could disrupt our operations and have a material adverse effect on our financial performance and operating results.
A party who is able to compromise the security measures on our networks or the security of our infrastructure could misappropriate either our proprietary information or the personal information of our customers, or cause interruptions or malfunctions in our operations. We may be required to expend significant capital and financial resources to protect against such threats or to alleviate problems caused by breaches in security. As techniques used to breach security change frequently, and are generally not recognized until launched against a target, we may not be able to implement security measures in a timely manner or, if and when implemented, these measures could be circumvented. Any breaches that may occur could expose us to increased risk of lawsuits, loss of existing or potential customers, harm to our reputation and increases in our security costs, which could have a material adverse effect on our financial performance and operating results.
A small number of customers account for a significant portion of our revenues, and the loss of any of these customers could significantly harm our business, financial condition and results of operations.
While no single customer accounted for 10% of our revenues for the year ended December 31, 2009, monthly recurring revenues for our top 10 customers at December 31, 2009 accounted for approximately 23% of our 2009 revenues. We currently depend, and expect to continue to depend upon a small number of customers for a significant percentage of our net revenue and upon their growth, viability, and financial stability. If any of our customers experience a decline in demand due to economic or other forces, the customer may reduce its level of commitment to us or terminate their relationship with us. A significant reduction in sales to any of our customers or a customer exerting significant pricing and margin pressures on us could have a material adverse effect on our result of operations.
If the market price of our stock continues to be volatile, the value of an investment in our common stock may decline and our ability to provide incentive compensation to our employees may be negatively impacted.
The market price of the shares of our common stock has been and may continue to be volatile. From February 7, 2007, the date of our initial public offering, to December 31, 2009, the price of our common stock on
21
the NASDAQ Global Select Market has ranged from $3.92 to $22.00 per share. Equinix’s stock price, opinions in the market regarding the risks relating to the closing of the Merger and the timing of the closing, general economic and market conditions, and market conditions for telecommunications stocks in general, may affect the market price of our common stock.
Announcements by us, Equinix, or our key customers or competitors may have a significant impact on the market price of our common stock. These announcements may relate to:
| • | operating results; |
| • | Equinix’ operating results; |
| • | general conditions in our industry; |
| • | new issuance of equity, debt, or convertible debt by us or Equinix; |
| • | developments in our or Equinix’s relationships with customers; |
| • | changes in regulatory policy or interpretation; |
| • | changes in the rating of our stock or Equinix’s stock by securities analysts; |
| • | our development, or Equinix’s development, of additional data center space; |
| • | acquisitions by us, or Equinix, of complementary businesses; or |
| • | the operational performance of our data centers or Equinix’s data centers. |
Furthermore, stock prices for many companies and emerging telecommunications companies in particular, fluctuate widely for reasons that may be unrelated to their operating results. Those fluctuations and general economic, political and market conditions, such as recessions or international currency fluctuations and demand for our services, may adversely affect the market price of our common stock.
As is common in our industry, our management team and employees are typically compensated through grants of equity awards in addition to their regular salaries. The volatility of our stock price may negatively impact our ability to provide equity incentive value to our management team and employees. To the extent we are unable to offer competitive compensation packages to our employees and adequately maintain equity incentive value, this may have a material adverse effect on our business, financial condition, and results of operations.
In addition to certain provisions of the Merger Agreement restricting our ability to pursue alternatives to the Merger, our authorized but unissued common stock and preferred stock may prevent a change in our control.
Our amended certificate of incorporation authorizes us to issue additional shares of our common stock or preferred stock. In addition, our board of directors may classify or reclassify any unissued shares of our preferred stock and may set the preferences, rights, and other terms of the classified or reclassified shares. As a result, our board may establish a series of preferred stock that could delay or prevent a transaction or a change in control that might involve a premium price for our common stock or otherwise be in the best interest of our stockholders. See “Risk Factors—Risks Related to the Merger with Equinix—The Merger Agreement restricts our ability to pursue alternatives to the Merger.”
In addition to certain provisions of the Merger Agreement restricting our ability to pursue alternatives to the Merger, anti-takeover provisions in our amended certificate of incorporation and amended and restated by-laws could delay a change in management and limit our share price.
Certain provisions of our amended certificate of incorporation and amended and restated by-laws could make it more difficult for a third party to acquire control of us or for us to acquire control of a third party even if such a change in control would increase the value of your common stock. We have a number of anti-takeover devices in place that will hinder takeover attempts and could reduce the market value of our common stock or prevent sale at a premium. Our anti-takeover provisions include:
| • | a staggered, or classified, board of directors; |
22
| • | removal of directors, only for cause, by 80% of the voting interest of stockholders entitled to vote; |
| • | a provision denying stockholders the ability to call special meetings; |
| • | Section 203 of the Delaware General Corporation Law, which restricts certain business combinations with interested stockholders in certain situations; and |
| • | advance notice requirements by stockholders for director nominations and actions to be taken at annual meetings. |
See “Risk Factors—Risks Related to the Merger with Equinix—The Merger Agreement restricts our ability to pursue alternatives to the Merger.”
Failure to design, implement and maintain effective internal controls could have a material adverse effect on our business and stock price.
As a public company, we must meet certain requirements for disclosure and internal controls and procedures. The process of designing and implementing effective controls and procedures is a continuous effort that requires us to anticipate and react to changes in our business and the economic and regulatory environments and to expend significant resources to maintain a system of controls and procedures that is adequate to satisfy our reporting obligations as a public company. If we are unable to establish and maintain appropriate internal financial reporting controls and procedures, it could cause us to fail to meet our reporting obligations on a timely basis, result in material misstatements in our financial statements and harm our operating results. In addition, we are required to document and test our disclosure and internal controls and procedures in order to satisfy the requirements of Section 404 of the Sarbanes-Oxley Act, which requires annual management assessments of the effectiveness of our disclosure controls and procedures, the effectiveness of our internal control over financial reporting and a report by our independent auditors on our internal control over financial reporting. Testing and maintaining our disclosure and internal controls and procedures may divert our management’s attention from other matters that are important to our business. We may not be able to conclude on an ongoing basis that we have effective disclosure controls and procedures, effective internal control over financial reporting in accordance with Section 404 or our independent auditors may not issue a favorable assessment. If either we are unable to conclude that we have effective disclosure controls and procedures, effective internal control over financial reporting or our independent auditors are unable to provide us with an unqualified report, investors could lose confidence in our reported financial information, which could have a negative effect on the trading price of our stock.
RISKS RELATED TO OUR INDUSTRY
Our business depends on the continued use of the Internet, as well as the increasing adoption and usage of bandwidth intensive services.
Acceptance and use of the Internet may not continue to develop at historical rates and a sufficiently broad base of consumers may not continue to use the Internet and other online services as a medium of communication, commerce, and entertainment. Demand for Internet services and products is subject to a high level of uncertainty and such services and products are subject to significant pricing pressure. As a result, we cannot be certain that a viable market for our services will be sustainable in our markets. If the market for our services grows more slowly than we currently anticipate, our revenues and operating results will be materially and adversely affected.
Industry consolidation may have a negative impact on our business.
The telecommunications industry has a history of consolidation. As our customers consolidate, there may be fewer telecommunications service providers available in our data centers and, with less network density in our data centers, our network-neutral interconnection and colocation services may become less attractive to our customers. Further, our customers may require less colocation and interconnection services as they combine businesses. Given the competitive and evolving nature of this industry, further consolidation of our customers and competitors may present a risk to our network-neutral business model and have a material adverse effect on our revenues and results of operations.
23
Changes in technology could adversely affect our business.
The markets for the services we offer are characterized by rapidly changing technology, evolving industry standards, frequent new service introductions, shifting distribution channels, and changing customer demands. We may not be able to adapt our services or acquire new services that can compete. We risk losing customers to our competitors if we are unable to adapt to this evolving marketplace.
In addition, our large telecommunications service provider customers that may be colocated at our data centers and our competitors’ data centers may, for reasons that are beyond our control, decide to upgrade the equipment in our competitors’ data centers but not at our data centers. This could lead to the phasing out of our data centers as a marketplace for telecommunications services, making our services less desirable for our customers. Such an occurrence would adversely affect our financial condition, our ability to retain existing customers, and our ability to attract new customers.
Government regulation of data networks is largely unsettled, and depending on its evolution, may adversely affect our business.
The telecommunications industry is currently undergoing a transformation in technology as it moves from a traditional dedicated circuit network architecture to a design where all forms of traffic—voice, video, and information—are transmitted as digital bits over IP-based networks. With the advent of these digital data transmissions and the growth of the Internet, data networks are becoming the networks over which all communications services can be offered. Determining the appropriate regulatory framework for these data networks is one of the most significant challenges facing federal and state telecommunication policy makers. As a result of this fundamental shift in the telecommunications industry’s underlying technology, various laws, and governmental regulations in the U.S., at the federal, state, and local levels, and in Canada, governing IP-based services, related communications services, and information technologies remain largely unsettled.
We are currently regulated by the Federal Communications Commission and the Canadian Radio Television and Telecommunications Commission regarding our provision of International Private Line interexchange services. We are also regulated by the New York State Department of Public Service regarding the provisions of intrastate interexchange services. Due to changing technology and applications of that technology it is uncertain whether and how existing laws or regulations or new laws or regulations will be applied by the Federal Communications Commission and other regulatory agencies in the future to other currently unregulated services we offer, or to new services or products that we may offer in the future.
Terrorist activity throughout the world and military action to counter terrorism could adversely impact our business, particularly in regards to our operations located in the San Francisco Bay Area and New York City.
We may not have adequate property and liability insurance to cover catastrophic events or attacks brought on by these factors. In addition, we depend heavily on the physical infrastructure, particularly as it relates to power, that exists in the markets in which we operate. Any damage to such infrastructure in these markets, particularly in our New York City and San Francisco Bay Area markets that are likely to be more prone to terrorist activity, may materially and adversely affect our business.
| ITEM 1B. UNRESOLVED | STAFF COMMENTS |
None.
24
| ITEM 2. | PROPERTIES |
Our corporate headquarters are located in Tampa, Florida. We lease space for our data centers in buildings with a significant concentration of telecommunications carriers or buildings located near the primary telecommunications central offices within a particular market. This proximity to telecommunications carriers reduces the cost and complexity of connecting their networks to our data centers. We currently operate 34 data centers. The amount of gross square footage in each of our markets ranges from 12,000 to 256,100 square feet. The amount of gross square footage for our top ten markets, as defined by revenues, ranges from 20,800 to 256,100 square feet. We believe that our data centers are well maintained, have a high utilization rate and are generally suitable and adequate to carry out our business at expected capacity for the foreseeable future. As of February 15, 2010, the following table shows the number and gross square footage of our data centers, along with other information:
| Market |
Number of our Facilities |
Approximate Gross Square Footage |
Lease Expiration Dates | Approximate 2010 Annual Cash Rent (in thousands) |
Renewal Option and Other Data |
|||||||
| Top Markets |
||||||||||||
| New York Metro area* |
4 | 256,100 | Ranges from 8/2014 to 7/2023 | $ | 7,273 | (1 | ) | |||||
| San Francisco Bay area* |
3 | 107,200 | Ranges from 8/2019 to 2/2025 | $ | 4,567 | (2 | ) | |||||
| Atlanta* |
1 | 108,500 | Ranges from 2/2015 to 11/2023 | $ | 2,469 | (3 | ) | |||||
| Northern Virginia area* |
3 | 84,200 | Ranges from 7/2014 to 10/2024 | $ | 3,709 | (4 | ) | |||||
| Dallas* |
3 | 72,200 | Ranges from 6/2014 to 6/2020 | $ | 2,179 | (5 | ) | |||||
| Seattle* |
2 | 62,700 | Ranges from 4/2014 to 9/2023 | $ | 4,847 | (6 | ) | |||||
| Toronto |
1 | 58,800 | Ranges from 4/2011 to 3/2019 | $ | 3,961 | (7 | ) | |||||
| Philadelphia |
2 | 41,900 | Ranges from 1/2018 to 10/2022 | $ | 957 | (8 | ) | |||||
| Chicago |
1 | 21,700 | 11/2013 | $ | 363 | (9 | ) | |||||
| Los Angeles |
1 | 20,800 | 2/2019 | $ | 1,218 | (10 | ) | |||||
| Top Markets Total |
21 | 834,100 | ||||||||||
| Other Markets** |
13 | 226,500 | ||||||||||
| Total |
34 | 1,060,600 | ||||||||||
| * | Denotes market where we also provide Internet exchange services. |
| ** | Boston, Buffalo, Cleveland, Denver, Detroit, Indianapolis, Miami (2 data centers), Nashville, Phoenix, Pittsburgh, St. Louis and Tampa. |
| (1) | Of our leased space in the New York Metro area, approximately 180,400 square feet is subject to a lease renewal option and approximately 75,700 square feet is not subject to a lease renewal option. |
| (2) | All of our leased space in the San Francisco Bay area is subject to a lease renewal option. |
| (3) | All of our leased space in Atlanta is subject to renewal options. Of our space in Atlanta, approximately 81,500 square feet is not expected to open to customers until the latter half of 2010. |
| (4) | Of our leased space in Northern Virginia, approximately 59,600 square feet is subject to a lease renewal option, and approximately 24,600 square feet is not subject to a lease renewal option. |
| (5) | Of our leased space in Dallas, approximately 31,600 square feet is subject to a lease renewal option, and approximately 40,600 square feet is not subject to a lease renewal option. Space not subject to a lease renewal is under lease through June 2020. |
| (6) | All of our leased space in Seattle is subject to a lease renewal option. |
| (7) | All of our leased space in Toronto is subject to a lease renewal option. |
| (8) | Of our leased space in Philadelphia, 21,300 square feet is subject to a lease renewal option, and approximately 20,600 square feet is not subject to a lease renewal option. |
| (9) | All of our leased space in Chicago is not subject to a lease renewal option. |
| (10) | All of our leased space in Los Angeles is subject to a lease renewal option. |
25
| ITEM 3. | LEGAL PROCEEDINGS |
On October 27, 2009, a purported stockholder class action lawsuit was filed in the Delaware Chancery Court against Switch and Data, members of Switch and Data’s board of directors, Sundance Acquisition Corporation and Equinix. The lawsuit, Gibbs v. Switch & Data Facilities Company, Inc., et al. (Case No. 5027-VCS), alleged that the members of our board of directors breached their fiduciary duties to our stockholders in connection with the Merger by, among other things, entering into the Merger Agreement without first taking steps to obtain adequate, fair and maximum consideration for our stockholders, by structuring the transaction to benefit themselves and by including provisions intended to dissuade other potential suitors from making competing offers. The complaint also alleged that Switch and Data and Equinix aided and abetted those supposed breaches of duty. The complaint sought various forms of relief, including but not limited to an injunction prohibiting the consummation of the Merger.
On October 30, 2009, a second purported stockholder class action lawsuit, Jiannaras v. Switch & Data Facilities Company, Inc., et al. (Case No. 09-CA-027950), was filed against the same defendants in a Hillsborough County, Florida state court. The complaint alleged that the members of our board of directors breached their fiduciary duties to our stockholders by, among other things, failing to take steps to maximize our value to our stockholders, failing to value properly Switch and Data, failing to protect against the directors’ conflicts of interest, and failing to disclose all material information to allow a fully informed vote by the stockholders. Specifically, plaintiffs contended that the defendants timed the merger to take advantage of the recent downturn in our share price to sell us at an illusory premium that did not reflect our financial performance, thereby depriving our stockholders of the true value of their shares and allowing defendants to reap disproportionate benefits to themselves instead of maximizing stockholder value. Plaintiffs further asserted that Switch and Data and Equinix aided and abetted the alleged breaches of duty by our directors. The complaint sought various relief, including but not limited to an injunction prohibiting the consummation of the Merger.
On December 7, 2009, a third purported stockholder class action lawsuit, Broadbased Equities v. Keith Olsen, et al. (Case No. 8:09-CV-02473), was filed against the same defendants (other than Sundance Acquisition Corporation, which was not named) in the United States District Court for the Middle District of Florida. The complaint alleges that the defendants have provided materially incomplete information to our stockholders in the Proxy Statement, that our Chief Executive Officer and President sought to advance his own interests at the expense of our stockholders in connection with the Merger, and that our directors breached their fiduciary duties in connection with the Merger, including by agreeing to provisions in the Merger Agreement intended to dissuade other potential suitors from making competing offers. The complaint also alleged that Equinix aided and abetted those supposed breaches of duty. The complaint sought various forms of relief, including but not limited to an injunction prohibiting the consummation of the Merger.
On January 19, 2010, counsel for parties in all three lawsuits entered into a memorandum of understanding in which they agreed upon the terms of a settlement of all lawsuits. In connection with this settlement, the three lawsuits and all claims asserted therein would be dismissed with prejudice, including the claims brought against us and our directors. The parties will seek approval of the settlement in the Florida state court; simultaneously, the parties will agree to stay the actions pending in the Delaware Chancery Court and the United States District Court for the Middle District of Florida. The proposed settlement is conditional upon, among other things, the execution of an appropriate stipulation of settlement, consummation of the Merger and final approval of the proposed settlement by the Florida state court. The proposed settlement contemplates that plaintiffs’ counsel will apply to the Florida state court for an award of attorneys’ fees and costs in an aggregate amount of $0.9 million, and that the defendants will not oppose or undermine this application. These attorneys’ fees and costs will not be deducted from the Merger consideration. Both Switch and Data and Equinix will share in the payment of such settlement. As of December 31, 2009, we have accrued $0.6 million, our portion of the settlement, and recorded an insurance receivable of $0.4 million.
In addition to the matters described above, we are presently involved in various legal proceedings arising in the ordinary course of our business operations, including contractual disputes, that we do not believe, based on information currently available to us, will materially adversely affect our financial position or results of operations.
| ITEM 4. | SUBMISSION OF MATTERS TO A VOTE OF SECURITY HOLDERS |
None.
26
| ITEM 5. | MARKET FOR REGISTRANT’S COMMON EQUITY, RELATED STOCKHOLDER MATTERS AND ISSUER PURCHASES OF EQUITY SECURITIES |
Market Information
Our common stock, par value $0.0001, is listed on the Nasdaq Global Market under the stock symbol “SDXC” and has been so listed since February 8, 2007, when it was first listed in connection with our initial public offering. We have no public trading history prior to February 8, 2007. The following table sets forth on a per share basis the low and high sales prices of our common stock as reported by the Nasdaq Global Market for each fiscal quarter during the last two years.
| Fiscal 2008 | Fiscal 2009 | |||||||||||
| Low | High | Low | High | |||||||||
| Fourth Quarter |
$ | 3.92 | $ | 12.44 | $ | 12.99 | $ | 20.66 | ||||
| Third Quarter |
9.79 | 18.17 | 10.01 | 14.84 | ||||||||
| Second Quarter |
9.56 | 18.54 | 8.50 | 14.00 | ||||||||
| First Quarter |
8.43 | 16.06 | 5.15 | 9.28 | ||||||||
Holders
The number of registered stockholders of record of our common stock was 64 as of February 15, 2010. Because many of the shares of our common stock are held by brokers and other institutions on behalf of stockholders, we are unable to estimate the total number of beneficial owners represented by these stockholders of record.
Dividends
We have never paid any dividends on our common stock. We currently intend to retain all of our future earnings, if any, to finance the growth and development of our business. Our existing credit facilities prohibit us from paying cash dividends, and any future financing agreements may prohibit us from paying any type of dividends.
Issuer Purchases of Equity Securities
During the year ended December 31, 2009, we did not purchase any of our equity securities.
Sales of Unregistered Securities
During the year ended December 31, 2009, we did not issue or sell any unregistered securities.
Equity Compensation Plans
In 2007, we filed a registration statement to register for resale 5,132,542 shares of common stock reserved for issuance under our 2007 Stock Incentive Plan. In January 2007, prior to the consummation of our initial public offering and corporate reorganization, the Board of Directors approved the 2007 Stock Incentive Plan (the “Plan”) and authorized the 5,132,542 shares of common stock to be reserved for issuance to employees, consultants or directors pursuant to the terms of the Plan.
On May 20, 2009, our stockholders voted to amend the 2007 Stock Incentive Plan by increasing the authorized shares by 3,181,728 shares.
27
During 2009, we granted 621,859 options to purchase equivalent shares of our common stock at a weighted-average exercise price of $6.42, of which 586,859 were granted to our employees with a 10-year contractual term, vesting 25% each year over the next four years. The remaining 35,000 options were granted to non-employee directors and vest immediately.
During 2009, we granted 204,573 restricted stock awards. The restricted stock awards vest at the end of the three year performance period. Performance targets were set at the high end of the Company’s publicly disclosed revenue and EBITDA guidance for 2009. For 2010 and 2011, performance targets will be established by our Board of Directors.
| Plan category |
Number of securities to be issued upon exercise of outstanding options, warrants and rights (a) |
Weighted- average exercise price of outstanding options, warrants and rights (b) |
Number of securities remaining available for future issuance under equity compensation plans (excluding securities reflected in column (a)) (c) | |||
| Equity compensation plans approved by security holders |
— | — | 3,181,728 | |||
| Equity compensation plans not approved by security holders |
3,085,478 | $10.85 | 2,047,064 |
Stock Performance Graph
The comparisons shown in the graph below are based upon historical data. The Company cautions that the stock performance shown in the graph below is not indicative of, nor intended to forecast the potential future performance of Switch and Data.
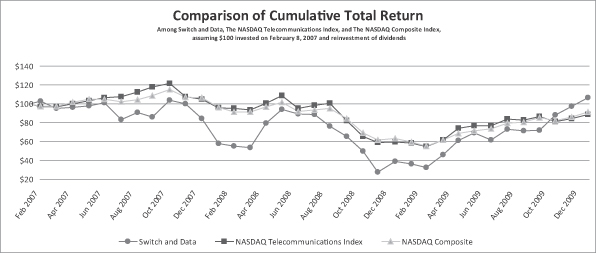
28
Notwithstanding anything to the contrary set forth in any of our previous or future filings under the Securities Act or the Exchange Act that might incorporate this Form 10-K or future filings made by Switch and Data under those statutes, the Stock Performance Graph shall not be deemed filed with the SEC and shall not be deemed incorporated by reference into any of those prior filings or into any future filings made by Switch and Data under those statutes.
| ITEM 6. | SELECTED FINANCIAL DATA |
The following selected data is derived from our consolidated financial statements and is qualified by reference to and should be read in conjunction with the consolidated financial statements and notes thereto and with Item 7. “Management’s Discussion and Analysis of Financial Condition and Results of Operations” included elsewhere in this Form 10-K.
We derived the financial data as of and for the years ended December 31, 2007, 2008 and 2009 from our audited financial statements. We derived the financial data as of December 31, 2005 and 2006 and for the years ended December 31, 2005 and 2006 from the audited financial statements of our predecessor, Switch & Data Facilities Company, Inc.
Consolidated Statement of Operations:
| For the year ended December 31, | ||||||||||||||||||||
| 2005 | 2006 | 2007 | 2008 | 2009 | ||||||||||||||||
| (In thousands, except per share data) | ||||||||||||||||||||
| Revenues: |
$ | 104,483 | $ | 111,028 | $ | 137,530 | $ | 171,525 | $ | 205,438 | ||||||||||
| Costs and operating expenses: |
||||||||||||||||||||
| Cost of revenues, exclusive of depreciation and amortization |
53,896 | 59,537 | 70,986 | 90,122 | 103,133 | |||||||||||||||
| Sales and marketing |
9,846 | 12,324 | 16,313 | 19,670 | 20,733 | |||||||||||||||
| General and administrative |
9,568 | 10,374 | 15,039 | 17,659 | 18,955 | |||||||||||||||
| Depreciation and amortization |
29,869 | 23,459 | 25,584 | 30,716 | 41,473 | |||||||||||||||
| Lease litigation settlements |
— | — | 2,600 | — | 700 | |||||||||||||||
| Asset impairment |
145 | 1,842 | — | — | — | |||||||||||||||
| Total cost and operating expenses |
103,324 | 107,536 | 130,522 | 158,167 | 184,994 | |||||||||||||||
| Operating income |
1,159 | 3,492 | 7,008 | 13,358 | 20,444 | |||||||||||||||
| Interest income |
106 | 77 | 1,808 | 1,587 | 56 | |||||||||||||||
| Interest expense |
(9,356 | ) | (14,812 | ) | (6,622 | ) | (19,193 | ) | (15,775 | ) | ||||||||||
| Loss from debt extinguishment |
(769 | ) | — | (2,809 | ) | (695 | ) | — | ||||||||||||
| Other income (expense) |
183 | (34 | ) | (305 | ) | (768 | ) | (3,063 | ) | |||||||||||
| Income (loss) from continuing operations before income taxes |
(8,677 | ) | (11,277 | ) | (920 | ) | (5,711 | ) | 1,662 | |||||||||||
| Provision for income taxes |
(69 | ) | — | (263 | ) | (1,324 | ) | (1,254 | ) | |||||||||||
| Income (loss) from continuing operations |
(8,746 | ) | (11,277 | ) | (1,183 | ) | (7,035 | ) | 408 | |||||||||||
| Income (loss) from discontinued operations |
(2,528 | ) | (444 | ) | 397 | — | — | |||||||||||||
| Net income (loss) |
(11,274 | ) | (11,721 | ) | (786 | ) | (7,035 | ) | 408 | |||||||||||
| Preferred stock accretions and dividends |
(33,691 | ) | (13,530 | ) | (227,522 | ) | — | — | ||||||||||||
| Net income (loss), attributable to common stockholders |
$ | (44,965 | ) | $ | (25,251 | ) | $ | (228,308 | ) | $ | (7,035 | ) | $ | 408 | ||||||
29
| For the year ended December 31, | ||||||||||||||||||||
| 2005 | 2006 | 2007 | 2008 | 2009 | ||||||||||||||||
| (In thousands, except per share data) | ||||||||||||||||||||
| Income (loss) per common share-basic: |
||||||||||||||||||||
| Continuing operations, attributable to common stockholders |
$ | (0.39 | ) | $ | (0.23 | ) | $ | (5.49 | ) | $ | (0.20 | ) | $ | 0.01 | ||||||
| Discontinued operations |
$ | (0.03 | ) | $ | (0.00 | ) | $ | 0.01 | $ | — | $ | — | ||||||||
| Net income (loss), attributable to common stockholders |
$ | (0.42 | ) | $ | (0.23 | ) | $ | (5.48 | ) | $ | (0.20 | ) | $ | 0.01 | ||||||
| Weighted average common shares outstanding, basic |
107,787 | 107,545 | 41,626 | 34,369 | 34,569 | |||||||||||||||
| Income (loss) per common share-diluted: |
||||||||||||||||||||
| Continuing operations, attributable to common stockholders |
$ | (0.39 | ) | $ | (0.23 | ) | $ | (5.49 | ) | $ | (0.20 | ) | $ | 0.01 | ||||||
| Discontinued operations |
$ | (0.03 | ) | $ | (0.00 | ) | $ | 0.01 | $ | — | $ | — | ||||||||
| Net income (loss), attributable to common stockholders |
$ | (0.42 | ) | $ | (0.23 | ) | $ | (5.48 | ) | $ | (0.20 | ) | $ | 0.01 | ||||||
| Weighted average common shares outstanding, diluted |
107,787 | 107,545 | 41,626 | 34,369 | 35,330 | |||||||||||||||
| Consolidated Balance Sheet Data: | ||||||||||||||||||||
| As of December 31, | ||||||||||||||||||||
| 2005 | 2006 | 2007 | 2008 | 2009 | ||||||||||||||||
| (In thousands) | ||||||||||||||||||||
| Cash and cash equivalents |
$ | 10,417 | $ | 3,671 | $ | 45,595 | $ | 14,706 | $ | 28,528 | ||||||||||
| Total assets |
163,222 | 152,056 | 232,690 | 358,865 | 400,380 | |||||||||||||||
| Long term obligations |
153,602 | 151,816 | 72,160 | 191,748 | 214,726 | |||||||||||||||
| Redeemable Preferred Stock |
180,644 | 194,174 | — | — | — | |||||||||||||||
| Total stockholders’ equity (deficit) |
(189,360 | ) | (214,320 | ) | 125,055 | 120,921 | 132,828 | |||||||||||||
| Consolidated Statement of Cash Flow Data: | ||||||||||||||||||||
| For the year ended December 31, | ||||||||||||||||||||
| 2005 | 2006 | 2007 | 2008 | 2009 | ||||||||||||||||
| (In thousands) | ||||||||||||||||||||
| Cash provided by (used in): |
||||||||||||||||||||
| Operating activities |
$ | 25,333 | $ | 16,991 | $ | 38,641 | $ | 45,614 | $ | 53,588 | ||||||||||
| Investing activities |
(41,516 | ) | (21,073 | ) | (33,933 | ) | (154,710 | ) | (62,514 | ) | ||||||||||
| Financing activities |
12,875 | (2,663 | ) | 36,563 | 78,863 | 22,582 | ||||||||||||||
30
| ITEM 7. | MANAGEMENT’S DISCUSSION AND ANALYSIS OF FINANCIAL CONDITION AND RESULTS OF OPERATIONS |
We believe transparency and clarity are the primary goals of financial reporting. We remain committed to the transparency of our financial reporting, providing our stockholders with informative financial disclosures and presenting an accurate view of our financial position and operating results.
In accordance with Section 404 of the Sarbanes-Oxley Act of 2002, our management, including our Chief Executive Officer and Chief Financial Officer, conducted an evaluation of our disclosure controls and procedures and internal control over financial reporting and concluded that such controls and procedures were effective as of December 31, 2009. Management’s report on the effectiveness of our internal control over financial reporting and the related report of our independent registered certified public accounting firm are included in Item 9A, Controls and Procedures, and Item 15, Exhibits, Financial Statement Schedules, respectively, of this Annual Report on Form 10-K.
Management’s Discussion and Analysis of Financial Condition and Results of Operations (“MD&A”) is intended to provide a reader of our financial statements with a narrative from the perspective of our management on our financial condition, results of operations, liquidity, and certain other factors that may affect our future results. Our MD&A is presented in seven sections:
| • | Overview |
| • | Critical Accounting Estimates |
| • | Key Components of our Results of Operations |
| • | Results of Operations |
| • | Liquidity and Capital Resources |
| • | Recent Accounting Pronouncements |
Our MD&A should be read in conjunction with the Consolidated Financial Statements and related Notes included in Item 15, Exhibits, Financial Statement Schedules, of this Annual Report on Form 10-K.
OVERVIEW
Pending Merger with and into Equinix
Please see “Business—Pending Merger With and Into Equinix” for a discussion of the Merger.
Operations
We are a premier provider of network-neutral data centers that house, power, and interconnect the Internet. Leading content companies, enterprises, and communications service providers rely on Switch and Data to connect to customers and exchange Internet traffic. Our colocation services provide space and power for customers’ networking and computing equipment allowing those customers to avoid the costs of building and maintaining their own data centers. As a network-neutral provider, we do not own or operate our own network, and, as a result, our interconnection services enable our customers to exchange network traffic through direct connections with each other or through peering connections with multiple parties. We provide our services in 34 data centers, which is the broadest network-neutral footprint in North America. Our footprint includes our data center in Palo Alto, one of the first commercial Internet exchanges in the world. Our high network densities, as demonstrated by approximately 22,300 cross connects between our customers, create a network effect, which provides an incentive for our existing customers to remain within our data centers and is a differentiating factor in attracting new customers.
31
We continue to benefit from the strong growth in Internet Protocol (“IP”) traffic. Our strategy has been to expand in key markets where the growth in IP traffic has created the most demand for data center services. Our performance this year was due to the execution of our strategy to meet this market demand.
The highlights of our financial and operational results for the year ended December 31, 2009 were as follows:
| • | Completed a 1,000 cabinet equivalent expansion in one of our New York Metro area data centers. |
| • | Secured $100.0 million in financing for data center expansion. |
| • | Increased revenues $33.9 million or 19.8% in 2009 over 2008. |
| • | Increased net income to $0.4 million in 2009, from a loss of $7.0 million in 2008. |
| • | Increased cabinet equivalents billed 13.1%, number of customers by 4.2%, and cross connects by 5.3% over 2008. |
| • | Generated over 50% of new sales in 2009 were in our new or expanded data centers. |
Demand for our colocation and interconnection services continues to be driven by the increase in network traffic associated with bandwidth-intensive content and web-enabled applications. Our customers continue to offer new services and applications in our data centers to serve their customers, which creates revenue drivers for us. Our broad footprint of data centers located across key markets, our Internet exchanges, and our network-neutral service offering are attractive to network centric businesses as they expand their operations.
As a result of this growth in customer demand and our reputation for service quality, sales to both new and existing customers have continued to grow in our data centers. Our year-over-year revenue growth primarily results from new sales to existing customers, which reflects both a high level of customer satisfaction and demand for our service offerings.
CRITICAL ACCOUNTING POLICIES AND ESTIMATES
The discussion of our financial condition and results of operations are derived from our consolidated financial statements, which have been prepared in accordance with generally accepted accounting principles in the U.S. In preparing our consolidated financial statements, we make estimates and assumptions that can have a significant impact on our financial position and results of operations. The application of our critical accounting policies requires an evaluation of a number of complex criteria and significant accounting judgments by us. In applying those policies, our management uses its judgment to determine the appropriate assumptions to be used in the determination of certain estimates. Actual results may differ significantly from these estimates under different assumptions, judgments or conditions, and these differences could be material.
Fair Value. The Company adopted the guidance associated with fair value accounting as of January 1, 2008. The guidance clarifies the definition of fair value, prescribes methods for measuring fair value, establishes a fair value hierarchy based on the inputs used to measure fair value, and expands disclosures about the use of fair value measurements. The adoption of fair value accounting resulted in a cumulative transition adjustment of $0.1 million that decreased the Company’s derivative liability and increased retained earnings.
The fair value hierarchy has three levels based on the reliability of the inputs used to determine fair value. Level 1 inputs are quoted prices (unadjusted) in active markets for identical assets or liabilities. Level 2 inputs are quoted prices for similar assets and liabilities in active markets or inputs that are observable for the asset or liability, either directly or indirectly through market corroboration, for substantially the full term of the financial instrument. Level 3 inputs are unobservable inputs based on assumptions used to measure assets and liabilities at fair value. A financial asset or liability’s classification within the hierarchy is determined based on the lowest level input that is significant to the fair value measurement.
32
The following table provides our assets and liabilities carried at fair value.
| Fair Value of Measurement at December 31, 2008 Using: |
Fair Value of Measurement at December 31, 2009 Using: | |||||||||||||||||
| (in thousands) | Quoted prices in active markets (Level 1) |
Significant other observable inputs (Level 2) |
Significant unobservable inputs (Level 3) |
Quoted prices in active markets (Level 1) |
Significant other observable inputs (Level 2) |
Significant unobservable inputs (Level 3) | ||||||||||||
| Cash and Cash Equivalents |
$ | 14,706 | $ | — | $ | — | $ | 28,528 | $ | — | $ | — | ||||||
| Derivative liability |
$ | — | $ | 7,434 | $ | — | $ | — | $ | 8,713 | $ | — | ||||||
The following is a description of our valuation methodology for assets and liabilities measured at fair value:
Cash and cash equivalents, accounts receivable net of the allowance for doubtful accounts, other current assets, accounts payable, accrued expenses, and other current liabilities. Cash equivalents are carried at fair value based on quoted market prices in active markets. All other financial instruments are not carried at fair value, but are carried at amounts that approximate fair value due to their short-term nature and generally negligible credit risk.
Interest rate swaps. These financial instruments are carried at fair value, calculated as the present value of amounts estimated to be received or paid to a marketplace participant in a selling transaction. These derivatives are valued using a model based on significant other observable inputs (Level 2 inputs). The model utilizes Eurodollar Futures settlement pricing from the Chicago Mercantile Exchange to estimate future LIBOR rates and in turn estimate amounts to be received or paid under the terms of the interest rate swap agreements.
In accordance with generally accepted accounting principles, we consider nonperformance risk in calculating fair value adjustments. This includes a credit risk adjustment based on the credit worthiness of the counterparty when we are in a gain position, or our own credit worthiness when we are in an unrealized loss position. This assessment of nonperformance risk is generally derived from credit ratings, credit spreads, and other financial analysis. The impact of the nonperformance risk adjustments for our assets and liabilities carried at fair value was not material at December 31, 2008 and 2009.
The methods described above may produce a fair value that may not be indicative of future fair values. Furthermore, while we believe our valuation methods are appropriate and consistent with other market participants, the use of different methodologies, or assumptions, to determine the fair value of certain financial instruments could result in a different estimate of fair value at the reporting date.
Revenue Recognition and Allowance for Doubtful Accounts. We generate recurring revenue from providing colocation and interconnection services. More than 90% of our revenues are generated from these recurring revenues. Our remaining revenues are non-recurring and consist primarily of technical support and installation services.
Colocation services are governed by the terms and conditions of a master service agreement. Customers typically execute agreements for one to three year terms. We bill customers on a monthly or quarterly basis and recognize the revenue on a straight-line basis over the life of the agreement. Installation services for such long-term agreements, defined as greater than one month, are recognized on a straight-line basis over the term of the agreement, which we believe approximates the life of the customer relationship.
Interconnection services are generally provided on either a month-to-month or one year term under an arrangement separate from those services provided under colocation services. Interconnection services include port and cross connect services. Port services are typically sold on a one year term and revenue is recognized in a manner similar to colocation services. Cross connect services are typically sold on a month-to-month basis.
33
These interconnection services are considered as a separate earnings process that is provided and completed on a month-to-month basis. We bill customers on a monthly and quarterly basis and recognize the revenue in the period the service is provided. Installation service revenue for these cross connect services is recognized in the period when the installation is complete. The earning process from cross connect installation is culminated in the month the installation is complete.
Technical support services are provided primarily on a time and materials basis and are billed and recognized in the period services are provided.
We guarantee certain service levels, such as uptime, as outlined in customer contracts. To the extent these service levels are not achieved, we reduce revenue for any credits given to the customer. Any service level credits recorded in the periods presented are immaterial.
Revenue is recognized only when the service has been provided and when there is persuasive evidence of an arrangement, the fee is fixed or determinable and collection of the receivable is reasonably assured. We regularly assess collectibility of accounts receivable from customers based on a number of factors, including prior history with the customer and the credit status of the customer. If we determine that collection of revenue from a customer is not reasonably assured, we do not recognize revenue until collection becomes reasonably assured, which is generally upon receipt of cash. We also maintain an allowance for doubtful accounts for accounts receivable for which management believes such receivables are uncollectible. We analyze accounts receivable, bankruptcy filings, historical bad debts, customer credit-worthiness and changes in customer payment patterns when evaluating revenue recognition and the adequacy of our reserves. A specific bad debt reserve is accrued for specifically identifiable receivables that become uncollectible. Another reserve is established for all other accounts receivable based on the age of the invoices. Delinquent account balances are written-off after a determination that the likelihood of collection is not probable.
Impairment of Long-Lived Assets. We review all long-lived assets, which consist primarily of property and equipment and intangible assets, for impairment whenever events or changes in circumstances indicate that the carrying amount of an asset or asset group may not be recoverable. Recoverability of assets to be held and used is measured by a comparison of the carrying amount of an asset to the future net undiscounted cash flows to be generated by the asset. Impairment is measured by the amount by which the carrying amount of the assets exceeds their fair value.
Goodwill and Other Intangible Assets. Goodwill represents the purchase price, including acquisition related costs, in excess of the fair values of identifiable tangible and intangible acquired assets and liabilities in business combinations accounted for as purchases. Goodwill is not amortized, but is tested for impairment at least annually. Each year, during the third quarter, we test for impairment of goodwill according to a two-step approach. In the first step, we test for impairment of goodwill by estimating the fair values of each data center using the present value of future cash flows approach. If the carrying amount exceeds the fair value, the second step of the goodwill impairment test is performed to measure the amount of the impairment loss, if any. In the second step, the implied fair value of the goodwill is estimated as the fair value of the data center in the first step less the fair values of all other net tangible and intangible assets of the data center. If the carrying amount of the goodwill exceeds the implied fair market value, an impairment loss is recognized in an amount equal to that excess, not to exceed the carrying amount of goodwill. Goodwill of a data center is also tested for impairment, between annual tests, if an event occurs or circumstances change that would more likely than not reduce the fair value of a data center below its carrying value. We completed our review of goodwill reported for each data center during each of 2007, 2008, and 2009, and no impairment was recorded. We can provide no assurance that a material impairment charge will not occur in future periods as a result of these analyses.
Other intangible assets consist of customer-based assets recorded through acquisitions or other purchases and are unique to the acquired data center. These assets are amortized using the straight-line method over the shorter of their estimated periods of benefit or the lease term of the acquired data center, ranging from two to
34
twelve years. No residual value is estimated for these assets. Assets are re-evaluated whenever circumstances indicate that revised estimates of useful lives or impairment may be warranted.
Other long-term assets consist of security deposits, costs related to the issuance of debt, and public offering costs. Costs related to the issuance of debt are capitalized and amortized to interest expense using the effective interest method over the life of the related debt. Public offering costs were offset against the gross proceeds of the offering in 2007.
Contingent Liabilities. We estimate the amount of contingent liabilities based on the best information available at the time of determination. For litigation claims, when we, with consultation from legal counsel, can reasonably estimate the range of loss and an unfavorable outcome is probable, a contingent liability is recorded. As additional information becomes available, we assess the potential liability related to pending litigation and revise our estimates. Revisions in our estimates of the potential liabilities could materially impact our results of operation and financial position.
Accounting for Income Taxes. Generally accepted accounting principles require an asset and liability approach to financial accounting and reporting for income taxes. Deferred tax assets and liabilities are recognized for the future tax consequences attributable to differences between financial statement carrying amounts of existing assets and liabilities and their respective tax bases. Deferred tax assets and liabilities are measured using enacted tax rates expected to apply to taxable income in the years in which those temporary differences are expected to be recovered or settled. The effect on deferred tax assets and liabilities of a change in tax rates is recognized in income in the period that includes the enactment date. Valuation allowances are established to reduce tax assets to the amounts more likely than not to be realized.
We currently have provided for a full valuation allowance against our net current and long-term deferred tax assets. We have considered future taxable income in assessing the need for the valuation allowance. Based on the available evidence, management does not believe that the net deferred tax assets will be realizable in the foreseeable future. Should we determine that we would be able to realize our deferred tax assets in the foreseeable future, an adjustment to the deferred tax assets would increase income in the period such determination was made.
In preparing our consolidated financial statements, we are required to estimate our income taxes in each of the jurisdictions in which we operate. The determination of income taxes also involves estimating the impact of additional taxes resulting from tax examinations and uncertainties in the application of tax laws and regulations. Accruals for tax contingencies require management to estimate the actual outcome of any such audits and the impact of uncertainties. Actual results could vary from these estimates.
Stock-Based Compensation. Stock-based compensation expense is measured at the grant date for all stock-based awards made to employees and directors, based on the fair value of the award using an option-pricing model and is recognized as an expense over the requisite service period, which is generally the vesting period. As of December 31, 2009, there was $10,549 of unrecognized compensation cost related to non-vested stock-based compensation arrangements granted under our stock-based compensation plans. These costs are recognized ratably over the vesting period. We recorded $6,292 of compensation expense for the year ended December 31, 2009.
We use the Black-Scholes option-pricing model to determine the fair value of stock options. The determination of the fair value of stock-based payment awards is based on a number of complex and subjective assumptions. These assumptions include the expected term of the options, a risk-free interest rate, expected dividend yields, and stock price volatility. If factors change and we employ different assumptions for estimating stock-based compensation expense in future periods or if we decide to use a different valuation model, the expense in future periods may differ significantly from what we have recorded in the current period, which could have a material impact on our consolidated financial statements.
35
For options granted during the years ended December 31, 2007, 2008, and 2009, the fair value of each option grant was based on the Black-Scholes option-pricing model with the following assumptions:
| For the year ended December 31, | ||||||
| 2007 | 2008 | 2009 | ||||
| Options to non-employees vesting immediately |
||||||
| Expected term of the options |
5.00 years | 5.00 years | 5.00 years | |||
| Risk-free interest rate |
4.70% | 2.88% | 1.89% | |||
| Expected stock price volatility |
81.17% | 61.08% | 61.47% | |||
| Expected dividend yield |
None | None | None | |||
| Options vesting 25% annually over four years |
||||||
| Expected term of the options |
6.25 years | 6.25 years | 6.25 years | |||
| Risk-free interest rate |
3.60% to 4.67% | 2.83% to 3.42% | 2.10% to 3.03% | |||
| Expected stock price volatility |
85.50% to 99.55% | 76.27% to 82.81% | 66.83% to 72.97% | |||
| Expected dividend yield |
None | None | None | |||
As a public company without sufficient option exercise history, we estimate the expected term of options granted by taking the weighted average of the vesting period and the contractual term of the option. We use the risk-free interest rate on U.S. Treasury zero-coupon issues with remaining terms similar to the expected term on our equity awards. As a public company without a sufficient history of common stock prices for a period equal to the expected option term, we estimate the future stock price volatility of our common stock by using our historical volatility since we became public and supplementing the volatility prior to our becoming public with the historical volatility of a similar company. We believe such an approach best represents our future volatility. We do not anticipate paying any cash dividends in the foreseeable future, and therefore, assumed an expected dividend yield of zero in our option-pricing model.
KEY COMPONENTS OF OUR RESULTS OF OPERATIONS
Metrics
We use several primary metrics to analyze our revenues and measure our performance. These metrics include:
Number of cross connects. Cross connects enable one-to-one interconnections between customers within a data center, reduce network costs, and lower network latency. The number of cross connects is a measure of our network density. By increasing network densities within our data centers, we are able to further enhance our value proposition to our customers. We target customers with bandwidth intensive and network centric requirements. These customers require data centers with high network densities to optimize their services and enhance the experiences of their customers. We expect the number of cross connects to increase as new and existing customers grow in our data centers.
Cabinet equivalents billed. Our data centers have a finite amount of space and power that can be utilized to provide colocation services. This space is measured in cabinet equivalents, which includes an assessment of available power and cooling. Cabinet equivalents billed is a measure of how much space in our data centers is used by customers. Cabinet equivalents billed is the sum of the total cage square feet billed divided by 20 (“20” is the estimated square feet required to support a single customer cabinet), plus the actual cabinets billed in each data center. We expect the number of cabinet equivalents billed to increase as new and existing customers grow in our data centers.
Utilization rate. The utilization rate represents the percentage of our data center space that has been sold to customers. The utilization rate increases with sales to customers and decreases when new data center capacity is
36
added or with the loss of existing customers. The utilization rate is calculated as a percentage, the numerator of which is equal to the total space licensed to our customers and the denominator of which is equal to the total licensable space taking into account existing power and cooling. Our utilization rate has decreased as a result of our investments in capacity in 2008 and 2009. We expect our utilization rate to increase as new and existing customers grow in our data centers.
Percentage of incremental sales to existing customers. This percentage is a measure of sales to existing customers. Over the past few years, approximately 80% of all new sales have been to existing customers. We believe this percentage is a testament to our customers’ satisfaction with our quality of service and product offerings.
Churn as a percentage of recurring revenues. Churn represents lost revenues during a given period. Our business is based on a recurring revenue model, so lost revenues in a period affect future periods. From December 31, 2008 to December 31, 2009, churn has fluctuated in a range between 1.1% to 1.5%.
New sales. New sales represent the recurring and non-recurring revenues from orders initiated during the given quarter. Recurring revenue from new sales represents new service agreements entered into by new and existing customers during the given quarter. Revenue from these agreements will recur monthly over the life of the agreement. Non-recurring revenue represents the one-time installation fees associated with new service agreements. These one-time fees are billed to customers upon completion of the installation service and such revenue is typically recognized on a straight-line basis over the life of the agreement.
The following tables present a summary of these metrics for the periods indicated:
| December 31, 2008 |
March 31, 2009 |
June 30, 2009 |
September 30, 2009 |
December 31, 2009 |
||||||||||||||||
| Number of cross connects |
21,149 | 21,504 | 21,705 | 22,085 | 22,277 | |||||||||||||||
| Cabinet equivalents billed |
7,596 | 7,864 | 7,982 | 8,110 | 8,588 | |||||||||||||||
| Utilization rate |
58.4 | % | 60.4 | % | 61.2 | % | 57.7 | % | 61.3 | % | ||||||||||
| For the three months ended | ||||||||||||||||||||
| December 31, 2008 |
March 31, 2009 |
June 30, 2009 |
September 30, 2009 |
December 31, 2009 |
||||||||||||||||
| Percentage of sales to existing customers |
84 | % | 78 | % | 84 | % | 73 | % | 92 | % | ||||||||||
| Churn as a percentage of recurring revenues |
1.5 | % | 1.3 | % | 1.3 | % | 1.1 | % | 1.4 | % | ||||||||||
| New Sales (In thousands): |
||||||||||||||||||||
| Recurring revenue |
$ | 1,305 | $ | 1,297 | $ | 1,382 | $ | 1,269 | $ | 1,640 | ||||||||||
| Non-recurring revenue |
1,717 | 1,825 | 3,321 | 4,165 | 2,339 | |||||||||||||||
| New Sales |
$ | 3,022 | $ | 3,122 | $ | 4,703 | $ | 5,434 | $ | 3,979 | ||||||||||
Revenues
Our revenues consist of recurring and non-recurring revenues. We generate recurring revenue from our network-neutral interconnection and colocation services. Our ability to sell our colocation space within each data center is limited by the space required by our existing power and cooling infrastructure, as well as the customer requirements for power and cooling. Power and cooling requirements continue to grow on a per cabinet or square foot basis. We carefully monitor the power and cooling usage in each of our data centers and plan to invest in our power and cooling infrastructure to maximize the amount of utilizable space in our data centers. We generate non-recurring revenue from our TechSmart technical support services and installation services. To review our revenue recognition policies for our recurring and non-recurring revenues, refer to “Critical Accounting Policies and Estimates” above.
37
Colocation.
Space. We provide colocation space for a recurring monthly fee for a cabinet or rack, or on a per square foot basis for cage space. Our customers that license cage space typically use between 50 and 500 square feet in a data center, and often license such space in multiple data centers. Customers sign a service order, governed by the terms and conditions of a master services agreement, typically for one to three years.
Power. We provide conditioned power either on a term basis for one to three years or on a month-to-month basis, for a recurring monthly fee under both arrangements. We provide both alternating current and direct current power circuits. Our customers pay for power on a per circuit basis, typically in 20 to 30 amp increments.
Interconnection Services.
Our interconnection services include our cross connect and Internet exchange services. Our cross connect services enable our customers to connect directly to a telecommunications carrier, Internet service provider, or other customers in our data centers. These services are typically provided for a recurring monthly fee per connection. Our Internet exchange services enable our customers to connect directly to our Internet exchange, which provides for public or private peering with other customers. Our customers license ports to connect to our Internet exchange for a recurring monthly fee per port, based on port capacity. Customers typically sign one year agreements for our Internet exchange services and month-to-month agreements for our cross connect services. We also generate recurring revenues from reselling Internet access, which we do to accommodate certain customers. We contract with certain Internet service providers and then resell their Internet access service to customers typically in one megabit per second to one hundred megabits per second increments. Customers typically sign a one-year contract for this service and pay us a recurring monthly fee per megabits per second.
Non-recurring Revenue.
We generate non-recurring revenue from the following services:
Installation Services. We receive one-time installation fees related to our interconnection and colocation services. The complexity of the installation determines the amount of fees charged to the customer. We typically receive a one-time fee per circuit or port for the installation of our interconnection services. We receive a one-time fee per cabinet or rack or per linear foot of cage space for the installation of our colocation services. We receive a one-time fee per circuit for the installation of power, depending on the size of circuit and amount of voltage provided.
TechSmart Technical Support Services. We provide technical support services to assist customers with installation, circuit testing, equipment rebooting, and other related services. Customers pay for these services on an hourly basis or under contractual arrangements for a certain number of hours of technical support per month. We recognize revenue once the services have been provided.
The following table presents our revenues and percentage of revenues for the periods presented:
| For the year ended December 31, | ||||||||||||||||||
| ($ in Thousands) | 2007 | 2008 | 2009 | |||||||||||||||
| Revenues |
||||||||||||||||||
| Colocation |
$ | 84,617 | 62 | % | $ | 108,504 | 63 | % | $ | 129,815 | 63 | % | ||||||
| Interconnection |
45,408 | 33 | % | 53,192 | 31 | % | 61,445 | 30 | % | |||||||||
| Recurring Total |
$ | 130,025 | 95 | % | $ | 161,696 | 94 | % | $ | 191,260 | 93 | % | ||||||
| Non-recurring |
7,505 | 5 | % | 9,829 | 6 | % | 14,178 | 7 | % | |||||||||
| Total |
$ | 137,530 | 100 | % | $ | 171,525 | 100 | % | $ | 205,438 | 100 | % | ||||||
38
Cost of Revenues, Exclusive of Depreciation and Amortization
Cost of Revenues. Cost of revenues is comprised primarily of lease, utilities, personnel related expenses, maintenance and repair, telecommunications services, security, and property taxes. The components of our cost of revenues are mostly fixed in nature and do not vary significantly from period to period. However, certain components of our cost of revenues are variable in nature and are directly related to the growth of our revenues. We expect our utilities expenses to increase in the future due to an increase in power usage by our customers. Further, we experience seasonality in our utilities expenses based on temperatures and seasonal rate adjustments, which causes the amount of these expenses to fluctuate during the year. As a result of our expansions, we typically incur lease, utilities, and personnel related expenses prior to being able to accept customers for, and generate revenue from, new data centers. As we expand our data centers primarily in our top 10 markets, we expect cost of revenues to increase.
Operating Expenses
Sales and Marketing. Sales and marketing expenses consist primarily of personnel related expenses for our sales and marketing employees, including wages, benefits, bonuses, commissions, travel, and the cost of marketing programs such as sales support, trade shows, corporate communications, promotional events, and advertising. We expect our sales and marketing expenses to increase in absolute dollars as we increase the headcount of our sales staff and increase our marketing and promotional efforts.
General and Administrative. General and administrative expenses include personnel related costs as well as travel, rent, insurance, legal, accounting, and consulting expenses. Personnel related expenses include wages, benefits and bonuses for our executive management as well as for our accounting, legal, data center design and construction, information technology, and human resources employees. We expect our general and administrative expenses to increase in absolute dollars as we incur additional costs to support the growth of the Company, including higher personnel, legal, insurance, and financial reporting expenses, but we expect general and administrative expenses to decrease as a percentage of revenues.
Depreciation and Amortization. Depreciation expense includes depreciation of our leasehold improvements, generators, uninterruptible power systems, direct current power plants, heating, ventilation and air-conditioning equipment, furniture and fixtures. Amortization expense is composed of the amortization of our customer based intangible assets and debt issuance costs related to our acquisitions.
Asset Impairment. Asset impairment expenses represent the write-off of capitalized data center related assets which we have determined to be impaired.
Other Expense, Net
Other Expense, Net. Other expenses primarily include non-income based taxes and related interest and penalties. Expenses associated with our acquisition by Equinix are included in this line item.
RESULTS OF OPERATIONS
The following is a more detailed discussion of our financial condition and results of operations for the periods presented. The year-to-year comparison of financial results is not necessarily indicative of future results.
39
Year Ended December 31, 2008 Compared to the Year Ended December 31, 2009
Revenues
| For the year ended December 31, | $ Change | % Change | ||||||||||
| ($ in Thousands) | 2008 | 2009 | ||||||||||
| Revenues |
$ | 171,525 | $ | 205,438 | $ | 33,913 | 20 | % | ||||
Revenues increased 20% for the year ended December 31, 2009 over the same period in 2008. Approximately 53% of new sales for the year ended December 31, 2009 were in our new or expanded data centers. Recurring revenue increased by $29.6 million to $191.3 million. Recurring revenue consisted of colocation and interconnection revenue of $129.8 million and $61.4 million, respectively. Cabinet equivalents billed were 8,588 at December 31, 2009, which is a 12% increase over the December 31, 2008 cabinet equivalents billed of 7,596. The number of cross connects was 22,277 at December 31, 2009, which is a 5% increase over December 31, 2008 cross connects of 21,149. Sales to existing customers were 92% of sales during the three months ended December 31, 2009. Non-recurring revenue was $14.2 million for the year ended December 31, 2009 as compared to $9.8 million for the year ended December 31, 2008. The increase in non-recurring revenue was primarily related to two customer contracts with a total of $3.9 million in one-time charges.
Cost of Revenues, Exclusive of Depreciation and Amortization
| For the year ended December 31, | $ Change | % Change | ||||||||||||
| ($ in Thousands) | 2008 | 2009 | ||||||||||||
| Cost of revenues, exclusive of depreciation and amortization |
$ | 90,122 | $ | 103,133 | $ | 13,011 | 14 | % | ||||||
| As a percent of revenue |
53 | % | 50 | % | ||||||||||
The increase in cost of revenues was primarily from increased rent, utilities, and property tax expenses. Rent expense increased $6.6 million, primarily from lease renewals or expansions in Northern Virginia, Los Angeles, Atlanta, Toronto, and Seattle. Utilities increased $2.0 million due to additional usage by our customers, largely in our New York Metro area data centers. Property and other taxes increased by $1.4 million, primarily due to recent expansions in our Northern Virginia and New York Metro area data centers. Cost of revenues also included non-cash stock compensation expense of $1.3 million and $1.9 million for the years ended December 31, 2009 and 2008, respectively. We expect our cost of revenues will increase in absolute dollars as we continue our growth and expansion plan.
Sales and Marketing
| For the year ended December 31, | $ Change | % Change | ||||||||||||
| ($ in Thousands) | 2008 | 2009 | ||||||||||||
| Sales and marketing |
$ | 19,670 | $ | 20,733 | $ | 1,063 | 5 | % | ||||||
| As a percent of revenue |
11 | % | 10 | % | ||||||||||
The increase in sales and marketing expense is primarily related to general marketing and personnel related expenses. Marketing expenses increased $0.5 million primarily related to branding efforts and new and expanded data center openings. Personnel related expenses increased by $0.5 million, primarily for wages associated with additional headcount. Sales and marketing expense also included non-cash stock compensation expense of $2.3 million and $2.1 million for the years ended December 31, 2009 and 2008, respectively. We expect sales and marketing expenses will continue to decrease as a percentage of revenues as we expect revenues to increase at a higher rate than our sales and marketing expenses.
40
General and Administrative
| For the year ended December 31, | $ Change | % Change | ||||||||||||
| ($ in Thousands) | 2008 | 2009 | ||||||||||||
| General and administrative |
$ | 17,659 | $ | 18,955 | $ | 1,296 | 7 | % | ||||||
| As a percent of revenue |
10 | % | 9 | % | ||||||||||
The increase in general and administrative expenses was primarily due to personnel related expenses, which increased by $1.6 million. This increase was partially offset by a decrease in professional fees of $0.5 million. General and administrative expenses included non-cash stock compensation of $2.7 million and $2.3 million for the years ended December 31, 2009 and 2008, respectively. We expect general and administrative expenses to continue to decrease as a percentage of revenues because we expect revenues to increase at a higher rate than our general and administrative expenses.
Depreciation and Amortization
| For the year ended December 31, | $ Change | % Change | ||||||||||||
| ($ in Thousands) | 2008 | 2009 | ||||||||||||
| Depreciation and amortization |
$ | 30,716 | $ | 41,473 | $ | 10,757 | 35 | % | ||||||
| As a percent of revenue |
18 | % | 20 | % | ||||||||||
Depreciation and amortization expenses increased by $10.8 million. The increase was primarily related to the expansion of our data centers in Seattle, Northern Virginia, and the New York Metro area, which resulted in an increase in depreciable assets. We expect depreciation and amortization to continue to increase as we make capital investments in new and existing data centers.
Lease Litigation Settlement
| For the year ended December 31, | $ Change | % Change | |||||||||||
| ($ in Thousands) | 2008 | 2009 | |||||||||||
| Lease litigation settlement |
$ | — | $ | 700 | $ | 700 | N/A | ||||||
| As a percent of revenue |
0 | % | 0 | % | |||||||||
Lease litigation settlement for the year ended December 31, 2009 includes $0.7 million related to a lease settlement in Milwaukee. We were previously served with a lawsuit alleging a failure to execute a lease in October 2000 for a building in Milwaukee, Wisconsin. On May 21, 2009, the Company agreed to pay $0.9 million to the plaintiffs, in exchange for a full settlement agreement and the execution of a mutual full and complete release of all claims which were raised or could have been raised in the referenced matter. Amounts previously accrued in prior years for the settlement were $0.2 million. The settlement amount was paid in May 2009 and the case was dismissed with prejudice. There were no lease litigation settlement expenses in 2008.
Operating Income
| For the year ended December 31, | $ Change | % Change | ||||||||||||
| ($ in Thousands) | 2008 | 2009 | ||||||||||||
| Operating income |
$ | 13,358 | $ | 20,444 | $ | 7,086 | 53 | % | ||||||
| As a percent of revenue |
8 | % | 10 | % | ||||||||||
41
The increase in operating income is primarily related to the increase in revenue of $33.9 million from sales to new and existing customers. The increase in revenue was partially offset by increased expenses, including $13.0 million, $10.8 million, $1.3 million, $1.1 million, and $0.7 million for cost of revenues, depreciation and amortization, general and administrative, sales and marketing, and lease litigation settlements.
Interest Expense, Interest Income, and Loss from Debt Extinguishment
| For the year ended December 31, | $ Change | % Change | |||||||||||||
| ($ in Thousands) | 2008 | 2009 | |||||||||||||
| Interest expense |
$ | (19,193 | ) | $ | (15,775 | ) | $ | 3,418 | (18 | )% | |||||
| Interest income |
$ | 1,587 | $ | 56 | $ | (1,531 | ) | (96 | )% | ||||||
| Loss from debt extinguishment |
$ | (695 | ) | $ | 0 | $ | 695 | (100 | )% | ||||||
The decrease in interest expense is primarily due to the decreased change in the fair value of our interest rate swaps. We convert a portion of the variable rate interest of our outstanding debt to fixed interest rates through the use of interest rate swap instruments. These instruments are marked to market value at the end of each quarter, with gains and losses treated as decreases or increases to interest expense. The change in market value of the derivative, directly related to the decreases in current and future LIBOR rates, resulted in an increase in interest expense of $6.9 million for the year ended December 31, 2008, and an increase of $1.3 million for the year ended December 31, 2009. The decreased change of the fair value of our interest rate swaps was partially offset by an increase in the interest expense associated with the increase in our outstanding debt balance of $22.5 million during 2009.
Interest income decreased by $1.5 million for the year ended December 31, 2009 compared to the year ended December 31, 2008. The decrease is attributable to a lower average cash balance and lower interest rates during 2009.
Loss from debt extinguishment was $0.7 million for the year ended December 31, 2008 due to the write-off of certain debt issuance costs related to our debt refinancing that occurred in March 2008.
Other Expense, net
| For the year ended December 31, | $ Change | % Change | |||||||||||||
| ($ in Thousands) | 2008 | 2009 | |||||||||||||
| Other expense, net |
$ | (768 | ) | $ | (3,063 | ) | $ | (2,295 | ) | 299 | % | ||||
Other income (expense), net increased to $3.1 million. The increase is primarily related to $2.7 million in costs associated with the Merger, including but not limited to accounting, advisory, legal, and travel costs.
Net Income (Loss)
| For the year ended December 31, | $ Change | % Change | ||||||||||
| ($ in Thousands) | 2008 | 2009 | ||||||||||
| Net income (loss) |
$ | (7,035 | ) | $ | 408 | $ | 7,443 | N/A | ||||
Net income for the year ended December 31, 2009 was $0.4 million. This $7.4 million improvement over the prior year loss is primarily attributable to the impact of the 2008 decrease in the fair value of our interest rate swaps of $6.9 million, as well as the previously described attributes above.
42
Year Ended December 31, 2007 Compared to the Year Ended December 31, 2008
Revenues
| For the year ended December 31, | $ Change | % Change | ||||||||||
| ($ in Thousands) | 2007 | 2008 | ||||||||||
| Revenues |
$ | 137,530 | $ | 171,525 | $ | 33,995 | 25 | % | ||||
Revenues increased primarily from the sale of our services to new and existing customers. Expansion projects during 2007 and 2008 created additional product capacities in our top ten markets. This expansion, coupled with the demand of increasing IP traffic growth, allowed for an increased number of sales, as well as larger average sales, to new and existing customers. We experienced a 25% increase in revenues in 2008 over 2007. Also, over 30% of new sales for 2008 were in our new or expanded data centers. Recurring revenue increased by $31.7 million. The recurring revenue increase consisted of colocation and interconnection revenue of $23.9 million and $7.8 million, respectively. Cabinet equivalents billed were 7,596 at December 31, 2008, which is a 10.4% increase over the December 31, 2007 cabinet equivalents billed of 6,883. The number of cross connects was 21,149 at December 31, 2008, which is an 8.0% increase over December 31, 2007 cross connects of 19,577. Existing customers comprised 80% of new sales during the year ended December 31, 2008. Churn as measured by monthly recurring revenue increased to 1.3% for the year ended December 31, 2008, from 1.0% for the year ended December 31, 2007. Non-recurring revenue increased by $2.3 million primarily from increased installation revenue.
Cost of Revenues, Exclusive of Depreciation and Amortization
| For the year ended December 31, | $ Change | % Change | ||||||||||||
| ($ in Thousands) | 2007 | 2008 | ||||||||||||
| Cost of revenues, exclusive of depreciation and amortization |
$ | 70,986 | $ | 90,122 | $ | 19,136 | 27 | % | ||||||
| As a percent of revenue |
52 | % | 53 | % | ||||||||||
The increase in cost of revenues was primarily from increased rent, utilities, and personnel expenses. Rent expense increased $5.3 million, primarily from expansion in the Northern Virginia area, Toronto, and Seattle. The increase in rent included $3.6 million of deferred rent for recently executed long-term leases. Utilities increased $5.3 million due to rate increases and additional usage by our customers, largely in our New York Metro area data centers. Personnel expenses increased $3.0 million from additional headcount to support customer growth. Personnel expenses also included non-cash stock compensation expense of $1.9 million and $1.3 million for the years ended December 31, 2008 and 2007, respectively. Carrier services, repairs and maintenance, and bad debt expense increased by $1.8 million, $1.4 million, and $0.9 million, respectively.
Sales and Marketing
| For the year ended December 31, | $ Change | % Change | ||||||||||||
| ($ in Thousands) | 2007 | 2008 | ||||||||||||
| Sales and marketing |
$ | 16,313 | $ | 19,670 | $ | 3,357 | 21 | % | ||||||
| As a percent of revenue |
12 | % | 11 | % | ||||||||||
The increase in sales and marketing expense is primarily related to personnel related expenses. Personnel related expenses increased by $3.0 million, primarily for sales commissions and wages due to additional headcount. Such expense also included non-cash stock compensation expense of $2.1 million and $1.1 million for the years ended December 31, 2008 and 2007, respectively.
43
General and Administrative
| For the year ended December 31, | ||||||||||||||
| ($ in Thousands) | 2007 | 2008 | $ Change | % Change | ||||||||||
| General and administrative |
$ | 15,039 | $ | 17,659 | $ | 2,620 | 17 | % | ||||||
| As a percent of revenue |
11 | % | 10 | % | ||||||||||
The increase in general and administrative expenses was primarily due to increased personnel related expenses, professional fees, and back office equipment and system maintenance. Personnel related expenses increased by $1.6 million. Such expense also included non-cash stock compensation of $2.3 million and $1.8 million for the years ended December 31, 2008 and 2007, respectively. Professional fees and back-office expenses increased by $0.4 million.
Depreciation and Amortization
| For the year ended December 31, | $ Change | % Change | ||||||||||||
| ($ in Thousands) | 2007 | 2008 | ||||||||||||
| Depreciation and amortization |
$ | 25,584 | $ | 30,716 | $ | 5,132 | 20 | % | ||||||
| As a percent of revenue |
19 | % | 18 | % | ||||||||||
Depreciation and amortization expenses increased by $5.1 million, or 20%, to $30.7 million for the year ended December 31, 2008 compared to $25.6 million for the year ended December 31, 2007. The increase was primarily related to the expansion of our data centers in the New York Metro and San Francisco Bay areas.
Lease Litigation Settlement
| For the year ended December 31, | $ Change | % Change | |||||||||||||
| ($ in Thousands) | 2007 | 2008 | |||||||||||||
| Lease litigation settlement |
$ | 2,600 | $ | — | $ | (2,600 | ) | (100 | )% | ||||||
| As a percent of revenue |
2 | % | 0 | % | |||||||||||
Lease litigation settlement for the year ended December 31, 2007 includes $2.5 million related to a lease settlement in West Palm Beach and $0.1 million for lease litigation in Milwaukee. There were no lease litigation settlement expenses in 2008.
Operating Income
| For the year ended December 31, | $ Change | % Change | ||||||||||||
| ($ in Thousands) | 2007 | 2008 | ||||||||||||
| Operating income |
$ | 7,008 | $ | 13,358 | $ | 6,350 | 91 | % | ||||||
| As a percent of revenue |
5 | % | 8 | % | ||||||||||
The increase in operating income is primarily related to the increase in revenue of $34.0 million from sales to new and existing customers. The increase in revenue was offset by increased expenses, including $19.1 million, $5.1 million, $3.4 million, and $2.6 million, for cost of revenues, depreciation and amortization, sales and marketing, and general and administrative, respectively.
44
Interest Expense, Interest Income, and Loss from Debt Extinguishment
| For the year ended December 31, | $ Change | % Change | |||||||||||||
| ($ in Thousands) | 2007 | 2008 | |||||||||||||
| Interest expense |
$ | (6,622 | ) | $ | (19,193 | ) | $ | (12,571 | ) | 190 | % | ||||
| Interest income |
$ | 1,808 | $ | 1,587 | $ | (221 | ) | (12 | )% | ||||||
| Loss from debt extinguishment |
$ | (2,809 | ) | $ | (695 | ) | $ | 2,114 | (75 | )% | |||||
The increase in interest expense is primarily due to the change in the fair value of our interest rate swaps. We convert a portion of the variable rate interest of our outstanding debt to fixed interest rates through the use of interest rate swap instruments. These instruments are marked to market value at the end of each quarter, with gains and losses treated as decreases or increases to interest expense. The change in market value of the derivative, directly related to the decreases in current and future LIBOR rates, resulted in an increase in interest expense of $6.9 million for the year ended December 31, 2008. The increase in interest expense was also attributable to the first full year of interest associated with our capital lease obligations, which increased to $4.4 million for the year ended December 31, 2008 from $0.6 million for the year ended December 31, 2007. Interest expense was also affected by an increase in our weighted average outstanding debt balance, which increased to $99.8 million for the year ended December 31, 2008 from $55.4 million for the year ended December 31, 2007, as a result of borrowing additional funds under the 2008 Credit Facility.
Interest income decreased by $0.2 million for the year ended December 31, 2008 compared to the year ended December 31, 2007. The decrease is attributable to a lower average cash balance and lower rates during 2008.
Loss from debt extinguishment was $0.7 million for the year ended December 31, 2008 due to the write-off of certain debt issuance costs related to our debt refinancing that occurred in March 2008. Loss from debt extinguishment for the year ended December 31, 2007 was due to the repayment of $104.7 million of our debt with proceeds from our initial public offering.
Provision for Income Taxes
| For the year ended December 31, | $ Change | % Change | |||||||||||||
| ($ in Thousands) | 2007 | 2008 | |||||||||||||
| Provision for income taxes |
$ | (263 | ) | $ | (1,324 | ) | $ | (1,061 | ) | 403 | % | ||||
The provision for income taxes increased by $1.1 million for the year ended December 31, 2008. During 2008 we experienced the effects of: (i) Canadian and several local jurisdiction net operating loss carryforwards becoming fully utilized; (ii) various new state income taxes; and (iii) the federal alternative minimum tax. Canadian, local jurisdiction, and federal taxes increased by $0.6 million, $0.3 million, and $0.1 million, respectively, during the year ended December 31, 2008.
Income from Discontinued Operations
| For the year ended December 31, | $ Change | % Change | |||||||||||
| ($ in Thousands) | 2007 | 2008 | |||||||||||
| Income from discontinued operations |
$ | 397 | $ | — | $ | (397 | ) | (100 | )% | ||||
Income from discontinued operations decreased by $0.4 million for the year ended December 31, 2008 compared to the year ended December 31, 2007. During 2007, leases for data centers in Chicago and Kansas City were not renewed. The results of operations for these data centers are shown here as discontinued operations.
45
Net Loss
| For the year ended December 31, | $ Change | % Change | |||||||||||||
| ($ in Thousands) | 2007 | 2008 | |||||||||||||
| Net loss |
$ | (786 | ) | $ | (7,035 | ) | $ | (6,249 | ) | 795 | % | ||||
Net loss increased by $6.2 million to $7.0 million for the year ended December 31, 2008. The change in net loss is primarily attributable to the impact of the decrease in the fair value of our interest rate swaps of $6.9 million.
Inflation and Changing Prices
Management believes that, for the periods presented, inflation and changing prices have not had a material effect on results of operations.
LIQUIDITY AND CAPITAL RESOURCES
Overview
The following table sets forth a summary of our cash flows for the periods indicated:
| For the year ended December 31, | ||||||||||||
| (In thousands) | 2007 | 2008 | 2009 | |||||||||
| Cash provided by (used in): |
||||||||||||
| Operating activities |
$ | 38,641 | $ | 45,614 | $ | 53,588 | ||||||
| Investing activities |
(33,933 | ) | (154,710 | ) | (62,514 | ) | ||||||
| Financing activities |
36,563 | 78,863 | 22,582 | |||||||||
Sources and Uses of Cash
Our principal sources of cash are from our operating activities and the funds available to us from our debt borrowings. On March 27, 2008, we entered into the Credit Facility. As of December 31, 2009, $120.0 million was outstanding under the Term Loan, $22.5 million was outstanding under the Delayed Draw Term Loan, a $1.4 letter of credit was outstanding under the Revolver, and no borrowings had occurred under any Additional Delayed Draw Term Loan.
For the year ended December 31, 2009, our capital expenditures were $62.6 million. Our 2009 capital expenditures included the expansion of our new data center in the New York Metro area and the acceleration of our expansion in Atlanta.
We expect our 2010 capital expenditures to approximate $97.0 million. Such expenditures are expected to be funded from cash flows from operations, our cash on hand, and our Additional Delayed Draw Term Loan. We do not expect to access funds under our Revolver. Our 2010 capital expenditures will include the completion of our expansion in Atlanta. These investments will increase product availability, which we believe will enable us to increase revenue and potentially reduce our accumulated deficit. We typically incur lease, utility, and personnel related expenses prior to being able to accept customers for, and generate revenue from the additional capacity. As a result of the operating leverage inherent in our business model, we believe incremental revenue from these expansions will increase operating cash flow. In addition, because most of our costs are fixed, once a market achieves positive cash flow from its operations, new revenues typically generate cash flow at higher operating margins. While we expect our cash flow from operations will continue to increase, we expect our cash flow used in investing activities, primarily as a result of our expansion efforts, to be greater than our cash flows generated from operating activities for at least the next twelve months.
46
While we cannot provide any assurances, given our current cash position and cash needs, we believe that our cash generated from operating activities, existing cash balance, and available borrowings under the Credit Facility will be sufficient to meet our anticipated capital expenditures, debt service and working capital requirements for at least the next twelve months.
Net Cash Provided by Operating Activities
Net cash provided by operating activities for the year ended December 31, 2009 was $53.6 million. This was attributable to: (i) net income of $0.4 million; (ii) depreciation, amortization and other non-cash charges of $58.3 million;(iii) an increase in assets of $4.5 million, primarily related to increases in accounts receivable from longer pay cycles; and (iv) a decrease in liabilities of $0.6 million, primarily due to timing differences in end of period payables.
Net cash provided by operating activities for the year ended December 31, 2008 was $45.6 million. This was attributable to a net loss of $7.0 million, depreciation, amortization and other non-cash charges of $52.2 million and cash provided by net operating assets and liabilities of $0.4 million.
Net cash provided by operating activities for the year ended December 31, 2007 was $38.6 million. This was attributable to a net loss of $0.8 million, depreciation, amortization and other non-cash charges of $35.7 million and cash provided by net operating assets and liabilities of $3.7 million.
Net Cash Used in Investing Activities
Net cash used in investing activities for the year ended December 31, 2009 was $62.5 million compared to $154.7 million for the year ended December 31, 2008. Cash used in investing activities in 2009 was primarily for capital expenditures relating to the expansion of data centers in the New York Metro area and Atlanta. Such expansions added approximately 1,000 sellable cabinets during 2009. Cash used in investing activities in 2008 was primarily for capital expenditures relating to the expansion of data centers in the New York Metro area, the San Francisco Bay area, and several of our other top markets. Such expansions added approximately 3,300 sellable cabinets during 2008.
Cash used in investing activities in 2007 was primarily for capital expenditures relating to the expansion of data centers and the installation of additional power and cooling equipment in several of our top markets.
Net Cash Provided by Financing Activities
Net cash provided by financing activities for the year ended December 31, 2009 was $22.6 million compared to net cash provided by financing activities of $78.9 million for the year ended December 31, 2008. Cash provided from financing activities during 2009 was primarily from the Delayed Draw Term Loan. Cash provided from financing activities during 2008 was primarily from the Term Loan.
Cash provided from financing activities during 2007 was primarily from our initial public offering, net of $106.0 million in debt payments.
Debt Obligations
As of December 31 2009, we have $120.0 million in principal outstanding under the Term Loan, $22.5 million in principal outstanding under the Delayed Draw Term Loan, and a $1.4 million letter of credit outstanding under the Revolver.
Substantially all of the assets of the Company and its restricted subsidiaries are pledged as collateral for the Credit Facility, and the Credit Facility is guaranteed by the Company’s restricted subsidiaries. For all loans under the Credit Facility, we have the option to pay interest at a rate equal to: (a) 2.5% to 3.5% above the base rate
47
(which is equal to the greater of the administrative agent’s prime rate, 0.5% above the federal funds rate, and 3.0% per annum) or (b) 3.5% to 4.5% above the LIBOR rate (which is equal to the greater of the LIBOR rate for such interest period and 2.0%), where in each case the applicable margin changes based on our consolidated total leverage ratio. The current rate of interest is 3.0% above the base rate or 4.0% above the LIBOR rate. We also pay unused facility fees equal to 0.50% per annum on the unused portion of the Revolver and 1.0% per annum on the unused portion of the Additional Delayed Draw Term Loan.
Borrowings under the Revolver are available until September 26, 2013. Borrowings under the Additional Delayed Draw Term Loan are available until September 4, 2010. Repayments of principal under the Term Loan and the Delayed Draw Term Loan are due in scheduled quarterly installments, beginning March 31, 2010, with the final payment due and payable on March 27, 2014. All outstanding amounts under the Revolver, if any, will be due and payable on September 27, 2013. Repayments of principal outstanding under the Additional Delayed Draw Term Loans, if any, will commence on March 31, 2011 in quarterly installments, with the final payment due and payable on March 27, 2014.
The Credit Facility requires compliance with certain financial covenant ratios including our consolidated total leverage ratio, consolidated senior leverage ratio, annualized consolidated interest coverage ratio, and an annualized consolidated fixed charge coverage ratio. We were in compliance with all such financial covenant ratios as of December 31, 2009. A 10% change in the ratios would not change our compliance status.
The Credit Facility also requires that we comply with certain other covenants, which among other things, restrict our ability to incur additional debt, pay dividends and make other restricted payments, sell assets, enter into affiliate transactions and take other actions. We were in compliance with all such covenants as of December 31, 2009 and anticipate compliance with all covenants for the next twelve months.
The ability to comply with these provisions may be affected by events beyond our control. The breach of any of these covenants could result in a default, subject to customary cure rights, under the Credit Facility and, if not cured within any applicable cure period or waived by our lenders, could trigger acceleration of repayment and the exercise of remedies against the collateral and otherwise, thus adversely affecting the business.
Capital Lease Obligations
The present value of obligations under capital leases at December 31, 2009 were $60.3 million.
In August 2007, we recorded a capital lease for a data center in Sunnyvale, California. Monthly payments under the capital lease commenced in August 2007 and will be made through July 2032, at an effective interest rate of 8.36% per annum.
In February 2008, we recorded a capital lease for a data center in North Bergen, New Jersey. Monthly payments under the capital lease commenced in August 2008 and will be made through July 2033, at an effective interest rate of 9.85% per annum.
During 2009, we recorded capital leases totaling $10.0 million for data center equipment. Monthly payments under these capital leases commenced in July 2009 and will be made through March 2014, at a weighted average effective interest rate of 7.0% per annum.
48
Contractual Obligations
The following table summarizes, as of December 31, 2009, our minimum payments for long-term debt and other obligations for the next five years and thereafter:
| ($ in thousands) | Total | 2010 | 2011 and 2012 |
2013 and 2014 |
Thereafter | ||||||||||
| Operating lease obligations |
$ | 355,662 | $ | 32,276 | $ | 64,082 | $ | 63,482 | $ | 195,822 | |||||
| Capital lease obligations* |
142,776 | 7,033 | 14,224 | 12,933 | 108,586 | ||||||||||
| Long term debt |
142,500 | 14,250 | 57,000 | 71,250 | — | ||||||||||
| Interest expense on long-term debt** |
30,539 | 10,041 | 15,681 | 4,817 | |||||||||||
| Power Purchase Commitments |
2,770 | 2,011 | 759 | — | — | ||||||||||
| Total contractual obligations*** |
$ | 674,247 | $ | 65,611 | $ | 151,746 | $ | 152,482 | $ | 304,408 | |||||
| * | Minimum payments for capital lease obligations includes imputed interest included in the capital lease accounting. |
| ** | The interest expense forecast is based on the greater of the LIBOR rate or 6.5% as of December 31, 2009. Interest expense was calculated by multiplying the outstanding balance by the interest rate for the given time period. |
| *** | The contractual obligations table above does not include accruals for uncertain income tax liabilities of $0.2 million, due to their uncertain nature and timing. |
Off Balance Sheet Arrangements
As of December 31, 2008 and 2009 we did not have any relationships with unconsolidated entities or financial partnerships, such as entities referred to as structured finance or special purpose entities, which were established for the purpose of facilitating off balance sheet arrangements.
We lease space for a majority of our data centers through operating leases. This space is not represented as an asset, nor is the obligation associated with the lease arrangements represented as a liability on our Consolidated Balance Sheets. Minimum payments for such operating lease obligations are disclosed in the footnotes to our financial statements and are included in the contractual obligations table above.
RECENT ACCOUNTING PRONOUNCEMENTS
In October, 2009, the Financial Accounting Standards Board (the “FASB”) issued new guidance regarding accounting for and reporting on multiple-deliverable arrangements. Specifically, the guidance addresses how to separate deliverables and how to measure and allocate arrangement consideration to one or more units of accounting. This guidance is effective prospectively for revenue arrangements entered into or materially modified in fiscal years beginning on or after June 15, 2010. We are still evaluating such guidance.
In June 2009, the FASB issued The FASB Accounting Standards Codification (the “Codification”). The Codification is the source of authoritative U.S. GAAP recognized by the FASB to be applied by nongovernmental entities. The Codification is effective for financial statements issued for interim and annual periods ending after September 15, 2009. We adopted the Codification in September 2009.
In May 2009, new accounting guidance was issued regarding subsequent events. This guidance establishes general standards of accounting and disclosure for events that occur after the balance sheet date but before financial statements are issued. This guidance is effective for interim and annual periods ending after June 15, 2009. We adopted the guidance in June 2009.
In April 2009, new accounting guidance was issued regarding the estimation of fair value. This guidance provides additional information on estimating fair value when the volume and level of activity for an asset or
49
liability have significantly decreased in relation to normal market activity, as well as additional information on circumstances which may indicate a transaction is not orderly. The guidance requires interim disclosures of the inputs and valuation techniques used to measure fair value reflecting changes in the valuation techniques and related inputs. This guidance is effective prospectively for interim and annual reporting periods ending after June 15, 2009. We adopted the guidance in June 2009.
In April 2009, new accounting guidance was issued regarding interim disclosures about fair value. This guidance requires that disclosures provide quantitative and qualitative information on fair value estimates for all financial instruments not measured on the balance sheet at fair value, when practicable. This guidance is effective prospectively for interim reporting periods ending after June 15, 2009. We adopted the guidance in June 2009.
In March 2008, new accounting guidance was issued regarding disclosures about derivative instruments. This new guidance enhances disclosure about how and why a company uses derivatives; how derivative instruments are accounted for; and how derivatives affect a company’s financial position, financial performance, and cash flows. This guidance is effective for financial statements issued for fiscal years and interim periods beginning after November 15, 2008. We adopted the guidance as of January 1, 2009, as reflected in Note 5.
The adoption of new accounting guidance did not have a material effect on our consolidated financial statements.
| ITEM 7A. | QUANTITATIVE AND QUALITATIVE DISCLOSURES ABOUT MARKET RISK |
INTEREST RATE RISK
We are required by our credit agreements to manage the interest rate risk on our debt. A portion of the floating interest rate on the outstanding debt of $142.5 million is swapped to a fixed rate through an interest rate swap derivative, thus minimizing interest rate risk.
Our existing interest rate swap was entered into on January 15, 2009, has a notional amount of $120.0 million, and a maturity date of February 2012. There was no up-front cost for this agreement. The fixed LIBOR rates associated with this swap are 1.71% from February 2009 through February 2010 and 4.99% from February 2010 through February 2012. If the three-month LIBOR rate is higher than these fixed rates for the given periods, we will receive cash payments for the difference between actual three-month LIBOR and the fixed rates for the given periods. If the three-month LIBOR rate is lower than these fixed rates for the given periods, we will pay the difference between actual three-month LIBOR and the fixed rates for the given periods.
As of December 31, 2009, the three-month LIBOR rate was 0.25%, which is lower than our contracted rates. A 10% change in the current LIBOR rate would not change our current net pay position.
FOREIGN CURRENCY RISK
We have a data center located in Toronto, Canada. Revenue from this data center was 7.6% of total revenues for the year ended December 31, 2009. We primarily receive payment for services provided at this data center, and primarily pay expenses related to it, in Canadian dollars, which mitigates our exposure to currency exchange rate risk. However, fluctuating foreign currency exchange rates have a direct impact on how our international results of operations translate into U.S. dollars. During 2009, the U.S. dollar was generally weaker relative to the Canadian dollar. This adversely impacted our results of operations as amounts in Canadian dollars generally translated into fewer U.S. dollars. We have determined that the impact of a near-term 10% appreciation or depreciation of the U.S. dollar relative to the Canadian dollar would not have a significant effect on our financial position, results of operations, or cash flows. We do not maintain any derivative instruments to mitigate the exposure to translation and transaction risk. Our foreign exchange transaction gains and losses are included in our results of operations and were not material for all periods presented.
50
FAIR VALUE RISK
We do not have material exposure to market risk with respect to investments, because our investments consist primarily of highly liquid cash equivalent securities. We do not use derivative financial instruments for speculative or trading purposes; however, this does not preclude our adoption of specific hedging strategies in the future.
COMMODITY PRICE RISK
Operating costs incurred by us are subject to price fluctuations caused by the volatility of underlying electricity prices at some of our data centers. We monitor the cost of electricity at our data centers. In a limited number of our data centers, we enter into power purchase agreements to fix the price at which we acquire electricity.
| ITEM 8. | FINANCIAL STATEMENTS AND SUPPLEMENTARY DATA |
The financial statements and supplementary data required by this Item 8 are listed in Item 15(a)(1) and 15(a)(2) and begin at page F-2 of this Annual Report on Form 10-K.
| ITEM 9. | CHANGES IN AND DISAGREEMENTS WITH ACCOUNTANTS ON ACCOUNTING AND FINANCIAL DISCLOSURE |
None.
| ITEM 9A. | CONTROLS AND PROCEDURES |
Evaluation of Disclosure Controls and Procedures
In designing and evaluating our disclosure controls and procedures, management recognized that disclosure controls and procedures, no matter how well conceived and operated, can provide only reasonable assurance of achieving the desired control objectives and we are required to apply our judgment in evaluating the cost-benefit relationship of possible disclosure controls and procedures. Accordingly, we have designed our disclosure controls and procedures to provide reasonable assurance of achieving the desired control objectives.
We carried out an evaluation required by Rule 13a-15 and 15d-15 under the Exchange Act (the “Evaluation”), under the supervision and with the participation of our President and Chief Executive Officer (“CEO”) and our Chief Financial Officer (“CFO”), of the effectiveness of our disclosure controls and procedures as defined in Rules 13a-15 and 15d-15 under the Exchange Act (“Disclosure Controls”) as of December 31, 2009. Based upon this evaluation our CEO and CFO concluded that the design and operation of our current Disclosure Controls were effective at a reasonable assurance level to ensure that information disclosed by us in reports that we file or submit under the Exchange Act is (i) recorded, processed, summarized and reported within the time periods specified in SEC rules and forms, and (ii) accumulated and communicated to our senior management, including our CEO and CFO, to allow timely decisions regarding required disclosures.
Management’s Report on Internal Control Over Financial Reporting
Management is responsible for establishing and maintaining internal control over financial reporting as such term is defined in Exchange Act Rule 13a-15(f). Because of its inherent limitations, internal control over financial reporting may not prevent or detect misstatements. Also, projections of any evaluation of effectiveness to future periods are subject to the risk that controls may all become inadequate because of changes in conditions, or that the degree of compliance with the policies or procedures may deteriorate.
Our management evaluated, under the supervision and with the participation of our CEO and our CFO, the effectiveness of the design and operation of internal control over financial reporting as of December 31, 2009.
Based on our evaluation under the framework in Internal Control—Integrated Framework, issued by the Committee of Sponsoring Organizations of the Treadway Commission, our management concluded that our internal control over financial reporting was effective as of December 31, 2009.
51
The effectiveness of our internal control over financial reporting as of December 31, 2009 has been audited by PricewaterhouseCoopers LLP, an independent registered certified public accounting firm, as stated in their report which is included herein on page F-1 of this Annual Report on Form 10-K.
Changes in Internal Control Over Financial Reporting
For the fourth quarter of 2009, we did not identify any modifications to our internal control over financial reporting that have materially affected, or are reasonably likely to materially affect, our internal control over financial reporting.
CEO and CFO Certifications
Exhibits 31.1 and 31.2 are the Certifications of the CEO and the CFO, respectively. The Certifications are required in accordance with Section 302 of the Sarbanes-Oxley Act of 2002 (the “Section 302 Certifications”). This Item of this report, which you are currently reading, is the information concerning the Evaluation referred to in the Section 302 Certifications, and this information should be read in conjunction with the Section 302 Certifications for a more complete understanding of the topics presented.
| ITEM 9B. | OTHER INFORMATION |
None.
| ITEM 10. | DIRECTORS, EXECUTIVE OFFICERS AND CORPORATE GOVERNANCE |
Information regarding our directors, executive officers and corporate governance is incorporated by reference to the information set forth in our Proxy Statement for the Annual Meeting of Stockholders to be filed with the SEC within 120 days after the end of our fiscal year ended December 31, 2009.
| ITEM 11. | EXECUTIVE COMPENSATION |
Information regarding executive compensation is incorporated by reference to the information set forth in our Proxy Statement for the Annual Meeting of Stockholders to be filed with the SEC within 120 days after the end of our fiscal year ended December 31, 2009.
| ITEM 12. | SECURITY OWNERSHIP OF CERTAIN BENEFICIAL OWNERS AND MANAGEMENT AND RELATED STOCKHOLDER MATTERS |
Information regarding security ownership of certain beneficial owners and management and related stockholder matters is incorporated by reference to the information set forth in our Proxy Statement for the Annual Meeting of Stockholders to be filed with the SEC within 120 days after the end of our fiscal year ended December 31, 2009.
| ITEM 13. | CERTAIN RELATIONSHIPS AND RELATED TRANSACTIONS, AND DIRECTOR INDEPENDENCE |
Information regarding certain relationships and related transactions, and director independence is incorporated by reference to the information set forth in our Proxy Statement for the Annual Meeting of Stockholders to be filed with the SEC within 120 days after the end of our fiscal year ended December 31, 2009.
| ITEM 14. | PRINCIPAL ACCOUNTING FEES AND SERVICES |
Information regarding principal accountant fees and services is incorporated by reference to the information set forth in our Proxy Statement for the Annual Meeting of Stockholders to be filed with the SEC within 120 days after the end of our fiscal year ended December 31, 2009.
52
| ITEM 15. | EXHIBITS, FINANCIAL STATEMENT SCHEDULES |
(a)(1) Financial Statements
| Report of Independent Registered Certified Public Accounting Firm |
F-1 | |
| Consolidated Balance Sheets as of December 31, 2008 and 2009 |
F-2 | |
| Consolidated Statements of Operations for the years ended December 31, 2007, 2008, and 2009 |
F-3 | |
| Consolidated Statements of Stockholders’ Equity (Deficit) and Comprehensive Income (Loss) for the years ended December 31, 2007, 2008, and 2009 |
F-4 | |
| Consolidated Statements of Cash Flows for the years ended December 31, 2007, 2008, and 2009 |
F-6 | |
| Notes to Consolidated Financial Statements |
F-7 |
(a)(2) Schedules
All schedules have been omitted because they are not applicable or the required information is shown in the financial statements or notes thereto.
(a)(3) Exhibits
| Exhibit |
Description of Document |
Incorporated By Reference |
Filing Date | Filed Herein | ||||
| 2.1 | Agreement and Plan of Merger, dated October 21, 2009, among Equinix, Inc., Sundance Acquisition Corporation and Switch & Data Facilities Company, Inc. | 8-K Exhibit 2.1 |
10/22/2009 | |||||
| 2.2 | Voting Agreement, dated October 21, 2009, among Equinix, Inc., Switch & Data Facilities Company, Inc. and each Securityholder party thereto | 8-K Exhibit 2.2 |
10/22/2009 | |||||
| 3.1 | Amended Certificate of Incorporation | S-8 Exhibit 4.2 |
3/14/2007 | |||||
| 3.2 | Amended and Restated By-Laws | S-8 Exhibit 4.3 |
3/14/2007 | |||||
| 3.3 | Form of Certificate of Merger | S-1/A Exhibit 3.3 |
2/16/2007 | |||||
| 4.1 | Form of Specimen Common Stock Certificate | S-1/A Exhibit 4.1 |
2/16/2007 | |||||
| 4.2 | Fifth Amended and Restated Investors Agreement | S-8 Exhibit 4.4 |
3/14/2007 | |||||
| 10.1 | Employment Agreement, dated December 16, 2008, between Switch & Data Facilities Company, Inc. and Keith Olsen | 8-K Exhibit 10.1 |
12/22/2008 | |||||
| 10.2 | Amended and Restated Employment Agreement, dated December 18, 2008, between Switch and Data Management Company LLC and George A. Pollock, Jr. | 8-K Exhibit 10.2 |
12/22/2008 | |||||
| 10.3 | Amended and Restated Employment Agreement, dated December 18, 2008, between Switch and Data Management Company LLC and Ernest Sampera | 8-K Exhibit 10.3 |
12/22/2008 | |||||
53
| Exhibit |
Description of Document |
Incorporated By Reference |
Filing Date | Filed Herein | ||||
| 10.4 | Fourth Amended and Restated Credit Agreement, dated as of March 27, 2008, among Switch & Data Holdings, Inc., as the Borrower, the institutions party thereto from time to time as lenders, as the Lenders, Royal Bank of Canada, as the Administrative Agent, Royal Bank of Canada, as the Documentation Agent, General Electric Capital Corporation, as the Syndication Agent, and RBC Capital Markets Corporation, and GE Capital Markets, Inc., as Joint Lead Arrangers and Joint Bookrunners | 8-K Exhibit 10.1 |
3/31/2008 | |||||
| 10.5 | Offer Letter, dated August 8, 2005, between Switch and Data Management Company LLC and Ali Marashi | S-1 Exhibit 10.5 |
9/27/2006 | |||||
| 10.6 | Switch & Data 2007 Stock Incentive Plan | S-1/A Exhibit 10.9 |
2/16/2007 | |||||
| 10.7 | Agreement of Lease with 111 Eighth Avenue LLC, dated as of June 30, 1998 | S-1/A Exhibit 10.10 |
2/7/2007 | |||||
| 10.8 | First Amendment of Lease with 111 Eighth Avenue LLC, dated as of August 3, 2005 | S-1/A Exhibit 10.11 |
2/7/2007 | |||||
| 10.9 | Sublease with Global Crossing Telecommunications, Inc., dated as of November 21, 2005 | S-1/A Exhibit 10.12 |
2/7/2007 | |||||
| 10.10 | First Amendment to Sublease with Global Crossing Telecommunications, Inc., dated as of May 4, 2006 | S-1/A Exhibit 10.13 |
2/7/2007 | |||||
| 10.11 | Second Amendment to Sublease with Global Crossing Telecommunications, Inc., dated as of August 10, 2006 | S-1 Exhibit 10.14 |
9/27/2006 | |||||
| 10.12 | Sublease Agreement with Abovenet Communications, Inc., dated as of March 13, 2003 | S-1/A Exhibit 10.15 |
2/7/2007 | |||||
| 10.13 | Lease with 529 Bryant Street Partners, LLC, dated as of January 31, 2005 | S-1/A Exhibit 10.16 |
2/7/2007 | |||||
| 10.14 | Amendment No. 2 to Lease with 529 Bryant Street Partners, LLC, dated as of January 31, 2005 | S-1 Exhibit 10.17 |
9/27/2006 | |||||
| 10.15 | Form of Nonqualified Stock Option Agreement under the Switch & Data 2007 Stock Incentive Plan | 10-K Exhibit 10.20 |
3/28/2007 | |||||
| 10.16 | Form of Incentive Stock Option Agreement under the Switch & Data 2007 Stock Incentive Plan | 10-K Exhibit 10.21 |
3/28/2007 | |||||
| 10.17 | Fourth Amendment to Third Amended and Restated Credit Agreement, dated as of June 20, 2007 | 8-K Exhibit 10.1 |
6/22/2007 | |||||
| 10.18 | Fifth Amendment to Third Amended and Restated Credit Agreement, dated as of June 20, 2007 | 8-K Exhibit 10.2 |
6/22/2007 | |||||
| 10.19 | Lease with 5851 Westside Avenue Associates, L.L.C., dated October 30, 2007 | 8-K Exhibit 10.1 |
11/5/2007 | |||||
| 10.20 | Settlement Agreement - 625 Milwaukee LLC et al v. Switch & Data Facilities Company LLC et al | 8-K Exhibit 10.1 |
5/27/2009 | |||||
54
| Exhibit |
Description of Document |
Incorporated By Reference |
Filing Date | Filed Herein | ||||
| 10.21 | First Amendment to the Fourth Amended and Restated Credit Agreement, dated as of September 4, 2009 | 8-K Exhibit 10.1 |
9/8/2009 | |||||
| 21.1 | Subsidiaries of Switch & Data Facilities Company, Inc. | X | ||||||
| 23.1 | Consent of Independent Registered Certified Public Accounting Firm | X | ||||||
| 24.1 | Power of Attorney (contained on signature page) | X | ||||||
| 31.1 | Chief Executive Officer Certification pursuant to Section 302 of the Sarbanes-Oxley Act of 2002 | X | ||||||
| 31.2 | Chief Financial Officer Certification pursuant to Section 302 of the Sarbanes-Oxley Act of 2002 | X | ||||||
| 32.1 | Chief Executive Officer Certification pursuant to Section 906 of the Sarbanes-Oxley Act of 2002 | X | ||||||
| 32.2 | Chief Financial Officer Certification pursuant to Section 906 of the Sarbanes-Oxley Act of 2002 | X | ||||||
55
SIGNATURES
Pursuant to the requirements of Section 13 or 15(d) of the Securities Exchange Act of 1934, the registrant has caused this Annual Report on Form 10-K to be signed on its behalf by the undersigned, thereunto duly authorized in the City of Tampa, State of Florida, on this 22nd day of February, 2010.
| SWITCH & DATA FACILITIES COMPANY, INC. | ||
| By: | /s/ KEITH OLSEN | |
| Name: | Keith Olsen | |
| Title: | Chief Executive Officer | |
POWER OF ATTORNEY
KNOW ALL PERSONS BY THESE PRESENTS, that each person whose signature appears below constitutes and appoints Keith Olsen and George Pollock, Jr., and each of them, each with the power of substitution, their attorney-in-fact, to sign any amendments to this Annual Report on Form 10-K (including post-effective amendments), and to file the same, with exhibits thereto and other documents in connection therewith, with the SEC, hereby ratifying and confirming all that each of said attorneys-in-fact, or their substitute or substitutes, may do or cause to be done by virtue hereof.
Pursuant to the requirements of the Securities Exchange Act of 1934, as amended, this report has been signed below by the following persons on behalf of the registrant and in the capacities and on the dates indicated:
| Signature |
Title |
Date | ||
| /s/ WILLIAM LUBY William Luby |
Chairman of the Board of Directors |
February 22, 2010 | ||
| /s/ KEITH OLSEN Keith Olsen |
President, Chief Executive Officer and Director (Principal Executive Officer) |
February 22, 2010 | ||
| /s/ GEORGE POLLOCK, JR. George Pollock, Jr. |
Senior Vice President and Chief Financial Officer (Principal Financial and Accounting Officer) |
February 22, 2010 | ||
| /s/ GEORGE KELLY George Kelly |
Director | February 22, 2010 | ||
| /s/ KATHLEEN EARLEY Kathleen Earley |
Director | February 22, 2010 | ||
| /s/ ARTHUR MATIN Arthur Matin |
Director | February 22, 2010 | ||
| /s/ M. ALEX WHITE M. Alex White |
Director | February 22, 2010 | ||
| /s/ G. MICHAEL SIEVERT G. Michael Sievert |
Director | February 22, 2010 | ||
| /s/ MICHAEL SILECK Michael Sileck |
Director | February 22, 2010 | ||
56
REPORT OF INDEPENDENT REGISTERED CERTIFIED PUBLIC ACCOUNTING FIRM
To the Board of Directors and Stockholders of
Switch & Data Facilities Company, Inc.
In our opinion, the accompanying consolidated balance sheets and the related statements of operations, stockholders’ equity (deficit) and comprehensive income (loss) and cash flows present fairly, in all material respects, the financial position of Switch & Data Facilities Company, Inc. and its subsidiaries at December 31, 2009 and 2008 and the results of their operations and their cash flows for each of the three years in the period ended December 31, 2009 in conformity with accounting principles generally accepted in the United States of America. Also in our opinion, the Company maintained, in all material respects, effective internal control over financial reporting as of December 31, 2009, based on criteria established in Internal Control—Integrated Framework issued by the Committee of Sponsoring Organizations of the Treadway Commission (COSO). The Company’s management is responsible for these financial statements, for maintaining effective internal control over financial reporting and for its assessment of the effectiveness of internal control over financial reporting, included in Management’s Report on Internal Control over Financial Reporting appearing under item 9A. Our responsibility is to express opinions on these financial statements and on the Company’s internal control over financial reporting based on our audits (which were integrated audits in 2009 and 2008). We conducted our audits in accordance with the standards of the Public Company Accounting Oversight Board (United States). Those standards require that we plan and perform the audits to obtain reasonable assurance about whether the financial statements are free of material misstatement and whether effective internal control over financial reporting was maintained in all material respects. Our audits of the financial statements included examining, on a test basis, evidence supporting the amounts and disclosures in the financial statements, assessing the accounting principles used and significant estimates made by management, and evaluating the overall financial statement presentation. Our audit of internal control over financial reporting included obtaining an understanding of internal control over financial reporting, assessing the risk that a material weakness exists, and testing and evaluating the design and operating effectiveness of internal control based on the assessed risk. Our audits also included performing such other procedures as we considered necessary in the circumstances. We believe that our audits provide a reasonable basis for our opinions.
A company’s internal control over financial reporting is a process designed to provide reasonable assurance regarding the reliability of financial reporting and the preparation of financial statements for external purposes in accordance with generally accepted accounting principles. A company’s internal control over financial reporting includes those policies and procedures that (i) pertain to the maintenance of records that, in reasonable detail, accurately and fairly reflect the transactions and dispositions of the assets of the company; (ii) provide reasonable assurance that transactions are recorded as necessary to permit preparation of financial statements in accordance with generally accepted accounting principles, and that receipts and expenditures of the company are being made only in accordance with authorizations of management and directors of the company; and (iii) provide reasonable assurance regarding prevention or timely detection of unauthorized acquisition, use, or disposition of the company’s assets that could have a material effect on the financial statements.
Because of its inherent limitations, internal control over financial reporting may not prevent or detect misstatements. Also, projections of any evaluation of effectiveness to future periods are subject to the risk that controls may become inadequate because of changes in conditions, or that the degree of compliance with the policies or procedures may deteriorate.
/s/ PricewaterhouseCoopers LLP
Tampa, Florida
February 22, 2010
F-1
SWITCH & DATA FACILITIES COMPANY, INC. AND SUBSIDIARIES
CONSOLIDATED BALANCE SHEETS
In Thousands, Except Per Common Share Amounts
| December 31, 2008 |
December 31, 2009 |
|||||||
| Assets |
||||||||
| Current assets |
||||||||
| Cash and cash equivalents |
$ | 14,706 | $ | 28,528 | ||||
| Accounts receivable, net of allowance for bad debts of $818 and $1,056, respectively |
11,497 | 13,930 | ||||||
| Prepaids and other assets |
2,429 | 2,849 | ||||||
| Total current assets |
28,632 | 45,307 | ||||||
| Property and equipment, net |
270,286 | 297,312 | ||||||
| Goodwill |
36,023 | 36,023 | ||||||
| Other intangible assets, net |
18,575 | 15,274 | ||||||
| Other long-term assets, net |
5,349 | 6,464 | ||||||
| Total assets |
$ | 358,865 | $ | 400,380 | ||||
| Liabilities, Preferred Stock and Stockholders’ Equity |
||||||||
| Current liabilities |
||||||||
| Accounts payable and accrued expenses |
$ | 34,131 | $ | 23,741 | ||||
| Derivative Liability |
7,434 | 8,713 | ||||||
| Current portion of unearned revenue |
3,629 | 3,275 | ||||||
| Current portion of deferred rent |
455 | 336 | ||||||
| Current portion of customer security deposits |
547 | 577 | ||||||
| Current portion of long-term debt |
— | 14,250 | ||||||
| Current portion of capital lease obligation |
— | 1,934 | ||||||
| Total current liabilities |
46,196 | 52,826 | ||||||
| Unearned revenue, less current portion |
1,858 | 1,506 | ||||||
| Deferred rent, less current portion |
18,587 | 26,287 | ||||||
| Customer security deposits, less current portion |
376 | 319 | ||||||
| Long-term debt, less current portion |
120,000 | 128,250 | ||||||
| Long-term portion of capital lease obligation |
50,927 | 58,364 | ||||||
| Total liabilities |
237,944 | 267,552 | ||||||
| Commitments and contingencies |
||||||||
| Stockholders’ equity |
||||||||
| Common stock, $0.0001 par value, authorized 200,000 shares; 34,564 and 34,737 issued and outstanding as of December 31, 2008 and December 31, 2009, respectively |
3 | 3 | ||||||
| Preferred stock, $0.0001 par value, authorized 25,000 shares; no shares issued |
— | — | ||||||
| Additional paid-in capital |
347,909 | 356,624 | ||||||
| Accumulated deficit |
(224,534 | ) | (224,126 | ) | ||||
| Accumulated other comprehensive income (loss) |
(2,457 | ) | 327 | |||||
| Total stockholders’ equity |
120,921 | 132,828 | ||||||
| Total liabilities, preferred stock and stockholders’ equity |
$ | 358,865 | $ | 400,380 | ||||
The accompanying notes are an integral part of these consolidated financial statements
F-2
SWITCH & DATA FACILITIES COMPANY, INC. AND SUBSIDIARIES
CONSOLIDATED STATEMENTS OF OPERATIONS
In Thousands, Except Per Common Share Amounts
| For the year ended December 31, | ||||||||||||
| 2007 | 2008 | 2009 | ||||||||||
| Revenues |
$ | 137,530 | $ | 171,525 | $ | 205,438 | ||||||
| Costs and operating expenses |
||||||||||||
| Cost of revenues, exclusive of depreciation and amortization |
70,986 | 90,122 | 103,133 | |||||||||
| Sales and marketing |
16,313 | 19,670 | 20,733 | |||||||||
| General and administrative |
15,039 | 17,659 | 18,955 | |||||||||
| Depreciation and amortization |
25,584 | 30,716 | 41,473 | |||||||||
| Lease litigation settlement |
2,600 | — | 700 | |||||||||
| Total costs and operating expenses |
130,522 | 158,167 | 184,994 | |||||||||
| Operating income |
7,008 | 13,358 | 20,444 | |||||||||
| Interest income |
1,808 | 1,587 | 56 | |||||||||
| Interest expense |
(6,622 | ) | (19,193 | ) | (15,775 | ) | ||||||
| Loss from debt extinguishment |
(2,809 | ) | (695 | ) | — | |||||||
| Other expense, net |
(305 | ) | (768 | ) | (3,063 | ) | ||||||
| Income (loss) from continuing operations before income taxes |
(920 | ) | (5,711 | ) | 1,662 | |||||||
| Provision for income taxes |
(263 | ) | (1,324 | ) | (1,254 | ) | ||||||
| Income (loss) from continuing operations |
(1,183 | ) | (7,035 | ) | 408 | |||||||
| Income from discontinued operations |
397 | — | — | |||||||||
| Net income (loss) |
(786 | ) | (7,035 | ) | 408 | |||||||
| Preferred stock accretions and dividends |
(227,522 | ) | — | — | ||||||||
| Net income (loss) attributable to common stockholders |
$ | (228,308 | ) | $ | (7,035 | ) | $ | 408 | ||||
| Income (loss) per common share—basic |
||||||||||||
| Continuing operations attributable to common stockholders |
$ | (5.49 | ) | $ | (0.20 | ) | $ | 0.01 | ||||
| Discontinued operations |
0.01 | — | — | |||||||||
| Net loss attributable to common stockholders |
$ | (5.48 | ) | $ | (0.20 | ) | $ | 0.01 | ||||
| Weighted average common shares outstanding |
41,626 | 34,369 | 34,569 | |||||||||
| Income (loss) per common share—diluted |
||||||||||||
| Continuing operations attributable to common stockholders |
$ | (5.49 | ) | $ | (0.20 | ) | $ | 0.01 | ||||
| Discontinued operations |
0.01 | — | — | |||||||||
| Net loss attributable to common stockholders |
$ | (5.48 | ) | $ | (0.20 | ) | $ | 0.01 | ||||
| Weighted average common shares outstanding |
41,626 | 34,369 | 35,330 | |||||||||
The accompanying notes are an integral part of these consolidated financial statements
F-3
SWITCH & DATA FACILITIES COMPANY, INC. AND SUBSIDIARIES
CONSOLIDATED STATEMENTS OF STOCKHOLDERS’ EQUITY (DEFICIT)
AND COMPREHENSIVE INCOME (LOSS)
For The Three Years Ended December 31, 2009
In Thousands, Except Per Common Share Amounts
| Common Stock (Successor) |
Common Stock (Predecessor) |
Series B Common Stock |
Special Junior Stock |
Series D-1 and D-2 Preferred Stock |
Addi- tional Paid-In Capital |
Un- earned Stock Comp- ensation |
Accum- ulated Other Compre- hensive Income |
Accum- ulated Deficit |
Total Stock- holders’ Equity (Deficit) |
|||||||||||||||||||||||||||||||||||||||
| Shares | Amount | Shares | Amount | Units | Amount | Units | Amount | Units | Amount | |||||||||||||||||||||||||||||||||||||||
| Balance as of December 31, 2006 |
— | $— | 42,295 | $ 4 | 65,217 | $ | 7 | 1,191 | $ | — | 537 | $ | 5 | $ | — | $ | (137 | ) | $ | 772 | $ | (214,971 | ) | $ | (214,320 | ) | ||||||||||||||||||||||
| Accretion of Series B convertible preferred stock |
— | — | — | — | — | — | — | — | — | — | — | — | — | (1,734 | ) | (1,734 | ) | |||||||||||||||||||||||||||||||
| Issuance of common shares |
505 | 0 | — | — | — | — | — | — | — | — | 1,298 | — | — | — | 1,298 | |||||||||||||||||||||||||||||||||
| Initial public offering |
9,000 | 1 | — | — | — | — | — | — | — | — | 139,199 | — | — | — | 139,200 | |||||||||||||||||||||||||||||||||
| Reorganization |
24,807 | 2 | (42,295 | ) | (4 | ) | (65,217 | ) | (7 | ) | (1,191 | ) | — | (537 | ) | (5 | ) | 195,921 | — | — | — | 195,907 | ||||||||||||||||||||||||||
| Stock compensation |
— | — | — | — | — | — | — | — | — | — | 3,963 | 122 | — | — | 4,085 | |||||||||||||||||||||||||||||||||
| Excess tax benefits from stock-based compensation |
— | — | — | — | — | — | — | — | — | — | 139 | — | — | — | 139 | |||||||||||||||||||||||||||||||||
| Cumulative FIN 48 adjustment |
— | — | — | — | — | — | — | — | — | — | — | — | — | (82 | ) | (82 | ) | |||||||||||||||||||||||||||||||
| Comprehensive income |
||||||||||||||||||||||||||||||||||||||||||||||||
| Net loss |
— | — | — | — | — | — | — | — | — | — | — | — | — | (786 | ) | (786 | ) | |||||||||||||||||||||||||||||||
| Currency translation adjustments |
— | — | — | — | — | — | — | — | — | — | — | — | 1,348 | — | 1,348 | |||||||||||||||||||||||||||||||||
| Comprehensive income |
— | — | — | — | — | — | — | — | — | — | — | — | — | — | 562 | |||||||||||||||||||||||||||||||||
| Balance as of December 31, 2007 |
34,312 | $ 3 | — | $— | — | $ | — | — | $ | — | — | $ | — | $ | 340,520 | $ | (15 | ) | $ | 2,120 | $ | (217,573 | ) | $ | 125,055 | |||||||||||||||||||||||
The accompanying notes are an integral part of these consolidated financial statements
F-4
SWITCH & DATA FACILITIES COMPANY, INC. AND SUBSIDIARIES
CONSOLIDATED STATEMENTS OF STOCKHOLDERS’ EQUITY (DEFICIT)
AND COMPREHENSIVE INCOME (LOSS)—(Continued)
For The Three Years Ended December 31, 2009
In Thousands, Except Per Common Share Amounts
| Common Stock | Additional Paid-In Capital |
Unearned Stock Compensation |
Accumulated Other Comprehensive Income (loss) |
Accumulated Deficit |
Total Stockholders’ Equity |
|||||||||||||||||||
| Shares | Amount | |||||||||||||||||||||||
| Balance as of December 31, 2007 |
34,312 | $ | 3 | $ | 340,520 | $ | (15 | ) | $ | 2,120 | $ | (217,573 | ) | $ | 125,055 | |||||||||
| Issuance of common shares |
252 | 0 | 997 | — | — | — | 997 | |||||||||||||||||
| Stock compensation |
— | — | 6,299 | 15 | — | — | 6,314 | |||||||||||||||||
| Excess tax benefits from stock compensation |
— | — | 93 | — | — | — | 93 | |||||||||||||||||
| FAS 157 transition adjustment |
— | — | — | — | 74 | 74 | ||||||||||||||||||
| Comprehensive loss |
||||||||||||||||||||||||
| Net loss |
— | — | — | — | — | (7,035 | ) | (7,035 | ) | |||||||||||||||
| Currency translation adjustment |
— | — | — | — | (4,577 | ) | — | (4,577 | ) | |||||||||||||||
| Comprehensive loss |
— | — | — | — | — | — | (11,612 | ) | ||||||||||||||||
| Balance as of December 31, 2008 |
34,564 | $ | 3 | $ | 347,909 | $ | 0 | $ | (2,457 | ) | $ | (224,534 | ) | $ | 120,921 | |||||||||
| Issuance of common shares |
173 | 0 | 2,423 | — | — | — | 2,423 | |||||||||||||||||
| Stock compensation |
— | — | 6,292 | — | — | — | 6,292 | |||||||||||||||||
| Excess tax benefits from stock compensation |
— | — | 0 | — | — | — | 0 | |||||||||||||||||
| Comprehensive loss |
||||||||||||||||||||||||
| Net income |
— | — | — | — | — | 408 | 408 | |||||||||||||||||
| Currency translation adjustment |
— | — | — | — | 2,784 | — | 2,784 | |||||||||||||||||
| Comprehensive income |
— | — | — | — | — | — | 3,192 | |||||||||||||||||
| Balance as of December 31, 2009 |
34,737 | $ | 3 | $ | 356,624 | $ | — | $ | 327 | $ | (224,126 | ) | $ | 132,828 | ||||||||||
The accompanying notes are an integral part of these consolidated financial statements
F-5
SWITCH & DATA FACILITIES COMPANY, INC. AND SUBSIDIARIES
CONSOLIDATED STATEMENTS OF CASH FLOWS
In Thousands, Except Per Common Share Amounts
| For the year ended December 31, | ||||||||||||
| 2007 | 2008 | 2009 | ||||||||||
| Cash flows from operating activities: |
||||||||||||
| Net income (loss) |
$ | (786 | ) | $ | (7,035 | ) | $ | 408 | ||||
| Adjustments to reconcile net income (loss) to net cash provided by operating activities |
||||||||||||
| Depreciation |
18,286 | 26,624 | 37,861 | |||||||||
| Amortization of debt issuance costs |
417 | 667 | 921 | |||||||||
| Amortization of other intangible assets |
7,288 | 4,092 | 3,617 | |||||||||
| Loss on debt extinguishment |
2,359 | 695 | — | |||||||||
| Stock compensation expense |
4,085 | 6,314 | 6,292 | |||||||||
| Provision for bad debts, net of recoveries |
(54 | ) | 839 | 1,150 | ||||||||
| Deferred rent |
2,203 | 6,094 | 7,289 | |||||||||
| Change in fair value of derivative |
1,184 | 6,884 | 1,279 | |||||||||
| Loss (gain) on disposal of fixed assets |
3 | 5 | (99 | ) | ||||||||
| Changes in operating assets and liabilities, net of acquired amounts |
||||||||||||
| Increase in accounts receivable |
(1,308 | ) | (3,509 | ) | (3,451 | ) | ||||||
| Increase in prepaids and other assets |
(219 | ) | (997 | ) | (411 | ) | ||||||
| Increase in other long term assets |
(41 | ) | (189 | ) | (651 | ) | ||||||
| Increase in accounts payable, accrued expenses, and other liabilities |
2,761 | 5,003 | 252 | |||||||||
| Decrease (increase) in unearned revenue |
2,463 | 127 | (869 | ) | ||||||||
| Net cash provided by operating activities |
38,641 | 45,614 | 53,588 | |||||||||
| Cash flows from investing activities: |
||||||||||||
| Purchase of property and equipment |
(33,934 | ) | (154,710 | ) | (62,629 | ) | ||||||
| Proceeds from sale of property and equipment |
1 | — | 115 | |||||||||
| Net cash used in investing activities |
(33,933 | ) | (154,710 | ) | (62,514 | ) | ||||||
| Cash flows from financing activities: |
||||||||||||
| Principal payments under long-term debt |
(105,968 | ) | (38,188 | ) | — | |||||||
| Principal payments under capital lease |
(69 | ) | — | (953 | ) | |||||||
| Proceeds from long-term debt |
— | 120,000 | 22,500 | |||||||||
| Proceeds from exercise of stock options |
1,298 | 997 | 2,423 | |||||||||
| Excess tax benefits from stock-based compensation |
139 | 93 | — | |||||||||
| Public offering costs |
(1,072 | ) | — | — | ||||||||
| Proceeds from initial public offering |
142,290 | — | — | |||||||||
| Debt issuance and amendment costs |
(55 | ) | (4,039 | ) | (1,388 | ) | ||||||
| Net cash provided by financing activities |
36,563 | 78,863 | 22,582 | |||||||||
| Net increase (decrease) in cash and cash equivalents |
41,271 | (30,233 | ) | 13,656 | ||||||||
| Effect of exchange rate changes on cash |
653 | (656 | ) | 166 | ||||||||
| Cash and cash equivalents: |
||||||||||||
| Beginning of the period |
3,671 | 45,595 | 14,706 | |||||||||
| End of the period |
$ | 45,595 | $ | 14,706 | $ | 28,528 | ||||||
| Supplemental disclosure of cash flow information: |
||||||||||||
| Cash paid for interest |
$ | 5,847 | $ | 9,425 | $ | 16,204 | ||||||
| Cash paid for income taxes |
$ | 117 | $ | 1,309 | $ | 1,066 | ||||||
| Cash paid for pre-payment penalty on long-term debt |
$ | 450 | $ | — | $ | — | ||||||
| Supplemental schedule of non-cash investing and financing activities: |
||||||||||||
| Purchased property and equipment in accounts payable and accrued expenses |
$ | 13,038 | $ | 16,845 | $ | 6,361 | ||||||
| Asset acquired and obligation incurred under capital lease (see Notes 4 and 6) |
$ | 22,119 | $ | 27,500 | $ | 10,001 | ||||||
The accompanying notes are an integral part of these consolidated financial statements
F-6
SWITCH & DATA FACILITIES COMPANY, INC. AND SUBSIDIARIES
NOTES TO CONSOLIDATED FINANCIAL STATEMENTS
In Thousands, Except Per Common Share Amounts
1. Organization
Description of Business
Switch & Data Facilities Company, Inc. (the “Company” or “Switch and Data”) is a premier provider of network-neutral data centers that house, power and interconnect the Internet. Leading content companies, enterprises, and communications service providers rely on the Company to connect to customers and exchange Internet traffic.
On February 8, 2007, the Company commenced its initial public offering of common stock consisting of 13,417 shares. Of these shares, 9,000 were newly issued shares sold by the Company and 4,417 were existing shares sold by the selling stockholders. Proceeds to the Company were $139,199, net of offering expenses, including underwriting discounts and commissions. Of these proceeds, $104,655 was used to repay a portion of the long term debt.
On February 13, 2007, the Company completed its initial public offering and reorganization. Switch & Data Facilities Company, Inc. (the “Predecessor”), the parent holding company that owned all of the entities through which business was operated, was merged into a newly formed, wholly owned Delaware corporation named Switch and Data, Inc. (the “Successor”). The merger was accounted for as a combination of entities under common control where assets and liabilities of the Predecessor were transferred to the Successor using historical carrying values, and income and expenses were recorded in a manner similar to that in a pooling of interests. Pursuant to the reorganization, 55,252 preferred shares of the Predecessor were exchanged for 24,807 common shares of the Successor. The newly issued common stock was recorded at fair market value. The difference in the carrying value of such preferred shares and the fair market value of the newly issued common shares was $225,788, which was accounted for as a deemed dividend to the preferred stockholders, reducing the net income (loss) attributable to common stockholders. The Successor immediately changed its name to Switch & Data Facilities Company, Inc. after the merger.
On October 21, 2009, the Company entered into an Agreement and Plan of Merger (the “Merger Agreement”) with Equinix, Inc. (“Equinix”) and Sundance Acquisition Corporation, a wholly-owned subsidiary of Equinix (“Merger Sub”). Pursuant to the terms of the Merger Agreement and subject to the satisfaction or waiver of the conditions therein, Merger Sub will merge with and into the Company, with Switch and Data surviving as a wholly-owned subsidiary of Equinix (the “Merger”).
Subject to the terms and conditions of the Merger Agreement, at the effective time of and as a result of the Merger, each of the Company’s outstanding shares of common stock (other than dissenting shares and shares held by the Company as treasury stock or owned by Equinix) will be converted into merger consideration that will consist of 0.19409 shares of Equinix’s common stock, $19.06 in cash or a combination of shares of Equinix’s common stock and cash. Under the Merger Agreement, Switch and Data’s stockholders had the opportunity to elect whether they would prefer to receive 0.19409 shares of Equinix’s common stock or $19.06 in cash for each share of Switch and Data’s common stock that they hold.
The Merger Agreement further provides that the overall consideration to be paid by Equinix in the Merger will consist 80% of Equinix common stock and 20% of cash. Accordingly, in the event that holders of more than 80% of Switch and Data’s common stock elect to receive Equinix common stock or holders of more than 20% of Switch and Data’s common stock elect to receive cash, the Merger Agreement provides that the merger consideration will be pro-rated to achieve these proportions. At the effective time of and as a result of the Merger, each of Switch and Data’s outstanding shares of common stock will be canceled and extinguished.
F-7
SWITCH & DATA FACILITIES COMPANY, INC. AND SUBSIDIARIES
NOTES TO CONSOLIDATED FINANCIAL STATEMENTS—(Continued)
In Thousands, Except Per Common Share Amounts
While Switch and Data’s stockholders voted on January 29, 2010 to approve the Merger, completion of the Merger remains subject to the expiration or termination of the waiting period imposed by the Hart-Scott-Rodino Antitrust Improvement Act of 1976, as amended, and the satisfaction or waiver of the other closing conditions specified in the Merger Agreement. The Company currently expects the Merger to close in the second quarter of 2010. The Company will announce the Merger’s expected closing date by issuing a press release and filing that press release on Form 8-K with the Securities and Exchange Commission (the “SEC”) no later than five business days before the expected closing date.
Additional information regarding the Merger is provided in the Current Report on Form 8-K that was filed with the SEC on October 22, 2009, as well as subsequent SEC filings.
2. Summary of Significant Accounting Policies
Principles of Consolidation
The consolidated financial statements include the accounts of Switch & Data Facilities Company, Inc. and its wholly owned subsidiaries. All significant intercompany balances and transactions were eliminated in consolidation.
Use of Estimates
The preparation of consolidated financial statements in conformity with accounting principles generally accepted in the U.S. requires management to make estimates and assumptions that affect the reported amounts of assets and liabilities and disclosure of contingencies at the date of the consolidated financial statements and the reported amounts of revenues and expenses during the reporting period. Actual results could differ from these estimates.
Fair Value
The Company adopted the guidance associated with fair value accounting as of January 1, 2008. The guidance clarifies the definition of fair value, prescribes methods for measuring fair value, establishes a fair value hierarchy based on the inputs used to measure fair value, and expands disclosures about the use of fair value measurements. The adoption of fair value accounting resulted in a cumulative transition adjustment of $74 that decreased the Company’s derivative liability and increased retained earnings.
The fair value hierarchy has three levels based on the reliability of the inputs used to determine fair value. Level 1 inputs are quoted prices (unadjusted) in active markets for identical assets or liabilities. Level 2 inputs are quoted prices for similar assets and liabilities in active markets or inputs that are observable for the asset or liability, either directly or indirectly through market corroboration, for substantially the full term of the financial instrument. Level 3 inputs are unobservable inputs based on assumptions used to measure assets and liabilities at fair value. A financial asset or liability’s classification within the hierarchy is determined based on the lowest level input that is significant to the fair value measurement.
F-8
SWITCH & DATA FACILITIES COMPANY, INC. AND SUBSIDIARIES
NOTES TO CONSOLIDATED FINANCIAL STATEMENTS—(Continued)
In Thousands, Except Per Common Share Amounts
The following table provides the Company’s assets and liabilities carried at fair value.
| Fair Value of Measurement at December 31, 2008 Using: |
Fair Value of Measurement at December 31, 2009 Using: | |||||||||||||||||
| (in thousands) |
Quoted prices in active markets (Level 1) |
Significant other observable inputs (Level 2) |
Significant unobservable inputs (Level 3) |
Quoted prices in active markets (Level 1) |
Significant other observable inputs (Level 2) |
Significant unobservable inputs (Level 3) | ||||||||||||
| Cash and Cash Equivalents |
$ | 14,706 | $ | — | $ | — | $ | 28,528 | $ | — | $ | — | ||||||
| Derivative liability |
$ | — | $ | 7,434 | $ | — | $ | — | $ | 8,713 | $ | — | ||||||
The following is a description of the Company’s valuation methodology for assets and liabilities measured at fair value:
Cash and Cash Equivalents, accounts receivable net of the allowance for doubtful accounts, other current assets, accounts payable, accrued expenses, and other current liabilities. Cash equivalents are carried at fair value based on quoted market prices in active markets. All other financial instruments are not carried at fair value, but are carried at amounts that approximate fair value due to their short-term nature and generally negligible credit risk.
Interest Rate Swaps. These financial instruments are carried at fair value, calculated as the present value of amounts estimated to be received or paid to a marketplace participant in a selling transaction. These derivatives are valued using a model based on significant other observable inputs (Level 2 inputs). The model utilizes Eurodollar Futures settlement pricing from the Chicago Mercantile Exchange to estimate future LIBOR rates and in turn estimate amounts to be received or paid under the terms of the interest rate swap agreements.
In accordance with generally accepted accounting principles, the Company considers nonperformance risk in calculating fair value adjustments. This includes a credit risk adjustment based on the credit worthiness of the counterparty when the Company is in a gain position, or the Company’s own credit worthiness when the Company is in an unrealized loss position. This assessment of nonperformance risk is generally derived from credit ratings, credit spreads, and other financial analysis. The impact of the nonperformance risk adjustments for the Company’s assets and liabilities carried at fair value was not material at December 31, 2008 and 2009.
The methods described above may produce a fair value that may not be indicative of future fair values. Furthermore, while the Company believes its valuation methods are appropriate and consistent with other market participants, the use of different methodologies, or assumptions, to determine the fair value of certain financial instruments could result in a different estimate of fair value at the reporting date.
Cash and Cash Equivalents
The Company considers all highly liquid investments purchased with original maturities of three months or less to be cash equivalents. Cash equivalents consist primarily of money market instruments.
Property and Equipment
Property and equipment are stated at original cost. The Company commences depreciation when the assets are placed in service. Equipment and furniture are depreciated on a straight-line basis over their estimated useful lives of five to seven years. Leasehold improvements and buildings acquired under capital lease are amortized on
F-9
SWITCH & DATA FACILITIES COMPANY, INC. AND SUBSIDIARIES
NOTES TO CONSOLIDATED FINANCIAL STATEMENTS—(Continued)
In Thousands, Except Per Common Share Amounts
a straight-line basis over the lesser of the term of the related lease (including renewal periods which are reasonably assured) or the estimated life of the asset. Equipment acquired under capital leases are amortized on a straight-line basis over the estimated life of the equipment. Expenditures for improvements that significantly add to productive capacity or extend the useful life of an asset are capitalized. At the time property is retired, or otherwise disposed of, the asset and related accumulated depreciation are removed from the accounts and any resulting gain or loss is included in earnings. Repairs and maintenance costs are expensed when incurred. Prepaid maintenance contracts for property and equipment are amortized over the appropriate service period.
Leases
The Company leases space for its colocation data centers. Such leases are recorded as capital or operating leases in accordance with generally accepted accounting principles.
For leases determined to be capital leases, the assets held under capital lease and related obligations are recorded at the lesser of the present value of aggregate future minimum lease payments or the fair value of the assets held under capital lease.
For leases determined to be operating leases, lease expense is recorded on a straight-line basis over the lease term. Certain leases include renewal options that, at the inception of the lease, are considered reasonably assured of being renewed. Such renewal periods are included in the lease term. The lease term begins when the Company controls the leased property, which is typically before lease payments begin under the terms of the lease. The difference between the expense recorded in the consolidated statements of operations and the amount paid is recorded as deferred rent and is included in the consolidated balance sheets.
Capitalization of Interest
The Company capitalizes interest on projects that qualify for interest capitalization. Capitalized interest is included within construction in progress and is depreciated over the useful lives of the assets once the project is complete.
Goodwill, Intangible Assets and Other Long-Term Assets
Goodwill represents the purchase price, including acquisition related costs for acquisitions in prior years, in excess of the fair values of identifiable tangible and intangible acquired assets and liabilities in business combinations accounted for as purchases. Goodwill is not amortized, but is tested for impairment at least annually. Each year, during the third quarter, the Company tests for impairment of goodwill according to a two-step approach. In the first step, the Company tests for impairment of goodwill by estimating the fair values of each data center using the present value of future cash flows approach. If the carrying amount exceeds the fair value, the second step of the goodwill impairment test is performed to measure the amount of the impairment loss, if any. In the second step, the implied fair value of the goodwill is estimated as the fair value of the data center in the first step less the fair values of all other net tangible and intangible assets of the data center. If the carrying amount of the goodwill exceeds its implied fair market value, an impairment loss is recognized in an amount equal to that excess, not to exceed the carrying amount of goodwill. Goodwill of a data center is also tested for impairment, between annual tests, if an event occurs or circumstances change that would more likely than not reduce the fair value of a data center below its carrying value. The Company completed its review of goodwill reported for each data center during each of 2007, 2008, and 2009, and no impairment was recorded. The Company can provide no assurance that a material impairment charge will not occur in future periods as a result of these analyses.
F-10
SWITCH & DATA FACILITIES COMPANY, INC. AND SUBSIDIARIES
NOTES TO CONSOLIDATED FINANCIAL STATEMENTS—(Continued)
In Thousands, Except Per Common Share Amounts
Other intangible assets consist of customer-based assets recorded through acquisitions or other purchases and are unique to the acquired data center. These assets are amortized using the straight-line method over the shorter of their estimated periods of benefit or the lease term of the acquired data center, ranging from two to 12 years. No residual value is estimated for these assets. Assets are re-evaluated whenever circumstances indicate that revised estimates of useful lives or impairment may be warranted.
Other long-term assets consist of security deposits, costs related to the issuance of debt, and public offering costs. Costs related to the issuance of debt are capitalized and amortized to interest expense using the effective interest method over the life of the related debt. Public offering costs were offset against the gross proceeds of the offering in 2007.
Impairment of Long-Lived Assets
The Company reviews all long-lived assets, which consist primarily of property and equipment and intangible assets, for impairment whenever events or changes in circumstances indicate that the carrying amount of an asset or asset group may not be recoverable. Recoverability of assets to be held and used is measured by a comparison of the carrying amount of an asset or asset group to the future net undiscounted cash flows to be generated by the asset or asset group. Impairment is measured by the amount by which the carrying amount of the assets exceeds their fair value. No impairments were recorded for the periods ended December 31, 2007, 2008, or 2009.
Derivative Financial Instruments
Derivative instruments are recorded in the consolidated balance sheet as either assets or liabilities, measured at fair value. Changes in fair value are recognized in earnings. The Company utilizes interest rate derivatives to convert a portion of its floating rate debt to fixed rate debt and did not elect to apply hedge accounting. The interest rate differentials to be paid or received under such derivatives and the changes in the fair value of the instruments are recognized and recorded as adjustments to interest expense. The principle objectives of the derivative instruments are to minimize the risks and reduce the expenses associated with financing activities. The Company does not use financial instruments for trading purposes.
Customer Security Deposits
The Company collects security deposits from certain customers based on a credit review of the customer. Security deposits are classified as short term when the underlying customer contract is scheduled to renew within the next twelve months or the customer contract has a month-to-month term.
Foreign Currency Translation
The financial statements of the Company’s foreign subsidiary are measured using the local currency as the functional currency. Assets and liabilities of the subsidiary are translated at exchange rates as of the balance sheet date. Revenues and expenses are translated at average rates of exchange in effect during the year. The resulting cumulative translation adjustments have been recorded as a separate component of stockholders’ equity in other comprehensive income for all periods presented in the Company’s financial statements.
Earnings Per Common Share
The Company computes net income (loss) per common share in accordance with generally accepted accounting principles. Under such principles, basic net income (loss) per common share is computed by dividing
F-11
SWITCH & DATA FACILITIES COMPANY, INC. AND SUBSIDIARIES
NOTES TO CONSOLIDATED FINANCIAL STATEMENTS—(Continued)
In Thousands, Except Per Common Share Amounts
the net income (loss) attributable to common stockholders, including both net income (loss) and dividends on preferred instruments, for the period by the weighted average number of common shares outstanding during the period. Diluted net income (loss) per common share is computed by dividing the net income (loss) attributable to common stockholders for the period by the number of common and potential common shares outstanding during the period. During any period when they would be anti-dilutive, potential common shares are not considered in the computations.
Revenue Recognition and Allowance for Doubtful Accounts
The Company generates recurring revenue from providing colocation and interconnection services. More than 90% of its revenues are generated from these recurring revenues. The Company’s remaining revenues are non-recurring and consist primarily of technical support and installation services.
Colocation services are governed by the terms and conditions of a master service agreement. Customers typically execute agreements for one to three year terms. The Company bills customers on a monthly or quarterly basis and recognizes the revenue on a straight-line basis over the life of the agreement. Installation services for such long-term agreements, defined as greater than one month, are recognized on a straight-line basis over the term of the agreement, which the Company believes approximates the life of the customer relationship.
Interconnection services are generally provided on either a month-to-month or one year term under an arrangement separate from those services provided under colocation services. Interconnection services include port and cross connect services. Port services are typically sold on a one year term and revenue is recognized in a manner similar to colocation services. Cross connect services are typically sold on a month-to-month basis. These interconnection services are considered as a separate earnings process that is provided and completed on a month-to-month basis. The Company bills customers on a monthly or quarterly basis and recognizes the revenue in the period the service is provided. Installation service revenue for these cross connect services is recognized in the period when the installation is complete. The earning process from cross connect installation is culminated in the month the installation is complete.
Technical support services are provided primarily on a time and materials basis and are billed and recognized in the period services are provided.
The Company guarantees certain service levels, such as uptime, as outlined in customer contracts. To the extent these service levels are not achieved, the Company reduces revenue for any credits given to the customer. Any service level credits recorded in the periods presented are immaterial.
Revenue is recognized only when the service has been provided and when there is persuasive evidence of an arrangement, the fee is fixed or determinable and collection of the receivable is reasonably assured. The Company regularly assesses collectibility of accounts receivable from customers based on a number of factors, including prior history with the customer and the credit status of the customer. If the Company determines that collection of revenue from a customer is not reasonably assured, the Company does not recognize revenue until collection becomes reasonably assured, which is generally upon receipt of cash. The Company also maintains an allowance for doubtful accounts for accounts receivable for which management believes such receivables are uncollectible. Management analyzes accounts receivable, bankruptcy filings, historical bad debts, customer credit-worthiness and changes in customer payment patterns when evaluating revenue recognition and the adequacy of the Company’s reserves. A specific bad debt reserve is accrued for specifically identifiable receivables that become uncollectible. Another reserve is established for all other accounts receivable based on the age of the invoices. Delinquent account balances are written-off after a determination that the likelihood of collection is not probable.
F-12
SWITCH & DATA FACILITIES COMPANY, INC. AND SUBSIDIARIES
NOTES TO CONSOLIDATED FINANCIAL STATEMENTS—(Continued)
In Thousands, Except Per Common Share Amounts
Stock-Based Compensation
Stock-based compensation expense is measured at the grant date for all stock-based awards made to employees and directors based on the fair value of the award using an option-pricing model and is recognized as an expense over the requisite service period, which is generally the vesting period. As of December 31, 2009, there was $10,549 of unrecognized compensation cost related to non-vested stock-based compensation arrangements granted under the Company’s stock-based compensation plans to be recognized ratably over a weighted average period of less than four years. These costs are recognized ratably over the vesting period. The Company recorded $4,085, $6,314, and $6,292 of compensation expense for the years ended December 31, 2007, 2008, and 2009, respectively.
The Company uses the Black-Scholes option-pricing model to determine the fair value of stock options. The determination of the fair value of stock-based payment awards is based on a number of complex and subjective assumptions. These assumptions include the expected term of the options, a risk-free interest rate, expected dividend yields, and stock price volatility. If factors change and the Company employs different assumptions for estimating stock-based compensation expense in future periods or if it decides to use a different valuation model, the expense in future periods may differ significantly from what the Company has recorded in the current period, which could have a material impact on the consolidated financial statements.
For options granted during the years ended December 31, 2007, 2008, and 2009, the fair value of each option grant was based on the Black-Scholes option-pricing model with the following assumptions:
| For the year ended December 31, | ||||||
| 2007 | 2008 | 2009 | ||||
| Options to non-employees vesting immediately |
||||||
| Expected term of the options |
5.00 years | 5.00 years | 5.00 years | |||
| Risk-free interest rate |
4.70% | 2.88% | 1.89% | |||
| Expected stock price volatility |
81.17% | 61.08% | 61.47% | |||
| Expected dividend yield |
None | None | None | |||
| Options vesting 25% annually over four years |
||||||
| Expected term of the options |
6.25 years | 6.25 years | 6.25 years | |||
| Risk-free interest rate |
3.60% to 4.67% | 2.83% to 3.42% | 2.10% to 3.03% | |||
| Expected stock price volatility |
85.50% to 99.55% | 76.27% to 82.81% | 66.83% to 72.97% | |||
| Expected dividend yield |
None | None | None | |||
As a public company without sufficient option exercise history, the Company estimates the expected term of options granted by taking the weighted average of the vesting period and the contractual term of the option. The Company uses the risk-free interest rate on U.S. Treasury zero-coupon issues with remaining terms similar to the expected term on its equity awards. As a public company without a sufficient history of common stock prices for a period equal to the expected option term, the Company estimates the future stock price volatility of its common stock by using its historical volatility since the Company became public and supplementing the volatility prior to the Company becoming public with the historical volatility of a similar company. The Company believes such an approach best represents its future volatility. The Company does not anticipate paying any cash dividends in the foreseeable future, and therefore, assumed an expected dividend yield of zero in its option-pricing model.
The weighted-average grant date fair value per share was $13.89, $7.86, and $4.19 for stock options granted during 2007, 2008, and 2009, respectively.
F-13
SWITCH & DATA FACILITIES COMPANY, INC. AND SUBSIDIARIES
NOTES TO CONSOLIDATED FINANCIAL STATEMENTS—(Continued)
In Thousands, Except Per Common Share Amounts
Income Taxes
The Company uses the asset and liability method of accounting for income taxes. Under this method, deferred tax assets and liabilities are recognized for the expected tax consequences in future years of differences between the tax bases of assets and liabilities and their financial reporting amounts at year-end using enacted tax rates in effect for the period in which the differences are expected to affect taxable income. Valuation allowances are established, when necessary, to reduce deferred tax assets to the amount that is expected to more likely than not be realized. Income tax expense is the tax payable for the period and the change during the period in deferred tax assets and liabilities. (See Note 7)
Advertising, Promotion and Marketing Expenses
All costs associated with advertising, promotion and marketing are expensed when the related activities occur. Advertising, promotion and marketing expenses for the years ended December 31, 2007, 2008, and 2009, were approximately $1,083, $1,325, and $1,835, respectively, and are included in sales and marketing expenses.
Segment Information
The Company manages its business as one reportable segment. Although the Company provides colocation services in several markets, these operations have been aggregated into one reportable segment based on the similar economic characteristics among all markets, including the nature of the services provided and the type of customers purchasing such services. (See Note 14)
Concentrations of Credit Risk
Concentrations of credit risk generally arise from accounts receivable and cash balances. The Company provides colocation and interconnection services to customers ranging in size from small entrepreneurial entities to national and international corporations. The Company’s data centers are located throughout the U.S. and in Toronto, Ontario, which management believes provides diversification with respect to the Company’s exposure to economic risks in any particular location.
The Company attempts to limit its credit risk associated with cash and cash equivalents by keeping deposits in major financial institutions and periodically monitoring the financial stability of such institutions. Management believes the financial institutions that hold the Company’s cash balances are financially stable and, therefore, credit risk is minimized with respect to these cash balances. At each fiscal year end, cash balances were in excess of Federal Deposit Insurance Corporation (FDIC) insured limits.
Recent Accounting Pronouncements
In October, 2009, the Financial Accounting Standards Board (the “FASB”) issued new guidance regarding accounting for and reporting on multiple-deliverable arrangements. Specifically, the guidance addresses how to separate deliverables and how to measure and allocate arrangement consideration to one or more units of accounting. This guidance is effective prospectively for revenue arrangements entered into or materially modified in fiscal years beginning on or after June 15, 2010. The Company is still evaluating such guidance.
In June 2009, the FASB issued The FASB Accounting Standards Codification (the “Codification”). The Codification is the source of authoritative U.S. GAAP recognized by the FASB to be applied by nongovernmental entities. The Codification is effective for financial statements issued for interim and annual periods ending after September 15, 2009 and was adopted by the Company in September 2009.
F-14
SWITCH & DATA FACILITIES COMPANY, INC. AND SUBSIDIARIES
NOTES TO CONSOLIDATED FINANCIAL STATEMENTS—(Continued)
In Thousands, Except Per Common Share Amounts
In May 2009, new accounting guidance was issued regarding subsequent events. This guidance establishes general standards of accounting and disclosure for events that occur after the balance sheet date but before financial statements are issued. This guidance is effective for interim and annual periods ending after June 15, 2009 and was adopted by the Company in June 2009.
In April 2009, new accounting guidance was issued regarding the estimation of fair value. This guidance provides additional information on estimating fair value when the volume and level of activity for an asset or liability have significantly decreased in relation to normal market activity, as well as additional information on circumstances which may indicate a transaction is not orderly. The guidance requires interim disclosures of the inputs and valuation techniques used to measure fair value reflecting changes in the valuation techniques and related inputs. This guidance is effective prospectively for interim and annual reporting periods ending after June 15, 2009 and was adopted by the Company in June 2009.
In April 2009, new accounting guidance was issued regarding interim disclosures about fair value. This guidance requires that disclosures provide quantitative and qualitative information on fair value estimates for all financial instruments not measured on the balance sheet at fair value, when practicable. This guidance is effective prospectively for interim reporting periods ending after June 15, 2009 and was adopted by the Company in June 2009.
In March 2008, new accounting guidance was issued regarding disclosures about derivative instruments. This new guidance enhances disclosure about how and why a company uses derivatives; how derivative instruments are accounted for; and how derivatives affect a company’s financial position, financial performance, and cash flows. This guidance is effective for financial statements issued for fiscal years and interim periods beginning after November 15, 2008 and was adopted by the Company as of January 1, 2009, as reflected in Note 6.
The adoption of new accounting guidance did not have a material effect on the Company’s consolidated financial statements.
3. Accounts Receivable
Accounts receivable, net, consists of the following:
| December 31, | ||||||||
| 2008 | 2009 | |||||||
| Accounts receivable, gross |
$ | 12,315 | $ | 14,986 | ||||
| Allowance for doubtful accounts |
(818 | ) | (1,056 | ) | ||||
| Accounts receivable, net |
$ | 11,497 | $ | 13,930 | ||||
Additions (reductions) to the allowance for doubtful accounts were approximately ($54), $839, and $1,150 for the years ended December 31, 2007, 2008, and 2009, respectively. Write-offs charged against the allowance were approximately $308, $436 and $912 for the years ended December 31, 2007, 2008, and 2009, respectively.
F-15
SWITCH & DATA FACILITIES COMPANY, INC. AND SUBSIDIARIES
NOTES TO CONSOLIDATED FINANCIAL STATEMENTS—(Continued)
In Thousands, Except Per Common Share Amounts
4. Property and Equipment, Net
Property and equipment consisted of the following:
| December 31, | ||||||||
| 2008 | 2009 | |||||||
| Leasehold improvements |
$ | 207,893 | $ | 246,998 | ||||
| Equipment |
153,332 | 164,520 | ||||||
| Assets under capital lease |
49,619 | 59,620 | ||||||
| Construction in progress |
1,534 | 6,065 | ||||||
| Furniture |
2,655 | 2,731 | ||||||
| Property and equipment, gross |
415,033 | 479,934 | ||||||
| Less: accumulated depreciation |
(144,747 | ) | (182,622 | ) | ||||
| Property and equipment, net |
$ | 270,286 | $ | 297,312 | ||||
The Company capitalized approximately $1,833 and $1,099 of interest related to start-up and expansion projects at its data centers during the years ended December 31, 2008 and 2009, respectively.
Depreciation included in continuing operations for the years ended December 31, 2007, 2008, and 2009 was approximately $18,286, $26,624, and $37,861 respectively. Depreciation associated with assets under capital lease was $345, $1,896 and $2,585 for the years ended December 31, 2007, 2008 and 2009, respectively.
5. Goodwill, Other Intangible Assets and Other Long-Term Assets
Goodwill from previous acquisitions was $36,023 at both December 31, 2008 and 2009.
At December 31, 2008 and 2009 other intangible assets, consisting of customer-based contracts, were as follows:
| December 31, | ||||||||
| 2008 | 2009 | |||||||
| Gross carrying amount |
$ | 36,783 | $ | 36,537 | ||||
| Accumulated amortization |
(18,208 | ) | (21,263 | ) | ||||
| Net carrying amount |
$ | 18,575 | $ | 15,274 | ||||
Amortization of other intangible assets was approximately $7,288, $4,092, and $3,617 for the years ended December 31, 2007, 2008, and 2009, respectively. Future amortization expense on intangible assets is estimated to be approximately $3,419 for fiscal year 2010, $3,193 for fiscal year 2011, $2,585 for fiscal year 2012, $2,383 for fiscal year 2013, $2,340 for fiscal year 2014, and $1,349 thereafter.
Included in other long-term assets, net, on the Consolidated Balance Sheets are debt issuance costs, net, of $3,565 and $4,032 as of December 31, 2008 and 2009, respectively. On March 27, 2008, the Company executed the Fourth Amended and Restated Credit Agreement, and wrote-off previously capitalized debt issuance costs of $599 and capitalized new debt issuance costs of $3,943. On September 4, 2009, the Company executed the First Amendment to the Fourth Amended and Restated Credit Agreement and capitalized new debt issuance costs of $1,388. See Note 6 for further discussion on debt issuance costs.
F-16
SWITCH & DATA FACILITIES COMPANY, INC. AND SUBSIDIARIES
NOTES TO CONSOLIDATED FINANCIAL STATEMENTS—(Continued)
In Thousands, Except Per Common Share Amounts
Amortization of debt issuance costs, included as a component of interest expense, was approximately $417, $667, and $921 for the years ended December 31, 2007, 2008, and 2009, respectively.
6. Long-Term Debt
The Company’s long-term debt consisted of the following:
| December 31, 2008 |
December 31, 2009 |
||||||
| Credit Facility—Total cost of outstanding debt was 6.21% at December 31, 2009. |
$ | 120,000 | $ | 142,500 | |||
| Less current portion |
— | (14,250 | ) | ||||
| Long-term debt |
$ | 120,000 | $ | 128,250 | |||
Accrued interest included in accounts payable and accrued expenses related to long-term debt in the Consolidated Balance Sheets was $2,577 and $719 at December 31, 2008 and 2009, respectively.
On March 27, 2008, the Company entered into a Fourth Amended and Restated Credit Agreement which provided for: (i) a $120,000 term loan (the “Term Loan”); (ii) a $22,500 delayed draw term loan (the “Delayed Draw Term Loan”), to be funded at the option of the Company no later than March 27, 2009; (iii) a $15,000 revolving loan (the “Revolver”); and (iv) the option to request an incremental term loan before March 27, 2009, of up to $50,000 (the “Incremental Term Loan”) subject to the willingness of the lenders to make such loan. On March 28, 2008, the full $120,000 of the Term Loan was funded, of which $38,189 was used to refinance the $38,189 of term debt remaining outstanding under the Company’s previous credit agreement. On January 5, 2009, the Company borrowed $22,500 under the Delayed Draw Term Loan. The Incremental Term Loan expired unused on March 27, 2009.
On September 4, 2009, the Company entered into the First Amendment to the Fourth Amended and Restated Credit Agreement (as amended, the “Credit Facility”) which, among other things, provided the Company with an additional delayed draw term loan of up to $100,000 (the “Additional Delayed Draw Term Loan”).
Total fees incurred for the First Amendment to the Fourth Amended and Restated Credit Agreement were $1,425 of which $1,388 were capitalized and $37 were expensed.
As of December 31, 2009, no borrowings had occurred under the Revolver or the Additional Delayed Draw Term Loan. A $1,400 letter of credit has been issued under the Revolver as a security deposit.
The proceeds of the Credit Facility not used to refinance the $38,189 of term debt must be used for working capital, general corporate purposes, and for capital expenditures of the Company.
Substantially all of the assets of the Company and its restricted subsidiaries are pledged as collateral under the Credit Facility. Interest under the Term Loan, the Revolver, the Delayed Draw Term Loan and the Additional Delayed Draw Term Loan is paid at a rate equal to: (i) 2.5% to 3.5% above the alternate base rate (which is equal to the greater of the administrative agent’s prime rate, 0.5% above the federal funds rate, and 3.0% per annum) or (ii) 3.5% to 4.5% above the adjusted LIBOR rate, (which is equal to the greater of the LIBOR rate for such interest period and 2.0% per annum); where in each case the applicable margin changes based on the Company’s consolidated total leverage ratio. The current rate of interest is 3.0% above the alternate base rate or 4.0% above the LIBOR rate. The Company also pays unused facility fees equal to 0.5% per annum on the unused portion of the Revolver and 1.0% on the Additional Delayed Draw Term Loan.
F-17
SWITCH & DATA FACILITIES COMPANY, INC. AND SUBSIDIARIES
NOTES TO CONSOLIDATED FINANCIAL STATEMENTS—(Continued)
In Thousands, Except Per Common Share Amounts
The Credit Facility requires compliance with various financial covenant ratios, including a consolidated total leverage ratio, a consolidated senior leverage ratio, an annualized consolidated interest coverage ratio, an annualized consolidated fixed charge coverage ratio, and a maximum capital expenditure limit.
The Credit Facility requires that the Company comply with certain other covenants which, among other things, restrict the Company’s ability to incur additional debt, pay dividends and make other restricted payments, sell assets, enter into affiliate transactions and take other actions. The breach of any of these covenants could result in a default and, if not cured within any applicable cure period or waived by the lenders, could trigger acceleration of repayment and the exercise of remedies against the collateral and otherwise. The Company was in compliance with all covenants as of December 31, 2009.
Borrowings under the Revolver are available until September 26, 2013. Borrowings under the Additional Delayed Draw Term Loan are available until September 4, 2010. Repayments of principal under the Term Loan and the Delayed Draw Term Loan are due in scheduled quarterly installments, beginning March 31, 2010, with the final payment due and payable on March 27, 2014. Quarterly payments of principal outstanding under the Additional Delayed Draw Term Loan, if any, will commence on March 31, 2011. Each of the quarterly payments through December 31, 2011 will be equal to 2.5% of the aggregate principal amount of the Additional Delayed Draw Term Loan, with the percentage increasing to 5.0% for payments beginning March 31, 2012 through December 31, 2012, 10.0% for payments beginning March 31, 2013 through December 31, 2013, and 30.0% for the payment on March 27, 2014. All outstanding amounts under the Revolver will be due and payable on September 27, 2013. As of December 31, 2009, scheduled maturities of the Term Loan for the next five years are as follows:
| Year |
Amount | ||
| 2010 |
14,250 | ||
| 2011 |
28,500 | ||
| 2012 |
28,500 | ||
| 2013 |
57,000 | ||
| 2014 |
14,250 | ||
| Total |
$ | 142,500 | |
At December 31, 2008 and 2009, the fair value of the Company’s debt was estimated at $120,000 and $142,500, respectively, which approximates the carrying value.
Capital Lease Obligation
In August 2007, the Company recorded a capital lease for a data center in Sunnyvale, California. Monthly payments under the capital lease commenced in August 2007 and will be made through July 2032, at an effective interest rate of 8.36% per annum. In February 2008, the Company recorded a capital lease for a data center in North Bergen, New Jersey. Monthly payments under the capital lease commenced in August 2008 and will be made through July 2033, at an effective interest rate of 9.85% per annum.
During 2009, the Company recorded capital leases totaling $10,001 for data center equipment. Monthly payments under these capital leases commenced in July 2009 and will be made through March 2014, at a weighted average effective interest rate of 7.0% per annum.
F-18
SWITCH & DATA FACILITIES COMPANY, INC. AND SUBSIDIARIES
NOTES TO CONSOLIDATED FINANCIAL STATEMENTS—(Continued)
In Thousands, Except Per Common Share Amounts
As of December 31, 2009, the present value of total capital lease obligations was $60,298. As of December 31, 2009, future minimum lease payments, for the next five years and thereafter are as follows:
| Year |
Amount | |||
| 2010 |
$ | 7,033 | ||
| 2011 |
7,085 | |||
| 2012 |
7,139 | |||
| 2013 |
7,331 | |||
| 2014 |
5,602 | |||
| Thereafter |
108,586 | |||
| Total future minimum capital lease payments |
142,776 | |||
| Less: interest component of capital lease payments |
(82,478 | ) | ||
| Present value of minimum capital lease payments |
60,298 | |||
| Less: current portion of capital lease obligations |
(1,934 | ) | ||
| Long-term capital lease obligations |
$ | 58,364 | ||
Accrued interest included in accounts payable and accrued expenses related to capital lease obligations in the Consolidated Balance Sheets was $392 and $394 at December 31, 2008 and 2009, respectively.
Interest Rate Derivatives
The Credit Facility requires the Company to fix its floating interest rate on no less than 50% of the principal of the Credit Facility. The Company utilizes interest rate swap agreements to manage its exposure to fluctuations in interest rates. These agreements are recorded at fair value, and the changes in fair value are included in interest expense. The Company does not elect hedge accounting on any of these agreements. The fair value of these agreements is reflected in a separate line item on the Consolidated Balance Sheets.
In March 2005, the Company entered into an interest rate swap agreement on a notional value of $15,000. There was no up-front cost for this agreement. The contract states that the Company pays 3.97% from July 2005 through June 2006 and 4.48% from July 2006 through June 2007. The counterparty either paid to the Company or received from the Company the difference between actual LIBOR and the contracted rate.
In November 2005, the Company entered into an interest rate swap agreement with a notional value of $70,000. There was no up-front cost for this agreement. The agreement states that the Company pays 4.76% from February 2006 through February 2009. The counterparty either pays to the Company or receives from the Company the difference between the actual LIBOR rate and the contracted rate of 4.76%.
In August 2008, the Company entered into an interest rate swap agreement with a notional value of $75,000 (the “August Swap”). There was no up-front cost for this agreement. The agreement states that the Company pays 4.07% from February 2009 through February 2012. The counterparty either pays to the Company or receives from the Company the difference between the actual LIBOR rate and the contracted rate of 4.07%.
In October 2008, the Company entered into an interest rate swap agreement with a notional value of $45,000 (the “October Swap”). There was no up-front cost for this agreement. The agreement states that the Company pays 3.10% from February 2009 through February 2012. The counterparty either pays to the Company or receives from the Company the difference between the actual LIBOR rate and the contracted rate of 3.10%.
F-19
SWITCH & DATA FACILITIES COMPANY, INC. AND SUBSIDIARIES
NOTES TO CONSOLIDATED FINANCIAL STATEMENTS—(Continued)
In Thousands, Except Per Common Share Amounts
In January 2009, the Company cancelled the August Swap and the October Swap agreements. There was no up-front cost to cancel these swaps. The Company then entered into a single interest rate swap agreement with a notional value of $120,000. There was no up-front cost for this agreement. The agreement states that the Company pays 1.71% from February 2009 through February 2010 and 4.99% from February 2010 through February 2012. The counterparty either pays to the Company or receives from the Company the difference between the actual LIBOR rate and the contracted rates for the given periods.
The fair value of the interest rate derivative represents the estimated receipts or payments that would be made to terminate the agreement prior to expiration. As of December 31, 2008, and 2009, the Company recorded interest rate derivative liabilities to the balance sheet of approximately $7,434 and $8,713, respectively. The change in fair value of approximately $1,184, $6,811, and $1,279 is recorded as an increase in interest expense in the Consolidated Statements of Operations for the years ended December 31, 2007, 2008, and 2009, respectively.
7. Income Taxes
Income (loss) before incomes taxes is attributable to the following geographic locations as follows:
| For the year ended December 31, | |||||||||||
| 2007 | 2008 | 2009 | |||||||||
| United States |
$ | (1,548 | ) | $ | (4,719 | ) | $ | 1,002 | |||
| Foreign |
628 | (992 | ) | 660 | |||||||
| Income (loss) from continuing operations before income taxes |
$ | (920 | ) | $ | (5,711 | ) | $ | 1,662 | |||
The provision for income taxes for the years ended December 31, 2007, 2008, and 2009 consists of the following:
| For the year ended December 31, | ||||||||||
| 2007 | 2008 | 2009 | ||||||||
| Current: |
||||||||||
| Federal |
$ | 149 | $ | 210 | $ | (153 | ) | |||
| Foreign |
36 | 688 | 677 | |||||||
| State |
78 | 426 | 671 | |||||||
| 263 | 1,324 | 1,195 | ||||||||
| Deferred: |
||||||||||
| Federal |
— | — | 52 | |||||||
| Foreign |
— | — | — | |||||||
| State |
— | — | 7 | |||||||
| — | — | 59 | ||||||||
| Provision for income taxes |
$ | 263 | $ | 1,324 | $ | 1,254 | ||||
There were no net deferred income tax provisions for the years ended December 31, 2007 and 2008. The Company recorded a deferred tax liability of $59 for the year ended December 31, 2009. This deferred tax liability is included in accounts payable and accrued expenses in the consolidated financial statements.
F-20
SWITCH & DATA FACILITIES COMPANY, INC. AND SUBSIDIARIES
NOTES TO CONSOLIDATED FINANCIAL STATEMENTS—(Continued)
In Thousands, Except Per Common Share Amounts
As of December 31, 2009, the Company had a federal net operating loss carry forward (“NOL”) of approximately $110,909 and an alternative minimum tax credit of $65 available to reduce future federal income taxes. The NOL will begin to expire in 2022 and the alternative minimum tax credit does not expire.
The components of the Company’s deferred tax assets and liabilities as of December 31, 2008 and 2009 are as follows:
| December 31, | ||||||||
| 2008 | 2009 | |||||||
| Current deferred tax assets |
||||||||
| Deferred rent |
$ | 173 | $ | 126 | ||||
| Unearned revenue |
1,126 | 947 | ||||||
| Accrued expenses |
3,820 | 3,837 | ||||||
| 5,119 | 4,910 | |||||||
| Less: Valuation allowance |
4,945 | 2,568 | ||||||
| Net current deferred tax assets |
174 | 2,342 | ||||||
| Non-current deferred tax assets |
||||||||
| Net operating loss carryforwards |
19,388 | 40,374 | ||||||
| State depreciation |
— | 3,926 | ||||||
| Non-qualified stock options |
1,411 | 2,500 | ||||||
| Deferred rent |
7,034 | 9,874 | ||||||
| Unearned revenue |
578 | 435 | ||||||
| Leases accounted for as operating for tax purposes |
— | 706 | ||||||
| Other |
598 | 265 | ||||||
| 29,009 | 58,080 | |||||||
| Non-current deferred tax liabilities |
||||||||
| Intangible assets |
(562 | ) | (19 | ) | ||||
| Property and equipment |
(600 | ) | (30,059 | ) | ||||
| (1,162 | ) | (30,078 | ) | |||||
| Net non-current deferred tax assets |
27,847 | 28,002 | ||||||
| Less: Valuation allowance |
28,021 | 30,403 | ||||||
| Net non-current deferred tax assets |
(174 | ) | (2,401 | ) | ||||
| Net deferred taxes |
$ | — | $ | (59 | ) | |||
The Company provides a valuation allowance against net deferred tax assets if, based on the weight of available evidence, it is more likely than not that some or all of the deferred tax assets will not be realized.
F-21
SWITCH & DATA FACILITIES COMPANY, INC. AND SUBSIDIARIES
NOTES TO CONSOLIDATED FINANCIAL STATEMENTS—(Continued)
In Thousands, Except Per Common Share Amounts
The changes in the valuation allowance account for the net deferred tax assets are as follows:
| 2007 | 2008 | 2009 | |||||||
| Balance at January 1 |
$ | 32,030 | $ | 32,829 | $ | 32,966 | |||
| Additions charged to costs and expenses |
799 | 137 | 5 | ||||||
| Balance at December 31 |
$ | 32,829 | $ | 32,966 | $ | 32,971 | |||
The Company’s effective income tax rate was (50.4)%, (23.2)%, and 75.6% for the years ended December 31, 2007, 2008, and 2009, respectively. The following table accounts for the differences between the actual tax provision and amounts obtained by applying the statutory U.S. federal income tax rate of 35% to the pretax income (loss) for the years ended December 31, 2007, 2008, and 2009:
| 2007 | 2008 | 2009 | ||||||||||
| Statutory benefit |
$ | (183 | ) | $ | (1,999 | ) | $ | 582 | ||||
| State Taxes Net of Federal Benefit |
50 | 277 | 344 | |||||||||
| Foreign Statutory Rate Difference |
65 | 11 | (14 | ) | ||||||||
| Non Deductible Expenses/Other |
(468 | ) | 683 | 1,986 | ||||||||
| Change in valuation allowance |
799 | 137 | 5 | |||||||||
| Deferred taxes on earnings of state, foreign subsidiaries, and other |
— | 2,215 | (1,649 | ) | ||||||||
| Provision for Income Taxes |
$ | 263 | $ | 1,324 | $ | 1,254 | ||||||
The Company files income tax returns in the U.S. federal jurisdiction, and various U.S. states and foreign jurisdictions. With certain exceptions, the Company is no longer subject to U.S. federal, state, and foreign income tax examination for years before 2005.
The Company adopted the generally accepted accounting principles related to uncertainty in income taxes on January 1, 2007. The Company is currently under examination by the state of New York regarding income taxes. The Company does not anticipate adjustments from this audit would result in a material change to its financial position. As a result of such adoption and such examination, the Company recognized an $82 increase in the current liability for unrecognized tax benefits, which was accounted for as a reduction to the January 1, 2007, balance of retained earnings. Approximately $63 was accrued in current liabilities in prior years for this same tax position. If recognized, the total amount of the unrecognized tax benefit will impact the effective tax rate. A reconciliation of the beginning and ending amount of unrecognized tax benefits is as follows:
| For the year ended December 31, | |||||||||
| 2007 | 2008 | 2009 | |||||||
| Balance at January 1, |
$ | 145 | $ | 145 | $ | 154 | |||
| Additions based on tax positions related to the current year |
— | — | — | ||||||
| Additions for tax positions of prior years |
— | — | — | ||||||
| Additions for interest and penalties for prior tax positions |
— | 9 | 9 | ||||||
| Reductions for tax positions of prior years |
— | — | — | ||||||
| Settlements |
— | — | — | ||||||
| Balance at December 31, |
$ | 145 | $ | 154 | $ | 163 | |||
F-22
SWITCH & DATA FACILITIES COMPANY, INC. AND SUBSIDIARIES
NOTES TO CONSOLIDATED FINANCIAL STATEMENTS—(Continued)
In Thousands, Except Per Common Share Amounts
The Company accrued approximately $33 for the payment of interest and penalties on January 1, 2007. An additional $9 and $9 of interest was accrued during 2008 and 2009, respectively, which is included as a component of the unrecognized tax benefit noted above. The Company’s policy is to now recognize interest and penalties as components of pretax income (loss).
The Company estimates that unrecognized tax benefits as of December 31, 2009 will be resolved with the settlement of audits in the next twelve months.
8. Income (Loss) Per Common Share
The weighted average share calculation for the year ended December 31, 2007, includes the Predecessor’s shares outstanding through February 13, 2007, and the Successor’s shares issued in connection with the initial public offering outstanding from February 13, 2007.
The loss attributable to common stockholders for the year ended December 31, 2007, includes $1,734 of accretion on preferred stock for the period between January 1, 2007 and February 13, 2007, the date of reorganization and a $225,788 deemed dividend, which represents the difference in carrying value of the Predecessor’s preferred stock that was converted into the Successor’s common stock and the fair market value of such common stock.
The following table sets forth the detail for the computation of basic and diluted income (loss) per common share attributable to common stockholders.
| For the years ended December 31, | |||||||||||
| 2007 | 2008 | 2009 | |||||||||
| Numerator: |
|||||||||||
| Income (loss) from continuing operations |
$ | (1,183 | ) | $ | (7,035 | ) | $ | 408 | |||
| Less preferred stock accretions and dividends |
(227,522 | ) | — | — | |||||||
| Income (loss) from continuing operations attributable to common stockholders |
$ | (228,705 | ) | $ | (7,035 | ) | $ | 408 | |||
| Income from discontinued operations |
397 | — | — | ||||||||
| Net income (loss) attributable to common stockholders |
$ | (228,308 | ) | $ | (7,035 | ) | $ | 408 | |||
| Denominator: |
|||||||||||
| Weighted average common shares outstanding—basic |
41,626 | 34,369 | 34,569 | ||||||||
| Weighted average common shares outstanding—diluted |
41,626 | 34,369 | 35,330 | ||||||||
| Net income (loss) per common share basic: |
|||||||||||
| Continuing operations attributable to common stockholders |
$ | (5.49 | ) | $ | (0.20 | ) | $ | 0.01 | |||
| Discontinued operations |
$ | 0.01 | $ | — | $ | — | |||||
| Net income (loss) attributable to common stockholders |
$ | (5.48 | ) | $ | (0.20 | ) | $ | 0.01 | |||
| Net income (loss) per common share diluted: |
|||||||||||
| Continuing operations attributable to common stockholders |
$ | (5.49 | ) | $ | (0.20 | ) | $ | 0.01 | |||
| Discontinued operations |
$ | 0.01 | $ | — | $ | — | |||||
| Net income (loss) attributable to common stockholders |
$ | (5.48 | ) | $ | (0.20 | ) | $ | 0.01 | |||
F-23
SWITCH & DATA FACILITIES COMPANY, INC. AND SUBSIDIARIES
NOTES TO CONSOLIDATED FINANCIAL STATEMENTS—(Continued)
In Thousands, Except Per Common Share Amounts
The following table provides the detail of potential common shares that are not included in the diluted net income (loss) per share calculation because these shares are anti-dilutive:
| For the years ended December 31, | ||||||
| 2007 | 2008 | 2009 | ||||
| Common stock options |
2,162 | 2,708 | 2,044 | |||
9. Common stock, Series B Common stock, Special Junior stock and Preferred stock
Predecessor Shares
The Predecessor had nine classes of capital stock outstanding—Common stock; Series B Common stock; Series A Special Junior stock; Series B Special Junior stock; Series C Special Junior stock; Series B Convertible Preferred (“Series B”) stock; Series C Redeemable Preferred (“Series C”) stock; Series D Redeemable Preferred (“Series D”) stock; Series D-1 Preferred stock; and Series D-2 Preferred stock. These classes generally differed with respect to their relative priority regarding distributions and other rights. Each class of capital stock had voting rights, other than Series C Redeemable Preferred stock. The Special Junior stock was issued to certain employees pursuant to compensation arrangements established by the Predecessor’s Board of Directors.
The Series B stock carried a cumulative dividend of 8.0% compounded semi-annually through accretion adjustments to accumulated deficit in stockholder’s equity (deficit). The Series B stock accreted $1,734 for the year ended December 31, 2007.
On February 13, 2007, in connection with the initial public offering, the Company completed a reorganization whereby stockholders of the Predecessor received 24,807 shares of the Company’s Common stock in exchange for their shares of the Predecessor’s capital stock. Pursuant to an investors agreement entered into between the Company and virtually all of its stockholders, 55,252 shares of the Predecessor were exchanged for 24,807 common shares of the Successor. Shares of the Company’s Common stock were allocated as follows to the Predecessor’s stockholders:
| Predecessor Class |
Number of Shares | |
| Series D-1 Preferred stock |
15,111 | |
| Series D-2 Preferred stock |
1,559 | |
| Series C Redeemable Preferred stock |
2,395 | |
| Series B Convertible Preferred stock |
5,742 | |
| Common stock |
— | |
| Series B Common stock |
— | |
| Series A Special Junior stock |
— | |
| Series B Special Junior stock |
— | |
| Series C Special Junior stock |
— | |
| Total |
24,807 | |
F-24
SWITCH & DATA FACILITIES COMPANY, INC. AND SUBSIDIARIES
NOTES TO CONSOLIDATED FINANCIAL STATEMENTS—(Continued)
In Thousands, Except Per Common Share Amounts
Successor Shares
The holders of common stock are entitled to one vote per share on all matters to be voted on by the stockholders. Subject to preferences that may be applicable to any outstanding preferred stock, the holders of common stock are entitled to receive ratably such dividends, if any, as may be declared from time to time by the Board of Directors out of funds legally available for payment of dividends. In the event of a liquidation, dissolution, or winding up of the Company, the holders of common stock are entitled to share ratably in all assets remaining after payment of liabilities, subject to prior distribution rights of preferred stock, if any, then outstanding.
On February 8, 2007, 9,000 shares of common stock were sold to the public through an initial public offering. From February 8, 2007 to December 31, 2009, 930 common stock options were exercised.
No dividends were declared during 2007, 2008, or 2009 for the holders of common stock.
The Company has also authorized 25,000 shares of preferred stock for future issuance.
10. Stock Based Compensation
Series D-2 Preferred stock options
The Predecessor granted Series D-2 Preferred stock options to employees in 2003 and 2004 under the 2003 Stock Incentive Plan. The Predecessor also granted options to two directors in 2003. The exercise price of the options granted in 2003 was $0.01 per option, and the exercise price of the options granted in 2004 was $27.69 per option. No D-2 Preferred stock options have been granted since.
The options vested at the rate of 25% on the first anniversary of the grant date and 6.25% for each three month period thereafter until the options were fully vested. Certain members of senior management received options that vested 25% at the date of grant and 6.25% for each three month period thereafter until the options were fully vested. These vesting periods were established by the Board of Directors at the date of grant. Options expire ten years after the date of grant or when an individual ceases to be an employee of the Company.
In connection with the reorganization, the Series D-2 Preferred stock options were required by the 2003 Stock Incentive Plan to be converted into common stock options of the Successor, at the same ratio as the D-2 Preferred stock pursuant to the terms of the reorganization. The exercise price was also converted to maintain an equitable fair value for the option holder. The vesting period and contractual term were not changed. As the modification of the Series D-2 Preferred stock options was required by the 2003 Stock Incentive Plan, no incremental compensation expense was incurred.
A summary of the activity related to Series D-2 Preferred stock options is presented below:
| Number of Shares |
Weighted Average Exercise Price | |||||
| Outstanding as of December 31, 2006 |
194 | $ | 21.97 | |||
| Options granted |
— | $ | — | |||
| Options exercised |
(6 | ) | $ | 0.06 | ||
| Options cancelled |
— | $ | — | |||
| Options cancelled for conversion |
(188 | ) | $ | 22.71 | ||
| Outstanding as of December 31, 2007, 2008, and 2009 |
— | $ | — | |||
F-25
SWITCH & DATA FACILITIES COMPANY, INC. AND SUBSIDIARIES
NOTES TO CONSOLIDATED FINANCIAL STATEMENTS—(Continued)
In Thousands, Except Per Common Share Amounts
Common stock options
The common stock options of the Predecessor under the 2001 Stock Incentive Plan were cancelled as part of the reorganization in February 2007. No options had ever been exercised under this plan.
In January 2007, the Board of Directors approved the 2007 Stock Incentive Plan (the “Plan”) and authorized 5,133 shares of the Company’s common stock to be reserved for issuance to employees, consultants or directors pursuant to the terms of the Plan. Of such shares, 1,346 were allocated to the conversion of D-2 Preferred stock options as discussed above.
During the year ended December 31, 2007, the Company granted 1,341 common stock options with a weighted average exercise price of $17.15 per share to employees and non-employee directors. Approximately 1,316 of the common stock options were granted to employees. Non-employee directors received a total of 25 common stock options.
During the year ended December 31, 2008, the Company granted 943 common stock options with a weighted average exercise price of $10.95 per share to employees and non-employee directors. Approximately 858 were granted to employees. Non-employee directors received a total of 85 common stock options.
During the year ended December 31, 2009, the Company granted 622 common stock options with a weighted average exercise price of $6.42 per share to employees and non-employee directors. Approximately 587 were granted to employees. Non-employee directors received a total of 35 common stock options.
Options granted to employees vest at a rate of 25% on the first anniversary of the grant date and 25% annually until the common stock options are fully vested. Options granted to non-employee directors vest immediately. All vesting periods were established by the Board of Directors at the date of grant.
Common stock options expire ten years after the date of grant or when an individual ceases to be an employee of the Company. Compensation expense for these common stock options will be recognized over the vesting period.
F-26
SWITCH & DATA FACILITIES COMPANY, INC. AND SUBSIDIARIES
NOTES TO CONSOLIDATED FINANCIAL STATEMENTS—(Continued)
In Thousands, Except Per Common Share Amounts
A summary of the common stock option activity of the Plan between December 31, 2006, and December 31, 2009, is presented below:
| Number of Shares |
Weighted Average Exercise Price | |||||
| Outstanding as of December 31, 2006 |
— | $ | — | |||
| Options issued for Series D-2 Preferred stock options conversion |
1,346 | $ | 3.01 | |||
| Options granted |
1,341 | $ | 17.15 | |||
| Options exercised |
(505 | ) | $ | 2.57 | ||
| Options forfeited or cancelled |
(20 | ) | $ | 16.97 | ||
| Outstanding as of December 31, 2007 |
2,162 | $ | 11.76 | |||
| Options granted |
943 | $ | 10.95 | |||
| Options exercised |
(252 | ) | $ | 3.96 | ||
| Options forfeited or cancelled |
(145 | ) | $ | 13.58 | ||
| Outstanding as of December 31, 2008 |
2,708 | $ | 12.10 | |||
| Options granted |
622 | $ | 6.42 | |||
| Options exercised |
(173 | ) | $ | 13.99 | ||
| Options forfeited or cancelled |
(71 | ) | $ | 12.35 | ||
| Outstanding as of December 31, 2009 |
3,086 | $ | 10.85 | |||
A summary of the nonvested shares activity between December 31, 2006, and December 31, 2009, is presented below.
| Nonvested Common Stock Options |
Weighted Average Grant Date Fair Value Per Option | |||||
| Nonvested at December 31, 2006 |
— | $ | — | |||
| Nonvested options issued for Series D-2 Preferred stock options |
172 | $ | 0.57 | |||
| Options granted |
1,341 | $ | 13.89 | |||
| Vested |
(171 | ) | $ | 2.13 | ||
| Forfeited |
(20 | ) | $ | 13.87 | ||
| Nonvested at December 31, 2007 |
1,322 | $ | 12.33 | |||
| Options granted |
943 | $ | 7.86 | |||
| Vested |
(383 | ) | $ | 12.62 | ||
| Forfeited |
(130 | ) | $ | 10.28 | ||
| Nonvested at December 31, 2008 |
1,752 | $ | 11.06 | |||
| Options granted |
622 | $ | 4.19 | |||
| Vested |
(550 | ) | $ | 10.95 | ||
| Forfeited |
(50 | ) | $ | 8.46 | ||
| Nonvested at December 31, 2009 |
1,774 | $ | 8.76 | |||
F-27
SWITCH & DATA FACILITIES COMPANY, INC. AND SUBSIDIARIES
NOTES TO CONSOLIDATED FINANCIAL STATEMENTS—(Continued)
In Thousands, Except Per Common Share Amounts
The following table summarizes information about common stock options outstanding under the Plan as of December 31, 2009:
| Exercise Price |
Number of Options |
Weighted Average Remaining Contractual Life | ||
| $0.00–$4.00 |
577 | 4.22 | ||
| $4.01–$8.00 |
566 | 9.15 | ||
| $8.01–$12.00 |
783 | 8.21 | ||
| $12.01–$16.00 |
49 | 9.21 | ||
| $16.01–$20.00 |
1,111 | 7.20 | ||
| Total options outstanding |
3,086 | 7.29 | ||
| Total options exerciseable |
1,312 | 6.09 | ||
The aggregate intrinsic value of options outstanding as of December 31, 2009 was $28,891. The aggregate intrinsic value of options exercisable as of December 31, 2009, was $13,643.
Restricted Stock
The following table summarizes the changes in restricted stock awards for the year ended December 31, 2009:
| Performance Based Restricted Stock |
Weighted Average Grant Date Fair Value Per Share | ||||
| Performance-based restricted stock at December 31, 2008 |
— | $ | — | ||
| Shares granted |
205 | $ | 5.84 | ||
| Shares vested |
— | $ | — | ||
| Shares forfeited |
— | $ | — | ||
| Performance-based restricted stock at December 31, 2009 |
205 | $ | 5.84 | ||
The aggregate intrinsic value of restricted stock outstanding as of December 31, 2009 was $4,143.
F-28
SWITCH & DATA FACILITIES COMPANY, INC. AND SUBSIDIARIES
NOTES TO CONSOLIDATED FINANCIAL STATEMENTS—(Continued)
In Thousands, Except Per Common Share Amounts
11. Discontinued Operations and Other Dispositions
The lease for a data center in Chicago expired on February 28, 2007, and was not renewed. The lease for a data center in Kansas City expired on September 30, 2007, and was not renewed. Both data centers met the criteria for classification as discontinued operations. As such, the income associated with these data centers is reflected as discontinued operations in the Company’s results of operations as follows:
| For the year ended December 31, | |||||||||
| 2007 | 2008 | 2009 | |||||||
| Income from operations of discontinued facilities |
$ | 397 | $ | — | $ | — | |||
12. Commitments and Contingencies
Lease Payments
The Company and its subsidiaries are engaged in the operation of network-neutral data centers, which are held under non-cancelable operating leases expiring at various dates through 2025. Certain of these non-cancelable operating leases provide for renewal options. Total rent expense was $24,185, $29,539, and $35,452 for the years ended December 31, 2007, 2008, and 2009, respectively.
As of December 31, 2009, future minimum lease payments under these non-cancelable operating leases for the next five years and thereafter are approximately as follows:
| Year |
Amount | ||
| 2010 |
$ | 32,276 | |
| 2011 |
32,117 | ||
| 2012 |
31,965 | ||
| 2013 |
32,728 | ||
| 2014 |
30,754 | ||
| Thereafter |
195,822 | ||
| Total minimum lease payments |
$ | 355,662 | |
Power Purchase Commitments
In a limited number of our data centers, we enter into power purchase agreements to fix the price at which we acquire electricity. Such agreements are entered into on a normal purchase, normal sale basis. As of December 31, 2009, future payments under such agreements are estimated to be $2,011, $598, and $161 for the years 2010, 2011, and 2012, respectively.
Legal Proceedings
Lease Litigation—Closed
On May 31, 2006, the Company and Switch & Data Facilities Company, LLC, a subsidiary of the Company, were served with a lawsuit alleging a failure by the Company or its subsidiary to execute a lease in October 2000 for a building in Milwaukee, Wisconsin. Plaintiffs claimed the rent and associated lease charges due for the entire ten year term of the lease was $3,666. Plaintiffs also claimed a $750 loss on the sale of the building and
F-29
SWITCH & DATA FACILITIES COMPANY, INC. AND SUBSIDIARIES
NOTES TO CONSOLIDATED FINANCIAL STATEMENTS—(Continued)
In Thousands, Except Per Common Share Amounts
$200 in attorney fees. Management believed there was a range of likely outcomes and had accrued $150 in connection with such litigation. On May 21, 2009, the Company agreed to pay $850 to the plaintiffs, in exchange for a full settlement agreement and the execution of a mutual full and complete release of all claims which were raised or could have been raised in the referenced matter. The settlement amount was paid in May 2009 and the case was dismissed with prejudice.
Litigation Related to the Proposed Merger with Equinix
On October 27, 2009, a purported stockholder class action lawsuit was filed in the Delaware Chancery Court against Switch and Data, members of Switch and Data’s board of directors, Sundance Acquisition Corporation and Equinix. The lawsuit, Gibbs v. Switch & Data Facilities Company, Inc., et al. (Case No. 5027-VCS), alleged that the members of Switch and Data’s board of directors breached their fiduciary duties to Switch and Data stockholders in connection with the Merger by, among other things, entering into the Merger Agreement without first taking steps to obtain adequate, fair and maximum consideration for stockholders, by structuring the transaction to benefit themselves and by including provisions intended to dissuade other potential suitors from making competing offers. The complaint also alleged that Switch and Data and Equinix aided and abetted those supposed breaches of duty. The complaint sought various forms of relief, including but not limited to an injunction prohibiting the consummation of the Merger.
On October 30, 2009, a second purported stockholder class action lawsuit, Jiannaras v. Switch & Data Facilities Company, Inc., et al. (Case No. 09-CA-027950), was filed against the same defendants in a Hillsborough County, Florida state court. The complaint alleges that the members of Switch and Data’s board of directors breached their fiduciary duties to Switch and Data stockholders by, among other things, failing to take steps to maximize Switch and Data’s value to its public stockholders, failing to value properly Switch and Data, failing to protect against the directors’ conflicts of interest, and failing to disclose all material information to allow a fully informed vote by the stockholders. Specifically, plaintiffs contended that the defendants timed the merger to take advantage of the recent downturn in our share price to sell us at an illusory premium that did not reflect our financial performance, thereby depriving our stockholders of the true value of their shares and allowing defendants to reap disproportionate benefits to themselves instead of maximizing stockholder value. Plaintiffs further asserted that Switch and Data and Equinix aided and abetted the alleged breaches of duty by our directors. The complaint sought various relief, including but not limited to an injunction prohibiting the consummation of the Merger.
On December 7, 2009, a third purported stockholder class action lawsuit, Broadbased Equities v. Keith Olsen, et al. (Case No. 8:09-CV-02473), was filed against the same defendants (other than Sundance Acquisition Corporation, which was not named) in the United States District Court for the Middle District of Florida. The complaint alleges that the defendants have provided materially incomplete information to Switch and Data’s stockholders in the Proxy Statement, that the Switch and Data’s Chief Executive Officer and President sought to advance his own interests at the expense of Switch and Data’s stockholders in connection with the Merger, and that Switch and Data’s directors breached their fiduciary duties in connection with the Merger, including by agreeing to provisions in the Merger Agreement intended to dissuade other potential suitors from making competing offers. The complaint also alleged that Equinix aided and abetted those supposed breaches of duty. The complaint sought various forms of relief, including but not limited to an injunction prohibiting the consummation of the Merger.
On January 19, 2010, counsel for parties in all three lawsuits entered into a memorandum of understanding in which they agreed upon the terms of a settlement of all lawsuits. In connection with this settlement, the three lawsuits and all claims asserted therein would be dismissed with prejudice, including the claims brought against Switch and Data and its directors. The parties will seek approval of the settlement in the Florida state court; simultaneously, the parties will agree to stay the actions pending in the Delaware Chancery Court and the United States District Court for the Middle District of Florida. The proposed settlement is conditional upon, among other
F-30
SWITCH & DATA FACILITIES COMPANY, INC. AND SUBSIDIARIES
NOTES TO CONSOLIDATED FINANCIAL STATEMENTS—(Continued)
In Thousands, Except Per Common Share Amounts
things, the execution of an appropriate stipulation of settlement, consummation of the Merger and final approval of the proposed settlement by the Florida state court. The proposed settlement contemplates that plaintiffs’ counsel will apply to the Florida state court for an award of attorneys’ fees and costs in an aggregate amount of $900, and that the defendants will not oppose or undermine this application. These attorneys’ fees and costs will not be deducted from the Merger consideration. Both Switch and Data and Equinix will share in the payment of such settlement. As of December 31, 2009, the Company has accrued $630, its portion of the settlement and recorded $380 as an insurance receivable.
General Litigation
The Company is subject to other legal proceedings and claims which arise in the ordinary course of business. Based upon currently available information, management, based upon advice of legal counsel, believes that the amounts accrued in the Consolidated Balance Sheets are adequate for the aforementioned proceedings and claims and the amount of any additional liability with respect to these actions will not materially affect the financial position, results of operations or liquidity of the Company.
Taxes
During 2005, the State of Washington performed an excise tax audit on three of the Company’s subsidiaries and assessed additional business and occupation taxes. During 2007, the Company unsuccessfully challenged these assessments, deemed this as a probable loss contingency, and accrued $660 in March 2007 for the periods under audit as well as all subsequent periods including estimated taxes and penalties. During 2008, the Company paid $310 in settlement fees for years 2005 and prior. During 2009, the Company paid $218 in settlement fees for years 2006 to present.
The Company is examined in the normal course of business by various state and local taxing authorities regarding various tax matters. As of December 31, 2009 the Company is not under examination by any taxing authority related to non-income tax matters. The Company has accrued $130 as of December 31, 2009 in anticipation of future examinations.
13. Employee Benefit Plan
During 1999, the Company adopted the Switch & Data Facilities Company 401(k) Plan (the “401(k) Plan”). All employees located in the U.S. are eligible to participate on the first day of the quarter following their first day of employment. Under the 401(k) Plan, eligible employees are entitled to make tax deferred contributions, which the Company matches at a rate of 50% up to the maximum allowable statutory contribution. The Company contributed approximately $679, $831, and $877 for the years ended December 31, 2007, 2008 and 2009, respectively, to the 401(k) Plan.
14. Segment Information
The Company manages its business as one reportable segment. Although the Company provides colocation services in several markets, these operations have been aggregated into one reportable segment based on the similar economic characteristics among all markets, including the nature of the services provided and the type of customers purchasing such services.
The Company’s geographic revenues are as follows:
| For the year ended December 31, | |||||||||
| 2007 | 2008 | 2009 | |||||||
| Revenues |
|||||||||
| United States |
$ | 128,480 | $ | 160,066 | $ | 189,850 | |||
| Canada |
9,050 | 11,459 | 15,588 | ||||||
| $ | 137,530 | $ | 171,525 | $ | 205,438 | ||||
F-31
SWITCH & DATA FACILITIES COMPANY, INC. AND SUBSIDIARIES
NOTES TO CONSOLIDATED FINANCIAL STATEMENTS—(Continued)
In Thousands, Except Per Common Share Amounts
The Company’s long-lived assets are located in the following geographic regions:
| December 31, | ||||||
| 2008 | 2009 | |||||
| Long-Lived Assets |
||||||
| United States |
$ | 252,927 | $ | 278,088 | ||
| Canada |
17,359 | 19,224 | ||||
| $ | 270,286 | $ | 297,312 | |||
The Company had no customers that represented more than 10% of total revenues for the years ended December 31, 2007, 2008, and 2009.
15. Quarterly Financial Data (Unaudited)
The following table presents selected quarterly information for fiscal 2008:
| For the three months ended | ||||||||||||||
| March 31, 2008 |
June 30, 2008 |
September 30, 2008 |
December 31, 2008 |
|||||||||||
| Revenues |
$ | 39,777 | $ | 41,895 | $ | 44,079 | $ | 45,774 | ||||||
| Operating income |
3,369 | 4,323 | 3,780 | 1,886 | ||||||||||
| Net income (loss) |
339 | 1,140 | (32 | ) | (8,482 | ) | ||||||||
| Net income (loss) per common share—basic |
0.01 | 0.03 | (0.00 | ) | (0.25 | ) | ||||||||
| Net income (loss) per common share—diluted |
0.01 | 0.03 | (0.00 | ) | (0.25 | ) | ||||||||
The following table presents selected quarterly information for fiscal 2009.
The following table presents selected quarterly information for fiscal 2009:
| For the three months ended | ||||||||||||||
| March 31, 2009 |
June 30, 2009 |
September 30, 2009 |
December 31, 2009 |
|||||||||||
| Revenues |
$ | 47,133 | $ | 49,360 | $ | 53,520 | $ | 55,425 | ||||||
| Operating income |
2,888 | 4,873 | 7,341 | 5,342 | ||||||||||
| Net income (loss) |
(1,980 | ) | 1,874 | 2,588 | (2,074 | ) | ||||||||
| Net income (loss) per common share—basic |
(0.06 | ) | 0.05 | 0.07 | (0.06 | ) | ||||||||
| Net income (loss) per common share—diluted |
(0.06 | ) | 0.05 | 0.07 | (0.06 | ) | ||||||||
16. Subsequent Events
See “Litigation Related to the Proposed Merger with Equinix” in Footnote 12, for further discussion.
The Company has performed an evaluation of subsequent events through February 22, 2010, which is the date the consolidated financial statements were issued.
F-32