Attached files
UNITED STATES
SECURITIES AND EXCHANGE COMMISSION
WASHINGTON, D.C. 20549
FORM 10-K
ANNUAL REPORT PURSUANT TO SECTION 13 OR 15(d) OF
THE SECURITIES EXCHANGE ACT OF 1934
For the fiscal year ended December 31, 2009 Commission file number 0-1402
LINCOLN ELECTRIC HOLDINGS, INC.
(Exact name of registrant as specified in its charter)
| Ohio | 34-1860551 | |||||||
| (State or other jurisdiction of incorporation or organization) |
(I.R.S. Employer Identification No.) | |||||||
| 22801 St. Clair Avenue, Cleveland, Ohio | 44117 | |||||||
| (Address of principal executive offices) | (Zip Code) | |||||||
(216) 481-8100
(Registrant’s telephone number, including area code)
Securities registered pursuant to Section 12(b) of the Act:
| Common Shares, without par value | The NASDAQ Stock Market LLC | |||||||
| (Title of each class) | (Name of each exchange on which registered) |
Securities registered pursuant to Section 12(g) of the Act: None
Indicate by check mark if the registrant is a well-known seasoned issuer, as defined in Rule 405 of the Securities Act. Yes þ No ¨
Indicate by check mark if the registrant is not required to file reports pursuant to Section 13 or Section 15(d) of the Act. Yes ¨ No þ
Indicate by check mark whether the registrant (1) has filed all reports required to be filed by Section 13 or 15(d) of the Securities Exchange Act of 1934 during the preceding 12 months (or for such shorter period that the registrant was required to file such reports), and (2) has been subject to such filing requirements for the past 90 days. Yes þ No ¨
Indicate by check mark whether the registrant has submitted electronically and posted on its corporate Web site, if any, every Interactive Data File required to be submitted and posted pursuant to Rule 405 of Regulation S-T (§ 232.405 of this chapter) during the preceding 12 months (or for such shorter period that the registrant was required to submit and post such files). Yes ¨ No ¨
Indicate by check mark if disclosure of delinquent filers pursuant to Item 405 of Regulation S-K (§ 229.405 of this chapter) is not contained herein, and will not be contained, to the best of registrant’s knowledge, in definitive proxy or information statements incorporated by reference in Part III of this Form 10-K or any amendment to this Form 10-K þ
Indicate by check mark whether the registrant is a large accelerated filer, an accelerated filer, a non-accelerated filer, or a smaller reporting company. See the definitions of “large accelerated filer,” “accelerated filer” and “smaller reporting company” in Rule 12b-2 of the Exchange Act.
| Large accelerated filer þ |
Accelerated filer ¨ | Non-accelerated filer ¨ | Smaller reporting company ¨ | |||
| (Do not check if a smaller reporting company) |
Indicate by check mark whether the registrant is a shell company (as defined in Rule 12b-2 of the Exchange Act). Yes ¨ No þ
The aggregate market value of the common shares held by non-affiliates as of June 30, 2009 was $1,438,957,655 (affiliates, for this purpose, have been deemed to be Directors and Executive Officers of the Company and certain significant shareholders).
The number of shares outstanding of the registrant’s common shares as of December 31, 2009 was 42,637,247.
DOCUMENTS INCORPORATED BY REFERENCE
Part III of this Annual Report on Form 10-K incorporates by reference certain information from the registrant’s definitive proxy statement to be filed on or about March 19, 2010 with respect to the registrant’s 2010 Annual Meeting of Shareholders.
PART I
| ITEM 1. | BUSINESS |
General
As used in this report, the term “Company,” except as otherwise indicated by the context, means Lincoln Electric Holdings, Inc., its wholly-owned and majority-owned subsidiaries for which it has a controlling interest. The Lincoln Electric Company began operations in 1895 and was incorporated under the laws of the State of Ohio in 1906. During 1998, The Lincoln Electric Company reorganized into a holding company structure, and Lincoln Electric Holdings, Inc. became the publicly-held parent of Lincoln Electric subsidiaries worldwide, including The Lincoln Electric Company.
The Company is a broad-line manufacturer and reseller of welding and cutting products. Welding products include arc welding power sources, wire feeding systems, robotic welding packages, fume extraction equipment, consumable electrodes and fluxes. The Company’s welding product offering also includes regulators and torches used in oxy-fuel welding and cutting. In addition, the Company has a leading global position in the brazing and soldering alloys market.
The arc welding power sources and wire feeding systems manufactured by the Company range in technology from basic units used for light manufacturing and maintenance to highly sophisticated robotic applications for high production welding and fabrication. Three primary types of arc welding electrodes are produced: (1) coated manual or stick electrodes, (2) solid electrodes produced in coil, reel or drum forms for continuous feeding in mechanized welding, and (3) cored electrodes produced in coil form for continuous feeding in mechanized welding.
The Company has wholly-owned subsidiaries or joint venture manufacturing facilities located in the United States, Australia, Brazil, Canada, Colombia, France, Germany, India, Indonesia, Italy, Mexico, the Netherlands, People’s Republic of China, Poland, Portugal, Turkey, United Kingdom and Venezuela. Nearly all of the above facilities are ISO 9001 certified.
During the fourth quarter of 2009, the Company realigned its business units into five operating segments to enhance the utilization of the Company’s worldwide resources and global sourcing initiatives. The operating segments consist of North America Welding, Europe Welding, Asia Pacific Welding, South America Welding and The Harris Products Group. The North America Welding segment includes welding operations in the United States, Canada and Mexico. The other three welding segments include welding operations in Europe, Asia Pacific and South America, respectively. The fifth segment, The Harris Products Group, includes the Company’s global cutting, soldering and brazing businesses as well as the retail business in the United States. See Note 3 to the Company’s Consolidated Financial Statements for segment and geographic area information.
Customers
The Company’s products are sold in both domestic and international markets. In North America, products are sold principally through industrial distributors, retailers and also directly to users of welding products. Outside of North America, the Company has an international sales organization comprised of Company employees and agents who sell products from the Company’s various manufacturing sites to distributors and product users.
The Company’s major end-user markets include:
| • | general metal fabrication, |
| • | power generation and process industry, |
| • | structural steel construction (buildings and bridges), |
| • | heavy equipment fabrication (farming, mining and rail), |
| • | shipbuilding, |
| • | automotive, |
2
| • | pipe mills and pipelines, and |
| • | offshore oil and gas exploration and extraction. |
The Company is not dependent on a single customer or a few customers. The loss of any one customer would not have a material adverse effect on its business. The Company’s business is not seasonal.
Competition
Conditions in the arc welding and cutting industry are highly competitive. The Company believes it is the world’s largest manufacturer of consumables and equipment with relatively few major broad-line competitors worldwide, but numerous smaller competitors in specific geographic markets. The Company continues to pursue strategies to heighten its competitiveness in domestic and international markets, which includes positioning low cost manufacturing facilities in most geographical markets. Competition in the arc welding and cutting industry is on the basis of brand preference, product quality, price, performance, warranty, delivery, service and technical support. The Company believes its performance against these factors has contributed to the Company’s position as the leader in the industry.
Most of the Company’s products may be classified as standard commercial articles and are manufactured for stock. The Company believes it has a competitive advantage in the marketplace because of its highly trained technical sales force and the support of its welding research and development staff, which allow it to assist the consumers of its products in optimizing their welding applications. The Company utilizes this technical expertise to present its Guaranteed Cost Reduction Program to end users through which the Company guarantees that the user will achieve cost savings in its manufacturing process when it utilizes the Company’s products. This allows the Company to introduce its products to new users and to establish and maintain close relationships with its consumers. This close relationship between the technical sales force and the direct consumers, together with its supportive relationship with its distributors, who are particularly interested in handling the broad range of the Company’s products, is an important element of the Company’s market success and a valuable asset of the Company.
Raw Materials
The principal raw materials essential to the Company’s business are various chemicals, electronics, steel, engines, brass, copper and aluminum alloys, all of which are normally available for purchase in the open market.
Patents and Trademarks
The Company holds many valuable patents, primarily in arc welding, and has increased the application process as research and development has progressed in both the United States and major international jurisdictions. The Company believes its trademarks are an important asset and aggressively pursues brand management.
Environmental Regulations
The Company’s facilities are subject to environmental regulations. To date, compliance with these environmental regulations has not had a material adverse effect on the Company’s earnings. The Company is ISO 14001 certified at all significant manufacturing facilities in North America and Europe and is working to gain certification at its remaining facilities worldwide. In addition, the Company is ISO 9001 certified at nearly all facilities worldwide.
International Operations
The Company conducts a significant amount of its business and has a number of operating facilities in countries outside the United States. As a result, the Company is subject to business risks inherent to non- U.S. activities, including political uncertainty, import and export limitations, exchange controls and currency fluctuations.
3
Research and Development
Research activities, which the Company believes provide a competitive advantage, relate to the development of new products and the improvement of existing products. Research activities are Company-sponsored. Refer to Note 1 to the consolidated financial statements with respect to total costs of research and development.
Employees
The number of persons employed by the Company worldwide at December 31, 2009 was 8,950. See Item 10 of Part III for information regarding the Company’s executive officers, which is incorporated herein by reference.
Website Access
The Company’s website, www.lincolnelectric.com, is used as a channel for routine distribution of important information, including news releases and financial information. The Company posts its filings as soon as reasonably practicable after they are electronically filed with, or furnished to, the SEC, including annual, quarterly, and current reports on Forms 10-K, 10-Q, and 8-K; proxy statements; and any amendments to those reports or statements. The Company also posts its Code of Corporate Conduct and Ethics on its website. All such postings and filings are available on the Company’s website free of charge. In addition, this website allows investors and other interested persons to sign up to automatically receive e-mail alerts when news releases and financial information is posted on the website. The SEC also maintains a web site, www.sec.gov, that contains reports, proxy and information statements, and other information regarding issuers that file electronically with the SEC. The content on any website referred to in this Annual Report on Form 10-K is not incorporated by reference into this Annual Report unless expressly noted.
| ITEM 1A. | RISK FACTORS |
From time to time, information we provide, statements by our employees or information included in our filings with the SEC may contain forward-looking statements that are not historical facts. Those statements are “forward-looking” within the meaning of the Private Securities Litigation Reform Act of 1995. Forward-looking statements, and our future performance, operating results, financial position and liquidity, are subject to a variety of factors that could materially affect results, including those described below. Any forward-looking statements made in this report or otherwise speak only as of the date of the statement, and, except as required by law, we undertake no obligation to update those statements. Comparisons of results for current and any prior periods are not intended to express any future trends or indications of future performance, unless expressed as such, and should only be viewed as historical data.
In the ordinary course of our business, we face various strategic, operating, compliance and financial risks. These risks could have an impact on our business, financial condition, operating results and cash flows. Many of our most significant risks are set forth below and elsewhere in this Annual Report on Form 10-K. We can mitigate these risks and their impact on the Company only to a limited extent.
Our Enterprise Risk Management (“ERM”) process seeks to identify and address significant risks. Our ERM process is a company-wide initiative that is designed with the intent of prioritizing risks and giving risks appropriate consideration. We use the integrated risk framework of the Committee of Sponsoring Organizations to assess, manage and monitor risks.
Management has identified and prioritized critical risks based on the severity and likelihood of each risk and assigned an executive to address each major identified risk area and lead action plans to monitor and mitigate risks, where possible. Our Board of Directors provides oversight of the ERM process and systematically reviews identified critical risks. The Audit Committee also reviews major financial risk exposures and the steps management has taken to monitor and seek to control them.
4
Our goal is to proactively manage risks in a structured approach and in conjunction with strategic planning, with the intent to preserve and enhance shareholder value. However, these and other risks and uncertainties could cause our results to vary materially from recent results or from our anticipated future results.
The risks and uncertainties described below and all of the other information in this Annual Report on Form 10-K should be carefully considered. These risks and uncertainties are not the only ones we face. Additional risks and uncertainties of which we are currently unaware or that we currently believe to be immaterial may also adversely affect our business.
General economic and market conditions may adversely affect the Company’s financial condition, results of operations and access to capital markets.
The Company’s operating results are sensitive to changes in general economic conditions. Recessionary economic cycles, higher interest rates, inflation, higher tax rates and other changes in tax laws or other economic factors could adversely affect demand for the Company’s products. The industrial downturn recently experienced affecting the U.S. and global economies could continue to negatively impact investment activity within key geographic and market segments served by the Company. In addition, any further deterioration in the condition of financial markets may limit the Company’s access to capital markets. There can be no assurances that government responses to disruptions in the financial and broader industrial markets will restore market confidence.
Availability of and volatility in energy costs or raw material prices may adversely affect our performance.
In the normal course of business, we are exposed to market risks related to the availability of and price fluctuations in the purchase of energy and commodities used in the manufacture of our products (primarily steel, brass, copper and aluminum alloys, electricity and natural gas). The availability and prices for raw materials are subject to volatility and are influenced by worldwide economic conditions, speculative action, world supply and demand balances, inventory levels, availability of substitute materials, currency exchange rates, our competitors’ production costs, anticipated or perceived shortages and other factors. The price of the type of steel used to manufacture our products has experienced periods of significant price volatility and has been subject to periodic shortages due to global economic factors. We have also experienced substantial volatility in prices for other raw materials, including metals, chemicals and energy costs. Our operating margins will be dependent on our ability to manage the impact of volatility in supply and related costs.
We are a co-defendant in litigation alleging manganese induced illness and litigation alleging asbestos induced illness. Liabilities relating to such litigation could reduce our profitability and impair our financial condition.
At December 31, 2009, we were a co-defendant in cases alleging manganese induced illness involving claims by approximately 3,333 plaintiffs and a co-defendant in cases alleging asbestos induced illness involving claims by approximately 17,191 plaintiffs. In each instance, we are one of a large number of defendants. In the manganese cases, the claimants allege that exposure to manganese contained in welding consumables caused the plaintiffs to develop adverse neurological conditions, including a condition known as manganism. In the asbestos cases, the claimants allege that exposure to asbestos contained in welding consumables caused the plaintiffs to develop adverse pulmonary diseases, including mesothelioma and other lung cancers.
Since January 1, 1995, we have been a co-defendant in manganese cases that have been resolved as follows: 13,471 of those claims were dismissed, 20 were tried to defense verdicts in favor of us and five were tried to plaintiff verdicts (four of which are being or will be appealed). In addition, 13 claims were resolved by agreement for immaterial amounts and one was decided in favor of us following a motion for summary judgment. Since January 1, 1995, we have been a co-defendant in asbestos cases that have been resolved as follows: 38,465 of those claims were dismissed, 12 were tried to defense verdicts, four were tried to plaintiff verdicts, one was resolved by agreement for an immaterial amount and 563 were decided in favor of us following summary judgment motions.
5
Defense costs remain significant. The long-term impact of the manganese and asbestos loss contingencies, in each case in the aggregate, on operating results, operating cash flows and access to capital markets is difficult to assess, particularly since claims are in many different stages of development and we benefit significantly from cost-sharing with co-defendants and insurance carriers. While we intend to contest these lawsuits vigorously, and believe we have applicable insurance relating to these claims, there are several risks and uncertainties that may affect our liability for personal claims relating to exposure to manganese and asbestos, including the future impact of changing cost sharing arrangements or a change in our overall trial experience.
Manganese is an essential element of steel and cannot be eliminated from welding consumables. Asbestos use in welding consumables in the U.S. ceased in 1981.
We may incur material losses and costs as a result of product liability claims that may be brought against us.
Our products are used in a variety of applications, including infrastructure projects such as oil and gas pipelines and platforms, buildings, bridges and power generation facilities, the manufacture of transportation and heavy equipment and machinery, and various other construction projects. We face risk of exposure to product liability claims in the event that accidents or failures on these projects result, or are alleged to result, in bodily injury or property damage. Further, our welding products are designed for use in specific applications, and if a product is used inappropriately, personal injury or property damage may result. For example, in the period between 1994 and 2000, we were a defendant or co-defendant in 21 lawsuits filed by building owners or insurers in Los Angeles County, California. The plaintiffs in those cases alleged that certain buildings affected by the 1994 Northridge earthquake sustained property damage in part because a particular electrode used in the construction of those buildings was unsuitable for that use. In the Northridge cases, one case was tried to a defense verdict in favor of us, 12 were voluntarily dismissed, seven were settled and we received summary judgment in our favor in another.
The occurrence of defects in or failures of our products, or the misuse of our products in specific applications, could cause termination of customer contracts, increased costs and losses to us, our customers and other end users. We cannot be assured that we will not experience any material product liability losses in the future or that we will not incur significant costs to defend those claims. Further, we cannot be assured that our product liability insurance coverage will be adequate for any liabilities that we may ultimately incur or that it will continue to be available on terms acceptable to us.
The cyclicality and maturity of the arc welding and cutting industry in developed markets may adversely affect our performance.
The arc welding and cutting industry is generally a mature industry in developed markets such as North America and Western Europe and is very cyclical in nature. The growth of the arc welding and cutting industry in developed markets has been and continues to be constrained by factors such as the increased cost of steel. Overall demand for arc welding and cutting products is largely determined by the level of capital spending in manufacturing and other industrial sectors, and the welding industry has historically experienced contraction during periods of slowing industrial activity. If economic, business and industry conditions deteriorate, capital spending in those sectors may be substantially decreased, which could reduce demand for our products, our revenues and our results of operations.
We may not be able to complete our acquisition strategy or successfully integrate acquired businesses.
Part of our business strategy is to pursue targeted business acquisition opportunities, including foreign investment opportunities. For example, the Company has completed and continues to pursue acquisitions or joint ventures in the People’s Republic of China in order to strategically position resources to increase our presence in this growing market. We cannot be certain that we will be successful in pursuing potential acquisition candidates or that the consequences of any acquisition would be beneficial to us. Future acquisitions may involve the expenditure of significant funds and management time. Depending on the nature, size and timing of future
6
acquisitions, we may be required to raise additional financing, which may not be available to us on acceptable terms. Our current operational cash flow is sufficient to fund our current acquisition plans, but a significant acquisition could require access to the capital markets. Further, we may not be able to successfully integrate any acquired business with our existing businesses or recognize the expected benefits from any completed acquisition.
If we cannot continue to develop, manufacture and market products that meet customer demands, our revenues and gross margins may suffer.
Our continued success depends, in part, on our ability to continue to meet our customers’ needs for welding products through the introduction of innovative new products and the enhancement of existing product design and performance characteristics. We must remain committed to product research and development and customer service in order to remain competitive. Accordingly, we may spend a proportionately greater amount on research and development than some of our competitors. We cannot be assured that new products or product improvements, once developed, will meet with customer acceptance and contribute positively to our operating results, or that we will be able to continue our product development efforts at a pace to sustain future growth. Further, we may lose customers to our competitors if they demonstrate product design, development or manufacturing capabilities superior to ours.
The competitive pressures we face could harm our revenue, gross margins and prospects.
We operate in a highly competitive global environment and compete in each of our businesses with other broad-line manufacturers and numerous smaller competitors specializing in particular products. We compete primarily on the basis of brand, product quality, price, performance, warranty, delivery, service and technical support. We have initiated significant rationalization activities to align our business to current market conditions. Rationalization activities could fail to deliver the desired competitive cost structure and could result in disruptions in customer service. If our products, services, support and cost structure do not enable us to compete successfully based on any of the criteria listed above, our operations, results and prospects could suffer.
Further, in the past decade, the United States arc welding industry has been subject to increased levels of foreign competition as low cost imports have become more readily available. Our competitive position could also be harmed if new or emerging competitors become more active in the arc welding business. For example, while steel manufacturers traditionally have not been significant competitors in the domestic arc welding industry, some foreign integrated steel producers manufacture selected consumable arc welding products. Our sales and results of operations, as well as our plans to expand in some foreign countries, could be harmed by this practice.
We conduct our sales and distribution operations on a worldwide basis and are subject to the risks associated with doing business outside the United States.
Our long-term strategy is to continue to increase our share in growing international markets, particularly Asia (with emphasis in China and India), Latin America, Eastern Europe and other developing markets. There are a number of risks in doing business abroad, which may impede our ability to achieve our strategic objectives relating to our foreign operations. Many developing countries, like Venezuela, have a significant degree of political and economic uncertainty that may impede our ability to implement and achieve our foreign growth objectives. Conducting business internationally also subjects us to corporate governance and management challenges in consideration of the numerous U.S. and foreign laws and regulations, including regulations relating to import-export control, technology transfer restrictions, repatriation of earnings, exchange controls, anti-boycott provisions and anti-bribery laws (such as the Foreign Corrupt Practices Act and the Organization for Economic Cooperation and Development Convention). Failure by the Company or its sales representatives or agents to comply with these laws and regulations could result in administrative, civil or criminal liabilities, all or any of which could negatively impact our business and reputation.
Moreover, social unrest, the absence of trained labor pools and the uncertainties associated with entering into joint ventures or similar arrangements in foreign countries have slowed our business expansion into some
7
developing economies. Our presence in emerging markets has been facilitated in part through joint venture agreements with local organizations. While this strategy has allowed us to gain a footprint in emerging markets while leveraging the experience of local organizations, it also presents corporate governance and management challenges.
Our foreign operations also subject us to the risks of international terrorism and hostilities and to foreign currency risks, including exchange rate fluctuations and limits on the repatriation of funds.
The share of sales and profits we derive from our international operations and exports from the United States is significant and growing. This trend increases our exposure to the performance of many developing economies in addition to the developed economies outside of the United States.
Our operations depend on maintaining a skilled workforce, and any interruption in our workforce could negatively impact our results of operations and financial condition.
We are dependent on our highly trained technical sales force and the support of our welding research and development staff. Any interruption of our workforce, including interruptions due to unionization efforts, changes in labor relations or shortages of appropriately skilled individuals for our research, production and sales forces could impact our results of operations and financial condition.
Our revenues and results of operations may suffer if we cannot continue to enforce the intellectual property rights on which our business depends or if third parties assert that we violate their intellectual property rights.
We rely upon patent, trademark, copyright and trade secret laws in the United States and similar laws in foreign countries, as well as agreements with our employees, customers, suppliers and other third parties, to establish and maintain our intellectual property rights. However, any of our intellectual property rights could be challenged, invalidated or circumvented, or our intellectual property rights may not be sufficient to provide a competitive advantage. Further, the laws and their application in certain foreign countries do not protect our proprietary rights to the same extent as U.S. laws. Accordingly, in certain countries, we may be unable to protect our proprietary rights against unauthorized third-party copying or use, which could impact our competitive position.
Further, third parties may claim that we or our customers are infringing upon their intellectual property rights. Even if we believe that those claims are without merit, defending those claims and contesting the validity of patents can be time-consuming and costly. Claims of intellectual property infringement also might require us to redesign affected products, enter into costly settlement or license agreements or pay costly damage awards, or face a temporary or permanent injunction prohibiting us from manufacturing, marketing or selling certain of our products.
Our global operations are subject to increasingly complex environmental regulatory requirements.
We are subject to increasingly complex environmental regulations affecting international manufacturers, including those related to air and water emissions, waste management and climate change.
There is a growing political and scientific belief that emissions of greenhouse gases (“GHG”) alter the composition of the global atmosphere in ways that are affecting the global climate. Various stakeholders, including legislators and regulators, shareholders and non-governmental organizations, as well as companies in many business sectors, are considering ways to reduce GHG emissions. There is growing consensus that some form of U.S. regulation will be forthcoming at the federal level with respect to GHG emissions. Such regulation could result in regulatory or product standard requirements for the Company’s global businesses but because any impact is dependent on the design of the mandate or standard, the Company is unable to predict its significance at this time.
Furthermore, the potential physical impacts of theorized climate change on the Company’s customers, and therefore on the Company’s operations, are speculative and highly uncertain, and would be particular to the circumstances developing in various geographical regions. These may include changes in weather patterns
8
(including drought and rainfall levels), water availability, storm patterns and intensities, and temperature levels. These potential physical effects may adversely impact the cost, production, sales and financial performance of the Company’s operations.
It is our policy to apply strict standards for environmental protection to sites inside and outside the United States, even when we are not subject to local government regulations. We may incur substantial costs, including cleanup costs, fines and civil or criminal sanctions, liabilities resulting from third-party property damage or personal injury claims, or our products could be enjoined from entering certain jurisdictions, if we were to violate or become liable under environmental laws or if our products become non-compliant with environmental laws.
We also face increasing complexity in our products design and procurement operations as we adjust to new and future requirements relating to the design, production and labeling of our products that are sold in the European Union. The ultimate costs under environmental laws and the timing of these costs are difficult to predict, and liability under some environmental laws relating to contaminated sites can be imposed retroactively and on a joint and several basis.
| ITEM 1B. | UNRESOLVED STAFF COMMENTS |
None.
| ITEM 2. | PROPERTIES |
The Company’s corporate headquarters and principal United States manufacturing facilities are located in the Cleveland, Ohio area. Total Cleveland area property consists of 233 acres, of which present manufacturing facilities comprise an area of approximately 2,940,000 square feet.
The Company has 38 manufacturing facilities, including operations and joint ventures in 18 countries, the locations (grouped by operating segment) of which are as follows:
| North American Welding: |
||
| United States |
Cleveland, Ohio; Oceanside, California. | |
| Canada |
Toronto; Mississauga. | |
| Mexico |
Mexico City; Torreon. | |
| Europe Welding: |
||
| France |
Grand-Quevilly. | |
| Germany |
Essen. | |
| Italy |
Genoa; Corsalone. | |
| Netherlands |
Nijmegen. | |
| Poland |
Bielawa; Swietochlowice; Dzierzoniow. | |
| Portugal |
Lisbon. | |
| Turkey |
Istanbul. | |
| United Kingdom |
Sheffield; Chertsey. | |
| Asia Pacific Welding: |
||
| Australia |
Sydney. | |
| India |
Chennai. | |
| Indonesia |
Cikarang. | |
| People’s Republic of China |
Shanghai; Jining; Jinzhou; Nanjing; Zhengzhou. | |
| South America Welding: |
||
| Brazil |
Sao Paulo. | |
| Colombia |
Bogota. | |
| Venezuela |
Maracay. | |
| The Harris Products Group: |
||
| United States |
Mason, Ohio; Gainesville, Georgia; Santa Fe Springs, California. | |
| Brazil |
Guarulhos. | |
| Mexico |
Tijuana. | |
| Poland |
Dzierzoniow. | |
9
All properties relating to the Company’s Cleveland, Ohio headquarters and manufacturing facilities are owned by the Company. Most of the Company’s foreign subsidiaries own manufacturing facilities in the country where they are located. The Company believes that its existing properties are in good condition and are suitable for the conduct of its business. At December 31, 2009, $2.2 million of indebtedness under capital leases was secured by property with a book value of $4.7 million.
In addition, the Company maintains operating leases for its distribution centers and many sales offices throughout the world. See Note 11 to the Company’s Consolidated Financial Statements with respect to lease commitments.
| ITEM 3. | LEGAL PROCEEDINGS |
The Company is subject, from time to time, to a variety of civil and administrative proceedings arising out of its normal operations, including, without limitation, product liability claims and health, safety and environmental claims. Among such proceedings are the cases described below.
At December 31, 2009, the Company was a co-defendant in cases alleging asbestos induced illness involving claims by approximately 17,191 plaintiffs, which is a net decrease of 255 claims from those previously reported. In each instance, the Company is one of a large number of defendants. The asbestos claimants seek compensatory and punitive damages, in most cases for unspecified sums. Since January 1, 1995, the Company has been a co-defendant in other similar cases that have been resolved as follows: 38,465 of those claims were dismissed, 12 were tried to defense verdicts, four were tried to plaintiff verdicts, one was resolved by agreement for an immaterial amount and 563 were decided in favor of the Company following summary judgment motions.
At December 31, 2009, the Company was a co-defendant in cases alleging manganese induced illness involving claims by approximately 3,333 plaintiffs, which is a net decrease of 11 claims from those previously reported. In each instance, the Company is one of a large number of defendants. The claimants in cases alleging manganese induced illness seek compensatory and punitive damages, in most cases for unspecified sums. The claimants allege that exposure to manganese contained in welding consumables caused the plaintiffs to develop adverse neurological conditions, including a condition known as manganism. At December 31, 2009, cases involving 2,048 claimants were filed in or transferred to federal court where the Judicial Panel on MultiDistrict Litigation has consolidated these cases for pretrial proceedings in the Northern District of Ohio. Since January 1, 1995, the Company has been a co-defendant in similar cases that have been resolved as follows: 13,471 of those claims were dismissed, 20 were tried to defense verdicts in favor of the Company and five were tried to plaintiff verdicts (four of which are being or will be appealed). In addition, 13 claims were resolved by agreement for immaterial amounts and one claim was decided in favor of the Company following a summary judgment motion.
On December 13, 2006, the Company filed a complaint in U.S. District Court (Northern District of Ohio) against Illinois Tool Works, Inc. seeking a declaratory judgment that eight patents owned by the defendant relating to certain inverter power sources have not and are not being infringed and that the subject patents are invalid. Illinois Tool Works filed a motion to dismiss this action, which the Court denied on June 21, 2007. On September 7, 2007, the Court stayed the litigation, referencing pending reexaminations before the U.S. Patent and Trademark Office. On June 17, 2008, the Company filed a motion to amend its pleadings in the foregoing matter to include several additional counts, including specific allegations of fraud on the U.S. Patent and Trademark Office with respect to portable professional welding machines and resulting monopoly power in that market.
| ITEM 4. | SUBMISSION OF MATTERS TO A VOTE OF SECURITY HOLDERS |
No matters were submitted to a vote of security holders during the quarter ended December 31, 2009.
10
PART II
| ITEM 5. | MARKET FOR REGISTRANT’S COMMON EQUITY, RELATED STOCKHOLDER MATTERS AND ISSUER PURCHASES OF EQUITY SECURITIES |
| (In thousands of dollars, except per share data) |
The Company’s common shares are traded on The NASDAQ Stock Market under the symbol “LECO.” The number of record holders of common shares at December 31, 2009 was 1,758.
The total amount of dividends paid in 2009 was $45,801. For 2009, dividends were paid quarterly on January 15, April 15, July 15 and October 15.
Quarterly high and low stock prices and dividends declared for the last two years were:
| 2009 | 2008 | |||||||||||||||||
| Stock Price | Dividends Declared |
Stock Price | Dividends Declared | |||||||||||||||
| High | Low | High | Low | |||||||||||||||
| First quarter |
$ | 56.22 | $ | 26.32 | $ | 0.27 | $ | 71.48 | $ | 53.32 | $ | 0.25 | ||||||
| Second quarter |
45.96 | 30.88 | 0.27 | 86.97 | 64.07 | 0.25 | ||||||||||||
| Third quarter |
52.81 | 32.97 | 0.27 | 86.47 | 59.78 | 0.25 | ||||||||||||
| Fourth quarter |
56.71 | 42.90 | 0.28 | 65.11 | 34.27 | 0.27 | ||||||||||||
Source: The NASDAQ Stock Market
Issuer purchases of equity securities for 2009 were:
| Period |
Total Number of Shares Repurchased (1) |
Average Price Paid Per Share |
Total Number of Shares Repurchased as Part of Publicly Announced Plans or Programs |
Maximum Number of Shares that May Yet be Purchased Under the Plans or Programs (2) | |||||
| February 1-28, 2009 |
8,407 | $ | 40.85 | 8,407 | 3,784,610 | ||||
| (1) | The above acquisition consists of the surrender of 8,407 shares of the Company’s common shares to satisfy minimum income tax withholding requirements related to the vesting of 30,550 restricted shares granted pursuant to the Company’s 1998 Stock Plan. |
| (2) | The Company’s Board of Directors authorized share repurchase programs for up to 15 million shares of the Company’s common stock. Total shares purchased through the share repurchase programs were 11,215,390 shares at a cost of $274,531 for a weighted average cost of $24.48 per share through December 31, 2009. |
11
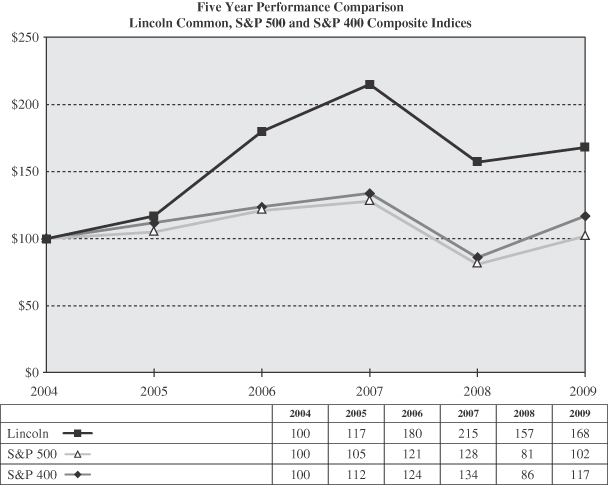
The following line graph compares the yearly percentage change in the cumulative total shareholder return on Lincoln Electric Holdings, Inc. (“Lincoln”) common shares against the cumulative total return of the S&P Composite 500 Stock Index (“S&P 500”) and the S&P 400 MidCap Index (“S&P 400”) for the five-year calendar period commencing January 1, 2005 and ending December 31, 2009. This graph assumes that $100 was invested on December 31, 2004 in each of Lincoln common, the S&P 500 and the S&P 400. A peer-group index for the welding industry, in general, was not readily available because the industry is comprised of a large number of privately held competitors and competitors that are relatively small entities of large publicly traded companies.
| ITEM 6. | SELECTED FINANCIAL DATA |
| (In thousands of dollars, except per share data) |
| Year Ended December 31, | |||||||||||||||
| 2009 | 2008 | 2007 | 2006 | 2005 | |||||||||||
| Net sales |
$ | 1,729,285 | $ | 2,479,131 | $ | 2,280,784 | $ | 1,971,915 | $ | 1,601,190 | |||||
| Net income |
48,576 | 212,286 | 202,736 | 175,008 | 122,306 | ||||||||||
| Basic earnings per share |
$ | 1.15 | $ | 4.98 | $ | 4.73 | $ | 4.11 | $ | 2.93 | |||||
| Diluted earnings per share |
1.14 | 4.93 | 4.67 | 4.07 | 2.90 | ||||||||||
| Cash dividends declared |
1.09 | 1.02 | 0.91 | 0.79 | 0.73 | ||||||||||
| Total assets |
$ | 1,705,292 | $ | 1,718,805 | $ | 1,645,296 | $ | 1,394,579 | $ | 1,161,161 | |||||
| Long-term debt |
87,850 | 91,537 | 117,329 | 113,965 | 157,853 | ||||||||||
12
Results for 2009 include rationalization and asset impairment charges of $29,897 ($23,789 after-tax). The Company’s rationalization activities to align the business to current market conditions resulted in charges of $29,018 ($23,193 after-tax) and impairment charges of $879 ($596 after-tax) were recognized for certain indefinite-lived intangible assets. Results also include a loss of $7,943 ($7,943 after-tax) associated with the acquisition of a business in China and the related disposal of an interest in Taiwan, a pension settlement gain of $1,543 ($1,543 after-tax) and a gain on the sale of a property by the Company’s joint venture in Turkey of $5,667 ($5,667 after-tax).
Results for 2008 include a charge of $2,447 ($1,698 after-tax) relating to the Company’s rationalization programs that began in the fourth quarter of 2008 designed to align the business to current market conditions. Results for 2008 also include $16,924 ($16,615 after-tax) in asset impairment charges including $13,194 of goodwill and $2,388 of long-lived assets related to two businesses in China (with no tax benefit) as well as an impairment charge of $1,342 ($1,033 after-tax) for intangible assets in North America and Europe.
Results for 2007 include a net gain of $188 ($107 after-tax) relating to the Company’s rationalization programs.
Results for 2006 include a charge of $3,478 ($3,478 after-tax) relating to the Company’s rationalization programs and a gain of $9,006 ($7,204 after-tax) on the sale of a facility in Ireland.
Results for 2005 include a charge of $1,761 ($1,303 after-tax) relating to the Company’s rationalization programs, a one-time state income tax benefit of $1,807 (net of federal benefit) relating to changes in Ohio tax laws, a favorable adjustment of $8,711 related to the resolution of prior years’ tax liabilities, a net favorable tax benefit of $1,146 associated with the repatriation of foreign earnings and a gain of $1,418 ($876 after-tax) on the settlement of legal disputes.
| ITEM 7. | MANAGEMENT’S DISCUSSION AND ANALYSIS OF FINANCIAL CONDITION AND RESULTS OF OPERATIONS |
| (In thousands of dollars, except share and per share data) |
The following discussions of financial condition and results of operations should be read together with “Selected Financial Data,” the Company’s Consolidated Financial Statements and other financial information included elsewhere in this report. This report contains forward-looking statements that involve risks and uncertainties. Actual results may differ materially from those indicated in the forward-looking statements. See Risk Factors in Item 1A for more information regarding forward-looking statements.
General
The Company is the world’s largest designer and manufacturer of arc welding and cutting products, manufacturing a broad line of arc welding equipment, consumable welding products and other welding and cutting products.
The Company is one of only a few worldwide broad-line manufacturers of both arc welding equipment and consumable products. Welding products include arc welding power sources, wire feeding systems, robotic welding packages, fume extraction equipment, consumable electrodes and fluxes. The Company’s welding product offering also includes regulators and torches used in oxy-fuel welding and cutting. In addition, the Company has a leading global position in the brazing and soldering alloys market.
The Company invests in the research and development of arc welding equipment and consumable products in order to continue its market leading product offering. The Company continues to invest in technologies that improve the quality and productivity of welding products. In addition, the Company continues to actively increase its patent application process in order to secure its technology advantage in the United States and other major international jurisdictions. The Company believes its significant investment in research and development and its highly trained technical sales force provide a competitive advantage in the marketplace.
The Company’s products are sold in both domestic and international markets. In North America, products are sold principally through industrial distributors, retailers and also directly to users of welding products. Outside of North America, the Company has an international sales organization comprised of Company employees and agents who sell products from the Company’s various manufacturing sites to distributors and product users.
13
The Company’s major end user markets include:
| • | general metal fabrication, |
| • | power generation and process industry, |
| • | structural steel construction (buildings and bridges), |
| • | heavy equipment fabrication (farming, mining and rail), |
| • | shipbuilding, |
| • | automotive, |
| • | pipe mills and pipelines, and |
| • | offshore oil and gas exploration and extraction. |
The Company has, through wholly-owned subsidiaries or joint ventures, manufacturing facilities located in the United States, Australia, Brazil, Canada, Colombia, France, Germany, India, Indonesia, Italy, Mexico, the Netherlands, People’s Republic of China, Poland, Portugal, Turkey, United Kingdom and Venezuela.
During the fourth quarter of 2009, the Company realigned its business units into five operating segments to enhance the utilization of the Company’s worldwide resources and global sourcing initiatives. The operating segments consist of North America Welding, Europe Welding, Asia Pacific Welding, South America Welding and The Harris Products Group. The North America Welding segment includes welding operations in the United States, Canada and Mexico. The other three welding segments include welding operations in Europe, Asia Pacific and South America, respectively. The fifth segment, The Harris Products Group, includes the Company’s global cutting, soldering and brazing businesses as well as the retail business in the United States. The segment information of prior periods has been recast to conform to the current segment presentation.
The principal raw materials essential to the Company’s business are various chemicals, electronics, steel, engines, brass, copper and aluminum alloys, all of which are normally available for purchase in the open market.
The Company’s facilities are subject to environmental regulations. To date, compliance with these environmental regulations has not had a material adverse effect on the Company’s earnings. The Company is ISO 9001 certified at nearly all facilities worldwide. In addition, the Company is ISO 14001 certified at all significant manufacturing facilities in North America and Europe and is working to gain certification at its remaining facilities worldwide.
Key Indicators
Key economic measures relevant to the Company include industrial production trends, steel consumption, purchasing manager indices, capacity utilization within durable goods manufacturers and consumer confidence indicators. Key industries which provide a relative indication of demand drivers to the Company include steel, farm machinery and equipment, construction and transportation, fabricated metals, electrical equipment, ship and boat building, defense, truck manufacturing, energy and railroad equipment. Although these measures provide key information on trends relevant to the Company, the Company does not have available a more direct correlation of leading indicators which can provide a forward-looking view of demand levels in the markets which ultimately use the Company’s welding products.
Key operating measures utilized by the operating units to manage the Company include orders, sales, inventory and fill-rates, all of which provide key indicators of business trends. These measures are reported on various cycles including daily, weekly and monthly depending on the needs established by operating management.
Key financial measures utilized by the Company’s executive management and operating units in order to evaluate the results of its business and in understanding key variables impacting the current and future results of the Company include: sales; gross profit; selling, general and administrative expenses; earnings before interest and taxes; earnings before interest, taxes and bonus; net income; operating cash flows; and capital expenditures, including applicable ratios such as return on invested capital and average operating working capital to sales. These measures are reviewed at monthly, quarterly and annual intervals and compared with historical periods, as well as objectives established by the Board of Directors of the Company.
14
Results of Operations
The following table shows the Company’s results of operations:
| Year Ended December 31, | |||||||||||||||||||||
| 2009 | 2008 | 2007 | |||||||||||||||||||
| Amount | % of Sales | Amount | % of Sales | Amount | % of Sales | ||||||||||||||||
| Net sales |
$ | 1,729,285 | 100.0 | % | $ | 2,479,131 | 100.0 | % | $ | 2,280,784 | 100.0 | % | |||||||||
| Cost of goods sold |
1,273,017 | 73.6 | % | 1,758,980 | 71.0 | % | 1,633,218 | 71.6 | % | ||||||||||||
| Gross profit |
456,268 | 26.4 | % | 720,151 | 29.0 | % | 647,566 | 28.4 | % | ||||||||||||
| Selling, general & administrative expenses |
333,395 | 19.3 | % | 405,376 | 16.4 | % | 370,122 | 16.2 | % | ||||||||||||
| Rationalization and asset impairment charges (gain) |
29,897 | 1.7 | % | 19,371 | 0.8 | % | (188 | ) | (0.0 | )% | |||||||||||
| Operating income |
92,976 | 5.4 | % | 295,404 | 11.9 | % | 277,632 | 12.2 | % | ||||||||||||
| Interest income |
3,462 | 0.2 | % | 8,845 | 0.4 | % | 8,294 | 0.4 | % | ||||||||||||
| Equity (loss) earnings in affiliates |
(5,025 | ) | (0.3 | )% | 6,034 | 0.2 | % | 9,838 | 0.4 | % | |||||||||||
| Other income |
3,589 | 0.2 | % | 1,681 | 0.1 | % | 2,823 | 0.1 | % | ||||||||||||
| Interest expense |
(8,521 | ) | (0.5 | )% | (12,155 | ) | (0.5 | )% | (11,430 | ) | (0.5 | )% | |||||||||
| Income before income taxes |
86,481 | 5.0 | % | 299,809 | 12.1 | % | 287,157 | 12.6 | % | ||||||||||||
| Income taxes |
37,905 | 2.2 | % | 87,523 | 3.5 | % | 84,421 | 3.7 | % | ||||||||||||
| Net income |
$ | 48,576 | 2.8 | % | $ | 212,286 | 8.6 | % | $ | 202,736 | 8.9 | % | |||||||||
2009 Compared to 2008
Net Sales: Net sales for 2009 decreased 30.2% to $1,729,285 from $2,479,131 in 2008. The decrease in Net sales reflects a $738,535 (29.8%) decrease due to volume, a $13,130 (0.5%) decrease due to price, a $73,450 (3.0%) increase from acquisitions and a $71,631 (2.9%) unfavorable impact as a result of changes in foreign currency exchange rates.
Net sales for the North America Welding segment decreased 34.7% to $858,180 in 2009 compared with $1,313,881 in 2008. This decrease reflects a decrease of $456,826 (34.8%) due to volume, a $15,912 (1.2%) increase due to price and a $14,787 (1.1%) decrease as a result of changes in foreign currency exchange rates.
Net sales for the Europe Welding segment decreased 35.7% to $346,383 in 2009 compared with $538,570 in 2008. This decrease reflects a decrease of $130,235 (24.2%) due to volume, a $22,510 (4.2%) decrease due to price, a $5,242 (1.0%) increase from acquisitions and a $44,684 (8.3%) unfavorable impact as a result of changes in foreign currency exchange rates.
Net sales for the Asia Pacific Welding segment decreased 9.7% to $208,280 in 2009 compared with $230,661 in 2008. This decrease reflects a decrease of $68,447 (29.7%) due to volume, a $5,471 (2.4%) decrease due to price, a $54,638, (23.7%) increase from acquisitions and a $3,101 (1.3%) unfavorable impact as a result of changes in foreign currency exchange rates.
Net sales for the South America Welding segment decreased 14.6% to $99,171 in 2009 compared with $116,061 in 2008. This decrease reflects a decrease of $23,831 (20.5%) due to volume, a $13,117 (11.3%) increase due to price and a $6,176 (5.3%) unfavorable impact as a result of changes in foreign currency exchange rates.
15
Net sales for The Harris Products Group segment decreased 22.4% to $217,271 in 2009 compared with $279,958 in 2008. This decrease reflects a decrease of $59,196 (21.1%) due to volume, a $14,178 (5.1%) decrease due to price, a $13,570, (4.8%) increase from acquisitions and a $2,883 (1.0%) unfavorable impact as a result of changes in foreign currency exchange rates.
Gross Profit: Gross profit decreased 36.6% to $456,268 during 2009 compared with $720,151 in 2008. As a percentage of Net sales, Gross profit decreased to 26.4% in 2009 from 29.0% in 2008. This decrease was primarily a result of lower volumes, the liquidation of higher cost inventories and higher retirement costs in the U.S. of $15,466 offset by lower product liability costs of $5,412 primarily due to a gain on an insurance settlement. Foreign currency exchange rates had a $12,653 unfavorable translation impact in 2009. The LIFO reserve decreased by $28,467 as a result of decreases in commodity prices in 2009, primarily steel, and a reduction in inventory levels. The reduction in inventory levels resulted in a decrease to the LIFO reserve of $14,254.
Selling, General & Administrative (“SG&A”) Expenses: SG&A expenses decreased $71,981 (17.8%) during 2009 compared with 2008. The decrease was primarily due to lower bonus expense of $56,292, lower selling, administrative and research and development expenses of $11,574, the favorable translation impact of foreign currency exchange rates of $12,785 and incremental foreign currency transaction gains of $9,172 partially offset by higher retirement costs in the U.S. of $12,120 and incremental SG&A from acquisitions of $6,118. The Company realized a gain of $1,543 on the settlement of a pension obligation during 2009 that was recorded as a reduction to SG&A expenses.
Rationalization and Asset Impairment Charges (Gain): In 2009, the Company recorded $29,897 ($23,789 after-tax) in charges related to rationalization activities to align the business to current market conditions and asset impairments. These charges include $27,142 primarily related to employee severance costs, $2,061 in long-lived asset impairment charges and a gain of $185 recognized in connection with the partial settlement of a pension plan. Rationalization activities during the year affected 1,063 employees and included the closure of two manufacturing facilities. Impairment charges on certain indefinite-lived intangible assets of $879 were also included under this caption.
Interest Income: Interest income decreased to $3,462 in 2009 from $8,845 in 2008. The decrease was due to lower interest rates on Cash and cash equivalents in 2009 when compared with 2008.
Equity (Loss) Earnings in Affiliates: Equity loss in affiliates was $5,025 in 2009 compared with earnings of $6,034 in 2008. The equity loss in 2009 includes a loss of $7,943 associated with the acquisition of Jinzhou Jin Tai Welding and Metal Co, Ltd. (“Jin Tai”) and the related disposal of an interest in Kuang Tai Metal Industrial Co., Ltd. (“Kuang Tai”), the Company’s Taiwanese joint venture, and income of $5,667 as the Company’s share of a gain realized on the sale of a property by the Company’s joint venture in Turkey. Excluding these items, equity earnings decreased primarily as a result of losses at the Company’s joint venture in Taiwan prior to the acquisition of Jin Tai. See the “Acquisitions” section of Item 7 for additional information related to the acquisition of Jin Tai.
Interest Expense: Interest expense decreased to $8,521 in 2009 from $12,155 in 2008 primarily as a result of a lower average debt balance from the payment of $30,000 on the Senior Unsecured Note that matured in March 2009 and the impact of the amortization of gains on the terminated interest rate swaps.
Income Taxes: The Company recorded $37,905 of tax expense on pre-tax income of $86,481, resulting in an effective tax rate of 43.8% for 2009. The effective tax rate exceeds the Company’s statutory rate due to losses at certain non-U.S. entities, including the loss associated with the acquisition of Jin Tai and related disposal of Kuang Tai of $7,943, with no tax benefit, partially offset by a benefit for the utilization of foreign tax credits.
Net Income: Net income for 2009 was $48,576 compared with $212,286 in the prior year. Diluted earnings per share for 2009 were $1.14 compared with earnings of $4.93 per share in 2008. Foreign currency exchange rate movements had a favorable translation effect of $612 and $2,508 on net income for 2009 and 2008, respectively.
16
Non-GAAP Financial Measures: The Company reviews Operating income, Net income and Diluted earnings per share (“EPS”) excluding special items, non-GAAP financial measures, in assessing and evaluating the Company’s underlying operating performance. The following tables present reconciliations of Operating income, Net income and Diluted EPS as reported to Operating income, Net income and Diluted EPS excluding special items.
| Year Ended December 31, | |||||||
| 2009 | 2008 | ||||||
| Operating income as reported |
$ | 92,976 | $ | 295,404 | |||
| Special items: |
|||||||
| Rationalization charges |
29,018 | 2,447 | |||||
| Impairment charges |
879 | 16,924 | |||||
| Pension settlement gain |
(1,543 | ) | — | ||||
| Adjusted Operating income excluding special items |
$ | 121,330 | $ | 314,775 | |||
| Year Ended December 31, | |||||||
| 2009 | 2008 | ||||||
| Net income as reported |
$ | 48,576 | $ | 212,286 | |||
| Special items (after-tax): |
|||||||
| Rationalization charges |
23,193 | 1,698 | |||||
| Impairment charges |
596 | 16,615 | |||||
| Pension settlement gain |
(1,543 | ) | — | ||||
| Loss associated with the acquisition of Jin Tai |
7,943 | — | |||||
| Gain on sale of property |
(5,667 | ) | — | ||||
| Adjusted Net income excluding special items |
$ | 73,098 | $ | 230,599 | |||
| Diluted EPS |
$ | 1.14 | $ | 4.93 | |||
| Special items |
0.57 | 0.43 | |||||
| Adjusted Diluted EPS excluding special items |
$ | 1.71 | $ | 5.36 | |||
2008 Compared to 2007
Net Sales: Net sales for 2008 increased 8.7% to $2,479,131 from $2,280,784 in 2007. The increase in Net sales reflects an $88,436 (3.9%) decrease due to volume, a $176,045 (7.7%) increase due to price, a $67,538 (3.0%) increase from acquisitions and a $43,200 (1.9%) favorable impact as a result of changes in foreign currency exchange rates.
Net sales for the North America Welding segment increased 5.2% to $1,313,881 in 2008 compared with $1,248,382 in 2007. This increase reflects a decrease of $57,607 (4.6%) due to volume, a $113,883 (9.1%) increase due to price and a $9,425 (0.8%) increase from acquisitions.
Net sales for the Europe Welding segment increased 13.5% to $538,570 in 2008 compared with $474,388 in 2007. This increase reflects a decrease of $1,592 (0.3%) due to volume, a $6,458 (1.4%) increase due to price, a $29,827 (6.3%) increase from acquisitions and a $29,489 (6.2%) favorable impact as a result of changes in foreign currency exchange rates.
17
Net sales for the Asia Pacific Welding segment increased 29.5% to $230,661 in 2008 compared with $178,120 in 2007. This increase reflects a $21,752 (12.2%) increase due to price, a $23,159 (13.0%) increase from acquisitions and a $7,699 (4.3%) favorable impact as a result of changes in foreign currency exchange rates.
Net sales for the South America Welding segment increased 14.4% to $116,061 in 2008 compared with $101,426 in 2007. This increase reflects a decrease of $10,444 (10.3%) due to volume, a $20,883 (20.6%) increase due to price and a $4,196 (4.1%) favorable impact as a result of changes in foreign currency exchange rates.
Net sales for The Harris Products Group segment increased 0.5% to $279,958 in 2008 compared with $278,468 in 2007. This increase reflects a decrease of $18,724 (6.7%) due to volume, a $13,069 (4.7%) increase due to price, a $5,127 (1.8%) increase from acquisitions and a $2,018 (0.7%) favorable impact as a result of changes in foreign currency exchange rates.
Gross Profit: Gross profit increased 11.2% to $720,151 during 2008 compared with $647,566 in 2007. As a percentage of Net sales, Gross profit increased to 29.0% in 2008 from 28.4% in 2007. This increase was primarily a result of favorable pricing leverage and improved operational effectiveness partially offset by volume decreases and the continuing shift in sales mix to traditionally lower margin geographies and businesses. Foreign currency exchange rates had a $10,621 favorable impact in 2008.
Selling, General & Administrative Expenses: SG&A expenses increased $35,254 (9.5%) in 2008 compared with 2007. The increase was primarily due to higher selling expenses of $10,543 resulting from increased sales activity, incremental selling, general and administrative expenses from acquisitions totaling $9,222, higher bonus expense of $5,706 and higher foreign currency transaction losses of $4,381. Foreign currency exchange rates had a $5,587 unfavorable impact.
Rationalization and Asset Impairment Charges (Gain): In 2008, the Company recorded $19,371 in rationalization and asset impairment charges. This total included $2,447 ($1,698 after-tax) in rationalization charges related to workforce reductions that affected 67 employees in The Harris Products Group segment and 65 employees in the Europe Welding segment. The actions were taken to align the business to current market conditions. Asset impairment charges of $16,924 ($16,615 after-tax) included $15,582 (with no tax benefit) to write off goodwill and write down long-lived assets related to two businesses in China and $1,342 ($1,033 after-tax) to write down intangible assets in North America and Europe.
In 2007, the Company recorded a net gain of $188 ($107 after-tax) to rationalization charges due to a gain of $816 ($735 after-tax) related to the termination of the Harris Ireland Pension Plan offsetting other charges related to severance costs covering 66 employees at the Company’s facility in Ireland.
Interest Income: Interest income increased to $8,845 in 2008 from $8,294 in 2007. The increase was a result of higher cash balances partially offset by lower interest rate investments in 2008 when compared with 2007.
Equity Earnings in Affiliates: Equity earnings in affiliates decreased to $6,034 in 2008 from $9,838 in 2007 as a result of lower earnings at the Company’s joint venture investments in Turkey and Taiwan.
Interest Expense: Interest expense increased to $12,155 in 2008 from $11,430 in 2007 as a result of a lower level of amortization of the gain associated with previously terminated interest rate swap agreements and higher debt levels.
Income Taxes: Income taxes for 2008 were $87,523 on income before income taxes of $299,809, an effective rate of 29.2%, compared with income taxes of $84,421 on income before income taxes of $287,157, or an effective rate of 29.4% for 2007. The decrease in the effective tax rate for 2008 from 2007 was a result of additional utilization of foreign tax credits from the repatriation of higher-taxed earnings partially offset by non-deductible asset impairment charges in China. The effective rate for 2008 and 2007 was lower than the Company’s statutory rate primarily because of the utilization of foreign tax credits, lower taxes on non-U.S. earnings and the utilization of foreign tax loss carryforwards, for which valuation allowances had been previously provided.
18
Net Income: Net income for 2008 was $212,286 compared with $202,736 in the prior year. Diluted EPS for 2008 was $4.93 compared with $4.67 per share in 2007. Foreign currency exchange rate movements had a $2,508 and a $3,419 favorable effect on net income for 2008 and 2007, respectively.
Non-GAAP Financial Measures: The Company reviews Operating income, Net income and Diluted EPS excluding special items, non-GAAP financial measures, in assessing and evaluating the Company’s underlying operating performance. The following tables present reconciliations of Operating income, Net income and Diluted EPS as reported to Operating income, Net income and Diluted EPS excluding special items.
| Year Ended December 31, | |||||||
| 2008 | 2007 | ||||||
| Operating income as reported |
$ | 295,404 | $ | 277,632 | |||
| Special items: |
|||||||
| Rationalization charges (gain) |
2,447 | (188 | ) | ||||
| Impairment charges |
16,924 | — | |||||
| Adjusted Operating income excluding special items |
$ | 314,775 | $ | 277,444 | |||
| Year Ended December 31, | |||||||
| 2008 | 2007 | ||||||
| Net income as reported |
$ | 212,286 | $ | 202,736 | |||
| Special items (after-tax): |
|||||||
| Rationalization charges (gain) |
1,698 | (107 | ) | ||||
| Impairment charges |
16,615 | — | |||||
| Adjusted Net income excluding special items |
$ | 230,599 | $ | 202,629 | |||
| Diluted EPS |
$ | 4.93 | $ | 4.67 | |||
| Special items |
0.43 | — | |||||
| Adjusted Diluted EPS excluding special items |
$ | 5.36 | $ | 4.67 | |||
Liquidity and Capital Resources
The Company’s cash flow from operations, while cyclical, has been reliable and strong. Operational cash flow is a key driver of liquidity, providing cash and access to capital markets. In assessing liquidity, the Company reviews working capital measurements to define areas for improvement. Management anticipates the Company will be able to satisfy cash requirements for its ongoing businesses for the foreseeable future primarily with cash generated by operations, existing cash balances and, if necessary, borrowings under its existing credit facilities.
19
The following table reflects changes in key cash flow measures:
| Year Ended December 31, | $ Change | |||||||||||||||||||
| 2009 | 2008 | 2007 | 2009 vs. 2008 | 2008 vs. 2007 | ||||||||||||||||
| Cash provided by operating activities: |
$ | 250,350 | $ | 257,449 | $ | 249,832 | $ | (7,099 | ) | $ | 7,617 | |||||||||
| Cash used by investing activities: |
(63,581 | ) | (115,800 | ) | (79,705 | ) | 52,219 | (36,095 | ) | |||||||||||
| Capital expenditures |
(38,201 | ) | (72,426 | ) | (61,633 | ) | 34,225 | (10,793 | ) | |||||||||||
| Acquisition of businesses, net of cash acquired |
(25,449 | ) | (44,036 | ) | (18,773 | ) | 18,587 | (25,263 | ) | |||||||||||
| Cash used by financing activities: |
(89,072 | ) | (67,741 | ) | (77,586 | ) | (21,331 | ) | 9,845 | |||||||||||
| (Payments) proceeds on short-term borrowings, net |
(12,954 | ) | 6,104 | 2,826 | (19,058 | ) | 3,278 | |||||||||||||
| (Payments) proceeds on long-term borrowings, net |
(30,874 | ) | 319 | (40,142 | ) | (31,193 | ) | 40,461 | ||||||||||||
| Proceeds from exercise of stock options |
705 | 7,201 | 8,644 | (6,496 | ) | (1,443 | ) | |||||||||||||
| Tax benefit from exercise of stock options |
195 | 3,728 | 4,289 | (3,533 | ) | (561 | ) | |||||||||||||
| Purchase of shares for treasury |
(343 | ) | (42,337 | ) | (15,459 | ) | 41,994 | (26,878 | ) | |||||||||||
| Cash dividends paid to shareholders |
(45,801 | ) | (42,756 | ) | (37,744 | ) | (3,045 | ) | (5,012 | ) | ||||||||||
| Increase in Cash and cash equivalents |
103,804 | 66,950 | 97,170 | 36,854 | (30,220 | ) | ||||||||||||||
Cash and cash equivalents increased 36.5%, or $103,804, to $388,136 as of December 31, 2009, from $284,332 as of December 31, 2008. This compares with an increase of 30.8%, or $66,950, in Cash and cash equivalents during 2008.
Cash provided by operating activities for 2009 decreased $7,099 from 2008. The decrease was primarily due to lower net income that was largely offset by reductions in accounts receivable and inventory as the Company adjusted working capital levels commensurate with lower demand. Net operating working capital to net sales was 23.2% at December 31, 2009 compared with 24.8% at December 31, 2008. Days sales in inventory decreased to 100.8 days at December 31, 2009 from 115.8 days at December 31, 2008. Accounts receivable days increased to 56.9 days at December 31, 2009 from 55.0 days at December 31, 2008. Average days in accounts payable decreased to 30.0 days at December 31, 2009 from 32.1 days at December 31, 2008.
Cash used by investing activities decreased by $52,219 for 2009 compared with 2008. Cash used in the acquisition of businesses in 2009 decreased $18,587 from 2008. Capital expenditures during 2009 were $38,201, a $34,225 decrease from 2008. The Company anticipates capital expenditures in 2010 in the range of $40,000 — $50,000. Anticipated capital expenditures reflect plans to improve operational effectiveness and the Company’s continuing international expansion. Management critically evaluates all proposed capital expenditures and requires each project to increase efficiency, reduce costs, promote business growth or to improve the overall safety and environmental conditions of the Company’s facilities.
Cash used by financing activities for 2009 increased $21,331 from 2008. The increase was primarily due to the $30,000 repayment of the Company’s Series B Senior Unsecured Note upon maturity during the first quarter of 2009, a reduction in short-term borrowings of $12,954 in the current period versus an increase of $6,104 in the comparable period of 2008 and a decrease in proceeds from the exercise of stock options and related tax benefits of $10,029 partially offset by lower purchases of shares for treasury of $41,994.
The Company’s debt levels decreased from $142,230 at December 31, 2008, to $123,717 at December 31, 2009. Debt to total capitalization decreased to 10.2% at December 31, 2009 from 12.3% at December 31, 2008.
A total of $45,801 in dividends was paid during 2009. In January 2010, the Company paid a quarterly cash dividend of $0.28 cents per share, or $11,885 to shareholders of record on December 31, 2009.
20
Subsequent Events
The Company has investments in Venezuela which currently require the approval of a government agency to convert local currency to U.S. dollars at official government rates. Government approval for currency conversion to satisfy U.S. dollar liabilities to foreign suppliers, including payables to Lincoln affiliates, has lagged payment due dates from time to time in the past, resulting in higher cash balances and higher past due U.S. dollar payables within our Venezuelan subsidiary. If the Company had settled its Venezuelan subsidiary’s U.S. dollar liabilities using unofficial parallel currency exchange mechanisms as of December 31, 2009, it would have resulted in a currency exchange gain of approximately $437.
Cumulative inflation in Venezuela over the preceding three year period reached 100% during the fourth quarter of 2009. As a result, the Company changed the functional currency of its Venezuelan subsidiary to the U.S. dollar as of January 1, 2010. During January 2010, the Venezuelan government announced the devaluation of the official exchange rate used for most foreign currency transactions common to the Company’s Venezuelan subsidiary from 2.15 to 4.30 Bolivars to the U.S. dollar.
The Company’s Venezuelan subsidiary’s net Bolivar denominated monetary liability position is expected to result in a gain of approximately $2,500 during the first quarter of 2010. The Company also expects that its Venezuelan subsidiary’s results of operations will decrease significantly in 2010 due to the new exchange rate. The impact of selling inventories carried at the previous exchange rate is expected to decrease gross profit by approximately $5,000.
Rationalization and Asset Impairments
The Company recorded rationalization and asset impairment charges of $29,897 for the year ended December 31, 2009. These charges include $27,142 primarily related to employee severance costs, $2,061 in long-lived asset impairment charges, $879 in indefinite-lived intangible asset impairment charges and a gain of $185 recognized in connection with the partial settlement of a pension plan.
In the fourth quarter of 2009, the Company determined that the carrying value of certain long-lived assets exceeded fair value at operations affected by rationalization activities initiated in the second and third quarters of 2009. As a result, asset impairment charges totaling $2,061 were recognized in “Rationalization and asset impairment charges (gain).” Of the total asset impairment charges, $253 were recognized in the Europe Welding segment, $1,515 in the Asia Pacific Welding segment and $293 in The Harris Products Group segment. Fair values of impaired long-lived assets were determined primarily by third party appraisal.
During the third quarter of 2009, the Company initiated various rationalization actions including the closure of a manufacturing facility in Europe and the consolidation of certain manufacturing operations in the Europe Welding and Asia Pacific Welding segments. These actions impacted 80 employees in the Europe Welding segment, 175 employees in the Asia Pacific Welding segment and nine employees in the South America Welding segment. These actions are expected to cost approximately $12,000, of which the Company recorded rationalization charges of $8,333 for the year ended December 31, 2009. At December 31, 2009, a liability related to these actions of $3,912 was recorded in “Other current liabilities.” Costs related to these actions relate primarily to employee severance actions that are expected to be substantially completed and paid over the next year.
During the second quarter of 2009, the Company initiated various rationalization actions including the closure of a manufacturing facility in The Harris Products Group segment. These actions affected eight employees in the North America Welding segment, 61 employees in the Europe Welding segment, 81 employees in the Asia Pacific Welding segment, 23 employees in the South America Welding segment and 58 employees in The Harris Products Group segment. The Company recorded rationalization charges of $6,684 for the year ended December 31, 2009 related to these actions. A liability related to these actions of $2,445 was recorded in “Other current liabilities” at December 31, 2009. These costs relate primarily to employee severance actions that are essentially complete and are expected to be paid over the next year.
21
Rationalization actions taken during the first quarter of 2009 included a voluntary separation incentive program covering certain U.S.-based employees. These actions affected 408 employees in the North America Welding segment, 48 employees in the Europe Welding segment, 44 employees in the Asia Pacific Welding segment, 22 employees in the South America Welding segment and 46 employees in The Harris Products Group segment. The Company recorded rationalization charges of $12,092 for the year ended December 31, 2009 related to these actions. At December 31, 2009, all activities associated with these actions were completed.
Rationalization actions taken during the fourth quarter of 2008 affected 67 and 65 employees in The Harris Products Group and Europe Welding segments, respectively. The Company recorded rationalization charges of $2,447 at December 31, 2008 and $33 for the year ended December 31, 2009 related to these actions. At December 31, 2009, all activities associated with these actions were completed.
The Company continues evaluating its cost structure and additional rationalization actions may result in charges in subsequent quarters.
In the fourth quarter of 2008, the Company recorded asset impairment charges totaling $16,924 in “Rationalization and asset impairment charges (gain).”
In the fourth quarter of 2008, the Company determined that poor operating results and a dampened economic outlook indicated the potential for impairment at two of its businesses in China. Impairment testing determined that the carrying value of long-lived assets exceeded fair value at one of these businesses and the Company recorded a charge of $2,388. In addition, the carrying value of goodwill at both of these businesses exceeded the implied value of goodwill and the Company recorded a charge of $13,194.
The Company also tested indefinite-lived intangible assets and determined that the carrying value of certain intangible assets in the Europe Welding and North America Welding segments exceeded fair value. As a result, the Company recorded charges of $524 and $818, respectively.
Fair values of impaired assets were determined using projected discounted cash flows.
In 2005, the Company committed to a plan to rationalize manufacturing operations at Harris Calorific Limited (“Harris Ireland”). The Company incurred a total of $3,920 in charges related to this plan of which a gain of $188 was recorded in 2007. During 2009, the Company received cash of $1,740 related to the termination of the Harris Ireland pension plan and recognized a gain of $185.
Acquisitions
On July 29, 2009, the Company completed the acquisition of 100% of Jin Tai, based in Jinzhou, China. This transaction expanded the Company’s customer base and gave the Company control of significant cost-competitive solid wire manufacturing capacity.
The Company previously held a 21% direct interest in Jin Tai and a further 27% indirect interest via its 35% interest in Kuang Tai. Under the terms of the agreement, the Company exchanged its 35% interest in Kuang Tai with a fair value of $22,723, paid cash of $35,531 and will pay an additional $4,181 in cash over a three-year period after close.
The fair value of the Company’s previous non-controlling direct interest in Jin Tai was $8,675. The carrying values of the Company’s interests in Kuang Tai and Jin Tai were $29,368 and $9,973, respectively. The excess carrying value over fair value of these interests resulted in a loss on the transaction of $7,943 recorded in “Equity (loss) earnings in affiliates.”
The Company previously reported its proportional share of Jin Tai’s net income under the equity method in “Equity (loss) earnings in affiliates.” Jin Tai’s sales were $186,774 in 2008 and $74,834 in 2009 prior to the acquisition. Jin Tai’s sales of $53,956 after the acquisition were included in “Net sales” for 2009. The pro forma impact on the results of operations if the acquisition had been completed as of the beginning of both 2009 and 2008 would not have been significant.
22
The identifiable assets acquired and liabilities assumed upon the acquisition of Jin Tai were as follows:
| July 29, 2009 | |||
| Cash and cash equivalents |
$ | 16,032 | |
| Accounts receivable |
23,306 | ||
| Inventory |
17,037 | ||
| Other current assets |
18,932 | ||
| Property, plant and equipment |
29,275 | ||
| Intangibles |
15,201 | ||
| Goodwill |
1,429 | ||
| Other non-current assets |
5,585 | ||
| Total assets acquired |
126,797 | ||
| Amounts due banks |
28,833 | ||
| Trade accounts payable |
2,306 | ||
| Current liabilities |
7,839 | ||
| Long-term liabilities |
15,459 | ||
| Total liabilities assumed |
54,437 | ||
| Net assets acquired |
$ | 72,360 | |
All assets acquired and liabilities assumed were recorded at estimated fair value. Goodwill of $1,429 was allocated to the Asia Pacific Welding segment and is not deductible for income tax purposes under current tax law. Net assets acquired included a non-controlling interest in one of Jin Tai’s operations valued at $1,250. This non-controlling interest was subsequently acquired and accounted for as an equity transaction.
On October 1, 2008, the Company acquired a 90% interest in a leading Brazilian manufacturer of brazing products for approximately $24,000 in cash and assumed debt. The newly acquired company, based in Sao Paulo, is being operated as Harris Soldas Especiais S.A. This acquisition expanded the Company’s brazing product line and increased the Company’s presence in the South American market. Annual sales at the time of the acquisition were approximately $30,000.
On April 7, 2008, the Company acquired all of the outstanding stock of Electro-Arco S.A. (“Electro-Arco”), a privately held manufacturer of welding consumables headquartered near Lisbon, Portugal, for approximately $24,000 in cash and assumed debt. This acquisition added to the Company’s European consumables manufacturing capacity and widened the Company’s commercial presence in Western Europe. Annual sales at the time of the acquisition were approximately $40,000.
On November 30, 2007, the Company acquired the assets and business of Vernon Tool Company Ltd. (“Vernon Tool”), a privately held manufacturer of computer-controlled pipe cutting equipment used for precision fabrication purposes headquartered near San Diego, California, for approximately $12,434 in cash. This acquisition added to the Company’s ability to support its customers in the market for infrastructure development. Annual sales at the time of the acquisition were approximately $9,000.
On November 29, 2007, the Company announced that it had entered into a majority-owned joint venture with Zhengzhou Heli Welding Materials Company Ltd. (“Zhengzhou Heli”), a privately held manufacturer of subarc flux based in Zhengzhou, China. The Company has contributed $16,400 to Zhengzhou Heli. Annual sales at the time of the acquisition were approximately $8,000.
23
On July 20, 2007, the Company acquired Nanjing Kuang Tai Welding Materials Company, Ltd. (“Nanjing”), a manufacturer of stick electrode products based in Nanjing, China, for approximately $4,245 in cash and assumed debt. The Company previously owned 35% of Nanjing indirectly through its investment in Kuang Tai. Annual sales at the time of the acquisition were approximately $10,000.
On March 30, 2007, the Company acquired all of the outstanding stock of Spawmet Sp. z o.o. (“Spawmet”), a privately held manufacturer of welding consumables headquartered near Katowice, Poland, for approximately $5,000 in cash. This acquisition provided the Company with a portfolio of stick electrode products and broadened its distributor network in Poland and Eastern Europe. Annual sales at the time of the acquisition were approximately $5,000.
Acquired companies are included in the Company’s consolidated financial statements as of the date of acquisition.
The Company continues to expand globally and periodically looks at transactions that would involve significant investments. The Company can fund its global expansion plans with operational cash flow, but a significant acquisition may require access to capital markets, in particular, the public and/or private bond market, as well as the syndicated bank loan market. The Company’s financing strategy is to fund itself at the lowest after-tax cost of funding. Where possible, the Company utilizes operational cash flows and raises capital in the most efficient market, usually the U.S., and then lends funds to the specific subsidiary that requires funding. If additional acquisitions providing appropriate financial benefits become available, additional expenditures may be made.
Debt
During March 2002, the Company issued Senior Unsecured Notes (the “Notes”) totaling $150,000 through a private placement. The Notes have original maturities ranging from five to ten years with a weighted-average interest rate of 6.1% and an average tenure of eight years. Interest is payable semi-annually in March and September. The proceeds are being used for general corporate purposes, including acquisitions, and are generally invested in short-term, highly liquid investments. The Notes contain certain affirmative and negative covenants, including restrictions on asset dispositions and financial covenants (interest coverage and funded debt-to-EBITDA, as defined in the Notes Agreement, ratios). As of December 31, 2009, the Company was in compliance with all of its debt covenants. The Company repaid the $40,000 Series A Notes and the $30,000 Series B Notes in March 2007 and March 2009, respectively, reducing the balance outstanding of the Notes to $80,000, which is due March 2012.
During March 2002, the Company entered into floating rate interest rate swap agreements totaling $80,000 to convert a portion of the Notes outstanding from fixed to floating rates. These swaps were designated as fair value hedges and, as such, the gains or losses on the derivative instrument, as well as the offsetting gains or losses on the hedged item attributable to the hedged risk, were recognized in earnings. Net payments or receipts under these agreements were recognized as adjustments to “Interest expense.” In May 2003, these swap agreements were terminated. The gain of $10,613 on the termination of these swaps was deferred and is being amortized as an offset to “Interest expense” over the remaining life of the Notes. The amortization of this gain reduced “Interest expense” by $313 in 2009, $958 in 2008 and $1,121 in 2007, and is expected to reduce annual “Interest expense” by $206 in 2010. At December 31, 2009, $442 remains to be amortized and is recorded in “Long-term debt, less current portion.”
During July 2003 and April 2004, the Company entered into various floating rate interest rate swap agreements totaling $110,000 to convert a portion of the Notes outstanding from fixed to floating rates based on the London Inter-Bank Offered Rate (“LIBOR”). These swaps were designated and qualified as fair value hedges and, as such, the gains or losses on the derivative instrument, as well as the offsetting gains or losses on the hedged item, were recognized in earnings. Net payments or receipts under these agreements were recognized as adjustments to “Interest expense.”
During February 2009, the Company terminated swaps with a notional value of $80,000 and realized a gain of $5,079. This gain was deferred and is being amortized over the remaining life of the Notes. The amortization of
24
this gain reduced “Interest expense” by $1,429 in 2009 and is expected to reduce annual “Interest expense” by $1,661 in 2010. At December 31, 2009, $3,650 remains to be amortized and is included in “Long-term debt, less current portion.”
During March 2009, swaps designated as fair value hedges that converted the $30,000 Series B Notes from fixed to floating interest rates matured with the underlying Notes. The Company has no interest rate swaps outstanding at December 31, 2009. The weighted average effective rate on the Notes, net of the impact of swaps, was 4.1% and 4.6% for 2009 and 2008, respectively.
At December 31, 2009 and 2008, the fair value of long term debt, including the current portion, was approximately $91,365 and $124,446, respectively, which was determined using available market information and methodologies requiring judgment. Since considerable judgment is required in interpreting market information, the fair value of the debt is not necessarily the amount which could be realized in a current market exchange.
Revolving Credit Agreement
On November 18, 2009, the Company entered into an Amended and Restated Credit Agreement (“Credit Agreement”) for a $150,000 revolving credit facility to be used for general corporate purposes. This Credit Agreement amended and restated the Company’s $175,000 revolving credit agreement that was entered into on December 17, 2004 and had a maturity date in December 2009. The Credit Agreement has a three-year term and may be increased, subject to certain conditions, by an additional amount up to $75,000 at any time not later than 180 days prior to the last day of the term. The interest rate on borrowings is based on either LIBOR or the prime rate, plus a spread based on the Company’s leverage ratio, at the Company’s election. A quarterly facility fee is payable based upon the daily aggregate amount of commitments and the Company’s leverage ratio.
The Credit Agreement contains customary affirmative, negative and financial covenants for credit facilities of this type, including limitations on the Company with respect to liens, investments, distributions, mergers and acquisitions, dispositions of assets, transactions with affiliates and a fixed charges coverage ratio and total leverage ratio. As of December 31, 2009, there were no borrowings under the Credit Agreement.
Short-term Borrowings
The Company’s short-term borrowings included in “Amounts due banks” were $34,577 and $19,436 at December 31, 2009 and 2008, respectively, and represent the borrowings of foreign subsidiaries at weighted average interest rates of 8.35% and 22.78%, respectively. The decrease in the weighted average interest rate in 2009 is primarily due to the low interest rate short-term borrowings at Jin Tai offsetting higher interest rate borrowings at the Company’s subsidiary in Venezuela. The higher weighted average interest rate in 2008 was due to borrowings at the Company’s subsidiary in Venezuela.
25
Contractual Obligations and Commercial Commitments
The Company’s contractual obligations and commercial commitments as of December 31, 2009 are as follows:
| Payments Due By Period | |||||||||||||||
| Total | 2010 | 2011 to 2012 |
2013 to 2014 |
2015 and Beyond | |||||||||||
| Long-term debt |
$ | 82,209 | $ | 326 | $ | 80,457 | $ | 303 | $ | 1,123 | |||||
| Interest on long-term debt |
13,209 | 5,235 | 7,828 | 53 | 93 | ||||||||||
| Capital lease obligations |
2,839 | 964 | 1,652 | 83 | 140 | ||||||||||
| Short-term debt |
34,577 | 34,577 | — | — | — | ||||||||||
| Interest on short-term debt |
904 | 904 | — | — | — | ||||||||||
| Operating leases |
34,709 | 9,923 | 12,559 | 4,995 | 7,232 | ||||||||||
| Total contractual cash obligations |
$ | 168,447 | $ | 51,929 | $ | 102,496 | $ | 5,434 | $ | 8,588 | |||||
As of December 31, 2009, there were $42,840 of tax liabilities related to unrecognized tax benefits. Because of the high degree of uncertainty regarding the timing of future cash outflows associated with these liabilities, the Company is unable to estimate the years in which settlement will occur with the respective taxing authorities. See Note 9 to the Company’s Consolidated Financial Statements for further discussion.
The Company expects to contribute $30,000 to the U.S. pension plans in 2010.
Stock-Based Compensation
On April 28, 2006, the shareholders of the Company approved the 2006 Equity and Performance Incentive Plan, as amended (“EPI Plan”), which replaced the 1998 Stock Plan, as amended and restated in May 2003. The EPI Plan provides for the granting of options, appreciation rights, restricted shares, restricted stock units and performance-based awards up to an additional 3,000,000 of the Company’s common shares. In addition, on April 28, 2006, the shareholders of the Company approved the 2006 Stock Plan for Non-Employee Directors, as amended (“Director Plan”), which replaced the Stock Option Plan for Non-Employee Directors adopted in 2000. The Director Plan provides for the granting of options, restricted shares and restricted stock units up to an additional 300,000 of the Company’s common shares.
Under these plans, options and restricted shares granted were 386,305 in 2009, 316,264 in 2008 and 268,854 in 2007. The Company issued shares of common stock from treasury upon all exercises of stock options and the granting of restricted stock awards in 2009, 2008 and 2007.
Expense is recognized for all awards of stock-based compensation by allocating the aggregate grant date fair value over the vesting period. No expense is recognized for any stock options, restricted or deferred shares ultimately forfeited because recipients fail to meet vesting requirements. Total stock-based compensation expense recognized in the consolidated statements of income for 2009, 2008 and 2007 was $5,432, $4,738 and $4,679, respectively. The related tax benefit for 2009, 2008 and 2007 was $2,058, $1,793 and $1,789, respectively. As of December 31, 2009, total unrecognized stock-based compensation expense related to nonvested stock options and restricted shares was $13,508, which is expected to be recognized over a weighted average period of approximately 39 months.
The aggregate intrinsic value of awards outstanding at December 31, 2009, based on the Company’s closing stock price of $53.46 as of the last business day of the year ended December 31, 2009, which would have been received by the optionees had all options been exercised on that date was $32,367. The aggregate intrinsic value of awards exercisable at December 31, 2009, based on the Company’s closing stock price of $53.46 as of the last business day of the year ended December 31, 2009, which would have been received by the optionees had all
26
awards been exercised on that date was $19,385. The total intrinsic value of awards exercised during 2009 and 2008 was $2,236 and $10,366, respectively. Intrinsic value is the amount by which the fair value of the underlying stock exceeds the exercise price of the awards.
Product Liability Expense
Product liability expenses have been significant particularly with respect to welding fume claims. Costs incurred are volatile and are largely related to trial activity. The costs associated with these claims are predominantly defense costs which are recognized in the periods incurred. Product liability costs decreased $5,412 in 2009 compared with 2008 primarily due to an insurance settlement. See Note 12 to the Company’s Consolidated Financial Statements for further discussion.
The long-term impact of the welding fume loss contingency, in the aggregate, on operating results, operating cash flows and access to capital markets is difficult to assess, particularly since claims are in many different stages of development and the Company benefits significantly from cost sharing with co-defendants and insurance carriers. Moreover, the Company has been largely successful to date in its defense of these claims and indemnity payments have been immaterial. If cost sharing dissipates for some currently unforeseen reason, or the Company’s trial experience changes overall, it is possible on a longer term basis that the cost of resolving this loss contingency could materially reduce the Company’s operating results, cash flows and restrict capital market access.
Off-Balance Sheet Financial Instruments
The Company utilizes letters of credit to back certain payment and performance obligations. Letters of credit are subject to limits based on amounts outstanding under the Company’s Credit Agreement. The Company has also provided a guarantee on loans for an unconsolidated joint venture of approximately $1,381 at December 31, 2009. The Company believes the likelihood is remote that any payment will be required under this arrangement because of the current financial condition of the joint venture. See Note 12 to the Company’s Consolidated Financial Statements for further discussion.
New Accounting Pronouncements
New Accounting Standards Adopted:
In June 2009, the Financial Accounting Standards Board (“FASB”) issued Accounting Standards Codification (“ASC”) topic 105 (formerly Statement of Financial Accounting Standards (“SFAS”) 168, “The FASB Accounting Standards Codification and the Hierarchy of Generally Accepted Accounting Principles”). ASC 105 established the FASB Accounting Standards Codification as the source of authoritative accounting principles recognized by the FASB to be applied by entities in the preparation of financial statements in conformity with generally accepted accounting principles (“GAAP”). This pronouncement is effective for financial statements issued for interim and annual periods ending after September 15, 2009. The Company adopted this pronouncement in 2009. Adoption did not have a significant impact on the Company’s financial statements.
In May 2009, the FASB issued ASC 855 (formerly SFAS 165, “Subsequent Events”). ASC 855 established general standards of accounting for disclosure of events that occur after the balance sheet date but before financial statements are issued or are available to be issued. In particular, ASC 855 sets forth the period after the balance sheet date during which management should evaluate events or transactions that may occur for potential recognition or disclosure in the financial statements, the circumstances under which an entity should recognize events or transactions occurring after the balance sheet date in its financial statements and the disclosures that an entity should make about events or transactions that occurred after the balance sheet date. ASC 855 was adopted in 2009 and did not have a significant impact on the Company’s financial statements.
In December 2008, the FASB issued ASC 715 (formerly FSP FAS 132(R)-1, “Employers’ Disclosures about Postretirement Benefit Plan Assets”). ASC 715 requires disclosure about an entity’s investment policies and
27
strategies, the categories of plan assets, concentrations of credit risk and fair value measurements of plan assets. The standard, effective for fiscal years ending after December 15, 2009, resulted in increased disclosures in the notes to the Company’s financial statements related to the assets of the Company’s defined benefit pension plans.
In November 2008, the FASB issued ASC 323-10 (formerly Emerging Issues Task Force (“EITF’) Issue 08-6, “Equity Method Investment Accounting Considerations”). ASC 323-10 addresses the impact that ASC 805 (formerly SFAS 141(R)), and ASC 810 (formerly SFAS 160), might have on the accounting for equity method investments including how the initial carrying value of an equity method investment should be determined, how it should be tested for impairment and how changes in classification from equity method to cost method should be treated. ASC 323-10 is to be implemented prospectively and is effective for fiscal years beginning after December 15, 2008. The adoption of ASC 323-10 did not have a significant impact on the Company’s financial statements.
In June 2008, the FASB issued ASC 260-10 (formerly FSP EITF 03-6-1, “Determining Whether Instruments Granted in Share-Based Payment Transactions Are Participating Securities”). ASC 260-10 determined that unvested share-based payment awards that contain rights to receive nonforfeitable dividends or dividend equivalents (whether paid or unpaid) are participating securities, and thus, should be included in the two-class method of computing earnings per share. This standard did not have a significant impact on the Company’s disclosure of earnings per share.
In April 2008, the FASB issued ASC 275-10 and ASC 350-30 (formerly FSP 142-3, “Determination of the Useful Life of Intangible Assets”). These standards amend the factors that should be considered in developing renewal or extension assumptions used to determine the useful life of a recognized intangible asset under ASC 350 (formerly SFAS 142, “Goodwill and Other Intangible Assets”). ASC 275-10 and ASC 350-30 are effective for financial statements issued for fiscal years beginning after December 15, 2008 and interim periods within those fiscal years. ASC 275-10 and ASC 350-30 apply prospectively to intangible assets acquired after adoption. The adoption of ASC 275-10 and ASC 350-30 did not have a significant impact on the Company’s financial statements.
In March 2008, the FASB issued ASC 815 (formerly SFAS 161, “Disclosures about Derivative Instruments and Hedging Activities”). ASC 815 requires disclosures of how and why an entity uses derivative instruments, how derivative instruments and related hedged items are accounted for and how derivative instruments and related hedged items affect an entity’s financial position, financial performance and cash flows. ASC 815 is effective for fiscal years beginning after November 15, 2008 with early adoption permitted. The Company adopted these provisions as of January 1, 2009. See Note 10 for the Company’s disclosures pursuant to adoption.
In December 2007, the FASB issued ASC 810 (formerly SFAS 160, “Noncontrolling Interests in Consolidated Financial Statements”). ASC 810 clarifies that a noncontrolling interest in a subsidiary is an ownership interest in the consolidated entity that should be reported as equity in the consolidated financial statements. ASC 810 changes the way the consolidated statement of income is presented thus requiring consolidated net income to be reported at amounts that include the amounts attributable to both parent and the noncontrolling interest. This pronouncement is effective for fiscal years and interim periods within those fiscal years beginning on or after December 15, 2008. The Company adopted these provisions as of January 1, 2009, applying the presentation and disclosure requirements retrospectively resulting in reclassification of noncontrolling interests from “Other non-current liabilities” to “Total equity.” Income attributable to noncontrolling interests is included in “Selling, general and administrative expenses” in the Consolidated Statements of Income and is not material to the Company. Therefore, the Company did not present income attributable to non-controlling interests separately in the Consolidated Statements of Income.
In December 2007, the FASB issued ASC 805 (formerly SFAS 141 (revised 2007), “Business Combinations” which replaced SFAS 141, “Business Combinations”). ASC 805 retains the fundamental requirements in SFAS 141 that the acquisition method of accounting (which SFAS 141 called the purchase method) be used for all business combinations and for an acquirer to be identified for each business combination. ASC 805 defines the acquirer as the entity that obtains control of one or more businesses in the business combination and establishes
28
the acquisition date as the date that the acquirer achieves control. ASC 805 requires an acquirer to recognize the assets acquired, the liabilities assumed and any noncontrolling interest in the acquiree at the acquisition date measured at their fair values as of that date with limited exceptions specified in the statement. ASC 805 applies prospectively to business combinations for which the acquisition date is on or after the beginning of the first annual reporting period beginning on or after December 15, 2008.
New Accounting Standards to be Adopted:
In January 2010, the FASB issued Accounting Standards Update (“ASU”) No. 2010-06, “Fair Value Measurements and Disclosures (Topic 820) Improving Disclosures about Fair Value Measurements.” ASU 2010-06 amends ASC 820-10-50 to require additional information to be disclosed principally with respect to Level 3 fair value measurements and transfers to and from Level 1 and Level 2 measurements; in addition, enhanced disclosure is required concerning inputs and valuation techniques used to determine Level 2 and Level 3 fair value measurements. The new disclosures and clarifications of existing disclosures, as required by ASU 2010-06, are effective for interim and annual reporting periods beginning after December 15, 2009, except for the disclosures about purchases, sales, issuances and settlements in the roll forward of activity in Level 3 fair value measurements. Those disclosures are effective for fiscal years beginning after December 15, 2010, and for interim periods within those fiscal years. Earlier application is permitted. ASU No. 2010-06 is not expected to have a significant impact on the Company’s financial statements.
In December 2009, the FASB issued ASU No. 2009-17, “Consolidations (Topic 810) Improvements to Financial Reporting by Enterprises Involved with Variable Interest Entities an Amendment of the FASB Accounting Standards Codification.” In June 2009, the FASB issued ASC 810 (formerly SFAS 167, “Amendments to FASB Interpretation No. 46(R)”). The objective of ASC 810 is to amend certain requirements of FASB Interpretation 46 (R) (revised December 2003), “Consolidation of Variable Interest Entities,” to improve financial reporting by enterprises involved with variable interest entities and to provide more relevant and reliable information to users of financial statements. ASC 810 will be effective as of the beginning of each reporting entity’s first annual reporting period that begins after November 15, 2009, for interim periods within that first annual reporting period, and for interim and annual reporting periods thereafter. Earlier application is prohibited. ASU No. 2009-17 is not expected to have a significant impact on the Company’s financial statements.
In December 2009, the FASB issued ASU No. 2009-16, “Transfers and Servicing (Topic 860) Accounting for Transfers of Financial Assets an Amendment of the FASB Accounting Standards Codification.” In June 2009, the FASB issued ASC 860, “Transfers and Servicing,” (formerly SFAS 166, “Accounting for Transfers of Financial Assets, an amendment of FASB Statement No. 140”). The objective of ASC 860 is to improve the relevance, representational faithfulness and comparability of the information that a reporting entity provides in its financial reports about a transfer of financial assets; the effects of a transfer on its financial position, financial performance and cash flows; and a transferor’s continuing involvement in transferred financial assets. ASC 860 must be applied as of the beginning of each reporting entity’s first annual reporting period that begins after November 15, 2009, for interim periods within that first annual reporting period and for interim and annual reporting periods thereafter. Earlier application is prohibited. ASU No. 2009-16 must be applied to transfers occurring on or after the effective date. ASU No. 2009-16 is not expected to have a significant impact on the Company’s financial statements.
In October 2009, the FASB issued ASU No. 2009-13, “Revenue Recognition (Topic 605) Multiple-Deliverable Revenue Arrangements a consensus of the FASB Emerging Issues Task Force.” This update provides amendments to the criteria in Subtopic ASC 605-25. ASU No. 2009-13 provides principles for allocating consideration among multiple-elements and accounting for separate deliverables under an arrangement. ASC 605-25, as amended, introduces an estimated selling price method for valuing the elements of a bundled arrangement if vendor-specific objective evidence or third-party evidence of selling price is not available and significantly expands related disclosure requirements. This standard is effective on a prospective basis for revenue arrangements entered into or materially modified in fiscal years beginning on or after June 15, 2010. Alternatively, adoption may be on a retrospective basis and early application is permitted. The Company is currently evaluating the impact of ASU No. 2009-13, but does not expect it will have a significant impact on the Company’s financial statements.
29
Critical Accounting Policies
The Company’s consolidated financial statements are based on the selection and application of significant accounting policies, which require management to make estimates and assumptions. These estimates and assumptions are reviewed periodically by management and compared to historical trends to determine the accuracy of estimates and assumptions used. If warranted, these estimates and assumptions may be changed as current trends are assessed and updated. Historically, the Company’s estimates have been determined to be reasonable. No material changes to the Company’s accounting policies were made during 2009. The Company believes the following are some of the more critical judgment areas in the application of its accounting policies that affect its financial condition and results of operations.
Legal and Tax Contingencies
The Company, like other manufacturers, is subject from time to time to a variety of civil and administrative proceedings arising in the ordinary course of business. Such claims and litigation include, without limitation, product liability claims and health, safety and environmental claims, some of which relate to cases alleging asbestos and manganese-induced illnesses. The costs associated with these claims are predominantly defense costs, which are recognized in the periods incurred. Insurance reimbursements mitigate these costs and, where reimbursements are probable, they are recognized in the applicable period. With respect to costs other than defense costs (i.e., for liability and/or settlement or other resolution), reserves are recorded when it is probable that the contingencies will have an unfavorable outcome. The Company accrues its best estimate of the probable costs, after a review of the facts with management and counsel and taking into account past experience. If an unfavorable outcome is determined to be reasonably possible but not probable, or if the amount of loss cannot be reasonably estimated, disclosure is provided for material claims or litigation. Many of the current cases are in differing procedural stages and information on the circumstances of each claimant, which forms the basis for judgments as to the validity or ultimate disposition of such actions, will vary greatly. Therefore, in many situations a range of possible losses cannot be made. Reserves are adjusted as facts and circumstances change and related management assessments of the underlying merits and the likelihood of outcomes change. Moreover, reserves only cover identified and/or asserted claims. Future claims could, therefore, give rise to increases to such reserves. See Note 12 to the Company’s Consolidated Financial Statements and the Legal Proceedings section of this Annual Report on Form 10-K for further discussion of legal contingencies.
The Company is subject to taxation from U.S. federal, state, municipal and international jurisdictions. The calculation of current income tax expense is based on the best information available and involves significant management judgment. The actual income tax liability for each jurisdiction in any year can in some instances be ultimately determined several years after the financial statements are published.
The Company maintains reserves for estimated income tax exposures for many jurisdictions. Exposures are settled primarily through the completion of audits within each individual tax jurisdiction or the closing of a statute of limitation. Exposures can also be affected by changes in applicable tax law or other factors, which may cause management to believe a revision of past estimates is appropriate. Management believes that an appropriate liability has been established for income tax exposures; however, actual results may materially differ from these estimates.
Deferred Income Taxes
Deferred income taxes are recognized at currently enacted tax rates for temporary differences between the financial reporting and income tax bases of assets and liabilities and operating loss and tax credit carryforwards. The Company does not provide deferred income taxes on unremitted earnings of certain non-U.S. subsidiaries which are deemed permanently reinvested. It is not practicable to calculate the deferred taxes associated with the remittance of these earnings. Deferred income taxes of $283 have been provided on earnings of $1,831 that are not expected to be permanently reinvested. At December 31, 2009, the Company had approximately $141,730 of gross deferred tax assets related to deductible temporary differences and tax loss and credit carryforwards which may reduce taxable income in future years.
30
In assessing the realizability of deferred tax assets, the Company assesses whether it is more likely than not that a portion or all of the deferred tax assets will not be realized. The Company considers the scheduled reversal of deferred tax liabilities, tax planning strategies, and projected future taxable income in making this assessment. At December 31, 2009, a valuation allowance of $34,095 was recorded against these deferred tax assets based on this assessment. The Company believes it is more likely than not that the tax benefit of the remaining net deferred tax assets will be realized. The amount of net deferred tax assets considered realizable could be increased or reduced in the future if the Company’s assessment of future taxable income or tax planning strategies changes.
Pensions
The Company maintains a number of defined benefit and defined contribution plans to provide retirement benefits for employees. These plans are maintained and contributions are made in accordance with the Employee Retirement Income Security Act of 1974 (“ERISA”), local statutory law or as determined by the Board of Directors. The plans generally provide benefits based upon years of service and compensation. Pension plans are funded except for a domestic non-qualified pension plan for certain key employees and certain foreign plans.
A substantial portion of the Company’s pension amounts relates to its defined benefit plan in the United States. The fair value of plan assets is determined at December 31 of each year.
A significant element in determining the Company’s pension expense is the expected return on plan assets. At the end of each year, the expected return on plan assets is determined based on the weighted average expected return of the various asset classes in the plan’s portfolio and the targeted allocation of plan assets. The asset class return is developed using historical asset return performance as well as current market conditions such as inflation, interest rates and equity market performance. The Company determined this rate to be 8.0% and 8.2% for its U.S. plans at December 31, 2009 and 2008, respectively. The assumed long-term rate of return on assets is applied to the market value of plan assets. This produces the expected return on plan assets included in pension expense. The difference between this expected return and the actual return on plan assets is deferred and amortized over the average remaining service period of active employees expected to receive benefits under the plan. The amortization of the net deferral of past losses will increase future pension expense. During 2009, investment returns in the Company’s U.S. pension plans were 16.3% compared with a decline of 22.2% in 2008. A 25 basis point change in the expected return on plan assets would increase or decrease pension expense by approximately $1,500.
Another significant element in determining the Company’s pension expense is the discount rate for plan liabilities. To develop the discount rate assumption to be used, the Company refers to the yield derived from matching projected pension payments with maturities of a portfolio of available non-callable bonds rated AA- or better. The Company determined this rate to be 5.8% for its U.S. plans at December 31, 2009. A 12.5 basis point change in the discount rate would increase or decrease pension expense by approximately $1,000.
Pension expense relating to the Company’s defined benefit plans was $34,774, $4,613 and $6,260 in 2009, 2008 and 2007, respectively. The Company expects 2010 pension expense to decrease by approximately $2,000 to $4,000.
The Company made voluntary contributions to its U.S. defined benefit plans of $45,000, $20,000 and $10,000 in 2009, 2008 and 2007, respectively. The Company expects to voluntarily contribute $30,000 to its U.S. plans in 2010. Based on current pension funding rules, the Company does not anticipate that contributions to the plans would be required in 2010.
Inventories
Inventories are valued at the lower of cost or market. Fixed manufacturing overhead costs are allocated to inventory based on normal production capacity and abnormal manufacturing costs are recognized as period costs.
31
For most domestic inventories, cost is determined principally by the last-in, first-out (“LIFO”) method, and for non-U.S. inventories, cost is determined by the first-in, first-out (“FIFO”) method. The valuation of LIFO inventories is made at the end of each year based on inventory levels and costs at that time. The excess of current cost over LIFO cost amounted to $62,447 at December 31, 2009 and $90,914 at December 31, 2008. The Company reviews the net realizable value of inventory on an on-going basis, with consideration given to deterioration, obsolescence and other factors. If actual market conditions differ from those projected by management, and the Company’s estimates prove to be inaccurate, write-downs of inventory values and adjustments to cost of sales may be required. Historically, the Company’s reserves have approximated actual experience.
Accounts Receivable
The Company maintains an allowance for doubtful accounts for estimated losses from the failure of its customers to make required payments for products delivered. The Company estimates this allowance based on the age of the related receivable, knowledge of the financial condition of customers, review of historical receivables and reserve trends and other pertinent information. If the financial condition of customers deteriorates or an unfavorable trend in receivable collections is experienced in the future, additional allowances may be required. Historically, the Company’s reserves have approximated actual experience.
Long-Lived Assets
The Company periodically evaluates whether current facts or circumstances indicate that the carrying value of its depreciable long-lived assets to be held and used may not be recoverable. If such circumstances are determined to exist, an estimate of undiscounted future cash flows produced by the long-lived asset, or the appropriate grouping of assets, is compared to the carrying value to determine whether impairment exists. If an asset is determined to be impaired, a loss is recognized to the extent that carrying value exceeds fair value. Fair value is measured based on quoted market prices in active markets, if available. If quoted market prices are not available, the estimate of fair value is based on various valuation techniques, including the discounted value of estimated future cash flows.
Goodwill and Intangibles
The Company performs an annual impairment test of goodwill and indefinite-lived intangible assets in the fourth quarter using the same dates each year or more frequently if changes in circumstances or the occurrence of events indicate potential impairment. The fair value of each indefinite-lived intangible asset is compared to its carrying value and an impairment charge is recorded if the carrying value exceeds the fair value. Goodwill is tested by comparing the fair value of each reporting unit with its carrying value. If the carrying value of the reporting unit exceeds its fair value, the implied value of goodwill is compared to its carrying value and impairment is recognized to the extent that the carrying value exceeds the implied fair value.
Fair values are determined using established business valuation multiples and models developed by the Company which incorporate allocations of certain assets and cash flows among reporting units, estimates of market participant assumptions of future cash flows, future growth rates and the applicable discount rates to value estimated cash flows. Changes in economic and operating conditions impacting these assumptions could result in asset impairments in future periods.
Goodwill allocated to The Harris Products Group reporting unit at December 31, 2009 was $19,824. The fair value of the reporting unit exceeded carrying value by 8% as of the testing date during the fourth quarter of 2009. Key assumptions in estimating the reporting unit’s fair value include assumed market participant assumptions of revenue growth, operating margins and the rate used to discount future cash flows. Actual revenue growth and operating margins below the assumed market participant assumptions or an increase in the discount rate would have a negative impact on the fair value of the reporting unit that could result in a goodwill impairment charge in a future period.
32
| ITEM 7A. | QUANTITATIVE AND QUALITATIVE DISCLOSURES ABOUT MARKET RISK |
The Company’s primary financial market risks include fluctuations in currency exchange rates, commodity prices and interest rates. The Company manages these risks by using derivative financial instruments in accordance with established policies and procedures. The Company does not enter into derivatives or other financial instruments for trading or speculative purposes.
Included below is a sensitivity analysis based upon a hypothetical 10% weakening or strengthening in the U.S. dollar compared to foreign currency exchange rates at December 31, 2009, a 10% change in commodity prices, and a 100 basis point increase in effective interest rates under the Company’s current borrowing arrangements. The contractual derivative and borrowing arrangements in effect at December 31, 2009 were compared to the hypothetical foreign exchange, commodity price, or interest rates in the sensitivity analysis to determine the effect on income before taxes, interest expense, or accumulated other comprehensive loss. The analysis takes into consideration any offset that would result from changes in the value of the hedged asset or liability.
Foreign Currency Exchange Risk
The Company enters into forward foreign exchange contracts principally to hedge the currency fluctuations in transactions denominated in foreign currencies, thereby limiting the Company’s risk that would otherwise result from changes in exchange rates. At December 31, 2009, the Company hedged certain third party and intercompany purchases and sales. At December 31, 2009, the Company had foreign exchange contracts with a notional value of approximately $3,570. At December 31, 2009, a hypothetical 10% weakening of the U.S. dollar would not materially affect the Company’s financial statements.
Commodity Price Risk
From time to time, the Company uses various hedging arrangements to manage exposures to price risk from commodity purchases. These hedging arrangements have the effect of locking in for specified periods the prices the Company will pay for the volume to which the hedge relates. A hypothetical 10% adverse change in commodity prices on the Company’s open commodity futures at December 31, 2009 would not materially affect the Company’s financial statements.
Interest Rate Risk
As of December 31, 2009 the Company had no interest rate swaps outstanding.
The fair value of the Company’s Cash and cash equivalents at December 31, 2009 approximated carrying value. The Company’s financial instruments are subject to concentrations of credit risk. The Company has minimized this risk by entering into investments with a number of major banks and financial institutions and investing in high-quality instruments. The Company does not expect any counterparties to fail to meet their obligations.
| ITEM 8. | FINANCIAL STATEMENTS AND SUPPLEMENTARY DATA |
The response to this item is submitted in a separate section of this Annual Report on Form 10-K following the signature page.
| ITEM 9. | CHANGES IN AND DISAGREEMENTS WITH ACCOUNTANTS ON ACCOUNTING AND FINANCIAL DISCLOSURES |
None.
| ITEM 9A. | CONTROLS AND PROCEDURES |
Conclusion Regarding the Effectiveness of Disclosure Controls and Procedures
Under the supervision and with the participation of management, including the Chief Executive Officer and Chief Financial Officer, the Company conducted an evaluation of disclosure controls and procedures, as such
33
term is defined in Rule 13a-15(e) of the Exchange Act. Based on this evaluation, the Chief Executive Officer and Chief Financial Officer concluded that the Company’s disclosure controls and procedures were effective as of the end of the period covered by this Annual Report on Form 10-K.
Management’s Report on Internal Control Over Financial Reporting
The Company’s management is responsible for establishing and maintaining adequate internal control over financial reporting, as such term is defined in Exchange Act Rule 13a-15(f). Under the supervision and with the participation of the Company’s management, including the Chief Executive Officer and Chief Financial Officer, the Company conducted an evaluation of the effectiveness of internal control over financial reporting as of December 31, 2009 based on the framework in “Internal Control — Integrated Framework” issued by the Committee of Sponsoring Organizations of the Treadway Commission. Based on the Company’s evaluation under such framework, management concluded that the Company’s internal control over financial reporting was effective as of December 31, 2009.
The effectiveness of the Company’s internal control over financial reporting as of December 31, 2009 has been audited by Ernst & Young LLP, an independent registered public accounting firm, as stated in their report, which is included herein.
Changes in Internal Control Over Financial Reporting
There have been no changes in the Company’s internal control over financial reporting that occurred during the fourth quarter of 2009 that materially affected, or are reasonably likely to materially affect, the Company’s internal control over financial reporting.
| ITEM 9B. | OTHER INFORMATION |
None.
34
PART III
| ITEM 10. | DIRECTORS, EXECUTIVE OFFICERS AND CORPORATE GOVERNANCE |
The Company is expected to file its 2010 proxy statement pursuant to Regulation 14A of the Exchange Act prior to April 30, 2010.
Except for the information set forth below concerning our Executive Officers, the information required by this item is incorporated by reference from the 2010 proxy statement.
EXECUTIVE OFFICERS OF THE REGISTRANT
| Name |
Age | Position | ||
| John M. Stropki, Jr. |
59 | Chairman of the Board since October 13, 2004; Director since 1998; Chief Executive Officer and President since June 3, 2004; Chief Operating Officer from May 1, 2003 to June 3, 2004; Executive Vice President from 1995 to June 3, 2004 and President North America from 1996 to 2003. | ||
| Vincent K. Petrella |
49 | Senior Vice President, Chief Financial Officer and Treasurer since October 7, 2005; Vice President, Chief Financial Officer and Treasurer from February 4, 2004 to October 7, 2005 and Vice President, Corporate Controller from 2001 to 2003. | ||
| Frederick G. Stueber |
56 | Senior Vice President, General Counsel and Secretary since 1996. | ||
| George D. Blankenship |
47 | Senior Vice President, President Lincoln Electric North America since July 30, 2009; Senior Vice President, Global Engineering from October 7, 2005 to July 30, 2009; Vice President, Global Engineering from May 5, 2005 to October 7, 2005; President, Lincoln Electric North America of The Lincoln Electric Company since July 30, 2009; Senior Vice President; President, Lincoln Cleveland of The Lincoln Electric Company from January 8, 2008 to July 30, 2009; Senior Vice President, U.S. Operations of The Lincoln Electric Company from October 7, 2005 to January 8, 2008; Vice President, Cleveland Operations of The Lincoln Electric Company from June 6, 2005 to October 7, 2005 and Vice President, Engineering and Quality Assurance of The Lincoln Electric Company from 2000 to June 6, 2005. | ||
| Gretchen A. Farrell |
47 | Senior Vice President, Human Resources and Compliance since July 30, 2009; Vice President, Human Resources from May 5, 2005 to July 30, 2009 and Vice President, Human Resources of The Lincoln Electric Company since March 5, 2003. | ||
| Thomas A. Flohn |
49 | Vice President; President, Lincoln Asia Pacific since January 1, 2005 and Vice President of Sales and Marketing, Lincoln Electric Asia Pacific from May 1, 1999 to December 31, 2004. | ||
| David M. LeBlanc |
45 | Senior Vice President, President Lincoln Electric International since July 30, 2009; Vice President; President, Lincoln Electric Europe and Russia from March 10, 2008 to July 30, 2009; Vice President; President Lincoln Electric Europe from September 1, 2005 to March 10, 2008 and Vice President; President, Lincoln Electric Latin America from January 1, 2002 to August 31, 2005. | ||
The Company has been advised that there is no arrangement or understanding among any one of the officers listed and any other persons pursuant to which he or she was elected as an officer. The executive officers serve at the pleasure of the Board of Directors.
| ITEM 11. | EXECUTIVE COMPENSATION |
The information required by this item is incorporated by reference from the 2010 proxy statement.
35
| ITEM 12. | SECURITY OWNERSHIP OF CERTAIN BENEFICIAL OWNERS AND MANAGEMENT AND RELATED STOCKHOLDER MATTERS |
Except for the information set forth below regarding our equity plans, the information required by this item is incorporated by reference from the 2010 proxy statement.
| Plan Category |
Number of Securities to be Issued Upon Exercise of Outstanding Options (a) |
Weighted Average Exercise Price of Outstanding Options (b) |
Number of Securities Remaining Available for Future Issuance Under Equity Compensation Plans (Excluding Securities Reflected in Column (a)) (c) | ||||
| Equity compensation plans: |
|||||||
| Approved by security holders |
2,016,327 | $ | 45.49 | 3,264,886 | |||
| Not approved by security holders |
— | — | — | ||||
| Total |
2,016,327 | $ | 45.49 | 3,264,886 | |||
For further information on the Company’s equity compensation plans see Note 1 and Note 7 to the Company’s consolidated financial statements included in Item 8.
| ITEM 13. | CERTAIN RELATIONSHIPS AND RELATED TRANSACTIONS, AND DIRECTOR INDEPENDENCE |
The information required by this item is incorporated by reference from the 2010 proxy statement.
| ITEM 14. | PRINCIPAL ACCOUNTANT FEES AND SERVICES |
The information required by this item is incorporated by reference from the 2010 proxy statement.
PART IV
| ITEM 15. | EXHIBITS AND FINANCIAL STATEMENT SCHEDULES |
(a)(1) Financial Statements
The following consolidated financial statements of the Company are included in a separate section of this report following the signature page and certifications:
Report of Independent Registered Public Accounting Firm
Report of Independent Registered Public Accounting Firm on Internal Control Over Financial Reporting
Consolidated Balance Sheets — December 31, 2009 and 2008
Consolidated Statements of Income — Years ended December 31, 2009, 2008 and 2007
Consolidated Statements of Shareholders’ Equity — Years ended December 31, 2009, 2008 and 2007
Consolidated Statements of Cash Flows — Years ended December 31, 2009, 2008 and 2007
Notes to Consolidated Financial Statements
(a)(2) Financial Statement Schedules
The following consolidated financial statement schedule of the Company is included in a separate section of this report following the signature page:
Schedule II — Valuation and Qualifying Accounts
All other schedules for which provision is made in the applicable accounting regulation of the Securities and Exchange Commission are not required under the related instructions or are inapplicable, and therefore, have been omitted.
36
(a)(3) Exhibits
| Exhibit No. |
Description | ||
| 3.1 | Restated Articles of Incorporation of Lincoln Electric Holdings, Inc. (filed as Annex B to Form S-4 of Lincoln Electric Holdings, Inc., Registration No. 333-50435, filed on April 17, 1998, and incorporated herein by reference and made a part hereof). | ||
| 3.2 | Amended and Restated Code of Regulations of Lincoln Electric Holdings, Inc. (as Amended on November 3, 2009) (filed as Exhibit 3.2 to Form 10-Q of Lincoln Electric Holdings, Inc. for the three months ended September 30, 2009, SEC File No. 0-01402 and incorporated herein by reference and made a part hereof). | ||
| 10.1 | Amended and Restated Credit Agreement dated November 18, 2009 among Lincoln Electric Holdings, Inc., The Lincoln Electric Company, Lincoln Electric International Holding Company, J.W. Harris Co., Inc., Vernon Tool Co., Ltd., Lincoln Global, Inc., the financial institutions listed in Annex A thereof, and KeyBank National Association, as Letter of Credit Issuer and Administrative Agent (filed as Exhibit 10.1 to Form 8-K of Lincoln Electric Holdings, Inc. filed on November 20, 2009, SEC File No. 0-1402 and incorporated herein by reference and made a part hereof). | ||
| 10.2 | Note Purchase Agreement dated March 12, 2002 between Lincoln Electric Holdings, Inc. and The Lincoln Electric Company and the Purchasers listed in Schedule A thereof (filed as Exhibit 10(q) to Form 10-Q of Lincoln Electric Holdings, Inc. for the three months ended March 31, 2002, SEC File No. 0-1402 and incorporated herein by reference and made a part hereof). | ||
| 10.3 | Amended and Restated Note Purchase and Private Shelf Agreement between Lincoln Electric Holdings, Inc., The Lincoln Electric Company and The Prudential Insurance Company of America dated as of April 30, 2002 (filed as Exhibit 10(v) to Form 10-Q of Lincoln Electric Holdings, Inc. for the three months ended June 30, 2002, SEC File No. 0-1402 and incorporated herein by reference and made a part hereof). | ||
| 10.4 | Amendment No. 1 to the Amended and Restated Note Purchase and Private Shelf Agreement dated as of December 14, 2006 (filed as Exhibit 10(d) to Form 10-K of Lincoln Electric Holdings, Inc. for the year ended December 31, 2006, SEC File No. 0-1402 and incorporated herein by reference and made a part hereof). | ||
| 10.5 | * | 1998 Stock Plan (Amended, Restated and Renamed as of May 1, 2003) (filed as Appendix B to the Lincoln Electric Holdings, Inc. proxy statement dated March 31, 2003, SEC File No. 0-1402 and incorporated herein by reference and made a part hereof). | |
| 10.6 | * | Amendment No. 1 to the 1998 Stock Plan (Amended, Restated and Renamed Effective May 1, 2003) dated October 20, 2006 (filed as Exhibit 10.6 to Form 10-K of Lincoln Electric Holdings, Inc. for the year ended December 31, 2007, SEC File No. 0-1402 and incorporated herein by reference and made a part hereof). | |
| 10.7 | * | 1988 Incentive Equity Plan (filed as Exhibit 28 to the Form S-8 Registration Statement of The Lincoln Electric Company, SEC File No. 33-25209 and incorporated herein by reference and made a part hereof) as adopted and amended by Lincoln Electric Holdings, Inc. pursuant to an Instrument of Adoption and Amendment dated December 29, 1998 (filed as Exhibit 10(d) to Form 10-K of Lincoln Electric Holdings, Inc. for the year ended December 31, 1998, SEC File No. 0-1402 and incorporated herein by reference and made a part hereof). | |
| 10.8 | * | Amendment No. 2 to the 1988 Incentive Equity Plan dated October 20, 2006 (filed as Exhibit 10.8 to Form 10-K of Lincoln Electric Holdings, Inc. for the year ended December 31, 2007, SEC File No. 0-1402 and incorporated herein by reference and made a part hereof). | |
| 10.9 | * | Form of Indemnification Agreement (filed as Exhibit A to The Lincoln Electric Company 1987 proxy statement, SEC File No. 0-1402, and incorporated herein by reference and made a part hereof). | |
37
| Exhibit No. |
Description | ||
| 10.10 | * | Supplemental Executive Retirement Plan (Amended and Restated as of December 31, 2008) (filed as Exhibit 10.1 to Form 8-K of Lincoln Electric Holdings, Inc. filed on January 7, 2009 and incorporated herein by reference and made part hereof). | |
| 10.11 | * | Deferred Compensation Plan for Executives (Amended and Restated as of January 1, 2004) (filed as Exhibit 10(h) to Form 10-K of Lincoln Electric Holdings, Inc. for the year ended December 31, 2003, SEC File No. 0-1402 and incorporated herein by reference and made a part hereof). | |
| 10.12 | * | Amendment No. 1 to the Deferred Compensation Plan for Executives (Amended and Restated as of January 1, 2004) (filed as Exhibit 10.2 to Form 8-K of Lincoln Electric Holdings, Inc. on February 1, 2005, SEC File No. 0-1402 and incorporated herein by reference and made a part hereof). | |
| 10.13 | * | Instrument of Termination of the Deferred Compensation Plan for Executives (filed as Exhibit 10.2 to Form 8-K of Lincoln Electric Holdings, Inc. filed on January 4, 2006, SEC File No. 0-1402 and incorporated herein by reference and made a part hereof). | |
| 10.14 | * | Deferred Compensation Plan for Certain Retention Agreements and Other Contractual Arrangements (Amended and Restated as of January 1, 2004) (filed as Exhibit 10(i) to Form 10-K of Lincoln Electric Holdings, Inc. for the year ended December 31, 2003, SEC File No. 0-1402 and incorporated herein by reference and made a part hereof). | |
| 10.15 | * | Non-Employee Directors’ Deferred Compensation Plan (Amended and Restated as of December 31, 2008) (filed as Exhibit 10.3 to Form 8-K of Lincoln Electric Holdings, Inc. filed on January 7, 2009, SEC File No. 0-1402 and incorporated herein by reference and made a part hereof). | |
| 10.16 | * | Description of Management Incentive Plan (filed as Exhibit 10(e) to Form 10-K of The Lincoln Electric Company for the year ended December 31, 1995, SEC File No. 0-1402 and incorporated herein by reference and made a part hereof). | |
| 10.17 | * | Description of Long-Term Performance Plan (filed as Exhibit 10(f) to Form 10-K of The Lincoln Electric Company for the year ended December 31, 1997, SEC File No. 0-1402 and incorporated herein by reference and made a part hereof). | |
| 10.18 | * | Form of Severance Agreement (as entered into by the Company and the following executive officers: Messrs. Stropki, Petrella, Stueber, LeBlanc and Flohn) (filed as Exhibit 10.1 to Form 10-Q of Lincoln Electric Holdings, Inc. for the three months ended June 30, 2009, SEC File No. 0-1402 and incorporated herein by reference and made a part hereof). | |
| 10.19 | * | Stock Option Plan for Non-Employee Directors (filed as Exhibit 10(p) to Form 10-Q of Lincoln Electric Holdings, Inc. for the three months ended March 31, 2000, SEC File No. 0-1402 and incorporated herein by reference and made a part hereof). | |
| 10.20 | * | Amendment No. 1 to the Stock Option Plan for Non-Employee Directors dated October 20, 2006 (filed as Exhibit 10.26 to Form 10-K of Lincoln Electric Holdings, Inc. for the year ended December 31, 2007, SEC File No. 0-1402 and incorporated herein by reference and made a part hereof). | |
| 10.21 | * | Summary of Cash Long-Term Incentive Plan, as amended (filed as Exhibit 10.1 to Form 8-K of Lincoln Electric Holdings, Inc. filed on April 6, 2005, SEC File No. 0-1402 and incorporated herein by reference and made a part hereof). | |
| 10.22 | * | Letter Agreement between John M. Stropki, Jr. and Lincoln Electric Holdings, Inc. dated October 12, 2004 (filed as Exhibit 10.1 to Form 8-K of Lincoln Electric Holdings, Inc. filed on October 18, 2004, SEC File No. 0-1402 and incorporated herein by reference and made a part hereof). | |
| 10.23 | * | 2005 Deferred Compensation Plan for Executives (Amended and Restated as of December 31, 2008) (filed as Exhibit 10.2 to Form 8-K of Lincoln Electric Holdings, Inc. filed on January 7, 2009, SEC File No. 0-1402 and incorporated herein by reference and made a part hereof). | |
38
| Exhibit No. |
Description | |
| 10.24* | 2006 Equity and Performance Incentive Plan (filed as Appendix B to the Lincoln Electric Holdings, Inc. proxy statement dated March 28, 2006, SEC File No. 0-1402 and incorporated herein by reference and made a part hereof). | |
| 10.25* | Amendment No. 1 to the 2006 Equity and Performance Incentive Plan dated October 20, 2006 (filed as Exhibit 10.1 to Form 10-Q of Lincoln Electric Holdings, Inc. for the three months ended March 31, 2007, SEC File No. 0-1402 and incorporated herein by reference and made a part hereof). | |
| 10.26* | Amendment No. 2 to the 2006 Equity and Performance Incentive Plan (filed as Exhibit 10.5 to Form 8-K of Lincoln Electric Holdings, Inc. filed on January 7, 2009, SEC File No. 0-1402 and incorporated herein by reference and made a part hereof). | |
| 10.27* | 2006 Stock Plan for Non-Employee Directors (filed as Appendix C to the Lincoln Electric Holdings, Inc. proxy statement dated March 28, 2006, SEC File No. 0-1402 and incorporated herein by reference and made a part hereof). | |
| 10.28* | Amendment No. 1 to the 2006 Stock Plan for Non-Employee Directors dated October 20, 2006 (filed as Exhibit 10.2 to Form 10-Q of Lincoln Electric Holdings, Inc. for the three months ended March 31, 2007, SEC file No. 0-1402 and incorporated herein by reference and made a part hereof). | |
| 10.29* | Amendment No. 2 to the 2006 Stock Plan for Non-Employee Directors dated July 26, 2007 (filed as Exhibit 10.1 to Form 10-Q of Lincoln Electric Holdings, Inc. for the three months ended September 30, 2007, SEC file No. 0-1402 and incorporated herein by reference and made a part hereof). | |
| 10.30* | 2007 Management Incentive Compensation Plan (Amended and Restated as of December 31, 2008) (filed as Exhibit 10.4 to Form 8-K of Lincoln Electric Holdings, Inc. filed on January 7, 2009, SEC File No. 0-1402 and incorporated herein by reference and made a part hereof). | |
| 21 | Subsidiaries of the Registrant. | |
| 23 | Consent of Independent Registered Public Accounting Firm. | |
| 24 | Powers of Attorney. | |
| 31.1 | Certification by the President and Chief Executive Officer pursuant to Rule 13a-14(a) of the Securities Exchange Act of 1934. | |
| 31.2 | Certification by the Senior Vice President, Chief Financial Officer and Treasurer pursuant to Rule 13a-14(a) of the Securities Exchange Act of 1934. | |
| 32.1 | Certifications pursuant to 18 U.S.C. Section 1350, as adopted pursuant to Section 906 of the Sarbanes-Oxley Act of 2002. | |
| * | Reflects management contract or other compensatory arrangement required to be filed as an exhibit pursuant to Item 15(b) of this report. |
39
SIGNATURES
Pursuant to the requirements of Section 13 or 15(d) of the Securities Exchange Act of 1934, the registrant has duly caused this report to be signed on its behalf by the undersigned, thereunto duly authorized.
| LINCOLN ELECTRIC HOLDINGS, INC. | ||
| By: | /s/ VINCENT K. PETRELLA | |
| Vincent K. Petrella Senior Vice President, Chief Financial Officer and Treasurer (principal financial and accounting officer) February 22, 2010 | ||
40
Pursuant to the requirements of the Securities Exchange Act of 1934, this report has been signed below by the following persons on behalf of the registrant and in the capacities and on the dates indicated.
| /s/ JOHN M. STROPKI, JR. |
/s/ VINCENT K. PETRELLA | |||
| John M. Stropki, Jr., Chairman of the Board, President and Chief Executive Officer (principal executive officer) February 22, 2010 |
Vincent K. Petrella, Senior Vice President, Chief Financial Officer and Treasurer (principal financial and accounting officer) February 22, 2010 | |||
| /s/ VINCENT K. PETRELLA |
/s/ VINCENT K. PETRELLA | |||
| Vincent K. Petrella as Attorney-in-Fact for Harold L. Adams, Director February 22, 2010 |
Vincent K. Petrella as Attorney-in-Fact for David H. Gunning, Director February 22, 2010 | |||
| /s/ VINCENT K. PETRELLA |
/s/ VINCENT K. PETRELLA | |||
| Vincent K. Petrella as Attorney-in-Fact for Stephen G. Hanks, Director February 22, 2010 |
Vincent K. Petrella as Attorney-in-Fact for Kathryn Jo Lincoln, Director February 22, 2010 | |||
| /s/ VINCENT K. PETRELLA |
/s/ VINCENT K. PETRELLA | |||
| Vincent K. Petrella as Attorney-in-Fact for Robert J. Knoll, Director February 22, 2010 |
Vincent K. Petrella as Attorney-in-Fact for Hellene S. Runtagh, Director February 22, 2010 | |||
| /s/ VINCENT K. PETRELLA |
/s/ VINCENT K. PETRELLA | |||
| Vincent K. Petrella as Attorney-in-Fact for G. Russell Lincoln, Director February 22, 2010 |
Vincent K. Petrella as Attorney-in-Fact for William E. MacDonald, III, Director February 22, 2010 | |||
| /s/ VINCENT K. PETRELLA |
/s/ VINCENT K. PETRELLA | |||
| Vincent K. Petrella as Attorney-in-Fact for George H. Walls, Jr., Director February 22, 2010 |
Vincent K. Petrella as Attorney-in-Fact for Christopher L. Mapes, Director February 22, 2010 | |||
41
REPORT OF INDEPENDENT REGISTERED PUBLIC ACCOUNTING FIRM
The Board of Directors and Shareholders of Lincoln Electric Holdings, Inc.
We have audited the accompanying consolidated balance sheets of Lincoln Electric Holdings, Inc. and subsidiaries as of December 31, 2009 and 2008, and the related consolidated statements of income, shareholders’ equity, and cash flows for each of the three years in the period ended December 31, 2009. Our audits also included the financial statement schedule listed in the Index as Item 15 (a) (2). These financial statements and schedule are the responsibility of the Company’s management. Our responsibility is to express an opinion on these financial statements and schedule based on our audits.
We conducted our audits in accordance with the standards of the Public Company Accounting Oversight Board (United States). Those standards require that we plan and perform the audit to obtain reasonable assurance about whether the financial statements are free of material misstatement. An audit includes examining, on a test basis, evidence supporting the amounts and disclosures in the financial statements. An audit also includes assessing the accounting principles used and significant estimates made by management, as well as evaluating the overall financial statement presentation. We believe that our audits provide a reasonable basis for our opinion.
In our opinion, the financial statements referred to above present fairly, in all material respects, the consolidated financial position of Lincoln Electric Holdings, Inc. and subsidiaries at December 31, 2009 and 2008, and the consolidated results of their operations and their cash flows for each of the three years in the period ended December 31, 2009, in conformity with U.S. generally accepted accounting principles. Also, in our opinion, the related financial statement schedule, when considered in relation to the basic financial statements taken as a whole, presents fairly in all material respects, the information set forth therein.
As discussed in Note 1 to the consolidated financial statements, in 2009 the Company changed its method of accounting for business combinations and noncontrolling interests. Also as discussed in Note 9 to the consolidated financial statements, in 2007 the Company changed its method of accounting for uncertain tax positions.
We also have audited, in accordance with the standards of the Public Company Accounting Oversight Board (United States), Lincoln Electric Holdings, Inc. and subsidiaries’ internal control over financial reporting as of December 31, 2009, based on criteria established in Internal Control-Integrated Framework issued by the Committee of Sponsoring Organizations of the Treadway Commission and our report dated February 22, 2010 expressed an unqualified opinion thereon.
/s/ ERNST & YOUNG LLP
February 22, 2010
F-1
REPORT OF INDEPENDENT REGISTERED PUBLIC ACCOUNTING FIRM
The Board of Directors and Shareholders of Lincoln Electric Holdings, Inc.
We have audited Lincoln Electric Holdings, Inc. and subsidiaries’ internal control over financial reporting as of December 31, 2009, based on criteria established in Internal Control — Integrated Framework issued by the Committee of Sponsoring Organizations of the Treadway Commission (the COSO criteria). Lincoln Electric Holdings, Inc. and subsidiaries’ management is responsible for maintaining effective internal control over financial reporting, and for its assessment of the effectiveness of internal control over financial reporting included in the accompanying Management’s Report on Internal Control over Financial Reporting in Item 9A. Our responsibility is to express an opinion on the company’s internal control over financial reporting based on our audit.
We conducted our audit in accordance with the standards of the Public Company Accounting Oversight Board (United States). Those standards require that we plan and perform the audit to obtain reasonable assurance about whether effective internal control over financial reporting was maintained in all material respects. Our audit included obtaining an understanding of internal control over financial reporting, assessing the risk that a material weakness exists, testing and evaluating the design and operating effectiveness of internal control based on the assessed risk, and performing such other procedures as we considered necessary in the circumstances. We believe that our audit provides a reasonable basis for our opinion.
A company’s internal control over financial reporting is a process designed to provide reasonable assurance regarding the reliability of financial reporting and the preparation of financial statements for external purposes in accordance with generally accepted accounting principles. A company’s internal control over financial reporting includes those policies and procedures that (1) pertain to the maintenance of records that, in reasonable detail, accurately and fairly reflect the transactions and dispositions of the assets of the company; (2) provide reasonable assurance that transactions are recorded as necessary to permit preparation of financial statements in accordance with generally accepted accounting principles, and that receipts and expenditures of the company are being made only in accordance with authorizations of management and directors of the company; and (3) provide reasonable assurance regarding prevention or timely detection of unauthorized acquisition, use, or disposition of the company’s assets that could have a material effect on the financial statements.
Because of its inherent limitations, internal control over financial reporting may not prevent or detect misstatements. Also, projections of any evaluation of effectiveness to future periods are subject to the risk that controls may become inadequate because of changes in conditions, or that the degree of compliance with the policies or procedures may deteriorate.
In our opinion, Lincoln Electric Holdings, Inc. and subsidiaries maintained, in all material respects, effective internal control over financial reporting as of December 31, 2009, based on the COSO criteria.
We also have audited, in accordance with the standards of the Public Company Accounting Oversight Board (United States), the consolidated balance sheets of Lincoln Electric Holdings, Inc. and subsidiaries as of December 31, 2009 and 2008, and the related consolidated statements of income, shareholders’ equity, and cash flows for each of the three years in the period ended December 31, 2009 of Lincoln Electric Holdings, Inc. and subsidiaries and our report dated February 22, 2010 expressed an unqualified opinion thereon.
/s/ ERNST & YOUNG LLP
February 22, 2010
F-2
LINCOLN ELECTRIC HOLDINGS, INC.
CONSOLIDATED BALANCE SHEETS
(In thousands of dollars)
| December 31, | ||||||
| 2009 | 2008 | |||||
| ASSETS |
||||||
| Current Assets |
||||||
| Cash and cash equivalents |
$ | 388,136 | $ | 284,332 | ||
| Accounts receivable (less allowance for doubtful accounts of $8,174 in 2009; $7,673 in 2008) |
273,700 | 299,171 | ||||
| Inventories |
||||||
| Raw materials |
69,048 | 94,112 | ||||
| Work-in-process |
32,727 | 49,692 | ||||
| Finished goods |
153,968 | 203,128 | ||||
| Total inventory |
255,743 | 346,932 | ||||
| Deferred income taxes |
23,779 | 16,725 | ||||
| Other current assets |
82,188 | 77,566 | ||||
| Total Current Assets |
1,023,546 | 1,024,726 | ||||
| Property, Plant and Equipment |
||||||
| Land |
42,823 | 38,745 | ||||
| Buildings |
291,444 | 258,736 | ||||
| Machinery and equipment |
683,037 | 643,056 | ||||
| 1,017,304 | 940,537 | |||||
| Less accumulated depreciation |
557,243 | 512,635 | ||||
| Property, Plant and Equipment, Net |
460,061 | 427,902 | ||||
| Other Assets |
||||||
| Prepaid pensions |
1,921 | 2,716 | ||||
| Equity investments in affiliates |
22,899 | 62,358 | ||||
| Intangibles, net |
81,774 | 65,262 | ||||
| Goodwill |
39,554 | 36,187 | ||||
| Long-term investments |
29,077 | 29,843 | ||||
| Deferred income taxes |
26,326 | 47,397 | ||||
| Other non-current assets |
20,134 | 22,414 | ||||
| Total Other Assets |
221,685 | 266,177 | ||||
| TOTAL ASSETS |
$ | 1,705,292 | $ | 1,718,805 | ||
See notes to these consolidated financial statements.
F-3
LINCOLN ELECTRIC HOLDINGS, INC.
CONSOLIDATED BALANCE SHEETS
(In thousands of dollars, except share data)
| December 31, | ||||||||
| 2009 | 2008 | |||||||
| LIABILITIES AND SHAREHOLDERS’ EQUITY |
||||||||
| Current Liabilities |
||||||||
| Amounts due banks |
$ | 34,577 | $ | 19,436 | ||||
| Trade accounts payable |
100,052 | 124,388 | ||||||
| Accrued employee compensation and benefits |
36,486 | 47,405 | ||||||
| Accrued expenses |
28,941 | 25,173 | ||||||
| Accrued taxes, including income taxes |
22,430 | 13,305 | ||||||
| Accrued pensions |
3,014 | 3,248 | ||||||
| Dividends payable |
11,885 | 11,444 | ||||||
| Other current liabilities |
59,296 | 80,986 | ||||||
| Current portion of long-term debt |
1,290 | 31,257 | ||||||
| Total Current Liabilities |
297,971 | 356,642 | ||||||
| Long-Term Liabilities |
||||||||
| Long-term debt, less current portion |
87,850 | 91,537 | ||||||
| Accrued pensions |
139,670 | 188,160 | ||||||
| Deferred income taxes |
16,679 | 8,553 | ||||||
| Accrued taxes |
53,388 | 40,323 | ||||||
| Other long-term liabilities |
24,059 | 23,617 | ||||||
| Total Long-Term Liabilities |
321,646 | 352,190 | ||||||
| Shareholders’ Equity |
||||||||
| Preferred shares, without par value – at stated capital amount; authorized – 5,000,000 shares; issued and outstanding – none |
— | — | ||||||
| Common shares, without par value – at stated capital amount; authorized –120,000,000 shares; issued – 49,290,717 shares in 2009 and 2008; outstanding –42,637,247 shares in 2009 and 42,521,628 shares in 2008 |
4,929 | 4,929 | ||||||
| Additional paid-in capital |
159,440 | 155,538 | ||||||
| Retained earnings |
1,239,004 | 1,236,810 | ||||||
| Accumulated other comprehensive loss |
(149,404 | ) | (218,254 | ) | ||||
| Treasury shares, at cost – 6,653,470 shares in 2009 and 6,769,089 shares in 2008 |
(181,623 | ) | (183,807 | ) | ||||
| Total Shareholders’ Equity |
1,072,346 | 995,216 | ||||||
| Noncontrolling interests |
13,329 | 14,757 | ||||||
| Total Equity |
1,085,675 | 1,009,973 | ||||||
| TOTAL LIABILITIES AND EQUITY |
$ | 1,705,292 | $ | 1,718,805 | ||||
See notes to these consolidated financial statements.
F-4
LINCOLN ELECTRIC HOLDINGS, INC.
CONSOLIDATED STATEMENTS OF INCOME
(In thousands of dollars, except per share data)
| Year Ended December 31, | ||||||||||||
| 2009 | 2008 | 2007 | ||||||||||
| Net sales |
$ | 1,729,285 | $ | 2,479,131 | $ | 2,280,784 | ||||||
| Cost of goods sold |
1,273,017 | 1,758,980 | 1,633,218 | |||||||||
| Gross profit |
456,268 | 720,151 | 647,566 | |||||||||
| Selling, general & administrative expenses |
333,395 | 405,376 | 370,122 | |||||||||
| Rationalization and asset impairment charges (gain) |
29,897 | 19,371 | (188 | ) | ||||||||
| Operating income |
92,976 | 295,404 | 277,632 | |||||||||
| Other (expense) income: |
||||||||||||
| Interest income |
3,462 | 8,845 | 8,294 | |||||||||
| Equity (loss) earnings in affiliates |
(5,025 | ) | 6,034 | 9,838 | ||||||||
| Other income |
3,589 | 1,681 | 2,823 | |||||||||
| Interest expense |
(8,521 | ) | (12,155 | ) | (11,430 | ) | ||||||
| Total other (expense) income |
(6,495 | ) | 4,405 | 9,525 | ||||||||
| Income before income taxes |
86,481 | 299,809 | 287,157 | |||||||||
| Income taxes |
37,905 | 87,523 | 84,421 | |||||||||
| Net income |
$ | 48,576 | $ | 212,286 | $ | 202,736 | ||||||
| Basic weighted average shares outstanding |
42,391 | 42,648 | 42,899 | |||||||||
| Effect of dilutive securities – stock options and awards |
243 | 406 | 493 | |||||||||
| Diluted weighted average shares outstanding |
42,634 | 43,054 | 43,392 | |||||||||
| Basic earnings per share |
$ | 1.15 | $ | 4.98 | $ | 4.73 | ||||||
| Diluted earnings per share |
$ | 1.14 | $ | 4.93 | $ | 4.67 | ||||||
| Cash dividends declared per share |
$ | 1.09 | $ | 1.02 | $ | 0.91 | ||||||
See notes to these consolidated financial statements.
F-5
LINCOLN ELECTRIC HOLDINGS, INC.
CONSOLIDATED STATEMENTS OF SHAREHOLDERS’ EQUITY
(In thousands, except per share data)
| Common Shares Outstanding |
Common Stock |
Additional Paid-In Capital |
Retained Earnings |
Accumulated Other Comprehensive Income (Loss) |
Treasury Shares |
Total | ||||||||||||||||||||
| Balance January 1, 2007 |
42,806 | $ | 4,929 | $ | 137,315 | $ | 906,074 | $ | (54,568 | ) | $ | (140,689 | ) | $ | 853,061 | |||||||||||
| Comprehensive income: |
||||||||||||||||||||||||||
| Net income |
202,736 | 202,736 | ||||||||||||||||||||||||
| Unrecognized amounts from defined benefit pension plans, net of tax of $10,371 |
17,704 | 17,704 | ||||||||||||||||||||||||
| Unrealized loss on derivatives designated and qualifying as cash flow hedges, net of tax of $1,772 |
(2,989 | ) | (2,989 | ) | ||||||||||||||||||||||
| Currency translation adjustment |
55,779 | 55,779 | ||||||||||||||||||||||||
| Less comprehensive income attributable to non-controlling interests |
(229 | ) | (229 | ) | ||||||||||||||||||||||
| Total comprehensive income |
273,001 | |||||||||||||||||||||||||
| Cash dividends declared – $0.91 per share |
(39,120 | ) | (39,120 | ) | ||||||||||||||||||||||
| Issuance of shares under benefit plans |
378 | 8,939 | 8,673 | 17,612 | ||||||||||||||||||||||
| Purchase of shares for treasury |
(222 | ) | (15,459 | ) | (15,459 | ) | ||||||||||||||||||||
| Adjustment to initially adopt FIN 48 (ASC 740) |
(429 | ) | (1,590 | ) | (2,019 | ) | ||||||||||||||||||||
| Balance December 31, 2007 |
42,962 | 4,929 | 145,825 | 1,068,100 | 15,697 | (147,475 | ) | 1,087,076 | ||||||||||||||||||
| Comprehensive income: |
||||||||||||||||||||||||||
| Net income |
212,286 | 212,286 | ||||||||||||||||||||||||
| Unrecognized amounts from defined benefit pension plans, net of tax of $84,685 |
(142,422 | ) | (142,422 | ) | ||||||||||||||||||||||
| Unrealized gain on derivatives designated and qualifying as cash flow hedges, net of tax of $137 |
842 | 842 | ||||||||||||||||||||||||
| Currency translation adjustment |
(92,419 | ) | (92,419 | ) | ||||||||||||||||||||||
| Less comprehensive loss attributable to non-controlling interests |
48 | 48 | ||||||||||||||||||||||||
| Total comprehensive loss |
(21,665 | ) | ||||||||||||||||||||||||
| Cash dividends declared – $1.02 per share |
(43,576 | ) | (43,576 | ) | ||||||||||||||||||||||
| Issuance of shares under benefit plans |
301 | 9,713 | 6,005 | 15,718 | ||||||||||||||||||||||
| Purchase of shares for treasury |
(741 | ) | (42,337 | ) | (42,337 | ) | ||||||||||||||||||||
| Balance December 31, 2008 |
42,522 | 4,929 | 155,538 | 1,236,810 | (218,254 | ) | (183,807 | ) | 995,216 | |||||||||||||||||
| Comprehensive income: |
||||||||||||||||||||||||||
| Net income |
48,576 | 48,576 | ||||||||||||||||||||||||
| Unrecognized amounts from defined benefit pension plans, net of tax of $12,242 |
21,287 | 21,287 | ||||||||||||||||||||||||
| Unrealized gain on derivatives designated and qualifying as cash flow hedges, net of tax of $1,477 |
1,444 | 1,444 | ||||||||||||||||||||||||
| Currency translation adjustment |
46,968 | 46,968 | ||||||||||||||||||||||||
| Less comprehensive income attributable to non-controlling interests |
(849 | ) | (849 | ) | ||||||||||||||||||||||
| Total comprehensive income |
117,426 | |||||||||||||||||||||||||
| Cash dividends declared – $1.09 per share |
(46,382 | ) | (46,382 | ) | ||||||||||||||||||||||
| Issuance of shares under benefit plans |
123 | 3,902 | 2,527 | 6,429 | ||||||||||||||||||||||
| Purchase of shares for treasury |
(8 | ) | (343 | ) | (343 | ) | ||||||||||||||||||||
| Balance December 31, 2009 |
42,637 | $ | 4,929 | $ | 159,440 | $ | 1,239,004 | $ | (149,404 | ) | $ | (181,623 | ) | $ | 1,072,346 | |||||||||||
See notes to these consolidated financial statements.
F-6
LINCOLN ELECTRIC HOLDINGS, INC.
CONSOLIDATED STATEMENTS OF CASH FLOWS
(In thousands of dollars)
| Year Ended December 31, | ||||||||||||
| 2009 | 2008 | 2007 | ||||||||||
| CASH FLOWS FROM OPERATING ACTIVITIES |
||||||||||||
| Net income |
$ | 48,576 | $ | 212,286 | $ | 202,736 | ||||||
| Adjustments to reconcile net income to net cash provided by operating activities: |
||||||||||||
| Rationalization and asset impairment charges (gain) |
2,940 | 19,371 | (188 | ) | ||||||||
| Depreciation and amortization |
56,598 | 56,925 | 52,610 | |||||||||
| Equity loss (earnings) of affiliates, net |
8,554 | (3,235 | ) | (7,208 | ) | |||||||
| Deferred income taxes |
(7,090 | ) | 7,367 | (3,711 | ) | |||||||
| Stock-based compensation |
5,432 | 4,738 | 4,679 | |||||||||
| Amortization of terminated interest rate swaps |
(1,742 | ) | (958 | ) | (1,121 | ) | ||||||
| Amortization of actuarial losses and prior service costs |
25,064 | 1,706 | 4,690 | |||||||||
| Other non-cash items, net |
2,027 | 4,758 | (5,146 | ) | ||||||||
| Changes in operating assets and liabilities, net of effects from acquisitions: |
||||||||||||
| Decrease (increase) in accounts receivable |
60,913 | 30,130 | (20,723 | ) | ||||||||
| Decrease (increase) in inventories |
127,739 | (27,845 | ) | 36,011 | ||||||||
| Decrease (increase) in other current assets |
10,222 | (27,450 | ) | 2,354 | ||||||||
| Decrease in accounts payable |
(30,364 | ) | (26,768 | ) | (3,333 | ) | ||||||
| (Decrease) increase in other current liabilities |
(22,778 | ) | 37,040 | (1,798 | ) | |||||||
| Decrease in accrued pensions |
(39,185 | ) | (25,975 | ) | (9,794 | ) | ||||||
| Net change in other long-term assets and liabilities |
3,444 | (4,641 | ) | (226 | ) | |||||||
| NET CASH PROVIDED BY OPERATING ACTIVITIES |
250,350 | 257,449 | 249,832 | |||||||||
| CASH FLOWS FROM INVESTING ACTIVITIES |
||||||||||||
| Capital expenditures |
(38,201 | ) | (72,426 | ) | (61,633 | ) | ||||||
| Acquisition of businesses, net of cash acquired |
(25,449 | ) | (44,036 | ) | (18,773 | ) | ||||||
| Additions to equity investment in affiliates |
(488 | ) | — | — | ||||||||
| Proceeds from sale of property, plant and equipment |
557 | 662 | 701 | |||||||||
| NET CASH USED BY INVESTING ACTIVITIES |
(63,581 | ) | (115,800 | ) | (79,705 | ) | ||||||
| CASH FLOWS FROM FINANCING ACTIVITIES |
||||||||||||
| Proceeds from short-term borrowings |
22,241 | 19,504 | 6,550 | |||||||||
| Payments on short-term borrowings |
(34,779 | ) | (7,849 | ) | (1,004 | ) | ||||||
| Amounts due banks, net |
(416 | ) | (5,551 | ) | (2,720 | ) | ||||||
| Proceeds from long-term borrowings |
531 | 1,352 | — | |||||||||
| Payments on long-term borrowings |
(31,405 | ) | (1,033 | ) | (40,142 | ) | ||||||
| Proceeds from exercise of stock options |
705 | 7,201 | 8,644 | |||||||||
| Tax benefit from exercise of stock options |
195 | 3,728 | 4,289 | |||||||||
| Purchase of shares for treasury |
(343 | ) | (42,337 | ) | (15,459 | ) | ||||||
| Cash dividends paid to shareholders |
(45,801 | ) | (42,756 | ) | (37,744 | ) | ||||||
| NET CASH USED BY FINANCING ACTIVITIES |
(89,072 | ) | (67,741 | ) | (77,586 | ) | ||||||
| Effect of exchange rate changes on cash and cash equivalents |
6,107 | (6,958 | ) | 4,629 | ||||||||
| INCREASE IN CASH AND CASH EQUIVALENTS |
103,804 | 66,950 | 97,170 | |||||||||
| Cash and cash equivalents at beginning of year |
284,332 | 217,382 | 120,212 | |||||||||
| CASH AND CASH EQUIVALENTS AT END OF YEAR |
$ | 388,136 | $ | 284,332 | $ | 217,382 | ||||||
See notes to these consolidated financial statements.
F-7
LINCOLN ELECTRIC HOLDINGS, INC.
NOTES TO CONSOLIDATED FINANCIAL STATEMENTS
(In thousands of dollars, except share and per share data)
NOTE 1 – SIGNIFICANT ACCOUNTING POLICIES
Principles of Consolidation
The consolidated financial statements include the accounts of Lincoln Electric Holdings, Inc., its wholly-owned and majority-owned subsidiaries for which it has a controlling interest (the “Company”) after elimination of all intercompany accounts, transactions and profits.
Subsequent Events
Cumulative inflation in Venezuela over the preceding three-year period reached 100% during the fourth quarter of 2009. As a result, the Company changed the functional currency of its Venezuelan subsidiary to the U.S. dollar as of January 1, 2010. During January 2010, the Venezuelan government announced the devaluation of the official exchange rate used for most foreign currency transactions common to the Company’s Venezuelan subsidiary from 2.15 to 4.30 Bolivars to the U.S. dollar.
The Company’s Venezuelan subsidiary’s net Bolivar denominated monetary liability position is expected to result in a gain of approximately $2,500 during the first quarter of 2010. The Company also expects that its Venezuelan subsidiary’s results of operations will decrease significantly in 2010 due to the new exchange rate. The impact of selling inventories carried at the previous exchange rate is expected to decrease gross profit by approximately $5,000.
Management has evaluated and disclosed all material events occurring subsequent to the date of the financial statements up to February 22, 2010, the filing date of this Annual Report on Form 10-K.
Cash Equivalents
The Company considers all highly liquid investments with a maturity of three months or less when purchased to be cash equivalents.
Accounts Receivable
The Company maintains an allowance for doubtful accounts for estimated losses from the failure of its customers to make required payments for products delivered. The Company estimates this allowance based on the age of the related receivable, knowledge of the financial condition of customers, review of historical receivables and reserve trends and other pertinent information. If the financial condition of customers deteriorates or an unfavorable trend in receivable collections is experienced in the future, additional allowances may be required. Historically, the Company’s reserves have approximated actual experience.
Inventories
Inventories are valued at the lower of cost or market. Fixed manufacturing overhead costs are allocated to inventory based on normal production capacity, and abnormal manufacturing costs are recognized as period costs. For domestic inventories, cost is determined principally by the last-in, first-out (“LIFO”) method, and for non-U.S. inventories, cost is determined by the first-in, first-out (“FIFO”) method. At December 31, 2009 and 2008, approximately 31% and 35%, respectively, of total inventories were valued using the LIFO method. The excess of current cost over LIFO cost amounted to $62,447 at December 31, 2009 and $90,914 at December 31, 2008. A reduction in inventory levels resulted in a decrease to the LIFO reserve of $14,254.
Reserves are maintained for estimated obsolescence or excess inventory equal to the difference between the cost of inventory and the estimated market value based upon assumptions about future demand and market conditions. Historically, the Company’s reserves have approximated actual experience.
F-8
LINCOLN ELECTRIC HOLDINGS, INC.
NOTES TO CONSOLIDATED FINANCIAL STATEMENTS — (Continued)
NOTE 1 – SIGNIFICANT ACCOUNTING POLICIES (continued)
Equity Investments
Investments in businesses in which the Company does not have a controlling interest and holds between a 20% and 50% ownership interest are accounted for using the equity method of accounting on a one-month lag basis. The Company’s 50% ownership interest in equity investments includes investments in Turkey and Chile. The amount of retained earnings that represents undistributed earnings of 50% or less owned equity investments was $12,619 at December 31, 2009 and $26,875 at December 31, 2008. The decrease from the prior year is due to the acquisition of a business in China in which the Company previously held a non-controlling interest and the related divestiture of a non-controlling interest in Taiwan. See Note 2 for additional information.
Property, Plant and Equipment
Property, plant and equipment are stated at cost and include improvements which significantly increase capacities or extend the useful lives of existing plant and equipment. Depreciation and amortization are computed using a straight-line method over useful lives ranging from three to 20 years for machinery, tools and equipment, and up to 50 years for buildings. Net gains or losses related to asset dispositions are recognized in earnings in the period in which dispositions occur.
The following table summarizes assets held under capital leases and included in property, plant and equipment:
| December 31, | ||||||||
| 2009 | 2008 | |||||||
| Buildings |
$ | 6,663 | $ | 6,421 | ||||
| Machinery and equipment |
982 | 1,561 | ||||||
| Less: accumulated depreciation |
(2,184 | ) | (2,257 | ) | ||||
| Net capital leases |
$ | 5,461 | $ | 5,725 | ||||
Routine maintenance, repairs and replacements are expensed as incurred. The Company capitalizes interest cost associated with construction in progress.
Goodwill and Intangibles
The Company performs an annual impairment test of goodwill and indefinite-lived intangible assets in the fourth quarter using the same dates each year or more frequently if changes in circumstances or the occurrence of events indicate potential impairment. The fair value of each indefinite-lived intangible asset is compared to its carrying value and an impairment charge is recorded if the carrying value exceeds the fair value. Goodwill is tested by comparing the fair value of each reporting unit with its carrying value. If the carrying value of the reporting unit exceeds its fair value, the implied value of goodwill is compared to its carrying value and impairment is recognized to the extent that the carrying value exceeds the implied fair value.
Fair values are determined using established business valuation multiples and models developed by the Company which incorporate allocations of certain assets and cash flows among reporting units, estimates of market participant assumptions of future cash flows, future growth rates and the applicable discount rates to value estimated cash flows. Changes in economic and operating conditions impacting these assumptions could result in asset impairments in future periods.
In 2009, the Company determined that certain indefinite-lived intangible assets were impaired and recognized an impairment charge of $879 to reduce the carrying value of these intangible assets to fair value and assigned definite lives to two of the intangible assets on a prospective basis.
F-9
LINCOLN ELECTRIC HOLDINGS, INC.
NOTES TO CONSOLIDATED FINANCIAL STATEMENTS — (Continued)
NOTE 1 – SIGNIFICANT ACCOUNTING POLICIES (continued)
In 2008, the Company determined that the carrying value of goodwill at two businesses in China exceeded the implied value of goodwill and the Company recognized an impairment charge of $13,194. In addition, the Company determined that two indefinite-lived intangible assets were impaired. The Company recognized an impairment charge of $1,342 to reduce the carrying value of these intangible assets to fair value and assigned a definite life to these intangible assets on a prospective basis.
The changes in the carrying amount of goodwill by reportable segment for the years ended December 31, 2009 and 2008 were as follows:
| North America Welding |
Europe Welding |
Asia Pacific Welding |
South America Welding |
The Harris Products Group |
Consolidated | |||||||||||||
| Balance as of January 1, 2008 |
$6,212 | $10,817 | $12,387 | $538 | $12,773 | $42,727 | ||||||||||||
| Additions and adjustments |
(1,118 | ) | 20 | 3,413 | — | 7,890 | 10,205 | |||||||||||
| Impairment charges |
— | — | (13,194 | ) | — | — | (13,194 | ) | ||||||||||
| Foreign currency translation |
(327 | ) | (2,116 | ) | 879 | (56 | ) | (1,931 | ) | (3,551 | ) | |||||||
| Balance as of December 31, 2008 |
4,767 | 8,721 | 3,485 | 482 | 18,732 | 36,187 | ||||||||||||
| Additions and adjustments |
(3 | ) | — | 1,429 | — | (1,044 | ) | 382 | ||||||||||
| Foreign currency translation |
229 | 571 | — | 49 | 2,136 | 2,985 | ||||||||||||
| Balance as of December 31, 2009 |
$4,993 | $9,292 | $4,914 | $531 | $19,824 | $39,554 | ||||||||||||
Additions and adjustments to goodwill primarily reflect goodwill recognized in the acquisitions of Harris Soldas Especiais S.A. and Vernon Tool Company, Ltd. in 2008 and Jinzhou Jin Tai Welding and Metal Co, Ltd. (“Jin Tai”) in 2009 (See Note 2).
Gross intangible assets other than goodwill by asset class as of December 31, 2009 and 2008 were as follows:
| December 31, | ||||||||
| 2009 | 2008 | |||||||
| Gross Amount |
Accumulated Amortization |
Gross Amount |
Accumulated Amortization | |||||
| Trademarks and trade names |
$30,001 | $6,928 | $26,973 | $6,342 | ||||
| Customer relationships |
32,647 | 4,038 | 23,900 | 2,331 | ||||
| Patents |
14,912 | 2,653 | 13,095 | 2,192 | ||||
| Other |
30,078 | 12,245 | 23,289 | 11,130 | ||||
| Total |
$107,638 | $25,864 | $87,257 | $21,995 | ||||
Intangible assets other than goodwill are recorded at fair value at the time acquired or at cost, if applicable. Intangible assets that do not have indefinite lives are amortized on a straight-line basis over the shorter of the legal or estimated life. Included in the above table are trademarks and trade names with indefinite lives totaling $17,071 and $16,960 at December 31, 2009 and 2008, respectively.
The weighted average amortization period for trademarks and trade names, customer relationships, patents and other intangibles is 16, 19, 20 and 18 years, respectively. Aggregate amortization expense was $4,524, $3,432 and $2,349 for 2009, 2008 and 2007, respectively. Estimated annual amortization expense for intangible assets for each of the next five years is $5,128 in 2010, $4,983 in 2011, $4,927 in 2012, $4,365 in 2013 and $3,746 in 2014.
F-10
LINCOLN ELECTRIC HOLDINGS, INC.
NOTES TO CONSOLIDATED FINANCIAL STATEMENTS — (Continued)
NOTE 1 – SIGNIFICANT ACCOUNTING POLICIES (continued)
Long-lived Assets
The Company periodically evaluates whether current facts or circumstances indicate that the carrying value of its depreciable long-lived assets to be held and used may not be recoverable. If such circumstances are determined to exist, an estimate of undiscounted future cash flows produced by the long-lived asset, or the appropriate grouping of assets, is compared to the carrying value to determine whether impairment exists. If an asset is determined to be impaired, a loss is recognized to the extent that carrying value exceeds fair value. Fair value is measured based on quoted market prices in active markets, if available. If quoted market prices are not available, the estimate of fair value is based on various valuation techniques, including the discounted value of estimated future cash flows.
Product Warranties
The Company accrues for product warranty claims based on historical experience and the expected material and labor costs to provide warranty service. Warranty services are provided for periods up to three years from the date of sale. The accrual for product warranty claims is included in “Accrued expenses.”
The changes in the carrying amount of product warranty accruals for 2009, 2008 and 2007 were as follows:
| December 31, | ||||||||||||
| 2009 | 2008 | 2007 | ||||||||||
| Balance at beginning of year |
$ | 13,736 | $ | 12,308 | $ | 9,373 | ||||||
| Charged to expense |
11,359 | 14,022 | 12,460 | |||||||||
| Deductions |
(8,718 | ) | (11,974 | ) | (9,988 | ) | ||||||
| Foreign currency translation |
391 | (620 | ) | 463 | ||||||||
| Balance at end of year |
$ | 16,768 | $ | 13,736 | $ | 12,308 | ||||||
Warranty expense was 0.7%, 0.6% and 0.5% of sales for 2009, 2008 and 2007, respectively.
Revenue Recognition
The Company recognizes revenue when the risks and rewards of ownership and title to the product have transferred to the customer. Revenue is recognized in accordance with shipping terms which is generally at the point of shipment.
Distribution Costs
Distribution costs, including warehousing and freight related to product shipments, are included in “Cost of goods sold.”
Stock-Based Compensation
Expense is recognized for all awards of stock-based compensation by allocating the aggregate grant date fair value over the vesting period. No expense is recognized for any stock options, restricted or deferred shares ultimately forfeited because the recipients fail to meet vesting requirements.
F-11
LINCOLN ELECTRIC HOLDINGS, INC.
NOTES TO CONSOLIDATED FINANCIAL STATEMENTS — (Continued)
NOTE 1 – SIGNIFICANT ACCOUNTING POLICIES (continued)
Common stock issuable upon the exercise of employee stock options is excluded from the calculation of diluted earnings per share when the calculation of option equivalent shares is anti-dilutive. The calculation of diluted earnings per share excludes anti-dilutive shares of 709,512 in 2009, 232,044 in 2008 and 29,495 in 2007.
Translation of Foreign Currencies
Asset and liability accounts are translated into U.S. dollars using exchange rates in effect at the date of the consolidated balance sheet; revenue and expense accounts are translated at monthly exchange rates. Translation adjustments are reflected as a component of Shareholders’ equity. For subsidiaries operating in highly inflationary economies, both historical and current exchange rates are used in translating balance sheet accounts, and translation adjustments are included in net income.
Foreign currency transaction losses are included in “Selling, general & administrative expenses” and were $226, $10,409 and $6,102 in 2009, 2008 and 2007, respectively.
Financial Instruments
The Company uses forward contracts to hedge exposures to commodity prices and exchange rate fluctuations on certain purchase and sales transactions and balance sheet exposures. Contracts are generally written on a short-term basis but may cover exposures for up to two years and are not held for trading or speculative purposes. The Company uses interest rate swaps from time to time to hedge changes in the fair value of debt. The Company recognizes derivative instruments as either assets or liabilities at fair value. The accounting for changes in the fair value of derivative instruments depends on whether it has been designated and qualifies as part of a hedging relationship and on the type of hedging relationship.
For derivative instruments that qualify as a fair value hedge (i.e., hedging the exposure to changes in the fair value of an asset or a liability), the gain or loss on the derivative instrument, as well as the offsetting loss or gain on the hedged item are recognized in earnings. For derivative instruments that qualify as a cash flow hedge (i.e., hedging the exposure to variability in expected future cash flows), the effective portion of the unrealized gain or loss on the derivative instrument is reported as a component of “Accumulated other comprehensive loss” with offsetting amounts recorded as “Other current assets,” “Other non-current assets,” “Other current liabilities” or “Other long-term liabilities” depending on the position and the duration of the contract. At settlement, the realized gain or loss is reflected in earnings in the same period or periods during which the hedged transaction affects earnings. Any remaining gain or loss on the derivative instrument is recognized in earnings. For derivative instruments not designated as hedges, the gain or loss from changes in the fair value of the instruments is recognized in earnings. The Company does not hedge its net investments in foreign subsidiaries.
Advertising Costs
Advertising costs are charged to “Selling, general & administrative expenses” when incurred and totaled $7,982, $10,337 and $10,245 in 2009, 2008 and 2007, respectively.
Research and Development
Research and development costs are charged to “Selling, general & administrative expenses” as incurred and totaled $27,567, $26,736 and $25,794 in 2009, 2008 and 2007, respectively.
F-12
LINCOLN ELECTRIC HOLDINGS, INC.
NOTES TO CONSOLIDATED FINANCIAL STATEMENTS — (Continued)
NOTE 1 – SIGNIFICANT ACCOUNTING POLICIES (continued)
Bonus
Included in “Selling, general & administrative expenses” are the costs related to the Company’s discretionary employee bonus programs, net of hospitalization costs for certain U.S.-based employees, of $43,919 in 2009, $100,706 in 2008 and $93,958 in 2007.
Estimates
The preparation of financial statements in conformity with U.S. generally accepted accounting principles (“GAAP”) requires management to make estimates and assumptions in certain circumstances that affect the amounts reported in the accompanying consolidated financial statements and notes. Actual results could differ from these estimates.
Reclassification
Certain reclassifications have been made to prior year financial statements to conform to current year classifications.
New Accounting Pronouncements
New Accounting Standards Adopted:
In June 2009, the Financial Accounting Standards Board (“FASB”) issued Accounting Standards Codification (“ASC”) topic 105 (formerly Statement of Financial Accounting Standards (“SFAS”) 168, “The FASB Accounting Standards Codification and the Hierarchy of Generally Accepted Accounting Principles”). ASC 105 established the FASB Accounting Standards Codification as the source of authoritative accounting principles recognized by the FASB to be applied by entities in the preparation of financial statements in conformity with GAAP. This pronouncement is effective for financial statements issued for interim and annual periods ending after September 15, 2009. The Company adopted this pronouncement in 2009. Adoption did not have a significant impact on the Company’s financial statements.
In May 2009, the FASB issued ASC 855 (formerly SFAS 165, “Subsequent Events”). ASC 855 established general standards of accounting for disclosure of events that occur after the balance sheet date but before financial statements are issued or are available to be issued. In particular, ASC 855 sets forth the period after the balance sheet date during which management should evaluate events or transactions that may occur for potential recognition or disclosure in the financial statements, the circumstances under which an entity should recognize events or transactions occurring after the balance sheet date in its financial statements and the disclosures that an entity should make about events or transactions that occurred after the balance sheet date. ASC 855 was adopted in 2009 and did not have a significant impact on the Company’s financial statements.
In December 2008, the FASB issued ASC 715 (formerly FSP FAS 132(R)-1, “Employers’ Disclosures about Postretirement Benefit Plan Assets”). ASC 715 requires disclosure about an entity’s investment policies and strategies, the categories of plan assets, concentrations of credit risk and fair value measurements of plan assets. The standard, effective for fiscal years ending after December 15, 2009, resulted in increased disclosures in the notes to the Company’s financial statements related to the assets of the Company’s defined benefit pension plans.
In November 2008, the FASB issued ASC 323-10 (formerly Emerging Issues Task Force (“EITF’) Issue 08-6, “Equity Method Investment Accounting Considerations”). ASC 323-10 addresses the impact that ASC 805 (formerly SFAS 141(R)), and ASC 810 (formerly SFAS 160), might have on the accounting for equity method
F-13
LINCOLN ELECTRIC HOLDINGS, INC.
NOTES TO CONSOLIDATED FINANCIAL STATEMENTS — (Continued)
NOTE 1 – SIGNIFICANT ACCOUNTING POLICIES (continued)
investments including how the initial carrying value of an equity method investment should be determined, how it should be tested for impairment and how changes in classification from equity method to cost method should be treated. ASC 323-10 is to be implemented prospectively and is effective for fiscal years beginning after December 15, 2008. The adoption of ASC 323-10 did not have a significant impact on the Company’s financial statements.
In June 2008, the FASB issued ASC 260-10 (formerly FSP EITF 03-6-1, “Determining Whether Instruments Granted in Share-Based Payment Transactions Are Participating Securities”). ASC 260-10 determined that unvested share-based payment awards that contain rights to receive nonforfeitable dividends or dividend equivalents (whether paid or unpaid) are participating securities, and thus, should be included in the two-class method of computing earnings per share. This standard did not have a significant impact on the Company’s disclosure of earnings per share.
In April 2008, the FASB issued ASC 275-10 and ASC 350-30 (formerly FSP 142-3, “Determination of the Useful Life of Intangible Assets”). These standards amend the factors that should be considered in developing renewal or extension assumptions used to determine the useful life of a recognized intangible asset under ASC 350 (formerly SFAS 142, “Goodwill and Other Intangible Assets”). ASC 275-10 and ASC 350-30 are effective for financial statements issued for fiscal years beginning after December 15, 2008 and interim periods within those fiscal years. ASC 275-10 and ASC 350-30 apply prospectively to intangible assets acquired after adoption. The adoption of ASC 275-10 and ASC 350-30 did not have a significant impact on the Company’s financial statements.
In March 2008, the FASB issued ASC 815 (formerly SFAS 161, “Disclosures about Derivative Instruments and Hedging Activities”). ASC 815 requires disclosures of how and why an entity uses derivative instruments, how derivative instruments and related hedged items are accounted for and how derivative instruments and related hedged items affect an entity’s financial position, financial performance and cash flows. ASC 815 is effective for fiscal years beginning after November 15, 2008 with early adoption permitted. The Company adopted these provisions as of January 1, 2009. See Note 10 for the Company’s disclosures pursuant to adoption.
In December 2007, the FASB issued ASC 810 (formerly SFAS 160, “Noncontrolling Interests in Consolidated Financial Statements”). ASC 810 clarifies that a noncontrolling interest in a subsidiary is an ownership interest in the consolidated entity that should be reported as equity in the consolidated financial statements. ASC 810 changes the way the consolidated statement of income is presented thus requiring consolidated net income to be reported at amounts that include the amounts attributable to both parent and the noncontrolling interest. This pronouncement is effective for fiscal years and interim periods within those fiscal years beginning on or after December 15, 2008. The Company adopted these provisions as of January 1, 2009, applying the presentation and disclosure requirements retrospectively resulting in reclassification of noncontrolling interests from “Other non-current liabilities” to “Total equity.” Income attributable to noncontrolling interests is included in “Selling, general and administrative expenses” in the Consolidated Statements of Income and is not material to the Company. Therefore, the Company did not present income attributable to non-controlling interests separately in the Consolidated Statements of Income.
In December 2007, the FASB issued ASC 805 (formerly SFAS 141 (revised 2007), “Business Combinations” which replaced SFAS 141, “Business Combinations”). ASC 805 retains the fundamental requirements in SFAS 141 that the acquisition method of accounting (which SFAS 141 called the purchase method) be used for all business combinations and for an acquirer to be identified for each business combination. ASC 805 defines the acquirer as the entity that obtains control of one or more businesses in the business combination and establishes the acquisition date as the date that the acquirer achieves control. ASC 805 requires an acquirer to recognize the assets acquired, the liabilities assumed and any noncontrolling interest in the acquiree at the acquisition date
F-14
LINCOLN ELECTRIC HOLDINGS, INC.
NOTES TO CONSOLIDATED FINANCIAL STATEMENTS — (Continued)
NOTE 1 – SIGNIFICANT ACCOUNTING POLICIES (continued)
measured at their fair values as of that date with limited exceptions specified in the statement. ASC 805 applies prospectively to business combinations for which the acquisition date is on or after the beginning of the first annual reporting period beginning on or after December 15, 2008.
New Accounting Standards to be Adopted:
In January 2010, the FASB issued Accounting Standards Update (“ASU”) No. 2010-06, “Fair Value Measurements and Disclosures (Topic 820) Improving Disclosures about Fair Value Measurements.” ASU 2010-06 amends ASC 820-10-50 to require additional information to be disclosed principally with respect to Level 3 fair value measurements and transfers to and from Level 1 and Level 2 measurements; in addition, enhanced disclosure is required concerning inputs and valuation techniques used to determine Level 2 and Level 3 fair value measurements. The new disclosures and clarifications of existing disclosures, as required by ASU 2010-06, are effective for interim and annual reporting periods beginning after December 15, 2009, except for the disclosures about purchases, sales, issuances and settlements in the roll forward of activity in Level 3 fair value measurements. Those disclosures are effective for fiscal years beginning after December 15, 2010, and for interim periods within those fiscal years. Earlier application is permitted. ASU No. 2010-06 is not expected to have a significant impact on the Company’s financial statements.
In December 2009, the FASB issued ASU No. 2009-17, “Consolidations (Topic 810) Improvements to Financial Reporting by Enterprises Involved with Variable Interest Entities an Amendment of the FASB Accounting Standards Codification.” In June 2009, the FASB issued ASC 810 (formerly SFAS 167, “Amendments to FASB Interpretation No. 46(R)”). The objective of ASC 810 is to amend certain requirements of FASB Interpretation 46 (R) (revised December 2003), “Consolidation of Variable Interest Entities,” to improve financial reporting by enterprises involved with variable interest entities and to provide more relevant and reliable information to users of financial statements. ASC 810 will be effective as of the beginning of each reporting entity’s first annual reporting period that begins after November 15, 2009, for interim periods within that first annual reporting period, and for interim and annual reporting periods thereafter. Earlier application is prohibited. ASU No. 2009-17 is not expected to have a significant impact on the Company’s financial statements.
In December 2009, the FASB issued ASU No. 2009-16, “Transfers and Servicing (Topic 860) Accounting for Transfers of Financial Assets an Amendment of the FASB Accounting Standards Codification.” In June 2009, the FASB issued ASC 860, “Transfers and Servicing,” (formerly SFAS 166, “Accounting for Transfers of Financial Assets, an amendment of FASB Statement No. 140”). The objective of ASC 860 is to improve the relevance, representational faithfulness and comparability of the information that a reporting entity provides in its financial reports about a transfer of financial assets; the effects of a transfer on its financial position, financial performance and cash flows; and a transferor’s continuing involvement in transferred financial assets. ASC 860 must be applied as of the beginning of each reporting entity’s first annual reporting period that begins after November 15, 2009, for interim periods within that first annual reporting period and for interim and annual reporting periods thereafter. Earlier application is prohibited. ASU No. 2009-16 must be applied to transfers occurring on or after the effective date. ASU No. 2009-16 is not expected to have a significant impact on the Company’s financial statements.
In October 2009, the FASB issued ASU No. 2009-13, “Revenue Recognition (Topic 605) Multiple-Deliverable Revenue Arrangements a consensus of the FASB Emerging Issues Task Force.” This update provides amendments to the criteria in Subtopic ASC 605-25. ASU No. 2009-13 provides principles for allocating consideration among multiple-elements and accounting for separate deliverables under an arrangement. ASC 605-25, as amended, introduces an estimated selling price method for valuing the elements of a bundled arrangement if vendor-specific objective evidence or third-party evidence of selling price is not available and
F-15
LINCOLN ELECTRIC HOLDINGS, INC.
NOTES TO CONSOLIDATED FINANCIAL STATEMENTS — (Continued)
NOTE 1 – SIGNIFICANT ACCOUNTING POLICIES (continued)
significantly expands related disclosure requirements. This standard is effective on a prospective basis for revenue arrangements entered into or materially modified in fiscal years beginning on or after June 15, 2010. Alternatively, adoption may be on a retrospective basis and early application is permitted. The Company is currently evaluating the impact of ASU No. 2009-13, but does not expect it will have a significant impact on the Company’s financial statements.
NOTE 2 – ACQUISITIONS
On July 29, 2009, the Company completed the acquisition of 100% of Jin Tai, based in Jinzhou, China. This transaction expanded the Company’s customer base and gave the Company control of significant cost-competitive solid wire manufacturing capacity.
The Company previously held a 21% direct interest in Jin Tai and a further 27% indirect interest via its 35% interest in Taiwan-based Kuang Tai Metal Industrial Co., Ltd. (“Kuang Tai”). Under the terms of the agreement, the Company exchanged its 35% interest in Kuang Tai with a fair value of $22,723, paid cash of $35,531 and will pay an additional $4,181 in cash over a three-year period after close.
The fair value of the Company’s previous non-controlling direct interest in Jin Tai was $8,675. The carrying values of the Company’s interests in Kuang Tai and Jin Tai were $29,368 and $9,973, respectively. The excess carrying value over fair value of these interests resulted in a loss on the transaction of $7,943 recorded in “Equity (loss) earnings in affiliates.”
The Company previously reported its proportional share of Jin Tai’s net income under the equity method in “Equity (loss) earnings in affiliates.” Jin Tai’s sales were $186,774 in 2008 and $74,834 in 2009 prior to the acquisition. Jin Tai’s sales of $53,956 after the acquisition were included in “Net sales” for 2009. The pro forma impact on the results of operations if the acquisition had been completed as of the beginning of both 2009 and 2008 would not have been significant.
The identifiable assets acquired and liabilities assumed upon the acquisition of Jin Tai were as follows:
| July 29, 2009 | |||
| Cash and cash equivalents |
$ | 16,032 | |
| Accounts receivable |
23,306 | ||
| Inventory |
17,037 | ||
| Other current assets |
18,932 | ||
| Property, plant and equipment |
29,275 | ||
| Intangibles |
15,201 | ||
| Goodwill |
1,429 | ||
| Other non-current assets |
5,585 | ||
| Total assets acquired |
126,797 | ||
| Amounts due banks |
28,833 | ||
| Trade accounts payable |
2,306 | ||
| Current liabilities |
7,839 | ||
| Long-term liabilities |
15,459 | ||
| Total liabilities assumed |
54,437 | ||
| Net assets acquired |
$ | 72,360 | |
F-16
LINCOLN ELECTRIC HOLDINGS, INC.
NOTES TO CONSOLIDATED FINANCIAL STATEMENTS — (Continued)
NOTE 2 – ACQUISITIONS (continued)
All assets acquired and liabilities assumed were recorded at estimated fair value. Goodwill of $1,429 was allocated to the Asia Pacific Welding segment and is not deductible for income tax purposes under current tax law. Net assets acquired included a non-controlling interest in one of Jin Tai’s operations valued at $1,250. This non-controlling interest was subsequently acquired and accounted for as an equity transaction.
On October 1, 2008, the Company acquired a 90% interest in a leading Brazilian manufacturer of brazing products for approximately $24,000 in cash and assumed debt. The newly acquired company, based in Sao Paulo, is being operated as Harris Soldas Especiais S.A. This acquisition expanded the Company’s brazing product line and increased the Company’s presence in the South American market. Annual sales at the time of the acquisition were approximately $30,000.
On April 7, 2008, the Company acquired all of the outstanding stock of Electro-Arco S.A. (“Electro-Arco”), a privately held manufacturer of welding consumables headquartered near Lisbon, Portugal, for approximately $24,000 in cash and assumed debt. This acquisition added to the Company’s European consumables manufacturing capacity and widened the Company’s commercial presence in Western Europe. Annual sales at the time of the acquisition were approximately $40,000.
On November 30, 2007, the Company acquired the assets and business of Vernon Tool Company Ltd. (“Vernon Tool”), a privately held manufacturer of computer-controlled pipe cutting equipment used for precision fabrication purposes headquartered near San Diego, California, for approximately $12,434 in cash. This acquisition added to the Company’s ability to support its customers in the market for infrastructure development. Annual sales at the time of the acquisition were approximately $9,000.
On November 29, 2007, the Company announced that it had entered into a majority-owned joint venture with Zhengzhou Heli Welding Materials Company Ltd. (“Zhengzhou Heli”), a privately held manufacturer of subarc flux based in Zhengzhou, China. The Company has contributed $16,400 to Zhengzhou Heli. Annual sales at the time of the acquisition were approximately $8,000.
On July 20, 2007, the Company acquired Nanjing Kuang Tai Welding Materials Company, Ltd. (“Nanjing”), a manufacturer of stick electrode products based in Nanjing, China, for approximately $4,245 in cash and assumed debt. The Company previously owned 35% of Nanjing indirectly through its investment in Kuang Tai. Annual sales at the time of the acquisition were approximately $10,000.
On March 30, 2007, the Company acquired all of the outstanding stock of Spawmet Sp. z o.o. (“Spawmet”), a privately held manufacturer of welding consumables headquartered near Katowice, Poland, for approximately $5,000 in cash. This acquisition provided the Company with a portfolio of stick electrode products and broadened its distributor network in Poland and Eastern Europe. Annual sales at the time of the acquisition were approximately $5,000.
Acquired companies are included in the Company’s consolidated financial statements as of the date of acquisition.
NOTE 3 – SEGMENT INFORMATION
The Company’s primary business is the design and manufacture of arc welding and cutting products, manufacturing a broad line of arc welding equipment, consumable welding products and other welding and cutting products. The Company also has a leading global position in the brazing and soldering alloys market.
During the fourth quarter of 2009, the Company realigned its business units into five operating segments to enhance the utilization of the Company’s worldwide resources and global sourcing initiatives. The operating
F-17
LINCOLN ELECTRIC HOLDINGS, INC.
NOTES TO CONSOLIDATED FINANCIAL STATEMENTS — (Continued)
NOTE 3 – SEGMENT INFORMATION (continued)
segments consist of North America Welding, Europe Welding, Asia Pacific Welding, South America Welding and The Harris Products Group. The North America Welding segment includes welding operations in the United States, Canada and Mexico. The other three welding segments include welding operations in Europe, Asia Pacific and South America, respectively. The fifth segment, The Harris Products Group, includes the Company’s global cutting, soldering and brazing businesses as well as the retail business in the United States. The segment information of prior periods has been recast to conform to the current segment presentation.
Segment performance is measured and resources are allocated based on a number of factors, the primary profit measure being earnings before interest and income taxes (“EBIT”), as adjusted. Segment EBIT is adjusted for special items as determined by management such as the impact of rationalization activities, certain asset impairment charges and gains or losses on disposals of assets. The accounting principles applied at the operating segment level are generally the same as those applied at the consolidated financial statement level with the exception of LIFO. Segment assets include inventories measured on a FIFO basis while consolidated inventories are reported on a LIFO basis. Segment and consolidated income before interest and income taxes are reported on a LIFO basis. At December 31, 2009, 2008 and 2007, approximately 31%, 35% and 36%, respectively, of total inventories were valued using the LIFO method. LIFO is only used for certain domestic inventories included in the North America Welding segment. Inter-segment sales are recorded at agreed upon prices that approximate arm’s length prices and are eliminated in consolidation. Corporate-level expenses are allocated to the operating segments on a basis that management believes to be reasonable. Certain corporate-level expenses may not be allocated to the operating segments and are reported as Corporate/Eliminations.
F-18
LINCOLN ELECTRIC HOLDINGS, INC.
NOTES TO CONSOLIDATED FINANCIAL STATEMENTS — (Continued)
NOTE 3 – SEGMENT INFORMATION (continued)
Financial information for the reportable segments follows:
| North America Welding |
Europe Welding |
Asia Pacific Welding |
South America Welding |
The Harris Products Group |
Corporate / Eliminations |
Consolidated | ||||||||||||||||||||
| For the year ended December 31, 2009 |
||||||||||||||||||||||||||
| Net sales |
$ | 858,180 | $ | 346,383 | $ | 208,280 | $ | 99,171 | $ | 217,271 | $ | — | $ | 1,729,285 | ||||||||||||
| Inter-segment sales |
85,630 | 8,725 | 4,051 | 308 | 7,739 | (106,453 | ) | — | ||||||||||||||||||
| Total |
$ | 943,810 | $ | 355,108 | $ | 212,331 | $ | 99,479 | $ | 225,010 | $ | (106,453 | ) | $ | 1,729,285 | |||||||||||
| EBIT, as adjusted |
$ | 134,544 | $ | (2,196 | ) | $ | (18,370 | ) | $ | 10,648 | $ | 888 | $ | (3,344 | ) | $ | 122,170 | |||||||||
| Special items |
10,386 | 4,335 | 9,607 | 528 | 5,774 | — | 30,630 | |||||||||||||||||||
| EBIT |
$ | 124,158 | $ | (6,531 | ) | $ | (27,977 | ) | $ | 10,120 | $ | (4,886 | ) | $ | (3,344 | ) | $ | 91,540 | ||||||||
| Interest income |
3,462 | |||||||||||||||||||||||||
| Interest expense |
(8,521 | ) | ||||||||||||||||||||||||
| Income before income taxes |
$ | 86,481 | ||||||||||||||||||||||||
| Total assets |
$ | 792,876 | $ | 379,449 | $ | 310,329 | $ | 81,734 | $ | 253,851 | $ | (112,947 | ) | $ | 1,705,292 | |||||||||||
| Equity investments in affiliates |
— | 19,455 | — | 3,444 | — | — | 22,899 | |||||||||||||||||||
| Capital expenditures |
13,726 | 7,543 | 15,887 | 796 | 2,457 | (2,208 | ) | 38,201 | ||||||||||||||||||
| Depreciation and amortization |
31,097 | 9,779 | 9,397 | 1,543 | 4,642 | 140 | 56,598 | |||||||||||||||||||
| For the year ended December 31, 2008 |
||||||||||||||||||||||||||
| Net sales |
$ | 1,313,881 | $ | 538,570 | $ | 230,661 | $ | 116,061 | $ | 279,958 | $ | — | $ | 2,479,131 | ||||||||||||
| Inter-segment sales |
127,087 | 15,649 | 3,522 | 37 | 8,568 | (154,863 | ) | — | ||||||||||||||||||
| Total |
$ | 1,440,968 | $ | 554,219 | $ | 234,183 | $ | 116,098 | $ | 288,526 | $ | (154,863 | ) | $ | 2,479,131 | |||||||||||
| EBIT, as adjusted |
$ | 243,648 | $ | 55,998 | $ | 8,260 | $ | 9,984 | $ | 10,218 | $ | (5,618 | ) | $ | 322,490 | |||||||||||
| Special items |
818 | 2,052 | 15,582 | — | 919 | — | 19,371 | |||||||||||||||||||
| EBIT |
$ | 242,830 | $ | 53,946 | $ | (7,322 | ) | $ | 9,984 | $ | 9,299 | $ | (5,618 | ) | $ | 303,119 | ||||||||||
| Interest income |
8,845 | |||||||||||||||||||||||||
| Interest expense |
(12,155 | ) | ||||||||||||||||||||||||
| Income before income taxes |
$ | 299,809 | ||||||||||||||||||||||||
| Total assets |
$ | 848,233 | $ | 428,690 | $ | 244,461 | $ | 81,093 | $ | 248,360 | $ | (132,032 | ) | $ | 1,718,805 | |||||||||||
| Equity investments in affiliates |
— | 13,814 | 45,256 | 3,288 | — | — | 62,358 | |||||||||||||||||||
| Capital expenditures |
39,486 | 13,956 | 14,788 | 2,172 | 2,406 | (382 | ) | 72,426 | ||||||||||||||||||
| Depreciation and amortization |
32,383 | 11,065 | 6,631 | 1,501 | 5,145 | 200 | 56,925 | |||||||||||||||||||
| For the year ended December 31, 2007 |
||||||||||||||||||||||||||
| Net sales |
$ | 1,248,382 | $ | 474,388 | $ | 178,120 | $ | 101,426 | $ | 278,468 | $ | — | $ | 2,280,784 | ||||||||||||
| Inter-segment sales |
114,930 | 14,295 | 2,501 | 1,793 | 8,028 | (141,547 | ) | — | ||||||||||||||||||
| Total |
$ | 1,363,312 | $ | 488,683 | $ | 180,621 | $ | 103,219 | $ | 286,496 | $ | (141,547 | ) | $ | 2,280,784 | |||||||||||
| EBIT, as adjusted |
$ | 206,768 | $ | 57,495 | $ | (328 | ) | $ | 8,804 | $ | 18,612 | $ | (1,246 | ) | $ | 290,105 | ||||||||||
| Special items |
— | — | — | — | (188 | ) | — | (188 | ) | |||||||||||||||||
| EBIT |
$ | 206,768 | $ | 57,495 | $ | (328 | ) | $ | 8,804 | $ | 18,800 | $ | (1,246 | ) | $ | 290,293 | ||||||||||
| Interest income |
8,294 | |||||||||||||||||||||||||
| Interest expense |
(11,430 | ) | ||||||||||||||||||||||||
| Income before income taxes |
$ | 287,157 | ||||||||||||||||||||||||
| Total assets |
$ | 859,828 | $ | 428,181 | $ | 215,946 | $ | 77,349 | $ | 229,973 | $ | (165,981 | ) | $ | 1,645,296 | |||||||||||
| Equity investments in affiliates |
— | 16,154 | 40,787 | 2,782 | — | — | 59,723 | |||||||||||||||||||
| Capital expenditures |
25,275 | 16,546 | 15,491 | 1,754 | 3,679 | (1,112 | ) | 61,633 | ||||||||||||||||||
| Depreciation and amortization |
31,160 | 9,454 | 4,921 | 1,251 | 5,766 | 58 | 52,610 | |||||||||||||||||||
F-19
LINCOLN ELECTRIC HOLDINGS, INC.
NOTES TO CONSOLIDATED FINANCIAL STATEMENTS — (Continued)
NOTE 3 – SEGMENT INFORMATION (continued)
In 2009, special items include for the North America Welding segment a charge of $10,386 for rationalization actions. The Europe Welding segment includes a charge of $9,868 for rationalization actions, $134 in intangible asset impairment charges and a gain of $5,667 on the sale of a property. The Asia Pacific Welding segment includes a charge of $3,207 for rationalization actions, a gain of $1,543 on the settlement of a pension obligation and a loss of $7,943 associated with the acquisition of Jin Tai and related divestiture of Kuang Tai. The South America Welding segment includes a charge of $528 for rationalization actions. The Harris Products Group segment includes a charge of $5,029 for rationalization actions and $745 in intangible asset impairment charges.
In 2008, special items include for the North America Welding segment a charge of $818 for the impairment of an intangible asset. The Europe Welding segment includes a charge of $1,528 for rationalization actions and a charge of $524 for the impairment of an intangible asset. The Asia Pacific Welding segment includes a charge of $15,582 for the impairment of goodwill and certain long-lived assets. The Harris Products Group segment includes a charge of $919 for rationalization actions.
In 2007, special items include for The Harris Products Group segment a gain of $188 for rationalization actions.
Export sales (excluding intercompany sales) from the United States were $154,526 in 2009, $242,312 in 2008 and $194,476 in 2007. No individual customer comprised more than 10% of the Company’s total revenues for any of the three years ended December 31, 2009.
The geographic split of the Company’s net sales, based on the location of the customer, and property, plant and equipment were as follows:
| Year Ended December 31, | ||||||||||||
| 2009 | 2008 | 2007 | ||||||||||
| Net sales: |
||||||||||||
| United States |
$ | 722,638 | $ | 1,072,593 | $ | 1,064,113 | ||||||
| Foreign countries |
1,006,647 | 1,406,538 | 1,216,671 | |||||||||
| Total |
$ | 1,729,285 | $ | 2,479,131 | $ | 2,280,784 | ||||||
| December 31, | ||||||||||||
| 2009 | 2008 | 2007 | ||||||||||
| Property, plant and equipment, net: |
||||||||||||
| United States |
$ | 153,342 | $ | 169,764 | $ | 167,659 | ||||||
| Foreign countries |
307,073 | 259,469 | 263,738 | |||||||||
| Eliminations |
(354 | ) | (1,331 | ) | (1,453 | ) | ||||||
| Total |
$ | 460,061 | $ | 427,902 | $ | 429,944 | ||||||
Net sales derived from customers and property, plant and equipment in any individual foreign country were not material.
F-20
LINCOLN ELECTRIC HOLDINGS, INC.
NOTES TO CONSOLIDATED FINANCIAL STATEMENTS — (Continued)
NOTE 4 – RATIONALIZATION AND ASSET IMPAIRMENTS
The Company recorded rationalization and asset impairment charges of $29,897 for the year ended December 31, 2009. These charges include $27,142 primarily related to employee severance costs, $2,061 in long-lived asset impairment charges, $879 in indefinite-lived intangible asset impairment charges and a gain of $185 recognized in connection with the partial settlement of a pension plan.
In the fourth quarter of 2009, the Company determined that the carrying value of certain long-lived assets exceeded fair value at operations affected by rationalization activities initiated in the second and third quarters of 2009. As a result, asset impairment charges totaling $2,061 were recognized in “Rationalization and asset impairment charges (gain).” Of the total asset impairment charges, $253 were recognized in the Europe Welding segment, $1,515 in the Asia Pacific Welding segment and $293 in The Harris Products Group segment. Fair values of impaired long-lived assets were determined primarily by third party appraisal.
During the third quarter of 2009, the Company initiated various rationalization actions including the closure of a manufacturing facility in Europe and the consolidation of certain manufacturing operations in the Europe Welding and Asia Pacific Welding segments. These actions impacted 80 employees in the Europe Welding segment, 175 employees in the Asia Pacific Welding segment and nine employees in the South America Welding segment. These actions are expected to cost approximately $12,000, of which the Company recorded rationalization charges of $8,333 for the year ended December 31, 2009. At December 31, 2009, a liability related to these actions of $3,912 was recorded in “Other current liabilities.” Costs related to these actions relate primarily to employee severance actions that are expected to be substantially completed and paid over the next year.
During the second quarter of 2009, the Company initiated various rationalization actions including the closure of a manufacturing facility in The Harris Products Group segment. These actions affected eight employees in the North America Welding segment, 61 employees in the Europe Welding segment, 81 employees in the Asia Pacific Welding segment, 23 employees in the South America Welding segment and 58 employees in The Harris Products Group segment. The Company recorded rationalization charges of $6,684 for the year ended December 31, 2009 related to these actions. A liability related to these actions of $2,445 was recorded in “Other current liabilities” at December 31, 2009. These costs relate primarily to employee severance actions that are essentially complete and are expected to be paid over the next year.
Rationalization actions taken during the first quarter of 2009 included a voluntary separation incentive program covering certain U.S.-based employees. These actions affected 408 employees in the North America Welding segment, 48 employees in the Europe Welding segment, 44 employees in the Asia Pacific Welding segment, 22 employees in the South America Welding segment and 46 employees in The Harris Products Group segment. The Company recorded rationalization charges of $12,092 for the year ended December 31, 2009 related to these actions. At December 31, 2009, all activities associated with these actions were completed.
Rationalization actions taken during the fourth quarter of 2008 affected 67 and 65 employees in The Harris Products Group and Europe Welding segments, respectively. The Company recorded rationalization charges of $2,447 at December 31, 2008 and $33 for the year ended December 31, 2009 related to these actions. At December 31, 2009, all activities associated with these actions were completed.
The Company continues evaluating its cost structure and additional rationalization actions may result in charges in subsequent quarters.
In the fourth quarter of 2008, the Company recorded asset impairment charges totaling $16,924 in “Rationalization and asset impairment charges (gain).”
In the fourth quarter of 2008, the Company determined that poor operating results and a dampened economic outlook indicated the potential for impairment at two of its businesses in China. Impairment testing determined
F-21
LINCOLN ELECTRIC HOLDINGS, INC.
NOTES TO CONSOLIDATED FINANCIAL STATEMENTS — (Continued)
NOTE 4 – RATIONALIZATION AND ASSET IMPAIRMENTS (continued)
that the carrying value of long-lived assets exceeded fair value at one of these businesses and the Company recorded a charge of $2,388. In addition, the carrying value of goodwill at both of these businesses exceeded the implied value of goodwill and the Company recorded a charge of $13,194.
The Company also tested indefinite-lived intangible assets and determined that the carrying value of certain intangible assets in the Europe Welding and North America Welding segments exceeded fair value. As a result, the Company recorded charges of $524 and $818, respectively.
Fair values of impaired assets were determined using projected discounted cash flows.
In 2005, the Company committed to a plan to rationalize manufacturing operations at Harris Calorific Limited (“Harris Ireland”). The Company incurred a total of $3,920 in charges related to this plan of which a gain of $188 was recorded in 2007. During 2009, the Company received cash of $1,740 related to the termination of the Harris Ireland pension plan and recognized a gain of $185.
The following table summarizes the activity related to the rationalization liabilities:
| North America Welding |
Europe Welding |
Asia Pacific Welding |
South America Welding |
The Harris Products Group |
Consolidated | |||||||||||||||||||
| Balance at December 31, 2008 |
$ | — | $ | 1,563 | $ | — | $ | — | $ | 739 | $ | 2,302 | ||||||||||||
| Payments and other adjustments |
(10,386 | ) | (8,097 | ) | (861 | ) | (528 | ) | (3,215 | ) | (23,087 | ) | ||||||||||||
| Charged to expense |
10,386 | 9,615 | 1,692 | 528 | 4,921 | 27,142 | ||||||||||||||||||
| Balance at December 31, 2009 |
$ | — | $ | 3,081 | $ | 831 | $ | — | $ | 2,445 | $ | 6,357 | ||||||||||||
NOTE 5 – ACCUMULATED OTHER COMPREHENSIVE (LOSS) INCOME
The components of accumulated other comprehensive (loss) income are as follows:
| Defined Benefit Plans, net of tax |
Currency Translation Adjustment |
Unrealized Gain (Loss) on Derivatives Designated and Qualifying as Cash Flow Hedges, net of tax |
Comprehensive Loss (Income) Attributable to Non-controlling Interests |
Total Accumulated Other Comprehensive (Loss) Income |
||||||||||||||||
| Balance January 1, 2007 |
$ | (69,978 | ) | $ | 15,266 | $ | 59 | $ | 85 | $ | (54,568 | ) | ||||||||
| Other comprehensive income (loss) |
17,704 | 55,779 | (2,989 | ) | (229 | ) | 70,265 | |||||||||||||
| Balance December 31, 2007 |
(52,274 | ) | 71,045 | (2,930 | ) | (144 | ) | 15,697 | ||||||||||||
| Other comprehensive (loss) income |
(142,422 | ) | (92,419 | ) | 842 | 48 | (233,951 | ) | ||||||||||||
| Balance December 31, 2008 |
(194,696 | ) | (21,374 | ) | (2,088 | ) | (96 | ) | (218,254 | ) | ||||||||||
| Other comprehensive income (loss) |
21,287 | 46,968 | 1,444 | (849 | ) | 68,850 | ||||||||||||||
| Balance December 31, 2009 |
$ | (173,409 | ) | $ | 25,594 | $ | (644 | ) | $ | (945 | ) | $ | (149,404 | ) | ||||||
F-22
LINCOLN ELECTRIC HOLDINGS, INC.
NOTES TO CONSOLIDATED FINANCIAL STATEMENTS — (Continued)
NOTE 6 – DEBT
At December 31, 2009 and 2008, debt consisted of the following:
| December 31, | ||||||
| 2009 | 2008 | |||||
| Long-term debt |
||||||
| Senior Unsecured Notes paid in 2009, interest at 5.89% |
$ | — | $ | 30,144 | ||
| Senior Unsecured Notes due 2012, interest at 6.36% |
84,092 | 86,759 | ||||
| Capital leases due through 2017, interest at .90% to 28.00% |
2,839 | 3,651 | ||||
| Other borrowings due through 2023, interest up to 10.59% |
2,209 | 2,240 | ||||
| 89,140 | 122,794 | |||||
| Less current portion |
1,290 | 31,257 | ||||
| Total long-term debt |
87,850 | 91,537 | ||||
| Short-term debt |
||||||
| Amounts due banks, interest at 8.35% (22.78% in 2008) |
34,577 | 19,436 | ||||
| Current portion long-term debt |
1,290 | 31,257 | ||||
| Total short-term debt |
35,867 | 50,693 | ||||
| Total debt |
$ | 123,717 | $ | 142,230 | ||
Senior Unsecured Notes
During March 2002, the Company issued Senior Unsecured Notes (the “Notes”) totaling $150,000 through a private placement. The Notes have original maturities ranging from five to ten years with a weighted-average interest rate of 6.1% and an average tenure of eight years. Interest is payable semi-annually in March and September. The proceeds are being used for general corporate purposes, including acquisitions, and are generally invested in short-term, highly liquid investments. The Notes contain certain affirmative and negative covenants, including restrictions on asset dispositions and financial covenants (interest coverage and funded debt-to-EBITDA, as defined in the Notes Agreement, ratios). As of December 31, 2009, the Company was in compliance with all of its debt covenants. The Company repaid the $40,000 Series A Notes and the $30,000 Series B Notes in March 2007 and March 2009, respectively, reducing the balance outstanding of the Notes to $80,000, which is due March 2012.
During March 2002, the Company entered into floating rate interest rate swap agreements totaling $80,000 to convert a portion of the Notes outstanding from fixed to floating rates. These swaps were designated as fair value hedges and, as such, the gains or losses on the derivative instrument, as well as the offsetting gains or losses on the hedged item attributable to the hedged risk, were recognized in earnings. Net payments or receipts under these agreements were recognized as adjustments to “Interest expense.” In May 2003, these swap agreements were terminated. The gain of $10,613 on the termination of these swaps was deferred and is being amortized as an offset to “Interest expense” over the remaining life of the Notes. The amortization of this gain reduced “Interest expense” by $313 in 2009, $958 in 2008 and $1,121 in 2007, and is expected to reduce annual “Interest expense” by $206 in 2010. At December 31, 2009, $442 remains to be amortized and is recorded in “Long-term debt, less current portion.”
F-23
LINCOLN ELECTRIC HOLDINGS, INC.
NOTES TO CONSOLIDATED FINANCIAL STATEMENTS — (Continued)
NOTE 6 – DEBT (continued)
During July 2003 and April 2004, the Company entered into various floating rate interest rate swap agreements totaling $110,000 to convert a portion of the Notes outstanding from fixed to floating rates based on the London Inter-Bank Offered Rate (“LIBOR”). These swaps were designated and qualified as fair value hedges and, as such, the gains or losses on the derivative instrument, as well as the offsetting gains or losses on the hedged item, were recognized in earnings. Net payments or receipts under these agreements were recognized as adjustments to “Interest expense.”
During February 2009, the Company terminated swaps with a notional value of $80,000 and realized a gain of $5,079. This gain was deferred and is being amortized over the remaining life of the Notes. The amortization of this gain reduced “Interest expense” by $1,429 in 2009 and is expected to reduce annual “Interest expense” by $1,661 in 2010. At December 31, 2009, $3,650 remains to be amortized and is included in “Long-term debt, less current portion.”
During March 2009, swaps designated as fair value hedges that converted the $30,000 Series B Notes from fixed to floating interest rates matured with the underlying Notes. The Company has no interest rate swaps outstanding at December 31, 2009. The weighted average effective rate on the Notes, net of the impact of swaps, was 4.1% and 4.6% for 2009 and 2008, respectively.
At December 31, 2009 and 2008, the fair value of long term debt, including the current portion, was approximately $91,365 and $124,446, respectively, which was determined using available market information and methodologies requiring judgment. Since considerable judgment is required in interpreting market information, the fair value of the debt is not necessarily the amount which could be realized in a current market exchange.
Revolving Credit Agreement
On November 18, 2009, the Company entered into an Amended and Restated Credit Agreement (“Credit Agreement”) for a $150,000 revolving credit facility to be used for general corporate purposes. This Credit Agreement amended and restated the Company’s $175,000 revolving credit agreement that was entered into on December 17, 2004 and had a maturity date in December 2009. The Credit Agreement has a three-year term and may be increased, subject to certain conditions, by an additional amount up to $75,000 at any time not later than 180 days prior to the last day of the term. The interest rate on borrowings is based on either LIBOR or the prime rate, plus a spread based on the Company’s leverage ratio, at the Company’s election. A quarterly facility fee is payable based upon the daily aggregate amount of commitments and the Company’s leverage ratio.
The Credit Agreement contains customary affirmative, negative and financial covenants for credit facilities of this type, including limitations on the Company with respect to liens, investments, distributions, mergers and acquisitions, dispositions of assets, transactions with affiliates and a fixed charges coverage ratio and total leverage ratio. As of December 31, 2009, there were no borrowings under the Credit Agreement.
Capital Leases
At December 31, 2009 and 2008, $2,839 and $3,651 of capital lease indebtedness was secured by property, plant and equipment, respectively.
Other
Maturities of long-term debt, including payments under capital leases and amounts due banks, for the five years succeeding December 31, 2009 are $35,867 in 2010, $1,297 in 2011, $80,812 in 2012, $190 in 2013, $196 in 2014 and $1,262 thereafter. Total interest paid was $11,339 in 2009, $13,037 in 2008 and $11,537 in 2007. The
F-24
LINCOLN ELECTRIC HOLDINGS, INC.
NOTES TO CONSOLIDATED FINANCIAL STATEMENTS — (Continued)
NOTE 6 – DEBT (continued)
primary difference between interest expense and interest paid is the amortization of the gains on terminated interest rate swaps.
The Company’s short-term borrowings included in “Amounts due banks” were $34,577 and $19,436 at December 31, 2009 and 2008, respectively, and represent the borrowings of foreign subsidiaries at weighted average interest rates of 8.35% and 22.78%, respectively. The decrease in the weighted average interest rate in 2009 is primarily due to the low interest rate short-term borrowings at Jin Tai offsetting higher interest rate borrowings at the Company’s subsidiary in Venezuela. The higher weighted average interest rate in 2008 was due to borrowings at the Company’s subsidiary in Venezuela.
NOTE 7 – STOCK PLANS
On April 28, 2006, the shareholders of the Company approved the 2006 Equity and Performance Incentive Plan, as amended (“EPI Plan”), which replaced the 1998 Stock Plan, as amended and restated in May 2003. The EPI Plan provides for the granting of options, appreciation rights, restricted shares, restricted stock units and performance-based awards up to an additional 3,000,000 of the Company’s common shares. In addition, on April 28, 2006, the shareholders of the Company approved the 2006 Stock Plan for Non-Employee Directors, as amended (“Director Plan”), which replaced the Stock Option Plan for Non-Employee Directors adopted in 2000. The Director Plan provides for the granting of options, restricted shares and restricted stock units up to an additional 300,000 of the Company’s common shares. At December 31, 2009, there were 3,264,886 common shares available for future grant under all plans.
The following table summarizes the activity for each of the three years ended December 31, 2009, under all Plans:
| Year Ended December 31, | ||||||||||||||||||
| 2009 | 2008 | 2007 | ||||||||||||||||
| Shares | Weighted Average Exercise Price |
Shares | Weighted Average Exercise Price |
Shares | Weighted Average Exercise Price | |||||||||||||
| Balance at beginning of year |
1,716,017 | $ | 43.55 | 1,663,704 | $ | 41.63 | 1,747,050 | $ | 34.28 | |||||||||
| Shares granted |
386,305 | 52.61 | 316,264 | 44.11 | 268,854 | 68.48 | ||||||||||||
| Shares exercised |
(66,669 | ) | 34.86 | (235,650 | ) | 30.56 | (348,450 | ) | 25.30 | |||||||||
| Shares canceled |
(19,326 | ) | 51.49 | (28,301 | ) | 45.23 | (3,750 | ) | 60.72 | |||||||||
| Balance at end of year |
2,016,327 | $ | 45.49 | 1,716,017 | $ | 43.55 | 1,663,704 | $ | 41.63 | |||||||||
| Exercisable at end of year |
1,334,346 | $ | 41.81 | 1,144,784 | $ | 39.14 | 1,152,545 | $ | 33.45 | |||||||||
Options granted under both the EPI Plan and its predecessor plans may be outstanding for a maximum of ten years from the date of grant. The majority of options granted vest ratably over a period of three years from the grant date. The exercise prices of all options were equal to the quoted market price of the Company’s common shares at the date of grant. The Company issued shares of common stock from treasury upon all exercises of stock options and the granting of restricted stock awards in 2009, 2008 and 2007.
Restricted shares are valued at the quoted market price on the grant date. The majority of restricted shares vest over a period of three to five years. Under the EPI Plan, the Company issued 85,943 restricted shares at a weighted average market price of $52.58 per share in 2009, 56,205 restricted shares at a market price of $44.03
F-25
LINCOLN ELECTRIC HOLDINGS, INC.
NOTES TO CONSOLIDATED FINANCIAL STATEMENTS — (Continued)
NOTE 7 – STOCK PLANS (continued)
per share in 2008 and 25,690 restricted shares at a market price of $68.51 per share in 2007. The Company issued 8,532 restricted shares at a market price of $52.71 per share, 10,233 restricted shares at a market price of $43.97 per share and 7,102 restricted shares at a market price of $68.21 under the Director Plan in 2009, 2008 and 2007, respectively.
The Company uses the Black-Scholes option pricing model for estimating fair values of options. In estimating the fair value of options granted, the expected option life is based on the Company’s historical experience. The expected volatility is based on historical volatility. The weighted average assumptions for each of the three years ended December 31, 2009 were as follows:
| Year Ended December 31, | ||||||||||||
| 2009 | 2008 | 2007 | ||||||||||
| Expected volatility |
40.48 | % | 33.80 | % | 23.05 | % | ||||||
| Dividend yield |
2.15 | % | 3.09 | % | 1.57 | % | ||||||
| Risk-free interest rate |
2.04 | % | 1.63 | % | 3.50 | % | ||||||
| Expected option life (years) |
4.7 | 4.5 | 4.3 | |||||||||
| Weighted average fair value per option granted during the year |
$ | 16.05 | $ | 9.85 | $ | 14.33 | ||||||
Expense is recognized for all awards of stock-based compensation by allocating the aggregate grant date fair value over the vesting period. No expense is recognized for any stock options, restricted or deferred shares ultimately forfeited because recipients fail to meet vesting requirements. Total stock-based compensation expense recognized in the Consolidated Statements of Income for 2009, 2008 and 2007 was $5,432, $4,738 and $4,679, respectively. The related tax benefit for 2009, 2008 and 2007 was $2,058, $1,793 and $1,789, respectively. As of December 31, 2009, total unrecognized stock-based compensation expense related to nonvested stock options and restricted shares was $13,508, which is expected to be recognized over a weighted average period of approximately 39 months.
The following table summarizes nonvested stock options and restricted shares for the year ended December 31, 2009:
| December 31, 2009 | ||||||
| Number of Options and Restricted Shares |
Weighted Average Fair Value at Grant Date | |||||
| Balance at beginning of year |
524,583 | $ | 22.96 | |||
| Granted |
386,305 | 24.99 | ||||
| Vested |
(271,037 | ) | 17.35 | |||
| Forfeited |
(11,835 | ) | 11.70 | |||
| Balance at end of year |
628,016 | $ | 26.84 | |||
The aggregate intrinsic value of awards outstanding at December 31, 2009, based on the Company’s closing stock price of $53.46 as of the last business day in the year ended December 31, 2009, which would have been received by the optionees had all awards been exercised on that date was $32,367. The aggregate intrinsic value of awards exercisable at December 31, 2009, based on the Company’s closing stock price of $53.46 as of the last
F-26
LINCOLN ELECTRIC HOLDINGS, INC.
NOTES TO CONSOLIDATED FINANCIAL STATEMENTS — (Continued)
NOTE 7 – STOCK PLANS (continued)
business day in the year ended December 31, 2009, which would have been received by the optionees had all awards been exercised on that date was $19,385. The total intrinsic value of awards exercised during 2009 and 2008 was $2,236 and $10,366, respectively. Intrinsic value is the amount by which the fair value of the underlying stock exceeds the exercise price of the awards.
The following table summarizes information about awards outstanding as of December 31, 2009:
| Outstanding | Exercisable | |||||||||||
| Exercise Price Range |
Number of Awards |
Weighted Average Exercise Price |
Number of Awards |
Weighted Average Exercise Price |
Weighted Average Remaining Life (years) | |||||||
| $13.50 - $34.99 |
328,581 | $ | 23.42 | 328,581 | $ | 23.42 | 3.0 | |||||
| $35.00 - $39.99 |
527,762 | $ | 37.64 | 525,727 | $ | 37.63 | 5.4 | |||||
| Over $40.00 |
1,159,984 | $ | 55.32 | 480,038 | $ | 58.97 | 7.7 | |||||
| 2,016,327 | 1,334,346 | 6.3 | ||||||||||
The 1995 Lincoln Stock Purchase Plan provides employees the ability to purchase open market shares on a commission-free basis up to a limit of ten thousand dollars annually. Under this plan, 400,000 shares have been authorized to be purchased. Under this plan, shares purchased were 3,818 in 2009, 1,085 in 2008 and 6,843 in 2007.
NOTE 8 – RETIREMENT ANNUITY AND GUARANTEED CONTINUOUS EMPLOYMENT PLANS
The Company maintains a number of defined benefit and defined contribution plans to provide retirement benefits for employees. These plans are maintained and contributions are made in accordance with the Employee Retirement Income Security Act of 1974 (“ERISA”), local statutory law or as determined by the Board of Directors. The plans generally provide benefits based upon years of service and compensation. Pension plans are funded except for a domestic non-qualified pension plan for certain key employees and certain foreign plans. The Company uses a December 31 measurement date for its plans.
The Company does not have, and does not provide for, any postretirement or postemployment benefits other than pensions and certain non-U.S. statutory termination benefits.
Defined Benefit Plans
The defined benefit plans generally provide benefits based upon years of service and compensation. The plans are funded except for a domestic non-qualified pension plan for certain key employees and certain foreign plans. The contributions are made in amounts sufficient to fund current service costs on a current basis and to fund past service costs, if any, over various amortization periods.
F-27
LINCOLN ELECTRIC HOLDINGS, INC.
NOTES TO CONSOLIDATED FINANCIAL STATEMENTS — (Continued)
NOTE 8 – RETIREMENT ANNUITY AND GUARANTEED CONTINUOUS EMPLOYMENT PLANS (continued)
Obligations and Funded Status
| December 31, | ||||||||
| 2009 | 2008 | |||||||
| Change in benefit obligations |
||||||||
| Benefit obligations at beginning of year |
$ | 721,467 | $ | 699,129 | ||||
| Service cost |
12,755 | 16,501 | ||||||
| Interest cost |
43,097 | 42,615 | ||||||
| Plan participants’ contributions |
408 | 550 | ||||||
| Actuarial loss |
35,289 | 15,372 | ||||||
| Benefits paid |
(37,468 | ) | (38,970 | ) | ||||
| Settlement/curtailment |
(6,173 | ) | (14 | ) | ||||
| Currency translation |
8,146 | (13,716 | ) | |||||
| Benefit obligations at end of year |
777,521 | 721,467 | ||||||
| Change in plan assets |
||||||||
| Fair value of plan assets at beginning of year |
532,775 | 715,072 | ||||||
| Actual return on plan assets |
87,936 | (159,522 | ) | |||||
| Employer contributions |
46,128 | 23,810 | ||||||
| Plan participants’ contributions |
408 | 550 | ||||||
| Benefits paid |
(34,366 | ) | (34,237 | ) | ||||
| Settlement |
(3,746 | ) | — | |||||
| Currency translation |
7,623 | (12,898 | ) | |||||
| Fair value of plan assets at end of year |
636,758 | 532,775 | ||||||
| Funded status at end of year |
(140,763 | ) | (188,692 | ) | ||||
| Unrecognized net loss |
278,529 | 312,071 | ||||||
| Unrecognized prior service cost |
(872 | ) | (917 | ) | ||||
| Unrecognized transition assets, net |
78 | 109 | ||||||
| Net amount recognized |
$ | 136,972 | $ | 122,571 | ||||
The after-tax amounts of unrecognized actuarial net loss, prior service credits and transition obligations included in “Accumulated other comprehensive loss” at December 31, 2009 were $173,861, $(512) and $60, respectively. The pre-tax amounts of unrecognized actuarial net loss, prior service credits and transition obligations expected to be recognized as components of net periodic benefit cost during 2010 are $21,233, $(50) and $5, respectively.
F-28
LINCOLN ELECTRIC HOLDINGS, INC.
NOTES TO CONSOLIDATED FINANCIAL STATEMENTS — (Continued)
NOTE 8 – RETIREMENT ANNUITY AND GUARANTEED CONTINUOUS EMPLOYMENT PLANS (continued)
Amounts Recognized in Consolidated Balance Sheets
| December 31, | ||||||||
| 2009 | 2008 | |||||||
| Prepaid pensions |
$ | 1,921 | $ | 2,716 | ||||
| Accrued pension liability, current |
(3,014 | ) | (3,248 | ) | ||||
| Accrued pension liability, long-term |
(139,670 | ) | (188,160 | ) | ||||
| Accumulated other comprehensive loss, excluding tax effects |
277,735 | 311,263 | ||||||
| Net amount recognized in the balance sheets |
$ | 136,972 | $ | 122,571 | ||||
Components of Pension Cost for Defined Benefit Plans
| Year Ended December 31, | ||||||||||||
| 2009 | 2008 | 2007 | ||||||||||
| Service cost |
$ | 12,755 | $ | 16,501 | $ | 17,829 | ||||||
| Interest cost |
43,097 | 42,615 | 40,621 | |||||||||
| Expected return on plan assets |
(43,802 | ) | (56,954 | ) | (55,943 | ) | ||||||
| Amortization of prior service cost |
(23 | ) | 70 | 75 | ||||||||
| Amortization of net loss |
25,087 | 1,636 | 4,615 | |||||||||
| Settlement/curtailment (gain) loss |
(2,340 | ) | 745 | (937 | ) | |||||||
| Pension cost for defined benefit plans |
$ | 34,774 | $ | 4,613 | $ | 6,260 | ||||||
Pension Plans with Accumulated Benefit Obligations in Excess of Plan Assets
| December 31, | ||||||
| 2009 | 2008 | |||||
| U.S. pension plans |
||||||
| Projected benefit obligation |
$ | 714,455 | $ | 670,243 | ||
| Accumulated benefit obligation |
679,899 | 635,433 | ||||
| Fair value of plan assets |
584,321 | 491,367 | ||||
| Non-U.S. pension plans |
||||||
| Projected benefit obligation |
$ | 49,862 | $ | 39,362 | ||
| Accumulated benefit obligation |
46,309 | 37,208 | ||||
| Fair value of plan assets |
37,321 | 26,841 | ||||
The total accumulated benefit obligation for all plans was $738,965 as of December 31, 2009 and $685,565 as of December 31, 2008.
F-29
LINCOLN ELECTRIC HOLDINGS, INC.
NOTES TO CONSOLIDATED FINANCIAL STATEMENTS — (Continued)
NOTE 8 – RETIREMENT ANNUITY AND GUARANTEED CONTINUOUS EMPLOYMENT PLANS (continued)
Contributions to Plans
Contributions to U.S. plans were $45,000 and $20,000 for the years ended December 31, 2009 and 2008, respectively. The Company expects to contribute $30,000 to the U.S. plans during 2010. The actual amounts to be contributed to the pension plans in 2010 will be determined at the Company’s discretion.
Benefit Payments for Plans
Benefits expected to be paid for the U.S. plans are as follows:
| Estimated Payments | |||
| 2010 |
$ | 38,876 | |
| 2011 |
40,949 | ||
| 2012 |
48,212 | ||
| 2013 |
42,911 | ||
| 2014 |
44,602 | ||
| 2015 through 2019 |
253,638 | ||
Assumptions
Weighted average assumptions used to measure the benefit obligation for the Company’s significant defined benefit plans as of December 31, 2009 and 2008 were as follows:
| December 31, | ||||||
| 2009 | 2008 | |||||
| Discount rate |
5.8 | % | 6.2 | % | ||
| Rate of increase in compensation |
4.0 | % | 4.1 | % | ||
Weighted average assumptions used to measure the net periodic benefit cost for the Company’s significant defined benefit plans as of December 31, 2009, 2008 and 2007 were as follows:
| December 31, | |||||||||
| 2009 | 2008 | 2007 | |||||||
| Discount rate |
6.2 | % | 6.3 | % | 5.9 | % | |||
| Rate of increase in compensation |
4.0 | % | 4.1 | % | 4.1 | % | |||
| Expected return on plan assets |
8.2 | % | 8.2 | % | 8.4 | % | |||
To develop the discount rate assumption to be used for U.S. plans, the Company refers to the yield derived from matching projected pension payments with maturities of a portfolio of available non-callable bonds rated AA- or better. The expected long-term rate of return assumption is based on the weighted average expected return of the various asset classes in the plans’ portfolio and the targeted allocation of plan assets. The asset class return is developed using historical asset return performance as well as current market conditions such as inflation, interest rates and equity market performance. The rate of compensation increase is determined by the Company based upon annual reviews.
F-30
LINCOLN ELECTRIC HOLDINGS, INC.
NOTES TO CONSOLIDATED FINANCIAL STATEMENTS — (Continued)
NOTE 8 – RETIREMENT ANNUITY AND GUARANTEED CONTINUOUS EMPLOYMENT PLANS (continued)
Pension Plans’ Assets
The primary objective of the pension plans’ investment policy is to ensure sufficient assets are available to provide benefit obligations when such obligations mature. Investment management practices must comply with ERISA or any other applicable regulations and rulings. The overall investment strategy for the defined benefit pension plans’ assets is to achieve a rate of return over a normal business cycle relative to an acceptable level of risk that is consistent with the long-term objectives of the portfolio. The target allocation for plan assets is 60% to 70% equity securities and 30% to 40% debt securities.
The following table sets forth, by level within the fair value hierarchy, the pension plans’ assets:
| Pension Plans’ Assets at Fair Value as of December 31, 2009 | ||||||||||||
| Quoted Prices in Active Markets for Identical Assets (Level 1) |
Significant Other Observable Inputs (Level 2) |
Significant Unobservable Inputs (Level 3) |
Total | |||||||||
| Corporate stock (1) |
$ | 88,600 | $ | — | $ | — | $ | 88,600 | ||||
| Insurance company nonpooled separate |
||||||||||||
| Cash and cash equivalents |
— | 33,547 | — | 33,547 | ||||||||
| Corporate and other obligations |
— | 11,793 | 1,699 | 13,492 | ||||||||
| Common trusts (3) |
— | 496,600 | — | 496,600 | ||||||||
| Private equity funds |
— | — | 4,519 | 4,519 | ||||||||
| Total assets at fair value |
$ | 88,600 | $ | 541,940 | $ | 6,218 | $ | 636,758 | ||||
| (1) | This investment category includes publicly traded equity investments directly held by the plans. |
| (2) | The insurance company nonpooled separate account is focused on capital preservation and invests in fixed-income securities and money market instruments. |
| (3) | Common trusts are comprised of a number of investment funds that invest in a diverse portfolio of assets including equity securities, corporate and governmental bonds, equity and credit indexes, and money markets. |
The table below sets forth a summary of changes in the fair value of the Level 3 pension plans’ assets for the year ended December 31, 2009:
| Insurance Company Nonpooled Separate Account |
Private Equity Funds |
Total | |||||||||
| Balance at the beginning of year |
$ | 1,638 | $ | 2,328 | $ | 3,966 | |||||
| Purchases, sales, issuances and settlements |
(432 | ) | 2,473 | 2,041 | |||||||
| Realized and unrealized gains (losses) |
493 | (282 | ) | 211 | |||||||
| Balance at the end of year |
$ | 1,699 | $ | 4,519 | $ | 6,218 | |||||
| The amount of total (losses) gains during the period attributable to the change in unrealized (losses) gains relating to Level 3 net assets still held at the reporting date |
$ | (283 | ) | $ | 586 | $ | 303 | ||||
F-31
LINCOLN ELECTRIC HOLDINGS, INC.
NOTES TO CONSOLIDATED FINANCIAL STATEMENTS — (Continued)
NOTE 8 – RETIREMENT ANNUITY AND GUARANTEED CONTINUOUS EMPLOYMENT PLANS (continued)
Supplemental Executive Retirement Plan
The Company maintains a domestic unfunded supplemental executive retirement plan (“SERP”) under which non-qualified supplemental pension benefits are paid to certain employees in addition to amounts received under the Company’s qualified retirement plan which is subject to Internal Revenue Service (“IRS”) limitations on covered compensation. The annual cost of this program has been included in the determination of total net pension costs shown above and was $2,088, $2,598 and $2,411 in 2009, 2008 and 2007, respectively. The projected benefit obligation associated with this plan is also included in the pension disclosure shown above and was $20,442, $18,764 and $19,195 at December 31, 2009, 2008 and 2007, respectively.
Defined Contribution Plans
Substantially all U.S. employees are covered under a 401(k) savings plan in which they may invest 1% or more of eligible compensation, limited to maximum amounts as determined by the IRS. For most participants the plan provides for Company matching contributions of 35% of the first 6% of employee compensation contributed to the plan. On January 1, 2009, the match provision was suspended for the 401(k) savings plan as part of the Company’s actions to reduce costs in light of market conditions. In addition, the plan includes a feature in which participants hired after November 1, 1997 receive an annual Company contribution of 2% of their base pay. The plan allowed employees hired before November 1, 1997, at their election, to receive this contribution in exchange for forfeiting certain benefits under the pension plan.
The annual costs recognized for defined contribution plans were $4,810, $8,471 and $8,590 in 2009, 2008 and 2007, respectively.
Multi-Employer Plans
The Company participates in multi-employer plans for several of its operations in Europe. Pension costs for these plans are recognized as contributions are funded. The annual costs of these programs were $1,322, $1,509 and $1,725 in 2009, 2008 and 2007, respectively.
Other Benefits
The Cleveland, Ohio, area operations have a Guaranteed Continuous Employment Plan covering substantially all employees which, in general, provides that the Company will provide work for at least 75% of every standard work week (presently 40 hours). This plan does not guarantee employment when the Company’s ability to continue normal operations is seriously restricted by events beyond the control of the Company. The Company has reserved the right to terminate this plan effective at the end of a calendar year by giving notice of such termination not less than six months prior to the end of such year.
F-32
LINCOLN ELECTRIC HOLDINGS, INC.
NOTES TO CONSOLIDATED FINANCIAL STATEMENTS — (Continued)
NOTE 9 – INCOME TAXES
The components of income (loss) before income taxes for the three years ended December 31, 2009 were as follows:
| Year Ended December 31, | ||||||||||||
| 2009 | 2008 | 2007 | ||||||||||
| U.S. |
$ | 110,909 | $ | 223,672 | $ | 205,779 | ||||||
| Non-U.S. |
(24,428 | ) | 76,137 | 81,378 | ||||||||
| Total |
$ | 86,481 | $ | 299,809 | $ | 287,157 | ||||||
| The components of income tax expense (benefit) for the three years ended December 31, 2009 were as follows: | ||||||||||||
| Year Ended December 31, | ||||||||||||
| 2009 | 2008 | 2007 | ||||||||||
| Current: |
||||||||||||
| Federal |
$ | 25,688 | $ | 51,700 | $ | 61,277 | ||||||
| Non-U.S. |
15,943 | 21,880 | 20,313 | |||||||||
| State and local |
3,364 | 6,576 | 6,542 | |||||||||
| 44,995 | 80,156 | 88,132 | ||||||||||
| Deferred: |
||||||||||||
| Federal |
(4,612 | ) | 8,622 | (711 | ) | |||||||
| Non-U.S. |
(2,735 | ) | (1,435 | ) | (3,712 | ) | ||||||
| State and local |
257 | 180 | 712 | |||||||||
| (7,090 | ) | 7,367 | (3,711 | ) | ||||||||
| Total |
$ | 37,905 | $ | 87,523 | $ | 84,421 | ||||||
The differences between total income tax expense and the amount computed by applying the statutory Federal income tax rate to income before income taxes for the three years ended December 31, 2009 were as follows:
| Year Ended December 31, | ||||||||||||
| 2009 | 2008 | 2007 | ||||||||||
| Statutory rate of 35% applied to pre-tax income |
$ | 30,268 | $ | 104,933 | $ | 100,505 | ||||||
| Effect of state and local income taxes, net of federal tax benefit |
2,443 | 4,454 | 4,964 | |||||||||
| Taxes more (less) than the U.S. tax rate on non-U.S. earnings, including utilization of tax loss carryforwards, losses with no benefit and changes in non-U.S. valuation allowance |
21,646 | (6,203 | ) | (11,881 | ) | |||||||
| Manufacturing deduction |
(2,310 | ) | (4,170 | ) | (3,583 | ) | ||||||
| U.S. tax (benefit) cost of foreign source income |
(14,486 | ) | (6,888 | ) | 1,151 | |||||||
| Resolution of prior years’ tax liabilities |
(137 | ) | (4,309 | ) | (6,818 | ) | ||||||
| Other |
481 | (294 | ) | 83 | ||||||||
| Total |
$ | 37,905 | $ | 87,523 | $ | 84,421 | ||||||
| Effective tax rate |
43.83 | % | 29.19 | % | 29.40 | % | ||||||
Total income tax payments, net of refunds, were $33,522 in 2009, $72,923 in 2008 and $83,950 in 2007.
F-33
LINCOLN ELECTRIC HOLDINGS, INC.
NOTES TO CONSOLIDATED FINANCIAL STATEMENTS — (Continued)
NOTE 9 – INCOME TAXES (continued)
Unrecognized Tax Benefits
In 2007, the Company adopted FIN 48, subsequently codified in ASC 740, which clarified the recognition threshold and measurement attribute for the financial statement recognition and measurement of a tax position taken or expected to be taken in a tax return. The Company’s unrecognized tax benefits upon adoption were $28,997 and the cumulative effect of adoption was recorded as a decrease of $1,590 to retained earnings.
Liabilities for unrecognized tax benefits are classified as “Accrued taxes” non-current unless expected to be paid in one year. The Company recognizes interest and penalties related to unrecognized tax benefits in “Income taxes.” For the years ended December 31, 2009 and 2008, current income tax expense included $2,194 and $1,044 of interest and penalties, respectively. For those same years, the Company’s accrual for interest and penalties related to unrecognized tax benefits totaled $10,547 and $6,141, respectively.
The following table summarizes the activity related to unrecognized tax benefits:
| 2009 | 2008 | |||||||
| Balance at January 1 |
$ | 34,183 | $ | 29,215 | ||||
| Increase related to current year tax provisions |
3,973 | 7,646 | ||||||
| Increase related to prior years’ tax positions |
710 | 2,734 | ||||||
| Increase related to acquisitions |
6,617 | — | ||||||
| Decrease related to settlements with taxing authorities |
(1,685 | ) | — | |||||
| Resolution of prior years’ tax liabilities |
(1,200 | ) | (4,255 | ) | ||||
| Other |
242 | (1,157 | ) | |||||
| Balance at December 31 |
$ | 42,840 | $ | 34,183 | ||||
The total amount of unrecognized tax benefits that, if recognized, would affect the effective tax rate was $27,182 at December 31, 2009 and $19,945 at December 31, 2008.
The Company files income tax returns in the U.S. and various state, local and foreign jurisdictions. With few exceptions, the Company is no longer subject to U.S. federal, state and local or non-U.S. income tax examinations by tax authorities for years before 2005. The Company anticipates no significant changes to its total unrecognized tax benefits through the end of 2010. The Company is currently subject to an IRS audit for the tax years 2005 – 2008 and an Indonesian tax audit for 2005 – 2006. The Company does not expect the results of these examinations to have a material effect on the consolidated financial statements.
F-34
LINCOLN ELECTRIC HOLDINGS, INC.
NOTES TO CONSOLIDATED FINANCIAL STATEMENTS — (Continued)
NOTE 9 – INCOME TAXES (continued)
Deferred Taxes
Significant components of deferred tax assets and liabilities at December 31, 2009 and 2008, were as follows:
| December 31, | ||||||||
| 2009 | 2008 | |||||||
| Deferred tax assets: |
||||||||
| Tax loss and credit carryforwards |
$ | 44,634 | $ | 16,918 | ||||
| Inventory |
10,724 | 8,548 | ||||||
| Other accruals |
16,249 | 12,710 | ||||||
| Employee benefits |
14,445 | 13,502 | ||||||
| Pension obligations |
42,106 | 63,130 | ||||||
| Other |
13,572 | 16,282 | ||||||
| 141,730 | 131,090 | |||||||
| Valuation allowance |
(34,095 | ) | (18,295 | ) | ||||
| 107,635 | 112,795 | |||||||
| Deferred tax liabilities: |
||||||||
| Property, plant and equipment |
35,316 | 31,338 | ||||||
| Intangible assets |
13,766 | 10,998 | ||||||
| Inventory |
11,012 | 10,970 | ||||||
| Pension obligations |
2,016 | 2,052 | ||||||
| Other |
12,104 | 10,314 | ||||||
| 74,214 | 65,672 | |||||||
| Total |
$ | 33,421 | $ | 47,123 | ||||
At December 31, 2009, certain subsidiaries had tax loss carryforwards of approximately $120,928 that will expire in various years from 2010 through 2029, except for $36,853 for which there is no expiration date.
In assessing the realizability of deferred tax assets, the Company assesses whether it is more likely than not that a portion or all of the deferred tax assets will not be realized. The Company considers the scheduled reversal of deferred tax liabilities, tax planning strategies, and projected future taxable income in making this assessment. At December 31, 2009, a valuation allowance of $34,095 was recorded against certain deferred tax assets based on this assessment. The Company believes it is more likely than not that the tax benefit of the remaining net deferred tax assets will be realized. The amount of net deferred tax assets considered realizable could be increased or decreased in the future if the Company’s assessment of future taxable income or tax planning strategies changes.
The Company does not provide deferred income taxes on unremitted earnings of certain non-U.S. subsidiaries which are deemed permanently reinvested. It is not practicable to calculate the deferred taxes associated with the remittance of these earnings. Deferred income taxes of $283 have been provided on earnings of $1,831 that are not expected to be permanently reinvested.
NOTE 10 – DERIVATIVES AND FAIR VALUE
The Company uses derivatives to manage exposures to currency exchange rates, interest rates and commodity prices arising in the normal course of business. Derivative contracts to hedge currency and commodity exposures are generally written on a short-term basis but may cover exposures for up to two years while interest rate contracts may cover longer periods consistent with the terms of the underlying debt. The Company does not enter into derivatives for trading or speculative purposes.
F-35
LINCOLN ELECTRIC HOLDINGS, INC.
NOTES TO CONSOLIDATED FINANCIAL STATEMENTS — (Continued)
NOTE 10 – DERIVATIVES AND FAIR VALUE (continued)
All derivatives are recorded at fair value on the balance sheet. The accounting for gains and losses resulting from changes in fair value depends on the use of the derivative and whether it is designated and qualifies for hedge accounting. The Company formally documents the relationship of the hedge with the hedged item as well as the risk-management strategy for all designated hedges. Both at inception and on an ongoing basis, the hedging instrument is assessed as to its effectiveness, when applicable. If and when a derivative is determined not to be highly effective as a hedge, or the underlying hedged transaction is no longer likely to occur, or the derivative is terminated, hedge accounting is discontinued. The cash flows from settled derivative contracts are recorded in operating activities in the Consolidated Statements of Cash Flows. Hedge ineffectiveness was immaterial for the three years ended December 31, 2009.
The Company is subject to the credit risk of the counterparties to derivative instruments. Counterparties include a number of major banks and financial institutions. The Company manages individual counterparty exposure by monitoring the credit rating of the counterparty and the size of financial commitments and exposures between the Company and the counterparty. None of the concentrations of risk with any individual counterparty was considered significant at December 31, 2009. The Company does not expect any counterparties to fail to meet their obligations.
Cash flow hedges
Certain foreign currency forward contracts were qualified and designated as cash flow hedges. The dollar equivalent gross notional amount of these short-term contracts was $3,570 at December 31, 2009 and $35,807 at December 31, 2008. The effective portions of the fair value gains or losses on these cash flow hedges were recorded in “Accumulated other comprehensive income” (“AOCI”) and subsequently reclassified to “Cost of goods sold” or “Sales” for hedges of purchases and sales, respectively, as the underlying hedged transactions affected earnings. The Company reclassified a net loss of $61 from AOCI to earnings based on the probability of the forecasted transactions no longer occurring for the year ended December 31, 2009.
Fair value hedges
In February 2009, the Company terminated interest rate swaps that were qualified and designated as fair value hedges that converted notional amounts of $80,000 of debt from fixed to floating interest rates. The gain of $5,079 realized on termination was deferred and is being amortized as an offset to “Interest expense” over the remaining life of the Note. The fair value gains or losses on these contracts prior to settlement were recognized in earnings and offset by fair value losses or gains on the fixed-rate borrowings.
In March 2009, interest rate swaps designated as fair value hedges that converted notional amounts of $30,000 of debt from fixed to floating interest rates matured with the underlying Note. The fair value gains or losses on these contracts were recognized in earnings and offset by fair value losses or gains on the fixed-rate borrowings.
At December 31, 2008, the Company had interest rate swap agreements outstanding that effectively converted notional amounts of $110,000 of debt from fixed to floating interest rates. The fair value of the swaps was an unrealized gain of $6,148 at December 31, 2008.
Derivatives not designated as hedging instruments
The Company has certain foreign exchange forward contracts which were not designated as hedges. These derivatives were held as economic hedges of certain balance sheet exposures. The dollar equivalent gross notional amount of these contracts was $102,410 at December 31, 2009 and $65,040 at December 31, 2008. The fair value gains or losses from these contracts were recognized currently in “Selling, general and administrative expenses,” offsetting the losses or gains on the exposures being hedged.
F-36
LINCOLN ELECTRIC HOLDINGS, INC.
NOTES TO CONSOLIDATED FINANCIAL STATEMENTS — (Continued)
NOTE 10 – DERIVATIVES AND FAIR VALUE (continued)
The Company dedesignated commodity forward contracts at the inception of 2009 that had previously been designated and qualified as cash flow hedges. At December 31, 2009, the notional amounts, in thousands of pounds, of these contracts consisted of aluminium forward contracts of 450, copper forward contracts of 450 and nickel forward contracts of 54. The effective portion of the fair value gains or losses on these instruments were recorded in AOCI while the instruments were designated and qualified as cash flow hedges. Realized gains and losses were reclassified to earnings as the underlying hedged transactions affected earnings. For the year ended December 31, 2009, the Company reclassified a loss of $1,262 from AOCI to earnings based on the probability of the forecasted transactions no longer occurring. Subsequent to dedesignation, the fair value gains or losses on these instruments were recognized currently in earnings.
At December 31, 2008, the notional amounts, in thousands of pounds, of the Company’s derivative contracts consisted of aluminium forward contracts of 3,125, copper forward contracts of 2,925 and nickel forward contracts of 276. These derivative financial instruments qualified and were designated as cash flow hedges.
The Company has short-term silver forward contracts with a notional amount of 250,000 troy ounces at December 31, 2009. Realized and unrealized gains and losses on these contracts were recorded to earnings.
Fair values of derivative instruments in the Consolidated Balance Sheet follow:
| December 31, 2009 | ||||||
| Derivatives by hedge designation |
Other Current Assets |
Other Current Liabilities | ||||
| Designated as hedging instruments: |
||||||
| Foreign exchange contracts |
$ | 63 | $ | 12 | ||
| Not designated as hedging instruments: |
||||||
| Foreign exchange contracts |
133 | 1,017 | ||||
| Commodity contracts |
611 | 186 | ||||
| Total derivatives |
$ | 807 | $ | 1,215 | ||
At December 31, 2008, the fair value of the non-designated foreign exchange contracts, the designated cash flow hedges and the commodity forward contracts was an unrealized loss of $4,732, an unrealized gain of $3,076 and an unrealized loss of $7,708, respectively.
The effects of designated fair value hedges and undesignated derivative instruments on the Consolidated Statement of Income for the year ended December 31, 2009 consisted of the following:
| Derivatives by hedge designation |
Classification of gains (losses) |
Year Ended December 31, 2009 |
||||
| Fair value hedges: |
||||||
| Interest rate swaps |
Interest expense | $ | 181 | |||
| Not designated as hedges: |
||||||
| Foreign exchange contracts |
Selling, general & administrative expenses | (6,053 | ) | |||
| Commodity contracts |
Cost of goods sold | 3,613 | ||||
F-37
LINCOLN ELECTRIC HOLDINGS, INC.
NOTES TO CONSOLIDATED FINANCIAL STATEMENTS — (Continued)
NOTE 10 – DERIVATIVES AND FAIR VALUE (continued)
The effects of designated cash flow hedges on AOCI and the Consolidated Statement of Income for the year ended December 31, 2009 consisted of the following:
| Total recognized in AOCI, |
December 31, 2009 | Gain (loss) reclassified |
Year Ended December 31, 2009 |
|||||||
| Foreign exchange contracts |
$ | (5 | ) | Sales | $ | (149 | ) | |||
| Cost of goods sold | 1,851 | |||||||||
| Commodity contracts |
(639 | ) | Cost of goods sold | (6,150 | ) | |||||
The Company expects $644 related to existing contracts to be reclassified from AOCI, net of tax, to earnings over the next 12 months as the hedged transactions are realized.
Financial assets and liabilities, such as the Company’s derivative contracts, are valued at fair value using the market and income valuation approaches. The Company uses the market approach to value similar assets and liabilities in active markets and the income approach that consists of discounted cash flow models that take into account the present value of future cash flows under the terms of the contracts using current market information as of the reporting date.
The following hierarchy is used to classify the inputs used to measure fair value:
| Level 1 | Unadjusted quoted prices in active markets for identical assets or liabilities. | |
| Level 2 | Unadjusted quoted prices in active markets for similar assets or liabilities, or unadjusted quoted prices for identical or similar assets or liabilities in markets that are not active, or inputs other than quoted prices that are observable for the asset or liability. | |
| Level 3 | Unobservable inputs for the asset or liability. |
The following table provides a summary of fair value measurements:
| Fair Value Measurements at December 31, 2009 Using | ||||||||||||
| Description |
Balance as of December 31, 2009 |
Quoted Prices in Active Markets for Identical Assets (Level 1) |
Significant Other Observable Inputs (Level 2) |
Significant Unobservable Inputs (Level 3) | ||||||||
| Derivatives, net liability |
$ | 408 | $ | — | $ | 408 | $ | — | ||||
The Company has various financial instruments, including cash and cash equivalents, short-and long-term debt and forward contracts. While these financial instruments are subject to concentrations of credit risk, the Company has minimized this risk by entering into arrangements with a number of major banks and financial institutions and investing in several high-quality instruments. The Company does not expect any counterparties to fail to meet their obligations. The fair value of cash and cash equivalents approximated book value at December 31, 2009 and 2008. See Note 6 for the fair value estimate of debt.
NOTE 11 – OPERATING LEASES
The Company leases sales offices, warehouses and distribution centers, transportation equipment, office equipment and data processing equipment. Such leases, some of which are noncancelable and, in many cases, include renewals, expire at various dates. The Company pays most insurance, maintenance and taxes relating to leased assets. Rental expense was $14,275 in 2009, $14,679 in 2008 and $13,883 in 2007.
At December 31, 2009, total future minimum lease payments for noncancelable operating leases were $9,923 in 2010, $7,231 in 2011, $5,328 in 2012, $2,763 in 2013, $2,232 in 2014 and $7,232 thereafter.
F-38
LINCOLN ELECTRIC HOLDINGS, INC.
NOTES TO CONSOLIDATED FINANCIAL STATEMENTS — (Continued)
NOTE 12 – CONTINGENCIES
The Company, like other manufacturers, is subject from time to time to a variety of civil and administrative proceedings arising in the ordinary course of business. Such claims and litigation include, without limitation, product liability claims and health, safety and environmental claims, some of which relate to cases alleging asbestos and manganese induced illnesses. The claimants in the asbestos and manganese cases seek compensatory and punitive damages, in most cases for unspecified amounts. The Company believes it has meritorious defenses to these claims and intends to contest such suits vigorously.
The Company’s reserve for contingent liabilities, primarily for product liability claims, was $15,333 as of December 31, 2009 and $12,308 as of December 31, 2008. The reserve is included in “Other current liabilities.” The Company also has an asset for recoveries from insurance carriers on the outstanding insured claims of $11,235 as of December 31, 2009 and $11,041 as of December 31, 2008. The asset is included in “Other current assets.”
Based on the Company’s historical experience in litigating product liability claims, including a significant number of dismissals, summary judgments and defense verdicts in many cases and immaterial settlement amounts, as well as the Company’s current assessment of the underlying merits of the claims and applicable insurance, the Company believes resolution of these claims and proceedings, individually or in the aggregate (exclusive of defense costs), will not have a material adverse impact upon the Company’s consolidated financial statements.
The Company has provided a guarantee on loans for an unconsolidated joint venture of approximately $1,381 at December 31, 2009. The loans, maturing in July 2010, were undertaken to fund the joint venture’s working capital and capital expansion needs. The Company would become liable for any unpaid principal and accrued interest if the joint venture were to default on payment at the respective maturity dates. The Company believes the likelihood is remote that any payment will be required under these arrangements based on the current financial condition of the joint venture.
NOTE 13 – QUARTERLY FINANCIAL DATA (UNAUDITED)
| First | Second | Third | Fourth | ||||||||||
| 2009 |
|||||||||||||
| Net sales |
$ | 411,751 | $ | 413,283 | $ | 441,802 | $ | 462,449 | |||||
| Gross profit |
90,248 | 106,391 | 125,131 | 134,498 | |||||||||
| (Loss) income before income taxes |
(2,010 | ) | 23,865 | 24,231 | 40,395 | ||||||||
| Net (loss) income |
(3,594 | ) | 15,068 | 12,757 | 24,345 | ||||||||
| Basic (loss) earnings per share |
$ | (0.08 | ) | $ | 0.36 | $ | 0.30 | $ | 0.57 | ||||
| Diluted (loss) earnings per share |
$ | (0.08 | ) | $ | 0.35 | $ | 0.30 | $ | 0.57 | ||||
| 2008 |
|||||||||||||
| Net sales |
$ | 620,227 | $ | 699,826 | $ | 632,892 | $ | 526,186 | |||||
| Gross profit |
177,451 | 204,714 | 196,878 | 141,108 | |||||||||
| Income before income taxes |
78,991 | 95,100 | 92,882 | 32,836 | |||||||||
| Net income |
53,477 | 70,128 | 69,211 | 19,470 | |||||||||
| Basic earnings per share |
$ | 1.25 | $ | 1.64 | $ | 1.62 | $ | 0.46 | |||||
| Diluted earnings per share |
$ | 1.24 | $ | 1.62 | $ | 1.60 | $ | 0.46 | |||||
F-39
LINCOLN ELECTRIC HOLDINGS, INC.
NOTES TO CONSOLIDATED FINANCIAL STATEMENTS — (Continued)
NOTE 13 – QUARTERLY FINANCIAL DATA (UNAUDITED) (continued)
The quarter ended December 31, 2009 includes a charge of $3,298 ($2,786 after-tax) related to rationalization activities to align the business to current market conditions and impairment charges of $879 ($596 after-tax) to certain indefinite-lived intangible assets.
The quarter ended September 30, 2009 includes a charge of $7,144 ($6,340 after-tax) related to rationalization activities to align the business to current market conditions including the closure of a manufacturing facility in Europe and the consolidation of certain manufacturing operations in the Europe Welding and Asia Pacific Welding segments and a loss of $7,943 ($7,943 after-tax) on the acquisition of Jin Tai.
The quarter ended June 30, 2009 includes a charge of $6,877 ($6,639 after-tax) related to the Company’s rationalization activities to align the business to current market conditions including the closure of a manufacturing facility in The Harris Products Group segment, a pension settlement gain of $1,543 ($1,543 after-tax) and a gain on the sale of a property by the Company’s joint venture in Turkey of $5,667 ($5,667 after-tax).
The quarter ended March 31, 2009 includes a charge of $11,699 ($7,428 after-tax) related to the Company’s rationalization activities to align the business to current market conditions including a voluntary separation incentive program covering certain U.S.-based employees.
The quarter ended December 31, 2008 includes a charge of $2,447 ($1,698 after-tax) related to the Company’s rationalization activities to align the business to current market conditions and $16,924 ($16,615 after-tax) in asset impairment charges including $13,194 of goodwill impairment with no tax benefit, $2,388 in impairment of long-lived assets with no tax benefit and $1,342 ($1,033 after-tax) in impairment of intangible assets.
The quarterly earnings per share (EPS) amounts are each calculated independently. Therefore, the sum of the quarterly EPS amounts may not equal the annual totals.
F-40
SCHEDULE II – VALUATION AND QUALIFYING ACCOUNTS
LINCOLN ELECTRIC HOLDINGS, INC. AND SUBSIDIARIES
(In thousands)
| Additions | ||||||||||||||||
| Description |
Balance at Beginning of Period |
Charged to Costs and Expenses |
(1) Charged to Other Accounts |
(2) Deductions |
Balance at End of Period | |||||||||||
| Allowance for doubtful accounts: |
||||||||||||||||
| Year ended December 31, 2009 |
$ | 7,673 | $ | 2,685 | $ | 368 | $ | 2,552 | $ | 8,174 | ||||||
| Year ended December 31, 2008 |
7,424 | 3,986 | (735 | ) | 3,002 | 7,673 | ||||||||||
| Year ended December 31, 2007 |
8,484 | 3,115 | 630 | 4,805 | 7,424 | |||||||||||
| (1) | Currency translation adjustment. |
| (2) | Uncollectible accounts written-off, net of recoveries. |
F-41