UNITED STATES
SECURITIES AND EXCHANGE COMMISSION
WASHINGTON, D.C. 20549
FORM 8-K
CURRENT REPORT
Pursuant to Section 13 or 15(d) of the Securities Exchange Act of 1934
February 22, 2010
(Date of earliest event reported)
LABORATORY CORPORATION
OF
AMERICA HOLDINGS
| DELAWARE | 1-11353 | 13-3757370 | ||
| (State or other jurisdiction of Incorporation) |
(Commission File Number) |
(I.R.S. Employer Identification No.) |
| 358 SOUTH MAIN STREET, BURLINGTON, NORTH CAROLINA |
27215 | 336-229-1127 | ||
| (Address of principal executive offices) | (Zip Code) |
(Registrant's telephone number including area code) |
Check the appropriate box below if the Form 8-K filing is intended to simultaneously satisfy the filing obligation of the registrant under any of the following provisions:
¨ Written communications pursuant to Rule 425 under the Securities Act (17 CFR 230.425)
¨ Soliciting material pursuant to Rule 14a-12 under the Exchange Act (17 CFR 240.14a-12)
¨ Pre-commencement communications pursuant to Rule 14d-2(b) under the Exchange Act (17 CFR 240.14d-2(b))
¨ Pre-commencement communications pursuant to Rule 13e-4(c) under the Exchange Act (17 CFR 240.13e-4(c))
ITEM 7.01. Regulation FD Disclosure
Summary information of the Company in connection with non-deal related meetings at Barclays Capital in New York, NY on February 23, 2010.
SIGNATURES
Pursuant to the requirements of the Securities Exchange Act of 1934, the registrant has duly caused this report to be signed on its behalf by the undersigned hereunto duly authorized.
| Laboratory Corporation of America Holdings (Registrant) |
||||
| Date: February 22, 2010 | By: | /s/F. Samuel Eberts III | ||
| F. Samuel Eberts III, Chief Legal Officer and Secretary |
||||

New York, NY
February 23, 2010
Barclays Capital
NDR

2
This slide presentation contains forward-looking
statements which are subject to change based
on various important factors, including without
limitation, competitive actions in the marketplace
and adverse actions of governmental and other
third-party payors.
Actual results could differ materially from those
suggested by these forward-looking statements.
Further information on potential factors that
could affect the Company’s
financial results is
included in the Company’s Form 10-K for the
year ended December 31, 2008, and subsequent
SEC filings.
Forward Looking Statement

Introduction
3
Leading National
Lab Provider
Fastest growing national lab
$55 billion market
Clinical, Anatomic and Genomic Testing
Serving clients in all 50 states and Canada
Foremost clinical trials testing business
Introduction
4

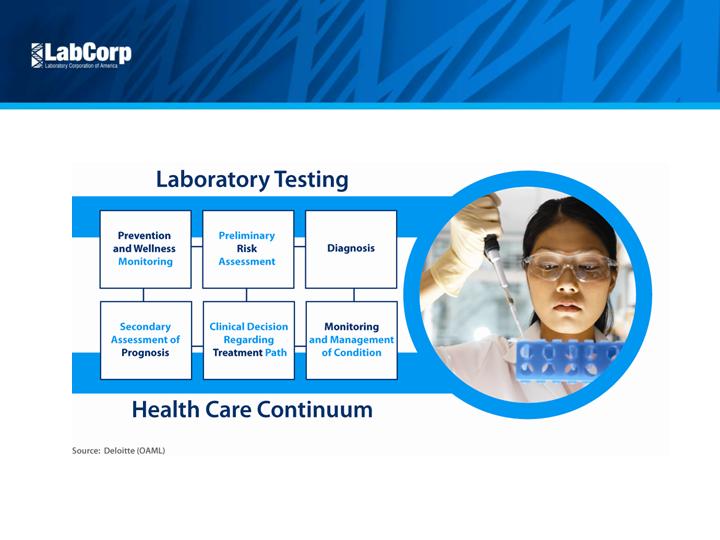
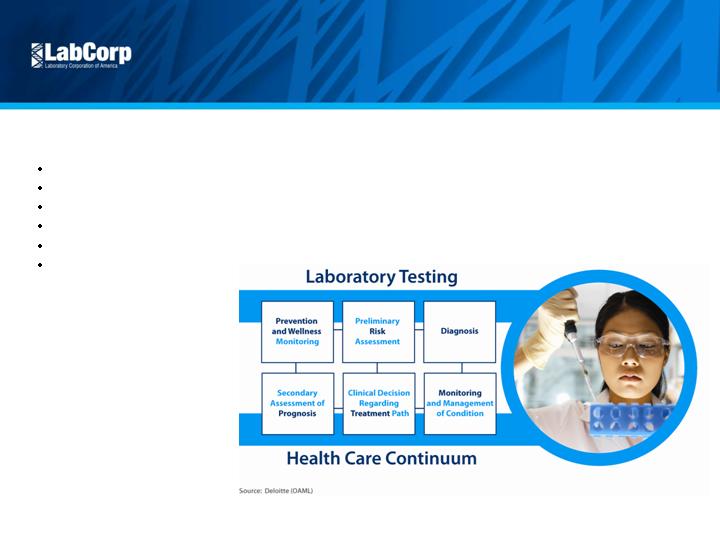
Valuable Service
Small component of total cost
influences large percentage
of clinical decisions
Screening, early detection,
and monitoring reduce
downstream costs
Companion diagnostics
improve drug efficacy and
reduce adverse drug effects
Attractive Market
5
Attractive Market
6
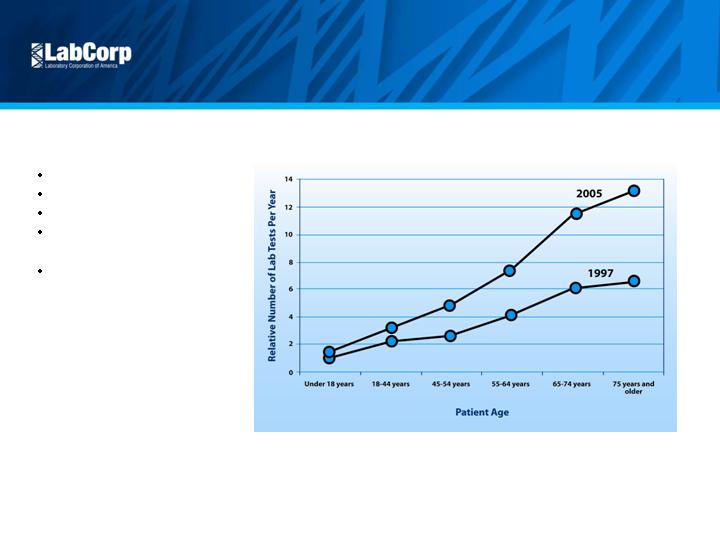
Growth Drivers
Aging population
Industry consolidation
Advances in genomics
Pharmacogenomics /
companion diagnostics
Cost pressures
Source: CDC National Ambulatory Medical Care Survey and Company Estimates

Attractive Market
7
Opportunity to
Take Share
Approximately 5,000
independent labs
High cost competitors
Source: Washington G-2 Reports and company estimates
$55 Billion US Lab Market
55%
14%
9%
4%
19%
Hospital Affiliated
Quest
LabCorp
Physician Office
Other Independent
Attractive Market
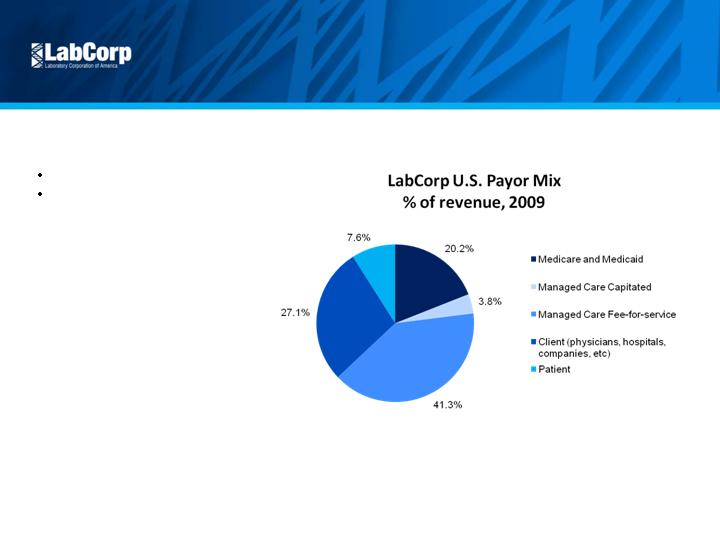
Diversified Payor Mix
No customer > 9% of revenue
Limited government exposure
8
Attractive Market
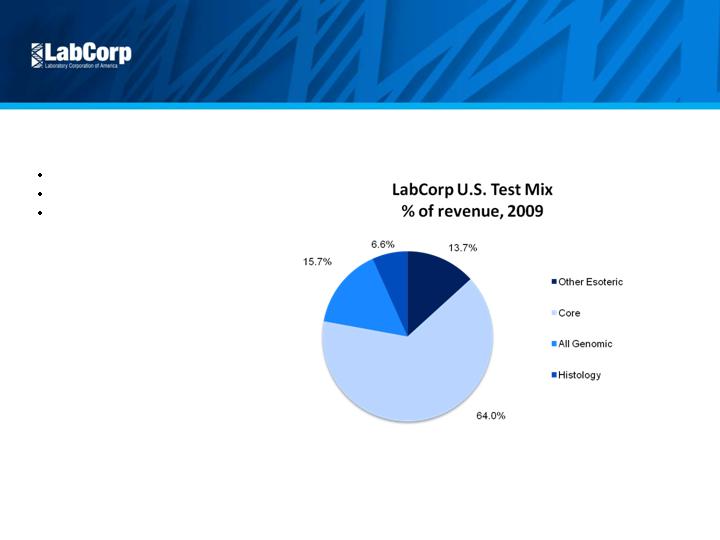
Diversified Test Mix
Esoteric 36% of revenue
Goal of 40% in 3 – 5 years
Higher priced business
9
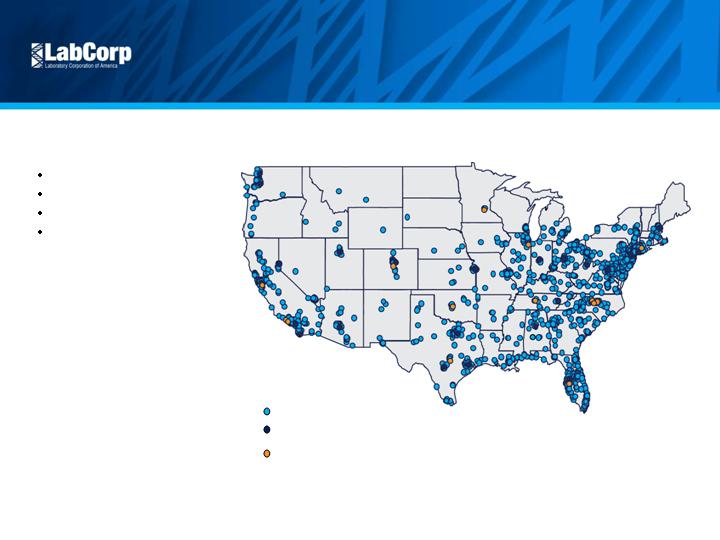
Competitive Position
Scale and Scope
National infrastructure
Broad test offering
Managed care contracts
Economies of scale
10
Primary LabCorp Testing Locations*
Esoteric Lab Locations
(CET, CMBP, Dianon, Esoterix, Monogram Biosciences, NGI, OTS, US Labs, Viromed)
Patient Service Centers*

Competitive Position
11
Managed Care Relationships
Exclusive national laboratory for UnitedHealthcare
Sole national strategic partner for WellPoint
Significant national plans recently renewed or
extended on a multi-year basis, including
WellPoint, Cigna and Humana
Contracted with numerous local and
regional anchor plans
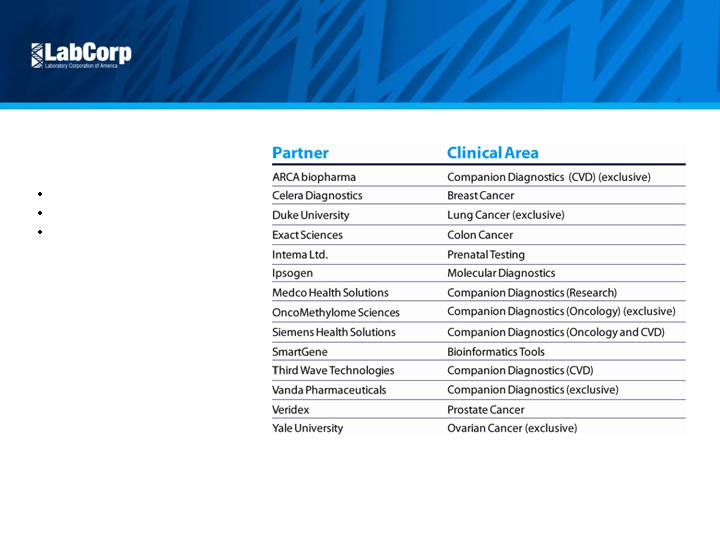
Scientific
Leadership
Introduction of new tests
Acquisitions and licensing
Collaborations with leading
companies and academic
institutions
Competitive Position
12

Competitive Position
13
Standardized and
Efficient Processes
Standardized lab and billing
IT systems
Automation of pre-analytics
Capacity rationalization
Logistics optimization

2010 Priorities
14
Our Focus
Profitable revenue growth
IT and client connectivity
Continue scientific
leadership
Maintain price
Control costs

2010 Priorities
15
Profitable Revenue Growth
Target specialty physicians with
breadth of menu and services
Educate payers and physicians on
value of LabCorp testing
Leverage assets from Monogram
acquisition
Continue to improve patient experience
2010 Priorities
16
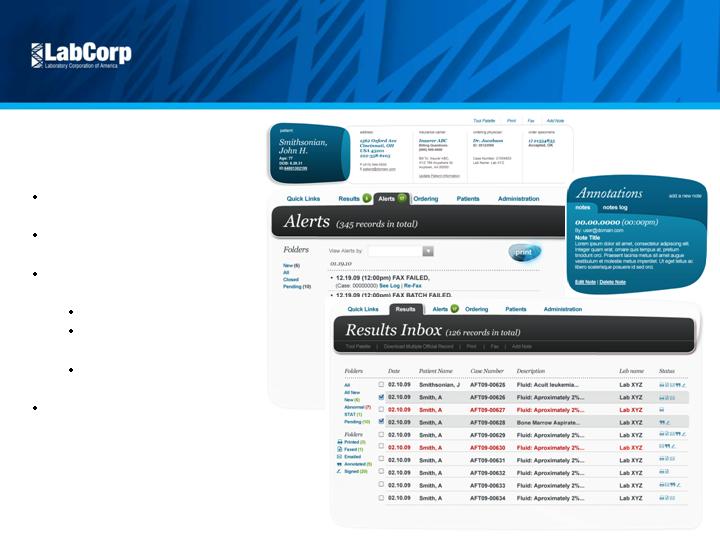
IT and Client
Connectivity
Enhance online services and
analytic tools
LabCorp Inside the Box for
superior connectivity
Improve Patient Experience
through:
Automated PSC workflow
Patient access via PHRs,
online appointments
Enterprise services
including VoIP
Continue “open platform” strategy
to maximize options for users

Continue Scientific
Leadership
Increase esoteric testing
Grow and enhance offerings in
personalized medicine:
Expand outcome improvement
programs
Develop and commercialize
companion diagnostics
2010 Priorities
17
Increase
Esoteric Testing
Introduction of new tests
Acquisitions and licensing
Collaborations with academic
institutions
Continue Scientific Leadership
18
New Tests Include:
Collaborations Include:
BRAF Gene Mutation Detection
EGRF Mutation Analysis for Nonsmall-Cell Lung Cancer
Warfarin (P450 2C9 and VKORC1)
Clopidogrel CYP2C19 Genotyping
Duke University
National Jewish Health
Integrase – HIV Genotyping (GenoSure) and HIV Phenotyping (PhenoSense)
HERmark for Breast Cancer
????
Yale University
Enhanced Trofile
H1N1 – Flu Testing
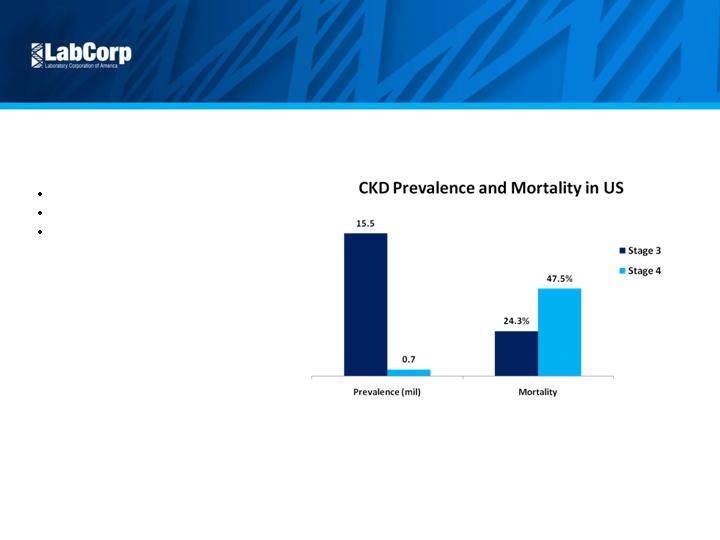
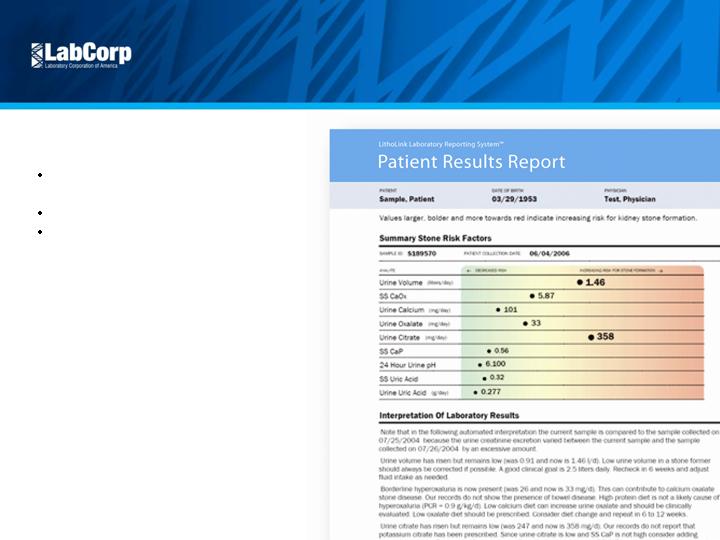
Expand Outcomes
Improvement
Litholink kidney stone
CKD
Continual development of
valuable programs
Continue Scientific Leadership
19

Continue Scientific Leadership
20
Develop and
Commercialize
Companion Diagnostics
Invest in clinical trials
Relationships with biotech and
pharma companies
Promote key tests
K-RAS
HLA-B* 5701
BRAF Gene Mutation Detection
EGRF Mutation Analysis
CYP 450 2C19
Monogram Biosciences
Trofile
PhenoSense, PhenoSense GT
HERmark
“K-RAS testing should be routinely conducted in
all colorectal cancer patients immediately after
diagnosis to ensure the best treatment strategies
for the individual
Patient”
– Dr. Eric Van Cutsem, presenter at the June 2008 American
Society of Clinical Oncology meeting
FDA recommends genetic screening prior to
treatment with Abacavir
ROCKVILLE, Md -- July 24, 2008 -- The US Food and Drug Administration (FDA) has issued
an alert regarding serious, and sometimes fatal, hypersensitivity reactions (HSRs) caused by
abacavir (Ziagen) therapy in patients with a particular human leukocyte antigen (HLA) allele,
HLA-B* 5701.
Genetic tests for HLA-B*5701 are already available, and all patients should be screened for the
HLA-B*5701 allele before starting or restarting treatment with abacavir or abacavir-containing
medications.
“FDA has approved the expanded use of Selzentry…
to include adult patients with CCR5-tropic HIV-1
virus who are starting treatment for the first time.”
- ViiV Healthcare Press Release, November 20th, 2009
2010 Priorities
Maintain Price
Managed care stability; offsets
1.9% Medicare rate decrease
Focus on high-value tests
Promote outcome improvement
21

Control Costs
Continue focus on collections
and bad debt reduction
Optimize supply chain
Use efficiency gains to
improve patient experience
2010 Priorities
22

$3,085
$3,328
$3,591
$4,068
$4,513
$4,695
$2.45
$2.80
$3.30
$4.18
$4.60
$4.89
2004
2005
2006
2007
2008
2009
Revenue ($mil)
EPS
Excellent Performance
23
Revenue and
EPS Growth
9% Revenue CAGR
15% EPS CAGR
(1) Excluding the $0.09 per diluted share impact in 2005 of restructuring and other special
charges, and a non-recurring investment loss; excluding the $0.06 per diluted share
impact in 2006 of restructuring and other special charges; excluding the $0.25 per
diluted share impact in 2007 of restructuring and other special charges; excluding the
(2) EPS, as presented, represents adjusted, non-GAAP financial measures. Diluted EPS,
as reported in the Company’s Annual Report were: $2.45 in 2004; $2.71 in 2005;
$3.24 in 2006; $3.93 in 2007; $4.16 in 2008; and $4.98 in 2009.
$0.44 per diluted share impact in 2008 of restructuring and other special charges; excluding
the ($0.09) per diluted share impact in 2009 of restructuring and other special charges.
Revenue and EPS Growth: 2004 – 2009 (1) (2)

Excellent Performance
24
Leading Returns
Leading returns
Leading EBIT margin
18.2%
20.5%
21.8%
27.6%
27.5%
25.8%
0.0%
5.0%
10.0%
15.0%
20.0%
25.0%
30.0%
2004
2005
2006
2007
2008
2009
LabCorp ROE 2004-2009

Excellent Performance
25
Cash Flow
11% FCF CAGR
$2.0 B+ share repurchase
over last three years
Note: $ in Millions
$538
$574
$632
$710
$781
$862
$443
$481
$516
$567
$624
$748
$
-
$200
$400
$600
$800
$1,000
2004
2005
2006
2007
2008
2009
Operating Cash Flow
Free Cash Flow

Fourth Quarter and Full Year 2009 Results
26
2009
2008
+/(-)
2009
2008
+/(-)
Adjusted Revenue
1,165.1
$
1,126.6
$
3.4%
4,694.7
$
4,512.7
$
4.0%
Adjusted Operating Income
221.9
$
219.8
$
1.0%
954.9
$
937.0
$
1.9%
Adjusted Operating Income Margin
19.0%
19.5%
(50)
bp
20.3%
20.8%
(50)
bp
Adjusted EPS
1.16
$
1.10
$
5.5%
4.89
$
4.60
$
6.3%
Operating Cash Flow
224.7
$
215.3
$
4.4%
862.4
$
780.9
$
10.4%
Less: Capital Expenditures
(37.6)
$
(36.3)
$
3.6%
(114.7)
$
(156.7)
$
-26.8%
Free Cash Flow
187.1
$
179.0
$
4.5%
747.7
$
624.2
$
19.8%
Twelve Months Ended Dec 31,
Three Months Ended Dec 31,

Supplemental Financial Information
27
Q1 09
Q2 09
Q3 09
Q4 09
2009
Bad debt as a percentage of sales
5.3%
5.3%
5.3%
5.3%
5.3%
Days sales outstanding
52
50
48
44
44
A/R coverage (Allowance for Doubtful Accts. / A/R)
19.5%
20.6%
21.9%
23.2%
23.2%
Laboratory Corporation of America
Other Financial Information
Full Year 2009
($ in million's)
Key Points
Critical position in health care delivery system
Attractive market
Strong competitive position - well positioned to gain share
Leadership in personalized medicine
Excellent cash flow
Strong balance sheet
Conclusion
28

29
©2010 LabCorp. All rights reserved. 8026-0210