Attached files
Table of Contents
UNITED STATES
SECURITIES AND EXCHANGE COMMISSION
WASHINGTON, D.C. 20549
FORM 10-K
ANNUAL REPORT PURSUANT TO SECTION 13 OR 15(d) OF
THE SECURITIES EXCHANGE ACT OF 1934
For the fiscal year ended December 31, 2009
Commission File Number 001-10109

BECKMAN COULTER, INC.
(Exact name of registrant as specified in its charter)
| Delaware | 95-104-0600 | |
| (State or other jurisdiction of incorporation or organization) |
(I.R.S. Employer Identification No.) | |
| 250 S. Kraemer Boulevard, Brea, California |
92821 | |
| (Address of principal executive offices) | (Zip Code) | |
(714) 993-5321
(Registrant’s telephone number, including area code)
Securities registered pursuant to Section 12(b) of the Act:
| Title of each class |
Name of each exchange on which registered | |
| Common Stock, $0.10 par value | New York Stock Exchange |
Securities registered pursuant to Section 12(g) of the Act:
None
Indicate by check mark if the registrant is a well-known seasoned issuer, as defined in Rule 405 of the Securities Act. x Yes ¨ No
Indicate by check mark if the registrant is not required to file reports pursuant to Section 13 or Section 15(d) of the Act. ¨ Yes x No
Indicate by check mark whether the registrant (1) has filed all reports required to be filed by Section 13 or 15(d) of the Securities Exchange Act of 1934 during the preceding 12 months (or for such shorter period that the registrant was required to file such reports), and (2) has been subject to such filing requirements for the past 90 days. x Yes ¨ No
Indicate by check mark whether the registrant has submitted electronically and posted on its corporate Web site, if any, every Interactive Data File required to be submitted and posted pursuant to Rule 405 of Regulation S-T during the preceding 12 months (or for such shorter period that the registrant was required to submit and post such files). ¨ Yes ¨ No
Indicate by check mark if disclosure of delinquent filers pursuant to Item 405 of Regulation S-K (§ 229.405 of this chapter) is not contained herein, and will not be contained, to the best of registrant’s knowledge, in definitive proxy or information statements incorporated by reference in Part III of this Form 10-K or any amendment to this Form 10-K. ¨
Indicate by check mark whether the registrant is a large accelerated filer, an accelerated filer, a non-accelerated filer, or a smaller reporting company. See the definitions of “large accelerated filer”, “accelerated filer” and “smaller reporting company” in Rule 12b-2 of the Exchange Act.
| Large accelerated filer | x | Accelerated filer | ¨ | |||
| Non-accelerated filer | ¨ (Do not check if a smaller reporting company) | Smaller reporting company | ¨ | |||
Indicate by check mark whether the registrant is a shell company (as defined in Rule 12b-2 of the Act). ¨ Yes x No
Aggregate market value of voting stock held by non-affiliates of the registrant as of June 30, 2009: $3,642,689,456
69,867,500 shares of the registrant’s Common Stock, $0.10 par value were outstanding as of February 5, 2010
DOCUMENTS INCORPORATED BY REFERENCE
Certain information contained in the Proxy Statement for the Annual Meeting of Stockholders of the registrant to be held on April 22, 2010 is incorporated by reference into Part III hereof.
Table of Contents
| Page number | ||||
| Part I | ||||
| Item 1. |
3 | |||
| Item 1A. |
16 | |||
| Item 1B. |
20 | |||
| Item 2. |
20 | |||
| Item 3. |
21 | |||
| Item 4. |
21 | |||
| Part II | ||||
| Item 5. |
22 | |||
| Item 6. |
24 | |||
| Item 7. |
Management’s Discussion and Analysis of Financial Condition and Results of Operations |
25 | ||
| Item 7A. |
45 | |||
| Item 8. |
47 | |||
| Item 9. |
Changes in and Disagreements With Accountants on Accounting and Financial Disclosure |
96 | ||
| Item 9A. |
96 | |||
| Item 9B. |
96 | |||
| Part III | ||||
| Item 10. |
98 | |||
| Item 11. |
98 | |||
| Item 12. |
Security Ownership of Certain Beneficial Owners and Management and Related Stockholder Matters |
98 | ||
| Item 13. |
Certain Relationships and Related Transactions and Director Independence |
98 | ||
| Item 14. |
98 | |||
| Part IV | ||||
| Item 15. |
98 |
| 2 | BEC 2009 FORM 10-K |
Table of Contents
This Annual Report on Form 10-K (“Form 10-K”) contains forward-looking statements within the meaning of Section 21E of the Securities Exchange Act of 1934, as amended, and Section 27A of the Securities Act of 1933, as amended. Many of the forward-looking statements are located in the “Management’s Discussion and Analysis of Financial Condition and Results of Operations” section below. You can identify the forward-looking statements by words such as “may,” “will,” “might,” “expect,” “believe,” “anticipate,” “could,” “would,” “estimate,” “continue,” “pursue,” “plans,” “should,” “likely,” “might,” or the negative thereof or comparable terminology. The forward-looking statements may include information regarding our expectations, goals or intentions regarding the future. Forward-looking statements reflect our current views with respect to future events and involve certain risks and uncertainties. Our actual results may differ materially from those expressed or implied in our forward-looking statements. Factors that could cause results to differ include those discussed in the section below entitled “Risk Factors” under Part I, Item 1A of this Form 10-K. All forward-looking statements in this Form 10-K are made as of the date of this filing and we assume no obligation to update any forward-looking statement, except as required by law.
| Item 1. | Business. |
Company Profile
From complex DNA sequencing in pioneering research laboratories and high-volume laboratory testing in hospitals to simple single-use diagnostic screening kits used in physicians’ offices, Beckman Coulter is the world’s largest company devoted solely to biomedical testing. We estimate this market had about $40.8 billion in worldwide sales in 2009. Tracing our origins to 1935, we are a leading manufacturer and marketer of biomedical testing instrument systems, tests and supplies that simplify, automate and innovate complex laboratory processes. Our inspiration is to improve patient health and reduce the cost of care with products that fall into two basic categories:
| • | Clinical Diagnostics, which represent over 85% of our total revenues, produce information physicians use to diagnose disease, make treatment decisions and monitor patients in hospitals and other critical care settings around the world. We estimate that 65% of health care decisions are based on critical diagnostic information produced by laboratory-based testing. Our clinical diagnostic customers include hospitals, physician’s offices and reference laboratories. Central laboratories of mid- to large-size hospitals represent our most significant customer group. |
| • | Life Science research instruments and tools, which generate less than 15% of total revenues, are used by scientists to study complex biological problems including the causes of disease, identifying new therapies and testing new drugs. Our Life Science customers include pharmaceutical and biotechnology companies, universities, medical schools and research institutions. |
Our revenue is about evenly distributed inside and outside of the United States. In 2009, about 81% of our total revenue was generated from recurring revenue consisting of consumable supplies (including reagent test kits), service and operating-type lease payments.
Incorporated in Delaware in 1988, we have approximately 11,800 employees in 136 facilities on six continents, all dedicated to improving patient health and reducing the cost of care in more than 160 countries in which our products are sold.
| BEC 2009 FORM 10-K | 3 |
Table of Contents
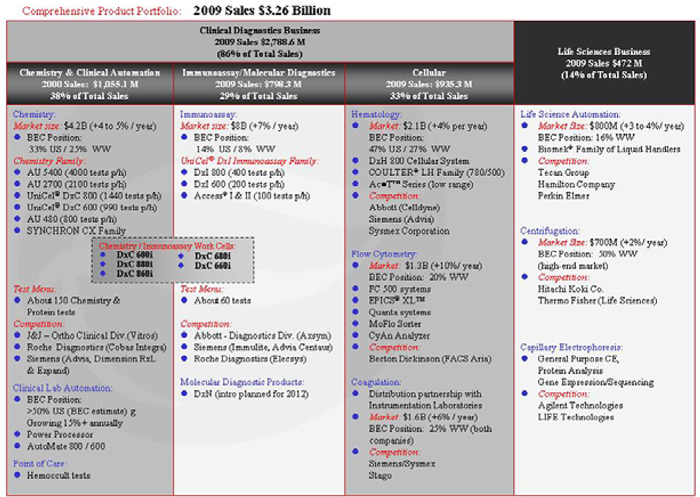
| • | This Comprehensive Product Portfolio chart is a representative listing of our products and our competitors’ products. Not all products are included in the chart. |
| • | Market estimates and share amounts are approximate and are based on external surveys and internal estimates. For additional information regarding our business segments and geographic information see Note 18 “Business Segment Information” of the Notes to Consolidated Financial Statements in Item 8 of this Form 10-K. |
Company History
Beckman and Coulter combine two of the best known brand names in laboratories. We adopted our current name in April 1998, changing from Beckman Instruments, Inc. to Beckman Coulter, Inc. (the “Company”), to reflect the October 1997 acquisition of Coulter Corporation.
Beckman Instruments, Inc., founded by Dr. Arnold O. Beckman in 1935, entered the laboratory market with the world’s first pH meter, an electronic instrument used to measure pH (acidity or alkalinity). The company became a publicly traded corporation in 1952. In 1968, Beckman Instruments, Inc. expanded its laboratory instrument focus to include healthcare applications in clinical diagnostics. We were acquired by SmithKline Corporation to form SmithKline Beckman Corporation in 1982, operating as a subsidiary of SmithKline Beckman until 1989, when we once again became a publicly owned company.
Coulter Corporation was founded by Wallace and Joseph Coulter in 1958 as a private company, remaining under the control of the Coulter family until acquired by Beckman Instruments, Inc. in 1997. Coulter invented the “Coulter Principle” in 1948 to automatically count and characterize particles and reduced it to practice for the medical field in an instrument used to determine the distribution of red and white cells in blood. This proved to be the foundation of automated hematology.
Company Strengths
We believe the Beckman and Coulter names have become two of the most valuable brand names in biomedical testing for a number of reasons:
| • | Our installed base of more than 200,000 systems operating in laboratories in more than 160 countries |
| • | Our breadth of product offering and “building block” designs provide laboratories with broad-based testing capability that is highly configurable and flexible |
| • | Our world class menu of more than 600 clinical diagnostics tests, capable of meeting nearly 100% of hospital-based routine laboratory testing needs |
| 4 | BEC 2009 FORM 10-K |
Table of Contents
| • | Our development capabilities across chemical, biological, hardware and software disciplines enable a prolific flow of new systems to meet customer requirements for simplifying, automating and innovating laboratory testing |
| • | Our first mover approach has enabled us to be the first to provide islands of automation, the first to develop an integrated centrifuge and the first with refrigerated post-analytical storage. With the leading market share in the United States, we are the recognized leader in total laboratory automation. |
Major trends support increased worldwide demand for our products including an aging population, the explosion in biological understanding, growth of outreach testing and the ever-present focus on increased efficiency and lower costs.
Strategic Initiatives
Our core strategy is to simplify, automate and innovate biomedical testing processes. Our strategic initiatives for 2010 continue our focus on growth, quality and operating excellence:
| • | We are integrating our recent acquisition of the diagnostics systems portion of Olympus Corporation’s business or Olympus. In 2009 we completed the Olympus acquisition to extend our Clinical Diagnostics chemistry and automation product offering and enhance our geographic reach and scale. We expect to substantially complete the Olympus integration by mid-2010 and to realize additional synergies as the integration progresses. |
| • | We are working to expand our test menu, particularly in our immunoassay and molecular diagnostics products and believe our focus on certain disease states will enable us to deliver enhanced testing capability to our customers, which will ultimately improve patient health and reduce the cost of care. |
| • | We are building on our industry-leading ability to help customers simplify, automate and innovate their processes. Our unparalleled knowledge of customers’ laboratory processes supports our expansion of automation and work cells, growing our installed base of instruments. |
| • | From a geographic perspective, we are increasing resources in developing markets, including China, which we believe will improve our opportunities for long-term growth. |
| • | We intend to continue to reduce product, service and operating costs by streamlining our supply chain operations and expanding our use of “Lean Six Sigma” tools to other business processes throughout the company. |
| • | We have announced that we plan to design and build an automated, fully integrated molecular diagnostic sample to result system to enable moderately complex testing in clinical diagnostic laboratories. Product development costs for the project are anticipated to be about $30 million per year at least through 2012, excluding any test menu licensing fees. |
As part of our strategic initiatives, we expect to incur charges as we integrate Olympus, realign our manufacturing and distribution footprint and implement initiatives to improve productivity and reduce operating costs in the future.
Customers and Markets
We provide the critical laboratory tools that enable our customers to:
| • | Conduct basic research into the fundamental processes of human biology |
| • | Develop vaccines and drugs to treat disease |
| • | Conduct clinical trials and related research activities |
| • | Perform tests ranging from simple patient blood analysis to complex diagnostics |
Our customers are the hospitals, laboratories, research centers and physician’s offices that are continuously searching for processes and systems to help them perform these types of tests faster, more efficiently and at a lower cost. To meet these needs, we seek to leverage our investment in research and development (“R&D”) and to use our core competencies in systems integration, applications, distribution and service to create systems that meet customer requirements.
Since mid-2005, most of our instruments have been provided to customers under cash sales or operating type lease or OTL arrangements, rather than the sales-type lease or STL arrangements that we previously utilized. We provide OTLs under bundled lease arrangements, in which our customers pay a monthly amount for the instruments, supplies, test kits and service. Our lease arrangements primarily take the form of what are known as “reagent rentals” where an instrument is placed at a customer location and the customer commits to purchase a minimum volume of reagents annually. We also enter into “metered” contracts with customers where the instrument is placed at a customer location with a stock of reagents and the customer is billed monthly based on actual reagent usage.
| BEC 2009 FORM 10-K | 5 |
Table of Contents
As indicated in the above Comprehensive Product Portfolio chart, Beckman Coulter targets two principal markets: Clinical Diagnostics and Life Science.
Clinical Diagnostics
Our Clinical Diagnostics business includes:
| • | Beckman Coulter 2009 Revenues — $2,788.6 million |
| • | Estimated World Market — $41 billion |
| • | Top Five Competitors’ Share — over 60% |
| • | Estimated Long Term Market Growth Rate — 4 to 5% in constant currency |
| • | Typical Customers — hospitals, clinics, physicians’ offices and reference laboratories |
| • | Beckman Coulter Products — UniCel DxC and AU Chemistry Family, UniCel DxI Immunoassay Family, Hematology and Flow Cytometry Family, Hemostasis Products and Test Panels |
| • | Principal Competitors — Abbott Laboratories (Diagnostics Division), Johnson & Johnson (Ortho Clinical Diagnostics), Roche Diagnostics, Siemens Medical Diagnostics Solutions, Becton Dickinson and Company (BD Bioscience Immunocytometry Systems) and Sysmex Corporation |
Clinical diagnostics products are used to evaluate and analyze samples made up of body fluids, cells and other substances from patients or “in vitro” diagnostic or IVD testing. More than 20 billion tests are conducted each year worldwide, with over 82% of the tests routine tests. The information generated is used to diagnose disease, monitor and guide treatment and therapy, assist in managing chronic disease and assess patient status during hospital admission and discharge. This type of diagnostic testing is increasingly valued as an effective method of reducing health care costs through accurate, early detection of health disorders and enhanced management of treatment, potentially reducing the length of expensive hospital stays and improving patient outcomes. Due to their important role in the diagnosis and treatment of patients, these tests are an integral part of the overall care of patients. In general, clinical diagnostic testing influences over 60% of critical health care decisions, while representing less than 3% of overall health care costs.
The major fields that comprise the clinical diagnostics testing industry are clinical chemistry, immunoassay, microbiology, hematology and cellular, with molecular diagnostics a new and expanding part of the clinical diagnostics testing market. We have significant market positions in the three largest fields: clinical chemistry (33% United States; 25% worldwide), immunoassay (14% United States; 8% worldwide) and hematology (47% United States; 27% worldwide).
Today’s clinical laboratories face unique and significant challenges. Newer diagnostic tests demand greater and greater sensitivity and can be complex and time consuming to perform. At the same time, the laboratory must consistently and rapidly provide high quality results, often 24 hours per day, in a regulated environment that is faced with a shortage of skilled labor. We are the leading provider of progressive automation solutions to help laboratories reduce testing turnaround time, reduce the staff required, enhance the quality of testing and reduce overall health care costs.
Life Science
Our Life Science business includes:
| • | Beckman Coulter 2009 Revenues — $472 million |
| • | Estimated World Market — $36 billion |
| • | Estimated Long Term Market Growth Rate — 3 to 4% in constant currency |
| • | Typical Customers — Research laboratories in universities and medical schools, research institutes, government laboratories, and biotechnology and pharmaceutical companies |
| • | Beckman Coulter Products — Centrifuges, automated liquid handling systems and capillary electrophoresis systems |
| • | Principal Competitors — Agilent Technologies (Chemical Analysis Group), LIFE (ABI), Hamilton, Perkin Elmer Inc., Tecan Group, Ltd., Hitachi Koki Co., Ltd. and Thermo Fisher (Life Science). |
Life science research is the study of the characteristics, behavior and structure of living organisms and their component systems. The life science testing market is evolving rapidly as a result of advances in genomics, proteomics and cell based testing. With the rough map of the human genome complete, the work that will more directly affect patient care has begun, as researchers start to incorporate this information into specific studies to improve therapeutic efficacy. Our life science testing products play a role in helping researchers understand disease by simplifying and automating key testing processes.
| 6 | BEC 2009 FORM 10-K |
Table of Contents
Growth in the life science testing market is driven by funding for government and academic research, pharmaceutical R&D spending and biotechnology investment. Universities and medical research laboratories represent about half of the life science testing market. These customers perform basic medical research to further understand the basis of disease and clinical research, where human samples are used to characterize disease states. Biotechnology firms and pharmaceutical companies represent the other half of the life science testing market. They rely on our instrument systems to speed the long and detailed drug discovery process. Also, once new therapeutics and vaccines emerge from the research phase, they move into clinical trials to evaluate their effectiveness, where our products are used to monitor clinical trials.
Business Segments
We operate our business on the basis of two reportable segments: Clinical Diagnostics and Life Science. Segment revenue and profit information is presented in Note 18 “Business Segment Information” of the Notes to Consolidated Financial Statements in Item 8 of this Form 10-K. Within our Clinical Diagnostics segment, we have identified three product areas, each focused on a core product strategy: chemistry and clinical automation, immunoassay and molecular diagnostics and cellular analysis. The majority of Olympus revenue is classified as part of our Clinical Diagnostics business segment.
Approximately 81% of our revenue and 93% of our gross profit are derived from recurring revenue, comprised of consumable supplies (including reagent test kits), services and operating-type lease payments for our leased instruments. The remaining balance of our revenue is derived from “instrument sales.” Our products and services include:
| • | Instruments, which typically have a five to seven year life in their initial placement on an operating-type lease. |
| • | Supplies such as sample containers, adapters and pipette tips and other items used during test procedures |
| • | Test kits, which include chemistries consisting of reagents that react with samples to produce measurable, objective results, as well as calibrators and quality control materials |
| • | Services provided by scientists and technical specialists in each product line and major scientific discipline served by our products. These individuals provide the level of after-sales service and technical support critical to customer satisfaction, including immediate technical support by telephone, delivery of parts and servicing instruments on site |
| • | Data management tools that consolidate patient test information from multiple instruments in the lab enhancing the laboratory information system and delivering laboratory management information from a single workstation |
Consumable supplies (including reagent test kits), service and operating-type lease payments generate significant ongoing revenue, which continues throughout the life of an instrument. We also sell instruments under normal credit terms.
Product Areas
Clinical Diagnostics
Chemistry and Clinical Automation. Routine chemistry systems use electrochemical detection and chemical reactions with patient samples to detect and quantify substances of diagnostic interest (referred to as “analytes”) in blood, urine and other body fluids. Commonly performed tests include glucose, cholesterol, triglycerides, electrolytes, proteins and enzymes. We offer tests for more than 100 individual analytes, which account for the vast majority of hospital-based clinical chemistry testing. To save time and reduce the opportunity for errors, systems identify patient samples through barcodes. Automated clinical chemistry systems are designed to be highly reliable and available on short notice, 24 hours a day. We offer systems and workflow solutions for a broad range of customers from small hospitals to the largest reference laboratories.
We acquired the diagnostics systems business from Olympus Corporation on August 3, 2009 through a cash payment of approximately $800 million. The Olympus acquisition expands our reach in the high-throughput and low-volume segments of the clinical diagnostics industry. The Olympus products include a broad offering of reliable chemistry systems, complemented by robust and efficient pre-analytical automation systems. Customers should benefit from the expanded range of products, particularly those large hospital and university laboratories where higher throughput systems are preferred.
Chemistry Systems. Our primary autochemistry clinical chemistry systems are:
| • | AU5400, our maximum throughput analyzer with the capacity to hold up to 96 different reagents on board |
| • | AU2700, designed for high to very high volume labs with the capacity to hold up to 96 different reagents on board |
| BEC 2009 FORM 10-K | 7 |
Table of Contents
| • | UniCel DxC 800, designed for high volume laboratories with the capacity to hold up to 70 different reagents on board |
| • | UniCel DxC 600, designed for labs with moderate volume with the capacity to hold up to 65 different reagents on board |
| • | AU680, designed for labs with moderate volume with the capacity to hold up to 63 different reagents on board |
| • | AU480, designed for small to medium sized laboratories with the capacity to hold about 60 different reagents on board |
Both the UniCel DxC 600 and 800 systems are capable of performing closed tube sampling, which allows the operator to use the tubes that samples are collected in to perform assays. This capability eliminates the tedious and time consuming de-capping and recapping steps while reducing operator exposure to biohazards and repetitive motion injuries. These systems also offer minimal maintenance, fast start up and superior STAT testing capability. The AU5400, AU2700 and AU480 systems, acquired in the Olympus transaction are amongst the highest throughput and most reliable analyzers on the market today.
Clinical Lab Automation. In recent years, automation has become an increasingly important element in the efficient operation of clinical laboratories as a result of a worsening shortage of skilled laboratory personnel and an increasing focus on cost savings. We address these needs through our Power Processor, AutoMate 600/800 and AutoMate 1200/2500 systems. Our Power Processor and AutoMate systems allow the laboratory to automate a number of pre-analytical steps, including sample log-in and sorting through bar code technology, centrifugation, aliquoting and cap removal. These systems also sort the prepared samples into discrete racks for further processing on our clinical chemistry, immunoassay and hematology systems. The post-analytical capability includes resorting for additional testing on other platforms or to a storage position. The Power Processor can be integrated with modules, track systems and analyzers to create comprehensive laboratory automation that handles virtually all of the laboratory’s preanalytical and post analytical processes. The Automate 1200/2500 systems that we acquired from Olympus automate the pre- and post-analytical sample handling steps in very to ultra-high volume laboratories. Our strength in total lab automation should be complemented by Olympus’ worldwide leadership position in pre-analytical automation.
Point of Care Testing. Point of care testing products are used in physicians’ office laboratories, clinics, hospitals and other medical settings. These products include a range of rapid diagnostic test kits and hematology instruments that give physicians immediate information to help them manage patients. The Hemoccult and Hemoccult SENSA tests are the industry standard in fecal occult blood testing and are used as aids in screening for gastrointestinal disease and colorectal cancer.
Immunohematology. Our immunohematology products were acquired in the Olympus acquisition. The products include the PK 7200 and PK 7300 fully automated analyzers, blood grouping reagents and CMV and Syphilis screening assays. These products are sold to blood donor testing centers worldwide. The PK 7300 analyzer includes features that enable customers to comply with donor testing regulations around the globe. The PK systems are the highest throughput and among the most reliable products in the donor testing market. More than 90% of donor blood units collected worldwide are tested on a PK system.
Immunoassay and Molecular Diagnostics. Immunoassay systems also detect and quantify chemical substances of diagnostic interest in blood, urine or other body fluids. These systems, however, use antibodies as the central components in their analytical reactions and have the ability to detect and quantify very low analyte concentrations. Commonly performed tests assess thyroid function, screen and monitor for cancer and cardiac risk and provide important information in fertility and reproductive testing. Other tests are used to monitor critical factors associated with anemia, blood viruses and infectious disease.
We offer over 60 immunoassay test kits. Our most significant products are the Access family of immunoassay systems. The Access family includes:
| • | Access Classic and Access 2, targeted to lower volume immunoassay testing environments |
| • | UniCel DxI 600 Access Immunoassay System, introduced in 2007. The UniCel DxI 600 system is used primarily in mid-volume laboratories, making it possible for mid-sized hospitals to perform lower-volume assays in-house, reducing outsourcing costs and improving laboratory efficiency. |
| 8 | BEC 2009 FORM 10-K |
Table of Contents
| • | UniCel DxI 800 Access Immunoassay System, the highest throughput immunoassay system available in the industry today, is used primarily in large hospital and reference laboratories. We believe these laboratories make up approximately 40% of the immunodiagnostic testing market worldwide. |
In addition, we offer a comprehensive menu of more than 60 assays, targeted to a broad range of disease states, from cancer (PSA, fPSA)) to reproductive testing (Inhibin A). Most of the systems use identical reagents, which can facilitate improved work flow and flexibility and can simplify inventory management for the laboratory.
Molecular Diagnostics Products. Molecular diagnostics is an emerging and promising field that includes testing for infectious diseases, genetic diseases and disorders, human cancers and pharmacogenics. As knowledge of the genome and its functioning continues to expand, new applications are being developed and, in some cases, are being used today as diagnostic tools as well as in genetic disease susceptibility testing. We are developing a sample-to-result system for molecular diagnostics, the UniCel DxN, which we believe will meet the needs of routine, moderately complex clinical laboratories for an automated, fully integrated molecular diagnostics test system. We expect to commercialize the UniCel DxN in the next few years.
In 2008, we licensed certain rights to testing for the hepatitis C virus (HCV) from Siemens Healthcare Diagnostics. Under the agreement, Beckman Coulter can develop, manufacture and sell a quantitative viral load HCV blood test for use on our DxN system under development. HCV viral load testing is essential for managing patients affected by the hepatitis C virus and is used to monitor therapy for the duration of the infection. An estimated 170 million people are chronically infected with the hepatitis virus and an additional three to four million people are newly infected each year- making HCV viral load testing one of the most commonly ordered infectious disease tests in molecular diagnostics.
Our wholly owned subsidiary, Beckman Coulter Genomics, Inc., is a leading provider of nucleic acid purification products in the biomedical research market. Its patented Solid Phase Reversible Immobilization (SPRI) technology provides state-of-the-art results for the isolation and purification of RNA and DNA. This technology is integrated with our automated liquid handling systems to provide customers with an automated solution for nucleic acid purification. We are incorporating the SPRI technology into other product lines to further expand the overall use of this technology. Recently, we launched the SPRI-TE Nucleic Acid Extractor for simple, automated purification of DNA and RNA.
Chemistry/Immunoassay Work Cells. Work cells, the integration of chemistry and immunoassay, is one of the fastest growing areas in the clinical diagnostics laboratory. We believe we offer some of the most capable work cells in the industry, from the mid-volume UniCel DxC 600i to the high-volume DxC 880i. At the end of 2008 three additional work cells were launched: UniCel DxC 860i, DxC 680i and the DxC 660i.
Beckman Coulter work cells offer our entire menu of more than 150 chemistry and immunoassay tests from a single point of sample entry. And they all feature our exclusive closed-tube sampling, which helps improve efficiency and reduce the potential for errors. Importantly, the entire fielded base of UniCel DxC 600 and 800 chemistry systems can be upgraded to work cells.
Cellular Analysis
Hematology. Our blood cell systems use principles of physics, optics, electronics and chemistry to separate cells of diagnostic interest and then quantify and characterize them. These systems allow clinicians to study formed elements in blood, such as red and white blood cells and platelets. The most common diagnostic test is a “CBC” or complete blood count, which provides information on from eight to 23 different blood cell parameters. Our hematology product line is structured to address the differing requirements of high, medium and low volume laboratories and includes:
| • | COULTER LH 750, 755, 780, and 1500 series of hematology systems. These systems offer features such as five-part white blood cell differential analysis, enumeration of nucleated red blood cells, random-access capability and automated slide making and staining from a single aspiration of blood. The LH 780 system offers enhanced quality control features that improve productivity and add additional parameters to support anemia studies. The LH 1500 series of hematology automation systems are designed to link multiple analyzers, to automate the pre-analytical process and to eliminate a number of post-analytical steps. |
| • | COULTER DxH 800, cleared by the FDA in late 2008, provides a differentiated modular and scalable system for cellular testing. The system’s algorithms and optics are expected to deliver enhanced value by reducing the number of manual reviews by pathologists using a microscope, when a sample is flagged as abnormal. The overall system design also allows for future integration of full flow cytometry capability, which should better meet customers’ cellular analysis needs, allowing for menu expansion within the hematology laboratory. |
| BEC 2009 FORM 10-K | 9 |
Table of Contents
| • | COULTER LH 500 Hematology Analyzer and other moderate volume hematology systems. These systems offer the technology features of larger systems in a compact bench top system. |
| • | COULTER Ac•T family of hematology systems and other low-volume hematology systems. The Ac•T series hematology analyzers are small, compact and relatively simple to use, making them well suited for low volume office labs and smaller laboratories. They also are suitable for use with pediatric specimens that are typically of small volume, as these systems require comparatively small sample volumes for analysis. |
Flow Cytometry. Flow cytometry is used in numerous applications in basic research, clinical research, drug discovery and clinical diagnostics testing. Flow cytometers rapidly identify, categorize and characterize multiple types of cells in suspension. Flow cytometers allow analysis of cell types including specific cell characteristics such as phenotype or functionally, thereby allowing researchers to analyze specific cell populations. This analysis can be performed beyond blood to include bone marrow, tumors and other cellular samples. Our line of flow cytometry systems includes:
| • | Gallios research analyzer, which is our new high performance analyzer used for a broad range of research applications |
| • | Navios clinical analyzer used in applications such as HIV monitoring and a variety of clinical research applications, such as leukemia and lymphoma testing |
| • | CyAn ADP analyzer, predominantly used in research, is known for its speed and is finding increased utility where speed of analysis can be a key requirement, such as high content and high throughput screening for drug discovery |
| • | MoFlo XDP cell sorter is a high performance, high speed cell sorter used to identify and individually select and sort cells of interest for further analysis, often at a functional or genetic level |
| • | Cytomics FC 500 series of flow cytometry systems and COULTER EPICS XL and XL-MCL flow cytometer series, which also are used in the clinical laboratory, predominantly for HIV monitoring and additionally in the case of the FC500 for CD34 enumeration |
Coagulation. Coagulation systems rely on clotting, chromogenic and immunologic technologies to provide the detailed information that the clinician requires to diagnose bleeding and clotting disorders and to monitor anticoagulant therapy. We offer a range of hemostasis systems and reagents as the North American distributor of the Instrumentation Laboratory ACL line of hemostasis systems and its Instrumentation Laboratory and Hemoliance brands of reagents. We believe these products give a laboratory access to the broadest automated hemostasis menu in the industry, from routine screening tests such as the activated partial thromboplastin time and prothrombin time to a wide range of esoteric tests.
Life Science
Life Science Automation. Our products are used in many parts of the drug discovery and development process as well as automated sample preparation for genomic and cellular analysis. Important applications for these automation products include sample preparation for high throughput genomic analysis such as genotyping. The analysis of massive amounts of genetic information requires automation of sample preparation to meet timing requirements. Our automation systems are used in the process of handling live cells in a high throughput mode as biologic drugs are a critical part of the drug development pipeline. Other drug development applications that require samples to be processed in an automated or high-throughput mode include target identification, secondary screening and pre-clinical testing.
Centrifugation. Centrifuges separate liquid samples based on the density of the components. Centrifugal samples are spun at up to 150,000 revolutions per minute to create forces that exceed 1,000,000 times that of gravity. These forces result in the nondestructive separation of proteins, DNA, viruses and other cellular components while retaining their biological activity. Our centrifuges are routinely used in cellular, genomic and proteomic research as well as in vaccine development and production because they enable very efficient sample separation processes.
Capillary Electrophoresis. This microscale technology provides the separation, quantitation and characterization of charged/polar molecules like ions, drugs, metabolites, proteins, glycoproteins and nucleic acids in a fast and efficient way, reducing analysis cost, sample consumption and time to answer. We have developed this core separation technology into analytical solutions for industrial, academic, medical and government laboratories. Our CE based solutions include:
| • | PA 800 Plus, Pharmaceutical Analysis Systems for characterization and quality control of therapeutic biologics using automated SDS-gel for purity analysis, isoelectric focusing for heterogeneity and identity determination and glycan analysis for in depth characterization |
| • | GeXP Genetic Analysis Systems that focus on gene expression, SNP detection, STR analysis and sequencing for pathogen identification, stem cell, cancer and industrial applications |
| 10 | BEC 2009 FORM 10-K |
Table of Contents
| • | P/ACE Series Platform focusing on ion, drug and metabolite analysis in industrial, forensic and medical research |
Competition
To compete effectively in our markets, a company must invest in R&D and establish the technical infrastructure needed to develop complex systems, integrating engineering, chemical, biological and computer sciences. In addition, an extensive distribution infrastructure with highly qualified personnel to perform sales, service, customer training and technical product support is needed in the market segment. Also, in some cases, authorization to market Clinical Diagnostics products must be obtained from regulatory authorities in the United States and other countries. We consider our reputation for service responsiveness and our sales and service network within our market segments to be important competitive assets.
Nevertheless, we encounter significant competition from many domestic and international manufacturers, with many of these companies participating in one or more parts of each of our market segments. Some of these competitors are divisions or subsidiaries of corporations with substantial resources. In addition, we compete with several companies that offer reagents, consumables and service for laboratory instruments that are manufactured by us and others.
Research and Development
We must continue to introduce new instrument and reagent technologies and remain at the forefront in helping customers advance medical science, improve patient outcomes and reduce healthcare costs to continue to grow, gain market share and remain competitive. To remain competitive our strategy is to acquire and defend intellectual property and invest in R&D. Otherwise, our current products could become technologically obsolete over time.
Our new products originate from four sources:
| • | Internal R&D programs |
| • | External collaborative efforts with individuals in academic institutions and technology companies |
| • | Devices or techniques generated in customers’ laboratories |
| • | Business and technology acquisitions |
Development programs focus on production of new generations of existing product lines as well as new product categories not currently offered. Areas of pursuit include innovative approaches to cell characterization, immunochemistry, molecular biology, advanced electrophoresis technologies and automated sample processing and information technologies. Our R&D teams are skilled in a variety of scientific, engineering and computer science disciplines, in addition to a broad range of biological and chemical sciences. Our R&D expenditures were $266.4 million in 2009 and $280.1 million in 2008. Our expenditures vary due primarily to charges incurred in certain periods to acquire licenses for products in development that have no alternative future use.
Sales and Service
We have sales in more than 160 countries. Most of our products are distributed by our own marketing, service and sales organizations in major markets. We also employ independent distributors to serve those markets that are more efficiently reached through such channels. Our sales representatives are technically educated and trained in the operation and application of our products. The sales force is supported by a staff of scientists and technical specialists in each product line and in each major scientific discipline served by our products. These individuals enable us to provide the level of immediate after-sales service and technical support that is critical to customer satisfaction. This includes capabilities to provide immediate technical support by phone and to deliver parts or have a service engineer on site within hours. To have such capabilities on a global basis requires a major investment in personnel, facilities and other resources. Our large installed base of instruments makes the required service and support infrastructure financially viable.
Patents and Trademarks
Patents and other proprietary rights are essential to our business. We rely on trademarks, copyrights, trade secrets, know-how and confidentiality agreements to develop, maintain and strengthen our competitive position. We own a number of patents and trademarks throughout the world and have also entered into license arrangements relating to various third-party patents and technologies.
Products manufactured by us are sold primarily under our own trademarks and trade names. Our primary trademark and trade name is “Beckman Coulter” alone or in association with our logo. We vigorously protect our primary trademark, which is used on or in association with our worldwide product offerings. We believe that the name “Beckman Coulter” is recognized throughout the worldwide scientific and diagnostic community as a premier source of biomedical instrumentation and products. We also own and use secondary trademarks with various products for product differentiation purposes. “Coulter” is used as a secondary mark and source identifier with some of our products.
| BEC 2009 FORM 10-K | 11 |
Table of Contents
We protect our products and technology through patents on a worldwide basis, balancing the cost of such protection against obtaining the greatest value. We currently maintain a worldwide patent portfolio of approximately 3,500 active patents and pending applications for patents, which includes approximately 693 active U.S. patents, 213 applications for U.S. patents, 1,357 active foreign patents and 1,237 applications for foreign patents. Our entire portfolio of patents and applications is distributed between our Clinical Diagnostics and Life Science products and the chemistries and kits used with them.
We also protect certain unpatented confidential and proprietary information important to our business as trade secrets. We maintain certain details about our processes, products and technology as trade secrets and generally require employees, consultants, parties to collaboration agreements and other business partners to enter into confidentiality agreements.
We recognize the need to promote the enforcement of our patents and trademarks and continue to take commercially reasonable steps to enforce our patents and trademarks around the world against potential infringers. We operate in an industry susceptible to significant patent litigation. At any given time, we generally are involved as both a plaintiff and defendant in a number of patent infringement and other intellectual-property related actions. Such litigation can result in significant royalty or other payments or result in injunctions that can prevent the sale of products.
Government Regulations
Our products and operations are subject to a number of federal, state, local and foreign laws and regulations. Virtually all of our Clinical Diagnostics products and some of our Life Science products are classified as “medical devices” under the United States Food, Drug and Cosmetic Act (the “FDCA”). The FDCA requires these products, when sold in the United States, to be safe and effective for their intended use and to comply with regulations administered by the United States Food & Drug Administration (“FDA”). These regulatory requirements include:
| • | Establishment Registration. We must register with the FDA each facility where regulated products are developed or manufactured. These facilities are periodically inspected by the FDA. |
| • | Marketing Authorization. We must obtain FDA authorization to begin marketing a regulated, non-exempted product in the United States. For most of our products, this authorization is obtained by submitting a pre-market notification, which simply provides data on the performance of the product to allow the FDA to determine substantial equivalence to a product already in commercial distribution in the United States. A small number of products must go through a formal pre-market approval process which includes the performance of clinical studies and may include review of the product by a formal scientific review panel. |
| • | Quality Systems. We are required to establish a quality system that includes procedures for ensuring regulated products are developed, manufactured and distributed in accordance with specified standards. We also must establish procedures for investigating and responding to customer complaints regarding the performance of regulated products. |
| • | Labeling. The labeling for the products must contain specified information. In some cases, the FDA must review and approve the labeling and any quality assurance protocols specified in the labeling. |
| • | Imports and Exports. The FDCA establishes requirements for importing and exporting products into and from the United States. In general, any limitations on importing and exporting products apply only to products that have not received marketing authorization. |
| • | Post-market Reporting. After regulated products have been distributed to customers, we must investigate and report to the FDA certain events involving the products. We also must notify the FDA when we conduct recalls or certain types of field corrective actions involving our products. |
The FDCA authorizes the FDA to bring legal action to enforce the act and to address violations. Legal remedies available to the FDA for violations of the act include criminal prosecution, seizure of violative products, injunctions against the distribution of the products and assessment of civil penalties. The FDA normally provides companies with an opportunity to correct alleged violations before taking legal action.
| 12 | BEC 2009 FORM 10-K |
Table of Contents
The European Union also has adopted requirements that affect our products. These requirements include establishing standards that address creating a certified quality system as well as a number of directives that address specific product areas. The most significant of these directives is the In Vitro Diagnostic Medical Device Directive (“IVDD”), which includes:
| • | Essential Requirements. The IVDD specifies “essential requirements” that all medical devices must meet. The requirements are similar to those adopted by the FDA relating to quality systems and product labeling. |
| • | Conformity Assessment. Unlike United States regulations, which require virtually all devices to undergo some level of premarket review by the FDA, the IVDD allows manufacturers to bring many devices to market using a process in which the manufacturer certifies that the device conforms to the essential requirements for that device. A small number of products must go through a more formal pre-market review process. |
| • | Vigilance. The IVDD also specifies requirements for post market reporting similar to those adopted by the FDA. |
Our major manufacturing operations and development centers and many of our international sales and service subsidiaries have been certified as complying with the European Union’s quality system requirements. We also have programs in place that address the various aspects of the IVDD.
A number of other countries, including Australia, Brazil, Canada, China and Japan, have adopted or are in the process of adopting standards for medical devices sold in those countries. Many of these standards are loosely patterned after those adopted by the European Union, but with elements unique to each country. We routinely monitor these developments and address compliance with the various country requirements as new standards are adopted.
United States and foreign regulations governing reimbursement for diagnostic laboratory testing services may directly or indirectly affect our products’ design and potential market. In many cases, the acceptance of new technologies in the marketplace is directly related to the availability of reimbursement. Health care reform efforts in the United States and other countries also may further alter the methods and financial aspects of doing business in the health care field. We closely follow these developments, so we may position ourselves to respond to them.
Environmental
We are subject to federal, state and local environmental laws and regulations both in the United States and other countries. Although we continue to make expenditures to comply with environmental laws and regulations, we do not anticipate that these expenditures will have a material impact on our operations or financial position. We believe our operations comply in all material respects with applicable federal, state and local environmental laws and regulations.
Although few of our products are directly regulated by environmental laws, they may be impacted by environmental laws that have broad general scope. For example, a growing number of jurisdictions have adopted laws banning the use of certain chemicals and materials in electronic components as well as requiring those components to be recycled rather than discarded. Similarly, a number of customers are located in areas that either ban outright or limit the use of products that contain chemicals, such as mercury, lead and other heavy metals, cyanides and certain organic compounds. In some cases, manufacturers of chemicals that we use as raw materials have withdrawn those materials from the market due to perceived environmental issues. We have adopted a number of programs to address these various requirements and, in a few cases, have been required to redesign products to address them.
We began conducting environmental studies at our Fullerton site in 2008 in connection with our previously announced Orange County consolidation project and closure of our Fullerton, California site. The data generated by these studies suggests that soils under and around several of the buildings contain chemicals previously used in operations at the facility. Some of these chemicals also have been found in groundwater underlying the site. Studies to determine the source and extent of these chemicals are underway. We notified the California State Department of Toxic Substances Control of the presence of these chemicals at the site and expect the agency to oversee determination of any remediation requirements. We recorded a liability of $19.0 million representing our best estimate of the future expenditures for investigation and remediation at the site. The ultimate costs incurred could range from $10.0 million to $30.0 million. Our estimates are based upon the results of our investigation to date and comparison to our prior experience with environmental remediation at another site. Additional activities not contemplated at this time could be required and that the actual costs could differ materially from the amount we have recorded as a liability or our estimated range. Through December 31, 2009 we have spent $1.4 million.
We also remain subject to costs of remediating sites where we formerly conducted operations or where we disposed of wastes. For most of these sites, we are one of a large number of parties required to contribute toward remediation of the site. To address these contingent environmental costs we establish accruals when the costs are probable and can be reasonably estimated. We believe that, based on current information and regulatory requirements, the accruals established for environmental expenditures are adequate. Based on current knowledge, to the extent that additional costs may be incurred that exceed the accruals, the amounts are not expected to have a material adverse effect on our operations, financial condition or liquidity, although no assurance can be given in this regard.
| BEC 2009 FORM 10-K | 13 |
Table of Contents
Executive Officers of the Registrant
Following are our executive officers as of February 9, 2010:
Scott Garrett, 60, Chairman of the Board, President and Chief Executive Officer
Mr. Garrett serves as Beckman Coulter’s Chairman of the Board, President, Chief Executive Officer. He was named Chairman of the Board in April 2008, Chief Executive Officer effective February 2005 and served as President and Chief Operating Officer since December 2003. He joined Beckman Coulter in 2002 as President, Clinical Diagnostics. Prior to joining Beckman Coulter, he served as chief executive officer of Garrett Capital Advisors, L.L.C., a private equity firm focused on medical device companies, and as chief executive officer for Kendro Laboratory Products, L.P., a life science company. Mr. Garrett also spent over 20 years of his career with Baxter International/American Hospital Supply Corporation and a Baxter spin-off company. He began his career with Baxter in product development. Through a series of promotions Mr. Garrett became Group Vice President of Baxter and President of the Diagnostics subsidiary. Baxter’s Diagnostics subsidiary subsequently became Dade International and then Dade Behring, Inc., where Mr. Garrett served as Chairman and Chief Executive Officer. Mr. Garrett has been a director of Beckman Coulter since January 2005.
Scott Atkin, 46, Executive Vice President, Chemistry, Discovery and Instrument Systems Development
Mr. Atkin was named Executive Vice President, Chemistry, Discovery and Instrument Systems Development in January 2010. Prior to this, he was Group Vice President, Chemistry, Discovery and Automation Business Group and Instrument Systems Development Center, effective January 2007. Mr. Atkin joined Beckman Coulter in 1996 as a Director with product development and business leadership responsibilities. Previously, Mr. Atkin was President, Chief Executive Officer and a principal founder of SAGIAN, Inc., a company involved with data acquisition and laboratory robotics, which Beckman Coulter acquired in 1996.
Carolyn D. Beaver, 52, Corporate Vice President, Controller and Chief Accounting Officer
Ms. Beaver was named Corporate Vice President and Controller of Beckman Coulter, Inc. effective August 2005 and was named Chief Accounting Officer effective October 2005. She served as interim Chief Financial Officer from July 2006 through October 2006. Ms. Beaver is a director of Commerce National Bank, Newport Beach, California, chair of its audit committee and a member of its asset/liability committee. She is a member of the finance committee of Hoag Memorial Hospital Presbyterian, Newport Beach, California. Ms. Beaver was an audit partner with KPMG LLP from 1987 through April 2002 and is a certified public accountant.
Cynthia Collins, 51, Group Vice President, Cellular Analysis
Ms. Collins was named Group Vice President, Cellular Analysis effective May 2007. Ms. Collins joined Beckman Coulter from Sequoia Pharmaceuticals, Inc., where she most recently served as Chief Executive Officer. Prior to joining Sequoia Pharmaceuticals, Ms. Collins served as President of Clinical Micro Sensors, Inc., a wholly owned subsidiary of Motorola where she directed the development and commercialization of molecular diagnostic microarray products. Before Motorola, she spent over 17 years at Baxter Healthcare in a variety of executive roles, including President of Global Oncology and Vice President of Strategy and Portfolio Management of BioScience, in addition to six years with Abbott Laboratories in a series of operational assignments. Ms. Collins also serves on the Corporate Strategic Advisory Council with the University of Miami, Miller School of Medicine.
| 14 | BEC 2009 FORM 10-K |
Table of Contents
Richard S. Creager, Ph.D., 57, Group Vice President, Immunoassay and Molecular Diagnostics
Dr. Creager was named Group Vice President, Immunoassay and Molecular Diagnostics in December 2009 after serving as Group Vice President, High Sensitivity Testing since September 2008. Prior to this, he held a variety of management positions with the Company: Corporate Vice President, Immunoassay Business Center from September 2007 to 2008; Vice President, Immunoassay Product and Business Development from 2003 to 2007; Vice President and Director Chemistry Reagent Development Clinical Diagnostics Division from 2002 to 2003; Director Immunoassay Research and Development and Chaska Site Manager from 1998 to 2002; and Director Immunoassay Research and Development and Manufacturing Operations from 1997 to 1998.
Paul Glyer, 53, Senior Vice President, Strategy, Business Development and Communications
Mr. Glyer was named Senior Vice President, Strategy, Business Development and Communications in February 2006. He previously served as Vice President Corporate Development since July 2005 and Vice President and Treasurer since February 2003. Prior positions were Vice President-Director, Financial Planning since November 1999 and Vice President-Director, Finance for Diagnostics Development and Corporate Manufacturing since February 1999 and Assistant Treasurer and then Treasurer from 1989 to 1999. Mr. Glyer joined Beckman Coulter, Inc. in 1989.
J. Robert Hurley, 60, Senior Vice President, Human Resources and Chairman, Beckman Coulter, Japan
Mr. Hurley was named Senior Vice President, Human Resources effective July 2005 and Chairman, Beckman Coulter, Japan in August 2009. He joined Beckman Coulter in May 2005 as Vice President, Human Resources. Before Beckman Coulter, Mr. Hurley was a Corporate Vice President at Baxter International Inc.
Robert W. Kleinert, 58, Executive Vice President, Worldwide Commercial Operations
Mr. Kleinert was named Executive Vice President, Worldwide Commercial Operations in January 2007. He served as Executive Vice President, North America Commercial Operations since May 2006. He joined Beckman Coulter in 2003 as Vice President, Clinical Diagnostics Commercial Operations, Americas. Prior to Beckman Coulter, Mr. Kleinert served as President and Chief Executive Officer of Lifestream International, Inc.
Pamela A. Miller, 55, Senior Vice President, Supply Chain Management
Ms. Miller was named Senior Vice President, Supply Chain Management of Beckman Coulter, Inc., effective June 2006. From 1997 to 2006, she held the following management positions with the Company: Vice President, Immunoassay Supply Chain Management from 2004 to 2006; Director Worldwide Reagent Production from 2003 to 2004; and Director Immunoassay Manufacturing from 1997 to 2003. Ms. Miller currently sits on the Board of Directors for the Orange County Chapter of the American Red Cross.
Clair K. O’Donovan, Ph.D., 53, Senior Vice President, Quality and Regulatory Affairs
Dr. O’Donovan was named Senior Vice President, Quality and Regulatory in October 2009. Prior to this, she held a variety of management positions with the Company as Vice President, Supply Chain for Chemistry Systems from 2006 to 2009; Director of Reagent Manufacturing for Carlsbad, California and Galway, Ireland from 2004 to 2006; Director of Worldwide Technical Operations from 2003 to 2004; Director of Reagent Manufacturing for Miami, Florida from 2001 to 2003; and Plant Manager Galway Ireland from 1997 to 2001.
Arnold A. Pinkston, 51, Senior Vice President, General Counsel and Secretary
Mr. Pinkston was named Senior Vice President and General Counsel effective November 2005 and Secretary effective December 2005. Prior to joining Beckman Coulter, Mr. Pinkston was Deputy General Counsel of Eli Lilly and Company, responsible for the legal affairs of Lilly USA, Eli Lilly and Company’s global pharmaceutical products component and its global marketing and sales organization. Mr. Pinkston served as the General Counsel for PCS Health Systems, a pharmacy benefit management company from 1994 to 1999. Prior to this, Mr. Pinkston held senior positions in the Law Department of McKesson Corporation.
Charles P. Slacik, 55, Senior Vice President and Chief Financial Officer
Mr. Slacik joined Beckman Coulter as Senior Vice President and Chief Financial Officer in October 2006. Before joining Beckman Coulter, Mr. Slacik was Executive Vice President and Chief Financial Officer of the specialty pharmaceutical company Watson Pharmaceuticals, Inc. since 2003. Prior to that, he was Senior Vice President and Chief Financial Officer at C.R. Bard, which develops and manufactures vascular, urology, oncology and surgical specialty products. Before C.R. Bard, he was with Wyeth (formerly American Home Products) in a variety of increasingly responsible positions in finance, information technology, and general management for several of the company’s divisions.
| BEC 2009 FORM 10-K | 15 |
Table of Contents
Employee Relations
As of December 31, 2009, we and our subsidiaries had approximately 11,800 employees worldwide. We believe relations with our employees are good.
Financial Information About Geographic Areas
Geographic data information is presented in Note 18 “Business Segment Information” of the Notes to Consolidated Financial Statements in Item 8 of this Form 10-K.
Available Information
We file reports and other information with the SEC, including Forms 8-K, 10-K, 10-Q, and 11-K, Form S-8, and proxy statements. The public may read and copy any materials we file with the SEC at the SEC’s Public Reference Room at 100 F Street, NW, Washington, DC 20549. The public may obtain information on the operation of the Public Reference Room by calling the SEC at 1-800-SEC-0330. The SEC maintains an Internet site that contains reports, proxy, and information statements, and other information regarding issuers that file electronically with the SEC. The address of that site is “http://www.sec.gov.”
Our website includes a link to a website where copies of our annual report on Form 10-K, quarterly reports on Form 10-Q, current reports on Form 8-K, and amendments to those reports filed or furnished pursuant to Section 13(a) or 15(d) of the Exchange Act may be obtained free of charge as soon as reasonably practicable after they are electronically filed with, or furnished to, the SEC. The website also includes copies of our code of ethics for officers, employees, and directors, including our chief executive officer and senior finance officers, our corporate governance guidelines, and the charters for our audit and finance, organization and compensation, and nominating and corporate governance committees. These materials may be obtained by accessing the website at “http://www.beckmancoulter.com,” selecting “Investor Relations,” and then “Corporate Governance.” Paper copies of these documents may be obtained free of charge by writing to us at Beckman Coulter, Inc., Office of Investor Relations, 250 S. Kraemer Boulevard, Brea, California 92821.
We face significant competition, and our failure to compete effectively could adversely affect our sales and results of operations.
We face significant competition from many domestic and international manufacturers, with many of these companies participating in one or more parts of each of our markets. Some of these competitors are divisions or subsidiaries of corporations with substantial resources. We also compete with several companies that offer reagents, supplies and service for laboratory instruments that are manufactured by us or others. Our sales and results of operations may be adversely affected by loss of market share through aggressive competition, the rate at which new products are introduced by us and our competitors and the extent to which new products displace existing technologies and competitive pricing especially in areas where currency has an effect.
We are subject to various federal, state, local and foreign regulations, and compliance with these laws or any new laws or regulations, including potential health care reform, could cause us to incur substantial costs and adversely affect our business and results of operations.
Our products and operations are subject to a number of federal, state, local and foreign laws and regulations. A determination that our products or operations are not in compliance with these laws and regulations could subject us to civil and criminal penalties, prevent us from manufacturing or selling certain of our products and cause us to incur substantial costs in order to be in compliance. To varying degrees, compliance with these laws and regulations may:
| • | Take a significant amount of time |
| • | Require the expenditure of substantial resources |
| • | Involve extensive clinical and pre-clinical testing |
| • | Involve modifications, repairs or replacements of our products |
| • | Result in limitations on the proposed uses of our products |
| 16 | BEC 2009 FORM 10-K |
Table of Contents
In addition, changes to existing laws or regulations, including the effect of potential health care reforms, also could prevent us from manufacturing or selling our products, reduce funding for government and academic research and cause us to incur substantial compliance costs.
Our compliance costs include addressing our ongoing responsibilities under FDA regulations that apply to our products both before and after they are approved for distribution. If the FDA were to conclude that any of our products are ineffective or pose an unreasonable health risk, or that we are not in compliance with applicable regulations, the FDA could:
| • | Ban the product |
| • | Seize adulterated or misbranded products |
| • | Order a recall, repair or replacement of such product or a refund to the purchaser of the product |
| • | Require us to notify health professionals and others that the products present unreasonable risks of substantial harm to the public health |
| • | Impose operating restrictions |
| • | Enjoin and restrain certain violations of applicable law pertaining to the products |
| • | Assess civil penalties against our company, officers or employees |
| • | Recommend criminal prosecution to the Department of Justice |
An adverse regulatory action could restrict us from effectively marketing and selling our products.
Foreign governmental regulations have become more common and stringent. We may become subject to more rigorous regulation by foreign governmental authorities in the future. Penalties for noncompliance with foreign regulation could be severe, including revocation or suspension of the ability to sell products in that country and criminal sanctions.
As a result of the factors discussed above, domestic or foreign health care or tax laws and regulations may have a material adverse effect on our business.
Current healthcare reform changes, if adopted, may have a material adverse effect on our operating results.
The U.S. Administration has announced healthcare reform to be one of its priorities. Members of Congress have proposed major healthcare reform measures that, if adopted, could have a material impact on our business. There are pending proposals in both the House and Senate, each intended to institute substantial changes to the way health care is financed by both governmental and private insurers. Pending provisions, if adopted, could include imposition of a significant non-deductible fee on the medical device industry. If the proposals are passed by Congress, President Obama can either sign the legislation into law or veto it.
We must continue to market and improve existing products and develop new products that meet customer needs and expectations or our business and results of operations will be adversely impacted.
Our ability to continue to grow depends on our success in continuing to market and improve our existing products and develop new products that meet customer needs and expectations. Improving existing products and developing new products requires us to successfully integrate hardware, software and chemistry components. Consequently, the expected introductions of new products may be impacted by factors such as complexity and uncertainty in the development of new high-technology products and availability of qualified engineers, programmers and other key personnel. The viability of supply partners also may impact new product introductions for products we distribute. In addition, our ability to introduce new products and to continue marketing existing products may be affected by patents and other intellectual property rights of others, our ability to protect our intellectual property from others, the acquisition and integration of other companies and intellectual property and our ability to obtain regulatory approvals, including delays in obtaining any government marketing authorizations necessary to market the products, particularly with respect to Clinical Diagnostics products. Factors affecting the introduction of molecular diagnostic products include the inability to develop clinical diagnostic tests based on new technologies, a determination that the tests do not provide sufficient precision and accuracy, identification of additional necessary intellectual property rights, failure to establish the clinical utility of these tests during clinical studies and delays resulting from the timing and scope of regulatory agency reviews.
| BEC 2009 FORM 10-K | 17 |
Table of Contents
Our business could be adversely affected if we do not prevail in present or future third party intellectual property litigation adverse to our products or if our patents or other intellectual property rights are challenged, invalidated, circumvented or expire.
We cannot assure you that our products will be free of intellectual property rights of others or that a court will not find such products to infringe third party rights. Patent disputes are frequent, costly and may preclude or delay product commercialization. We may have to pay significant licensing fees to obtain access to third party intellectual property rights to make and sell current products or to introduce new products and cannot guarantee that such licenses will be available on terms acceptable to us, or at all. We also cannot assure you that our issued patents will include claims sufficiently broad to prevent competitors from developing competing products or that pending patent applications will result in issued patents. Obtaining and maintaining patents is an iterative process with patent offices worldwide. Our patents may not protect us against competitors with similar products or technologies, because competing products or technologies may not infringe our patents. The enforcement of our issued patents requires the filing and prosecution of legal actions in countries around the world, and we cannot assure you that we will prevail in such actions.
We rely on certain suppliers and manufacturers for raw materials and other products, and fluctuations in the availability and price of such products and services may interfere with our ability to meet our customers’ needs.
Difficulty in obtaining raw materials and components for our products, especially in the rapidly evolving electronic components market, could affect our ability to achieve anticipated production levels. For some of our products we are dependent on a small number of suppliers of finished products and of critical raw materials and components and our ability to obtain, enter into and maintain contracts with these suppliers. We cannot assure you that we will be able to obtain, enter into or maintain all such contracts in the future. On occasion, we have been forced to redesign portions of products when a supplier of critical raw materials or components terminated its contract or no longer made the materials or components available. If we are unable to achieve anticipated production levels and meet our customers needs, our operating results could be adversely affected. In addition, our results of operations may be significantly impacted by unanticipated increases in the costs of labor, raw materials, freight, utilities and other items needed to develop, manufacture and maintain our products and operate our business. Suppliers also may deliver components or materials that do not meet specifications preventing us from manufacturing products that meet our design specifications or customer requirements.
Consolidation of our customer base and the formation of group purchasing organizations could adversely affect our sales and results of operations.
Consolidation among health care providers and the formation of buying groups has put pressure on pricing and sales of our products, and in some instances, required payment of fees to group purchasing organizations. Our success in these areas depends partly on our ability to enter into contracts with integrated health networks and group purchasing organizations. If we are unable to enter into contracts with these group purchasing organizations and integrated health networks on terms acceptable to us, our sales and results of operations may be adversely affected. Even if we are able to enter into these contracts, they may be on terms that negatively affect our current or future profitability.
Reductions in government funding to our customers could negatively impact our sales and results of operations.
Many of our customers rely on government funding and on prompt and full reimbursement by Medicare and equivalent programs outside of the United States. In addition, our sales are affected by factors such as:
| • | Level of government funding for clinical testing, biomedical research, bioterrorism, forensics, and food safety |
| • | Pharmaceutical company spending policies |
| • | Access to capital by biotechnology start ups |
A reduction in the amount or types of government funding or reimbursement that affect our customers, as well as the unavailability of capital to our Clinical Diagnostics and biomedical research customers, could have a negative impact on our sales. Global economic uncertainty can result in lower levels of government funding or reimbursement.
Our international operations expose us to foreign currency exchange fluctuations.
We operate a substantial portion of our business outside of the United States and are therefore exposed to fluctuations in the exchange rate between the U.S. dollar and the currencies in which our foreign subsidiaries and dealers receive revenue and pay expenses. With a strengthening U.S. dollar, this exposure includes a negative impact on margins on sales of our products in foreign countries that are manufactured in the United States. We may enter into currency hedging arrangements in an effort to stabilize certain of these fluctuations. There are certain costs associated with these currency hedging arrangements, and we cannot be certain that such arrangements will have the full intended effect. Our currency exposures may not be hedged exposing us to losses on our
| 18 | BEC 2009 FORM 10-K |
Table of Contents
assets and cash flows denominated in these currencies. Our dealers may experience slower payment terms from their customers or have trouble paying for the purchases due to a stronger U.S. dollar. Further, we are exposed to counter party risks in the event that our counterparties do not perform in accordance with the contract terms. The Olympus acquisition also exposes us to more risk related to variability in the Japanese Yen, because a portion of our manufacturing and R&D costs are now centered in Japan.
Global market, economic and political conditions and natural disasters may adversely affect our operations and performance.
Our operations and performance depend significantly on worldwide market economic and political conditions and their impact on levels of certain customer spending, which may deteriorate significantly in many countries and regions, including the United States, particularly in light of the current worldwide market disruptions and economic downturn, and may remain depressed for the foreseeable future. For example, global political conditions and general economic conditions in foreign countries where we do significant business, such as the United States, France, Germany, India, Japan and China, could negatively impact on our sales. These disruptions could adversely affect our customer’s ability to pay for products or purchase additional products. These conditions also may adversely affect our suppliers, which could cause disruptions in our ability to produce our products. In addition, economic and market volatility and disruption, such as the current worldwide market disruptions and economic downturn, may adversely affect the cost and availability of credit. Concern about market stability and counterparty strength may lead lenders and institutional investors to reduce or cease to provide funding to borrowers. Natural disasters, such as hurricanes and earthquakes, could adversely affect our customers and our ability to manufacture and deliver products. Any of these market, economic, political or natural disaster factors could have a material adverse effect on demand for our products, our ability to manufacture, support and distribute products, our financial condition and operating results, and the terms of equity and debt capital and our ability to issue them.
Costs associated with our supply chain initiatives may disrupt operations and affect earnings and results of operations.
We have announced several relocation plans, including our plan to vacate our Fullerton, California facility and consolidate those operations to other facilities. In connection with this consolidation and the related closure of our Fullerton, California site, we plan to relocate our data center in 2010. We also have initiated environmental studies of the Fullerton facility and could incur substantial costs in addition to those already estimated and recorded depending upon determination of the remediation requirements. We may experience difficulties, delays or unexpected costs and not achieve anticipated cost savings from our relocation and consolidation plans. The scope and timing of the relocations and related charges and savings could disrupt our operations and impact our earnings and results of operations.
We are subject to various income tax risks and regulations throughout the world.
By conducting business in the United States and many other countries, we must continually interpret, and then comply with, the income tax rules and regulations in these countries. Different interpretations of income tax rules and regulations as applied to our facts by us and applicable tax authorities throughout the world could result, either historically or prospectively, in adverse impacts to our worldwide effective income tax rates and income tax liabilities. Other factors that could impact our worldwide effective tax rates and income tax liabilities are:
| • | Amount of taxable income in the various countries in which we conduct business |
| • | Tax rates in those countries |
| • | Income tax treaties between countries |
| • | Extent to which income is repatriated between countries |
| • | Future changes in income tax rules and regulations |
| • | Adoption of new types of taxes such as consumption, sales and value added taxes |
Our investment in marketable securities is significant and is subject to market, interest rate and credit risk that may reduce its value.
Within the pension plan assets, we maintain a significant portfolio of marketable securities as well as other assets subject to market fluctuations. Our earnings and stockholder’s equity could be adversely affected by changes in the value of this portfolio. In particular, the value of our investments may be adversely affected by general economic conditions, changes in interest rates, downgrades in the corporate bonds included in the portfolio and other factors. Each of these events may cause us to reduce the carrying value of our investment portfolio and may result in higher pension expense or our pension plans being further under-funded.
| BEC 2009 FORM 10-K | 19 |
Table of Contents
Acquisitions and divestitures pose financial and other risks and challenges.
We routinely explore acquiring other businesses and assets that would fit strategically. From time to time, we also may consider disposing of certain assets, subsidiaries or lines of business that are less of a strategic fit within our portfolio. Potential acquisitions or divestitures present financial, managerial and operational challenges, including diversion of management attention, difficulty with integrating or separating personnel and financial and other systems, increased expenses, assumption of unknown liabilities, indemnities and potential disputes with the buyers or sellers. There can be no assurance that we will engage in any acquisitions or divestitures or that we will be able to do so on terms that will result in any expected benefits. Acquisitions financed with borrowings could put financial stress on our earnings resulting in materially higher interest rates.
The Olympus acquisition involves the integration of Olympus with our existing Clinical Diagnostics business. The integration of the two businesses that have previously operated separately is a costly and time-consuming process that involves a number of risks including:
| • | Difficulties in assimilating different corporate cultures, practices and sales and distribution methodologies, as well as in assimilating and retaining geographically dispersed operations and personnel |
| • | Reliance on Olympus Corporation to provide certain transitional services, such as ongoing financial information and other data or support needed to successfully operate the Olympus business until we have completed the integration for these services |
| • | Larger foreign operations and increased exposure to risks relating to business operations outside the United States |
| • | Difficulties and unanticipated expenses related to integrating facilities, departments, systems, including accounting systems, computer and other technologies, books and records and procedures, as well as maintaining uniform standards, including internal accounting controls, procedures and policies |
| • | Difficulties in implementing anticipated infrastructure changes, which could offset any such savings and other synergies resulting from the Olympus acquisition |
| • | Costs and expenses associated with any undisclosed or potential liabilities |
| • | Use of cash resources and increased capital expenditures on integration and implementation activities in excess of our current expectations, which could offset any such savings and other synergies resulting from the Olympus acquisition |
Even if we successfully integrate the Olympus operations, we may be unable to realize our anticipated cost savings, synergies and growth from the integration in our expected time frame and the costs of achieving these benefits may be higher than expected.
The Olympus operations are subject to their own risks, which we may not be able to manage successfully. There may be additional risks resulting from the Olympus acquisition that are not presently known to us which could adversely affect us.
The results of Olympus operations are subject to many of the same risks that affect our financial condition and results of operations and, more specifically, those of our Clinical Diagnostics business. Any discovery of adverse information concerning Olympus after the closing of the acquisition could be material and, in many cases, we would have limited rights of recovery. The indemnification provided in the master purchase agreement may be insufficient to protect or compensate us for all losses resulting from the acquisition or Olympus’ prior operations. For example, under the terms of the master purchase agreement, indemnification is limited to certain subject matters and the maximum aggregate amount of such losses for which Olympus Corporation will indemnify us is, subject to certain exceptions, limited to 12.5% of the purchase price of Olympus. A material loss associated with the Olympus acquisition for which there is not adequate indemnification could negatively affect our results of operations, financial condition and industry reputation and reduce the anticipated benefits of the acquisition.
Item 1B. Unresolved Staff Comments.
None.
We conduct a variety of operations at approximately 15 owned and 121 leased facilities worldwide, including administration, R&D, hardware and consumables manufacturing, warehouse and distribution, marketing, sales, and service. Beckman Coulter’s facilities often serve both our Clinical Diagnostics and Life Science segments.
| 20 | BEC 2009 FORM 10-K |
Table of Contents
Our corporate headquarters and principal business centers are located at the following facilities:
| • | Brea, California – Corporate headquarters, Clinical Diagnostics chemistry and clinical automation business center and Life Science business center |
| • | Miami, Florida – Clinical Diagnostics cellular business center |
| • | Indianapolis, Indiana – Life Science |
| • | Chaska, Minnesota – Clinical Diagnostics immunoassay and molecular diagnostics business center |
During 2009, we vacated most of our Fullerton, California facility, which we own, and consolidated these operations to other existing facilities. We expect to complete the remaining moves of products and functions in the first quarter of 2010. We refer to this as our Orange County consolidation project. The Brea, California, Miami, Florida and Chaska, Minnesota facilities (as well as a facility in Palo Alto, California that we no longer utilize) previously owned by us were sold and leased in 1998 for initial terms of 20 years with options to renew for up to an additional 30 years.
We designed and renovated our new Brea, California worldwide headquarters using strategies to improve its environmental impact and meet “green” building and performance measures. The U.S. Green Building Certification Institute awarded our Brea, California facility the LEED (Leadership in Energy and Environmental Design) Gold certification for its building sustainability.
We conduct a number of operations outside of the United States, which are principally administrative, manufacturing, and warehouse or distribution facilities and include locations in China, Czech Republic, France, Germany, Ireland, Japan and Switzerland.
We believe our production facilities meet applicable government environmental, health and safety regulations in all material respects and industry standards for maintenance and that our facilities in general are adequate for our current business.
Certain of our legal proceedings in which we are involved are discussed in Note 17 “Commitments and Contingencies” of the Notes to Consolidated Financial Statements in Item 8 of this Form 10-K and are incorporated by reference.
Item 4. Submission of Matters to a Vote of Security Holders.
No matters were submitted to a vote of our stockholders during the fourth quarter of 2009.
| BEC 2009 FORM 10-K | 21 |
Table of Contents
Item 5. Market for Registrant’s Common Equity, Related Stockholder Matters and Issuer Purchases of Equity Securities
The principal market on which our common stock is traded is the New York Stock Exchange. As of February 5, 2010 there were approximately 4,321 holders of record of our common stock.
Following are the high and low sales price of our common stock on the New York Stock Exchange – Composite Transactions reporting system during each quarter of our fiscal years ended December 31, 2009 and 2008:
| 2009 | 2008 | |||||||||||
| Fiscal Quarters |
High | Low | High | Low | ||||||||
| First |
$ | 51.81 | $ | 40.60 | $ | 74.35 | $ | 63.13 | ||||
| Second |
57.36 | 50.00 | 71.23 | 61.98 | ||||||||
| Third |
71.20 | 54.27 | 76.66 | 67.61 | ||||||||
| Fourth |
69.54 | 64.06 | 70.74 | 37.24 | ||||||||
The declaration and payment of dividends is at the sole discretion of our Board of Directors. In 2009, we paid three quarterly dividends of $0.17 per share and one quarterly dividend of $0.18, for a total of $0.69 per share of common stock for the year. During 2008, we paid four quarterly dividends of $0.17 per share, for a total of $0.68 per share of common stock for the year.
ISSUER PURCHASES OF EQUITY SECURITIES
| Period |
Total Number of Shares Purchased |
Average Price Paid per Share |
Total Number of Shares Purchased as Part of Publicly Announced Plans or programs |
Maximum Number of Shares that May Yet Be Purchased Under the Plans or Programs | ||||
| October 1 through 31, 2009 |
2,417 | $68.27 | — | 1,168.262 | ||||
| November 1 through 30, 2009 |
22,470 | 67.15 | — | 1,168.262 | ||||
| December 1 through 31, 2009 |
— | — | — | 1,168.262 | ||||
| Total |
24,887 | $67.26 | — | 1,168.262 | ||||
18,876 of the shares above were repurchased as part of our Benefit Equity Trust (“the Trust”) using proceeds from the dividends paid on shares already held in the Trust. The transfer of the shares to the Trust and the issuance of shares from the Trust was authorized by our Board of Directors in October 2004. The Trust was established to pre-fund stock-related obligations of employee benefit plans.
The remaining 6,011 of the shares repurchased are attributable to shares surrendered to us by employees in payment of tax obligations related to the vesting of restricted stock.
| 22 | BEC 2009 FORM 10-K |
Table of Contents
Performance Graph
The following graph compares our cumulative total stockholder return since December 30, 2004 with the Major Index, Industry Index and Peer Group Index composed of other companies with similar business models (Peer Group graph assumes that the value of the investment in our common stock and each index including reinvestment of dividends was $100.0 on December 30, 2004.)
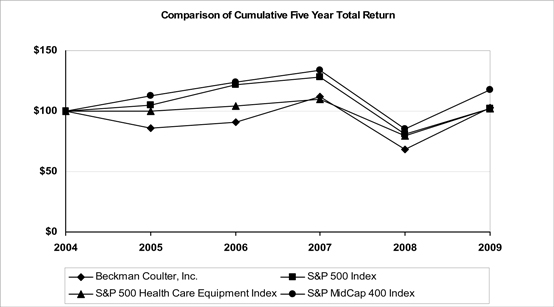
Total Return To Shareholders
(Includes reinvestment of dividends)
| ANNUAL RETURN PERCENTAGE Years Ended December 31, | ||||||||||||||
| Company / Index |
2005 | 2006 | 2007 | 2008 | 2009 | |||||||||
| Beckman Coulter, Inc. |
(14.27 | ) | 6.24 | 22.89 | (38.99 | ) | 50.76 | |||||||
| S&P 500 Index |
4.91 | 15.79 | 5.49 | (37.00 | ) | 26.46 | ||||||||
| S&P 500 Health Care Equipment Index |
0.05 | 4.12 | 5.13 | (27.64 | ) | 28.79 | ||||||||
| S&P MidCap 400 Index |
12.56 | 10.32 | 7.98 | (36.23 | ) | 37.38 | ||||||||
| Company / Index |
Base Period 2004 |
INDEXED RETURNS Years Ended December 31, | ||||||||||||
| 2005 | 2006 | 2007 | 2008 | 2009 | ||||||||||
| Beckman Coulter, Inc. |
100 | 85.73 | 91.08 | 111.93 | 68.29 | 102.95 | ||||||||
| S&P 500 Index |
100 | 104.91 | 121.48 | 128.16 | 80.74 | 102.11 | ||||||||
| S&P 500 Health Care Equipment Index |
100 | 100.05 | 104.18 | 109.52 | 79.25 | 102.06 | ||||||||
| S&P MidCap 400 Index |
100 | 112.56 | 124.17 | 134.08 | 85.50 | 117.46 | ||||||||
| BEC 2009 FORM 10-K | 23 |
Table of Contents
Item 6. Selected Financial Data
(In millions, except amounts per share)
As a result of the adoption of the Financial Accounting Standards Board (“FASB”) standard related to debt with conversions and other options, prior year amounts in the below table have been adjusted.
| Years Ended December 31, |
2009 | 2008 | 2007 | 2006 | 2005 | ||||||||||||||
| Operating Results |
|||||||||||||||||||
| Recurring revenue – supplies, service and lease payments |
$ | 2,645.2 | $ | 2,402.6 | $ | 2,178.4 | $ | 1,946.9 | $ | 1,739.9 | |||||||||
| Instrument sales |
$ | 615.4 | $ | 696.3 | $ | 582.9 | $ | 581.6 | $ | 703.9 | |||||||||
| Total revenue |
$ | 3,260.6 | $ | 3,098.9 | $ | 2,761.3 | $ | 2,528.5 | $ | 2,443.8 | |||||||||
| Cost of sales—recurring |
$ | 1,247.0 | $ | 1,095.7 | $ | 964.5 | $ | 848.9 | $ | 834.4 | |||||||||
| Cost of sales—instruments |
$ | 512.5 | $ | 575.2 | $ | 505.0 | $ | 484.2 | $ | 499.1 | |||||||||
| Selling, general & administrative expenses |
$ | 811.6 | $ | 793.4 | $ | 706.9 | $ | 668.2 | $ | 635.3 | |||||||||
| Research and development |
$ | 266.4 | $ | 280.1 | $ | 274.0 | $ | 264.9 | $ | 208.9 | |||||||||
| Amortization of intangible assets |
$ | 39.6 | $ | 29.6 | $ | 24.2 | $ | 19.4 | $ | 17.0 | |||||||||
| Operating income |
$ | 231.2 | $ | 284.5 | $ | 269.0 | $ | 261.3 | $ | 188.8 | |||||||||
| Earnings from continuing operations |
$ | 147.1 | $ | 186.0 | $ | 202.1 | $ | 157.9 | $ | 150.6 | |||||||||
| Net earnings |
$ | 147.1 | $ | 186.0 | $ | 203.7 | $ | 186.6 | $ | 150.6 | |||||||||
| Basic earnings per share from continuing operations |
$ | 2.22 | $ | 2.95 | $ | 3.23 | $ | 2.52 | $ | 2.42 | |||||||||
| Basic earnings per share |
$ | 2.22 | $ | 2.95 | $ | 3.26 | $ | 2.98 | $ | 2.42 | |||||||||
| Diluted earnings per share from continuing operations |
$ | 2.18 | $ | 2.89 | $ | 3.15 | $ | 2.47 | $ | 2.32 | |||||||||
| Diluted earnings per share |
$ | 2.18 | $ | 2.89 | $ | 3.18 | $ | 2.92 | $ | 2.32 | |||||||||
| Weighted average common shares and dilutive potential common shares |
67.4 | 64.3 | 64.1 | 64.0 | 64.9 | ||||||||||||||
| Balance Sheet |
|||||||||||||||||||
| Total assets |
$ | 4,677.1 | $ | 3,541.8 | $ | 3,594.3 | $ | 3,291.7 | $ | 3,027.6 | |||||||||
| Working capital |
$ | 1,062.6 | $ | 817.1 | $ | 690.9 | $ | 626.5 | $ | 475.1 | |||||||||
| Long-term debt, less current maturities |
$ | 1,305.9 | $ | 819.0 | $ | 798.0 | $ | 848.9 | $ | 589.1 | |||||||||
| Stockholders’ equity |
$ | 1,961.2 | $ | 1,482.3 | $ | 1,537.4 | $ | 1,257.6 | $ | 1,194.8 | |||||||||
| Shares outstanding |
69.6 | 63.0 | 62.5 | 61.0 | 62.4 | ||||||||||||||
| Dividends declared per share of common stock |
$ | 0.69 | $ | 0.68 | $ | 0.64 | $ | 0.60 | $ | 0.56 | |||||||||
| Earnings from continuing operations include the following items which we consider to be significant to understand our results:
| |||||||||||||||||||
| Years Ended December 31, |
2009 | 2008 | 2007 | 2006 | 2005 | ||||||||||||||
| Fair value adjustment for acquired inventory |
$ | 22.1 | $ | 1.0 | $ | — | $ | — | $ | — | |||||||||
| Inventory write-offs associated with discontinued product lines |
$ | 1.6 | $ | — | $ | — | $ | — | $ | 2.3 | |||||||||
| In-process research and development charges |
$ | — | $ | — | $ | 35.4 | $ | — | $ | — | |||||||||
| Amortization of intangible assets acquired from Olympus |
$ | 9.6 | $ | — | $ | — | $ | — | $ | — | |||||||||
| Restructure and acquisition related charges |
$ | 152.3 | $ | 21.4 | $ | 17.7 | $ | 15.5 | $ | 60.4 | |||||||||
| Environmental remediation charge |
$ | — | $ | 19.0 | $ | — | $ | — | $ | — | |||||||||
| Charges for licensing rights for products under development |
$ | 5.8 | $ | 23.7 | $ | — | $ | 46.4 | $ | — | |||||||||
| Litigation accruals / (settlements) |
$ | 3.9 | $ | — | $ | 2.4 | $ | (35.0 | ) | $ | — | ||||||||
| Other miscellaneous operating charges |
$ | — | $ | — | $ | — | $ | 14.6 | $ | 11.9 | |||||||||
| Break up gain associated with termination of Biosite agreement |
$ | — | $ | — | $ | (40.6 | ) | $ | — | $ | — | ||||||||
| Unusual non-operating (gains) and losses |
$ | (21.1 | ) | $ | (1.2 | ) | $ | (17.2 | ) | $ | — | $ | — | ||||||
The above items included in earnings from continuing operations, which we consider to be significant to understand our results, are not allocated to our segments for performance assessment by our chief operating decision maker.
| 24 | BEC 2009 FORM 10-K |
Table of Contents
2009 non-operating (gains) losses includes foreign currency gains of $26.7 million pretax in connection with the Olympus acquisition net of interest expense of $5.6 million pretax associated with the debt offering entered into to partially fund the Olympus acquisition two months before completing the Olympus acquisition.
2009 also includes share-based compensation charges of $22.2 million ($35.8 million pretax) recognized in accordance with the accounting standard for share-based compensation adopted in 2006.
2008 includes a non-operating gain of $1.2 million pretax of land from the escrow account that was in dispute in relation to the sale of vacant land in Miami.
2008 also includes share-based compensation charges of $18.4 million ($29.6 million pretax) recognized in accordance with the accounting standard for share-based compensation adopted in 2006.
2007 unusual non-operating (gains) losses includes gain on sale of vacant land in Miami of $26.2 million and $9.0 million charge for the establishment of the Beckman Coulter Foundation.
2007 includes share-based compensation charges of $15.2 million ($24.5 million pretax) recognized in accordance with the accounting standard for share-based compensation adopted in 2006.
2006 includes other miscellaneous operating charges for the year of $4.0 million of pretax curtailment charges, $2.9 million pretax for investigation charges, and $7.7 million pre-tax for debt extinguishment charges.
2006 also includes incremental share-based compensation charges of $14.3 million ($23.0 million pretax) as a result of the implementation of the accounting standard for share-based compensation adopted in 2006 on a modified prospective basis.
2005 includes other miscellaneous operating charges for the year of $4.9 million pre-tax due to Hurricane Katrina, $5.3 million officer retirement charges, and $1.7 million pretax business development charge.
Item 7. Management’s Discussion and Analysis of Financial Condition and Results of Operation
The following discussion should be read in conjunction with the description of our Business in Item 1 of this Form 10-K and our Consolidated Financial Statements and Notes to Consolidated Financial Statements included in Item 8 of this Form 10-K. Management’s Discussion and Analysis of Financial Condition and Results of Operations or MD&A is designed to provide a reader of our financial statements with management’s perspective on our financial condition, results of operations, liquidity and certain other factors that may affect our future results.
Overview
We create value for customers and shareholders by understanding the process and impact of clinical testing and applying our skills and experience to simplify, automate and innovate complex laboratory processes. We believe we can thereby improve patient health and reduce the cost of care.
Following is a summary of key 2009 financial and nonfinancial information:
| • | We completed the Olympus acquisition for approximately $800 million effective August 3; |
| • | We issued $240 million in common stock and $500 million in debt to finance the Olympus acquisition ; |
| • | Recurring revenue of $2,645.2 million , increased by $242.6 million, of which $158.5 million resulted from the acquired Olympus products. Excluding the Olympus products, we experienced growth in recurring revenue of 6.5% in constant currency; |
| • | Instrument sales of $615.4 million declined by $80.9 million from unusually strong instrument sales in 2008, despite adding $26.8 million of instrument sales related to Olympus products; |
| • | Reported operating income of $231.2 million declined by $53.3 million largely as a result of restructuring and acquisition related costs of $152.3 million in 2009, due primarily to $105.7 million incurred for the Olympus acquisition and $46.6 million for other initiatives; |
| • | Effective control of operating expenses combined with growth in revenue were more than offset by the increase in restructuring and acquisition related costs, resulting in reported net earnings per diluted share of $2.18 compared to $2.89 per share in 2008. |
| BEC 2009 FORM 10-K | 25 |
Table of Contents
| • | 2009 capital expenditures of $163.4 million for property, plant and equipment and $167.1 million for OTL instruments; |
| • | We had $288.8 million of cash on hand and |
| • | Our debt-to-capital ratio was 34.3% at December 31, 2009. |
Recurring revenue, which we believe is the best indicator of our business’ overall strength, grew 3.5% (6.5% in constant currency), excluding the effect of the Olympus acquisition. The increase in recurring revenue was generated primarily from our Clinical Diagnostics products, driven in part by Access Immunoassay which grew 10.5% in constant currency. In addition to the incremental revenue resulting from the Olympus business, our acquisition of Cogenics contributed about 60 basis points of recurring revenue growth. Excluding revenue from the Olympus acquisition, instrument sales declined in all product areas when compared to the prior year due primarily to weakness in the U.S. market and in Emerging Markets.
We expect our steady gains in recurring revenue, which represents nearly 82% of our total revenue, to provide a predictable source of earnings expansion and cash flow. Historically, recurring revenue allowed us to generate substantial operating cash flows, which we used to facilitate growth in our business by developing, marketing and launching new products through internal development and business and technology acquisitions. Our OTLs require additional investment and increased capital expenditures. Our investment in customer leased instruments and our operating cash flow should continue to build more moderately since we have almost completed the five-year transition to our OTL model.
Operating income declined as a result of the increase in restructuring and acquisition related costs in 2009, due primarily to the Olympus acquisition. We also incurred $42.1 million in restructuring costs related to the Orange County consolidation and other 2009 restructuring initiatives, compared to $21.4 million incurred in 2008 for site consolidation and other initiatives. Operating income, excluding restructuring and acquisition related charges and the 2008 environmental remediation charge, increased as a result of increased recurring revenue and effective control over expenses.
Non-operating expense remained relatively flat during 2009 compared to 2008. However, during 2009, we incurred $19.6 million more in interest expense due to additional debt issued in connection with the Olympus acquisition, combined with lower interest income. This was offset by approximately $27 million in gains related to our hedging of the Olympus acquisition, which was paid in yen, and for settling intercompany loans associated with the transaction.
Our effective tax rate decreased to 20.2% from 22.0% during 2008, due primarily to certain discrete items including settlement of tax audits related to prior years, additional R&E tax credits which reduced tax expense, and a shift in the geographic mix, with more income earned outside the U.S. in lower-tax jurisdictions.
Supply Chain Initiatives and Olympus Diagnostic Systems Acquisition
As part of our previously announced strategic supply chain management initiatives to improve productivity and reduce operating costs, we closed and relocated certain manufacturing and distribution sites. Our plans to vacate our Fullerton, California facility and consolidate those operations to other existing facilities (Orange County consolidation project) were developed in 2008 and were substantially completed in 2009, with final moves expected to be completed in the first half of 2010. Ongoing efforts to consolidate operations and exit buildings allowed us to reduce our space requirements by approximately 973,000 square feet in 2009 and 100,000 square feet in 2008. We incurred $42.1 million in restructuring costs related to the Orange County consolidation and other 2009 restructuring initiatives, compared to $21.4 million incurred in 2008 for site consolidation and other initiatives. During 2009, our acquisition of Olympus resulted in additional restructuring costs as we combine operations for efficiency. In connection with these activities, we recorded charges of $88.3 million and $21.4 million for severance and other costs for 2009 and 2008, respectively.
Acquisition Related Costs
In connection with the Olympus acquisition, we incurred acquisition related and integration costs of $31.4 million and $28.1 million during 2009, respectively. A significant portion of these expenses were related to legal, consulting and investment banking fees.
On April 14, 2009, we entered into a stock purchase agreement with Clinical Data Inc. to acquire Cogenics, the genomics division of Clinical Data Inc. In connection with this acquisition, we incurred $4.4 million of acquisition related and integration costs during 2009.
| 26 | BEC 2009 FORM 10-K |
Table of Contents
Critical Accounting Policies and Estimates
Our Consolidated Financial Statements are prepared in accordance with U.S. generally accepted accounting principles or U.S. GAAP. To prepare our financial statements, we make assumptions and estimates about future events and apply judgments that affect the reported amounts of assets, liabilities, revenue, expenses and the related disclosures. We base our assumptions, estimates and judgments on historical experience, current trends and other factors that management considers relevant. Because future events and their effects cannot be determined with certainty, actual results could differ materially from our assumptions and estimates.
We describe our significant accounting policies in Note 1, “Nature of Business and Summary of Significant Accounting Policies” of the Notes to Consolidated Financial Statements in Item 8 of this Form 10-K. Management believes that the following accounting estimates are important to fully understanding and evaluating our reported financial results, and they require management’s subjective or complex judgments, resulting from the need to make estimates about the effect of matters that are inherently uncertain. Management has reviewed these critical accounting estimates and related disclosures with the Audit & Finance Committee of our Board of Directors.
Revenue Recognition
Revenue is recognized when persuasive evidence of an arrangement exists, the price to the buyer is fixed or determinable, when collectability is reasonably assured and when risk of loss transfers. For instrument sales that include customer specific acceptance criteria, revenue is recognized when the acceptance criteria have been met. When a customer enters into an OTL agreement, lease revenue is recognized on a straight-line basis over the life of the lease, while the cost of the leased equipment is carried in customer leased instruments within property, plant and equipment and depreciated over its estimated useful life. Under an STL agreement, hardware sales revenue and related costs are generally recognized at the time of shipment based on the present value of the minimum lease payments with interest income recognized over the life of the lease using the effective interest method. Supplies and test kit revenue is generally recognized at the time of delivery or usage. Service revenue on maintenance contracts is recognized ratably over the life of the service agreement or as service is performed, if not under contract.
For those STL and sale agreements that include multiple deliverables, such as installation, training, after-market supplies or service, we allocate revenue based on the relative fair values of the individual components. The fair market value of our leased instruments is determined by a range of cash selling prices or other verifiable objective evidence, if applicable. We regularly evaluate available objective evidence of instrument fair values using historical data. Our allocation of revenue for future sales could be affected by changes in estimates of the relative fair value of the various deliverables which could affect the timing of our revenue recognition or allocation to the various components.
Our accounting for leases involves specific determinations under the accounting standard for leases, as amended, which often involves complex provisions and significant judgments. Before classifying a lease as an STL, among other things, we assess whether collectability of the lease payment is reasonably assured and whether there are any significant uncertainties related to costs that we have yet to incur with respect to the lease. Generally, our leases that qualify as STLs are non-cancelable leases with a term of 75 percent or more of the economic life of the equipment. In 2005, we changed our standard leasing terms around cancellation provisions to emphasize terms which meet the criteria for OTL classification. As a result, nearly all of our lease arrangements are OTLs. Certain of our lease contracts are customized for larger customers and often result in complex terms and conditions that typically require significant judgment in applying the lease accounting criteria.
Business Combinations
We allocate the purchase price of acquired companies to the tangible assets acquired, liabilities assumed and intangible assets acquired, including in-process research and development or IPR&D, based on their estimated fair values. The excess of the purchase price over these fair values is recorded as goodwill. We engage independent third-party appraisal firms to assist us in determining the fair values of assets acquired and liabilities assumed. Such valuations require management to make significant estimates and assumptions, especially with respect to intangible assets. The significant purchased intangible assets recorded by us include customer and dealer relationships, developed and core technology and trade names. The fair values assigned to the identified intangible assets are discussed in detail in Note 3 “Acquisitions” of the Notes to the Consolidated Financial Statements in Item 8.
Critical estimates in valuing certain intangible assets for business combinations include:
| • | Future expected cash flows from customer contracts, customer lists, distribution agreements and acquired developed technologies and patents |
| BEC 2009 FORM 10-K | 27 |
Table of Contents
| • | Expected costs to develop IPR&D into commercially viable products and estimating cash flows from projects when completed |
| • | The Coulter brand recognition and market position, as well as assumptions about the period of time the brand will continue to be used in our product portfolio |
| • | Risk adjusted discount rate |
Management’s estimates of fair value are based upon assumptions believed to be reasonable, but which are inherently uncertain and unpredictable and, as a result, actual results may differ from estimates.
Other estimates associated with the accounting for acquisitions may change as additional information becomes available regarding the assets acquired and liabilities assumed, as more fully discussed in Note 3 “Acquisitions” of the Notes to the Consolidated Financial Statements in Item 8.
Allowances for Doubtful Accounts
We maintain allowances for doubtful accounts for estimated losses resulting from the inability of our customers to make required payments. These allowances are determined by analyzing specific customer accounts that have known or potential collection issues and applying an estimated loss rate to the aging of the remaining accounts receivable balances. This estimated loss rate is based on our historical loss experience but also contemplates current market conditions. If the financial condition of our customers were to deteriorate, resulting in an impairment of their ability to make payments, additional allowances may be required.
Inventories
Inventories, which include material, labor and manufacturing overhead, are valued at the lower of cost or market using the first-in, first-out or FIFO method of determining inventory cost. Inventory schedules are analyzed quarterly by finance and logistics personnel, and where necessary, provisions for excess and obsolete inventory are recorded based primarily on our estimated forecast of product demand and production requirements. A significant decrease in forecasted demand could result in an increase in the amount of excess inventory quantities on hand requiring additional inventory reserves or write-downs and increased cost of sales.
Customer Leased Instruments
The economic life of our leased instruments requires significant accounting estimates and judgment. These estimates are based on our historical experience. The most objective measure of the economic life of our leased instrument is the original term of a lease, which is typically five or seven years, since historically a majority of the instruments are returned by the lessee at or near the end of the lease term and there is not a significant after-market for our used instruments without substantial remanufacturing. The economic life of products acquired in connection with the Olympus acquisition is estimated to be seven years based upon the instruments’ historical experience in the field. We believe these lives represent the periods during which the instruments are expected to be economically usable, with normal service, for the purposes for which they are intended. We evaluate regularly the economic life of existing and new products for purposes of this determination.
Valuation of Other Long-Lived Assets
The process of evaluating the potential impairment of other long-lived assets, such as our property, plant and equipment, including software for internal use, is subjective and requires judgment. We review long-lived assets for impairment when events or changes in circumstances indicate the carrying value of an asset may not be recoverable. If the fair value is less than the asset’s carrying amount, we recognize a loss for the difference. To estimate the fair value of long-lived assets, we typically make various assumptions about the asset’s usefulness and consider market factors specific to the business in which the asset is used and estimate future cash flows to be generated by that business. Based on these assumptions and estimates, we determine whether we need an impairment charge to reduce the value of the asset stated on our balance sheet to reflect its estimated fair value. Assumptions and estimates about future values and remaining useful lives are complex and often subjective. They can be affected by a variety of factors, including industry and economic trends, changes in our business strategy and our internal forecasts. Furthermore, we may determine that our assets have a shorter useful life than our current estimate, which would result in a higher depreciation and amortization expense. Although we believe our past assumptions and estimates have been reasonable and appropriate, changes in the assumptions and estimates could materially impact our future reported financial results.
| 28 | BEC 2009 FORM 10-K |
Table of Contents
Goodwill and Other Intangible Assets
We review goodwill and other intangible assets for impairment at least annually, or more frequently when events or changes in circumstances indicate the assets may be impaired. Goodwill is evaluated for impairment at the reporting unit level that is an operating segment or one level below an operating segment. For goodwill, we compare the carrying value to the fair value of the reporting unit to which the assets are assigned.
In September 2009, we reevaluated our core technology, which previously had an indefinite useful life. We considered current and expected technological changes evolving in the marketplace, including the potential of our competitors developing newer technologies, and determined that over time these factors could make our core technology less valuable for our related products. Thus, we deemed it appropriate to assign an estimated 20 year useful life to the technology. Our core technology assets are not impaired. The incremental annual amortization resulting from this change is approximately $2.3 million.
Our future operating performance will be impacted by the future amortization of intangible assets with finite lives and potential impairment charges related to goodwill or intangibles with indefinite lives. As a result of business acquisitions, the allocation of the purchase price of the acquired companies to goodwill and intangible assets requires us to make significant estimates and assumptions, including estimates of future cash flows expected to be generated by the acquired assets and the appropriate discount rate for these cash flows. If conditions differ from management’s estimate at the time of acquisition, material write-downs of intangible assets or goodwill may be required, which could adversely affect our operating results. We assess impairment annually during the fourth quarter of our fiscal year. See Note 7 “Goodwill and Other Intangible Assets” of the Notes to Consolidated Financial Statements for further discussion.
Environmental Obligations
Compliance with federal, state and foreign environmental laws and regulations may require us to remove or mitigate the effects of the disposal or release of chemical substances in jurisdictions where we do business or maintain properties. We establish accruals when such costs are probable and can be reasonably estimated, estimating. accrual amounts based on currently available information, regulatory requirements, remediation strategies, historical experience, our relative share of the total remediation costs and a relevant discount rate, when the time period of estimated costs can be reasonably predicted. Changes in these assumptions could impact our future reported results.
Income Taxes
We record liabilities for potential income tax assessments based on our estimate of potential tax related exposures. These estimates require significant judgment as uncertainties often exist in interpretations of new laws, new interpretations of existing laws and rulings by multiple taxing authorities. Differences between actual results and our assumptions, or changes in our assumptions in future periods, are recorded in the period they become known. Changes in our estimates could have a material effect on our effective income tax rate in the period.
Deferred income taxes are recognized for the tax consequences of temporary differences by applying enacted statutory tax rates applicable to future years to the difference between the financial statement carrying amounts and the tax bases of existing assets and liabilities and for tax credit carryforwards. The effect on deferred taxes of a change in tax rates is recognized in income in the period that includes the enactment date.
We establish a valuation allowance to reduce deferred tax assets to an amount whose realization is more likely than not. An increase or decrease to net earnings may occur if we were to determine that we were able to utilize more or less of these deferred tax assets than currently expected.
In the fourth quarter of 2008 the U.S. Congress enacted legislation extending the Research & Experimentation(“R&E”) tax credit for the 2008 and 2009 tax years. As a result, we recorded an estimated 2008 R&E credit of $8.9 million in the fourth quarter of 2008. The 2008 financial statements include the benefit for the 2008 and 2007 R&E tax credit. In prior years, due to the difficulty in estimating the R&E credit on a current basis, we used a method to record the R&E tax credit for financial reporting purposes that resulted in recognizing the benefit in the year subsequent to the credit utilization on its tax return. The prior method used to record the R&E tax credit did not have a material impact on any of the financial statements presented.
| BEC 2009 FORM 10-K | 29 |
Table of Contents
Pension and Postretirement Benefit Plans
We sponsor pension plans in various forms, and a postretirement medical benefit plan which covers U.S. employees and retirees who met certain eligibility criteria at the end of 2002. The obligations under these plans are recognized in the Consolidated Financial Statements based upon a number of factors which are used to determine the expense, liabilities and asset values related to the plans. Two of the critical assumptions are the expected long-term rate of return on plan assets and the discount rate. Other important assumptions include expected future salary increases, retirement dates, employee turnover, mortality rates and the health care cost trend rate. We review these assumptions annually.
The expected long-term rate of return on plan assets is estimated based upon historical cumulative returns on plan assets, the investment strategy, plan asset allocation and expected returns. While there is no absolute predictor of future performance, our historical return on plan assets has been over 8%. We believe our expected long-term rate of return assumption, which is used to calculate pension expense, of 8.25% in 2009, 8.5% in 2008 and 9% in 2007, is reasonable based on our investment strategy and our long-term investment return experience. We froze entrance to the pension plan effective December 31, 2006 and changed the investment allocation in December 2007 in an effort to reduce the volatility of changes in the fair value of plan assets. Although the value of our U.S. pension plan assets has increased in 2009 as compared to 2008, our U.S. pension plan is underfunded at December 31, 2009 as a result of the decline in the credit and equity markets.
The discount rate is an assumption used to determine the actuarial present value of benefits attributed to the services rendered by participants in our pension plans. The rate used reflects our best estimate of the rate at which pension benefits will be effectively settled considering the timing of expected payments to plan participants. The discount rates are developed based on benchmarking indexes. The benchmarking indexes are obtained by using high-quality long-term corporate bond yields currently available with terms similar to the expected timing of payments to be made under our pension obligation. The discount rate used to determine the benefit obligation for the U.S. Pension Plan and postretirement plans was selected by us, in consultation with independent actuaries, using an average of pension discount yield curves based on the characteristics of the U.S. Plan and postretirement liabilities, each determined independently. The weighted average discount rate we utilized to measure our U.S. pension obligation as of December 31, 2009 and to calculate our 2010 expense was 5.78% in comparison to 6.33% used in determining our 2009 expense. For all other non-U.S. pension plans, we set the assumed discount rates based on the nature of liabilities, local economic environments and available bond indices or a third party yield curve.
Changes in the expected long term rate of return on assets (“ELTRA”) or discount rate could have a material effect on our reported pension obligation and related pension expense. The following table illustrates the sensitivity to a change to certain key assumptions used in the calculation of expense for the year ended December 31, 2009 and the projected benefit obligation (PBO) at December 31, 2009 for our major U.S. and non-U.S. defined benefit pension plans (in millions):
| Impact on 2009 Pre-Tax Pension Expense Increase (Decrease) |
Impact on PBO December 31, 2009 Increase (Decrease) |
|||||||||||||||
| Change in assumption: |
U.S. | Non- U.S. | U.S. | Non-U.S. | ||||||||||||
| 25 basis point decrease in discount rate |
$ | 1.3 | $ | 1.0 | $ | 17.8 | $ | 11.7 | ||||||||
| 25 basis point increase in discount rate |
$ | (1.3 | ) | $ | (0.9 | ) | $ | (17.8 | ) | $ | (10.9 | ) | ||||
| 25 basis point decrease in ELTRA |
$ | 1.5 | $ | 0.5 | NA | NA | ||||||||||
| 25 basis point increase in ELTRA |
$ | (1.5 | ) | $ | (0.5 | ) | NA | NA | ||||||||
Our funding policy provides that payments to our domestic pension trusts will at least be equal to the minimum funding requirements provided for by the Employee Retirement Income Security Act of 1974.
Share-Based Compensation
We measure and recognize compensation expense for all share-based payment awards made to employees and directors. Share-based payments include stock options, employee stock purchases under the Employee Stock Purchase Plan, restricted stock and performance shares. Share-based compensation expense is based on the value of share-based payment awards that is ultimately expected to vest. We have elected to use the Black-Scholes-Merton option-pricing model which incorporates various assumptions, including volatility, expected life and interest rates to estimate the fair value of stock options. The expected life is based on the observed and expected time to post-vesting exercise and forfeitures of stock options by our employees. We use a combination of historical and implied volatility, or blended volatility, in deriving the expected volatility assumption. The risk-free interest rate assumption is based upon observed interest rates appropriate for the term of our stock options. The dividend yield assumption is based on our history and expectation of dividend payouts. Forfeitures were estimated based on our historical experience. We evaluate and adjust our assumptions on an annual basis. If factors change and we employ different assumptions in the application of the accounting guidance for share based compensation in future periods, the compensation expense that we record may differ significantly from what we have recorded in the current period.
| 30 | BEC 2009 FORM 10-K |
Table of Contents
Change in Presentation
We have a hedging program to reduce the risk of foreign currency changes on cash flows generated from intercompany inventory purchases. In the first quarter of 2009, our results of operations were impacted more significantly by currency changes, a portion of which was offset by the results of our hedging program. To reflect this net currency impact on our operating results, we have reclassified our gains and losses related to cash flow hedging activities and foreign currency transactions to cost of sales from non-operating income or expense for all periods presented. The amounts reclassified for the prior periods were not material.
Results of Operations
Management reviews revenue by segment, product area, markets we serve and major geographic area. To facilitate our understanding of results, we review revenue on both a reported and constant currency basis. We define constant currency revenue as current period revenue in local currency translated to U.S. dollars at the prior year’s foreign currency exchange rate for that period, computed monthly. Constant currency growth is defined as current period constant currency revenue less prior year reported revenue divided by prior year reported revenue. This measure provides information on revenue growth assuming that foreign currency exchange rates have not changed between the prior year and the current period. We believe the use of this measure aids in the understanding of our operations without the impact of foreign currency fluctuations. This presentation is also consistent with our internal use of the measure, which we use to measure the profitability of ongoing operating results against prior periods and against our internally developed targets. Constant currency revenue and constant currency growth as defined or presented by us may not be comparable to similarly titled measures reported by other companies. Additionally, these measures are not U.S. GAAP defined measures, and therefore not an alternative measure of revenue or revenue growth on a U.S. GAAP basis.
| BEC 2009 FORM 10-K | 31 |
Table of Contents
The following represents a breakout of our 2009 revenue by type, segment and geography:
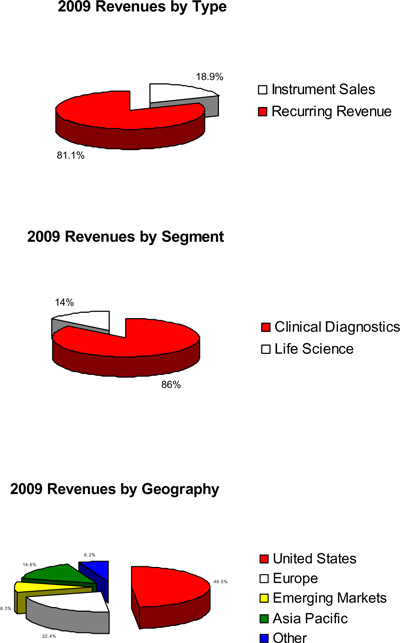
Note: Emerging Markets includes Eastern Europe, Russia, Middle East, Africa and India.
| 32 | BEC 2009 FORM 10-K |
Table of Contents
Revenue
The following table provides revenue by type, segment and geography for 2009, 2008 and 2007 (dollar amounts in millions):
| 2009 Revenue* |
2008 Revenue* |
2007 Revenue* |
2009 to 2008 Reported Growth % * |
2009 to 2008 Constant Currency Growth % * (a) |
2008 to 2007 Reported Growth % * |
2008 to 2007 Constant Currency Growth % * (a) | |||||||||||
| Total revenue: | |||||||||||||||||
| Recurring revenue – supplies, service and lease payments |
$ | 2,645.2 | $ | 2,402.6 | $ | 2,178.4 | 10.1% | 12.9% | 10.3% | 8.3% | |||||||
| Instrument sales |
615.4 | 696.3 | 582.9 | (11.6)% | (11.3)% | 19.5% | 18.2% | ||||||||||
| Total revenue |
$ | 3,260.6 | $ | 3,098.9 | $ | 2,761.3 | 5.2% | 7.5% | 12.2% | 10.4% | |||||||
| Segment revenue: | |||||||||||||||||
| Clinical Diagnostics: |
|||||||||||||||||
| Chemistry and Clinical Automation |
$ | 1,055.1 | $ | 898.7 | $ | 815.3 | 17.4% | 19.7% | 10.2% | 8.4% | |||||||
| Cellular Analysis |
935.3 | 954.1 | 840.9 | (2.0)% | — | 13.5% | 11.7% | ||||||||||
| Immunoassay and Molecular Diagnostics |
798.3 | 739.1 | 627.2 | 8.0% | 11.2% | 17.9% | 15.7% | ||||||||||
| Total Clinical Diagnostics |
2,788.6 | 2,591.9 | 2,283.4 | 7.6% | 10.0% | 13.5% | 11.6% | ||||||||||
| Life Science |
472.0 | 507.0 | 477.9 | (6.9)% | (5.4)% | 6.1% | 4.3% | ||||||||||
| Total revenue |
$ | 3,260.6 | $ | 3,098.9 | $ | 2,761.3 | 5.2% | 7.5% | 12.2% | 10.4% | |||||||
| Revenue by geography: | |||||||||||||||||
| United States |
$ | 1,580.4 | $ | 1,542.1 | $ | 1,425.0 | 2.5% | 2.5% | 8.2% | 8.2% | |||||||
| Europe |
731.4 | 687.1 | 605.4 | 6.5% | 12.8% | 13.5% | 8.7% | ||||||||||
| Emerging Markets (b) |
270.2 | 278.3 | 224.1 | (2.9)% | 3.3% | 24.2% | 24.2% | ||||||||||
| Asia Pacific |
477.6 | 383.7 | 316.1 | 24.5% | 22.0% | 21.4% | 15.9% | ||||||||||
| Other (c) |
200.9 | 207.7 | 190.7 | (3.3)% | 6.1% | 8.9% | 6.2% | ||||||||||
| Total revenue |
$ | 3,260.6 | $ | 3,098.9 | $ | 2,761.3 | 5.2% | 7.5% | 12.2% | 10.4% | |||||||
| * | Amounts in table may not foot or recalculate due to rounding. |
Revenue for 2009 includes the following amounts related to our Olympus acquisition completed on August 3, 2009 (in millions):
| Total revenue: |
|||
| Recurring revenue – supplies, service and lease payments |
$ | 158.5 | |
| Instrument sales |
26.8 | ||
| Total revenue |
$ | 185.3 | |
| Segment revenue: |
|||
| Clinical Diagnostics: |
|||
| Chemistry and Clinical Automation |
$ | 180.1 | |
| Immunoassay and Molecular Diagnostics |
5.2 | ||
| Total revenue |
$ | 185.3 | |
| Revenue by geography: |
|||
| United States |
$ | 58.9 | |
| Europe |
67.9 | ||
| Emerging Markets (b) |
22.1 | ||
| Asia Pacific |
36.2 | ||
| Other (c) |
0.2 | ||
| Total revenue |
$ | 185.3 | |
Notes:
| (a) | Constant currency growth is not a U.S. GAAP defined measure of revenue growth. |
| (b) | Emerging Markets includes Eastern Europe, Russia, Middle East, Africa and India. |
| BEC 2009 FORM 10-K | 33 |
Table of Contents
| (c) | Other includes Canada and Latin America. |
Recurring revenue, the best indicator of the overall strength of our business, grew 10.1% (12.9% in constant currency) in 2009 in comparison to 2008, including growth of 6.6% due to the Olympus acquisition. Strong growth in consumable sales in immunoassay, continued growth in other product areas including the continued build up of lease payments and the acquisition of Cogenics in April 2009 contributed to the increase. Recurring revenue represented 81.1% of our total revenue during 2009.
In 2008 recurring revenue grew by 10.3% or 8.3% in constant currency compared to 2007, due to growth of consumable sales, particularly in Access Immunoassay, and continued build up of lease payments.
Year over year instrument sales revenue declined by 11.6% or 11.3% in constant currency during 2009 after growing by 19.5% or 18.2% in constant currency in 2008. The decline in 2009 was despite additional sales of $26.8 million from Olympus products. We believe the overall decline in 2009 cash instrument sales is due to a number of factors, including the continued difficult economic environment, the tightening of the credit markets, constrained hospital and research operating environment and the strengthening dollar in the first half of the year. As a result, sales were negatively impacted as customers remain cautious in their capital spending and in some cases have delayed purchases. We expect instrument sales in 2010 to be slightly higher than 2009 as the outlook for the economy in general has improved.
Clinical Diagnostics
Clinical Diagnostics revenue increased by 7.6% in 2009 compared to 2008, as a result of the acquisitions and organic growth in recurring revenue, offset by the decline in instrument sales. In constant currency, Clinical Diagnostics realized an increase in revenue of 10.0% for the year primarily driven by a 14.2% improvement in recurring revenue. The Olympus acquisition accounted for $158.5 million, or 7.2% of growth in recurring revenue during 2009. Continued robust growth in Access Immunoassay also contributed to the increase. Recurring revenue growth, excluding the effect of the Olympus acquisition, largely reflects an expanding installed base, particularly in China, and increased test kit utilization. The gains in recurring revenue, however, were partially offset by declines in instrument sales of 13.9% in constant currency, in comparison to the prior year. The decline in instrument sales was mainly due to cellular analysis products, which declined by more than 19% during 2009 as compared to unusually strong instrument sales during 2008, which benefited, in part, by increased sales as we recovered from a 2007 supply disruption.
During 2008 Clinical Diagnostics experienced double digit growth in all three product areas. This was due primarily to strong instrument sales combined with growth in recurring revenue. Instrument sales increased 31.0% or 29.8% in constant currency for 2008, while recurring revenue grew by 10.9% or 9.0% in constant currency. The growth in instrument sales was due to added sales from our flow cytometry acquisition in December 2007, elimination of our instrument backlog during the first half of the year, an increase in placements of chemistry and clinical automation systems, and our robust sales to emerging markets, where we continue to improve our penetration. The growth in recurring revenue largely reflects the combined effect of expanding our installed base and increasing test kit utilization. We also had higher than normal sales of BNP tests in 2008 as a distributor increased its inventory of BNP tests.
| 34 | BEC 2009 FORM 10-K |
Table of Contents
Chemistry and Clinical Automation. The Olympus acquisition contributed revenue of $180.1 million. Recurring revenue in constant currency from the existing business increased by 6.5% in 2009, however, cash instruments sales were down due to the constrained economic environment. We achieved a fifth consecutive record year of integrated chemistry system placements, growing our installed base in mid to large sized hospitals and experience strong demand internationally as our customers focus on the efficiency and cost savings that can be provided by increased automation.
In 2008, the increase in revenue was driven by continued success of the UniCel DxC autochemistry instruments, leading to a fourth straight record year of UniCel DxC instrument placements and growth in clinical automation of 25%. Autochemistry grew by more than 10% in comparison to 2007 due to accelerated work cell placements and double digit international growth.
Cellular Analysis. Revenue from cellular analysis decreased due primarily to a 19.3% constant currency decline in cash instrument sales for the year due in large part to significantly lower placement of instruments in Hematology. We believe Hematology sales were down due primarily to unusually high sales in 2008 and the effect of constrained capital spending due to the economic environment in 2009. Cash instrument sales were unusually high during 2008 as we resolved a 2007 backlog related to a supply chain disruption. In addition, the current constrained capital expenditure environment, including a stronger dollar in the first half of 2009, has had a negative impact on our cash instrument sales. Instrument sales in flow cytometry declined as a result of constrained funding in the research market. The decline in instrument sales, however, was partially offset by an increase in recurring revenue.
In 2008 revenue from cellular analysis increased due primarily to an increase in instrument sales of 35.2%. The increase was led by growth in flow cytometry products and the elimination of the instrument backlog in the first half of the year, as mentioned above. Our flow cytometry acquisition added 470 basis points to the overall cellular group’s growth rate.
Immunoassay and Molecular Diagnostics. Revenue in immunoassay and molecular diagnostics increased due to an increase in sales of consumable products, primarily Access Immunoassay. Recurring revenue grew by 9.0% and 12.3% in constant currency for 2009. Growth in placements of mid to ultra high volume Immunoassay systems in the prior year helped increase our penetration at the account level and fueled recurring revenue growth. Additionally, the acquisition of Cogenics in April 2009 and Olympus in August 2009 contributed $16.8 million and $5.2 million to revenue during the year, respectively.
In 2008, revenue in immunoassay and molecular diagnostics increased by 17.9% when compared to 2007. The increase in recurring revenue was led by a 19.6% growth from our Access immunoassay products. Total Access immunoassay sales, including instrument sales, grew 22.1% worldwide in comparison to 2007. Placements were up considerably, driven by strong growth of units in mid to high volume hospital laboratories.
Life Science
Revenue from our Life Science products decreased due to lower cash instrument sales, which declined by 8.8% (8.1% in constant currency) for the year. The decline was due to the current economic conditions in 2009, which caused customers to delay capital spending. We anticipate that research markets in 2010 will show a slight recovery, as government stimulus funding becomes more available to some customers.
Revenue in 2008 increased due to growth in instrument sales of our centrifugation and Life Science automation products. Although we posted growth in this segment for 2008, the growth moderated in the second half of the year as the dollar strengthened. In the fourth quarter, Life Science sales were down more than 7% or approximately 4% in constant currency as compared to the same period in the prior year. This decline was partly due to lower activity in international markets.
Revenue by Major Geography
Overall, revenue in the U.S. increased as a result of revenue from the Olympus and Cogenics acquisitions and from growth in recurring revenue, partially offset by declines of more than 24% in cash instrument sales due to the factors mentioned earlier. In 2008 revenue in the U.S. was up 8.2% due primarily to growth in Clinical Diagnostics of 8.6%. Momentum in Clinical Diagnostics was broad based, with growth in Access-family immunoassay, auto chemistry and cellular analysis systems. Growth in these product lines was due primarily to increased instrument placements, our flow cytometry acquisition and elimination of the cellular instrument backlog in the first half of 2008.
Revenue in Europe increased in 2009 due to an increase in recurring revenue of 17.8%, primarily resulting from the Olympus acquisition and from solid growth in immunoassay and molecular diagnostics. The region, however, experienced a decline in cash instrument sales of 6.7% or 4.3% in constant currency. We believe that the decline is due to adverse credit market and economic conditions which has led some customers to defer capital expenditures. In 2008 revenue in Europe rose by 13.5% (8.7% in constant currency) with Clinical Diagnostics leading the way, up over 17% or 12.0% in constant currency. Within Clinical Diagnostics, cellular analysis and immunoassay and molecular diagnostics remained the greatest contributors to growth. The increase in cellular analysis was due to added sales from our flow cytometry products which we acquired at the end of 2007, while the increase in immunoassay and molecular diagnostics was due to increased recurring revenue from our Access immunoassay products, generated from our expanding installed base. Automation and workcells are also becoming a key factor in expanding our growth in Europe.
| BEC 2009 FORM 10-K | 35 |
Table of Contents
Revenue from Emerging Markets decreased by 2.9% (a 3.3% increase in constant currency) for 2009 as we experienced a decrease in cash instrument sales. Overall, cash instrument sales dropped by 38% on a constant currency basis. Sales in 2008 had been particularly strong due to the weaker dollar which enabled us to increase our market penetration. However, in 2009, the stronger dollar and difficult economic environment reduced cash instrument sales. Recurring revenue increased due to revenue from the Olympus acquisition and continued growth in recurring revenue from instruments placed in prior years. In 2008 revenue from Emerging Markets increased by 24.2% (24.2% in constant currency) primarily driven by an increase in instrument sales of 40.7% or 41.0% in constant currency during 2008 as compared to 2007. The increased installed base has also resulted in recurring revenue growth of 17.6% or 17.5% in constant currency.
Sales in Asia Pacific increased by 24.5% (22.0% in constant currency) for the year, mainly due to 22.2% growth in recurring revenue (20.4% in constant currency), led by growth in products from chemistry and clinical automation as a result of the Olympus acquisition and immunoassay and molecular diagnostics. China continued to experience the highest growth, up 37% (35.9% in constant currency). In 2008 sales in Asia Pacific increased by 21.4% (15.9% in constant currency), also led by growth in China of 27.6% (24.9% in constant currency). Asia Pacific reported increased growth in all product lines, with immunoassay and molecular diagnostic as the key driver of the 25.8% growth in Clinical Diagnostics, while centrifugation was the main contributor of the 8.2% growth in Life Science.
Cost of Sales
| Years Ended December 31, | ||||||||||||||||||
| 2009 | 2008 | 2007 | 2009 to 2008 Percent Change |
2008 to 2007 Percent Change |
||||||||||||||
| (in millions) |
||||||||||||||||||
| Cost of recurring revenue |
$ | 1,247.0 | $ | 1,095.7 | $ | 964.5 | 13.8 | % | 13.6 | % | ||||||||
| As a percentage of recurring revenue |
47.1 | % | 45.6 | % | 44.3 | % | 1.5 | % | 1.3 | % | ||||||||
| Years Ended December 31, | ||||||||||||||||||
| 2009 | 2008 | 2007 | 2009 to 2008 Percent Change |
2008 to 2007 Percent Change |
||||||||||||||
| (in millions) |
||||||||||||||||||
| Cost of instrument sales |
$ | 512.5 | $ | 575.2 | $ | 505.0 | (10.9 | )% | 14.0 | % | ||||||||
| As a percentage of instrument sales |
83.3 | % | 82.6 | % | 86.6 | % | 0.7 | % | (4.0 | )% | ||||||||
| Years Ended December 31, | ||||||||||||||||||
| 2009 | 2008 | 2007 | 2009 to 2008 Percent Change |
2008 to 2007 Percent Change |
||||||||||||||
| (in millions) |
||||||||||||||||||
| Total cost of sales |
$ | 1,759.5 | $ | 1,670.9 | $ | 1,469.5 | 5.3 | % | 13.7 | % | ||||||||
| As a percentage of total revenue |
54.0 | % | 53.9 | % | 53.2 | % | 0.1 | % | 0.7 | % | ||||||||
Overall, our cost of sales increased $88.6 million or 5.3% during 2009 as compared to 2008. The Olympus acquisition contributed $130.1 million in cost of sales during 2009, including a charge of $22.1 million for the effect of the inventory accounting purchase adjustment in connection with the acquisition accounting. Excluding the cost of sales generated from the Olympus acquisition, cost of sales decreased by 2.5% due in part to a 0.8% decrease in overall sales. Cost of sales decreased more than sales due primarily to a mix favoring recurring revenue, which yields stronger margins.
| 36 | BEC 2009 FORM 10-K |
Table of Contents
Cost of sales increased during 2008 due to a 12.2% increase in overall revenue. Cost of sales grew faster than the pace of revenue due to the increased sales activity in developing countries during 2008, which generally carry higher cost of sales and a product mix of more instrument sales which have a lower margin.
Operating Expenses
Selling, General and Administrative
| Years Ended December 31, | ||||||||||||||||||
| 2009 | 2008 | 2007 | 2009 to 2008 Percent Change |
2008 to 2007 Percent Change |
||||||||||||||
| (in millions) |
||||||||||||||||||
| Selling, general and administrative (“SG&A”) |
$ | 811.6 | $ | 793.4 | $ | 706.9 | 2.3 | % | 12.2 | % | ||||||||
| As a percentage of total revenue |
24.9 | % | 25.6 | % | 25.6 | % | (0.7 | )% | — | |||||||||
Selling, general and administrative or SG&A expense for 2009 increased by $18.2 million, due primarily to:
| • | $39.4 million in additional SG&A associated with the Olympus business, a $25.5 million increase in pension expense and charges of $8.0 million related to legal matters, offset by |
| • | An overall decline in SG&A spending of $54.7 million primarily due to our continued focus on cost containment initiatives, especially in light of the shortfall in cash instrument revenue combined with the effect of a stronger dollar during the first half of 2009. |
In 2008, SG&A increased compared to 2007 primarily due to (a) increased spending on selling and marketing activities to support our revenue growth, (b) increased costs as a result of the translation of international costs due to comparative weakness of the U.S. dollar during 2008 as compared to 2007.
Research and Development
| Years Ended December 31, | ||||||||||||||||||
| 2009 | 2008 | 2007 | 2009 to 2008 Percent Change |
2008 to 2007 Percent Change |
||||||||||||||
| (in millions) |
||||||||||||||||||
| Research and Development (“R&D”) |
$ | 266.4 | $ | 280.1 | $ | 274.0 | (4.9 | )% | 2.2 | % | ||||||||
| As a percentage of total revenue |
8.2 | % | 9.0 | % | 9.9 | % | (0.8 | )% | (0.9 | )% | ||||||||
R&D costs decreased by $13.7 million during 2009 despite the added R&D costs of $17.1 million associated with the Olympus business and the purchase of a $5.8 million sublicense to certain patent rights which will be used for a molecular diagnostics test. The primary reason for the decrease relates to the following R&D charges incurred during 2008:
| • | $12.0 million charge in connection with the acquisition of a non-exclusive, non-transferable, sub-license to receive certain patent rights to testing for the hepatitis C virus. Under the sublicense, we can develop, manufacture and sell a quantitative viral load HCV blood test for use on our molecular diagnostic instrument that is in development. |
| • | $11.7 million charge in connection with buying out our future U.S. royalty for preeclampsia tests from Nephromics LLC. This fully paid license relates to future U.S. sales of a number of markers including a preeclampsia panel covered by patents licensed exclusively to Nephromics. |
The products under the above agreements have not received regulatory clearance, are still in the development stage and do not have alternative future use; therefore the costs were charged to R&D expense.
Excluding the effect of these items and the added R&D associated with the Olympus business, R&D decreased by $13.0 million during the year as compared to the prior year primarily as a result of completion of certain R&D projects and our efforts to reprioritize other R&D projects. However, we continue to fund significant R&D programs within high potential areas such as flow cytometry and molecular diagnostics.
| BEC 2009 FORM 10-K | 37 |
Table of Contents
In 2008, R&D expense increased 2.2% as we funded significant R&D programs, including the two significant R&D initiatives as mentioned above, and delivering four new work cells and our next-generation cellular analysis system. Investment in our molecular diagnostics program was also expanded. R&D for 2007 included a charge of $35.4 million for in-process R&D acquired as part of our acquisition of NexGen.
| Years Ended December 31, | |||||||||||||||
| 2009 | 2008 | 2007 | 2009 to 2008 Percent Change |
2008 to 2007 Percent Change |
|||||||||||
| (in millions) |
|||||||||||||||
| Amortization of intangibles |
$ | 39.6 | $ | 29.6 | $ | 24.2 | 33.8 | % | 22.3 | % | |||||
| Restructuring and acquisition related costs |
$ | 152.3 | $ | 21.4 | $ | 17.7 | >100.0 | % | 20.9 | % | |||||
| Environmental remediation |
— | $ | 19.0 | — | (100.0 | )% | 100 | % | |||||||
Amortization of Intangibles
Amortization of intangibles increased by $10.0 million during 2009 due primarily to the acquired intangibles from the Olympus acquisition, while the $5.4 million increase during 2008 was related primarily to intangibles acquired as part of an acquisition completed in December 2007. Amortization of intangible assets is related primarily to assets for acquired technology, customer and distributor relationships.
Restructuring and Acquisition Related Costs
Restructuring and acquisition related costs increased by $130.9 million during 2009, when compared to the prior year. This increase is due primarily to restructuring, integration and acquisition related costs associated with the Olympus acquisition of $105.7 million. In addition, we incurred restructuring costs associated with the closure and relocation of certain manufacturing and distribution sites along with activities related to our plan to vacate our Fullerton, California facility and consolidate those operations to other existing facilities. The restructuring cost related to the closure and relocation of these sites includes severance, relocation, and other exit costs. Additionally, we analyzed the remaining useful life of certain assets, which in some cases resulted in a shorter life than our initial estimate. Based on this revised and shortened useful life, we accelerated depreciation expense, which resulted in $1.6 million of higher depreciation during 2009.
In 2008 we recorded charges of $21.4 million related to severance, relocation, and other duplicative exit costs. The charge includes a net gain of $3.0 million related to the sale of buildings and land in Hialeah, Florida. Also, an impairment charge of $1.3 million was recorded in the fourth quarter of 2008 in connection with our Orange County consolidation project, as we identified assets that will no longer be needed due to the consolidation.
Environmental Remediation
During 2008 we began conducting soil and groundwater environmental studies at our Fullerton, California site in connection with our Orange County consolidation and planned closure of the Fullerton site. These studies indicate that the soil and groundwater at the Fullerton site contain chemicals previously used in operations at the facility. As a result, we recorded a $19.0 million environmental remediation charge related to our Fullerton facility. The $19.0 million represents our best estimate of future expenditures for evaluation and remediation at the site. The ultimate costs may range from $10 million to $30 million.
| 38 | BEC 2009 FORM 10-K |
Table of Contents
Operating Income
Management evaluates business segment performance based on revenue and operating income exclusive of certain adjustments, which are not allocated to our segments for performance assessment by our chief operating decision maker.
The following table presents operating income for each reportable segment for 2009, 2008 and 2007 and a reconciliation of our segment operating income to consolidated earnings before income taxes (dollar amounts in millions):
| 2009 | 2008 | 2007 | ||||||||||
| Operating income: |
||||||||||||
| Clinical Diagnostics |
$ | 357.6 | $ | 274.5 | $ | 262.4 | ||||||
| Life Science |
68.9 | 75.1 | 61.3 | |||||||||
| Total segment operating income |
426.5 | 349.6 | 323.7 | |||||||||
| Restructuring and acquisition related costs |
(152.3 | ) | (21.4 | ) | (17.7 | ) | ||||||
| Environmental remediation |
— | (19.0 | ) | — | ||||||||
| Fair market value inventory adjustment for Clinical Diagnostics |
(22.1 | ) | (1.0 | ) | — | |||||||
| Technology acquired for use in R&D for Clinical Diagnostics |
(5.8 | ) | (23.7 | ) | (35.4 | ) | ||||||
| Litigation accrual |
(3.9 | ) | — | — | ||||||||
| Rental tax dispute |
— | — | (1.6 | ) | ||||||||
| Discontinued product write-off related to Clinical Diagnostics |
(1.6 | ) | — | — | ||||||||
| Olympus intangible asset amortization related to Clinical Diagnostics |
(9.6 | ) | — | — | ||||||||
| Total operating income |
231.2 | 284.5 | 269.0 | |||||||||
| Non-operating (income) expense: |
||||||||||||
| Interest income |
(5.0 | ) | (10.0 | ) | (14.4 | ) | ||||||
| Interest expense |
76.6 | 60.8 | 61.7 | |||||||||
| Other |
(24.8 | ) | (4.9 | ) | (58.5 | ) | ||||||
| Total non-operating expense (income) |
46.8 | 45.9 | (11.2 | ) | ||||||||
| Earnings from continuing operations before income taxes |
$ | 184.4 | $ | 238.6 | $ | 280.2 | ||||||
The increase in operating income generated from the Clinical Diagnostics segment during 2009 is due primarily to the increase in recurring revenue which has higher profit margins than cash instrument sales coupled with lower SG&A expense as a percentage of sales resulting from our cost containment initiatives and synergies from our Olympus acquisition, while the increase in operating income from our Clinical Diagnostics segment in 2008 was due primarily to double digit growth in all three product areas as a result of robust instrument sales and strong recurring revenue growth.
The decrease in operating income for our Life Science segment during 2009 was due primarily to a 6.9% decrease in revenue, with lower cash instrument sales being a significant driver. Operating income from this segment posted an increase of 23% due primarily to higher overall revenue when compared to 2007.
Non-Operating Income and Expense
| Years Ended December 31, | ||||||||||
| 2009 | 2008 | 2007 | 2009 to 2008 Percent Change |
2008 to 2007 Percent Change | ||||||
| (in millions) |
||||||||||
| Interest income |
$(5.0) | $(10.0) | $(14.4) | (50.0)% | (30.6)% | |||||
| Interest expense |
76.6 | 60.8 | 61.7 | 26.0% | (1.5)% | |||||
| Other non-operating expense (income) |
(24.8) | (4.9) | (58.5) | >100% | >(100)% | |||||
Interest income decreased during 2009 and 2008 due, in part, to our decreasing investment in STL receivables coupled with overall lower rates of interest on our cash and investment balances.
| BEC 2009 FORM 10-K | 39 |
Table of Contents
Interest expense for all periods reflects our adoption of the new accounting standard related to convertible debt, which effectively increases the amount of interest expense recorded on our convertible debt instruments. The adoption of this standard was applied retrospectively to the prior year financial results. We recorded interest expense of $14.4 million for 2009, $13.2 million for 2008 and $12.4 million for 2007 as a result of implementing this accounting change.
Interest expense increased by $15.8 million during 2009 due primarily to additional interest expense of $19.6 million resulting from our $500 million issuance of debt to finance the Olympus acquisition offset by lower interest expense on our income tax liabilities. Interest expense decreased in 2008 due primarily to a decrease in our tax liabilities for uncertain tax positions coupled with lower interest rates on our borrowings in comparison to 2007.
The increase in other non-operating income for 2009 was primarily related to foreign currency gains related to the Olympus acquisition. We recognized a $19.6 million hedging gain during the year associated with forward contracts to purchase Japanese yen. Since our purchase price for the Olympus acquisition was paid in yen, we entered into forward contracts in an effort to mitigate the risk associated with changes in the value of the yen which we settled as of July 30, 2009. We recorded a $2.2 million foreign currency gain on the value of the yen for the period between settling the forward contract and the transfer of funds in yen to purchase Olympus. Additionally, we recorded a $4.9 million foreign currency gain related to the settlement of intercompany loans related to the Olympus acquisition.
The increase in other non-operating expense during 2008 was due primarily to the following transactions recorded during 2007:
| • | $40.6 million gain, net of expenses, associated with the breakup fee received in connection with the termination of the merger agreement with Biosite, Incorporated (“Biosite”). |
| • | $26.2 million gain on the sale of vacant land in Miami |
| • | $9.0 million expense with respect to a contribution to establish the Beckman Coulter Foundation |
Excluding the effect of these transactions, other non-operating expense increased over the prior year due primarily to currency related costs.
Discontinued Operations
In July 2007, we received the remaining funds held in escrow related to our 2006 sale of our interest in Agencourt Personal Genomics. The additional gain on sale of $2.6 million ($1.6 million net of taxes), was recorded in discontinued operations during 2007.
Income Tax
Income tax as a percentage of pretax earnings from continuing operations was 20.2% in 2009, 22.0% in 2008 and 27.9% in 2007. Discrete items which reduced tax expense for 2009 consisted primarily of settlement of tax audits, changes to various tax credits and recognition of a deferred tax asset for a foreign net operating loss.
Our effective tax rate was lower than the United States federal statutory rate due primarily to:
| • | Geographic profit mix with more income earned outside the U.S. in lower-tax jurisdictions |
| • | Various tax credits, including R&E tax credits |
| • | Deduction allowed for U.S. tax purposes related to manufacturing activities in the U.S. |
During 2009, we filed certain tax accounting method changes with the U.S. Internal Revenue Service (“IRS”). As a result of these accounting method changes, certain tax deductions were accelerated and reflected in the 2008 federal income tax return, resulting in a net operating loss for that year for tax purposes. This loss has been carried back to the 2006 tax year and reduces taxes previously paid. We received a total of $66.0 million in additional tax refunds in 2009 resulting from accounting method changes. The acceleration of these tax deductions reduces certain permanent tax benefits in tax years 2008 and 2006. The impact of the reduction of these permanent tax benefits, totaling $3.4 million, was reflected as a discrete item in the tax provision for the year.
Additional R&E tax credits of $8.9 million were recorded in 2008 to record the credits in the year earned. Previously we recorded R&E credits in the following year due to difficulties in estimating credits. Total R&E tax credits recorded in 2008 were $17.6 million ($8.9 million for 2008 credits and $8.7 million for 2007 credits). R&E credits recorded in 2007 were $6.2 million (related to 2006 credits).
| 40 | BEC 2009 FORM 10-K |
Table of Contents
Income tax as a percentage of pretax earnings from continuing operations in 2008 was impacted negatively by several items including the establishment of a joint intercompany research and development program in Ireland, which is expected to negatively impact our tax rate over the next couple of years but yield a lower long term tax rate.
See Note 12 “Income Taxes” of the Notes to Consolidated Financial Statements in Item 8 of this Form 10-K for a reconciliation of the U.S. statutory tax rate to our effective tax rate. We expect the effective tax rate in 2010 to be higher than 2009 due to a change in geographical profit mix with more income expected to be earned in higher-tax jurisdictions such as the U.S. Our 2010 effective tax rate, however, may be impacted by a number of factors including, enactments of new tax laws, new interpretations of existing tax laws, rulings by and settlements with taxing authorities, our generation of tax credits, including R&E tax credits and our geographic profit mix.
Liquidity and Capital Resources
Our cash balances are held in numerous locations throughout the world. Some amounts held outside of the United States could be subject to United States federal income taxes if repatriated, less applicable foreign tax credits. Repatriation of some foreign balances is restricted by local laws. We have provided for the United States federal tax liability on these amounts for financial statement purposes, except for foreign earnings that are considered indefinitely reinvested outside of the United States. Repatriation could result in additional United States federal income tax payments in future years. Where local restrictions prevent an efficient intercompany transfer of funds, our intent is that cash balances would remain outside of the United States and we would meet United States liquidity needs through ongoing cash flows, external borrowings, or both. We utilize a variety of tax planning and financing strategies in an effort to ensure that our worldwide cash is available in the locations in which it is needed.
Liquidity is our ability to generate sufficient cash flows from operating activities to meet our obligations and commitments. Liquidity includes our ability to obtain appropriate financing and to convert assets that are no longer required in meeting existing strategic and financing objectives into cash. For purposes of achieving long-range business objectives and meeting our commitments, liquidity cannot be considered separately from capital resources that consist of current and potentially available funds.
Our business model, in particular recurring revenue comprised of consumable supplies (including reagent test kits), service, and OTL payments, allows us to generate substantial operating cash flows. We continue to invest a substantial portion of this cash flow in instruments leased to customers. We expect operating cash flows to increase as our revenue and depreciation from new OTLs increase year over year. We anticipate our operating cash flows together with the funds available through our credit facilities will continue to satisfy our working capital requirements. During the next twelve months, we anticipate using our operating cash flows or other sources of liquidity to:
| • | Facilitate growth in the business by developing, marketing and launching new products. We expect new product offerings to come from new technologies gained through licensing arrangements, existing R&D projects, and business acquisitions, |
| • | Maintain or raise our quarterly dividend. In February 2010, our Board of Directors declared a quarterly cash dividend of $0.18 per share, payable on March 12, 2010 to stockholders of record on February 26, 2010. Although dividend payments are at the discretion of our Board of Directors, we expect to pay quarterly dividends in 2010 of $0.18 per share, |
| • | Pay costs associated with our supply chain and restructuring initiatives, |
| • | Complete our Orange County consolidation project, |
| • | Make pension and postretirement plan contributions of $39.3 million, and |
| • | Repurchase shares |
We expect payments associated with the environmental clean up of our Fullerton facility to become more significant in 2010 and beyond. Proceeds from the potential sale of the Fullerton facility are not anticipated in the near term.
| BEC 2009 FORM 10-K | 41 |
Table of Contents
The following is a summary of our cash flow from operating, investing and financing activities, as reflected in our consolidated statements of cash flows:
| 2009 | 2008 | 2007 | ||||||||||
| Cash provided by (used in): |
||||||||||||
| Operating activities |
$ | 568.6 | $ | 474.8 | $ | 397.1 | ||||||
| Investing activities |
(1,138.8 | ) | (305.9 | ) | (341.4 | ) | ||||||
| Financing activities |
737.0 | (128.2 | ) | (52.8 | ) | |||||||
| Effect of exchange rate changes on cash and cash equivalents |
2.0 | (3.7 | ) | 4.9 | ||||||||
| Change in cash and cash equivalents |
$ | 168.8 | $ | 37.0 | $ | 7.8 | ||||||
Cash provided by operating activities for 2009 increased by $93.8 million due primarily to improved collection efforts for customer receivables and timing of payments for expenses, particularly restructuring costs. We also received a refund of U.S. Federal income taxes of $66.0 million as a result of amending tax returns to deduct software costs in the periods incurred rather than capitalizing the costs for tax purposes. The above increases in cash provided by operating activities were partially offset by higher pension contributions, which increased by about $66 million.
Cash provided by operating activities in 2008 increased by $77.7 million. The increase in operating cash flows resulted primarily from better management of inventory levels, stronger collections of trade accounts receivable and the collection of international value added tax refunds of $20.0 million. These items were partially offset by increased payments of vendor invoices related to our trade accounts payable. Additionally, operating cash flows in 2007 included a $40.6 million gain (pretax) associated with the termination of the merger agreement with Biosite.
Investing activities in 2009 used additional cash of $832.9 million compared to 2008. This increase is primarily related to the acquisition of Olympus for a purchase price, net of cash received, of $803.3 million on August 3, 2009 coupled with the $16.4 million acquisition of Cogenics on April 14, 2009. Additionally, there was an increase in payments for property, plant and equipment, due primarily to the Orange County consolidation project, offset by a decrease in spending for new customer leased instruments.
Investing activities in 2008 used $35.5 million less cash compared to 2007. The change in investing cash flows is primarily attributed to the 2007 acquisition of a flow cytometry business and the remaining 80.1% interest in NexGen. Additionally, in 2007 we paid $22.2 million to obtain an exclusive worldwide license of certain technology from Wayne State University. There were no similar payments for acquisitions or capitalized technology license assets in 2008. Additionally, 2007 activity included proceeds received from the sale of building and land in connection with the Miami land sale.
Cash flows provided by financing activities in 2009 increased by $865.2 million compared to 2008 due primarily to our $500 million debt offering completed in May 2009 and the $240 million equity offering completed in July 2009 to finance a portion of the Olympus acquisition, which closed on August 3, 2009.
Cash flows used in financing activities in 2008 increased by $75.4 million compared to prior year due primarily to an increase in treasury stock repurchases of $37.1 million, and an increase in net debt repayments of $33.6 million. Total stock repurchases were $1.3 million, $94.4 million and $57.3 million in 2009, 2008 and 2007 respectively.
Short and Long Financing Arrangements
At December 31, 2009, we had the following resources available to obtain short-term or long-term financings if we need additional liquidity:
| In millions | |||
| 2008 Shelf Registration Statement |
Unspecified | ||
| Credit Facility |
$ | 350.0 | |
| Uncommitted lines of credit |
267.4 | ||
| Revolving trade receivables-based facilities |
125.0 | ||
Shelf Registration Statement
In November 2008, we renewed our universal shelf registration statement with the United States Securities and Exchange Commission for the offer and sale of up to $500 million of securities, which may include debt securities, preferred stock, common stock and warrants to purchase debt securities, common stock, preferred stock or depository shares. We have no immediate plans to offer or sell any securities.
| 42 | BEC 2009 FORM 10-K |
Table of Contents
Credit Facility
In May 2009, we entered into an Amended and Restated Credit Agreement (the “Credit Facility”) and extended the maturity date of the Credit Facility to May 2012. The Credit Facility provides us with a $350.0 million revolving line of credit, which may be increased in $50.0 million increments up to a maximum line of credit of $450.0 million. Interest on advances is determined using formulas specified in the agreement, generally, an approximation of LIBOR plus 2.25% to 2.88% margin with the precise margin determinable based on our long-term senior unsecured non-credit-enhanced debt rating, which as of December 31, 2009 was a S&P rating of BBB. We also must pay a facility fee of 0.50% per annum on the aggregate average daily amount of each lender’s commitment with the precise margin determinable based on our long-term senior unsecured non-credit-enhanced debt rating, which as of December 31, 2009 was a S&P rating of BBB. At December 31, 2009, no amounts were outstanding under the Credit Facility.
Uncommitted Line of Credit
At December 31, 2009, $227.4 million of unused, uncommitted, short-term lines of credit were available to our subsidiaries outside the United States at various interest rates. In the United States, $40 million in unused, uncommitted, short-term lines of credit at prevailing market rates were available.
Revolving Trade Receivables-Based Facilities
Our wholly owned subsidiary, Beckman Coulter Finance Company, LLC (“BCFC”), a Delaware limited liability company, entered into an accounts receivable securitization program with several financial institutions. The securitization facility is on a 364-day revolving basis. As part of the securitization program, we transferred our interest in a defined pool of accounts receivable to BCFC. In turn, BCFC sold an ownership interest in the underlying receivables to the multi-seller conduits administered by a third party bank. Sale of receivables under the program is accounted for as a secured borrowing. The cost of funds under this program varies based on changes in interest rates. The term of the agreement extends to October 27, 2010 and the maximum borrowing amount is $125.0 million. We did not have any amounts drawn on the facility as of December 31, 2009.
Other Financing
On May 18, 2009, we issued $250 million principal amount of the Company’s 6% Senior Notes due 2015 and $250 million principal amount of the Company’s 7% Senior Notes due 2019. In connection with the Notes, we incurred issuance costs of $4.8 million and the Notes were issued at a discount of $2.3 million which is being amortized over the estimated life of the Notes. The proceeds from the Notes were used to fund the Olympus acquisition.
On May 19, 2009 we entered into forward sale agreements for the sale of an aggregate of 4,722,989 shares of our common stock including an amount equal to the underwriters’ over-allotment option in the public offering. The initial forward sale price was $50.75 per share which was equivalent to the public offering price of $53.00 less the underwriting discount of $2.25. On July 27, 2009, we completed the forward sale of our common stock, as described in Note 11, “Debt and Equity Financing” and received total net proceeds of approximately $240 million which was used to fund the Olympus acquisition. We incurred issuance costs and underwriting fees of $11.8 million in connection with this offering, which were deducted from the proceeds of the offering.
Certain of our borrowing agreements contain covenants that we must comply with, for example, a debt to earnings ratio and a minimum interest coverage ratio. At December 31, 2009, we were in compliance with all such covenants as well as reporting requirements related to these covenants.
The following is included in long-term debt at December 31, 2009 and 2008 (dollar amounts in millions):
| Average Rate of Interest for 2009 |
2009 | 2008 | ||||||||
| Convertible Notes, unsecured, due 2036 |
5.59% | $ | 598.6 | $ | 598.6 | |||||
| Senior Notes, unsecured, due 2011 |
6.88% | 235.0 | 235.0 | |||||||
| Senior Notes, unsecured, due 2015 |
6.00% | 250.0 | — | |||||||
| Senior Notes, unsecured, due 2019 |
7.00% | 250.0 | — | |||||||
| Debentures, unsecured, due 2026 |
7.05% | 36.2 | 36.2 | |||||||
| Revolving credit facility |
0.88% | — | — | |||||||
| Other long-term debt |
2.75% | 39.8 | 37.4 | |||||||
| Deferred gains on terminated interest rate swaps (see Note 10) |
3.1 | 4.8 | ||||||||
| Embedded derivative on Convertible Notes |
0.9 | 0.6 | ||||||||
| Unamortized debt discounts and issuance costs |
(83.6 | ) | (89.2 | ) | ||||||
| 1,330.0 | 823.4 | |||||||||
| Less current maturities |
(24.1 | ) | (4.4 | ) | ||||||
| Long-term debt, less current maturities |
$ | 1,305.9 | $ | 819.0 | ||||||
| BEC 2009 FORM 10-K | 43 |
Table of Contents
Our credit ratings at December 31, 2009, were as follows:
| Rating Agency |
Rating | Outlook | ||
| Fitch |
BBB | Stable | ||
| Moody’s |
Baa3 | Stable | ||
| Standard & Poor’s |
BBB | Stable |
Factors that can affect our credit ratings include changes in our operating performance, our financial position and changes in our business strategy. We do not currently foresee any reasonable circumstances under which our credit ratings would be significantly downgraded. If a downgrade were to occur, it could adversely impact, among other things, our future borrowing costs and access to capital markets.
Based upon current levels of operations and expected future growth, we believe our cash flows from operations together with available borrowings under our Credit Facility and other sources of liquidity will be adequate to meet our anticipated requirements for interest payments and other debt service obligations, working capital, capital expenditures, lease payments, pension contributions and other operating and investing needs.
Capital Expenditures
Customer leased instruments normally comprise about two-thirds of our total capital expenditures; however in 2009 our expenditures on property, plant and equipment increased primarily as a result of our progress on our Orange County consolidation project. We expect our OTL instrument balance to increase as the majority of our contracts are from OTL transactions. We expect to incur capital expenditures of about $375 million in 2010. Capital expenditures are funded through cash provided by operating activities, as well as available cash and cash equivalents and short-term investments.
Off-Balance Sheet Arrangements and Contractual Obligations
We do not have any off-balance sheet arrangements that have had or are reasonably likely to have a current or future material effect on our financial condition, results of operations or liquidity.
The following represents a summary of our contractual obligations and commitments as of December 31, 2009 (in millions):
| Payments Due by Period | |||||||||||||||||||||
| Total | 2010 | 2011 | 2012 | 2013 | 2014 | Thereafter | |||||||||||||||
| Long-term debt and interest (a) |
$ | 2,156.4 | $ | 90.3 | $ | 303.6 | $ | 50.9 | $ | 61.0 | $ | 51.8 | $ | 1,598.8 | |||||||
| Operating leases |
376.5 | 69.5 | 57.7 | 48.2 | 41.2 | 38.0 | 121.9 | ||||||||||||||
| Other(b) |
310.9 | 245.8 | 24.3 | 17.2 | 12.2 | 8.6 | 2.8 | ||||||||||||||
| Unrecognized tax benefit (c) |
35.8 | 4.0 | 7.9 | — | — | — | 23.9 | ||||||||||||||
| Total contractual cash obligations |
$ | 2,879.6 | $ | 409.6 | $ | 393.5 | $ | 116.3 | $ | 114.4 | $ | 98.4 | $ | 1,747.4 | |||||||
| (a) | The amounts for long-term debt assume that the respective debt instruments will be outstanding until their scheduled maturity dates, or the earliest date the debt may be put to us by the holder. Holders of the Convertible Notes may require us to repurchase all or part of their Convertible Notes on December 15, 2013, or upon the occurrence of certain designated events as described in the debt offering memorandum. The amounts include interest, but exclude the unamortized discount of $83.6 million, and the $3.1 million fair value adjustment recorded for the reverse interest rate swap as permitted by the accounting standard for derivatives and hedging, specifically the embedded derivatives subtopic. See Note 9 “Debt Financing” of the Notes to Consolidated Financial Statements in Item 8 of this Form 10-K for additional information regarding our long-term debt. |
| 44 | BEC 2009 FORM 10-K |
Table of Contents
| (b) | Other consists primarily of inventory purchase commitments. |
| (c) | Unrecognized tax benefits represent our potential future obligation to the taxing authority for a tax position that was not recognized. Given that the timing of payments associated with this obligation is undeterminable, a portion of the balance has been categorized under the “thereafter” column. |
Recent Accounting Developments
See Note 1 “Nature of Business and Summary of Significant Accounting Policies” of the Notes to Consolidated Financial Statements included in Item 8 of this Form 10-K for a description of recently issued accounting pronouncements, including the expected dates of adoption and estimated effects on our results of operations, financial position, and cash flows.
Item 7A. Quantitative and Qualitative Disclosures About Market Risk
The following information about potential effects of changes in currency exchange and interest rates is based on a sensitivity analysis, which models the effects of fluctuations in currency exchange rates and interest rates. This analysis is constrained by several factors, including the following:
| • | it is based on a single point in time, and |
| • | it does not include the effects of other complex market reactions that would arise from the changes modeled. |
Although the results of the analysis may be useful as a benchmark, they should not be viewed as forecasts.
Our most significant foreign currency exposures relate to the Euro, Japanese Yen, Australian dollar, British Pound Sterling and Canadian dollar. As of December 31, 2009 and 2008, the notional amounts of all derivative foreign exchange contracts were $546.3 million and $257.8 million, respectively. Notional amounts are stated in U.S. dollar equivalents at the spot exchange rate at the respective dates. The net fair values of all derivative foreign exchange contracts as of December 31, 2009 and 2008, were a net asset of $1.9 million and $25.7 million, respectively. We estimated the sensitivity of the fair value of all derivative foreign exchange contracts to a hypothetical 10% strengthening and 10% weakening of the spot exchange rates for the U.S. dollar against the foreign currencies at December 31, 2009. The analysis showed that a 10% strengthening of the U.S. dollar would result in a gain from a fair value change of $19.8 million and a 10% weakening of the U.S. dollar would result in a loss from a fair value change of $19.8 million in these instruments. Losses and gains on the underlying transactions being hedged would largely offset any gains and losses on the fair value of the derivative contracts. These offsetting gains and losses are not reflected in the above analysis.
Similarly, we performed a sensitivity analysis on our variable rate debt instruments and derivatives. A one percentage point increase or decrease in interest rates was estimated to have no impact on our pre-tax earnings based on the amount of variable rate debt outstanding at December 31, 2009.
Additional information with respect to our foreign currency and interest rate exposures are discussed in Note 10 “Derivatives” of the Notes to Consolidated Financial Statements in Item 8 of this Form 10-K.
Financial Risk Management
Our risk management program, developed by senior management and approved by the Board of Directors, seeks to minimize the potentially negative effects of changes in foreign exchange rates and interest rates on the results of operations. Our primary exposures to fluctuations in the financial markets are to changes in foreign exchange rates and interest rates.
Foreign exchange risk arises because our reporting currency is the U.S. dollar and we generate approximately 51% of our revenue in various foreign currencies. U.S. dollar-denominated costs and expenses as a percentage of total operating costs and expenses are much greater than U.S. dollar-denominated revenue as a percentage of total net revenue. As a result, appreciation of the U.S. dollar against our major trading currencies has a negative impact on our results of operations, and depreciation of the U.S. dollar against such currencies has a positive impact. The dollar strengthened since the first half of 2009, therefore the impact of the strengthening dollar will be more pronounced in the first half of 2010 than in the second half of 2010, based upon current rates.
We seek to minimize our exposure to changes in exchange rates by denominating costs and expenses in foreign currencies. When these opportunities are exhausted, we use derivative financial instruments to function as “hedges”. We use forward contracts and purchased option contracts to hedge certain foreign currency denominated transactions based on prior year rates. We do not use these instruments for speculative or trading purposes. The major currencies against which we hedge are the Euro, Japanese Yen, Australian dollar, British Pound Sterling and Canadian dollar.
| BEC 2009 FORM 10-K | 45 |
Table of Contents
We do not have significant exposure to interest rate risk since our long-term debt is nearly all fixed.
Inflation
We continually monitor inflation and the effects of changing prices. Inflation increases the cost of goods and services used. Competitive and regulatory conditions in many markets restrict our ability to fully recover the higher costs of acquired goods and services through price increases. We attempt to mitigate the impact of inflation by implementing continuous process improvement solutions to enhance productivity and efficiency and, as a result, lower costs and operating expenses. The effects of inflation have, in our opinion, been managed appropriately and as a result have not had a material impact on our operations and the resulting financial position or liquidity.
| 46 | BEC 2009 FORM 10-K |
Table of Contents
Item 8. Financial Statements and Supplementary Data
Report of Independent Registered Public Accounting Firm
The Board of Directors and Stockholders
Beckman Coulter, Inc.:
We have audited the accompanying consolidated balance sheets of Beckman Coulter, Inc. and subsidiaries (“the Company”) as of December 31, 2009 and 2008, and the related consolidated statements of earnings, stockholders’ equity and comprehensive income (loss), and cash flows for each of the years in the three-year period ended December 31, 2009. In connection with our audits of the consolidated financial statements, we also have audited the financial statement schedule of valuation and qualifying accounts as listed in the index under Item 15(a)(3). These consolidated financial statements and financial statement schedule are the responsibility of the Company’s management. Our responsibility is to express an opinion on these consolidated financial statements and related financial statement schedule based on our audits.
We conducted our audits in accordance with the standards of the Public Company Accounting Oversight Board (United States). Those standards require that we plan and perform the audit to obtain reasonable assurance about whether the financial statements are free of material misstatement. An audit includes examining, on a test basis, evidence supporting the amounts and disclosures in the financial statements. An audit also includes assessing the accounting principles used and significant estimates made by management, as well as evaluating the overall financial statement presentation. We believe that our audits provide a reasonable basis for our opinion.
In our opinion, the consolidated financial statements referred to above present fairly, in all material respects, the financial position of the Company as of December 31, 2009 and 2008, and the results of its operations and its cash flows for each of the years in the three-year period ended December 31, 2009, in conformity with U.S. generally accepted accounting principles. Also in our opinion, the related financial statement schedule, when considered in relation to the basic consolidated financial statements taken as a whole, presents fairly, in all material respects, the information set forth therein.
As discussed in Note 1 to the consolidated financial statements, the Company changed its method of accounting for business combinations and retrospectively changed its method of accounting for certain convertible debt securities due to the adoption of new accounting pronouncements in 2009.
We also have audited, in accordance with the standards of the Public Company Accounting Oversight Board (United States), the Company’s internal control over financial reporting as of December 31, 2009, based on criteria established in Internal Control – Integrated Framework issued by the Committee of Sponsoring Organizations of the Treadway Commission (COSO), and our report dated February 22, 2010, expressed an unqualified opinion on the effectiveness of the Company’s internal control over financial reporting.
| /s/ KPMG LLP |
| Irvine, California |
| February 22, 2010 |
| BEC 2009 FORM 10-K | 47 |
Table of Contents
Consolidated Balance Sheets
(in millions, except amounts per share)
| December 31, | ||||||||
| 2009 | 2008 | |||||||
| Assets |
||||||||
| Current assets |
||||||||
| Cash and cash equivalents |
$ | 288.8 | $ | 120.0 | ||||
| Trade and other receivables, net |
827.9 | 706.7 | ||||||
| Inventories |
596.8 | 496.2 | ||||||
| Deferred income taxes |
79.0 | 62.5 | ||||||
| Prepaids and other current assets |
77.4 | 76.3 | ||||||
| Total current assets |
1,869.9 | 1,461.7 | ||||||
| Property, plant and equipment, net |
621.9 | 465.5 | ||||||
| Customer leased instruments, net |
523.0 | 448.7 | ||||||
| Goodwill |
1,041.9 | 696.3 | ||||||
| Other intangible assets, net |
561.8 | 396.8 | ||||||
| Deferred income taxes |
— | 1.3 | ||||||
| Other assets |
58.6 | 71.5 | ||||||
| Total assets |
$ | 4,677.1 | $ | 3,541.8 | ||||
| Liabilities and Stockholders’ Equity |
||||||||
| Current liabilities |
||||||||
| Accounts payable |
$ | 235.7 | $ | 172.2 | ||||
| Accrued expenses |
540.1 | 416.9 | ||||||
| Income taxes payable |
5.6 | 29.7 | ||||||
| Short-term borrowings |
1.8 | 21.4 | ||||||
| Current maturities of long-term debt |
24.1 | 4.4 | ||||||
| Total current liabilities |
807.3 | 644.6 | ||||||
| Long-term debt, less current maturities |
1,305.9 | 819.0 | ||||||
| Deferred income taxes |
50.1 | — | ||||||
| Other liabilities |
552.6 | 595.9 | ||||||
| Total liabilities |
2,715.9 | 2,059.5 | ||||||
| Commitments and contingencies (see Note 17) |
||||||||
| Stockholders’ equity |
||||||||
| Preferred stock, $0.10 par value; authorized 10.0 shares; none issued |
— | — | ||||||
| Common stock, $0.10 par value; authorized 300.0 shares; shares issued 73.8 and 68.8 at 2009 and 2008, respectively; shares outstanding 69.6 and 63.0 at 2009 and 2008, respectively |
7.4 | 6.9 | ||||||
| Additional paid-in capital |
886.8 | 621.5 | ||||||
| Retained earnings |
1,482.7 | 1,381.6 | ||||||
| Accumulated other comprehensive loss |
(176.8 | ) | (199.8 | ) | ||||
| Treasury stock, at cost: 3.8 and 5.5 common shares at 2009 and 2008, respectively |
(238.9 | ) | (327.9 | ) | ||||
| Common stock held in grantor trust, at cost: 0.4 common shares at 2009 and 2008 |
(21.3 | ) | (19.3 | ) | ||||
| Grantor trust liability |
21.3 | 19.3 | ||||||
| Total stockholders’ equity |
1,961.2 | 1,482.3 | ||||||
| Total liabilities and stockholders’ equity |
$ | 4,677.1 | $ | 3,541.8 | ||||
See accompanying notes to consolidated financial statements.
| 48 | BEC 2009 FORM 10-K |
Table of Contents
Consolidated Statements of Earnings
(in millions, except amounts per share)
| Years Ended December 31, | ||||||||||||
| 2009 | 2008 | 2007 | ||||||||||
| Recurring revenue – supplies, service and lease payments |
$ | 2,645.2 | $ | 2,402.6 | $ | 2,178.4 | ||||||
| Instrument sales |
615.4 | 696.3 | 582.9 | |||||||||
| Total revenue |
3,260.6 | 3,098.9 | 2,761.3 | |||||||||
| Cost of recurring revenue |
1,247.0 | 1,095.7 | 964.5 | |||||||||
| Cost of instrument sales |
512.5 | 575.2 | 505.0 | |||||||||
| Total cost of sales |
1,759.5 | 1,670.9 | 1,469.5 | |||||||||
| Operating costs and expenses |
||||||||||||
| Selling, general and administrative |
811.6 | 793.4 | 706.9 | |||||||||
| Research and development |
266.4 | 280.1 | 274.0 | |||||||||
| Amortization of intangible assets |
39.6 | 29.6 | 24.2 | |||||||||
| Restructuring and acquisition related costs |
152.3 | 21.4 | 17.7 | |||||||||
| Environmental remediation |
— | 19.0 | — | |||||||||
| Total operating costs and expenses |
1,269.9 | 1,143.5 | 1,022.8 | |||||||||
| Operating income |
231.2 | 284.5 | 269.0 | |||||||||
| Non-operating expense (income) |
||||||||||||
| Interest income |
(5.0 | ) | (10.0 | ) | (14.4 | ) | ||||||
| Interest expense |
76.6 | 60.8 | 61.7 | |||||||||
| Other, net |
(24.8 | ) | (4.9 | ) | (58.5 | ) | ||||||
| Total non-operating expense (income) |
46.8 | 45.9 | (11.2 | ) | ||||||||
| Earnings from continuing operations before income taxes |
184.4 | 238.6 | 280.2 | |||||||||
| Income taxes |
37.3 | 52.6 | 78.1 | |||||||||
| Earnings from continuing operations |
147.1 | 186.0 | 202.1 | |||||||||
| Earnings from discontinued operations, net of tax |
— | — | 1.6 | |||||||||
| Net earnings |
$ | 147.1 | $ | 186.0 | $ | 203.7 | ||||||
| Basic earnings per share |
||||||||||||
| Continuing operations |
$ | 2.22 | $ | 2.95 | $ | 3.23 | ||||||
| Discontinued operations |
— | — | 0.03 | |||||||||
| Basic earnings per share |
$ | 2.22 | $ | 2.95 | $ | 3.26 | ||||||
| Diluted earnings per share |
||||||||||||
| Continuing operations |
$ | 2.18 | $ | 2.89 | $ | 3.15 | ||||||
| Discontinued operations |
— | — | 0.03 | |||||||||
| Diluted earnings per share |
$ | 2.18 | $ | 2.89 | $ | 3.18 | ||||||
| Weighted average number of shares outstanding (in thousands) |
||||||||||||
| Basic |
66,297 | 62,969 | 62,505 | |||||||||
| Diluted |
67,383 | 64,348 | 64,066 | |||||||||
See accompanying notes to consolidated financial statements.
| BEC 2009 FORM 10-K | 49 |
Table of Contents
Consolidated Statements of Stockholders’ Equity and Comprehensive Income (Loss)
(in millions)
| Common Stock |
Additional Paid-In Capital |
Retained Earnings |
Accumulated Other Comprehensive Income (Loss) |
Treasury Stock |
Common Stock Held in Grantor Trust |
Grantor Trust Liability |
Total | |||||||||||||||||||||||
| Balance December 31, 2006 |
$ | 6.8 | $ | 550.3 | $ | 1,076.0 | $ | (55.4 | ) | $ | (361.5 | ) | $ | (16.8 | ) | $ | 16.8 | $ | 1,216.2 | |||||||||||
| Net earnings |
— | — | 203.7 | — | — | — | — | 203.7 | ||||||||||||||||||||||
| Foreign currency translation adjustments |
— | — | — | 65.0 | — | — | — | 65.0 | ||||||||||||||||||||||
| Net actuarial (losses) associated with pension and other postretirement benefits, net of income taxes of $11.5 |
— | — | — | (14.5 | ) | — | — | — | (14.5 | ) | ||||||||||||||||||||
| Amortization of prior service cost and unrecognized gains included in net periodic benefit cost, net of income taxes of $(3.8) |
— | — | — | 6.7 | — | — | — | 6.7 | ||||||||||||||||||||||
| Derivatives qualifying as hedges: |
||||||||||||||||||||||||||||||
| Net derivative (losses), net of income taxes of $1.9 |
— | — | — | (3.1 | ) | — | — | — | (3.1 | ) | ||||||||||||||||||||
| Reclassification to income, net of income taxes of $0.3 |
— | — | — | (0.5 | ) | — | — | — | (0.5 | ) | ||||||||||||||||||||
| Other/Total Comprehensive Income |
$ | 53.6 | $ | 257.3 | ||||||||||||||||||||||||||
| Shares issued under stock option and benefit plans |
— | (14.0 | ) | — | — | — | — | — | (14.0 | ) | ||||||||||||||||||||
| Share-based compensation expense |
— | 23.3 | — | — | — | — | — | 23.3 | ||||||||||||||||||||||
| Tax benefit from exercise of non-qualified stock options |
— | 22.0 | — | — | — | — | — | 22.0 | ||||||||||||||||||||||
| Cumulative effect of adopting the accounting standard for income taxes |
— | — | (0.6 | ) | — | — | — | — | (0.6 | ) | ||||||||||||||||||||
| Cumulative effect of adopting measurement provisions of the accounting standard for compensation related to retirement benefits |
— | — | (0.5 | ) | — | — | — | — | (0.5 | ) | ||||||||||||||||||||
| Dividends to stockholders |
— | — | (40.4 | ) | — | — | — | — | (40.4 | ) | ||||||||||||||||||||
| Pension liability adjustments |
— | — | — | (11.0 | ) | — | — | — | (11.0 | ) | ||||||||||||||||||||
| Repurchases of treasury stock |
— | — | — | — | (57.3 | ) | — | — | (57.3 | ) | ||||||||||||||||||||
| Stock issued from treasury |
— | — | — | — | 101.0 | — | — | 101.0 | ||||||||||||||||||||||
| Repurchases of common stock held in grantor trust |
— | — | — | — | — | (1.0 | ) | 1.0 | — | |||||||||||||||||||||
| Balance December 31, 2007 |
6.8 | 581.6 | 1,238.2 | (12.8 | ) | (317.8 | ) | (17.8 | ) | 17.8 | 1,496.0 | |||||||||||||||||||
| Net earnings |
— | — | 186.0 | — | — | — | — | 186.0 | ||||||||||||||||||||||
| Foreign currency translation adjustments |
— | — | — | (64.2 | ) | — | — | — | (64.2 | ) | ||||||||||||||||||||
| Net actuarial (losses) associated with pension and other postretirement benefits, net of income taxes of $90.6 |
— | — | — | (147.1 | ) | — | — | — | (147.1 | ) | ||||||||||||||||||||
| Amortization of prior service cost and unrecognized gains included in net periodic benefit cost, net of income taxes of $(3.9) |
— | — | — | 6.2 | — | — | — | 6.2 | ||||||||||||||||||||||
| Derivatives qualifying as hedges: |
||||||||||||||||||||||||||||||
| Net derivative gains, net of income taxes of $(9.2) |
— | — | — | 15.0 | — | — | — | 15.0 | ||||||||||||||||||||||
| Reclassification to income, net of income taxes of $(1.9) |
— | — | — | 3.1 | — | — | — | 3.1 | ||||||||||||||||||||||
| Other/Total Comprehensive Income (Loss) |
$ | (187.0 | ) | $ | (1.0 | ) | ||||||||||||||||||||||||
| Shares issued under stock option and benefit plans |
0.1 | (7.2 | ) | — | — | — | — | — | (7.1 | ) | ||||||||||||||||||||
| Share-based compensation expense |
— | 35.2 | — | — | — | — | — | 35.2 | ||||||||||||||||||||||
| Tax benefit from exercise of non-qualified stock options |
— | 11.9 | — | — | — | — | — | 11.9 | ||||||||||||||||||||||
| Dividends to stockholders |
— | — | (42.6 | ) | — | — | — | — | (42.6 | ) | ||||||||||||||||||||
| Repurchases of treasury stock |
— | — | — | — | (94.4 | ) | — | — | (94.4 | ) | ||||||||||||||||||||
| 50 | BEC 2009 FORM 10-K |
Table of Contents
| Common Stock |
Additional Paid-In Capital |
Retained Earnings |
Accumulated Other Comprehensive Income (Loss) |
Treasury Stock |
Common Stock Held in Grantor Trust |
Grantor Trust Liability |
Total | |||||||||||||||||||||||
| Stock issued from treasury |
— | — | — | — | 84.3 | — | — | 84.3 | ||||||||||||||||||||||
| Repurchases of common stock held in grantor trust |
— | — | — | — | — | (1.5 | ) | 1.5 | — | |||||||||||||||||||||
| Balance December 31, 2008 |
6.9 | 621.5 | 1,381.6 | (199.8 | ) | (327.9 | ) | (19.3 | ) | 19.3 | 1,482.3 | |||||||||||||||||||
| Net earnings |
— | — | 147.1 | — | — | — | — | 147.1 | ||||||||||||||||||||||
| Foreign currency translation adjustments |
— | — | — | 26.7 | — | — | — | 26.7 | ||||||||||||||||||||||
| Net actuarial (losses) associated with pension and other postretirement benefits, net of income taxes of $1.9 |
— | — | — | (2.7 | ) | — | — | — | (2.7 | ) | ||||||||||||||||||||
| Amortization of prior service cost and unrecognized gains included in net periodic benefit cost, net of income taxes of $(9.2) |
— | — | — | 15.5 | — | — | — | 15.5 | ||||||||||||||||||||||
| Derivatives qualifying as hedges: |
||||||||||||||||||||||||||||||
| Net derivative losses, net of income taxes of $5.3 |
— | — | — | (8.5 | ) | — | — | — | (8.5 | ) | ||||||||||||||||||||
| Reclassification to income, net of income taxes of $4.9 |
— | — | — | (8.0 | ) | — | — | — | (8.0 | ) | ||||||||||||||||||||
| Other/Total Comprehensive Income |
$ | 23.0 | $ | 170.1 | ||||||||||||||||||||||||||
| Shares issued under stock option and benefit plans |
— | (9.5 | ) | — | — | — | — | — | (9.5 | ) | ||||||||||||||||||||
| Share-based compensation expense |
— | 33.5 | — | — | — | — | — | 33.5 | ||||||||||||||||||||||
| Issuance of common stock |
0.5 | 238.0 | — | — | 90.3 | — | — | 328.8 | ||||||||||||||||||||||
| Tax benefit from exercise of non-qualified stock options |
— | 3.3 | — | — | — | — | — | 3.3 | ||||||||||||||||||||||
| Dividends to stockholders |
— | — | (46.0 | ) | — | — | — | — | (46.0 | ) | ||||||||||||||||||||
| Repurchases of treasury stock |
— | — | — | — | (1.3 | ) | — | — | (1.3 | ) | ||||||||||||||||||||
| Repurchases of common stock held in grantor trust |
— | — | — | — | — | (2.0 | ) | 2.0 | — | |||||||||||||||||||||
| Balance December 31, 2009 |
$ | 7.4 | $ | 886.8 | $ | 1,482.7 | $ | (176.8 | ) | $ | (238.9 | ) | $ | (21.3 | ) | $ | 21.3 | $ | 1,961.2 | |||||||||||
See accompanying notes to consolidated financial statements.
| BEC 2009 FORM 10-K | 51 |
Table of Contents
Consolidated Statements of Cash Flows
(in millions)
| Years Ended December 31, | ||||||||||||
| 2009 | 2008 | 2007 | ||||||||||
| Cash flows from operating activities |
||||||||||||
| Net earnings |
$ | 147.1 | $ | 186.0 | $ | 203.7 | ||||||
| Less: Earnings from discontinued operations, net of tax |
— | — | 1.6 | |||||||||
| Earnings from continuing operations |
147.1 | 186.0 | 202.1 | |||||||||
| Adjustments to reconcile net earnings from continuing operations to net cash provided by operating activities |
||||||||||||
| Depreciation and amortization |
319.0 | 255.9 | 203.0 | |||||||||
| Provision for doubtful accounts receivable |
4.5 | 6.8 | 4.7 | |||||||||
| Share-based compensation expense |
35.8 | 29.6 | 24.5 | |||||||||
| Loss (gain) on asset disposals and sales |
14.8 | (1.0 | ) | (19.9 | ) | |||||||
| U.S. pension trust contributions |
(74.0 | ) | (8.2 | ) | (9.3 | ) | ||||||
| Accreted interest on convertible debt |
14.4 | 13.7 | 13.0 | |||||||||
| Amortization of pension and postretirement costs |
24.0 | 9.8 | 6.8 | |||||||||
| In-process research and development |
— | — | 35.4 | |||||||||
| Deferred income taxes |
38.2 | (21.1 | ) | (24.4 | ) | |||||||
| Changes in assets and liabilities, net of acquisitions |
||||||||||||
| Trade and other receivables |
7.2 | (7.3 | ) | (25.5 | ) | |||||||
| Prepaid and other current assets |
(3.2 | ) | 26.2 | (27.2 | ) | |||||||
| Inventories |
(4.2 | ) | 18.3 | (50.5 | ) | |||||||
| Accounts payable and accrued expenses |
51.6 | (46.4 | ) | 64.4 | ||||||||
| Income taxes payable |
(23.6 | ) | (16.3 | ) | (1.4 | ) | ||||||
| Long-term lease receivables |
14.5 | 14.5 | 10.0 | |||||||||
| Environmental remediation obligation |
(0.8 | ) | 18.4 | — | ||||||||
| Other |
3.3 | (4.1 | ) | (7.6 | ) | |||||||
| Net cash provided by operating activities of continuing operations |
568.6 | 474.8 | 398.1 | |||||||||
| Net cash used in operating activities of discontinued operations |
— | — | (1.0 | ) | ||||||||
| Net cash provided by operating activities |
568.6 | 474.8 | 397.1 | |||||||||
| Cash flows from investing activities |
||||||||||||
| Additions to property, plant and equipment |
(163.4 | ) | (92.3 | ) | (107.9 | ) | ||||||
| Additions to customer leased instruments |
(167.1 | ) | (207.5 | ) | (166.5 | ) | ||||||
| Proceeds from sales of building and land |
— | 7.4 | 30.9 | |||||||||
| Sale of marketable securities |
— | — | 17.7 | |||||||||
| Payments for technology licenses |
(6.0 | ) | (2.7 | ) | (24.5 | ) | ||||||
| Payments for business acquisitions, net of cash acquired |
(802.3 | ) | (10.8 | ) | (93.7 | ) | ||||||
| Net cash used in investing activities of continuing operations |
(1,138.8 | ) | (305.9 | ) | (344.0 | ) | ||||||
| Net cash provided by investing activities of discontinued operations |
— | — | 2.6 | |||||||||
| Net cash used in investing activities |
(1,138.8 | ) | (305.9 | ) | (341.4 | ) | ||||||
| Cash flows from financing activities |
||||||||||||
| Dividends to stockholders |
(46.0 | ) | (42.6 | ) | (40.4 | ) | ||||||
| Distribution to minority shareholders |
— | — | (14.2 | ) | ||||||||
| Proceeds from issuance of stock |
323.6 | 79.4 | 87.0 | |||||||||
| Repurchase of common stock as treasury stock |
(1.3 | ) | (94.4 | ) | (57.3 | ) | ||||||
| Repurchase of common stock held in grantor trust |
(2.0 | ) | (1.5 | ) | (1.0 | ) | ||||||
| Excess tax benefits from share-based payment transactions |
6.6 | 11.9 | 20.7 | |||||||||
| Tax benefit on distribution of stock |
— | — | 1.3 | |||||||||
| Net payments on lines of credit |
(31.3 | ) | (73.3 | ) | (42.5 | ) | ||||||
| Proceeds from issuance of long-term debt |
497.8 | — | — | |||||||||
| Debt repayments |
— | (7.7 | ) | (4.9 | ) | |||||||
| Debt issuance costs |
(10.4 | ) | — | (1.5 | ) | |||||||
| Net cash provided by (used in) financing activities |
737.0 | (128.2 | ) | (52.8 | ) | |||||||
| Effect of exchange rates on cash and cash equivalents |
2.0 | (3.7 | ) | 4.9 | ||||||||
| Change in cash and cash equivalents |
168.8 | 37.0 | 7.8 | |||||||||
| Cash and cash equivalents-beginning of year |
120.0 | 83.0 | 75.2 | |||||||||
| Cash and cash equivalents-end of year |
$ | 288.8 | $ | 120.0 | $ | 83.0 | ||||||
See accompanying notes to consolidated financial statements.
| 52 | BEC 2009 FORM 10-K |
Table of Contents
Notes to Consolidated Financial Statements
(tabular dollar amounts in millions, except amounts per share)
Note 1. Nature of Business and Summary of Significant Accounting Policies
Nature of Business
Beckman Coulter, Inc. (the “Company”, “we”, “our”) is a leading manufacturer of biomedical testing instrument systems, tests and supplies that simplify and automate laboratory processes. Spanning the biomedical testing continuum — from pioneering medical research and clinical trials to laboratory diagnostics and point-of-care testing — our installed base of systems provides essential biomedical information to improve patient health and reduce the cost of care.
Our revenue is about evenly distributed inside and outside of the United States. Clinical Diagnostics sales represent 86% of our total revenue, with the balance coming from the Life Science markets. Approximately 81% of our total revenue is generated by recurring revenue from consumable supplies (including reagent test kits), services and operating type lease (“OTL”) payments. Central laboratories of mid-to large-size hospitals represent our most significant customer group.
Principles of Consolidation
The Consolidated Financial Statements include the accounts of the Company, its wholly owned subsidiaries and accounts of consolidated variable interest entities. All significant intercompany transactions have been eliminated from the Consolidated Financial Statements.
Use of Estimates
We follow generally accepted accounting principles in the United States of America (“U.S. GAAP”), which requires us to make estimates and assumptions about future events. These estimates and the underlying assumptions affect the reported amounts of assets, liabilities, revenue and expenses, and disclosures about contingent assets and liabilities. Such estimates include the valuation of accounts receivable, inventories, and long-lived assets, legal contingencies, lives of customer leased instruments, lives of plant and equipment, lives of intangible assets, and assumptions used in the calculation of warranty accruals, employee benefit plan obligations, environmental and litigation obligations, taxes, share-based compensation and others. These estimates and assumptions are based on management’s best estimates and judgment and affect the amounts reported in the consolidated financial statements and accompanying notes. Management evaluates its estimates and assumptions on an ongoing basis using historical experience and other factors, including the current economic environment, which management believes to be reasonable under the circumstances. We adjust such estimates and assumptions when facts and circumstances dictate. As future events and their effects cannot be determined with precision, actual results could differ significantly from these estimates. Changes in those estimates will be reflected in the financial statements in future periods.
Foreign Currency Translation
Our reporting currency is the US dollar. The translation of our results of operations and financial position of subsidiaries with non-US dollar functional currencies subjects us to currency exchange rate fluctuations in our results of operations and financial position. Assets and liabilities of subsidiaries with non-US dollar functional currencies are translated into US dollars at fiscal period-end exchange rates. Income, expense and cash flow items are translated at weighted average exchange rates prevailing during the fiscal period. The resulting currency translation adjustments are recorded as a component of accumulated other comprehensive loss within stockholders’ equity. Our primary currency translation exposures were related to entities having functional currencies denominated in the Euro, Japanese Yen, British Pound Sterling, Canadian dollar and Chinese Renminbi.
Cash and Cash Equivalents
Cash and cash equivalents include cash in banks, time deposits and investments having original maturities of three months or less.
| BEC 2009 FORM 10-K | 53 |
Table of Contents
Notes to Consolidated Financial Statements (Continued)
(tabular dollar amounts in millions, except amounts per share)
Fair Value of Financial Instruments
The carrying values of our financial instruments approximate their fair value at December 31, 2009 and 2008, except for long-term debt (see Note 9 “Debt and Equity Financing”). Management estimates are used to determine the market value of cash and cash equivalents, trade and other receivables, notes payable, accounts payable and amounts included in other current assets, other assets and accrued expenses meeting the definition of a financial instrument. Concentrations of credit risk with respect to receivables are limited due to the large number of customers and their dispersion across worldwide geographic areas. Quotes from financial institutions are used to determine market values of our debt, pension assets and derivative financial instruments. The carrying value and fair value of our long-term debt at December 31, 2009 was $1,330.0 million and $1,543.9 million, respectively. The carrying value and fair value of our long-term debt at December 31, 2008 was $823.4 million and $835.4 million, respectively. The Company estimates the fair value of long term debt through quoted prices in active markets that are unadjusted and accessible on the measurement date.
Derivative Financial Instruments and Hedging Activities
We recognize all derivatives as either assets or liabilities at fair value. Changes in the fair value of derivatives designated as fair value hedges and of the hedged item attributable to the hedged risk are recognized in cost of sales. If the derivative is designated as a cash flow hedge, the effective portion of the fair value of the derivative is recorded in accumulated other comprehensive income (loss) (i.e., derivatives qualifying as hedges) and is subsequently recognized in cost of sales upon the recognition of the hedged transaction. Ineffective portions of changes in the fair value of cash flow hedges are immediately recognized in other non-operating expense (income).
Allowance for Doubtful Accounts
We maintain allowances for doubtful accounts for estimated losses resulting from the inability of our customers to make required payments. These allowances are determined by analyzing specific customer accounts that have known or potential collection issues, and applying an estimated loss rate to the aging of the remaining account receivable balances. The estimated loss rate is based on our historical loss experience and also contemplates current market conditions.
Inventories
Inventories are valued at the lower of cost, using the first-in, first-out method, or market (net realizable value).
Property, Plant and Equipment and Depreciation
Land, buildings, machinery and equipment are carried at cost. The cost of additions and improvements are capitalized, while maintenance and repairs are expensed as incurred. Depreciation is calculated based on the straight-line method over the estimated useful lives of the assets as follows:
| Estimated Useful Life | ||
| Buildings |
20-40 years | |
| Machinery and equipment |
3-10 years | |
| Software for internal use |
10 years | |
| Leasehold improvements |
Lesser of life of the asset or term of the lease |
Software for Internal Use
We capitalize certain internal and external costs incurred to acquire or create internal use computer software, principally related to software coding, designing system interfaces and installation and testing of the software. We capitalize interest on these costs for significant projects. We amortize computer software costs for each module or component over its estimated useful life, generally 10 years for software related to our enterprise resource planning (ERP) system.
Customer Leased Instruments
Customer leased instruments are carried at cost. Depreciation is calculated based on the straight-line method over the estimated useful lives of the assets, five to seven years.
| 54 | BEC 2009 FORM 10-K |
Table of Contents
Notes to Consolidated Financial Statements (Continued)
(tabular dollar amounts in millions, except amounts per share)
The economic life of our leased instruments and their fair value require significant accounting estimates and judgment. These estimates are based on our historical experience. The most objective measure of historical evidence of the economic life of our leased instruments is the original term of a lease, which is typically five years. The economic life of products acquired in connection with the Olympus Diagnostics Systems (“Olympus”) acquisition is estimated to be seven years based upon the instruments’ historical experience in the field and experience with lease renewals for the Olympus equipment. We believe these lives represent the periods during which the instruments are expected to be economically usable, with normal service, for the purposes for which they are intended. There is not a significant after-market for our used instruments without substantial remanufacturing. We regularly evaluate the economic life of existing and new products for purposes of this determination.
Goodwill and Other Intangible Assets
Goodwill and purchased intangible assets that have indefinite lives are not amortized but instead are tested at least annually for impairment or more frequently if events or changes in circumstances indicate that the assets might be impaired. We perform our annual impairment test in the fourth quarter.
Goodwill – For purposes of our goodwill impairment test, a two-step test is used to identify the potential impairment and to measure the amount of goodwill impairment, if any. The first step is to compare the fair value of the reporting unit with its carrying amount, including goodwill. If the fair value of the reporting unit exceeds its carrying amount, goodwill is considered not impaired. If the carrying amount of a reporting unit exceeds its fair value, the second step of the goodwill impairment test is performed to measure the amount of impairment loss, if any. Under step two, the impairment loss is measured by comparing the implied fair value of the reporting unit goodwill with the carrying amount of that goodwill. If the carrying amount of the reporting unit goodwill exceeds the implied fair value of that goodwill, an impairment loss is recognized in an amount equal to that excess.
Intangible assets – Intangible assets consist primarily of patents, trademarks, tradename, developed technology and customer relationships arising from business acquisitions. Purchased intangible assets are carried at cost, net of accumulated amortization. Intangible assets with finite lives are amortized over their estimated useful lives using the straight-line method. Our impairment test consists of a comparison of the fair value of the intangible asset with its carrying amount. If the carrying amount of an intangible asset exceeds its fair value, an impairment loss is recognized in an amount equal to the excess.
| Estimated Useful Life | ||
| Technology |
4 -25 years | |
| Customer relationships |
5 -25 years | |
| Core technology |
20 years | |
| Other intangibles |
3 -15 years |
Accounting for Long-Lived Assets
Long-lived assets are reviewed for impairment whenever events or changes in circumstances indicate that the carrying value of an asset may not be recoverable. We assess the recoverability of the assets based on the undiscounted future cash flow the assets are expected to generate and recognize an impairment loss when estimated undiscounted future cash flow expected to result from the use of the asset plus net proceeds expected from disposition of the asset, if any, are less than the carrying value of the asset. When we identify an impairment, we reduce the carrying amount of the asset to its estimated fair value based on a discounted cash flow approach or, when available and appropriate, to comparable market values.
Revenue Recognition
The vast majority of our revenue is generated from consumable supplies (including reagent test kits), service and OTL payment arrangements. Approximately 81% of our total revenue in 2009 was generated by this type of revenue, which we refer to as “recurring revenue.” The remaining balance of revenue is derived from “instrument sales,” which consists primarily of sales made under normal trade terms. Instrument sales also include lease arrangements that qualify as a sales type lease (“ STL”) when certain criteria are met. See below for a further discussion of these lease arrangements.
Revenue is recognized when persuasive evidence of an arrangement exists, the price to the buyer is fixed or determinable, collectability is reasonably assured and risk of loss transfers, normally upon delivery. For instrument sales that include customer specific acceptance criteria, revenue is recognized when the acceptance criteria have been met. Credit is extended based upon the
| BEC 2009 FORM 10-K | 55 |
Table of Contents
Notes to Consolidated Financial Statements (Continued)
(tabular dollar amounts in millions, except amounts per share)
evaluation of the customer’s financial condition and we generally do not require collateral. When a customer enters into an OTL agreement, instrument lease revenue is recognized on a straight-line basis over the life of the lease, while the cost of the leased equipment is carried as customer leased instruments within property, plant and equipment and depreciated over its estimated useful life. Under an STL agreement, the instrument sale revenue and related cost is generally recognized at the time of customer shipment based on the present value of the minimum lease payments with interest income recognized over the life of the lease using the interest method. Supplies and test kit revenue is generally recognized at the time of delivery or usage. Service revenue on maintenance contracts is recognized ratably over the life of the service agreement or as service is performed, if not under contract.
For those STL and sale agreements that include multiple deliverables, such as installation, training, after-market supplies or service, we allocate revenue based on the relative fair values of the individual components as determined by a range of cash selling prices or other verifiable objective evidence for the instruments and other deliverables. We regularly evaluate available objective evidence of instrument fair value using historical data. Our allocation of revenue for future sales could be affected by changes in estimates of the relative fair value of the various deliverables, which could affect the timing of revenue recognition and allocation between instrument, consumable supplies and service.
Our accounting for leases involves specific determinations, which often involve complex provisions and significant judgments. The four criteria of the accounting standard that we use in the determination of an STL or OTL are 1) a review of the lease term to determine if it is equal to or greater than 75 percent of the economic life of the equipment; 2) a review of the minimum lease payments to determine if they are equal to or greater than 90 percent of the fair market value of the equipment; 3) a determination of whether or not the lease transfers ownership to the lessee at the end of the lease term; and 4) a determination of whether or not the lease contains a bargain purchase option. Additionally, we assess whether collectibility of the lease payments is reasonably assured and whether there are any significant uncertainties related to costs that we have yet to incur with respect to the lease. Generally, our leases that qualify as STLs are non-cancelable leases with a term of 75 percent or more of the economic life of the equipment. Our OTLs are generally cancellable after the first two years. Certain of our lease contracts are customized for larger customers and often result in complex terms and conditions that typically require significant judgment in applying the lease accounting criteria. Revenue recognized under STL arrangements was not significant and represents a small portion of our total revenue, since we primarily use leases which meet the criteria for OTLs.
Leases and Asset Retirement Obligations
We account for our lease agreements as a lessee as either operating or capital leases depending on certain defined criteria at the inception of the lease. Most of our leases are operating type leases. Leasehold improvements are capitalized at cost and amortized over the lesser of their expected useful life or the life of the lease, considering renewal features which may be exercised at our option. We establish assets and liabilities for the present value of estimated future costs to return certain of our leased facilities to their original condition. Such assets are depreciated over the lease period into operating expense and the recorded liabilities are accreted to the future value of the estimated restoration costs.
Environmental Obligations
Our compliance with federal, state and foreign environmental laws and regulations may require us to remove or mitigate the effects of the disposal or release of chemical substances in jurisdictions where we do business or maintain properties. We establish accruals when such costs are probable and can be reasonably estimated. Accrual amounts are estimated based on currently available information, regulatory requirements, remediation strategies, historical experience, our relative shares of the total remediation costs and a relevant discount rate, when the time periods of estimated costs can be reasonably predicted. Changes in these assumptions could impact our future reported results.
Product Warranty Obligation
We record a liability for product warranty obligations at the time of sale based upon historical warranty experience. The term of the warranty is generally twelve months. We also record an additional liability for specific warranty matters when they become known and are reasonably estimable. Our product warranty obligations are included in accrued expenses in the accompanying consolidated balance sheets. Changes in product warranty obligations are as follows:
| 2009 | 2008 | 2007 | ||||||||||
| Beginning of year |
$ | 12.4 | $ | 12.5 | $ | 11.1 | ||||||
| Current period warranty charges |
19.4 | 20.4 | 16.0 | |||||||||
| Olympus |
2.4 | — | — | |||||||||
| Current period utilization |
(20.4 | ) | (20.5 | ) | (14.6 | ) | ||||||
| End of year |
$ | 13.8 | $ | 12.4 | $ | 12.5 | ||||||
| 56 | BEC 2009 FORM 10-K |
Table of Contents
Notes to Consolidated Financial Statements (Continued)
(tabular dollar amounts in millions, except amounts per share)
Taxes Collected from Customers and Remitted to Governmental Authorities
Taxes are assessed by various governmental authorities on sales and leases. We record taxes collected from customers and remitted to governmental authorities on a net basis (excluded from revenue).
Income Taxes
We utilize the asset and liability method of accounting for income taxes and recognize deferred income taxes for the tax consequences of temporary differences by applying enacted statutory tax rates applicable to future years to the difference between the financial statement carrying amounts and the tax bases of existing assets and liabilities and for tax credit carryforwards. The effect on deferred taxes of a change in tax rates is recognized in income in the period that includes the enactment date.
We have established a valuation allowance to reduce deferred tax assets to an amount whose realization is more likely than not. An increase or decrease to income could occur if we determine that we are able to utilize more or less of these deferred tax assets than currently expected.
Liabilities are recorded for more likely than not income tax assessments based on estimates of potential tax related exposures. Accounting for these assessments requires significant judgment as uncertainties often exist in respect to existing tax laws, new interpretations of existing laws and rulings by taxing authorities. Differences between actual results and assumptions, or changes in assumptions in future periods, are recorded in the period they become known.
Share-Based Compensation
We record share-based compensation expense based upon the grant date fair value of share-based awards. We use the Black-Scholes Merton (“BSM”) option-pricing model, which incorporates various assumptions including volatility, expected life and interest rates to determine fair value. The expected life is based on the observed and expected time to post-vesting exercise and forfeitures of stock options by our employees. We used a combination of historical and implied volatility, or blended volatility, in deriving the expected volatility assumption. The risk-free interest rate assumption is based upon observed interest rates appropriate for the term of our stock options. The dividend yield assumption is based on our history and expectation of dividend payouts. We estimate forfeitures at the time of grant based on our historical experience and revise our estimates, if necessary, in subsequent periods if actual forfeitures differ. The expected term of the stock options was determined using historical data adjusted for the estimated exercise dates of unexercised options.
Retirement Benefits
We recognize the funded status of pension and postretirement benefit plans in our consolidated balance sheets. Unrecognized actuarial gains and losses, prior service costs or credits, and any remaining transition assets or obligations are recognized in accumulated other comprehensive income (loss) in stockholders’ equity, net of tax effects, until they are amortized as a component of net periodic benefit cost.
Our funding policy provides that payments to our domestic pension trusts shall at least be equal to the minimum funding requirements of the Employee Retirement Income Security Act of 1974.
Recently Adopted Accounting Standards
Subsequent Events
We evaluated subsequent events that occurred after the balance sheet date and through the date we issued our financial statements on February 22, 2010.
Fair Value Measurements
In September 2006, the FASB issued authoritative standards for fair value measurements and disclosures which defines fair value, establishes a framework for measuring fair value and expands disclosures related to assets and liabilities measured at fair value. In February 2008, the FASB delayed the effective date of these standards to fiscal years beginning after November 15, 2008 for all nonfinancial assets and nonfinancial liabilities that are recognized or disclosed at fair value in the financial statements on a
| BEC 2009 FORM 10-K | 57 |
Table of Contents
Notes to Consolidated Financial Statements (Continued)
(tabular dollar amounts in millions, except amounts per share)
nonrecurring basis. We adopted all provisions of these standards as of January 1, 2008, except for the guidance applicable to non-recurring nonfinancial assets and nonfinancial liabilities. As of January 1, 2009, we adopted the remaining provisions of these standards and there was no material impact on our consolidated financial position, results of operations and cash flows. See Note 4 “Fair Value Measurements” for further information.
In general, fair values determined by Level 1 inputs utilize quoted prices (unadjusted) in active markets for identical assets or liabilities. Fair values determined by Level 2 inputs utilize data points that are observable such as quoted prices, interest rates and yield curves. Fair values determined by Level 3 inputs are unobservable data points for the asset or liability and include situations where there is little, if any, market activity for the asset or liability.
Accounting for Convertible Debt Instruments That May be Settled in Cash Upon Conversion
In May 2008, the FASB issued an accounting standard for debt with conversion and other options. Convertible debt securities that may be settled in cash (or other assets), including partial cash settlement, are separated into a debt and an equity component. The value assigned to the debt component as of the issuance date is the estimated fair value based on a similar debt instrument without the conversion feature. The difference between the proceeds obtained for the securities and the estimated fair value assigned to the debt component represents the equity component. As a result, the debt is recorded at a discount reflecting its below market coupon interest rate and is subsequently accreted to its par value over its expected life, using the rate of interest that reflects the market rate at issuance. We adopted this standard retrospectively and adjusted amounts previously reported related to our convertible notes which were issued in December 2006.
In December 2006, we issued $600.0 million of convertible notes at a coupon rate of 2.50% (the” Convertible Notes”), as described in Note 9 “Debt and Equity Financing”. The Convertible Notes have a conversion feature that allows the holders of the Convertible Notes to convert their investment into common stock. Upon adoption of the standard we assigned a fair value of $493.8 million to the debt component of the Convertible Notes based on a similar debt instrument without the conversion feature. The market rate of interest applied to determine that value was 5.59%. The difference between the proceeds obtained and the fair value of the debt component was assigned to the equity component and recorded as additional paid-in capital. The resulting debt discount is amortized over the initial term of seven years, of which four years are remaining as of December 31, 2009. Interest cost for the years 2009, 2008 and 2007 included the stated interest coupon of $15.0 million for each year, and amortization of the discount in the amount of $14.4 million, $13.6 million and $12.9 million for the years 2009, 2008 and 2007, respectively. The adoption of this standard as of January 1, 2009, was applied retrospectively and reduced net earnings by $8.0 million and $7.6 million and diluted earnings per share by $0.12 and $0.12 for the years 2008 and 2007, respectively. Additional paid-in capital and retained earnings also increased by $62.3 million and decreased by $0.4 million, respectively, as of January 1, 2007.
The following table sets forth the effect of the retrospective application of this standard on certain previously reported line items:
Consolidated Statements of Earnings:
| 2008 | 2007 | |||||||||||
| As Previously Reported |
As Adjusted | As Previously Reported |
As Adjusted | |||||||||
| Interest expense |
$ | 47.6 | $ | 60.8 | $ | 49.3 | $ | 61.7 | ||||
| Income taxes |
$ | 57.9 | $ | 52.6 | $ | 83.0 | $ | 78.1 | ||||
| Net earnings |
$ | 194.0 | $ | 186.0 | $ | 211.3 | $ | 203.7 | ||||
| Basic earnings per share |
$ | 3.08 | $ | 2.95 | $ | 3.38 | $ | 3.26 | ||||
| Diluted earnings per share |
$ | 3.01 | $ | 2.89 | $ | 3.30 | $ | 3.18 | ||||
| 58 | BEC 2009 FORM 10-K |
Table of Contents
Notes to Consolidated Financial Statements (Continued)
(tabular dollar amounts in millions, except amounts per share)
Consolidated Balance Sheets:
| December 31, 2008 | ||||||
| As Previously Reported |
As Adjusted | |||||
| Long-term debt, less current maturities |
$ | 896.3 | $ | 819.0 | ||
| Additional paid-in capital |
$ | 559.2 | $ | 621.5 | ||
| Deferred income tax assets |
$ | 32.3 | $ | 1.3 | ||
| Retained earnings |
$ | 1,397.6 | $ | 1,381.6 | ||
The following table provides additional information about our convertible notes:
| December 31, 2009 | December 31, 2008 | |||||
| Principal amount of the liability component |
$ | 600.0 | $ | 600.0 | ||
| Unamortized discount of liability component |
$ | 64.7 | $ | 79.1 | ||
| Net carrying amount of liability component |
$ | 535.3 | $ | 520.9 | ||
| Carrying amount of the equity component |
$ | 103.7 | $ | 103.7 | ||
Business Combinations
Effective January 1, 2009, we account for business combinations using the acquisition method of accounting. The acquisition method requires an acquirer to recognize the assets acquired, the liabilities assumed, and any noncontrolling interest in the acquiree at the acquisition date, measured at their fair values as of that date. The provisions of the acquisition method related to income tax adjustments apply to all business combinations regardless of consummation date. As a result of implementing the acquisition method, acquisition costs of $35.8 million, which included legal, accounting and investment banking fees were expensed and $10.2 million of in-process research and developments costs were capitalized during the year ended December 31 2009, respectively, in connection with the Olympus and Cogenics acquisitions. Additionally, severance liabilities associated with these acquisitions were expensed during the year ended December 31, 2009. Both acquisitions are further described in Note 3, “Acquisitions.” Also see Note 5, “Restructuring Activities and Asset Impairment Charges,” for further discussion of these acquisition costs.
Fair value is defined as the price that would be received to sell an asset or paid to transfer a liability in an orderly transaction between market participants at the measurement date. This is an exit price concept for the valuation of the asset or liability. In addition, market participants are assumed to be buyers and sellers in the principal market for the asset or liability. Fair value measurements for an asset assume the highest and best use by these market participants. As a result of these standards, we may be required to record assets which we do not intend to use or sell (defensive assets) and/or to value assets at fair value measures that do not reflect our intended use of those assets. Many of these fair value measurements can be highly subjective and it is also possible that other professionals, applying reasonable judgment to the same facts and circumstances, could develop and support a range of alternative estimated amounts.
Determining Whether an Instrument (or Embedded Feature) Is Indexed to an Entity’s Own Stock
We adopted the guidance in a new accounting standard to evaluate contracts in our own equity as of January 1, 2009. This standard mandates a two-step process for evaluating whether an equity-linked financial instrument or embedded feature is indexed to the entity’s own stock, including evaluating the instrument’s contingent exercise and settlement provisions. The adoption of this standard as of January 1, 2009 did not have a material impact on our consolidated financial position, results of operations and cash flows. As further discussed in Note 9, “Debt and Equity Financing,” we entered into forward sale agreements to sell equity to finance a portion of the acquisition of Olympus. The forward sale agreements were considered indexed to the Company’s own stock after being evaluated and appropriately classified as equity.
New Accounting Standards Not Yet Adopted
Revenue Arrangements with Multiple Deliverables
In October 2009, the FASB issued an update to the accounting standard for revenue recognition related to multiple-element arrangements, which in certain instances requires companies to allocate revenue in arrangements involving multiple deliverables based on the estimated selling price of each deliverable, even though such deliverables are not sold separately either by the company itself or other vendors. This standard eliminates the requirement that all undelivered elements must have objective and reliable
| BEC 2009 FORM 10-K | 59 |
Table of Contents
Notes to Consolidated Financial Statements (Continued)
(tabular dollar amounts in millions, except amounts per share)
evidence of fair value before a company can recognize the portion of the overall arrangement fee that is attributable to items that already have been delivered. As a result, the new guidance may allow some companies to recognize revenue on transactions that involve multiple deliverables earlier than under previous requirements. This standard will be effective for us beginning in the first quarter of fiscal year 2011. Early adoption is permitted. We are currently evaluating the requirements of the standard on our consolidated financial position, results of operations and cash flows.
Certain Revenue Arrangements That Include Software Elements
In October 2009, the FASB issued an update to the accounting standard for software revenue recognition. This standard reduces the types of transactions that fall within the current scope of software revenue recognition guidance. Existing software revenue recognition guidance requires that its provisions be applied to an arrangement when the sale of any products or services containing or utilizing software when the software is considered more than incidental to the product or service. As a result of the update to the accounting standard, many tangible products that rely on software will not be accounted for under the software revenue recognition guidance. Under this update, the following components would be excluded from the scope of software revenue recognition guidance: the tangible element of the product, software products bundled with tangible products where the software components and non-software components function together to deliver the product’s essential functionality, and undelivered components that relate to software that is essential to the tangible product’s functionality. The amendment also provides guidance on how to allocate transaction consideration when an arrangement contains both deliverables within the scope of software revenue guidance (software deliverables) and deliverables not within the scope of that guidance (non-software deliverables). This standard will be effective for us beginning January 1, 2011. We may elect to adopt the provisions prospectively to new or materially modified arrangements beginning on the effective date or retrospectively for all periods presented. However, we must elect the same transition method for this guidance as that chosen for by the accounting standard update for revenue recognition, related to multiple-element arrangements discussed above. We are currently evaluating the impact of this standard on our consolidated financial position, results of operations and cash flows.
Accounting for Transfers of Financial Assets
In June 2009, the FASB issued an accounting standard for transfers and servicing of financial assets. This guidance removes the concept of a qualifying special-purpose entity (“QSPE”) from the accounting standard for transfers and servicing and removes the exception from applying “Consolidation of Variable Interest Entities” from the accounting standard for consolidation. This guidance also clarifies the requirements for isolation and limitations on portions of financial assets that are eligible for sale accounting. This guidance is effective for fiscal years beginning after November 15, 2009. We are currently evaluating the impact, if any, of the adoption of this standard on our consolidated financial position, results of operations and cash flows.
Change in Presentation
We have a hedging program to reduce the risk of foreign currency changes on cash flows generated from intercompany inventory purchases. In the first quarter of 2009, our results of operations were impacted more significantly by currency changes, a portion of which was offset by the results of our hedging program. To reflect this net currency impact on our operating results, we have reclassified our gains and losses related to cash flow hedging activities and related foreign currency transactions to cost of sales from non-operating income or expense for all periods presented. The amounts reclassified for the prior periods were not material.
Note 2. Composition of Certain Financial Statement Captions and Supplemental Disclosures of Cash Flow Information
The following provides components of certain financial statement captions:
| 2009 | 2008 | |||||||
| Trade and other receivables, net |
||||||||
| Trade receivables |
$ | 780.2 | $ | 668.8 | ||||
| Other receivables |
35.6 | 30.1 | ||||||
| Current portion of STL receivables |
32.4 | 29.1 | ||||||
| Less allowance for doubtful accounts |
(20.3 | ) | (21.3 | ) | ||||
| $ | 827.9 | $ | 706.7 | |||||
| Inventories |
||||||||
| Raw materials, parts and assemblies |
$ | 180.4 | $ | 156.5 | ||||
| 60 | BEC 2009 FORM 10-K |
Table of Contents
Notes to Consolidated Financial Statements (Continued)
(tabular dollar amounts in millions, except amounts per share)
| 2009 | 2008 | |||||||
| Work in process |
29.5 | 19.2 | ||||||
| Finished products |
386.9 | 320.5 | ||||||
| $ | 596.8 | $ | 496.2 | |||||
| Property, plant and equipment, net |
||||||||
| Land |
$ | 19.3 | $ | 3.4 | ||||
| Buildings, machinery and equipment |
838.2 | 685.9 | ||||||
| Software for internal use |
353.7 | 317.4 | ||||||
| 1,211.2 | 1,006.7 | |||||||
| Less accumulated depreciation |
||||||||
| Buildings, machinery and equipment |
(461.0 | ) | (441.8 | ) | ||||
| Software for internal use |
(128.3 | ) | (99.4 | ) | ||||
| $ | 621.9 | $ | 465.5 | |||||
| Customer leased instruments |
$ | 1,056.7 | $ | 833.2 | ||||
| Less accumulated depreciation |
(533.7 | ) | (384.5 | ) | ||||
| $ | 523.0 | $ | 448.7 | |||||
| Accrued Expenses |
||||||||
| Unrealized service income |
$ | 124.8 | $ | 106.2 | ||||
| Accrued compensation |
162.4 | 154.5 | ||||||
| Accrued insurance |
12.1 | 20.5 | ||||||
| Accrued sales and other taxes |
40.0 | 24.4 | ||||||
| Accrued severance and other related costs |
41.9 | 10.2 | ||||||
| Accrued warranty |
13.8 | 12.4 | ||||||
| Olympus additional purchase price |
17.5 | — | ||||||
| Other |
127.6 | 88.7 | ||||||
| $ | 540.1 | $ | 416.9 | |||||
| Other liabilities |
||||||||
| Pension obligation in excess of plan assets |
$ | 249.4 | $ | 273.7 | ||||
| Postretirement obligation |
117.1 | 135.8 | ||||||
| Other |
186.1 | 186.4 | ||||||
| $ | 552.6 | $ | 595.9 | |||||
| 2009 | 2008 | 2007 | |||||||
| Supplemental Disclosures of Cash Flow Information |
|||||||||
| Cash paid during the period for: |
|||||||||
| Interest, net of capitalized interest |
$ | 66.3 | $ | 42.1 | $ | 45.5 | |||
| Income taxes |
$ | 85.6 | $ | 49.6 | $ | 98.0 | |||
| Non-cash investing and financing activities: |
|||||||||
| Liabilities incurred in connection with the purchase of property, plant and equipment |
$ | 10.8 | $ | 3.7 | $ | 8.8 | |||
| Liability incurred due to acquisition purchase price adjustment |
$ | 17.5 | $ | — | $ | — | |||
Depreciation expense was $279.4 million, $226.2 million, and $178.6 million for 2009, 2008 and 2007, respectively. Interest expense of $1.7 million, $1.7 million and $3.4 million was capitalized to property, plant and equipment in 2009, 2008, and 2007, respectively, related to internal use software under development.
| BEC 2009 FORM 10-K | 61 |
Table of Contents
Notes to Consolidated Financial Statements (Continued)
(tabular dollar amounts in millions, except amounts per share)
Note 3. Acquisitions
Olympus Diagnostics Systems Business
We entered into a master purchase agreement with Olympus Corporation, dated February 27, 2009, to acquire the laboratory-based diagnostics systems business which we refer to as Olympus or the Diagnostic Systems Business. On August 3, 2009, we completed the Olympus acquisition through a cash payment of approximately 76 billion Japanese yen (approximately U.S. $800 million based on currency exchange rates as of August 3, 2009). Based on an estimate of the final closing net assets, an additional $17.5 million was recorded as a liability for additional purchase price. The amount is subject to change upon final agreement regarding the final closing asset values.
The Olympus diagnostic systems business encompasses the development, manufacturing, marketing, sale, distribution and use of clinical chemistry and immunoassay analyzers, blood transfusion testing systems, and the chemical reagents and other consumables used with them, and related laboratory automation equipment, for in vitro diagnostic testing of samples from humans and animals. The completion of this transaction adds considerable product depth and significantly expands our geographic reach and increases scale in certain regions. We expect the Olympus business to fill some important gaps in our product line, in both the high-throughput and low-throughput market segments. Additionally, we have had success selling immunoassay to our chemistry customers. We have the same opportunity to continue our above-market growth in immunoassay by selling our immunoassay products to an entirely new base of loyal Olympus chemistry customers. Our strength in total lab automation should be complemented by Olympus’ strong pre-analytical automation position in Europe and Asia. Customers should benefit from the expanded range of products, particularly those large hospital and university laboratories where higher throughput systems are preferred. This acquisition is classified as part of our Clinical Diagnostics business segment.
On February 27, 2009, we also entered into forward contracts with various banks covering the full amount of the purchase price in order to hedge the risk of changes in the exchange rate of the Japanese yen versus the U.S. dollar between the signing and closing of the Olympus acquisition. The forward contracts transaction effectively fixed the U.S. dollar cost of the transaction at $780 million U.S. dollars. See Note 10, “Derivatives,” for further discussion. The acquisition was accounted for at the currency exchange rate in effect at the time the transaction was closed on August 3, 2009, which amounted to approximately $800 million. A $19.6 million gain on the settlement of the forward contracts was recorded in non-operating income for 2009.
The Olympus acquisition is accounted for under the acquisition method of accounting. Accordingly, we have estimated the fair values of the tangible and intangible assets acquired and liabilities assumed at the August 3, 2009 acquisition date. The initial accounting for the business combination is not complete until, among other things, the final closing net asset adjustment has been completed. The amounts recognized are subject to revision if additional information is obtained about the facts and circumstances that existed as of the acquisition date.
The following table summarizes the fair values assigned to the net assets acquired, including cash acquired of $14.5 million, as of the August 3, 2009 acquisition date:
| Range of Useful Lives | |||||
| Purchase price including estimated liability for closing net asset adjustment |
$ | 817.8 | |||
| Assets |
|||||
| Cash and cash equivalents |
14.5 | ||||
| Accounts receivable |
121.6 | ||||
| Inventories |
105.1 | ||||
| Intangible assets subject to amortization: |
|||||
| Trade names |
7.9 | 5 – 8 years | |||
| Developed technology |
100.3 | 4 – 8 years | |||
| In-process research and development |
10.2 | ||||
| Customer and dealer relationships |
71.5 | 6 – 10 years | |||
| Property, plant and equipment and customer leased instruments |
158.0 | 3 – 30 years | |||
| Deferred tax assets, net |
12.0 | ||||
| Other assets |
30.8 | ||||
| Total Assets Acquired |
631.9 | ||||
| 62 | BEC 2009 FORM 10-K |
Table of Contents
Notes to Consolidated Financial Statements (Continued)
(tabular dollar amounts in millions, except amounts per share)
| Liabilities |
|||
| Accounts payable |
61.8 | ||
| Accrued expenses |
24.0 | ||
| Deferred tax liabilities, net |
17.3 | ||
| Other liabilities |
46.7 | ||
| Total Liabilities Assumed |
149.8 | ||
| Goodwill |
$ | 335.7 | |
The fair value measurements of the intangible assets were based primarily on significant unobservable inputs and thus represent a Level 3 measurement as defined in Note 4, “Fair Value Measurements.”
We determined the fair value of trade names using the “relief from royalty” method, an approach under which fair value is estimated to be the present value of royalties saved because we own the intangible asset and therefore do not have to pay a royalty for its use. A royalty rate was selected based on consideration of several factors, including our external research of third party trade name licensing agreements and management estimates. The useful life was estimated based on a typical market participant’s likelihood of rebranding the name or merging the name with its own trade name and the discount rate was selected based on consideration of the weighted average cost of capital “WACC”, the weighted average rate of return “WARA”, and the internal rate of return “IRR”, as well as the risk and return characteristics.
The developed technology was valued utilizing the relief from royalty method. The royalty rate was selected based on consideration of external research of third party technology licensing agreements and management estimates. The estimated useful lives are based on our understanding of the technologies and the time it takes before the existing technology phases out. Lastly, the discount rate is selected based on the WACC, the WARA, and the IRR, as well as the risk and return characteristics.
The in-process research and development (“IPR&D”) was valued utilizing the relief from royalty method. Forecasted revenue and costs to complete assumptions were utilized, while the royalty rate was selected based on consideration of external research of third party technology licensing agreements, including management estimates. The estimated useful lives are based on our understanding of the stage of development of the IPR&D. Lastly, the discount rate was selected based on the WACC, the WARA, and the IRR, as well as the risk and return characteristics.
The customer and dealer relationships were valued utilizing the income approach. Estimated cash flow associated with the existing customers and dealers were estimated based on historical and market participant data. Lastly, the discount rate was selected based on consideration of the WACC, the WARA, and the IRR, as well as the risk and return characteristics.
Assets include accounts receivable with a fair value of $121.6 million and gross contractual amounts receivable of $122.5 million. We estimate that accounts receivable of $2.2 million will not be collected.
Goodwill largely consists of expected synergies resulting from the acquisition. The Company also anticipates that the transaction will produce significant growth synergies through the application of each product line’s innovative technologies and as a result of the combined businesses’ broader product portfolio in key geographies that have strong global growth rates. Goodwill also includes the assembled workforce of the Olympus business, which does not qualify for separate recognition as an intangible asset.
The goodwill associated with the Olympus acquisition is deductible for income tax purposes in certain jurisdictions. In the United States goodwill is amortizable and deductible over fifteen years and in other jurisdictions over varying periods of amortization. In a few jurisdictions the goodwill is not tax deductible. We estimate approximately $285 million of the total goodwill will be tax deductible over time.
Supplemental Pro Forma Information
Since the acquisition date, the Olympus acquisition has contributed $185.3 million of operating revenues and a pretax loss of $6.5 million (including interest expense associated with our $500 million debt offering of approximately $14 million) to our consolidated results. Excluded from the pretax loss is $22.1 million of increased cost of sales associated with Olympus products as a result of the roll-out of the fair value adjustment to inventory recorded in connection with the acquisition accounting.
| BEC 2009 FORM 10-K | 63 |
Table of Contents
Notes to Consolidated Financial Statements (Continued)
(tabular dollar amounts in millions, except amounts per share)
The following supplemental pro forma information presents the results of operations as if the Olympus acquisition had occurred at the beginning of the respective reporting periods:
| Years Ended December 31, | ||||||
| 2009 | 2008 | |||||
| Total revenue |
$ | 3,565.3 | $ | 3,623.4 | ||
| Net earnings |
219.3 | 184.1 | ||||
| Earnings per share |
||||||
| Basic |
3.31 | 2.72 | ||||
| Diluted |
3.25 | 2.67 | ||||
The supplemental pro forma information has been adjusted to include the pro forma impact of amortization of intangible assets and depreciation of property, plant and equipment, based on the purchase price allocation. Furthermore, the pro forma net earnings also includes the impact of additional interest expense associated with the financing of the acquisition but excludes acquisition, integration, restructure costs and foreign exchange gains related to the Olympus acquisition. The additional cost of sales as a result of the roll-out of the fair value adjustment to inventory is also excluded as those are not ongoing costs. The pro forma results are presented for illustrative purposes only and do not reflect the realization of potential cost savings, or any related acquisition or integration costs. Certain cost savings may result from the acquisition; however, there can be no assurance that these cost savings will be achieved. These pro forma results do not purport to be indicative of the results that would have actually been obtained if the acquisition occurred at the beginning of the respective reporting periods, nor is the pro forma data intended to be a projection of future results.
The supplemental pro forma information for the year ended December 31, 2008 combines our historical results for the year ended December 31, 2008 with the Olympus results for the year ended March 31, 2009. Accordingly, Olympus results of operations for the three months ended March 31, 2009 are included in the table above for both 2009 and 2008. Revenue and net earnings of Olympus for the three months ended March 31, 2009 were $127.2 million and $18.6 million, respectively.
Cogenics
On April 14, 2009, we entered into a stock purchase agreement with Clinical Data Inc. to acquire Cogenics, the genomics division of Clinical Data Inc. for $16.4 million. The Cogenics business includes DNA and RNA extraction, genotyping and gene expression, as well as multiple applications of Quantitative Polymerase Chain Reaction and services for cell bank characterization and biorepository, in both research and regulated environments.
Lumigen, Inc.
In November 2006, we acquired all outstanding shares of Lumigen, Inc. (“Lumigen”), for a purchase price of $187 million. Lumigen develops and manufactures novel detection chemistries for high-sensitivity testing in Clinical Diagnostics and Life Science research and supplies us with chemiluminescent reagents for assays used on our Access family of immunoassay systems. During 2009 and 2007, we released to Lumigen $10.0 million and $5.0 million, respectively, of the $15.0 million in deposits held in escrow for the resolution of future contingencies, and recorded additional goodwill.
NexGen Diagnostics, LLC
In connection with the acquisition of Lumigen, NexGen Diagnostics LLC (“NexGen”) was formed by certain former shareholders of Lumigen who held a combined 80.1% equity interest in NexGen and Lumigen who held the remaining 19.9% equity interest in NexGen. NexGen was formed to develop intellectual property into products. Concurrent with our acquisition of Lumigen, we employed the NexGen shareholders who are deemed related parties as defined under U.S. GAAP.
In November 2007, we acquired the remaining 80.1% interest in NexGen for a total purchase price of $36 million. The purchase price was allocated to a portfolio of intellectual property to be used in the research and development process, referred to as IPR&D. The IPR&D acquired relates to technology that is not yet proven and will require significant research and funding in order to commercialize the product. As such, we recorded a $35.4 million charge to write-off the value of the acquired IPR&D as technological feasibility had not been established and it was determined that the IPR&D had no alternative future uses.
Other than for our Olympus acquisition, supplementary information, such as results of operations on a pro forma basis have not been presented for the other acquisitions mentioned above or for our acquisition of Dako Colorado Inc. (“Dako Co”) in December 2007 as these acquisitions are deemed immaterial business acquisitions individually and in the aggregate.
| 64 | BEC 2009 FORM 10-K |
Table of Contents
Notes to Consolidated Financial Statements (Continued)
(tabular dollar amounts in millions, except amounts per share)
Note 4. Fair Value Measurements
The following table presents information about our financial assets and financial liabilities that are measured at fair value on a recurring basis at December 31, 2009 and 2008, and indicates the fair value hierarchy of the valuation techniques we utilize to determine such fair value:
| Description of assets (liabilities) |
Fair Value at December 31, 2009 |
Fair Value Measurements at Reporting Date Using | ||||||
| Quoted Prices in Active Markets for Identical Assets (Level 1) |
Significant Other Observable Inputs (Level 2) |
Significant Unobservable Inputs (Level 3) | ||||||
| Derivatives |
||||||||
| Forward contracts |
$ (0.6) | $ (0.6) | ||||||
| Option contracts |
$ 2.6 | $ 2.6 | ||||||
| Description of assets (liabilities) |
Fair Value at December 31, 2008 |
Fair Value Measurements at Reporting Date Using | ||||||
| Quoted Prices in Active Markets for Identical Assets (Level 1) |
Significant Other Observable Inputs (Level 2) |
Significant Unobservable Inputs (Level 3) | ||||||
| Derivatives |
||||||||
| Forward contracts |
$ (1.5) | $ (1.5) | ||||||
| Option contracts |
$ 27.2 | $ 27.2 | ||||||
| BEC 2009 FORM 10-K | 65 |
Table of Contents
Notes to Consolidated Financial Statements (Continued)
(tabular dollar amounts in millions, except amounts per share)
Our financial assets and financial liabilities have been classified as Level 2. These derivative contracts have been initially valued at the transaction price and subsequently valued using market data including quotes, benchmark yields, spot rates, and other industry and economic events. When necessary, we validate our valuation techniques by understanding the models used and obtaining market values from pricing sources.
Note 5. Restructuring Activities and Asset Impairment Charges
Restructuring Activities
Restructuring actions and exit activities generally include significant actions involving employee-related severance charges, contract termination costs, and impairment of assets associated with such actions.
Employee-related severance charges are largely based upon distributed employment policies and substantive severance plans and are reflected in the quarter in which management approves the associated actions and the amount of the severance is probable and estimable. Severance amounts for which affected employees were required to render service in order to receive benefits at their termination dates were measured at the date such benefits were communicated to the applicable employees and recognized as expense over the employees’ remaining service periods.
Contract termination and other charges primarily reflect costs to terminate a contract before the end of its term (measured at fair value at the time the Company provided notice to the counterparty) or costs that will continue to be incurred under the contract for its remaining term without economic benefit to the Company. Asset impairment charges related to property, plant and equipment reflect the excess of the assets’ carrying values over their fair values.
Total Restructuring Charges
For the years ended December 31, 2009, 2008 and 2007, we recorded restructuring charges of $88.3 million, $21.4 million (net of $3.0 million gain on sale of building and land in Hialeah, Florida) and $17.7 million, respectively. These charges related to severance, relocation, asset impairment and other exit costs which were included within the restructuring and acquisition related costs line of our consolidated statement of earnings. From January 2007 through 2009, we incurred a total of $127.4 million of net restructuring charges of which $50.6 million relates to severance costs. In addition, we incurred a charge of $19.0 million in the third quarter of 2008 for the remediation of environmental contamination as further described in Note 14, “Commitments and Contingencies.”
Following is a detailed description of charges included in restructuring activities:
Supply Chain Initiatives
During 2007 and 2009, as part of our supply chain initiatives, we announced the closure and relocation of certain manufacturing and distribution sites. Additionally, during 2008, we announced our Orange County consolidation project. As part of these relocations, we incurred severance and other relocation charges of $36.4 million in 2009, $20.1 million in 2008 and $17.7 million in 2007.
Clinical Diagnostics Business
In connection with the Olympus acquisition, we incurred severance costs of $20.2 million due to redundancies as part of combining the two entities. Furthermore, we discontinued our DXC 500 project which was a development project for a low throughput chemistry analyzer since it will be replaced with the AU480 product line acquired from Olympus. We incurred a $14.2 million vendor cancellation fee associated with the discontinuation of this project during the third quarter of 2009. Lastly, as a result of our decision to discontinue the Immunoassay business acquired as part of the Olympus acquisition, we recorded $2.2 million for purchase commitments for products we will not use.
Asset Impairment Charges and Employee Severance
During 2009 we incurred asset impairment charges of $9.2 million, $3.5 million of which was incurred in connection with the cancellation of the DXC500 project described above. We also recorded asset impairment charges associated with our consolidation effort to close other facilities and relocate operations of $5.7 million.
| 66 | BEC 2009 FORM 10-K |
Table of Contents
Notes to Consolidated Financial Statements (Continued)
(tabular dollar amounts in millions, except amounts per share)
The following is a reconciliation of the accrual for employee severance and related costs included in accrued expenses in the consolidated balance sheets at December 31, 2009 and 2008:
| Balance at December 31, 2006 |
$ | 14.1 | ||
| Additional charges |
16.9 | |||
| Utilization |
(19.7 | ) | ||
| Balance at December 31, 2007 |
$ | 11.3 | ||
| Additional charges |
24.2 | |||
| Utilization |
(25.3 | ) | ||
| Balance at December 31, 2008 |
10.2 | |||
| Additional charges |
88.3 | |||
| Utilization |
(56.6 | ) | ||
| Balance at December 31, 2009 |
$ | 41.9 | ||
Acquisition Related Costs
In connection with the Olympus acquisition, we incurred acquisition related and integration costs of $59.5 million during 2009. A significant portion of these expenses were related to legal, consulting and investment banking fees. For our Cogenics acquisition, we incurred $4.5 million of acquisition related and integration costs during 2009. These charges are included within the restructuring and acquisition related costs line of our consolidated statements of earnings.
Note 6. Sale of Assets
We sold certain receivables (“Receivables”) with a net book value of $74.5 million in 2009, $68.4 million in 2008, and $58.8 million in 2007, for which we received cash proceeds for nearly the same amounts. Substantially all of these sales took place in Japan. These transactions were accounted for as sales and as a result the Receivables have been excluded from the accompanying consolidated balance sheets. See Note 1, “Nature of Business and Summary of Significant Accounting Policies” for disclosure regarding the future adoption of a new accounting standard for transfers and servicing of financial assets.
On July 30, 2007, we sold our investment in vacant land adjacent to our Miami, Florida facility for approximately $30 million, net of settlement costs. We acquired the parcel of vacant land as part of our 1997 acquisition of Coulter Corporation. In connection with this sale, $26.2 million gain on sale was recorded in other non-operating income during 2007. An additional $1.2 million was held in escrow at December 31, 2007 and released to us in January 2008 following the resolution of a dispute regarding title to a portion of the land.
Note 7. Goodwill and Other Intangible Assets
During the fourth quarter of 2009, we completed our annual impairment testing of our goodwill and indefinite lived intangible assets and determined there was no impairment.
Beginning in 2008, we began to measure our business on the basis of two operating segments—Clinical Diagnostics and Life Science with three reporting units. Therefore, we reassigned our goodwill balances between the two operating segments using a relative fair value allocation approach.
Changes to the carrying amount of goodwill are summarized as follows (in millions):
| Clinical Diagnostics |
Life Science |
Total | ||||||||||
| Goodwill, January 1, 2008 |
$ | 597.4 | $ | 110.0 | $ | 707.4 | ||||||
| Acquisitions and related adjustments |
(10.4 | ) | (0.7 | ) | (11.1 | ) | ||||||
| Goodwill, December 31, 2008 |
587.0 | 109.3 | 696.3 | |||||||||
| Olympus |
335.7 | — | 335.7 | |||||||||
| Other acquisitions and related adjustments |
9.7 | 0.2 | 9.9 | |||||||||
| Goodwill, December 31, 2009 |
$ | 932.4 | $ | 109.5 | $ | 1,041.9 | ||||||
In 2008, adjustments to goodwill were primarily attributed to the settlement of pre-acquisition tax contingencies and the finalization of our purchase price allocations for intangible assets related to the acquisition of Dako Co in December 2007.
| BEC 2009 FORM 10-K | 67 |
Table of Contents
Notes to Consolidated Financial Statements (Continued)
(tabular dollar amounts in millions, except amounts per share)
In 2009, adjustments to goodwill, excluding the Olympus goodwill, were primarily attributed to the release of $10.0 million in deposits held in escrow for the resolution of future contingencies related to our acquisition of Lumigen.
The following provides information about our other intangible assets:
| December 31, 2009 | December 31, 2008 | |||||||||||||||||||||||
| Gross Carrying Amount |
Accumulated Amortization |
Net | Weighted Average Amortization Period |
Gross Carrying Amount |
Accumulated Amortization |
Net | Weighted Average Amortization Period | |||||||||||||||||
| Amortized intangible assets: |
||||||||||||||||||||||||
| Customer/dealer relationships |
$ | 295.4 | $ | (101.7 | ) | $ | 193.7 | 17 years | $ | 219.2 | $ | (86.3 | ) | $ | 132.9 | 21 years | ||||||||
| Technology |
229.2 | (58.0 | ) | 171.2 | 11 years | 128.9 | (40.8 | ) | 88.1 | 14 years | ||||||||||||||
| Core technology |
66.6 | (1.0 | ) | 65.6 | 20 years | — | — | — | — | |||||||||||||||
| Other |
87.6 | (40.0 | ) | 47.6 | 8 years | 69.4 | (33.7 | ) | 35.7 | 10 years | ||||||||||||||
| 678.8 | (200.7 | ) | 478.1 | 14 years | 417.5 | (160.8 | ) | 256.7 | 17 years | |||||||||||||||
| Non-amortizing intangible assets: |
||||||||||||||||||||||||
| Tradename |
73.5 | — | 73.5 | 73.5 | — | 73.5 | ||||||||||||||||||
| Core technology |
— | — | — | 66.6 | — | 66.6 | ||||||||||||||||||
| IPR&D |
10.2 | — | 10.2 | — | — | — | ||||||||||||||||||
| $ | 762.5 | $ | (200.7 | ) | $ | 561.8 | $ | 557.6 | $ | (160.8 | ) | $ | 396.8 | |||||||||||
Intangible amortization expense, for the years ended December 31, 2009, 2008, and 2007 was $39.6 million, $29.6 million, and $24.2 million, respectively. Estimated future intangible amortization expense (based on existing amortized intangible assets) consists of the following:
| 2010 |
$ | 54.9 | |
| 2011 |
54.3 | ||
| 2012 |
50.6 | ||
| 2013 |
49.5 | ||
| 2014 |
47.3 | ||
| Thereafter |
221.5 | ||
| Total |
$ | 478.1 | |
In September 2009, we reevaluated our core technology, which previously had an indefinite useful life. We considered current and expected future technological changes evolving in the marketplace, including the potential development of newer technologies by our competitors. We determined that over time these factors could make our core technology less valuable for our related products, and determined that it was appropriate to assign an estimated 20 year useful life to the technology. We determined in the current year that our core technology assets were not impaired. The estimated future annual amortization of this change is $3.3 million.
Note 8. Sale-leaseback of Real Estate
On June 25, 1998, we sold our interest in four properties located in Brea, California; Palo Alto, California; Chaska, Minnesota; and Miami, Florida. At the same time, we entered into long-term leases for each of these properties.
The initial term of each of the leases is 20 years, with options to renew for up to an additional 30 years. As provided by the leases, we pay the rents in Japanese Yen. Annual rentals are $25.2 million at 2009 year-end rates. At the closing of the sale-leaseback transaction, we became the guarantor of a currency swap agreement between our landlord and our banks to convert the Yen payments to U.S. dollars and entered into a tri-party foreign currency swap agreement. As long as this swap agreement is in place, our obligation is to pay the rents in Yen. In accordance with the transition provisions of the accounting standard for derivatives and hedging, we elected not to separate embedded derivatives in hybrid instruments entered into before January 1, 1999 and, therefore, the foreign currency swaps embedded in the lease agreements are not separately recognized in our financial statements. Payments under the swap agreements are considered contingent rent payments and are recognized when they are probable. Rental payments in Yen are recognized on a straight line basis over the 20 year lease term. In accordance with the terms of the original swap agreements we negotiated an extension of the foreign currency swap agreements and incurred a charge of $4.6 million, in the second quarter of 2008. If this agreement ceases to exist, our obligation reverts to U.S. dollar payments. We expect to pay the rents as they come due out of cash generated by our Japanese operation. Obligations under the operating lease agreements are included in Note 17 “Commitments and Contingencies.”
| 68 | BEC 2009 FORM 10-K |
Table of Contents
Notes to Consolidated Financial Statements (Continued)
(tabular dollar amounts in millions, except amounts per share)
The aggregate proceeds received from the sale of the four properties totaled $242.8 million before closing costs and transaction expenses. We deferred the gain from this transaction in other liabilities in the accompanying consolidated balance sheets. This gain is being amortized over the initial lease term of 20 years to the various components of operating income. At December 31, 2009 and 2008, there was $59.8 million and $66.8 million of deferred gain remaining. The deferred gain amortized to income from operations was $7.0 million for 2009, $7.1 million for 2008, and $7.0 million for 2007.
Note 9. Debt and Equity Financing
Notes payable consists primarily of short-term bank borrowings by our subsidiaries outside the U.S. under local lines of credit. At December 31, 2009, $227.4 million of unused, uncommitted, short-term lines of credit were available to our subsidiaries outside the U. S. at various interest rates. Within the U.S., $40.0 million in unused, uncommitted, short-term lines of credit at prevailing market rates were available.
Long-term debt consists of the following at December 31:
| Average Rate of Interest for 2009 |
2009 | 2008 | ||||||||
| Convertible Notes, unsecured, due 2036 |
5.59% | $ | 598.6 | $ | 598.6 | |||||
| Senior Notes, unsecured, due 2011 |
6.88% | 235.0 | 235.0 | |||||||
| Senior Notes, unsecured, due 2015 |
6.00% | 250.0 | — | |||||||
| Senior Notes, unsecured, due 2019 |
7.00% | 250.0 | — | |||||||
| Debentures, unsecured, due 2026 |
7.05% | 36.2 | 36.2 | |||||||
| Revolving credit facility |
0.88% | — | — | |||||||
| Other long-term debt |
2.75% | 39.8 | 37.4 | |||||||
| Deferred gains on terminated interest rate swaps (see Note 10) |
3.1 | 4.8 | ||||||||
| Embedded derivative on Convertible Notes |
0.9 | 0.6 | ||||||||
| Unamortized debt discounts and issuance costs |
(83.6 | ) | (89.2 | ) | ||||||
| 1,330.0 | 823.4 | |||||||||
| Less current maturities |
(24.1 | ) | (4.4 | ) | ||||||
| Long-term debt, less current maturities |
$ | 1,305.9 | $ | 819.0 | ||||||
The following represents a summary of the aggregate maturities of long-term debt:
| Year |
Amount | ||
| 2010 |
$ | 24.1 | |
| 2011 |
237.3 | ||
| 2012 |
0.8 | ||
| 2013 |
10.9 | ||
| 2014 |
1.7 | ||
| Thereafter |
1,135.7 | ||
| Total |
$ | 1,410.5 | |
The amounts above exclude the unamortized discount of $83.6 million and the $3.1 million fair value adjustment recorded for the reverse interest rate swap.
| BEC 2009 FORM 10-K | 69 |
Table of Contents
Notes to Consolidated Financial Statements (Continued)
(tabular dollar amounts in millions, except amounts per share)
Convertible Notes
On December 12, 2006, we issued 2.50% unsecured convertible senior notes due 2036 (“Convertible Notes”), for an aggregate principal amount of $600.0 million. The Convertible Notes, which are convertible into shares of our common stock upon the occurrence of certain events, are due on December 15, 2036, unless earlier redeemed, repurchased or converted and carry an interest rate of 2.50% that is payable semi annually and under certain circumstances, beginning with the six-month period beginning December 15, 2012, contingent interest. The Convertible Notes conversion feature allows the holders of the Convertible Notes to convert, in increments of $1,000 principal, their investment into 13.4748 shares of our common stock (equivalent to a conversion price of $74.21 per share of common stock as of December 31, 2009, subject to adjustment). In certain circumstances, the notes may be convertible into cash up to the principal amount and, if applicable, shares of common stock with respect to any excess conversion value. Holders of the Convertible Notes may require us to repurchase all or part of their Convertible Notes on December 15, 2013, 2016, 2021, 2026, and 2031 or upon the occurrence of certain designated events as described in the debt offering memorandum. Also, on or after December 20, 2013, we may redeem all or part of the Convertible Notes. Upon such events, we will repurchase or redeem such Convertible Notes for cash at a price equal to 100% of the principal amount of the Convertible Notes being repurchased or redeemed, plus accrued and unpaid interest.
In addition, beginning with the six-month interest period commencing December 15, 2012, we will pay contingent interest in cash during any six-month interest period in which the trading price of the Convertible Notes for each of the five trading days ending on the trading day immediately preceding the first day of the applicable six-month interest period equals or exceeds 120% of the principal amount of the Convertible Notes (“Contingent Interest Feature”). During any interest period when contingent interest shall be payable, the contingent interest payable per $1,000 principal amount of the Convertible Notes will equal the greater of 0.2795% and 0.25% of the average trading price of $1,000 principal amount of the Convertible Notes during the five trading days immediately preceding the first day of the applicable six-month interest period.
This Contingent Interest Feature is an embedded derivative and has been bifurcated and recorded separately in the accompanying consolidated balance sheets in long term debt. The fair value assigned to the embedded derivative was $0.9 million and $0.6 million at December 31, 2009 and 2008 respectively. We utilize a probability weighted valuation model to determine the fair value of the embedded derivative. Changes to the fair value of this embedded derivative are included in interest expense.
We recorded debt issuance costs and debt discounts of $118.0 million in 2006, which have been deducted from the total debt outstanding. These capitalized costs are being amortized using the effective interest method at an imputed interest rate of 5.59% over seven years, the minimum life based upon the terms of the debt.
Senior Notes
In November 2001, we issued $235.0 million of 6.875% unsecured Senior Notes due November 15, 2011 (the “2011 Senior Notes”). Interest is payable semi-annually in May and November. Discount and issuance costs approximated $1.9 million and are being amortized to interest expense over the term of the 2011 Senior Notes.
At our option, the 2011 Senior Notes may be redeemed in whole or in part at any time at a redemption price equal to the greater of:
| • | the principal amount of the Senior Notes; or |
| • | the sum of the present values of the remaining scheduled payments of principal and interest thereon discounted to the redemption date on a semi-annual basis at a comparable treasury rate plus a margin of 0.35% for the 2011 Senior Notes. |
On May 18, 2009, we issued $250.0 million principal amount of the Company’s 6% Senior Notes due 2015 and $250.0 million principal amount of the Company’s 7% Senior Notes due 2019 (the “Notes”). In connection with the Notes, we incurred issuance costs of $4.8 million. The Notes were issued at a discount of $2.3 million which is being amortized over the estimated life of the Notes. The proceeds from the Notes were used on August 3, 2009 to partially fund the Olympus acquisition that is further described in Note 3, “Acquisitions.”
Debentures
In June 1996, we issued $100.0 million of debentures bearing an interest rate of 7.05% per annum due June 1, 2026. Interest is payable semi-annually in June and December. In 2006, $56.0 million of our $100.0 million debentures were tendered by the holders of the debentures. In June 2008, we also redeemed another $8.0 million of the debentures, resulting in an ending principal balance of $36.2 million as of December 31, 2009 and 2008.
| 70 | BEC 2009 FORM 10-K |
Table of Contents
Notes to Consolidated Financial Statements (Continued)
(tabular dollar amounts in millions, except amounts per share)
Revolving Credit Facilities
In May 2009, we entered into an Amended and Restated Credit Agreement (the “Credit Facility”) and extended the maturity date of the Credit Facility to May 2012. The Credit Facility provides us with a $350.0 million revolving line of credit, which may be increased in $50.0 million increments up to a maximum line of credit of $450.0 million. In connection with the Amendment of the Credit Facility, we incurred issuance costs of $5.3 million which are being amortized over the term of the Credit Facility. Interest on advances is determined using formulas specified in the agreement, generally, an approximation of LIBOR plus 2.25% to 2.875% margin with the precise margin determinable based on our long-term senior unsecured non-credit-enhanced debt rating, which as of December 31, 2009 was a S&P rating of BBB. We also must pay a facility fee of 0.50% per annum on the aggregate average daily amount of each lender’s commitment with the precise margin determinable based on our long-term senior unsecured non-credit-enhanced debt rating, which as of December 31, 2009 was a S&P rating of BBB. At December 31, 2009 and 2008, no amounts were outstanding under the Credit Facility.
At December 31, 2009, we also had $16.0 million of letters of credit outstanding with availability to issue an additional $14.3 million of letters of credit.
Securitization
Our wholly owned subsidiary, Beckman Coulter Finance Company, LLC (“BCFC”), a Delaware limited liability company, entered into an accounts receivable securitization program with several financial institutions. The securitization facility is on a 364-day revolving basis. As part of the securitization program, we transferred our interest in a defined pool of accounts receivable to BCFC. In turn, BCFC sold an ownership interest in the underlying receivables to the multi-seller conduits administered by a third party bank. Sale of receivables under the program is accounted for as a secured borrowing. The cost of funds under this program varies based on changes in interest rates. The term of the agreement extends to October 27, 2010 and the maximum borrowing amount is $125.0 million. We did not have any amounts drawn on the facility as of December 31, 2009 and 2008.
Other Long-term Debt
Other long-term debt at December 31, 2009 and 2008 consists primarily of $27.3 million and $27.7 million, respectively, of notes used to fund the operations of our international subsidiaries. Some of the notes issued by our international subsidiaries are secured by their assets. Capitalized lease obligations of $11.7 million in 2009 and $9.7 million in 2008 are also included in other long-term debt.
Covenants
Certain of our borrowing agreements contain covenants that we must comply with, for example, a debt to earnings ratio and a minimum interest coverage ratio. At December 31, 2009, we were in compliance with all such covenants as well as reporting requirements related to these covenants.
Forward Sale Agreements
On May 19, 2009 we entered into forward sale agreements for the sale of an aggregate of 4,722,989 shares of our common stock including an amount equal to the underwriters’ over-allotment option in the public offering. The initial forward sale price was $50.75 per share which was equivalent to the public offering price of $53.00 less the underwriting discount of $2.25. On July 27, 2009 we received net proceeds of approximately $240 million from the issuance of shares in connection with this offering, which were used to partially fund the Olympus acquisition. Additionally, we incurred issuance costs of $11.8 million in connection with this offering, which is recorded as a reduction to additional paid-in capital.
Note 10. Derivatives
We use derivative financial instruments to hedge foreign currency and interest rate exposures. Our objectives for holding derivatives are to minimize currency and interest rate risks using the most effective methods to eliminate or reduce the impacts of these exposures. We do not speculate in derivative instruments in order to profit from foreign currency exchange or interest rate fluctuations; nor do we enter into trades for which there are no underlying exposures. The following discusses in more detail our foreign currency and interest rate exposures and related derivative instruments.
| BEC 2009 FORM 10-K | 71 |
Table of Contents
Notes to Consolidated Financial Statements (Continued)
(tabular dollar amounts in millions, except amounts per share)
Foreign Currency
We manufacture our products principally in the U.S., but generated 51.5% of our revenue in 2009 from sales made outside the U.S. by our international subsidiaries. Revenues generated by the international subsidiaries generally are denominated in the subsidiary’s local currency, thereby exposing us to the risk of foreign currency fluctuations. In order to mitigate the impact of changes in foreign currency exchange rates, we use derivative financial instruments (or “foreign currency contracts”) to hedge the foreign currency exposure resulting from intercompany revenue to our international subsidiaries through their anticipated cash settlement date which is typically over a period of 2 years. These foreign currency contracts include forward and option contracts and are designated as cash flow hedges. The major currencies against which we hedge are the Euro, Japanese Yen, Australian dollar, British Pound Sterling and Canadian dollar. As of December 31, 2009 and 2008, the notional amounts of all derivative foreign exchange contracts were $546.3 million and $257.8 million, respectively.
We also use foreign currency forward contracts to offset the effect of changes in value of loans between subsidiaries and do not designate these derivative instruments as accounting hedges, therefore the changes in the value of these derivative instruments are included within the non-operating (income) expense section of the Consolidated Statement of Earnings.
Hedge ineffectiveness associated with our cash flow hedges was immaterial and no cash flow hedges were discontinued in the years ended December 31, 2009, 2008 and 2007. Derivative gains and losses on effective hedges included in accumulated other comprehensive income are reclassified into cost of sales upon the recognition of the hedged transaction. We estimate that substantially all of the $7.0 million of unrealized loss ($4.3 million after tax) included in accumulated other comprehensive income at December 31, 2009, will be reclassified to cost of sales within the next twelve months. The actual amounts that will be reclassified to earnings over the next twelve months will vary from this amount as a result of changes in market rates. We have cash flow hedges at December 31, 2009, which settle as late as December 2010.
The following table presents the fair value of derivative instruments within the consolidated balance sheets:
| Balance Sheet Location |
Asset Derivatives | Balance Sheet Location |
Liability Derivatives | |||||||||
| December 31, 2009 |
December 31, 2008 |
December 31, 2009 |
December 31, 2008 | |||||||||
| Derivatives designated as hedging Instruments |
||||||||||||
| Foreign exchange forwards and options |
Other current assets |
$ 7.6 | $ 27.2 | Other current liabilities |
$ 5.6 | $ — | ||||||
| Foreign exchange forwards |
Other long term assets |
— | Other long term liabilities |
1.5 | ||||||||
| Total derivatives designated as hedging instruments |
$ 7.6 | $ 27.2 | $ 5.6 | $ 1.5 | ||||||||
| 72 | BEC 2009 FORM 10-K |
Table of Contents
Notes to Consolidated Financial Statements (Continued)
(tabular dollar amounts in millions, except amounts per share)
The following tables present the amounts affecting the consolidated financial statements:
| Amount of (Loss) Gain Recognized in Other Comprehensive Income on Derivatives |
Location of Gain Reclassified From Accumulated Other Comprehensive Loss into Net Earnings |
Amount of Gain Reclassified From Accumulated Other Comprehensive Loss into Net Earnings | |||||||||||||
| Years Ended December 31, | Years Ended December 31, | ||||||||||||||
| 2009 | 2008 | 2009 | 2008 | ||||||||||||
| Derivatives in Cash Flow Hedging Relationships |
|||||||||||||||
| Foreign exchange forwards and options |
$ | (13.8 | ) | $ | 24.2 | Cost of sales | $ | 12.9 | $ | 5.0 | |||||
| Total |
$ | (13.8 | ) | $ | 24.2 | $ | 12.9 | $ | 5.0 | ||||||
| BEC 2009 FORM 10-K | 73 |
Table of Contents
Notes to Consolidated Financial Statements (Continued)
(tabular dollar amounts in millions, except amounts per share)
| Location of Gain Recognized in Net Earnings on Derivatives |
Amount of Gain in Net Earnings on Derivatives |
||||||||
| Years Ended December 31, | |||||||||
| 2009 | 2008 | ||||||||
| Derivatives not designated as hedging instruments |
|||||||||
| Foreign exchange forwards |
Other non-operating income | $ | 17.2 | $ | (2.5 | ) | |||
| Total |
$ | 17.2 | $ | (2.5 | ) | ||||
The bank counterparties to the foreign exchange forward contracts expose us to credit-related losses in the event of their nonperformance. To help mitigate that risk, we only contract with counterparties that meet certain minimum requirements under our counterparty risk assessment process. The Company monitors ratings and potential downgrades on at least a quarterly basis. Based on our on-going assessment of counterparty risk, we will adjust our exposure to various counterparties as deemed necessary.
Interest Rate
We use interest rate derivative contracts on certain borrowing transactions to hedge fluctuating interest rates. Interest differentials paid or received under these contracts are recognized as adjustments to the effective yield of the underlying financial instruments hedged.
In April 2002, in connection with the issuance of our $235.0 million 2011 Senior Notes, we entered into reverse interest rate swap contracts totaling $235.0 million. In September 2004, we terminated $95.0 million of these reverse interest rate swap contracts and in June 2006, terminated the remaining $140.0 million of these reverse interest rate swap contracts, resulting in deferred gains of $9.5 million and $1.7 million, respectively. The deferred gains are being amortized over the notes remaining term through November 2011.
Note 11. Other Non-operating Expense (Income)
The components of other non-operating expense (income) were as follows:
| 2009 | 2008 | 2007 | ||||||||||
| Biosite merger termination fee |
$ | — | $ | — | $ | (40.6 | ) | |||||
| Gain on sale of land |
— | (1.2 | ) | (26.8 | ) | |||||||
| Contribution to Beckman Coulter Foundation |
— | — | 9.0 | |||||||||
| Gain on foreign currency and related derivative activity |
(24.2 | ) | (2.4 | ) | (0.3 | ) | ||||||
| Other |
(0.6 | ) | (1.3 | ) | 0.2 | |||||||
| $ | (24.8 | ) | $ | (4.9 | ) | $ | (58.5 | ) | ||||
The following is a description of the main components of other non-operating expense (income) as shown in the table above.
In 2009, we recognized a $19.6 million hedging gain associated with forward contracts to purchase Japanese yen. Since our purchase price for the Olympus acquisition was payable in yen, we entered into forward contracts in an effort to mitigate the risk associated with changes in the value of the yen, and settled the contracts on July 30, 2009. We recorded a $2.2 million foreign currency gain on the value of the yen for the period between settling the forward contracts and the transfer of funds in yen to purchase Olympus. Additionally, we recorded a $4.9 million foreign currency gain related to the settlement of intercompany loans related to the Olympus acquisition.
| 74 | BEC 2009 FORM 10-K |
Table of Contents
Notes to Consolidated Financial Statements (Continued)
(tabular dollar amounts in millions, except amounts per share)
In 2007, the definitive merger agreement to acquire Biosite, Inc. (“Biosite”) was terminated by Biosite in accordance with its terms. Pursuant to the terms of the merger agreement, we received a break-up fee of $54.0 million from Biosite and recorded a gain of $40.6 million (net of associated expenses of $13.4 million).
In 2007, gain on sale of land of $26.2 million was mainly attributed to the sale of vacant land held for investment purposes in Miami. An additional $1.2 million was held in escrow at December 31, 2007 and released in January 2008 following the resolution of a dispute regarding title to a portion of the land.
Using proceeds received from the sale of vacant land in Miami, we made a $9.0 million irrevocable contribution to establish the Beckman Coulter Foundation (the “Foundation”), a related party non-profit organization. The Foundation’s purpose is to operate for the benefit of funding charitable, scientific, literary and /or educational programs. Certain members of our management also serve as directors of the Foundation.
Note 12. Income Taxes
The components of earnings from continuing operations before income taxes were:
| 2009 | 2008 | 2007 | ||||
| U.S. |
$ 23.5 | $ 63.7 | $175.4 | |||
| Non-U.S. |
160.9 | 174.9 | 104.8 | |||
| $184.4 | $238.6 | $280.2 | ||||
|
The provision for income taxes on earnings from continuing operations consisted of the following:
| ||||||
| 2009 | 2008 | 2007 | ||||
| Current |
||||||
| U.S. federal |
$ (48.8) | $ 34.4 | $ 70.6 | |||
| Non-U.S. |
47.9 | 33.1 | 29.2 | |||
| U.S. state |
— | 6.2 | 2.7 | |||
| Total current |
(0.9) | 73.7 | 102.5 | |||
| Deferred |
||||||
| U.S. federal and state |
44.2 | (26.8) | (22.0) | |||
| Non-U.S. |
(6.0) | 5.7 | (2.4) | |||
| Total deferred, net |
38.2 | (21.1) | (24.4) | |||
| Total |
$ 37.3 | $ 52.6 | $ 78.1 | |||
|
Income tax benefits attributable to the exercise of non-qualified employee stock options of $4.6 million, $11.9 million and $22.0 million in 2009, 2008 and 2007, respectively, are recorded directly to additional paid-in-capital.
The reconciliation of the U.S. federal statutory tax rate to the consolidated effective tax rate is as follows:
| ||||||
| 2009 | 2008 | 2007 | ||||
| Statutory tax rate |
35.0% | 35.0% | 35.0% | |||
| State taxes, net of U.S. tax benefit |
1.4 | (0.8) | 1.1 | |||
| Ireland and China manufacturing income |
(10.6) | (7.5) | (4.4) | |||
| Non-U.S. taxes |
1.4 | (2.2) | 1.9 | |||
| Foreign income taxed in the U.S. net of credits |
(0.7) | (0.7) | (1.3) | |||
| Federal tax credits |
(3.0) | (5.1) | (1.6) | |||
| Tax settlements and adjustments to unrecognized tax benefits |
(4.4) | 3.3 | (0.1) | |||
| Adjustment relating to prior year’s state taxes |
— | — | (1.6) | |||
| Other |
1.1 | — | (1.1) | |||
| Effective tax rate |
20.2% | 22.0% | 27.9% | |||
| BEC 2009 FORM 10-K | 75 |
Table of Contents
Notes to Consolidated Financial Statements (Continued)
(tabular dollar amounts in millions, except amounts per share)
Subsidiaries conducting manufacturing operations in Ireland and China are taxed at substantially lower income tax rates than the U.S. federal statutory tax rate. The lower tax rates reduced expected taxes by $19.5 million in 2009, $18.9 million in 2008 and $12.9 million in 2007.
In the fourth quarter of 2008 the U.S. Congress enacted legislation extending the federal Research & Experimentation (“R&E”) tax credit for the 2008 and 2009 tax years. As a result, an estimated 2008 R&E credit of $8.9 million was recorded in the fourth quarter of 2008. The 2008 financial statements include the benefit for the 2008 and 2007 R&E tax credit. In prior years, due to the difficulty in estimating an R&E credit on a current basis, we used a method to record the R&E tax credit for financial reporting purposes, which resulted in recognizing the benefit in the year subsequent to the credit utilization on its tax return. The prior method used to record the R&E tax credit did not have a material impact on any of the financial statements presented.
The tax effect of temporary differences which give rise to significant portions of deferred tax assets and liabilities consists of the following at December 31:
| 2009 | 2008 | |||||||
| Deferred tax assets |
||||||||
| Accrued expenses |
$ | 33.1 | $ | 30.0 | ||||
| Accrued compensation |
53.4 | 48.6 | ||||||
| Inventories |
54.2 | 51.8 | ||||||
| Postemployment and postretirement benefits |
73.2 | 63.8 | ||||||
| Net operating loss and R&E credit carryforwards |
41.4 | 21.8 | ||||||
| Intangible assets |
10.9 | 11.7 | ||||||
| Pension benefits |
51.9 | 81.3 | ||||||
| State income taxes |
26.9 | 36.1 | ||||||
| License payments |
10.9 | 8.0 | ||||||
| Hedging activities |
2.8 | — | ||||||
| Other |
29.5 | 5.4 | ||||||
| 388.2 | 358.5 | |||||||
| Less: Valuation allowance |
(7.5 | ) | (6.2 | ) | ||||
| Total deferred tax assets |
380.7 | 352.3 | ||||||
| Deferred tax liabilities |
||||||||
| Accelerated depreciation |
(63.5 | ) | (16.0 | ) | ||||
| Deferred service contracts |
(1.0 | ) | (5.3 | ) | ||||
| Intangible assets |
(133.2 | ) | (127.4 | ) | ||||
| Sale-leaseback deferred gain |
(34.2 | ) | (34.0 | ) | ||||
| State income taxes |
(35.9 | ) | (28.0 | ) | ||||
| Hedging activities |
— | (7.5 | ) | |||||
| Interest on convertible debt |
(43.7 | ) | (41.3 | ) | ||||
| Leases |
(4.0 | ) | (3.2 | ) | ||||
| Other |
(36.3 | ) | (25.8 | ) | ||||
| Total deferred tax liabilities |
(351.8 | ) | (288.5 | ) | ||||
| Net deferred tax asset |
$ | 28.9 | $ | 63.8 | ||||
| 76 | BEC 2009 FORM 10-K |
Table of Contents
Notes to Consolidated Financial Statements (Continued)
(tabular dollar amounts in millions, except amounts per share)
At December 31, 2009, we had a valuation allowance of $7.5 million primarily on net operating loss carryforwards of certain foreign subsidiaries and tax credits acquired in the acquisition of Dako Co due to uncertainties regarding their realizability. We believe that the remaining deferred income tax assets will be realized based upon our historical and expected future pre-tax earnings, adjusted for significant items such as non-recurring charges, and the recognition of taxable income for the reversal of deferred tax liabilities in the same future period. Certain tax planning or other strategies will be implemented, if necessary, to supplement income from operations and the recognition of taxable income from the reversal of deferred tax liabilities in the same future period to fully realize these deferred tax assets.
During the year ended December 31, 2009, we increased our valuation allowance by $1.3 million related to the acquisition of net operating loss carryovers from Cogenics. There was no net change in our valuation allowances related to foreign net operating loss carryforwards.
At December 31, 2009, the Company had deferred tax assets related to net operating loss carryforwards of $23.0 million and tax credit carryforwards of $18.4 million. Net operating loss carryforwards related to our foreign subsidiaries are $48.5 million, including $19.6 million acquired in the Cogenics acquisition. Of the $48.5 million in foreign net operating loss carryforwards, $1.1 million will expire in the years 2010 through 2012 and $47.4 million do not expire. U.S. State net operating loss carryforwards at December 31, 2009 are $45.5 million in the aggregate, which related to the 2008 tax year and expire at varying times. Net operating loss carryforwards of $31.3 million acquired in the Dako Co acquisition will expire in the years 2022 through 2026. Our unutilized state tax credits of $7.9 million at December 31, 2009 do not expire. Tax credits acquired in the Dako Co acquisition of $2.8 million will expire in the years 2019 through 2026. Our unutilized Alternative Minimum Tax credit carryforward of $ 6.7 million does not expire.
During the year ended December 31, 2008, we increased our valuation allowance by $1.5 million related to the acquisition of R&E tax credits from Dako Co due to the limitations on the utilization of such credits. We decreased our valuation allowance by $1.0 million related to foreign net operating loss carryforwards due to utilization of carryforwards or changes in uncertainties regarding their realizability.
The following is a reconciliation of deferred tax assets (liabilities) to net deferred tax assets (liabilities) as shown on the consolidated balance sheets at December 31:
| 2009 | 2008 | |||||||
| Current |
||||||||
| U.S. deferred income tax assets |
$ | 61.5 | $ | 54.1 | ||||
| Non-U.S. deferred income tax assets |
17.5 | 8.4 | ||||||
| Non-current |
||||||||
| U.S. deferred income tax assets (liabilities) |
(81.2 | ) | (15.6 | ) | ||||
| Non-U.S. deferred income tax assets |
31.1 | 16.9 | ||||||
| Net deferred tax asset |
$ | 28.9 | $ | 63.8 | ||||
The total amount of unrecognized tax benefits as of December 31, 2009 and December 31, 2008 were $35.8 million and $45.0 million, respectively, which if recognized, would primarily affect the effective tax rate in the future.
A reconciliation of the beginning and ending balance of unrecognized tax benefits included within other liabilities and income taxes payable is as follows:
| 2009 | 2008 | |||||||
| Beginning balance |
$ | 45.0 | $ | 36.7 | ||||
| Additions based on tax positions related to the current year |
4.4 | 4.3 | ||||||
| Additions for tax positions of prior years |
1.4 | 12.8 | ||||||
| Reductions for tax positions of prior years |
(1.4 | ) | (6.7 | ) | ||||
| Settlements |
(16.7 | ) | (0.9 | ) | ||||
| Lapse of statute of limitations |
(0.3 | ) | (6.9 | ) | ||||
| Unrecognized tax benefit of net operating losses and tax credits |
0.2 | 6.3 | ||||||
| Other unrecognized tax benefits |
3.0 | — | ||||||
| Cumulative translation adjustment |
0.2 | (0.6 | ) | |||||
| Ending balance |
$ | 35.8 | $ | 45.0 | ||||
| BEC 2009 FORM 10-K | 77 |
Table of Contents
Notes to Consolidated Financial Statements (Continued)
(tabular dollar amounts in millions, except amounts per share)
During the year ended December 31, 2009, our recognized tax benefits were reduced by $16.7 million as a result of tax audit settlements around the world, $11.3 million of this amount reduced income tax expense in 2009.
During the year ended December 31, 2008, our unrecognized tax benefits were reduced by $6.4 million as a result of tax audit settlements and expirations of statutes of limitation, $5.0 million of this amount was recorded to goodwill and $1.4 million reduced income tax expense in 2008.
During the year ended December 31, 2007, our unrecognized tax benefits were reduced by $1.9 million as a result of tax audit settlements around the world, all of which reduced income tax expense in 2007.
We accrue interest and penalties where there is an underpayment of taxes, based on management’s best estimate of the amount ultimately to be paid, in the same period that 1) the interest would begin accruing or 2) the penalties would first be assessed. Our policy on the classification of interest and penalties is to record both as part of interest expense. As of December 31, 2009 and December 31, 2008, we had $2.4 million and $5.3 million in accrued interest and penalties for taxes, respectively. We recognized $2.9 million and $0.8 million of interest and penalties during 2009 and 2008, respectively.
The Company and its domestic subsidiaries file federal, state and local income/franchise tax returns in the U.S. Our international subsidiaries file income tax returns in various non-U.S. jurisdictions. The audit of our U.S. federal income tax returns for 2004 and 2005 was closed in 2009. Tax years 2006 through 2008 remain open to U.S. federal income tax examination and an audit by the U.S. Internal Revenue Service (“IRS”) for 2006 through 2008 commenced in 2009. The audit of our German subsidiary’s tax returns for 2003 through 2005 was closed in 2009. We are no longer subject to state income tax examinations by tax authorities in our major state jurisdictions for years prior to 2004. The earliest tax years of our major international subsidiaries that are subject to non-U.S. income tax examinations by tax authorities are: Switzerland, 1998; Hong Kong, 2002; Italy and the United Kingdom, 2004; Canada, 2005; France and Germany, 2006; and Japan, 2008.
A number of years may elapse before an uncertain tax position is finally resolved. It is difficult to predict the final outcome or the timing of resolution of any particular uncertain tax position. We reevaluate and adjust our reserves for income taxes, as well as the related interest, in light of changing facts and circumstances. Settlement of any particular position would usually require the use of cash and result in the reduction of the related reserve. The resolution of a matter would be recognized as an adjustment to the provision for income taxes and the effective tax rate in the period of resolution, except for the resolution of certain tax contingency matters related to acquisitions, which would result in an adjustment to goodwill. At December 31, 2009, it is reasonably possible that our liability for uncertain tax positions will be reduced in the next twelve months by as much as $4.0 million as a result of either the settlement of tax positions with various tax authorities or by virtue of the statute of limitations expiring in the next twelve months for years with uncertain tax positions. All of this amount would favorably impact our effective rate. The reduction of uncertain tax positions that would favorably impact our effective tax rate relates to various intercompany transactions.
We have not provided for U.S. income and foreign withholding taxes on approximately $651 million of certain foreign subsidiaries’ undistributed earnings, because such earnings have been retained and are intended to be indefinitely reinvested by the subsidiaries or will be offset by credits for foreign income taxes paid. Accordingly, no provision has been made for U.S. or foreign withholding taxes which may become payable if undistributed earnings of foreign subsidiaries were paid to us as dividends. The additional income taxes and applicable withholding taxes that would result had such earnings actually been repatriated are not practically determinable.
| 78 | BEC 2009 FORM 10-K |
Table of Contents
Notes to Consolidated Financial Statements (Continued)
(tabular dollar amounts in millions, except amounts per share)
Note 13. Accumulated Other Comprehensive Loss
The components of accumulated other comprehensive loss, net of income taxes, as of December 31 are as follows:
| 2009 | 2008 | 2007 | ||||||||||
| Cumulative currency translation adjustments |
$ | 117.2 | $ | 90.5 | $ | 154.7 | ||||||
| Pension and other postretirement plan liability adjustments |
(289.7 | ) | (302.6 | ) | (161.7 | ) | ||||||
| Net unrealized (loss) gain on derivative instruments |
(4.3 | ) | 12.3 | (5.8 | ) | |||||||
| Total accumulated other comprehensive loss |
$ | (176.8 | ) | $ | (199.8 | ) | $ | (12.8 | ) | |||
Note 14. Earnings Per Share, Outstanding Shares and Treasury Stock
Earnings Per Share
Basic earnings per share (“EPS”) is calculated by dividing net earnings by the weighted-average common shares outstanding during the period. Diluted EPS reflects the potential dilution to basic EPS that could occur upon conversion or exercise of securities, options or other such items, to common stock using the treasury stock method based upon the weighted-average fair value of our common stock during the period. The following is a reconciliation of the numerators and denominators of the basic and diluted EPS computations:
| Net Earnings | Shares (in millions) |
Per Share Amount | ||||
| Year Ended December 31, 2009 |
||||||
| Basic EPS: |
||||||
| Net earnings |
$ 147.1 | 66.297 | $ 2.22 | |||
| Effect of dilutive stock options, non-vested equity shares and share units outstanding |
— | 1.086 | (0.04) | |||
| Diluted EPS: |
||||||
| Net earnings |
$ 147.1 | 67.383 | $ 2.18 | |||
| Year Ended December 31, 2008 |
||||||
| Basic EPS: |
||||||
| Net earnings |
$ 186.0 | 62.969 | $ 2.95 | |||
| Effect of dilutive stock options, non-vested equity shares and share units outstanding |
— | 1.379 | (0.06) | |||
| Diluted EPS: |
||||||
| Net earnings |
$ 186.0 | 64.348 | $ 2.89 | |||
| Year Ended December 31, 2007 |
||||||
| Basic EPS: |
||||||
| Net earnings |
$ 203.7 | 62.505 | $ 3.26 | |||
| Effect of dilutive stock options, non-vested equity shares and share units outstanding |
— | 1.561 | (0.08) | |||
| Diluted EPS: |
||||||
| Net earnings |
$ 203.7 | 64.066 | $ 3.18 | |||
In 2009, 2008, and 2007 there were 2.6 million shares, 2.1 million shares, and 0.7 million shares, respectively, relating to the possible exercise of outstanding stock options not included in the computation of diluted EPS as their effect would have been anti-dilutive.
The principal amount of the convertible notes issued in December 2006 and due in 2036 is expected to be settled in cash. Any conversion spread over the principal amount would be settled in our common shares. Since the average stock price during 2009, 2008 and 2007 was less than the conversion price of the Convertible Notes, no shares associated with the convertible notes have been assumed to be outstanding in computing diluted EPS.
| BEC 2009 FORM 10-K | 79 |
Table of Contents
Notes to Consolidated Financial Statements (Continued)
(tabular dollar amounts in millions, except amounts per share)
As a result of retrospectively applying the accounting standard for convertible debt, net earnings for the years ended December 31, 2008 and 2007 have been adjusted from the previously disclosed amount of $194.0 million to $186.0 million and $211.3 million to $203.7 million, respectively. See Note 1, “Nature of Business and Summary of Significant Accounting Policies,” for further discussion on the 2009 adoption of this accounting standard related to the Convertible Notes.
In connection with our May 2009 equity offering, as further discussed under Note 9, “Debt and Equity Financing,” we entered into forward sale agreements with certain forward purchasers (the “Forward Purchasers”). Pursuant to the underwriting agreement, the Forward Purchasers borrowed and sold to the Underwriters an aggregate of 4,722,989 shares of our common stock at an initial forward price of $53.00, before the underwriting discount of $2.25 per share. Before the issuance of our common stock upon the July 27, 2009 settlement of the forward sale agreements, the forward sale agreements were reflected in our diluted earnings per share calculations using the treasury stock method.
Outstanding Shares
The following is activity in our outstanding common shares:
| 2009 | 2008 | 2007 | ||||||
| Outstanding at beginning of year |
63.0 | 62.5 | 61.0 | |||||
| Employee stock purchases |
1.9 | 1.9 | 2.3 | |||||
| Treasury stock purchases (see below) |
— | (1.4 | ) | (0.8 | ) | |||
| Issuance of shares |
4.7 | — | — | |||||
| Outstanding at end of year |
69.6 | 63.0 | 62.5 | |||||
Treasury Stock
In 2004, we created the Benefit Equity Trust (“BET”) for pre-funding stock-related obligations of employee benefit plans. The BET does not change these plans or the amount of stock expected to be issued for these employee benefit plans. At December 31, 2009, 1.4 million shares remain in BET of which all are treasury shares. The BET has been included in our Consolidated Financial Statements. The shares in the BET are not considered outstanding for the calculation of EPS. During 2009 and 2008, 1.7 and 1.6 million shares, respectively, related to stock option exercises were issued out of the BET.
In February 2008, the Board of Directors authorized the repurchase of up to 2.5 million shares of our outstanding common stock through 2009. Of the 2.5 million share authorized repurchase, 1.3 million shares were repurchased in 2008 for $91.5 million and no shares were repurchased in 2009.
We consider several factors in determining when to make share repurchases including, among other things, our cash needs and the market price of our stock. We expect that cash provided by future operating activities, as well as available cash and cash equivalents, short term investments and available debt will be the sources of funding for future share repurchases.
Note 15. Employee Benefits
Share-Based Compensation
We recognize the cost resulting from all share-based payment transactions in the financial statements at fair value. The compensation expense recognized in the consolidated statements of earnings for share-based compensation arrangements was $35.8 million ($22.2 million after tax), $29.6 million ($18.4 million after tax), and $24.5 million ($15.2 million after tax) for the years 2009, 2008 and 2007, respectively. Share-based compensation costs capitalized as part of inventory for 2009, 2008 and 2007 was $0.6 million. Additionally, the tax benefit from the tax deduction related to share-based compensation that is in excess of recognized compensation costs is reported as a financing cash flow rather than an operating cash flow. The entire tax benefit from option exercises for the years 2009, 2008 and 2007, was $4.6 million, $11.9 million and $22.0 million, respectively.
| 80 | BEC 2009 FORM 10-K |
Table of Contents
Notes to Consolidated Financial Statements (Continued)
(tabular dollar amounts in millions, except amounts per share)
Employee Stock Option and Stock Purchase Plans
Our 2004 Long-Term Performance Plan (the “2004 Plan”), which is shareholder approved, authorizes the issuance of up to 6.5 million share options and nonvested shares to our employees. This plan was terminated on April 5, 2007 and replaced with the 2007 Long-Term Performance Plan (the “2007 Plan”), which was approved by shareholders. The 2007 Plan authorizes the issuance of 2.4 million common shares. As of December 31, 2009, there were approximately 2 million shares available for issuance under the 2007 Plan. Stock option awards are generally granted with an exercise price equal to the market price of our shares at the date of grant and typically vest over four years and expire seven years from the date of grant, however, stock option awards could vest at the date of grant for employees who meet certain criteria for retirement eligibility based upon age and years of service.
We have an Employee Stock Purchase Plan (“ESPP”) that operates in accordance with section 423 of the Internal Revenue Code, whereby U.S. employees can purchase our common stock at favorable prices. Under the plan, eligible employees are permitted to apply salary withholdings to purchase shares of common stock at a price equal to 90% of the lower of the market value of the stock at the beginning or end of each six-month option period ending June 30 and December 31. Employees purchased 0.3 million shares for $14.2 million in 2009, 0.3 million shares for $13.9 million in 2008, and 0.2 million shares for $13.1 million in 2007.
The fair value of stock options and ESPP shares granted during the years ended December 31, 2009, 2008 and 2007, have been estimated at the date of grant using a BSM option-pricing model with the following weighted average assumptions:
| 2009 | 2008 | 2007 | ||||||||||
| Stock Option Plans |
ESPP | Stock Option Plans |
ESPP | Stock Option Plans |
ESPP | |||||||
| Option life (in years) |
5.30 | 0.5 | 5.30 | 0.5 | 5.26 | 0.5 | ||||||
| Risk free interest rate |
2.84% | 0.41% | 4.04% | 1.10% | 4.52% | 4.54% | ||||||
| Stock price volatility |
28.50% | 29.14% | 28.80% | 28.21% | 27.20% | 28.07% | ||||||
| Dividend yield |
0.90% | 0.90% | 0.93% | 0.92% | 0.92% | 0.92% | ||||||
The following table summarizes activity under our stock option plans (options in thousands):
| 2009 | 2008 | 2007 | ||||||||||||||
| Options | Weighted Average Exercise Price Per Option |
Weighted Average Remaining Contractual Life (Years) |
Aggregate Intrinsic Value |
Options | Weighted Average Exercise Price Per Option |
Options | Weighted Average Exercise Price Per Option | |||||||||
| Outstanding at beginning of year |
6,439 | $53.74 | 7,185 | $50.11 | 8,469 | $46.15 | ||||||||||
| Granted |
778 | $43.43 | 495 | $72.30 | 545 | $59.12 | ||||||||||
| Exercised |
(1,226) | $44.85 | (1,210) | $39.72 | (1,766) | $34.30 | ||||||||||
| Canceled/forfeited |
(31) | $50.03 | (31) | $55.04 | (63) | $59.14 | ||||||||||
| Outstanding at end of year |
5,960 | $54.25 | 2.90 | $70.9 | 6,439 | $53.74 | 7,185 | $50.11 | ||||||||
| Exercisable at end of year |
4,421 | $54.19 | 2.12 | $51.6 | 4,819 | $50.22 | 5,346 | $46.29 | ||||||||
| Options expected to vest at December 31, 2009 |
1,488 | $54.52 | 5.11 | $18.6 | ||||||||||||
| BEC 2009 FORM 10-K | 81 |
Table of Contents
Notes to Consolidated Financial Statements (Continued)
(tabular dollar amounts in millions, except amounts per share)
| Range of Exercise Prices |
Options Outstanding at December 31, 2009 |
Weighted Average Exercise Price Per Outstanding Option |
Weighted Average Remaining Contractual Life (Years) |
Options Exercisable at December 31, 2009 |
Weighted Average Exercise Price Per Exercisable Option |
Options Expected to Vest at December 31, 2009 |
Weighted Average Exercise Price for Options Expected to Vest | |||||||
| $25.01 – 30.00 |
442 | $28.53 | 2.54 | 442 | $28.53 | — | — | |||||||
| $30.01 – 35.00 |
37 | $33.08 | 3.13 | 37 | $33.08 | — | — | |||||||
| $35.01 – 40.00 |
257 | $38.51 | 1.01 | 257 | $38.51 | — | — | |||||||
| $40.01 – 45.00 |
1,199 | $43.21 | 4.55 | 434 | $43.02 | 730 | $43.32 | |||||||
| $45.01 – 50.00 |
63 | $48.68 | 1.89 | 63 | $48.67 | 1 | $49.48 | |||||||
| $50.01 – 55.00 |
763 | $51.88 | 1.07 | 763 | $51.89 | — | $53.79 | |||||||
| $55.01 and over |
3,199 | $64.12 | 2.93 | 2,425 | $63.72 | 757 | $65.32 | |||||||
| 5,960 | 4,421 | 1,488 | ||||||||||||
|
As of December 31, 2009, the aggregate unamortized fair value of all unvested stock options was $5.9 million which is expected to be amortized on a straight-line basis over a weighted average period of approximately two years. The weighted average fair value of options granted during 2009, 2008 and 2007 was $12.24, $22.12 and $18.03 per share, respectively. The total intrinsic value of stock options exercised during 2009, 2008 and 2007 was $21.8 million, $37.7 million and $59.1 million, respectively.
Nonvested Stock Plan
Under the 2004 and 2007 Plans, we may issue shares of nonvested stock to our employees. These shares vest each year over the service period, generally four years, however the shares vest upon completion of one year of additional service for employees who meet certain criteria for retirement eligibility.
The following table summarizes activity under our nonvested stock plan (in thousands, except per share amounts):
| ||||||||||||||
| 2009 | 2008 | 2007 | ||||||||||||
| Number of Shares |
Weighted Average Grant Date Fair Value |
Number of Shares |
Weighted Average Grant Date Fair Value |
Number of Shares |
Weighted Average Grant Date Fair Value | |||||||||
| Nonvested at January 1, |
360 | $60.96 | 350 | $56.61 | 267 | $54.64 | ||||||||
| Granted |
206 | $45.08 | 131 | $72.11 | 155 | $61.47 | ||||||||
| Vested |
(136) | $61.42 | (109) | $56.20 | (57) | $56.13 | ||||||||
| Canceled/forfeited |
(13) | $55.94 | (12) | $61.15 | (15) | $51.86 | ||||||||
| Nonvested at December 31, |
417 | $52.90 | 360 | $60.96 | 350 | $56.61 | ||||||||
The total fair value of shares vested during the year ended December 31, 2009, was $6.4 million. As of December 31, 2009, the aggregate unamortized fair value of all nonvested stock awards was $6.8 million, which is expected to be amortized on a straight-line basis over a weighted average period of approximately two years.
Performance Shares
Under the 2004 Plan, we granted Performance Share Awards (“Performance Shares”) to executives and other key employees. The vesting of the Performance Shares is contingent upon employee service and meeting company-wide performance goals for a three year period.
| • | The 2007 grant provided for vesting upon the achievement of free cash flows of at least $275 million in the aggregate for the years 2007 through 2009. |
| • | The 2008 grant provided for early vesting in 2010 upon the achievement of free cash flows of $375 million in the aggregate for years 2008-2009 |
| 82 | BEC 2009 FORM 10-K |
Table of Contents
Notes to Consolidated Financial Statements (Continued)
(tabular dollar amounts in millions, except amounts per share)
As a result of meeting the performance targets for the 2007 and 2008 grants, the Performance Shares vested in February 2010, resulting in accelerated expense of $2.5 million in 2009.
The 2009 grant provides for vesting upon achievement of a measure of return on invested capital and operating cash flow over three years. Each measure is weighted equally and applies with respect to half the target number of Performance Shares subject to the award for the performance period 2009 to 2011.
We granted 179,020, 108,950 and 112,670 shares during the years ended December 31, 2009, 2008 and 2007, at an average grant date fair value of $40.85, $64.75 and $64.61, respectively. There were 85,630 vested Performance Shares at an average grant date fair value of $51.11 as of December 31, 2009. There were 6,850 forfeited shares during the year ended December 31, 2009, at an average grant date fair value of $62.37.
As of December 31, 2009, the aggregate unamortized grant date fair value of all unvested Performance Share awards was $6.4 million, which to the extent management estimates that performance goals will be achieved, are being amortized on a straight-line basis over a weighted average period of 1.5 years.
Stock Appreciation Rights
We award stock appreciation rights (“SARs”) to certain international employees. These rights are granted with an exercise price equal to the market price of our shares at the date of grant and typically vest over four years and expire seven years from the date of grant. The expected life of stock appreciation rights granted is based on the simplified calculation of expected life, described in the Securities and Exchange Commission guidance. The fair values of the stock appreciation rights granted, have been estimated using a BSM option-pricing model with the following assumptions:
| 2009 | 2008 | |||
| Option life (in years) |
0.55 – 3.77 | 0.37 – 4.01 | ||
| Risk-free interest rate |
1.00% | 1.36% | ||
| Stock price volatility |
28.54% | 28.54% | ||
| Weighted average stock price volatility |
20.76% | 23.64% | ||
| Dividend yield |
0.92% | 0.92% |
The following table summarizes activity under our SARs plan (in thousands, except per share amounts):
| 2009 | 2008 | |||||||
| Number of Shares |
Weighted Average Fair Value |
Number of Shares |
Weighted Average Fair Value | |||||
| Outstanding at January 1, |
411 | $ 2.65 | 389 | $23.35 | ||||
| Granted |
64 | $14.72 | 82 | $ 3.08 | ||||
| Exercised |
(52) | $19.08 | (46) | $21.48 | ||||
| Canceled |
(12) | $ 7.17 | (14) | $17.00 | ||||
| Outstanding at December 31, |
411 | $11.44 | 411 | $ 2.65 | ||||
The total intrinsic value of SARs exercised during the years 2009, 2008, and 2007 was $0.9 million, $1.1 million, and $4.5 million, respectively.
We currently use treasury stock to deliver shares of our common stock under our share-based payment plans. At December 31, 2009, the number of shares authorized to be issued under our share-based payment plans combined with shares held as treasury stock are sufficient to cover future stock option exercises.
Postemployment Benefits
We have various benefit plans and recognize an obligation for certain benefits awarded to individuals after employment but before retirement. During 2009, 2008 and 2007, we recorded charges of $6.2 million, $1.6 million and $3.7 million, respectively, associated with our postemployment obligations. Excluded from these amounts are obligations arising from our restructuring activities. See Note 5 “Restructuring Activities and Asset Impairment Charges” for further details.
| BEC 2009 FORM 10-K | 83 |
Table of Contents
Notes to Consolidated Financial Statements (Continued)
(tabular dollar amounts in millions, except amounts per share)
Grantor Trust for Beckman Coulter, Inc. Executive Plans
In 2002, we established an irrevocable grantor trust (the “Trust”) to provide a source of funds to assist us in meeting our obligations under various executive and director deferred compensation benefit plans. Periodically, our common stock obligations under the plans are estimated and the Trust is funded in the amount of those obligations. The Trust has been consolidated in our financial statements. The $21.3 million and $19.3 million of common stock (at cost) held in the Trust and the offsetting grantor trust liability have been included in the accompanying consolidated balance sheets as components of stockholders’ equity at December 31, 2009 and 2008, respectively. The common stock was acquired in the open market. The Trust will hold the common stock for the benefit of the participants and will distribute the stock to the participants in accordance with the provisions of the plans. The participants may elect to receive distributions over five to 15 years, upon termination of service, or upon a selected date at least two years after the date of the deferral election.
Note 16. Retirement Benefits
Defined Benefit Pension Plans and Postretirement Plan
We provide pension benefits under defined benefit pension plans covering certain employees. Pension benefits for our domestic employees are based on age, years of service and compensation rates. Our funding policy is to provide for accumulated benefits, subject to federal regulations. Several of our international subsidiaries have separate pension plan arrangements, which include both funded and unfunded plans.
Our postretirement plan provides certain health care and life insurance benefits for retired U.S. and certain international employees and their dependents. Eligibility under the postretirement plan and participant cost sharing is dependent upon the participant’s age at retirement, years of service and retirement date. Employees who had not met certain age and service requirements as of December 31, 2002, are not eligible to receive medical coverage upon retirement.
Benefit Obligations
The following represents disclosures regarding benefit obligations, plan assets and the weighted average assumptions utilized for the pension and postretirement plans as determined by outside actuarial valuations:
| Pension Plans | Postretirement Plan | |||||||||||||||
| 2009 | 2008 | 2009 | 2008 | |||||||||||||
| Change in Benefit Obligation: |
||||||||||||||||
| Benefit obligation at beginning of year |
$ | 898.9 | $ | 935.3 | $ | 141.8 | $ | 150.8 | ||||||||
| Adjustment to beginning of year benefit obligation |
(4.0 | ) | — | — | — | |||||||||||
| Service cost |
21.8 | 22.9 | 1.7 | 2.4 | ||||||||||||
| Interest cost |
53.2 | 51.8 | 6.7 | 7.9 | ||||||||||||
| Actuarial loss (gain) |
73.3 | (19.8 | ) | (25.5 | ) | (15.4 | ) | |||||||||
| Benefits paid |
(54.5 | ) | (54.1 | ) | (7.7 | ) | (8.7 | ) | ||||||||
| Plan participant contributions |
3.7 | 3.6 | 3.1 | 3.7 | ||||||||||||
| Plan amendments |
— | (9.5 | ) | — | — | |||||||||||
| Plan additions |
— | (0.1 | ) | — | 1.8 | |||||||||||
| Business combinations |
39.6 | — | — | — | ||||||||||||
| Plan settlements |
(0.3 | ) | (0.6 | ) | — | — | ||||||||||
| Curtailments |
(5.2 | ) | — | 0.6 | — | |||||||||||
| Expenses and premiums paid |
(0.7 | ) | (0.6 | ) | — | — | ||||||||||
| Special termination benefits |
0.1 | 0.2 | — | — | ||||||||||||
| Retiree drug subsidy received |
— | — | 0.7 | 0.6 | ||||||||||||
| Impact of foreign currency changes |
13.6 | (30.2 | ) | 1.0 | (1.3 | ) | ||||||||||
| Benefit obligation at end of year |
$ | 1,039.5 | $ | 898.9 | $ | 122.4 | $ | 141.8 | ||||||||
| U.S. benefit obligation |
$ | 765.1 | $ | 706.0 | $ | 117.1 | $ | 137.2 | ||||||||
| International benefit obligation |
274.4 | 192.9 | 5.3 | 4.6 | ||||||||||||
| Benefit obligation at end of year |
$ | 1,039.5 | $ | 898.9 | $ | 122.4 | $ | 141.8 | ||||||||
| 84 | BEC 2009 FORM 10-K |
Table of Contents
Notes to Consolidated Financial Statements (Continued)
(tabular dollar amounts in millions, except amounts per share)
| Pension Plans | Postretirement Plan | |||||||||||||||
| 2009 | 2008 | 2009 | 2008 | |||||||||||||
| Change in Plan Assets: |
||||||||||||||||
| Fair value of plan assets at beginning of year |
$ | 624.1 | $ | 897.9 | $ | — | $ | — | ||||||||
| Employer contributions |
91.2 | 21.4 | 4.6 | 5.0 | ||||||||||||
| Plan participant contributions |
3.7 | 3.6 | 3.1 | 3.7 | ||||||||||||
| Benefits paid |
(54.5 | ) | (54.1 | ) | (7.7 | ) | (8.7 | ) | ||||||||
| Business combinations |
23.3 | — | — | — | ||||||||||||
| Plan settlements |
(0.3 | ) | (0.4 | ) | — | — | ||||||||||
| Expenses and premiums paid |
(0.7 | ) | (0.6 | ) | — | — | ||||||||||
| Actual return (loss) on plan assets |
93.1 | (217.7 | ) | — | — | |||||||||||
| Impact of foreign currency changes |
10.8 | (26.0 | ) | — | — | |||||||||||
| Fair value of plan assets at end of year |
$ | 790.7 | $ | 624.1 | $ | — | $ | — | ||||||||
| Fair value of U.S. plan assets |
$ | 589.1 | $ | 484.8 | $ | — | $ | — | ||||||||
| Fair value of international plan assets |
201.6 | 139.3 | — | — | ||||||||||||
| Fair value of plan assets at end of year |
$ | 790.7 | $ | 624.1 | $ | — | $ | — | ||||||||
| Funded Status at end of year |
$ | (248.8 | ) | $ | (274.8 | ) | $ | (122.4 | ) | $ | (141.8 | ) | ||||
| Amounts recognized in the consolidated balance sheets consist of: |
||||||||||||||||
| Non-current assets |
$ | 3.1 | $ | 1.4 | $ | — | $ | — | ||||||||
| Current liabilities |
(2.5 | ) | (2.5 | ) | (5.3 | ) | (6.0 | ) | ||||||||
| Non-current liabilities |
(249.4 | ) | (273.7 | ) | (117.1 | ) | (135.8 | ) | ||||||||
| Net amount recognized |
$ | (248.8 | ) | $ | (274.8 | ) | $ | (122.4 | ) | $ | (141.8 | ) | ||||
| Amounts recognized in accumulated other comprehensive (income) loss consist of: |
||||||||||||||||
| Net actuarial loss (gain) |
$ | 452.7 | $ | 446.2 | $ | (0.7 | ) | $ | 21.9 | |||||||
| Prior service cost credit |
(6.3 | ) | (5.9 | ) | (1.7 | ) | (2.0 | ) | ||||||||
| Total (before tax effects) |
$ | 446.4 | $ | 440.3 | $ | (2.4 | ) | $ | 19.9 | |||||||
| U.S. Plans |
||||||||||||||||
| Discount rate |
5.78 | % | 6.33 | % | 5.78 | % | 6.33 | % | ||||||||
| Rate of compensation increase |
3.50 | % | 3.50 | % | — | — | ||||||||||
| International Plans |
||||||||||||||||
| Discount rate |
4.69 | % | 5.0 | % | — | — | ||||||||||
| Rate of compensation increase |
3.66 | % | 3.3 | % | — | — | ||||||||||
The discount rate is an assumption used to determine the actuarial present value of benefits attributed to the services rendered by participants in our pension plans. The rate used reflects our best estimate of the rate at which pension benefits will be effectively
| BEC 2009 FORM 10-K | 85 |
Table of Contents
Notes to Consolidated Financial Statements (Continued)
(tabular dollar amounts in millions, except amounts per share)
settled considering the timing of expected payments to plan participants. The discount rates are developed based on benchmarking indexes. The benchmarking indexes are obtained by using high-quality long-term corporate bond yields currently available with terms similar to the expected timing of payments to be made under our pension obligation. The discount rate used to determine the benefit obligation for the U.S. Pension Plan and postretirement plans was selected by us, in consultation with independent actuaries, using an average of pension discount yield curves based on the characteristics of the U.S. Plan and postretirement liabilities, each determined independently. For all other non-U.S. pension plans, we set the assumed discount rates based on the nature of liabilities, local economic environments and available bond indices or a third party yield curve.
The accumulated benefit obligation for our pension plans is $913.8 million as of the 2009 measurement date and $822.8 million as of the 2008 measurement date.
Information regarding our pension plans with an accumulated benefit obligation in excess of plan assets is as follows:
| 2009 | 2008 | |||||
| Projected benefit obligation |
$ | 945.4 | $ | 871.9 | ||
| Accumulated benefit obligation |
865.6 | 799.8 | ||||
| Fair value of plan assets |
704.9 | 597.7 | ||||
Information regarding our pension plans with a projected benefit obligation in excess of plan assets is as follows:
| 2009 | 2008 | |||||
| Projected benefit obligation |
$ | 1,029.7 | $ | 889.0 | ||
| Fair value of plan assets |
777.8 | 612.8 | ||||
Benefit Expense (Credit)
The following table lists the components of the net periodic benefit cost of the plans and the weighted-average assumptions for the years ended December 31:
| Pension Plans | Postretirement Plan | |||||||||||||||||||||||
| 2009 | 2008 | 2007 | 2009 | 2008 | 2007 | |||||||||||||||||||
| Components of Net Periodic Benefit Cost: |
||||||||||||||||||||||||
| Service cost |
$ | 21.8 | $ | 22.9 | $ | 24.9 | $ | 1.7 | $ | 2.4 | $ | 2.3 | ||||||||||||
| Interest cost |
53.2 | 51.8 | 49.3 | 6.7 | 7.9 | 7.7 | ||||||||||||||||||
| Expected return on plan assets |
(55.9 | ) | (68.6 | ) | (70.4 | ) | — | — | — | |||||||||||||||
| Amortization of: |
||||||||||||||||||||||||
| Prior service costs (credits) |
0.1 | 0.2 | 0.9 | (0.4 | ) | (4.4 | ) | (4.4 | ) | |||||||||||||||
| Actuarial loss (gain) |
25.6 | 13.4 | 12.2 | (0.2 | ) | 1.1 | 1.8 | |||||||||||||||||
| Net periodic benefit cost |
44.8 | 19.7 | 16.9 | 7.8 | 7.0 | 7.4 | ||||||||||||||||||
| Additional costs (benefits) due to curtailments and settlements |
0.3 | (0.1 | ) | 1.0 | (0.1 | ) | — | — | ||||||||||||||||
| Net periodic benefit cost |
$ | 45.1 | $ | 19.6 | $ | 17.9 | $ | 7.7 | $ | 7.0 | $ | 7.4 | ||||||||||||
| Amounts Expected to be Recognized in Net Periodic Cost in the Coming Year |
||||||||||||||||||||||||
| Loss recognition |
$ | 30.5 | $ | 25.4 | $ | 12.8 | $ | — | $ | 1.3 | $ | 3.1 | ||||||||||||
| Prior service cost (benefit) recognition |
— | 0.1 | 1.1 | (0.4 | ) | (0.4 | ) | (4.4 | ) | |||||||||||||||
| U.S. Plans |
||||||||||||||||||||||||
| Discount rate |
6.33 | % | 6.0 | % | 6.0 | % | 6.33 | % | 6.0 | % | 6.0 | % | ||||||||||||
| Expected return on plan assets |
8.25 | % | 8.5 | % | 9.0 | % | — | — | — | |||||||||||||||
| Rate of compensation increase |
3.50 | % | 3.5 | % | 3.5 | % | — | — | — | |||||||||||||||
| International Plans |
||||||||||||||||||||||||
| Discount rate |
5.13 | % | 4.9 | % | 4.3 | % | — | — | — | |||||||||||||||
| Expected return on plan assets |
5.84 | % | 6.3 | % | 6.3 | % | — | — | — | |||||||||||||||
| Rate of compensation increase |
3.33 | % | 3.3 | % | 3.1 | % | — | — | — | |||||||||||||||
| 86 | BEC 2009 FORM 10-K |
Table of Contents
Notes to Consolidated Financial Statements (Continued)
(tabular dollar amounts in millions, except amounts per share)
We amended our pension plans effective December 31, 2006, to freeze benefits to employees who were under the age of 40 or had less than five years of vested service. These employees will no longer earn additional benefits in the pension plan. Instead, these employees and those hired after December 31, 2006, are eligible to participate in a retirement account plan which is a defined contribution plan.
Expected Benefit Payments
Expected benefit payments for future years ending December 31 are as follows:
| Pension Benefits | Other Retirement Benefits | |||
| 2010 |
$ 59.2 | $ 6.2 | ||
| 2011 |
64.4 | 7.9 | ||
| 2012 |
66.5 | 8.6 | ||
| 2013 |
69.0 | 9.4 | ||
| 2014 |
70.1 | 10.1 | ||
| 2015 through 2019 |
401.6 | 59.4 |
The following is the expected Medicare Retiree Drug Subsidy benefit receipts for our Postretirement Benefit plan for future years ending December 31:
| Other Retirement Benefits | ||
| 2010 |
$ 0.8 | |
| 2011 |
0.9 | |
| 2012 |
1.0 | |
| 2013 |
1.1 | |
| 2014 |
1.2 | |
| 2015 through 2019 |
7.6 |
Contributions
We expect to contribute $33.3 million to our U.S. and international pension plans and $6.0 million to our postretirement plans during 2010.
Plan Assets
Our overall investment strategy is to achieve a mix of investments for long-term growth and for near-term benefit payments with diversification of asset types, fund strategies, and fund managers. We seek to achieve optimal asset returns while balancing the liquidity requirements of the plans’ liabilities. We utilize a diversified, strategic asset allocation to efficiently and prudently generate investment returns that will meet the objectives of the investment trust that hold the plan assets. Our investment guidelines limit the amount of allowed exposure to investments in more volatile sectors and limit concentrations based on established criteria. A change in the overall investment strategy could significantly impact the expected rate of return on plan assets.
| BEC 2009 FORM 10-K | 87 |
Table of Contents
Notes to Consolidated Financial Statements (Continued)
(tabular dollar amounts in millions, except amounts per share)
The fair values of our pension plan assets at December 31, 2009 by asset category are as follows:
| Quoted Prices in Active Markets for Identical Assets |
Significant Observable Inputs |
Significant Unobservable Inputs |
||||||
| (Level 1) | (Level 2) | (Level 3) | Total | |||||
| Asset category |
||||||||
| Cash and cash equivalents |
$ 7.3 | $ 0.5 | $ — | $ 7.8 | ||||
| Commingled funds (a) |
— | 683.8 | 25.3 | 709.1 | ||||
| Hedge funds |
— | — | 4.3 | 4.3 | ||||
| Private equity funds |
— | — | 27.2 | 27.2 | ||||
| Real estate |
— | — | 1.5 | 1.5 | ||||
| Insurance contracts |
— | — | 40.8 | 40.8 | ||||
| Total |
$ 7.3 | $ 684.3 | $ 99.1 | $ 790.7 | ||||
(a) The benefit plans own commingled funds that invest in equity and fixed income securities and real estate. The commingled funds that invest in equity securities seek to out-perform the Russell 1000 and 2000 Indices and the MSCI EAFE Index. The commingled funds that hold fixed income securities invest primarily in domestic investment grade securities, including corporate, municipal and US Treasury securities and seek to outperform the Barclays Capital US Aggregate Bond Index.
The following table represents the fair value reconciliation of Level 3 assets and liabilities measured at fair value for pension plans during the year ended December 31, 2009:
| Private Equity | Commingled Funds in Real Estate |
Real Estate | Insurance Contracts |
Hedge Funds | Total | |||||||
| Beginning balance at January 1, 2009 |
$ 28.3 | $ 44.2 | $ 1.8 | $ 37.8 | $ 11.5 | $ 123.6 | ||||||
| Actual return on plan assets Relating to assets still held at the reporting date |
(3.2) | (17.8) | (0.3) | 1.4 | (0.3) | (20.2) | ||||||
| Relating to assets sold during the period |
— | 0.3 | — | — | (1.8) | (1.5) | ||||||
| Purchases, sales and settlements |
2.1 | (1.4) | — | 1.6 | (5.1) | (2.8) | ||||||
| Ending balance at December 31, 2009 |
$ 27.2 | $ 25.3 | $ 1.5 | $ 40.8 | $ 4.3 | $ 99.1 | ||||||
Fair Value Measurements
The pension plan assets are recognized at fair value. The following is a description of the valuation methodologies used for the investments measured at fair value, including the general classification of such instruments pursuant to the valuation hierarchy.
Cash and Cash Equivalents – These investments consist of U.S. dollars and foreign currencies held in trust accounts with a weighted average portfolio of 90 days or less, such as money market instruments, fixed income securities and in some instances assets are in a pooled fund with government banks. Foreign currencies held are reported in terms of U.S. dollars based on currency exchange rates readily available in active markets. These cash investments are classified as Level 1 and 2 investments.
| 88 | BEC 2009 FORM 10-K |
Table of Contents
Notes to Consolidated Financial Statements (Continued)
(tabular dollar amounts in millions, except amounts per share)
Commingled Funds – Commingled funds are maintained by investment companies and hold certain investments in accordance with a stated set of fund objectives, which are consistent with the pension plan’s overall investment strategy. For equity and fixed income commingled funds, these investments are not publicly traded, but the underlying assets held in these funds are traded on active markets and the prices for these assets are readily observable. Holdings in registered commingled funds are classified as Level 2 investments. Real estate commingled funds are funds with a direct investment in a pool of real estate properties. These funds are valued by investment managers on a periodic basis using models that use independent appraisals from sources with professional qualifications. Since these valuation inputs are not highly observable, real estate investments are classified as Level 3 investments.
Hedge Funds – These investments employ a fund of funds strategy with the objective to achieve long term capital appreciation with limited net asset value volatility by investing the assets of the Fund in investment funds pursuing a number of alternative and diverse investment strategies selected, advised or managed by a number of money managers. The hedge fund manager employs a fair value approach to its underlying investments, using a combination of valuation techniques. In general, fund valuations are based on the net asset value of the underlying funds on a periodic basis; however these valuations rely on the underlying fund managers providing a reasonable valuation of their funds’ investments and may be adjusted by the fund manager in accordance with the fund’s valuation policy. Since these valuation inputs are not highly observable, hedge funds have been classified as Level 3 investments.
Private Equity Funds – Private equity funds are generally partnerships in which the pension plan is a limited partner. These partnerships generate capital returns through investing in enterprises such as other limited partnerships or other pooled investment vehicles which, in turn, make equity-oriented investments in venture capital companies. Private equity funds are valued by investment managers on a periodic basis using pricing models that use market, income, and cost valuation methods. Since these valuation inputs are not highly observable, private equity funds have been classified as Level 3 investments.
Real Estate – For the U.S. pension plan, the real estate investment is a limited partnership for the purpose of acquiring real estate assets with the objective of maximizing long-term appreciation. The investments consist of real estate properties that are held for investment. The partnership investments are valued at net asset value based upon available information concerning the market for real estate property investments using current appraisals or other market information and the general partner’s good faith estimate of value. Since these valuation inputs are not highly observable, the real estate investments have been classified as Level 3 investments.
Insurance Contracts – Assets are held and valued by an insurance company based on the surrender value. Since these valuation inputs are not highly observable, these investments have been classified as Level 3 investments.
Asset Allocation Strategy
Our U.S. pension plan assets are invested using active investment strategies that employ multiple investment management firms. Risk is controlled through diversification among multiple asset classes, managers, styles and securities. Risk is further controlled both at the manager and asset class level by assigning excess return and tracking error targets. Monitoring activities take place to evaluate performance against these targets.
Our U.S. pension plan is underfunded at December 31, 2009. We may decide to make additional pension plan contributions beyond the amounts required in order to return the plan to fully funded status.
The overall expected long-term rate of return on assets assumption for our U.S. pension plans is based on the target asset allocation for Plan assets, capital markets forecasts for asset classes employed and active management excess return expectations. Equilibrium forecasts are used to reflect long-term expectations for the asset classes employed. To the extent asset classes are actively managed , an excess return premium is added. The following table illustrates the calculation to arrive at the 2010 expected long term rate of return assumption for our U.S. pension plans of 8.25%.
| Asset Class |
Target Allocation | Long Term Expected Return | ||
| Equities |
40% | 3.70% | ||
| Fixed Income |
40% | 2.60% | ||
| Real Estate |
5% | 0.40% | ||
| Other |
15% | 1.30% | ||
| Sub-total |
100% | 8.00% | ||
| Active Management |
— | 0.25% | ||
| Total |
100% | 8.25% | ||
| BEC 2009 FORM 10-K | 89 |
Table of Contents
Notes to Consolidated Financial Statements (Continued)
(tabular dollar amounts in millions, except amounts per share)
Historical returns for our U.S. pension assets have been more than 8%, consistent with the expected long term rate of return assumption shown above.
The approach used to arrive at the expected rate of return on assets for the non-U.S. plans reflects the asset allocation policy of each plan and the expected country real returns for equity and fixed income investments. On an annual basis, we gather empirical data from the local country subsidiaries to determine expected long-term rates of return for equity and fixed income securities. We then weight these expected real rates of return based on country specific allocation mixes adjusted for inflation.
Assumed Health Care Cost Trend Rates
The assumed health care trend rate used in measuring the postretirement cost for 2009 is 10.0%, gradually declining to 5.0% by the year 2014 and remaining at that level thereafter. Assumed health care cost trend rates have a significant effect on the amounts reported for postretirement benefits. A 1.0% increase in assumed health care cost trend rates would increase the totals of the interest cost and service components for 2009 and the postretirement benefit obligation as of December 31, 2009 by $1.0 million and $15.0 million, respectively. A 1.0% decrease in assumed health care cost trend rates would decrease the total of the interest cost and service components for 2009 and the postretirement benefit obligation as of December 31, 2009 by $0.8 million and $12.7 million, respectively.
Defined Contribution Plans
We have a defined contribution plan available to our domestic employees. Under the plan, eligible employees may contribute a portion of their compensation. Employer contributions are primarily based on a percentage of employee contributions and vest immediately. However, certain former Coulter employees are eligible for additional employer contributions based on age and salary levels, which become fully vested after five years of service. We contributed $20.9 million in 2009, $24.8 million in 2008, and $20.2 million in 2007 to the plan.
Effective January 1, 2007, we established the Retirement Account Plan I (RAP I) for the benefit of certain eligible employees in the U.S. who were excluded from the defined benefit pension plan. Effective January 1, 2008, we established the Retirement Account Plan II (RAP II) for newly hired employees in the U.S. RAP I and II are fully funded by the company and contributions are made in the first quarter following each year. For RAP I, contributions are based on age and years of service. For RAP II, contributions are based on years of service. Contributions vest after three years of service. Under both plans, there are no employee contributions and no distributions are allowed until termination of employment. We contributed $8.3 million in 2009, $7.6 million in 2008 and $5.4 million in 2007 to the RAP I and II plans.
Note 17. Commitments and Contingencies
We are subject to federal, state, local and foreign environmental laws and regulations. Although we continue to incur expenditures for environmental protection, we do not anticipate any expenditures to comply with such laws and regulations which would have a material impact on our consolidated operations or financial position except as discussed below. We believe that our operations comply in all material respects with applicable federal, state and local environmental laws and regulations.
| 90 | BEC 2009 FORM 10-K |
Table of Contents
Notes to Consolidated Financial Statements (Continued)
(tabular dollar amounts in millions, except amounts per share)
In connection with our Orange County consolidation project and closure of our Fullerton, California site, we began conducting environmental studies at our Fullerton site. The data generated by these studies indicates that soils under and around several of the buildings contain chemicals previously used in operations at the facility. Some of these chemicals also have been found in groundwater underlying the site. Studies to determine the source and extent of these chemicals are underway and are expected to continue for several months. We have notified the State Department of Toxic Substances Control of the presence of these chemicals at the site and expect that agency to oversee determination of any remediation requirements. We have recorded a liability of $19 million in 2008, representing our best estimate of the future expenditures for investigation and remediation at the site; however, it is possible that the ultimate costs incurred could range from $10 million to $30 million. Our estimates are based upon the results of our investigation to date and comparison to our prior experience with environmental remediation at another site. Therefore, it is possible that additional activities not contemplated at this time could be required and that the actual costs could differ materially from the amount we have recorded as a liability or our estimated range. Through December 31, 2009 we have spent $1.4 million in relation to investigation and remediation activities.
To address contingent environmental costs, we establish reserves when the costs are probable and can be reasonably estimated. We believe that, based on current information and regulatory requirements, the reserves established by us for environmental expenditures are adequate. Based on current knowledge, to the extent that additional costs may be incurred that exceed the reserves, the amounts are not expected to have a material adverse effect on our operations, consolidated financial condition or liquidity.
Legal Proceedings
We are involved in a number of lawsuits, which we consider ordinary and routine in view of our size and the nature of our business. We accrue for our best estimate within the range of the loss or the minimum probable liability if no best estimate can be determined. Such accruals at December 31, 2009 were immaterial. We do not believe any ultimate liability resulting from any of these lawsuits will have a material adverse effect on our results of operations, financial position or liquidity. We cannot, however give any assurances regarding the ultimate outcome of these lawsuits, and their resolution could be material to our operating results for any particular period, depending upon the level of income for the period.
Lease Commitments
We lease certain facilities, equipment and automobiles under operating lease arrangements. Certain of the leases provide for payment of taxes, insurance and other charges by the lessee. Rent expense was $99.9 million in 2009, $89.5 million in 2008, and $85.9 million in 2007.
As of December 31, 2009, minimum annual rentals payable under non-cancelable operating leases aggregate $376.5 million, which is payable as follows:
| Year |
Amount | ||
| 2010 |
$ | 69.5 | |
| 2011 |
57.7 | ||
| 2012 |
48.2 | ||
| 2013 |
41.2 | ||
| 2014 |
38.0 | ||
| Thereafter |
121.9 | ||
| Total |
$ | 376.5 | |
Note 18. Business Segment Information
We are engaged primarily in the design, manufacture and sale of laboratory instrument systems and related products. The Clinical Diagnostics segment, which includes products used to evaluate and analyze body fluids, cells and other patient samples, represents 86% of our consolidated revenue. The product areas within Clinical Diagnostics are chemistry and clinical automation, cellular analysis, and immunoassay and molecular diagnostics. Our Life Science segment includes systems used in disease research performed in academic centers as well as therapeutic research performed by biopharmaceutical companies.
Management evaluates business segment performance on a revenue and operating income basis. Operating profit for segment reporting, disclosed below, is revenue less operating costs and unallocated corporate expenses. Segment operating expenses include
| BEC 2009 FORM 10-K | 91 |
Table of Contents
Notes to Consolidated Financial Statements (Continued)
(tabular dollar amounts in millions, except amounts per share)
allocations of certain centrally incurred costs such as employee benefits, occupancy, information systems, accounting services, internal legal staff, and human resources administration. These costs are allocated based on actual usage or other appropriate methods, such as number of employees. Unallocated corporate expenses are corporate overhead expenses not attributable to the operating groups such as restructuring charges, technology license fees and other charges, which are not allocated to our segments for performance assessment by our chief operating decision maker. Non-operating income (expense) and interest income and expense are not allocated to the segments. We do not discretely allocate assets to our operating segments, nor does our chief operating decision maker evaluate operating segments using discrete asset information.
The following table sets forth revenue and operating income data with respect to our two operating segments and a reconciliation of our segments’ operating income to consolidated earnings before income taxes:
| 2009* | 2008* | 2007* | ||||||||||
| Segment revenues: |
||||||||||||
| Clinical Diagnostics |
||||||||||||
| Chemistry and Clinical Automation |
$ | 1,055.1 | $ | 898.7 | $ | 815.3 | ||||||
| Cellular Analysis |
935.3 | 954.1 | 840.9 | |||||||||
| Immunoassay and Molecular Diagnostics |
798.3 | 739.1 | 627.2 | |||||||||
| Total Clinical Diagnostics |
2,788.6 | 2,591.9 | 2,283.4 | |||||||||
| Life Science |
472.0 | 507.0 | 477.9 | |||||||||
| Total revenues |
$ | 3,260.6 | $ | 3,098.9 | $ | 2,761.3 | ||||||
| Segment operating income: |
||||||||||||
| Clinical Diagnostics |
$ | 357.6 | $ | 274.5 | $ | 262.4 | ||||||
| Life Science |
68.9 | 75.1 | 61.3 | |||||||||
| Total segment operating income |
426.5 | 349.6 | 323.7 | |||||||||
| Restructuring expenses |
(152.3 | ) | (21.4 | ) | (17.7 | ) | ||||||
| Environmental remediation |
— | (19.0 | ) | — | ||||||||
| Technology acquired for use in R&D for Clinical Diagnostics |
(5.8 | ) | (23.7 | ) | (35.4 | ) | ||||||
| Fair market value inventory adjustment for Clinical Diagnostics |
(22.1 | ) | (1.0 | ) | — | |||||||
| Litigation accrual |
(3.9 | ) | — | — | ||||||||
| Rental tax dispute |
— | — | (1.6 | ) | ||||||||
| Discontinued product write-off related to Clinical Diagnostics |
(1.6 | ) | — | — | ||||||||
| Olympus intangibles asset amortization related to Clinical Diagnostics |
(9.6 | ) | — | — | ||||||||
| Total operating income |
231.2 | 284.5 | 269.0 | |||||||||
| Non-operating (income) expense: |
||||||||||||
| Interest income |
(5.0 | ) | (10.0 | ) | (14.4 | ) | ||||||
| Interest expense |
76.6 | 60.8 | 61.7 | |||||||||
| Other |
(24.8 | ) | (4.9 | ) | (58.5 | ) | ||||||
| Total non-operating expense (income) |
46.8 | 45.9 | (11.2 | ) | ||||||||
| Earnings from continuing operations before income taxes |
$ | 184.4 | $ | 238.6 | $ | 280.2 | ||||||
| * | Amounts may not foot due to rounding. |
Our principal markets are the U.S. and international markets. The U.S. information is presented separately since we are headquartered in the U.S. United States revenues represented 48.5%, 49.8% and 51.6% of our total consolidated revenues for each of the three years ended December 31, 2009, 2008 and 2007, respectively. No other country accounts for greater than 10% of revenues.
| 92 | BEC 2009 FORM 10-K |
Table of Contents
Notes to Consolidated Financial Statements (Continued)
(tabular dollar amounts in millions, except amounts per share)
The following table sets forth revenue and long-lived asset data by geography:
| 2009* | 2008* | 2007* | |||||||
| Revenues by geography: |
|||||||||
| United States |
$ | 1,580.4 | $ | 1,542.1 | $ | 1,425.0 | |||
| Europe |
731.4 | 687.1 | 605.4 | ||||||
| Emerging Markets (a) |
270.2 | 278.3 | 224.1 | ||||||
| Asia Pacific |
477.6 | 383.7 | 316.1 | ||||||
| Other (b) |
200.9 | 207.7 | 190.7 | ||||||
| Total revenues |
$ | 3,260.6 | $ | 3,098.9 | $ | 2,761.3 | |||
| 2009 | 2008 | 2007 | |||||||
| Long-lived assets: |
|||||||||
| United States |
$ | 1,967.8 | $ | 1,690.3 | $ | 1,724.3 | |||
| International |
839.4 | 389.8 | 381.9 | ||||||
| Total long-lived assets |
$ | 2,807.2 | $ | 2,080.1 | $ | 2,106.2 | |||
| * | Amounts in table may not foot or recalculate due to rounding. |
| (a) | Emerging Markets includes Eastern Europe, Russia, Middle East, Africa and India. |
| (b) | Other includes Canada and Latin America. |
| BEC 2009 FORM 10-K | 93 |
Table of Contents
Notes to Consolidated Financial Statements (Continued)
(tabular dollar amounts in millions, except amounts per share)
Note 19. Quarterly Information (Unaudited)
| First Quarter (a) | Second Quarter (b) | Third Quarter (c) | Fourth Quarter (d) | Full Year | |||||||||||||||||||||||||||||
| 2009 | 2008 | 2009 | 2008 | 2009 | 2008 | 2009 | 2008 | 2009 | 2008 | ||||||||||||||||||||||||
| Recurring revenue |
$ | 573.7 | $ | 579.3 | $ | 629.0 | $ | 618.7 | $ | 676.1 | $ | 594.6 | $ | 766.4 | $ | 610.0 | $ | 2,645.2 | $ | 2,402.6 | |||||||||||||
| Instrument sales |
117.8 | 151.2 | 127.7 | 179.6 | 146.7 | 164.2 | 223.2 | 201.3 | 615.4 | 696.3 | |||||||||||||||||||||||
| Total revenue |
691.5 | 730.5 | 756.7 | 798.3 | 822.8 | 758.8 | 989.6 | 811.3 | 3,260.6 | 3,098.9 | |||||||||||||||||||||||
| Cost of recurring revenue |
268.3 | 270.5 | 285.0 | 278.1 | 324.9 | 274.5 | 368.8 | 272.6 | 1,247.0 | 1,095.7 | |||||||||||||||||||||||
| Cost of instrument sales |
104.1 | 131.2 | 114.8 | 153.3 | 120.0 | 135.3 | 173.6 | 155.4 | 512.5 | 575.2 | |||||||||||||||||||||||
| Total cost of sales |
372.4 | 401.7 | 399.8 | 431.4 | 444.9 | 409.8 | 542.4 | 428.0 | 1,759.5 | 1,670.9 | |||||||||||||||||||||||
| Selling, general and administrative |
185.9 | 196.1 | 191.2 | 205.3 | 211.3 | 201.8 | 223.2 | 190.2 | 811.6 | 793.4 | |||||||||||||||||||||||
| Research and development |
59.9 | 62.7 | 60.7 | 77.7 | 71.7 | 74.8 | 74.1 | 64.9 | 266.4 | 280.1 | |||||||||||||||||||||||
| Amortization of intangible assets |
7.3 | 7.5 | 7.5 | 7.4 | 11.3 | 7.4 | 13.5 | 7.3 | 39.6 | 29.6 | |||||||||||||||||||||||
| Environmental remediation |
— | — | — | — | — | 19.0 | — | — | 19.0 | ||||||||||||||||||||||||
| Restructuring and acquisition related costs |
26.4 | 0.7 | 21.6 | 4.7 | 79.2 | 7.8 | 25.1 | 8.2 | 152.3 | 21.4 | |||||||||||||||||||||||
| Operating income |
39.6 | 61.8 | 75.9 | 71.8 | 4.4 | 38.2 | 111.3 | 112.7 | 231.2 | 284.5 | |||||||||||||||||||||||
| Non-operating expense (income) |
21.4 | 8.4 | (2.5 | ) | 9.7 | 4.9 | 12.3 | 23.0 | 15.5 | 46.8 | 45.9 | ||||||||||||||||||||||
| Earnings before income taxes |
18.2 | 53.4 | 78.4 | 62.1 | (0.5 | ) | 25.9 | 88.3 | 97.2 | 184.4 | 238.6 | ||||||||||||||||||||||
| Income taxes |
(2.4 | ) | 12.5 | 17.6 | 16.2 | (2.0 | ) | 1.8 | 24.1 | 22.1 | 37.3 | 52.6 | |||||||||||||||||||||
| Net earnings |
$ | 20.6 | $ | 40.9 | $ | 60.8 | $ | 45.9 | $ | 1.5 | $ | 24.1 | $ | 64.2 | $ | 75.1 | $ | 147.1 | $ | 186.0 | |||||||||||||
| Basic earnings per share |
$ | 0.32 | $ | 0.65 | $ | 0.95 | $ | 0.73 | $ | 0.02 | $ | 0.38 | $ | 0.92 | $ | 1.19 | $ | 2.22 | $ | 2.95 | |||||||||||||
| Diluted earnings per share |
$ | 0.32 | $ | 0.63 | $ | 0.94 | $ | 0.71 | $ | 0.02 | $ | 0.37 | $ | 0.90 | $ | 1.18 | $ | 2.18 | $ | 2.89 | |||||||||||||
| Dividends per share |
$ | 0.17 | $ | 0.17 | $ | 0.17 | $ | 0.17 | $ | 0.17 | $ | 0.17 | $ | 0.18 | $ | 0.17 | $ | 0.69 | $ | 0.68 | |||||||||||||
| Stock price – High |
$ | 51.81 | $ | 74.35 | $ | 57.36 | $ | 71.23 | $ | 71.20 | $ | 76.66 | $ | 69.54 | $ | 70.74 | $ | 71.20 | $ | 76.66 | |||||||||||||
| Stock price – Low |
$ | 40.60 | $ | 63.13 | $ | 50.00 | $ | 61.98 | $ | 54.27 | $ | 67.61 | $ | 64.06 | $ | 37.24 | $ | 40.60 | $ | 37.24 | |||||||||||||
| 94 | BEC 2009 FORM 10-K |
Table of Contents
Notes to Consolidated Financial Statements (Continued)
(tabular dollar amounts in millions, except amounts per share)
Notes
| (a) | In the first quarter of 2009, we incurred an $11.8 million charge within non-operating expense related to foreign currency losses in connection with the Olympus acquisition associated with a forward contract that does not qualify as a cash flow hedge. |
| (b) | In the second quarter of 2008, we incurred a $12.0 million R&D charge related to the acquisition of a sub-license to receive certain patent rights to testing for the hepatitis C virus. In the second quarter of 2009, we had a gain within non-operating income of $20.5 million related to foreign currency gains in connection with the Olympus acquisition. |
| (c) | In the third quarter of 2008, we recorded a $19.0 million environmental remediation charge related to our Orange County consolidation project along with an $11.7 million R&D charge in connection with buying out our future U.S. royalty for preeclampsia tests from Nephromics LLC. In the third quarter of 2009, we recorded an $8.8 million charge within cost of recurring revenue related to the fair value of acquired inventory in connection with the Olympus acquisition, as a portion of the acquired inventory was sold during the third quarter. Also in the third quarter of 2009, we had a gain within non-operating income of $18.0 million related to foreign currency gains in connection with the Olympus acquisition. |
| (d) | In the fourth quarter of 2008, we recorded additional R&E tax credits of $8.9 million, as further described in Note 12. In the fourth quarter for 2009, we recorded a $13.0 million charge within cost of recurring revenue related to the fair value of acquired inventory in connection with the Olympus acquisition, as a portion of the acquired inventory was sold during the fourth quarter. |
| BEC 2009 FORM 10-K | 95 |
Table of Contents
Notes to Consolidated Financial Statements (Continued)
(tabular dollar amounts in millions, except amounts per share)
Item 9. Changes in and Disagreements with Accountants on Accounting and Financial Disclosure.
None.
Item 9A. Controls and Procedures.
We maintain disclosure controls and procedures that are designed to ensure that information required to be disclosed in our Exchange Act reports is recorded, processed, summarized and reported within the time periods specified in the SEC’s rules and forms, and that such information is accumulated and communicated to our management, including our Chief Executive Officer and Chief Financial Officer, as appropriate, to allow timely decisions regarding required disclosure. In designing and evaluating the disclosure controls and procedures, management recognizes that any controls and procedures, no matter how well designed and operated, can provide only reasonable assurance of achieving the desired control objectives, and management necessarily is required to apply its judgment in evaluating the cost-benefit relationship of possible controls and procedures.
As of December 31, 2009, the end of the fiscal year covered by this report, we carried out an evaluation, under the supervision and with the participation of our management, including our Chief Executive Officer and our Chief Financial Officer, of the effectiveness of the design and operation of our disclosure controls and procedures. Based on the foregoing, our Chief Executive Officer and Chief Financial Officer concluded that our disclosure controls and procedures were effective at the reasonable assurance level.
Management’s Report on Internal Control Over Financial Reporting
Our management also is responsible for establishing and maintaining adequate internal control over financial reporting for us. As part of that process, as of December 31, 2009, the end of the fiscal year covered by this report, we carried out an evaluation of our internal control over financial reporting. The evaluation was conducted following the Committee of Sponsoring Organizations of the Treadway Commission (COSO) Internal Control – Integrated Framework. The assessment did not identify any material weaknesses in our internal control over financial reporting and management concluded that our internal control over financial reporting was effective.
As discussed in Note 3 “Acquisitions” of the Notes to Consolidated Financial Statements in Item 8 of this Form 10-K, we acquired Olympus Diagnostics Systems (“Olympus”) in August 2009. We have excluded from our assessment of the effectiveness of our internal control over financial reporting as of December 31, 2009, the Olympus internal control over financial reporting associated with 9 percent of total assets and 6 percent of total revenues included in our consolidated financial statements as of and for the year ended December 31, 2009.
The independent registered public accounting firm that audited our financial statements contained in this annual report has issued an audit report on the effectiveness of our internal control over financial reporting. There has been no change in our internal control over financial reporting during our most recent fiscal quarter that has materially affected, or is reasonably likely to materially affect our internal control over financial reporting.
None.
| 96 | BEC 2009 FORM 10-K |
Table of Contents
Report of Independent Registered Public Accounting Firm
The Board of Directors and Stockholders
Beckman Coulter, Inc.:
We have audited Beckman Coulter, Inc.’s internal control over financial reporting as of December 31, 2009, based on criteria established in Internal Control – Integrated Framework issued by the Committee of Sponsoring Organizations of the Treadway Commission (COSO). Beckman Coulter’s management is responsible for maintaining effective internal control over financial reporting, and for its assessment of the effectiveness of internal control over financial reporting, included in the accompanying Management’s Report on Internal Control Over Financial Reporting appearing under Item 9A. Our responsibility is to express an opinion on the effectiveness of the Company’s internal control over financial reporting based on our audit.
We conducted our audit in accordance with the standards of the Public Company Accounting Oversight Board (United States). Those standards require that we plan and perform the audit to obtain reasonable assurance about whether effective internal control over financial reporting was maintained in all material respects. Our audit included obtaining an understanding of internal control over financial reporting, assessing the risk that a material weakness exists, and testing and evaluating the design and operating effectiveness of internal control based on the assessed risk. Our audit also included performing such other procedures as we considered necessary in the circumstances. We believe that our audit provides a reasonable basis for our opinion.
A company’s internal control over financial reporting is a process designed to provide reasonable assurance regarding the reliability of financial reporting and the preparation of financial statements for external purposes in accordance with generally accepted accounting principles. A company’s internal control over financial reporting includes those policies and procedures that (1) pertain to the maintenance of records that, in reasonable detail, accurately and fairly reflect the transactions and dispositions of the assets of the company; (2) provide reasonable assurance that transactions are recorded as necessary to permit preparation of financial statements in accordance with generally accepted accounting principles, and that receipts and expenditures of the company are being made only in accordance with authorizations of management and directors of the company; and (3) provide reasonable assurance regarding prevention or timely detection of unauthorized acquisition, use, or disposition of the company’s assets that could have a material effect on the financial statements.
Because of its inherent limitations, internal control over financial reporting may not prevent or detect misstatements. Also, projections of any evaluation of effectiveness to future periods are subject to the risk that controls may become inadequate because of changes in conditions, or that the degree of compliance with the policies or procedures may deteriorate.
In our opinion, Beckman Coulter, Inc. maintained, in all material respects, effective internal control over financial reporting as of December 31, 2009, based on criteria established in Internal Control – Integrated Framework issued by the Committee of Sponsoring Organizations of the Treadway Commission (COSO).
Beckman Coulter, Inc. acquired Olympus Diagnostic Systems (Olympus) in August 2009. Management excluded from its assessment of the effectiveness of Beckman Coulter’s internal control over financial reporting as of December 31, 2009, the Olympus internal control over financial reporting associated with 9 percent of total assets and 6 percent of total revenues included in the consolidated financial statements of Beckman Coulter, Inc. as of and for the year ended December 31, 2009. Our audit of internal control over financial reporting of Beckman Coulter, Inc. also excluded an evaluation of the internal control over financial reporting of Olympus.
We also have audited, in accordance with the standards of the Public Company Accounting Oversight Board (United States), the consolidated balance sheets of Beckman Coulter, Inc. and subsidiaries as of December 31, 2009 and 2008, and the related consolidated statements of earnings, stockholders’ equity and comprehensive income, and cash flows for each of the years in the three-year period ended December 31, 2009, and our report dated February 22, 2010, expressed an unqualified opinion on those consolidated financial statements.
| /s/ KPMG LLP |
| Irvine, California |
| February 22, 2010 |
| BEC 2009 FORM 10-K | 97 |
Table of Contents
Item 10. Directors, Executive Officers and Corporate Governance.
A list of our executive officers and biographical information appears in Part I, Item 1, “Executive Officers of the Registrant” of this Form 10-K and is incorporated herein by reference. An executive officer holds office until such officer resigns, is removed or otherwise disqualified to serve, or such officer’s successor is elected and qualified. There are no family relationships among any of our executive officers, and no executive officer was selected pursuant to any arrangement or understanding with another person. Additional information about our executive officers and information about our directors will be contained in our proxy statement to be filed for our 2010 Annual Meeting of Shareholders and is incorporated herein by reference.
We have adopted a Code of Ethics that applies to our principal executive officer, principal financial officer and principal accounting officer. A copy of the Code of Ethics is publicly available on our website at www.beckman.com. If we make any substantive amendments to the Code of Ethics or grant any waiver from a provision of the Code of Ethics applying to our principal executive officer, principal financial officer or principal accounting officer, we will disclose the nature of such amendment or waiver on our website or in a report on Form 8-K.
Item 11. Executive Compensation.
The information required by this item will be contained in our proxy statement to be filed for our 2010 Annual Meeting of Stockholders and is incorporated herein by reference.
Item 12. Security Ownership of Certain Beneficial Owners and Management and Related Stockholder Matters.
The information required by this item will be contained in our proxy statement to be filed for our 2010 Annual Meeting of Stockholders and is incorporated herein by reference.
Item 13. Certain Relationships and Related Transactions, and Director Independence.
The information required by this item will be contained in our proxy statement to be filed for our 2010 Annual Meeting of Stockholders and is incorporated herein by reference.
Item 14. Principal Accountant Fees and Services.
The information required by this item will be contained in our proxy statement to be filed for our 2010 Annual Meeting of Stockholders and is incorporated herein by reference.
Item 15. Exhibits, Financial Statement Schedules.
(a)(1), (a)(2) Financial Statements and Financial Statement Schedules
(a)(3) Exhibits
A list of exhibits filed with this Form 10-K is set forth on the Exhibit Index and is incorporated by reference. Each management contract or compensatory plan or arrangement required to be filed as an exhibit to this Form 10-K is indicated by an “*” on the Exhibit Index.
| 98 | BEC 2009 FORM 10-K |
Table of Contents
SIGNATURES
Pursuant to the requirements of Section 13 or 15(d) of the Securities Exchange Act of 1934, the registrant has duly caused this report to be signed on its behalf by the undersigned, thereunto duly authorized.
| Beckman Coulter, Inc. | ||||||
| Date: February 22, 2010 | By: | /s/ Scott Garrett | ||||
| Scott Garrett | ||||||
| Chairman of the Board, President and Chief Executive Officer | ||||||
| Date: February 22, 2010 | By: | /s/ Charles P. Slacik | ||||
| Charles P. Slacik | ||||||
| Senior Vice President & Chief Financial Officer | ||||||
| Date: February 22, 2010 | By: | /s/ Carolyn D. Beaver | ||||
| Carolyn D. Beaver | ||||||
| Corporate Vice President, Controller and Chief Accounting Officer | ||||||
| BEC 2009 FORM 10-K | 99 |
Table of Contents
POWER OF ATTORNEY
Each person whose signature appears below appoints Scott Garrett, Arnold A. Pinkston, and Charles P. Slacik, and each of them, as his or her true and lawful attorneys-in-fact and agents with full power of substitution and resubstitution, for him or her and in his or her name, place and stead, in any and all capacities, to sign any or all amendments to this Annual Report on Form 10-K, and to file the same, with all exhibits thereto, and all documents in connection therewith, with the Securities and Exchange Commission, granting unto said attorneys-in-fact and agents, and each of them, full power and authority to do and perform each and every act and thing requisite and necessary to be done in and about the foregoing, as fully to all intents and purposes as he or she might or could do in person, hereby ratifying and confirming all that said attorneys-in-fact and agents, or any of them or their substitutes, may lawfully do or cause to be done by virtue hereof.
Pursuant to the requirements of the Securities Exchange Act of 1934, this report has been signed by the following persons on behalf of the registrant and in the capacities and on the dates indicated.
| Signature |
Title |
Date | ||
| /s/ Scott Garrett |
Chairman of the Board, President and Chief Executive Officer |
February 22, 2010 | ||
| Scott Garrett | ||||
| /s/ Glenn S. Schafer |
Independent Lead Director | February 17, 2010 | ||
| Glenn S. Schafer | ||||
| /s/ Peter B. Dervan, Ph.D. |
Director | February 22, 2010 | ||
| Peter B. Dervan, Ph.D. | ||||
| /s/ Kevin M. Farr |
Director | February 22, 2010 | ||
| Kevin M. Farr | ||||
| /s/ Robert G. Funari |
Director | February 18, 2010 | ||
| Robert G. Funari | ||||
| /s/ Charles A. Haggerty |
Director | February 22, 2010 | ||
| Charles A. Haggerty | ||||
| /s/ Van B. Honeycutt |
Director | February 22, 2010 | ||
| Van B. Honeycutt | ||||
| /s/ William N. Kelley, M.D. |
Director | February 17, 2010 | ||
| William N. Kelley, M.D. | ||||
| /s/ Susan R. Nowakowski |
Director | February 22, 2010 | ||
| Susan R. Nowakowski | ||||
| 100 | BEC 2009 FORM 10-K |
Table of Contents
| Signature |
Title |
Date | ||
| /s/ Betty Woods |
Director | February 22, 2010 | ||
| Betty Woods | ||||
| /s/ Richard P. Wallace |
Director | February 22, 2010 | ||
| Richard P. Wallace | ||||
| /s/ Lewis T. Williams, M.D., Ph.D. |
Director | February 18, 2010 | ||
| Lewis T. Williams, M.D., Ph.D. | ||||
| BEC 2009 FORM 10-K | 101 |
Table of Contents
INDEX TO EXHIBITS
Exhibit
| Incorporated by Reference | ||||||||||||
| Exhibit No. |
Exhibit Description |
Form | SEC File No. |
Exhibit | Filing Date | Filed Herewith | ||||||
| 3.1 |
Restated Certificate of Incorporation | 10-Q | 001-10109 | 3.1 | 8/9/05 | |||||||
| 3.2 |
Amended and Restated Bylaws | 8-K | 001-10109 | 3.1 | 12/10/08 | |||||||
| 4.1 |
Specimen Common Stock Certificate | S-1/A | 33-24572 | 4.1 | 11/2/88 | |||||||
| 4.2 |
Senior Indenture, dated May 15, 1996, between registrant and The First National Bank of Chicago | 10-Q | 001-10109 | 10.1 | 7/24/96 | |||||||
| 4.3 |
7.05% Debentures Due June 1, 2026 | 10-Q | 001-10109 | 10.2 | 7/24/96 | |||||||
| 4.4 |
Supplemental Indenture No. 1 dated of March 6, 1998 to Senior Indenture dated May 15, 1996 between registrant and The First National Bank of Chicago | S-3 | 333-36426 | 4.13 | 4/13/01 | |||||||
| 4.5 |
Supplemental Indenture No. 2 dated March 6, 1998 to Senor Indenture dated May 15, 1996 between registrant and The First National Bank of Chicago, Beckman Instruments (Naguabo) Inc., Hybritech Incorporated, SmithKline Diagnostics, Inc., Coulter Corporation, and Coulter Leasing Corporation | S-3 | 333-36426 | 4.14 | 4/13/01 | |||||||
| 4.6 |
Senior Indenture, dated April 25, 2001, between registrant and Citibank, N.A. | S-3/A | 333-58968 | 4.1 | 4/26/01 | |||||||
| 4.7 |
First Supplemental Indenture dated November 19, 2001 to Senior Indenture dated April 25, 2001 between registrant, Citibank, N.A., Coulter Corporation, and Hybritech Incorporated | 10-K | 001-10109 | 4.12 | 2/22/02 | |||||||
| 4.8 |
Form of 6.875% Senior Notes Due 2011 (included in Exhibit 4.7) | |||||||||||
| 4.9 |
Second Supplemental Indenture dated December 15, 2006 to Senior Indenture dated April 15, 2001 between registrant and Wells Fargo Bank, National Association, as successor trustee | 8-K | 001-10109 | 4.1 | 12/15/06 | |||||||
| 4.10 |
Form of 2.50% Convertible Senior Notes Due 2036 (included in Exhibit 4.9) | |||||||||||
| 4.11 |
Third Supplemental Indenture dated May 21, 2009 to Senior Indenture dated April 25, 2001 between registrant and Wells Fargo Bank, National Association | 8-K | 001-10109 | 4.1 | 5/21/09 | |||||||
| 4.12 |
Form of 6% senior notes due 2015 (included in Exhibit 4.11) | |||||||||||
| 4.13 |
Form of 7% senior notes due 2019 (included in Exhibit 4.11) | |||||||||||
| 10.1 |
Distribution Agreement dated April 11, 1989 between registrant, SmithKline Beckman Corporation, and Allergan, Inc. | 8-K | 1-4077 | 3 | 4/14/89 | |||||||
| 102 | BEC 2009 FORM 10-K |
Table of Contents
| Incorporated by Reference | ||||||||||||
| Exhibit No. |
Exhibit Description |
Form | SEC File No. |
Exhibit | Filing Date | Filed Herewith | ||||||
| 10.2 |
Amendment to the Distribution Agreement dated June 1, 2989 between registrant, SmithKline Beckman Corporation, and Allergan, Inc. | S-1/A2 | 33-28853 | 10.26 | 6/20/89 | |||||||
| 10.3 |
Cross-Indemnification Agreement dated October 31, 1988 between registrant and SmithKline Beckman Corporation | S-1/A | 33-24572 | 10.1 | 11/2/88 | |||||||
| 10.4 |
Lease Agreement dated June 25, 1998 between registrant, NPDC-EY Brea Trust, and NPDC-R1 Brea Trust | 8-K | 001-10109 | 2.5 | 7/9/98 | |||||||
| 10.5 |
Lease Agreement dated June 25, 1998 between registrant and Cardbeck Chaska Trust | 8-K | 001-10109 | 2.6 | 7/9/98 | |||||||
| 10.6 |
Lease Agreement dated June 25, 1998 between registrant and Cardbeck Miami Trust | 8-K | 001-10109 | 2.7 | 7/9/98 | |||||||
| 10.7 |
Lease Agreement dated June 25, 1998 between registrant, NPDC-EY Palo Alto Trust, and NPDC-RI Palo Alto Trust | 8-K | 001-10109 | 2.8 | 7/9/98 | |||||||
| 10.8 |
Lease Modification Agreement dated June 25, 1998 between registrant, NPDC-EY Brea Trust, and NPDC-RI Brea Trust | 8-K | 001-10109 | 2.9 | 7/9/98 | |||||||
| 10.9 |
Lease Modification Agreement dated June 25, 1998 between registrant and Cardbeck Chaska Trust | 8-K | 001-10109 | 2.10 | 7/9/98 | |||||||
| 10.10 |
Lease Modification Agreement dated June 25, 1998 between registrant and Cardbeck Miami Trust | 8-K | 001-10109 | 2.11 | 7/9/98 | |||||||
| 10.11 |
Lease Modification Agreement dated June 25, 1998 between registrant, NPDC-EY Palo Alto Trust, and NPDC-RI Palo Alto Trust | 8-K | 001-10109 | 2.12 | 7/9/98 | |||||||
| 10.12 |
Amended and Restated Credit Agreement dated May 8, 2009 among registrant, Bank of America, N.A., JPMorgan Chase Bank, N.A., Citibank, N.A., Banc of America Securities, LLC, J.P. Morgan Securities, Inc. and Citigroup Global Markets Inc., and Banc of America Securities, LLC | 8-K | 001-10109 | 10.1 | 5/13/09 | |||||||
| 10.13 |
Receivables Sale Agreement dated October 31, 2007 between registrant and Beckman Coulter Finance Company, LLC | 8-K | 001-10109 | 10.1 | 11/6/07 | |||||||
| 10.14 |
Receivables Purchase Agreement dated October 31, 2007 between registrant, Beckman Coulter Finance Company, LLC, Park Avenue Receivables Company LLC, JPMorgan Chase Bank, N.A. and the financial institutions party thereto | 8-K | 001-10109 | 10.1 | 11/3/08 | |||||||
| 10.15 |
Interpurchaser Agreement dated February 6, 2008 between registrant, Beckman Coulter Finance Company, LLC, De Lage Landen Financial Services, Inc., De Lage Landen Finance, Inc. and JPMorgan Chase Bank, N.A. | 8-K | 001-10109 | 10.1 | 2/26/08 | |||||||
| 10.16 |
Omnibus Amendment to Receivables Sale Agreement dated February 6, 2008 between registrant, Beckman Coulter Finance Company LLC, the financial institutions party hereto, Park Avenue Receivables Company LLC and JPMorgan Chase Bank, N.A. | 8-K | 001-10109 | 10.2 | 2/26/08 | |||||||
| BEC 2009 FORM 10-K | 103 |
Table of Contents
| Incorporated by Reference | ||||||||||||
| Exhibit No. |
Exhibit Description |
Form |
SEC File No. |
Exhibit | Filing Date | Filed Herewith | ||||||
| 10.17 |
Benefit Equity Trust Agreement Dated as of October 5, 2008 between registrant and Wells Fargo Bank, N.A. | 10-Q | 001-10109 | 10.1 | 11/4/04 | |||||||
| 10.18 |
First Amendment to Beckman Coulter, Inc. Benefit Equity Trust Agreement as of February 23, 2009 between registrant and Wells Fargo Bank, N.A. | 10-K | 001-10109 | 10.18 | 2/23/09 | |||||||
| 10.19* |
Employees’ Stock Purchase Plan, amended and restated effective January 1, 2002 | DEF 14A |
001-10109 | B | 3/2/01 | |||||||
| 10.20* |
Amendment Number 2001-1 to the Employees’ Stock Purchase Plan, adopted September 25, 2001 | 10-Q | 001-10109 | 10.4 | 11/13/01 | |||||||
| 10.21* |
Option Gain Deferral Program, dated January 14, 1998 | S-8 POS |
333-24851 | 4.2 | 1/13/98 | |||||||
| 10.22* |
Beckman Coulter, Inc. Savings Plan, as amended and restated | S-8 | 333-156005 | 4. | 12/08/08 | |||||||
| 10.23* |
Amendment 2008-1 to Beckman Coulter, Inc. Savings Plan, dated December 19, 2008 | 10-K | 001-10109 | 10.18 | 2/23/09 | |||||||
| 10.24* |
1998 Incentive Compensation Plan | DEF 14A |
001-10109 | A | 2/26/98 | |||||||
| 10.25* |
Amendment 1998-1 adopted and effective April 2, 1998 to 1998 Incentive Compensation Plan | 10-Q | 001-10109 | 10.2 | 5/14/98 | |||||||
| 10.26* |
Amendment 1999-2 adopted November 23, 1999 to 1998 Incentive Compensation Plan | 10-K | 001-10109 | 10.51 | 3/6/00 | |||||||
| 10.27* |
2004 Long-Term Performance Plan | DEF 14A |
001-10109 | B | 2/27/04 | |||||||
| 10.28* |
Amendment 2005-1 to 2004 Long-Term Performance Plan dated December 22, 2005 | 10-Q | 001-10109 | 10.2 | 7/17/06 | |||||||
| 10.29* |
2007 Long-Term Performance Plan, as amended | 8-K | 001-10109 | 10.1 | 4/29/09 | |||||||
| 10.30* |
Form of 2007 Long-Term Performance Plan Terms and Conditions Award Notice and Agreement for Stock Option Grant | 10-K | 001-10109 | 10.30 | 2/23/09 | |||||||
| 10.31* |
Form of 2007 Long-Term Performance Plan Director Terms and Conditions Award Notice and Agreement for Stock Option Grant | 10-K | 001-10109 | 10.31 | 2/23/09 | |||||||
| 10.32* |
Form of 2007 Long-Term Performance Plan Terms and Conditions Award Notice and Agreement for Stock Unit Grant | 10-K | 001-10109 | 10.32 | 2/23/09 | |||||||
| 10.33* |
Form of 2007 Long-Term Performance Plan Director Terms and Conditions Award Notice and Agreement for Stock Unit Grant | 10-K | 001-10109 | 10.33 | 2/23/09 | |||||||
| 10.34* |
Form of 2007 Long-Term Performance Plan Terms and Conditions Award Notice and Agreement for 2008 Performance Share Grant | 10-K | 001-10109 | 10.34 | 2/23/09 | |||||||
| 10.35* |
Form of Change in Control Agreement dated December 31, 2008 between registrant and certain of its executive officers and other key employees | 8-K | 001-10109 | 10.1 | 12/10/08 | |||||||
| 104 | BEC 2009 FORM 10-K |
Table of Contents
| Incorporated by Reference | ||||||||||||
| Exhibit No. |
Exhibit Description |
Form | SEC File No. |
Exhibit | Filing Date | Filed Herewith | ||||||
| 10.36* |
Separation Pay Plan, Amended and Restated effective December 31, 2008 | 10-K | 001-10109 | 10.36 | 2/23/09 | |||||||
| 10.37* |
Deferred Directors Fee Program, Amended and Restated Effective January 1, 2008 | 10-K | 001-10109 | 10.90 | 2/29/08 | |||||||
| 10.38* |
Executive Deferred Compensation Plan, Amended and Restated Effective January 1, 2008 | 10-K | 001-10109 | 10.91 | 2/29/08 | |||||||
| 10.39* |
Executive Restoration Plan, Amended and Restated Effective January 1, 2008 | 10-K | 001-10109 | 10.92 | 2/29/08 | |||||||
| 10.40* |
Supplemental Pension Plan, Amended and Restated Effective January 1, 2008 | 10-K | 001-10109 | 10.40 | 2/23/09 | |||||||
| 10.41* |
Management Incentive Plan | 10-Q | 001-10109 | 10.1 | 5/7/09 | |||||||
| 10.42 |
Amended and Restated Master Purchase Agreement dated August 3, 2009 between registrant and Olympus Corporation | 8-K | 001-10109 | 2.1 | 8/4/09 | |||||||
| 12 |
Ratio of Earnings to Fixed Charges | X | ||||||||||
| 21 |
Significant Subsidiaries | X | ||||||||||
| 23 |
Consent of Independent Registered Public Accounting Firm | X | ||||||||||
| 31 |
Rule 13a-14(a)/15d-14(a) Certifications | X | ||||||||||
| 32 |
Section 1350 Certifications | X | ||||||||||
| 99 |
II. Valuation and Qualifying Accounts | X | ||||||||||
| * | This represents a management contract or compensatory plan or arrangement required to be filed as an exhibit to this Form 10-K. |
| BEC 2009 FORM 10-K | 105 |