Attached files
Table of Contents
UNITED STATES
SECURITIES AND EXCHANGE COMMISSION
WASHINGTON, D.C. 20549
FORM 10-K
[ x ] Annual Report Pursuant to Section 13 or 15(d) of the Securities Exchange Act of 1934
For the fiscal year ended: December 31, 2009
[ ] Transition Report Pursuant to Section 13 or 15(d) of the Securities Exchange Act of 1934
For the transition period from to .
Commission File Number: 000-25597
UMPQUA HOLDINGS CORPORATION
(Exact name of Registrant as specified in its charter)
| OREGON | 93-1261319 | |
| (State or Other Jurisdiction of Incorporation or Organization) |
(I.R.S. Employer Identification Number) |
ONE SW COLUMBIA STREET, SUITE 1200, PORTLAND, OREGON 97258
(Address of principal executive offices) (zip code)
(503) 727-4100
(Registrant’s telephone number, including area code)
Securities registered pursuant to Section 12(b) of the Act:
| Title of each class |
Name of each exchange on which registered | |
| Depositary Shares, representing interests in Series B |
The NASDAQ Stock Market, LLC |
Securities registered pursuant to Section 12(g) of the Act: Common Stock
Indicate by check mark if the registrant is a well-known seasoned issuer, as defined in Rule 405 of the Securities Act. Yes [ x ] No [ ]
Indicate by check mark if the registrant is not required to file reports pursuant to Section 13 or Section 15(d) of the Act. Yes [ ] No [ x ]
Indicate by check mark whether the registrant: (1) has filed all reports required to be filed by Section 13 or 15(d) of the Securities Exchange Act of 1934 during the preceding 12 months (or for such shorter period that the registrant was required to file such reports), and (2) has been subject to such filing requirements for the past 90 days. Yes [ x ] No [ ]
Indicate by check mark if disclosure of delinquent filers pursuant to Item 405 of Regulation S-K is not contained herein, and will not be contained, to the best of registrant’s knowledge, in definitive proxy or information statements incorporated by reference in Part III of this Form 10-K or any amendment to this Form 10-K. [ ]
Indicate by check mark whether the registrant has submitted electronically and posted on its corporate Web site, if any, every Interactive Data File required to be submitted and posted pursuant to Rule 405 of Regulation S-T (§232.405 of this chapter) during the preceding 12 months (or for such shorter period that the registrant was required to submit and post such files). Yes [ ] No [ ]
Indicate by check mark whether the registrant is a large accelerated filer, an accelerated filer, or a non-accelerated filer. See definition of “accelerated filer”, “large accelerated filer” and “smaller reporting company” in Rule 12b-2 of the Act. Check one:
Large Accelerated filer [ ] Accelerated filer [ x ] Non-accelerated filer [ ] Smaller reporting company [ ]
Indicate by check mark whether the registrant is a shell company (as defined in Rule 12b-2 of the Act). Yes [ ] No [ x ]
The aggregate market value of the voting common stock held by non-affiliates of the registrant as of June 30, 2009, based on the closing price on that date of $7.76 per share, and 59,222,425 shares outstanding was $459,566,018.
Indicate the number of shares outstanding for each of the issuer’s classes of common stock, as of the latest practical date:
The number of shares of the Registrant’s common stock (no par value) outstanding as of January 31, 2010 was 86,808,891.
DOCUMENTS INCORPORATED BY REFERENCE
Portions of the Proxy Statement for the 2010 Annual Meeting of Shareholders of Umpqua Holdings Corporation are incorporated by reference in this Form 10-K in response to Part III, Items 10, 11, 12, 13 and 14.
Table of Contents
FORM 10-K CROSS REFERENCE INDEX
1
Table of Contents
This Annual Report on Form 10-K contains forward-looking statements, within the meaning of Section 27A of the Securities Act of 1933 and Section 21E of the Securities Exchange Act of 1934, which are intended to be covered by the safe harbor for “forward-looking statements” provided by the Private Securities Litigation Reform Act of 1995. These statements may include statements that expressly or implicitly predict future results, performance or events. Statements other than statements of historical fact are forward-looking statements. You can find many of these statements by looking for words such as “anticipates,” “expects,” “believes,” “estimates” and “intends” and words or phrases of similar meaning. We make forward-looking statements regarding projected sources of funds, use of proceeds, availability of acquisition and growth opportunities, dividends, adequacy of our allowance for loan and lease losses and provision for loan and lease losses, our commercial real estate portfolio and subsequent chargeoffs. Forward-looking statements involve substantial risks and uncertainties, many of which are difficult to predict and are generally beyond our control. There are many factors that could cause actual results to differ materially from those contemplated by these forward-looking statements. Risks and uncertainties that could cause our financial performance to differ materially from our goals, plans, expectations and projections expressed in forward-looking statements include those set forth in our filings with the SEC, Item 1A of this Annual Report on Form 10-K, and the following factors that might cause actual results to differ materially form those presented:
| • | our ability to attract new deposits and loans and leases; |
| • | demand for financial services in our market areas; |
| • | competitive market pricing factors; |
| • | deterioration in economic conditions that could result in increased loan and lease losses; |
| • | risks associated with concentrations in real estate related loans; |
| • | market interest rate volatility; |
| • | stability of funding sources and continued availability of borrowings; |
| • | changes in legal or regulatory requirements or the results of regulatory examinations that could restrict growth; |
| • | our ability to recruit and retain key management and staff; |
| • | availability of, and competition for, FDIC-assisted acquisition opportunities; |
| • | risks associated with merger and acquisition integration; |
| • | significant decline in the market value of the Company that could result in an impairment of goodwill; |
| • | our ability to raise capital or incur debt on reasonable terms; |
| • | regulatory limits on the Bank’s ability to pay dividends to the Company; |
| • | effectiveness of the Emergency Economic Stabilization Act of 2008 (“EESA”) and other legislative and regulatory efforts to help stabilize the U.S. financial markets; |
| • | the impact of the EESA and the American Recovery and Reinvestment Act (“ARRA”) and related rules and regulations on the Company’s business operations and competitiveness, including the impact of executive compensation restrictions, which may affect the Company’s ability to retain and recruit executives in competition with other firms who do not operate under those restrictions. |
For a more detailed discussion of some of the risk factors, see the section entitled “Risk Factors” below. We do not intend to update any factors or to publicly announce revisions to any of our forward-looking statements. You should consider any forward looking statements in light of this explanation, and we caution you about relying on forward-looking statements.
2
Table of Contents
Umpqua Holdings Corporation
Introduction
Umpqua Holdings Corporation (referred to in this report as “we,” “our,” “Umpqua,” and “the Company”), an Oregon corporation, was formed as a bank holding company in March 1999. At that time, we acquired 100% of the outstanding shares of South Umpqua Bank, an Oregon state-chartered bank formed in 1953. We became a financial holding company in March 2000 under the provisions of the Gramm-Leach-Bliley Act. Umpqua has two principal operating subsidiaries, Umpqua Bank (the “Bank”) and Umpqua Investments, Inc. (“Umpqua Investments”). Prior to July 2009, Umpqua Investments was known as Strand, Atkinson, Williams and York, Inc. (“Strand”).
We file annual reports on Form 10-K, quarterly reports on Form 10-Q, current reports on Form 8-K, proxy statements and other information with the Securities and Exchange Commission (“SEC”). You may obtain these reports, and any amendments, from the SEC’s website at www.sec.gov. You may obtain copies of these reports, and any amendments, through our website at www.umpquaholdingscorp.com. These reports are available through our website as soon as reasonably practicable after they are filed electronically with the SEC. All of our SEC filings since November 14, 2002 have been made available on our website within two days of filing with the SEC.
General Background
Prior to 2004, the Company’s footprint included the Portland metropolitan and Willamette Valley areas of Oregon along the I-5 corridor, southern Oregon, and the Oregon coast. During the third quarter of 2004, we completed the acquisition of Humboldt Bancorp, which at the time of acquisition had total assets of approximately $1.5 billion and 27 branches located throughout Northern California. On June 2, 2006, we completed the acquisition of Western Sierra Bancorp and its principal operating subsidiaries, Western Sierra Bank, Central California Bank, Lake Community Bank and Auburn Community Bank. At the time of the acquisition, Western Sierra Bancorp had total assets of approximately $1.5 billion and 31 branches located throughout Northern California. On April 26, 2007, we completed the acquisition of North Bay Bancorp and its principal operating subsidiary, The Vintage Bank, along with its Solano Bank division. At the time of the acquisition, North Bay Bancorp had total assets of approximately $727.6 million and 10 Northern California branches located in the Napa area and in the communities of St. Helena, American Canyon, Vacaville, Benicia, Vallejo and Fairfield. On January 16, 2009, the Washington Department of Financial Institutions closed the Bank of Clark County, Vancouver, Washington, and appointed the Federal Deposit Insurance Corporation (“FDIC”) as its receiver. The FDIC entered into a purchase and assumption agreement with Umpqua Bank to assume certain assets and the insured non-brokered deposit balances, representing two branches, at no premium. On January 22, 2010, the Washington Department of Financial Institutions closed EvergreenBank, Seattle, Washington. Umpqua Bank entered into a whole bank purchase and assumption agreement with the FDIC to assume all of the deposits of EvergreenBank and purchase essentially all of the assets. The FDIC and Umpqua Bank entered into a loss-share transaction on $374.8 million of EvergreenBank’s assets. Umpqua Bank will share in the losses on the asset pools covered under the loss-share agreement. EvergreenBank’s seven Seattle metropolitan area branches opened as Umpqua Bank stores on January 25, 2010.
Our headquarters is located in Portland, Oregon, and we engage primarily in the business of commercial and retail banking and the delivery of retail brokerage services. The Bank provides a wide range of banking, mortgage banking and other financial services to corporate, institutional and individual customers. Along with our subsidiaries, we are subject to the regulations of state and federal agencies and undergo periodic examinations by these regulatory agencies. See “Supervision and Regulation” below for additional information.
We are considered one of the most innovative community banks in the United States, combining a retail product delivery approach with an emphasis on quality-assured personal service. The Bank has evolved from a traditional community bank into a community-oriented financial services retailer by implementing a variety of retail marketing strategies to increase revenue and differentiate ourselves from our competition.
Umpqua Investments is a registered broker-dealer and investment advisor with offices in Portland, Eugene, and Medford, Oregon, and in many Umpqua Bank stores. The firm is one of the oldest investment companies in the Northwest and is actively engaged in the communities it serves. Umpqua Investments offers a full range of investment products and services including: stocks, fixed income securities (municipal, corporate, and government bonds, CDs, and money market instruments), mutual funds, annuities, options, retirement planning, money management services and life insurance.
3
Table of Contents
Business Strategy
Our principal objective is to become the leading community-oriented financial services retailer throughout the Pacific Northwest and Northern California. We plan to continue the expansion of our market from Seattle to San Francisco, primarily along the I-5 corridor. We intend to continue to grow our assets and increase profitability and shareholder value by differentiating ourselves from competitors through the following strategies:
Capitalize On Innovative Product Delivery System. Our philosophy has been to develop an environment for the customer that makes the banking experience relevant and enjoyable. With this approach in mind, we have developed a unique store concept that offers “one-stop” shopping and includes distinct physical areas or boutiques, such as a “serious about service center,” an “investment opportunity center” and a “computer café,” which make the Bank’s products and services more tangible and accessible. In 2006, we introduced our “Neighborhood Stores” and in 2007, we introduced the Umpqua “Innovation Lab”. We expect to continue remodeling existing and acquired stores in metropolitan locations to further our retail vision.
Deliver Superior Quality Service. We insist on quality service as an integral part of our culture, from the Board of Directors to our new sales associates, and believe we are among the first banks to introduce a measurable quality service program. Under our “return on quality” program, each sales associate’s and store’s performance is evaluated monthly based on specific measurable factors such as the “sales effectiveness ratio” that totals the average number of banking products purchased by each new customer. The evaluations also encompass factors such as the number of new loan and deposit accounts generated in each store, reports by incognito “mystery shoppers” and customer surveys. Based on scores achieved, the “return on quality” program rewards both individual sales associates and store teams with financial incentives. Through such programs, we believe we can measure the quality of service provided to our customers and maintain employee focus on quality customer service.
Establish Strong Brand Awareness. As a financial services retailer, we devote considerable resources to developing the “Umpqua Bank” brand. This is done through marketing, merchandising, community based events, and our unique store environment. From bank branded tee-shirts and hats to branded bags of custom roasted coffee beans, to educational seminars, Umpqua’s goal is to engage our customer with the brand in a whole new way. The unique look and feel of our stores and interactive displays help position us as an innovative, customer friendly retailer of financial products and services. We build consumer preference for our products and services through strong brand awareness. During 2005, we secured naming rights to the office tower in Portland, Oregon in which our administrative offices and main branch are now located. This downtown building now displays prominent illuminated signage with the Bank’s name and logo.
Use Technology to Expand Customer Base. Although our strategy continues to emphasize superior personal service, we plan to expand user-friendly, technology-based systems to attract customers that may prefer to interact with their financial institution electronically. We offer technology-based services including remote deposit capture, online banking, bill pay and treasury services, mobile banking (March 2010), voice response banking, automatic payroll deposit programs, advanced function ATMs, interactive product kiosks, and a robust internet web site. We believe the availability of both traditional bank services and electronic banking services enhances our ability to attract a broader range of customers.
Increase Market Share in Existing Markets and Expand Into New Markets. As a result of our innovative retail product orientation, measurable quality service program and strong brand awareness, we believe that there is significant potential to increase business with current customers, to attract new customers in our existing markets and to enter new markets.
Pursue FDIC-assisted transactions. A part of our near-term strategy is to pursue certain failing banks that the FDIC makes available for bid, and that meet our strategic objectives. Failed bank transactions are attractive opportunities because we can acquire loans subject to a loss share agreement with the FDIC that limits our downside risk on the purchased loan portfolio and, apart from our assumption of deposit liabilities, we have significant discretion as to the non-deposit liabilities that we assume. Assets purchased from the FDIC are marked to their fair value and in many cases there is little or no addition to goodwill arising from an FDIC-assisted transaction. We have completed two FDIC-assisted transactions since January 1, 2009.
4
Table of Contents
Umpqua Holdings Corporation
Marketing and Sales
Our goal of increasing our share of financial services in our market areas is driven by a marketing and sales plan with the following key components:
Media Advertising. Our comprehensive marketing campaigns aim to strengthen the Umpqua Bank brand and heighten public awareness about our innovative delivery of financial products and services. The bank has been recognized nationally for its use of new media and unique approach. From programs like Umpqua’s Discover Local Music Project, Umpqua’s ice cream truck, the introduction of LocalSpace, a social networking site for businesses, to campaigns like “Save Hard Spend Smart” and the “Lemonaire”, Umpqua is utilizing non traditional media channels and leveraging mass market media in new ways. In 2005 Umpqua dubbed the term “hand-shake marketing” to describe the company’s fresh approach to localized marketing.
Retail Store Concept. As a financial services provider, we believe that the store environment is critical to successfully market and sell products and services. Retailers traditionally have displayed merchandise within their stores in a manner designed to encourage customers to purchase their products. Purchases are made on the spur of the moment due to the products’ availability and attractiveness. Umpqua Bank believes this same concept can be applied to financial institutions and accordingly displays financial services and products through tactile merchandising within our stores. Unlike many financial institutions whose strategy is to discourage customers from visiting their facilities in favor of ATMs or other forms of electronic banking, we encourage customers to visit our stores, where they are greeted by well-trained sales associates and encouraged to browse and to make “impulse purchases.” Our “Next Generation” store model includes features like wireless laptop computers customers can use, opening rooms with fresh fruit and refrigerated beverages and innovative products packaging like MainStreet for businesses – a package that includes relationship pricing for deposit and loan products, access to LocalSpace our social network for small businesses, and invitation to “Business Therapy” seminars. The stores host a variety of after-hours events, from poetry readings to seminars on how to build an art collection. In 2007, to bring financial services to our customers in a cost-effective way, we introduced “Neighborhood Stores.” We build these stores in established neighborhoods and design them to be neighborhood hubs. These stand-alone full-service stores are smaller size and emphasize advanced technology. To strengthen brand recognition, all Neighborhood Stores are similar in appearance. Umpqua’s “Innovation Lab” is a one-of-a-kind location, showcasing emerging and existing technologies that foster community and redefine what consumers can expect from a banking experience. As a testing ground for new initiatives, the Lab will change regularly to feature new technology, products, services and community events.
Service Culture. Umpqua believes strongly that if we lead with service culture, we will have more opportunity to sell our products and services and to create deeper customer relationships. Although a successful marketing program will attract customers to visit our stores, a service environment and a well-trained sales team are critical to selling our products and services. We believe that our service culture has become well established throughout the organization due to our unique facility designs and ongoing training of our “Universal Associates” on all aspects of sales and service. We train our associates at our in-house training facility known as “The World’s Greatest Bank University” to recognize and celebrate exceptional service, and pay commissions for the sale of the Bank’s products and services. This service culture has helped transform us from a traditional community bank to a nationally recognized marketing company focused on selling financial products and services.
Products and Services
We offer a full array of financial products to meet the banking needs of our market area and targeted customers. To ensure the ongoing viability of our product offerings, we regularly examine the desirability and profitability of existing and potential new products. To make it easy for new prospective customers to bank with us and access our products, we offer a “Switch Kit,” which allows a customer to open a primary checking account with Umpqua Bank in less than ten minutes. Other avenues through which customers can access our products include our web site equipped with an e-switchkit which includes automated billpay switch, internet banking through “umpqua.online”, mobile banking (coming in March of 2010), and our 24-hour telephone voice response system.
Deposit Products. We offer a traditional array of deposit products, including non-interest bearing checking accounts, interest bearing checking and savings accounts, money market accounts and certificates of deposit. These accounts earn interest at rates established by management based on competitive market factors and management’s desire to increase certain types or
5
Table of Contents
maturities of deposit liabilities. Our approach is to tailor fit products and bundle those that fit the customer’s needs. This approach adds value for the customer, increases products per household and produces higher service fee income. We also offer a seniors program to customers over fifty years old, which includes an array of banking services and other amenities, such as purchase discounts, vacation trips and seminars.
During the economic downturn, Umpqua opted to increase FDIC insurance coverage for our customers providing greater peace of mind during these difficult times. In addition, the Company has an agreement with Promontory Interfinancial Network that makes it possible to offer FDIC insurance to depositors in excess of the current deposit limits. This Certificate of Deposit Account Registry Service (“CDARS”) uses a deposit-matching program to distribute excess deposit balances across other participating banks. This product is designed to enhance our ability to attract and retain customers and increase deposits, by providing additional FDIC coverage to customers. Due to the nature of the placement of the funds, CDARS deposits are classified as “brokered deposits” by regulatory agencies.
Private Bank. Umpqua Private Bank serves high net worth individuals with liquid investable assets by providing customized financial solutions and offerings. The private bank is designed to augment Umpqua’s existing high-touch customer experience, and works collaboratively with the bank’s affiliate retail brokerage Umpqua Investments and with the independent capital management firm Ferguson Wellman, to offer a comprehensive, integrated approach that meets clients’ financial goals.
Retail Brokerage Services. Umpqua Investments provides a full range of brokerage services including equity and fixed income products, mutual funds, annuities, options, retirement planning and money management services. Additionally, Umpqua Investments offers life insurance policies. At December 31, 2009, Umpqua Investments had 52 Series 7-licensed financial advisors serving clients at three stand-alone retail brokerage offices and “Investment Opportunity Centers” located in many Bank stores.
Asset Management Services. Umpqua entered into a strategic alliance with Ferguson Wellman Capital Management Group in the fall of 2009 to further enhance our offerings to individuals, unions and corporate retirement plans, endowments and foundations.
Commercial Loans and Commercial Real Estate Loans. We offer specialized loans for business and commercial customers, including accounts receivable and inventory financing, equipment loans, international trade, real estate construction loans and permanent financing and SBA program financing. Additionally, we offer specially designed loan products for small businesses through our Small Business Lending Center. Ongoing credit management activities continue to focus on commercial real estate loans given this is a significant portion of our loan portfolio. We are also engaged in initiatives that continue to diversify the loan portfolio including a strong focus on commercial and industrial loans in addition to financing owner-occupied properties.
Residential Real Estate Loans. Real estate loans are available for construction, purchase and refinancing of residential owner-occupied and rental properties. Borrowers can choose from a variety of fixed and adjustable rate options and terms. We sell most residential real estate loans that we originate into the secondary market. Servicing is retained on the majority of these loans. We also support the Home Affordable Refinance Program and Home Affordable Modification Program.
Consumer Loans. We provide loans to individual borrowers for a variety of purposes, including secured and unsecured personal loans, home equity and personal lines of credit and motor vehicle loans.
Market Area and Competition
The geographic markets we serve are highly competitive for deposits, loans, leases and retail brokerage services. We compete with traditional banking and thrift institutions, as well as non-bank financial service providers, such as credit unions, brokerage firms and mortgage companies. In our primary market areas of Oregon, Western Washington and Northern California, major banks and large regional banks generally hold dominant market share positions. By virtue of their larger capital bases, these institutions have significantly larger lending limits than we do and generally have more expansive branch networks. Competition also includes other commercial banks that are community-focused, some of which were recently formed as “de novo” institutions seeking to capitalize on any perceived marketplace void resulting from merger and acquisition consolidation.
6
Table of Contents
Umpqua Holdings Corporation
Our primary competitors also include non-bank financial services providers, such as credit unions, brokerage firms, insurance companies and mortgage companies. As the industry becomes increasingly dependent on and oriented toward technology- driven delivery systems, permitting transactions to be conducted by telephone, computer and the internet, such non-bank institutions are able to attract funds and provide lending and other financial services even without offices located in our primary service area. Some insurance companies and brokerage firms compete for deposits by offering rates that are higher than may be appropriate for the Bank in relation to its asset and liability management objectives. However, we offer a wide array of deposit products and believe we can compete effectively through rate-driven product promotions. We also compete with full service investment firms for non-bank financial products and services offered by Umpqua Investments.
Credit unions present a significant competitive challenge for our banking services and products. As credit unions currently enjoy an exemption from income tax, they are able to offer higher deposit rates and lower loan rates than we can on a comparable basis. Credit unions are also not currently subject to certain regulatory constraints, such as the Community Reinvestment Act, which, among other things, requires us to implement procedures to make and monitor loans throughout the communities we serve. Adhering to such regulatory requirements raises the costs associated with our lending activities, and reduces potential operating profits. Accordingly, we seek to compete by focusing on building customer relationships, providing superior service and offering a wide variety of commercial banking products that do not compete directly with products and services typically offered by the credit unions, such as commercial real estate loans, inventory and accounts receivable financing, and SBA program loans for qualified businesses.
Many of our stores are located in markets that have historically experienced growth below statewide averages and the economy of Oregon is particularly sensitive to changes in the demand for forest and high technology products. With the completion of the Humboldt, Western Sierra and North Bay acquisitions, the Bank’s market area expanded to include most of Northern California. Like Oregon, some California stores are located in communities with growth rates that lag historically behind the state average. During the past several years, the States of Oregon, California and Washington have experienced economic difficulties. To the extent the fiscal condition of state and local governments does not improve, there could be an adverse effect on business conditions in the affected state that would negatively impact the prospects for the Bank’s operations located there.
The current adverse economic conditions, driven by the U.S. recession, the housing market downturn, and declining real estate values in our markets, have negatively impacted aspects of our loan portfolio and the markets we serve. Continued deterioration in the real estate market or other segments of our loan portfolio could further negatively impact our operations in these markets, financial condition and results of operations.
7
Table of Contents
The following table presents the Bank’s market share percentage for total deposits as of June 30, 2009, in each county where we have operations. The table also indicates the ranking by deposit size in each market, excluding EvergreenBank acquired in January 2010. See Note 28 of the Notes to the Consolidated Financial Statement in Item 8 below. All information in the table was obtained from SNL Financial of Charlottesville, Virginia, which compiles deposit data published by the FDIC as of June 30, 2009 and updates the information for any bank mergers completed subsequent to the reporting date.
| Oregon | |||||||
| County | Market Share |
Market Rank |
Number of Stores | ||||
| Benton |
6.3 | % | 7 | 1 | |||
| Clackamas |
3.1 | % | 7 | 5 | |||
| Coos |
36.3 | % | 1 | 5 | |||
| Curry |
24.6 | % | 2 | 1 | |||
| Deschutes |
3.8 | % | 9 | 5 | |||
| Douglas |
58.0 | % | 1 | 10 | |||
| Jackson |
13.5 | % | 2 | 9 | |||
| Josephine |
15.6 | % | 2 | 5 | |||
| Lane |
17.3 | % | 1 | 9 | |||
| Lincoln |
11.7 | % | 3 | 2 | |||
| Linn |
11.4 | % | 4 | 3 | |||
| Marion |
6.5 | % | 7 | 3 | |||
| Multnomah |
2.2 | % | 7 | 11 | |||
| Washington |
3.3 | % | 9 | 3 | |||
| California | |||||||
| County | Market Share |
Market Rank |
Number of Stores | ||||
| Amador |
4.5 | % | 7 | 1 | |||
| Butte |
2.7 | % | 8 | 2 | |||
| Calaveras |
22.0 | % | 2 | 4 | |||
| Colusa |
31.9 | % | 1 | 2 | |||
| Contra Costa |
0.2 | % | 25 | 1 | |||
| El Dorado |
6.4 | % | 4 | 5 | |||
| Glenn |
24.5 | % | 3 | 2 | |||
| Humboldt |
25.0 | % | 1 | 7 | |||
| Lake |
13.2 | % | 3 | 2 | |||
| Mendocino |
2.4 | % | 7 | 1 | |||
| Napa |
10.3 | % | 3 | 7 | |||
| Placer |
8.0 | % | 3 | 9 | |||
| Sacramento |
0.4 | % | 17 | 6 | |||
| San Joaquin |
0.4 | % | 19 | 1 | |||
| Shasta |
2.3 | % | 8 | 1 | |||
| Solano |
4.1 | % | 9 | 4 | |||
| Stanislaus |
0.6 | % | 16 | 2 | |||
| Sutter |
13.6 | % | 3 | 2 | |||
| Tehama |
16.0 | % | 3 | 2 | |||
| Trinity |
27.5 | % | 2 | 1 | |||
| Tuolumne |
13.1 | % | 4 | 5 | |||
| Yolo |
2.3 | % | 11 | 1 | |||
| Yuba |
22.5 | % | 3 | 2 | |||
8
Table of Contents
Umpqua Holdings Corporation
| Washington | |||||||
| County | Market Share |
Market Rank |
Number of Stores | ||||
| Clark |
7.1 | % | 7 | 5 | |||
| King |
0.1 | % | 44 | 2 | |||
Lending and Credit Functions
The Bank makes both secured and unsecured loans to individuals and businesses. At December 31, 2009, real estate construction/development, real estate mortgage, commercial real estate, commercial/industrial, and consumer/other loans represented approximately 10%, 12%, 58%, 19% and 1%, respectively, of the total loan and lease portfolio.
Inter-agency guidelines adopted by federal bank regulators mandate that financial institutions establish real estate lending policies with maximum allowable real estate loan-to-value limits, subject to an allowable amount of non-conforming loans as a percentage of capital. We have adopted as loan policy loan-to-value limits that range from 5% to 10% less than the federal guidelines for each category; however, policy exceptions are permitted for real estate loan customers with strong financial credentials.
Allowance for Loan and Lease Losses (“ALLL”) Methodology
The Bank performs regular credit reviews of the loan and lease portfolio to determine the credit quality and adherence to underwriting standards. When loans and leases are originated, they are assigned a risk rating that is reassessed periodically during the term of the loan through the credit review process. The Company’s risk rating methodology assigns risk ratings ranging from 1 to 10, where a higher rating represents higher risk. The 10 risk rating categories are a primary factor in determining an appropriate amount for the allowance for loan and lease losses. The Bank has a management ALLL Committee, which is responsible for, among other things, regularly reviewing the ALLL methodology, including loss factors, and ensuring that it is designed and applied in accordance with generally accepted accounting principles. The ALLL Committee reviews and approves loans and leases recommended for impaired status. The ALLL Committee also approves removing loans and leases from impaired status. The Bank’s Audit and Compliance Committee provides board oversight of the ALLL process and reviews and approves the ALLL methodology on a quarterly basis.
Each risk rating is assessed an inherent credit loss factor that determines the amount of the allowance for loan and lease losses provided for that group of loans and leases with similar risk rating. Credit loss factors may vary by region based on management’s belief that there may ultimately be different credit loss rates experienced in each region.
Regular credit reviews of the portfolio also identify loans that are considered potentially impaired. Potentially impaired loans are referred to the ALLL Committee which reviews and approves designated loans as impaired. A loan is considered impaired when based on current information and events, we determine that we will probably not be able to collect all amounts due according to the loan contract, including scheduled interest payments. When we identify a loan as impaired, we measure the impairment using discounted cash flows, except when the sole remaining source of the repayment for the loan is the liquidation of the collateral. In these cases, we use the current fair value of the collateral, less selling costs, instead of discounted cash flows. If we determine that the value of the impaired loan is less than the recorded investment in the loan, we either recognize an impairment reserve as a specific component to be provided for in the allowance for loan and lease losses or charge-off the impaired balance on collateral dependent loans if it is determined that such amount represents a confirmed loss. The combination of the risk rating-based allowance component and the impairment reserve allowance component lead to an allocated allowance for loan and lease losses.
The Bank may also maintain an unallocated allowance amount to provide for other credit losses inherent in a loan and lease portfolio that may not have been contemplated in the credit loss factors. This unallocated amount generally comprises less than 5% of the allowance, but may be maintained at higher levels during times of deteriorating economic conditions characterized by falling real estate values. The unallocated amount is reviewed periodically based on trends in credit losses, the results of credit reviews and overall economic trends. As of December 31, 2009, the unallocated allowance amount represented 9% of the allowance.
9
Table of Contents
Management believes that the ALLL was adequate as of December 31, 2009. There is, however, no assurance that future loan losses will not exceed the levels provided for in the ALLL and could possibly result in additional charges to the provision for loan and lease losses. In addition, bank regulatory authorities, as part of their periodic examination of the Bank, may require additional charges to the provision for loan and lease losses in future periods if warranted as a result of their review. Approximately 81% of our loan portfolio is secured by real estate, and a significant decline in real estate market values may require an increase in the allowance for loan and lease losses. The U.S. recession, the housing market downturn, and declining real estate values in our markets have negatively impacted aspects of our residential development, commercial real estate, commercial construction and commercial loan portfolios, and have led to an increase in non-performing loans and the allowance for loan and lease losses. A continued deterioration in our markets may adversely affect our loan portfolio and may lead to additional charges to the provision for loan and lease losses.
Employees
As of December 31, 2009, we had a total of 1,857 full-time equivalent employees. None of the employees are subject to a collective bargaining agreement and management believes its relations with employees to be good. Umpqua Bank was named #23 on Fortune magazine’s 2010 list of “100 Best Companies to Work For”, #34 on the 2009 list, #13 on the 2008 list and #34 on the 2007 list. Information regarding employment agreements with our executive officers is contained in Item 11 below, which item is incorporated by reference to our proxy statement for the 2010 annual meeting of shareholders.
Government Policies
The operations of our subsidiaries are affected by state and federal legislative changes and by policies of various regulatory authorities. These policies include, for example, statutory maximum legal lending rates, domestic monetary policies of the Board of Governors of the Federal Reserve System, United States fiscal policy, and capital adequacy and liquidity constraints imposed by federal and state regulatory agencies. Congress enacted the Emergency Economic Stabilization Act of 2008 (“EESA”), which granted significant authority to the U.S. Department of the Treasury (the “Treasury”) to invest in financial institutions, guarantee debt, buy troubled assets and take other action designed to stabilize financial markets. In November 2008, the Company closed a transaction under the Capital Purchase Program (“CPP”) in which the Company issued 214,181 shares of cumulative preferred stock to the Treasury and issued a warrant to purchase 2,221,795 (reduced in 2009 to 1,110,898) shares of common stock at $14.46 per share in exchange for $214,181,000. Agreements executed in connection with the CPP transaction place restrictions on compensation payable to senior executive officers and provide that the Company may not declare dividends that exceed $0.19 per common share per quarter without Treasury’s prior written consent. Federal and state governments have been actively responding to the financial market crisis that unfolded in 2008 and legislative and regulatory initiatives are expected to continue for the foreseeable future. In connection with the company’s public offering in February 2010, Umpqua repurchased the preferred stock from the Treasury. See Note 28 of the Notes to the Consolidated Financial Statement in Item 8 below.
Supervision and Regulation
General. We are extensively regulated under federal and state law. These laws and regulations are generally intended to protect depositors and customers, not shareholders. To the extent that the following information describes statutory or regulatory provisions, it is qualified in its entirety by reference to the particular statute or regulation. Any change in applicable laws or regulations may have a material effect on our business and prospects. Our operations may be affected by legislative changes and by the policies of various regulatory authorities. We cannot accurately predict the nature or the extent of the effects on our business and earnings that fiscal or monetary policies, or new federal or state legislation may have in the future. Umpqua is subject to the disclosure and regulatory requirements of the Securities Act of 1933, as amended, and the Securities Exchange Act of 1934, as amended, both as administered by the Securities and Exchange Commission. As a listed company on NASDAQ, Umpqua is subject to NASDAQ rules for listed companies.
Holding Company Regulation. We are a registered financial holding company under the Gramm-Leach-Bliley Act of 1999 (the “GLB Act”), and are subject to the supervision of, and regulation by, the Board of Governors of the Federal Reserve System (the “Federal Reserve”). As a financial holding company, we are examined by and file reports with the Federal Reserve. The Federal
10
Table of Contents
Umpqua Holdings Corporation
Reserve expects a bank holding company to serve as a source of financial and managerial strength to its subsidiary bank and, under appropriate circumstances, to commit resources to support the subsidiary bank.
Financial holding companies are bank holding companies that satisfy certain criteria and are permitted to engage in activities that traditional bank holding companies are not. The qualifications and permitted activities of financial holdings companies are described below under “Regulatory Structure of the Financial Services Industry.”
Federal and State Bank Regulation. Umpqua Bank, as a state chartered bank with deposits insured by the FDIC, is primarily subject to the supervision and regulation of the Oregon Department of Consumer and Business Services Division of Finance and Corporate Securities, the Washington Department of Financial Institutions, the California Department of Financial Institutions and the FDIC. These agencies may prohibit the Bank from engaging in what they believe constitute unsafe or unsound banking practices. Our primary state regulator (the State of Oregon) regularly examines the Bank or participates in joint examinations with the FDIC.
The Community Reinvestment Act (“CRA”) requires that, in connection with examinations of financial institutions within its jurisdiction, the FDIC evaluate the record of the financial institutions in meeting the credit needs of their local communities, including low- and moderate-income neighborhoods, consistent with the safe and sound operation of those institutions. These factors are also considered in evaluating mergers, acquisitions and applications to open a branch or new facility. A less than “Satisfactory” rating would result in the suspension of any growth of the Bank through acquisitions or opening de novo branches until the rating is improved. As of the most recent CRA examination in December 2007, the Bank’s CRA rating was “Satisfactory.”
Banks are also subject to certain restrictions imposed by the Federal Reserve Act on extensions of credit to executive officers, directors, principal shareholders or any related interest of such persons. Extensions of credit must be made on substantially the same terms, including interest rates and collateral as, and follow credit underwriting procedures that are not less stringent than, those prevailing at the time for comparable transactions with persons not affiliated with the bank, and must not involve more than the normal risk of repayment or present other unfavorable features. Banks are also subject to certain lending limits and restrictions on overdrafts to such persons. A violation of these restrictions may result in the assessment of substantial civil monetary penalties on the affected bank or any officer, director, employee, agent or other person participating in the conduct of the affairs of that bank, the imposition of a cease and desist order, and other regulatory sanctions.
The Federal Reserve Act and related Regulation W limit the amount of certain loan and investment transactions between the Bank and its affiliates, require certain levels of collateral for such loans, and limit the amount of advances to third parties that may be collateralized by the securities of Umpqua or its subsidiaries. Regulation W requires that certain transactions between the Bank and its affiliates be on terms substantially the same, or at least as favorable to the Bank, as those prevailing at the time for comparable transactions with or involving nonaffiliated companies or, in the absence of comparable transactions, on terms and under circumstances, including credit standards, that in good faith would be offered to or would apply to nonaffiliated companies. Umpqua and its subsidiaries have adopted an Affiliate Transactions Policy and have entered into an Affiliate Tax Sharing Agreement.
The Federal Reserve and the FDIC have adopted non-capital safety and soundness standards for institutions. These standards cover internal controls, information and internal audit systems, loan documentation, credit underwriting, interest rate exposure, asset growth, compensation, fees and benefits, and standards for asset quality, earnings and stock valuation. An institution that fails to meet these standards must develop a plan acceptable to the agency, specifying the steps that it will take to meet the standards. Failure to submit or implement such a plan may subject the institution to regulatory sanctions. We believe that the Bank is in compliance with these standards.
Federal Deposit Insurance. The Federal Deposit Insurance Reform Act of 2005 (“Reform Act”), enacted in February 2006, increased the deposit insurance limit for certain retirement plan deposit accounts from $100,000 to $250,000. The basic insurance limit for other deposits, including individuals, joint account holders, businesses, government entities, and trusts, remained at $100,000. The Reform Act also provided for the merger of the two deposit insurance funds administered by the FDIC, the Bank Insurance Fund (“BIF”) and the Savings Association Insurance Fund (“SAIF”), into the Deposit Insurance Fund (“DIF”). The FDIC effectuated the merger of the BIF and the SAIF into the DIF as of March 31, 2006. As a result of the merger of the funds, the BIF and the SAIF were abolished.
11
Table of Contents
On October 3, 2008, the EESA temporarily raised the basic limit on federal deposit insurance coverage from $100,000 to $250,000 per depositor. The basic deposit insurance limit would have returned to $100,000 after December 31, 2009. On May 20, 2009, the Helping Families Save Their Homes Act extended the temporary increase in the standard maximum deposit insurance amount to $250,000 per depositor through December 31, 2013. The standard maximum deposit insurance amount would return to $100,000 on January 1, 2014.
On November 21, 2008, the FDIC approved the final ruling establishing the Transaction Account Guarantee Program (“TAGP”) as part of the Temporary Liquidity Guarantee Program (“TLGP”). Under this program, effective immediately and through December 31, 2009, all non-interest bearing transaction accounts are fully guaranteed by the FDIC for the entire amount in the account. This unlimited coverage also extends to NOW (interest bearing deposit accounts) earning an interest rate no greater than .50% and all IOLTAs (lawyers’ trust accounts). Coverage under the TAGP, funded through insurance premiums paid by participating financial institutions, is in addition to and separate from the additional coverage announced under EESA. On August 26, 2009, the FDIC extended the TAGP portion of the TLGP for an additional six months, through June 30, 2010. Umpqua has elected to participate in the TAGP program through the extended period.
The amount of FDIC assessments paid by each member institution is based on its relative risk of default as measured by regulatory capital levels, regulatory examination ratings and other factors. The Reform Act created a new system and assessment rate schedule to calculate an institution’s assessment. The new base assessment rates per the Reform Act range from $0.02 to $0.40 per $100 of deposits annually. The FDIC may increase or decrease the assessment rate schedule five basis points (annualized) higher or lower than the base rates in order to manage the DIF to prescribed statutory target levels. For 2007 the effective assessment amounts were $0.03 above the base rate amounts. Assessment rates for well managed, well capitalized institutions ranged from $0.05 to $0.07 per $100 of deposits annually. The Bank’s assessment rate for 2008 fell within this range. In 2007, the FDIC issued one-time assessment credits that could be used to offset this expense. The Bank’s credit was fully utilized in 2007 and covered the majority of that year’s assessment. The Bank did not have any remaining credit to offset assessments in 2008.
In December 2008, the FDIC adopted a rule that amended the system for risk-based assessments and changed assessment rates in attempts to restore targeted reserve ratios in the DIF. Effective January 1, 2009, the risk-based assessment rates were uniformly raised by seven basis points (annualized). On February 27, 2009, the FDIC adopted another new rule further modifying the risk-based assessment system, effective April 1, 2009. The modifications to the assessment system effectively require riskier institutions to pay a larger share of the assessment. Characteristics of riskier institutions may include institutions with a significant reliance on secured liabilities or brokered deposits, particularly when combined with rapid asset growth. The rule also provided incentives for institutions to hold long-term unsecured debt and, for smaller institutions, high levels of Tier 1 capital. The initial base assessment rates range from $0.12 to $0.45 per $100 of deposits annually. After potential adjustments related to unsecured debt, secured liabilities and brokered deposit balances, the final total assessment rates range from $0.07 to $0.775 per $100 of deposits annually. Initial base assessment rates for well managed, well capitalized institutions ranged from $0.12 to $0.16 per $100 of deposits annually. The Bank’s assessment rate for 2009 fell within this range. Further increases in the assessment rate could have a material adverse effect on our earnings, depending upon the amount of the increase.
The FDIC may terminate the deposit insurance of any insured depository institution if it determines that the institution has engaged in or is engaging in unsafe and unsound banking practices, is in an unsafe or unsound condition or has violated any applicable law, regulation or order or any condition imposed in writing by, or pursuant to, any written agreement with the FDIC. The termination of deposit insurance for the Bank could have a material adverse effect on our financial condition and results of operations due to the fact that the Bank’s liquidity position would likely be affected by deposit withdrawal activity.
Dividends. Under the Oregon Bank Act and the Federal Deposit Insurance Corporation Improvement Act of 1991, the Bank is subject to restrictions on the payment of cash dividends to its parent company. A bank may not pay cash dividends if that payment would reduce the amount of its capital below that necessary to meet minimum applicable regulatory capital requirements. In addition, under the Oregon Bank Act, the amount of the dividend paid by the Bank may not be greater than net unreserved retained earnings, after first deducting to the extent not already charged against earnings or reflected in a reserve, all bad debts, which are debts on which interest is unpaid and past due at least six months unless the debt is fully
12
Table of Contents
Umpqua Holdings Corporation
secured and in the process of collection; all other assets charged-off as required by Oregon bank regulators or a state or federal examiner; and all accrued expenses, interest and taxes of the Bank. In addition, state and federal regulatory authorities are authorized to prohibit banks and holding companies from paying dividends that would constitute an unsafe or unsound banking practice. The Federal Reserve has issued a policy statement on the payment of cash dividends by bank holding companies, which expresses the Federal Reserve’s view that a bank holding company should pay cash dividends only to the extent that its net income for the past year is sufficient to cover both the cash dividends and a rate of earnings retention that is consistent with the holding company’s capital needs, asset quality and overall financial condition.
The agreements that we executed with the Treasury in connection with the CPP transaction provide that the Company may not pay dividends on, repurchase, or redeem any other class of stock unless we are current in the payment of all dividends on the preferred stock issued to Treasury. Furthermore, the agreement provides that we may not pay quarterly cash dividends on the Company’s common stock in excess of $0.19 per share without Treasury’s prior written consent, for as long as the preferred stock is outstanding. In connection with the company’s public offering in February 2010, Umpqua repurchased the preferred stock. See Note 28 of the Notes to the Consolidated Financial Statement in Item 8 below.
Capital Adequacy. The federal and state bank regulatory agencies use capital adequacy guidelines in their examination and regulation of holding companies and banks. If capital falls below the minimum levels established by these guidelines, a holding company or a bank may be denied approval to acquire or establish additional banks or non-bank businesses or to open new facilities.
The FDIC and Federal Reserve have adopted risk-based capital guidelines for holding companies and banks. The risk-based capital guidelines are designed to make regulatory capital requirements more sensitive to differences in risk profile among holding companies and banks, to account for off-balance sheet exposure and to minimize disincentives for holding liquid assets. Assets and off-balance sheet items are assigned to broad risk categories, each with appropriate weights. The resulting capital ratios represent capital as a percentage of total risk-weighted assets and off-balance sheet items. The capital adequacy guidelines limit the degree to which a holding company or bank may leverage its equity capital.
Federal regulations establish minimum requirements for the capital adequacy of depository institutions, such as the Bank. Banks with capital ratios below the required minimums are subject to certain administrative actions, including prompt corrective action, the termination of deposit insurance upon notice and hearing, or a temporary suspension of insurance without a hearing.
FDICIA requires federal banking regulators to take “prompt corrective action” with respect to a capital-deficient institution, including requiring a capital restoration plan and restricting certain growth activities of the institution. Umpqua could be required to guarantee any such capital restoration plan required of the Bank if the Bank became undercapitalized. Pursuant to FDICIA, regulations were adopted defining five capital levels: well capitalized, adequately capitalized, undercapitalized, severely undercapitalized and critically undercapitalized. Under the regulations, the Bank is considered “well capitalized” as of December 31, 2009.
Federal and State Regulation of Broker-Dealers. Umpqua Investments, Inc. is a fully disclosed introducing broker-dealer clearing through First Clearing LLC. Umpqua Investments is regulated by the Financial Industry Regulatory Authority (“FINRA”) and has deposits insured through the Securities Investors Protection Corp (“SIPC”) as well as third party insurers. FINRA performs regular examinations of the firm that include reviews of policies, procedures, recordkeeping, trade practices, and customer protection as well as other inquiries.
SIPC protects client securities and cash up to $500,000, including $100,000 for cash with additional coverage provided through First Clearing for the remaining net equity balance in a brokerage account, if any. This coverage does not include losses in investment accounts.
Broker-Dealer and Related Regulatory Supervision. Umpqua Investments is a member of, and is subject to the regulatory supervision of, the FINRA. Areas subject to this regulatory review include compliance with trading rules, financial reporting, investment suitability for clients, and compliance with stock exchange rules and regulations.
Effects of Government Monetary Policy. Our earnings and growth are affected not only by general economic conditions, but also by the fiscal and monetary policies of the federal government, particularly the Federal Reserve. The Federal Reserve
13
Table of Contents
implements national monetary policy for such purposes as curbing inflation and combating recession, through its open market operations in U.S. Government securities, control of the discount rate applicable to borrowings from the Federal Reserve, and establishment of reserve requirements against certain deposits. These activities influence growth of bank loans, investments and deposits, and also affect interest rates charged on loans or paid on deposits. The nature and impact of future changes in monetary policies and their impact on us cannot be predicted with certainty.
Regulatory Structure of the Financial Services Industry. Federal laws and regulations governing banking and financial services underwent significant changes in recent years and are subject to significant changes in the future. From time to time, legislation is introduced in the United States Congress that contains proposals for altering the structure, regulation, and competitive relationships of the nation’s financial institutions. If enacted into law, these proposals could increase or decrease the cost of doing business, limit or expand permissible activities, or affect the competitive balance among banks, savings associations, and other financial institutions. Whether or in what form any such legislation may be adopted or the extent to which our business might be affected thereby cannot be predicted.
The GLB Act, enacted in November 1999, repealed sections of the Banking Act of 1933, commonly referred to as the Glass-Steagall Act, that prohibited banks from engaging in securities activities, and prohibited securities firms from engaging in banking. The GLB Act created a new form of holding company, known as a financial holding company, that is permitted to acquire subsidiaries that are variously engaged in banking, securities underwriting and dealing, and insurance underwriting.
A bank holding company, if it meets specified requirements, may elect to become a financial holding company by filing a declaration with the Federal Reserve, and may thereafter provide its customers with a broader spectrum of products and services than a traditional bank holding company is permitted to do. A financial holding company may, through a subsidiary, engage in any activity that is deemed to be financial in nature and activities that are incidental or complementary to activities that are financial in nature. These activities include traditional banking services and activities previously permitted to bank holding companies under Federal Reserve regulations, but also include underwriting and dealing in securities, providing investment advisory services, underwriting and selling insurance, merchant banking (holding a portfolio of commercial businesses, regardless of the nature of the business, for investment), and arranging or facilitating financial transactions for third parties.
To qualify as a financial holding company, the bank holding company must be deemed to be well-capitalized and well-managed, as those terms are used by the Federal Reserve. In addition, each subsidiary bank of a bank holding company must also be well-capitalized and well-managed and be rated at least “satisfactory” under the Community Reinvestment Act. A bank holding company that does not qualify, or has not chosen, to become a financial holding company must limit its activities to traditional banking activities and those non-banking activities the Federal Reserve has deemed to be permissible because they are closely related to the business of banking.
The GLB Act also includes provisions to protect consumer privacy by prohibiting financial services providers, whether or not affiliated with a bank, from disclosing non-public personal, financial information to unaffiliated parties without the consent of the customer, and by requiring annual disclosure of the provider’s privacy policy.
Legislation enacted by Congress in 1995 permits interstate banking and branching, which allows banks to expand nationwide through acquisition, consolidation or merger. Under this law, an adequately capitalized bank holding company may acquire banks in any state or merge banks across state lines if permitted by state law. Further, banks may establish and operate branches in any state subject to the restrictions of applicable state law. Under Oregon law, an out-of-state bank or bank holding company may merge with or acquire an Oregon state chartered bank or bank holding company if the Oregon bank, or in the case of a bank holding company, the subsidiary bank, has been in existence for a minimum of three years, and the law of the state in which the acquiring bank is located permits such merger. Branches may not be acquired or opened separately, but once an out-of-state bank has acquired branches in Oregon, either through a merger with or acquisition of substantially all the assets of an Oregon bank, the acquirer may open additional branches. The Bank now has the ability to open additional de novo branches in the states of Oregon, California and Washington.
14
Table of Contents
Umpqua Holdings Corporation
Anti-Terrorism Legislation. The Uniting and Strengthening America by Providing Appropriate Tools Required to Intercept and Obstruct Terrorism Act (“USA Patriot Act”), enacted in 2001:
| • | prohibits banks from providing correspondent accounts directly to foreign shell banks; |
| • | imposes due diligence requirements on banks opening or holding accounts for foreign financial institutions or wealthy foreign individuals; |
| • | requires financial institutions to establish an anti-money-laundering (“AML”) compliance program; and |
| • | generally eliminates civil liability for persons who file suspicious activity reports. |
The USA Patriot Act also increases governmental powers to investigate terrorism, including expanded government access to account records. The Department of the Treasury is empowered to administer and make rules to implement the Act, which to some degree, affects our record-keeping and reporting expenses. Should the Bank’s AML compliance program be deemed insufficient by federal regulators, we would not be able to grow through acquiring other institutions or opening de novo branches.
Sarbanes-Oxley Act of 2002. The Sarbanes-Oxley Act of 2002 addresses public company corporate governance, auditing, accounting, executive compensation and enhanced and timely disclosure of corporate information.
The Sarbanes-Oxley Act represents significant federal involvement in matters traditionally left to state regulatory systems, such as the regulation of the accounting profession, and regulation of the relationship between a Board of Directors and management and between a Board of Directors and its committees.
The Sarbanes-Oxley Act provides for, among other things:
| • | prohibition on personal loans by Umpqua to its directors and executive officers except loans made by the Bank in accordance with federal banking regulations; |
| • | independence requirements for Board audit committee members and our auditors; |
| • | certification of Exchange Act reports by the chief executive officer, chief financial officer and principal accounting officer; |
| • | disclosure of off-balance sheet transactions; |
| • | expedited reporting of stock transactions by insiders; and |
| • | increased criminal penalties for violations of securities laws. |
The Sarbanes-Oxley Act also requires:
| • | management to establish, maintain and evaluate disclosure controls and procedures; |
| • | management to report on its annual assessment of the effectiveness of internal controls over financial reporting; |
| • | our external auditor to attest to the effectiveness of internal controls over financial reporting. |
The SEC has adopted regulations to implement various provisions of the Sarbanes-Oxley Act, including disclosures in periodic filings pursuant to the Exchange Act. Also, in response to the Sarbanes-Oxley Act, NASDAQ adopted new standards for listed companies. In 2004, the Sarbanes-Oxley Act substantially increased our reporting and compliance expenses.
Emergency Economic Stabilization Act of 2008 (EESA). This act granted broad powers to the U.S. Treasury, the FDIC, and the Federal Reserve to stabilize the financial markets under the following programs:
| • | the Capital Purchase Program allocated $250 billion to Treasury to purchase senior preferred shares and warrants to purchase commons stock from approved financial institutions; |
| • | the Troubled Asset Purchase Program allocated $250 billion to Treasury to purchase troubled assets from financial institutions, with Treasury to also receive securities issued by participating institutions; |
15
Table of Contents
| • | the Temporary Liquidity Guaranty Program (“TLGP”) authorized the FDIC to insure newly issued senior unsecured debt and insure the total balance in non-interest bearing transactional deposit accounts of those institutions who elect to participate; |
| • | the Commercial Paper and Money Market Investor Funding Facilities authorized the Federal Reserve Bank of New York to purchase rated commercial paper from U.S. companies and to purchase money market instruments from U.S. money market mutual funds. |
The Company is participating in the Capital Purchase Program and the Transaction Account Guarantee Program under the TLGP.
16
Table of Contents
Umpqua Holdings Corporation
In addition to the other information set forth in this report, you should carefully consider the factors discussed below. These factors could materially adversely affect our business, financial condition, liquidity, results of operations and capital position, and could cause our actual results to differ materially from our historical results or the results contemplated by the forward-looking statements contained in this report.
Difficult market conditions have adversely affected and may continue to have an adverse affect on our industry.
The capital and credit markets have been experiencing unprecedented volatility and disruption for more than twenty four months. Dramatic declines in the housing market over the past twenty four months, with falling home prices and increasing foreclosures, unemployment and under-employment, have negatively impacted the credit performance of mortgage loans and resulted in significant write-downs of asset values by financial institutions, including government-sponsored entities as well as major commercial and investment banks. These write-downs have caused many financial institutions to seek additional capital, to merge with larger and stronger institutions and, in some cases, to fail. Reflecting concern about the stability of the financial markets generally and the strength of counterparties, many lenders and institutional investors have reduced or ceased providing funding to borrowers, including to other financial institutions. This market turmoil and tightening of credit have led to an increased level of commercial and consumer delinquencies, lack of consumer confidence, increased market volatility and widespread reduction of business activity generally. The resulting economic pressure on consumers and lack of confidence in the financial markets has adversely affected our business, financial condition and results of operations. We do not expect that the difficult conditions in the financial markets are likely to improve in the near future. A worsening of these conditions would likely exacerbate the adverse effects of these difficult market conditions on us and others in the financial institutions industry. In particular, we may face the following risks in connection with these events:
| • | We expect to face increased regulation of our industry, including as a result of the Emergency Economic Stabilization Act of 2008 (the “EESA”) and the American Recovery and Reinvestment Act of 2009 (the “ARRA”). Compliance with such regulation may increase our costs and limit our ability to pursue business opportunities. |
| • | Our ability to assess the creditworthiness of our customers may be impaired if the models and approaches we use to select, manage, and underwrite our customers become less predictive of future performance. |
| • | The process we use to estimate losses inherent in our loan portfolio requires difficult, subjective, and complex judgments, including forecasts of economic conditions and how these economic predictions might impair the ability of our borrowers to repay their loans, which process may no longer be capable of accurate estimation and may, in turn, impact its reliability. |
| • | We may be required to pay future significantly higher Federal Deposit Insurance Corporation premiums if losses further deplete the FDIC deposit insurance fund. |
| • | There may be downward pressure on our stock price. |
| • | Our ability to engage in routine funding transactions could be adversely affected by the actions and commercial soundness of other financial institutions and government sponsored entities. |
| • | We may face increased competition due to intensified consolidation of the financial services industry. |
If current levels of market disruption and volatility continue or worsen, there can be no assurance that we will not experience an adverse effect, which may be material, on our ability to access capital and on our business, financial condition and results of operations.
The majority of our assets are loans, which if not repaid would result in losses to the Bank.
The Bank, like other lenders, is subject to credit risk, which is the risk of losing principal or interest due to borrowers’ failure to repay loans in accordance with their terms. Underwriting and documentation controls do not always work properly. A downturn in the economy or the real estate market in our market areas or a rapid increase in interest rates could have a negative effect on collateral values and borrowers’ ability to repay. To the extent loans are not paid timely by borrowers, the loans are placed on
17
Table of Contents
non-accrual status, thereby reducing interest income. Further, under these circumstances, an additional provision for loan and lease losses or unfunded commitments may be required. See Management’s Discussion and Analysis of Financial Condition and Results of Operations—“Allowance for Loan and Lease Losses and Reserve for Unfunded Commitments”, “Provision for Loan and Lease Losses” and “Asset Quality and Non-Performing Assets”.
A large percentage of our loan portfolio is secured by real estate, in particular commercial real estate. Continued deterioration in the real estate market or other segments of our loan portfolio would lead to additional losses, which could have a material adverse effect on our business, financial condition and results of operations.
As of December 31, 2009, approximately 81% of our loan portfolio is secured by real estate, the majority of which is commercial real estate. As a result of increased levels of commercial and consumer delinquencies and declining real estate values, we have experienced increasing levels of net charge-offs and allowances for loan and lease reserves. Continued increases in commercial and consumer delinquency levels or continued declines in real estate market values would require increased net charge-offs and increases in the allowance for loan and lease losses, which could have a material adverse effect on our business, financial condition and results of operations and prospects.
Continued deterioration in the real estate market could result in loans that we have restructured to become delinquent and classified as non-accrual loans.
At December 31, 2009, impaired loans of $134.4 million were classified as performing restructured loans. We restructured the loans in response to borrower financial difficulty, and generally provided for a temporary modification of loan repayment terms. Loans are reported as restructured when we grant concessions to a borrower experiencing financial difficulties that we would not otherwise consider. Examples of such concessions include forgiveness of principal or accrued interest, extending the maturity dates or providing a lower interest rate than would be normally available for a transaction of similar risk. In exchange for these concessions, at the time of restructure, we require additional collateral to bring the loan to value to at most 100%. A further decline in the economic conditions in our general market areas or other factors could adversely impact borrowers with restructured loans and cause borrowers to become delinquent or otherwise default or call into question their ability to repay full interest and principal in accordance with the restructured terms, which would result in the restructured loan being reclassified as non-accrual.
The effects of the current economic recession have been particularly severe in our primary market areas in the Pacific Northwest and Northern California.
Substantially all of our loans are to businesses and individuals in Northern California, Oregon and Washington. The Pacific Northwest has one of the nation’s highest unemployment rates and major employers in Oregon and Washington have recently implemented substantial employee layoffs or scaled back growth plans. Severe declines in housing prices and property values have been particularly acute in our primary market areas. The State of California continues to face fiscal challenges, the long-term effects of which on the State’s economy cannot be predicted. A further deterioration in the economic conditions or a prolonged delay in economic recovery in our primary market areas could result in the following consequences, any of which could materially and adversely affect our business: loan delinquencies may increase; problem assets and foreclosures may increase putting further price pressures on valuations generally; demand for our products and services may decrease; low cost or noninterest bearing deposits may decrease; and collateral for loans made by us, especially real estate, may decline in value, in turn reducing customers’ borrowing power, and reducing the value of assets and collateral associated with our existing loans.
FDIC-assisted acquisition opportunities may not become available and increased competition may make it more difficult for us to successfully bid on failed bank transactions.
Our near-term business strategy includes analyzing and bidding on failing banks that the FDIC plans to place in receivership. The FDIC may not place banks that meet our strategic objectives into receivership. Failed bank transactions are attractive opportunities in part because of loss sharing arrangements with the FDIC that limit the acquirer’s downside risk on the purchased loan portfolio and, apart from our assumption of deposit liabilities, we have significant discretion as to the non-deposit liabilities that we assume. In addition, assets purchased from the FDIC are marked to their fair value and in many cases there often is little or no addition to goodwill arising from FDIC-assisted transaction. The bidding process for failing banks
18
Table of Contents
Umpqua Holdings Corporation
could become very competitive and the FDIC does not provide information about bids until after the failing bank is closed. We may not be able to match or beat the bids of other acquirers unless we bid aggressively by increasing the premium paid on assumed deposits or reducing the discount bid on assets purchased, which could make the acquisition less beneficial to the financial performance of the Bank.
A rapid change in interest rates could make it difficult to maintain our current interest income spread and could result in reduced earnings.
Our earnings are largely derived from net interest income, which is interest income and fees earned on loans and investments, less interest paid on deposits and other borrowings. Interest rates are highly sensitive to many factors that are beyond the control of our management, including general economic conditions and the policies of various governmental and regulatory authorities. As interest rates change, net interest income is affected. With fixed rate assets (such as fixed rate loans and most investment securities) and liabilities (such as certificates of deposit), the effect on net interest income depends on the cash flows associated with the maturity of the asset or liability. Asset/liability management policies may not be successfully implemented and from time to time our risk position is not balanced. An unanticipated rapid decrease or increase in interest rates could have an adverse effect on the spreads between the interest rates earned on assets and the rates of interest paid on liabilities, and therefore on the level of net interest income. For instance, any rapid increase in interest rates in the future could result in interest expense increasing faster than interest income because of fixed rate loans and longer-term investments. Further, substantially higher interest rates generally reduce loan demand and may result in slower loan growth than previously experienced. See Management’s Discussion and Analysis of Financial Condition and Results of Operations—“Quantitative and Qualitative Disclosures about Market Risk”.
Interest rate volatility and credit risk adjusted rate spreads may impact our financial assets and liabilities measured at fair value, particularly the fair value of our junior subordinated debentures.
The widening of the credit risk adjusted rate spreads on potential new issuances of junior subordinated debentures above our contractual spreads and recent reductions in three month LIBOR rates have contributed to positive fair value adjustments in our junior subordinated debentures carried at fair value over the last three years. Tightening of these credit risk adjusted rate spreads and interest rate volatility may result in recognizing fair value adjustments in the form of write-downs charged to earnings in the future.
Recent legislative and regulatory initiatives to support the financial services industry have been coupled with numerous restrictions and requirements that could detrimentally affect the Company’s business and require us to raise additional capital.
In addition to the U.S. Treasury’s Capital Purchase Program (“CPP”) under the Troubled Asset Relief Program (“TARP”) announced in the fall of 2008, the U.S. Treasury and the FDIC have taken further steps to support and regulate the financial services industry, that include enhancing the liquidity support available to financial institutions, establishing a commercial paper funding facility, temporarily guaranteeing money market funds and certain types of debt issuances, and increasing insurance on bank deposits. Also, the U.S. Congress, through the EESA and the ARRA, has imposed a number of restrictions and limitations on the operations of financial services firms participating in the federal programs. These programs subject us and other financial institutions who participate in them to additional restrictions, oversight, reporting obligations and costs, which could have an adverse impact on our business, financial condition, results of operations or the price of our common stock. In addition, new proposals for legislation continue to be introduced in the U.S. Congress that could further substantially increase regulation of the financial services industry and impose restrictions on the ability of firms within the industry to conduct business consistent with historical practices, including aspects such as compensation, interest rates, new and inconsistent consumer protection regulations and mortgage regulation, among others. Federal and state legislatures could also adopt laws reducing the amount that borrowers are otherwise contractually required to pay under existing loan contracts or require lenders to extend or restructure certain loans. Federal and state regulatory agencies also frequently adopt changes to their regulations or change the manner in which existing regulations are applied.
We cannot predict the substance or impact of pending or future legislation or regulation, or the application thereof. Compliance with such current and potential regulation and scrutiny may significantly increase our costs, impede the efficiency of our internal business processes, require us to increase our regulatory capital and limit our ability to pursue business
19
Table of Contents
opportunities in an efficient manner. In response, we may be required to or choose to raise additional capital, which could have a dilutive effect on the existing holders of our common stock and adversely affect the market price of our common stock.
We may be required to raise additional capital in the future, but that capital may not be available when it is needed, or it may only be available on unacceptable terms, which could adversely affect our financial condition and results of operations.
We are required by federal and state regulatory authorities to maintain adequate levels of capital to support our operations or to support future FDIC-assisted acquisitions. Our ability to raise additional capital, if needed, will depend on conditions in the capital markets at that time, which are outside our control, and on our financial performance. Accordingly, we may not be able to raise additional capital, if needed, on terms acceptable to us. If we cannot raise additional capital when needed, our ability to further expand our operations and pursue our growth strategy could be materially impaired.
Conditions in the financial markets may limit our access to additional funding to meet our liquidity needs.
Liquidity is essential to our business. An inability to raise funds through deposits, borrowings, the sale or pledging as collateral of loans and other assets could have a substantial negative effect on our liquidity. Our access to funding sources in amounts adequate to finance our activities could be impaired by factors that affect us specifically or the financial services industry in general. An adverse regulatory action against us could detrimentally impact our access to liquidity sources. Our ability to borrow could also be impaired by factors that are nonspecific to us, such as severe disruption of the financial markets or negative news and expectations about the prospects for the financial services industry as a whole as evidenced by recent turmoil in the domestic and worldwide credit markets.
Our wholesale funding sources may prove insufficient to support our future growth or an unexpected reduction in deposits.
We must maintain sufficient funds to respond to the needs of depositors and borrowers. As a part of our liquidity management, we use a number of funding sources in addition to core deposit growth and repayments and maturities of loans and investments. If we continue to grow more rapidly than any increase in our deposit balances, we are likely to become more dependent on these sources, which include Federal Home Loan Bank advances, proceeds from the sale of loans and liquidity resources at the holding company. Our financial flexibility will be severely constrained if we are unable to maintain our access to funding or if adequate financing is not available to accommodate future growth at acceptable interest rates. If we are required to rely more heavily on more expensive funding sources to support future growth, our revenues may not increase proportionately to cover our costs, and our profitability would be adversely affected.
As a bank holding company that conducts substantially all of our operations through Umpqua Bank, our banking subsidiary, our ability to pay dividends, repurchase our shares or to repay our indebtedness depends upon liquid assets held by the holding company and the results of operations of our subsidiaries.
Umpqua Holdings Corporation is a separate and distinct legal entity from our subsidiaries and it receives substantially all of its revenue from dividends paid from Umpqua Bank. There are legal limitations on the extent to which the Bank may extend credit, pay dividends or otherwise supply funds to, or engage in transactions with, us. Our inability to receive dividends from the Bank could adversely affect our business, financial condition, results of operations and prospects.
Our net income depends primarily upon Umpqua Bank’s net interest income, which is the income that remains after deducting from total income generated by earning assets the expense attributable to the acquisition of the funds required to support earning assets (primarily interest paid on deposits). The amount of interest income is dependent on many factors including the volume of earning assets, the general level of interest rates, the dynamics of changes in interest rates and the levels of nonperforming loans. All of those factors affect the Bank’s ability to pay dividends to the holding company.
Various statutory provisions restrict the amount of dividends the Bank can pay to us without regulatory approval. The Bank may not pay cash dividends if that payment could reduce the amount of its capital below that necessary to meet the “adequately capitalized” level in accordance with regulatory capital requirements. It is also possible that, depending upon the financial condition of the Bank and other factors, regulatory authorities could conclude that payment of dividends or other payments, including payments to us, is an unsafe or unsound practice and impose restrictions or prohibit such payments. Under Oregon law, the Bank may not pay dividends in excess of unreserved retained earnings, deducting therefrom, to the extent not already
20
Table of Contents
Umpqua Holdings Corporation
charged against earnings or reflected in a reserve, the following: (1) all bad debts, which are debts on which interest is past due and unpaid for at least six months, unless the debt is fully secured and in the process of collection; (2) all other assets charged-off as required by Oregon bank regulators or a state or federal examiner; and (3) all accrued expenses, interest and taxes of the institution. The Federal Reserve has issued a policy statement on the payment of cash dividends by bank holding companies, which expresses the Federal Reserve’s view that a bank holding company should pay cash dividends only to the extent that its net income for the past year is sufficient to cover both the cash dividends and a rate of earnings retention that is consistent with the holding company’s capital needs, asset quality and overall financial condition.
A significant decline in the company’s market value could result in an impairment of goodwill.
Recently, the Company’s common stock has been trading at a price below its book value, including goodwill and other intangible assets. The valuation of goodwill is determined using discounted cash flows of forecasted earnings, estimated sales price based on recent observable market transactions and market capitalization based on current stock price. If impairment was deemed to exist, a write down of the asset would occur with a charge to earnings. In the second quarter 2009, we recognized a goodwill impairment charge of $112.0 million related to our Community Banking operating segment. See Management’s Discussion and Analysis of Financial Condition and Results of Operations— “Goodwill and Other Intangible Assets”.
A deferred tax asset position comprises $16.9 million of our total assets at December 31, 2009, and we are required to assess the recoverability of this asset on an ongoing basis.
Deferred tax assets are evaluated on a quarterly basis to determine if they are expected to be recoverable in the future. Our evaluation considers positive and negative evidence to assess whether it is more likely than not that a portion of the asset will not be realized. The risk of a valuation allowance increases if continuing operating losses are incurred. Future negative operating performance or other negative evidence may result in a valuation allowance being recorded against some or all of this amount. A valuation allowance on our deferred tax asset could have a material adverse impact on our capital and results of operations.
We are pursuing an aggressive growth strategy that is expected to include mergers and acquisitions, which could create integration risks.
Umpqua is among the fastest-growing community financial services organizations in the United States. Since 2000, we have completed the acquisition and integration of seven other financial institutions. There is no assurance that future acquisitions will be successfully integrated. We have announced our intent to pursue FDIC-assisted acquisition opportunities and to open new stores in Oregon, Washington and California, and to continue our growth strategy. If we pursue our growth strategy too aggressively, or if factors beyond management’s control divert attention away from our integration plans, we might not be able to realize some or all of the anticipated benefits. Moreover, we are dependent on the efforts of key personnel to achieve the synergies associated with our acquisitions. The loss of one or more of our key persons could have a material adverse effect upon our ability to achieve the anticipated benefits.
Because of our participation in the Troubled Asset Relief Program, we are subject to several restrictions including restrictions on our ability to declare or pay dividends and repurchase our shares as well as restrictions on compensation paid to our executives.
On November 14, 2008, in exchange for an aggregate purchase price of $214,181,000, we issued and sold to the U.S. Treasury, pursuant to the TARP Capital Purchase Program: (i) 214,181 shares of the Fixed Rate Cumulative Perpetual Preferred Stock, Series A, no par value per share and liquidation preference $1,000 per share and (ii) a warrant to purchase up to 2,221,795 shares of our common stock (recently adjusted to 1,110,898 shares), no par value per share. On February 17, 2010, we redeemed the Series A Preferred Shares and we will give notice of our intent to repurchase the Warrant. Until we redeemed the Series A Preferred Shares, our ability to declare or pay dividends on any of our shares was limited and the Treasury’s consent was generally required for us to make any stock repurchase. Those restrictions have now lapsed.
In addition, we were subject to TARP rules and standards governing executive compensation in 2009, which generally apply to our five most highly compensated employees, including our Chief Executive Officer. The standards include (1) ensuring that incentive compensation for senior executives does not encourage unnecessary and excessive risks that threaten the value of the
21
Table of Contents
financial institution; (2) required clawback of any bonus or incentive compensation paid to a senior executive based on statements of earnings, gains or other criteria that are later proven to be materially inaccurate; (3) prohibition on making golden parachute payments to senior executives; (4) agreement not to deduct for tax purposes executive compensation in excess of $500,000 for each senior executive; and (5) bonus and incentive compensation restrictions. In particular, the change to the deductibility limit on executive compensation will likely increase the overall cost of our compensation programs in 2010. Some of these restrictions will affect us for that part of fiscal year 2010 prior to redemption of the preferred shares and we may have some reporting obligations that extend beyond February 2010.
The financial services industry is highly competitive.
We face pricing competition for loans and deposits. We also face competition with respect to customer convenience, product lines, accessibility of service and service capabilities. Our most direct competition comes from other banks, brokerages, mortgage companies and savings institutions. We also face competition from credit unions, government-sponsored enterprises, mutual fund companies, insurance companies and other non-bank businesses. This significant competition in attracting and retaining deposits and making loans as well as in providing other financial services throughout our market area may impact future earnings and growth.
Involvement in non-bank business creates risks associated with the securities industry.
Umpqua Investments’ retail brokerage operations present special risks not borne by community banks that focus exclusively on community banking. For example, the brokerage industry is subject to fluctuations in the stock market that may have a significant adverse impact on transaction fees, customer activity and investment portfolio gains and losses. Likewise, additional or modified regulations may adversely affect Umpqua Investments’ operations. Umpqua Investments is also dependent on a small number of established brokers, whose departure could result in the loss of a significant number of customer accounts. A significant decline in fees and commissions or trading losses suffered in the investment portfolio could adversely affect Umpqua Investments’ income and potentially require the contribution of additional capital to support its operations. Umpqua Investments is subject to claim arbitration risk arising from customers who claim their investments were not suitable or that their portfolios were too actively traded. These risks increase when the market, as a whole, declines. The risks associated with retail brokerage may not be supported by the income generated by those operations. See Management’s Discussion and Analysis of Financial Condition and Results of Operations—“Non-interest Income”.
Our banking and brokerage operations are subject to extensive government regulation that is expected to become more burdensome, increase our costs and make us less competitive compared to financial services firms that are not subject to the same regulation.
We and our subsidiaries are subject to extensive regulation under federal and state laws. These laws and regulations are primarily intended to protect customers, depositors and the deposit insurance fund, rather than shareholders. The Bank is an Oregon state-chartered commercial bank whose primary regulator is the Oregon Division of Finance and Corporate Securities. The Bank is also subject to the supervision by and the regulations of the Washington Department of Financial Institutions, the California Department of Financial Institutions and the Federal Deposit Insurance Corporation (“FDIC”), which insures bank deposits. Umpqua Investments is subject to extensive regulation by the Securities and Exchange Commission (“SEC”) and the Financial Industry Regulatory Authority. Umpqua is subject to regulation and supervision by the Board of Governors of the Federal Reserve System, the SEC and NASDAQ. Federal and state regulations may place banks and brokerage firms at a competitive disadvantage compared to less regulated competitors such as finance companies, credit unions, mortgage banking companies and leasing companies. There is also the possibility that laws could be enacted that would prohibit a company from controlling both an FDIC-insured bank and a broker dealer, or restrict their activities if under common ownership. If we receive less than satisfactory results on regulatory examinations, we could be restricted from making acquisitions, adding new stores, developing new lines of business or otherwise continuing our growth strategy for a period of time. Future changes in federal and state banking and brokerage regulations could adversely affect our operating results and ability to continue to compete effectively.
22
Table of Contents
Umpqua Holdings Corporation
The value of the securities in our investment securities portfolio may be negatively affected by continued disruptions in securities markets.
The market for some of the investment securities held in our portfolio has become extremely volatile over the past two years. Volatile market conditions or deteriorating financial performance of the issuer or obligor may detrimentally affect the value of these securities. There can be no assurance that the declines in market value associated with these disruptions will not result in other-than-temporary or permanent impairments of these assets, which would lead to accounting charges that could have a material adverse effect on our net income and capital levels.
The volatility of our mortgage banking business can adversely affect earnings if our mitigating strategies are not successful.
Changes in interest rates greatly affect the mortgage banking business. One of the principal risks in this area is prepayment of mortgages and the consequent detrimental effect on the value of mortgage servicing rights (“MSR”). We may employ hedging strategies to mitigate this risk but if the hedging decisions and strategies are not successful, our net income could be adversely affected. See Management’s Discussion and Analysis of Financial Condition and Results of Operations—“Mortgage Servicing Rights”.
Our business is highly reliant on technology and our ability to manage the operational risks associated with technology.
We depend on internal and outsourced technology to support all aspects of our business operations. Interruption or failure of these systems creates a risk of business loss such as civil fines or damage claims from privacy breaches and adverse customer experience. Risk management programs are expensive to maintain and will not protect the Company from all risks associated with maintaining the security of customer information, proprietary data, external and internal intrusions, disaster recovery and failures in the controls used by vendors.
Our business is highly reliant on third party vendors and our ability to manage the operational risks associated with outsourcing those services.
We rely on third parties to provide services that are integral to our operations. These third party service providers support our operations and our sales efforts. Any disruption in the services provided by these third parties, or any reputational risk or damage they may suffer as a result of such disruptions could have an adverse effect on our reputation, operations and our ability to meet the needs of our customers. In our asset management business, we have a business alliance with Ferguson Wellman, a registered investment advisor to whom we refer customers for investment advice and asset management services. We cannot be sure that we will be able to maintain these relationships on favorable terms. We are dependent on third party service providers for data processing and information processing services that support our day-to-day banking and brokerage services. Some of these providers are associated with our competitors. The loss of these third party relationships could produce disruption of service and significant costs in connection with replacing these services.
Store construction can disrupt banking activities and may not be completed on time or within budget, which could result in reduced earnings.
The Bank has, over the past several years, been transformed from a traditional community bank into a community-oriented financial services retailer. We have announced plans to build new stores in Oregon, Washington and California as part of our de novo branching strategy. This includes our strategy of building “Neighborhood Stores.” We also continue to remodel acquired bank branches to resemble retail stores that include distinct physical areas or boutiques such as a “serious about service center,” an “investment opportunity center” and a “computer cafe.” Store construction involves significant expense and risks associated with locating store sites and delays in obtaining permits and completing construction. Remodeling involves significant expense, disrupts banking activities during the remodeling period, and presents a new look and feel to the banking services and products being offered. Financial constraints may delay remodeling projects. Customers may not react favorably to the construction-related activities or the remodeled look and feel. There are risks that construction or remodeling costs will exceed forecasted budgets and that there may be delays in completing the projects, which could cause disruption in those markets.
Changes in accounting standards may impact how we report our financial condition and results of operations.
23
Table of Contents
Our accounting policies and methods are fundamental to how we record and report our financial condition and results of operations. From time to time the Financial Accounting Standards Board (“FASB”) changes the financial accounting and reporting standards that govern the preparation of our financial statements. These changes can be difficult to predict and can materially impact how we record and report our financial condition and results of operations. In some cases, we could be required to apply a new or revised standard retroactively, resulting in a restatement of prior period financial statements.
ITEM 1B. UNRESOLVED STAFF COMMENTS.
None.
The executive offices of Umpqua are located at One SW Columbia Street in Portland, Oregon in office space that is leased. The main office of Umpqua Investments is located at 200 SW Market Street in Portland, Oregon in office space that is leased. The Bank owns its main office located in Roseburg, Oregon. At December 31, 2009, the Bank conducted Community Banking activities or operated Commercial Banking Centers at 155 locations, in Northern California, Oregon and Washington along the I-5 corridor; in the San Francisco Bay area, Inland Foothills, Napa and Coastal regions in California; in Bend and along the Coast of Oregon; in greater Seattle and Bellevue, Washington, of which 53 are owned and 102 are leased under various agreements. As of December 31, 2009, the Bank also operated 12 facilities for the purpose of administrative and other functions, such as back-office support, of which three are owned and 9 are leased. All facilities are in a good state of repair and appropriately designed for use as banking or administrative office facilities. As of December 31, 2009, Umpqua Investments leased five stand-alone offices from unrelated third parties and also leased space in 9 Bank stores under lease agreements that are based on market rates.
Additional information with respect to owned premises and lease commitments is included in Notes 6 and 18, respectively, of the Notes to Consolidated Financial Statements in Item 8 below.
On June 19, 2009, in the Circuit Court of the State of Oregon for Multnomah County, Kevin D. Padrick, Trustee of the Summit Accommodators Liquidating Trust, as plaintiff, filed a complaint seeking damages of at least $30 million from Umpqua Bank. Plaintiff alleges that the Bank’s provision of banking services to Summit Accommodators, Inc. (“Summit”), a 1031 exchange accommodator, aided and abetted the principals of Summit to breach their fiduciary duty to Summit. Based on the allegations in the complaint and our understanding of the relevant facts and circumstances, we believe that the claim is without merit and the Company is vigorously defending the claim.
On September 10, 2009, Danae Miller and fifty-seven additional plaintiffs, who are creditors in the Summit bankruptcy, filed a complaint in Multnomah County Circuit Court seeking damages of at least $30 million from Umpqua Bank. Plaintiffs make allegations that are similar to the allegations made by Padrick, i.e. that the Bank’s provision of banking services to Summit aided and abetted Summit’s breach of fiduciary duty to plaintiffs. Like the Padrick case, we believe that this claim is without merit and the Company is vigorously defending the claim.
No loss accrual has been made for either of these claims in the accompanying audited consolidated financial statements.
In addition, due to the nature of our business, we are involved in legal proceedings that arise in the ordinary course of our business. While the outcome of these matters is currently not determinable, we do not expect that the ultimate costs to resolve these matters will have a material adverse effect on our consolidated financial position, results of operations, or cash flows.
See Part II, Item 7, Non-Interest Expense for a discussion of the Company’s involvement in litigation pertaining to Visa, Inc.
ITEM 4. SUBMISSION OF MATTERS TO A VOTE OF SECURITIES HOLDERS.
No matters were submitted to the shareholders of the Company, through the solicitation of proxies or otherwise, during the fourth quarter of the year ended December 31, 2009.
24
Table of Contents
Umpqua Holdings Corporation
ITEM 5. MARKET FOR REGISTRANT’S COMMON EQUITY, RELATED STOCKHOLDER MATTERS AND ISSUER PURCHASES OF EQUITY SECURITIES.
(a) Our Common Stock is traded on The NASDAQ Global Select Market under the symbol “UMPQ.” As of December 31, 2009, there were 100,000,000 common shares authorized for issuance. The following table presents the high and low sales prices of our common stock for each period, based on inter-dealer prices that do not include retail mark-ups, mark-downs or commissions, and cash dividends declared for each period:
| Quarter Ended | High | Low | Cash Dividend Per Share | ||||||
| December 31, 2009 |
$ | 13.73 | $ | 9.41 | $ | 0.05 | |||
| September 30, 2009 |
$ | 11.84 | $ | 6.95 | $ | 0.05 | |||
| June 30, 2009 |
$ | 12.11 | $ | 7.58 | $ | 0.05 | |||
| March 31, 2009 |
$ | 14.54 | $ | 6.68 | $ | 0.05 | |||
| December 31, 2008 |
$ | 18.40 | $ | 10.14 | $ | 0.05 | |||
| September 30, 2008 |
$ | 23.10 | $ | 8.57 | $ | 0.19 | |||
| June 30, 2008 |
$ | 16.97 | $ | 11.43 | $ | 0.19 | |||
| March 31, 2008 |
$ | 17.06 | $ | 12.00 | $ | 0.19 | |||
As of December 31, 2009, our common stock was held by approximately 5,000 shareholders of record, a number that does not include beneficial owners who hold shares in “street name”, or shareholders from previously acquired companies that have not exchanged their stock. At December 31, 2009, a total of 1.8 million stock options, 187,000 shares of restricted stock and 335,000 restricted stock units were outstanding. Additional information about stock options, restricted stock and restricted stock units is included in Note 20 of the Notes to Consolidated Financial Statements in Item 8 below and in Item 12 below.
The payment of future cash dividends is at the discretion of our Board and subject to a number of factors, including results of operations, general business conditions, growth, financial condition and other factors deemed relevant by the Board of Directors. Further, our ability to pay future cash dividends is subject to certain regulatory requirements and restrictions discussed in the Supervision and Regulation section in Item 1 above.
In connection with the issuance and sale of preferred stock in the fourth quarter of 2008, the Company entered into a Letter Agreement including the Securities Purchase Agreement—Standard Terms (the “Agreement”) with the U.S. Treasury. The Agreement contained certain limitations on the payment of quarterly cash dividends on the Company’s common stock in excess of $0.19 per share, and on the Company’s ability to repurchase its common stock. The preferred stock has no maturity date and ranks senior to our common stock with respect to the payment of dividends and distribution of amounts payable upon liquidation, dissolution and winding up of the Company. The preferred has no general voting or participation rights, and no sinking fund requirements. In the event dividends on the preferred stock are not paid full for six dividend periods, whether or not consecutive, the preferred stock holders will have the right to elect two directors. Additional information about the preferred stock is included in Note 20 of the Notes to Consolidated Financial Statements in Item 8 below. Following the company’s public offering in February 2010, Umpqua redeemed the preferred stock on February 17, 2010 and thereby terminated the restrictions on the payment of common stock dividends under the Agreement. See Note 28 of the Notes to the Consolidated Financial Statement in Item 8 below.
During 2009, Umpqua’s Board of Directors declared a quarterly cash dividend of $0.05 per common share per quarter. These dividends were made pursuant to our existing dividend policy and in consideration of, among other things, earnings, regulatory capital levels, the overall payout ratio and expected asset growth. We expect that the dividend rate will be reassessed on a quarterly basis by the Board of Directors in accordance with the dividend policy. Such dividends are subject to the restrictions described in the preceding paragraph.
We have a dividend reinvestment plan that permits shareholder participants to purchase shares at the then-current market price in lieu of the receipt of cash dividends. Shares issued in connection with the dividend reinvestment plan are purchased in open market transactions.
25
Table of Contents
Equity Compensation Plan Information
The following table sets forth information about equity compensation plans that provide for the award of securities or the grant of options to purchase securities to employees and directors of Umpqua, its subsidiaries and its predecessors by merger that were in effect at December 31, 2009.
(shares in thousands)
| Equity Compensation Plan Information | ||||||||||
| (A | ) | (B | ) | (C | ) | |||||
| Plan category | Number of securities to be issued upon exercise of outstanding options, warrants and rights |
Weighted average exercise rights(4) |
Number of securities remaining available for future issuance under equity compensation plans excluding securities reflected in column(A) |
|||||||
| Equity compensation plans approved by security holders |
||||||||||
| 2003 Stock Incentive Plan(1) |
1,194 | $ | 16.96 | 489 | ||||||
| 2007 Long Term Incentive Plan(2) |
335 | — | 642 | |||||||
| Other(3) |
607 | $ | 11.39 | — | ||||||
| Total |
2,136 | $ | 15.05 | 1,131 | ||||||
| Equity compensation plans not approved by security holders |
— | — | — | |||||||
| Total |
2,136 | $ | 15.05 | 1,131 | ||||||
| (1) | At Umpqua’s 2007 Annual Meeting, shareholders approved an amendment to the 2003 Stock Incentive Plan. The plan authorized the issuance of two million shares of stock through awards of incentive stock options, nonqualified stock options or restricted stock grants, provided awards of stock options and restricted stock grants under the 2003 Stock Incentive Plan, when added to options outstanding under all other plans, are limited to a maximum 10% of the outstanding shares on a fully diluted basis. |
| (2) | At Umpqua’s 2007 Annual Meeting, shareholders approved a 2007 Long Term Incentive Plan. The plan authorized the issuance of one million shares of stock through awards of performance-based restricted stock unit grants to executive officers. Target grants of 111,000 and maximum grants of 194,000 were approved to be issued in 2007, target grants of 105,000 and maximum grants of 183,000 were approved to be issued in 2008, and target grants of 65,000 and maximum grants of 114,000 were approved to be issued in 2009 under this plan. During 2008, 76,000 units forfeited upon the retirement of an executive. During 2009, 23,000 units vested and were released and 57,000 units forfeited upon the retirement of an executive. As of December 31, 2009 112,000 restricted stock units are expected to vest if the current estimate of performance-based targets is satisfied, and would result in 865,000 securities available for future issuance. |
| (3) | Includes other Umpqua stock plans and stock plans assumed through previous mergers. Includes 24,000 shares issued under North Bay Bancorp’s stock option plans, having a weighted average exercise price of $17.17. Includes 351,000 shares issued under all other previously acquired companies’ stock option plans, having a weighted average exercise price of $8.78 per share. |
| (4) | Weighted average exercise price is based solely on securities with an exercise price. |
| (b) | Not applicable. |
26
Table of Contents
Umpqua Holdings Corporation
(c) The following table provides information about repurchases of common stock by the Company during the quarter ended December 31, 2009:
| Period | Total number of Shares Purchased(1) |
Average Price Paid per Share |
Total Number of Shares Purchased as Part of Publicly Announced Plan(2) |
Maximum Number of Remaining Shares that May be Purchased at Period End under the Plan | |||||
| 10/1/09 - 10/31/09 |
228 | $ | 10.16 | — | 1,542,945 | ||||
| 11/1/09 - 11/30/09 |
— | $ | — | — | 1,542,945 | ||||
| 12/1/09 - 12/31/09 |
175 | $ | 11.62 | — | 1,542,945 | ||||
| Total for quarter |
403 | $ | 10.79 | — | |||||
| (1) | Shares repurchased by the Company during the quarter consist of cancellation of 403 restricted shares to pay withholding taxes. There were no shares tendered in connection with option exercises and no shares were repurchased pursuant to the Company’s publicly announced corporate stock repurchase plan described in (2) below. |
| (2) | The Company’s share repurchase plan, which was approved by the Board and announced in August 2003, originally authorized the repurchase of up to 1.0 million shares. Prior to 2007, the authorization was amended to increase the repurchase limit to 2.5 million shares. On April 19, 2007, the Company announced an expansion of the Board approved common stock repurchase plan, increasing the repurchase limit to 6.0 million shares and extending the plan’s expiration date from June 30, 2007 to June 30, 2009. On April 21, 2009, the Company announced that the Board of Directors approved an extension to the expiration date of the common stock repurchase plan from June 30, 2009 to June 30, 2011. The timing and amount of future repurchases will depend upon the market price for our common stock, securities laws restricting repurchases, asset growth, earnings, our capital plan, and are subject to certain limitations resulting from the Company’s participation in the TARP Capital Purchase Program, as described in Note 20 in the Notes to Consolidated Financial Statements in Item 8 of this report. |
During the year ended December 31, 2009, there were no shares tendered in connection with option exercises. During the year ended December 31, 2008, there were 263 shares tendered in connection with option exercises. Restricted shares cancelled to pay withholding taxes totaled 11,257 and 7,936 shares during the years ended December 31, 2009 and 2008, respectively. Restricted stock units cancelled to pay withholding taxes totaled 8,259 during the year ended December 31, 2009. No restricted stock units were cancelled to pay withholding taxes during the year ended December 31, 2008.
27
Table of Contents
STOCK PERFORMANCE GRAPH
The following chart, which is furnished not filed, compares the yearly percentage changes in the cumulative shareholder return on our common stock during the five fiscal years ended December 31, 2009, with (i) the Total Return Index for Nasdaq Bank Stocks (ii) the Total Return Index for The Nasdaq Stock Market (U.S. Companies) and (iii) the Standard and Poor’s 500. This comparison assumes $100.00 was invested on December 31, 2004, in our common stock and the comparison indices, and assumes the reinvestment of all cash dividends prior to any tax effect and retention of all stock dividends. Price information from December 31, 2004 to December 31, 2009, was obtained by using the Nasdaq closing prices as of the last trading day of each year.
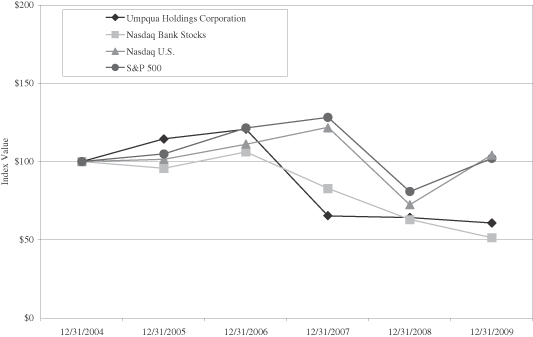
| Period Ending | ||||||||||||||||||
| 12/31/2004 | 12/31/2005 | 12/31/2006 | 12/31/2007 | 12/31/2008 | 12/31/2009 | |||||||||||||
| Umpqua Holdings Corporation |
$ | 100.00 | $ | 114.60 | $ | 120.75 | $ | 65.22 | $ | 64.23 | $ | 60.72 | ||||||
| Nasdaq Bank Stocks |
$ | 100.00 | $ | 95.67 | $ | 106.20 | $ | 82.76 | $ | 62.96 | $ | 51.31 | ||||||
| Nasdaq U.S. |
$ | 100.00 | $ | 101.37 | $ | 111.03 | $ | 121.92 | $ | 72.49 | $ | 104.31 | ||||||
| S&P 500 |
$ | 100.00 | $ | 104.91 | $ | 121.48 | $ | 128.16 | $ | 80.74 | $ | 102.11 | ||||||
28
Table of Contents
Umpqua Holdings Corporation
ITEM 6. SELECTED FINANCIAL DATA.
Umpqua Holdings Corporation
Annual Financial Trends
(in thousands, except per share data)
| 2009 | 2008 | 2007 | 2006 | 2005 | ||||||||||||
| Interest income |
$ | 423,732 | $ | 442,546 | $ | 488,392 | $ | 405,941 | $ | 282,276 | ||||||
| Interest expense |
103,024 | 152,239 | 202,438 | 143,817 | 72,994 | |||||||||||
| Net interest income |
320,708 | 290,307 | 285,954 | 262,124 | 209,282 | |||||||||||
| Provision for loan and lease losses |
209,124 | 107,678 | 41,730 | 2,552 | 2,468 | |||||||||||
| Non-interest income |
73,516 | 107,118 | 64,829 | 53,525 | 47,713 | |||||||||||
| Non-interest expense |
267,178 | 215,588 | 210,804 | 177,104 | 146,725 | |||||||||||
| Goodwill impairment |
111,952 | 982 | — | — | — | |||||||||||
| Merger-related expense |
273 | — | 3,318 | 4,773 | 262 | |||||||||||
| (Loss) income before income taxes |
(194,303 | ) | 73,177 | 94,931 | 131,220 | 107,540 | ||||||||||
| (Benefit from) provision for income taxes |
(40,937 | ) | 22,133 | 31,663 | 46,773 | 37,805 | ||||||||||
| Net (loss) income |
(153,366 | ) | 51,044 | 63,268 | 84,447 | 69,735 | ||||||||||
| Preferred stock dividends |
12,866 | 1,620 | — | — | — | |||||||||||
| Dividends and undistributed earnings allocated to participating securities |
30 | 154 | 187 | 192 | 85 | |||||||||||
| Net (loss) earnings available to common shareholders |
$ | (166,262 | ) | $ | 49,270 | $ | 63,081 | $ | 84,255 | $ | 69,650 | |||||
| YEAR END |
||||||||||||||||
| Assets |
$ | 9,381,372 | $ | 8,597,550 | $ | 8,340,053 | $ | 7,344,236 | $ | 5,360,639 | ||||||
| Earning assets |
8,344,203 | 7,491,498 | 7,146,841 | 6,287,202 | 4,636,334 | |||||||||||
| Loans and leases |
5,999,267 | 6,131,374 | 6,055,635 | 5,361,862 | 3,921,631 | |||||||||||
| Deposits |
7,440,434 | 6,588,935 | 6,589,326 | 5,840,294 | 4,286,266 | |||||||||||
| Term debt |
76,274 | 206,531 | 73,927 | 9,513 | 3,184 | |||||||||||
| Junior subordinated debentures, at fair value |
85,666 | 92,520 | 131,686 | — | — | |||||||||||
| Junior subordinated debentures, at amortized cost |
103,188 | 103,655 | 104,680 | 203,688 | 165,725 | |||||||||||
| Common shareholders’ equity |
1,362,182 | 1,284,830 | 1,239,938 | 1,156,211 | 738,261 | |||||||||||
| Total shareholders’ equity |
1,566,517 | 1,487,008 | 1,239,938 | 1,156,211 | 738,261 | |||||||||||
| Common shares outstanding |
86,786 | 60,146 | 59,980 | 58,080 | 44,556 | |||||||||||
| AVERAGE |
||||||||||||||||
| Assets |
$ | 8,975,178 | $ | 8,342,005 | $ | 7,897,568 | $ | 6,451,660 | $ | 5,053,417 | ||||||
| Earning assets |
7,925,014 | 7,215,001 | 6,797,834 | 5,569,619 | 4,353,696 | |||||||||||
| Loans and leases(1) |
6,103,666 | 6,118,540 | 5,822,907 | 4,803,509 | 3,613,257 | |||||||||||
| Deposits |
7,010,739 | 6,459,576 | 6,250,521 | 5,003,949 | 4,002,153 | |||||||||||
| Term debt |
129,814 | 194,312 | 57,479 | 58,684 | 31,161 | |||||||||||
| Junior subordinated debentures |
190,491 | 226,349 | 221,833 | 187,994 | 165,981 | |||||||||||
| Common shareholders’ equity |
1,315,953 | 1,254,730 | 1,222,628 | 970,394 | 711,765 | |||||||||||
| Total shareholders’ equity |
1,519,119 | 1,281,220 | 1,222,628 | 970,394 | 711,765 | |||||||||||
| Basic common shares outstanding |
70,399 | 60,084 | 59,828 | 52,311 | 44,438 | |||||||||||
| Diluted common shares outstanding |
70,399 | 60,424 | 60,404 | 52,990 | 45,001 | |||||||||||
| PER COMMON SHARE DATA |
||||||||||||||||
| Basic (loss) earnings |
$ | (2.36 | ) | $ | 0.82 | $ | 1.05 | $ | 1.61 | $ | 1.57 | |||||
| Diluted (loss) earnings |
(2.36 | ) | 0.82 | 1.04 | 1.59 | 1.55 | ||||||||||
| Book value |
15.70 | 21.36 | 20.67 | 19.91 | 16.57 | |||||||||||
| Tangible book value(2) |
8.33 | 8.76 | 7.92 | 8.21 | 7.40 | |||||||||||
| Cash dividends declared |
0.20 | 0.62 | 0.74 | 0.60 | 0.32 | |||||||||||
29
Table of Contents
| (dollars in thousands)
|
|||||||||||||||
| 2009 | 2008 | 2007 | 2006 | 2005 | |||||||||||
| PERFORMANCE RATIOS |
|||||||||||||||
| Return on average assets(3) |
-1.85% | 0.59% | 0.80% | 1.31% | 1.38% | ||||||||||
| Return on average common shareholders’ equity(4) |
-12.63% | 3.93% | 5.16% | 8.68% | 9.79% | ||||||||||
| Return on average tangible common shareholders’ equity(5) |
-26.91% | 9.99% | 13.05% | 20.79% | 22.88% | ||||||||||
| Efficiency ratio(6), (7) |
95.34% | 54.08% | 60.62% | 57.32% | 56.92% | ||||||||||
| Average common shareholders’ equity to average assets |
14.66% | 15.04% | 15.48% | 15.04% | 14.08% | ||||||||||
| Leverage ratio(8) |
12.79% | 12.38% | 9.24% | 10.28% | 10.09% | ||||||||||
| Net interest margin (fully tax equivalent)(9) |
4.09% | 4.07% | 4.24% | 4.74% | 4.84% | ||||||||||
| Non-interest revenue to total net revenue(10) |
18.65% | 26.95% | 18.48% | 16.96% | 18.57% | ||||||||||
| Dividend payout ratio(11) |
-8.47% | 75.61% | 70.48% | 37.27% | 20.38% | ||||||||||
| ASSET QUALITY |
|||||||||||||||
| Non-performing loans |
$ | 199,027 | $ | 133,366 | $ | 91,099 | $ | 9,058 | $ | 6,440 | |||||
| Non-performing assets |
223,593 | 161,264 | 98,042 | 9,058 | 7,563 | ||||||||||
| Allowance for loan and lease losses |
107,657 | 95,865 | 84,904 | 60,090 | 43,885 | ||||||||||
| Net charge-offs |
197,332 | 96,717 | 21,994 | 574 | 2,812 | ||||||||||
| Non-performing loans to total loans |
3.32% | 2.18% | 1.50% | 0.17% | 0.16% | ||||||||||
| Non-performing assets to total assets |
2.38% | 1.88% | 1.18% | 0.12% | 0.14% | ||||||||||
| Allowance for loan and lease losses to total loans and leases |
1.79% | 1.56% | 1.40% | 1.12% | 1.12% | ||||||||||
| Allowance for credit losses to total loans |
1.81% | 1.58% | 1.42% | 1.15% | 1.16% | ||||||||||
| Net charge-offs to average loans and leases |
3.23% | 1.58% | 0.38% | 0.01% | 0.08% | ||||||||||
| (1) | Excludes loans held for sale |
| (2) | Average common shareholders’ equity less average intangible assets divided by shares outstanding at the end of the year. |
| (3) | Net (loss) earnings available to common shareholders divided by average assets. |
| (4) | Net (loss) earnings available to common shareholders divided by average common shareholders’ equity. |
| (5) | Net (loss) earnings available to common shareholders divided by average common shareholders’ equity less average intangible assets. See Management’s Discussion and Analysis of Financial Condition and Results of Operations—“Results of Operations – Overview” for the reconciliation of non-GAAP financial measures, in Item 7 of this report. |
| (6) | Non-interest expense divided by the sum of net interest income (fully tax equivalent) and non-interest income. |
| (7) | The efficiency ratio calculation includes goodwill impairment charges of $112.0 million and $1.0 million in 2009 and 2008, respectively. Goodwill impairment losses are a non-cash expense that have no direct effect on the Company’s or the Bank’s liquidity or capital ratios. |
| (8) | Tier 1 capital divided by leverage assets. Leverage assets are defined as quarterly average total assets, net of goodwill, intangibles and certain other items as required by the Federal Reserve. |
| (9) | Net interest margin (fully tax equivalent) is calculated by dividing net interest income (fully tax equivalent) by average interest earnings assets. |
| (10) | Non-interest revenue divided by the sum of non-interest revenue and net interest income |
| (11) | Dividends declared per common share divided by basic earnings per common share. |
30
Table of Contents
Umpqua Holdings Corporation
ITEM 7. MANAGEMENT’S DISCUSSION AND ANALYSIS OF FINANCIAL CONDITION AND RESULTS OF OPERATIONS
FORWARD LOOKING STATEMENTS AND RISK FACTORS
See the discussion of forward-looking statements and risk factors in Part I Item 1 and Item 1A of this report.
EXECUTIVE OVERVIEW
Umpqua’s 2009 results reflect the continued effects of the U.S. recession, the housing market downturn and declining real estate values. The economic environment has adversely affected our residential development, commercial real estate, commercial construction and commercial loan portfolios, with the following results:
| • | Non-performing assets increased to $223.6 million, or 2.38% of total assets, as of December 31, 2009, compared to $161.3 million, or 1.88% of total assets as of December 31, 2008. Non-performing loans increased to $199.0 million, or 3.32% of total loans, as of December 31, 2009, compared to $133.4 million, or 2.18% of total loans as of December 31, 2008. Non-accrual loans have been written-down to their estimated net realizable values. |
| • | Net charge-offs were $197.3 million in 2009, or 3.23% of average loans and leases, as compared to net charge-offs of $96.7 million, or 1.58% of average loans and leases in 2008. The increase in and write-down of impaired loans in the current year has contributed to the increase in net charge-offs. |
| • | Downgrades within the loan portfolio and net charge-offs in 2009 contributed to a $209.1 million provision for loan and lease losses in 2009, as compared to $107.7 million in 2008. |
However, the past year was not without some significant accomplishments. During the year, we:
| • | Raised $258.7 million through a public offering by issuing 26,538,461 shares of common stock. After deducting underwriting discounts and commissions and offering expenses, net proceeds to the Company were $245.7 million. The proceeds from the offering qualify as Tier 1 capital and will be used for general corporate purposes, which include capital to support growth and acquisition opportunities and to position us for redemption of our Series A preferred stock issued to the U.S. Treasury under the TARP Capital Purchase Program. |
| • | Increased our total risk based capital ratio to 17.2% as of December 31, 2009, compared to 14.6% as of December 31, 2008, primarily due to the successful public stock offering completed in August 2009. |
| • | Mortgage banking revenue was $18.7 million in 2009, compared to $2.4 million in 2008. Closed mortgage volume increased 131% in the current year due to a significant increase in purchase and refinancing activity, resulting from historically low mortgage interest rates. Additionally, the prior period’s revenue includes a $2.4 million charge on an ineffective mortgage servicing right (“MSR”) hedge, which was suspended, due to widening spreads and price declines that were not offset by a corresponding gain in the related MSR asset. |
| • | Opened a new Commercial Banking Center in Lynnwood, Washington, and Community Banking stores in Portland, Oregon and Vancouver, Washington. |
| • | Opened our new International Banking Division in San Francisco, California to serve the financing needs of small and middle-market companies involved in international trade. |
| • | Entered into a purchase and assumption agreement with the FDIC on January 16, 2009, to assume at no premium the insured, non-brokered deposit balances, which totaled $183.9 million, and certain other assets, of the Bank of Clark County in Vancouver, Washington, adding two new stores in Vancouver, Washington. |
Also during the year:
| • | Net loss per diluted common share was $2.36 in 2009, as compared to net earnings of $0.82 per diluted common share earned in 2008. The decline in net earnings per diluted common share is principally attributed |
31
Table of Contents
| to a goodwill impairment charge, increased provision for loan and lease losses, losses incurred on other real estate owned, and interest reversals on loans. Operating loss per diluted common share, defined as earnings available to common shareholders before merger related expenses, net of tax, and goodwill impairment divided by the same diluted share total used in determining diluted earnings per common share, was $0.77 in 2009, as compared to operating income per diluted common share of $0.83 in 2008. Operating income per diluted common share is considered a “non-GAAP” financial measure. More information regarding this measurement and reconciliation to the comparable GAAP measurement is provided under the heading Results of Operations—Overview below. |
| • | Net interest margin, on a tax equivalent basis, increased to 4.09% in 2009 from 4.07% in 2008. The increase in net interest margin resulted from a decrease in the cost of interest bearing deposits, partially offset by reductions in earning asset yields due primarily to a lower prime rate during the current year as compared to the prior year. Excluding a $4.4 million reversal of interest income on loans in 2009, the tax equivalent net interest margin would have been 4.15%. |
| • | We recorded gains of $6.5 million in the income statement representing the change in fair value on our junior subordinated debentures measured at fair value in 2009, compared to gains of $38.9 million in 2008. The change in fair value recognized in the current period primarily resulted from the widening of credit risk adjusted rate spreads above the Company’s contractual spreads. |
| • | Net loss on investment securities of $1.7 million in 2009 includes other-than-temporary impairment (“OTTI”) charges of $10.6 million, which primarily relate to non-agency collateralized mortgage obligations. The impairment charge was offset by gains on the sale of securities of $8.9 million. |
| • | FDIC assessments increased to $15.8 million in 2009, as compared to $5.2 million 2008. The increase results from an industry-wide increase in assessment rates and a $4.0 million special assessment incurred in the second quarter of 2009 imposed by the FDIC in efforts to rebuild the Deposit Insurance Fund. |
| • | Gross loans and leases decreased to $6.0 billion as of December 31, 2009, a decrease of $132.1 million, or 2.2%, as compared to December 31, 2008. This decrease is principally attributable to charge-offs of $200.9 million and transfers to other real estate owned of $50.9 million, offset by net loan originations of $108.7 million during the year. |
| • | Total deposits were $7.4 billion as of December 31, 2009, an increase of $851.5 million, or 12.9%, as compared to December 31, 2008. Excluding the deposits acquired through the FDIC-assisted purchase and assumption of the Bank of Clark County, the organic deposit growth rate was 10.4% annualized. |
| • | Total consolidated assets were $9.4 billion as of December 31, 2009, compared to $8.6 billion as of December 31, 2008, representing an increase of $783.8 million or 9.1%. The growth in total assets is principally attributable to the increase in deposits and the proceeds received from the public offering of common stock in the third quarter of 2009. |
| • | Declared cash dividends of $0.05 per common share for each quarter in 2009. In determining the amount of dividends to be paid, we consider capital preservation, expected asset growth, projected earnings and our overall dividend pay-out ratio. |
SUMMARY OF CRITICAL ACCOUNTING POLICIES
The SEC defines “critical accounting policies” as those that require application of management’s most difficult, subjective or complex judgments, often as a result of the need to make estimates about the effect of matters that are inherently uncertain and may change in future periods. Our significant accounting policies are described in Note 1 in the Notes to Consolidated Financial Statements in Item 8 of this report. Not all of these critical accounting policies require management to make difficult, subjective or complex judgments or estimates. Management believes that the following policies would be considered critical under the SEC’s definition.
32
Table of Contents
Umpqua Holdings Corporation
Allowance for Loan and Lease Losses and Reserve for Unfunded Commitments
The Bank performs regular credit reviews of the loan and lease portfolio to determine the credit quality and adherence to underwriting standards. When loans and leases are originated, they are assigned a risk rating that is reassessed periodically during the term of the loan through the credit review process. The Company’s risk rating methodology assigns risk ratings ranging from 1 to 10, where a higher rating represents higher risk. The 10 risk rating categories are a primary factor in determining an appropriate amount for the allowance for loan and lease losses. The Bank has a management Allowance for Loan and Lease Losses (“ALLL”) Committee, which is responsible for, among other things, regularly reviewing the ALLL methodology, including loss factors, and ensuring that it is designed and applied in accordance with generally accepted accounting principles. The ALLL Committee reviews and approves loans and leases recommended for impaired status. The ALLL Committee also approves removing loans and leases from impaired status. The Bank’s Audit and Compliance Committee provides board oversight of the ALLL process and reviews and approves the ALLL methodology on a quarterly basis.
Each risk rating is assessed an inherent credit loss factor that determines the amount of the allowance for loan and lease losses provided for that group of loans and leases with similar risk rating. Credit loss factors may vary by region based on management’s belief that there may ultimately be different credit loss rates experienced in each region.
Regular credit reviews of the portfolio also identify loans that are considered potentially impaired. Potentially impaired loans are referred to the ALLL Committee which reviews and approves designated loans as impaired. A loan is considered impaired when based on current information and events, we determine that we will probably not be able to collect all amounts due according to the loan contract, including scheduled interest payments. When we identify a loan as impaired, we measure the impairment using discounted cash flows, except when the sole remaining source of the repayment for the loan is the liquidation of the collateral. In these cases, we use the current fair value of the collateral, less selling costs, instead of discounted cash flows. If we determine that the value of the impaired loan is less than the recorded investment in the loan, we either recognize an impairment reserve as a specific component to be provided for in the allowance for loan and lease losses or charge-off the impaired balance on collateral dependent loans if it is determined that such amount represents a confirmed loss. The combination of the risk rating-based allowance component and the impairment reserve allowance component lead to an allocated allowance for loan and lease losses.
The Bank may also maintain an unallocated allowance amount to provide for other credit losses inherent in a loan and lease portfolio that may not have been contemplated in the credit loss factors. This unallocated amount generally comprises less than 5% of the allowance, but may be maintained at higher levels during times of deteriorating economic conditions characterized by falling real estate values. The unallocated amount is reviewed periodically based on trends in credit losses, the results of credit reviews and overall economic trends. As of December 31, 2009, the unallocated allowance amount represented 9% of the allowance.
The reserve for unfunded commitments (“RUC”) is established to absorb inherent losses associated with our commitment to lend funds, such as with a letter or line of credit. The adequacy of the ALLL and RUC are monitored on a regular basis and are based on management’s evaluation of numerous factors. These factors include the quality of the current loan portfolio; the trend in the loan portfolio’s risk ratings; current economic conditions; loan concentrations; loan growth rates; past-due and non-performing trends; evaluation of specific loss estimates for all significant problem loans; historical charge-off and recovery experience; and other pertinent information.
Management believes that the ALLL was adequate as of December 31, 2009. There is, however, no assurance that future loan losses will not exceed the levels provided for in the ALLL and could possibly result in additional charges to the provision for loan and lease losses. In addition, bank regulatory authorities, as part of their periodic examination of the Bank, may require additional charges to the provision for loan and lease losses in future periods if warranted as a result of their review. Approximately 81% of our loan portfolio is secured by real estate, and a significant decline in real estate market values may require an increase in the allowance for loan and lease losses. The U.S. recession, the housing market downturn, and declining real estate values in our markets have negatively impacted aspects of our residential development, commercial real estate, commercial construction and commercial loan portfolios, and have led to an increase in non-performing loans and the
33
Table of Contents
allowance for loan and lease losses. A continued deterioration in our markets may adversely affect our loan portfolio and may lead to additional charges to the provision for loan and lease losses.
Mortgage Servicing Rights
In accordance with Financial Accounting Standards Board Accounting Standards Codification (“FASB ASC”) 860, Transfers and Servicing, the Company determines its classes of servicing assets based on the asset type being serviced along with the methods used to manage the risk inherent in the servicing assets, which includes the market inputs used to value the servicing assets. The Company elected to measure its residential mortgage servicing assets at fair value and to report changes in fair value through earnings. Fair value adjustments encompass market-driven valuation changes and the runoff in value that occurs from the passage of time, which are separately reported. Under the fair value method, the MSR is carried in the balance sheet at fair value and the changes in fair value are reported in earnings under the caption mortgage banking revenue in the period in which the change occurs.
Retained mortgage servicing rights are measured at fair value as of the date of sale. We use quoted market prices when available. Subsequent fair value measurements are determined using a discounted cash flow model. In order to determine the fair value of the MSR, the present value of expected future cash flows is estimated. Assumptions used include market discount rates, anticipated prepayment speeds, delinquency and foreclosure rates, and ancillary fee income. This model is periodically validated by an independent external model validation group. The model assumptions and the MSR fair value estimates are also compared to observable trades of similar portfolios as well as to MSR broker valuations and industry surveys, as available.
The expected life of the loan can vary from management’s estimates due to prepayments by borrowers, especially when rates fall. Prepayments in excess of management’s estimates would negatively impact the recorded value of the mortgage servicing rights. The value of the mortgage servicing rights is also dependent upon the discount rate used in the model, which we base on current market rates. Management reviews this rate on an ongoing basis based on current market rates. A significant increase in the discount rate would reduce the value of mortgage servicing rights. Additional information is included in Note 8 of the Notes to Consolidated Financial Statements.
Valuation of Goodwill and Intangible Assets
At December 31, 2009, we had $639.6 million in goodwill and other intangible assets as a result of business combinations. Goodwill and other intangible assets with indefinite lives are not amortized but instead are periodically tested for impairment. Management performs an impairment analysis for the intangible assets with indefinite lives on an annual basis as of December 31. Additionally, goodwill and other intangible assets with indefinite lives are evaluated on an interim basis when events or circumstance indicate impairment potentially exists. As a result of the year-end analysis in 2008, management determined that there was a $1.0 million impairment related to the Retail Brokerage reporting segment as of December 31, 2008, which resulted from the Company’s evaluation following the departure of certain Umpqua Investments financial advisors. The valuation of the impairment at the Retail Brokerage operating segment was determined using an income approach by discounting cash flows of forecasted earnings. The remaining balance of goodwill and other intangible assets relate to the Community Banking reporting segment. The Company performed a goodwill impairment analysis of the Community Banking reporting segment as of June 30, 2009, due to a further decline in the Company’s market capitalization below the book value of equity and continued weakness in the banking industry. The Company engaged an independent valuation consultant to assist us in determining whether our goodwill asset was impaired. The valuation of the reporting unit was determined using discounted cash flows of forecasted earnings, estimated sales price multiples based on recent observable market transactions and market capitalization based on current stock price. The results of the Company’s and valuation specialist’s step one test indicated that the reporting unit’s fair value was less than its carrying value, and therefore the Company performed a step two analysis. In the step two analysis, we calculated the fair value for the reporting unit’s assets and liabilities, as well as its unrecognized identifiable intangible assets, such as the core deposit intangible and trade name, in order to determine the implied fair value of goodwill. Fair value adjustments to items on the balance sheet primarily related to investment securities held to maturity, loans, other real estate owned, Visa Class B common stock, deferred taxes, deposits, term debt, and junior subordinated debentures. Based on the results of the step two analysis, the Company determined that the implied fair value of the goodwill was greater than its carrying amount on the Company’s balance sheet, and as a result, recognized a goodwill
34
Table of Contents
Umpqua Holdings Corporation
impairment loss of $112.0 million. This write-down of goodwill is a non-cash charge that does not affect the Company’s or the Bank’s liquidity or operations. In addition, because goodwill is excluded in the calculation of regulatory capital, the Company’s “well-capitalized” capital ratios were not affected by this charge. The Company evaluated the Community Banking reporting segment as of December 31, 2009. In the first step of the goodwill impairment test the Company determined that the fair value of the Community Banking reporting unit exceeded its carrying amount. This determination is consistent with the events occurring after the Company recognized the $112.0 million impairment of goodwill second quarter of 2009. First, the market capitalization and estimated fair value of the Company increased significantly subsequent to the recognition of the impairment charge as the fair value of the Company’s stock increased 73% from June 30, 2009 to December 31, 2009. Secondly, the Company’s successful public common stock offering in the third quarter of 2009 diluted the carrying value of the reporting unit’s book equity on a per share basis, based upon which the fair value of the reporting unit is measured. The impairment analysis requires management to make subjective judgments. Events and factors that may significantly affect the estimates include, among others, competitive forces, customer behaviors and attrition, changes in revenue growth trends, cost structures, technology, changes in discount rates and specific industry and market conditions. There can be no assurance that changes in circumstances, estimates or assumption will not result in additional impairment of all, or some portion of, goodwill. Additional information is included in Note 7 of the Notes to Consolidated Financial Statements.
Stock-based Compensation
Consistent with the provisions of FASB ASC 718, Stock Compensation, a revision to the previously issued guidance on accounting for stock options and other forms of equity-based compensation, we recognize expense for the grant-date fair value of stock options and other equity-based forms of compensation issued to employees over the employees’ requisite service period (generally the vesting period). The requisite service period may be subject to performance conditions. The fair value of each option grant is estimated as of the grant date using the Black-Scholes option-pricing model. Management assumptions utilized at the time of grant impact the fair value of the option calculated under the Black-Scholes methodology, and ultimately, the expense that will be recognized over the life of the option. Additional information is included in Note 1 of the Notes to Consolidated Financial Statements.
Fair Value
FASB ASC 820, Fair Value Measurements and Disclosures establishes a hierarchical disclosure framework associated with the level of pricing observability utilized in measuring financial instruments at fair value. The degree of judgment utilized in measuring the fair value of financial instruments generally correlates to the level of pricing observability. Financial instruments with readily available active quoted prices or for which fair value can be measured from actively quoted prices generally will have a higher degree of pricing observability and a lesser degree of judgment utilized in measuring fair value. Conversely, financial instruments rarely traded or not quoted will generally have little or no pricing observability and a higher degree of judgment utilized in measuring fair value. Pricing observability is impacted by a number of factors, including the type of financial instrument, whether the financial instrument is new to the market and not yet established and the characteristics specific to the transaction. See Note 22 of the Notes to Consolidated Financial Statements for additional information about the level of pricing transparency associated with financial instruments carried at fair value.
RECENT ACCOUNTING PRONOUNCEMENTS
In December 2007, FASB revised FASB ASC 805, Business Combinations. FASB ASC 805 establishes principles and requirements for how an acquirer recognizes and measures in its financial statements the identifiable assets acquired, the liabilities assumed, any noncontrolling interest in the acquired entity and the goodwill acquired. Furthermore, acquisition-related and other costs will now be expensed rather than treated as cost components of the acquisition. FASB ASC 805 also establishes disclosure requirements to enable the evaluation of the nature and financial effects of the business combination. The revision to this guidance applies prospectively to business combinations for which the acquisition date occurs on or after January 1, 2009. The adoption of these revisions will increase the costs charged to operations for acquisitions consummated on or after January 1, 2009.
35
Table of Contents
In December 2007, FASB amended FASB ASC 810, Consolidation. This amendment establishes accounting and reporting standards for the noncontrolling interest in a subsidiary and for the deconsolidation of a subsidiary. The standard also requires additional disclosures that clearly identify and distinguish between the interest of the parent’s owners and the interest of the noncontrolling owners of the subsidiary. This statement is effective on January 1, 2009 for the Company, to be applied prospectively. The impact of adoption did not have a material impact on the Company’s consolidated financial statements.
In June 2008, FASB amended FASB ASC 260, Earnings per Share. This amendment concluded that nonvested share-based payment awards that contain nonforfeitable rights to dividends or dividend equivalents are participating securities and shall be included in the computation of EPS pursuant to the two-class method. This amendment is effective for fiscal years beginning after December 15, 2008, to be applied retrospectively. Certain of the Company’s nonvested restricted stock awards qualify as participating securities as described under this amendment. The adoption of this provision reduced both basic and diluted earnings per common share by $0.01 for the year ended December 31, 2007.
In January 2009, FASB amended FASB ASC 325-40, Investments—Other. This amendment addressed certain practice issues related to the recognition of interest income and impairment on purchased beneficial interests and beneficial interests that continue to be held by a transferor in securitized financial assets, by making its other-than-temporary impairment (“OTTI”) assessment guidance consistent with FASB ASC 320, Investments—Debt and Equity Securities. The amendment removes the reference to the consideration of a market participant’s estimates of cash flows and instead requires an assessment of whether it is probable, based on current information and events, that the holder of the security will be unable to collect all amounts due according to the contractual terms. If it is probable that there has been an adverse change in estimated cash flows, an OTTI is deemed to exist, and a corresponding loss shall be recognized in earnings equal to the entire difference between the investment’s carrying value and its fair value at the balance sheet date of the reporting period for which the assessment is made. This amendment became effective for interim and annual reporting periods ending after December 15, 2008, and is applied prospectively. The impact of adoption did not have a material impact on the Company’s consolidated financial statements.
In April 2009, FASB amended FASB ASC 820, Fair Value Measurements and Disclosures, to address issues related to the determination of fair value when the volume and level of activity for an asset or liability has significantly decreased, and identifying transactions that are not orderly. The revisions affirm the objective that fair value is the price that would be received to sell an asset in an orderly transaction (that is not a forced liquidation or distressed sale) between market participants at the measurement date under current market conditions, even if the market is inactive. The amendment provides additional guidance for estimating fair value when the volume and level of activity for the asset or liability have decreased significantly. It also provides guidance on identifying circumstances that indicate a transaction is not orderly. If determined that a quoted price is distressed (not orderly), and thereby not representative of fair value, the entity may need to make adjustments to the quoted price or utilize an alternative valuation technique (e.g. income approach or multiple valuation techniques) to determine fair value. Additionally, an entity must incorporate appropriate risk premium adjustments, reflective of an orderly transaction under current market conditions, due to uncertainty in cash flows. The revised guidance requires disclosures in interim and annual periods regarding the inputs and valuation techniques used to measure fair value and a discussion of changes in valuation techniques and related inputs, if any, during the period. It also requires financial institutions to disclose the fair values of investment securities by major security type. The changes are effective for the interim reporting period ending after June 15, 2009, and are to be applied prospectively. The adoption of these amendments impacted the Company’s determination of fair value related to our junior subordinated debentures measured at fair value. As of March 31, 2009, prior to the adoption of these amendments, we discounted these liabilities by the current three month LIBOR plus a credit risk adjusted spread of 500 basis points. Due to the lack of observable, orderly transactions, of either new issuances or trades, we estimated that a market participant would utilize a credit risk adjusted spread of 500 basis points if an actual market transaction in an active market were to take place for an entity with comparable nonperformance risk. The amendments clarify that a fair value measurement shall assume a risk premium market participants would require at a measurement date under current market conditions, even if the market is inactive. With the assistance of a third-party pricing service, we determined that a credit risk adjusted spread of 675 basis points would be representative of the nonperformance risk premium a market participant would require under current market conditions as of June 30, 2009. In accordance with the guidance, this is accounted for as a change in accounting
36
Table of Contents
Umpqua Holdings Corporation
estimate. This increase in the credit risk adjusted spread is the primary factor resulting in the $8.6 million gain on junior subordinated debentures carried at fair value recognized in the second quarter of 2009. At December 31, 2009, we continue to estimate that the credit risk adjusted spread of 675 basis points is appropriate. The change in junior subordinated debentures carried at fair value in the third and fourth quarters of 2009 is attributable to changes in three month LIBOR and quarterly interest payments, and would have generally been recognized under both methodologies. The effect of these amendments did not have a significant impact on the fair value measurement of any other assets or liabilities.
In April 2009, FASB revised FASB ASC 320, Investments—Debt and Equity Securities, to change the OTTI model for debt securities. Previously, an entity was required to assess whether it has the intent and ability to hold a security to recovery in determining whether an impairment of that security is other-than-temporary. If the impairment was deemed other-than-temporarily impaired, the investment was written-down to fair value through earnings. Under the revised guidance, OTTI is triggered if an entity has the intent to sell the security, it is likely that it will be required to sell the security before recovery, or if the entity does not expect to recover the entire amortized cost basis of the security. If the entity intends to sell the security or it is likely it will be required to sell the security before recovering its cost basis, the entire impairment loss would be recognized in earnings as an OTTI. If the entity does not intend to sell the security and it is not likely that the entity will be required to sell the security but the entity does not expect to recover the entire amortized cost basis of the security, only the portion of the impairment loss representing credit losses would be recognized in earnings as an OTTI. The credit loss is measured as the difference between the amortized cost basis and the present value of the cash flows expected to be collected of a security. Projected cash flows are discounted by the original or current effective interest rate depending on the nature of the security being measured for potential OTTI. The remaining impairment loss related to all other factors, the difference between the present value of the cash flows expected to be collected and fair value, would be recognized as a charge to other comprehensive income (“OCI”). Impairment losses related to all other factors are to be presented as a separate category within OCI. For investment securities held to maturity, this amount is accreted over the remaining life of the debt security prospectively based on the amount and timing of future estimated cash flows. The accretion of the OTTI amount recorded in OCI will increase the carrying value of the investment, and would not affect earnings. If there is an indication of additional credit losses the security is re-evaluated accordingly based on the procedures described above. Upon adoption of the revised guidance, the noncredit portion of previously recognized OTTI shall be reclassified to accumulated OCI by a cumulative-effect adjustment to the opening balance of retained earnings. These revisions became effective in the interim reporting period ending after June 15, 2009. Upon adoption of this guidance the Company analyzed the securities for which OTTI had been previously recognized and determined that as of the adoption date such losses were credit related. As such, there was no cumulative effect adjustment to the opening balance of retained earnings or a corresponding adjustment to accumulated OCI.
In April 2009, FASB revised FASB ASC 825, Financial Instruments, to require fair value disclosures in the notes of an entity’s interim financial statements for all financial instruments, whether or not recognized in the statement of financial position. This revision became effective for the interim reporting period ending after June 15, 2009. The adoption of the revised increased interim financial statement disclosures and did not impact on the Company’s consolidated financial statements.
In May 2009, FASB amended FASB ASC 855, Subsequent Events. The updated guidance established general standards of accounting for and disclosure of events that occur after the balance sheet date but before financial statements are issued or are available to be issued. The revisions should not result in significant changes in the subsequent events that an entity reports, either through recognition or disclosure in its financial statements. It does require disclosure of the date through which an entity has evaluated subsequent events and the basis for that date, that is, whether that date represents the date the financial statements were issued or were available to be issued. This disclosure should alert all users of financial statements that an entity has not evaluated subsequent events after that date in the set of financial statements being presented. We adopted the provisions of this guidance for the interim period ended June 30, 2009, and the impact of adoption did not have a material impact on the Company’s consolidated financial statements.
In December 2009, FASB issued ASU No. 2009-17, Transfers and Servicing (Topic 860)—Accounting for Transfers of Financial Assets. This update codifies SFAS No. 166, Accounting for Transfers of Financial Assets—an Amendment of FASB Statement No. 140, which was previously issued by FASB in June 2009 but was not included in the original codification. ASU 2009-17 eliminates the concept of a qualifying special-purpose entity, creates more stringent conditions for reporting a transfer of a
37
Table of Contents
portion of a financial asset as a sale, clarifies other sale-accounting criteria, and changes the initial measurement of a transferor’s interest in transferred financial assets. This statement is effective for annual reporting periods beginning after November 15, 2009, and for interim periods therein. This standard will primarily impact the Company’s accounting and reporting of transfers representing a portion of a financial asset for which the Company has a continuing involvement, generally known as loan participations. In order to recognize the transfer of a portion of a financial asset as a sale, the transferred portion and any portion that continues to be held by the transferor must represent a participating interest, and the transfer of the participating interest must meet the conditions for surrender of control. To qualify as a participating interest (i) the portions of a financial asset must represent a proportionate ownership interest in an entire financial asset, (ii) from the date of transfer, all cash flows received from the entire financial asset must be divided proportionately among the participating interest holders in an amount equal to their share of ownership, (iii) involve no recourse (other than standard representation and warranties) to, or subordination by, any participating interest holder, and (iv) no party has the right to pledge or exchange the entire financial asset. If the participating interest or surrender of control criteria are not met the transfer is not accounted for as a sale and derecognition of the asset is not appropriate. Rather the transaction is accounted for as a secured borrowing arrangement. The impact of certain participations being reported as secured borrowings rather than derecognizing a portion of a financial asset would increase total assets (loans), liabilities (term debt) and their respective interest income and expense. An increase in total assets also increases regulatory risk-weighted assets and could negatively impact our capital ratios. The Company is reviewing our participation agreements to ensure new originations meet the criteria to allow for sale accounting in order to limit the impact upon our financial statements. The terms contained in certain participation and loan sale agreements, however, are outside the control of the Company. These arrangements largely relate to Small Business Administration (“SBA”) loan sales. These sales agreements contain recourse provisions (generally 90 days) that will initially preclude sale accounting. However, once the recourse provision expires, transfers of portions of financial assets may be reevaluated to determine if they meet the participating interest definition. As a result, we expect to report SBA and potentially certain other transfers of financial assets as secured borrowings which will defer the gain of sale on these transactions, at least until the recourse provision expires, assuming all other sales criteria for each transaction are met. The Company does not believe it has or will have a significant amount of participations subject to recourse provisions or other features that would preclude derecognition of the assets transferred. The Company does not believe the impact of adoption will have a material impact on the Company’s consolidated financial statements.
In December 2009, FASB issued ASU No. 2009-18, Consolidations (Topic 810)—Improvements to Financial Reporting by Enterprises Involved with Variable Interest Entities. This update codifies SFAS No. 167, Amendments to FASB Interpretation No. 46(R), which was previously issued by FASB in June 2009 but was not included in the original codification. ASU 2009-18 eliminates FASB Interpretations 46(R) (“FIN 46(R)”) exceptions to consolidating qualifying special-purpose entities, contains new criteria for determining the primary beneficiary, and increases the frequency of required reassessments to determine whether a company is the primary beneficiary of a variable interest entity (“VIE”). Under the revised guidance, the primary beneficiary of a VIE (party who must consolidate the VIE) is the enterprise that has (i) the power to direct the activities of the VIE that most significantly impact the VIE’s economic performance, and (ii) the obligation to absorb losses of the VIE that could potentially be significant to the VIE, or the right to receive benefits of the VIE that could potentially be significant to the VIE. ASU 2009-18 also contains a new requirement that any term, transaction, or arrangement that does not have a substantive effect on an entity’s status as a variable interest entity, a company’s power over a variable interest entity, or a company’s obligation to absorb losses or its right to receive benefits of an entity must be disregarded in applying FIN 46(R) provisions. The elimination of the qualifying special-purpose entity concept and its consolidation exceptions means more entities will be subject to consolidation assessments and reassessments. This statement requires additional disclosures regarding an entity’s involvement in a variable interest entity. This statement is effective for annual reporting periods beginning after November 15, 2009, and for interim periods therein. The Company has evaluated the impact of this guidance in regards to our involvement with variable interest entities. This guidance potentially impacts the accounting for our limited partnership equity investments in affordable housing development funds and real estate investment funds. In regards to affordable housing investments, the primary activities that most significantly impacts the VIE’s economic performance include leasing rental units at appropriate rent rates in compliance with low income housing restrictions and requirements, operating the rental property thereby generating income/loss from the partnership operations, and protecting the low income housing tax credits from recapture. As a limited partner, the Company
38
Table of Contents
Umpqua Holdings Corporation
generally does not participate in the control of the partnerships’ business, our involvement is limited to providing a stated amount of financial support (commitment or subscription) as stated within contractual agreements, and the primary purpose of the investment is to receive the tax attributes (tax credits) of the partnership. The general partner, which generally are a developer or non-profit organization, exercise the day-to-day control and management of the partnerships that most significantly impacts the VIE’s economic performance. In regards to the real estate investment funds, the primary activities that most significantly impacts the VIE’s economic performance include the development, financing, and leasing of real estate related properties, and ultimately finding a profitable exit from such investments. The Company’s involvement in these funds are limited minority interest partners. According to the terms of the partnerships, the general partners have exclusive control to manage the enterprise and power to direct activities that impact the VIE’s economic performance. The impact of adoption did not result in the Company consolidating or deconsolidating any variable interest entities as accounted for under previous guidance and, therefore, did not have a material impact on the Company’s consolidated financial statements.
In June 2009, FASB codified FASB ASC 105, Generally Accepted Accounting Principles, to establish the FASB ASC (the “Codification”). The Codification is not expected to change U.S. GAAP, but combines all authoritative standards into a comprehensive, topically organized online database. Following this guidance, the Financial Accounting Standards Board will not issue new standards in the form of Statements, FASB Staff Positions, or Emerging Issues Task Force Abstracts. Instead, it will issue Accounting Standards Updates (“ASU”) to update the Codification. After the launch of the Codification on July 1, 2009 only one level of authoritative U.S. GAAP for non governmental entities will exist, other than guidance issued by the Securities and Exchange Commission. This statement is effective for interim and annual reporting periods ending after September 15, 2009. The adoption of the FASB ASC 105 did not have any impact on the Company’s consolidated financial statements, and only affects how the Company’s references authoritative accounting guidance going forward.
In August 2009, the FASB issued ASU No. 2009-05, Measuring Liabilities at Fair Value. This update amends FASB ASC 820, Fair Value Measurements and Disclosure, in regards to the fair value measurement of liabilities. FASB ASC 820 clarifies that in circumstances in which a quoted price for a identical liability in an active market in not available, a reporting entity shall utilize one or more of the following techniques: i) the quoted price of the identical liability when traded as an asset, ii) the quoted price for a similar liability or a similar liability when traded as an asset, or iii) another valuation technique that is consistent with the principles of FASB ASC 820. In all instances a reporting entity shall utilize the approach that maximizes the use of relevant observable inputs and minimizes the use of unobservable inputs. Also, when measuring the fair value of a liability a reporting entity shall not include a separate input or adjustment to other inputs relating to the existence of a restriction that prevents the transfer of the liability. This update is effective for the Company in the fourth quarter of 2009. This update primarily affects our considerations related to our measurement of junior subordinated debentures carried at fair value. The adoption of FASB ASU 2009-05 did not have a material impact on the Company’s consolidated financial statements.
In January 2010, the FASB issued ASU No. 2010-06, Fair Value Measurements and Disclosures (Topic 820) – Improving Disclosures about Fair Value Measurements. FASB ASU No. 2009-06 requires (i) fair value disclosures by each class of assets and liabilities (generally a subset within a line item as presented in the statement of financial position) rather than major category, (ii) for items measured at fair value on a recurring basis, the amounts of significant transfers between Levels 1 and 2, and transfers into and out of Level 3, and the reasons for those transfers, including separate discussion related to the transfers into each level apart from transfers out of each level, and (iii) gross presentation of the amounts of purchases, sales, issuances, and settlements in the Level 3 recurring measurement reconciliation. Additionally, the ASU clarifies that a description of the valuation techniques(s) and inputs used to measure fair values is required for both recurring and nonrecurring fair value measurements. Also, if a valuation technique has changed, entities should disclose that change and the reason for the change. Disclosures other than the gross presentation changes in the Level 3 reconciliation are effective for the first reporting period beginning after December 15, 2009. The requirement to present the Level 3 activity of purchases, sales, issuances, and settlements on a gross basis will be effective for fiscal years beginning after December 15, 2010. The Company is currently evaluating the impact of adoption of FASB ASU No. 2010-06. We do not expect the adoption of this ASU will have a material impact on the Company’s consolidated financial statements.
39
Table of Contents
RESULTS OF OPERATIONS—OVERVIEW
For the year ended December 31, 2009, net loss available to common shareholders was $166.3 million, or $2.36 per diluted common share, as compared to net earnings available to common shareholders of $49.3 million, or $0.82 per diluted common share for the year ended December 31, 2008. The decrease in net earnings available to common shareholders in 2009 is principally attributable to increased provision for loan and lease losses, decreased non-interest income, increased non-interest expense and increased preferred stock dividends, partially offset by increased net interest income. Non-interest expense in the year ended December 31, 2009 includes a goodwill impairment charge recognized in the second quarter of $112.0 million related to the Community Banking operating segment. We assumed the insured non-brokered deposit balances and certain other assets of the Bank of Clark County on January 16, 2009 and the results of the acquired operations are included in our financial results starting on January 17, 2009.
For the year ended December 31, 2008, net earnings available to common shareholders was $49.3 million, or $0.82 per diluted common share, a decrease of 22% on a per diluted common share basis compared to 2007. The decrease in net earnings available to common shareholders in 2008 is principally attributable to increased provision for loan and lease losses and non-interest expense, partially offset by increased net interest and non-interest income. We completed the acquisition of North Bay Bancorp on April 26, 2007, and the results of the acquired operations are included in our financial results starting on April 27, 2007.
We incur significant expenses related to the completion and integration of mergers. Additionally, we may recognize goodwill impairment losses that have no effect on the Company’s or the Bank’s cash balances, liquidity, or regulatory capital ratios. Accordingly, we believe that our operating results are best measured on a comparative basis excluding the impact of merger-related expenses, net of tax, and other charges related to business combinations such as goodwill impairment charges. We define operating income as earnings available to common shareholders before merger related expenses, net of tax, and goodwill impairment, and we calculate operating income per diluted share by dividing operating income by the same diluted share total used in determining diluted earnings per common share (see Note 23 of the Notes to Consolidated Financial Statements in Item 8 below). Operating income and operating income per diluted share are considered “non-GAAP” financial measures. Although we believe the presentation of non-GAAP financial measures provides a better indication of our operating performance, readers of this report are urged to review the GAAP results as presented in the Financial Statements and Supplementary Data in Item 8 below.
The following table presents a reconciliation of operating (loss) income and operating (loss) income per diluted share to net (loss) earnings and net (loss) earnings per diluted common share for years ended December 31, 2009, 2008 and 2007:
Reconciliation of Operating (Loss) Income to Net (Loss) Earnings Available to Common Shareholders
Years Ended December 31,
(in thousands, except per share data)
| 2009 | 2008 | 2007 | ||||||||
| Net (loss) earnings available to common shareholders |
$ | (166,262 | ) | $ | 49,270 | $ | 63,081 | |||
| Merger-related expenses, net of tax |
164 | — | 1,991 | |||||||
| Goodwill impairment |
111,952 | 982 | — | |||||||
| Operating (loss) income |
$ | (54,146 | ) | $ | 50,252 | $ | 65,072 | |||
| Per diluted common share: |
||||||||||
| Net (loss) earnings available to common shareholders |
$ | (2.36 | ) | $ | 0.82 | $ | 1.04 | |||
| Merger-related expenses, net of tax |
— | — | 0.04 | |||||||
| Goodwill impairment |
1.59 | 0.01 | — | |||||||
| Operating (loss) income |
$ | (0.77 | ) | $ | 0.83 | $ | 1.08 | |||
40
Table of Contents
Umpqua Holdings Corporation
The following table presents the returns on average assets, average common shareholders’ equity and average tangible common shareholders’ equity for the years ended December 31, 2009, 2008 and 2007. For each of the years presented, the table includes the calculated ratios based on reported net (loss) earnings available to common shareholders and operating (loss) income as shown in the table above. Our return on average common shareholders’ equity is negatively impacted as a result of capital required to support goodwill. To the extent this performance metric is used to compare our performance with other financial institutions that do not have merger-related intangible assets, we believe it beneficial to also consider the return on average common tangible shareholders’ equity. The return on average common tangible shareholders’ equity is calculated by dividing net (loss) earnings available to common shareholders by average common shareholders’ common equity less average goodwill and intangible assets, net (excluding MSRs). The return on average tangible common shareholders’ equity is considered a non-GAAP financial measure and should be viewed in conjunction with the return on average common shareholders’ equity.
Returns on Average Assets, Common Shareholders’ Equity and Tangible Common Shareholders’ Equity
For the Years Ended December 31,
(dollars in thousands)
| 2009 | 2008 | 2007 | ||||||||||
| RETURNS ON AVERAGE ASSETS: |
||||||||||||
| Net (loss) earnings available to common shareholders |
-1.85% | 0.59% | 0.80% | |||||||||
| Operating (loss) income |
-0.60% | 0.60% | 0.82% | |||||||||
| RETURNS ON AVERAGE COMMON SHAREHOLDERS’ EQUITY: |
||||||||||||
| Net (loss) earnings available to common shareholders |
-12.63% | 3.93% | 5.16% | |||||||||
| Operating (loss) income |
-4.11% | 4.01% | 5.32% | |||||||||
| RETURNS ON AVERAGE TANGIBLE COMMON SHAREHOLDERS’ EQUITY: |
||||||||||||
| Net (loss) earnings available to common shareholders |
-26.91% | 9.99% | 13.05% | |||||||||
| Operating (loss) income |
-8.77% | 10.19% | 13.46% | |||||||||
| CALCULATION OF AVERAGE TANGIBLE COMMON SHAREHOLDERS’ EQUITY: |
||||||||||||
| Average common shareholders’ equity |
$ | 1,315,953 | $ | 1,254,730 | $ | 1,222,628 | ||||||
| Less: average goodwill and other intangible assets, net |
(698,223 | ) | (761,672 | ) | (739,086 | ) | ||||||
| Average tangible common shareholders’ equity |
$ | 617,730 | $ | 493,058 | $ | 483,542 | ||||||
Additionally, management believes tangible common equity and the tangible common equity ratio are meaningful measures of capital adequacy. Umpqua believes the exclusion of certain intangible assets in the computation of tangible common equity and tangible common equity ratio provides a meaningful base for period-to-period and company-to-company comparisons, which management believes will assist investors in analyzing the operating results and capital of the Company. Tangible common equity is calculated as total shareholders’ equity less preferred stock and less goodwill and other intangible assets, net (excluding MSRs). In addition, tangible assets are total assets less goodwill and other intangible assets, net (excluding MSRs). The tangible common equity ratio is calculated as tangible common shareholders’ equity divided by tangible assets. The tangible common equity and tangible common equity ratio is considered a non-GAAP financial measure and should be viewed in conjunction with the total shareholders’ equity and the total shareholders’ equity ratio.
41
Table of Contents
The following table provides a reconciliation of ending shareholders’ equity (GAAP) to ending tangible common equity (non-GAAP), and ending assets (GAAP) to ending tangible assets (non-GAAP) as of December 31, 2009 and December 31, 2008:
Reconciliations of Total Shareholders’ Equity to Tangible Common Shareholders’ Equity and Total Assets to Tangible Assets
(dollars in thousands)
| 2009 | 2008 | |||||
| Total shareholders’ equity |
$ | 1,566,517 | $ | 1,487,008 | ||
| Subtract: |
||||||
| Preferred Stock |
204,335 | 202,178 | ||||
| Goodwill and other intangible assets, net |
639,634 | 757,833 | ||||
| Tangible common shareholders’ equity |
$ | 722,548 | $ | 526,997 | ||
| Total assets |
$ | 9,381,372 | $ | 8,597,550 | ||
| Subtract: |
||||||
| Goodwill and other intangible assets, net |
639,634 | 757,833 | ||||
| Tangible assets |
$ | 8,741,738 | $ | 7,839,717 | ||
| Tangible common equity ratio |
8.27% | 6.72% | ||||
Non-GAAP financial measures have inherent limitations, are not required to be uniformly applied, and are not audited. Although we believe these non-GAAP financial measure are frequently used by stakeholders in the evaluation of a company, they have limitations as analytical tools, and should not be considered in isolation or as a substitute for analyses of results as reported under GAAP.
NET INTEREST INCOME
Net interest income is the largest source of our operating income. Net interest income for 2009 was $320.7 million, an increase of $30.4 million, or 10% over 2008. Net interest income for 2008 was $290.3 million, an increase of $4.4 million, or 2% over 2007. The negative impact to net interest income of the reversal of interest income on loans during the year was $4.4 million in both 2009 and 2008, and $5.0 million in 2007. The increase in net interest income in 2009 as compared to 2008 is attributable to growth in outstanding average interest earnings assets, primarily investment securities, and a modest increase in net interest margin, partially offset by growth in interest bearing liabilities, primarily time deposits. The increase in net interest income in 2008 as compared to 2007 is attributable to growth in outstanding average interest earnings assets, primarily loans and leases and investment securities, partially offset by both growth in interest bearing liabilities, primarily money-market, time deposits and term debt, and a decrease in net interest margin. In addition to organic growth, the FDIC-assisted purchase and assumption of certain assets and liabilities of the Bank of Clark County, which was completed on January 16, 2009, partially contributed to the increase in interest earning assets and interest bearing liabilities in 2009 over 2008. The deposit liabilities assumed from the Bank of Clark County purchase and assumption transaction totaled $183.9 million as of the assumption date. The North Bay merger, which was completed on April 26, 2007, contributed to the increase in interest earnings assets and interest bearing liabilities during 2007. The fair value of interest earnings assets acquired as a result of the North Bay merger totaled $523.5 million, and interest bearing liabilities totaled $572.2 million.
The net interest margin (net interest income as a percentage of average interest earnings assets) on a fully tax-equivalent basis was 4.09% for 2009, an increase of 2 basis points as compared to the same period in 2008. The increase in net interest margin primarily resulted from the decrease in our interest expense to earning assets of 81 basis points in 2009 resulting from the lower costs of interest bearing deposits, and junior subordinated debentures that are indexed to the three month LIBOR. This was partially offset by the decreased yield on interest-earning assets of 79 basis points primarily resulting from reductions in the prime rate, holding higher interest bearing cash balances with the Federal Reserve Bank (at 25 basis points), and interest reversals on loans. The increased interest bearing cash balances result from the historically low yields available in the bond
42
Table of Contents
Umpqua Holdings Corporation
markets that do not present an attractive long-term investment alternative. The $4.4 million reversal of interest income on loans in 2009 contributed to a 6 basis point decline in the tax equivalent net interest margin for the year.
The net interest margin on a fully tax-equivalent basis was 4.07% for 2008, a decrease of 17 basis points as compared to the same period in 2007. The decrease in net interest margin in 2008 resulted from decreases in market index rates, such as prime and the fed funds rates, and interest reversals on loans. The decreased yield on interest earnings assets of 104 basis points in 2008 primarily resulted from reductions in the prime rate. This decline in net interest margin was partially offset by the decrease in our interest expense to earning assets of 87 basis points from the lower costs of interest bearing deposits. The $4.4 million reversal of interest income on loans in 2008 contributed to a 6 basis point decline in the tax equivalent net interest margin for the year.
Our net interest income is affected by changes in the amount and mix of interest earnings assets and interest bearing liabilities, as well as changes in the yields earned on interest earnings assets and rates paid on deposits and borrowed funds. The following table presents condensed average balance sheet information, together with interest income and yields on average interest earnings assets, and interest expense and rates paid on average interest bearing liabilities for the years ended December 31, 2009, 2008 and 2007:
43
Table of Contents
Average Rates and Balances
(dollars in thousands)
| 2009 | 2008 | 2007 | ||||||||||||||||||||||||||||
| Average Balance |
Interest Income or Expense |
Average Yields or Rates |
Average Balance |
Interest Income or Expense |
Average Yields or Rates |
Average Balance |
Interest Income or Expense |
Average Yields or Rates |
||||||||||||||||||||||
| INTEREST EARNING ASSETS: |
||||||||||||||||||||||||||||||
| Loans and leases(1) |
$ | 6,145,927 | $ | 355,195 | 5.78 | % | $ | 6,136,380 | $ | 393,927 | 6.42 | % | $ | 5,836,980 | $ | 443,939 | 7.61 | % | ||||||||||||
| Taxable securities |
1,386,960 | 60,217 | 4.34 | % | 883,987 | 41,523 | 4.70 | % | 743,266 | 35,216 | 4.74 | % | ||||||||||||||||||
| Non-taxable securities(2) |
198,641 | 11,522 | 5.80 | % | 170,277 | 9,667 | 5.68 | % | 149,291 | 8,234 | 5.52 | % | ||||||||||||||||||
| Temporary investments and interest bearing deposits |
193,486 | 526 | 0.27 | % | 24,357 | 443 | 1.82 | % | 68,297 | 3,415 | 5.00 | % | ||||||||||||||||||
| Total interest earning assets |
7,925,014 | 427,460 | 5.39 | % | 7,215,001 | 445,560 | 6.18 | % | 6,797,834 | 490,804 | 7.22 | % | ||||||||||||||||||
| Allowance for loan and lease losses |
(96,916 | ) | (84,649 | ) | (70,177 | ) | ||||||||||||||||||||||||
| Other assets |
1,147,080 | 1,211,653 | 1,169,911 | |||||||||||||||||||||||||||
| Total assets |
$ | 8,975,178 | $ | 8,342,005 | $ | 7,897,568 | ||||||||||||||||||||||||
| INTEREST BEARING LIABILITIES: |
||||||||||||||||||||||||||||||
| Interest bearing checking and savings accounts |
$ | 3,333,088 | $ | 32,341 | 0.97 | % | $ | 3,196,763 | $ | 55,739 | 1.74 | % | $ | 3,136,738 | $ | 93,070 | 2.97 | % | ||||||||||||
| Time deposits |
2,358,697 | 56,401 | 2.39 | % | 2,007,550 | 73,631 | 3.67 | % | 1,849,910 | 87,770 | 4.74 | % | ||||||||||||||||||
| Securities sold under agreements to repurchase and federal funds purchased |
60,722 | 680 | 1.12 | % | 99,366 | 2,220 | 2.23 | % | 65,660 | 2,135 | 3.25 | % | ||||||||||||||||||
| Term debt |
129,814 | 4,576 | 3.53 | % | 194,312 | 6,994 | 3.60 | % | 57,479 | 2,642 | 4.60 | % | ||||||||||||||||||
| Junior subordinated debentures |
190,491 | 9,026 | 4.74 | % | 226,349 | 13,655 | 6.03 | % | 221,833 | 16,821 | 7.58 | % | ||||||||||||||||||
| Total interest bearing liabilities |
6,072,812 | 103,024 | 1.70 | % | 5,724,340 | 152,239 | 2.66 | % | 5,331,620 | 202,438 | 3.80 | % | ||||||||||||||||||
| Noninterest bearing deposits |
1,318,954 | 1,255,263 | 1,263,873 | |||||||||||||||||||||||||||
| Other liabilities |
64,293 | 81,182 | 79,447 | |||||||||||||||||||||||||||
| Total liabilities |
7,456,059 | 7,060,785 | 6,674,940 | |||||||||||||||||||||||||||
| Preferred equity |
203,166 | 26,490 | — | |||||||||||||||||||||||||||
| Common equity |
1,315,953 | 1,254,730 | 1,222,628 | |||||||||||||||||||||||||||
| Total shareholders’ equity |
1,519,119 | 1,281,220 | 1,222,628 | |||||||||||||||||||||||||||
| Total liabilities and shareholders’ equity |
$ | 8,975,178 | $ | 8,342,005 | $ | 7,897,568 | ||||||||||||||||||||||||
| NET INTEREST INCOME(2) |
$ | 324,436 | $ | 293,321 | $ | 288,366 | ||||||||||||||||||||||||
| NET INTEREST SPREAD |
3.69 | % | 3.52 | % | 3.42 | % | ||||||||||||||||||||||||
| AVERAGE YIELD ON EARNING ASSETS(1),(2) |
5.39 | % | 6.18 | % | 7.22 | % | ||||||||||||||||||||||||
| INTEREST EXPENSE TO EARNING ASSETS |
1.30 | % | 2.11 | % | 2.98 | % | ||||||||||||||||||||||||
| NET INTEREST INCOME TO EARNING ASSETS OR NET INTEREST MARGIN(1),(2) |
4.09 | % | 4.07 | % | 4.24 | % | ||||||||||||||||||||||||
| (1) | Non-accrual loans and mortgage loans held for sale are included in average balances. |
| (2) | Tax-exempt income has been adjusted to a tax equivalent basis at a 35% tax rate. The amount of such adjustment was an addition to recorded income of approximately $3.7 million, $3.0 million and $2.4 million in the years ended December 31, 2009, 2008 and 2007, respectively. |
44
Table of Contents
Umpqua Holdings Corporation
The following table sets forth a summary of the changes in tax equivalent net interest income due to changes in average asset and liability balances (volume) and changes in average rates (rate) for 2009 compared to 2008 and 2008 compared to 2007. Changes in tax equivalent interest income and expense, which are not attributable specifically to either volume or rate, are allocated proportionately between both variances.
Rate/Volume Analysis
(in thousands)
| 2009 COMPARED TO 2008 | 2008 COMPARED TO 2007 | |||||||||||||||||||||||
| INCREASE (DECREASE) IN INTEREST INCOME AND EXPENSE DUE TO CHANGES IN |
INCREASE (DECREASE) IN INTEREST INCOME AND EXPENSE DUE TO CHANGES IN |
|||||||||||||||||||||||
| VOLUME | RATE | TOTAL | VOLUME | RATE | TOTAL | |||||||||||||||||||
| INTEREST EARNING ASSETS: |
||||||||||||||||||||||||
| Loans and leases |
$ | 612 | $ | (39,344 | ) | $ | (38,732 | ) | $ | 21,892 | $ | (71,904 | ) | $ | (50,012 | ) | ||||||||
| Taxable securities |
22,047 | (3,353 | ) | 18,694 | 6,612 | (305 | ) | 6,307 | ||||||||||||||||
| Non-taxable securities(1) |
1,641 | 214 | 1,855 | 1,185 | 248 | 1,433 | ||||||||||||||||||
| Temporary investments and interest bearing deposits |
746 | (663 | ) | 83 | (1,494 | ) | (1,478 | ) | (2,972 | ) | ||||||||||||||
| Total(1) |
25,046 | (43,146 | ) | (18,100 | ) | 28,195 | (73,439 | ) | (45,244 | ) | ||||||||||||||
| INTEREST BEARING LIABILITIES: |
||||||||||||||||||||||||
| Interest bearing checking and savings accounts |
2,285 | (25,683 | ) | (23,398 | ) | 1,748 | (39,079 | ) | (37,331 | ) | ||||||||||||||
| Time deposits |
11,380 | (28,610 | ) | (17,230 | ) | 7,017 | (21,156 | ) | (14,139 | ) | ||||||||||||||
| Securities sold under agreements to repurchase and federal funds purchased |
(675 | ) | (865 | ) | (1,540 | ) | 883 | (798 | ) | 85 | ||||||||||||||
| Term debt |
(2,277 | ) | (141 | ) | (2,418 | ) | 5,039 | (687 | ) | 4,352 | ||||||||||||||
| Junior subordinated debentures |
(1,966 | ) | (2,663 | ) | (4,629 | ) | 336 | (3,502 | ) | (3,166 | ) | |||||||||||||
| Total |
8,747 | (57,962 | ) | (49,215 | ) | 15,023 | (65,222 | ) | (50,199 | ) | ||||||||||||||
| Net increase in net interest income(1) |
$ | 16,299 | $ | 14,816 | $ | 31,115 | $ | 13,172 | $ | (8,217 | ) | $ | 4,955 | |||||||||||
| (1) | Tax exempt income has been adjusted to a tax equivalent basis at a 35% tax rate. |
PROVISION FOR LOAN AND LEASE LOSSES
The provision for loan and lease losses was $209.1 million for 2009, compared to $107.7 million for 2008 and $41.7 million for 2007. As a percentage of average outstanding loans, the provision for loan losses recorded for 2009 was 3.43%, an increase of 167 basis points and 271 basis points from 2008 and 2007, respectively.
The increase in the provision for loan and lease losses in 2009 as compared to 2008 and 2007 is principally attributable to downgrades within the portfolio related primarily to the housing market downturn and its impact on our residential development and other segments of our portfolio, the U.S. recession and declining real estate values in our markets and the resulting impact on our commercial real estate and commercial construction portfolio, and the increase in loans charged-off.
Prior to the second quarter of 2008, the Company established specific reserves within the allowance for loan and leases losses for loan impairments and recognized the charge-off of the impairment reserve when the loan was resolved, sold, or foreclosed and transferred to other real estate owned. Due to declining real estate values in our markets and the deterioration of the U.S. economy in general, it is increasingly likely that impairment reserves on collateral dependent loans, particularly those relating to real estate, will not be recoverable and represent a confirmed loss. As a result, beginning in the second quarter of 2008, the
45
Table of Contents
Company began recognizing the charge-off of impairment reserves on impaired loans in the period they arise for collateral dependent loans. This process has effectively accelerated the recognition of charge-offs recognized since the second quarter of 2008. The change in our assessment of the possible recoverability of our collateral dependent impaired loans’ carrying values has ultimately had no impact on our impairment valuation procedures or the amount of provision for loan and leases losses included within the Consolidated Statements of Operations. Therefore, the non-accrual loans of $193.1 million as of December 31, 2009 have already been written-down to their estimated fair value, less estimated costs to sell, and are expected to be resolved with no additional material loss, absent further decline in market prices. Depending on the characteristics of a loan, the fair value of collateral is estimated by obtaining external appraisals.
The provision for loan and lease losses is based on management’s evaluation of inherent risks in the loan portfolio and a corresponding analysis of the allowance for loan and lease losses. Additional discussion on loan quality and the allowance for loan and lease losses is provided under the heading Asset Quality and Non-Performing Assets below.
NON-INTEREST INCOME
Non-interest income in 2009 was $73.5 million, a decrease of $33.6 million, or 31%, compared to 2008. Non-interest income in 2008 was $107.1 million, an increase of $42.3 million, or 65%, over 2007. The following table presents the key components of non-interest income for years ended December 31, 2009, 2008 and 2007:
Non-Interest Income
Years Ended December 31,
(dollars in thousands)
| 2009 compared to 2008 | 2008 compared to 2007 | |||||||||||||||||||||||||||
| 2009 | 2008 | Change Amount |
Change Percent |
2008 | 2007 | Change Amount |
Change Percent |
|||||||||||||||||||||
| Service charges on deposit accounts |
$ | 32,957 | $ | 34,775 | $ | (1,818 | ) | -5 | % | $ | 34,775 | $ | 32,126 | $ | 2,649 | 8 | % | |||||||||||
| Brokerage commissions and fees |
7,597 | 8,948 | (1,351 | ) | -15 | % | 8,948 | 10,038 | (1,090 | ) | -11 | % | ||||||||||||||||
| Mortgage banking revenue, net |
18,688 | 2,436 | 16,252 | 667 | % | 2,436 | 7,791 | (5,355 | ) | -69 | % | |||||||||||||||||
| (Loss) gain on investment securities, net |
(1,677 | ) | 1,349 | (3,026 | ) | -224 | % | 1,349 | (13 | ) | 1,362 | N | M | |||||||||||||||
| Gain on junior subordinated debentures carried at fair value |
6,482 | 38,903 | (32,421 | ) | -83 | % | 38,903 | 4,928 | 33,975 | 689 | % | |||||||||||||||||
| Proceeds from Visa mandatory partial redemption |
— | 12,633 | (12,633 | ) | -100 | % | 12,633 | — | 12,633 | N | M | |||||||||||||||||
| Other income |
9,469 | 8,074 | 1,395 | 17 | % | 8,074 | 9,959 | (1,885 | ) | -19 | % | |||||||||||||||||
| Total |
$ | 73,516 | $ | 107,118 | $ | (33,602 | ) | -31 | % | $ | 107,118 | $ | 64,829 | $ | 42,289 | 65 | % | |||||||||||
The decrease in deposit service charges in 2009 compared to 2008 is principally attributable to decreased non-sufficient funds and overdraft fee income due to lower average overdraft balances. The increase in deposit service charges in 2008 over 2007 is principally attributable to increased volume of deposit accounts during the year. Brokerage commissions and fees declined as a result of the continuation of stressed conditions in the trading market during 2009, relative to the same periods in 2008 and 2007, and the departure of certain Umpqua Investments financial advisors in the fourth quarter of 2008. However, brokerage commissions and fees in the second half of 2009 increased 43% over the first half of 2009 due to the new leadership’s ability to recruit new brokers and grow assets under management.
Mortgage banking revenue in 2009 increased due to a significant increase in purchase and refinancing activity, resulting from historically low mortgage interest rates, as compared 2008. Closed mortgage volume for 2009 was $757.0 million, representing an 131% increase over 2008 production. The current low mortgage interest rate environment contributed to a $3.2 million decline in fair value on the mortgage servicing right (“MSR”) asset in the current year, compared to a $4.6 million decline in fair
46
Table of Contents
Umpqua Holdings Corporation
value recognized in the same period prior year. Additionally, mortgage banking revenue in the first quarter of 2008 reflects a $2.4 million realized loss on an ineffective MSR hedge, which has been suspended, due to widening spreads and price declines that were not offset by a corresponding gain in the related MSR asset. The decrease in mortgage banking revenue in 2008 compared to 2007 primarily resulted from the difference between the $4.6 million loss and a $756,000 loss on the MSR asset between the respective periods, and the $2.4 million realized loss on an ineffective MSR hedge due to significant market volatility in the first quarter of 2008, partially offset by increased fees on loans sold.
The net loss on investment securities recognized in 2009 represents an other-than-temporary impairment (“OTTI”) charge of $10.6 million, partially offset by the realized gain on sale of investment securities of $8.9 million. The OTTI charge recognized in earnings primarily related to held to maturity non-agency collateralized mortgage obligations, and the amount recognized in earnings represents our estimate of the credit loss component of the total impairment. In 2008, the Company realized a $5.5 million gain on sale of investment securities as part of a repositioning of the investment portfolio to reduce the weighted average life in response to the current economic outlook, and other factors. This gain was offset by a $4.2 million OTTI charge primarily related to held to maturity non-agency collateralized mortgage obligations. Additional discussion on the OTTI charges and gain on sale of investment securities are provided in Note 4 of the Notes to Consolidated Financial Statements and under the heading Investment Securities below.
The change in fair value of the junior subordinated debentures carried at fair value for all periods presented primarily resulted from the widening of the credit risk adjusted spread over the contractual rate of each junior subordinated debenture measured at fair value. Additional information on the junior subordinated debentures carried at fair value is included in Note 16 of the Notes to Consolidated Financial Statements and under the heading Junior Subordinated Debentures below.
In the first quarter of 2008 Visa completed an initial public offering and the Company received $12.6 million as part of a subsequent mandatory partial redemption of our Visa Class B shares. As part of this offering, Visa also established a $3.0 billion escrow account to cover settlements, the resolution of pending litigation and related claims (“covered litigation”). The Company’s remaining 468,659 shares of Visa Class B common stock are restricted and may not be transferred until the later of (1) three years from the date of the initial public offering or (2) the period of time necessary to resolve the covered litigation. A conversion ratio of 0.71429 was established for the conversion rate of Class B shares into Class A shares. If the funds in the escrow account are insufficient to settle all the covered litigation, Visa may sell additional Class A shares, use the proceeds to settle litigation, and further reduce the conversion ratio. If funds remain in the escrow account after all litigation is settled, the Class B conversion ratio will be increased to reflect that surplus. In December 2008, Visa deposited additional funds into the escrow account to satisfy a settlement with Discover Card related to an antitrust lawsuit. In July 2009, Visa deposited additional funds into the litigation escrow account to provide additional reserves to cover potential losses related to the two remaining litigation cases. The deposit of these funds into the escrow account reduced the conversion ratio applicable to Class B common stock outstanding from 0.71429 per Class A share to 0.5824 per Class A share. As of December 31, 2009, the value of the Class A shares was $87.46 per share. The value of unredeemed Class A equivalent shares owned by the Company was $23.9 million as of December 31, 2009, and has not been reflected in the accompanying financial statements.
Other income increased in 2009 over 2008 as a result of compensatory damages awarded to the Company and increased income on trading assets invested in trust for the benefit of certain executives or former employees of acquired institutions as required by agreements. The increase was partially offset by decreased gains and broker fee income related to Small Business Administration loan sales and proceeds from a legal settlement in the first quarter of 2008. Other income decreased in 2008 over 2007 largely due to decreased gains and broker fee income related to Small Business Administration (“SBA”) loan sales, and losses related to trading assets.
47
Table of Contents
NON-INTEREST EXPENSE
Non-interest expense for 2009 was $379.4 million, an increase of $162.8 million or 75% compared to 2008. Non-interest expense for 2008 was $216.6 million, an increase of $2.4 million or 1% compared to 2007. The following table presents the key elements of non-interest expense for the years ended December 31, 2009, 2008 and 2007.
Non-Interest Expense
Years Ended December 31,
(dollars in thousands)
| 2009 compared to 2008 | 2008 compared to 2007 | |||||||||||||||||||||||||||
| 2009 | 2008 | Change Amount |
Change Percent |
2008 | 2007 | Change Amount |
Change Percent |
|||||||||||||||||||||
| Salaries and employee benefits |
$ | 126,850 | $ | 114,600 | $ | 12,250 | 11 | % | $ | 114,600 | $ | 112,864 | $ | 1,736 | 2 | % | ||||||||||||
| Net occupancy and equipment |
39,673 | 37,047 | 2,626 | 7 | % | 37,047 | 35,785 | 1,262 | 4 | % | ||||||||||||||||||
| Communications |
7,671 | 7,063 | 608 | 9 | % | 7,063 | 7,202 | (139 | ) | -2 | % | |||||||||||||||||
| Marketing |
4,529 | 4,573 | (44 | ) | -1 | % | 4,573 | 5,554 | (981 | ) | -18 | % | ||||||||||||||||
| Services |
21,918 | 18,792 | 3,126 | 17 | % | 18,792 | 18,564 | 228 | 1 | % | ||||||||||||||||||
| Supplies |
3,257 | 2,908 | 349 | 12 | % | 2,908 | 3,627 | (719 | ) | -20 | % | |||||||||||||||||
| FDIC assessments |
15,825 | 5,182 | 10,643 | 205 | % | 5,182 | 1,223 | 3,959 | 324 | % | ||||||||||||||||||
| Net loss on other real estate owned |
23,204 | 8,313 | 14,891 | 179 | % | 8,313 | 4 | 8,309 | N | M | ||||||||||||||||||
| Intangible amortization |
6,165 | 5,857 | 308 | 5 | % | 5,857 | 6,094 | (237 | ) | -4 | % | |||||||||||||||||
| Goodwill impairment |
111,952 | 982 | 110,970 | N | M | 982 | — | 982 | N | M | ||||||||||||||||||
| Merger related expenses |
273 | — | 273 | N | M | — | 3,318 | (3,318 | ) | -100 | % | |||||||||||||||||
| Visa litigation |
— | (5,183 | ) | 5,183 | -100 | % | (5,183 | ) | 5,183 | (10,366 | ) | -200 | % | |||||||||||||||
| Other expenses |
18,086 | 16,436 | 1,650 | 10 | % | 16,436 | 14,704 | 1,732 | 12 | % | ||||||||||||||||||
| Total |
$ | 379,403 | $ | 216,570 | $ | 162,833 | 75 | % | $ | 216,570 | $ | 214,122 | $ | 2,448 | 1 | % | ||||||||||||
NM – Not meaningful
Management believes there are several categories of non-interest expense which are outside of the control of the Company, including FDIC deposit insurance assessments, net losses on other real estate owned, and Visa related litigation accruals, and infrequently occurring expenses such as goodwill impairments. Excluding the impact of these non-controllable or infrequently occurring items, non-interest expense increased $21.1 million in 2009 over 2008. Of this increase, $6.1 million relates to the increase in variable costs in the Mortgage Division that directly corresponds to the significant increase in mortgage banking revenue as discussed under the heading Non-Interest Income above. Excluding the incremental impact of the mortgage division’s variable costs, non-interest expense in 2009 over 2008 increased $15.0 million, or 7%, which is less than the 9% growth in total assets during the current year. Excluding these non-controllable or infrequently occurring items, non-interest expense in 2008 over 2007 decreased $436,000 due to the Company’s extensive cost control measures that were put in place in reaction to the slowing economy.
Of the $12.3 million increase in total salaries and employee benefits expense in 2009 compared to 2008, approximately $5.3 million is a direct result of increased production in our mortgage banking division, and $1.6 million is a result of reduced loan origination activity related to lower customer demand, resulting in a reduced offset to compensation expense for deferred loan costs. The remainder primarily results from the increase in employees by 157 full-time equivalents in the current year. The increase in total salaries and employee benefits expense in 2008 compared to 2007 is primarily a result of reduced loan origination activity, resulting in a reduced offset to compensation expense for deferred loan costs. Excluding the impact of the reduced deferred loan costs, salaries and employee benefits expense decreased $1.2 million in 2008 compared to 2007 despite the addition of approximately 110 associates from the North Bay acquisition in April 2007. Net occupancy and equipment
48
Table of Contents
Umpqua Holdings Corporation
expense continues to increase primarily as a result of the growth in the number of our Company’s locations. The growth in 2009 reflects the two new banking locations obtained through the FDIC-assisted purchase and assumption of the Bank of Clark County in January 2009, the addition of two de novo Community Banking locations, in Portland, Oregon and Vancouver, Washington, and the opening of a new Commercial Banking Center in Lynnwood, Washington. In 2008, we opened a new Commercial Banking Center in San Francisco, California and a Mortgage Office in Stockton, California. Additionally, in 2008, we remodeled thirty-eight stores, primarily locations acquired through acquisitions, to meet Umpqua brand standards and customer expectations throughout the California region. The expense recognized in 2007 reflects ten new banking locations as a result of the North Bay acquisition in April 2007, and the addition of three de novo banking locations. The increase in net occupancy and equipment expense in 2009 also reflects increased maintenance contract and software amortization costs.
Communications, marketing, supplies, and other expenses fluctuated in the current year as a result of normal operations. Services expense increased in 2009 compared to 2008 primarily due to higher legal and other professional fees. The decline in communications, marketing, and supplies expense, as well as the modest increase in services expense, in 2008 compared to 2007 are a result of aggressive cost saving initiatives implemented in late 2007.
FDIC assessments represent premiums payable to the FDIC for deposit insurance and Financing Corporation (“FICO”) assessments. The Federal Deposit Insurance Reform Act of 2005 (“Reform Act”) created a new system and rate schedule related to FDIC deposit insurance assessments effective in 2007. As a result, the Company was assessed deposit insurance premiums beginning in 2007; however, most of the premium was offset by a one-time assessment credit that was provided to eligible institutions as part of the Reform Act. The Company’s one-time deposit insurance assessment credit was fully exhausted in 2007. The increase in FDIC assessments in 2008 compared to prior years is a result of increased deposit insurance assessments rates and no remaining one-time assessment credits available to offset the current period expense. In December 2008 and again in February 2009, the FDIC adopted rules to further modify the risk-based deposit insurance assessment system that increased the assessment rates in attempts to restore the Deposit Insurance Fund to targeted reserve ratios. The increase in FDIC assessment expense in 2009 compared to 2008 results from the industry-wide increase in assessment rates and a $4.0 million special assessment imposed in the second quarter of 2009 by the FDIC in efforts to rebuild the Deposit Insurance Fund. Additional discussion on FDIC insurance assessments is provided in Item 1 Business above, under the heading Federal Deposit Insurance.
The continued slowdown in the housing industry, which has detrimentally affected our residential development portfolio, and declines in the fair value of real estate, that serves as collateral securing real estate related credits, has led to an increase of foreclosures on real estate related properties and movement of the properties into other real estate owned (“OREO”). Declines in the market values of these properties after foreclosure have resulted in additional losses on the sale of the properties or by valuation adjustments. During 2009, the Company recognized losses on sale of OREO of $11.0 million. The increase in losses on sale of OREO was due to a combination of the continued value compression of real estate properties and our desire to expedite the sale of several properties. Of the total loss on sale of OREO recognized in the 2009, $4.7 million related to two residential development related properties located in Central Oregon. In 2009, the Company recognized valuation adjustments on OREO of $12.2 million. These valuation adjustments related to 26 properties, of which 86% relate to residential development projects. Of the total valuation adjustments recognized year-to-date, 73% related to properties in Oregon and Washington, with $4.7 million specifically related to three residential development projects in Central Oregon and $1.6 million specifically related to one residential development project in Southern Washington region. The remaining 27% related to properties in California, with $1.9 million relating to two residential development projects and $700,000 relating to one commercial real estate property in the greater Sacramento region. During 2008, the Company recognized losses on sale of OREO of $3.2 million and valuation adjustments of $5.1 million. Additional discussion regarding our procedures to determine and recognize valuation adjustments on other real estate owned is provided under the heading Asset Quality and Non-Performing Assets below.
The increase in intangible amortization in 2009 as compared to 2008 results from an $804,000 impairment recognized in the fourth quarter related to the merchant servicing portfolio obtained through the North Bay acquisition, partially offset by the run-off of intangible assets that are being amortized on an accelerated basis. The decrease in intangible amortization in 2008 as compared to 2007 is due to the run-off of intangible assets that are being amortized on an accelerated basis. The goodwill
49
Table of Contents
impairment charge incurred in 2009 relates to the Community Banking operating segment. This charge primarily resulted from a decline in the fair value of the Community Banking reporting unit, which corresponded to the decline in the Company’s market capitalization and the banking industry in general, and its effect on the implied fair value of the goodwill. The goodwill impairment charge incurred in 2008 related to the Retail Brokerage reporting segment, which resulted from the Company’s evaluation following the departure of certain Umpqua Investments financial advisors. Discussion related to the goodwill impairment charge is provided in Note 7 of the Notes to Consolidated Financial Statements and under the heading Goodwill and Other Intangible Assets below.
We incur significant expenses in connection with the completion and integration of bank acquisitions that are not capitalizable. Classification of expenses as merger-related is done in accordance with the provisions of a Board-approved policy. The following table presents the merger-related expenses by major category for the years ended December 31, 2009 and 2007. The Company incurred no merger-related expenses in 2008. The merger-related expenses incurred in 2009 relate to the FDIC-assisted purchase and assumption of certain assets and liabilities of the Bank of Clark County. The merger-related expenses incurred in 2007 primarily related to the North Bay acquisition. We do not expect to incur any additional merger-related expenses in connection with the Bank of Clark County, North Bay or any other previous merger.
Merger-Related Expense
Years Ended December 31,
(in thousands)
| 2009 | 2007 | |||||
| Professional fees |
$ | 143 | $ | 982 | ||
| Compensation and relocation |
39 | 1,077 | ||||
| Communications |
61 | 478 | ||||
| Premises and equipment |
2 | 188 | ||||
| Other |
28 | 593 | ||||
| Total |
$ | 273 | $ | 3,318 | ||
In November 2007, Visa Inc. announced that it had reached a settlement with American Express related to an antitrust lawsuit. Umpqua Bank and other Visa member banks are obligated to fund the settlement and share in losses resulting from this litigation. We recorded a liability and corresponding expense of approximately $3.9 million pre-tax, for our proportionate share of that settlement. In addition, Visa notified us that it had established a contingency reserve related to unsettled litigation with Discover Card. In connection with this contingency, we recorded a liability and corresponding expense of $1.2 million pre-tax, for our proportionate share of that contingent liability. We are not a party to the Visa litigation and our liability arises solely from the Bank’s membership interest in Visa, Inc.
In connection with Visa establishing a $3.0 billion litigation escrow account from the proceeds of an initial public offering, the Company reversed the $5.2 million reserve in the first quarter of 2008, reflected as a reduction of other non-interest expense. We were required to recognize an estimate of Visa’s pending litigation settlements in the fourth quarter of 2007 based on our ownership position prior to the initial public offering by Visa. With the escrow litigation account funded for the estimated liability for covered litigation as of the end of the first quarter 2008, we were able to reverse the accrual. In October 2008, Visa announced that it had reached a settlement with Discover Card related to an antitrust lawsuit. Umpqua Bank and other Visa member banks are obligated to fund the settlement and share in losses resulting from this litigation that are not already provided for in the escrow account. Visa notified the Company that it had established an additional reserve related to the settlement with Discover Card that has not already been funded into the escrow account. In connection with this settlement, the Company recorded, in the third quarter of 2008, a liability and corresponding expense of $2.1 million pre-tax, for its proportionate share of that liability. The Company is not a party to the Visa litigation and its liability arises solely from the Bank’s membership interest in Visa. In December 2008, this liability and expense were reversed when Visa deposited additional funds into the escrow account to cover the remaining amount of the settlement.
50
Table of Contents
Umpqua Holdings Corporation
Other non-interest expense increased in 2009 over 2008 primarily as a result of expenses related to problem loans, other real estate owned, and settlement fees related to the retail brokerage subsidiary. Other non-interest expense increased in 2008 over 2007 primarily as a result of expenses related to other real estate owned and deposit administration fees.
INCOME TAXES
Our consolidated effective tax rate as a percentage of pre-tax income for 2009 was 21.0%, compared to 30.2% for 2008 and 33.4% for 2007. The effective tax rates were below the federal statutory rate of 35% and the apportioned state rate of 5% (net of the federal tax benefit) principally because of the non-deductible impairment loss on goodwill (for 2009), non-taxable income arising from bank-owned life insurance, income on tax-exempt investment securities, tax credits arising from low income housing investments, Business Energy tax credits and exemptions related to loans and hiring in designated enterprise zones. The income tax benefit from income taxes in 2009 is a result of the operating loss recognized in the period.
Additional information on income taxes is provided in Note 11 of the Notes to Consolidated Financial Statements in Item 8 below.
FINANCIAL CONDITION
INVESTMENT SECURITIES
The composition of our investment securities portfolio reflects management’s investment strategy of maintaining an appropriate level of liquidity while providing a relatively stable source of interest income. The investment securities portfolio also mitigates interest rate and credit risk inherent in the loan portfolio, while providing a vehicle for the investment of available funds, a source of liquidity (by pledging as collateral or through repurchase agreements) and collateral for certain public funds deposits.
Trading securities consist of securities held in inventory by Umpqua Investments for sale to its clients and securities invested in trust for the benefit of former employees of acquired institutions as required by agreements. Trading securities were $2.3 million at December 31, 2009, as compared to $2.0 million at December 31, 2008. This increase is principally attributable to increases in the fair market value of investments securities invested for the benefit of former employees and contributions made to supplemental retirement plans for the benefit of certain executives, partially offset by a decrease in Umpqua Investments’ inventory of trading securities and a decrease in trading assets invested for the benefit of former employees as a result of scheduled distributions.
Investment securities available for sale increased $556.9 million to $1.8 billion as of December 31, 2009, as compared to December 31, 2008. This increase is principally attributable to purchases of $1.0 billion of investment securities available for sale, $4.2 million of investment securities available for sale assumed from the Bank of Clark County, and an increase in fair value of investments securities available for sale of $23.9 million, offset by the proceeds from the sales and maturities of $464.4 million of investment securities available for sale (of which $8.8 million represents net gains on sale) and amortization of net purchase price premiums of $9.3 million.
Investment securities held to maturity were $6.1 million as of December 31, 2009, as compared to $15.8 million at December 31, 2008. This decrease is principally attributable to paydowns and maturities of investment securities held to maturity of $2.3 million and other-than-temporary impairment (“OTTI”) charges of $8.0 million (of which $5.3 million represents the credit loss component recognized as a charge to earnings and $2.7 million representing the loss related to all other factors recognized in other comprehensive income), partially offset by the accretion of net purchase price discounts of $130,000 and the accretion of the non-credit related losses in other comprehensive income of $300,000.
51
Table of Contents
The following table presents the available for sale and held to maturity investment securities portfolio by major type as of December 31 for each of the last three years:
Summary of Investment Securities
As of December 31,
(in thousands)
| December 31, | |||||||||
| 2009 | 2008 | 2007 | |||||||
| AVAILABLE FOR SALE: |
|||||||||
| U.S. Treasury and agencies |
$ | 11,794 | $ | 31,226 | $ | 158,432 | |||
| Obligations of states and political subdivisions |
211,825 | 179,585 | 169,994 | ||||||
| Residential mortgage-backed securities and collateralized mortgage obligations |
1,569,849 | 1,025,295 | 672,344 | ||||||
| Other debt securities |
159 | 634 | 967 | ||||||
| Investments in mutual funds and other equity securities |
1,989 | 1,972 | 49,019 | ||||||
| $ | 1,795,616 | $ | 1,238,712 | $ | 1,050,756 | ||||
| HELD TO MATURITY: |
|||||||||
| Obligations of states and political subdivisions |
$ | 3,216 | $ | 4,166 | $ | 5,403 | |||
| Residential mortgage-backed securities and collateralized mortgage obligations |
2,845 | 11,496 | 227 | ||||||
| Other investment securities |
— | 150 | 375 | ||||||
| $ | 6,061 | $ | 15,812 | $ | 6,005 | ||||
The following table presents information regarding the amortized cost, fair value, average yield and maturity structure of the investment portfolio at December 31, 2009.
Investment Securities Composition*
December 31, 2009
(dollars in thousands)
| Amortized Cost |
Fair Value |
Average Yield |
|||||||
| U.S. TREASURY AND AGENCIES |
|||||||||
| One year or less |
$ | 11,017 | $ | 11,216 | 3.04 | % | |||
| One to five years |
353 | 357 | 2.71 | % | |||||
| Five to ten years |
218 | 221 | 3.68 | % | |||||
| 11,588 | 11,794 | 3.04 | % | ||||||
| OBLIGATIONS OF STATES AND POLITICAL SUBDIVISIONS |
|||||||||
| One year or less |
15,433 | 15,581 | 3.90 | % | |||||
| One to five years |
71,922 | 74,912 | 3.71 | % | |||||
| Five to ten years |
111,117 | 114,352 | 4.03 | % | |||||
| Over ten years |
10,293 | 10,207 | 4.22 | % | |||||
| 208,765 | 215,052 | 3.92 | % | ||||||
| OTHER DEBT SECURITIES |
|||||||||
| Over ten years |
145 | 159 | 32.50 | % | |||||
| Serial maturities |
1,535,994 | 1,572,758 | 6.18 | % | |||||
| Other investment securities |
1,959 | 1,989 | 3.90 | % | |||||
| Total securities |
$ | 1,758,451 | $ | 1,801,752 | 5.89 | % | |||
| * | Weighted average yields are stated on a federal tax-equivalent basis of 35%. Weighted average yields for available for sale investments have been calculated on an amortized cost basis. |
52
Table of Contents
Umpqua Holdings Corporation
The mortgage-related securities in “Serial maturities” in the table above include both pooled mortgage-backed issues and high-quality collaterized mortgage obligation structures, with an average duration of 2.9 years. These mortgage-related securities provide yield spread to U.S. Treasury or agency securities; however, the cash flows arising from them can be volatile due to refinancing of the underlying mortgage loans.
The equity security in “Other investment securities” in the table above at December 31, 2009 principally represents an investment in a Community Reinvestment Act investment fund comprised largely of mortgage-related securities, although funds may also invest in municipal bonds, money market accounts or asset-backed securities.
We review investment securities on an ongoing basis for the presence of other-than-temporary impairment (“OTTI”) or permanent impairment, taking into consideration current market conditions, fair value in relationship to cost, extent and nature of the change in fair value, issuer rating changes and trends, whether we intend to sell a security or if it is likely that we will be required to sell the security before recovery of our amortized cost basis of the investment, which may be maturity, and other factors.
Prior to the second quarter of 2009, the Company would assess an OTTI or permanent impairment based on the nature of the decline and whether the Company has the ability and intent to hold the investments until a market price recovery. If the Company determined a security to be other-than-temporarily or permanently impaired, the full amount of impairment would be recognized through earnings in its entirety. New guidance related to the recognition and presentation of OTTI of debt securities became effective in the second quarter of 2009. Rather than asserting whether a Company has the ability and intent to hold an investment until a market price recovery, a Company must consider whether they intend to sell a security or if it is likely that they would be required to sell the security before recovery of the amortized cost basis of the investment, which may be maturity. For debt securities, if we intend to sell the security or it is likely that we will be required to sell the security before recovering its cost basis, the entire impairment loss would be recognized in earnings as an OTTI. If we do not intend to sell the security and it is not likely that we will be required to sell the security but we do not expect to recover the entire amortized cost basis of the security, only the portion of the impairment loss representing credit losses would be recognized in earnings. The credit loss on a security is measured as the difference between the amortized cost basis and the present value of the cash flows expected to be collected. Projected cash flows are discounted by the original or current effective interest rate depending on the nature of the security being measured for potential OTTI. The remaining impairment related to all other factors, the difference between the present value of the cash flows expected to be collected and fair value, is recognized as a charge to other comprehensive income (“OCI”). Impairment losses related to all other factors are presented as separate categories within OCI. For investment securities held to maturity, this amount is accreted over the remaining life of the debt security prospectively based on the amount and timing of future estimated cash flows. The accretion of the amount recorded in OCI increases the carrying value of the investment and does not affect earnings. If there is an indication of additional credit losses the security is reevaluated accordingly to the procedures described above.
Prior to the Company’s adoption of the new guidance related to the recognition and presentation of OTTI of debt securities which became effective in the second quarter of 2009, the Company recorded a $2.1 million OTTI charge in the three months ended March 31, 2009. This charge related to three non-agency collateralized mortgage obligations carried as held to maturity for which the default rates and loss severities of the underlying collateral and credit coverage ratios of the security indicated that it was probable that credit losses were expected to occur. In 2008, the Company recorded $4.2 million in OTTI. Charges of $3.8 million related to seven non-agency collateralized mortgage obligations carried as held to maturity for which the default rates and loss severities of the underlying collateral and credit coverage ratios of the security indicated that it was probable that credit losses were expected to occur. These securities were valued by third party pricing services using matrix or model pricing methodologies, and were corroborated by broker indicative bids. The remaining non-agency securities within mortgage-backed securities and collateralized mortgage obligations carried as held to maturity were specifically evaluated for OTTI, and the default rates and loss severities of the underlying collateral indicated that credit losses are not expected to occur. Upon adoption of the new OTTI guidance in the second quarter of 2009, the Company analyzed these securities as well as other securities where OTTI had been previously recognized, and determined that as of the adoption date such losses were credit related. As such, there was no cumulative effect adjustment to the opening balance of retained earnings or a corresponding adjustment to accumulated OCI.
53
Table of Contents
The following table presents the OTTI losses for the years ended December 31, 2009 and 2008. There were no similar charges recorded in 2007.
(in thousands)
| 2009 | 2008 | |||||||||||
| Held To Maturity |
Available For Sale |
Held To Maturity |
Available For Sale | |||||||||
| Total other-than-temporary impairment losses |
$ | 12,317 | $ | 239 | $ | 4,041 | $ | 139 | ||||
| Portion of other-than-temporary impairment losses recognized in other comprehensive income(1) |
1,983 | — | — | — | ||||||||
| Net impairment losses recognized in earnings(2) |
$ | 10,334 | $ | 239 | $ | 4,041 | $ | 139 | ||||
| (1) | Represents other-than-temporary impairment losses related to all other factors. |
| (2) | Represents other-than-temporary impairment losses related to credit losses. |
The OTTI recognized on investment securities held to maturity primarily relates to 29 non-agency collateralized mortgage obligations for all periods presented. Each of these securities holds various levels of credit subordination. The underlying mortgage loans of these securities were originated from 2003 through 2007. At origination, the weighted average loan-to-value of the underlying mortgages was 69%; the underlying borrowers had weighted average FICO scores of 731, and 59% were limited documentation loans. These securities were valued by third-party pricing services using matrix or model pricing methodologies and were corroborated by broker indicative bids. We estimated the cash flows of the underlying collateral for each security considering credit, interest and prepayment risk models that incorporate management’s estimate of projected key assumptions including prepayment rates, collateral default rates and loss severity. Assumptions utilized vary from security to security, and are influenced by factors such as loan interest rates, geographic location, borrower characteristics and vintage, and historical experience. We then used a third party to obtain information about the structure of each security, including subordination and other credit enhancements, in order to determine how the underlying collateral cash flows will be distributed to each security issued in the structure. These cash flows were then discounted at the interest rate used to recognize interest income on each security. We reviewed the actual collateral performance of these securities as of December 31, 2009 and noted no significant further deterioration of the underlying mortgages that would significantly impact the inputs or cash flow projections we utilized since the last date these securities were evaluated for impairment. The following table presents a summary of the significant inputs utilized to measure management’s estimate of the credit loss component on these non-agency collateralized mortgage obligations as of December 31, 2009:
| Range | Weighted |
||||||||
| Minimum | Maximum | ||||||||
| Constant prepayment rate |
4.0 | % | 25.0 | % | 14.8 | % | |||
| Collateral default rate |
8.0 | % | 45.0 | % | 16.7 | % | |||
| Loss severity |
20.0 | % | 40.0 | % | 31.4 | % | |||
In the second quarter of 2009 the Company recorded an OTTI charge of $239,000 related to an available for sale collateralized debt obligation that holds trust preferred securities. Management noted certain deferrals and defaults in the pool and believes the impairment represents credit loss in its entirety.
Gross unrealized losses in the available for sale investment portfolio was $3.8 million at December 31, 2009. This consisted primarily of unrealized losses on residential mortgage-backed securities and collateralized mortgage obligations of $3.6 million and unrealized losses on obligations of states and political subdivisions of $204,000. The unrealized losses were primarily caused by interest rate increases subsequent to the purchase of the securities, and not credit quality. In the opinion of management, these securities are considered only temporarily impaired due to changes in market interest rates or the widening of market spreads subsequent to the initial purchase of the securities, and not due to concerns regarding the underlying credit
54
Table of Contents
Umpqua Holdings Corporation
of the issuers or the underlying collateral. Additional information about the investment securities portfolio is provided in Note 4 of the Notes to Consolidated Financial Statements in Item 8 below.
RESTRICTED EQUITY SECURITIES
Restricted equity securities were $15.2 million at December 31, 2009 and $16.5 million at December 31, 2008. Of the $15.2 million at December 31, 2009, $11.9 million and $2.5 million represent the Bank’s investment in the Federal Home Loan Banks (“FHLB”) of Seattle and San Francisco, respectively. FHLB stock is carried at par and does not have a readily determinable fair value. Ownership of FHLB stock is restricted to the FHLB and member institutions, and can only be purchased and redeemed at par. The remaining restricted equity securities represent investments in Pacific Coast Bankers’ Bancshares stock.
Although as of September 30, 2009, the FHLB of Seattle met all of its regulatory requirements (including the risk-based capital requirement), on November 6, 2009, the Finance Agency reaffirmed the FHLB of Seattle capital classification as undercapitalized. The Finance Agency also indicated that it would not change the capital classification to adequately capitalized until the Finance Agency believes the FHLB of Seattle has demonstrated sustained performance in line with an approved capital restoration plan.
Management periodically evaluates FHLB stock for other-than-temporary or permanent impairment. Management’s determination of whether these investments are impaired is based on its assessment of the ultimate recoverability of cost rather than by recognizing temporary declines in value. The determination of whether a decline affects the ultimate recoverability of cost is influenced by criteria such as (1) the significance of any decline in net assets of the FHLB as compared to the capital stock amount for the FHLB and the length of time this situation has persisted, (2) commitments by the FHLB to make payments required by law or regulation and the level of such payments in relation to the operating performance of the FHLB, (3) the impact of legislative and regulatory changes on institutions and, accordingly, the customer base of the FHLB, and (4) the liquidity position of the FHLB.
Under Federal Housing Finance Agency regulations, a FHLB that fails to meet any regulatory capital requirement may not declare a dividend or redeem or repurchase capital stock in excess of what is required for members’ current loans. Moody’s Investors Service (Moody’s) current assessment of the FHLB’s portfolios indicates that the true economic losses embedded in these securities are significantly less than the accounting impairments would suggest and are manageable given the FHLB’s capital levels. According to Moody’s, the large difference between the expected economic losses and the mark-to-market impairment losses for accounting purposes is attributed to market illiquidity, de-leveraging and stress in the credit market in general. The FHLBs have access to the U.S. Government-Sponsored Enterprise Credit Facility, a secured lending facility that serves as a liquidity backstop, substantially reducing the likelihood that the FHLBs would need to sell securities to raise liquidity and, thereby, cause the realization of large economic losses. In addition, the Federal Reserve has begun to purchase direct debt obligations of Freddie Mac, Fannie Mae and the FHLBs. Moody’s has stated that their Aaa senior debt rating and Prime-1 short-term debt rating for the FHLB system are likely to remain unchanged based on expectations that the FHLBs have a very high degree of government support. Moody’s rating of the FHLB of Seattle as Aaa with stable outlook was reaffirmed in May 2009, and Standard and Poors rating of AA+ was reaffirmed in August 2009. Based on the above, the Company has determined there is not an other-than-temporary impairment on the FHLB stock investment as of December 31, 2009.
LOANS AND LEASES
Total loans and leases outstanding at December 31, 2009 were $6.0 billion, a decrease of $132.1 million, or 2.2%, from year-end 2008. This decrease is principally attributable to charge-offs of $200.9 million and transfers to other real estate owned of $50.9 million, offset by net loan originations of $108.7 million during the year.
The Bank provides a wide variety of credit services to its customers, including construction loans, commercial lines of credit, secured and unsecured commercial loans, commercial real estate loans, residential mortgage loans, home equity credit lines, consumer loans and commercial leases. Loans are principally made on a secured basis to customers who reside, own property or operate businesses within the Bank’s principal market area.
55
Table of Contents
The following table presents the composition of the loan portfolio as of December 31 for each of the last five years. The classification of loan balances presented is reported in accordance with the regulatory reporting requirements.
Loan Portfolio Composition
As of December 31,
(dollars in thousands)
| 2009 | 2008 | 2007 | 2006 | 2005 | |||||||||||||||||||||||||||||||
| Type of Loan | Amount | Percentage | Amount | Percentage | Amount | Percentage | Amount | Percentage | Amount | Percentage | |||||||||||||||||||||||||
| Real estate secured loans: |
|||||||||||||||||||||||||||||||||||
| Construction |
$ | 618,476 | 10.3 | % | $ | 931,090 | 15.2 | % | $ | 1,202,173 | 19.9 | % | $ | 1,189,090 | 22.2 | % | $ | 638,555 | 16.3 | % | |||||||||||||||
| Mortgage |
726,658 | 12.1 | % | 661,723 | 10.8 | % | 582,771 | 9.6 | % | 523,715 | 9.8 | % | 427,877 | 10.9 | % | ||||||||||||||||||||
| Commercial and agricultural |
3,482,687 | 58.1 | % | 3,236,645 | 52.8 | % | 3,012,743 | 49.7 | % | 2,649,468 | 49.4 | % | 2,019,623 | 51.5 | % | ||||||||||||||||||||
| Total real estate loans |
4,827,821 | 80.5 | % | 4,829,458 | 78.8 | % | 4,797,687 | 79.2 | % | 4,362,273 | 81.4 | % | 3,086,055 | 78.7 | % | ||||||||||||||||||||
| Commercial and agricultural |
1,090,275 | 18.1 | % | 1,211,167 | 19.7 | % | 1,169,939 | 19.3 | % | 924,917 | 17.2 | % | 753,131 | 19.3 | % | ||||||||||||||||||||
| Leases |
34,528 | 0.6 | % | 40,155 | 0.7 | % | 40,207 | 0.7 | % | 22,870 | 0.4 | % | 17,385 | 0.4 | % | ||||||||||||||||||||
| Installment and other |
58,044 | 1.0 | % | 62,044 | 1.0 | % | 59,091 | 1.0 | % | 63,262 | 1.2 | % | 76,128 | 1.9 | % | ||||||||||||||||||||
| Deferred loan fees, net |
(11,401 | ) | -0.2 | % | (11,450 | ) | -0.2 | % | (11,289 | ) | -0.2 | % | (11,460 | ) | -0.2 | % | (11,068 | ) | -0.3 | % | |||||||||||||||
| Total loans |
$ | 5,999,267 | 100.0 | % | $ | 6,131,374 | 100.0 | % | $ | 6,055,635 | 100.0 | % | $ | 5,361,862 | 100.0 | % | $ | 3,921,631 | 100.0 | % | |||||||||||||||
The following table presents the concentration distribution of our loan portfolio by major type:
Loan Concentrations
As of December 31,
(dollars in thousands)
| 2009 | 2008 | |||||||||||||
| Amount | Percentage | Amount | Percentage | |||||||||||
| Construction and land development |
$ | 618,476 | 10.3 | % | $ | 931,090 | 15.2 | % | ||||||
| Farmland |
110,106 | 1.9 | % | 93,533 | 1.5 | % | ||||||||
| Home equity credit lines |
267,963 | 4.5 | % | 266,107 | 4.4 | % | ||||||||
| Single family first lien mortgage |
236,362 | 3.9 | % | 204,076 | 3.3 | % | ||||||||
| Single family second lien mortgage |
23,609 | 0.4 | % | 26,946 | 0.4 | % | ||||||||
| Multifamily |
198,724 | 3.3 | % | 164,594 | 2.7 | % | ||||||||
| Commercial real estate |
3,372,581 | 56.2 | % | 3,143,112 | 51.3 | % | ||||||||
| Total real estate secured |
4,827,821 | 80.5 | % | 4,829,458 | 78.8 | % | ||||||||
| Commercial and industrial |
1,016,803 | 16.9 | % | 1,139,441 | 18.5 | % | ||||||||
| Agricultural production |
73,472 | 1.2 | % | 71,726 | 1.2 | % | ||||||||
| Consumer |
35,212 | 0.6 | % | 36,316 | 0.6 | % | ||||||||
| Leases |
34,528 | 0.6 | % | 40,155 | 0.7 | % | ||||||||
| Other |
22,832 | 0.4 | % | 25,728 | 0.4 | % | ||||||||
| Deferred loan fees, net |
(11,401 | ) | -0.2 | % | (11,450 | ) | -0.2 | % | ||||||
| Total loans |
$ | 5,999,267 | 100.0 | % | $ | 6,131,374 | 100.0 | % | ||||||
56
Table of Contents
Umpqua Holdings Corporation
Commercial, agricultural and construction loans are the most sensitive to interest rate changes. The following table presents the maturity distribution of our commercial, agricultural and construction loan portfolios and the sensitivity of these loans to changes in interest rates as of December 31, 2009:
Maturities and Sensitivities of Loans to Changes in Interest Rates
(in thousands)
| By Maturity | Loans Over One Year by Rate Sensitivity | ||||||||||||||||
| One Year or Less |
One Through Five Years |
Over Five Years |
Total | Fixed Rate |
Floating Rate | ||||||||||||
| Commercial and agricultural |
$ 615,555 | $ | 338,924 | $ | 135,796 | $ | 1,090,275 | $ | 354,196 | $ | 120,524 | ||||||
| Real estate—construction |
460,728 | 100,561 | 57,187 | 618,476 | 96,986 | 60,762 | |||||||||||
| $1,076,283 | $ | 439,485 | $ | 192,983 | $ | 1,708,751 | $ | 451,182 | $ | 181,286 | |||||||
In order to assist with understanding the concentrations and risks associated with our portfolio, we are providing several additional tables to provide details of the most significant classes of the Company’s loan portfolio. The classification of loan balances are presented in accordance with how management monitors and manages the risks of the loan portfolio, including how the Company applies its allowance for loan and lease losses methodology. This classification of loan balances does not directly correspond to tables presented above, which are reported in accordance with regulatory reporting definitions.
The following table presents a distribution of the term commercial real estate portfolio by type and region as of December 31, 2009 and December 31, 2008. In 2008 we did not utilize a separate Retail commercial real estate collateral coding, and these balances were primarily included in the Commercial building collateral type.
57
Table of Contents
Commercial Real Estate Portfolio by Type and Region
(in thousands)
| December 31, 2009 | ||||||||||||||||||||||||
| Northwest Oregon |
Central Oregon |
Southern Oregon |
Washington | Greater Sacramento |
Northern California |
Total | December 31, 2008 | |||||||||||||||||
| Non-owner occupied |
||||||||||||||||||||||||
| Commercial building |
$ | 110,805 | $ | 4,367 | $ | 37,924 | $ | 15,820 | $ | 106,502 | $ | 101,516 | $ | 376,934 | $ | 881,094 | ||||||||
| Medical office |
80,514 | 1,104 | 15,711 | 4,210 | 16,473 | 13,562 | 131,574 | 115,409 | ||||||||||||||||
| Professional office |
176,920 | 8,649 | 54,413 | 26,213 | 106,395 | 65,559 | 438,149 | 430,936 | ||||||||||||||||
| Storage |
20,747 | 352 | 18,698 | — | 17,477 | 39,876 | 97,150 | 102,354 | ||||||||||||||||
| Multi-family |
60,579 | 249 | 10,251 | 1,428 | 5,630 | 20,173 | 98,310 | 112,093 | ||||||||||||||||
| Resort |
2,064 | — | 5,081 | — | — | — | 7,145 | 7,338 | ||||||||||||||||
| Retail |
223,272 | 3,528 | 33,101 | 11,178 | 165,667 | 73,723 | 510,469 | — | ||||||||||||||||
| Residential |
32,030 | 352 | 13,002 | 6,056 | 10,219 | 18,677 | 80,336 | 67,826 | ||||||||||||||||
| Farmland & agricultural |
5,976 | 223 | 638 | — | 204 | 29,000 | 36,041 | 40,229 | ||||||||||||||||
| Apartments |
61,395 | — | 9,925 | — | 11,330 | 22,601 | 105,251 | 74,874 | ||||||||||||||||
| Assisted living |
106,607 | — | 67,486 | — | 2,933 | 8,725 | 185,751 | 143,824 | ||||||||||||||||
| Hotel & motel |
50,782 | — | 1,023 | 11,112 | 18,066 | 18,653 | 99,636 | 102,922 | ||||||||||||||||
| Industrial |
29,656 | 3,584 | 7,751 | — | 36,983 | 23,565 | 101,539 | 105,947 | ||||||||||||||||
| RV park |
31,158 | 675 | 15,490 | — | 821 | 5,963 | 54,107 | 52,654 | ||||||||||||||||
| Warehouse |
11,416 | — | 237 | — | 1,198 | 1,717 | 14,568 | 26,345 | ||||||||||||||||
| Other |
31,851 | 1,055 | 3,668 | 3,522 | 3,746 | 5,599 | 49,441 | 62,238 | ||||||||||||||||
| Total non-owner occupied |
$ | 1,035,772 | $ | 24,138 | $ | 294,399 | $ | 79,539 | $ | 503,644 | $ | 448,909 | $ | 2,386,401 | $ | 2,326,083 | ||||||||
| Owner occupied |
||||||||||||||||||||||||
| Commercial building |
$ | 163,314 | $ | 2,639 | $ | 31,417 | $ | 12,388 | $ | 61,729 | $ | 108,766 | $ | 380,253 | $ | 483,244 | ||||||||
| Medical office |
64,699 | 3,319 | 17,553 | 2,218 | 1,646 | 25,977 | 115,412 | 64,360 | ||||||||||||||||
| Professional office |
49,118 | 2,830 | 12,479 | 3,324 | 21,489 | 17,174 | 106,414 | 104,268 | ||||||||||||||||
| Storage |
15,061 | 149 | — | 663 | 148 | 5,087 | 21,108 | 16,962 | ||||||||||||||||
| Multi-family |
869 | — | 60 | — | 158 | — | 1,087 | 2,536 | ||||||||||||||||
| Resort |
5,736 | — | — | — | 3,131 | 1,067 | 9,934 | 7,475 | ||||||||||||||||
| Retail |
59,651 | 2,939 | 12,402 | 4,055 | 31,954 | 57,872 | 168,873 | — | ||||||||||||||||
| Residential |
6,974 | — | 2,632 | — | 1,401 | 2,814 | 13,821 | 11,777 | ||||||||||||||||
| Farmland & agricultural |
10,906 | — | 822 | — | — | 44,904 | 56,632 | 40,437 | ||||||||||||||||
| Apartments |
202 | — | 741 | — | 51 | — | 994 | 823 | ||||||||||||||||
| Assisted living |
27,656 | — | 146 | — | 6,964 | 15,619 | 50,385 | 49,228 | ||||||||||||||||
| Hotel & motel |
12,226 | — | 192 | 716 | — | 24,330 | 37,464 | 24,551 | ||||||||||||||||
| Industrial |
53,607 | 1,409 | 13,958 | 1,562 | 9,480 | 39,030 | 119,046 | 103,887 | ||||||||||||||||
| RV park |
144 | — | 2,544 | — | 161 | 1,239 | 4,088 | 4,171 | ||||||||||||||||
| Warehouse |
10,885 | — | 410 | — | 1,145 | 6,921 | 19,361 | 11,610 | ||||||||||||||||
| Other |
28,417 | 1,513 | — | — | 276 | 1,625 | 31,831 | 6,384 | ||||||||||||||||
| Total owner occupied |
$ | 509,465 | $ | 14,798 | $ | 95,356 | $ | 24,926 | $ | 139,733 | $ | 352,425 | $ | 1,136,703 | $ | 931,713 | ||||||||
| Total commercial real estate |
$ | 1,545,237 | $ | 38,936 | $ | 389,755 | $ | 104,465 | $ | 643,377 | $ | 801,334 | $ | 3,523,104 | $ | 3,257,796 | ||||||||
58
Table of Contents
Umpqua Holdings Corporation
| December 31, 2008 | |||||||||||||||||||||
| Northwest Oregon |
Central Oregon |
Southern Oregon |
Washington | Greater Sacramento |
Northern California |
Total | |||||||||||||||
| Total non-owner occupied |
$ | 1,000,098 | $ | 33,298 | $ | 297,387 | $ | 58,078 | $ | 499,006 | $ | 438,216 | $ | 2,326,083 | |||||||
| Total owner occupied |
375,942 | 13,606 | 97,514 | 20,425 | 127,158 | 297,068 | 931,713 | ||||||||||||||
| Total commercial real estate |
$ | 1,376,040 | $ | 46,904 | $ | 394,901 | $ | 78,503 | $ | 626,164 | $ | 735,284 | $ | 3,257,796 | |||||||
The following table presents a distribution of the term commercial real estate portfolio by type and year of origination as of December 31, 2009:
Commercial Real Estate Portfolio by Type and Year of Origination
(in thousands)
| December 31, 2009 | ||||||||||||||||||
| Prior to 2000 |
2000 - 2004 |
2005 - 2006 |
2007 - 2008 |
2009 | Total | |||||||||||||
| Non-owner occupied |
||||||||||||||||||
| Commercial building |
$ | 14,211 | $ | 90,648 | $ | 63,746 | $ | 144,016 | $ | 64,313 | $ | 376,934 | ||||||
| Medical office |
627 | 48,475 | 17,947 | 47,143 | 17,382 | 131,574 | ||||||||||||
| Professional office |
13,804 | 168,057 | 140,227 | 83,757 | 32,304 | 438,149 | ||||||||||||
| Storage |
1,940 | 49,505 | 26,866 | 18,487 | 352 | 97,150 | ||||||||||||
| Multi-family |
3,709 | 27,098 | 19,122 | 42,829 | 5,552 | 98,310 | ||||||||||||
| Resort |
737 | 5,715 | — | 693 | — | 7,145 | ||||||||||||
| Retail |
10,439 | 178,260 | 158,973 | 148,617 | 14,180 | 510,469 | ||||||||||||
| Residential |
1,328 | 10,029 | 27,581 | 27,379 | 14,019 | 80,336 | ||||||||||||
| Farmland & agricultural |
856 | 8,217 | 12,328 | 6,899 | 7,741 | 36,041 | ||||||||||||
| Apartments |
838 | 25,494 | 23,169 | 23,176 | 32,574 | 105,251 | ||||||||||||
| Assisted living |
7,356 | 55,791 | 92,412 | 16,164 | 14,028 | 185,751 | ||||||||||||
| Hotel & motel |
12,537 | 43,180 | 20,097 | 22,990 | 832 | 99,636 | ||||||||||||
| Industrial |
3,298 | 42,813 | 40,341 | 14,450 | 637 | 101,539 | ||||||||||||
| RV park |
3,127 | 17,656 | 16,553 | 11,071 | 5,700 | 54,107 | ||||||||||||
| Warehouse |
1,131 | 8,989 | 3,828 | 620 | — | 14,568 | ||||||||||||
| Other |
659 | 10,332 | 14,962 | 20,764 | 2,724 | 49,441 | ||||||||||||
| Total non-owner occupied |
$ | 76,597 | $ | 790,259 | $ | 678,152 | $ | 629,055 | $ | 212,338 | $ | 2,386,401 | ||||||
| Owner occupied |
||||||||||||||||||
| Commercial building |
$ | 10,711 | $ | 82,631 | $ | 91,642 | $ | 124,725 | $ | 70,544 | $ | 380,253 | ||||||
| Medical office |
2,284 | 22,428 | 13,099 | 27,246 | 50,355 | 115,412 | ||||||||||||
| Professional office |
4,184 | 34,752 | 28,700 | 33,004 | 5,774 | 106,414 | ||||||||||||
| Storage |
547 | 5,312 | 5,437 | 9,164 | 648 | 21,108 | ||||||||||||
| Multi-family |
179 | 908 | — | — | — | 1,087 | ||||||||||||
| Resort |
415 | 6,412 | 139 | — | 2,968 | 9,934 | ||||||||||||
| Retail |
6,024 | 39,775 | 61,738 | 56,705 | 4,631 | 168,873 | ||||||||||||
| Residential |
128 | 5,226 | 4,331 | 2,336 | 1,800 | 13,821 | ||||||||||||
| Farmland & agricultural |
1,499 | 10,066 | 15,010 | 19,343 | 10,714 | 56,632 | ||||||||||||
| Apartments |
51 | — | — | 943 | — | 994 | ||||||||||||
| Assisted living |
4,975 | 7,831 | 21,212 | 14,200 | 2,167 | 50,385 | ||||||||||||
| Hotel & motel |
3,927 | 15,956 | 5,765 | 1,592 | 10,224 | 37,464 | ||||||||||||
| Industrial |
2,929 | 46,104 | 36,049 | 13,852 | 20,112 | 119,046 | ||||||||||||
| RV park |
877 | 1,074 | — | 1,993 | 144 | 4,088 | ||||||||||||
| Warehouse |
114 | 9,410 | 2,666 | 2,409 | 4,762 | 19,361 | ||||||||||||
| Other |
— | 1,877 | 21,260 | 7,911 | 783 | 31,831 | ||||||||||||
| Total owner occupied |
$ | 38,844 | $ | 289,762 | $ | 307,048 | $ | 315,423 | $ | 185,626 | $ | 1,136,703 | ||||||
| Total commercial real estate |
$ | 115,441 | $ | 1,080,021 | $ | 985,200 | $ | 944,478 | $ | 397,964 | $ | 3,523,104 | ||||||
59
Table of Contents
The following table presents a distribution of the term commercial real estate portfolio by type and year of maturity as of December 31, 2009:
Commercial Real Estate Portfolio by Type and Year of Maturity
(in thousands)
| December 31, 2009 | |||||||||||||||||||||
| 2010 | 2011 | 2012 - 2013 |
2014 - 2015 |
2016 - 2020 |
2021 & Later |
Total | |||||||||||||||
| Non-owner occupied |
|||||||||||||||||||||
| Commercial building |
$ | 17,630 | $ | 19,250 | $ | 61,651 | $ | 59,837 | $ | 202,742 | $ | 15,824 | $ | 376,934 | |||||||
| Medical office |
1,280 | 955 | 5,181 | 34,265 | 79,066 | 10,827 | 131,574 | ||||||||||||||
| Professional office |
32,221 | 7,338 | 89,564 | 101,780 | 194,867 | 12,379 | 438,149 | ||||||||||||||
| Storage |
1,317 | 2,125 | 14,182 | 21,593 | 54,559 | 3,374 | 97,150 | ||||||||||||||
| Multi-family |
4,100 | 2,144 | 11,275 | 22,792 | 53,327 | 4,672 | 98,310 | ||||||||||||||
| Resort |
— | — | 692 | 871 | 1,193 | 4,389 | 7,145 | ||||||||||||||
| Retail |
28,368 | 21,276 | 65,163 | 158,049 | 232,364 | 5,249 | 510,469 | ||||||||||||||
| Residential |
23,840 | 10,661 | 8,952 | 10,548 | 21,662 | 4,673 | 80,336 | ||||||||||||||
| Farmland & agricultural |
10,171 | 349 | 2,948 | 4,843 | 15,159 | 2,571 | 36,041 | ||||||||||||||
| Apartments |
6,033 | 1,683 | 5,789 | 15,872 | 73,174 | 2,700 | 105,251 | ||||||||||||||
| Assisted living |
22,847 | 24,084 | 20,919 | 33,489 | 82,137 | 2,275 | 185,751 | ||||||||||||||
| Hotel & motel |
4,830 | 6,034 | 18,065 | 35,732 | 30,271 | 4,704 | 99,636 | ||||||||||||||
| Industrial |
2,780 | 3,856 | 16,434 | 24,948 | 47,290 | 6,231 | 101,539 | ||||||||||||||
| RV park |
1,308 | 846 | 6,712 | 14,685 | 28,894 | 1,662 | 54,107 | ||||||||||||||
| Warehouse |
420 | 125 | 6,862 | 2,795 | 4,366 | — | 14,568 | ||||||||||||||
| Other |
16,114 | 4,463 | 9,158 | 6,942 | 9,098 | 3,666 | 49,441 | ||||||||||||||
| Total non-owner occupied |
$ | 173,259 | $ | 105,189 | $ | 343,547 | $ | 549,041 | $ | 1,130,169 | $ | 85,196 | $ | 2,386,401 | |||||||
| Owner occupied |
|||||||||||||||||||||
| Commercial building |
$ | 12,932 | $ | 4,284 | $ | 35,356 | $ | 56,324 | $ | 224,348 | $ | 47,009 | $ | 380,253 | |||||||
| Medical office |
— | 78 | 6,873 | 10,821 | 74,471 | 23,169 | 115,412 | ||||||||||||||
| Professional office |
2,908 | 1,000 | 18,857 | 24,581 | 52,664 | 6,404 | 106,414 | ||||||||||||||
| Storage |
1,480 | 149 | 2,621 | 1,370 | 14,794 | 694 | 21,108 | ||||||||||||||
| Multi-family |
25 | — | 638 | 244 | 180 | — | 1,087 | ||||||||||||||
| Resort |
— | — | 108 | 3,955 | 5,871 | — | 9,934 | ||||||||||||||
| Retail |
1,545 | 5,078 | 19,517 | 32,809 | 99,310 | 10,614 | 168,873 | ||||||||||||||
| Residential |
2,407 | 230 | 2,681 | 3,169 | 3,655 | 1,679 | 13,821 | ||||||||||||||
| Farmland & agricultural |
1,128 | 3,677 | 2,585 | 11,961 | 34,678 | 2,603 | 56,632 | ||||||||||||||
| Apartments |
— | — | — | 51 | 943 | — | 994 | ||||||||||||||
| Assisted living |
175 | — | 4,932 | 18,576 | 24,500 | 2,202 | 50,385 | ||||||||||||||
| Hotel & motel |
1,744 | 9 | 8,657 | 6,846 | 11,038 | 9,170 | 37,464 | ||||||||||||||
| Industrial |
3,520 | 3,788 | 16,441 | 23,826 | 52,617 | 18,854 | 119,046 | ||||||||||||||
| RV park |
165 | — | 777 | 571 | 2,414 | 161 | 4,088 | ||||||||||||||
| Warehouse |
1,149 | 338 | 1,618 | 9,128 | 7,024 | 104 | 19,361 | ||||||||||||||
| Other |
1,768 | 715 | 169 | 762 | 3,238 | 25,179 | 31,831 | ||||||||||||||
| Total owner occupied |
$ | 30,946 | $ | 19,346 | $ | 121,830 | $ | 204,994 | $ | 611,745 | $ | 147,842 | $ | 1,136,703 | |||||||
| Total commercial real estate |
$ | 204,205 | $ | 124,535 | $ | 465,377 | $ | 754,035 | $ | 1,741,914 | $ | 233,038 | $ | 3,523,104 | |||||||
60
Table of Contents
Umpqua Holdings Corporation
The following table presents a distribution of the commercial real estate construction portfolio by type and region as of December 31, 2009 and December 31, 2008. In 2008, we did not utilize a separate Retail commercial real estate collateral coding, and these balances were largely included in the Commercial building collateral type.
Commercial Real Estate Construction Portfolio by Type and Region
(in thousands)
| December 31, 2009 | ||||||||||||||||||||||||
| Northwest Oregon |
Central Oregon |
Southern Oregon |
Washington | Greater Sacramento |
Northern California |
Total | December 31, 2008 | |||||||||||||||||
| Non-owner occupied |
||||||||||||||||||||||||
| Commercial building |
$ | 19,726 | $ | — | $ | 3,023 | $ | 9,434 | $ | 31,565 | $ | 2,250 | $ | 65,998 | $ | 118,127 | ||||||||
| Medical office |
15,429 | — | 264 | — | — | 400 | 16,093 | 12,426 | ||||||||||||||||
| Professional office |
16,472 | — | — | — | 15,180 | 3,500 | 35,152 | 39,121 | ||||||||||||||||
| Storage |
6,100 | — | — | — | 1,711 | 3,094 | 10,905 | 16,237 | ||||||||||||||||
| Multi-family |
1,339 | — | — | — | 6,184 | — | 7,523 | 5,798 | ||||||||||||||||
| Retail |
15,801 | — | — | — | 6,456 | 1,212 | 23,469 | — | ||||||||||||||||
| Residential |
29,314 | 1,778 | 5,128 | 4,630 | 39,188 | 11,167 | 91,205 | 91,703 | ||||||||||||||||
| Apartments |
13,621 | — | — | — | — | — | 13,621 | 12,453 | ||||||||||||||||
| Assisted living |
16,196 | — | — | — | 209 | — | 16,405 | 27,631 | ||||||||||||||||
| Hotel & motel |
— | — | — | — | — | 4,070 | 4,070 | 84 | ||||||||||||||||
| Industrial |
— | — | — | — | 1,515 | 18 | 1,533 | 7,936 | ||||||||||||||||
| Other |
249 | — | — | — | — | 3,000 | 3,249 | 32,401 | ||||||||||||||||
| Total non-owner occupied |
$ | 134,247 | $ | 1,778 | $ | 8,415 | $ | 14,064 | $ | 102,008 | $ | 28,711 | $ | 289,223 | $ | 363,917 | ||||||||
| Owner occupied |
||||||||||||||||||||||||
| Commercial building |
$ | 14,342 | $ | — | $ | 171 | $ | — | $ | 10,421 | $ | 10,498 | $ | 35,432 | $ | 55,102 | ||||||||
| Medical office |
14,472 | — | 403 | — | 3,511 | 463 | 18,849 | 48,616 | ||||||||||||||||
| Professional office |
— | — | — | — | — | — | — | 4,432 | ||||||||||||||||
| Storage |
995 | — | — | — | — | — | 995 | 995 | ||||||||||||||||
| Multi-family |
— | — | — | — | — | — | — | — | ||||||||||||||||
| Retail |
— | — | — | — | — | 4,041 | 4,041 | — | ||||||||||||||||
| Residential |
4,981 | — | — | — | 3,675 | 619 | 9,275 | 10,638 | ||||||||||||||||
| Apartments |
860 | — | — | — | — | — | 860 | — | ||||||||||||||||
| Assisted living |
7,472 | — | — | — | — | — | 7,472 | 6,344 | ||||||||||||||||
| Hotel & motel |
— | — | — | — | — | — | — | — | ||||||||||||||||
| Industrial |
415 | — | 118 | — | — | — | 533 | 3,371 | ||||||||||||||||
| Other |
— | — | — | — | — | — | — | — | ||||||||||||||||
| Total owner occupied |
$ | 43,537 | $ | — | $ | 692 | $ | — | $ | 17,607 | $ | 15,621 | $ | 77,457 | $ | 129,498 | ||||||||
| Total commercial construction |
$ | 177,784 | $ | 1,778 | $ | 9,107 | $ | 14,064 | $ | 119,615 | $ | 44,332 | $ | 366,680 | $ | 493,415 | ||||||||
| December 31, 2008 | |||||||||||||||||||||
| Northwest Oregon |
Central Oregon |
Southern Oregon |
Washington | Greater Sacramento |
Northern California |
Total | |||||||||||||||
| Total non-owner occupied |
$ | 170,477 | $ | 7,814 | $ | 10,260 | $ | 11,922 | $ | 130,156 | $ | 33,288 | $ | 363,917 | |||||||
| Total owner occupied |
68,688 | — | 2,350 | — | 34,849 | 23,611 | 129,498 | ||||||||||||||
| Total commercial real estate |
$ | 239,165 | $ | 7,814 | $ | 12,610 | $ | 11,922 | $ | 165,005 | $ | 56,899 | $ | 493,415 | |||||||
61
Table of Contents
The following table presents a distribution of the commercial loan portfolio by type and region as of December 31, 2009 and December 31, 2008.
Commercial Loan Portfolio by Type and Region
(in thousands)
| December 31, 2009 | ||||||||||||||||||||||||
| Northwest Oregon |
Central Oregon |
Southern Oregon |
Washington | Greater Sacramento |
Northern California |
Total | December 31, 2008 | |||||||||||||||||
| Commercial line of credit |
$ | 171,342 | $ | 3,050 | $ | 30,394 | $ | 28,005 | $ | 151,609 | $ | 80,017 | $ | 464,417 | $ | 589,902 | ||||||||
| Asset-based line of credit |
82,518 | 160 | 580 | 6,501 | 3,918 | 53,697 | 147,374 | 118,112 | ||||||||||||||||
| Term loans |
168,579 | 4,138 | 28,647 | 8,970 | 42,804 | 126,295 | 379,433 | 407,974 | ||||||||||||||||
| Agricultural |
29,696 | — | 786 | — | 287 | 53,461 | 84,230 | 80,910 | ||||||||||||||||
| Municipal |
15,680 | — | 20,778 | — | 73,640 | 9,798 | 119,896 | 113,956 | ||||||||||||||||
| SBA |
— | — | — | — | — | 60,936 | 60,936 | 58,461 | ||||||||||||||||
| Small business lending |
45,560 | — | — | 4,097 | 48,526 | — | 98,183 | 91,594 | ||||||||||||||||
| Total commercial |
$ | 513,375 | $ | 7,348 | $ | 81,185 | $ | 47,573 | $ | 320,784 | $ | 384,204 | $ | 1,354,469 | $ | 1,460,909 | ||||||||
| December 31, 2008 | |||||||||||||||||||||
| Northwest Oregon |
Central Oregon |
Southern Oregon |
Washington | Greater Sacramento |
Northern California |
Total | |||||||||||||||
| Total commercial |
$ | 603,820 | $ | 27,484 | $ | 104,113 | $ | 84,315 | $ | 256,400 | $ | 384,777 | $ | 1,460,909 | |||||||
Due to the impact of the continuing housing market downturn on our residential development loan portfolio, discussion of and tables related to this loan segment is provided under the heading Asset Quality and Non-Performing Assets below.
ASSET QUALITY AND NON-PERFORMING ASSETS
We manage asset quality and control credit risk through diversification of the loan portfolio and the application of policies designed to promote sound underwriting and loan monitoring practices. The Bank’s Credit Quality Group is charged with monitoring asset quality, establishing credit policies and procedures and enforcing the consistent application of these policies and procedures across the Bank. The provision for loan and lease losses charged to earnings is based upon management’s judgment of the amount necessary to maintain the allowance at a level adequate to absorb probable incurred losses. The amount of provision charge is dependent upon many factors, including loan growth, net charge-offs, changes in the composition of the loan portfolio, delinquencies, management’s assessment of loan portfolio quality, general economic conditions that can impact the value of collateral, and other trends. The evaluation of these factors is performed through an analysis of the adequacy of the allowance for loan and lease losses. Reviews of non-performing, past due loans and larger credits, designed to identify potential charges to the allowance for loan and lease losses, and to determine the adequacy of the allowance, are conducted on a quarterly basis. These reviews consider such factors as the financial strength of borrowers, the value of the applicable collateral, loan loss experience, estimated loan losses, growth in the loan portfolio, prevailing economic conditions and other factors. Additional information regarding the methodology used in determining the adequacy of the allowance for loan and lease losses is contained in Part I Item 1 of this report in the section titled Lending and Credit Functions.
Non-performing loans, which include non-accrual loans and accruing loans past due over 90 days, totaled $199.0 million or 3.32% of total loans as of December 31, 2009, as compared to $133.4 million, or 2.18% of total loans, at December 31, 2008. Non-performing assets, which include non-performing loans and foreclosed real estate (“other real estate owned”), totaled $223.6 million, or 2.38% of total assets as of December 31, 2009, compared with $161.3 million, or 1.88% of total assets as of December 31, 2008. The increase in non-performing assets in 2009 attributable to the effects of the U.S. recession, the housing market downturn and declining real estate values on our loan portfolio.
A loan is considered impaired when based on current information and events, we determine it is probable that we will not be able to collect all amounts due according to the loan contract, including scheduled interest payments. Generally, when loans
62
Table of Contents
Umpqua Holdings Corporation
are identified as impaired they are moved to our Special Assets Division. When we identify a loan as impaired, we measure the loan for potential impairment using discount cash flows, except when the sole remaining source of the repayment for the loan is the liquidation of the collateral. In these cases, we use the current fair value of collateral, less selling costs. The starting point for determining the fair value of collateral is through obtaining external appraisals. Generally, external appraisals are updated every six to nine months. We obtain appraisals from a pre-approved list of independent, third party, local appraisal firms. Approval and addition to the list is based on experience, reputation, character, consistency and knowledge of the respective real estate market. At a minimum, it is ascertained that the appraiser is: (a) currently licensed in the state in which the property is located, (b) is experienced in the appraisal of properties similar to the property being appraised, (c) is actively engaged in the appraisal work, (d) has knowledge of current real estate market conditions and financing trends, (e) is reputable, and (f) is not on Freddie Mac’s nor the Bank’s Exclusionary List of appraisers and brokers. In certain cases appraisals will be reviewed by our Real Estate Valuation Services group to ensure the quality of the appraisal and the expertise and independence of the appraiser. Upon receipt and review, an external appraisal is utilized to measure a loan for potential impairment. Our impairment analysis documents the date of the appraisal used in the analysis, whether the officer preparing the report deems it current, and, if not, allows for internal valuation adjustments with justification. Typical justified adjustments might include discounts for continued market deterioration subsequent to appraisal date, adjustments for the release of collateral contemplated in the appraisal, or the value of other collateral or consideration not contemplated in the appraisal. An appraisal over one year old in most cases will be considered stale dated and an updated or new appraisal will be required. Any adjustments from appraised value to net realizable value are detailed and justified in the impairment analysis, which is reviewed and approved by senior credit quality officers and the Company’s Allowance for Loan and Lease Losses (“ALLL”) Committee. Although an external appraisal is the primary source to value collateral dependent loans, we may also utilize values obtained through purchase and sale agreements, negotiated short sales, broker price opinions, or the sales price of the note. These alternative sources of value are used only if deemed to be more representative of value based on updated information regarding collateral resolution. Impairment analyses are updated, reviewed and approved on a quarterly basis at or near the end of each reporting period. Based on these processes, we do not believe there are significant time lapses for the recognition of additional loan loss provisions or charge-offs from the date they become known.
Loans are classified as non-accrual when collection of principal or interest is doubtful—generally if they are past due as to maturity or payment of principal or interest by 90 days or more—unless such loans are well-secured and in the process of collection. Additionally, all loans that are impaired are considered for non-accrual status. Loans placed on non-accrual will typically remain on non-accrual status until all principal and interest payments are brought current and the prospects for future payments in accordance with the loan agreement appear relatively certain.
Upon acquisition of real estate collateral, typically through the foreclosure process, we promptly begin to market the property for sale. If we do not begin to receive offers or indications of interest we will analyze the price and review market conditions to assess whether a lower price reflects the market value of the property and would enable us to sell the property. In addition, we update appraisals on other real estate owned property six to nine months after the most recent appraisal. Increases in valuation adjustments recorded in a period are primarily based on a) updated appraisals received during the period, or b) management’s authorization to reduce the selling price of the property during the period. Unless a current appraisal is available, an appraisal will be ordered prior to a loan moving to other real estate owned. Foreclosed properties held as other real estate owned are recorded at the lower of the recorded investment in the loan or market value of the property less expected selling costs. Other real estate owned at December 31, 2009 totaled $24.6 million and consisted of 47 properties. At December 31, 2009, one property with a carrying value of $1.3 million is subject to a sales contract, but is accounted for under the deposit method and continues to be reported as other real estate owned.
Loans are reported as restructured when the Bank grants a concession(s) to a borrower experiencing financial difficulties that it would not otherwise consider. Examples of such concessions include a reduction in the loan rate, forgiveness of principal or accrued interest, extending the maturity date(s) or providing a lower interest rate than would be normally available for a transaction of similar risk. As a result of these concessions, restructured loans are impaired as the Bank will not collect all amounts due, both principal and interest, in accordance with the terms of the original loan agreement. Impairment reserves on non-collateral dependent restructured loans are measured by comparing the present value of expected future cash flows on the
63
Table of Contents
restructured loans discounted at the interest rate of the original loan agreement to the loan’s carrying value. These impairment reserves are recognized as a specific component to be provided for in the allowance for loan and lease losses.
The Company has written down impaired, non-accrual loans as of December 31, 2009 to their estimated net realizable value, based on disposition value, and expects resolution with no additional material loss, absent further decline in market prices. The following table summarizes our non-performing assets as of December 31 for each of the last five years.
Non-Performing Assets
As of December 31,
(dollars in thousands)
| 2009 | 2008 | 2007 | 2006 | 2005 | |||||||||||
| Loans on non-accrual status |
$ | 193,118 | $ | 127,914 | $ | 81,317 | $ | 8,629 | $ | 5,953 | |||||
| Loans past due 90 days or more and accruing |
5,909 | 5,452 | 9,782 | 429 | 487 | ||||||||||
| Total non-performing loans |
199,027 | 133,366 | 91,099 | 9,058 | 6,440 | ||||||||||
| Other real estate owned |
24,566 | 27,898 | 6,943 | — | 1,123 | ||||||||||
| Total non-performing assets |
$ | 223,593 | $ | 161,264 | $ | 98,042 | $ | 9,058 | $ | 7,563 | |||||
| Restructured loans(1) |
$ | 134,439 | $ | 23,540 | $ | — | $ | 7,986 | $ | 8,077 | |||||
| Allowance for loan and lease losses |
$ | 107,657 | $ | 95,865 | $ | 84,904 | $ | 60,090 | $ | 43,885 | |||||
| Reserve for unfunded commitments |
731 | 983 | 1,182 | 1,313 | 1,601 | ||||||||||
| Allowance for credit losses |
$ | 108,388 | $ | 96,848 | $ | 86,086 | $ | 61,403 | $ | 45,486 | |||||
| Asset quality ratios: |
|||||||||||||||
| Non-performing assets to total assets |
2.38% | 1.88% | 1.18% | 0.12% | 0.14% | ||||||||||
| Non-performing loans to total loans |
3.32% | 2.18% | 1.50% | 0.17% | 0.16% | ||||||||||
| Allowance for loan and lease losses to total loans |
1.79% | 1.56% | 1.40% | 1.12% | 1.12% | ||||||||||
| Allowance for credit losses to total loans |
1.81% | 1.58% | 1.42% | 1.15% | 1.16% | ||||||||||
| Allowance for credit losses to total non-performing loans |
54% | 73% | 94% | 678% | 706% | ||||||||||
| (1) | Represents accruing restructured loans performing according to their restructured terms. |
64
Table of Contents
Umpqua Holdings Corporation
The following tables summarize our non-performing assets by loan type and region as of December 31, 2009 and December 31, 2008:
Non-Performing Assets by Type and Region
(in thousands)
| December 31, 2009 | |||||||||||||||||||||
| Northwest Oregon |
Central Oregon |
Southern Oregon |
Washington | Greater Sacramento |
Northern California |
Total | |||||||||||||||
| Loans on non-accrual status |
|||||||||||||||||||||
| Residential development |
$ | 4,090 | $ | 2,729 | $ | 4,950 | $ | — | $ | 23,391 | $ | 10,324 | $ | 45,484 | |||||||
| Commercial construction |
10,061 | 987 | — | 2,700 | 18,602 | 4,308 | 36,658 | ||||||||||||||
| Commercial real estate |
16,101 | 4,043 | 5,029 | 1,566 | 20,821 | 14,819 | 62,379 | ||||||||||||||
| Commercial |
31,329 | 3,591 | 481 | 9,963 | 328 | 2,905 | 48,597 | ||||||||||||||
| Other |
— | — | — | — | — | — | — | ||||||||||||||
| Total loans on non-accrual status |
61,581 | 11,350 | 10,460 | 14,229 | 63,142 | 32,356 | 193,118 | ||||||||||||||
| Loans past due 90 days or more and accruing |
|||||||||||||||||||||
| Residential development |
— | — | — | — | — | — | — | ||||||||||||||
| Commercial construction |
— | — | — | — | — | — | — | ||||||||||||||
| Commercial real estate |
— | — | — | 247 | — | — | 247 | ||||||||||||||
| Commercial |
— | — | — | 1,000 | 266 | — | 1,266 | ||||||||||||||
| Other |
4,222 | — | — | — | 174 | — | 4,396 | ||||||||||||||
| Total loans past due 90 days or more and accruing |
4,222 | — | — | 1,247 | 440 | — | 5,909 | ||||||||||||||
| Total non-performing loans |
65,803 | 11,350 | 10,460 | 15,476 | 63,582 | 32,356 | 199,027 | ||||||||||||||
| Other real estate owned |
|||||||||||||||||||||
| Residential development |
2,772 | 4,643 | 1,064 | 4,885 | 1,987 | 144 | 15,495 | ||||||||||||||
| Commercial construction |
359 | 392 | — | 426 | 3,595 | — | 4,772 | ||||||||||||||
| Commercial real estate |
430 | — | 514 | — | — | — | 944 | ||||||||||||||
| Commercial |
303 | 982 | — | — | — | 151 | 1,436 | ||||||||||||||
| Other |
1,919 | — | — | — | — | — | 1,919 | ||||||||||||||
| Total other real estate owned |
5,783 | 6,017 | 1,578 | 5,311 | 5,582 | 295 | 24,566 | ||||||||||||||
| Total non-performing assets |
$ | 71,586 | $ | 17,367 | $ | 12,038 | $ | 20,787 | $ | 69,164 | $ | 32,651 | $ | 223,593 | |||||||
65
Table of Contents
| December 31, 2008 | |||||||||||||||||||||
| Northwest Oregon |
Central Oregon |
Southern Oregon |
Washington | Greater Sacramento |
Northern California |
Total | |||||||||||||||
| Loans on non-accrual status |
|||||||||||||||||||||
| Residential development |
$ | 18,720 | $ | 15,846 | $ | 4,583 | $ | 648 | $ | 33,374 | $ | 14,041 | $ | 87,212 | |||||||
| Commercial construction |
— | — | — | — | 16,889 | 367 | 17,256 | ||||||||||||||
| Commercial real estate |
3,743 | 543 | 1,525 | 307 | 3,709 | 4,687 | 14,514 | ||||||||||||||
| Commercial |
2,287 | 5,402 | 77 | — | — | 1,166 | 8,932 | ||||||||||||||
| Other |
— | — | — | — | — | — | — | ||||||||||||||
| Total loans on non-accrual status |
24,750 | 21,791 | 6,185 | 955 | 53,972 | 20,261 | 127,914 | ||||||||||||||
| Loans past due 90 days or more and accruing |
|||||||||||||||||||||
| Residential development |
— | — | 1,894 | — | — | — | 1,894 | ||||||||||||||
| Commercial construction |
— | — | — | — | — | — | — | ||||||||||||||
| Commercial real estate |
— | — | — | — | — | — | — | ||||||||||||||
| Commercial |
195 | — | — | — | — | 114 | 309 | ||||||||||||||
| Other |
2,308 | — | — | 2 | 939 | — | 3,249 | ||||||||||||||
| Total loans past due 90 days or more and accruing |
2,503 | — | 1,894 | 2 | 939 | 114 | 5,452 | ||||||||||||||
| Total non-performing loans |
27,253 | 21,791 | 8,079 | 957 | 54,911 | 20,375 | 133,366 | ||||||||||||||
| Other real estate owned |
|||||||||||||||||||||
| Residential development |
1,418 | 13,076 | 1,352 | 1,525 | 6,284 | 254 | 23,909 | ||||||||||||||
| Commercial construction |
520 | — | — | — | — | — | 520 | ||||||||||||||
| Commercial real estate |
— | — | — | 381 | 1,700 | — | 2,081 | ||||||||||||||
| Commercial |
— | — | — | — | — | 293 | 293 | ||||||||||||||
| Other |
585 | — | — | — | 510 | — | 1,095 | ||||||||||||||
| Total other real estate owned |
2,523 | 13,076 | 1,352 | 1,906 | 8,494 | 547 | 27,898 | ||||||||||||||
| Total non-performing assets |
$ | 29,776 | $ | 34,867 | $ | 9,431 | $ | 2,863 | $ | 63,405 | $ | 20,922 | $ | 161,264 | |||||||
As of December 31, 2009, non-performing assets of $223.6 million have been written down by 41%, or $154.9 million, from their original balance of $378.5 million.
66
Table of Contents
Umpqua Holdings Corporation
The following table summarizes our loans past due 30-89 days by loan type and by region as of December 31, 2009 and December 31, 2008. Loans past due 30-89 days have decreased 30% between the two periods.
Loans Past Due 30-89 Days by Type and Region
(in thousands)
| December 31, 2009 | |||||||||||||||||||||
| Northwest Oregon |
Central Oregon |
Southern Oregon |
Washington | Greater Sacramento |
Northern California |
Total | |||||||||||||||
| Residential development |
$ | 7,500 | $ | 1,041 | $ | — | $ | — | $ | 283 | $ | 126 | $ | 8,950 | |||||||
| Commercial construction |
442 | — | — | 683 | — | 110 | 1,235 | ||||||||||||||
| Commercial real estate |
4,160 | 695 | 287 | 3,819 | 2,629 | 7,055 | 18,645 | ||||||||||||||
| Commercial |
1,553 | 529 | — | — | 772 | 5,531 | 8,385 | ||||||||||||||
| Other |
3,171 | — | — | — | 1,072 | — | 4,243 | ||||||||||||||
| Total |
$ | 16,826 | $ | 2,265 | $ | 287 | $ | 4,502 | $ | 4,756 | $ | 12,822 | $ | 41,458 | |||||||
| December 31, 2008 | |||||||||||||||||||||
| Northwest Oregon |
Central Oregon |
Southern Oregon |
Washington | Greater Sacramento |
Northern California |
Total | |||||||||||||||
| Residential development |
$ | 1,486 | $ | 3,374 | $ | 5,860 | $ | — | $ | 15,324 | $ | 3,428 | $ | 29,472 | |||||||
| Commercial construction |
— | — | — | 629 | — | — | 629 | ||||||||||||||
| Commercial real estate |
3,987 | 1,750 | 312 | 384 | 1,240 | 9,209 | 16,882 | ||||||||||||||
| Commercial |
401 | 2,992 | — | 206 | 402 | 4,295 | 8,296 | ||||||||||||||
| Other |
3,386 | — | — | — | 473 | — | 3,859 | ||||||||||||||
| Total |
$ | 9,260 | $ | 8,116 | $ | 6,172 | $ | 1,219 | $ | 17,439 | $ | 16,932 | $ | 59,138 | |||||||
Our residential development loan portfolio, a subset of the construction and development category, has been adversely impacted by the housing market downturn. As a result, the Company has focused its efforts to reduce our exposure to this segment. The following table presents a geographic distribution of the residential development portfolio during 2009 by quarter:
Residential Development Loans
(dollars in thousands)
| December 31, 2008 |
March 31, 2009 |
June 30, 2009 |
September 30, 2009 |
December 31, 2009 |
Change Since December 31, 2008 | ||||||||||||||||
| Northwest Oregon |
$ | 134,506 | $ | 120,460 | $ | 120,076 | $ | 93,745 | $ | 88,762 | -34% | ||||||||||
| Central Oregon |
31,186 | 20,951 | 15,493 | 13,753 | 9,059 | -71% | |||||||||||||||
| Southern Oregon |
33,850 | 29,738 | 26,561 | 21,852 | 19,006 | -44% | |||||||||||||||
| Washington |
27,531 | 26,514 | 24,744 | 17,690 | 8,616 | -69% | |||||||||||||||
| Greater Sacramento |
109,181 | 92,744 | 84,522 | 80,107 | 74,993 | -31% | |||||||||||||||
| Northern California |
47,905 | 38,266 | 29,894 | 31,336 | 25,373 | -47% | |||||||||||||||
| Total |
$ | 384,159 | $ | 328,673 | $ | 301,290 | $ | 258,483 | $ | 225,809 | -41% | ||||||||||
| Percentage of total loan portfolio |
6% | 5% | 5% | 4% | 4% | ||||||||||||||||
| Quarterly change amount |
$ | (55,486 | ) | $ | (27,383 | ) | $ | (42,807 | ) | $ | (32,674 | ) | |||||||||
| Quarterly change percentage |
-14% | -8% | -14% | -13% | |||||||||||||||||
| Year-to-date change amount |
$ | (55,486 | ) | $ | (82,869 | ) | $ | (125,676 | ) | $ | (158,350 | ) | |||||||||
| Year-to-date change percentage |
-14% | -22% | -33% | -41% | |||||||||||||||||
67
Table of Contents
The largest single loan type of non-performing assets throughout the year was residential development loans. At December 31, 2008, $87.2 million, or 68%, of the total $127.9 million of non-accrual loans were residential development loans. By the end of 2009, we reduced our balance of non-accrual residential development loans to $45.5 million, or 23% of total non-accrual loans, representing a 48% decrease. During the same period, we reduced our balance of residential development related OREO properties by 35%. The following table presents a geographic distribution of the non-performing residential development loans during 2009 by quarter:
Residential Development Non-Performing Loans
(dollars in thousands)
| December 31, 2008 |
March 31, 2009 |
June 30, 2009 |
September 30, 2009 |
December 31, 2009 |
Change Since December 31, 2008 | ||||||||||||||||
| Northwest Oregon |
$ | 18,720 | $ | 8,689 | $ | 6,985 | $ | 6,815 | $ | 4,090 | -78% | ||||||||||
| Central Oregon |
15,846 | 12,415 | 6,118 | 4,860 | 2,729 | -83% | |||||||||||||||
| Southern Oregon |
6,477 | 8,246 | 7,254 | 3,951 | 4,950 | -24% | |||||||||||||||
| Washington |
648 | 216 | 4,720 | 4,720 | — | -100% | |||||||||||||||
| Greater Sacramento |
33,374 | 37,264 | 25,673 | 21,821 | 23,391 | -30% | |||||||||||||||
| Northern California |
14,041 | 13,271 | 10,601 | 8,648 | 10,324 | -26% | |||||||||||||||
| Total |
$ | 89,106 | $ | 80,101 | $ | 61,351 | $ | 50,815 | $ | 45,484 | -49% | ||||||||||
| Percentage of non-performing loans |
67% | 63% | 54% | 39% | 23% | ||||||||||||||||
| Quarterly change amount |
$ | (9,005 | ) | $ | (18,750 | ) | $ | (10,536 | ) | $ | (5,331 | ) | |||||||||
| Quarterly change percentage |
-10% | -23% | -17% | -10% | |||||||||||||||||
| Year-to-date change amount |
$ | (9,005 | ) | $ | (27,755 | ) | $ | (38,291 | ) | $ | (43,622 | ) | |||||||||
| Year-to-date change percentage |
-10% | -31% | -43% | -49% | |||||||||||||||||
The following table presents the remaining performing residential development loans by size and geographic distribution as of December 31, 2009:
Residential Development Performing Loans
(dollars in thousands)
| $250k and less |
$250k to $1 million |
$1 million to $3 million |
$3 million to $5 million |
$5 million to $10 million |
$10 million and greater |
Total | |||||||||||||||
| Northwest Oregon |
$ | 4,674 | $ | 8,770 | $ | 22,307 | $ | 17,480 | $ | 16,635 | $ | 14,806 | $ | 84,672 | |||||||
| Central Oregon |
514 | 2,115 | 3,701 | — | — | — | 6,330 | ||||||||||||||
| Southern Oregon |
1,209 | 7,330 | 5,517 | — | — | — | 14,056 | ||||||||||||||
| Washington |
— | 632 | 4,792 | 3,192 | — | — | 8,616 | ||||||||||||||
| Greater Sacramento |
3,605 | 6,487 | 4,628 | 4,867 | 11,455 | 20,560 | 51,602 | ||||||||||||||
| Northern California |
1,640 | 3,792 | 9,617 | — | — | — | 15,049 | ||||||||||||||
| Total |
$ | 11,642 | $ | 29,126 | $ | 50,562 | $ | 25,539 | $ | 28,090 | $ | 35,366 | $ | 180,325 | |||||||
Commercial real estate, commercial and commercial construction represents 31%, 25% and 18%, respectively, of the remaining non-performing loans as of December 31, 2009, compared to 11%, 7% and 13%, respectively, as of December 31, 2008. Commercial real estate non-performing loans were $62.6 million at December 31, 2009, compared to $14.5 million at December 31, 2008. Commercial non-performing loans were $49.9 million at December 31, 2009, compared to $9.2 million at December 31, 2008. Commercial construction non-performing loans were $36.7 million at December 31, 2009, compared to $17.3 million at December 31, 2008. Of these non-performing loan balances as of December 31, 2009, 61% are directly
68
Table of Contents
Umpqua Holdings Corporation
affected by the housing market downturn or the real estate bubble, or indirectly impacted from the contraction of real estate dependent businesses. The remaining non-performing loans in these segments primarily reflect the impact of the U.S. recession on certain businesses.
The Company is continually performing extensive reviews of our permanent commercial real estate portfolio, including stress testing. These reviews are being performed on both our non-owner and owner occupied credits. These reviews are being completed to verify leasing status, to ensure the accuracy of risk ratings, and to develop proactive action plans with borrowers on projects. The stress testing has been performed to determine the effect of rising cap rates, interest rates and vacancy rates, on this portfolio. Based on our analysis, the Company believes our lending teams are effectively managing the risks in this portfolio. There can be no assurance that any further declines in economic conditions, such as potential increases in retail or office vacancy rates, will exceed the projected assumptions utilized in the stress testing and may result in additional non-performing loans in the future.
At December 31, 2009 and December 31, 2008, impaired loans of $134.4 million and $23.5 million were classified as performing restructured loans, respectively. The restructurings were granted in response to borrower financial difficulty, and generally provide for a temporary modification of loan repayment terms. The performing restructured loans on accrual status represent the only impaired loans accruing interest at each respective date. In order for a restructured loan to be considered performing and on accrual status, the loan’s collateral coverage generally will be greater than or equal to 100% of the loan balance, the loan is current on payments, and the borrower must either prefund an interest reserve or demonstrate the ability to make payments from a verified source of cash flow. The Company has obligations to lend $455,000 of additional funds on the restructured loans as of December 31, 2009, which primarily relates to one residential development related credit.
The following tables summarize our performing restructured loans by loan type and region as of December 31, 2009 and December 31, 2008:
Restructured Loans by Type and Region
(in thousands)
| December 31, 2009 | |||||||||||||||||||||
| Northwest Oregon |
Central Oregon |
Southern Oregon |
Washington | Greater Sacramento |
Northern California |
Total | |||||||||||||||
| Residential development |
$ | 26,994 | $ | — | $ | 306 | $ | 7,985 | $ | 33,103 | $ | — | $ | 68,388 | |||||||
| Commercial construction |
— | — | — | — | — | — | — | ||||||||||||||
| Commercial real estate |
18,349 | — | 5,790 | — | 9,742 | 7,866 | 41,747 | ||||||||||||||
| Commercial |
715 | — | — | — | 279 | 18,628 | 19,622 | ||||||||||||||
| Other |
4,634 | — | — | — | 48 | — | 4,682 | ||||||||||||||
| Total |
$ | 50,692 | $ | — | $ | 6,096 | $ | 7,985 | $ | 43,172 | $ | 26,494 | $ | 134,439 | |||||||
| December 31, 2008 | |||||||||||||||||||||
| Northwest Oregon |
Central Oregon |
Southern Oregon |
Washington | Greater Sacramento |
Northern California |
Total | |||||||||||||||
| Residential development |
$ | — | $ | — | $ | — | $ | — | $ | 20,135 | $ | 1,417 | $ | 21,552 | |||||||
| Commercial construction |
— | — | — | — | — | — | — | ||||||||||||||
| Commercial real estate |
— | — | — | — | — | 1,046 | 1,046 | ||||||||||||||
| Commercial |
422 | — | — | — | 360 | 160 | 942 | ||||||||||||||
| Other |
— | — | — | — | — | — | — | ||||||||||||||
| Total |
$ | 422 | $ | — | $ | — | $ | — | $ | 20,495 | $ | 2,623 | $ | 23,540 | |||||||
69
Table of Contents
The following table presents a distribution of our performing restructured loans by year of maturity, according to the restructured terms, as of December 31, 2009:
(in thousands)
| Year | Amount | ||
| 2010 |
$ | 96,717 | |
| 2011 |
12,621 | ||
| 2012 |
2,359 | ||
| 2013 |
5,129 | ||
| 2014 |
1,676 | ||
| Thereafter |
15,937 | ||
| Total |
$ | 134,439 | |
A further decline in the economic conditions in our general market areas or other factors could adversely impact individual borrowers or the loan portfolio in general. Accordingly, there can be no assurance that loans will not become 90 days or more past due, become impaired or placed on non-accrual status, restructured or transferred to other real estate owned in the future. Additional information about the loan portfolio is provided in Note 5 of the Notes to Consolidated Financial Statements in Item 8 below.
ALLOWANCE FOR LOAN AND LEASE LOSSES AND RESERVE FOR UNFUNDED COMMITMENTS
The allowance for loan and lease losses (“ALLL”) totaled $107.7 million and $95.9 million at December 31, 2009 and 2008, respectively. The increase in the allowance for loan and lease losses as of December 31, 2009 as compared to prior year is principally attributable to an increase in provision for loan and lease losses in excess of charge-offs.
The following table sets forth the allocation of the allowance for loan and lease losses:
Allowance for loan and lease losses Composition
As of December 31,
(in thousands)
| 2009 | 2008 | 2007 | 2006 | 2005 | |||||||||||
| Real estate |
$ | 72,941 | $ | 63,685 | $ | 60,840 | $ | 44,179 | $ | 30,137 | |||||
| Commercial |
24,583 | 23,104 | 19,513 | 14,161 | 11,230 | ||||||||||
| Loans to individuals and overdrafts |
606 | 484 | 504 | 603 | 669 | ||||||||||
| Unallocated |
9,527 | 8,592 | 4,047 | 1,147 | 1,849 | ||||||||||
| Allowance for loan and lease losses |
$ | 107,657 | $ | 95,865 | $ | 84,904 | $ | 60,090 | $ | 43,885 | |||||
The unallocated portion of ALLL provides for coverage of credit losses inherent in the loan portfolio but not captured in the credit loss factors that are utilized in the risk rating-based component, or in the specific impairment reserve component of the allowance for loan and lease losses, and acknowledges the inherent imprecision of all loss prediction models. As of December 31, 2009, the unallocated allowance amount represented 9% of the allowance for loan and lease losses, consistent with the level at December 31, 2008. The level in unallocated ALLL in the current year reflects management’s evaluation of the existing general business and economic conditions, and declining credit quality and collateral values of real estate in our markets. The ALLL composition should not be interpreted as an indication of specific amounts or loan categories in which future charge-offs may occur.
70
Table of Contents
Umpqua Holdings Corporation
The following table provides a summary of activity in the ALLL by major loan type for each of the five years ended December 31:
Activity in the Allowance for loan and lease losses
Years Ended December 31,
(dollars in thousands)
| 2009 | 2008 | 2007 | 2006 | 2005 | |||||||||||||||
| Balance at beginning of year |
$ 95,865 | $ | 84,904 | $ | 60,090 | $ | 43,885 | $ | 44,229 | ||||||||||
| Loans charged off: |
|||||||||||||||||||
| Real estate |
(142,322 | ) | (89,218 | ) | (21,340 | ) | (734 | ) | (132 | ) | |||||||||
| Commercial |
(56,136 | ) | (9,958 | ) | (2,030 | ) | (2,135 | ) | (6,538 | ) | |||||||||
| Consumer and other |
(2,409 | ) | (1,876 | ) | (1,360 | ) | (1,336 | ) | (1,082 | ) | |||||||||
| Total loans charged off |
(200,867 | ) | (101,052 | ) | (24,730 | ) | (4,205 | ) | (7,752 | ) | |||||||||
| Recoveries: |
|||||||||||||||||||
| Real Estate |
1,559 | 2,676 | 1,250 | 897 | 32 | ||||||||||||||
| Commercial |
1,450 | 1,018 | 785 | 1,916 | 4,344 | ||||||||||||||
| Consumer and other |
526 | 641 | 701 | 818 | 564 | ||||||||||||||
| Total recoveries |
3,535 | 4,335 | 2,736 | 3,631 | 4,940 | ||||||||||||||
| Net charge-offs |
(197,332 | ) | (96,717 | ) | (21,994 | ) | (574 | ) | (2,812 | ) | |||||||||
| Addition incident to mergers |
— | — | 5,078 | 14,227 | — | ||||||||||||||
| Provision charged to operations |
209,124 | 107,678 | 41,730 | 2,552 | 2,468 | ||||||||||||||
| Balance at end of year |
$ 107,657 | $ | 95,865 | $ | 84,904 | $ | 60,090 | $ | 43,885 | ||||||||||
| Ratio of net charge-offs to average loans |
3.23% | 1.58% | 0.38% | 0.01% | 0.08% | ||||||||||||||
| Ratio of provision to average loans |
3.43% | 1.76% | 0.72% | 0.05% | 0.07% | ||||||||||||||
| Recoveries as a percentage of charge-offs |
1.76% | 4.29% | 11.06% | 86.35% | 63.73% | ||||||||||||||
The increase in the ALLL as of December 31, 2009 is primarily a result of the increase in the provision for loan and lease losses in 2009. The increase in the provision for loan and lease losses is a result of several factors. The U.S. recession, the housing market downturn, and declining real estate values in our markets have negatively impacted aspects of our residential development, commercial real estate, commercial construction and commercial loan portfolios, resulting in downgrades within the portfolio, an increase in non-performing loans, and an increase in loans charged-off during the year. Downgrades within the portfolio have increased our classified credit balances resulting in a higher risk rating-based component of the allowance for loan and lease losses.
All impaired loans are individually evaluated for impairment. If the measurement of each impaired loans’ value is less than the recorded investment in the loan, we recognize this impairment and adjust the carrying value of the loan to fair value through the allowance for loan and lease losses. This can be accomplished by charging-off the impaired portion of the loan or establishing a specific component within the allowance for loan and lease losses. If in management’s assessment the sources of repayment will not result in a reasonable probability that the carrying value of a loan can be recovered, the amount of a loan’s specific impairment is charged-off against the allowance for loan and lease losses. Prior to the second quarter of 2008, the Company established specific reserves within the allowance for loan and leases losses for loan impairments and recognized the charge-off of the impairment reserve when the loan was resolved, sold, or foreclosed and transferred to other real estate owned. Due to declining real estate values in our markets and the deterioration of the U.S. economy in general, it is increasingly likely that impairment reserves on collateral dependent loans, particularly those relating to real estate, will not be recoverable and represent a confirmed loss. As a result, beginning in the second quarter of 2008, the Company began recognizing the charge-off of impairment reserves on impaired loans in the period they arise for collateral dependent loans. This process has effectively accelerated the recognition of charge-offs recognized since the second quarter of 2008. The change in our
71
Table of Contents
assessment of the possible recoverability of our collateral dependent impaired loans’ carrying values has ultimately had no impact on our impairment valuation procedures or the amount of provision for loan and leases losses included within the Consolidated Statements of Operations. Impairment reserves on non-collateral dependent restructured loans are measured by comparing the present value of expected future cash flows on the restructured loans discounted at the interest rate of the original loan agreement to the loan’s carrying value. These impairment reserves are recognized as a specific component to be provided for in the allowance for loan and lease losses.
At December 31, 2009, the recorded investment in loans classified as impaired totaled $328.0 million, with a corresponding valuation allowance (included in the allowance for loan and lease losses) of $2.7 million. The valuation allowance on impaired loans represents the impairment reserves on performing restructured loans. At December 31, 2008, the total recorded investment in impaired loans was $151.5 million, with no corresponding valuation allowance.
The majority of loan charge-offs in the current year relate to real estate related credits. In the current year we experienced increased charge-offs related to our residential development, commercial real estate, commercial construction and commercial portfolios. These charge-offs were largely driven by the deteriorating economic conditions coupled with falling real estate values in our markets. The majority of all charge-offs taken in the current year relate to borrowers that were directly affected by the housing market downturn or indirectly impacted from the contraction of real estate dependent businesses
The following table presents a summary of activity in the reserve for unfunded commitments (“RUC”):
Summary of Reserve for Unfunded Commitments Activity
Years Ended December 31,
(in thousands)
| 2009 | 2008 | 2007 | ||||||||||
| Balance, beginning of year |
$ | 983 | $ | 1,182 | $ | 1,313 | ||||||
| Acquisition |
— | — | 134 | |||||||||
| Net decrease credited to other expenses |
(252 | ) | (199 | ) | (265 | ) | ||||||
| Balance, end of year |
$ | 731 | $ | 983 | $ | 1,182 | ||||||
We believe that the ALLL and RUC at December 31, 2009 are sufficient to absorb losses inherent in the loan portfolio and credit commitments outstanding as of that date, respectively, based on the best information available. This assessment, based in part on historical levels of net charge-offs, loan growth, and a detailed review of the quality of the loan portfolio, involves uncertainty and judgment. Therefore, the adequacy of the ALLL and RUC cannot be determined with precision and may be subject to change in future periods. In addition, bank regulatory authorities, as part of their periodic examination of the Bank, may require additional charges to the provision for loan and lease losses in future periods if warranted as a result of their review.
72
Table of Contents
Umpqua Holdings Corporation
MORTGAGE SERVICING RIGHTS
The following table presents the key elements of our mortgage servicing rights asset as of December 31, 2009, 2008 and 2007:
Summary of Mortgage Servicing Rights
Years Ended December 31,
(dollars in thousands)
| 2009 | 2008 | 2007 | |||||||||
| Balance, beginning of year |
$ 8,205 | $ | 10,088 | $ | 9,952 | ||||||
| Additions for new mortgage servicing rights capitalized |
7,570 | 2,694 | 892 | ||||||||
| Changes in fair value: |
|||||||||||
| Due to changes in model inputs or assumptions(1) |
(3,469 | ) | (1,270 | ) | 595 | ||||||
| Other(2) |
319 | (3,307 | ) | (1,351 | ) | ||||||
| Balance, end of year |
$12,625 | $ | 8,205 | $ | 10,088 | ||||||
| Balance of loans serviced for others |
$ 1,277,832 | $ | 955,494 | $ | 870,680 | ||||||
| MSR as a percentage of serviced loans |
0.99% | 0.86% | 1.16% | ||||||||
| (1) | Principally reflects changes in discount rates and prepayment speed assumptions, which are primarily affected by changes in interest rates. |
| (2) | Represents changes due to collection/realization of expected cash flows over time. |
Mortgage servicing rights are adjusted to fair value quarterly with the change recorded in mortgage banking revenue. The value of mortgage servicing rights is impacted by market rates for mortgage loans. Historically low market rates can cause prepayments to increase as a result of refinancing activity. To the extent loans are prepaid sooner than estimated at the time servicing assets are originally recorded, it is possible that certain mortgage servicing rights assets may decrease in value. Generally, the fair value of our mortgage servicing rights will increase as market rates for mortgage loans rise and decrease if market rates fall.
In the fourth quarter of 2007, the Company began using derivative instruments to hedge the risk of changes in the fair value of MSR due to changes in interest rates. Starting in late February 2008 and continuing into March 2008, the bond markets experienced extraordinary volatility. This volatility resulted in widening spreads and price declines on the derivative instruments that were not offset by corresponding gains in the MSR asset. As a result, a $2.4 million charge was recognized within mortgage banking revenue in the first quarter of 2008. In March, the Company suspended the MSR hedge, given the continued volatility. Additional information about the Company’s mortgage servicing rights is provided in Note 8 of the Notes to Consolidated Financial Statements in Item 8 below.
GOODWILL AND OTHER INTANGIBLE ASSETS
At December 31, 2009, we had recognized goodwill of $610.0 million, as compared to $722.0 million at December 31, 2008. The goodwill recorded in connection with acquisitions represents the excess of the purchase price over the estimated fair value of the net assets acquired. Goodwill and other intangible assets with indefinite lives are not amortized but instead are periodically tested for impairment. Management evaluates intangible assets with indefinite lives on an annual basis as of December 31. Additionally, we perform impairment evaluations on an interim basis when events or circumstances indicate impairment potentially exists. A significant amount of judgment is involved in determining if an indicator of impairment has occurred. Such indicators may include, among others, a significant decline in our expected future cash flows; a sustained, significant decline in our stock price and market capitalization; a significant adverse change in legal factors or in the business climate; adverse action or assessment by a regulator; and unanticipated competition.
73
Table of Contents
The goodwill impairment test involves a two-step process. The first step compares the fair value of a reporting unit (e.g. Retail Brokerage and Community Banking) to its carrying value. If the reporting unit’s fair value is less than its carrying value, the Company would be required to proceed to the second step. In the second step the Company calculates the implied fair value of the reporting unit’s goodwill. The implied fair value of goodwill is determined in the same manner as goodwill recognized in a business combination. The estimated fair value of the Company is allocated to all of the Company’s assets and liabilities, including any unrecognized identifiable intangible assets, as if the Company had been acquired in a business combination and the estimated fair value of the reporting unit is the price paid to acquire it. The allocation process is performed only for purposes of determining the amount of goodwill impairment. No assets or liabilities are written up or down, nor are any additional unrecognized identifiable intangible assets recorded as a part of this process. Any excess of the estimated purchase price over the fair value of the reporting unit’s net assets represents the implied fair value of goodwill. If the carrying amount of the goodwill is greater than the implied fair value of that goodwill, an impairment loss would be recognized as a charge to earnings in an amount equal to that excess.
Substantially all of the Company’s goodwill is associated with our community banking operations. Due to a further decline in the Company’s market capitalization below book value of equity and continued weakness in the banking industry, the Company performed a goodwill impairment evaluation of the Community Banking operating segment as of June 30, 2009. The Company engaged an independent valuation consultant to assist us in determining whether and to what extent our goodwill asset was impaired. We utilized a variety of valuation techniques to analyze and measure the estimated fair value of reporting units under both the income and market valuation approach. Under the income approach, the fair value of the reporting unit is determined by projecting future earnings for five years, utilizing a terminal value based on expected future growth rates, and applying a discount rate reflective of current market conditions. The estimation of forecasted earnings uses management’s best estimate of economic and market conditions over the projected periods and considers estimated growth rates in loans and deposits and future expected changes in net interest margins. Various market-based valuation approaches are utilized and include applying market price to earnings, core deposit premium, and tangible book value multiples as observed from relevant, comparable peer companies of the reporting unit. We also valued the reporting unit by applying an estimated control premium to the market capitalization. Weightings are assigned to each of the aforementioned model results, judgmentally allocated based on the observability and reliability of the inputs, to arrive at a final fair value estimate of the reporting unit. The results of the Company’s and valuation specialist’s step one impairment test indicated that the reporting unit’s fair value was less than its carrying value. As a result, the Company performed a step two analysis.
The external valuation specialist assisted management’s analysis under step two of the goodwill impairment test. Under this approach, we calculated the fair value for the reporting unit’s assets and liabilities, as well as its unrecognized identifiable intangible assets, such as the core deposit intangible and trade name. Fair value adjustments to items on the balance sheet primarily related to investment securities held to maturity, loans, other real estate owned, Visa Class B common stock, deferred taxes, deposits, term debt, and junior subordinated debentures carried at amortized cost. The external valuation specialist assisted management to estimate the fair value of our unrecognized identifiable assets, such as the core deposit intangible and trade name.
The most significant fair value adjustment made in this analysis was to adjust the carrying value of the Company’s loans receivable portfolio to fair value. The fair value of the Company’s loan receivable portfolio at June 30, 2009 was estimated in a manner similar to methodology utilized as part of the December 31, 2008 goodwill impairment evaluation. As part of the December 31, 2008 loan valuation, the loan portfolio was stratified into sixty-eight loan pools that shared common characteristics, namely loan type, payment terms, and whether the loans were performing or non-performing. Each loan pool was discounted at a rate that considers current market interest rates, credit risk, and assumed liquidity premiums required based upon the nature of the underlying pool. Due to the disruption in the financial markets experienced during 2008 and continuing through 2009, the liquidity premium reflects the reduction in demand in the secondary markets for all grades of non-conforming credit, including those that are performing. Liquidity premiums for individual loan categories generally ranged from 4.6% for performing loans to 30% for construction and non-performing loans. At December 31, 2008, the fair value of the overall loan portfolio was calculated to be at a 9% discount relative to its book value. The composition of the loan portfolio at June 30, 2009, including loan type and performance indicators, was substantially similar to the loan portfolio at December 31, 2008. At June 30, 2009, the fair value of the loan portfolio was estimated to be at a 12% discount relative to its carrying value.
74
Table of Contents
Umpqua Holdings Corporation
The additional discount is primarily attributed to the additional liquidity premium required as of the measurement date associated with the Company’s concentration of commercial real estate loans.
Other significant fair value adjustments utilized in this goodwill impairment analysis included the value of the core deposit intangible asset which was calculated as 0.53% of core deposits, and includes all deposits except certificates of deposit. The carrying value of other real estate owned was discounted by 25%, representing a liquidity adjustment given the current market conditions. The fair value of our trade name, which represents the competitive advantage associated with our brand recognition and ability to attract and retain relationships, was estimated to be $19.3 million. The fair value of our junior subordinated debentures carried at amortized cost was determined in a manner and utilized inputs, primarily the credit risk adjusted spread, consistent with our methodology for determining the fair value of junior subordinated debentures recorded at fair value. Information relating to our methodologies for estimating the fair value of financial instruments that were adjusted to fair value as part of this analysis, including the Visa Class B common stock, deposits, term debt, and junior subordinated debentures, is included in Note 22 of the Notes to Consolidated Financial Statements.
Based on the results of the step two analysis, the Company determined that the implied fair value of the goodwill was less than its carrying amount on the Company’s balance sheet, and as a result, we recognized a goodwill impairment loss of $112.0 million in the second quarter of 2009. This write-down of goodwill is a non-cash charge that does not affect the Company’s or the Bank’s liquidity or operations. In addition, because goodwill is excluded in the calculation of regulatory capital, the Company’s “well-capitalized” regulatory capital ratios are not affected by this charge.
The Company also conducted its annual evaluation of goodwill for impairment as of December 31, 2009. In the first step of the goodwill impairment test the Company determined that the fair value of the Community Banking reporting unit exceeded its carrying amount. This determination is consistent with the events occurring after the Company recognized the $112.0 million impairment of goodwill second quarter of 2009. First, the market capitalization and estimated fair value of the Company increased significantly subsequent to the recognition of the impairment charge as the fair value of the Company’s stock increased 73% from June 30, 2009 to December 31, 2009. Secondly, the Company’s successful public common stock offering in the third quarter of 2009 diluted the carrying value of the reporting book equity on a per share basis, against which the fair value of the reporting unit is measured. The significant assumptions and methodology utilized to test for goodwill impairment as of December 31, 2009 were consistent with the impairment evaluations performed throughout the year.
If the Company’s common stock price declines further or continues to trade below book value per common share, or should general economic conditions deteriorate further or remain depressed for a prolonged period of time, particularly in the financial industry, the Company may be required to recognize additional impairment of all, or some portion of, its goodwill. It is possible that changes in circumstances, existing at the measurement date or at other times in the future, or changes in the numerous estimates associated with management’s judgments, assumptions and estimates made in assessing the fair value of our goodwill, such as valuation multiples, discount rates, or projected earnings, could result in an impairment charge in future periods. Additional impairment charges, if any, may be material to the Company’s results of operations and financial position. However, any potential future impairment charge will have no effect on the Company’s or the Bank’s cash balances, liquidity, or regulatory capital ratios.
The inputs management utilizes to estimate the fair value of a reporting unit in step one of the goodwill impairment test, and estimating the fair values of the underlying assets and liabilities of a reporting unit in the second step of the goodwill impairment test, require management to make significant judgments, assumptions and estimates where observable market may not readily exist. Such inputs include, but are not limited to, trading multiples from comparable transactions, control premiums, the value that may arise from synergies and other benefits that would accrue from control over an entity, and the appropriate rates to discount projected cash flows. Additionally, there may be limited current market inputs to value certain assets or liabilities, particularly loans and junior subordinated debentures. These valuation inputs are considered to be Level 3 inputs.
Management will continue to monitor the relationship of the Company’s market capitalization to both its book value and tangible book value, which management attributes to both financial services industry-wide and Company specific factors, and to evaluate the carrying value of goodwill and other intangible assets.
75
Table of Contents
As a result of the December 31, 2008 goodwill impairment evaluation related to the Retail Brokerage reporting segment, management determined that there was a $1.0 million impairment following the departure of certain Umpqua Investments financial advisors. The valuation of the impairment at the Retail Brokerage operating segment was determined using an income approach by discounting cash flows of forecasted earnings. The key assumptions used to estimate the fair value of each reporting unit include earnings forecasts for five years, a terminal value based on expected future growth rates, and a discount rate reflective of current market conditions. The Company evaluated the Retail Brokerage reporting segment’s goodwill for impairment as of December 31, 2009. The first step of the goodwill impairment test indicated that the reporting unit’s fair value exceeded its carrying value. As of December 31, 2009, the ending carrying value of the Retail Brokerage segment’s goodwill was $2.7 million.
At December 31, 2009, we had other intangible assets of $29.6 million, as compared to $35.8 million at December 31, 2008. As part of a business acquisition, a portion of the purchase price is allocated to the other value of intangible assets such as the merchant servicing portfolio or core deposits, which includes all deposits except certificates of deposit. The value of these other intangible assets were determined by a third party based on the net present value of future cash flows for the merchant servicing portfolio and an analysis of the cost differential between the core deposits and alternative funding sources for the core deposit intangible. Intangible assets with definite useful lives are amortized to their estimated residual values over their respective estimated useful lives, and are also reviewed for impairment. We amortize other intangible assets on an accelerated or straight-line basis over an estimated ten to fifteen year life. In the fourth quarter of 2009, the Company recognized an $804,000 impairment related to the merchant servicing portfolio obtained through the North Bay acquisition. The remaining decrease in other intangible assets resulted from scheduled amortization. No other impairment losses were recognized in connection with other intangible assets since their initial recognition.
Additional information regarding our accounting for goodwill and other intangible assets is included in Notes 1, 2 and 7 of the Notes to Consolidated Financial Statements in Item 8 below.
DEPOSITS
Total deposits were $7.4 billion at December 31, 2009, an increase of $851.5 million, or 12.9%, as compared to year-end 2008. Excluding the deposits acquired through the FDIC-assisted purchase and assumption of the Bank of Clark County, the organic deposit growth rate was 10.4%. Of the total change in deposit balances during the current year, deposits from consumers and businesses increased $909.7 million, partially offset by a decline in deposits from public entities of $58.2 million. Despite the increased competitive pressures to build deposits in light of the current recessionary economic climate, management attributes the ability to maintain our overall deposit base and grow certain lines of business to ongoing business development and marketing efforts in our service markets. Information on average deposit balances and average rates paid is included under the Net Interest Income section of this report. Additional information regarding interest bearing deposits is included in Note 12 of the Notes to Consolidated Financial Statements in Item 8 below.
The following table presents the deposit balances by major category as of December 31:
Deposits
As of December 31,
(dollars in thousands)
| 2009 | 2008 | |||||||||||
| Amount | Percentage | Amount | Percentage | |||||||||
| Noninterest bearing |
$ | 1,398,332 | 19 | % | $ | 1,254,079 | 19 | % | ||||
| Interest bearing demand |
872,184 | 12 | % | 752,931 | 11 | % | ||||||
| Savings and money market |
2,813,805 | 37 | % | 2,335,158 | 36 | % | ||||||
| Time, $100,000 or greater |
1,603,410 | 22 | % | 1,311,207 | 20 | % | ||||||
| Time, less than $100,000 |
752,703 | 10 | % | 935,560 | 14 | % | ||||||
| Total |
$ | 7,440,434 | 100 | % | $ | 6,588,935 | 100 | % | ||||
76
Table of Contents
Umpqua Holdings Corporation
The following table presents the scheduled maturities of time deposits of $100,000 and greater as of December 31, 2009:
Maturities of Time Deposits of $100,000 and Greater
| (in thousands)
|
|||
| Three months or less |
$ | 560,056 | |
| Over three months through six months |
374,227 | ||
| Over six months through twelve months |
535,794 | ||
| Over twelve months |
133,333 | ||
| Time, $100,000 and over |
$ | 1,603,410 | |
On January 16, 2009, the Washington Department of Financial Institutions closed the Bank of Clark County, Vancouver, Washington, and appointed the Federal Deposit Insurance Corporation (“FDIC”) as its receiver. The FDIC entered into a purchase and assumption agreement with Umpqua Bank to assume certain assets and the insured non-brokered deposit balances, which totaled $183.9 million, at no premium. Additional information regarding this transaction is included in Note 2 of the Notes to Consolidated Financial Statements.
The Company has an agreement with Promontory Interfinancial Network LLC (“Promontory”) that makes it possible to provide FDIC deposit insurance to balances in excess of current deposit insurance limits. Promontory’s Certificate of Deposit Account Registry Service (“CDARS”) uses a deposit-matching program to exchange Bank deposits in excess of the current deposit insurance limits for excess balances at other participating banks, on a dollar-for-dollar basis, that would be fully insured at the Bank. This product is designed to enhance our ability to attract and retain customers and increase deposits, by providing additional FDIC coverage to customers. CDARS deposits can be reciprocal or one-way. All of the Bank’s CDARS deposits are reciprocal. At December 31, 2009 and December 31, 2008, the Company’s CDARS balances totaled $290.3 million and $345.6 million, respectively. Of these totals, at December 31, 2009 and December 31, 2008, $245.6 million and $78.9 million, respectively, represented time deposits equal to or greater than $100,000 but were fully insured under current deposit insurance limits.
BORROWINGS
At December 31, 2009, the Bank had outstanding $45.2 million of securities sold under agreements to repurchase and no outstanding federal funds purchased balances. Additional information regarding securities sold under agreements to repurchase and federal funds purchased is provided in Notes 13 and 14 of Notes to Consolidated Financial Statements in Item 8 below.
At December 31, 2009, the Bank had outstanding term debt of $76.3 million primarily with the Federal Home Loan Bank (“FHLB”). Term debt outstanding as of December 31, 2009 decreased $130.3 million since December 31, 2008 primarily as a result of the repayment of FHLB borrowings. The overall decrease in borrowings is largely attributable to the enhanced liquidity and growth in deposits in the current year. Advances from the FHLB amounted to $75.8 million of the total term debt and are secured by investment securities and residential mortgage loans. Of the $75.8 million, $75.0 million of the FHLB advances outstanding at December 31, 2009 had a fixed interest rate of 3.35%, and the remaining balances had fixed interest rates ranging from 6.08% to 7.44%. Of the total term debt outstanding, $75.0 million, or 99%, mature prior to December 31, 2010, and the remaining mature after December 31, 2011. Management expects continued use of FHLB advances as a source of short and long-term funding. Additional information regarding term debt is provided in Note 15 of Notes to Consolidated Financial Statements in Item 8 below.
JUNIOR SUBORDINATED DEBENTURES
We had junior subordinated debentures with carrying values of $188.9 million and $196.2 million, respectively, at December 31, 2009 and 2008.
At December 31, 2009, approximately $219.6 million, or 95% of the total issued amount, had interest rates that are adjustable on a quarterly basis based on a spread over three month LIBOR. Interest expense for junior subordinated debentures
77
Table of Contents
decreased in 2009 as compared to 2008 and in 2008 as compared to 2007, primarily resulting from decreases in short-term market interest rates and LIBOR. Although increases in short-term market interest rates will increase the interest expense for junior subordinated debentures, we believe that other attributes of our balance sheet will serve to mitigate the impact to net interest income on a consolidated basis.
On January 1, 2007, the Company elected the fair value measurement option for certain pre-existing junior subordinated debentures of $97.9 million (the Umpqua Statutory Trusts). The remaining junior subordinated debentures as of the adoption date were acquired through business combinations and were measured at fair value at the time of acquisition. In 2007, the Company issued two series of trust preferred securities and elected to measure each instrument at fair value. Accounting for junior subordinated debentures originally issued by the Company at fair value enables us to more closely align our financial performance with the economic value of those liabilities. Additionally, we believe it improves our ability to manage the market and interest rate risks associated with the junior subordinated debentures. The junior subordinated debentures measured at fair value and amortized cost have been presented as separate line items on the balance sheet. The ending carrying (fair) value of the junior subordinated debentures measured at fair value represents the estimated amount that would be paid to transfer these liabilities in an orderly transaction amongst market participants under current market conditions as of the measurement date.
Prior to the second quarter of 2009, we estimated the fair value of junior subordinated debentures using an internal discounted cash flow model. The future cash flows of these instruments were extended to the next available redemption date or maturity date as appropriate based upon the spreads of recent issuances or quotes from brokers for comparable bank holding companies, as available, compared to the contractual spread of each junior subordinated debenture measured at fair value. The significant inputs utilized in the estimation of fair value of these instruments is the credit risk adjusted spread and three month LIBOR. The credit risk adjusted spread represents the nonperformance risk of the liability, contemplating both the inherent risk of the obligation and the Company’s entity-specific credit risk. Generally, an increase in the credit risk adjusted spread and/or a decrease in the three month LIBOR will result in positive fair value adjustments. Conversely, a decrease in the credit risk adjusted spread and/or an increase in the three month LIBOR will result in negative fair value adjustments. For additional assurance, we obtained valuations from a third party pricing service to validate the results of our model.
Prior to the third quarter of 2008, we utilized a credit risk adjusted spread that was based upon recent issuances or quotes from brokers for comparable bank holding companies as of the date of valuation, and we considered this to be a Level 2 input. Due to the increasing credit concerns in the capital markets and inactivity in the trust preferred markets that have limited the observability of credit risk adjusted market spreads, we classified this as a Level 3 fair value measure in the third quarter of 2008.
In the second quarter of 2009, due to continued inactivity in the junior subordinated debenture and related markets, and clarified guidance relating to the determination of fair value when the volume and level of activity for an asset or liability have significantly decreased or where transactions are not orderly, management utilized a third-party pricing service to estimate the fair value of these liabilities. The pricing service utilizes an income approach valuation technique, specifically an option-adjusted spread (“OAS”) valuation model. This OAS model values the cash flows over multiple interest rate scenarios and discounts these cash flows using a credit risk adjustment spread over the three month LIBOR swap curve. The OAS model currently being utilized is more sophisticated and computationally intensive than the model previously used; however, the models react similarly to changes in the underlying inputs and the results are considered comparable. With the assistance of a third-party pricing service, we determined that a credit risk adjusted spread of 675 basis points is representative of the nonperformance risk premium a market participant would require under current market conditions as of December 31, 2009. Generally, an increase in the credit risk adjusted spread and/or a decrease in the swap curve will result in positive fair value adjustments. Conversely, a decrease in the credit risk adjusted spread and/or an increase in the swap curve will result in negative fair value adjustments.
We recorded gains of $6.5 million, $38.9 million and $4.9 million for the years ended December 31, 2009, 2008 and 2007, respectively, resulting from the change in fair value of the junior subordinated debentures recorded at fair value. The change in fair value of the junior subordinated debentures carried at fair value during these periods primarily result from the widening of the credit risk adjusted spread. Management believes that the credit risk adjusted spread being utilized is indicative of the
78
Table of Contents
Umpqua Holdings Corporation
nonperformance risk premium a willing market participant would require under current market conditions, that is, the inactive market. Future contractions in the credit risk adjusted spread relative to the spread currently utilized to measure the Company’s junior subordinated debentures at fair value as of December 31, 2009, or the passage of time, will result in negative fair value adjustments. Generally, an increase in the credit risk adjusted spread and/or a decrease in the three month LIBOR swap curve will result in positive fair value adjustments. Conversely, a decrease in the credit risk adjusted spread and/or an increase in the three month LIBOR swap curve will result in negative fair value adjustments. In management’s estimation, the change in fair value of the junior subordinated debentures during the periods represent changes in the market’s nonperformance risk expectations and pricing of this type of debt, and not as a result of changes to our entity-specific credit risk.
Additional information regarding junior subordinated debentures measured at fair value is included in Note 22 of the Notes to Consolidated Financial Statements in Item 8 below.
All of the debentures issued to the Trusts, less the common stock of the Trusts, qualified as Tier 1 capital as of December 31, 2009, under guidance issued by the Board of Governors of the Federal Reserve System. Additional information regarding the terms of the junior subordinated debentures, including maturity/redemption dates, interest rates and the fair value election, is included in Note 16 of the Notes to Consolidated Financial Statements in Item 8 below.
LIQUIDITY AND CASH FLOW
The principal objective of our liquidity management program is to maintain the Bank’s ability to meet the day-to-day cash flow requirements of our customers who either wish to withdraw funds or to draw upon credit facilities to meet their cash needs.
We monitor the sources and uses of funds on a daily basis to maintain an acceptable liquidity position. One source of funds includes public deposits. Individual state laws require banks to collateralize public deposits, typically as a percentage of their public deposit balance in excess of FDIC insurance. The amount of collateral required varies by state and may also vary by institution within each state, depending on the individual state’s risk assessment of depository institutions. Changes in the pledging requirements for uninsured public deposits may require pledging additional collateral to secure these deposits, drawing on other sources of funds to finance the purchase of assets that would be available to be pledged to satisfy a pledging requirement, or could lead to the withdrawal of certain public deposits from the Bank. In addition to liquidity from core deposits and the repayments and maturities of loans and investment securities, the Bank can utilize established uncommitted federal funds lines of credit, sell securities under agreements to repurchase, borrow on a secured basis from the FHLB or issue brokered certificates of deposit.
The Bank had available lines of credit with the FHLB totaling $2.0 billion at December 31, 2009 subject to certain collateral requirements, namely the amount of pledged loans and investment securities. The Bank had uncommitted federal funds line of credit agreements with additional financial institutions totaling $100.0 million at December 31, 2009. Availability of the lines is subject to federal funds balances available for loan and continued borrower eligibility. These lines are intended to support short-term liquidity needs, and the agreements may restrict the consecutive day usage.
The Company is a separate entity from the Bank and must provide for its own liquidity. Substantially all of the Company’s revenues are obtained from dividends declared and paid by the Bank. In 2009, the Bank paid the Company $18.0 million in dividends to fund regular operations. There are statutory and regulatory provisions that could limit the ability of the Bank to pay dividends to the Company. We believe that such restrictions will not have an adverse impact on the ability of the Company to fund its quarterly cash dividend distributions to shareholders, when approved, and meet its ongoing cash obligations, which consist principally of debt service on the $230.1 million (issued amount) of outstanding junior subordinated debentures. As of December 31, 2009, the Company did not have any borrowing arrangements of its own.
Additional discussion related to liquidity related risks given the current economic climate is provided in Item 1A Risk Factors above.
As disclosed in the Consolidated Statements of Cash Flows in Item 8 of this report, net cash provided by operating activities was $93.2 million during 2009. The difference between cash provided by operating activities and net loss largely consisted of
79
Table of Contents
non-cash items including a $209.1 million provision for loan and lease losses and a goodwill impairment charge of $112.0 million. Net cash of $449.2 million used in investing activities consisted principally of $1.0 billion of purchases of investment securities available for sale, net loan growth of $108.7 million and $11.2 million of purchases of premises and equipment, partially offset by proceeds from investment securities of $464.4 million, cash acquired in the Bank of Clark County merger of $178.9 million and proceeds from the sale of other real estate owned of $26.2 million. The $756.7 million of cash provided by financing activities primarily consisted of $667.6 million increase in net deposits and $245.7 in net proceeds from the issuance of common stock, partially offset by $130.2 million repayment of term debt, $13.4 million of dividends paid on common stock and $10.7 million of dividends paid on preferred stock.
Although we expect the Bank’s and the Company’s liquidity positions to remain satisfactory during 2010, there is significant competition for bank deposits. It is possible that our deposit growth for 2010 may not be maintained at previous levels due to increased pricing pressure or, in order to generate deposit growth, our pricing may need to be adjusted in a manner that results in increased interest expense on deposits.
OFF-BALANCE-SHEET ARRANGEMENTS
Information regarding Off-Balance-Sheet Arrangements is included in Note 18 and Note 19 of the Notes to Consolidated Financial Statements in Item 8 below.
The following table presents a summary of significant contractual obligations extending beyond one year as of December 31, 2009 and maturing as indicated:
Future Contractual Obligations
As of December 31, 2009
(in thousands)
| Less than 1 Year |
1 to 3 Years |
3 to 5 Years |
More than 5 Years |
Total | |||||||||||
| Deposits(1) |
$ | 7,228,864 | $ | 173,819 | $ | 35,906 | $ | 1,845 | $ | 7,440,434 | |||||
| Term debt |
75,000 | — | 715 | 505 | 76,220 | ||||||||||
| Junior subordinated debentures(2) |
— | — | — | 230,061 | 230,061 | ||||||||||
| Operating leases |
12,221 | 22,100 | 16,021 | 24,525 | 74,867 | ||||||||||
| Other long-term liabilities(3) |
3,579 | 3,874 | 3,274 | 36,160 | 46,887 | ||||||||||
| Total contractual obligations |
$ | 7,319,664 | $ | 199,793 | $ | 55,916 | $ | 293,096 | $ | 7,868,469 | |||||
| (1) | Deposits with indeterminate maturities, such as demand, savings and money market accounts, are reflected as obligations due in less that one year. |
| (2) | Represents the issued amount of all junior subordinated debentures. |
| (3) | Includes maximum payments related to employee benefit plans, assuming all future vesting conditions are met. Additional information about employee benefit plans is provided in Note 17 of the Notes to Consolidated Financial Statements in Item 8 below. |
The table above does not include interest payments or purchase accounting adjustments related to deposits, term debt or junior subordinated debentures.
As of December 31, 2009, the Company has a liability for unrecognized tax benefits relating to California tax incentives and temporary differences in the amount of $2.6 million, which includes accrued interest of $365,000. As the Company is not able to estimate the period in which this liability will be paid in the future, this amount is not included in the future contractual obligations table above.
80
Table of Contents
Umpqua Holdings Corporation
CONCENTRATIONS OF CREDIT RISK
Information regarding Concentrations of Credit Risk is included in Notes 3, 5, and 18 of the Notes to Consolidated Financial Statements.
CAPITAL RESOURCES
Shareholders’ equity at December 31, 2009 was $1.6 billion, an increase of $79.5 million, or 5%, from December 31, 2008. The increase in shareholders’ equity during 2009 was principally due to the $245.7 million in net proceeds from the Company’s public stock offering in August 2009, the net change in unrealized gains on investment securities available for sale of $9.2 million (net of tax), increases related to stock-based compensation of $2.2 million and the net change in unrealized loss on investment securities held to maturity of $1.7 million (net of tax), partially offset by a net loss of $153.4 million, common stock dividends of $14.7 million, and preferred stock dividends of $10.7 million.
The Federal Reserve Board has in place guidelines for risk-based capital requirements applicable to U.S. banks and bank/financial holding companies. These risk-based capital guidelines take into consideration risk factors, as defined by regulation, associated with various categories of assets, both on and off-balance sheet. Under the guidelines, capital strength is measured in two tiers, which are used in conjunction with risk-adjusted assets to determine the risk-based capital ratios. The guidelines require an 8% total risk-based capital ratio, of which 4% must be Tier I capital. Our consolidated Tier I capital, which consists of shareholders’ equity and qualifying trust-preferred securities, less other comprehensive income, goodwill, other intangible assets, disallowed servicing assets and disallowed deferred tax assets, totaled $1.1 billion at December 31, 2009. Tier II capital components include all, or a portion of, the allowance for loan and lease losses and the portion of trust preferred securities in excess of Tier I statutory limits. The total of Tier I capital plus Tier II capital components is referred to as Total Risk-Based Capital, and was $1.2 billion at December 31, 2009. The percentage ratios, as calculated under the guidelines, were 15.91% and 17.16% for Tier I and Total Risk-Based Capital, respectively, at December 31, 2009. The Tier 1 and Total Risk-Based Capital ratios at December 31, 2008 were 13.37% and 14.62%, respectively.
A minimum leverage ratio is required in addition to the risk-based capital standards and is defined as period-end shareholders’ equity and qualifying trust preferred securities, less other comprehensive income, goodwill and deposit-based intangibles, divided by average assets as adjusted for goodwill and other intangible assets. Although a minimum leverage ratio of 4% is required for the highest-rated financial holding companies that are not undertaking significant expansion programs, the Federal Reserve Board may require a financial holding company to maintain a leverage ratio greater than 4% if it is experiencing or anticipating significant growth or is operating with less than well-diversified risks in the opinion of the Federal Reserve Board. The Federal Reserve Board uses the leverage and risk-based capital ratios to assess capital adequacy of banks and financial holding companies. Our consolidated leverage ratios at December 31, 2009 and 2008 were 12.79%, and 12.38%, respectively. As of December 31, 2009, the most recent notification from the FDIC categorized the Bank as “well-capitalized” under the regulatory framework for prompt corrective action. There are no conditions or events since that notification that management believes have changed the Bank’s regulatory capital category.
During the year ended December 31, 2009, the Company contributed $80.0 million to the Bank to strengthen its capital position. At December 31, 2009, all three of the capital ratios of the Bank exceeded the minimum ratios required by federal regulation. Management monitors these ratios on a regular basis to ensure that the Bank remains within regulatory guidelines. Further information regarding the actual and required capital ratios is provided in Note 21 of the Notes to Consolidated Financial Statements in Item 8 below.
On November 14, 2008, we issued 214,181 shares of our Fixed Rate Cumulative Perpetual Preferred Stock, Series A, with an aggregate liquidation preference of $214.2 million, or $1,000 per share, to the United States Department of the Treasury (“U.S. Treasury”) pursuant to the TARP Capital Purchase Program (“CPP”). The preferred stock will bear cumulative dividends at a rate of 5% per annum for the first five years and 9% per annum thereafter, in each case, applied to the $1,000 per share liquidation preference, but will only be paid when, as and if declared by the Company’s Board of Directors out of funds legally available therefor. Dividend payments are payable quarterly in arrears on the 15th day of February, May, August and November of each year.
81
Table of Contents
In connection with the issuance and sale of the preferred stock , the Company entered into a Letter Agreement including the Securities Purchase Agreement—Standard Terms (the “Agreement”) with the U.S. Treasury. The Agreement contains certain limitations on the payment of quarterly cash dividends on the Company’s common stock in excess of $0.19 per share, and on the Company’s ability to repurchase its common stock. The preferred stock has no maturity date and ranks senior to our common stock with respect to the payment of dividends and distribution of amounts payable upon liquidation, dissolution and winding up of the Company. The preferred stock has no general voting or participation rights, and no sinking fund requirements. In the event dividends on the preferred stock are not paid full for six dividend periods, whether or not consecutive, the preferred stock holders will have the right to elect two directors. Additional information about preferred stock is included in Note 20 of the Notes to Consolidated Financial Statements in Item 8 below.
On August 13, 2009, the Company raised $258.7 million through a public offering by issuing 26,538,461 shares of the Company’s common stock, including 3,461,538 shares pursuant to the underwriters’ over-allotment option, at a share price of $9.75 per share. The net proceeds to the Company after deducting underwriting discounts and commissions and offering expenses were $245.7 million. The net proceeds from the offering qualify as Tier 1 capital and will be used for general corporate purposes, which include capital to support growth and acquisition opportunities and to position the Company for redemption of preferred stock and warrants issued to the U.S. Treasury under the CPP. In connection with the public offering, the number of shares of common stock underlying the warrant held by the U.S. Treasury was reduced by 50%, to 1,110,898 shares. In connection with the company’s public offering in February 2010, Umpqua repurchased the preferred stock. See Note 28 of the Notes to the Consolidated Financial Statement in Item 8 below.
During 2009, Umpqua’s Board of Directors declared a quarterly cash dividend of $0.05 per common share per quarter. These dividends were made pursuant to our existing dividend policy and in consideration of, among other things, earnings, regulatory capital levels, the overall payout ratio and expected asset growth. We expect that the dividend rate will be reassessed on a quarterly basis by the Board of Directors in accordance with the dividend policy. The payment of cash dividends is subject to regulatory limitations as described under the Supervision and Regulation section of Part I of this report.
There is no assurance that future cash dividends on common shares will be declared or increased. The following table presents cash dividends declared and dividend payout ratios (dividends declared per common share divided by basic earnings per common share) for the years ended December 31, 2009, 2008 and 2007:
Cash Dividends and Payout Ratios per Common Share
| 2009 | 2008 | 2007 | |||||||
| Dividend declared per common share |
$ | 0.20 | $ | 0.62 | $ | 0.74 | |||
| Dividend payout ratio |
-8% | 76% | 70% | ||||||
On April 21, 2009, the Company announced that the Board of Directors approved an extension to the expiration date of the common stock repurchase plan from June 30, 2009 to June 30, 2011. As of December 31, 2009, a total of 1.5 million shares remained available for repurchase. There were no shares repurchased in open market transactions during the fourth quarter of 2009. The timing and amount of future repurchases will depend upon the market price for our common stock, securities laws restricting repurchases, asset growth, earnings, our capital plan, and are subject to certain limitations resulting from the Company’s participation in the CPP. In addition, our stock plans provide that option and award holders may pay for the exercise price and tax withholdings in part or whole by tendering previously held shares.
82
Table of Contents
Umpqua Holdings Corporation
ITEM 7A. QUANTITATIVE AND QUALITATIVE DISCLOSURES ABOUT MARKET RISK
The absolute level and volatility of interest rates can have a significant impact on our profitability. The objective of interest rate risk management is to identify and manage the sensitivity of net interest income to changing interest rates to achieve our overall financial objectives. Based on economic conditions, asset quality and various other considerations, management establishes tolerance ranges for interest rate sensitivity and manages within these ranges. Net interest income and the fair value of financial instruments are greatly influenced by changes in the level of interest rates. We manage exposure to fluctuations in interest rates through policies that are established by the Asset/Liability Management Committee (“ALCO”). The ALCO meets monthly and has responsibility for developing asset/liability management policy, formulating and implementing strategies to improve balance sheet positioning and earnings and reviewing interest rate sensitivity. The Board of Directors’ Loan and Investment Committee provides oversight of the asset/liability management process, reviews the results of the interest rate risk analyses prepared for the ALCO and approves the asset/liability policy on an annual basis.
Management utilizes an interest rate simulation model to estimate the sensitivity of net interest income to changes in market interest rates. Such estimates are based upon a number of assumptions for each scenario, including the level of balance sheet growth, deposit repricing characteristics and the rate of prepayments. Interest rate sensitivity is a function of the repricing characteristics of our interest earnings assets and interest bearing liabilities. These repricing characteristics are the time frames within which the interest bearing assets and liabilities are subject to change in interest rates either at replacement, repricing or maturity during the life of the instruments. Interest rate sensitivity management focuses on the maturity structure of assets and liabilities and their repricing characteristics during periods of changes in market interest rates. Effective interest rate sensitivity management seeks to ensure that both assets and liabilities respond to changes in interest rates within an acceptable timeframe, thereby minimizing the impact of interest rate changes on net interest income. Interest rate sensitivity is measured as the difference between the volumes of assets and liabilities at a point in time that are subject to repricing at various time horizons: immediate to three months, four to twelve months, one to five years, over five years, and on a cumulative basis. The differences are known as interest sensitivity gaps. The table below sets forth interest sensitivity gaps for these different intervals as of December 31, 2009.
83
Table of Contents
Interest Sensitivity Gap
(dollars in thousands)
| By Repricing Interval | Non-Rate- Sensitive |
Total | |||||||||||||||||||
| 0-3 Months | 4-12 Months | 1-5 Years | Over 5 Years | ||||||||||||||||||
| ASSETS |
|||||||||||||||||||||
| Interest bearing deposits |
$ | 491,462 | $ | — | $ | — | $ | — | $ | — | $ | 491,462 | |||||||||
| Temporary Investments |
598 | — | — | — | — | 598 | |||||||||||||||
| Trading account assets |
2,273 | — | — | — | — | 2,273 | |||||||||||||||
| Securities available for sale |
258,188 | 570,273 | 795,469 | 113,966 | 57,720 | 1,795,616 | |||||||||||||||
| Securities held to maturity |
2,492 | 1,355 | 2,210 | 1 | 3 | 6,061 | |||||||||||||||
| Loans and loans held for sale |
2,055,446 | 1,023,790 | 2,692,027 | 280,053 | (18,334 | ) | 6,032,982 | ||||||||||||||
| Non-interest earning assets |
— | — | — | — | 1,052,380 | 1,052,380 | |||||||||||||||
| Total assets |
2,810,459 | 1,595,418 | 3,489,706 | 394,020 | 1,091,769 | $ | 9,381,372 | ||||||||||||||
| LIABILITIES AND SHAREHOLDERS’ EQUITY |
|||||||||||||||||||||
| Interest bearing demand deposits |
872,184 | — | — | — | — | $ | 872,184 | ||||||||||||||
| Savings and money-market deposits |
2,813,805 | — | — | — | — | 2,813,805 | |||||||||||||||
| Time deposits |
740,168 | 1,403,911 | 209,725 | 1,846 | 463 | 2,356,113 | |||||||||||||||
| Securities sold under agreements to repurchase |
45,180 | — | — | — | — | 45,180 | |||||||||||||||
| Term debt |
85 | 75,263 | 367 | 505 | 54 | 76,274 | |||||||||||||||
| Junior subordinated debentures |
171,238 | — | — | 10,465 | 7,151 | 188,854 | |||||||||||||||
| Non-interest bearing liabilities and shareholders’ equity |
— | — | — | — | 3,028,962 | 3,028,962 | |||||||||||||||
| Total liabilities and shareholders’ equity |
4,642,660 | 1,479,174 | 210,092 | 12,816 | 3,036,630 | $ | 9,381,372 | ||||||||||||||
| Interest rate sensitivity gap |
(1,832,201 | ) | 116,244 | 3,279,614 | 381,204 | (1,944,861 | ) | ||||||||||||||
| Cumulative interest rate sensitivity gap |
$ | (1,832,201 | ) | $ | (1,715,957 | ) | $ | 1,563,657 | $ | 1,944,861 | $ | — | |||||||||
| Cumulative gap as a % of earning assets |
-22.0% | -20.6% | 18.8% | 23.4% | |||||||||||||||||
Changes in the mix of earning assets or supporting liabilities can either increase or decrease the net interest margin without affecting interest rate sensitivity. In addition, the interest rate spread between an asset and its supporting liability can vary significantly, while the timing of repricing for both the asset and the liability remains the same, thus impacting net interest income. This characteristic is referred to as basis risk and generally relates to the possibility that the repricing characteristics of short-term assets tied to the prime rate are different from those of short-term funding sources such as certificates of deposit. Varying interest rate environments can create unexpected changes in prepayment levels of assets and liabilities that are not reflected in the interest rate sensitivity analysis. These prepayments may have a significant impact on our net interest margin. Because of these factors, an interest sensitivity gap analysis may not provide an accurate assessment of our exposure to changes in interest rates.
We utilize an interest rate simulation model to monitor and evaluate the impact of changing interest rates on net interest income. The estimated impact on our net interest income over a time horizon of one year as of December 31, 2009 is indicated in the table below. For the scenarios shown, the interest rate simulation assumes a parallel and sustained shift in market interest rates ratably over a twelve-month period and no change in the composition or size of the balance sheet. For example, the “up 200 basis points” scenario is based on a theoretical increase in market rates of 16.7 basis points per month for twelve months applied to the balance sheet of December 31 for each respective year.
84
Table of Contents
Umpqua Holdings Corporation
Interest Rate Simulation Impact on Net Interest Income
As of December 31,
(dollars in thousands)
| 2009 | 2008 | 2007 | ||||||||||||||||
| Increase (Decrease) in Net Interest Income from Base Scenario |
Percentage Change |
Increase (Decrease) in Net Interest Income from Base Scenario |
Percentage Change |
Increase (Decrease) in Net Interest Income from Base Scenario |
Percentage Change | |||||||||||||
| Up 200 basis points |
$ | (2,118 | ) | -0.6% | $ | (9,539 | ) | -3.6% | $ | (7,646 | ) | -2.7% | ||||||
| Up 100 basis points |
$ | (3,033 | ) | -0.9% | $ | (4,824 | ) | -1.8% | $ | (3,868 | ) | -1.4% | ||||||
| Down 100 basis points |
$ | (290 | ) | -0.1% | $ | 1,370 | 0.5% | $ | 4,622 | 1.6% | ||||||||
| Down 200 basis points |
$ | (7,609 | ) | -2.2% | $ | (2,304 | ) | -0.9% | $ | 5,211 | 1.8% | |||||||
At December 31, 2007, we believe our balance sheet was in a “liability-sensitive” position, as the repricing characteristics were such that an increase in market interest rates would have a negative effect on net interest income and a decrease in market interest rates would have positive effect on net interest income. As of December 31, 2008, we were “liability-sensitive” in three of four scenarios. In an increased market interest rate scenario, our liability sensitivity need increased from 2007. At December 31, 2009, we were “liability-sensitive” in an increased market interest rate scenario, and “asset-sensitive” in a decreased interest rate scenario. Some of the assumptions made in the simulation model may not materialize and unanticipated events and circumstances will occur. In addition, the simulation model does not take into account any future actions which we could undertake to mitigate an adverse impact due to changes in interest rates from those expected, in the actual level of market interest rates or competitive influences on our deposit base.
A second interest rate sensitivity measure we utilize is the quantification of market value changes for all financial assets and liabilities, given an increase or decrease in market interest rates. This approach provides a longer-term view of interest rate risk, capturing all future expected cash flows. Assets and liabilities with option characteristics are measured based on different interest rate path valuations using statistical rate simulation techniques.
The table below illustrates the effects of various market interest rate changes on the fair values of financial assets and liabilities (excluding mortgage servicing rights) as compared to the corresponding carrying values and fair values:
Interest Rate Simulation Impact on Fair Value of Financial Assets and Liabilities
As of December 31,
(dollars in thousands)
| 2009 | 2008 | |||||||||||
| Increase (Decrease) in Estimated Fair Value of Equity |
Percentage Change |
Increase (Decrease) in Estimated Fair Value of Equity |
Percentage Change | |||||||||
| Up 200 basis points |
$ | (93,095 | ) | -4.3% | $ | (155,229 | ) | -6.5% | ||||
| Up 100 basis points |
$ | (49,027 | ) | -2.3% | $ | (85,391 | ) | -3.6% | ||||
| Down 100 basis points |
$ | 19,874 | 0.9% | $ | 52,031 | 2.2% | ||||||
| Down 200 basis points |
$ | 6,007 | 0.3% | $ | 21,450 | 0.9% | ||||||
Consistent with the results in the interest rate simulation impact on net interest income, our overall sensitivity to market interest rate changes as of December 31, 2009 has decreased compared to December 31, 2008.
85
Table of Contents
IMPACT OF INFLATION AND CHANGING PRICES
A financial institution’s asset and liability structure is substantially different from that of an industrial firm in that primarily all assets and liabilities of a bank are monetary in nature, with relatively little investment in fixed assets or inventories. Inflation has an important impact on the growth of total assets and the resulting need to increase equity capital at higher than normal rates in order to maintain appropriate capital ratios. We believe that the impact of inflation on financial results depends on management’s ability to react to changes in interest rates and, by such reaction, reduce the inflationary impact on performance. We have an asset/liability management program which attempts to manage interest rate sensitivity. In addition, periodic reviews of banking services and products are conducted to adjust pricing in view of current and expected costs.
Our financial statements included in Item 8 below have been prepared in accordance with accounting principles generally accepted in the United States, which requires us to measure financial position and operating results principally in terms of historic dollars. Changes in the relative value of money due to inflation or recession are generally not considered. The primary effect of inflation on our results of operations is through increased operating costs, such as compensation, occupancy and business development expenses. In management’s opinion, changes in interest rates affect the financial condition of a financial institution to a far greater degree than changes in the rate of inflation. Although interest rates are greatly influenced by changes in the inflation rate, they do not necessarily change at the same rate or in the same magnitude as the inflation rate. Interest rates are highly sensitive to many factors that are beyond our control, including U.S. fiscal and monetary policy and general national and global economic conditions.
86
Table of Contents
Umpqua Holdings Corporation
ITEM 8. FINANCIAL STATEMENTS AND SUPPLEMENTARY DATA.
REPORT OF INDEPENDENT REGISTERED PUBLIC ACCOUNTING FIRM
To the Board of Directors and Shareholders
Umpqua Holdings Corporation and Subsidiaries
We have audited the accompanying consolidated balance sheets of Umpqua Holdings Corporation and Subsidiaries (the Company) as of December 31, 2009 and 2008, and the related consolidated statements of operations, changes in shareholders’ equity and comprehensive (loss) income, and cash flows for each of the years in the three-year period ended December 31, 2009. We also have audited the Company’s internal control over financial reporting as of December 31, 2009, based on criteria established in Internal Control—Integrated Framework issued by the Committee of Sponsoring Organizations of the Treadway Commission (COSO). The Company’s management is responsible for these financial statements, for maintaining effective internal control over financial reporting, and for its assessment of the effectiveness of internal control over financial reporting included in the accompanying Report of Management on Internal Control over Financial Reporting. Our responsibility is to express an opinion on these financial statements and an opinion on the effectiveness of the Company’s internal control over financial reporting based on our audits.
We conducted our audits in accordance with auditing standards of the Public Company Accounting Oversight Board (United States). Those standards require that we plan and perform the audits to obtain reasonable assurance about whether the financial statements are free of material misstatement and whether effective internal control over financial reporting was maintained in all material respects. Our audit of the financial statements included examining, on a test basis, evidence supporting the amounts and disclosures in the financial statements, assessing the accounting principles used and significant estimates made by management, as well as evaluating the overall financial statement presentation. Our audit of internal control over financial reporting included obtaining an understanding of internal control over financial reporting, assessing the risk that a material weakness exists, and testing and evaluating the design and operating effectiveness of internal control based on the assessed risks. Our audits also included performing such other procedures as we considered necessary in the circumstances. We believe that our audits provide a reasonable basis for our opinions.
A company’s internal control over financial reporting is a process designed to provide reasonable assurance regarding the reliability of financial reporting and the preparation of financial statements for external purposes in accordance with generally accepted accounting principles. A company’s internal control over financial reporting includes those policies and procedures that (1) pertain to the maintenance of records that, in reasonable detail, accurately and fairly reflect the transactions and dispositions of the assets of the company; (2) provide reasonable assurance that transactions are recorded as necessary to permit preparation of financial statements in accordance with generally accepted accounting principles, and that receipts and expenditures of the company are being made only in accordance with authorizations of management and directors of the company; and (3) provide reasonable assurance regarding prevention or timely detection of unauthorized acquisition, use, or disposition of the company’s assets that could have a material effect on the financial statements.
Because of its inherent limitations, internal control over financial reporting may not prevent or detect misstatements. Also, projections of any evaluation of effectiveness to future periods are subject to the risk that controls may become inadequate because of changes in conditions, or that the degree of compliance with the policies or procedures may deteriorate.
In our opinion, the consolidated financial statements referred to above present fairly, in all material respects, the consolidated financial position of Umpqua Holdings Corporation and Subsidiaries as of December 31, 2009 and 2008, and the results of their operations and their cash flows for each of the years in the three-year period ended December 31, 2009, in conformity with accounting principles generally accepted in the United States of America. Also in our opinion, Umpqua Holdings Corporation maintained, in all material respects, effective internal control over financial reporting as of December 31, 2009 based on criteria established in Internal Control—Integrated Framework issued by the Committee of Sponsoring Organizations of the Treadway Commission (COSO).

Portland, Oregon
February 19, 2010
87
Table of Contents
UMPQUA HOLDINGS CORPORATION AND SUBSIDIARIES
CONSOLIDATED BALANCE SHEETS
December 31, 2009 and 2008
(in thousands, except shares)
| 2009 | 2008 | |||||||
| ASSETS |
||||||||
| Cash and due from banks |
$ | 113,353 | $ | 139,909 | ||||
| Interest bearing deposits |
491,462 | 8,155 | ||||||
| Temporary investments |
598 | 56,612 | ||||||
| Total cash and cash equivalents |
605,413 | 204,676 | ||||||
| Investment securities |
||||||||
| Trading |
2,273 | 1,987 | ||||||
| Available for sale, at fair value |
1,795,616 | 1,238,712 | ||||||
| Held to maturity, at amortized cost |
6,061 | 15,812 | ||||||
| Loans held for sale |
33,715 | 22,355 | ||||||
| Loans and leases |
5,999,267 | 6,131,374 | ||||||
| Allowance for loan and lease losses |
(107,657 | ) | (95,865 | ) | ||||
| Net loans and leases |
5,891,610 | 6,035,509 | ||||||
| Restricted equity securities |
15,211 | 16,491 | ||||||
| Premises and equipment, net |
103,266 | 104,694 | ||||||
| Goodwill and other intangible assets, net |
639,634 | 757,833 | ||||||
| Mortgage servicing rights, at fair value |
12,625 | 8,205 | ||||||
| Other real estate owned, net |
24,566 | 27,898 | ||||||
| Other assets |
251,382 | 163,378 | ||||||
| Total assets |
$ | 9,381,372 | $ | 8,597,550 | ||||
| LIABILITIES AND SHAREHOLDERS’ EQUITY |
||||||||
| Deposits |
||||||||
| Noninterest bearing |
$ | 1,398,332 | $ | 1,254,079 | ||||
| Interest bearing |
6,042,102 | 5,334,856 | ||||||
| Total deposits |
7,440,434 | 6,588,935 | ||||||
| Securities sold under agreements to repurchase |
45,180 | 47,588 | ||||||
| Term debt |
76,274 | 206,531 | ||||||
| Junior subordinated debentures, at fair value |
85,666 | 92,520 | ||||||
| Junior subordinated debentures, at amortized cost |
103,188 | 103,655 | ||||||
| Other liabilities |
64,113 | 71,313 | ||||||
| Total liabilities |
7,814,855 | 7,110,542 | ||||||
| COMMITMENTS AND CONTINGENCIES (NOTE 18) |
||||||||
| SHAREHOLDERS’ EQUITY |
||||||||
| Preferred stock, no par value, 2,000,000 shares authorized; Series A (liquidation preference $1,000 per share) issued and outstanding: 214,181 in 2009 and 2008 |
204,335 | 202,178 | ||||||
| Common stock, no par value, 100,000,000 shares authorized; issued and outstanding: 86,785,588 in 2009 and 60,146,400 in 2008 |
1,253,288 | 1,005,820 | ||||||
| Retained earnings |
83,939 | 264,938 | ||||||
| Accumulated other comprehensive income |
24,955 | 14,072 | ||||||
| Total shareholders’ equity |
1,566,517 | 1,487,008 | ||||||
| Total liabilities and shareholders’ equity |
$ | 9,381,372 | $ | 8,597,550 | ||||
See notes to consolidated financial statements
88
Table of Contents
Umpqua Holdings Corporation
UMPQUA HOLDINGS CORPORATION AND SUBSIDIARIES
CONSOLIDATED STATEMENTS OF OPERATIONS
For the Years Ended December 31, 2009, 2008 and 2007
(in thousands, except per share amounts)
| 2009 | 2008 | 2007 | ||||||||||
| INTEREST INCOME |
||||||||||||
| Interest and fees on loans |
$355,195 | $ | 393,927 | $ | 443,939 | |||||||
| Interest and dividends on investment securities |
||||||||||||
| Taxable |
60,195 | 41,189 | 34,891 | |||||||||
| Exempt from federal income tax |
7,794 | 6,653 | 5,822 | |||||||||
| Dividends |
22 | 334 | 325 | |||||||||
| Interest on temporary investments and interest bearing deposits |
526 | 443 | 3,415 | |||||||||
| Total interest income |
423,732 | 442,546 | 488,392 | |||||||||
| INTEREST EXPENSE |
||||||||||||
| Interest on deposits |
88,742 | 129,370 | 180,840 | |||||||||
| Interest on securities sold under agreements to repurchase and federal funds purchased |
680 | 2,220 | 2,135 | |||||||||
| Interest on term debt |
4,576 | 6,994 | 2,642 | |||||||||
| Interest on junior subordinated debentures |
9,026 | 13,655 | 16,821 | |||||||||
| Total interest expense |
103,024 | 152,239 | 202,438 | |||||||||
| Net interest income |
320,708 | 290,307 | 285,954 | |||||||||
| PROVISION FOR LOAN AND LEASE LOSSES |
209,124 | 107,678 | 41,730 | |||||||||
| Net interest income after provision for loan and lease losses |
111,584 | 182,629 | 244,224 | |||||||||
| NON-INTEREST INCOME |
||||||||||||
| Service charges on deposit accounts |
32,957 | 34,775 | 32,126 | |||||||||
| Brokerage commissions and fees |
7,597 | 8,948 | 10,038 | |||||||||
| Mortgage banking revenue, net |
18,688 | 2,436 | 7,791 | |||||||||
| (Loss) gain on investment securities, net |
||||||||||||
| Gain (loss) on sale of investment securities, net |
8,896 | 5,529 | (13 | ) | ||||||||
| Total other-than-temporary impairment losses |
(12,556 | ) | (4,180 | ) | — | |||||||
| Portion of other-than-temporary impairment losses recognized in other comprehensive income |
1,983 | — | — | |||||||||
| Total (loss) gain on investment securities, net |
(1,677 | ) | 1,349 | (13 | ) | |||||||
| Gain on junior subordinated debentures carried at fair value |
6,482 | 38,903 | 4,928 | |||||||||
| Proceeds from Visa mandatory partial redemption |
— | 12,633 | — | |||||||||
| Other income |
9,469 | 8,074 | 9,959 | |||||||||
| Total non-interest income |
73,516 | 107,118 | 64,829 | |||||||||
| NON-INTEREST EXPENSE |
||||||||||||
| Salaries and employee benefits |
126,850 | 114,600 | 112,864 | |||||||||
| Net occupancy and equipment |
39,673 | 37,047 | 35,785 | |||||||||
| Communications |
7,671 | 7,063 | 7,202 | |||||||||
| Marketing |
4,529 | 4,573 | 5,554 | |||||||||
| Services |
21,918 | 18,792 | 18,564 | |||||||||
| Supplies |
3,257 | 2,908 | 3,627 | |||||||||
| FDIC assessments |
15,825 | 5,182 | 1,223 | |||||||||
| Net loss on other real estate owned |
23,204 | 8,313 | 4 | |||||||||
| Intangible amortization and impairment |
6,165 | 5,857 | 6,094 | |||||||||
| Goodwill impairment |
111,952 | 982 | — | |||||||||
| Merger related expenses |
273 | — | 3,318 | |||||||||
| Visa litigation |
— | (5,183 | ) | 5,183 | ||||||||
| Other expenses |
18,086 | 16,436 | 14,704 | |||||||||
| Total non-interest expense |
379,403 | 216,570 | 214,122 | |||||||||
| (Loss) income before (benefit from) provision for income taxes |
(194,303 | ) | 73,177 | 94,931 | ||||||||
| (Benefit from) provision for income taxes |
(40,937 | ) | 22,133 | 31,663 | ||||||||
| Net (loss) income |
$ | (153,366 | ) | $ | 51,044 | $ | 63,268 | |||||
89
Table of Contents
UMPQUA HOLDINGS CORPORATION AND SUBSIDIARIES
CONSOLIDATED STATEMENTS OF OPERATIONS (Continued)
For the Years Ended December 31, 2009, 2008 and 2007
(in thousands, except per share amounts)
| 2009 | 2008 | 2007 | ||||||||
| Net (loss) income |
$ | (153,366) | $ | 51,044 | $ | 63,268 | ||||
| Preferred stock dividends |
12,866 | 1,620 | — | |||||||
| Dividends and undistributed earnings allocated to participating securities |
30 | 154 | 187 | |||||||
| Net (loss) earnings available to common shareholders |
$ | (166,262 | ) | $ | 49,270 | $ | 63,081 | |||
| (Loss) earnings per common share: |
||||||||||
| Basic |
$ | (2.36 | ) | $ | 0.82 | $ | 1.05 | |||
| Diluted |
$ | (2.36 | ) | $ | 0.82 | $ | 1.04 | |||
| Weighted average number of common shares outstanding: |
||||||||||
| Basic |
70,399 | 60,084 | 59,828 | |||||||
| Diluted |
70,399 | 60,424 | 60,404 | |||||||
See notes to consolidated financial statements
90
Table of Contents
Umpqua Holdings Corporation
UMPQUA HOLDINGS CORPORATION AND SUBSIDIARIES
CONSOLIDATED STATEMENTS OF CHANGES IN SHAREHOLDERS’ EQUITY
For the Years Ended December 31, 2009, 2008 and 2007
(in thousands, except shares)
| Preferred Stock |
Common Stock | Retained Earnings |
Accumulated Other Comprehensive (Loss) Income |
Total | ||||||||||||||||||
| Shares | Amount | |||||||||||||||||||||
| BALANCE AT JANUARY 1, 2007 |
$ | — | 58,080,171 | $ | 930,867 | $ | 234,783 | $ | (9,439 | ) | $ | 1,156,211 | ||||||||||
| Adoption of fair value option—junior subordinated debentures |
(2,064 | ) | (2,064 | ) | ||||||||||||||||||
| Net income |
63,268 | 63,268 | ||||||||||||||||||||
| Other comprehensive income, net of tax |
9,052 | 9,052 | ||||||||||||||||||||
| Comprehensive income |
$ | 72,320 | ||||||||||||||||||||
| Stock-based compensation |
2,684 | 2,684 | ||||||||||||||||||||
| Stock repurchased and retired |
(4,061,439 | ) | (96,291 | ) | (96,291 | ) | ||||||||||||||||
| Issuances of common stock under stock plans and related tax benefit |
797,856 | 9,408 | 9,408 | |||||||||||||||||||
| Stock issued in connection with acquisition |
5,163,573 | 142,112 | 142,112 | |||||||||||||||||||
| Cash dividends on common stock ($0.74 per share) |
(44,442 | ) | (44,442 | ) | ||||||||||||||||||
| Balance at December 31, 2007 |
$ | — | 59,980,161 | $ | 988,780 | $ | 251,545 | $ | (387 | ) | $ | 1,239,938 | ||||||||||
| BALANCE AT JANUARY 1, 2008 |
$ | — | 59,980,161 | $ | 988,780 | $ | 251,545 | $ | (387 | ) | $ | 1,239,938 | ||||||||||
| Net income |
51,044 | 51,044 | ||||||||||||||||||||
| Other comprehensive income, net of tax |
14,459 | 14,459 | ||||||||||||||||||||
| Comprehensive income |
$ | 65,503 | ||||||||||||||||||||
| Stock-based compensation |
3,893 | 3,893 | ||||||||||||||||||||
| Stock repurchased and retired |
(8,199 | ) | (129 | ) | (129 | ) | ||||||||||||||||
| Issuances of common stock under stock plans and related tax benefit |
174,438 | 1,022 | 1,022 | |||||||||||||||||||
| Issuance of preferred stock to U.S. Treasury |
201,927 | 201,927 | ||||||||||||||||||||
| Issuance of warrants to U.S. Treasury |
12,254 | 12,254 | ||||||||||||||||||||
| Amortization of discount on preferred stock |
251 | (251 | ) | — | ||||||||||||||||||
| Cash dividends on common stock ($0.62 per share) |
(37,400 | ) | (37,400 | ) | ||||||||||||||||||
| Balance at December 31, 2008 |
$ | 202,178 | 60,146,400 | $ | 1,005,820 | $ | 264,938 | $ | 14,072 | $ | 1,487,008 | |||||||||||
| BALANCE AT JANUARY 1, 2009 |
$ | 202,178 | 60,146,400 | $ | 1,005,820 | $ | 264,938 | $ | 14,072 | $ | 1,487,008 | |||||||||||
| Net loss |
(153,366 | ) | (153,366 | ) | ||||||||||||||||||
| Other comprehensive income, net of tax |
10,883 | 10,883 | ||||||||||||||||||||
| Comprehensive loss |
$ | (142,483 | ) | |||||||||||||||||||
| Issuance of common stock |
26,538,461 | 245,697 | 245,697 | |||||||||||||||||||
| Stock-based compensation |
2,188 | 2,188 | ||||||||||||||||||||
| Stock repurchased and retired |
(19,516 | ) | (174 | ) | (174 | ) | ||||||||||||||||
| Issuances of common stock under stock plans and related net tax deficiencies |
120,243 | (243 | ) | (243 | ) | |||||||||||||||||
| Amortization of discount on preferred stock |
2,157 | (2,157 | ) | — | ||||||||||||||||||
| Dividends declared on preferred stock |
(10,739 | ) | (10,739 | ) | ||||||||||||||||||
| Cash dividends on common stock ($0.20 per share) |
(14,737 | ) | (14,737 | ) | ||||||||||||||||||
| Balance at December 31, 2009 |
$ | 204,335 | 86,785,588 | $ | 1,253,288 | $ | 83,939 | $ | 24,955 | $ | 1,566,517 | |||||||||||
See notes to consolidated financial statements
91
Table of Contents
UMPQUA HOLDINGS CORPORATION AND SUBSIDIARIES
CONSOLIDATED STATEMENTS OF COMPREHENSIVE (LOSS) INCOME
For the Years Ended December 31, 2009, 2008 and 2007
(in thousands)
| 2009 | 2008 | 2007 | ||||||||||
| Net (loss) income |
$ | (153,366 | ) | $ | 51,044 | $ | 63,268 | |||||
| Available for sale securities: |
||||||||||||
| Unrealized gains arising during the year |
23,888 | 33,950 | 15,074 | |||||||||
| Reclassification adjustment for (gains), losses or impairments realized in net income, net of tax (expense of $3,431 and $2,156 in 2009 and 2008, respectively, and benefit of $5 in 2007) |
(5,147 | ) | (3,234 | ) | 8 | |||||||
| Income tax expense related to unrealized gains |
(9,555 | ) | (13,580 | ) | (6,030 | ) | ||||||
| Net change in unrealized gains |
9,186 | 17,136 | 9,052 | |||||||||
| Held to maturity securities: |
||||||||||||
| Unrealized losses on investment securities available for sale transferred to investment securities held to maturity (net of tax benefit of $2,988 in 2008) |
— | (4,482 | ) | — | ||||||||
| Reclassification adjustment for impairments realized in net income (net of tax benefit of $1,716 and $1,146 in 2009 and 2008, respectively) |
2,574 | 1,718 | — | |||||||||
| Amortization of unrealized losses on investment securities transferred to held to maturity (net of tax benefit of $70 and $58 for 2009 and 2008, respectively) |
103 | 87 | — | |||||||||
| Net change in unrealized losses on investment securities transferred to held to maturity |
2,677 | (2,677 | ) | — | ||||||||
| Unrealized losses related to factors other than credit (net of tax benefit of $1,080 in 2009) |
(1,620 | ) | — | — | ||||||||
| Reclassification adjustment for impairments realized in net income (net of tax benefit of $307 in 2009) |
460 | — | — | |||||||||
| Accretion of unrealized losses related to factors other than credit to investment securities held to maturity (net of tax benefit of $120 in 2009) |
180 | — | — | |||||||||
| Net change in unrealized losses related to factors other than credit |
(980 | ) | — | — | ||||||||
| Other comprehensive income, net of tax |
10,883 | 14,459 | 9,052 | |||||||||
| Comprehensive (loss) income |
$ | (142,483 | ) | $ | 65,503 | $ | 72,320 | |||||
See notes to consolidated financial statements
92
Table of Contents
Umpqua Holdings Corporation
UMPQUA HOLDINGS CORPORATION AND SUBSIDIARIES
CONSOLIDATED STATEMENTS OF CASH FLOWS
For the Years Ended December 31, 2009, 2008 and 2007
(in thousands)
| 2009 | 2008 | 2007 | ||||||||||
| CASH FLOWS FROM OPERATING ACTIVITIES: |
||||||||||||
| Net (loss) income |
$ | (153,366 | ) | $ | 51,044 | $ | 63,268 | |||||
| Adjustments to reconcile net (loss) income to net cash provided by operating activities: |
||||||||||||
| Restricted equity securities stock dividends |
— | (198 | ) | (234 | ) | |||||||
| Deferred income tax (benefit) expense |
(18,360 | ) | 9,889 | (5,080 | ) | |||||||
| Amortization (accretion) of investment premiums and discounts, net |
9,301 | 1,898 | (373 | ) | ||||||||
| (Gain) loss on sale of investment securities, net |
(8,896 | ) | (5,529 | ) | 13 | |||||||
| Other-than-temporary impairment on investment securities available for sale |
239 | 139 | — | |||||||||
| Other-than-temporary impairment on investment securities held to maturity |
10,334 | 4,041 | — | |||||||||
| Loss on sale of other real estate owned |
10,957 | 3,229 | 4 | |||||||||
| Valuation adjustment on other real estate owned |
12,247 | 5,084 | — | |||||||||
| Provision for loan and lease losses |
209,124 | 107,678 | 41,730 | |||||||||
| Depreciation, amortization and accretion |
11,649 | 7,085 | 12,765 | |||||||||
| Goodwill impairment |
111,952 | 982 | — | |||||||||
| Increase in mortgage servicing rights |
(7,570 | ) | (2,694 | ) | (892 | ) | ||||||
| Change in mortgage servicing rights carried at fair value |
3,150 | 4,577 | 756 | |||||||||
| Change in junior subordinated debentures carried at fair value |
(6,854 | ) | (39,166 | ) | (4,829 | ) | ||||||
| Stock-based compensation |
2,188 | 3,893 | 2,684 | |||||||||
| Net (increase) decrease in trading account assets |
(286 | ) | 850 | 1,367 | ||||||||
| Gain on sale of loans |
(6,649 | ) | (790 | ) | (1,406 | ) | ||||||
| Origination of loans held for sale |
(682,535 | ) | (250,439 | ) | (253,647 | ) | ||||||
| Proceeds from sales of loans held for sale |
677,598 | 241,481 | 256,830 | |||||||||
| Excess tax benefits from the exercise of stock options |
(1 | ) | (5 | ) | (289 | ) | ||||||
| Change in other assets and liabilities: |
||||||||||||
| Net (increase) decrease in other assets |
(72,570 | ) | 18,032 | (29,945 | ) | |||||||
| Net decrease in other liabilities |
(8,426 | ) | (14,535 | ) | (3,084 | ) | ||||||
| Net cash provided by operating activities |
93,226 | 146,546 | 79,638 | |||||||||
| CASH FLOWS FROM INVESTING ACTIVITIES: |
||||||||||||
| Purchases of investment securities available for sale |
(1,002,490 | ) | (811,868 | ) | (372,223 | ) | ||||||
| Proceeds from investment securities available for sale |
464,376 | 635,883 | 137,497 | |||||||||
| Proceeds from investment securities held to maturity |
2,282 | 1,705 | 2,737 | |||||||||
| Purchases of restricted equity securities |
— | (4,415 | ) | — | ||||||||
| Redemption of restricted equity securities |
1,280 | 3,395 | 5,603 | |||||||||
| Net loan and lease originations |
(121,257 | ) | (230,098 | ) | (315,860 | ) | ||||||
| Proceeds from sales of loans |
12,519 | 22,952 | 23,295 | |||||||||
| Proceeds from disposals of furniture and equipment |
270 | 357 | 5,813 | |||||||||
| Purchases of premises and equipment |
(11,239 | ) | (10,737 | ) | (9,560 | ) | ||||||
| Proceeds from sales of real estate owned |
26,167 | 15,319 | 17,906 | |||||||||
| Cash acquired in merger, net of cash consideration paid |
178,905 | — | 78,729 | |||||||||
| Net cash used by investing activities |
(449,187 | ) | (377,507 | ) | (426,063 | ) | ||||||
93
Table of Contents
UMPQUA HOLDINGS CORPORATION AND SUBSIDIARIES
CONSOLIDATED STATEMENTS OF CASH FLOWS (Continued)
For the Years Ended December 31, 2009, 2008 and 2007
(in thousands)
| 2009 | 2008 | 2007 | ||||||||||
| CASH FLOWS FROM FINANCING ACTIVITIES: |
||||||||||||
| Net increase (decrease) in deposit liabilities |
$ | 667,610 | $ | (437 | ) | $ | 286,315 | |||||
| Net (decrease) increase in federal funds purchased |
— | (69,500 | ) | 69,500 | ||||||||
| Net (decrease) increase in securities sold under agreements to repurchase |
(2,408 | ) | 11,294 | (11,691 | ) | |||||||
| Proceeds from term debt borrowings |
— | 345,000 | — | |||||||||
| Repayment of term debt |
(130,191 | ) | (212,284 | ) | (34,685 | ) | ||||||
| Proceeds from the issuance of junior subordinated debentures |
— | — | 60,000 | |||||||||
| Repayment of junior subordinated debentures |
— | — | (36,084 | ) | ||||||||
| Proceeds from issuance of preferred stock |
— | 201,927 | — | |||||||||
| Proceeds from issuance of warrants |
— | 12,254 | — | |||||||||
| Net proceeds from issuance of common stock |
245,697 | — | — | |||||||||
| Dividends paid on preferred stock |
(10,739 | ) | — | — | ||||||||
| Dividends paid on common stock |
(13,399 | ) | (45,796 | ) | (43,461 | ) | ||||||
| Excess tax benefits from the exercise of stock options |
1 | 5 | 289 | |||||||||
| Proceeds from stock options exercised |
301 | 1,233 | 8,955 | |||||||||
| Retirement of common stock |
(174 | ) | (129 | ) | (96,291 | ) | ||||||
| Net cash provided by financing activities |
756,698 | 243,567 | 202,847 | |||||||||
| Net increase (decrease) in cash and cash equivalents |
400,737 | 12,606 | (143,578 | ) | ||||||||
| Cash and cash equivalents, beginning of year |
204,676 | 192,070 | 335,648 | |||||||||
| Cash and cash equivalents, end of year |
$ | 605,413 | $ | 204,676 | $ | 192,070 | ||||||
| SUPPLEMENTAL DISCLOSURES OF CASH FLOW INFORMATION: |
||||||||||||
| Cash paid during the year for: |
||||||||||||
| Interest |
$ | 106,541 | $ | 156,686 | $ | 202,979 | ||||||
| Income taxes |
$ | 48 | $ | 6,092 | $ | 50,495 | ||||||
| SUPPLEMENTAL DISCLOSURE OF NONCASH INVESTING AND FINANCING ACTIVITIES: |
||||||||||||
| Change in unrealized gains on investment securities available for sale, net of taxes |
$ | 9,186 | $ | 17,136 | $ | 9,052 | ||||||
| Change in unrealized loss on investment securities transferred to held to maturity, net of taxes |
$ | 2,677 | $ | (2,677 | ) | $ | — | |||||
| Change in unrealized losses on investment securities held to maturity related to factors other than credit, net of taxes |
$ | (980 | ) | $ | — | $ | — | |||||
| Cash dividend declared and payable after year-end |
$ | 4,346 | $ | 3,016 | $ | 11,436 | ||||||
| Transfer of investment securities available for sale to held to maturity |
$ | — | $ | 12,580 | $ | — | ||||||
| Transfer of loans to other real estate owned |
$ | 50,914 | $ | 44,587 | $ | 24,853 | ||||||
| Receivable from sales of other real estate owned |
$ | 4,875 | $ | — | $ | — | ||||||
| Acquisitions: |
||||||||||||
| Common stock issued upon business combination |
$ | — | $ | — | $ | 135,182 | ||||||
| Assets acquired |
$ | 4,978 | $ | — | $ | 648,877 | ||||||
| Liabilities assumed |
$ | 183,883 | $ | — | $ | 585,494 | ||||||
See notes to consolidated financial statements
94
Table of Contents
Umpqua Holdings Corporation and Subsidiaries
NOTES TO CONSOLIDATED FINANCIAL STATEMENTS
Years Ended December 31, 2009, 2008 and 2007
NOTE 1. SIGNIFICANT ACCOUNTING POLICIES
Nature of Operations—Umpqua Holdings Corporation (the “Company”) is a financial holding company headquartered in Portland, Oregon, that is engaged primarily in the business of commercial and retail banking and the delivery of retail brokerage services. The Company provides a wide range of banking, asset management, mortgage banking and other financial services to corporate, institutional and individual customers through its wholly-owned banking subsidiary Umpqua Bank (the “Bank”). The Company engages in the retail brokerage business through its wholly-owned subsidiary Umpqua Investments, Inc. (“Umpqua Investments”). Prior to July 2009, Umpqua Investments was known as Strand, Atkinson, Williams & York, Inc. The Company and its subsidiaries are subject to regulation by certain federal and state agencies and undergo periodic examination by these regulatory agencies.
Basis of Financial Statement Presentation—The consolidated financial statements have been prepared in accordance with accounting principles generally accepted in the United States and with prevailing practices within the banking and securities industries. In preparing such financial statements, management is required to make certain estimates and judgments that affect the reported amounts of assets and liabilities and disclosure of contingent assets and liabilities as of the date of the balance sheet and the reported amounts of revenues and expenses for the reporting period. Actual results could differ significantly from those estimates. Material estimates that are particularly susceptible to significant change relate to the determination of the allowance for loan and lease losses, the valuation of mortgage servicing rights, the fair value of junior subordinated debentures and the valuation of goodwill and other intangible assets.
Consolidation—The accompanying consolidated financial statements include the accounts of the Company, the Bank and Umpqua Investments. All significant intercompany balances and transactions have been eliminated in consolidation. As of December 31, 2009, the Company had 14 wholly-owned trusts (“Trusts”) that were formed to issue trust preferred securities and related common securities of the Trusts. The Company has not consolidated the accounts of the Trusts in its consolidated financial statements in accordance with Financial Accounting Standards Board Accounting Standards Codification (“FASB ASC”) 810, Consolidation. As a result, the junior subordinated debentures issued by the Company to the Trusts are reflected on the Company’s consolidated balance sheet as junior subordinated debentures.
Subsequent events—The Company has evaluated events and transactions for potential recognition or disclosure through February 19, 2010, the day the financial statements were issued.
Cash and Cash Equivalents—Cash and cash equivalents include cash and due from banks, and temporary investments which are federal funds sold and interest bearing balances due from other banks. Cash and cash equivalents generally have a maturity of 90 days or less at the time of purchase.
Trading Account Securities—Debt and equity securities held for resale are classified as trading account securities and reported at fair value. Realized and unrealized gains or losses are recorded in non-interest income.
Investment Securities—Debt securities are classified as held to maturity if the Company has both the intent and ability to hold those securities to maturity regardless of changes in market conditions, liquidity needs or changes in general economic conditions. These securities are carried at cost adjusted for amortization of premium and accretion of discount, computed by the effective interest method over their contractual lives.
Securities are classified as available for sale if the Company intends and has the ability to hold those securities for an indefinite period of time, but not necessarily to maturity. Any decision to sell a security classified as available for sale would be based on various factors, including significant movements in interest rates, changes in the maturity mix of assets and liabilities, liquidity needs, regulatory capital considerations and other similar factors. Securities available for sale are carried at fair value. Unrealized holding gains or losses are included in other comprehensive income as a separate component of shareholders’ equity, net of tax. Realized gains or losses, determined on the basis of the cost of specific securities sold, are included in earnings. Premiums and discounts are amortized or accreted over the life of the related investment security as an adjustment to yield using the effective interest method. Dividend and interest income are recognized when earned.
95
Table of Contents
Prior to the second quarter of 2009, the Company would assess an other-than-temporary impairment (“OTTI”) or permanent impairment based on the nature of the decline and whether the Company has the ability and intent to hold the investments until a market price recovery. If the Company determined a security to be other-than-temporarily or permanently impaired, the full amount of impairment would be recognized through earnings in its entirety. New guidance related to the recognition and presentation of OTTI of debt securities became effective in the second quarter of 2009. Rather than asserting whether a Company has the ability and intent to hold an investment until a market price recovery, a Company must consider whether it intends to sell a security or if it is likely that they would be required to sell the security before recovery of the amortized cost basis of the investment, which may be maturity. For debt securities, if we intend to sell the security or it is likely that we will be required to sell the security before recovering its cost basis, the entire impairment loss would be recognized in earnings as an OTTI. If we do not intend to sell the security and it is not likely that we will be required to sell the security but we do not expect to recover the entire amortized cost basis of the security, only the portion of the impairment loss representing credit losses would be recognized in earnings. The credit loss on a security is measured as the difference between the amortized cost basis and the present value of the cash flows expected to be collected. Projected cash flows are discounted by the original or current effective interest rate depending on the nature of the security being measured for potential OTTI. The remaining impairment related to all other factors, the difference between the present value of the cash flows expected to be collected and fair value, is recognized as a charge to other comprehensive income (“OCI”). Impairment losses related to all other factors are presented as separate categories within OCI. For investment securities held to maturity, this amount is accreted over the remaining life of the debt security prospectively based on the amount and timing of future estimated cash flows. The accretion of the amount recorded in OCI increases the carrying value of the investment and does not affect earnings. If there is an indication of additional credit losses the security is re-evaluated according to the procedures described above. OTTI losses totaling $10.6 million and $4.2 million were recognized through earnings in the years ended December 31, 2009 and 2008, respectively, within total (loss) gain on investment securities, net. No OTTI losses were recognized in the year ended December 31, 2007.
Transfers of securities from available for sale to held to maturity are accounted for at fair value as of the date of the transfer. The difference between the fair value and the par value at the date of transfer is considered a premium or discount and is accounted for accordingly. Any unrealized gain or loss at the date of the transfer is reported in OCI, and is amortized over the remaining life of the security as an adjustment of yield in a manner consistent with the amortization of any premium or discount, and will offset or mitigate the effect on interest income of the amortization of the premium or discount for that held to maturity security.
Loans Held for Sale—Loans held for sale includes mortgage loans and are reported at the lower of cost or market value. Cost generally approximates market value, given the short duration of these assets. Gains or losses on the sale of loans that are held for sale are recognized at the time of the sale and determined by the difference between net sale proceeds and the net book value of the loans less the estimated fair value of any retained mortgage servicing rights.
Loans—Loans are stated at the amount of unpaid principal, net of unearned income and any deferred fees or costs. All discounts and premiums are recognized over the estimated life of the loan as yield adjustments. This estimated life is adjusted for prepayments.
Loans are classified as impaired when, based on current information and events, it is probable that the Bank will be unable to collect the scheduled payments of principal and interest when due, in accordance with the terms of the original loan agreement. The carrying value of impaired loans is based on the present value of expected future cash flows (discounted at each loan’s effective interest rate) or, for collateral dependent loans, at fair value of the collateral, less selling costs. If the measurement of each impaired loans’ value is less than the recorded investment in the loan, we recognize this impairment and adjust the carrying value of the loan to fair value through the allowance for loan and lease losses. This can be accomplished by charging-off the impaired portion of the loan or establishing a specific component to be provided for in the allowance for loan and lease losses.
Income Recognition on Non-Accrual and Impaired Loans—Loans, including impaired loans, are classified as non-accrual if the collection of principal and interest is doubtful. Generally, this occurs when a loan is past due as to maturity or payment of principal or interest by 90 days or more, unless such loans are well-secured and in the process of collection. Generally, if a loan or portion thereof is partially charged-off, the loan is considered impaired and classified as non-accrual. Loans that are less than 90 days past due may also be classified as non-accrual if repayment in full of principal and/or interest is in doubt.
96
Table of Contents
Umpqua Holdings Corporation and Subsidiaries
When a loan is classified as non-accrual, all uncollected accrued interest is reversed to interest income and the accrual of interest income is terminated. Generally, any cash payments are applied as a reduction of principal outstanding. In cases where the future collectibility of the principal balance in full is expected, interest income may be recognized on a cash basis. A loan may be restored to accrual status when the borrower’s financial condition improves so that full collection of future contractual payments is considered likely. For those loans placed on non-accrual status due to payment delinquency, this will generally not occur until the borrower demonstrates repayment ability over a period of not less than six months.
Loans are reported as restructured when the Bank grants a concession(s) to a borrower experiencing financial difficulties that it would not otherwise consider. Examples of such concessions include forgiveness of principal or accrued interest, extending the maturity date(s) or providing a lower interest rate than would be normally available for a transaction of similar risk. As a result of these concessions, restructured loans are impaired as the Bank will not collect all amounts due, both principal and interest, in accordance with the terms of the original loan agreement. Impairment reserves on non-collateral dependent restructured loans are measured by comparing the present value of expected future cash flows on the restructured loans discounted at the interest rate of the original loan agreement to the loan’s carrying value. These impairment reserves are recognized as a specific component to be provided for in the allowance for loan and lease losses.
The decision to classify a loan as impaired is made by the Bank’s Allowance for Loan and Lease Losses (“ALLL”) Committee. The ALLL Committee meets regularly to review the status of all problem and potential problem loans. If the ALLL Committee concludes a loan is impaired but recovery of the full principal and interest is expected, an impaired loan may remain on accrual status.
Allowance for loan and lease losses—The Bank performs regular credit reviews of the loan and lease portfolio to determine the credit quality of the portfolio and the adherence to underwriting standards. When loans and leases are originated, they are assigned a risk rating that is reassessed periodically during the term of the loan through the credit review process. The Company’s risk rating methodology assigns risk ratings ranging from 1 to 10, where a higher rating represents higher risk. The 10 risk rating categories are a primary factor in determining an appropriate amount for the allowance for loan and lease losses. The Bank has a management ALLL Committee, which is responsible for, among other things, regularly reviewing the ALLL methodology, including loss factors, and ensuring that it is designed and applied in accordance with generally accepted accounting principles. The ALLL Committee reviews and approves loans and leases recommended for impaired status. The ALLL Committee also approves removing loans and leases from impaired status. The Bank’s Audit and Compliance Committee provides board oversight of the ALLL process and reviews and approves the ALLL methodology on a quarterly basis.
Each risk rating is assessed an inherent credit loss factor that determines the amount of the allowance for loan and lease losses provided for that group of loans and leases with similar risk rating. Credit loss factors may vary by region based on management’s belief that there may ultimately be different credit loss rates experienced in each region.
Regular credit reviews of the portfolio also identify loans that are considered potentially impaired. Potentially impaired loans are referred to the ALLL Committee which reviews and approves designated loans as impaired. A loan is considered impaired when based on current information and events, we determine that we will probably not be able to collect all amounts due according to the loan contract, including scheduled interest payments. When we identify a loan as impaired, we measure the impairment using discounted cash flows, except when the sole remaining source of the repayment for the loan is the liquidation of the collateral. In these cases, we use the current fair value of the collateral, less selling costs, instead of discounted cash flows. If we determine that the value of the impaired loan is less than the recorded investment in the loan, we either recognize this impairment reserve as a specific component to be provided for in the allowance for loan and lease losses or charge-off the impaired balance on collateral dependent loans if it is determined that such amount represents a confirmed loss. The combination of the risk rating-based allowance component and the impairment reserve allowance component lead to an allocated allowance for loan and lease losses.
The Bank may also maintain an unallocated allowance amount to provide for other credit losses inherent in a loan and lease portfolio that may not have been contemplated in the credit loss factors. This unallocated amount generally comprises less than 5% of the allowance, but may be maintained at higher levels during times of deteriorating economic conditions characterized by falling real estate values. The unallocated amount is reviewed periodically based on trends in credit losses, the results of credit reviews and overall economic trends.
97
Table of Contents
As adjustments become necessary, they are reported in earnings in the periods in which they become known as a change in the provision for loan and lease losses and a corresponding charge to the allowance. Loans, or portions thereof, deemed uncollectible are charged to the allowance. Provisions for losses, and recoveries on loans previously charged-off, are added to the allowance.
The adequacy of the ALLL is monitored on a regular basis and is based on management’s evaluation of numerous factors. These factors include the quality of the current loan portfolio; the trend in the loan portfolio’s risk ratings; current economic conditions; loan concentrations; loan growth rates; past-due and non-performing trends; evaluation of specific loss estimates for all significant problem loans; historical charge-off and recovery experience; and other pertinent information.
Management believes that the ALLL was adequate as of December 31, 2009. There is, however, no assurance that future loan losses will not exceed the levels provided for in the ALLL and could possibly result in additional charges to the provision for loan and lease losses. In addition, bank regulatory authorities, as part of their periodic examination of the Bank, may require additional charges to the provision for loan and lease losses in future periods if warranted as a result of their review. Approximately 81% of our loan portfolio is secured by real estate, and a significant decline in real estate market values may require an increase in the allowance for loan and lease losses. The U.S. recession, the housing market downturn, and declining real estate values in our markets have negatively impacted aspects of our residential development, commercial real estate, commercial construction and commercial loan portfolios, and have led to an increase in non-performing loans, charge-offs, and the allowance for loan and lease losses. A continued deterioration in our markets may adversely affect our loan portfolio and may lead to additional charges to the provision for loan and lease losses.
Reserve for Unfunded Commitments—A reserve for unfunded commitments is maintained at a level that, in the opinion of management, is adequate to absorb probable losses associated with the Bank’s commitment to lend funds under existing agreements such as letters or lines of credit. Management determines the adequacy of the reserve for unfunded commitments based upon reviews of individual credit facilities, current economic conditions, the risk characteristics of the various categories of commitments and other relevant factors. The reserve is based on estimates, and ultimate losses may vary from the current estimates. These estimates are evaluated on a regular basis and, as adjustments become necessary, they are reported in earnings in the periods in which they become known. Draws on unfunded commitments that are considered uncollectible at the time funds are advanced are charged to the allowance. Provisions for unfunded commitment losses, and recoveries on loans commitments previously charged-off, are added to the reserve for unfunded commitments, which is included in the Other Liabilities section of the consolidated balance sheets.
Loan Fees and Direct Loan Origination Costs—Loan origination and commitment fees and direct loan origination costs are deferred and recognized as an adjustment to the yield over the life of the related loans.
Restricted Equity Securities—Restricted equity securities were $15.2 million and $16.5 million at December 31, 2009 and 2008, respectively. Federal Home Loan Bank stock amounted to $14.3 million and $15.6 million of the total restricted securities as of December 31, 2009 and 2008, respectively. Federal Home Loan Bank stock represents the Bank’s investment in the Federal Home Loan Banks of Seattle and San Francisco (“FHLB”) stock and is carried at par value, which reasonably approximates its fair value. Management periodically evaluates FHLB stock for other-than-temporary or permanent impairment. Management’s determination of whether these investments are impaired is based on its assessment of the ultimate recoverability of cost rather than by recognizing temporary declines in value. The determination of whether a decline affects the ultimate recoverability of cost is influenced by criteria such as (1) the significance of any decline in net assets of the FHLB as compared to the capital stock amount for the FHLB and the length of time this situation has persisted, (2) commitments by the FHLB to make payments required by law or regulation and the level of such payments in relation to the operating performance of the FHLB, (3) the impact of legislative and regulatory changes on institutions and, accordingly, the customer base of the FHLB, and (4) the liquidity position of the FHLB.
As a member of the FHLB system, the Bank is required to maintain a minimum level of investment in FHLB stock based on specific percentages of its outstanding mortgages, total assets, or FHLB advances. At December 31, 2009, the Bank’s minimum required investment in FHLB stock was $4.5 million. The Bank may request redemption at par value of any stock in excess of the minimum required investment. Stock redemptions are at the discretion of the FHLB. The remaining restricted equity securities balance primarily represents an investment in Pacific Coast Bankers’ Bancshares stock.
98
Table of Contents
Umpqua Holdings Corporation and Subsidiaries
Premises and Equipment—Premises and equipment are stated at cost less accumulated depreciation and amortization. Depreciation is provided over the estimated useful life of equipment, generally three to ten years, on a straight-line or accelerated basis. Depreciation is provided over the estimated useful life of premises, up to 39 years, on a straight-line or accelerated basis. Leasehold improvements are amortized over the life of the related lease, or the life of the related asset, whichever is shorter. Expenditures for major renovations and betterments of the Company’s premises and equipment are capitalized.
Management reviews long-lived and intangible assets any time that a change in circumstance indicates that the carrying amount of these assets may not be recoverable. Recoverability of these assets is determined by comparing the carrying value of the asset to the forecasted undiscounted cash flows of the operation associated with the asset. If the evaluation of the forecasted cash flows indicates that the carrying value of the asset is not recoverable, the asset is written down to fair value.
Goodwill and Other Intangibles—Intangible assets are comprised of goodwill and other intangibles acquired in business combinations. Goodwill and intangible assets with indefinite useful lives are not amortized. Intangible assets with definite useful lives are amortized to their estimated residual values over their respective estimated useful lives, and also reviewed for impairment.
Amortization of intangible assets is included in other non-interest expense in the Consolidated Statements of Operations. Goodwill is tested for impairment on an annual basis as of December 31. Additionally, goodwill is evaluated on an interim basis when events or circumstances indicate impairment potentially exists. An impairment loss is recognized to the extent that the carrying amount of the asset exceeds its implied fair value.
Mortgage Servicing Rights (“MSR”)—The Company determines its classes of servicing assets based on the asset type being serviced along with the methods used to manage the risk inherent in the servicing assets, which includes the market inputs used to value the servicing assets. The Company measures its residential mortgage servicing assets at fair value and reports changes in fair value through earnings. Fair value adjustments that encompass market-driven valuation changes and the runoff in value that occurs from the passage of time, are each separately reported. Under the fair value method, the MSR is carried in the balance sheet at fair value and the changes in fair value are reported in earnings under the caption mortgage banking revenue in the period in which the change occurs.
Retained mortgage servicing rights are measured at fair value as of the date of sale. We use quoted market prices when available. Subsequent fair value measurements are determined using a discounted cash flow model. In order to determine the fair value of the MSR, the present value of expected future cash flows is estimated. Assumptions used include market discount rates, anticipated prepayment speeds, delinquency and foreclosure rates, and ancillary fee income. This model is periodically validated by an independent external model validation group. The model assumptions and the MSR fair value estimates are also compared to observable trades of similar portfolios as well as to MSR broker valuations and industry surveys, as available. Key assumptions used in measuring the fair value of MSR as of December 31, 2009 were as follows:
| Constant prepayment rate |
18.35% | |
| Discount rate |
8.70% | |
| Weighted average life (years) |
4.5 |
The expected life of the loan can vary from management’s estimates due to prepayments by borrowers, especially when rates fall. Prepayments in excess of management’s estimates would negatively impact the recorded value of the mortgage servicing rights. The value of the mortgage servicing rights is also dependent upon the discount rate used in the model, which we base on current market rates. Management reviews this rate on an ongoing basis based on current market rates. A significant increase in the discount rate would reduce the value of mortgage servicing rights.
SBA/USDA Loans Sales and Servicing—The Bank, on a regular basis, sells or transfers loans, including the guaranteed portion of Small Business Administration (“SBA”) and Department of Agriculture (“USDA”) loans (with servicing retained) for cash proceeds equal to the principal amount of loans, as adjusted to yield interest to the investor based upon the current market rates. The Bank records an asset representing the right to service loans for others when it sells a loan and retains the servicing rights. The carrying value of loans is allocated between the loan and the servicing rights, based on their relative fair values. The
99
Table of Contents
fair value of servicing rights is estimated by discounting estimated future cash flows from servicing using discount rates that approximate current market rates and using estimated prepayment rates. The servicing rights are carried at the lower of cost or market and are amortized in proportion to, and over the period of, the estimated net servicing income, assuming prepayments.
For purposes of evaluating and measuring impairment, servicing rights are based on a discounted cash flow methodology, current prepayment speeds and market discount rates. Any impairment is measured as the amount by which the carrying value of servicing rights for a stratum exceeds its fair value. The carrying value of SBA/USDA servicing rights at December 31, 2009 and 2008 were $728,000 and $861,000, respectively. No impairment charges were recorded for the years ended December 31, 2009, 2008 or 2007 related to SBA/USDA servicing assets.
A premium over the adjusted carrying value is received upon the sale of the guaranteed portion of an SBA or USDA loan. The Bank’s investment in an SBA or USDA loan is allocated among the sold and retained portions of the loan based on the relative fair value of each portion at the time of loan origination, adjusted for payments and other activities. Because the portion retained does not carry an SBA or USDA guarantee, part of the gain recognized on the sold portion of the loan may be deferred and amortized as a yield enhancement on the retained portion in order to obtain a market equivalent yield.
Other Real Estate Owned—Other real estate owned represents real estate which the Bank has taken control of in partial or full satisfaction of loans. At the time of foreclosure, other real estate owned is recorded at the lower of the carrying amount of the loan or fair value less costs to sell, which becomes the property’s new basis. Any write-downs based on the asset’s fair value at the date of acquisition are charged to the allowance for loan and lease losses. After foreclosure, management periodically performs valuations such that the real estate is carried at the lower of its new cost basis or fair value, net of estimated costs to sell. Subsequent valuation adjustments are recognized within net loss on other real estate owned. Revenue and expenses from operations and subsequent adjustments to the carrying amount of the property are included in other non-interest expense in the Consolidated Statements of Operations.
In some instances, the Bank may make loans to facilitate the sales of other real estate owned. Management reviews all sales for which it is the lending institution for compliance with sales treatment under provisions established within FASB ASC 360-20, Real Estate Sales. Any gains related to sales of other real estate owned may be deferred until the buyer has a sufficient initial and continuing investment in the property.
Income Taxes—Income taxes are accounted for using the asset and liability method. Under this method a deferred tax asset or liability is determined based on the enacted tax rates which will be in effect when the differences between the financial statement carrying amounts and tax basis of existing assets and liabilities are expected to be reported in the Company’s income tax returns. The effect on deferred taxes of a change in tax rates is recognized in income in the period that includes the enactment date. Valuation allowances are established to reduce the net carrying amount of deferred tax assets if it is determined to be more likely than not, that all or some portion of the potential deferred tax asset will not be realized.
Derivative Loan Commitments—The Bank enters into forward delivery contracts to sell residential mortgage loans or mortgage-backed securities to broker/dealers at specific prices and dates in order to hedge the interest rate risk in its portfolio of mortgage loans held for sale and its residential mortgage loan commitments. The commitments to originate mortgage loans held for sale and the related forward delivery contracts are considered derivatives. In the fourth quarter of 2007 and the first quarter of 2008, the Bank utilized derivative instruments in attempts to hedge the risk of changes in the fair value of MSR due to changes in interest rates. The Company recognizes all derivatives as either assets or liabilities in the balance sheet and requires measurement of those instruments at fair value through adjustments to accumulated other comprehensive income and/or current earnings, as appropriate. None of the Company’s derivatives are designated as hedging instruments. Rather, they are accounted for as free-standing derivatives, or economic hedges, and the Company reports changes in fair values of its derivatives in current period net income.
The fair value of the derivative loan commitments is estimated using the present value of expected future cash flows. Assumptions used include pull-through rate assumption based on historical information, current mortgage interest rates, the stage of completion of the underlying application and underwriting process, the time remaining until the expiration of the derivative loan commitment, and the expected net future cash flows related to the associated servicing of the loan.
100
Table of Contents
Umpqua Holdings Corporation and Subsidiaries
Operating Segments—Public enterprises are required to report certain information about their operating segments in a complete set of financial statements to shareholders. There are also required to report certain enterprise-wide information about the Company’s products and services, its activities in different geographic areas, and its reliance on major customers. The basis for determining the Company’s operating segments is the manner in which management operates the business. Management has identified three primary business segments, Community Banking, Retail Brokerage and Mortgage Banking.
Share-Based Payment—The Company has two active stock-based compensation plans that provide for the granting of stock options and restricted stock to eligible employees and directors. In accordance with FASB ASC 718, Stock Compensation, we recognize in the income statement the grant-date fair value of stock options and other equity-based forms of compensation issued to employees over the employees’ requisite service period (generally the vesting period). The requisite service period may be subject to performance conditions.
The Company’s 2003 Stock Incentive Plan (“2003 Plan”) provides for granting of stock options and restricted stock awards. Stock options and restricted stock awards generally vest ratably over 5 years and are recognized as expense over that same period of time.
The fair value of each option grant is estimated as of the grant date using the Black-Scholes option-pricing model using assumptions noted in the following table. Expected volatility is based on the historical volatility of the price of the Company’s common stock. The Company uses historical data to estimate option exercise and stock option forfeiture rates within the valuation model. The expected term of options granted is determined based on historical experience with similar options, giving consideration to the contractual terms and vesting schedules, and represents the period of time that options granted are expected to be outstanding. The expected dividend yield is based on dividend trends and the market value of the Company’s common stock at the time of grant. The risk-free rate is based on the U.S. Treasury yield curve in effect at the time of grant corresponding to the estimated expected term of the options granted. The following weighted average assumptions were used to determine the fair value of stock option grants as of the grant date to determine compensation cost for the years ended December 31, 2009, 2008 and 2007:
| 2009 | 2008 | 2007 | |||||||
| Dividend yield |
2.23% | 4.39% | 3.29% | ||||||
| Expected life (years) |
7.3 | 7.3 | 6.2 | ||||||
| Expected volatility |
46% | 34% | 34% | ||||||
| Risk-free rate |
2.18% | 3.29% | 4.46% | ||||||
| Weighted average grant date fair value of options granted |
$ | 3.65 | $ | 3.32 | $ | 7.49 | |||
The Company’s 2007 Long Term Incentive Plan provides for granting of restricted stock units for the benefit of certain executive officers. Restricted stock unit grants are subject to performance-based vesting as well as other approved vesting conditions. The current restricted stock units outstanding cliff vest after three years based on performance and service conditions. Compensation expense is recognized over the service period to the extent restricted stock units are expected to vest.
Earnings per Share—According to the revised provisions of FASB ASC 260, Earnings Per Share, which became effective January 1, 2009, nonvested share-based payment awards that contain nonforfeitable rights to dividends or dividend equivalents are participating securities and are included in the computation of EPS pursuant to the two-class method. The two-class method is an earnings allocation formula that determines earnings per share for each class of common stock and participating security according to dividends declared (or accumulated) and participation rights in undistributed earnings. Certain of the Company’s nonvested restricted stock awards qualify as participating securities.
Net income, less any preferred dividends accumulated for the period (whether or not declared), is allocated between the common stock and participating securities pursuant to the two-class method, based on their rights to receive dividends, participate in earnings or absorb losses. Basic earnings per common share is computed by dividing net earnings available to common shareholders by the weighted average number of common shares outstanding during the period, excluding participating nonvested restricted shares.
101
Table of Contents
Diluted earnings per common share is computed in a similar manner, except that first the denominator is increased to include the number of additional common shares that would have been outstanding if potentially dilutive common shares, excluding the participating securities, were issued using the treasury stock method. For all periods presented, warrants, stock options, certain restricted stock awards and restricted stock units are the only potentially dilutive non-participating instruments issued by the Company. Next, we determine and include in diluted earnings per common share calculation the more dilutive effect of the participating securities using the treasury stock method or the two-class method. Undistributed losses are not allocated to the nonvested share-based payment awards (the participating securities) under the two-class method as the holders are not contractually obligated to share in the losses of the Company.
All earnings per common share amounts for 2008 and 2007 have been retrospectively adjusted to conform to the revised provisions of FASB ASC 260. The impact of the revised provisions reduced both basic and diluted earnings per common share by $0.01 for the year ended December 31, 2007 and had no effect for the year ended December 31, 2008.
Advertising expenses—Advertising costs are generally expensed as incurred.
Fair Value Measurements—FASB ASC 820, Fair Value Measurements and Disclosures, defines fair value as the price that would be received to sell an asset or paid to transfer a liability in an orderly transaction between market participants at the measurement date. FASB ASC 820 establishes a three-level hierarchy for disclosure of assets and liabilities recorded at fair value. The classification of assets and liabilities within the hierarchy is based on whether the inputs to the valuation methodology used for measurement are observable or unobservable. Observable inputs reflect market-derived or market-based information obtained from independent sources, while unobservable inputs reflect our estimates about market data. In general, fair values determined by Level 1 inputs utilize quoted prices for identical assets or liabilities traded in active markets that the Company has the ability to access. Fair values determined by Level 2 inputs utilize inputs other than quoted prices included in Level 1 that are observable for the asset or liability, either directly or indirectly. Level 2 inputs include quoted prices for similar assets and liabilities in active markets, and inputs other than quoted prices that are observable for the asset or liability, such as interest rates and yield curves that are observable at commonly quoted intervals. Level 3 inputs are unobservable inputs for the asset or liability, and include situations where there is little, if any, market activity for the asset or liability. In certain cases, the inputs used to measure fair value may fall into different levels of the fair value hierarchy. In such cases, the level in the fair value hierarchy within which the fair value measurement in its entirety falls has been determined based on the lowest level input that is significant to the fair value measurement in its entirety. The Company’s assessment of the significance of a particular input to the fair value measurement in its entirety requires judgment, and considers factors specific to the asset or liability.
Recently Issued Accounting Pronouncements—In December 2007, FASB revised FASB ASC 805, Business Combinations. FASB ASC 805 establishes principles and requirements for how an acquirer recognizes and measures in its financial statements the identifiable assets acquired, the liabilities assumed, any noncontrolling interest in the acquired entity and the goodwill acquired. Furthermore, acquisition-related and other costs will now be expensed rather than treated as cost components of the acquisition. FASB ASC 805 also establishes disclosure requirements to enable the evaluation of the nature and financial effects of the business combination. The revision to this guidance applies prospectively to business combinations for which the acquisition date occurs on or after January 1, 2009. The adoption of these revisions will increase the costs charged to operations for acquisitions consummated on or after January 1, 2009.
In December 2007, FASB amended FASB ASC 810, Consolidation. This amendment establishes accounting and reporting standards for the noncontrolling interest in a subsidiary and for the deconsolidation of a subsidiary. The standard also requires additional disclosures that clearly identify and distinguish between the interest of the parent’s owners and the interest of the noncontrolling owners of the subsidiary. This statement is effective on January 1, 2009 for the Company, to be applied prospectively. The impact of adoption did not have a material impact on the Company’s consolidated financial statements.
In June 2008, FASB amended FASB ASC 260, Earnings per Share. This amendment concluded that nonvested share-based payment awards that contain nonforfeitable rights to dividends or dividend equivalents are participating securities and shall be included in the computation of EPS pursuant to the two-class method. This amendment is effective for fiscal years beginning
102
Table of Contents
Umpqua Holdings Corporation and Subsidiaries
after December 15, 2008, to be applied retrospectively. Certain of the Company’s nonvested restricted stock awards qualify as participating securities as described under this amendment. The adoption of this provision reduced both basic and diluted earnings per common share by $0.01 for the year ended December 31, 2007.
In January 2009, FASB amended FASB ASC 325-40, Investments—Other. This amendment addressed certain practice issues related to the recognition of interest income and impairment on purchased beneficial interests and beneficial interests that continue to be held by a transferor in securitized financial assets, by making its other-than-temporary impairment (“OTTI”) assessment guidance consistent with FASB ASC 320, Investments—Debt and Equity Securities. The amendment removes the reference to the consideration of a market participant’s estimates of cash flows and instead requires an assessment of whether it is probable, based on current information and events, that the holder of the security will be unable to collect all amounts due according to the contractual terms. If it is probable that there has been an adverse change in estimated cash flows, an OTTI is deemed to exist, and a corresponding loss shall be recognized in earnings equal to the entire difference between the investment’s carrying value and its fair value at the balance sheet date of the reporting period for which the assessment is made. This amendment became effective for interim and annual reporting periods ending after December 15, 2008, and is applied prospectively. The impact of adoption did not have a material impact on the Company’s consolidated financial statements.
In April 2009, FASB amended FASB ASC 820, Fair Value Measurements and Disclosures, to address issues related to the determination of fair value when the volume and level of activity for an asset or liability has significantly decreased, and identifying transactions that are not orderly. The revisions affirm the objective that fair value is the price that would be received to sell an asset in an orderly transaction (that is not a forced liquidation or distressed sale) between market participants at the measurement date under current market conditions, even if the market is inactive. The amendment provides additional guidance for estimating fair value when the volume and level of activity for the asset or liability have decreased significantly. It also provides guidance on identifying circumstances that indicate a transaction is not orderly. If determined that a quoted price is distressed (not orderly), and thereby not representative of fair value, the entity may need to make adjustments to the quoted price or utilize an alternative valuation technique (e.g. income approach or multiple valuation techniques) to determine fair value. Additionally, an entity must incorporate appropriate risk premium adjustments, reflective of an orderly transaction under current market conditions, due to uncertainty in cash flows. The revised guidance requires disclosures in interim and annual periods regarding the inputs and valuation techniques used to measure fair value and a discussion of changes in valuation techniques and related inputs, if any, during the period. It also requires financial institutions to disclose the fair values of investment securities by major security type. The changes are effective for the interim reporting period ending after June 15, 2009, and are to be applied prospectively. The adoption of these amendments impacted the Company’s determination of fair value related to our junior subordinated debentures measured at fair value. As of March 31, 2009, prior to the adoption of these amendments, we discounted these liabilities by the current three month LIBOR plus a credit risk adjusted spread of 500 basis points. Due to the lack of observable, orderly transactions, of either new issuances or trades, we estimated that a market participant would utilize a credit risk adjusted spread of 500 basis points if an actual market transaction in an active market were to take place for an entity with comparable nonperformance risk. The amendments clarify that a fair value measurement shall assume a risk premium market participants would require at a measurement date under current market conditions, even if the market is inactive. With the assistance of a third-party pricing service, we determined that a credit risk adjusted spread of 675 basis points would be representative of the nonperformance risk premium a market participant would require under current market conditions as of June 30, 2009. In accordance with the guidance, this is accounted for as a change in accounting estimate. This increase in the credit risk adjusted spread is the primary factor resulting in the $8.6 million gain on junior subordinated debentures carried at fair value recognized in the second quarter of 2009. At December 31, 2009, we continue to estimate that the credit risk adjusted spread of 675 basis points is appropriate. The change in junior subordinated debentures carried at fair value in the third and fourth quarters of 2009 is attributable to changes in three month LIBOR and quarterly interest payments, and would have generally been recognized under both methodologies. The effect of these amendments did not have a significant impact on the fair value measurement of any other assets or liabilities.
In April 2009, FASB revised FASB ASC 320, Investments—Debt and Equity Securities, to change the OTTI model for debt securities. Previously, an entity was required to assess whether it has the intent and ability to hold a security to recovery in
103
Table of Contents
determining whether an impairment of that security is other-than-temporary. If the impairment was deemed other-than-temporarily impaired, the investment was written-down to fair value through earnings. Under the revised guidance, OTTI is triggered if an entity has the intent to sell the security, it is likely that it will be required to sell the security before recovery, or if the entity does not expect to recover the entire amortized cost basis of the security. If the entity intends to sell the security or it is likely it will be required to sell the security before recovering its cost basis, the entire impairment loss would be recognized in earnings as an OTTI. If the entity does not intend to sell the security and it is not likely that the entity will be required to sell the security but the entity does not expect to recover the entire amortized cost basis of the security, only the portion of the impairment loss representing credit losses would be recognized in earnings as an OTTI. The credit loss is measured as the difference between the amortized cost basis and the present value of the cash flows expected to be collected of a security. Projected cash flows are discounted by the original or current effective interest rate depending on the nature of the security being measured for potential OTTI. The remaining impairment loss related to all other factors, the difference between the present value of the cash flows expected to be collected and fair value, would be recognized as a charge to other comprehensive income (“OCI”). Impairment losses related to all other factors are to be presented as a separate category within OCI. For investment securities held to maturity, this amount is accreted over the remaining life of the debt security prospectively based on the amount and timing of future estimated cash flows. The accretion of the OTTI amount recorded in OCI increases the carrying value of the investment and does not affect earnings. If there is an indication of additional credit losses the security is re-evaluated accordingly to the procedures described above. Upon adoption of the revised guidance, the noncredit portion of previously recognized OTTI shall be reclassified to accumulated OCI by a cumulative-effect adjustment to the opening balance of retained earnings. These revisions became effective in the interim reporting period ending after June 15, 2009. Upon adoption of this guidance the Company analyzed the securities for which OTTI had been previously recognized and determined that as of the adoption date such losses were credit related. As such, there was no cumulative effect adjustment to the opening balance of retained earnings or a corresponding adjustment to accumulated OCI.
In April 2009, FASB revised FASB ASC 825, Financial Instruments, to require fair value disclosures in the notes of an entity’s interim financial statements for all financial instruments, whether or not recognized in the statement of financial position. This revision became effective for the interim reporting period ending after June 15, 2009. The adoption of the revised increased interim financial statement disclosures and did not impact on the Company’s consolidated financial statements.
In May 2009, FASB amended FASB ASC 855, Subsequent Events. The updated guidance established general standards of accounting for and disclosure of events that occur after the balance sheet date but before financial statements are issued or are available to be issued. The revisions should not result in significant changes in the subsequent events that an entity reports, either through recognition or disclosure in its financial statements. It does require disclosure of the date through which an entity has evaluated subsequent events and the basis for that date, that is, whether that date represents the date the financial statements were issued or were available to be issued. This disclosure should alert all users of financial statements that an entity has not evaluated subsequent events after that date in the set of financial statements being presented. We adopted the provisions of this guidance for the interim period ended June 30, 2009, and the impact of adoption did not have a material impact on the Company’s consolidated financial statements.
In December 2009, FASB issued ASU No. 2009-17, Transfers and Servicing (Topic 860)—Accounting for Transfers of Financial Assets. This update codifies SFAS No. 166, Accounting for Transfers of Financial Assets—an Amendment of FASB Statement No. 140, which was previously issued by FASB in June 2009 but was not included in the original codification. ASU 2009-17 eliminates the concept of a qualifying special-purpose entity, creates more stringent conditions for reporting a transfer of a portion of a financial asset as a sale, clarifies other sale-accounting criteria, and changes the initial measurement of a transferor’s interest in transferred financial assets. This statement is effective for annual reporting periods beginning after November 15, 2009, and for interim periods therein. This standard will primarily impact the Company’s accounting and reporting of transfers representing a portion of a financial asset for which the Company has a continuing involvement, generally known as loan participations. In order to recognize the transfer of a portion of a financial asset as a sale, the transferred portion and any portion that continues to be held by the transferor must represent a participating interest, and the transfer of the participating interest must meet the conditions for surrender of control. To qualify as a participating interest (i) the portions of a financial asset must represent a proportionate ownership interest in an entire financial asset, (ii) from the date of transfer, all cash flows
104
Table of Contents
Umpqua Holdings Corporation and Subsidiaries
received from the entire financial asset must be divided proportionately among the participating interest holders in an amount equal to their share of ownership, (iii) involve no recourse (other than standard representation and warranties) to, or subordination by, any participating interest holder, and (iv) no party has the right to pledge or exchange the entire financial asset. If the participating interest or surrender of control criteria are not met the transfer is not accounted for as a sale and derecognition of the asset is not appropriate. Rather the transaction is accounted for as a secured borrowing arrangement. The impact of certain participations being reported as secured borrowings rather than derecognizing a portion of a financial asset would increase total assets (loans), liabilities (term debt) and their respective interest income and expense. An increase in total assets also increases regulatory risk-weighted assets and could negatively impact our capital ratios. The Company is reviewing our participation agreements to ensure new originations meet the criteria to allow for sale accounting in order to limit the impact upon our financial statements. The terms contained in certain participation and loan sale agreements, however, are outside the control of the Company. These arrangements largely relate to Small Business Administration (“SBA”) loan sales. These sales agreements contain recourse provisions (generally 90 days) that will initially preclude sale accounting. However, once the recourse provision expires, transfers of portions of financial assets may be reevaluated to determine if they meet the participating interest definition. As a result, we expect to report SBA and potentially certain other transfers of financial assets as secured borrowings which will defer the gain of sale on these transactions, at least until the recourse provision expires, assuming all other sales criteria for each transaction are met. The Company does not believe it has or will have a significant amount of participations subject to recourse provisions or other features that would preclude derecognition of the assets transferred. The Company does not believe the impact of adoption will have a material impact on the Company’s consolidated financial statements.
In December 2009, FASB issued ASU No. 2009-18, Consolidations (Topic 810)—Improvements to Financial Reporting by Enterprises Involved with Variable Interest Entities. This update codifies SFAS No. 167, Amendments to FASB Interpretation No. 46(R), which was previously issued by FASB in June 2009 but was not included in the original codification. ASU 2009-18 eliminates FASB Interpretations 46(R) (“FIN 46(R)”) exceptions to consolidating qualifying special-purpose entities, contains new criteria for determining the primary beneficiary, and increases the frequency of required reassessments to determine whether a company is the primary beneficiary of a variable interest entity (“VIE”). Under the revised guidance, the primary beneficiary of a VIE (party who must consolidate the VIE) is the enterprise that has (i) the power to direct the activities of the VIE that most significantly impact the VIE’s economic performance, and (ii) the obligation to absorb losses of the VIE that could potentially be significant to the VIE, or the right to receive benefits of the VIE that could potentially be significant to the VIE. ASU 2009-18 also contains a new requirement that any term, transaction, or arrangement that does not have a substantive effect on an entity’s status as a variable interest entity, a company’s power over a variable interest entity, or a company’s obligation to absorb losses or its right to receive benefits of an entity must be disregarded in applying FIN 46(R) provisions. The elimination of the qualifying special-purpose entity concept and its consolidation exceptions means more entities will be subject to consolidation assessments and reassessments. This statement requires additional disclosures regarding an entity’s involvement in a variable interest entity. This statement is effective for annual reporting periods beginning after November 15, 2009, and for interim periods therein. The Company has evaluated the impact of this guidance in regards to our involvement with variable interest entities. This guidance potentially impacts the accounting for our limited partnership equity investments in affordable housing development funds and real estate investment funds. In regards to affordable housing investments, the primary activities that most significantly impacts the VIE’s economic performance include leasing rental units at appropriate rent rates in compliance with low income housing restrictions and requirements, operating the rental property thereby generating income/loss from the partnership operations, and protecting the low income housing tax credits from recapture. As a limited partner, the Company generally does not participate in the control of the partnerships’ business, our involvement is limited to providing a stated amount of financial support (commitment or subscription) as stated within contractual agreements, and the primary purpose of the investment is to receive the tax attributes (tax credits) of the partnership. The general partner, which generally are a developer or non-profit organization, exercise the day-to-day control and management of the partnerships that most significantly impacts the VIE’s economic performance. In regards to the real estate investment funds, the primary activities that most significantly impacts the VIE’s economic performance include the development, financing, and leasing of real estate related properties, and ultimately finding a profitable exit from such investments. The Company’s involvement in these funds are a limited partners minority interest. According to the terms of the partnerships, the general partners have exclusive control
105
Table of Contents
to manage the enterprise and power to direct activities that impact the VIE’s economic performance. The impact of adoption did not result in the Company consolidating or deconsolidating any variable interest entities as accounted for under previous guidance and, therefore, did not have a material impact on the Company’s consolidated financial statements.
In June 2009, FASB codified FASB ASC 105, Generally Accepted Accounting Principles, to establish the FASB ASC (the “Codification”). The Codification is not expected to change U.S. GAAP, but combines all authoritative standards into a comprehensive, topically organized online database. Following this guidance, the Financial Accounting Standards Board will not issue new standards in the form of Statements, FASB Staff Positions, or Emerging Issues Task Force Abstracts. Instead, it will issue Accounting Standards Updates (“ASU”) to update the Codification. After the launch of the Codification on July 1, 2009 only one level of authoritative U.S. GAAP for non governmental entities will exist, other than guidance issued by the Securities and Exchange Commission. This statement is effective for interim and annual reporting periods ending after September 15, 2009. The adoption of the FASB ASC 105 did not have any impact on the Company’s consolidated financial statements, and only affects how the Company’s references authoritative accounting guidance going forward.
In August 2009, the FASB issued ASU No. 2009-05, Measuring Liabilities at Fair Value. This update amends FASB ASC 820, Fair Value Measurements and Disclosure, in regards to the fair value measurement of liabilities. FASB ASC 820 clarifies that in circumstances in which a quoted price for a identical liability in an active market in not available, a reporting entity shall utilize one or more of the following techniques: i) the quoted price of the identical liability when traded as an asset, ii) the quoted price for a similar liability or a similar liability when traded as an asset, or iii) another valuation technique that is consistent with the principles of FASB ASC 820. In all instances a reporting entity shall utilize the approach that maximizes the use of relevant observable inputs and minimizes the use of unobservable inputs. Also, when measuring the fair value of a liability a reporting entity shall not include a separate input or adjustment to other inputs relating to the existence of a restriction that prevents the transfer of the liability. This update is effective for the Company in the fourth quarter of 2009. This update primarily affects our considerations related to our measurement of junior subordinated debentures carried at fair value. The adoption of FASB ASU 2009-05 did not have a material impact on the Company’s consolidated financial statements.
In January 2010, the FASB issued ASU No. 2010-06, Fair Value Measurements and Disclosures (Topic 820)—Improving Disclosures about Fair Value Measurements. FASB ASU No. 2009-06 requires (i) fair value disclosures by each class of assets and liabilities (generally a subset within a line item as presented in the statement of financial position) rather than major category, (ii) for items measured at fair value on a recurring basis, the amounts of significant transfers between Levels 1 and 2, and transfers into and out of Level 3, and the reasons for those transfers, including separate discussion related to the transfers into each level apart from transfers out of each level, and (iii) gross presentation of the amounts of purchases, sales, issuances, and settlements in the Level 3 recurring measurement reconciliation. Additionally, the ASU clarifies that a description of the valuation techniques(s) and inputs used to measure fair values is required for both recurring and nonrecurring fair value measurements. Also, if a valuation technique has changed, entities should disclose that change and the reason for the change. Disclosures other than the gross presentation changes in the Level 3 reconciliation are effective for the first reporting period beginning after December 15, 2009. The requirement to present the Level 3 activity of purchases, sales, issuances, and settlements on a gross basis will be effective for fiscal years beginning after December 15, 2010. The Company is currently evaluating the impact of adoption of FASB ASU No. 2010-06. We do not expect the adoption of this ASU will have a material impact on the Company’s consolidated financial statements.
Reclassifications— Certain amounts reported in prior years’ financial statements have been reclassified to conform to the current presentation. The results of the reclassifications are not considered material and have no effect on previously reported net earnings (losses) available to common shareholders and earnings (losses) per common share.
NOTE 2. BUSINESS COMBINATIONS
On January 16, 2009, the Washington Department of Financial Institutions closed the Bank of Clark County, Vancouver, Washington, and appointed the Federal Deposit Insurance Corporation (“FDIC”) as its receiver. The FDIC entered into a purchase and assumption agreement with Umpqua Bank to assume the insured non-brokered deposit balances, which totaled $183.9 million, at no premium. The Company recorded the deposit related liabilities at book value. In connection with the
106
Table of Contents
Umpqua Holdings Corporation and Subsidiaries
assumption, Umpqua Bank acquired certain assets totaling $23.0 million, primarily cash and marketable securities, with the difference of $160.9 million representing funds received directly from the FDIC. Through this agreement, Umpqua Bank now operates two additional store locations in Vancouver, Washington. In addition, the FDIC reimbursed Umpqua Bank for all overhead costs related to the acquired Bank of Clark County operations for 90 days following closing, while Umpqua Bank paid the FDIC a servicing fee on assumed deposit accounts for that same period.
The results of the Bank of Clark County’s operations have been included in the consolidated financial statements beginning January 17, 2009. Since this date, the Bank of Clark County has contributed net earnings of approximately $1.6 million for the year ended December 31, 2009, net of tax, which primarily represents interest income earned from the proceeds of the assumption which were invested in investment securities available for sale and service income on deposits. This was partially offset by interest expense on deposits, salaries and employee benefits expense, and the accrued servicing fee paid to the FDIC. Umpqua did not incur the FDIC servicing fee expense during the second or third quarter of 2009, but began incurring overhead expenses such as salaries and employee benefits expense and rent expense. The Company does not expect to incur any significant additional acquisition-related expenses in connection with the assumption of the Bank of Clark County deposits and assets. Given the nature and terms of the FDIC-assisted purchase and assumption of assets and liabilities of the Bank of Clark County, it is deemed impractical to provide historical pro forma financial information since financial information related to assets and liabilities assumed is not available. Additionally, management believes the effect of the operations assumed from the Bank of Clark County would not have had a material impact on the Company’s historical results of operations.
On April 26, 2007, the Company acquired all of the outstanding common stock of North Bay Bancorp (“North Bay”) and its principal operating subsidiary, The Vintage Bank, along with its Solano Bank division. The results of North Bay’s operations have been included in the consolidated financial statements since that date. This acquisition added North Bay’s network of 10 Northern California branches, including locations in the Napa area and in the communities of St. Helena, American Canyon, Vacaville, Benicia, Vallejo and Fairfield, to the Company’s network of Northern California, Oregon and Washington locations. This merger was consistent with the Company’s community banking expansion strategy and provided further opportunity to enter growth markets in Northern California.
The aggregate purchase price was $143.2 million and included 5.2 million common shares valued at $135.2 million, options to purchase 542,000 shares of common stock valued at $6.9 million and $1.1 million of direct merger costs. North Bay shareholders received 1.228 shares of the Company’s common stock for each share of North Bay common stock (“exchange ratio of 1.228:1”). The value of the common shares issued was $26.18 per share based on the average closing market price of the Company’s common stock for the fifteen trading days before the last five trading days before the merger. Outstanding North Bay stock options were converted (using the exchange ratio of 1.228:1) at a weighted average fair value of $12.78 per option.
107
Table of Contents
The following table summarizes the purchase price allocation, including the estimated fair value of the assets acquired and liabilities assumed at the date of acquisition.
(in thousands)
| April 26, 2007 | |||
| ASSETS ACQUIRED: |
|||
| Cash and equivalents |
$ | 78,729 | |
| Investment securities |
85,589 | ||
| Loans, net |
437,863 | ||
| Premises and equipment, net |
12,940 | ||
| Intangible assets |
14,210 | ||
| Goodwill |
78,794 | ||
| Other assets |
19,481 | ||
| Total assets acquired |
$ | 727,606 | |
| LIABILITIES ASSUMED: |
|||
| Deposits |
$ | 462,624 | |
| Term debt |
99,227 | ||
| Junior subordinated debentures |
10,342 | ||
| Other liabilities |
13,301 | ||
| Total liabilities assumed |
585,494 | ||
| Net Assets Acquired |
$ | 142,112 | |
The intangible assets represent the value ascribed to the long-term deposit relationships and merchant services portfolio income stream acquired. These intangible assets are being amortized on an accelerated basis over a weighted average estimated useful life of ten to fifteen years. The intangible assets are estimated not to have a significant residual value. Goodwill represents the excess of the total purchase price paid for North Bay over the fair values of the assets acquired, net of the fair values of liabilities assumed. Goodwill has been assigned to the Company’s Community Banking segment. Goodwill is not amortized, but is evaluated for possible impairment on a quarterly basis and more frequently if events and circumstances indicate that the asset might be impaired. In the second quarter of 2009, the Company recorded a goodwill impairment charge of $112.0 million related to the Community Banking segment. In the fourth quarter of 2009, the Company recognized an $804,000 impairment related to the merchant servicing portfolio obtained through the North Bay acquisition. No other impairment losses have been recognized in connection with other intangible assets during the period from acquisition to December 31, 2009.
108
Table of Contents
Umpqua Holdings Corporation and Subsidiaries
The following table presents unaudited pro forma results of operations for the year ended December 31, 2007 as if acquisition of North Bay had occurred on January 1, 2007. Any cost savings realized as a result of the mergers are not reflected in the pro forma consolidated condensed statement of operations. The pro forma results have been prepared for comparative purposes only and are not necessarily indicative of the results that would have been obtained had the acquisitions actually occurred on January 1, 2007:
Pro Forma Consolidated Condensed Statement of Operation
(in thousands, except per share data)
| Year Ended December 31, 2007 | ||||||||||||||
| Umpqua | North Bay (a) |
Pro Forma Adjustments |
Pro Forma Combined |
|||||||||||
| Net interest income |
$ | 285,954 | $ | 8,829 | $ | 18 | (b) | $ | 294,801 | |||||
| Provision for loan and lease losses |
41,730 | — | — | 41,730 | ||||||||||
| Non-interest income |
64,829 | 1,450 | — | 66,279 | ||||||||||
| Non-interest expense |
214,122 | 7,063 | (2,711 | )(c) | 218,474 | |||||||||
| Income before income taxes |
94,931 | 3,216 | 2,729 | 100,876 | ||||||||||
| Provision for income taxes |
31,663 | 1,066 | 1,092 | (d) | 33,821 | |||||||||
| Net income |
$ | 63,268 | $ | 2,150 | $ | 1,637 | $ | 67,055 | ||||||
| Net earnings available to common shareholders |
$ | 63,081 | $ | 66,857 | ||||||||||
| Earnings per common share: |
||||||||||||||
| Basic |
$ | 1.05 | $ | 1.09 | ||||||||||
| Diluted |
$ | 1.04 | $ | 1.08 | ||||||||||
| Average common shares outstanding: |
||||||||||||||
| Basic |
59,828 | 1,325 | 302 | (e) | 61,455 | |||||||||
| Diluted |
60,404 | 1,376 | 314 | (e) | 62,094 | |||||||||
| (a) | North Bay amounts represent results from January 1, 2007 to acquisition date of April 26, 2007. |
| (b) | Consists of additional net accretion of fair value adjustments related to the North Bay acquisition. |
| (c) | Consists of merger related expenses of $3.3 million at Umpqua, adjusted for amortization of intangible assets and premises purchase accounting adjustment related to the North Bay acquisition. |
| (d) | Income tax effect of pro forma adjustments at 40%. |
| (e) | Additional shares issued at an exchange ratio of 1.228:1. |
The following table summarizes activity in the Company’s accrued restructuring charges during the year ended December 31, 2009 related to the North Bay acquisition and are recorded in other liabilities.
Accrued Restructuring Charges
(in thousands)
| Beginning balance |
$ | 122 | ||
| Additions: |
||||
| Severance, retention and other compensation |
2 | |||
| Utilization: |
||||
| Cash payments |
(124 | ) | ||
| Ending Balance |
$ | — | ||
The Company incurs significant expenses related to mergers that cannot be capitalized. Generally, these expenses begin to be recognized while due diligence is being conducted and continue until such time as all systems have been converted and operational functions become fully integrated. Merger-related expenses are presented as a line item on the Consolidated Statements of Operations.
109
Table of Contents
The following table presents the key components of merger-related expense for years ended December 31, 2009 and 2007. The Company incurred no merger-related expenses in 2008. Substantially all of the merger-related expenses incurred during 2009 were in connection with the FDIC-assisted purchase and assumption of certain assets and liabilities of the Bank of Clark County and substantially all of the merger-related expenses incurred during 2007 were in connection with the North Bay acquisition.
Merger-Related Expense
(in thousands)
| 2009 | 2007 | ||||||
| Professional fees |
$ | 143 | $ | 982 | |||
| Compensation and relocation |
39 | 1,077 | |||||
| Communications |
61 | 478 | |||||
| Premises and equipment |
2 | 188 | |||||
| Other |
28 | 593 | |||||
| Total |
$ | 273 | $ | 3,318 | |||
No additional merger-related expenses are expected in connection with the FDIC-assisted purchase and assumption of certain assets and liabilities of the Bank of Clark County, the North Bay acquisition or any other prior acquisitions.
NOTE 3. CASH AND DUE FROM BANKS
The Bank is required to maintain an average reserve balance with the Federal Reserve Bank or maintain such reserve balance in the form of cash. The amount of required reserve balance at December 31, 2009 and 2008 was approximately $58.6 million and $58.4 million, respectively, and was met by holding cash and maintaining an average balance with the Federal Reserve Bank.
NOTE 4. INVESTMENT SECURITIES
The following table presents the amortized costs, unrealized gains, unrealized losses and approximate fair values of investment securities at December 31, 2009 and 2008:
December 31, 2009
(in thousands)
| Amortized Cost |
Unrealized Gains |
Unrealized Losses |
Fair Value | ||||||||||
| AVAILABLE FOR SALE: |
|||||||||||||
| U.S. Treasury and agencies |
$ | 11,588 | $ | 208 | $ | (2 | ) | $ | 11,794 | ||||
| Obligations of states and political subdivisions |
205,549 | 6,480 | (204 | ) | 211,825 | ||||||||
| Residential mortgage-backed securities and collateralized mortgage obligations |
1,533,149 | 40,272 | (3,572 | ) | 1,569,849 | ||||||||
| Other debt securities |
145 | 14 | — | 159 | |||||||||
| Investments in mutual funds and other equity securities |
1,959 | 30 | — | 1,989 | |||||||||
| $ | 1,752,390 | $ | 47,004 | $ | (3,778 | ) | $ | 1,795,616 | |||||
| HELD TO MATURITY: |
|||||||||||||
| Obligations of states and political subdivisions |
$ | 3,216 | $ | 11 | $ | — | $ | 3,227 | |||||
| Residential mortgage-backed securities and collateralized mortgage obligations |
2,845 | 251 | (187 | ) | 2,909 | ||||||||
| $ | 6,061 | $ | 262 | $ | (187 | ) | $ | 6,136 | |||||
110
Table of Contents
Umpqua Holdings Corporation and Subsidiaries
December 31, 2008
(in thousands)
| Amortized Cost |
Unrealized Gains |
Unrealized Losses |
Fair Value | ||||||||||
| AVAILABLE FOR SALE: |
|||||||||||||
| U.S. Treasury and agencies |
$ | 30,831 | $ | 401 | $ | (6 | ) | $ | 31,226 | ||||
| Obligations of states and political subdivisions |
176,966 | 3,959 | (1,340 | ) | 179,585 | ||||||||
| Residential mortgage-backed securities and collateralized mortgage obligations |
1,000,155 | 26,726 | (1,586 | ) | 1,025,295 | ||||||||
| Other debt securities |
884 | — | (250 | ) | 634 | ||||||||
| Investments in mutual funds and other equity securities |
1,959 | 13 | — | 1,972 | |||||||||
| $ | 1,210,795 | $ | 31,099 | $ | (3,182 | ) | $ | 1,238,712 | |||||
| HELD TO MATURITY: |
|||||||||||||
| Obligations of states and political subdivisions |
$ | 4,166 | $ | 8 | $ | (75 | ) | $ | 4,099 | ||||
| Residential mortgage-backed securities and collateralized mortgage obligations |
11,496 | 1 | (7,367 | ) | 4,130 | ||||||||
| Other investment securities |
150 | — | — | 150 | |||||||||
| $ | 15,812 | $ | 9 | $ | (7,442 | ) | $ | 8,379 | |||||
Investment securities that were in an unrealized loss position as of December 31, 2009 and 2008 are presented in the following tables, based on the length of time individual securities have been in an unrealized loss position. In the opinion of management, these securities are considered only temporarily impaired due to changes in market interest rates or the widening of market spreads subsequent to the initial purchase of the securities, and not due to concerns regarding the underlying credit of the issuers or the underlying collateral:
December 31, 2009
(in thousands)
| Less than 12 Months | 12 Months or Longer | Total | ||||||||||||||||
| Fair Value |
Unrealized Losses |
Fair Value |
Unrealized Losses |
Fair Value |
Unrealized Losses | |||||||||||||
| AVAILABLE FOR SALE: |
||||||||||||||||||
| U.S. Treasury and agencies |
$ | — | $ | — | $ | 133 | $ | 2 | $ | 133 | $ | 2 | ||||||
| Obligations of states and political subdivisions |
13,209 | 123 | 1,937 | 81 | 15,146 | 204 | ||||||||||||
| Residential mortgage-backed securities and collateralized mortgage obligations |
293,035 | 3,529 | 958 | 43 | 293,993 | 3,572 | ||||||||||||
| Total temporarily impaired securities |
$ | 306,244 | $ | 3,652 | $ | 3,028 | $ | 126 | $ | 309,272 | $ | 3,778 | ||||||
| HELD TO MATURITY: |
||||||||||||||||||
| Residential mortgage-backed securities and collateralized mortgage obligations |
$ | — | $ | — | $ | 620 | $ | 187 | $ | 620 | $ | 187 | ||||||
| Total temporarily impaired securities |
$ | — | $ | — | $ | 620 | $ | 187 | $ | 620 | $ | 187 | ||||||
111
Table of Contents
December 31, 2008
(in thousands)
| Less than 12 Months | 12 Months or Longer | Total | ||||||||||||||||
| Fair Value |
Unrealized Losses |
Fair Value |
Unrealized Losses |
Fair Value |
Unrealized Losses | |||||||||||||
| AVAILABLE FOR SALE: |
||||||||||||||||||
| U.S. Treasury and agencies |
$ | 93 | $ | 2 | $ | 230 | $ | 4 | $ | 323 | $ | 6 | ||||||
| Obligations of states and political subdivisions |
43,341 | 1,291 | 5,520 | 49 | 48,861 | 1,340 | ||||||||||||
| Residential mortgage-backed securities and collateralized mortgage obligations |
103,323 | 1,083 | 41,262 | 503 | 144,585 | 1,586 | ||||||||||||
| Other debt securities |
— | — | 634 | 250 | 634 | 250 | ||||||||||||
| Total temporarily impaired securities |
$ | 146,757 | $ | 2,376 | $ | 47,646 | $ | 806 | $ | 194,403 | $ | 3,182 | ||||||
| HELD TO MATURITY: |
||||||||||||||||||
| Obligations of states and political subdivisions |
$ | 4,099 | $ | 75 | $ | — | $ | — | $ | 4,099 | $ | 75 | ||||||
| Residential mortgage-backed securities and collateralized mortgage obligations |
4,130 | 7,367 | — | — | 4,130 | 7,367 | ||||||||||||
| Total temporarily impaired securities |
$ | 8,229 | $ | 7,442 | $ | — | $ | — | $ | 8,229 | $ | 7,442 | ||||||
The unrealized losses on investments in U.S. Treasury and agencies securities were caused by interest rate increases subsequent to the purchase of these securities. The contractual terms of these investments do not permit the issuer to settle the securities at a price less than par. Because the Bank does not intend to sell the securities in this class and it is not likely that the Bank will be required to sell these securities before recovery of their amortized cost bases, which may include holding each security until contractual maturity, the unrealized losses on these investments are not considered other-than-temporarily impaired.
Of the residential mortgage-backed securities and collateralized mortgage obligations portfolio in an unrealized loss position at December 31, 2009, 99.8% are issued or guaranteed by governmental agencies. The unrealized losses on residential mortgage-backed securities and collateralized mortgage obligations were caused by changes in market interest rates or the widening of market spreads subsequent to the initial purchase of these securities, and not concerns regarding the underlying credit of the issuers or the underlying collateral. It is expected that these securities will not be settled at a price less than the amortized cost of each investment. Because the decline in fair value is attributable to changes in interest rates or widening market spreads and not credit quality, and because the Bank does not intend to sell the securities in this class and it is not likely that the Bank will be required to sell these securities before recovery of their amortized cost bases, which may include holding each security until contractual maturity, the unrealized losses on these investments are not considered other-than-temporarily impaired.
The unrealized losses on obligations of political subdivisions were caused by changes in market interest rates or the widening of market spreads subsequent to the initial purchase of these securities. Management monitors published credit ratings of these securities and no adverse ratings changes have occurred since the date of purchase of obligations of political subdivisions which are in an unrealized loss position as of December 31, 2009. Because the decline in fair value is attributable to changes in interest rates or widening market spreads and not credit quality, and because the Bank does not intend to sell the securities in this class and it is not likely that Bank will be required to sell these securities before recovery of their amortized cost bases, which may include holding each security until maturity, the unrealized losses on these investments are not considered other-than-temporarily impaired.
During the third quarter of 2008, the Bank initiated a redemption-in-kind of shares owned in an intermediate mortgage fund, and received its proportionate share of the underlying securities within the fund. As of the date of the redemption, the book value of the fund was $28.6 million with a market value of $20.7 million, resulting in a $7.9 million unrealized loss. The composition of fund’s book value included 70% of non-agency mortgage-backed securities and collateralized mortgage
112
Table of Contents
Umpqua Holdings Corporation and Subsidiaries
obligations, 24% of agency mortgage-backed securities and collateralized mortgage obligations, 2% of U.S. Treasuries and 4% in cash equivalents. Of the $7.9 million unrealized loss, 94% related to the non-agency residential mortgage-backed securities and collateralized mortgage obligations, and the remainder related to the agency residential mortgage-backed securities and collateralized mortgage obligations. The transaction was accounted for as a nonmonetary exchange. The carrying value of the equity interest in the mortgage fund was allocated to the individual securities. No gain or loss was realized as a result of the redemption.
As part of this redemption in kind, the Company assessed the classification of the underlying securities acquired and elected to classify $12.6 million in non-agency mortgage-backed securities and collateralized mortgage obligations at fair value as investment securities held to maturity. The Company considers the held to maturity classification to be more appropriate because it has the ability and the intent to hold these securities to maturity. The book value of the securities was recorded at fair value as of the date of the transfer, resulting in a discount to par. This discount is being accreted to interest income over the remaining terms of the securities. The related unrealized pretax loss of $7.5 million included in other comprehensive income as of the date of the transfer remains in other comprehensive income and is being amortized as a yield adjustment through earnings over the remaining term of the securities, and will offset the accretion of the discount. No gain or loss was recognized at the time of the classification.
We review investment securities on an ongoing basis for the presence of other-than-temporary impairment (“OTTI”) or permanent impairment, taking into consideration current market conditions, fair value in relationship to cost, extent and nature of the decline in fair value, issuer rating changes and trends, whether we intend to sell a security or if it is likely that we will be required to sell the security before recovery of our amortized cost basis of the investment, which may be maturity, and other factors.
The following tables present the OTTI losses for the years ended December 31, 2009 and 2008. There were no similar charges recorded in 2007.
(in thousands)
| 2009 | 2008 | ||||||||||||
| Held To Maturity |
Available For Sale |
Held To Maturity |
Available For Sale |
||||||||||
| Total other-than-temporary impairment losses |
$ | 12,317 | $ | 239 | $ | 4,041 | $ | 139 | |||||
| Portion of other-than-temporary impairment losses recognized in other comprehensive income(1) |
1,983 | — | — | — | |||||||||
| Net impairment losses recognized in earnings(2) |
$ | 10,334 | $ | 239 | $ | 4,041 | $ | 139 | |||||
| (1) | Represents other-than-temporary impairment losses related to all other factors. |
| (2) | Represents other-than-temporary impairment losses related to credit losses. |
New guidance related to the recognition and presentation of OTTI of debt securities became effective beginning in the second quarter of 2009. Rather than asserting whether a Company has the ability and intent to hold an investment until a market price recovery, a Company must consider whether they intend to sell a security or if it is likely that they would be required to sell the security before recovery of the amortized cost basis of the investment, which may be maturity. The $8.2 million in OTTI recognized on investment securities held to maturity subsequent to March 31, 2009 primarily relates to 29 non-agency residential collateralized mortgage obligations. Each of these securities holds various levels of credit subordination. The underlying mortgage loans of these securities were originated from 2003 through 2007. At origination, the weighted average loan-to-value of the underlying mortgages was 69%; the underlying borrowers had weighted average FICO scores of 731, and 59% were limited documentation loans. These securities are valued by third-party pricing services using matrix or model pricing methodologies and were corroborated by broker indicative bids. We estimate cash flows of the underlying collateral for each security considering credit, interest and prepayment risk models that incorporate management’s estimate of projected key assumptions including prepayment rates, collateral default rates and loss severity. We review the actual collateral performance
113
Table of Contents
of these securities to support our estimation of the projected key assumptions utilized to determine future estimated cash flows. Assumptions utilized vary from security to security, and are influenced by factors such as loan interest rates, geographic location, borrower characteristics and vintage, and historical experience. We then used a third party to obtain information about the structure of each security, including subordination and other credit enhancements, in order to determine how the underlying collateral cash flows will be distributed to each security issued in the structure. These cash flows are then discounted at the interest rate used to recognize interest income on each security. The following table presents a summary of the significant inputs utilized to measure management’s estimate of the credit loss component on these non-agency residential collateralized mortgage obligations as of December 31, 2009:
| Range | Weighted Average |
||||||||
| Minimum | Maximum | ||||||||
| Constant prepayment rate |
4.0 | % | 25.0 | % | 14.8 | % | |||
| Collateral default rate |
8.0 | % | 45.0 | % | 16.7 | % | |||
| Loss severity |
20.0 | % | 40.0 | % | 31.4 | % | |||
In the second quarter of 2009 the Company recorded an OTTI charge of $239,000 related to an available for sale collateralized debt obligation that holds trust preferred securities. Management noted certain deferrals and defaults in the pool and believes the impairment represents credit loss in its entirety.
The following table presents a rollforward of the credit loss component of held to maturity debt securities that have been written down for OTTI with the credit loss component recognized in earnings and the remaining impairment loss related to all other factors recognized in OCI for nine months ended December 31, 2009, since the adoption of the revised guidance related to the recognition and presentation of OTTI of debt securities:
(in thousands)
| Nine months ended December 31, 2009 |
||||
| Balance, beginning of period |
$ | 5,952 | ||
| Additions: |
||||
| Initial OTTI credit losses |
7,211 | |||
| Subsequent OTTI credit losses |
986 | |||
| Reductions: |
||||
| Securities sold, matured or paid-off |
(1,785 | ) | ||
| Balance, end of period |
$ | 12,364 | ||
Prior to the Company’s adoption of the new guidance related to the recognition and presentation of OTTI of debt securities which became effective in the second quarter of 2009, the Company would assess an OTTI or permanent impairment based on the nature of the decline and whether the Company had the ability and intent to hold the investments until a market price recovery. In the three months ended March 31, 2009, the Company recorded a $2.1 million OTTI charge. This charge related to three non-agency residential collateralized mortgage obligations carried as held to maturity for which the default rates and loss severities of the underlying collateral and credit coverage ratios of the security indicated that it was probable that credit losses were expected to occur. In 2008, the Company recorded $4.2 million in OTTI. Charges of $3.8 million related to seven non-agency residential collateralized mortgage obligations carried as held to maturity for which the default rates and loss severities of the underlying collateral and credit coverage ratios of the security indicated that it was probable that credit losses were expected to occur. These securities were valued by third party pricing services using matrix or model pricing methodologies, and were corroborated by broker indicative bids. The remaining non-agency securities within residential mortgage-backed securities and collateralized mortgage obligations carried as held to maturity were specifically evaluated for OTTI, and the default rates and loss severities of the underlying collateral indicated that credit losses are not expected to occur. Upon adoption of the new OTTI guidance in the second quarter of 2009, the Company analyzed these securities as well as
114
Table of Contents
Umpqua Holdings Corporation and Subsidiaries
other securities where OTTI had been previously recognized, and determined that as of the adoption date such losses were credit related. As such, there was no cumulative effect adjustment to the opening balance of retained earnings or a corresponding adjustment to accumulated OCI.
In addition, during 2008 the Company recorded an OTTI charge of $139,000 related to a collateralized debt obligation that holds trust preferred securities in investments available for sale where default and deferrals on the underlying debt indicate credit losses are expected to occur within the security. An additional $225,000 charge was recognized during 2008 for preferred stock carried as an investment held to maturity.
The following table presents the maturities of investment securities at December 31, 2009:
(in thousands)
| Available For Sale | Held To Maturity | ||||||||||||
| Amortized Cost |
Fair Value |
Amortized Cost |
Fair Value |
||||||||||
| AMOUNTS MATURING IN: |
|||||||||||||
| Three months or less |
$ | 11,309 | $ | 11,357 | $ | 340 | $ | 341 | |||||
| Over three months through twelve months |
70,151 | 71,465 | 1,026 | 1,030 | |||||||||
| After one year through five years |
1,301,965 | 1,336,573 | 3,771 | 3,841 | |||||||||
| After five years through ten years |
336,800 | 343,959 | 847 | 845 | |||||||||
| After ten years |
30,206 | 30,273 | 77 | 79 | |||||||||
| Other investment securities |
1,959 | 1,989 | — | — | |||||||||
| $ | 1,752,390 | $ | 1,795,616 | $ | 6,061 | $ | 6,136 | ||||||
The amortized cost and fair value of collateralized mortgage obligations and mortgage-backed securities are presented by expected average life, rather than contractual maturity, in the preceding table. Expected maturities may differ from contractual maturities because borrowers have the right to prepay underlying loans without prepayment penalties.
The following table presents the gross realized gains and gross realized losses on the sale of securities available for sale for the years ended December 31, 2009, 2008 and 2007:
(in thousands)
| 2009 | 2008 | 2007 | |||||||||||||||
| Gains | Losses | Gains | Losses | Gains | Losses | ||||||||||||
| U.S. Treasury and agencies |
$ — | $ | — | $ | 522 | $ | — | $ | 44 | $ | 78 | ||||||
| Obligations of states and political subdivisions |
— | 1 | 6 | — | 16 | 8 | |||||||||||
| Residential mortgage-backed securities and collateralized mortgage obligations |
9,409 | 591 | 6,681 | 145 | 13 | — | |||||||||||
| Investments in mutual funds and other equity securities |
— | — | — | 1,535 | — | — | |||||||||||
| $9,409 | $ | 592 | $ | 7,209 | $ | 1,680 | $ | 73 | $ | 86 | |||||||
The following table presents, as of December 31, 2009, investment securities which were pledged to secure borrowings and public deposits as permitted or required by law:
(in thousands)
| Amortized Cost | Fair Value | ||||||
| To Federal Home Loan Bank to secure borrowings |
$ | 373,145 | $ | 386,013 | |||
| To state and local governments to secure public deposits |
817,533 | 831,367 | |||||
| To U.S. Treasury and Federal Reserve to secure customer tax payments |
6,989 | 7,218 | |||||
| Other securities pledged, principally to secure deposits |
267,839 | 275,933 | |||||
| Total pledged securities |
$ | 1,465,506 | $ | 1,500,531 | |||
The carrying value of investment securities pledged as of December 31, 2008 was $1.1 billion.
115
Table of Contents
NOTE 5. LOANS, LEASES AND ALLOWANCE FOR LOAN AND LEASE LOSSES
The following table presents the major types of loans recorded in the balance sheets as of December 31, 2009 and 2008:
(in thousands)
| 2009 | 2008 | |||||||
| Real estate—construction and land development |
$618,476 | $931,090 | ||||||
| Real estate—commercial and agricultural |
3,482,687 | 3,236,645 | ||||||
| Real estate—single and multi-family residential |
726,658 | 661,723 | ||||||
| Commercial, industrial and agricultural |
1,090,275 | 1,211,167 | ||||||
| Leases |
34,528 | 40,155 | ||||||
| Installment and other |
58,044 | 62,044 | ||||||
| 6,010,668 | 6,142,824 | |||||||
| Deferred loan fees, net |
(11,401 | ) | (11,450 | ) | ||||
| Total loans and leases |
$ | 5,999,267 | $ | 6,131,374 | ||||
The following table summarizes activity related to the allowance for loan and lease losses for the years ended December 31, 2009, 2008 and 2007:
(in thousands)
| 2009 | 2008 | 2007 | |||||||
| Balance, beginning of year |
$95,865 | $84,904 | $60,090 | ||||||
| Provision for loan and lease losses |
209,124 | 107,678 | 41,730 | ||||||
| Charge-offs |
(200,867 | ) | (101,052 | ) | (24,730 | ) | |||
| Recoveries |
3,535 | 4,335 | 2,736 | ||||||
| Acquisitions |
— | — | 5,078 | ||||||
| Balance, end of year |
$107,657 | $95,865 | $84,904 | ||||||
At December 31, 2009, the recorded investment in loans classified as impaired totaled $328.0 million, with a corresponding valuation allowance (included in the allowance for loan and lease losses) of $2.7 million. Due to declining real estate values in our markets, it is increasingly likely that an impairment reserve on collateral dependent real estate loans represents a confirmed loss. As a result, the Company recognizes the charge-off of impairment reserves on impaired loans in the period it arises for collateral dependent loans.
Therefore, the non-accrual loans as of December 31, 2009 have already been written-down to their estimated net realizable value, based on disposition value, and are expected to be resolved with no additional material loss, absent further decline in market prices. The valuation allowance on impaired loans primarily represents the impairment reserves on performing restructured loans, and is measured by comparing the present value of expected future cash flows on the restructured loans discounted at the interest rate of the original loan agreement to the loan’s carrying value. At December 31, 2008, the total recorded investment in impaired loans was $151.5 million, with no corresponding valuation allowance. The average recorded investment in impaired loans was approximately $234.5 million, $116.6 million and $45.7 million for the years ended December 31, 2009, 2008 and 2007, respectively.
At December 31, 2009 and December 31, 2008, impaired loans of $134.9 million and $23.5 million were classified as accruing restructured loans, respectively. The restructurings were granted in response to borrower financial difficulty, and generally provide for a temporary modification of loan repayment terms. The restructured loans on accrual status represent the only impaired loans accruing interest at each respective date. In order for a restructured loan to be considered for accrual status, the loan’s collateral coverage generally will be greater than or equal to 100% of the loan balance, the loan is current on payments, and the borrower must either prefund an interest reserve or demonstrate the ability to make payments from a verified source of
116
Table of Contents
Umpqua Holdings Corporation and Subsidiaries
cash flow. The Company has obligations to lend $455,000 of additional funds on the restructured loans as of December 31, 2009, which primarily relate to one residential development project. For the years ended December 31, 2009, 2008 and 2007, interest income of approximately $2.4 million, $732,000 and $135,000, respectively, was recognized in connection with impaired loans. The impaired loans for which these interest income amounts were recognized primarily relate to accruing restructured loans.
Non-accrual loans totaled $193.1 million at December 31, 2009, and $127.9 million at December 31, 2008. Had these non-accrual loans performed according to their original terms, additional interest income of approximately $9.6 million, $7.2 million, and $4.7 million would have been recognized in 2009, 2008 and 2007, respectively.
As of December 31, 2009, loans totaling $2.9 billion were pledged to secure borrowings.
NOTE 6. PREMISES AND EQUIPMENT
The following table presents the major components of premises and equipment at December 31, 2009 and 2008:
(in thousands)
| 2009 | 2008 | |||||||
| Land |
$ | 14,132 | $ | 14,175 | ||||
| Buildings and improvements |
94,583 | 92,540 | ||||||
| Furniture, fixtures and equipment |
87,885 | 81,218 | ||||||
| Construction in progress |
3,971 | 2,566 | ||||||
| Total premises and equipment |
200,571 | 190,499 | ||||||
| Less: Accumulated depreciation and amortization |
(97,305 | ) | (85,805 | ) | ||||
| Premises and equipment, net |
$ | 103,266 | $ | 104,694 | ||||
Depreciation expense totaled $12.8 million, $11.8 million and $10.9 million for the years ended December 31, 2009, 2008 and 2007, respectively.
Umpqua’s subsidiaries have entered into a number of non-cancelable lease agreements with respect to premises and equipment. See Note 18 for more information regarding rental expense, net of rent income, and minimum annual rental commitments under non-cancelable lease agreements.
117
Table of Contents
NOTE 7. GOODWILL AND OTHER INTANGIBLE ASSETS
The following table summarizes the changes in the Company’s goodwill and other intangible assets for the years ended December 31, 2006, 2007, 2008, and 2009. Goodwill is reflected by operating segment; all other intangible assets are related to the Community Banking segment.
(in thousands)
| Goodwill | |||||||||||||||||||||||
| Community Banking | Retail Brokerage | ||||||||||||||||||||||
| Gross | Accumulated Impairment |
Total | Gross | Accumulated Impairment |
Total | ||||||||||||||||||
| Balance, December 31, 2006 |
$ | 642,241 | $ | — | $ | 642,241 | $ | 3,697 | $ | — | $ | 3,697 | |||||||||||
| Net additions |
77,329 | — | 77,329 | — | — | — | |||||||||||||||||
| Amortization |
— | — | — | — | — | — | |||||||||||||||||
| Balance, December 31, 2007 |
719,570 | — | 719,570 | 3,697 | — | 3,697 | |||||||||||||||||
| Reductions |
(234 | ) | — | (234 | ) | — | — | — | |||||||||||||||
| Impairment |
— | — | — | — | (982 | ) | (982 | ) | |||||||||||||||
| Balance, December 31, 2008 |
719,336 | — | 719,336 | 3,697 | (982 | ) | 2,715 | ||||||||||||||||
| Reductions |
(81 | ) | — | (81 | ) | — | — | — | |||||||||||||||
| Impairment |
— | (111,952 | ) | (111,952 | ) | — | — | — | |||||||||||||||
| Balance, December 31, 2009 |
$ | 719,255 | $ | (111,952 | ) | $ | 607,303 | $ | 3,697 | $ | (982 | ) | $ | 2,715 | |||||||||
| Other Intangible Assets | |||||||||||
| Gross | Accumulated Amortization |
Net | |||||||||
| Balance, December 31, 2006 |
$ | 42,035 | $ | (8,480 | ) | $ | 33,555 | ||||
| Net additions |
14,178 | — | 14,178 | ||||||||
| Amortization |
— | (6,094 | ) | (6,094 | ) | ||||||
| Balance, December 31, 2007 |
56,213 | (14,574 | ) | 41,639 | |||||||
| Amortization |
— | (5,857 | ) | (16,094 | ) | ||||||
| Balance, December 31, 2008 |
56,213 | (20,431 | ) | 35,782 | |||||||
| Impairment |
— | (804 | ) | (804 | ) | ||||||
| Amortization |
— | (5,362 | ) | (5,362 | ) | ||||||
| Balance, December 31, 2009 |
$ | 56,213 | $ | (26,597 | ) | $ | 29,616 | ||||
Goodwill additions of $78.8 million in 2007 related primarily to the North Bay acquisition, and represented the excess of the total purchase price paid over the fair values of the assets acquired, net of the fair values of liabilities assumed. Additional information on the acquisition and purchase price allocation is provided in Note 2. The reductions to goodwill include decreases of $81,000, $234,000 and $2.6 million (included in net additions) in 2009, 2008 and 2007, respectively, due to the recognition of tax benefits upon exercise of fully vested acquired options.
The Company performs a goodwill impairment analysis on an annual basis as of December 31. Additionally, the Company performs a goodwill impairment evaluation on an interim basis when events or circumstances indicate impairment potentially exists. A significant amount of judgment is involved in determining if an indicator of impairment has occurred. Such indicators may include, among others, a significant decline in our expected future cash flows; a sustained, significant decline in our stock price and market capitalization; a significant adverse change in legal factors or in the business climate; adverse action or assessment by a regulator; and unanticipated competition.
The goodwill impairment test involves a two-step process. The first step compares the fair value of a reporting unit to its carrying value. If the reporting unit’s fair value is less than its carrying value, the Company would be required to proceed to the
118
Table of Contents
Umpqua Holdings Corporation and Subsidiaries
second step. In the second step the Company calculates the implied fair value of the reporting unit’s goodwill. The implied fair value of goodwill is determined in the same manner as goodwill recognized in a business combination. The estimated fair value of the Company is allocated to all of the Company’s assets and liabilities, including any unrecognized identifiable intangible assets, as if the Company had been acquired in a business combination and the estimated fair value of the reporting unit is the price paid to acquire it. The allocation process is performed only for purposes of determining the amount of goodwill impairment. No assets or liabilities are written up or down, nor are any additional unrecognized identifiable intangible assets recorded as a part of this process. Any excess of the estimated purchase price over the fair value of the reporting unit’s net assets represents the implied fair value of goodwill. If the carrying amount of the goodwill is greater than the implied fair value of that goodwill, an impairment loss would be recognized as a charge to earnings in an amount equal to that excess.
The Company performed a goodwill impairment analysis of the Community Banking operating segment as of June 30, 2009, due to a further decline in the Company’s market capitalization below book value of equity and continued weakness in the banking industry. The Company engaged an independent valuation consultant to assist us in determining whether and to what extent our goodwill asset was impaired. The results of the Company’s and valuation specialist’s step one impairment test indicated that the reporting unit’s fair value was less than its carrying value, and therefore the Company performed a step two analysis.
As part of the second step of the goodwill impairment analysis, we calculated the fair value of the reporting unit’s assets and liabilities, as well as its unrecognized identifiable intangible assets, such as the core deposit intangible and trade name. Fair value adjustments to items on the balance sheet primarily related to investment securities held to maturity, loans, other real estate owned, Visa Class B common stock, deferred taxes, deposits, term debt, and junior subordinated debentures carried at amortized cost. The external valuation specialist assisted management to estimate the fair value of our unrecognized identifiable assets, such as the core deposit intangible and trade name.
The most significant fair value adjustment made in this analysis was to adjust the carrying value of the Company’s loans receivable portfolio to fair value. The fair value of the Company’s loan receivable portfolio at June 30, 2009 was estimated in a manner similar to methodology utilized as part of the December 31, 2008 goodwill impairment evaluation. As part of the December 31, 2008 loan valuation, the loan portfolio was stratified into sixty-eight loan pools that shared common characteristics, namely loan type, payment terms, and whether the loans were performing or non-performing. Each loan pool was discounted at a rate that considers current market interest rates, credit risk, and assumed liquidity premiums required based upon the nature of the underlying pool. Due to the disruption in the financial markets experienced during 2008 and continuing through 2009, the liquidity premium reflects the reduction in demand in the secondary markets for all grades of non-conforming credit, including those that are performing. Liquidity premiums for individual loan categories generally ranged from 4.6% for performing loans to 30% for construction and non-performing loans. At December 31, 2008, the fair value of the overall loan portfolio was calculated to be at a 9% discount relative to its book value. The composition of the loan portfolio at June 30, 2009, including loan type and performance indicators, was substantially similar to the loan portfolio at December 31, 2008. At June 30, 2009, the fair value of the loan portfolio was estimated to be at a 12% discount relative to its carrying value. The additional discount is primarily attributed to the additional liquidity premium required as of the measurement date associated with the Company’s concentration of commercial real estate loans.
Other significant fair value adjustments utilized in this goodwill impairment analysis included the value of the core deposit intangible asset which was calculated as 0.53% of core deposits, and includes all deposits except certificates of deposit. The carrying value of other real estate owned was discounted by 25%, representing a liquidity adjustment given the current market conditions. The fair value of our trade name, which represents the competitive advantage associated with our brand recognition and ability to attract and retain relationships, was estimated to be $19.3 million. The fair value of our junior subordinated debentures carried at amortized cost was determined in a manner and utilized inputs, primarily the credit risk adjusted spread, consistent with our methodology for determining the fair value of junior subordinated debentures recorded at fair value. Information relating to our methodologies for estimating the fair value of financial instruments that were adjusted to fair value as part of this analysis, including the Visa Class B common stock, deposits, term debt, and junior subordinated debentures, is included in Note 22.
119
Table of Contents
Based on the results of the step two analysis, the Company determined that the implied fair value of the goodwill was less than its carrying amount on the Company’s balance sheet, and as a result, recognized a goodwill impairment loss of $112.0 million in the second quarter of 2009. This write-down of goodwill is a non-cash charge that does not affect the Company’s or the Bank’s liquidity or operations. In addition, because goodwill is excluded in the calculation of regulatory capital, the Company’s “well-capitalized” capital ratios were not affected by this charge.
The Company also conducted its annual evaluation of goodwill for impairment as of December 31, 2009. In the first step of the goodwill impairment test the Company determined that the fair value of the Community Banking reporting unit exceeded its carrying amount. This determination is consistent with the events occurring after the Company recognized the $112.0 million impairment of goodwill second quarter of 2009. First, the market capitalization and estimated fair value of the Company increased significantly subsequent to the recognition of the impairment charge as the fair value of the Company’s stock increased 73% from June 30, 2009 to December 31, 2009. Secondly, the Company’s successful public common stock offering in the third quarter of 2009 diluted the carrying value of the reporting unit’s book equity on a per share basis, against which the fair value of the reporting unit is measured. The significant assumptions and methodology utilized to test for goodwill impairment as of December 31, 2009 were consistent with the impairment evaluations performed throughout the year.
If the Company’s common stock price declines further or continues to trade below book value per common share, or should general economic conditions deteriorate further or remain depressed for a prolonged period of time, particularly in the financial industry, the Company may be required to recognize additional impairment of all, or some portion of, its goodwill. It is possible that changes in circumstances, existing at the measurement date or at other times in the future, or changes in the numerous estimates associated with management’s judgments, assumptions and estimates made in assessing the fair value of our goodwill, such as valuation multiples, discount rates, or projected earnings, could result in an impairment charge in future periods. Additional impairment charges, if any, may be material to the Company’s results of operations and financial position. However, any potential future impairment charge will have no effect on the Company’s or the Bank’s cash balances, liquidity, or regulatory capital ratios.
The inputs management utilizes to estimate the fair value of a reporting unit in step one of the goodwill impairment test, and estimating the fair values of the underlying assets and liabilities of a reporting unit in the second step of the goodwill impairment test, require management to make significant judgments, assumptions and estimates where observable market may not readily exist. Such inputs include, but are not limited to, trading multiples from comparable transactions, control premiums, the value that may arise from synergies and other benefits that would accrue from control over an entity, and the appropriate rates to discount projected cash flows.
Additionally, there may be limited current market inputs to value certain assets or liabilities, particularly loans and junior subordinated debentures. These valuation inputs are considered to be Level 3 inputs.
Management will continue to monitor the relationship of the Company’s market capitalization to both its book value and tangible book value, which management attributes to both financial services industry-wide and Company specific factors, and to evaluate the carrying value of goodwill and other intangible assets.
As a result of the December 31, 2008 goodwill impairment evaluation related to the Retail Brokerage reporting segment, management determined that there was a $1.0 million impairment following the departure of certain Umpqua Investments financial advisors. The valuation of the impairment at the Retail Brokerage operating segment was determined using an income approach by discounting cash flows of forecasted earnings. The key assumptions used to estimate the fair value of each reporting unit include earnings forecasts for five years, a terminal value based on expected future growth rates, and a discount rate reflective of current market conditions. The Company evaluated the Retail Brokerage reporting segment’s goodwill for impairment as of December 31, 2009. The first step of the goodwill impairment test indicated that the reporting unit’s fair value exceeded its carrying value, therefore, no additional impairment was recognized.
In 2009, the Company recognized an $804,000 impairment related to the merchant servicing portfolio acquired in the North Bay acquisition as a result of a decrease in the actual and expected future cash flows related to the income stream. Additional information on intangible assets related to acquisitions is provided in Note 2.
120
Table of Contents
Umpqua Holdings Corporation and Subsidiaries
The table below presents the forecasted amortization expense for intangible assets acquired in all mergers:
(in thousands)
| Year | Expected Amortization | ||
| 2010 |
$ | 5,007 | |
| 2011 |
4,700 | ||
| 2012 |
4,590 | ||
| 2013 |
4,436 | ||
| 2014 |
4,232 | ||
| Thereafter |
6,651 | ||
| $ | 29,616 | ||
NOTE 8. MORTGAGE SERVICING RIGHTS
The following table presents the changes in the Company’s mortgage servicing rights (“MSR”) for the years ended December 31, 2009, 2008 and 2007:
(in thousands)
| 2009 | 2008 | 2007 | ||||||||||
| Balance, beginning of year |
$ | 8,205 | $ | 10,088 | $ | 9,952 | ||||||
| Additions for new mortgage servicing rights capitalized |
7,570 | 2,694 | 892 | |||||||||
| Changes in fair value: |
||||||||||||
| Due to changes in model inputs or assumptions(1) |
(3,469 | ) | (1,270 | ) | 595 | |||||||
| Other(2) |
319 | (3,307 | ) | (1,351 | ) | |||||||
| Balance, end of year |
$ | 12,625 | $ | 8,205 | $ | 10,088 | ||||||
| Balance of loans serviced for others |
$ | 1,277,832 | $ | 955,494 | $ | 870,680 | ||||||
| MSR as a percentage of serviced loans |
0.99% | 0.86% | 1.16% | |||||||||
| (1) | Principally reflects changes in discount rates and prepayment speed assumptions, which are primarily |
| affected by changes in interest rates. |
| (2) | Represents changes due to collection/realization of expected cash flows over time. |
The amount of contractually specified servicing fees, late fees and ancillary fees earned, recorded in mortgage banking revenue on the Consolidated Statements of Operations, were $3.0 million, $2.5 million and $2.5 million, respectively, for the years ended December 31, 2009, 2008 and 2007.
In the fourth quarter of 2007, the Company began using derivative instruments to hedge the risk of changes in the fair value of MSR due to changes in interest rates. During 2007, we recognized a loss of $334,000 related to MSR hedging activities, which was recorded in mortgage banking revenue on the consolidated statements of income. Starting in late February 2008 and continuing into March 2008, the bond markets experienced extraordinary volatility. This volatility resulted in widening spreads and price declines on the derivative instruments that were not offset by corresponding gains in the MSR asset. As a result, a $2.4 million charge was recognized within mortgage banking revenue in the first quarter of 2008. In March, the Company suspended the MSR hedge, given the continued volatility.
121
Table of Contents
NOTE 9. OTHER REAL ESTATE OWNED, NET
The following table presents the changes in other real estate owned (“OREO”), net of valuation allowance, for the years ended December 31, 2009, 2008 and 2007:
(in thousands)
| 2009 | 2008 | 2007 | ||||||||||
| Balance, beginning of period |
$ | 27,898 | $ | 6,943 | $ | — | ||||||
| Additions to OREO |
50,914 | 44,587 | 24,853 | |||||||||
| Dispositions of OREO |
(41,999 | ) | (18,548 | ) | (17,910 | ) | ||||||
| Valuation adjustments in the period |
(12,247 | ) | (5,084 | ) | — | |||||||
| Balance, end of period |
$ | 24,566 | $ | 27,898 | $ | 6,943 | ||||||
OREO properties are recorded at the lower of the recorded investment in the loan (prior to foreclosure) or the fair market value of the property less expected selling costs. The Company recognized valuation allowances of $11.4 million and $3.5 million on its OREO balances as of December 31, 2009 and 2008. The Company had no valuation allowance on OREO as of December 31, 2007. Valuation allowances on OREO balances are based on updated appraisals of the underlying properties as received during a period or management’s authorization to reduce the selling price of a property during the period.
NOTE 10. OTHER ASSETS
Other assets consisted of the following at December 31, 2009 and 2008:
(in thousands)
| 2009 | 2008 | ||||||
| Cash surrender value of life insurance policies |
$ | 86,853 | $ | 83,666 | |||
| Prepaid FDIC deposit assessment |
42,206 | — | |||||
| Accrued interest receivable |
29,261 | 29,488 | |||||
| Income taxes receivable |
24,071 | 7,767 | |||||
| Deferred tax assets, net |
16,881 | 8,854 | |||||
| FDIC settlement receivable |
7,977 | — | |||||
| Investment in unconsolidated Trusts |
6,933 | 6,954 | |||||
| Equity method investments—Homestead |
3,911 | 4,294 | |||||
| Equity method investments—WNC Fund |
3,336 | 3,657 | |||||
| Other |
29,953 | 18,698 | |||||
| Total |
$ | 251,382 | $ | 163,378 | |||
The Company invests in Homestead Capital and WNC Fund, limited partnerships, that operate qualified affordable housing projects to receive tax benefits in the form of tax deductions from operating losses and tax credits. The Company accounts for the investments under the equity method. The Company’s remaining capital commitments to these partnerships at December 31, 2009 and 2008 were approximately $199,000 and $1.7 million, respectively. Such amounts are included in other liabilities on the consolidated balance sheets. Also see Note 16 for information on the Company’s investment in Trusts. The FDIC settlement receivable relates to the FDIC-assisted purchase and assumption of certain assets and liabilities of the Bank of Clark County, and was collected in the first quarter of 2010.
122
Table of Contents
Umpqua Holdings Corporation and Subsidiaries
NOTE 11. INCOME TAXES
The following table presents the components of income tax (benefit) expense attributable to continuing operations included in the Consolidated Statements of Operations for the years ended December 31:
(in thousands)
| Current | Deferred | Total | ||||||||||
| YEAR ENDED DECEMBER 31, 2009: |
||||||||||||
| Federal |
$ | (24,339 | ) | $ | (7,471 | ) | $ | (31,810 | ) | |||
| State |
1,762 | (10,889 | ) | (9,127 | ) | |||||||
| $ | (22,577 | ) | $ | (18,360 | ) | $ | (40,937 | ) | ||||
| YEAR ENDED DECEMBER 31, 2008: |
||||||||||||
| Federal |
$ | 8,178 | $ | 10,949 | $ | 19,127 | ||||||
| State |
4,066 | (1,060 | ) | 3,006 | ||||||||
| $ | 12,244 | $ | 9,889 | $ | 22,133 | |||||||
| YEAR ENDED DECEMBER 31, 2007: |
||||||||||||
| Federal |
$ | 29,946 | $ | (3,793 | ) | $ | 26,153 | |||||
| State |
6,797 | (1,287 | ) | 5,510 | ||||||||
| $ | 36,743 | $ | (5,080 | ) | $ | 31,663 | ||||||
The following table presents a reconciliation of income taxes computed at the Federal statutory rate to the actual effective rate for the years ended December 31:
| 2009 | 2008 | 2007 | ||||
| Statutory Federal income tax rate |
35.0% | 35.0% | 35.0% | |||
| Goodwill impairment |
-20.0% | 0.5% | 0.0% | |||
| State tax, net of Federal income tax benefit |
2.9% | 3.2% | 3.8% | |||
| Tax-exempt income |
2.2% | -5.4% | -3.1% | |||
| Tax credits |
1.0% | -2.9% | -2.3% | |||
| Other |
-0.1% | -0.2% | 0.0% | |||
| Effective income tax rate |
21.0% | 30.2% | 33.4% | |||
123
Table of Contents
The following table reflects the effects of temporary differences that give rise to the components of the net deferred tax asset (recorded in other assets on the consolidated balance sheets) as of December 31:
(in thousands)
| 2009 | 2008 | ||||||
| DEFERRED TAX ASSETS: |
|||||||
| Allowance for loan and lease losses |
$ | 43,529 | $ | 38,422 | |||
| Tax credits |
13,871 | 10,199 | |||||
| Accrued severance and deferred compensation |
10,445 | 11,580 | |||||
| Other real estate owned |
4,369 | — | |||||
| Net operating loss carryforwards |
3,386 | — | |||||
| Discount on trust preferred securities |
2,891 | 3,053 | |||||
| Basis differences of stock and securities |
2,842 | — | |||||
| Loans |
1,927 | 1,759 | |||||
| Other |
7,579 | 8,722 | |||||
| Total gross deferred tax assets |
90,839 | 73,735 | |||||
| DEFERRED TAX LIABILITIES: |
|||||||
| Fair market value adjustment on junior subordinated debentures |
19,734 | 16,963 | |||||
| Unrealized gain on investment securities |
17,290 | 9,382 | |||||
| Intangibles |
12,943 | 15,378 | |||||
| Leased assets |
5,196 | 4,282 | |||||
| Mortgage servicing rights |
4,974 | 2,169 | |||||
| Deferred loan fees |
4,425 | 4,865 | |||||
| Premises and equipment depreciation |
4,334 | 5,819 | |||||
| Other |
5,062 | 6,023 | |||||
| Total gross deferred tax liabilities |
73,958 | 64,881 | |||||
| Net deferred tax assets |
$ | 16,881 | $ | 8,854 | |||
The Company has determined that it is not required to establish a valuation allowance for the deferred tax assets as management believes it is more likely than not that the deferred tax assets of $90.8 million and $73.7 million at December 31, 2009 and 2008, respectively, will be realized principally through carry-back to taxable income in prior years and future reversals of existing taxable temporary differences. Management further believes that future taxable income will be sufficient to realize the benefits of temporary deductible differences that cannot be realized through carry-back to prior years or through the reversal of future temporary taxable differences.
The tax credits consist of state tax credits of $9.5 million and $10.2 million at December 31, 2009 and 2008, respectively, and $4.3 million of alternative minimum tax and federal low income housing credits at December 31, 2009. The state tax credits, comprised primarily of State of Oregon Business Energy Tax Credits (“BETC”), will be utilized to offset future state income taxes. The Company made its first BETC purchase in 2004, and has made subsequent BETC purchases in each year thereafter. Most of the state tax credits benefit a five-year period, with an eight-year carry-forward allowed. Federal low income housing credits have a twenty-year carry forward and the alternative minimum tax credits may be carried forward indefinitely. Management believes, based upon the Company’s historical performance, that the deferred tax assets relating to these tax credits will be realized in the normal course of operations, and, accordingly, management has not reduced these deferred tax assets by a valuation allowance.
The Company has state net operating loss carry forwards of $5.1 million at December 31, 2009. The state net operating losses may be carried forward twenty years in California and fifteen years in Oregon. Management believes, based upon the Company’s historical performance, that the deferred tax assets relating to state net operating losses will be realized in the normal course of operations, and, accordingly, management has not reduced these deferred tax assets by a valuation allowance.
124
Table of Contents
Umpqua Holdings Corporation and Subsidiaries
The Company and its subsidiaries file income tax returns in the U.S. federal jurisdiction, as well as the Oregon and California state jurisdictions. Except for the California amended returns of an acquired institution for the tax years 2001, 2002, and 2003, and only as it relates to the net interest deduction taken on these amended returns, the Company is no longer subject to U.S. federal or Oregon state tax authority examinations for years before 2006 and California state tax authority examinations for years before 2004. The Internal Revenue Service concluded an examination of the Company’s U.S. income tax returns for 2003 and 2004 in the second quarter of 2006 and concluded an examination of the Company’s U.S. amended income tax return for 2005 in the third quarter of 2009. The results of these examinations had no significant impact on the Company’s financial statements.
The Company adopted the revised provisions of FASB ASC 740, Income Taxes, (“ASC 740”), relating to the accounting for uncertainty in income taxes on January 1, 2007. Upon the implementation of the revised provisions, the Company recognized no material adjustment in the form of a liability for unrecognized tax benefits. The Company periodically reviews its income tax positions based on tax laws and regulations and financial reporting considerations, and records adjustments as appropriate. This review takes into consideration the status of current taxing authorities’ examinations of the Company’s tax returns, recent positions taken by the taxing authorities on similar transactions, if any, and the overall tax environment.
The Company recorded a liability for unrecognized tax benefits relating to California tax incentives and temporary differences in the amount of $1.3 million and $895,000 during 2009 and 2008 respectively. The Company had gross unrecognized tax benefits recorded as of December 31, 2009 and 2008 in the amounts of $2.3 million and $1.0 million, respectively. If recognized the unrecognized tax benefit would impact the 2009 annual effective tax rate by -.26%. During 2009, the Company also accrued $201,000 of interest related to unrecognized tax benefits, which is reported by the Company as a component of tax expense. As of December 31, 2009, the accrued interest related to unrecognized tax benefits is $365,000.
Detailed below is a reconciliation of the Company’s unrecognized tax benefits, gross of any related tax benefits, for the years ended December 31, 2009 and 2008, respectively:
(in thousands)
| 2009 | 2008 | |||||||
| Balance, beginning of period |
$ | 1,042 | $ | — | ||||
| Changes based on tax positions related to the current year |
692 | (1,036 | ) | |||||
| Changes based on tax positions related to prior years |
589 | 2,078 | ||||||
| Reductions for tax positions of prior years |
(60 | ) | — | |||||
| Settlements |
— | — | ||||||
| Balance, end of period |
$ | 2,263 | $ | 1,042 | ||||
NOTE 12. INTEREST BEARING DEPOSITS
The following table presents the major types of interest bearing deposits at December 31, 2009 and 2008:
(in thousands)
| 2009 | 2008 | |||||
| Negotiable order of withdrawal (NOW) |
$ | 872,184 | $ | 752,931 | ||
| Savings and money market |
2,813,805 | 2,335,158 | ||||
| Time, $100,000 and over |
1,603,410 | 1,311,207 | ||||
| Other time less than $100,000 |
752,703 | 935,560 | ||||
| Total interest bearing deposits |
$ | 6,042,102 | $ | 5,334,856 | ||
125
Table of Contents
The following table presents interest expense for each deposit type for the years ended December 31, 2009, 2008 and 2007:
(in thousands)
| 2009 | 2008 | 2007 | |||||||
| NOW |
$ | 4,884 | $ | 8,005 | $ | 13,286 | |||
| Savings and money market |
27,457 | 47,734 | 79,784 | ||||||
| Time, $100,000 and over |
36,070 | 42,690 | 48,816 | ||||||
| Other time less than $100,000 |
20,331 | 30,941 | 38,954 | ||||||
| Total interest on deposits |
$ | 88,742 | $ | 129,370 | $ | 180,840 | |||
The following table presents the scheduled maturities of time deposits as of December 31, 2009:
(in thousands)
| 2010 |
$ | 2,144,543 | |
| 2011 |
141,313 | ||
| 2012 |
32,506 | ||
| 2013 |
15,904 | ||
| 2014 |
20,002 | ||
| Thereafter |
1,845 | ||
| Total time deposits |
$ | 2,356,113 | |
The following table presents the remaining maturities of time deposits of $100,000 or more as of December 31, 2009:
(in thousands)
| Three months or less |
$ | 560,056 | |
| Over three months through six months |
374,227 | ||
| Over six months through twelve months |
535,794 | ||
| Over twelve months |
133,333 | ||
| Time, $100,000 and over |
$ | 1,603,410 | |
NOTE 13. SECURITIES SOLD UNDER AGREEMENTS TO REPURCHASE
The following table presents information regarding securities sold under agreements to repurchase at December 31, 2009 and 2008:
(dollars in thousands)
| Repurchase Amount |
Weighted Average Interest Rate |
Carrying Value of Underlying Assets |
Market Value of Underlying Assets | |||||||||
| December 31, 2009 |
$ | 45,180 | 1.05 | % | $ | 46,166 | $ | 46,166 | ||||
| December 31, 2008 |
$ | 47,588 | 1.22 | % | $ | 48,626 | $ | 48,626 | ||||
The securities underlying agreements to repurchase entered into by the Bank are for the same securities originally sold, with a one-day maturity. In all cases, the Bank maintains control over the securities. Securities sold under agreements to repurchase averaged approximately $56.8 million, $47.7 million and $49.1 million for the years ended December 31, 2009, 2008 and 2007, respectively. The maximum amount outstanding at any month end for the years ended December 31, 2009, 2008 and 2007 was $64.3 million, $55.6 million and $59.6 million, respectively. Investment securities are pledged as collateral in an amount equal to or greater than the repurchase agreements.
126
Table of Contents
Umpqua Holdings Corporation and Subsidiaries
NOTE 14. FEDERAL FUNDS PURCHASED
At December 31, 2009 and 2008, the Company had no outstanding federal funds purchased balances. The Bank had available lines of credit with the FHLB totaling $2.0 billion at December 31, 2009. The Bank had uncommitted federal funds line of credit agreements with additional financial institutions totaling $100.0 million at December 31, 2009. At December 31, 2009, the lines of credit had interest rates ranging from 0.30% to 3.00%. Availability of the lines is subject to federal funds balances available for loan, continued borrower eligibility and are reviewed and renewed periodically throughout the year. These lines are intended to support short-term liquidity needs, and the agreements may restrict consecutive day usage.
NOTE 15. TERM DEBT
The Bank had outstanding secured advances from the FHLB and other creditors at December 31, 2009 and 2008 of $76.3 million and $206.5 million, respectively.
Future contractual maturities of borrowed funds (excluding purchase accounting adjustments) at December 31, 2009 are as follows:
(in thousands)
| Year | Amount | ||
| 2010 |
$ | 75,000 | |
| 2011 |
— | ||
| 2012 |
— | ||
| 2013 |
715 | ||
| 2014 |
— | ||
| Thereafter |
505 | ||
| Total borrowed funds |
$ | 76,220 | |
The maximum amount outstanding from the FHLB under term advances at month end during 2009 and 2008 was $205.9 million and $236.0 million, respectively. The average balance outstanding on FHLB term advances during 2009 and 2008 was $129.2 million and $193.5 million, respectively. The average interest rate on the borrowings (excluding the accretion of purchase accounting adjustments) was 3.59% in 2009 and 3.67% in 2008. The FHLB requires the Bank to maintain a required level of investment in FHLB and sufficient collateral to qualify for notes. The Bank has pledged as collateral for these notes all FHLB stock, all funds on deposit with the FHLB, and its investments and commercial real estate portfolios, accounts, general intangibles, equipment and other property in which a security interest can be granted by the Bank to the FHLB.
NOTE 16. JUNIOR SUBORDINATED DEBENTURES
As of December 31, 2009, the Company had 14 wholly-owned trusts (“Trusts”), including a Master Trust formed in 2007 to issue two separate series of trust preferred securities, that were formed to issue trust preferred securities and related common securities of the Trusts and are not consolidated. Nine Trusts, representing aggregate total obligations of approximately $96.0 million (fair value of approximately $107.3 million as of the merger date), were assumed in connection with previous mergers.
127
Table of Contents
Following is information about the Trusts as of December 31, 2009:
Junior Subordinated Debentures
(dollars in thousands)
| Trust Name | Issue Date | Issued Amount |
Carrying Value(1) |
Rate(2) | Effective Rate(3) |
Maturity Date | Redemption Date | |||||||||||
| AT FAIR VALUE: |
||||||||||||||||||
| Umpqua Statutory Trust II |
October 2002 | $ | 20,619 | $ | 14,643 | Floating | (4) | 11.20 | % | October 2032 | October 2007 | |||||||
| Umpqua Statutory Trust III |
October 2002 | 30,928 | 22,254 | Floating | (5) | 11.20 | % | November 2032 | November 2007 | |||||||||
| Umpqua Statutory Trust IV |
December 2003 | 10,310 | 6,852 | Floating | (6) | 11.22 | % | January 2034 | January 2009 | |||||||||
| Umpqua Statutory Trust V |
December 2003 | 10,310 | 6,848 | Floating | (6) | 11.22 | % | March 2034 | March 2009 | |||||||||
| Umpqua Master Trust I |
August 2007 | 41,238 | 21,708 | Floating | (7) | 11.25 | % | September 2037 | September 2012 | |||||||||
| Umpqua Master Trust IB |
September 2007 | 20,619 | 13,361 | Floating | (8) | 11.22 | % | December 2037 | December 2012 | |||||||||
| 134,024 | 85,666 | |||||||||||||||||
| AT AMORTIZED COST: |
||||||||||||||||||
| HB Capital Trust I |
March 2000 | 5,310 | 6,440 | 10.875 | % | 8.10 | % | March 2030 | March 2010 | |||||||||
| Humboldt Bancorp Statutory Trust I |
February 2001 | 5,155 | 5,974 | 10.200 | % | 8.15 | % | February 2031 | February 2011 | |||||||||
| Humboldt Bancorp Statutory Trust II |
December 2001 | 10,310 | 11,485 | Floating | (9) | 2.99 | % | December 2031 | December 2006 | |||||||||
| Humboldt Bancorp Staututory Trust III |
September 2003 | 27,836 | 30,866 | Floating | (10) | 2.47 | % | September 2033 | September 2008 | |||||||||
| CIB Capital Trust |
November 2002 | 10,310 | 11,307 | Floating | (5) | 3.01 | % | November 2032 | November 2007 | |||||||||
| Western Sierra Statutory Trust I |
July 2001 | 6,186 | 6,186 | Floating | (11) | 3.86 | % | July 2031 | July 2006 | |||||||||
| Western Sierra Statutory Trust II |
December 2001 | 10,310 | 10,310 | Floating | (9) | 3.85 | % | December 2031 | December 2006 | |||||||||
| Western Sierra Statutory Trust III |
September 2003 | 10,310 | 10,310 | Floating | (12) | 3.18 | % | September 2033 | September 2008 | |||||||||
| Western Sierra Statutory Trust IV |
September 2003 | 10,310 | 10,310 | Floating | (12) | 3.18 | % | September 2033 | September 2008 | |||||||||
| 96,037 | 103,188 | |||||||||||||||||
| Total | $ | 230,061 | $ | 188,854 | ||||||||||||||
| (1) | Includes purchase accounting adjustments, net of accumulated amortization, for junior subordinated debentures |
| assumed in connection with previous mergers as well as fair value adjustments related to trusts recorded at fair value. |
| (2) | Contractual interest rate of junior subordinated debentures. |
| (3) | Effective interest rate based upon the carrying value as of December 2009. |
| (4) | Rate based on LIBOR plus 3.35%, adjusted quarterly. |
| (5) | Rate based on LIBOR plus 3.45%, adjusted quarterly. |
| (6) | Rate based on LIBOR plus 2.85%, adjusted quarterly. |
| (7) | Rate based on LIBOR plus 1.35%, adjusted quarterly. |
| (8) | Rate based on LIBOR plus 2.75%, adjusted quarterly. |
| (9) | Rate based on LIBOR plus 3.60%, adjusted quarterly. |
| (10) | Rate based on LIBOR plus 2.95%, adjusted quarterly. |
| (11) | Rate based on LIBOR plus 3.58%, adjusted quarterly. |
| (12) | Rate based on LIBOR plus 2.90%, adjusted quarterly. |
128
Table of Contents
Umpqua Holdings Corporation and Subsidiaries
The $230.1 million of trust preferred securities issued to the Trusts as of December 31, 2009 and 2008, with carrying values of $188.9 and $196.2 million, respectively, are reflected as junior subordinated debentures in the consolidated balance sheets. The common stock issued by the Trusts is recorded in other assets in the consolidated balance sheets, and totaled $6.9 million at December 31, 2009 and 2008.
All of the debentures issued to the Trusts, less the common stock of the Trusts, qualified as Tier 1 capital as of December 31, 2009, under guidance issued by the Board of Governors of the Federal Reserve System (“Federal Reserve Board”). Effective April 11, 2005, the Federal Reserve Board adopted a rule that permits the inclusion of trust preferred securities in Tier 1 capital, but with stricter quantitative limits. The Federal Reserve Board rule, with a five-year transition period set to end on March 31, 2009, would have limited the aggregate amount of trust preferred securities and certain other restricted core capital elements to 25% of Tier 1 capital, net of goodwill and any associated deferred tax liability. The rule allowed the amount of trust preferred securities and certain other elements in excess of the limit to be included in Tier 2 capital, subject to restrictions. In response to the stressed conditions in the financial markets and in order to promote stability in the financial markets and the banking industry, on March 17, 2009, the Federal Reserved adopted a new rule that delayed the effective date of the new limits on the inclusion of trust preferred securities and other restricted core capital elements in Tier 1 capital until March 31, 2011. At December 31, 2009, the Company’s restricted core capital elements were 19.3% of total core capital, net of goodwill and any associated deferred tax liability. There can be no assurance that the Federal Reserve Board will not further limit the amount of trust preferred securities permitted to be included in Tier 1 capital for regulatory capital purposes.
On January 1, 2007 the Company selected the fair value measurement option for certain pre-existing junior subordinated debentures of $97.9 million (the Umpqua Statutory Trusts). The remaining junior subordinated debentures as of the adoption date were acquired through business combinations and were measured at fair value at the time of acquisition. In 2007, the Company issued two series of trust preferred securities and elected to measure each instrument at fair value. Accounting for the junior subordinated debentures originally issued by the Company at fair value enables us to more closely align our financial performance with the economic value of those liabilities. Additionally, we believe it improves our ability to manage the market and interest rate risks associated with the junior subordinated debentures. The junior subordinated debentures measured at fair value and amortized cost have been presented as separate line items on the balance sheet. The ending carrying (fair) value of the junior subordinated debentures measured at fair value represents the estimated amount that would be paid to transfer these liabilities in an orderly transaction amongst market participants under current market conditions as of the measurement date.
Due to inactivity in the junior subordinated debenture market and the inability to obtain observable quotes of our, or similar, junior subordinated debenture liabilities or the related trust preferred securities when traded as assets, we utilize an income approach valuation technique to determine the fair value of these liabilities using our estimation of market discount rate assumptions. The significant inputs utilized in the estimation of fair value of these instruments is the credit risk adjusted spread and three month LIBOR. The credit risk adjusted spread represents the nonperformance risk of the liability, contemplating both the inherent risk of the obligation and the Company’s entity-specific credit risk. Generally, an increase in the credit risk adjusted spread and/or a decrease in the three month LIBOR will result in positive fair value adjustments. Conversely, a decrease in the credit risk adjusted spread and/or an increase in the three month LIBOR will result in negative fair value adjustments. Prior to the second quarter of 2009, we estimated the fair value of junior subordinated debentures using an internal discounted cash flow model. The future cash flows of these instruments were extended to the next available redemption date or maturity date as appropriate based upon the estimated credit risk adjusted spreads of recent issuances or quotes from brokers for comparable bank holding companies, as available, compared to the contractual spread of each junior subordinated debenture measured at fair value. For additional assurance, we obtain a valuation from a third-party pricing service to validate the results of our model.
In the second quarter of 2009, due to continued inactivity in the junior subordinated debenture and related markets and clarified guidance relating to the determination of fair value when the volume and level of activity for an asset or liability have significantly decreased or where transactions are not orderly, management has evaluated and determined to rely on a third-party pricing service to estimate the fair value of these liabilities. The pricing service utilizes an income approach valuation technique, specifically an option-adjusted spread (“OAS”) valuation model. This OAS model values the cash flows over multiple interest rate scenarios and discounts these cash flows using a credit risk adjustment spread over the three month LIBOR swap curve. The OAS model currently being utilized is more sophisticated and computationally intensive than the model previously
129
Table of Contents
used; however, the models react similarly to changes in the underlying inputs, and the results are considered comparable. With the assistance of a third-party pricing service, we determined that a credit risk adjusted spread of 675 basis points is representative of the nonperformance risk premium a market participant would require under current market conditions as of December 31, 2009. Generally, an increase in the credit risk adjusted spread and/or a decrease in the swap curve will result in positive fair value adjustments. Conversely, a decrease in the credit risk adjusted spread and/or an increase in the swap curve will result in negative fair value adjustments.
For the years ended December 31, 2009, 2008 and 2007, we recorded gains of $6.5 million, $38.9 million and $4.9 million, respectively, resulting from the change in fair value of the junior subordinated debentures recorded at fair value. The change in fair value of the junior subordinated debentures carried at fair value during these periods primarily result from the widening of the credit risk adjusted spread. Management believes that the credit risk adjusted spread being utilized is indicative of the nonperformance risk premium a willing market participant would require under current market conditions, that is, the inactive market. Future contractions in the credit risk adjusted spread relative to the spread currently utilized to measure the Company’s junior subordinated debentures at fair value as of December 31, 2009, or the passage of time, will result in negative fair value adjustments. Generally, an increase in the credit risk adjusted spread and/or a decrease in the three month LIBOR swap curve will result in positive fair value adjustments. Conversely, a decrease in the credit risk adjusted spread and/or an increase in the three month LIBOR swap curve will result in negative fair value adjustments. In management’s estimation, the change in fair value of the junior subordinated debentures during the periods represent changes in the market’s nonperformance risk expectations and pricing of this type of debt, and not as a result of changes to our entity-specific credit risk. These gains were recorded in gain on junior subordinated debentures carried at fair value within non-interest income. The contractual interest expense on junior subordinated debentures continues to be recorded on an accrual basis and is reported in interest expense. The junior subordinated debentures recorded at fair value of $85.7 million had contractual unpaid principal amounts of $134.0 million outstanding as of December 31, 2009. The junior subordinated debentures recorded at fair value of $92.5 million had contractual unpaid principal amounts of $134.0 million outstanding as of December 31, 2008.
NOTE 17. EMPLOYEE BENEFIT PLANS
Employee Savings Plan—Substantially all of the Bank’s and Umpqua Investments’ employees are eligible to participate in the Umpqua Bank 401(k) and Profit Sharing Plan (the “Umpqua 401(k) Plan”), a defined contribution and profit sharing plan sponsored by the Company. Employees may elect to have a portion of their salary contributed to the plan in conformity with Section 401(k) of the Internal Revenue Code. At the discretion of the Company’s Board of Directors, the Company may elect to make matching and/or profit sharing contributions to the Umpqua 401(k) Plan based on profits of the Bank. The Company’s contributions under the plan charged to expense amounted to $2.1 million, $2.3 million and $2.5 million for the years ended December 31, 2009, 2008 and 2007, respectively.
In connection with the North Bay acquisition, the Bank became the sponsor of the North Bay 401(k) plan. On May 1, 2007, the North Bay 401(k) plan was frozen and no further contributions were made to that plan. On January 1, 2008, the North Bay 401(k) plan was merged with the Bank’s 401(k) plan.
Supplemental Retirement Plan—The Company has established the Umpqua Holdings Corporation Deferred Compensation & Supplemental Retirement Plan (the “DC/SRP”), a nonqualified deferred compensation plan to help supplement the retirement income of certain highly compensated executives selected by resolution of the Company’s Board of Directors. The DC/SRP has two components, a supplemental retirement plan (“SRP”) and a deferred compensation plan (“DCP”). The Company may make discretionary contributions to the SRP. For the years ended December 31, 2009, 2008 and 2007, the Company’s matching contribution charged to expense for these supplemental plans totaled $6,000, $73,000 and $65,000, respectively. The plan balances at December 31, 2009 and 2008 were $358,000 and $327,000, respectively, and are recorded in other liabilities. Under the DCP, eligible officers may elect to defer up to 50% of their salary into a plan account. The plan balance at December 31, 2009 was $142,000. At December 31, 2008, there were no DCP balances.
Salary Continuation Plans—The Bank sponsors various salary continuation plans for the CEO and certain retired employees. These plans are unfunded, and provide for the payment of a specified amount on a monthly basis for a specified period (generally 10 to 20 years) after retirement. In the event of a participant employee’s death prior to or during retirement, the Bank
130
Table of Contents
Umpqua Holdings Corporation and Subsidiaries
is obligated to pay to the designated beneficiary the benefits set forth under the plan. At December 31, 2009 and 2008, liabilities recorded for the estimated present value of future salary continuation plan benefits totaled $15.6 million and $15.0 million, respectively, and are recorded in other liabilities. For the years ended December 31, 2009, 2008 and 2007, expense recorded for the salary continuation plan benefits totaled $1.8 million, $1.9 million and $1.0 million, respectively.
Deferred Compensation Plans and Rabbi Trusts—The Bank from time to time adopts deferred compensation plans that provide certain key executives with the option to defer a portion of their compensation. In connection with prior acquisitions, the Bank assumed liability for certain deferred compensation plans for key employees, retired employees and directors. Subsequent to the effective date of the acquisitions, no additional contributions were made to these plans. At December 31, 2009 and 2008, liabilities recorded in connection with deferred compensation plan benefits totaled $5.0 million and $5.9 million, respectively, and are recorded in other liabilities.
The Bank has established and sponsors, for some deferred compensation plans assumed in connection with prior mergers, irrevocable trusts commonly referred to as “Rabbi Trusts.” The trust assets (generally cash and trading assets) are consolidated in the Company’s balance sheets and the associated liability (which equals the related asset balances) is included in other liabilities. The asset and liability balances related to these trusts as of December 31, 2009 and 2008 were $1.6 million and $1.5 million, respectively.
The Bank has purchased, or acquired through mergers, life insurance policies in connection with the implementation of certain executive supplemental income, salary continuation and deferred compensation retirement plans. These policies provide protection against the adverse financial effects that could result from the death of a key employee and provide tax-exempt income to offset expenses associated with the plans. It is the Bank’s intent to hold these policies as a long-term investment. However, there will be an income tax impact if the Bank chooses to surrender certain policies. Although the lives of individual current or former management-level employees are insured, the Bank is the owner and sole or partial beneficiary. At December 31, 2009 and 2008, the cash surrender value of these policies was $86.9 million and $83.7 million, respectively. At December 31, 2009 and 2008, the Bank also had liabilities for post-retirement benefits payable to other partial beneficiaries under some of these life insurance policies of $1.3 million and $1.3 million, respectively. The Bank is exposed to credit risk to the extent an insurance company is unable to fulfill its financial obligations under a policy. In order to mitigate this risk, the Bank uses a variety of insurance companies and regularly monitors their financial condition.
NOTE 18. COMMITMENTS AND CONTINGENCIES
Lease Commitments—The Company leases 119 sites under non-cancelable operating leases. The leases contain various provisions for increases in rental rates, based either on changes in the published Consumer Price Index or a predetermined escalation schedule. Substantially all of the leases provide the Company with the option to extend the lease term one or more times following expiration of the initial term.
Rent expense for the years ended December 31, 2009, 2008 and 2007 was $13.0 million, $12.7 million and $11.9 million, respectively. Rent expense was offset by rent income of $555,000, $668,000 and $657,000 for the years ended December 31, 2009, 2008 and 2007, respectively.
The following table sets forth, as of December 31, 2009, the future minimum lease payments under non-cancelable operating leases and future minimum income receivable under non-cancelable operating subleases:
(in thousands)
| Lease Payments |
Sublease Income | |||||
| 2010 |
$ | 12,221 | $ | 691 | ||
| 2011 |
11,629 | 582 | ||||
| 2012 |
10,471 | 293 | ||||
| 2013 |
8,662 | 138 | ||||
| 2014 |
7,359 | |||||
| Thereafter |
24,525 | — | ||||
| Total |
$ | 74,867 | $ | 1,704 | ||
131
Table of Contents
Financial Instruments with Off-Balance-Sheet Risk—The Company’s financial statements do not reflect various commitments and contingent liabilities that arise in the normal course of the Bank’s business and involve elements of credit, liquidity and interest rate risk. The following table presents a summary of the Bank’s commitments and contingent liabilities:
(in thousands)
| As of December 31, 2009 | |||
| Commitments to extend credit |
$ | 934,963 | |
| Commitments to extend overdrafts |
$ | 193,180 | |
| Commitments to originate loans held for sale |
$ | 91,205 | |
| Forward sales commitments |
$ | 55,252 | |
| Standby letters of credit |
$ | 46,249 | |
The Bank is a party to financial instruments with off-balance-sheet credit risk in the normal course of business to meet the financing needs of its customers. These financial instruments include commitments to extend credit, standby letters of credit and financial guarantees. Those instruments involve elements of credit and interest-rate risk similar to the amounts recognized in the consolidated balance sheets. The contract or notional amounts of those instruments reflect the extent of the Bank’s involvement in particular classes of financial instruments.
The Bank’s exposure to credit loss in the event of nonperformance by the other party to the financial instrument for commitments to extend credit and standby letters of credit, and financial guarantees written, is represented by the contractual notional amount of those instruments. The Bank uses the same credit policies in making commitments and conditional obligations as it does for on-balance-sheet instruments.
Commitments to extend credit are agreements to lend to a customer as long as there is no violation of any covenant or condition established in the contract. Commitments generally have fixed expiration dates or other termination clauses and may require payment of a fee. Since many of the commitments are expected to expire without being drawn upon, the total commitment amounts do not necessarily represent future cash requirements. While most standby letters of credit are not utilized, a significant portion of such utilization is on an immediate payment basis. The Bank evaluates each customer’s creditworthiness on a case-by-case basis. The amount of collateral obtained, if it is deemed necessary by the Bank upon extension of credit, is based on management’s credit evaluation of the counterparty. Collateral varies but may include cash, accounts receivable, inventory, premises and equipment and income-producing commercial properties.
Standby letters of credit and financial guarantees written are conditional commitments issued by the Bank to guarantee the performance of a customer to a third party. These guarantees are primarily issued to support public and private borrowing arrangements, including international trade finance, commercial paper, bond financing and similar transactions. The credit risk involved in issuing letters of credit is essentially the same as that involved in extending loan facilities to customers. The Bank holds cash, marketable securities, or real estate as collateral supporting those commitments for which collateral is deemed necessary. The Bank has not been required to perform on any financial guarantees but incurred losses of $23,000 in connection with standby letters of credit during the year ended December 31, 2009. The Bank has not been required to perform on any financial guarantees and did not incur any losses in connection with standby letters of credit during the years ended December 31, 2008 and 2007. At December 31, 2009, approximately $26.9 million of standby letters of credit expire within one year, and $19.3 million expire thereafter. Upon issuance, the Company recognizes a liability equivalent to the amount of fees received from the customer for these standby letter of credit commitments. Fees are recognized ratably over the term of the standby letter of credit. The fair value of guarantees associated with standby letters of credit was $92,000 as of December 31, 2009.
At December 31, 2009 and 2008, the reserve for unfunded commitments, which is included in other liabilities on the consolidated balance sheet, was $731,000 and $1.0 million, respectively. The adequacy of the reserve for unfunded commitments is reviewed on a quarterly basis, based upon changes in the amounts of commitments, loss experience, and economic conditions.
Mortgage loans sold to investors may be sold with servicing rights retained, with only the standard legal representations and warranties regarding recourse to the Bank. Management believes that any liabilities that may result from such recourse provisions are not significant.
132
Table of Contents
Umpqua Holdings Corporation and Subsidiaries
Legal Proceedings—In November 2007, Visa Inc. (“Visa”) announced that it had reached a settlement with American Express related to an antitrust lawsuit. Umpqua Bank and other Visa member banks are obligated to fund the settlement and share in losses resulting from this litigation. In the fourth quarter of 2007, the Company recorded a liability and corresponding expense of approximately $3.9 million pre-tax, for its proportionate share of that settlement.
In addition, Visa notified the Company that it had established a contingency reserve related to unsettled litigation with Discover Card. In connection with this contingency, the Company recorded, in the fourth quarter of 2007, a liability and corresponding expense of $1.2 million pre-tax, for its proportionate share of that liability. The Company is not a party to the Visa litigation and its liability arises solely from the Bank’s membership interest in Visa.
During 2007, Visa announced that it completed restructuring transactions in preparation for an initial public offering of its Class A stock, and, as part of those transactions, Umpqua Bank’s membership interest was exchanged for 764,036 shares of Class B common stock in Visa. In March 2008, Visa completed its initial public offering. Following the initial public offering, the Company received $12.6 million proceeds as a mandatory partial redemption of 295,377 shares, reducing the Company’s holdings from 764,036 shares to 468,659 shares of Class B common stock. A conversion ratio of 0.71429 was established for the conversion rate of Class B shares into Class A shares. Using the proceeds from this offering, Visa also established a $3.0 billion escrow account to cover settlements, resolution of pending litigation and related claims (“covered litigation”). In connection with Visa’s establishment of the litigation escrow account, the Company reversed the $5.2 million Visa litigation related reserve in the first quarter of 2008.
In October 2008, Visa announced that it had reached a settlement with Discover Card related to an antitrust lawsuit. Umpqua Bank and other Visa member banks were obligated to fund the settlement and share in losses resulting from this litigation that were not already provided for in the escrow account. Visa notified the Company that it had established an additional reserve related to the settlement with Discover Card that had not already been funded into the escrow account. In connection with this settlement, the Company recorded, in the third quarter of 2008, a liability and corresponding expense of $2.1 million pre-tax, for its proportionate share of that liability. In December 2008, this liability and expense were reversed when Visa deposited additional funds into the escrow account to cover the remaining amount of the settlement. The deposit of funds into the escrow account further reduced the conversion ratio applicable to Class B common stock outstanding from 0.71429 per Class A share to 0.6296 per Class A share.
In July 2009, Visa deposited an additional $700 million into the litigation escrow account. While the outcome of the two remaining litigation cases remains unknown, this addition to the escrow account provides additional reserves to cover potential losses. As a result of the deposit, the conversion ratio applicable to Class B common stock outstanding decreased further from 0.6296 per Class A share to 0.5824 per Class A share.
The remaining unredeemed shares of Visa Class B common stock are restricted and may not be transferred until the later of (1) three years from the date of the initial public offering or (2) the period of time necessary to resolve the covered litigation. If the funds in the escrow account are insufficient to settle all the covered litigation, Visa may sell additional Class A shares, use the proceeds to settle litigation, and further reduce the conversion ratio. If funds remain in the escrow account after all litigation is settled, the Class B conversion ratio will be increased to reflect that surplus.
As of December 31, 2009, the value of the Class A shares was $87.46 per share. Utilizing the conversion ratio effective July 2009, the value of unredeemed Class A equivalent shares owned by the Company was $23.9 million as of December 31, 2009, and has not been reflected in the accompanying financial statements.
In the ordinary course of business, various claims and lawsuits are brought by and against the Company, the Bank and Umpqua Investments. In the opinion of management, there is no pending or threatened proceeding in which an adverse decision could result in a material adverse change in the Company’s consolidated financial condition or results of operations. Management has considered the potential impact of one or more adverse decisions in the actions brought by Kevin D. Padrick, Trustee of the Summit Accommodators Liquidating Trust and Danae Miller, et al., as described in Part II, Item 1. Based on the allegations in the complaint and our understanding of the relevant facts and circumstances, we believe that the claim is without merit and the Company is vigorously defending the claim. No loss accrual has been made for either of these claims in the accompanying audited consolidated financial statements.
133
Table of Contents
Concentrations of Credit Risk—The Company grants real estate mortgage, real estate construction, commercial, agricultural and installment loans and leases to customers throughout Oregon, Washington and California. In management’s judgment, a concentration exists in real estate-related loans, which represented approximately 81% and 79%, respectively, of the Company’s loan and lease portfolio at December 31, 2009 and 2008. Commercial real estate concentrations are managed to assure wide geographic and business diversity. Although management believes such concentrations have no more than the normal risk of collectibility, a substantial decline in the economy in general, material increases in interest rates, changes in tax policies, tightening credit or refinancing markets, or a decline in real estate values in the Company’s primary market areas in particular, such as was seen with the deterioration in the residential development market since 2007 and aspects of our commercial real estate, commercial construction and commercial loan portfolios, could have an adverse impact on the repayment of these loans. Personal and business incomes, proceeds from the sale of real property, or proceeds from refinancing, represent the primary sources of repayment for a majority of these loans.
The Bank recognizes the credit risks inherent in dealing with other depository institutions. Accordingly, to prevent excessive exposure to any single correspondent, the Bank has established general standards for selecting correspondent banks as well as internal limits for allowable exposure to any single correspondent. In addition, the Bank has an investment policy that sets forth limitations that apply to all investments with respect to credit rating and concentrations per issuer.
NOTE 19. DERIVATIVES
The Company may use derivatives to hedge the risk of changes in the fair values of interest rate lock commitments, residential mortgage loans held for sale, and mortgage servicing rights. None of the Company’s derivatives are designated as hedging instruments. Rather, they are accounted for as free-standing derivatives, or economic hedges, with changes in the fair value of the derivatives reported in income. The Company primarily utilizes forward interest rate contracts in its derivative risk management strategy.
The Bank enters into forward delivery contracts to sell residential mortgage loans or mortgage-backed securities to broker/dealers at specific prices and dates (“MBS TBAs”) in order to hedge the interest rate risk in its portfolio of mortgage loans held for sale and its residential mortgage loan commitments. Credit risk associated with forward contracts is limited to the replacement cost of those forward contracts in a gain position. There were no counterparty default losses on forward contracts in 2009, 2008 or 2007. Market risk with respect to forward contracts arises principally from changes in the value of contractual positions due to changes in interest rates. The Bank limits its exposure to market risk by monitoring differences between commitments to customers and forward contracts with broker/dealers. In the event the Company has forward delivery contract commitments in excess of available mortgage loans, the Company completes the transaction by either paying or receiving a fee to or from the broker/dealer equal to the increase or decrease in the market value of the forward contract. At December 31, 2009, the Bank had commitments to originate mortgage loans held for sale totaling $91.2 million and forward sales commitments of $55.3 million.
In the fourth quarter of 2007, the Company began using derivative instruments, primarily MBS TBAs, to hedge the risk of changes in the fair value of MSR due to changes in interest rates. Starting in late February 2008 and continuing into March 2008, the bond markets experienced extraordinary volatility. This volatility resulted in widening spreads and price declines on the derivative instruments that were not offset by corresponding gains in the MSR asset. In March of 2008, the Company suspended the MSR hedge, given the continued volatility.
134
Table of Contents
Umpqua Holdings Corporation and Subsidiaries
The following tables summarize the types of derivatives, separately by assets and liabilities, their locations on the consolidated balance sheets, and the fair values of such derivatives as of December 31, 2009 and 2008:
(in thousands)
| Underlying Risk Exposure | Description | Balance Sheet Location | 2009 | 2008 | ||||||||
| Asset Derivatives |
||||||||||||
| Interest rate contracts |
Rate lock commitments | Other assets | $ | 124 | $ | 1,170 | ||||||
| Interest rate contracts |
Forward sales commitments | Other assets | 845 | 151 | ||||||||
| Total asset derivatives |
$ | 969 | $ | 1,321 | ||||||||
| Liability Derivatives |
||||||||||||
| Interest rate contracts |
Rate lock commitments | Other liabilities | $ | 133 | $ | 3 | ||||||
| Interest rate contracts |
Forward sales commitments | Other liabilities | — | 583 | ||||||||
| Total liability derivatives |
$ | 133 | $ | 586 | ||||||||
The following table summarizes the types of derivatives, their location on the Consolidated Statements of Operations, and the losses recorded in 2009, 2008 and 2007:
(in thousands)
| Underlying Risk Exposure | Description | Income Statement Location |
2009 | 2008 | 2007 | |||||||||||
| Interest rate contracts |
Rate lock commitments | Mortgage banking revenue | $ | (1,176 | ) | $ | 1,099 | $ | 117 | |||||||
| Interest rate contracts |
Forward sales commitments | Mortgage banking revenue | (255 | ) | (184 | ) | (122 | ) | ||||||||
| Interest rate contracts |
MSR hedge instruments | Mortgage banking revenue | — | (2,398 | ) | (334 | ) | |||||||||
| Total |
$ | (1,431 | ) | $ | (1,483 | ) | $ | (339 | ) | |||||||
The Company’s derivative instruments do not have specific credit risk-related contingent features. The forward sales commitments do have contingent features that may require transferring collateral to the broker/dealers upon their request. However, this amount would be limited to the net unsecured loss exposure at such point in time and would not materially effect the Company’s liquidity or results of operations.
NOTE 20. SHAREHOLDERS’ EQUITY
On November 14, 2008, in exchange for an aggregate purchase price of $214.2 million, the Company issued and sold to the United States Department of the Treasury (“U.S. Treasury”) pursuant to the TARP Capital Purchase Program (the “CPP”) the following: (i) 214,181 shares of the Company’s newly designated non-convertible Fixed Rate Cumulative Perpetual Preferred Stock, Series A, (the “preferred stock”) no par value per share and liquidation preference $1,000 per share (and $214.2 million liquidation preference in the aggregate) and (ii) a warrant to purchase up to 2,221,795 shares of the Company’s common stock, no par value per share, at an exercise price of $14.46 per share, subject to certain customary anti-dilution and other adjustments.
In connection with the issuance and sale of the Company’s securities, the Company entered into a Letter Agreement including the Securities Purchase Agreement – Standard Terms, dated November 14, 2008, with the U.S. Treasury (the “Agreement”). The Agreement grants the holders of the preferred stock, the warrant and the common stock to be issued under the warrant registration rights and subjects the Company to executive compensation limitations included in the Emergency Economic Stabilization Act of 2008. For regulatory purposes, the preferred stock is considered Tier 1 capital. The preferred stock has no maturity date.
The preferred stock bears cumulative dividends at a rate of 5% per annum for the first five years and 9% per annum thereafter, in each case, applied to the $1,000 per share liquidation preference, but will only be paid when, as and if declared by the
135
Table of Contents
Company’s Board of Directors out of funds legally available therefor. Dividend payments are payable quarterly in arrears on the 15th day of February, May, August and November of each year. In January 2010, the Board declared a dividend in the amount of $2.7 million, which is payable in February 2010. As of December 31, 2009, no dividends on the preferred stock were in arrears.
The preferred stock ranks senior to our common stock (and on an equivalent basis with the Company’s other authorized series of preferred stock, of which no shares are currently outstanding) with respect to the payment of dividends and distributions of amounts payable upon liquidation, dissolution and winding up the Company. The Company may not pay dividends on, repurchase, or redeem any other class of stock unless all dividends in arrears are fully paid. Additionally, the Agreement contains limitations on the payment of quarterly cash dividends on the Company’s common stock in excess of $0.19 per share. So long as the preferred stock is outstanding and held by the U.S. Treasury, the Company may not repurchase common shares without the Treasury’s consent through the third anniversary date of the issuance, other than when in connection with any benefit plan in the ordinary course of business consistent with past practice.
Under the original terms of the CPP, the preferred stock may only be redeemed within the first three years from the date of issuance with the proceeds from a qualified equity offering that results in aggregate gross proceeds to the Company of not less that 25% of the issue price of the preferred stock. A qualified equity offering means the sale of Tier 1 qualifying perpetual preferred stock or common stock for cash. This requirement was removed under the provisions of the American Recovery and Reinvestment Act of 2009. As a result, the preferred stock, plus all accrued and unpaid dividends, may be redeemed by the Company subject to the approval of the Federal Reserve.
The preferred stock is not subject to any contractual restrictions on transfer. The holders of the preferred stock have no general voting rights, and have only limited class voting rights including, authorization or issuance of shares ranking senior to the preferred stock, any amendment to the rights of the preferred stock, or any merger, exchange or similar transaction which would adversely affect the rights of the preferred stock. If dividends on the preferred stock are not paid in full for six dividend periods, whether or not consecutive, the preferred stock holders will have the right to elect two directors. The right to elect directors will end when full dividends have been paid for four consecutive dividend periods. The preferred stock is not subject to sinking fund requirements and has no participation rights.
On November 10, 2008, the Company filed with the Secretary of State of the State of Oregon, Articles of Amendment to its Restated Articles of Incorporation establishing the terms of the preferred stock.
The warrants issued are immediately exercisable, in whole or in part, and have a ten year term. The U.S. Treasury may only exercise or transfer up to one-half of the warrants prior to the earlier of, the date the Company receives aggregate gross proceeds of not less than 100% of the issue price of the preferred stock from one or more qualified equity offerings, or December 31, 2009. The warrants are not subject to any other contractual restrictions on transfer. The Company has granted the warrant holder piggyback registration rights for the warrants and the common stock underlying the warrants and have agreed to take such other steps as may be reasonably requested to facilitate the transfer of the warrants and the common stock underlying the warrants. The holders of the warrants are not entitled to any common stockholder rights. The U.S. Treasury agrees not to exercise voting power with respect to any shares of common stock of the Company issued to it upon exercise of the warrants.
In accordance with the relevant accounting pronouncements and a letter from the Securities and Exchange Commission’s (the “SEC”) Office of the Chief Accountant, the Company recorded the preferred stock and detachable warrants within Stockholders’ Equity on the Consolidated Balance Sheets. The preferred stock and detachable warrants were initially recognized based on their relative fair values at the date of issuance. As a result, the preferred stock’s carrying value is at a discount to the liquidation value or stated value. The discount is considered an unstated dividend cost that shall be amortized over the period preceding commencement of the perpetual dividend using the effective interest method, by charging the imputed dividend cost against retained earnings and increasing the carrying amount of the preferred stock by a corresponding amount. The discount is therefore being amortized over five years using a 6.35% effective interest rate. The total stated dividends (whether or not declared) and unstated dividend cost combined represents a period’s total preferred stock dividend, which is deducted from net income to arrive at net earnings available to common shareholders on the Consolidated Statements of Operations.
136
Table of Contents
Umpqua Holdings Corporation and Subsidiaries
As the preferred stock and detachable warrants were initially recognized based on their relative fair values at the date of issuance, the value allocated to the warrants is different than the estimated fair value of the warrants as of the grant date. The following assumptions were used to determine the fair value of the warrants as of the grant date:
| Dividend yield |
4.17% | ||
| Expected life (years) |
10.0 | ||
| Expected volatility |
46% | ||
| Risk-free rate |
3.72% | ||
| Fair value per warrant at grant date |
$ | 4.94 | |
| Relative fair value per warrant at grant date |
$ | 5.52 |
On August 13, 2009, the Company raised $258.7 million through a public offering by issuing 26,538,461 shares of the Company’s common stock, including 3,461,538 shares pursuant to the underwriters’ over-allotment option, at a share price of $9.75 per share. The net proceeds to the Company after deducting underwriting discounts and commissions and offering expenses were $245.7 million. The net proceeds from the offering qualify as Tier 1 capital and will be used for general corporate purposes, which may include capital to support growth and acquisition opportunities and to position the Company for redemption of preferred stock issued to the U.S. Treasury under the Capital Purchase Program. In connection with the Company’s public offering in the third quarter of 2009, the number of shares of common stock underlying the warrant held by the U.S. Treasury was reduced by 50%, to 1,110,898 shares.
Stock Plans—The Company’s 2007 Long Term Incentive Plan (“2007 LTI Plan”) authorizes the award of up to 1 million restricted stock unit grants, which are subject to performance-based vesting as well as other approved vesting conditions. The Company’s 2003 Stock Incentive Plan (“2003 Plan”) provides for grants of up to 2 million shares. The 2003 Plan further provides that no grants may be issued if existing options and subsequent grants under the 2003 Plan exceed 10% of the Company’s outstanding shares on a diluted basis. Under the terms of the 2003 Plan, options and awards generally vest ratably over a period of five years, the exercise price of each option equals the market price of the Company’s common stock on the date of the grant, and the maximum term is ten years.
The Company has options outstanding under two prior plans adopted in 1995 and 2000, respectively. With the adoption of the 2003 Plan, no additional grants can be issued under the previous plans. The Company also assumed various plans in connection with mergers and acquisitions but does not make grants under those plans. During 2007, in connection with the North Bay merger, a total of 542,000 options were exchanged for North Bay stock options granted at an exchange ratio of 1.228 Umpqua stock options for each North Bay stock option outstanding. All of the North Bay options were vested as of the date the merger was completed.
The following table summarizes information about stock option activity for the years ended December 31, 2009, 2008 and 2007:
(shares in thousands)
| 2009 | 2008 | 2007 | ||||||||||||||||
| Options Outstanding |
Weighted Avg. Exercise Price |
Options Outstanding |
Weighted Avg. Exercise Price |
Options Outstanding |
Weighted Avg. Exercise Price | |||||||||||||
| Balance, beginning of year |
1,819 | $ | 15.66 | 1,582 | $ | 15.94 | 1,807 | $ | 14.78 | |||||||||
| Granted |
229 | $ | 9.34 | 527 | $ | 14.20 | 50 | $ | 26.12 | |||||||||
| Acquisitions |
— | $ | — | — | $ | — | 542 | $ | 13.39 | |||||||||
| Exercised |
(51 | ) | $ | 5.93 | (132 | ) | $ | 9.34 | (767 | ) | $ | 11.67 | ||||||
| Forfeited/expired |
(234 | ) | $ | 16.20 | (158 | ) | $ | 18.96 | (50 | ) | $ | 21.21 | ||||||
| Balance, end of year |
1,763 | $ | 15.05 | 1,819 | $ | 15.66 | 1,582 | $ | 15.94 | |||||||||
| Options exercisable, end of year |
1,071 | $ | 15.90 | 1,121 | $ | 15.05 | 1,215 | $ | 13.91 | |||||||||
137
Table of Contents
The following table summarizes information about outstanding stock options issued under all plans as of December 31, 2009:
(shares in thousands)
| Options Outstanding | Options Exercisable | |||||||||||
| Range of Exercise Prices | Options Outstanding |
Weighted Avg. Remaining Contractual Life (Years) |
Weighted Avg. Exercise Price |
Options Exercisable |
Weighted Avg. Exercise Price | |||||||
| $4.58 to $9.23 |
420 | 6.6 | $ | 7.26 | 220 | $ | 5.50 | |||||
| $9.33 to $13.34 |
378 | 4.8 | $ | 11.50 | 234 | $ | 11.60 | |||||
| $13.46 to $16.98 |
354 | 7.2 | $ | 15.34 | 131 | $ | 15.27 | |||||
| $17.45 to $23.49 |
457 | 4.4 | $ | 21.29 | 338 | $ | 21.62 | |||||
| $24.25 to $28.43 |
154 | 5.9 | $ | 25.76 | 148 | $ | 25.68 | |||||
| 1,763 | 5.7 | $ | 15.05 | 1,071 | $ | 15.90 | ||||||
The compensation cost related to stock options, including costs related to unvested options assumed in connection with acquisitions, that has been charged against income (included in salaries and employee benefits) was $1.4 million, $1.0 million and $1.3 million for the years ended December 31, 2009, 2008 and 2007, respectively. The total income tax benefit recognized in the income statement related to stock options was $541,000, $420,000 and $540,000 for the years ended December 31, 2009, 2008 and 2007, respectively. The total intrinsic value (which is the amount by which the stock price exceeds the exercise price) of both options outstanding and options exercisable as of December 31, 2009, was $3.3 million and $2.2 million, respectively. The weighted average remaining contractual term of options exercisable was 4.4 years as of December 31, 2009. The total intrinsic value of options exercised was $220,000, $666,000 and $8.7 million, in the years ended December 31, 2009, 2008 and 2007, respectively. During the years ended December 31, 2009, 2008 and 2007, the amount of cash received from the exercise of stock options was $301,000, $1.2 million and $9.0 million, respectively. As of December 31, 2009, there was $1.6 million of total unrecognized compensation cost related to nonvested stock options which is expected to be recognized over a weighted-average period of 2.8 years.
The Company grants restricted stock awards periodically as a part of the 2003 Plan for the benefit of employees. Restricted shares issued generally vest on an annual basis over five years. A deferred restricted stock award was granted to an executive in the second quarter of 2007. The award vests monthly based on continued service in various increments through July 1, 2011. The Company will issue certificates for the vested award within the seventh month following termination of the executive’s employment. The following table summarizes information about nonvested restricted shares outstanding at December 31:
(shares in thousands)
| 2009 | 2008 | 2007 | ||||||||||||||||
| Restricted Shares Outstanding |
Average Grant Date Fair Value |
Restricted Shares Outstanding |
Average Grant Date Fair Value |
Restricted Shares Outstanding |
Average Grant Date Fair Value | |||||||||||||
| Balance, beginning of year |
216 | $ | 23.42 | 247 | $ | 25.11 | 122 | $ | 26.36 | |||||||||
| Granted |
26 | $ | 9.83 | 32 | $ | 15.18 | 172 | $ | 24.31 | |||||||||
| Released |
(46 | ) | $ | 23.81 | (42 | ) | $ | 25.81 | (31 | ) | $ | 24.96 | ||||||
| Forfeited/expired |
(9 | ) | $ | 22.85 | (21 | ) | $ | 26.11 | (16 | ) | $ | 26.28 | ||||||
| Balance, end of year |
187 | $ | 21.46 | 216 | $ | 23.42 | 247 | $ | 25.11 | |||||||||
The compensation cost related to restricted stock awards that has been charged against income (included in salaries and employee benefits) was $1.4 million, $1.2 million and $1.3 million for the years ended December 31, 2009, 2008 and 2007, respectively. The total income tax benefit recognized in the income statement related to restricted stock awards was $548,000, $493,000 and $533,000 for the years ended December 31, 2009, 2008 and 2007, respectively. The total fair value of restricted
138
Table of Contents
Umpqua Holdings Corporation and Subsidiaries
shares vested was $445,000, $660,000 and $757,000, for the years ended December 31, 2009, 2008 and 2007, respectively. As of December 31, 2009, there was $2.5 million of total unrecognized compensation cost related to nonvested restricted stock awards which is expected to be recognized over a weighted-average period of 2.4 years.
The Company grants restricted stock units as a part of the 2007 Long Term Incentive Plan for the benefit of certain executive officers. Restricted stock unit grants are subject to performance-based vesting as well as other approved vesting conditions. In the second quarter of 2007, restricted stock units were granted that cliff vest after three years based on performance and service conditions. In the first quarter of 2008 and 2009, additional restricted stock units were granted to these executives under substantially similar vesting terms. The total number of restricted stock units granted represents the maximum number of restricted stock units eligible to vest based upon the performance and service conditions set forth in the grant agreements. The following table summarizes information about restricted stock units outstanding at December 31:
(shares in thousands)
| 2009 | 2008 | 2007 | |||||||||||||||
| Restricted Stock Units Outstanding |
Weighted Average Grant Date Fair Value |
Restricted Stock Units Outstanding |
Weighted Average Grant Date Fair Value |
Restricted Stock Units Outstanding |
Weighted Average Grant Date Fair Value | ||||||||||||
| Balance, beginning of year |
301 | $ | 19.48 | 194 | $ | 24.52 | — | $ | — | ||||||||
| Granted |
114 | $ | 8.01 | 183 | $ | 14.33 | 194 | $ | 24.52 | ||||||||
| Released |
(23 | ) | $ | 21.33 | — | $ | — | — | $ | — | |||||||
| Forfeited/expired |
(57 | ) | $ | 18.98 | (76 | ) | $ | 19.95 | — | $ | — | ||||||
| Balance, end of year |
335 | $ | 15.54 | 301 | $ | 19.48 | 194 | $ | 24.52 | ||||||||
For the year ended December 31, 2009, the Company recorded a reversal of compensation cost of $539,000 related to restricted stock units that has been credited to salaries and employee benefits expense. The compensation cost related to restricted stock units that has been charged against income was $1.6 million for the year ended December 31, 2008. The total income tax expense recognized in the income statement related to restricted stock units was $215,000 for the year ended December 31, 2009, and the total income tax benefit recognized in the income statement related to restricted stock units was $645,000 for the year ended December 31, 2008. The reduction of compensation expense recognized in 2009 as compared to 2008 is due to the reduction of units expected to vest as a result of the achievement of performance conditions. No compensation expense was recognized for the year ended December 31, 2007 as none of the performance-based vesting conditions were or were expected to be met. The total fair value of restricted stock units vested and released was $186,000 for the year ended December 31, 2009. No restricted stock unites were vested and released for the years ended December 31, 2008 and 2007. As of December 31, 2009, there was $297,000 of total unrecognized compensation cost related to nonvested restricted stock units which is expected to be recognized over a weighted-average period of 1.1 years, assuming the current expectation of performance conditions are met.
For the years ended December 31, 2009, 2008 and 2007, the Company received income tax benefits of $326,000, $527,000, and $3.4 million, respectively, related to the exercise of non-qualified employee stock options, disqualifying dispositions in the exercise of incentive stock options, the vesting of restricted shares and the vesting of restricted stock units. For the year ended December 31, 2009, the Company had net tax deficiencies (tax deficiency resulting from tax deductions less than the compensation cost recognized) of $369,000, compared to net tax deficiencies of $195,000 for the year ended December 31, 2008. Only cash flows from gross excess tax benefits are classified as financing cash flows.
Share Repurchase Plan—The Company’s share repurchase plan, which was approved by the Board and announced in August 2003, originally authorized the repurchase of up to 1.0 million shares. Prior to 2007, the authorization was amended to increase the repurchase limit to 2.5 million shares. On April 19, 2007, the Company announced an expansion of the Board of Directors approved common stock repurchase plan, increasing the repurchase limit to 6.0 million shares and extending the plan’s expiration date from June 30, 2007 to June 30, 2009. On April 21, 2009, the Board of Directors approved a further extension to
139
Table of Contents
the expiration date of the common stock repurchase plan from June 30, 2009 to June 30, 2011. As of December 31, 2009, a total of 1.5 million shares remained available for repurchase. The Company repurchased no shares under the repurchase plan in 2009 or 2008. The timing and amount of future repurchases will depend upon the market price for our common stock, securities laws restricting repurchases, asset growth, earnings, our capital plan, and are subject to certain limitations resulting from the Company’s participation in the TARP Capital Purchase Program.
We also have certain stock option and restricted stock plans which provide for the payment of the option exercise price or withholding taxes by tendering previously owned or recently vested shares. During the year ended December 31, 2009, there were no shares tendered in connection with option exercises. During the year ended December 31, 2008, there were 263 shares tendered in connection with option exercises. Restricted shares cancelled to pay withholding taxes totaled 11,257 and 7,936 shares during the years ended December 31, 2009 and 2008, respectively. Restricted stock units cancelled to pay withholding taxes totaled 8,259 during the year ended December 31, 2009. No restricted stock units were cancelled to pay withholding taxes during the year ended December 31, 2008.
NOTE 21. REGULATORY CAPITAL
The Company is subject to various regulatory capital requirements administered by the federal banking agencies. Failure to meet minimum capital requirements can initiate certain mandatory and possible additional discretionary actions by regulators that, if undertaken, could have a material effect on the Company’s financial statements. Under capital adequacy guidelines, the Company must meet specific capital guidelines that involve quantitative measures of the Company’s assets, liabilities, and certain off balance sheet items as calculated under regulatory accounting practices. The Company’s capital amounts and classifications are also subject to qualitative judgments by the regulators about risk components, asset risk weighting, and other factors.
Quantitative measures established by regulation to ensure capital adequacy require the Company to maintain minimum amounts and ratios (set forth in the table below) of total and Tier 1 capital to risk-weighted assets (as defined in the regulations), and of Tier 1 capital to average assets (as defined in the regulations). Management believes, as of December 31, 2009, that the Company meets all capital adequacy requirements to which it is subject.
140
Table of Contents
Umpqua Holdings Corporation and Subsidiaries
The Company’s capital amounts and ratios as of December 31, 2009 and 2008 are presented in the following table:
(dollars in thousands)
| Actual | For Capital Adequacy purposes |
To be Well Capitalized | |||||||||||||
| Amount | Ratio | Amount | Ratio | Amount | Ratio | ||||||||||
| AS OF DECEMBER 31, 2009: |
|||||||||||||||
| Total Capital |
|||||||||||||||
| (to Risk Weighted Assets) |
|||||||||||||||
| Consolidated |
$ | 1,197,831 | 17.16% | $ | 558,429 | 8.00% | $ | 698,037 | 10.00% | ||||||
| Umpqua Bank |
$ | 938,653 | 13.46% | $ | 557,892 | 8.00% | $ | 697,365 | 10.00% | ||||||
| Tier I Capital |
|||||||||||||||
| (to Risk Weighted Assets) |
|||||||||||||||
| Consolidated |
$ | 1,110,311 | 15.91% | $ | 279,148 | 4.00% | $ | 418,722 | 6.00% | ||||||
| Umpqua Bank |
$ | 851,227 | 12.21% | $ | 278,862 | 4.00% | $ | 418,293 | 6.00% | ||||||
| Tier I Capital |
|||||||||||||||
| (to Average Assets) |
|||||||||||||||
| Consolidated |
$ | 1,110,311 | 12.79% | $ | 347,243 | 4.00% | $ | 434,054 | 5.00% | ||||||
| Umpqua Bank |
$ | 851,227 | 9.81% | $ | 347,085 | 4.00% | $ | 433,857 | 5.00% | ||||||
| AS OF DECEMBER 31, 2008: |
|||||||||||||||
| Total Capital |
|||||||||||||||
| (to Risk Weighted Assets) |
|||||||||||||||
| Consolidated |
$ | 1,041,882 | 14.62% | $ | 570,113 | 8.00% | $ | 712,642 | 10.00% | ||||||
| Umpqua Bank |
$ | 943,986 | 13.25% | $ | 569,954 | 8.00% | $ | 712,442 | 10.00% | ||||||
| Tier I Capital |
|||||||||||||||
| (to Risk Weighted Assets) |
|||||||||||||||
| Consolidated |
$ | 952,725 | 13.37% | $ | 285,034 | 4.00% | $ | 427,550 | 6.00% | ||||||
| Umpqua Bank |
$ | 854,829 | 12.00% | $ | 284,943 | 4.00% | $ | 427,415 | 6.00% | ||||||
| Tier I Capital |
|||||||||||||||
| (to Average Assets) |
|||||||||||||||
| Consolidated |
$ | 952,725 | 12.38% | $ | 307,827 | 4.00% | $ | 384,784 | 5.00% | ||||||
| Umpqua Bank |
$ | 854,829 | 11.13% | $ | 307,216 | 4.00% | $ | 384,020 | 5.00% | ||||||
The Company is a registered financial holding company under the Gramm-Leach-Bliley Act of 1999 (the “GLB Act”), and is subject to the supervision of, and regulation by, the Board of Governors of the Federal Reserve System (the “Federal Reserve”). The Bank is an Oregon state chartered bank with deposits insured by the Federal Deposit Insurance Corporation (“FDIC”), and is subject to the supervision and regulation of the Director of the Oregon Department of Consumer and Business Services, administered through the Division of Finance and Corporate Securities, and to the supervision and regulation of the California Department of Financial Institutions, the Washington Department of Financial Institutions and the FDIC. As of December 31, 2009, the most recent notification from the FDIC categorized the Bank as “well-capitalized” under the regulatory framework for prompt corrective action. The Company is not subject to the regulatory framework for prompt corrective action. There are no conditions or events since that notification that management believes have changed the Bank’s regulatory capital category.
141
Table of Contents
NOTE 22. FAIR VALUES
The following table presents estimated fair values of the Company’s financial instruments as of December 31, 2009 and December 31, 2008, whether or not recognized or recorded at fair value in the Consolidated Balance Sheets:
(in thousands)
| 2009 | 2008 | |||||||||||
| Carrying Value |
Fair Value | Carrying Value |
Fair Value | |||||||||
| FINANCIAL ASSETS: |
||||||||||||
| Cash and cash equivalents |
$ | 605,413 | $ | 605,413 | $ | 204,676 | $ | 204,676 | ||||
| Trading securities |
2,273 | 2,273 | 1,987 | 1,987 | ||||||||
| Securities available for sale |
1,795,616 | 1,795,616 | 1,238,712 | 1,238,712 | ||||||||
| Securities held to maturity |
6,061 | 6,136 | 15,812 | 8,379 | ||||||||
| Loans held for sale |
33,715 | 33,715 | 22,355 | 22,355 | ||||||||
| Loans and leases, net |
5,891,610 | 5,208,893 | 6,035,509 | 5,515,970 | ||||||||
| Restricted equity securities |
15,211 | 15,211 | 16,491 | 16,491 | ||||||||
| Mortgage servicing rights |
12,625 | 12,625 | 8,205 | 8,205 | ||||||||
| Bank owned life insurance assets |
86,853 | 86,853 | 83,666 | 83,666 | ||||||||
| Derivatives |
969 | 969 | 1,321 | 1,321 | ||||||||
| Visa Class B common stock |
— | 19,336 | — | 12,536 | ||||||||
| FINANCIAL LIABILITIES: |
||||||||||||
| Deposits |
$ | 7,440,434 | $ | 7,440,631 | $ | 6,588,935 | $ | 6,605,170 | ||||
| Securities sold under agreement to repurchase |
45,180 | 45,180 | 47,588 | 47,588 | ||||||||
| Term debt |
76,274 | 77,130 | 206,531 | 208,998 | ||||||||
| Junior subordinated debentures, at fair value |
85,666 | 85,666 | 92,520 | 92,520 | ||||||||
| Junior subordinated debentures, at amortized cost |
103,188 | 69,194 | 103,655 | 77,426 | ||||||||
| Derivatives |
133 | 133 | 586 | 586 | ||||||||
The following table presents information about the Company’s assets and liabilities measured at fair value on a recurring basis at December 31, 2009 and 2008:
(in thousands)
| Fair Value at December 31, 2009 | ||||||||||||
| Description | Total | Level 1 | Level 2 | Level 3 | ||||||||
| Trading securities |
||||||||||||
| Obligations of states and political subdivisions |
$ | 693 | $ | 693 | $ | — | $ | — | ||||
| Equity securities |
1,438 | 1,438 | — | — | ||||||||
| Other investments securities(1) |
142 | 142 | — | — | ||||||||
| Available for sale securities |
||||||||||||
| U.S. Treasury and agencies |
11,794 | — | 11,794 | — | ||||||||
| Obligations of states and political subdivisions |
211,825 | — | 211,825 | — | ||||||||
| Residential mortgage-backed securities and collateralized mortgage obligations |
1,569,849 | — | 1,569,849 | — | ||||||||
| Other debt securities |
159 | — | 159 | — | ||||||||
| Investments in mutual funds and other equity securities |
1,989 | — | 1,989 | — | ||||||||
| Mortgage servicing rights, at fair value |
12,625 | — | — | 12,625 | ||||||||
| Derivatives |
969 | — | 969 | — | ||||||||
| Total assets measured at fair value |
$ | 1,811,483 | $ | 2,273 | $ | 1,796,585 | $ | 12,625 | ||||
| Junior subordinated debentures, at fair value |
$ | 85,666 | $ | — | $ | — | $ | 85,666 | ||||
| Derivatives |
133 | — | 133 | — | ||||||||
| Total liabilities measured at fair value |
$ | 85,799 | $ | — | $ | 133 | $ | 85,666 | ||||
142
Table of Contents
Umpqua Holdings Corporation and Subsidiaries
| Fair Value at December 31, 2008 | ||||||||||||
| Description | Total | Level 1 | Level 2 | Level 3 | ||||||||
| Trading securities |
||||||||||||
| Obligations of states and political subdivisions |
$ | 1,054 | $ | 1,054 | $ | — | $ | — | ||||
| Equity securities |
803 | 803 | — | — | ||||||||
| Other investments securities(1) |
130 | 130 | — | — | ||||||||
| Available for sale securities |
||||||||||||
| U.S. Treasury and agencies |
31,226 | — | 31,226 | — | ||||||||
| Obligations of states and political subdivisions |
179,585 | — | 179,585 | — | ||||||||
| Residential mortgage-backed securities and collateralized mortgage obligations |
1,025,295 | — | 1,025,295 | — | ||||||||
| Other debt securities |
634 | — | 634 | — | ||||||||
| Investments in mutual funds and other equity securities |
1,972 | — | 1,972 | — | ||||||||
| Mortgage servicing rights, at fair value |
8,205 | — | 8,205 | — | ||||||||
| Derivatives |
1,321 | — | 1,321 | — | ||||||||
| Total assets measured at fair value |
$ | 1,250,225 | $ | 1,987 | $ | 1,248,238 | $ | — | ||||
| Junior subordinated debentures, at fair value |
$ | 92,520 | $ | — | $ | — | $ | 92,520 | ||||
| Derivatives |
586 | — | 586 | — | ||||||||
| Total liabilities measured at fair value |
$ | 93,106 | $ | — | $ | 586 | $ | 92,520 | ||||
| (1) | Principally represents U.S. Treasury and agencies or residential mortgage-backed securities issued or guaranteed by governmental agencies. |
The following methods and assumptions were used to estimate the fair value of each class of financial instrument for which it is practicable to estimate that value:
Cash and Cash Equivalents—For short-term instruments, including cash and due from banks, and interest bearing deposits with banks, the carrying amount is a reasonable estimate of fair value.
Securities—Fair values for investment securities are based on quoted market prices when available or through the use of alternative approaches, such as matrix or model pricing, or broker indicative bids, when market quotes are not readily accessible or available.
Loans Held For Sale—For loans held for sale, carrying value approximates fair value.
Loans—Fair values are estimated for portfolios of loans with similar financial characteristics. Loans are segregated by type, including commercial, real estate and consumer loans. Each loan category is further segregated by fixed and variable rate, performing and nonperforming categories. The carrying values of variable rate real estate construction and development loans are discounted by a liquidity adjustment related to the current market environment. For the remaining variable rate loans, carrying value approximates fair value. The fair value of fixed rate loans is calculated by discounting contractual cash flows at rates which similar loans are currently being made and a liquidity adjustment related to the current market environment. The fair value of non-accrual loans are discounted further by credit and liquidity adjustments given the current market conditions.
Restricted Equity Securities—The carrying value of restricted equity securities approximates fair value as the shares can only be redeemed by the issuing institution at par.
Mortgage Servicing Rights—The fair value of mortgage servicing rights is estimated using a discounted cash flow model. Assumptions used include market discount rates, anticipated prepayment speeds, delinquency and foreclosure rates, and ancillary fee income. This model is periodically validated by an independent external model validation group. The model assumptions and the MSR fair value estimates are also compared to observable trades of similar portfolios as well as to MSR
143
Table of Contents
broker valuations and industry surveys, as available. Due to the limited observability of all significant inputs utilized in the valuation model, particularly the discount rate and projected constant prepayment rate, and how changes in these assumptions could potentially impact the ending valuation of this asset, as well as the lack of readily available quotes or observable trades of similar assets in the current period, we began classifying this as a Level 3 fair value measure in the third quarter of 2009. The transfer into Level 3 did not result in any changes in the methodology applied or the amount of realized or unrealized gains or losses recognized in the period. Management believes the significant inputs utilized are indicative of those that would be used by market participants.
Bank Owned Life Insurance Assets—Fair values of insurance policies owned are based on the insurance contract’s cash surrender value.
Deposits—The fair value of deposits with no stated maturity, such as non-interest bearing deposits, savings and interest checking accounts, and money market accounts, is equal to the amount payable on demand as of December 31, 2009 and 2008. The fair value of certificates of deposit is based on the discounted value of contractual cash flows. The discount rate is estimated using the rates currently offered for deposits of similar remaining maturities.
Securities Sold under Agreements to Repurchase and Federal Funds Purchased—For short-term instruments, including securities sold under agreements to repurchase and federal funds purchased, the carrying amount is a reasonable estimate of fair value.
Term Debt—The fair value of medium term notes is calculated based on the discounted value of the contractual cash flows using current rates at which such borrowings can currently be obtained.
Junior Subordinated Debentures—The fair value of junior subordinated debentures is estimated using an income approach valuation technique. The ending carrying (fair) value of the junior subordinated debentures measured at fair value represents the estimated amount that would be paid to transfer these liabilities in an orderly transaction amongst market participants. Due to the increasing credit concerns in the capital markets and inactivity in the trust preferred markets that have limited the observability of market spreads, we have classified this as a Level 3 fair value measure since the third quarter of 2008. In the second quarter of 2009, due to continued inactivity in the junior subordinated debenture and related markets and clarified guidance relating to the determination of fair value when the volume and level of activity for an asset or liability have significantly decreased or where transactions are not orderly, management evaluated and determined to rely on a third-party pricing service to estimate the fair value of these liabilities. The pricing service utilizes an income approach valuation technique, specifically an option-adjusted spread (“OAS”) valuation model. This OAS model values the cash flows over multiple interest rate scenarios and discounts these cash flows using a credit risk adjustment spread over the three month LIBOR swap curve. Prior to the second quarter of 2009, we estimated the fair value of junior subordinated debentures using an internal discounted cash flow model. The OAS model currently being utilized is more sophisticated and computationally intensive than the model previously used; however, the models react similarly to changes in the underlying inputs, and the results are considered comparable. With the assistance of a third-party pricing service, we determined that a credit risk adjusted spread of 675 basis points is representative of the nonperformance risk premium a market participant would require under current market conditions as of December 31, 2009.
Derivative Instruments—The fair value of the derivative instruments is estimated using quoted or published market prices for similar instruments, adjusted for factors such as pull-through rate assumptions based on historical information, where appropriate.
Visa Class B Common Stock—The fair value of Visa Class B common stock is estimated by applying a 19% discount to the value of the unredeemed Class A equivalent shares. The discount is determined by a third-party and primarily represents the risk related to the further potential reduction of the conversion ratio between Class B and Class A shares and a liquidity risk premium.
144
Table of Contents
Umpqua Holdings Corporation and Subsidiaries
The following table provides a reconciliation of assets and liabilities measured at fair value using significant unobservable inputs (Level 3) on a recurring basis during the years ended December 31, 2009 and 2008. The amount included in the “Transfer into Level 3” column represents the beginning balance of an item in the period (interim quarter) for which it was designated as a Level 3 fair value measure.
(in thousands)
| Beginning Balance |
Change included in earnings |
Purchases and issuances |
Sales and settlements |
Transfers into Level 3 |
Ending Balance |
Net change in unrealized gains or losses relating to items held at end of period |
||||||||||||||||||
| 2009 |
||||||||||||||||||||||||
| Mortgage servicing rights |
$ | — | $ | (1,341 | ) | $ | 3,335 | $ | — | $ | 10,631 | $ | 12,625 | $ | (467 | ) | ||||||||
| Junior subordinated debentures |
92,520 | (1,675 | ) | — | (5,179 | ) | — | 85,666 | (1,675 | ) | ||||||||||||||
| 2008 |
||||||||||||||||||||||||
| Junior subordinated debentures |
$ | — | $ | (30,357 | ) | $ | — | $ | (3,662 | ) | $ | 126,539 | $ | 92,520 | $ | (30,357 | ) | |||||||
Gains (losses) on mortgage servicing rights carried at fair value are recorded in mortgage banking revenue within other non-interest income. Gains resulting from the widening of the credit risk adjusted spread and changes in the three month LIBOR swap curve are recorded as gains on junior subordinated debentures carried at fair value within other non-interest income. The contractual interest expense on the junior subordinated debentures is recorded on an accrual basis as interest on junior subordinated debentures within interest expense. Settlements related to the junior subordinated debentures represent the payment of accrued interest that is embedded in the fair value of these liabilities.
Management believes that the credit risk adjusted spread being utilized is indicative of the nonperformance risk premium a willing market participant would require under current market conditions, that is, the inactive market. Management attributes the change in fair value of the junior subordinated debentures during the period to market changes in the nonperformance expectations and pricing of this type of debt, and not as a result of changes to our entity-specific credit risk. The widening of the credit risk adjusted spread above the Company’s contractual spreads has primarily contributed to the positive fair value adjustments. Future contractions in the credit risk adjusted spread relative to the spread currently utilized to measure the Company’s junior subordinated debentures at fair value as of December 31, 2009, or the passage of time, will result in negative fair value adjustments. Generally, an increase in the credit risk adjusted spread and/or a decrease in the three month LIBOR swap curve will result in positive fair value adjustments. Conversely, a decrease in the credit risk adjusted spread and/or an increase in the three month LIBOR swap curve will result in negative fair value adjustments.
Additionally, from time to time, certain assets are measured at fair value on a nonrecurring basis. These adjustments to fair value generally result from the application of lower-of-cost-or-market accounting or write-downs of individual assets due to impairment. The following table presents information about the Company’s assets and liabilities measured at fair value on a nonrecurring basis for which a nonrecurring change in fair value has been recorded during the years ended December 31, 2009 and 2008. The amounts disclosed below represent the fair values at the time the nonrecurring fair value measurements were made, and not necessarily the fair value as of the dates reported upon.
(in thousands)
| December 31, 2009 | ||||||||||||
| Description | Total | Level 1 | Level 2 | Level 3 | ||||||||
| Investment securities, held to maturity |
||||||||||||
| Residential mortgage-backed securities and collateralized mortgage obligations |
$ | 2,875 | $ | — | $ | — | $ | 2,875 | ||||
| Loans and leases |
138,134 | — | — | 138,134 | ||||||||
| Goodwill |
607,307 | — | — | 607,307 | ||||||||
| Other intangible assets, net |
295 | — | — | 295 | ||||||||
| Other real estate owned |
16,607 | — | — | 16,607 | ||||||||
| $ | 765,218 | $ | — | $ | — | $ | 765,218 | |||||
145
Table of Contents
| December 31, 2008 | ||||||||||||
| Description | Total | Level 1 | Level 2 | Level 3 | ||||||||
| Investment securities, held to maturity |
||||||||||||
| Residential mortgage-backed securities and collateralized mortgage obligations |
$ | 169 | $ | — | $ | — | $ | 169 | ||||
| Other debt securities |
150 | — | — | 150 | ||||||||
| Loans and leases |
65,752 | — | — | 65,752 | ||||||||
| Goodwill |
2,715 | — | — | 2,715 | ||||||||
| Other real estate owned |
4,251 | — | — | 4,251 | ||||||||
| $ | 73,037 | $ | — | $ | — | $ | 73,037 | |||||
The following table presents the losses resulting from nonrecurring fair value adjustments for the years ended December 31, 2009, 2008 and 2007:
(in thousands)
| 2009 | 2008 | 2007 | |||||||
| Investment securities, held to maturity |
|||||||||
| Residential mortgage-backed securities and collateralized mortgage obligations |
$ | 10,334 | $ | 3,816 | $ | — | |||
| Other debt securities |
— | 225 | — | ||||||
| Loans and leases |
185,810 | 86,607 | 32,335 | ||||||
| Goodwill |
111,952 | 982 | — | ||||||
| Other intangible assets, net |
804 | — | — | ||||||
| Other real estate owned |
12,247 | 5,084 | — | ||||||
| Total loss from nonrecurring measurements |
$ | 321,147 | $ | 96,714 | $ | 32,335 | |||
The investment securities held to maturity above represent non-agency collateralized mortgage obligations where other-than-temporary impairment (“OTTI”) has been identified and the investments have been adjusted to fair value. The fair value of these investments securities were obtained from third-party pricing services using matrix or model pricing methodologies and were corroborated by broker indicative bids. While we do not expect to recover the entire amortized cost basis of these securities, as we do not intend to sell these securities and it is not likely that we will be required to sell these securities before maturity, only the credit loss component of the impairment is recognized in earnings. The credit loss on a security is measured as the difference between the amortized cost basis and the present value of the cash flows expected to be collected. The remaining impairment loss related to all other factors, the difference between the present value of the cash flows expected to be collected and fair value, is recognized as a charge to a separate component other comprehensive income (“OCI”). We estimate the cash flows of the underlying collateral within each security considering credit, interest and prepayment risk models that incorporate management’s estimate of projected key assumptions including prepayment rates, collateral default rates and loss severity. Assumptions utilized vary from security to security, and are influenced by factors such as loan interest rates, geographic location, borrower characteristics and vintage, and historical experience. We then use a third party to obtain information about the structure of each security, including subordination and other credit enhancements, in order to determine how the underlying collateral cash flows will be distributed to each security issued in the structure. These cash flows are then discounted at the interest rate used to recognize interest income on each security.
146
Table of Contents
Umpqua Holdings Corporation and Subsidiaries
The loans and leases amount above represents impaired, collateral dependent loans that have been adjusted to fair value. When we identify a collateral dependent loan as impaired, we measure the impairment using the current fair value of the collateral, less selling costs. Depending on the characteristics of a loan, the fair value of collateral is generally estimated by obtaining external appraisals. If we determine that the value of the impaired loan is less than the recorded investment in the loan, we recognize this impairment and adjust the carrying value of the loan to fair value through the allowance for loan and lease losses. The loss represents charge-offs or impairments on collateral dependent loans for fair value adjustments based on the fair value of collateral. The carrying value of loans fully charged-off is zero.
The goodwill amount above represents goodwill that has been adjusted to fair value. The impairment charge recognized in 2009 relates to the Community Banking reporting segment. The Company engaged an independent valuation consultant to assist the Company in estimating the fair value of the Community Banking reporting unit for step one of the goodwill impairment test. We utilized a variety of valuation techniques to analyze and measure the estimated fair value of the reporting unit under both the income and market valuation approach. Under the income approach, the fair value of the reporting unit is determined by projecting future earnings for five years, utilizing a terminal value based on expected future growth rates, and applying a discount rate reflective of current market conditions. The estimation of forecasted earnings uses management’s best estimates of economic and market conditions over the projected periods and considers estimated growth rates in loans and deposits and future expected changes in net interest margins. Various market-based valuation approaches are utilized and include applying market price to earnings, core deposit premium, and tangible book value multiples as observed from relevant, comparable peer companies of the reporting unit. We also valued the reporting unit by applying an estimated control premium to the market capitalization. Weightings are assigned to each of the aforementioned model results, judgmentally allocated based on the observability and reliability of the inputs, to arrive at a final fair value estimate of the reporting unit. Because the step one analysis indicated that the implied fair value of goodwill was likely lower than the carrying amount, we completed step two of the goodwill impairment test. In step two of the goodwill impairment test, we calculated the fair value for the reporting unit’s assets and liabilities, as well as its unrecognized identifiable intangible assets, such as the core deposit intangible and trade name, in order to determine the implied fair value of goodwill. Fair value adjustments to items on the balance sheet primarily related to investment securities held to maturity, loans, other real estate owned, Visa Class B common stock, deferred taxes, deposits, term debt, and junior subordinated debentures carried at amortized cost. The external valuation specialist assisted management to estimate the fair value of our unrecognized identifiable assets, such as the core deposit intangible and trade name. Information relating to our methodologies for estimating the fair value of financial instruments is described above. Additional discussion relating to the significant assumptions utilized by management to estimate fair value in the second step of our goodwill impairment analysis, including the loans receivable portfolio and non-financial instruments, can be found in Note 7. Through this process, the Company determined that the implied fair value of the reporting unit’s goodwill was less than its carrying amount, and as a result, we recognized a goodwill impairment charge equal to that deficit. The goodwill impairment charge recognized in 2008 relates to the Retail Brokerage reporting segment. The impairment resulted from the Company’s evaluation following the departure of certain financial advisors. The valuation of the impairment at the Retail Brokerage operating segment was determined using an income approach by discounting cash flows of forecasted earnings.
The other intangible asset, net, amount above represents a merchant servicing portfolio income stream that has been adjusted to fair value. The impairment charge is a result of a decrease in the actual and expected future cash flows related to the income stream. The fair value of the merchant servicing portfolio was determined using an income approach (discounted cash flow model). Future cash flows were estimated based on actual historical experience and consideration of future expectations, including the discount revenue rates, offsetting operating expenses, growth and attrition rates, as well as other factors, discounted at a 14% discount rate.
The other real estate owned amount above represents impaired real estate that has been adjusted to fair value. Other real estate owned represents real estate which the Bank has taken control of in partial or full satisfaction of loans. At the time of foreclosure, other real estate owned is recorded at the lower of the carrying amount of the loan or fair value less costs to sell, which becomes the property’s new basis. Any write-downs based on the asset’s fair value at the date of acquisition are charged to the allowance for loan and lease losses. After foreclosure, management periodically performs valuations such that the real estate is carried at the lower of its new cost basis or fair value, net of estimated costs to sell. Fair value adjustments on other real estate owned are recognized within net loss on real estate owned. The loss represents impairments on other real estate owned for fair value adjustments based on the fair value of the real estate.
147
Table of Contents
NOTE 23. EARNINGS PER COMMON SHARE
The following is a computation of basic and diluted earnings per common share for the years ended December 31, 2009, 2008 and 2007:
(in thousands, except per share)
| 2009 | 2008 | 2007 | |||||||||
| NUMERATORS: |
|||||||||||
| Net (loss) income |
$ | (153,366 | ) | $ | 51,044 | $ | 63,268 | ||||
| Preferred stock dividends |
12,866 | 1,620 | — | ||||||||
| Dividends and undistributed earnings allocated to participating securities(1) |
30 | 154 | 187 | ||||||||
| Net (loss) earnings available to common shareholders |
$ | (166,262 | ) | $ | 49,270 | $ | 63,081 | ||||
| DENOMINATORS: |
|||||||||||
| Weighted average number of common shares outstanding—basic |
70,399 | 60,084 | 59,828 | ||||||||
| Effect of potentially dilutive common shares(2) |
— | 340 | 576 | ||||||||
| Weighted average number of common shares outstanding—diluted |
70,399 | 60,424 | 60,404 | ||||||||
| (LOSS) EARNINGS PER COMMON SHARE: |
|||||||||||
| Basic |
$ | (2.36 | ) | $ | 0.82 | $ | 1.05 | ||||
| Diluted |
$ | (2.36 | ) | $ | 0.82 | $ | 1.04 | ||||
| (1) | Represents dividends paid and undistributed earnings allocated to nonvested restricted stock awards. |
| (2) | Represents the effect of the assumed exercise of warrants, assumed exercise of stock options, vesting of |
| non-participating restricted shares, and vesting of restricted stock units, based on the treasury stock method. |
The following table presents the weighted average outstanding non-participating securities that were not included in the computation of diluted earnings per common share because their effect would be anti-dilutive for the years ended December 31, 2009, 2008 and 2007:
(in thousands)
| 2009 | 2008 | 2007 | ||||
| Stock options |
1,826 | 1,136 | 510 | |||
| CPP warrant |
1,811 | 291 | — | |||
| Non-participating, nonvested restricted shares |
17 | 26 | — | |||
| Restricted stock units |
100 | 3 | — | |||
| 3,754 | 1,456 | 510 | ||||
In the fourth quarter of 2008, the Company issued the CPP warrant to the U.S. Treasury to purchase up to 2,221,795 shares of common stock. This security was not included in the computation of diluted EPS for the years ended December 31, 2009 and 2008 because the warrant’s exercise price was greater than the average market price of common shares. The weighted average number of outstanding common stock underlying the CPP warrant in 2008 is calculated from the date of issuance. The weighted average number of outstanding common stock underlying the CPP warrant in 2009 reflects the 50% reduction of the number of shares of common stock underlying the warrant in connection with the Company’s qualifying public offering in the third quarter of 2009.
NOTE 24. OPERATING SEGMENTS
The Company operates three primary segments: Community Banking, Mortgage Banking and Retail Brokerage. The Community Banking segment’s principal business focus is the offering of loan and deposit products to its business and retail customers in its primary market areas. As of December 31, 2009, the Community Banking segment operates 155 locations throughout Oregon, Northern California and Washington.
The Mortgage Banking segment, which operates as a division of the Bank, originates, sells and services residential mortgage loans.
148
Table of Contents
Umpqua Holdings Corporation and Subsidiaries
The Retail Brokerage segment consists of the operations of Umpqua Investments, which offers a full range of retail brokerage services and products to its clients who consist primarily of individual investors. The Company accounts for intercompany fees and services between Umpqua Investments and the Bank at an estimated fair value according to regulatory requirements for services provided. Intercompany items relate primarily to management services.
Summarized financial information concerning the Company’s reportable segments and the reconciliation to the consolidated financial results is shown in the following tables:
Year Ended December 31, 2009
(in thousands)
| Community Banking |
Retail Brokerage |
Mortgage Banking |
Consolidated | ||||||||||||
| Interest income |
$ | 410,805 | $ | 122 | $ | 12,805 | $ | 423,732 | |||||||
| Interest expense |
99,383 | — | 3,641 | 103,024 | |||||||||||
| Net interest income |
311,422 | 122 | 9,164 | 320,708 | |||||||||||
| Provision for loan and lease losses |
209,124 | — | — | 209,124 | |||||||||||
| Non-interest income |
45,275 | 9,349 | 18,892 | 73,516 | |||||||||||
| Non-interest expense |
353,322 | 11,878 | 14,203 | 379,403 | |||||||||||
| (Loss) income before income taxes |
(205,749 | ) | (2,407 | ) | 13,853 | (194,303 | ) | ||||||||
| (Benefit from) provision for income taxes |
(45,527 | ) | (951 | ) | 5,541 | (40,937 | ) | ||||||||
| Net (loss) income |
(160,222 | ) | (1,456 | ) | 8,312 | (153,366 | ) | ||||||||
| Preferred stock dividends |
12,866 | — | — | 12,866 | |||||||||||
| Dividends and undistributed earnings allocated to participating securities |
30 | — | — | 30 | |||||||||||
| Net (loss) earnings available to common shareholders |
$ | (173,118 | ) | $ | (1,456 | ) | $ | 8,312 | $ | (166,262 | ) | ||||
| Total assets |
$ | 9,127,104 | $ | 13,634 | $ | 240,634 | $ | 9,381,372 | |||||||
| Total loans |
$ | 5,807,214 | $ | — | $ | 192,053 | $ | 5,999,267 | |||||||
| Total deposits |
$ | 7,432,647 | $ | — | $ | 7,787 | $ | 7,440,434 | |||||||
Year Ended December 31, 2008
(in thousands)
| Community Banking |
Retail Brokerage |
Mortgage Banking |
Consolidated | |||||||||||
| Interest income |
$ | 430,205 | $ | 35 | $ | 12,306 | $ | 442,546 | ||||||
| Interest expense |
147,070 | — | 5,169 | 152,239 | ||||||||||
| Net interest income |
283,135 | 35 | 7,137 | 290,307 | ||||||||||
| Provision for loan and lease losses |
107,678 | — | — | 107,678 | ||||||||||
| Non-interest income |
95,043 | 9,439 | 2,636 | 107,118 | ||||||||||
| Non-interest expense |
199,029 | 9,425 | 8,116 | 216,570 | ||||||||||
| Income before income taxes |
71,471 | 49 | 1,657 | 73,177 | ||||||||||
| Provision for income taxes |
21,063 | 407 | 663 | 22,133 | ||||||||||
| Net income (loss) |
50,408 | (358 | ) | 994 | 51,044 | |||||||||
| Preferred stock dividends |
1,620 | — | — | 1,620 | ||||||||||
| Dividends and undistributed earnings allocated to participating securities |
154 | — | — | 154 | ||||||||||
| Net earnings (loss) available to common shareholders |
$ | 48,634 | $ | (358 | ) | $ | 994 | $ | 49,270 | |||||
| Total assets |
$ | 8,376,734 | $ | 7,656 | $ | 213,160 | $ | 8,597,550 | ||||||
| Total loans |
$ | 5,951,047 | $ | — | $ | 180,327 | $ | 6,131,374 | ||||||
| Total deposits |
$ | 6,582,440 | $ | — | $ | 6,495 | $ | 6,588,935 | ||||||
149
Table of Contents
Year Ended December 31, 2007
(in thousands)
| Community Banking |
Retail Brokerage |
Mortgage Banking |
Consolidated | |||||||||
| Interest income |
$ | 472,836 | $ | 63 | $ | 15,493 | $ | 488,392 | ||||
| Interest expense |
194,139 | — | 8,299 | 202,438 | ||||||||
| Net interest income |
278,697 | 63 | 7,194 | 285,954 | ||||||||
| Provision for loan and lease losses |
41,730 | — | — | 41,730 | ||||||||
| Non-interest income |
45,970 | 10,750 | 8,109 | 64,829 | ||||||||
| Non-interest expense |
195,320 | 9,876 | 8,926 | 214,122 | ||||||||
| Income before income taxes |
87,617 | 937 | 6,377 | 94,931 | ||||||||
| Provision for income taxes |
28,748 | 364 | 2,551 | 31,663 | ||||||||
| Net income |
58,869 | 573 | 3,826 | 63,268 | ||||||||
| Preferred stock dividends |
— | — | — | — | ||||||||
| Dividends and undistributed earnings allocated to participating securities |
187 | — | — | 187 | ||||||||
| Net earnings available to common shareholders |
$ | 58,682 | $ | 573 | $ | 3,826 | $ | 63,081 | ||||
| Total assets |
$ | 8,120,970 | $ | 8,332 | $ | 210,751 | $ | 8,340,053 | ||||
| Total loans |
$ | 5,869,125 | $ | — | $ | 186,510 | $ | 6,055,635 | ||||
| Total deposits |
$ | 6,581,709 | $ | — | $ | 7,617 | $ | 6,589,326 | ||||
NOTE 25. RELATED PARTY TRANSACTIONS
In the ordinary course of business, the Bank has made loans to its directors and executive officers (and their associated and affiliated companies). All such loans have been made on the same terms as those prevailing at the time of origination to other borrowers.
The following table presents a summary of aggregate activity involving related party borrowers for the years ended December 31, 2009, 2008 and 2007:
(in thousands)
| 2009 | 2008 | 2007 | ||||||||||
| Loans outstanding at beginning of year |
$ | 13,968 | $ | 9,628 | $ | 12,191 | ||||||
| New loans and advances |
1,819 | 7,714 | 2,460 | |||||||||
| Less loan repayments |
(3,471 | ) | (3,374 | ) | (3,619 | ) | ||||||
| Reclassification(1) |
(15 | ) | — | (1,404 | ) | |||||||
| Loans outstanding at end of year |
$ | 12,301 | $ | 13,968 | $ | 9,628 | ||||||
| (1) | Represents loans that were once considered related party but are no longer considered related party, or loans that were not related party that subsequently became related party loans. |
At December 31, 2009 and 2008 deposits of related parties amounted to $14.3 million and $8.0 million, respectively.
150
Table of Contents
Umpqua Holdings Corporation and Subsidiaries
NOTE 26. PARENT COMPANY FINANCIAL STATEMENTS
Condensed Balance Sheets
December 31,
(in thousands)
| 2009 | 2008 | ||||||
| ASSETS |
|||||||
| Non-interest bearing deposits with subsidiary banks |
$ | 215,190 | $ | 70,481 | |||
| Investments in: |
|||||||
| Bank subsidiary |
1,535,981 | 1,611,612 | |||||
| Nonbank subsidiaries |
19,853 | 14,322 | |||||
| Other assets |
5,499 | 5,013 | |||||
| Total assets |
$ | 1,776,523 | $ | 1,701,428 | |||
| LIABILITIES AND SHAREHOLDERS’ EQUITY |
|||||||
| Payable to bank subsidiary |
$ | 60 | $ | 7 | |||
| Other liabilities |
21,092 | 18,238 | |||||
| Junior subordinated debentures, at fair value |
85,666 | 92,520 | |||||
| Junior subordinated debentures, at amortized cost |
103,188 | 103,655 | |||||
| Total liabilities |
210,006 | 214,420 | |||||
| Shareholders’ equity |
1,566,517 | 1,487,008 | |||||
| Total liabilities and shareholders’ equity |
$ | 1,776,523 | $ | 1,701,428 | |||
Condensed Statements of Income
Year Ended December 31,
(in thousands)
| 2009 | 2008 | 2007 | ||||||||||
| INCOME |
||||||||||||
| Dividends from subsidiaries |
$ | 18,306 | $ | 52,953 | $ | 104,540 | ||||||
| Other income |
6,656 | 38,528 | 5,307 | |||||||||
| Total income |
24,962 | 91,481 | 109,847 | |||||||||
| EXPENSES |
||||||||||||
| Management fees paid to subsidiaries |
305 | 183 | 150 | |||||||||
| Other expenses |
10,079 | 14,638 | 18,017 | |||||||||
| Total expenses |
10,384 | 14,821 | 18,167 | |||||||||
| Income before income tax and equity in undistributed earnings of subsidiaries |
14,578 | 76,660 | 91,680 | |||||||||
| Income tax (benefit) expense |
(1,677 | ) | 9,736 | (5,011 | ) | |||||||
| Net income before equity in undistributed earnings of subsidiaries |
16,255 | 66,924 | 96,691 | |||||||||
| (Distributions in excess) equity in undistributed earnings of subsidiaries |
(169,621 | ) | (15,880 | ) | (33,423 | ) | ||||||
| Net (loss) income |
(153,366 | ) | 51,044 | 63,268 | ||||||||
| Preferred stock dividends |
12,866 | 1,620 | — | |||||||||
| Dividends and undistributed earnings allocated to participating securities |
30 | 154 | 187 | |||||||||
| Net (loss) earnings available to common shareholders |
$ | (166,262 | ) | $ | 49,270 | $ | 63,081 | |||||
151
Table of Contents
Condensed Statements of Cash Flows
Year Ended December 31,
(in thousands)
| 2009 | 2008 | 2007 | ||||||||||
| OPERATING ACTIVITIES: |
||||||||||||
| Net (loss) income |
$ | (153,366 | ) | $ | 51,044 | $ | 63,268 | |||||
| Adjustment to reconcile net (loss) income to net cash provided by operating activities: |
||||||||||||
| (Distributions in excess) equity in undistributed earnings of subsidiaries |
169,621 | 15,880 | 33,423 | |||||||||
| Gain on sale of investment securities |
(79 | ) | — | — | ||||||||
| Depreciation, amortization and accretion |
(467 | ) | (1,025 | ) | (1,099 | ) | ||||||
| Change in fair value of junior subordinated debentures |
(6,854 | ) | (39,166 | ) | (4,829 | ) | ||||||
| Net (increase) decrease in other assets |
(637 | ) | 1,184 | (207 | ) | |||||||
| Net increase (decrease) in other liabilities |
1,523 | 13,889 | (2,164 | ) | ||||||||
| Net cash provided by operating activities |
9,741 | 41,806 | 88,392 | |||||||||
| INVESTING ACTIVITIES: |
||||||||||||
| Investment in subsidiaries |
(87,000 | ) | (160,000 | ) | 1,084 | |||||||
| Acquisitions |
— | — | 2,596 | |||||||||
| Proceeds from investment securities available for sale |
— | — | 797 | |||||||||
| Proceeds from investment securities held to maturity |
229 | — | — | |||||||||
| Net decrease (increase) in receivables from subsidiaries |
— | 283 | (121 | ) | ||||||||
| Net cash (used) provided by investing activities |
(86,771) | (159,717 | ) | 4,356 | ||||||||
| FINANCING ACTIVITIES: |
||||||||||||
| Net increase (decrease) in payables to subsidiaries |
53 | — | (13 | ) | ||||||||
| Proceeds from the issuance of subordinated debentures |
— | — | 60,000 | |||||||||
| Repayment of junior subordinated debentures |
— | — | (36,084 | ) | ||||||||
| Proceeds from issuance of preferred stock |
— | 201,927 | — | |||||||||
| Proceeds from issuance of warrants |
— | 12,254 | — | |||||||||
| Net proceeds from issuance of common stock |
245,697 | |||||||||||
| Dividends paid on preferred stock |
(10,739 | ) | — | — | ||||||||
| Dividends paid on common stock |
(13,399 | ) | (45,796 | ) | (43,461 | ) | ||||||
| Stock repurchased |
(174 | ) | (129 | ) | (96,291 | ) | ||||||
| Proceeds from exercise of stock options |
301 | 1,233 | 8,955 | |||||||||
| Net cash provided (used) by financing activities |
221,739 | 169,489 | (106,894 | ) | ||||||||
| Change in cash and cash equivalents |
144,709 | 51,578 | (14,146 | ) | ||||||||
| Cash and cash equivalents, beginning of year |
70,481 | 18,903 | 33,049 | |||||||||
| Cash and cash equivalents, end of year |
$ | 215,190 | $ | 70,481 | $ | 18,903 | ||||||
152
Table of Contents
Umpqua Holdings Corporation and Subsidiaries
NOTE 27. QUARTERLY FINANCIAL INFORMATION (Unaudited)
The following tables present the summary results for the eight quarters ending December 31, 2009
2009
(in thousands, except per share information)
| 2009 | ||||||||||||||||||||
| December 31 | September 30 | June 30 | March 31 | Four Quarters |
||||||||||||||||
| Interest income |
$ | 107,485 | $ | 107,088 | $ | 104,783 | $ | 104,376 | $ | 423,732 | ||||||||||
| Interest expense |
22,941 | 25,326 | 25,794 | 28,963 | 103,024 | |||||||||||||||
| Net interest income |
84,544 | 81,762 | 78,989 | 75,413 | 320,708 | |||||||||||||||
| Provision for loan losses |
68,593 | 52,108 | 29,331 | 59,092 | 209,124 | |||||||||||||||
| Non-interest income |
13,024 | 17,925 | 27,050 | 15,517 | 73,516 | |||||||||||||||
| Non-interest expense |
72,500 | 68,349 | 178,603 | 59,951 | 379,403 | |||||||||||||||
| Loss before income taxes |
(43,525 | ) | (20,770 | ) | (101,895 | ) | (28,113 | ) | (194,303 | ) | ||||||||||
| (Benefit from) provision for income taxes |
(16,843 | ) | (13,626 | ) | 2,396 | (12,864 | ) | (40,937 | ) | |||||||||||
| Net loss |
(26,682 | ) | (7,144 | ) | (104,291 | ) | (15,249 | ) | (153,366 | ) | ||||||||||
| Preferred stock dividends |
3,234 | 3,225 | 3,216 | 3,191 | 12,866 | |||||||||||||||
| Dividends and undistributed earnings allocated to participating securities |
8 | 7 | 7 | 8 | 30 | |||||||||||||||
| Net loss available to common shareholders |
$ | (29,924 | ) | $ | (10,376 | ) | $ | (107,514 | ) | $ | (18,448 | ) | $ | (166,262 | ) | |||||
| Basic loss per common share |
$ | (0.34 | ) | $ | (0.14 | ) | $ | (1.79 | ) | $ | (0.31 | ) | ||||||||
| Diluted loss per common share |
$ | (0.34 | ) | $ | (0.14 | ) | $ | (1.79 | ) | $ | (0.31 | ) | ||||||||
| Cash dividends declared per common share |
$ | 0.05 | $ | 0.05 | $ | 0.05 | $ | 0.05 | ||||||||||||
2008
(in thousands, except per share information)
| 2008 | |||||||||||||||
| December 31 | September 30 | June 30 | March 31 | Four Quarters | |||||||||||
| Interest income |
$ | 106,658 | $ | 109,722 | $ | 110,725 | $ | 115,441 | $ | 442,546 | |||||
| Interest expense |
33,614 | 36,014 | 37,190 | 45,421 | 152,239 | ||||||||||
| Net interest income |
73,044 | 73,708 | 73,535 | 70,020 | 290,307 | ||||||||||
| Provision for loan losses |
31,955 | 35,454 | 25,137 | 15,132 | 107,678 | ||||||||||
| Non-interest income |
20,881 | 36,664 | 19,979 | 29,594 | 107,118 | ||||||||||
| Non-interest expense |
56,304 | 58,490 | 54,289 | 47,487 | 216,570 | ||||||||||
| Income before income taxes |
5,666 | 16,428 | 14,088 | 36,995 | 73,177 | ||||||||||
| Provision for income taxes |
1,836 | 4,041 | 3,932 | 12,324 | 22,133 | ||||||||||
| Net income |
3,830 | 12,387 | 10,156 | 24,671 | 51,044 | ||||||||||
| Preferred stock dividends |
1,620 | — | — | — | 1,620 | ||||||||||
| Dividends and undistributed earnings allocated to participating securities |
5 | 37 | 30 | 82 | 154 | ||||||||||
| Net earnings available to common shareholders |
$ | 2,205 | $ | 12,350 | $ | 10,126 | $ | 24,589 | $ | 49,270 | |||||
| Basic earnings per common share |
$ | 0.04 | $ | 0.21 | $ | 0.17 | $ | 0.41 | |||||||
| Diluted earnings per common share |
$ | 0.04 | $ | 0.20 | $ | 0.17 | $ | 0.41 | |||||||
| Cash dividends declared per common share |
$ | 0.05 | $ | 0.19 | $ | 0.19 | $ | 0.19 | |||||||
153
Table of Contents
NOTE 28. SUBSEQUENT EVENTS
FDIC-assisted Purchase & Assumption—EvergreenBank
On January 22, 2010, the Washington Department of Financial Institutions closed EvergreenBank, Seattle, Washington, and appointed the Federal Deposit Insurance Corporation (“FDIC”) as its receiver. That same date, Umpqua Bank assumed the banking operations of EvergreenBank from the FDIC under a whole bank purchase and assumption agreement with loss sharing. Through this agreement, Umpqua Bank now operates seven additional store locations in the greater Seattle, Washington market.
The following table summarizes the gross book values of items assumed as recorded on EvergreenBank’s financial statement at the date of assumption, and do not include the fair value and other purchase accounting adjustments. The Company expects to finalize and record all opening balance purchase accounting adjustments during the first quarter of 2010. Significant adjustments to the book values of net assets assumed include, but are not limited to, recognizing the core deposit intangible and FDIC loss-sharing receivable assets, and adjusting loans, other real estate owned, time deposits and term debt to fair value. Additionally, Umpqua has a 90 day option to purchase any or all of the Bank’s owned premises and to assume any or all of the Bank’s leased premises.
| January 22, 2010 | |||
| Assets Acquired: |
|||
| Cash and equivalents |
$ | 18,919 | |
| Investment securities |
6,923 | ||
| Loans, net |
369,942 | ||
| Other real estate owned |
4,843 | ||
| Other assets |
1,507 | ||
| Total assets acquired |
$ | 402,134 | |
| Liabilities Assumed: |
|||
| Deposits |
$ | 284,752 | |
| Term debt |
58,317 | ||
| Other liabilities |
254 | ||
| Total liabilities assumed |
343,323 | ||
| Net assets acquired |
$ | 58,811 | |
Umpqua assumed both the insured and non-insured deposits balances, at a premium of 1.0%. The loss sharing agreement between the FDIC and Umpqua Bank, which covers all loans and other real estate owned that have been assumed, and business combination fair value adjustments, significantly mitigates the risk of future loss on the loan portfolio acquired. Under the terms of the loss sharing agreement, the FDIC will absorb a specified percentage of net losses in excess of Umpqua’s first loss tranche. Generally, the FDIC will absorb 80% of losses and share in 80% of loss recoveries on the first $90 million of losses, and absorb 95% of losses and share in 95% of loss recoveries on losses exceeding $90 million. The term for loss sharing on residential real estate loans is ten years, and the term for loss sharing on non-residential real estate loans is five years with respect to losses and eight years with respect to recoveries. The reimbursed losses from the FDIC are based on the book value of the relevant loan as determined by the FDIC at the date of the assumption. New loans made after that date are not covered by the loss sharing agreement.
Public Offerings of Common Stock and Common Stock Equivalent Securities
On February 3, 2010, the Company raised $303.6 million in gross proceeds through its previously announced underwritten public offering, by issuing 8,625,000 shares of the Company’s common stock, including 1,125,000 shares pursuant to the underwriter’s over-allotment option at a price of $11.00 per share; and 18,975,000 depository shares, including 2,475,000 depository shares pursuant to the underwriter’s over-allotment option, also at a price of $11.00 per share. The depository
154
Table of Contents
Umpqua Holdings Corporation and Subsidiaries
shares, as described below, represent interests in a series of Umpqua Holdings Corporation’s preferred stock designated as the Series B common stock equivalent.
The net proceeds to the Company after deducting underwriting discounts and commissions and estimated offering expenses are expected to be approximately $287.9 million. The net proceeds from the common stock offering and, if and when converted into common stock, the net proceeds of the depositary shares offering will qualify as both tangible common equity and regulatory Tier 1 capital and will be used, together with existing funds, to redeem preferred stock issued to the U.S. Treasury under the TARP Capital Purchase Program, to fund FDIC-assisted acquisition opportunities, similar to the recently announced acquisition of certain assets and deposits of EvergreenBank in an FDIC-assisted transaction, and for general corporate purposes.
The depositary shares, each of which represents a 1/100th interest in a share of Umpqua Holdings Corporation’s Series B common stock equivalent, entitle the holders, through the depository, to a proportional fractional interest in the rights and preferences of such share of common stock equivalent represented by the depositary share, including conversion, dividend, liquidation and voting rights. Each share of common stock equivalent has a liquidation amount of $1,100 and is initially subject to conversion into 100 shares of Umpqua Holdings Corporation’s common stock (and, correspondingly, each depositary share is initially subject to conversion into one share of Umpqua Holdings Corporation’s common stock). Umpqua Holdings Corporation has received approval to list the depositary shares on The NASDAQ Global Select Market under the symbol “UMPQP,” and trading commenced immediately.
TARP Repayment
On February 17, 2010, the Company repurchased all of the outstanding preferred stock that the Company issued to the U.S. Treasury in November 2008 for an aggregate purchase price of $214.2 million, which included accrued and unpaid dividends of $59,500. As a result of the repurchase of the preferred stock, the Company incurred a one-time deemed dividend of $9.7 million due to the accelerated amortization of the issuance discount on the preferred stock.
155
Table of Contents
ITEM 9. CHANGES IN AND DISAGREEMENTS WITH ACCOUNTANTS ON ACCOUNTING AND FINANCIAL DISCLOSURE.
Not applicable.
ITEM 9A. CONTROLS AND PROCEDURES.
On a quarterly basis, we carry out an evaluation, under the supervision and with the participation of our management, including our Chief Executive Officer, Principal Financial Officer and Principal Accounting Officer of the effectiveness of the design and operation of our disclosure controls and procedures pursuant to Rule 13a-15(b) under the Securities Exchange Act of 1934. Our Disclosure Control Committee operates under a charter that was approved by our Audit and Compliance Committee. As of December 31, 2009, our management, including our Chief Executive Officer, Principal Financial Officer, and Principal Accounting Officer, concluded that our disclosure controls and procedures are effective in timely alerting them to material information relating to us, that is required to be included in our periodic SEC filings.
Although we change and improve our internal controls over financial reporting on an ongoing basis, we do not believe that any such changes occurred in the fourth quarter 2009 that materially affected or are reasonably likely to materially affect our internal control over financial reporting.
REPORT OF MANAGEMENT ON INTERNAL CONTROL OVER FINANCIAL REPORTING
The management of Umpqua Holdings Corporation is responsible for establishing and maintaining adequate internal control over financial reporting as defined in Rule 13a-15(f) under the Securities Exchange Act of 1934. The Company’s internal control system is designed to provide reasonable assurance to our management and Board of Directors regarding the reliability of financial reporting and the preparation of financial statements for external purposes in accordance with generally accepted accounting principles. The Company’s internal control over financial reporting includes those policies and procedures that:
| • | Pertain to the maintenance of records that, in reasonable detail, accurately and fairly reflect the transactions and dispositions of the Company’s assets; |
| • | Provide reasonable assurance that transactions are recorded as necessary to permit preparation of financial statements in accordance with generally accepted accounting principles, and that receipts and expenditures of the company are being made only in accordance with the authorizations of management and directors of the Company; and |
| • | Provide reasonable assurance regarding prevention or timely detection of unauthorized acquisition, use or disposition of the Company’s assets that could have a material effect on the financial statements. |
Because of its inherent limitations, internal control over financial reporting may not prevent or detect misstatements. Also projections of any evaluation of effectiveness to future periods are subject to the risk that controls may become inadequate because of changes in conditions, or that the degree of compliance with the policies or procedures may deteriorate.
Management assessed the effectiveness of the Company’s internal control over financial reporting as of December 31, 2009. In making this assessment, we used the criteria set forth by the Committee of Sponsoring Organizations of the Treadway Commission (COSO) in Internal Control—Integrated Framework. Based on our assessment and those criteria, we believe that, as of December 31, 2009, the Company maintained effective internal control over financial reporting.
The Company’s registered public accounting firm has audited the Company’s consolidated financial statements and the effectiveness of our internal control over financial reporting as of and for the year ended December 31, 2009 that are included in this annual report and issued their Report of Independent Registered Public Accounting Firm, appearing under Item 8. The attestation report expresses an unqualified opinion on the effectiveness of the Company’s internal controls over financial reporting as of December 31, 2009.
February 19, 2010
None.
156
Table of Contents
Umpqua Holdings Corporation
ITEM 10. DIRECTORS, EXECUTIVE OFFICERS AND CORPORATE GOVERNANCE
The response to this item is incorporated by reference to Umpqua’s Proxy Statement for the April 2010 annual meeting of shareholders under the captions “Annual Meeting Business”, “Information About Directors and Executive Officers”, “Corporate Governance Overview” and “Section 16(a) Beneficial Ownership Reporting Compliance.”
ITEM 11. EXECUTIVE COMPENSATION.
The response to this item is incorporated by reference to the Proxy Statement, under the captions “Executive Compensation Discussion and Analysis” and “Executive Compensation Decisions.”
ITEM 12. SECURITY OWNERSHIP OF CERTAIN BENEFICIAL OWNERS AND MANAGEMENT AND RELATED STOCKHOLDER MATTERS
The response to this item is incorporated by reference to the Proxy Statement, under the caption “Security Ownership of Management and Others.”
ITEM 13. CERTAIN RELATIONSHIPS AND RELATED TRANSACTIONS AND DIRECTOR INDEPENDENCE
The response to this item is incorporated by reference to the Proxy Statement, under the caption “Related Party Transactions.”
ITEM 14. PRINCIPAL ACCOUNTING FEES AND SERVICES.
The response to this item is incorporated by reference to the Proxy Statement, under the caption “Independent Registered Public Accounting Firm.”
157
Table of Contents
ITEM 15. EXHIBITS AND FINANCIAL STATEMENT SCHEDULES.
| (a) | (1) Financial Statements: |
The consolidated financial statements are included as Item 8 of this Form 10-K.
| (2) | Financial Statement Schedules: |
All schedules have been omitted because the information is not required, not applicable, not present in amounts sufficient to require submission of the schedule, or is included in the financial statements or notes thereto.
| (3) | The exhibits filed as part of this report and exhibits incorporated herein by reference to other documents are listed on the Index of Exhibits to this annual report on Form 10-K on sequential page 161. |
158
Table of Contents
Umpqua Holdings Corporation
Pursuant to the requirements of Section 13 or 15(d) of the Securities Exchange Act of 1934, Umpqua Holdings Corporation has duly caused this Form 10-K to be signed on its behalf by the undersigned, thereunto duly authorized on February 19, 2010.
UMPQUA HOLDINGS CORPORATION (Registrant)
| By: | /s/ Raymond P. Davis |
Date: February 19, 2010 | ||
| Raymond P. Davis, President and Chief Executive Officer |
Pursuant to the requirements of the Securities Exchange Act of 1934, this report has been signed below by the following persons on behalf of the Registrant in the capacities and on the dates indicated.
| Signature | Title | Date | ||
| /s/ Raymond P. Davis Raymond P. Davis |
President, Chief Executive Officer and Director (Principal Executive Officer) |
February 19, 2010 | ||
| /s/ Ronald L. Farnsworth Ronald L. Farnsworth |
Executive Vice President, Chief Financial Officer (Principal Financial Officer) | February 19, 2010 | ||
| /s/ Neal T. McLaughlin Neal T. McLaughlin |
Executive Vice President, Treasurer (Principal Accounting Officer) |
February 19, 2010 | ||
| /s/ Ronald F. Angell Ronald F. Angell |
Director | February 19, 2010 | ||
|
Allyn C. Ford |
Director | |||
| /s/ Peggy Y. Fowler Peggy Y. Fowler |
Director | February 19, 2010 | ||
| /s/ David B. Frohnmayer David B. Frohnmayer |
Director | February 19, 2010 | ||
| /s/ Stephen M. Gambee Stephen M. Gambee |
Director | February 19, 2010 | ||
| /s/ Dan Giustina Dan Giustina |
Director | February 19, 2010 | ||
| /s/ Jose Hermocillo Jose Hermocillo |
Director | February 19, 2010 | ||
159
Table of Contents
| Signature | Title | Date | ||
|
William A. Lansing |
Director | |||
| /s/ Luis Machuca Luis Machuca |
Director | February 19, 2010 | ||
| /s/ Diane D. Miller Diane D. Miller |
Director | February 19, 2010 | ||
| /s/ Bryan L. Timm Bryan L. Timm |
Director | February 19, 2010 | ||
| /s/ Hilliard Terry Hilliard Terry |
Director | February 19, 2010 | ||
| /s/ Frank R. J. Whittaker Frank R. J. Whittaker |
Director | February 19, 2010 | ||
160
Table of Contents
Umpqua Holdings Corporation
| Exhibit | ||||
| 3.1 | Restated Articles of Incorporation with Designation of Fixed Rate Cumulative Perpetual Preferred Stock, Series A and designation of Series B Common Stock Equivalent preferred stock. | |||
| 3.2 | (a) |
Bylaws | ||
| 4.1 | (b) |
Specimen Common Stock Certificate | ||
| 4.2 | (c) |
Amended and Restated Declaration of Trust for Umpqua Master Trust I, dated August 9, 2007 | ||
| 4.3 | (d) |
Indenture, dated August 9, 2007, by and between Umpqua Holdings Corporation and LaSalle Bank National Association | ||
| 4.4 | (e) |
Series A Guarantee Agreement, dated August 9, 2007, by and between Umpqua Holdings Corporation and LaSalle Bank National Association | ||
| 4.5 | (f) |
Series B Guarantee Agreement, dated September 6, 2007, by and between Umpqua Holdings Corporation and LaSalle Bank National Association | ||
| 4.6 | (g) |
Series B Supplement pursuant to Amended and Restated Declaration of Trust dated August 9, 2007 | ||
| 4.7 | (h) |
Form of stock certificate for Series A preferred stock | ||
| 4.8 | (i) |
Warrant to purchase up to 2,221,795 shares of common stock issued on November 14, 2008 | ||
| 4.9 | (j-1) |
Series B Common Stock Equivalent stock certificate | ||
| 4.10 | (j-2) |
Deposit Agreement with Mellon Investor Services LLC | ||
| 4.11 | (j-3) |
Depository Receipt | ||
| 10.1 | (k) |
Third Restated Supplemental Executive Retirement Plan effective April 16, 2008 between the Company and Raymond P. Davis | ||
| 10.2 | (l) |
Employment Agreement dated effective July 1, 2003 between the Company and Raymond P. Davis | ||
| 10.3 | (m) |
Umpqua Holdings Corporation 2005 Performance-Based Executive Incentive Plan | ||
| 10.4 | (n) |
2003 Stock Incentive Plan, as amended, effective March 5, 2007 | ||
| 10.5 | (o) |
2007 Long Term Incentive Plan effective March 5, 2007 | ||
| 10.6 | (p) |
Employment Agreement with Brad Copeland dated March 10, 2006 | ||
| 10.7 | Employment Agreement with Kelly J. Johnson dated January 15, 2009 | |||
| 10.8 | Employment Agreement with Colin Eccles dated January 21, 2009 | |||
| 10.9 | (q) |
Employment Agreement with Ronald L. Farnsworth dated March 5, 2008 | ||
| 10.10 | (r) |
Form of Long Term Incentive Restricted Stock Unit Agreement | ||
| 10.11 | (s) |
Split-Dollar Insurance Agreement dated April 16, 2008 between the Company and Raymond P. Davis | ||
| 10.12 | (t) |
Form of First Amendment to Employment Agreement effective September 16, 2008 between the Company and Brad Copeland | ||
| 10.13 | (u) |
Letter Agreement dated November 14, 2008, including Securities Purchase Agreement—Standard Terms between the Company and the U.S. Department of the Treasury | ||
| 12 | Ratio of Earnings to Fixed Charges | |||
| 21.1 | Subsidiaries of the Registrant | |||
| 23.1 | Consent of Independent Registered Public Accounting Firm—Moss Adams LLP | |||
| 31.1 | Certification of Chief Executive Officer under Section 302 of the Sarbanes-Oxley Act of 2002 | |||
| 31.2 | Certification of Chief Financial Officer under Section 302 of the Sarbanes-Oxley Act of 2002 | |||
| 31.3 | Certification of Principal Accounting Officer under Section 302 of the Sarbanes-Oxley Act of 2002 | |||
| 32 | Certification of Chief Executive Officer, Chief Financial Officer and Principal Accounting Officer pursuant to Section 906 of the Sarbanes-Oxley Act of 2002 | |||
| 99.1 | Subsequent Year Certification of the Chief Executive Officer pursuant to Section 111(b) of the Emergency Economic Stabilization Act of 2008 | |||
| 99.2 | Subsequent Year Certification of the Chief Financial Officer pursuant to Section 111(b) of the Emergency Economic Stabilization Act of 2008 | |||
161
Table of Contents
| (a) | Incorporated by reference to Exhibit 3.2 to Form 8-K filed April 21, 2008 |
| (b) | Incorporated by reference to Exhibit 4 to the Registration Statement on Form S-8 (No. 333-77259) filed with the SEC on April 28, 1999 |
| (c) | Incorporated by reference to Exhibit 4.1 to Form 8-K filed August 10, 2007 |
| (d) | Incorporated by reference to Exhibit 4.2 to Form 8-K filed August 10, 2007 |
| (e) | Incorporated by reference to Exhibit 4.3 to Form 8-K filed August 10, 2007 |
| (f) | Incorporated by reference to Exhibit 4.3 to Form 8-K filed September 7, 2007 |
| (g) | Incorporated by reference to Exhibit 4.4 to Form 8-K filed September 7, 2007 |
| (h) | Incorporated by reference to Exhibit 4.1 to Form 8-K filed November 14, 2008 |
| (i) | Incorporated by reference to Exhibit 4.2 to Form 8-K filed November 14, 2008 |
| (j-1) | Incorporated by reference to Exhibit 4.2 to Form 8-K filed February 5, 2010 |
| (j-2) | Incorporated by reference to Exhibit 4.1 to Form 8-K filed February 5, 2010 |
| (j-3) | Incorporated by reference to Exhibit 4.3 to Form 8-K filed February 5, 2010 |
| (k) | Incorporated by reference to Exhibit 99.1 to Form 8-K/A filed April 23, 2008 |
| (l) | Incorporated by reference to Exhibit 10.4 to Form 10-Q filed August 11, 2003 |
| (m) | Incorporated by reference to Appendix B to Form DEF 14A filed March 31, 2005 |
| (n) | Incorporated by reference to Appendix A to Form DEF 14A filed March 14, 2007 |
| (o) | Incorporated by reference to Appendix B to Form DEF 14A filed March 14, 2007 |
| (p) | Incorporated by reference to Exhibit 10.2 to Form 8-K filed March 21, 2006 |
| (q) | Incorporated by reference to Exhibit 99.1 to Form 8-K filed March 7, 2008 |
| (r) | Incorporated by reference to Exhibit 10.4 to Form 10-Q filed August 3, 2007 |
| (s) | Incorporated by reference to Exhibit 99.2 to Form 8-K filed April 22, 2008 |
| (t) | Incorporated by reference to Exhibit 99.1 to Form 8-K filed October 8, 2008 |
| (u) | Incorporated by reference to Exhibit 10.1 to Form 8-K filed November 14, 2008 |
162