Attached files
Table of Contents
UNITED STATES
SECURITIES AND EXCHANGE COMMISSION
WASHINGTON, D.C. 20549
FORM 10-K
| x | ANNUAL REPORT PURSUANT TO SECTION 13 OR 15(d) OF THE SECURITIES EXCHANGE ACT OF 1934 |
For the Fiscal Year Ended December 31, 2009
or
| ¨ | TRANSITION REPORT PURSUANT TO SECTION 13 OR 15(d) OF THE SECURITIES EXCHANGE ACT OF 1934 |
For the transition period from to
Commission file number 001-33778
NEUTRAL TANDEM, INC.
(Exact Name of Registrant as Specified in its Charter)
| Delaware | 31-1786871 | |
| (State or Other Jurisdiction of Incorporation or Organization) |
(I.R.S. Employer Identification No.) | |
| One South Wacker Suite 200 Chicago, Illinois |
60606 | |
| (Address of Principal Executive Offices) | (Zip Code) | |
Registrant’s telephone number, including area code (312) 384-8000
Securities registered pursuant to Section 12(b) of the Exchange Act:
| Title of Each Class |
Name of Each Exchange on Which Registered | |
| Common Stock, $0.001 Par Value Per Share |
The NASDAQ Stock Market LLC |
Securities registered pursuant to Section 12(g) of the Exchange Act: None
Indicate check mark if the registrant is a well-known seasoned issuer, as defined in Rule 405 of the Securities Act. Yes ¨ No x
Indicate check mark if the registrant is not required to file reports pursuant to Section 13 or Section 15(d) of the Act. Yes ¨ No x
Indicate by check mark whether the registrant: (1) has filed all reports required to be filed by Section 13 or 15(d) of the Securities Exchange Act of 1934 during the preceding 12 months (or for such shorter period that the registrant was required to file such reports), and (2) has been subject to such filing requirements for the past 90 days. Yes x No ¨
Indicate by check mark whether the registrant has submitted electronically and posted on its corporate Web site, if any, every Interactive Data File required to be submitted and posted pursuant to Rule 405 of Regulation S-T (§ 232.405 of this chapter) during the preceding 12 months (or for such shorter period that the registrant was required to submit. Yes ¨ No ¨
Indicate by check mark if disclosure of delinquent filers pursuant to Item 405 of Regulation S-K is not contained herein, and will not be contained, to the best of the registrant’s knowledge, in definitive proxy or information statements incorporated by reference in Part III of this Form 10-K or any amendment to this Form 10-K. ¨
Indicate by check mark whether the registrant is a large accelerated filer, an accelerated filer, a non-accelerated filer, or a smaller reporting company. See definitions of “large accelerated filer,” “accelerated filer” and “smaller reporting company” in Rule 12b-2 of the Exchange Act. (Check one):
Large accelerated filer x Accelerated filer ¨ Non-accelerated filer ¨ Smaller reporting company ¨
Indicate by check mark whether the registrant is a shell company (as defined in Rule 12b-2 of the Exchange Act). Yes ¨ No x
The aggregate market value of the registrant’s common stock, $0.001 par value per share, held by non-affiliates of the registrant on June 30, 2009, the last business day of the registrant’s most recently completed second fiscal quarter, was $930,349,545 (based on the closing sales price of the registrant’s common stock on that date). Shares of the registrant’s common stock held by each officer, director and each other person known to the registrant who beneficially owns more than 5% or more of the registrant’s outstanding common stock have been excluded in that such persons may be deemed to be affiliates. This determination of affiliate status is not necessarily a conclusive determination for other purposes.
As of February 14, 2010, the registrant had 33,632,701 shares of common stock outstanding.
DOCUMENTS INCORPORATED BY REFERENCE
Portions of the Neutral Tandem, Inc. definitive Proxy Statement for its 2009 Annual Meeting of Stockholders to be filed with the Commission pursuant to Regulation 14A not later than 120 days after December 31, 2009 are incorporated by reference in Part III of this Form 10-K.
Table of Contents
NEUTRAL TANDEM, INC.
FORM 10-K
Table of Contents
PART I
| ITEM 1. | BUSINESS |
Our Company
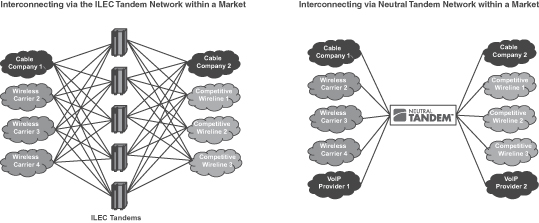
We provide tandem interconnection services principally to competitive carriers, including wireless, wireline, cable and broadband telephony companies. Competitive carriers use tandem switches to interconnect and exchange local and long distance traffic between their networks without the need to establish direct switch-to-switch connections. Prior to the introduction of our service, the primary method for competitive carriers to exchange traffic indirectly was through the tandem switches of the incumbent local exchange carriers, or ILECs. The tandem switching services offered by ILECs consist of transit services, which are provided in connection with local calls, and access services, which are provided in connection with long distance calls. Under certain interpretations of the Telecommunications Act of 1996 and implementing regulations, ILECs are required to provide tandem transit services to competitive carriers. ILECs generally set per minute rates and other charges for tandem transit services according to rate schedules approved by state public utility commissions, although the methodology used to review these rate schedules varies from state to state. ILECs are also required to offer access services to competing telecommunications carriers under the Telecommunications Act of 1996 and implementing regulations. ILECs generally set per minute rates and other charges for access services according to mandated rate schedules set by the Federal Communications Commission, or FCC, for interstate calls and by state public utility commissions for intrastate calls. Our solution enables competitive carriers to exchange traffic between their networks without using an ILEC tandem for both local and long distance calls.
The proliferation of competitive carriers over the past decade and their capture of an increasing share of subscribers shifted a greater amount of intercarrier traffic to ILEC tandem switches and amplified the complexity of carrier interconnections. This resulted in additional traffic loading of ILEC tandems, lower service quality and substantial costs incurred by competitive carriers for interconnection. A loss of ILEC market share to competitive carriers has escalated competitive tensions and resulted in an increased demand for tandem switching.
We founded our company to solve these interconnection problems and better facilitate the exchange of traffic among competitive carriers and non-carriers. By utilizing our managed tandem service, our customers benefit from a simplified interconnection network solution that reduces costs, increases network reliability, decreases competitive tension and adds network diversity and redundancy.
According to the Local Exchange Routing Guide, an industry standard guide maintained by Telcordia that is used by carriers, there are approximately 1.49 billion telephone numbers assigned to carriers in North America. Our services are principally targeted to address the estimated 799 million, or 54% of the total 1.49 billion, telephone numbers assigned primarily to competitive carriers; that is, all carriers that are not ILECs.
We have signed agreements with major competitive carriers and non-carriers and operated in 137 markets as of December 31, 2009. During the fourth quarter of 2009, our network carried 23.8 billion minutes of traffic. As of December 31, 2009, our network was capable of connecting calls to an estimated 480 million telephone numbers assigned to carriers. Telephone numbers assigned to a carrier may not necessarily be assigned to, and in use by, an end user.
Our business originally connected only local traffic among carriers within a single metropolitan market. In 2006, we installed a national IP backbone network connecting our major local markets. As a result, our service offerings now include the capability of switching and carrying long distance traffic between markets and among different types of customers.
We were incorporated in Delaware on April 19, 2001. Since commencing service in February 2004, we have grown rapidly and operated in 137 markets as of December 31, 2009. For the year ended December 31, 2009, we increased revenue to $168.9 million, an increase of 39.7% compared to $120.9 million for the year ended
1
Table of Contents
December 31, 2008. Our income from operations for the year ended December 31, 2009 was $64.0 million compared to $35.4 million for the year ended December 31, 2008. Net income for the year ended December 31, 2009 was approximately $41.3 million compared to net income of $24.0 million for the year ended December 31, 2008.
In recent years, new services and technologies have emerged as competitive alternatives to ILEC services for consumer and enterprise telephony. The increasingly diverse market now includes wireless, wireline and cable and broadband telephony companies. As these competitive carriers have expanded their customer base, the amount of traffic exchanged between them has also increased and is expected to grow in the future. For example:
| • | CTIA reported that total wireless minutes of use exceeded 1.1 trillion in the first half of 2009 and, as of June 2009, the industry survey recorded more than 276 million wireless users which represents a year-over-year increase of nearly 14 million subscribers (CTIA, 2009, CTIA’s Semi-Annual Wireless Industry Survey). |
| • | AT&T, Verizon, Qwest and Embarq, the four largest ILECs in the U.S., reported total access line losses of approximately 11.3 million in 2009, representing a decrease of approximately 9.4%. |
| • | Market Size. The continuing shift of telecommunications traffic away from conventional ILEC phone lines to the wireless segment provides opportunities for us to continue to expand our business. ILEC access lines declined by approximately 11.3 million during the 12 months ending September 30, 2009. Between June 2008 and June 2009, wireless subscribers grew by 14 million (CTIA, Mid-Year 2009 Wireless Industry Survey). Our tandem network was designed to serve the interconnection needs of wireless, cable, VoIP and IXC segments of the communications market, and since the initiation of our service in 2004, we feel we have built strong relationships with a majority of the leading carriers in these segments, which we believe provides opportunities for us to grow with our customers. |
Prior to the introduction of our services, competitive carriers generally had two alternatives for exchanging traffic between their networks. The two alternatives were interconnecting to the ILEC tandems or directly connecting individual switches, commonly referred to as “direct connects.” Given the cost and complexity of establishing direct connects, competitive carriers often elected to utilize the ILEC tandem as the method of exchanging traffic. The ILECs typically required competitive carriers to interconnect to multiple ILEC tandems with each tandem serving a restricted geographic area. In addition, as the competitive telecommunications market grew, the process of establishing interconnections at multiple ILEC tandems became increasingly difficult to manage and maintain, causing delays and inhibiting competitive carrier growth, and the purchase of ILEC tandem services became an increasingly significant component of a competitive carrier’s costs.
Growth in intercarrier traffic switched through ILEC tandems created switch capacity shortages known in the industry as ILEC “tandem exhaust,” where overloaded ILEC tandems became a bottleneck for competitive carriers. This increased call blocking and gave rise to service quality issues for competitive carriers. With the introduction of our services, we believe we became the first carrier to provide alternative tandem services capable of alleviating the ILEC tandem exhaust problem.
2
Table of Contents
The following diagrams illustrate interconnecting via the ILEC tandem networks and an example of interconnecting via our managed tandem network.
Following the introduction of our services, as discussed in further detail in “—Competition” below, we also began to face competition from other competitive carriers, including Level 3, Hypercube and Peerless Network. Over the past year, competition has intensified causing us to lose some traffic as well as reduce certain rates we charge our customers in various markets, including with respect to our major customers. For a further discussion see “Risk Factors—We face competition from the traditional ILECs and increasing competition from certain other providers such as Level 3 Communications, Peerless Network and Hypercube and expect to compete with new entrants to the tandem services market” in Item 1A below.
The second alternative for exchanging traffic, prior to our commencement of operations, was by directly connecting competitive carrier switches to each other. Implementing direct switch-to-switch network connections between all competitive switches in a market can be challenging. For example, in order to completely bypass the ILEC tandem network, a market with 100 competitive switches would require 9,900 direct one-way switch-to-switch connections. The capital and operating expense requirements, complexity and management challenges of establishing and maintaining direct connections generally makes them economical only for higher traffic switch combinations. However, where sufficient traffic between switches does exist, carriers often do establish direct connections. See “Risk Factors—The market for our services is competitive and increased adoption of IP switching technologies could increase the competition we face from direct connections” in Item 1A below. We believe that our customers are currently frequently directly connecting their networks, even for lower traffic switch pair combinations, for various reasons, including in order to avoid paying a transit fee. For a further discussion see “Risk Factors—The market for our services is competitive and increased adoption of IP switching technologies could increase the competition we face from direct connections” in item 1A below.
Competitive carriers are also interested in ways to reduce the risk of network failure. Recommendations of the Independent Panel Reviewing the Impact of Hurricane Katrina on Communications Networks, which was a report prepared for the FCC in June 2006, noted the need for tandem diversity. The report highlighted that the impact of an ILEC tandem failure due to the failure of routing paths into tandems in New Orleans in August 2005 led to the inability of local carriers to exchange and complete calls and the inability of long distance calls to enter or leave areas served by the tandem.
Our solutions potentially help minimize these network failures and interconnection problems by offering physically diverse tandem switching facilities and transmission paths that increase network reliability. We also simplify the ordering, provisioning and capacity management requirements of our customers, and seek to leverage our extensive interconnection network and proprietary technology to capitalize on the growth of intercarrier traffic.
3
Table of Contents
Our Services
Our services allow competitive carriers to exchange local and long distance traffic between their networks without using an ILEC tandem or establishing direct connections. Each competitive carrier that connects to our network generally gains access to all other competitive carriers’ switches connected to our network. Once connected to our network, carriers can route their traffic to other destinations (telephone numbers) that are addressable by our network. We charge on a per-minute basis for traffic switched by our network.
As a core component of our service offering, we actively manage network capacity between our tandem switches and customers’ switches, which results in improved network quality and reduced call blocking. By monitoring traffic levels and projecting anticipated growth in traffic, we are generally able to provide on a timely basis additional circuits between customer switches and our network to meet increased demand. This feature saves competitive carriers substantial time and effort in managing their interconnection network, improves their customers’ experience, reduces trouble tickets and allows them to focus more on their core business.
We use proprietary software tools (one of which is patent-pending) to manage and track routing combinations associated with hundreds of millions of telephone numbers. Our services include ongoing customer notification of new routing options that become available as we add new customers to our network or enter new markets. We also provide our customers with invoices, management reports and call detail records in paper and electronic formats along with monthly savings summary reports.
Our managed tandem network includes technologically advanced IP switching platforms manufactured by Sonus Networks, Inc. linked together by an IP backbone. Our network is capable of automatically switching IP-originated or conventional Time Division Multiplexing, or TDM, traffic to terminating carriers using either protocol. We support IP-to-IP, IP-to-TDM, TDM-to-IP and TDM-to-TDM traffic with appropriate protocol conversion and gateway functionality. We also support both conventional Signaling System #7 and Session Initiation Protocol call routing. Session Initiation Protocol is an application-layer control (signaling) protocol for creating, modifying and terminating realtime IP communications sessions with one or more participants. These sessions include Internet telephone calls, multimedia distribution and multimedia conferences. Signaling System #7 is a set of telephony signaling protocols which is used to set up the majority of the world’s Public Switched Telephone Network calls.
In addition, patent-pending proprietary software tools help us to manage the complicated routing scenarios required to terminate traffic to hundreds of millions of telephone numbers and support our network. The software allows us to quickly identify new routing opportunities between carriers and to help optimize our customers’ interconnection costs, which leads to improved customer service. We believe the adaptability and flexibility of our technology enables us to provide a robust service offering to interconnect a wide range of traffic types and to adapt our service offerings more efficiently than the ILECs, which predominantly employ legacy Class 4 TDM-only circuit switching technology for tandem switching.
Our network, as of December 31, 2009, connects 1,804 unique competitive carrier switches (a 26% increase over December 31, 2008), creating up to 3.2 million unique switch-to-switch routes serving an estimated 480 million telephone numbers assigned to these carriers. Telephone numbers assigned to a carrier may not necessarily be assigned to, and in use by, an end user. In the quarter ended December 31, 2009, our network carried approximately 8 billion minutes of traffic per month.
4
Table of Contents
Our Strategy
Our strategy is focused on expanding our business by increasing the share of telecommunications traffic that our network can serve. Expanding our share of telecommunications traffic increases the value of our network to our customers and enables us to capture a larger share of total telecommunications revenue. Key elements of our expansion strategy include:
| • | Broaden our geographic presence. Our managed tandem services, as of December 31, 2009, are currently available in 137 markets, serving an estimated 480 million telephone numbers assigned to competitive carriers out of a potential addressable market of 695 million telephone numbers assigned to competitive carriers in these 137 markets. Telephone numbers assigned to a carrier may not necessarily be assigned to, and in use by, an end user. As we now provide our services in most of the United States, in order to expand our business we are now seeking to offer international services (such as exchanging traffic that originates outside of the United States and terminates in the United States to the telephone numbers that we serve). |
| • | Expand our customer base. As our network expands, our market opportunity will include additional competitive carriers (particularly regional wireless carriers and cable companies) and non-carriers that we do not currently serve. Many of these potential customers, although not large providers, are among the fastest growing carriers in their service areas. |
| • | Increase the types of traffic we exchange. Our business originally connected only local traffic among carriers within a single metropolitan market. In 2006, we installed a national IP backbone network connecting our major local markets. As a result, our service offerings now include the capability of switching and carrying traffic between multiple markets and among different types of customers. With one point of access, our customers are able to increase the number of minutes that are switched by our network. In order to expand our business we may also seek to further develop our service offerings by increasing the types of voice traffic we exchange over our network and to offer other services, such as ethernet exchange services. |
Our Customers
We principally serve carriers, which represented approximately 96.5% of our revenues for our 2009 fiscal year, with non-carriers accounting for the remaining 3.5%. As of December 31, 2009, we have 99 carriers originating traffic and 116 carriers connected to our network. Our contracts with our top five customers represented approximately 63.9% of our total revenue through December 31, 2009. Our two largest customers, Sprint Nextel and AT&T, accounted for 23% and 14%, respectively, of our total revenues for the year ended December 31, 2009. Our contracts with customers do not contain volume commitments, are not exclusive, and could be terminated or modified in ways that are not favorable to us. However, while we have lost customers’ traffic in specific routes, since initiating service we have not had any significant customer cease using our services completely. We generate revenue for our managed tandem services by charging tandem transit and access fees on a minute of use basis. For the year ended December 31, 2009, wireless and cable companies account for approximately 64.5% of our revenue.
Since certain of our carrier customers interconnect with us in all of their markets where we have a presence, we have the ability to increase our revenues by entering new markets. In addition, we expect to broaden our customer base by targeting competitive carriers that are not current customers or that operate in markets that we do not yet serve. Of our 99 originating carriers, 92 of them currently use our services to deliver traffic in more than one market.
5
Table of Contents
Our Markets
| Akron, OH | Charlotte, NC | Greenville, SC | Nashville, TN | Salt Lake City, UT | ||||
| Albany, NY | Chattanooga, TN | Hartford, CT | New Mexico | San Antonio, TX | ||||
| Albany, GA | Chicago, IL | Houston, TX | New Orleans, LA | San Diego, CA | ||||
| Altoona, PA | Cincinnati, OH | Huntsville, AL | New York, NY | San Francisco, CA | ||||
| Amarillo, TX | Cleveland, OH | Indianapolis, IN | Oklahoma City, OK | San Luis Obispo, CA | ||||
| Asheville, NC | Colorado Springs, CO | Jackson, MS | Omaha, NE | Savannah, GA | ||||
| Atlanta, GA | Columbia, SC | Jacksonville, FL | Orlando, FL | Scranton, PA | ||||
| Atlantic City, NJ | Columbus, OH | Kansas City, MO | Palm Springs, CA | Seattle, WA | ||||
| Auburn, IN | Corpus Christi, TX | Knoxville, TN | Pensacola, FL | Shreveport, LA | ||||
| Augusta, GA | Dallas, TX | Lafayette, LA | Peoria, IL | South Bend, IN | ||||
| Austin, TX | Davenport, IA | Lansing, MI | Philadelphia, PA | Spokane, WA | ||||
| Bakersfield, CA | Dayton, OH | Las Vegas, NV | Phoenix, AZ | Springfield, IL | ||||
| Baltimore, MD | Daytona Beach, FL | Little Rock, AR | Pine Bluff, AR | St. Cloud, MN | ||||
| Baton Rouge, LA | Delaware Valley, PA | Los Angeles, CA | Pittsburgh, PA | St. Louis, MO | ||||
| Binghamton, NY | Denver, CO | Louisville, KY | Portland, ME | Sterling, IL | ||||
| Birmingham, AL | Des Moines, IA | Macon, GA | Portland, OR | Stockton, CA | ||||
| Bloomington, IL | Detroit, MI | Madison, WI | Poughkeepsie, NY | Syracuse, NY | ||||
| Bloomington, IN | El Paso, TX | Manchester, NH | Puerto Rico | Tallahassee, FL | ||||
| Boise, ID | Erie, PA | Mansfield, OH | Raleigh, NC | Tampa, FL | ||||
| Boston, MA | Eugene, OR | Matton, IL | Reno, NV | Toledo, OH | ||||
| Briston, TN | Evansville, IN | Memphis, TN | Rhode Island | Tulsa, OK | ||||
| Brownsville, TX | Fort Myers, FL | Miami, FL | Richmond, VA | Tucson, AZ | ||||
| Buffalo, NY | Fresno, CA | Milwaukee, WI | Richmond, IN | Waco, TX | ||||
| Capital, PA | Gainesville, FL | Minneapolis, MN | Rochester, NY | Washington DC | ||||
| Cedar Rapids, IA | Grand Rapids, MI | Mobile, AL | Rockford, IL | Wichita, KS | ||||
| Champaign, IL | Green Bay, WI | Montgomery, AL | Rocky Mount, NC | Wilmington, NC | ||||
| Charleston, SC | Greensboro, NC | Newark, NJ | Sacramento, CA | Winchester, KY | ||||
| Saginaw, MI | Youngstown, OH |
Our expected market expansion plan in the United States during the 12-month period following December 31, 2009 is more limited than it has been historically, as we now cover many of the major and mid-size markets in the United States. We are currently considering whether to expand internationally. International services may include exchanging traffic that originates outside of the United States and terminates in the United States to the telephone numbers that we serve.
Sales and Marketing
Our sales and marketing organization divides accounts by wireless, cable, wireline and non-carriers and seeks to develop solutions for our customers. Dividing customers in this way allows us to develop industry knowledge about each carrier and a more value-added sales force. Our sales team works closely with our customers to identify and address their needs. We seek to expand the use of our service offerings by our current customers through account managers who are dedicated to specific customer accounts. The sales team conducts weekly meetings to discuss customer activity, competitive activity and losses, best practices and industry trends. In addition to a base salary, the compensation package for the members of our sales team includes incentive arrangements, including quarterly target incentives based on our performance and the individual’s performance, tiered payment structures and negative incentives. The members of our sales organization have an average of over 22 years of sales experience and in-depth knowledge of the telecommunications industry.
Our marketing team works closely with the sales team to deliver comprehensive services, develop a clear and consistent corporate image and offer a full range of product offerings. Our marketing efforts are designed to
6
Table of Contents
drive awareness of our service offerings. Our marketing activities include direct sales programs, targeted public relations and participation in industry trade shows. We are also engaged in an ongoing effort to maintain relationships with key communications industry analysts.
Our Customer Support
Our ordering and provisioning groups form the core of our customer support team. Each group works closely with the different vendor and customer organizations responsible for establishing service. We assign an implementation manager to each account that is responsible for the end-to-end delivery of our services. These managers make daily contact with their customer and help coordinate our local operations teams during implementation. This process helps to improve customer satisfaction, increase customer implementation and promote our revenue realization.
Our network operations center monitors and supports our tandem network 24 hours a day, 365 days a year. The network operations center is responsible for troubleshooting any potential network problems.
Competition
Our primary competitors today are the traditional ILECs (primarily AT&T, Verizon and Qwest), other competitive carriers that provide tandem or similar services (primarily Level 3, Hypercube and Peerless Network), and direct connections between carriers.
The tandem switching services offered by ILECs consist of transit services, which are provided in connection with local calls, and access services, which are provided in connection with long distance calls. ILECs generally set per minute rates and other charges for tandem transit services according to rate schedules approved by state public utility commissions, although the methodology used to review these rate schedules varies from state to state. ILECs generally set per minute rates and other charges for access services according to mandated rate schedules set by the Federal Communications Commission, or FCC, for interstate calls and by state public utility commissions for intrastate calls. Our solution enables competitive carriers to exchange traffic between their networks without using an ILEC tandem for both local and long distance calls.
Over the past year, we have faced increasing direct competition from other competitive carriers, including Level 3, Hypercube and, most specifically, Peerless Network. As more specifically described below under “Item 3. Legal Proceedings,” we commenced a patent infringement action against Peerless Network and Peerless Network asserted several counterclaims against us generally alleging that (i) our patent is invalid and unenforceable under a variety of theories, (ii) assertion of the patent amounts to patent misuse and violates certain monopolization laws, and (iii) certain conduct surrounding the litigation gave rise to a tortious interference claim.
We also face indirect competition from carriers that directly connect their switches. When there is a significant amount of traffic between two switches, carriers have an economic incentive to establish direct connections to remove intermediate switching. We believe that our customers are currently frequently directly connecting their networks, even for lower traffic switch pair combinations, for various reasons, including in order to avoid paying a transit fee. As our customers grow, the amount of traffic exchanged between them grows, thus leading to the risk that they will increase the number of direct connections between their switches and remove traffic from our tandems. The risk of direct connections will increase as more carriers move to an IP-based interface, because direct connecting between two IP-based carriers is less complex, thus enabling more direct connections. See “Risk Factors—The market for our services is competitive and increased adoption of IP switching technologies could increase the competition we face from direct connections” in Item 1A below.
We are unable to provide accurate market share information, since no regulatory body or industry association requires carriers to identify amounts of traffic to other carrier types. Traffic in most instances is reported on aggregate levels.
7
Table of Contents
The ILECs that provide tandem switching services, as well as many competitive providers, including Level 3, have significantly more employees and greater financial, technical, marketing and other resources than we have. Our ability to compete successfully with them and other competing carriers depends on numerous factors, both inside and outside our control, including:
| • | tandem switching rates charged by third-party competitors; |
| • | our competitors’ ability to offer bundled service offerings, such as transit services and inexpensive long distance services; |
| • | our responsiveness to customer needs; |
| • | our ability to support existing and new industry standards and protocols; |
| • | our ability to raise capital; |
| • | our ability to retain and attract key employees; |
| • | interpretations of or changes to regulatory law; |
| • | our ability to continue development of technical innovations; and |
| • | the quality, reliability, security and price-competitiveness of our services. |
Regulation
Overview
Our communications services business is subject to varying degrees of federal and state regulation. We operate as a common carrier and therefore are subject to the jurisdiction of both federal and state regulatory agencies, which have the authority to review our prices, terms and conditions of service. We operate as a facilities-based carrier in most states and have received all necessary state and FCC authorizations to do so. The regulatory agencies exercise control over our prices and services to varying degrees, and also impose various obligations such as reporting, payment of fees and compliance with consumer protection and public safety requirements.
By operating as a common carrier, we benefit from certain legal rights established by federal and state legislation, especially the federal Telecommunications Act of 1996, which gives us and other competitive entrants the right to interconnect to the networks of incumbent telephone companies and access to their networks. We have used these rights to gain interconnection with the incumbent telephone companies and to purchase selected services at wholesale prices that complement our ability to terminate traffic. We have also used these rights to request interconnection with competitive carriers for the termination of transit traffic to carriers when such carriers decide for whatever reason not to utilize our transit service. While our experience has been that competitive carriers usually accommodate such requests, and indeed frequently become users of our transit service as well, we have participated in federal and state regulatory proceedings against other carriers involving our right to establish or maintain existing direct connections between us. As previously disclosed, we subsequently resolved these proceedings amicably.
The FCC and state regulators are considering a variety of issues that may result in changes in the regulatory environment in which we operate our business. Most importantly, many state and federal proceedings have considered issues related to the ILECs’ pricing of services that compete with our service. To the extent that the regulatory commissions maintain or impose pricing restrictions on the transit or access rates charged by the ILEC, then the price we compete with is likely to be lower than it would be in an unregulated market. In addition, the FCC is conducting a proceeding to consider reform of its intercarrier compensation rules. This proceeding may affect the pricing and regulation of ILEC tandem services against which we compete. To the extent that any state or the FCC mandates reductions in the rates the ILECs’ charge for tandem services, including transit or access rates, it could have a material and adverse effect on our business, financial condition, operating results or growth opportunities. See “Risk Factors—Regulatory developments could negatively impact our business” in Item 1A below.
8
Table of Contents
Although the nature and effects of governmental regulation are not predictable with certainty, we believe that the FCC is unlikely to enact rules that extinguish our basic right or ability to compete in telecommunications markets. However, even though many possible regulatory developments might not directly affect our operations, to the extent that they limit our customers’ ability to compete effectively against the ILEC or limit or reduce the rates at which an ILEC may provide the same services we provide, we are indirectly impacted. The following sections describe in more detail the regulatory developments described above and other regulatory matters that may affect our business.
Regulatory Framework
The Telecommunications Act of 1996
The Telecommunications Act of 1996, which substantially revised the Communications Act of 1934, established the regulatory framework for the introduction of competition for local communications services throughout the United States by new competitive entrants such as us. Before the passage of the Telecommunications Act, states typically granted an exclusive franchise in each local service area to a single dominant carrier, often a former subsidiary of AT&T known as a Regional Bell Operating Company, or RBOC, which owned the entire local exchange network and operated as a virtual monopoly in the provision of most local exchange services in most locations in the United States. The RBOCs now consist of Verizon, Qwest Communications and AT&T. These three carriers are also referred to as ILECs, along with many other smaller incumbent local exchange carriers that were not former subsidiaries of AT&T.
Among other things, the Telecommunications Act preempts state and local governments from prohibiting any entity from providing communications service, which has the effect of eliminating prohibitions on entry that existed in almost half of the states at the time the Telecommunications Act was enacted. Nonetheless, the Telecommunications Act preserved state and local jurisdiction over many aspects of local telephone service and, as a result, we are subject to varying degrees of federal, state and local regulation.
We believe that the Telecommunications Act provided the opportunity to accelerate the development of competition at the local level by, among other things, requiring the incumbent carriers to cooperate with competitors’ entry into the local exchange market. To that end, incumbent local exchange carriers are required to allow interconnection of their network with competitive networks. Incumbent local exchange carriers are further required by the Telecommunications Act to provide access to certain elements of their network to competitive local exchange carriers. These rules have helped the development of competitive telecommunications carriers, many of which have become our customers.
We have developed our business, including our decision to operate in most instances as a common carrier, and designed and constructed our networks to take advantage of the features of the Telecommunications Act. There have been numerous attempts to revise or eliminate the basic framework for competition in the local exchange services market through a combination of federal legislation, adoption of new rules by the FCC, and challenges to existing and proposed regulations by the incumbent carriers. We anticipate that Congress will consider a range of proposals to modify the Telecommunications Act over the next few years, including some proposals that could restrict or eliminate our access to elements of the incumbent local exchange carriers’ network. Although we consider it unlikely, based on statements of both telecommunications analysts and Congressional leaders, that Congress would reverse the fundamental policy of encouraging competition in communications markets, we cannot predict whether future legislation may adversely affect our business in any way.
Federal Regulation
The FCC regulates interstate and international communications services of common carriers, including access to local communications networks for the origination and termination of these services. We typically
9
Table of Contents
provide our services on a common carrier basis and the FCC has jurisdiction over our tandem access services to the extent they are used as part of the origination or termination of interstate or international calls. Under certain interpretations of the Telecommunications Act, the FCC may also have the authority to regulate our provision of local transit services and intrastate access services, including setting the methodology by which state regulators determine local or intrastate pricing. To date, the FCC has not determined whether to accept this interpretation of the Telecommunications Act with respect to local transit services, although some states have proceeded as if local transit services are subject to that law. For a further discussion of the states’ rights to determine the pricing of our services under the Telecommunications Act, see “Regulatory Framework-State Regulation” below.
The FCC imposes extensive economic regulations on incumbent local exchange carriers due to their ability to exercise market power. The FCC imposes less regulation on common carriers without market power including, to date, competitive local exchange carriers. Unlike incumbent carriers, we are not currently subject to price cap or rate of return regulation, but we are subject to the general federal requirement that our charges for interstate and international services must be just, reasonable and non-discriminatory. The rates we can charge for interstate access services are limited by FCC rules, and may not exceed the rates charged by the incumbent carrier for comparable services. Apart from this limitation, the FCC currently has no rules concerning our rates for tandem transit services. We are also required to file periodic reports, to pay regulatory fees based on our interstate revenues, and to comply with FCC regulations concerning the content and format of our bills, the process for changing a customer’s subscribed carrier, and other consumer protection matters. Because we do not directly serve consumers, many of these regulations have no practical effect on our business. The FCC has authority to impose monetary forfeitures and to condition or revoke a carrier’s operating authority for violations of its requirements. Our operating costs are increased by the need to assure compliance with regulatory obligations.
We are also affected indirectly by FCC regulations that alter the competitive landscape for customers or potential customers of our services. As discussed above, the Telecommunications Act requires the incumbent local exchange carriers to provide competitors access to elements of their local network on an unbundled basis, known as UNEs. Several FCC decisions in 2003 through 2005 significantly altered the terms on which competitive carriers can obtain access to these network elements. Among other things, these decisions eliminated the obligation of incumbent carriers to offer a network element “platform” known as UNE-P that allowed competitors to offer services without any facilities of their own. It also limited the availability of some high- capacity loop and transport network elements that are typically used by competitors who do have some of their own facilities.
These changes in the FCC rules have had several effects on the competitive telecommunications carriers who are our prospective customers. First, the elimination of UNE-P has reduced the market share of resellers and led some former resellers to convert to facilities-based service. This development is positive for us because resellers generally are not potential users of our transit services. Second, the restrictions on the availability of loop and transport UNEs may have contributed to accelerated consolidation among competitive carriers, which may have a negative impact on us because our business model is based on the existence of many independent carriers who need to exchange traffic with each other. It is difficult to predict the overall effect of these countervailing trends on our future business opportunities.
Future FCC rulings may further affect the market for our services. For example, the FCC has been asked in several cases to forbear from requiring incumbent carriers to continue offering loop and transport UNEs in particular markets. The FCC has granted such petitions in portions of two metropolitan areas (Omaha, Nebraska, and Anchorage, Alaska), and denied them in several others (Boston, Providence, New York, Pittsburgh, Philadelphia, and Virginia Beach-Norfolk, Seattle, Minneapolis-St. Paul, Denver, and Phoenix). The petitions that the FCC denied were recently remanded by a federal court of appeals, and are being reconsidered by the FCC. If the FCC approves additional forbearance petitions, or is required to do so by the court, it could force some competitive carriers to reduce or eliminate their operations in affected metropolitan areas, which may negatively affect our business opportunities. The FCC is also considering a number of other proposals that may
10
Table of Contents
affect competitive carriers’ access to UNEs as well as the prices for such access. We cannot predict the results of future regulatory or court rulings, or any changes in the availability of UNEs as the result of future legislative changes.
Intercarrier Compensation
In 2001, the FCC initiated a proceeding to address rules that require one carrier to make payment to another carrier for access to the other’s network, or intercarrier compensation. In its notice of proposed rulemaking, the FCC sought comment on some possible advantages of moving from the current rules to a bill and keep structure for all traffic types in which carriers would recover costs primarily from their own customers, not from other carriers. On November 5, 2008, the FCC issued for public comment two alternative proposed orders that address intercarrier compensation reform. The respective orders did not include express provisions governing transit traffic. Each proposed order did, however, request public comment on whether the proposed rules governing intercarrier compensation would, if enacted, necessitate any changes to the rules that govern transit traffic. To date, the FCC has taken no action on these proposed rules. More recently, on November 13, 2009, the FCC issued a public notice that included a request for comments on the role intercarrier compensation plays in the national broadband plan. If the FCC does make any changes to intercarrier compensation, whether as part of the intercarrier compensation docket or otherwise, such changes could affect our business. For example, the FCC could change the pricing of transit traffic, including lowering the rate, freezing the rate or establishing uniform rates, any of which could have a material adverse effect on our business, financial condition and operating results; or it could clarify that transit rates are intended to be unregulated, which could improve our opportunities in some markets where the current pricing is regulated at a very low level, which discourages competition. See “Risk Factors—Regulatory developments could negatively impact our business” in Item 1A below.
Additionally, we recently began providing access services, which is part of the origination and termination of long distance calls, using our tandem switches. The FCC generally regulates interstate access services and the states regulate intrastate access services. The FCC, as part of the intercarrier compensation draft orders discussed above, proposed to significantly reduce both interstate and intrastate terminating access charges over a ten-year transition period. As part of the same draft orders, the FCC also proposed to eliminate entirely certain originating interstate and intrastate access charges. If the FCC or any state does lower or eliminate any access charges, whether independent of or as part of the intercarrier compensation docket described above, such change could have a material and adverse effect on our business, financial condition, operating results or growth opportunities. See “Risk Factors—Regulatory developments could negatively impact our business” in Item 1A below.
We generally have no revenue exposure associated with reciprocal compensation for local traffic because our customers are primarily carrier customers, who are responsible for any compensation. However, the FCC draft orders discussed above, if adopted, would make us and other tandem service providers liable for the intercarrier compensation charges imposed by the terminating carrier in certain instances, which we would then have an opportunity to recover from the carrier who delivered the traffic to us. Even if we do have a legal right to recover these charges, we would bear risk if this occurs, including but not limited to disputes over the amount due and credit risk. See “Risk Factors—Regulatory developments could negatively impact our business” in Item 1A below.
We cannot predict either the timing or the result of this FCC rulemaking.
Regulatory Treatment of VoIP
In February 2004, the FCC initiated a proceeding to address the appropriate regulatory framework for VoIP providers. Currently, the status of VoIP providers is not clear, although a report issued by the FCC in 1998 suggests that some forms of VoIP may constitute “telecommunications services” that are subject to regulation as common carriers under federal law. The 1998 report also suggested, however, that this regulatory treatment would not apply until after the FCC determined which specific services were subject to regulation. This FCC
11
Table of Contents
proceeding may determine what, if any, regulation is appropriate for VoIP providers and whether the traffic carried by these providers will be subject to access charges. The principal focus of this rulemaking is on whether VoIP providers should be subject to some or all of the regulatory obligations of common carriers. The draft orders related to the intercarrier compensation reform described above each appear to provide that VoIP providers will be required to pay access charges, but only after the completion of a lengthy transition period. It is unclear whether or when any final rules on this matter will be issued.
In recent years, the FCC has imposed on VoIP providers most of the same requirements that would apply if they were regulated as common carriers, other than the payment of access charges. These include duties to provide access to 911 emergency services, to permit duly authorized law enforcement officials to monitor communications, to contribute to the cost of the FCC’s universal service program, to pay certain regulatory fees, and to comply with the same customer privacy rules as telecommunications carriers. These obligations are likely to increase the cost of providing VoIP service and slow the growth of VoIP providers. Because VoIP providers are users of our services, this trend may negatively affect demand for our services.
State Regulation
State agencies exercise jurisdiction over intrastate telecommunications services, including local telephone service and in-state toll calls. To date, we are authorized to provide intrastate local telephone and long-distance telephone services in forty-seven states, Puerto Rico and the District of Columbia. As a condition to providing intrastate telecommunications services as a common carrier, we are required, among other things, to:
| • | file and maintain intrastate tariffs or price lists in most states describing the rates, terms and conditions of our services; |
| • | comply with state regulatory reporting, tax and fee obligations, including contributions to intrastate universal service funds; and |
| • | comply with, and to submit to, state regulatory jurisdiction over consumer protection policies (including regulations governing customer privacy, changing of service providers and content of customer bills), complaints, transfers of control and certain financing transactions. |
Generally, state regulatory authorities can condition, modify, cancel, terminate or revoke certificates of authority to operate in a state for failure to comply with state laws or the rules, regulations and policies of the state regulatory authority. Fines and other penalties may also be imposed for such violations.
In addition, states have authority under the Telecommunications Act to approve or (in limited circumstances) reject agreements for the interconnection of telecommunications carriers’ facilities with those of the incumbent local exchange carrier, to arbitrate disputes arising in negotiations for interconnection and to interpret and enforce interconnection agreements. In exercising this authority, the states determine the rates, terms and conditions under which we can obtain collocation in ILEC central offices and interconnection trunks for termination of local traffic to ILEC customers, under the FCC rules. The states may re-examine these rates, terms and conditions from time to time.
Some state regulatory authorities assert jurisdiction over the provision of tandem transit services in connection with local calls, particularly the ILECs’ provision of the service. Various state regulatory authorities have initiated proceedings to examine the regulatory status of tandem transit services. Some states have taken the position that tandem transit service is an element of the “transport and termination of traffic” services that incumbent ILECs are required to provide at rates based on incremental cost analysis under the Telecommunications Act, while other states have ruled that the Telecommunications Act does not apply to these services. For example, a declaratory action was commenced in 2008 with the Connecticut Department of Public Utility Control (the “DPUC”) pursuant to which a competitive carrier requested that the DPUC order the ILEC to reduce its transit rate to a cost based rate similar to a rate offered by that ILEC in a different state or to a rate justified in a separate cost proceeding. The DPUC recently ordered the ILEC to implement an interim rate that is
12
Table of Contents
based on its costs for transit plus a 35% mark-up. Although the ILEC has filed an appeal of that order to the appropriate federal court, we have in some cases lowered the rate we charge our customers as a result of the DPUC’s ruling. Additionally, in December 2008, the Public Service Commission of Nebraska determined that the ILEC must provide tandem transit service under the Telecommunications Act and that the Nebraska PSC did not err in using TELRIC, an incremental cost based methodology, to determine the applicable rate. Similarly, the Public Service Commission of Georgia and the Public Utilities Commission of Ohio each have open rulemaking proceedings addressing, among other items, applying incremental cost based pricing for local tandem transit services. While we cannot predict whether or how such pricing rules may finally be adopted or implemented, the rulemaking in Ohio allows for waivers of pricing rules based on the existence of competition. We would pursue this waiver if necessary. If, as a result of any state proceeding, an ILEC is required to reduce or limit the rate it charges for transit service, we would likely be forced to reduce our rate, which could have a material and adverse affect on our business, financial condition and operating results. See “Risk Factors—Regulatory developments could negatively impact our business” in Item 1A below.
To date, the FCC has not resolved this dispute over interpretation of the Telecommunications Act, resulting in disparate pricing of these services among the states. Many states also have asserted that they have jurisdiction over interconnections between competitive carriers. Our success in securing interconnections with competitive carriers may be affected by the degree of jurisdiction states exert over such interconnections. See “Item 3. Legal Proceedings.” If a state takes the position that it does not have jurisdiction over such interconnection or over the regulation of competitive local transit services generally, we may be unable to assert successfully a legal right to terminate transit traffic to a carrier that refuses to accept terminating traffic from us on reasonable or any terms. Such an inability may have a material adverse effect on our business, financial condition and operating results. See “Risk Factors—Carriers may refuse to directly interconnect with us and consequently, we would be unable to terminate our customers’ traffic to them” in Item 1A below.
Additionally, we recently began providing access services, which is part of the origination and termination of long distance calls, using our tandem switches. Under the Telecommunications Act, state governments currently exercise jurisdiction over intrastate access services. Some states have imposed limits on the access charges that competitive carriers may impose, and some are currently considering whether to mandate any decrease in existing intrastate access charges. Also, as noted above, the FCC has asked for comments on the issue of intercarrier compensation. As a result of any proceeding on intercarrier compensation or otherwise, the FCC could require states to reduce their intrastate access charges. If any state does lower or eliminate intrastate access charges for any reason, such change could have a material and adverse effect on our business, financial condition, operating results or growth opportunities. See “Risk Factors—Regulatory developments could negatively impact our business” in Item 1A below.
Intellectual Property
Our success is dependent in part upon our proprietary technology. We rely principally upon trade secret and copyright law to protect our technology, including our software, network design, and subject matter expertise. We enter into confidentiality or license agreements with our employees, distributors, customers and potential customers and limit access to and distribution of our software, documentation and other proprietary information. We believe, however, that because of the rapid pace of technological change in the communications industry, the legal protections for our services are less significant factors in our success than the knowledge, ability and experience of our employees and the timeliness and quality of our services.
We have been granted one patent and have two additional patents pending with the U.S. Patent and Trademark Office. The granted patent addresses our core business, the operation of a managed tandem network. One of the pending patents addresses a series of traffic routing designs developed by us to assist our customers in reducing their internal network operating costs. The second pending patent covers a set of proprietary operating systems and software developed by us to manage our network. There can be no assurance regarding how, whether or when these additional patents may be granted.
13
Table of Contents
In June 2006, we commenced an action generally alleging that Peerless Network is infringing on the granted patent. Peerless Network has asserted several counterclaims against us, generally alleging that (i) our patent is invalid and unenforceable under a variety of theories, (ii) that assertion of the patent amounts to patent misuse and violates certain monopolization laws, and (iii) certain conduct surrounding the litigation gave rise to a tortious interference claim. See “Item 3. Legal Proceedings.”
OTHER MATTERS
Employees
At December 31, 2009, we had 147 full-time employees, including 123 in Operations, 7 in Sales and Marketing and 17 in General and Administrative functions. The number of employees increased by 7.3%, up from 137 on December 31, 2008. We expect to further increase our headcount in 2010 as we continue to expand both existing and new markets. Of our employees, 95 were located at our corporate office in Chicago, Illinois. The remaining 52 employees are located throughout the country at our switch locations. No labor union represents our employees. We have not experienced any work stoppages and consider our relations with our employees to be good.
Information Available on the Internet
Our internet address is www.neutraltandem.com. The information contained on or connected to our web site is not incorporated by reference into this Annual Report on Form 10-K and should not be considered part of this or any other report filed with the Securities and Exchange Commission (SEC). Our Annual Report on Form 10-K, Quarterly Reports on Form 10-Q and Current Reports on Form 8-K, as well as any amendments to those reports, are available free of charge through our web site as soon as reasonably practicable after we file them with, or furnish them to, the SEC. These reports may also be obtained at the SEC’s public reference room at 100 F Street, N.E., Washington, DC 20549. The SEC also maintains a web site at www.sec.gov that contains reports, proxy statements and other information regarding SEC registrants, including Neutral Tandem.
Corporate Information
Neutral Tandem’s principal executive offices are located at One South Wacker, Suite 200, Chicago, Illinois, 60606. We have switch sites located in Arizona, California, Colorado, Connecticut, Florida, Georgia, Illinois, Indiana, New York, Massachusetts, Michigan, Minnesota, Missouri, New Jersey, Nevada, Ohio, Oregon, Pennsylvania, Puerto Rico, Texas, Utah, Virginia, Washington and Wisconsin.
EXECUTIVE OFFICERS AND DIRECTORS
The names, ages and positions of our executive officers and directors, as of December 31, 2009, are set forth below:
| Name |
Age | Position(s) | ||
| Rian J. Wren |
53 | President, Chief Executive Officer and Director | ||
| Robert Junkroski |
45 | Chief Financial Officer and Executive Vice President | ||
| Surendra Saboo |
50 | Chief Operating Officer and Executive Vice President | ||
| Richard Monto |
45 | General Counsel, Secretary and Senior Vice President, External Affairs | ||
| David Lopez |
45 | Senior Vice President of Sales | ||
| James P. Hynes |
62 | Director, Chairman | ||
| Dixon R. Doll |
67 | Director | ||
| Peter J. Barris |
58 | Director | ||
| G. Edward Evans |
48 | Director | ||
| Robert C. Hawk |
70 | Director | ||
| Lawrence M. Ingeneri |
51 | Director |
14
Table of Contents
Rian J. Wren. Mr. Wren joined us in February 2006 and has served as our President, Chief Executive Officer and Director since that time. Prior to joining us, Mr. Wren was Senior Vice President and General Manager of Telephony for Comcast Cable from November 1999 to August 2005. Mr. Wren joined Comcast in 1999 and was named CEO of Broadnet, Comcast’s international wireless company located in Brussels, Belgium in 2000. After returning to the United States, he served as the Senior Vice President and General Manager of Telephony for Comcast Cable Division. Prior to joining Comcast, Mr. Wren held several senior management positions at AT&T from 1978 to 1999, including President of the Southwest Region, and worked in the Consumer, Business, Network Services, and Network Systems Manufacturing divisions for more than 20 years. Mr. Wren holds a B.S. degree in Electrical Engineering from the New Jersey Institute of Technology and an M.S. in Management from Stanford University, which he attended as a Sloan Fellow.
Robert Junkroski. Mr. Junkroski has been with the Company since it commenced services, and has served as our Chief Financial Officer and Executive Vice President since that time. Prior to joining us, Mr. Junkroski held the position of Vice President of Finance with Focal Communications Corporation, or Focal (now part of Level 3 Communications Inc.), from 1999 to 2002. Mr. Junkroski previously served as Focal’s Treasurer and Controller from 1997 to 2001. Focal filed for bankruptcy protection in December 2002. Before joining Focal, Mr. Junkroski was Controller for Brambles Equipment Services, Inc. and Focus Leasing Corporation. Mr. Junkroski holds a B.B.A. degree in Accounting and Economics from University of Dubuque and an M.B.A. concentrating in Finance and Accounting from Roosevelt University, and is a Certified Public Accountant in Illinois.
Surendra Saboo. Dr. Saboo joined us in May 2006 as our Chief Operating Officer and Executive Vice President. Prior to joining us, Dr. Saboo was the Vice President of Product Development and Operations for Voice Services at Comcast Corporation from January 2002 to March 2006. From June 2000 to December 2001, Dr. Saboo served as Executive Vice President and Chief Operating Officer of Broadnet Europe, SPRL, a pan-European subsidiary of Comcast Corporation. Prior to joining Comcast Corporation, Dr. Saboo was the Chairman, Chief Executive Officer and founder of Teledigm, an e-CRM software product company in Dallas, Texas. Prior to starting Teledigm, Dr. Saboo spent 14 years at AT&T in a variety of operating areas including research and development, engineering, product management, strategy, systems development and operations. Dr. Saboo began his career with AT&T in 1986 as a Member of Technical Staff at Bell Laboratories in Holmdel, NJ. Dr. Saboo holds a B.S.M.E. degree from Birla Institute of Technology, India as well as M.S. and Ph.D. degrees in Operations Research from Ohio State University.
Richard Monto. Mr. Monto joined us in 2007, and has served as our General Counsel and Corporate Secretary since February 2009. Mr. Monto has 15 years of diversified telecommunications experience. From 2001 to 2005, Mr. Monto held senior positions, including Chief Legal Officer, with Universal Access Global Holdings Inc. From 1995 and 2000, Mr. Monto held various legal positions with MCI Telecommunications. Prior to MCI, Mr. Monto practiced for several years at private law firms, including the law firm of Sonnenschein, Nath and Rosenthal. Mr. Monto holds a B.A. degree from the University of Michigan in Russian and Eastern European Studies and a J.D. from the Boston University School of Law.
David Lopez. Mr. Lopez joined us in 2003 and has served as our Senior Vice President of Sales since that time. As Senior Vice President of Sales, Mr. Lopez oversees the management and growth of all Neutral Tandem carrier accounts. Mr. Lopez brings a wealth of sales management experience to Neutral Tandem and has more than 20 years experience in the telecommunications industry. He has been with Neutral Tandem since its inception and has secured agreements with nearly every national wireless carrier and several dozen other competitive landline and cable providers. For nearly 20 years, Mr. Lopez has provided account management responsibilities at Centel, Sprint, and Focal Communications Corporation. In his most recent position, Mr. Lopez provided sales management for Focal’s largest and most successful market from 1997 to 2003. During his tenures at Centel and Sprint from 1992 to 1997, Mr. Lopez held national account positions with responsibility for local service, Centrex, and PBX equipment to Fortune 500 companies. Lopez holds a B.S. in Marketing from Illinois State University.
15
Table of Contents
James P. Hynes. Mr. Hynes co-founded Neutral Tandem in 2001, and served as Chief Executive Officer until February 2006, after which he became Executive Chairman. In December 2006 Mr. Hynes stepped down as Executive Chairman and assumed the title of Chairman of the Board, a position he holds today. Active in the industry for 30 years, Mr. Hynes personally directed the establishment of COLT Telecommunications in Europe as their first CEO in 1992. As Chairman of the Board, he led COLT’s initial public offering in 1996. Mr. Hynes established MetroRED Telecom in South America and Mexico, as well as KVH Telecom in Tokyo. Concurrent with taking on these operating roles, he was Group Managing Director at Fidelity Capital for 10 years. His career has included senior positions with Chase Manhattan, Continental Corporation, Bache & Co. and New York Telephone. Mr. Hynes is Chairman of the Board of Trustees of Iona College and is also on the North American Board of the SMURFIT Graduate School of Business, University College Dublin in Ireland.
Dixon R. Doll. Dr. Doll has served as a Director of Neutral Tandem since 2003. Dr. Doll is the co-founder and a general partner of DCM, an early stage technology venture capital firm that manages $1.6 billion from offices in Menlo Park, California, Beijing, China and Tokyo, Japan. In the mid-1980’s, Dixon Doll co-founded the venture capital industry’s first fund focused exclusively on telecommunications opportunities. At DCM, he has led the firm’s investments in About.com (Acquired by The New York Times Co.), @Motion (Acquired by Openwave), Clearwire (Nasdaq: CLWR), Foundry Networks (Nasdaq: FDRY), Internap (Nasdaq: INAP), Ipivot (Acquired by Intel) and Neutral Tandem (Nasdaq: TNDM) among others. In April 2005, he was elected to the Board of Directors of the National Venture Capital Association (NVCA) in Washington, D.C. Dr. Doll served as the NVCA Chairman for its 2008/2009 fiscal year. Additionally, he also serves on the Stanford Institute for Economic Policy Research Advisory Board and the Hoover Institution Board of Overseers at Stanford. He is also the Chairman of the San Francisco Asian Art Museum Board. Dr. Doll received his B.S.E.E. degree (cum laude) from Kansas State University as well as M.S. and Ph.D. degrees in Electrical Engineering from the University of Michigan, where he was a National Science Foundation scholar.
Peter J. Barris. Mr. Barris has served as a Director since 2003. Mr. Barris is currently the Managing General Partner of New Enterprise Associates (“NEA”) where he specializes in information technology investing. Mr. Barris has been with NEA since 1992, and he serves as either an executive officer or general partner of various NEA entities. From 1988 to 1990, Mr. Barris was President and Chief Operating Officer at LEGENT Corporation. Mr. Barris held various management positions at UCCEL Corporation from 1985 to 1988. Prior to that, Mr. Barris also held various management positions between 1977 and 1985 at the General Electric Company, including Vice President and General Manager at GE Information Services, Inc. Mr. Barris serves or has served as a member of the Boards of Directors of InnerWorkings, Inc., where he also serves as a member of the audit, compensation and nominating and corporate governance committees, Vonage Holdings Corp., where he also serves as a member of the compensation and nominating and corporate governance committees, Protostar, Boingo Wireless and Hillcrest, as well as several other private companies in the NEA portfolio. Mr. Barris is a member of the Board of Trustees of Northwestern University and the Board of Overseers of Tuck School at Dartmouth College.
G. Edward Evans. Mr. Evans has served as a Director since November 2008. Mr. Evans is currently the Chairman of the Board and Chief Executive Officer of Stelera Wireless, a leader in deploying broadband services to rural markets throughout the United States. Previously, Mr. Evans served as the Chairman of the Board and Chief Executive Officer of Syniverse Holdings, Inc. Mr. Evans was elected Syniverse’s Chairman in February 2005 after having served as a director since February 2002. Mr. Evans served as the Chief Executive Officer of Syniverse from February 2002 until January 2006, at which time he stepped down from the position. Mr. Evans remained Chairman of the Board until January 2007. From January 1997 to January 2002, Mr. Evans held various executive positions with Dobson Communications Corporation, first as President of its cellular subsidiaries and then as President and Chief Operating Officer of the organization. Today, Mr. Evans serves on the boards of Solix, CTIA—The Wireless Association, Carolina West Wireless, and the Network Reliability and Interoperability Commission, an advisory committee to the FCC.
16
Table of Contents
Robert C. Hawk. Mr. Hawk has served as a Director since January 2004. Mr. Hawk has served as President of Hawk Communications since 1996 and is a Venture Partner of DCM. Prior to this, Mr. Hawk served as President and Chief Executive Officer of US West Multimedia Communications, Inc. From 1986 until 1995, Mr. Hawk was President of the Carrier Division of US West Communications, Inc. Prior to holding that position, Mr. Hawk was Vice President, Marketing and Strategic Planning for CXC Corporation, and Director of Advanced Systems Development for American Bell. From 1997 to 2002, Mr. Hawk served as a Special Limited Partner of Crosspoint Venture Partners. During that time he served on the boards of directors or advisory boards of fifteen companies that went public. Mr. Hawk previously served as a Director of Covad Communications and Centillium Communications and is currently a director of several private high technology companies.
Lawrence M. Ingeneri. Mr. Ingeneri has served as a Director since October 2006. Mr. Ingeneri is currently the Chief Financial Officer and a member of the Board of Directors of mindSHIFT Technologies, Inc., an IT managed services provider which he joined in October 2003. Prior to that time, Mr. Ingeneri was employed by COLT Telecom Group plc, or COLT, a European telecommunications services company from July 1996 to December 2002. Mr. Ingeneri was the Chief Financial Officer of COLT from July 1996 to June 2002 and a member of the Board of Directors of COLT from June 2001 to June 2002.
17
Table of Contents
| ITEM 1A. | RISK FACTORS |
Risk Factors
Investing in our common stock involves a high degree of risk, and you should carefully consider the risks and uncertainties described below in addition to the other information included or incorporated by reference in this Annual Report on Form 10-K. If any of the following risks actually occurs, our business, financial condition or results of operations would likely suffer, possibly materially. In that case, the trading price of our common stock could decline.
Risk Factors Related To Our Business
We face competition from the traditional ILECs and increasing competition from certain other providers such as Level 3 Communications, Peerless Network and Hypercube and expect to compete with new entrants to the tandem services market.
We face competition from the traditional ILECs, certain other providers such as Level 3 Communications, Peerless Network and Hypercube, and expect to compete with new entrants to the tandem services market. Please see “Item 3. Legal Proceedings,” for a description of a legal proceeding between us and Peerless Network. Competition has recently intensified, especially with Peerless Network, causing us to lose some traffic as well as reduce certain rates we charge our customers in various markets, including with respect to our major customers in our largest markets. We expect competition to intensify in the future, including as a result of the adoption of IP-based switching by telecommunications carriers, which is likely to increase competition from direct connections. See “The market for our services is competitive and increased adoption of IP switching technologies could increase the competition we face from direct connections” below. Certain of our current and potential competitors have significantly more employees and greater financial, technical, marketing, research and development, intellectual property development and protection and other resources than us. Also, some of our current and potential competitors have greater name recognition that they can use to their advantage. Our competitors have charged rates that are below the rates we charge, at times substantially, and may continue to do so in the future. In addition, our competitors could bundle other services with their transit or access services to compete with us or be able to respond more quickly to new or emerging technologies and changes in customer requirements than we can. Furthermore, changes in switching technology have lowered the cost of entry into our business which could promote additional competition. Existing or increased competition as described above could result in fewer customer orders, reduced revenues, reduced gross margins and loss of market share, any of which could have a material and adverse effect on our business, prospects, financial condition and operating results.
Regulatory developments could negatively impact our business.
The communications services industry is extensively regulated by the federal and state governments. While the pricing of our services is generally not heavily regulated by the Federal Communications Commission, or FCC, or state utility agencies, these agencies have greater regulatory authority over the pricing of incumbent local exchange carriers’, or ILECs’, tandem transit and access services, which generally sets the benchmark for the prices of the competitive services that we offer. To the extent that ILEC transit or access rates are reduced or capped, it could have an adverse impact on us, as we would likely be forced to reduce our rates in order to compete with the ILEC or other competitors.
Local Tandem Transit Service
Some state regulatory authorities assert jurisdiction over the provision of local tandem transit services, particularly the ILECs’ provision of the service. Various states have initiated proceedings to examine the regulatory status of transit services. Some states have taken the position that transit service is an element of the
18
Table of Contents
“transport and termination of traffic” services that incumbent ILECs are required to provide at rates based on incremental costs under the Telecommunications Act, while other states have ruled that the Telecommunications Act does not apply to these services. For example:
| • | A declaratory action was commenced in 2008 with the Connecticut Department of Public Utility Control (the “DPUC”) pursuant to which a competitive carrier requested that the DPUC order the ILEC to reduce its transit rate to a cost-based rate similar to a rate offered by that ILEC in a different state or to a rate justified in a separate cost proceeding. The DPUC recently ordered the ILEC to implement an interim rate for wireless carriers that is based on the ILEC’s costs for transit plus a 35% mark-up. The ILEC has appealed this ruling to the appropriate federal court. We have filed an amicus brief supporting the ILEC’s position. Although we believe the ILEC may prevail in its appeal, we have lowered the rate we charge certain of our wireless customers, in some cases substantially, as a result of the DPUC’s ruling. Moreover, any final ruling in this proceeding by the DPUC could also apply to wireline and cable customers and/or result in the ILEC being forced to charge an even lower rate. |
| • | In 2005, the Michigan Public Service Commission revised the maximum allowable rate that AT&T could charge for transit service in Michigan based on AT&T’s total element long run incremental cost, or TELRIC, which was significantly below the rate previously charged by AT&T (previously SBC Communications). This decision caused us to reduce the rate we charged for our transit service and had a significant impact on the profitability of our service in Michigan. |
| • | In December 2008, the United States District Court for the District of Nebraska held that the Public Service Commission of Nebraska was correct in determining that the ILEC must provide transit service under the Telecommunications Act and that the Nebraska PSC did not err in ordering the ILEC to provide the service at TELRIC based rates. |
| • | The Telecommunications Regulatory Board (the “Board”) of Puerto Rico, where we recently began offering our service, recently determined that the ILEC must provide transit service at a cost-based rate, and ordered the ILEC to submit a cost study in order to support the development of a cost-based rate. In addition to submitting the cost study, on September 23, 2009, the ILEC filed a motion seeking administrative review of the Board’s order in the Puerto Rico appellate court. In its motion, the ILEC alleges that the Board’s order constitutes a regulation and as such was not approved as required by provisions of Puerto Rico’s Uniform Administrative Law. |
If, as a result of any of these current proceedings or a different proceeding, the applicable ILEC is required to reduce or limit the rate it charges for transit service, we would likely be forced to reduce our rate, perhaps substantially, or risk losing customer traffic, any of which could have an adverse affect on our business, financial condition and operating results.
The FCC currently does not regulate the local transit services we offer. However, in 2001, the FCC initiated a proceeding to address intercarrier compensation issues, such as rules that govern the amount that one carrier pays to another carrier for access to the other’s network. As part of that docket, on July 24, 2006, a group of large and rural local exchange carriers, or LECs, filed a proposal for intercarrier compensation reform at the FCC called the Missoula Plan, which includes provisions regarding local transit services. Under the Missoula Plan, local transit service would be provided at a rate not to exceed $0.0025 per minute of use for the first four years of the plan, and then increase with inflation. This rate is lower than the rates charged by the ILECs or by us in several of the markets in which we currently operate. Although the FCC has not yet issued a ruling in this docket that directly affects us, on November 5, 2008, the FCC issued for public comment two alternative proposed orders that comprehensively address intercarrier compensation reform. In these proposed orders, the FCC asserts legal authority to regulate comprehensively over all intercarrier compensation rates, including intrastate access and local transit charges.
The two proposed orders each requested public comment on whether the modifications to the rules governing intercarrier compensation would necessitate any changes to the rules that govern transit traffic. More
19
Table of Contents
recently, on November 13, 2009, the FCC issued a public notice in a separate proceeding that included a request for comments on the role intercarrier compensation plays in the national broadband plan. Any future changes to intercarrier compensation rules could have a material and adverse effect on our business. For example, the FCC could change the pricing of transit traffic, including lowering the rate, freezing the rate or establishing uniform rates, any of which could have a material adverse effect on our business, financial condition and operating results. In addition, from time to time, carriers that we connect with have requested that we pay them to terminate traffic, and any new rules could address those rights or obligations. If the FCC determines that a terminating carrier may have the right to receive payments from us for terminating traffic, it could have a material adverse effect on our business, financial condition and operating results.
Additionally, each of the proposed orders released by the FCC in 2008 contained provisions that indirectly affected local transit traffic. For example, under current law, the originating carrier is typically responsible for paying the terminating carrier certain “terminating charges,” such as reciprocal compensation charges, for access to the terminating carrier’s network. As a result, we, as the intermediate transit provider, are not responsible for paying such terminating charges to a terminating carrier in connection with the transit services we offer. Each draft order, however, required that we, as the transit provider, could be responsible for paying the highest lawful terminating charge to a terminating carrier if the terminating carrier received insufficient information for the terminating carrier to bill the originating carrier for that traffic. These amounts could be significantly larger than the rate we charge for providing the transit service associated with that traffic. Although the proposed orders also would allow us to recover from the originating carrier the same amount that we paid to the terminating carrier, in such an instance we would be faced with credit risks associated with collecting such amounts from the originating carrier, as well as possible disputes with both originating and terminating carriers regarding the appropriate amount due. In this event, if we were unable to recover amounts we paid to a terminating carrier or became involved in distracting and costly disputes with the originating carrier and/or the terminating carrier over the amount due, we could experience a material adverse effect on our business. Moreover, any final order could result in changes to the demand for our services or otherwise adversely impact our business, financial condition, operating results and growth opportunities in a manner that we have not presently identified.
Access Services
We recently began providing access services using our tandem switches. Access services are provided as a part of the origination and termination of long distance calls. The FCC regulates interstate access services and the states regulate intrastate access services. The FCC, under a proposed interpretation of the Telecommunications Act, may also assert certain rights to regulate intrastate access services, and, as part of the intercarrier compensation draft orders discussed above, has proposed to significantly reduce both interstate and intrastate terminating access charges over a ten-year transition period. As part of the same draft orders, the FCC also proposed to eliminate entirely certain originating interstate and intrastate access charges. Various states are also conducting proceedings to determine whether to decrease existing intrastate access charges. If the FCC or any state lowers these access charges, such change could have a material and adverse effect on our business, financial condition, operating results or growth opportunities.
As communications technologies and the communications industry continue to evolve, the statutes governing the communications industry or the regulatory policies of the FCC, state legislatures or agencies, or local authorities may change. If this were to occur, including pursuant to any of the proceedings discussed above, the demand and pricing for our services could change in ways that we cannot easily predict and our revenues could materially decline. These risks include the ability of the federal government, including Congress or the FCC, or state legislatures or agencies, or local authorities to:
| • | increase regulatory oversight over the services we provide, including limiting the prices we can charge; |
| • | adopt or modify statutes, regulations, policies, procedures or programs that are disadvantageous to the services we provide, or that are inconsistent with our current or future plans, or that require modification of the terms of our existing contracts, including reducing the rates for our services; |
20
Table of Contents
| • | adopt or modify statutes, regulations, policies, procedures or programs in a way that causes changes to our operations or costs or the operations of our customers, including the pricing of our services to our customers; |
| • | adopt or modify statutes, regulations, policies, procedures or programs in a way that causes a decrease in the amount of traffic our customers exchange with us or causes a change to our customers’ traffic mix, which results in our customers using, on average, lower priced services; or |
| • | increase or impose new or additional taxes or surcharges that are disadvantageous to the services we provide or cause a decrease in the amount of traffic our customers deliver to us. |
We cannot predict when, or upon what terms and conditions, further federal, state or local regulation or deregulation might occur or the effect future regulation or deregulation may have on our business. Any of these government actions could have a material adverse effect on our business, prospects, financial condition and operating results.
The market for our services is competitive and increased adoption of IP switching technologies could increase the competition we face from direct connections.
When there is a significant amount of traffic between two switches, there is an economic incentive to directly connect and remove the intermediate switching that we provide using our tandem switches. As our customers grow, the amount of traffic exchanged between them grows, thus leading to the risk that they will increase the number of direct connect switch paths that exchange traffic and remove that traffic from our tandems. We believe that the frequency at which our customers are implementing these direct connections is increasing, even in the case of lower traffic volume switch pairs, and we expect this trend to continue in the future, which may cause us to experience a reduction in our revenue. Moreover, the risk of direct connections is increased as more carriers move to an IP-based interface, because direct connecting between two IP-based carriers is less complex than establishing multiple direct connections between carriers’ switch pairs, thus enabling more direct connections. In addition, consolidation among telecommunications carriers can stimulate the risk of direct connections by increasing both the incentive and feasibility of establishing direct connections. For example, we have noticed that certain competitive carriers established direct connections following completion of a business combination. Increased competition from direct connections could result in fewer customer orders, reduced revenues, reduced gross margins and loss of market share, any of which could have a material and adverse effect on our business, prospects, financial condition and operating results.
Our top five customers represent, in the aggregate, a substantial portion of our revenue.
Our top five customers, in the aggregate, represented approximately 64% of our total revenues during the year ended December 31, 2009. Our two largest customers, Sprint Nextel and AT&T, accounted for 23% and 14% respectively, of our total revenues during the year ended December 31, 2009. Certain of these customers have solicited or received proposals from other providers to provide services that are the same as or similar to ours, and in some cases, have moved traffic to those competitors. In other cases, we have been required to lower the rates we charge customers to retain their traffic. As discussed in “We face competition from the traditional ILECs and increasing competition from certain other providers such as Level 3 Communications, Peerless Network and Hypercube and expect to compete with new entrants to the tandem services market” above, competition has intensified. As a result, we expect these trends to continue. In addition, our contracts with these customers are non-exclusive, have no volume or exclusivity commitments and any customer is able to discontinue the use of all or a portion of our services at any time.
We may lose all or a portion of our business with any of these customers if we fail to meet our customers’ expectations, including for performance and other reasons, or if another provider offers to provide the same or similar services at a lower cost. In addition, competitive forces resulting from the entrance of competitive providers have created significant pricing pressure in certain of our largest markets with respect to all of our customers, including our top five customers. We expect this trend to continue.
21
Table of Contents
Moreover, the current economic downturn could result in a decrease in the amount of services customers purchase from us or delays or failures to pay for such services. For example, weakening economic conditions could reduce both consumer and non-consumer spending on phone services which in turn could result in a reduction in our customers’ demand for our services. Furthermore, financial pressure faced by our customers could result in mergers, acquisitions, liquidations or divestitures of all or a portion of our customers’ businesses, which in turn could result in a reduction in the use of our services.
Any of the foregoing could have a material adverse effect on our business, prospects, financial condition and operating results.
During the year ended December 31, 2009, we delivered 63.0% of our terminating transit traffic to five carriers.
Although we also provide access services using our tandem switches, we generate the majority of our revenue from local transit services. We generate revenue from our local transit services by charging transit fees to the originating carrier of the call on a minute(s) of use basis. During the year ended December 31, 2009, we delivered 63.0% of this traffic to five carriers. If for any reason we are unable to terminate local transit traffic to any one of these five carriers or a material amount of any terminating traffic to any other carrier(s), we would be unable to generate revenue from our customer originating the calls to such terminating carriers, which could have a material adverse effect on our business, prospects, financial condition and operating results. Moreover, if any carrier refuses to accept transit or access traffic, regardless of what we believe is their legal obligation to do so, it could have a material adverse effect on our business, prospects, financial condition and operating result. See “Carriers may refuse to directly interconnect with us and consequently, we would be unable to terminate our customers’ traffic to them” below.
Carriers may refuse to directly interconnect with us and consequently, we would be unable to terminate our customers’ traffic to them.
By operating as a common carrier, we benefit from certain legal rights established by federal and state statutes. We have used these rights to gain interconnection with the incumbent telephone companies. We have also used these rights to request interconnection with competitive carriers for the termination of traffic to carriers that decide for whatever reason not to utilize our service. While our experience has been that competitive carriers usually accommodate such requests, we have been involved in various state and federal regulatory proceedings against Level 3 and Verizon Wireless related to their refusal to continue to accept terminating transit traffic. We entered into agreements resolving these disputes in 2008. If, however, any carrier in the future refuses to accept traffic over a direct connection or otherwise seeks to limit our ability to exchange traffic under terms we find acceptable or at all, it could have a material adverse effect on our business, prospects, financial condition and operating results. Moreover, even though we believe that we have the legal right to exchange traffic with carriers under reasonable terms and may seek to enforce that right in legal or regulatory proceedings, there can be no assurance that we would prevail. Our efforts therefore in any proceedings or responding to other actions could have an adverse impact on us if we do not prevail, or even if we do prevail, because of legal costs, diversion of management resources and other factors.
If we are unable to manage our growth strategy, our business, prospects, financial condition and operating results could be adversely affected.
As part of our growth strategy, we may provide new services, such as exchanging data traffic, and establish new tandem network switch sites or otherwise extend the reach of our network, particularly in new geographic markets outside of the United States. We currently offer our services in most of the United States and do not exchange data traffic. For a further description of our services see “—Business” in this Annual Report on Form 10-K. As a result, our international and data traffic initiatives are critical components of our growth strategy.
22
Table of Contents
We will face various risks associated with these initiatives, including risks relating to identifying, obtaining and integrating attractive network switch sites, equipment or software, cost estimation errors or overruns, interconnection delays, material delays or shortages, our inability to obtain necessary permits on a timely basis, if at all, and other factors, including the impact of regulation, many of which are beyond our control and all of which could delay our expansion into new markets or ability to offer new services. We may not be able to enter new markets or offer new services on a timely or profitable basis, if at all. Furthermore, revenues from our growth initiatives may be lower than anticipated. In addition, entering new markets and offering new services will increase our operating expenses, including lease expenses, expenses associated with hiring, training, retaining and managing new employees, purchasing new equipment, implementing new systems and incurring additional depreciation expense. Furthermore, if our growth initiatives are implemented, we will be exposed to risks related to conducting operations outside of the United States, including currency exchange rate fluctuations, trade protection measures, difficulty in staffing, training and managing foreign operations, political and economic instability and diminished protection of intellectual property in some countries outside of the United States.
If we are unable to successfully manage our growth strategy, our business, prospects, financial condition and operating results could be adversely affected.
Consolidation in the industry, such as AT&T-BellSouth-Cingular, Verizon-MCI and SBC-AT&T, reduces the need for intercarrier transit services and may limit our growth opportunities.
Consolidation in the industry reduces the need for intercarrier transit services by reducing the number of carriers. As carriers merge, (i) the risks to our business of direct connections increases, see “—The market for our services is competitive and increased adoption of IP switching technologies could increase the competition we face from direct connections” below, (ii) traffic that was carrier-to-carrier becomes intra-carrier traffic not normally addressable by us and (iii) in the case of consolidations involving an ILEC, such as AT&T or Verizon Communications Inc., or Verizon, previous transit traffic between competitive carriers and the carrier acquired by the ILEC now potentially becomes ILEC reciprocal compensation traffic and not transit traffic, and thus potentially not addressable by us. For example, as a result of the SBC-AT&T combination, beginning in the second quarter of 2006, the combined SBC and AT&T entity began reducing the amount of minutes of use processed by us. During our 2006 fiscal year, we processed approximately 55% fewer minutes from AT&T and SBC, as a combined entity, compared to our 2005 fiscal year. We have experienced growth notwithstanding this consolidation, but our ability to grow in the future could be adversely affected by greater consolidation.
Additionally, in connection with the 2006 merger of BellSouth Corp., or BellSouth, and AT&T, AT&T agreed not to seek an increase in its current transit rates for existing transit customers for 42 months in the AT&T and BellSouth incumbent local exchange carrier service territories. While having no direct regulatory impact on us, such an agreement indirectly limits the rates we can charge for our transit service. Further consolidation in the industry could lead to similar agreements which would limit our ability to grow revenues and may materially affect our operating results.
If we are not able to obtain and enforce patent protection for our methods and technologies, or prevail in our pending patent infringement action against Peerless Network, competitors may be more easily able to compete with us, our ability to successfully operate our network may be disrupted and our ability to operate our business profitably may be harmed.
Our success depends, in part, on our ability to protect proprietary methods and technologies that we develop under the patent and other intellectual property laws of the United States, so that we can prevent others from using our inventions and proprietary information. However, we may not hold proprietary rights to some of our current or future methods and technologies. Because patent applications in the United States are typically not published until 18 months after filing, or in some cases not at all, and because publications of discoveries in industry-related literature lag behind actual discoveries, we cannot be certain that we were the first to make the inventions claimed in issued patents or pending patent applications, or that we were the first to file for protection
23
Table of Contents
of the inventions set forth in our patent applications. As a result, we may not be able to obtain adequate patent protection and competitors would be more easily able to compete with us. Moreover, we may even be required to obtain licenses under third-party patents. If licenses are not available to us on acceptable terms, or at all, we will not be able to operate our network and competitors would be more easily able to compete with us.
The process of obtaining patent protection is expensive and time consuming, and we may not be able to file and prosecute all necessary or desirable patent applications at a reasonable cost or in a timely manner. Despite our efforts to protect our proprietary rights, unauthorized parties may be able to obtain and use information that we regard as proprietary. The issuance of a patent does not guarantee that it is valid or enforceable, so even if we obtain patents, they may not be valid or enforceable against third parties. In addition, the issuance of a patent does not guarantee that we have the right to practice the patented invention. Third parties may have blocking patents that could be used to prevent us from marketing our own patented product and practicing our own patented technology.
Our pending patent applications may not result in issued patents. The patent position of technology-oriented companies, including ours, is generally uncertain and involves complex legal and factual considerations. The standards which the United States Patent and Trademark Office use to grant patents are not always applied predictably or uniformly and can change. Accordingly, we do not know the degree of future protection for our proprietary rights or the breadth of claims allowed in any patents issued to us or to others. The allowance of broader claims may increase the incidence and cost of patent interference proceedings and/or opposition proceedings and the risk of such claims being invalidated by infringement litigation. On the other hand, the allowance of narrower claims may limit the value of our proprietary rights. Our issued patents may not contain claims sufficiently broad to protect us against third parties with similar technologies or products, or provide us with any competitive advantage. Moreover, once any patents have been issued, our patents and any patent for which we have licensed or may license rights may be challenged, narrowed, invalidated or circumvented. If our patents are invalidated or otherwise limited, other companies will be better able to develop products that compete with ours, which could adversely affect our competitive business position, business prospects and financial condition. On June 12, 2008, we commenced a patent infringement action against Peerless Network, LLC and John Barnicle in the United States District Court for the Northern District of Illinois to enforce our rights under U.S. Patent No. 7,123,708 (Neutral Tandem, Inc. v Peerless Network, LLC, Peerless Network of Illinois, LLC and John Barnicle, 08 CV 3402). See “Item 3. Legal Proceedings” for a further description of this matter. If we do not prevail in this matter, it could result in continued or increased competition, either of which could adversely affect our business and financial condition.
We also rely on trade secrets, know-how and technology, which are not protected by patents, to maintain our competitive position. If any trade secret, know-how or other technology not protected by a patent were to be disclosed to or independently developed by a competitor, our business and financial condition could be materially and adversely affected.
If we are unable to obtain approval of any tariff, or any provision of a tariff is held to be invalid or suspended, we could be unable to enforce the relevant provisions of the tariff, including the right to collect money for delivered services.
We provide certain services, principally switched access services, pursuant to tariffs we have filed with the FCC and those states in which we operate. These tariffs essentially form the binding legal agreement under which we provide these services to certain customers, and include terms setting forth the pricing for the services, our right to collect amounts charged, and other customary terms related to the provision of the services, including provisions that limit our liability if we fail to properly provide a service. If we are unable to obtain approval of a tariff, or if a tariff is approved but it is later determined that a provision is invalid or unenforceable for any reason, such a determination could affect our ability to collect for any service we have provided, require us to refund payments previously received, or limit our ability to defend ourselves for services not provided in accordance with the tariff or otherwise. Any of the foregoing, or other unforeseen event related to a tariff
24
Table of Contents
provision being invalid or unenforceable, could materially and adversely affect our business, prospects, financial condition and operating results.
Failures or interruptions of our tandem network or the loss of, or damage to, a tandem network switch site could materially harm our revenues and impair our ability to conduct our operations.
We provide telecommunications services that are critical to the operations of our customers. Notably, our tandem service is essential to the orderly operation of our customers’ telecommunications system because it enables competitive carriers to ensure that telephone calls are routed to the appropriate destinations. Our tandem network architecture is integral to our ability to process a high volume of calls in a timely and effective manner. We could experience failures or interruptions of our tandem network and services, or other problems in connection with our operations, as a result of:
| • | damage to, or failure of, our tandem network software or hardware or our connections and outsourced service arrangements with third parties; |
| • | errors in the processing of data by our systems; |
| • | computer viruses or software defects; |
| • | physical or electronic break-ins, sabotage, intentional acts of vandalism, natural disasters and similar events; |
| • | increased capacity demands or changes in systems requirements of our customers; or |
| • | errors by our employees or third-party service providers. |
If we cannot adequately protect the ability of our tandem network to perform consistently at a high level or otherwise fail to meet our customers’ expectations:
| • | we may be unable to provide and bill for services; |
| • | we may experience damage to our reputation, which may adversely affect our ability to attract or retain customers for our existing services, and may also make it more difficult for us to market our services; |
| • | we may be subject to significant damages claims, under our contracts or otherwise; |
| • | our operating expenses or capital expenditures may increase as a result of corrective efforts that we must perform; |
| • | our customers may postpone or cancel subsequently scheduled work or reduce their use of our services; or |
| • | one or more of our significant contracts may be terminated early, or may not be renewed. |
Any of these consequences would adversely affect our business, prospects, financial condition and operating results.
We may not have sufficient redundant systems or backup facilities to allow us to receive and process calls in the event of a loss of, or damage to, a tandem network switch site. We could lose, or suffer damage to, a site in the event of power loss, natural disasters such as fires, earthquakes, floods and tornadoes, telecommunications failures, such as transmission cable cuts, or other similar events that could adversely affect our customers’ ability to access our tandem services. Any such loss or damage could interrupt our operations, materially harm our revenues and growth and require significant cash expenditures to correct the failures caused by such loss or damage.
25
Table of Contents
Our failure to achieve or sustain market acceptance at desired pricing levels could impact our ability to maintain profitability or positive cash flow.
In addition to regulatory proceedings, our competitors and customers have caused and may continue to cause us to reduce the prices we charge for our services. The primary sources of pricing pressure include:
| • | competitors offering our customers services at reduced prices, at times substantially, or bundling and pricing services in a manner that makes it difficult for us to compete. For example, a competing provider of transit services might bundle transit with other services, such as inexpensive long distance services; |
| • | customers with a significant volume of calls have in the past and may in the future use their enhanced leverage in pricing negotiations with us. For example, from time to time, carriers that we connect with have requested that we pay them to terminate traffic. Although we believe such efforts are unlawful, in the future, such requests may adversely affect our business; and |
| • | if our prices are too high, potential customers may find it economically advantageous to handle certain functions internally using direct connections instead of using us. |
We may not be able to offset the effects of any price reductions by increasing the number of calls we handle or the number of customers we serve, by generating higher revenues from new or enhanced services or by reducing our costs.
We have a limited operating history as a company and as a tandem network for communications services providers. If we are unable to overcome the difficulties frequently encountered by early stage companies, our business could be materially harmed.
We began our operations in February, 2004. We have experienced, and expect to continue to experience, risks and difficulties frequently encountered by companies in an early stage of commercial development in new and rapidly evolving markets. This includes developing new services as we now provide services in many of the major and mid-size U.S. markets to most of the largest carriers. In order to overcome these risks and difficulties, we must, among other things:
| • | generate sufficient usage of our tandem network by our carrier customers; |
| • | maintain and attract a sufficient number of customers to our tandem network to achieve and sustain profitability; |
| • | execute our business strategy successfully, including successful development and provision of new services; |
| • | manage our expanding operations; and |
| • | upgrade our technology, systems and network infrastructure to accommodate increased traffic volume and to implement new features and functions. |
Our failure to overcome these risks and difficulties and the risks and difficulties frequently encountered by early stage companies could adversely affect our operating results which could impair our ability to raise capital, expand our business or continue our operations.
Economic conditions could cause a material reduction in the amount of traffic we carry on our network.
We generate revenue by charging carriers on a per minute of use basis for the traffic we carry on our network. If weakening economic conditions result in decreased spending on phone services (or a decrease in the subscriber base at our customers), the amount of traffic we carry on our network on behalf of our customers could decrease. Furthermore, financial pressure faced by our customers could result in mergers, acquisitions,
26
Table of Contents
liquidations or divestitures of all or a portion of our customers’ businesses, which in turn could result in a reduction in the use of our services. A reduction from these or other economic related causes that we have not foreseen could have a material and adverse effect on our business, financial condition and operating results.
We could experience material variances in our revenues due to events outside of our control.
We could experience material variances in our revenues due to events both under and outside of our control. For example, we could experience a material decline in the minutes of use that we process due to holidays or other seasonal variability, the timing of direct connects established between our customers, installation delays, the implementation of routing changes and traffic outages. If one or more of these events occur, especially with respect to one or more of our larger customers, it would cause a material decrease in our revenues and have a material adverse effect on our business, prospects, financial condition and operating results.
We may be unable to complete suitable acquisitions, or we may undertake acquisitions that could increase our costs or liabilities or be disruptive to our business.
In the future, we may selectively pursue acquisitions to grow our business. We do not currently have any commitments, contracts or understandings to acquire any specific businesses or other material operations. We may not be able to locate suitable acquisition candidates at prices that we consider appropriate or to finance acquisitions on terms that are satisfactory to us. See “We depended upon equity financings, as well as borrowing under our credit facility, to meet our cash requirements after we commenced operations in February 2004, neither of which may be available to us in the future on favorable terms, if at all. We may require substantial additional funds to execute our business plan and, if additional capital is not available, we may need to limit, scale-back or cease our operations” below. If we do identify an appropriate acquisition candidate, we may not be able to successfully negotiate the terms of an acquisition, finance the acquisition or, if the acquisition occurs, integrate the acquired business into our existing business. Acquisitions of businesses or other material operations may require additional debt or equity financing, resulting in additional leverage or dilution of ownership. Integration of acquired business operations could disrupt our business by diverting management away from day-to-day operations. The difficulties of integration may be increased by the necessity of coordinating geographically dispersed organizations, integrating and retaining personnel with disparate business backgrounds and combining different corporate cultures. We also may not realize cost efficiencies or synergies or other benefits that we anticipated when selecting our acquisition candidates. In addition, we may need to record write-downs from future impairments of intangible assets, which could reduce our future reported earnings. At times, acquisition candidates may have liabilities, neutrality-related risks or adverse operating issues that we fail to discover through due diligence prior to the acquisition. The failure to discover such issues prior to such acquisition could have a material adverse effect on our business, prospects, financial condition and operating results.
Our ability to sell our services depends in part on the quality of our support and service offerings, and our failure to offer high quality support and services would have a material adverse effect on our sales and operating results.
Once our services are deployed, our customers depend on our support organization to resolve any issues. A high level of support is critical for the successful marketing and sale of our services. If we do not effectively assist carriers in deploying our services, succeed in helping carriers quickly resolve post-deployment issues and provide effective ongoing support, it will adversely affect our ability to sell our services. As a result, our failure to maintain high quality support and services would have a material adverse effect on our business, prospects, financial condition and operating results.
27
Table of Contents
Security breaches could also adversely affect our business and our customers’ confidential information, which could result in us being subject to legal liability and our reputation could be harmed.
Our tandem network may be vulnerable to physical break-ins, computer viruses, attacks by computer hackers or similar disruptive problems. If unauthorized users gain access to our switch sites or our databases, a security or privacy breach could result in an interruption of service or reduced quality of service, which could cause harm to our business and reputation and could result in a loss of customers. Any breach of security relating to our customers’ confidential information could result in legal liability to us and a reduction in use of our services or cancellation of our services, either of which could materially harm our business. Our personnel often receive highly confidential information from our customers that is stored in our files and on our systems. Similarly, we receive sensitive information that has historically been maintained as a matter of confidence with our customers.
We currently have practices, policies and procedures in place to ensure the confidentiality of our customers’ information. However, our practices, policies and procedures to protect against the risk of inadvertent disclosure or unintentional breaches of security might fail to adequately protect information that we are obligated to keep confidential. We may not be successful in adopting more effective systems for maintaining confidential information, so our exposure to the risk of disclosure of the confidential information of our customers may grow as we expand our business and increase the amount of information that we possess. If we fail to adequately maintain our customers’ confidential information, some of our customers could end their business relationships with us and we could be subject to legal liability.
The failure of the third-party software and equipment we use in our tandem network could cause interruptions or failures of our systems.
We incorporate hardware, software and equipment and license technologies developed by third parties in our tandem network. Our third-party vendors include, among others, Sonus Networks, Inc. for our switches, Cisco Systems, Inc. and Oracle for our database systems and software, and various network services suppliers, such as AT&T, Verizon, Qwest, and Transaction Network Services Inc. and various competitive access providers, for our transport and Signaling System 7 services. As a result, our ability to provide tandem network services depends in part on the continued performance and support of the third-party services and products on which we rely and the respective vendors’ rights to license services and products to us, including without any third-party claims for intellectual property infringement. Notably, although we have only recently begun to use Sonus to supply switches and, therefore, our relationship and operating history with Sonus is limited, we have extensively deployed Sonus switches throughout our network. If any third-party services, equipment or products are not provided to us or experience failures or have defects, or the third parties that supply the services, equipment or products fail to provide adequate support due to financial problems they face or for any other reason, this could result in or exacerbate an interruption or failure of our systems or services. Any such failure or interruption could have a material adverse effect on our business, prospects, financial condition and operating results and expose us to claims by customers.
Our business could be harmed by prolonged electrical power outages or shortages, increased costs of energy or general availability of electrical resources.
Our tandem network switch sites are susceptible to regional costs of power, electrical power shortages, planned or unplanned power outages caused by these shortages, such as those that occurred in the northeast region of the United States in 2003 and in the southeast region of the United States in 2005, and limitations of adequate power resources. We may not be able to pass on to our customers significant increases in the cost of power and power outages could disrupt the services we provide and reduce our revenues. Power outages, which last beyond our backup and alternative power arrangements, could harm our business and expose us to claims by customers.
28
Table of Contents
There are no minimum revenue requirements in our contracts, which means that there is no limit to the potential adverse effect on our revenues from a decrease in the volume of traffic we handle.
We earn revenues for the vast majority of the services that we provide on a per minute of use or per transaction basis. There are no minimum revenue requirements in our contracts, which means that there is no limit to the potential adverse effect on our revenues from a decrease in the volume of traffic we handle. As a result, if our customers cease, or participants reduce, their usage of our services from their current levels, our revenues and results of operations will immediately suffer because there is no contractual requirement for the purchase of our services. For example, as discussed above, our customers have migrated services to a competitor that has been offering our customers lower pricing in certain of our largest and other markets. See “—We face competition from the traditional ILECs and increasing competition from certain other providers such as Level 3 Communications, Peerless Network and Hypercube and expect to compete with new entrants to the tandem services market” above. If such migration continues, or our customers develop internal systems to address their transit or access traffic needs, including direct connections, or if the cost of such transactions makes it impractical for a given carrier to use our services for these purposes, we may experience a reduction in transaction volumes. Finally, the trends that we believe will drive the future demand for our tandem network services, such as the growth of wireless services, and pressure on carriers to reduce costs, may not actually result in increased demand for our services, which would harm our future revenues and growth prospects.
Failure to comply with neutrality positioning could result in loss of significant business.
We have positioned ourselves against ILECs as a neutral third-party provider of tandem services. Our failure to continue to adhere to this neutrality positioning (for example, by competing with any of our customers in any of their core businesses) may result in lost sales or non-renewal of contracts, any one of which could have a material adverse effect on our business, prospects, financial condition and operating results. For example, we have begun providing national transit services and tandem access services, each of which are long distance services, and which can be viewed by some of our customers as being competitive with certain of the services they provide.
Our senior management is important to our customer relationships, and the loss of one or more of our senior managers could have a negative impact on our business.
We believe that our success depends in part on the continued contributions of our senior management. We rely on our executive officers and senior management to generate business and execute programs successfully. In addition, the relationships and reputation that members of our management team have established and maintain with our customers and our regulators contribute to our ability to maintain good customer relations and affect regulatory changes. The loss of one or more key members of senior management could impair our ability to identify and secure new contracts and otherwise to manage our business, any one of which could have a material adverse effect on our business, prospects, financial condition and operating results.
We must recruit and retain skilled employees to succeed in our business.
We believe that an integral part of our success is our ability to recruit and retain employees who have advanced skills in the tandem or new services that we provide and who work well with our customers in the regulated environment in which we operate. In particular, we must hire and retain employees with the technical expertise and industry knowledge necessary to maintain and continue to develop our operations and must effectively manage our growing sales and marketing organization to ensure the development of new services and growth of our operations. Our future success depends on the ability of our sales and marketing organization to establish direct sales and to develop new services. The employees with the skills we require are in great demand and are likely to remain a limited resource in the foreseeable future. If we are unable to recruit and retain a sufficient number of these employees at all levels, our ability to maintain and grow our business could be negatively impacted.
29
Table of Contents
We depended upon equity financings, as well as borrowing under our credit facility, to meet our cash requirements after we commenced operations in February 2004, neither of which may be available to us in the future on favorable terms, if at all. We may require substantial additional funds to execute our business plan and, if additional capital is not available, we may need to limit, scale-back or cease our operations.
We depended upon equity financings, as well as borrowings under our credit facility, to meet our cash requirements after we commenced our operations in February 2004. We expect to meet our cash requirements for the next 12 months through a combination of cash flow from operations, existing cash, cash equivalents and short-term investments. If our cash requirements vary materially from those currently planned, or if we fail to generate sufficient cash flow from our business, we may require additional financing sooner than anticipated. Additional equity or debt financing may result in the incurrence of additional leverage or dilution to our stockholders.
In addition, we may seek additional funding in the future and intend to do so through public or private equity and debt financings. Additional funds may not be available to us on acceptable terms or at all. If we are unable to obtain funding on a timely basis, we may not be able to execute our business plan and could face the following or other risks:
| • | we may not be able to expand or acquire complementary businesses; |
| • | we may not be able to continue to meet customer demand for service quality, availability and competitive pricing; |
| • | we may be forced to reduce our operations; |
| • | we may not be able to develop new services or otherwise respond to changing business conditions or competitive pressures; and |
| • | we may not be able to adequately maintain or upgrade our systems and technology. |
As a result, our business, operating results and financial condition could be adversely affected and we may be required to significantly curtail or cease our operations.
If we do not maintain or generate significant revenues, we may not remain profitable.
Although we achieved net income of approximately $41.3 million for the year ended December 31, 2009, we expect to incur significant future expenses, particularly with respect to the development of new services, deployment of additional infrastructure, expansion in strategic markets and additional legal costs. To remain profitable, we must continue to increase the usage of our tandem services by our customers and attract new customers. We must also deliver superior service to our customers, mitigate the effects of consolidation and develop and commercialize new products and services. We may not succeed in these activities and may never generate revenues that are significant or large enough to sustain profitability on a quarterly or annual basis. A substantial portion of our revenues are derived from fees that we charge our customers on a per-minute basis. Therefore, a general market decline in the price for tandem network services may adversely affect the fees we charge our customers and could materially impact our future revenues and profits.
A substantial portion of our cash at December 31, 2009 was invested in two money market mutual funds.
As of December 31, 2009, we had $157.4 million invested in two money market mutual funds. Due to the short duration of the cash invested, we believe that we do not have any material exposure to changes in the fair value of our cash investments as a result of changes in interest rates. However, since the share price of a money market fund is typically $1, the interest rate paid on the investment or the yield, is typically the predominant measure of the return we receive. The yield may be affected by the default of any securities the fund invests in or changes in the value of investments caused by changes in interest rates; if these factors are severe, the share price of a fund could drop, which could materially and adversely affect our liquidity and ability to operate. The Securities and Exchange Commission, under the authority of the Investment Company Act of 1940, regulates money market funds to minimize these risks.
30
Table of Contents
Our investments in auction rate securities are subject to risks which may cause losses and affect the liquidity of these investments.
At December 31, 2009, we held $17.1 million (par value) of investments comprised of auction rate securities (ARS), which are variable-rate securities and have a long-term maturity with the interest rate being reset through auctions that are typically held every 7, 28 or 35 days. These securities have historically traded at par and were callable at par at the option of the issuer. Interest was typically paid at the end of each auction period or semiannually. At December 31, 2009, we held ARS whose underlying assets are generally student loans which are insured in part by the federal government under the Federal Family Education Loan Programs (FFELP).
Since February 2008, most of the auctions for these securities have failed and there is no assurance that future auctions will succeed. As a result, our ability to liquidate our investment and fully recover the par value in the near term from our ARS is limited and it could take until final maturity of the ARS (up to 31 years) to realize our investments’ par value. In the event we need to access these funds, we may not be able to do so until a future auction on these investments is successful, a secondary market develops or the securities are redeemed by the broker dealer.
In the fourth quarter 2008, we elected to participate in a rights offering by UBS Financial Services, Inc. (UBS) which provides us with certain rights (ARS Rights) to sell $18.1 million (par value) of the ARS back to UBS at par value, at any time during a two-year sale period beginning June 30, 2010. The terms of the ARS Rights are further described in a Registration Statement on Form S-3 (File No. 333-153882) initially filed by UBS with the SEC on October 7, 2008. By electing to participate in the settlement and receive the ARS Rights, we granted UBS the right, exercisable at any time prior to June 30, 2010 or during the two-year sale period, to purchase or cause the sale of our ARS. The ARS and the ARS Rights will be revalued to fair market value on a quarterly basis until the sale of these securities has been completed. Notwithstanding our participation in the settlement, if UBS becomes insolvent or does not otherwise have sufficient financial resources, UBS may not meet its obligations under the settlement, and we may not be able to access these funds until a future auction on these investments is successful, a secondary market develops or the final maturity of the ARS.
Based on our expected operating cash flows, and our other sources of cash, we do not anticipate the potential lack of liquidity on these investments will affect our ability to execute our current business plan.
If we do not adapt to rapid technological change in the communications industry, we could lose customers or market share.
Our industry is characterized by rapid technological change and frequent new service offerings. Significant technological changes could make our technology and services obsolete, too costly or inefficient on a relative basis. We must adapt to our rapidly changing market by continually improving the features, functionality, reliability and responsiveness of our addressing, interoperability and infrastructure services, and by developing new features, services and applications to meet changing customer needs. We cannot ensure that we will be able to adapt to these challenges or respond successfully or in a cost-effective way. Our failure to do so would adversely affect our ability to compete and retain customers or market share. Although we currently provide our services primarily to traditional telecommunications companies, many existing and emerging companies are providing, or propose to provide, voice or similar services using new technologies. Furthermore, the increased adoption of IP switching technologies could increase the competition we face from direct connections. See “—The market for our services is competitive and increased adoption of IP switching technologies could increase the competition we face from direct connections” above. Our future revenues and profits will depend on our ability to provide value added service(s) to competitive carriers. If we are unable to provide these service(s), whether as a result of technology changes or otherwise, we could experience a material adverse effect on our business, prospects, financial condition and operating results.
31
Table of Contents
Confidentiality agreements with employees and others may not adequately prevent disclosure of trade secrets and other proprietary information.
In order to protect our proprietary technology, processes and methods, we rely in part on confidentiality agreements with our corporate partners, employees, consultants, advisors and others. These agreements may not effectively prevent disclosure of confidential information and may not provide an adequate remedy in the event of unauthorized disclosure of confidential information. In addition, others may independently discover trade secrets and proprietary information, and in such cases we could not assert any rights against such party. Costly and time-consuming litigation could be necessary to enforce and determine the scope of our proprietary rights, and failure to obtain or maintain trade secret protection could adversely affect our competitive business position.
Others may allege that we are infringing their intellectual property, forcing us to expend substantial resources in resulting litigation, the outcome of which would be uncertain. Any unfavorable outcome of such litigation could have a material adverse effect on our business, financial position and operating results.
If any parties successfully claim that our creation, offer for sale, sale, import or use of technologies infringes upon their intellectual property rights, we might be forced to incur expenses to litigate the claims, pay damages, potentially including treble damages, if we are found to have willfully infringed such parties’ patents or copyrights. In addition, if we are unsuccessful in litigation, a court could issue a permanent injunction preventing us from operating our network or commercializing our product and service candidates for the life of the patent that we have been deemed to have infringed. Litigation concerning patents and other forms of intellectual property and proprietary technologies, is becoming more widespread and can be protracted and expensive, and can distract management and other key personnel from performing their duties for us.
Any legal action against us claiming damages and seeking to enjoin commercial activities relating to the affected methods, processes, products and services could, in addition to subjecting us to potential liability for damages, require us to obtain a license in order to continue to operate our network or market the affected product and service candidates. Any license required under any patent may not be made available on commercially acceptable terms, if at all. In addition, some licenses may be nonexclusive, and therefore, our competitors may have access to the same technology licensed to us. If we fail to obtain a required license or are unable to design around a patent, we may be unable to effectively operate our network or market some of our technology and products, which could limit our ability to generate revenues or achieve profitability and possibly prevent us from generating revenue sufficient to sustain our operations.
From time to time we have received and we may in the future receive notices or inquiries from other companies regarding our services or the manner in which we operate our network suggesting that we may be infringing a pre-existing patent or we need to license use of their patents to avoid infringement. Such notices may, among other things, threaten litigation against us. As we have in the past, we will actively review the request and determine whether there is any validity to the request and seek to resolve the matter. Litigation over patent rights and other intellectual property rights is not uncommon with respect to network technologies, and sometimes involves patent holding companies or other adverse patent owners who have no relevant product revenues and against whom our own patents may therefore provide little or no deterrence. There can be no assurance that holders of patents will not pursue any claim against us in the future if they believe their patents are being infringed by our network or service offerings.
Risk Factors Related To Our Common Stock
Our common stock has only traded since November 2, 2007 and our stock price is likely to be volatile.
Our common stock has only traded since November 2, 2007. The market prices for securities of telecommunications companies have historically been volatile. Some of the factors that may cause the market price of our common stock to fluctuate include:
| • | the passage of various laws and governmental regulations governing communications-related services and Internet-related services; |
32
Table of Contents
| • | a decrease in the amount of traffic we carry or the rates we charge for such traffic, whether from competition or otherwise; |
| • | the failure to develop new services or successfully manage our growth strategy; |
| • | the failure of or disruption to our physical infrastructure or services; |
| • | conditions or trends in the Internet, technology and communications industries; |
| • | the addition or departure of any key employees; |
| • | the level and quality of securities research analyst coverage of our common stock; |
| • | changes in the estimates of our operating performance or changes in recommendations of us by any research analyst that follow our stock or any failure to meet the estimates made by research analysts; |
| • | litigation involving ourselves, including our granted or any future patents, or our general industry or both; |
| • | investors’ general perception of us, our services, the economy and general market conditions; |
| • | developments or disputes concerning our patents or other proprietary rights; |
| • | the announcement of significant acquisitions, strategic partnerships, joint ventures or capital commitments by us or our competitors; and |
| • | other factors discussed within these “Risk Factors”. |
If any of these factors cause an adverse effect on our business, operating results or financial condition, the price of our common stock could fall. In addition, public announcements by our competitors regarding, among other things, their performance, strategy, accounting practices, or legal problems could cause the price of our common stock to decline regardless of our actual operating performance.
Changes in our capital structure and level of indebtedness and the terms of such indebtedness could adversely affect our business and liquidity position.
Our level of indebtedness, including borrowings under our credit agreement, may increase from time to time for various reasons, including fluctuations in operating results, capital expenditures and possible acquisitions. Future consolidated indebtedness levels could materially affect our business by:
| • | requiring a substantial portion of our cash flow from operations to be dedicated to interest payments on such indebtedness, and thereby not available for other purposes; |
| • | materially limiting or impairing our ability to obtain further financing; |
| • | reducing our flexibility to respond to changing business and economic conditions or to take advantage of business opportunities that may arise; and |
| • | further limiting our ability to pay dividends. |
In addition, our credit agreement limits our ability to enter into various transactions. If we were to default on any of our indebtedness, or if we were unable to obtain necessary liquidity, our indebtedness would become due and payable immediately and our business could be adversely affected.
33
Table of Contents
Anti-takeover provisions under Delaware law and in our amended and restated certificate of incorporation and bylaws could diminish the value of our common stock and could make a merger, tender offer or proxy contest difficult or could impede an attempt to replace or remove our directors.
We are a Delaware corporation and the anti-takeover provisions of the Delaware General Corporation Law may discourage, delay or prevent a change in control by prohibiting us from engaging in a business combination with an interested stockholder for a period of three years after the person becomes an interested stockholder, even if a change of control would be beneficial to our existing stockholders. In addition, our amended and restated certificate of incorporation and bylaws may discourage, delay or prevent a change in our management or control over us that stockholders may consider favorable or make it more difficult for stockholders to replace directors even if stockholders consider it beneficial to do so. Our amended and restated certificate of incorporation and bylaws:
| • | authorize the issuance of “blank check” preferred stock that could be issued by our board of directors to increase the number of outstanding shares to thwart a takeover attempt; |
| • | prohibit cumulative voting in the election of directors, which would otherwise allow holders of less than a majority of the stock to elect some directors; |
| • | require that directors only be removed from office for cause and by the affirmative vote of the holders of at least 66 2/3% of the total votes eligible to be cast in the election of directors; |
| • | require that vacancies on the board of directors, including newly-created directorships, be filled only by a majority vote of directors then in office; |
| • | limit who may call special meetings of stockholders; |
| • | authorize the issuance of authorized but unissued shares of common stock and preferred stock without stockholder approval, subject to the rules and regulations of The NASDAQ Stock Market; |
| • | prohibit stockholder action by written consent, requiring all actions to be taken at a meeting of the stockholders; and |
| • | establish advance notice requirements for nominating candidates for election to the board of directors or for proposing matters. |
In addition, Section 203 of the Delaware General Corporation Law may inhibit potential acquisition bids for us. Section 203 regulates corporate acquisitions and limits the ability of a holder of 15% or more of our stock from acquiring the rest of our stock. Under Delaware law a corporation may opt out of the anti-takeover provisions, but we do not intend to do so.
These provisions may prevent a stockholder from receiving the benefit from any premium over the market price of our common stock offered by a bidder in a potential takeover. Even in the absence of an attempt to effect a change in management or a takeover attempt, these provisions may adversely affect the prevailing market price of our common stock if they are viewed as discouraging takeover attempts in the future.
| ITEM 1B. | UNRESOLVED STAFF COMMENTS |
None.
34
Table of Contents
| ITEM 2. | PROPERTIES |
Our headquarters is located at One South Wacker Drive, Suite 200, Chicago, Illinois, where we lease approximately 15,000 square feet of office space. Our leased properties are described below:
| Property Location |
Approximate Square Feet |
Use | Lease Expiration Date | |||
| Chicago, IL |
15,423 | Administrative Office | October 31, 2011 | |||
| Chicago, IL |
4,910 | Administrative Office | January 31, 2011 | |||
| New York, NY |
16,532 | Switch site | August 31, 2014 | |||
| Detroit, MI |
10,800 | Switch site | February 28, 2025 | |||
| Chicago, IL |
10,000 | Sublet | September 30, 2015 | |||
| Indianapolis, IN |
9,577 | Switch site | April 30, 2012 | |||
| Los Angeles, CA |
6,857 | Switch site | October 31, 2011 | |||
| Cleveland, OH |
6,000 | Switch site | October 31, 2011 | |||
| Atlanta, GA |
5,861 | Switch site | May 31, 2015 | |||
| Minneapolis, MN |
5,808 | Switch site | February 28, 2012 | |||
| Chicago, IL |
5.263 | Switch site | March 31, 2014 | |||
| Miami, FL |
5,176 | Switch site | December 31, 2011 | |||
| Dallas, TX |
4,842 | Switch site | May 31, 2017 | |||
| Chicago, IL |
4,347 | Switch site | May 31, 2011 | |||
| San Francisco, CA |
3,922 | Switch site | April 30, 2014 | |||
| Philadelphia, PA |
3,902 | Switch site | August 31, 2017 | |||
| Cincinnati, OH |
3,369 | Switch site | September 30, 2015 | |||
| Boston, MA |
2,416 | Switch site | June 11, 2016 | |||
| Houston, TX |
2,144 | Switch site | April 30, 2018 | |||
| Orlando, FL |
2,092 | Switch site | May 31, 2011 | |||
| Columbus, OH |
2,026 | Switch site | February 28, 2011 | |||
| St. Louis, MO |
2,000 | Switch site | April 30, 2013 | |||
| Charlotte, NC |
1,775 | Switch site | March 31, 2018 | |||
| Milwaukee, WI |
1,703 | Switch site | November 30, 2014 | |||
| Phoenix, AZ |
1,652 | Switch site | March 31, 2012 | |||
| Denver, CO |
1,650 | Switch site | May 31, 2017 | |||
| Vienna, VA |
1,131 | Switch site | September 30, 2017 | |||
| Seattle, WA |
1,051 | Switch site | May 31, 2017 | |||
| Tampa, FL |
1,048 | Switch site | January 31, 2016 | |||
| Portland, OR |
635 | Switch site | November 30, 2012 | |||
| Salt Lake City, UT |
212 | Switch site | November 12, 2012 | |||
| San Diego, CA |
140 | Switch site | December 09, 2012 | |||
| Las Vegas, NV |
140 | Switch site | May 31, 2018 | |||
| Puerto Rico |
2,576 | Switch site | April 25, 2016 | |||
| Newark, NJ |
130 | Switch site | August 31, 2019 |
We believe our existing facilities are adequate for our current needs in our existing markets and that suitable additional or alternative space will be available in the future on commercially reasonable terms as needed.
| ITEM 3. | LEGAL PROCEEDINGS |
From time to time, we are a party to legal or regulatory proceedings arising in the normal course of our business. Aside from the matters discussed below, we do not believe that we are party to any pending legal action that could reasonably be expected to have a material adverse effect on our business or operating results.
Peerless Network, LLC. On June 12, 2008, we commenced a patent infringement action against Peerless Network, LLC, Peerless Network of Illinois, LLC and John Barnicle in the United States District Court for the
35
Table of Contents
Northern District of Illinois to enforce U.S. Patent No. 7,123,708 (Neutral Tandem, Inc. v Peerless Network, LLC, Peerless Network of Illinois, LLC and John Barnicle, 08 CV 3402). On July 28, 2008, the defendants filed a response to our complaint denying liability and asserting various affirmative defenses and counterclaims. The defendants generally allege (i) that our patent is invalid and unenforceable under a variety of theories, (ii) that assertion of the patent amounts to patent misuse and violation of certain monopolization laws, and (iii) that certain conduct surrounding the litigation gave rise to tortious interference and business disparagement claims and Lanham Act violations. On December 4, 2008, the United States District Court for the Northern District of Illinois granted our motion to dismiss the claims alleging business disparagement and Lanham Act violations but denied our motion to dismiss the claims related to the alleged violation of certain monopolization laws. On November 30, 2009 and December 1, 2009, the court heard our motion dated August 25, 2009 for preliminary injunctive relief seeking to enjoin Peerless Network, LLC and Peerless Network of Illinois, LLC from providing certain tandem transit services. The court has not yet ruled on our request for injunctive relief and is not required to do so by any specific date. On January 27, 2010, the court issued an order construing each of the disputed terms in the patent in the manner we had proposed. The full trial in this action is currently scheduled to be held in the fall of 2010. The parties are currently completing discovery on our claims and the defendants’ remaining counterclaims. We believe that the defendants’ remaining allegations have no merit and intend to vigorously defend ourselves against these remaining counterclaims.
On January 28, 2010, Peerless Network filed a request with the United States Patent and Trademark Office (“USPTO”) requesting that the USPTO reexamine the patent at issue. The USPTO has not yet ruled on Peerless Network’s request, although the PTO typically accepts reexamination requests. If the USPTO grants Peerless Network’s request, the reexamination proceeding could result in the USPTO determining that some or all of the claims in the reexamined patent remain patentable over the prior art without requiring any amendment, that some or all of the claims must be amended to distinguish over the prior art, or that some or all of the claims are not patentable over the prior art.
| ITEM 4. | SUBMISSION OF MATTERS TO A VOTE OF SECURITY HOLDERS |
There were no matters submitted to a vote of security holders during the quarter ended December 31, 2009.
36
Table of Contents
PART II
| ITEM 5. | MARKET FOR REGISTRANT’S COMMON EQUITY, RELATED STOCKHOLDER MATTERS AND ISSUER PURCHASES OF EQUITY SECURITIES |
Market Information
Our common stock has traded on The Nasdaq Global Market under the symbol “TNDM” since November 2, 2007. Prior to that time, there was no public market for our common stock.
The following table sets forth the high and low sale prices per share for our common stock, for the periods indicated as regularly reported by The Nasdaq Global Market:
| 2009 |
High | Low | ||||
| First Quarter |
$ | 24.61 | $ | 14.63 | ||
| Second Quarter |
$ | 31.62 | $ | 23.08 | ||
| Third Quarter |
$ | 33.24 | $ | 21.25 | ||
| Fourth Quarter |
$ | 24.04 | $ | 20.25 | ||
| 2008 |
High | Low | ||||
| First Quarter |
$ | 22.90 | $ | 17.29 | ||
| Second Quarter |
$ | 20.46 | $ | 17.15 | ||
| Third Quarter |
$ | 20.84 | $ | 16.86 | ||
| Fourth Quarter |
$ | 17.98 | $ | 12.86 | ||
| 2007 |
High | Low | ||||
| Fourth Quarter (beginning November 2, 2007) |
$ | 20.28 | $ | 17.42 | ||
As of December 31, 2009, the Company had granted a total of 2,252,500 options that remained outstanding under the Neutral Tandem, Inc. 2007 Long-Term Equity Incentive Plan. The weighted average exercise price of the options outstanding as of December 31, 2009 was $21.00. Option awards for 1,136,511 shares, representing approximately 3.4% of the Company’s outstanding common stock as of December 31, 2009, remained available for additional grants under the 2007 Plan.
Holders of Record
On February 5, 2010, there were 7,700 holders of record of our common stock. Because many of the shares of our common stock are held by brokers and other institutions on behalf of stockholders, we are unable to determine the exact number of beneficial stockholders represented by these record holders, but we believe that there were approximately 17,000 beneficial owners of our common stock as of February 5, 2010.
Dividends
We currently do not pay regular dividends on our outstanding stock. The declaration of any future dividends and, if declared, the amount of any such dividends, will be subject to our actual future earnings, capital requirements, regulatory restrictions, debt covenants, other contractual restrictions and to the discretion of our board of directors. Our board of directors may take into account such matters as general business conditions, our financial condition and results of operations, our capital requirements, our prospects and such other factors as our board of directors may deem relevant.
37
Table of Contents
STOCK PERFORMANCE GRAPH
The following graph compares the cumulative 26-month total return provided stockholders on Neutral Tandem Inc.’s common stock relative to the cumulative total returns of the NASDAQ Composite index and the NASDAQ Telecommunications index. An investment of $100 (with reinvestment of all dividends) is assumed to have been made in our common stock and in each of the indexes on November 2, 2007, the first day of trading of our common stock and its relative performance is tracked through December 31, 2009. The NASDAQ Telecommunications Index contains securities of NASDAQ-listed companies classified according to the Industry Classification Benchmark as Telecommunications and Telecommunications Equipment. They include providers of fixed-line and mobile telephone services, and makers and distributors of high-technology communication products. This graph is not deemed to be “filed” with the SEC or subject to the liabilities of Section 18 of the Securities Exchange Act of 1934, and the graph shall not be deemed to be incorporated by reference into any prior or subsequent filing by Neutral Tandem under the Securities Act of 1933 or the Exchange Act.
COMPARISON OF 14 MONTH CUMULATIVE TOTAL RETURN
(Based upon an initial investment of $100 on November 2, 2007, the first day of trading of
our common stock with dividends reinvested)
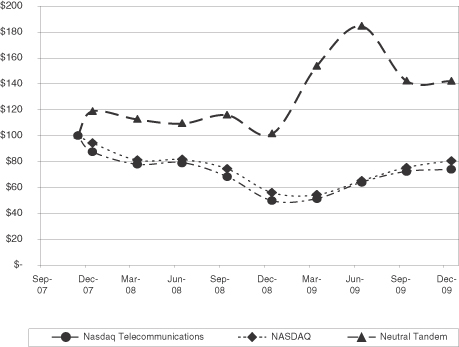
Issuer Purchases of Equity Securities
We did not repurchase any of our common stock during the fourth quarter of 2009. On February 16, 2009, we announced that our Board of Directors has authorized the repurchase of up to $25 million of our outstanding common stock as part of a stock repurchase program. As of February 18th, the Company repurchased 65,000 shares of common stock at an average price of $15.95.
38
Table of Contents
| ITEM 6. | SELECTED FINANCIAL DATA |
SELECTED HISTORICAL CONSOLIDATED FINANCIAL AND OTHER DATA
The selected consolidated financial data should be read in conjunction with “Management’s Discussion and Analysis of Financial Condition and Results of Operations” and our consolidated financial statements and related notes. The selected consolidated statements of operations data for the years ended December 31, 2009, 2008, and 2007 and the selected consolidated balance sheet data as of December 31, 2009 and 2008 are derived from, and are qualified by reference to, the audited consolidated financial statements included elsewhere in this annual report on Form 10-K. The selected consolidated statements of operations data for the fiscal years ended December 31, 2006 and 2005 and the selected consolidated balance sheet data as of December 31, 2007, 2006 and 2005 are derived from, and are qualified by reference to, our audited consolidated financial statements that are not included in this annual report on Form 10-K. The historical results presented below are not necessarily indicative of future results.
| Year Ended December 31, | ||||||||||||||||||||
| 2009 | 2008 | 2007 | 2006 | 2005 | ||||||||||||||||
| (In thousands, except per share data) | ||||||||||||||||||||
| Statements of Operations |
||||||||||||||||||||
| Revenue |
$ | 168,906 | $ | 120,902 | $ | 85,555 | $ | 52,866 | $ | 27,962 | ||||||||||
| Operating expense |
||||||||||||||||||||
| Network and facilities expense (excluding depreciation and amortization) |
50,648 | 40,327 | 30,163 | 21,305 | 11,349 | |||||||||||||||
| Operations |
19,798 | 16,929 | 15,536 | 11,613 | 8,189 | |||||||||||||||
| Sales and marketing |
1,996 | 1,940 | 1,770 | 1,553 | 1,360 | |||||||||||||||
| General and administrative |
17,958 | 12,104 | 9,426 | 4,166 | 3,053 | |||||||||||||||
| Depreciation and amortization |
14,594 | 14,023 | 11,076 | 7,160 | 3,141 | |||||||||||||||
| Impairment of fixed assets |
— | 195 | — | 1,234 | — | |||||||||||||||
| Loss (gain) on disposal of fixed assets |
(53 | ) | (11 | ) | (144 | ) | 333 | — | ||||||||||||
| Total operating expense |
104,941 | 85,507 | 67,827 | 47,364 | 27,092 | |||||||||||||||
| Income from operations |
63,965 | 35,395 | 17,728 | 5,502 | 870 | |||||||||||||||
| Other (income) expense |
||||||||||||||||||||
| Interest expense |
293 | 924 | 1,668 | 1,289 | 843 | |||||||||||||||
| Interest income |
(801 | ) | (3,474 | ) | (1,321 | ) | (778 | ) | (170 | ) | ||||||||||
| Change in fair value of warrants |
— | — | 4,919 | 832 | 674 | |||||||||||||||
| Other (income) expense |
(370 | ) | 1,131 | — | — | (11 | ) | |||||||||||||
| Total other (income) expense |
(878 | ) | (1,419 | ) | 5,266 | 1,343 | 1,336 | |||||||||||||
| Income (loss) before income taxes |
64,843 | 36,814 | 12,462 | 4,159 | (466 | ) | ||||||||||||||
| Provision (benefit) for income taxes |
23,528 | 12,794 | 6,204 | (499 | ) | — | ||||||||||||||
| Net income (loss) |
$ | 41,315 | $ | 24,020 | $ | 6,258 | $ | 4,658 | $ | (466 | ) | |||||||||
| Net income (loss) per common share—basic (1) |
$ | 1.25 | $ | 0.76 | $ | 0.68 | $ | 0.88 | $ | (0.08 | ) | |||||||||
| Net income (loss) per common share—diluted (1) |
$ | 1.22 | $ | 0.72 | $ | 0.24 | $ | 0.20 | $ | (0.08 | ) | |||||||||
| Weighted average number of shares outstanding—basic: |
33,156 | 31,790 | 9,248 | 5,293 | 5,628 | |||||||||||||||
| Weighted average number of shares outstanding—diluted: |
33,912 | 33,236 | 26,378 | 23,481 | 5,628 | |||||||||||||||
39
Table of Contents
| As of December 31, | ||||||||||||||||||||
| 2009 | 2008 | 2007 (2) | 2006 | 2005 | ||||||||||||||||
| (In thousands) | ||||||||||||||||||||
| Balance Sheet Data: |
||||||||||||||||||||
| Cash and cash equivalents |
$ | 161,411 | $ | 110,414 | $ | 112,020 | $ | 20,084 | $ | 1,291 | ||||||||||
| Total current assets |
205,959 | 131,335 | 127,382 | 31,525 | 10,566 | |||||||||||||||
| Total assets |
256,590 | 195,843 | 166,016 | 61,991 | 31,224 | |||||||||||||||
| Total current liabilities |
11,602 | 10,904 | 16,276 | 13,325 | 6,895 | |||||||||||||||
| Long term obligations, including current portion |
235 | 3,196 | 7,580 | 12,902 | 6,709 | |||||||||||||||
| Total liabilities |
15,759 | 15,977 | 22,094 | 25,356 | 11,833 | |||||||||||||||
| Total preferred stock |
— | — | — | 38,000 | 26,000 | |||||||||||||||
| Total shareholders’ equity (deficit) |
240,831 | 179,866 | 143,922 | (1,365 | ) | (6,609 | ) | |||||||||||||
| Cash Flow Data: |
||||||||||||||||||||
| Cash flows from operating activities |
$ | 56,396 | $ | 35,152 | $ | 24,141 | $ | 12,967 | $ | 2,147 | ||||||||||
| Cash flows from investing activities |
(16,379 | ) | (41,136 | ) | (19,947 | ) | (12,719 | ) | (10,240 | ) | ||||||||||
| Cash flows from financing activities |
10,980 | 4,378 | 87,742 | 18,545 | 9,185 | |||||||||||||||
| (1) | Basic earnings (loss) per share is computed by dividing net income (loss) by the weighted average number of common shares outstanding during the period. Diluted earnings (loss) per share is computed giving effect to all dilutive potential common shares that were outstanding during the period. The effect of preferred shares, stock options, non-vested shares and warrants represents the only difference between the weighted average shares used for the basic earnings (loss) per share computation compared to the diluted earnings (loss) per share computation. |
| (2) | On November 7, 2007, we completed on initial public offering of common stock in which we sold 7,247,849 shares of our common stock and selling shareholders sold 399,928 shares of our common stock, in each case at an issue price of $14.00 per share. We raised a total of $101.5 million in gross proceeds from our initial public offering, or $91.3 million in net proceeds after deducting underwriting discounts and commissions of $7.1 million and other offering costs of $3.1 million. |
To date, we have not declared or paid any cash dividends on our common stock. We do not anticipate paying any dividends on our common stock in the foreseeable future.
| ITEM 7. | MANAGEMENT’S DISCUSSION AND ANALYSIS OF FINANCIAL CONDITION AND RESULTS OF OPERATIONS |
This annual report on Form 10-K contains “forward-looking statements” that involve risks and uncertainties, as well as assumptions that, if they never materialize or prove incorrect, could cause our results to differ materially from those expressed or implied by such forward-looking statements. Such forward-looking statements include any expectation of earnings, revenues or other financial items; any statements of the plans, strategies and objectives of management for future operations; factors that may affect our operating results; statements related to future capital expenditures; statements related to future economic conditions or performance; statements as to industry trends and other matters that do not relate strictly to historical facts or statements of assumptions underlying any of the foregoing. These statements are often identified by the use of words such as “anticipate,” “believe,” “continue,” “could,” “estimate,” “expect,” “intend,” or “may,” and similar expressions or variations. These statements are based on the beliefs and assumptions of our management based on information currently available to management. Such forward-looking statements are subject to risks, uncertainties and other factors that could cause actual results and the timing of certain events to differ materially from future results expressed or implied by such forward-looking statements. Factors that could cause or contribute to such differences include, but are not limited to, those identified below, and those discussed in the section titled “Risk Factors” included in Item 1A of Part I of this annual report on Form 10-K. You should review these risk factors for a more complete understanding of the risks associated with an investment in our securities. We undertake no obligation to revise or update any forward-looking statements. The following
40
Table of Contents
discussion and analysis should be read in conjunction with our “Risk Factors”, “Selected Consolidated Financial Data” and consolidated financial statements and notes thereto included elsewhere in this annual report on Form 10-K.
Overview
We provide tandem interconnection services principally to competitive carriers, including wireless, wireline, cable and broadband telephony companies. Competitive carriers use tandem switches to interconnect and exchange local and long distance traffic between their networks without the need to establish direct switch-to-switch connections. Prior to the introduction of our service, the primary method for competitive carriers to exchange traffic indirectly was through the tandem switches of the incumbent local exchange carriers, or ILECs. The tandem switching services offered by ILECs consist of transit services, which are provided in connection with local calls, and access services, which are provided in connection with long distance calls. Under certain interpretations of the Telecommunications Act of 1996 and implementing regulations, ILECs are required to provide tandem transit services to competitive carriers. ILECs generally set per minute rates and other charges for tandem transit services according to rate schedules approved by state public utility commissions, although the methodology used to review these rate schedules varies from state to state. ILECs are also required to offer access services to competing telecommunications carriers under the Telecommunications Act of 1996 and implementing regulations. ILECs generally set per minute rates and other charges for access services according to mandated rate schedules set by the Federal Communications Commission, or FCC, for interstate calls and by state public utility commissions for intrastate calls. Our solution enables competitive carriers to exchange traffic between their networks without using an ILEC tandem for both local and long distance calls.
The proliferation of competitive carriers over the past decade and their capture of an increasing share of subscribers has shifted a greater amount of intercarrier traffic to ILEC tandem switches and amplified the complexity of carrier interconnections. This has resulted in additional traffic loading of ILEC tandems, lower service quality and substantial costs incurred by competitive carriers for interconnection. A loss of ILEC market share to competitive carriers has escalated competitive tensions and resulted in an increased demand for tandem switching.
We founded our company to solve these interconnection problems and better facilitate the exchange of traffic among competitive carriers and non-carriers. By utilizing our managed tandem service, our customers benefit from a simplified interconnection network solution that reduces costs, increases network reliability, decreases competitive tension and adds network diversity and redundancy.
According to the Local Exchange Routing Guide, an industry standard guide maintained by Telcordia that is used by carriers, there are approximately 1.49 billion telephone numbers assigned to carriers in North America. Our services are principally targeted to address the estimated 799 million, or 54% of the total 1.49 billion, telephone numbers assigned primarily to competitive carriers; that is, all carriers that are not ILECs.
We have signed agreements with major competitive carriers and non-carriers and we operated in 137 markets as of December 31, 2009. During the fourth quarter of 2009, our network carried 23.8 billion minutes of traffic. As of December 31, 2009, our network was capable of connecting calls to an estimated 480 million telephone numbers assigned to carriers. Telephone numbers assigned to a carrier may not necessarily be assigned to, and in use by, an end user.
Since commencing service in February 2004, we have grown rapidly and operated in 137 markets as of December 31, 2009. For the year ended December 31, 2009, we increased revenue to $168.9 million, an increase of 39.7% compared to the year ended December 31, 2008. The increase in revenue was primarily due to an increase of minutes of use to 87.8 billion minutes processed in the year ended December 31, 2009 from 61.0 billion minutes processed in the year ended December 31, 2008, an increase of 43.9%. Our income from operations for the year ended December 31, 2009 was $64.0 million compared to $35.4 million for the year
41
Table of Contents
ended December 31, 2008. Net income was approximately $41.3 million compared to net income of $24.0 million for the year ended December 31, 2008.
Revenue
We generate revenue from the sale of our interconnection services. Revenue is recorded each month on an accrual basis based upon minutes of traffic switched by our network by each customer, which we refer to as minutes of use. The rates charged per minute are determined by contracts between us and our customers or by filed and effective tariffs. The following table sets forth our revenue, minutes of use and the average rate we charged per minute for the years ended December 31, 2009, 2008 and 2007.
| Years Ended December 31, | |||||||||
| 2009 | 2008 | 2007 | |||||||
| Revenue (In thousands) |
$ | 168,906 | $ | 120,902 | $ | 85,555 | |||
| Minutes of Use Billed (In millions) |
87,799 | 61,001 | 41,003 | ||||||
| Average fee per billed minute |
$ | 0.0019 | $ | 0.0020 | $ | 0.0021 | |||
Minutes of use increase as we increase our number of customers, increase the penetration of existing markets, either with new customers or with existing customers, and increase our service offerings. The minutes of use decrease due to direct connection between existing customers, consolidation between customers, a customer using a different interconnection provider or a customer experiencing a decrease in the volume of traffic it carries.
The average fee per minute varies depending on market forces and type of service, such as switched access or local transit. The market rate in each market is based upon competitive conditions along with the switched access or local transit rates offered by the ILECs. Depending on the markets we enter, we may enter into contracts with our customers with either a higher or lower fee per minute than our current average. For example, although we regard the 37 new markets that we added in 2009, the 36 new markets that we added in 2008 and the 30 new markets that we added in 2007 as financially attractive, the rates for local transit service we charge in the more recently opened markets are generally lower than the rates we charge in the markets we opened earlier.
Our service solution incorporates other components beyond switching. In addition to switching, we generally provision trunk circuits between our customers’ switches and our network locations at our own expense and at no direct cost to our customers. We also provide quality of service monitoring, call records and traffic reporting and other services to our customers as part of our service solution. Our per-minute fees are intended to incorporate all of these services.
While generally not seasonal in nature, our revenues are affected by certain events such as holidays, the unpredictable timing of direct connects between our customers, and installation and implementation delays. These factors can cause our revenue to both increase or decrease unexpectedly. See “Risk Factors—Risks Factors Related to Our Business—We could experience material variances in our revenues.”
Operating Expense
Operating expenses include network and facilities expense, operations expenses, sales and marketing expenses, general and administrative expenses, depreciation and amortization, impairment of fixed assets and the gain or loss on the disposal of fixed assets. Personnel-related costs are the most significant component as we grew from 58 employees at December 31, 2004 to 147 employees at December 31, 2009.
Network and Facilities Expense. Our network and facilities expense include transport and signaling network costs, facility rents and utilities, together with other costs that directly support the switch locations. We do not defer or capitalize any costs associated with the start-up of new switch locations. The start-up of an additional switch location can take between three months to six months. During this time we typically incur
42
Table of Contents
facility rent, utilities, payroll and related benefit costs along with initial non-recurring circuit installation costs. Revenues generally follow sometime after the sixth month.
Network transport costs typically occur on a repeating monthly basis, which we refer to as recurring transport costs, or on a one-time basis, which we refer to as non-recurring transport costs. Recurring transport costs primarily include monthly usage charges from telecommunication carriers and are related to the circuits utilized by us to connect to our customers. As our traffic increases, we must utilize additional circuits. Non-recurring transport costs primarily include the initial installation of such circuits. Facility rents include the leases on our switch facilities, which expire through February 2025. Additionally, we pay the cost of all the utilities for all of our switch locations.
The largest component of our other costs relates to charges we pay to utilize the ILEC services. We incur some monthly charges from the ILECs as we diversify our network and provide alternative routes to complete our customers’ traffic. In some cases, we may not have sufficient capacity on circuits in our own network to handle the volume of traffic destined for a particular customer. In other cases, a circuit may experience an outage preventing us from completing a call. In these situations, we will incur these charges, generally temporarily, in order to maintain a high quality of service. We attempt to minimize these charges by managing our network, recognizing when additional capacity is required and working with our customers to augment the transport capacity required between our network and theirs.
Operations Expenses. Operations expenses include payroll and benefits for both our switch location personnel as well as individuals located at our corporate office who are directly responsible for maintaining and expanding our switch network. Other primary components of operations expenses include switch repair and maintenance, property taxes, property insurance and supplies.
Sales and Marketing Expense. Sales and marketing expenses represent the smallest component of our operating expenses and primarily include personnel costs, sales bonuses, marketing programs and other costs related to travel and customer meetings.
General and Administrative Expense. General and administrative expenses consist primarily of compensation and related costs for personnel and facilities associated with our executive, finance, human resource and legal departments and fees for professional services. Professional services principally consist of outside legal, audit and other accounting costs. The other accounting costs relate to work surrounding compliance with the Sarbanes-Oxley Act.
Depreciation and Amortization Expense. Depreciation and amortization expense is applied using the straight-line method over the estimated useful lives of the assets after they are placed in service, which are five years for switch equipment and test equipment, three years for computer equipment, computer software and furniture and fixtures. Leasehold improvements are amortized on a straight-line basis over an estimated useful life of five years or the life of the respective leases, whichever is shorter.
Impairment of Fixed Assets. The carrying value of long-lived assets, primarily property and equipment, is evaluated whenever events or changes in circumstances indicate that a potential impairment has occurred. A potential impairment has occurred if projected undiscounted cash flows are less than the carrying value of the assets. The estimated cash flows include management’s assumptions of cash inflows and outflows directly resulting from the use of that asset in operation. The impairment test is a two-step process. If the carrying value of the asset exceeds the expected future cash flows from the asset, impairment is indicated. The impairment loss recognized is the excess of the carrying value of the asset over its fair value. Typically, the fair value of the asset is determined by estimating future cash flows associated with the asset.
Gain on Disposal of Fixed Assets. We have disposed of switch equipment in connection with converting to new technology and computer equipment to replace old or damaged units. When there is a carrying value of
43
Table of Contents
these assets, we record the write-off of these amounts to loss on disposal. In some cases, this equipment is sold to a third party. When the proceeds from the sale of equipment identified for disposal exceeds the asset’s carrying value, we record a gain on disposal.
Change in Fair Value of Warrants. Freestanding warrants related to preferred shares that were conditionally redeemable were classified as liabilities on the consolidated balance sheet. The warrants were subject to re-measurement at each balance sheet date and any change in fair value was recognized as a component of other income (expense), net. Upon the closing of the Company’s IPO in November 2007, warrants to purchase shares of the Company’s convertible preferred stock became warrants to purchase shares of the Company’s common stock . The then-current aggregate fair value of these warrants of $6.9 million was reclassified from current liabilities to warrants, a component of stockholders’ equity, and the Company ceased to record any further periodic fair value adjustments. On February 21, 2008 all outstanding warrants were exercised.
Interest Income (Expense). Interest expense consists of interest paid each month related to our outstanding equipment loans associated with our security agreement with an affiliate of Western Technology Investment. We record accrued interest each month associated with a final payment for each loan equal to a range of 8.1% to 9.6% of the original principal loan amount. Interest expense also includes an amount related to the amortization of the value of debt discount associated with warrants issued to an affiliate of Western Technology Investment in accordance with the terms of our agreement. Interest income is earned primarily on our cash, cash equivalents and our investment in auction rate securities (ARS).
Other Expense. Other expense includes adjustments to the fair value of the ARS, adjustments to the fair value of the ARS Rights and expenses incurred in connection with the secondary offering by certain of our shareholders completed in the first quarter of 2008.
Income Taxes. Income tax provision includes U.S. federal, state, and local income taxes and is based on pre-tax income. In determining the estimated annual effective income tax rate, we analyze various factors, including projections of our annual earnings and taxing jurisdictions in which earnings will be generated, the impact of state and local income taxes and our ability to use tax credits and any net operating loss carryforwards.
See “Risk Factors” for certain matters that may bear on our future results of operations.
Critical Accounting Policies and Estimates
The discussion and analysis of our financial condition and results of operations are based on our consolidated financial statements, which have been prepared in accordance with generally accepted accounting principles, or GAAP, in the United States of America. The preparation of these financial statements in accordance with GAAP requires us to utilize accounting policies and make certain estimates and assumptions that affect the reported amounts of assets and liabilities, the disclosure of contingencies as of the date of the financial statements and the reported amounts of revenue and expense during a fiscal period. The Securities and Exchange Commission (SEC) considers an accounting policy to be critical if it is important to a company’s financial condition and results of operations, and if it requires significant judgment and estimates on the part of management in its application. We have discussed the selection and development of the critical accounting policies with the audit committee of our board of directors, and the audit committee has reviewed our related disclosures in this annual report. Although we believe that our judgments and estimates are appropriate and correct, actual results may differ from those estimates.
We believe the following to be our critical accounting policies because they are important to the portrayal of our financial condition and results of operations and they require critical management judgments and estimates about matters that are uncertain. If actual results or events differ materially from those contemplated by us in making these estimates, our reported financial condition and results of operation for future periods could be materially affected.
44
Table of Contents
Revenue Recognition
We generate revenue from sales of our neutral tandem interconnection services. We maintain tariffs and executed service agreements with each of our customers in which specific fees and rates are determined. Revenue is recorded each month based upon documented minutes of traffic switched for which service is provided, when collection is probable. We provide service primarily to large, well-established competitive carriers, including wireless, wireline, cable and broadband telephony providers.
Auction Rate Securities and ARS Rights
In the fourth quarter 2008, we entered into a settlement with UBS related to the ARS, pursuant to which we elected to participate in a rights offering that provides us with certain rights (ARS Rights) to sell $18.8 million (par value) of the ARS back to UBS at par value, at any time during a two-year sale period beginning June 30, 2010. The terms of the ARS Rights are further described in a Registration Statement on Form S-3 (File No. 333-153882) initially filed by UBS with the SEC on October 7, 2008. By electing to participate in the settlement and receive the ARS Rights, we granted UBS the right, exercisable at any time prior to June 30, 2010 or during the two-year sale period, to purchase or cause the sale of our auction rate securities.
Our ARS Rights are required to be recognized as free-standing assets, separate from our ARS. We elected to treat the ARS as trading securities and elected to measure the ARS Rights at fair value in order to match the changes in the fair value of the ARS. ARS Rights and the ARS were reclassified from available-for-sale to trading securities and are recorded in current other assets in the accompanying consolidated balance sheet as of December 31, 2009 and recorded in our non-current other assets in the accompanying consolidated balance sheet as of December 31, 2008.
The Company does not intend to hold these securities until final maturity. The ARS and ARS Rights will be revalued to fair market value on a quarterly basis until the sale of these securities has been completed.
Accounting for Income Taxes
Deferred income tax assets and liabilities are recognized for future income tax consequences attributable to temporary differences between the financial statement carrying amounts of existing assets and liabilities and their respective income tax bases and for net operating loss carryforwards. Deferred income tax assets and liabilities are measured using enacted tax rates expected to apply to taxable income in the years in which those temporary differences are expected to be recovered or settled. The effect on deferred income tax assets and liabilities of a change in income tax rates is recorded in earnings in the period of enactment. A valuation allowance is provided for deferred income tax assets whenever it is more likely than not that future tax benefits will not be realized. Deferred income tax assets are reviewed on a quarterly basis to determine if a valuation allowance is necessary based on current and historical performance, along with other relevant factors.
Income tax provision includes U.S. federal, state, and local income taxes and is based on pre-tax income or loss. In determining the estimated annual effective income tax rate, we analyze various factors, including projections of our annual earnings and taxing jurisdictions in which earnings will be generated, the impact of state and local income taxes and our ability to use tax credits and net operating loss carryforwards.
Our policy is to recognize interest and penalty expense associated with uncertain tax positions as a component of income tax expense in the consolidated statement of operations.
Stock-Based Compensation
We currently record stock-based compensation expense in connection with any grant of options or non-vested shares to our employees and independent contractors. We record stock-based compensation expense
45
Table of Contents
associated with our stock options and non-vested shares, which requires us to calculate the expense associated with our stock options by determining the fair value of the options.
The fair value of stock options is determined using the Black-Scholes valuation model. This model takes into account the exercise price of the stock option, the fair value of the common stock underlying the stock option as measured on the date of grant and an estimation of the volatility of the common stock underlying the stock option. Such value is recognized as expense over the service period, net of estimated forfeitures, using the straight-line method. The estimation of stock awards that will ultimately vest requires judgment, and to the extent actual results or updated estimates differ from our current estimates, such amounts will be recorded as a cumulative adjustment in the period estimates are revised. We consider many factors when estimating expected forfeitures, including types of awards, employee class, and historical experience. Actual results, and future changes in estimates, may differ substantially from current estimates.
Stock-based employee compensation is reflected in the statement of income. All options and non-vested shares granted under the Plan have an exercise price equal to the market value of the underlying common stock on the date of the grant.
We utilized the simple average volatility of three telecommunication companies that share similar business characteristics for estimating the fair value of options granted through December 31, 2008. The simple average volatility of the three companies selected range from 34.4% at the beginning of 2006 to 50.8% at December 31, 2008. We calculated the volatility of our own stock for the period between November 2, 2007 and December 31, 2008 and found that it is not materially different than the results of the three company average. As of January 1, 2009, we calculated and utilized our own volatility for estimated the fair value of options during 2009.
Legal Contingencies
We are currently involved in various claims and legal proceedings. We review the status of each significant matter quarterly and assess our financial exposure. If the potential loss from any claim or legal proceeding is considered probable and the amount can be reasonably estimated, we accrue a liability for the estimated loss. Significant judgment is required in both the determination of probability and the determination as to whether an exposure is reasonably estimable. Because of uncertainties related to these matters, accruals are based only on the best information available at the time. As additional information becomes available, we reassess the potential liability related to our pending claims and litigation and may revise our estimates. Such revisions in the estimates of the potential liabilities could have a material impact on our results of operations and financial position.
46
Table of Contents
Results of Operations
The following table sets forth our results of operations for the years ended December 31, 2009, 2008 and 2007:
NEUTRAL TANDEM, INC. AND SUBSIDIARIES
CONSOLIDATED STATEMENTS OF INCOME
(In thousands, except per share data)
| Year Ended December 31, | ||||||||||||
| 2009 | 2008 | 2007 | ||||||||||
| Revenue |
$ | 168,906 | $ | 120,902 | $ | 85,555 | ||||||
| Operating expense |
||||||||||||
| Network and facilities expense (excluding depreciation and amortization) |
50,648 | 40,327 | 30,163 | |||||||||
| Operations |
19,798 | 16,929 | 15,536 | |||||||||
| Sales and marketing |
1,996 | 1,940 | 1,770 | |||||||||
| General and administrative |
17,958 | 12,104 | 9,426 | |||||||||
| Depreciation and amortization |
14,594 | 14,023 | 11,076 | |||||||||
| Impairment of fixed assets |
— | 195 | — | |||||||||
| Gain on disposal of fixed assets |
(53 | ) | (11 | ) | (144 | ) | ||||||
| Total operating expense |
104,941 | 85,507 | 67,827 | |||||||||
| Income from operations |
63,965 | 35,395 | 17,728 | |||||||||
| Other (income) expense |
||||||||||||
| Interest expense, including debt discount of $52, $95 and $139, respectively |
293 | 924 | 1,668 | |||||||||
| Interest income |
(801 | ) | (3,474 | ) | (1,321 | ) | ||||||
| Change in fair value of warrants |
— | — | 4,919 | |||||||||
| Other (income) expense |
(370 | ) | 1,131 | — | ||||||||
| Total other (income) expense |
(878 | ) | (1,419 | ) | 5,266 | |||||||
| Income before income taxes |
64,843 | 36,814 | 12,462 | |||||||||
| Provision for income taxes |
23,528 | 12,794 | 6,204 | |||||||||
| Net income |
$ | 41,315 | $ | 24,020 | $ | 6,258 | ||||||
| Net income per share: |
||||||||||||
| Basic |
$ | 1.25 | $ | 0.76 | $ | 0.68 | ||||||
| Diluted |
$ | 1.22 | $ | 0.72 | $ | 0.24 | ||||||
| Weighted average number of shares outstanding: |
||||||||||||
| Basic |
33,156 | 31,790 | 9,248 | |||||||||
| Diluted |
33,912 | 33,236 | 26,378 | |||||||||
Year Ended December 31, 2009 Compared to Year Ended December 31, 2008
Revenue. Revenue of $168.9 million for the year ended December 31, 2009 increased $48.0 million, or 39.7%, from $120.9 million for the year ended December 31, 2008. The increase in revenue was primarily due to an increase in minutes of use billed to 87.8 billion minutes processed for the year ended December 31, 2009 from 61.0 billion minutes processed in the year ended December 31, 2008, an increase of 26.8 billion minutes, or 43.9 %. The number of minutes carried over our network increased as a result of the entry into 37 new markets in 2009 and further penetration of current markets and customers.
47
Table of Contents
The number of markets in which we operated increased to 137 at December 31, 2009 from 100 at December 31, 2008. The average fee per minute for the year ended December 31, 2009 of $0.0019 decreased from the December 31, 2008 amount of $0.0020.
Operating Expenses. Operating expenses of $104.9 million for the year ended December 31, 2009 increased $19.4 million from $85.5 million in the year ended December 31, 2008, or 62.1% and 70.7% of revenue, respectively. The components making up operating expenses are discussed further below.
Network and Facilities Expenses. Network and facilities expenses of $50.6 million for the year ended December 31, 2009, or 30.0% of revenue, increased from $40.3 million for the year ended December 31, 2008, or 33.3% of revenue. Network and facilities expenses increased due to an increase in the number of switch locations we connect, increasing by 468 switch locations to 1,804 switch locations at December 31, 2009 from 1,336 switch locations at December 31, 2008. In addition, our switch related costs, primarily made up of facility rent and utilities costs, increased as our number of locations at the end of December 31, 2009 grew to 32 compared to 31 locations at December 31, 2008. Excluding the switch location costs noted above, which are more fixed in nature, many components included in our network and facilities expense increase at a slower rate than our minute of use billed and revenue growth, causing the percentage to revenue for 2009 to decrease compared to 2008.
Operations Expenses. Operations expenses of $19.8 million for the year ended December 31, 2009, or 11.7% of revenue, increased $2.9 million compared to $16.9 million for the year ended December 31, 2008, or 14.0% of revenue. The increase in our operations expenses primarily resulted from an increase in payroll and benefits due to an increase in the number of switch location personnel as well as individuals located at our corporate office who are directly responsible for maintaining and expanding our switch network. Because many of the components making up our operations expenses are somewhat fixed in nature, or increase at a slower rate than our minute of use billed and revenue growth, the percentage to revenue for 2009 decreased compared to 2008.
Sales and Marketing Expense. Sales and marketing expense of $2.0 million for the year ended December 31, 2009, or 1.2% of revenue, increased slightly from $1.9 million for the year ended December 31, 2008, or 1.6% of revenue. We have successfully increased revenues while maintaining the same approximate size of the sales and marketing force.
General and Administrative Expense. General and administrative expense increased to $18.0 million for the year ended December 31, 2009, or 10.6% of revenue, compared to $12.1 million for the year ended December 31, 2008, or 10.0% of revenue. The $5.9 million increase in our general and administrative expense is primarily due to an increase of $2.7 million in payroll and benefits and $2.8 million in professional fees.
Depreciation and Amortization Expense. Depreciation and amortization expense increased to $14.6 million for the year ended December 31, 2009, or 8.6% of revenue, compared to $14.0 million for the year ended December 31, 2008, or 11.6% of revenue. The increase in our depreciation and amortization expense resulted from capital expenditures primarily related to the expansion of switch capacity in existing markets and the installation of switch capacity in new markets. Depreciation expense as a percentage of revenue has decreased as we have been able to add minutes to much of our current switch equipment without the purchase of additional equipment.
Impairment of Fixed Assets. During 2009, there was no impairment of fixed assets compared to $0.2 million for the year ended December 31, 2008. In June of 2008, we decided to invest in new switch equipment in our Michigan and Ohio locations. As a result of this decision, a significant portion of the old switch equipment in Michigan and Ohio was no longer utilized. In 2008, we recorded asset impairment of $0.2 million related to the installation of new equipment in our Michigan and Ohio locations. The new equipment in Michigan and Ohio was installed and became operational in October 2008.
48
Table of Contents
Gain on Disposal of Fixed Assets. We sold equipment in 2009 and 2008 for which we received less than $0.1 million. The equipment did not have any carrying value at the time of sale.
Other (Income) Expense. Other income was $0.9 million in the year ended December 31, 2009 compared to other income of $1.4 million for the year ended December 31, 2008. During 2009, the decrease in interest income was partially offset by a decrease in interest expense associated with debt and an increase in other income. Interest income decreased during the year due to lower interest rates earned on our investments. Interest expense associated with debt decreased during the year due to the repayment of debt outstanding throughout 2008 and 2009. Other income in 2009 includes the net of our $1.0 million gain associated with the fair value of the auction rate securities and our $0.7 million loss associated with the fair value of the ARS Rights. Other expense in 2008 includes costs we incurred in connection with a demand registration by certain of our shareholders that was consummated in the closing of a secondary offering of our common stock by certain selling shareholders in April 2008 of $0.6 million and the net of our $2.0 million loss associated with the fair value of the auction rate securities and our $1.4 million gain associated with the fair value of the ARS Rights (see note 9—Investments and Fair Value Measurements).
Provision for Income Taxes. Provision for income taxes was $23.5 million for the year ended December 31, 2009, an increase of $10.7 million compared to $12.8 million for the year ended December 31, 2008. The effective tax rate at December 31, 2009 was 36.3% compared to the effective tax rate at December 31, 2008 of 34.8%. The 2009 estimated effective income tax rate is higher than the statutory rate primarily due to state income tax, offset by the Illinois EDGE credit tax benefit. The 2008 estimated effective income tax rate is lower than the statutory rate primarily due to tax exempt municipal interest and the Illinois EDGE credit tax benefit.
Year Ended December 31, 2008 Compared to Year Ended December 31, 2007
Revenue. Revenue of $120.9 million for the year ended December 31, 2008 increased $35.3 million, or 41.2%, from $85.6 million for the year ended December 31, 2007. The increase in revenue was primarily due to an increase in minutes of use billed to 61.0 billion minutes processed for the year ended December 31, 2008, from 41.0 billion minutes processed in the year ended December 31, 2007, an increase of 20.0 billion minutes, or 48.8 %. The number of minutes carried over our network increased as a result of further penetration of current markets and customers, as well as the entry into 36 new markets in 2008.
The number of markets in which we operated increased to 100 at December 31, 2008 from 64 at December 31, 2007. The average fee per minute for the year ended December 31, 2008 of $0.0020 decreased from the December 31, 2007 amount of $0.0021.
Operating Expenses. Operating expenses of $85.5 million for the year ended December 31, 2008 increased $17.7 million from $67.8 million in the year ended December 31, 2007, or 70.7% and 79.2% of revenue, respectively. The components making up operating expenses are discussed further below.
Network and Facilities Expenses. Network and facilities expenses of $40.3 million for the year ended December 31, 2008, or 33.3% of revenue, increased from $30.2 million for the year ended December 31, 2007, or 35.3% of revenue. Network and facilities expenses increased due to an increase in the number of switch locations we connect, increasing by 445 switch locations to 1,336 switch locations at December 31, 2008 from 891 switch locations at December 31, 2007. In addition, our switch related costs, primarily made up of facility rent and utilities costs, increased as our number of locations at the end of December 31, 2008 grew to 31 compared to 24 locations at December 31, 2007.
Operations Expenses. Operations expenses of $16.9 million for the year ended December 31, 2008, or 14.0% of revenue, increased $1.4 million compared to $15.5 million for the year ended December 31, 2007, or 18.1% of revenue. The increase in our operations expenses primarily resulted from an increase in payroll and benefits due to an increase in the number of switch location personnel as well as individuals located at our corporate office who are directly responsible for maintaining and expanding our switch network. Because many
49
Table of Contents
of the components making up our operations expenses are somewhat fixed in nature, or increase at a slower rate than our minute of use billed and revenue growth, the percentage to revenue for 2008 decreased compared to 2007.
Sales and Marketing Expense. Sales and marketing expense of $1.9 million for the year ended December 31, 2008, or 1.6% of revenue, increased slightly from $1.8 million for the year ended December 31, 2007, or 2.1% of revenue. We have successfully increased revenues while maintaining the same approximate size of the sales and marketing force.
General and Administrative Expense. General and administrative expense increased to $12.1 million for the year ended December 31, 2008, or 10.0% of revenue, compared to $9.4 million for the year ended December 31, 2007, or 11.0% of revenue. The $2.7 million increase in our general and administrative expense is primarily due to an increase of $1.9 million in payroll and benefits, $0.5 million in professional fees and $0.3 million in business insurance.
Depreciation and Amortization Expense. Depreciation and amortization expense increased to $14.0 million for the year ended December 31, 2008, or 11.6% of revenue, compared to $11.1 million for the year ended December 31, 2007, or 13.0% of revenue. The increase in our depreciation and amortization expense resulted from capital expenditures primarily related to the expansion of switch capacity in existing markets and the installation of switch capacity in new markets along with accelerated depreciation of $2.2 million which was related to our conversion to new switch equipment in our New York, Michigan, Ohio, Illinois, Minnesota and Indiana locations.
Impairment of Fixed Assets. The impairment of fixed assets of $0.2 million for the year ended December 31, 2008 increased compared to no impairment of fixed assets for the year ended December 31, 2007. In June of 2008, we decided to invest in new switch equipment in our Michigan and Ohio locations. As a result of this decision, a significant portion of the old switch equipment in Michigan and Ohio was no longer utilized. In 2008, we recorded asset impairment of $0.2 million related to the installation of new equipment in our Michigan and Ohio locations. The new equipment in Michigan and Ohio was installed and became operational in October 2008.
Gain on Disposal of Fixed Assets. We sold equipment in 2008 in which we received less than $0.1 million. The equipment did not have any carrying value at the time of sale. We sold equipment in 2007 in which we received a total of approximately $0.2 million. The equipment did not have any carrying value at the time of sale. During the year we also disposed of equipment that resulted in a total loss of approximately $0.1 million.
Other (Income) Expense. Other income was $1.4 million in the year ended December 31, 2008 compared to other expense of $5.3 million for the year ended December 31, 2007. During 2008, the increase in investment income, decrease in interest expense associated with debt and decrease in the change in fair value of warrants was partially offset by an increase in other expense. Other expense in 2008 includes costs we incurred in connection with a demand registration by certain of our shareholders that was consummated in the closing of a secondary offering of our common stock by certain selling shareholders in April 2008 of $0.6 million and the net of our $2.0 million loss associated with the fair value of the auction rate securities and our $1.4 million gain associated with the fair value of the ARS Rights (see note 9—Investments and Fair Value Measurements).
Provision for Income Taxes. Provision for income taxes was $12.8 million for the year ended December 31, 2008, an increase of $6.6 million compared to $6.2 million for the year ended December 31, 2007. The effective tax rate at December 31, 2008 was 34.8% compared to the effective tax rate at December 31, 2007 of 49.8%. The 2008 estimated effective income tax rate is lower than the statutory rate primarily due to the Illinois EDGE credit tax benefit and tax exempt municipal interest. The 2007 effective tax rate was higher than the statutory rate primarily due to the non-deductibility of our expense related to the change in fair value of warrants.
50
Table of Contents
Liquidity and Capital Resources
Our primary sources of liquidity have been cash provided by operations, the sale and issuance of equity, borrowings under our credit facility and our initial public offering completed in November 2007. Our principal uses of cash have been capital expenditures for switch equipment, working capital and debt service requirements. We anticipate that our principal uses of cash in the future will be for facility expansion, capital expenditures for switch equipment and working capital.
At December 31, 2009, we had $161.4 million in cash and cash equivalents, $16.2 million in auction rate securities and $0.4 million in restricted cash. In comparison, at December 31, 2008 we had $110.4 million in cash and cash equivalents, $16.9 million in auction rate securities and $0.4 million in restricted cash. Cash and cash equivalents consist of highly liquid money market funds. The restricted cash balance is pledged as collateral for certain commercial letters of credit.
Working capital at December 31, 2009 was $196.2 million compared to $120.4 million at December 31, 2008. We received $91.3 million of net proceeds upon completion of our initial public offering in November 2007.
Our capital expenditures of $18.1 million, $22.3 million and $20.1 million in the years ended December 31, 2009, 2008 and 2007, respectively, related primarily to the installation of switching equipment in existing and new locations. Capital expenditures for 2010 are expected to be between $18.0 million and $22.0 million.
We believe that cash flow from operating activities, in addition to cash and cash equivalents currently on-hand, will be sufficient to fund our operations, including our anticipated growth plans, for the foreseeable future and in any event for at least the next 12 to 18 months. Given the generally negative and highly volatile global economic climate and the challenges and uncertainties in the global credit markets, however, no assurance can be given that this will be the case.
We regularly review acquisitions and additional strategic opportunities, which may require additional debt or equity financing. We currently do not have any pending agreements or understandings with respect to any acquisitions or strategic opportunities.
The following table sets forth components of our cash flow (in thousands) for the following periods:
| Year Ended December 31, | ||||||||||||
| 2009 | 2008 | 2007 | ||||||||||
| Cash flows from operating activities |
$ | 56,396 | $ | 35,152 | $ | 24,141 | ||||||
| Cash flows from investing activities |
($ | 16,379 | ) | ($ | 41,136 | ) | ($ | 19,947 | ) | |||
| Cash flows from financing activities |
$ | 10,980 | $ | 4,378 | $ | 87,742 | ||||||
Cash flows from operating activities
Net cash provided by operating activities for the year ended December 31, 2009 was $56.4 million, compared to $35.2 million for the year ended December 31, 2008. Operating cash inflows are largely attributable to payments from customers which are generally received between 35 to 45 days following the end of the billing month. Operating cash outflows are largely attributable to personnel related expenditures, facility and switch maintenance costs. The increase in operating cash flow reflects high operating earnings driven by a significant increase in minutes billed. Timing of cash collections and payments remained the same.
Net cash provided by operating activities for the year ended December 31, 2008 was $35.2 million, compared to $24.1 million for the year ended December 31, 2007. The increase in operating cash flow reflects high operating earnings driven by a significant increase in minutes billed and an increase in accrued liabilities, partially offset by increases in accounts receivable and the change in the fair value of warrants.
51
Table of Contents
Recent economic conditions have made the availability of credit for working capital purposes more difficult to obtain. If these conditions continue, it may impact our customers’ ability to pay their obligations to us as they become due and consequently impact our cash flows from operating activities. While we do not believe we have been materially impacted by these conditions to date, the magnitude of such impact, if any, is not known.
Cash flows from investing activities
Net cash used for investing activities for the year ended December 31, 2009 was $16.4 million, compared to $41.1 million for the year ended December 31, 2008. Investing cash outflows are primarily related to purchases of switch equipment and the timing of purchases and redemptions of short-term and long-term investments. We also use cash to support letters of credit required by certain facility landlords and other vendors. The decrease in net cash used for investing activities is the result of a decrease in the purchase of equipment and auction rate securities, partially offset by a decrease in proceeds from the redemption of auction rate securities.
Net cash used for investing activities for the year ended December 31, 2008 was $41.1 million, compared to $19.9 million for the year ended December 31, 2007. The increase in net cash used for investing activities used is the result of an increase in the purchase of equipment and auction rate securities, partially offset by a decrease in the proceeds from the redemption of auction rate securities.
Cash flows from financing activities
Net cash provided by financing activities for the year ended December 31, 2009 was $11.0 million, compared to $4.4 million for the year ended December 31, 2008. The changes in cash flows from financing activities primarily relate to the exercise of stock options and payments under our debt obligations. The increase in cash from financing activities is the result of an increase in the proceeds from the issuance of common stock associated with stock options, an increase in the excess tax benefit associated with stock option expense and a decrease in principal repayments of long-term debt.
Net cash provided by financing activities for the year ended December 31, 2008 was $4.4 million, compared to $87.7 million for the year ended December 31, 2007. During 2007, the Company had proceeds from the issuance of common stock. This was partially offset by an increase in the excess tax benefit associated with stock option expense and a decrease in principal repayments of long-term debt.
Investments
We held approximately $17.1 million (par value) and $18.8 million (par value) of municipal note investments at December 31, 2009 and December 31, 2008, respectively. These investments are comprised of auction rate securities, or ARS, which are variable-rate securities and have a long-term maturity with the interest rate being reset through auctions that are typically held every 7, 28 or 35 days. These securities have historically traded at par and were callable at par at the option of the issuer. Interest was typically paid at the end of each auction period or semiannually. Our auction rate securities had an auction reset feature whose underlying assets are generally student loans which are insured in part by the federal government under the Federal Family Education Loan Programs (FFELP).
Since February 2008, most of the auctions for these securities have failed and there is no assurance that future auctions will succeed. As a result, our ability to liquidate our investment and fully recover the par value of our ARS during the next twelve months is limited, without the settlement discussed in the following paragraph, and it could take until final maturity of the ARS (up to 31 years) to realize our investments’ par value. In the event we need to access these funds, we may not be able to do so until a future auction on these investments is successful, a secondary market develops or the securities are redeemed by the broker dealer.
52
Table of Contents
In the fourth quarter 2008, we entered into a settlement with UBS related to the ARS, pursuant to which we elected to participate in a rights offering that provides us with certain rights (ARS Rights) to sell all of the $18.8 million (par value) of the ARS held at the time of the rights agreement, back to UBS at par value, at any time during a two-year sale period beginning June 30, 2010. The terms of the ARS Rights are further described in a Registration Statement on Form S-3 (File No. 333-153882) initially filed by UBS with the SEC on October 7, 2008. By electing to participate in the settlement and receive the ARS Rights, we granted UBS the right, exercisable at any time prior to June 30, 2010 or during the two-year sale period, to purchase or cause the sale of our ARS. Our auction rate securities had an auction reset feature whose underlying assets are generally student loans which are insured in part by the federal government under the Federal Family Education Loan Programs (FFELP). Our ARS rights are required to be recognized as a free-standing asset, separate from the Company’s ARS. As such, in 2009 we recorded a loss of $0.7 million related to the ARS Rights and a gain of $1.0 million related to the ARS portfolio as we may not to hold these securities until final maturity because of UBS’s right to purchase and or right to sell the ARS. The ARS and the ARS Rights will be revalued to fair market value on a quarterly basis until the sale of these securities has been completed.
We also invest our excess cash in money market mutual funds whose carrying values approximate market value. As of December 31, 2009, we had $157.4 million in cash and cash equivalents invested in two money market mutual funds.
For further discussion of these investments see footnote 9 to the audited financial statements—”Investments and Fair Value Measurements.”
Contractual Cash Obligations
The following table represents a summary of our estimated future payments under contractual cash obligations as of December 31, 2009. Changes in our business needs, cancellation provisions, changing interest rates and other factors may result in actual payments differing from these estimates. We cannot provide certainty regarding the timing and amounts of payments. There have been no significant developments with respect to our contractual cash obligations since December 31, 2009.
| Payments due by period | |||||||||||||||
| Contractual Cash Obligations |
Total | Current | 2-3 years | 4-5 years | More than 5 years | ||||||||||
| (In thousands) | |||||||||||||||
| Principal payments on current portion of long-term debt |
$ | 235 | $ | 235 | $ | — | $ | — | $ | — | |||||
| Interest payments on current portion of long-term debt (1) |
243 | 243 | — | — | — | ||||||||||
| Operating leases |
21,195 | 4,571 | 7,182 | 4,981 | 4,461 | ||||||||||
| Transport purchase commitment |
5,700 | 3,180 | 2,520 | — | — | ||||||||||
| Total |
$ | 27,373 | $ | 8,229 | $ | 9,702 | $ | 4,981 | $ | 4,461 | |||||
| (1) | Interest rate is fixed according to the terms of the loan agreement. |
Long-Term Debt
We have an equipment loan and security agreement with an affiliate of Western Technology Investment. As of December 31, 2009 we had approximately $0.2 million outstanding under this credit facility and no available capacity for future borrowings. Outstanding loans bear interest at prime plus 1.25% and there is a terminal payment of 9.6% of the original amount borrowed. The average interest rate of this credit facility, including all balloon payments, was approximately 12.9% for each of the years ended December 31, 2009, 2008 and 2007. Our obligations under the credit facility are secured by a lien on substantially all of our assets and specified equipment.
53
Table of Contents
Under the terms of the credit facility, we must comply with certain negative covenants that limit our ability to declare or pay dividends, incur additional indebtedness, incur liens, dispose of significant assets, make acquisitions or significantly change the nature of our business without the permission of the lender. As of December 31, 2009 and 2008, we were in compliance with all of the covenants under the agreement.
Letters of Credit
We use cash collateralized letters of credit issued by Bank of America, N.A. to secure certain facility leases and other obligations. At December 31, 2009 there was $440,000 of restricted cash used as collateral for $336,000 in letters of credit outstanding.
Operating Leases
We lease facilities and certain equipment under operating leases which expire through February 2025. Rental expense for the years ended December 2009, 2008 and 2007 was $4.3 million, $4.0 million, $3.2 million, respectively. See Item 2 “Properties” above for a description of the location of our leased real property.
Purchase Commitment
We have a service agreement with one of our major transport providers, where we have committed to purchase a minimum amount of service through 2011. We purchased the minimum amount of service in 2009 in the ordinary course of business. There was no purchase commitment as of December 31, 2008 and December 31, 2007.
Effect of Inflation
Inflation generally affects us by increasing our cost of labor and equipment. We do not believe that inflation had any material effect on our results of operations for the years ended December 31, 2009, 2008 and 2007.
Off-Balance Sheet Arrangements
We do not have any off-balance sheet arrangements other than cash obligations for operating leases and the transport purchase commitment as noted in “Contractual Cash Obligations” above.
Recent Accounting Pronouncements
In June 2009, the FASB issued ASC No. 105, Generally Accepted Accounting Principles (ASC 105 or FASB Codification) (formerly Statement of Financial Accounting Standards (SFAS) No. 168, The FASB Accounting Standards Codification and the Hierarchy of Generally Accepted Accounting Principles - a replacement of FASB Statement No. 162 (SFAS 168)). The effective date for use of the FASB Codification is for interim and annual periods ending after September 15, 2009. Companies should account for the adoption of the guidance on a prospective basis. Effective July 1, 2009, the Company adopted the FASB Codification and its adoption did not have a material impact on its condensed consolidated financial statements. The Company has appropriately updated its disclosures with the appropriate FASB Codification references during the year ended December 31, 2009. As such, all the notes to the condensed consolidated financial statements below as well as the critical accounting policies in the Management’s Discussion and Analysis section have been updated with the appropriate FASB Codification references.
In April 2009, the FASB issued No. 820-10-35, Fair Value Measurements and Disclosures – Subsequent Measurement (ASC 820-10-35) (formerly FSP SFAS 157-4, Determining Fair Value When the Volume and Level of Activity for the Asset or Liability Have Significantly Decreased and Identifying Transactions That Are Not Orderly), which provides additional guidance on estimating fair value when the volume and level of activity for the asset or liability have significantly decreased. ASC 820-10-35 provides additional guidance on estimating
54
Table of Contents
fair value when the volume and level of activity for an asset or liability have significantly decreased in relation to normal market activity for the asset or liability. ASC 820-10-35 also provides additional guidance on circumstances that may indicate that a transaction is not orderly. The above provision is effective for interim and annual periods ending after June 15, 2009. The Company adopted the provisions relating to determining the fair value when the volume and level of activity for the asset or liability have significantly decreased and identifying transactions that are not orderly under ASC 820-10-35 during the second quarter of 2009, and its application had no impact on the Company’s consolidated financial statements.
In May 2009, the FASB issued ASC No. 855, Subsequent Events (ASC 855) (formerly SFAS No. 165, Subsequent Events). ASC 855 establishes general standards of accounting for and disclosure of events that occur after the balance sheet date but before the financial statements are issued or are available to be issued. Although the standard is based on the same principles as those that currently exist in the auditing standards, it includes a new required disclosure of the date through which an entity has evaluated subsequent events. The Company adopted this standard effective April 1, 2009 and the Company’s adoption did not have a material impact on its consolidated financial statements. The company evaluated subsequent events through the date the accompanying financial statements were issued, which was February 19, 2010.
| ITEM 7A. | QUANTITATIVE AND QUALITATIVE DISCLOSURES ABOUT MARKET RISK |
Interest rate exposure
We had cash, cash equivalents, short and long-term investments and restricted cash totaling $178.7 million and $129.1 million at December 31, 2009 and December 31, 2008, respectively. These amounts were allocated primarily in money market funds, ARS and associated ARS Rights. The unrestricted cash and cash equivalents are held for working capital purposes. We do not enter into investments for speculative purposes. At December 31, 2009, we had $157.4 million in cash and cash equivalents invested in two money market mutual fund and $16.9 million, in the aggregate, in ARS and ARS Rights. For further discussion of these investments see footnote 9 to the consolidated financial statements—”Investments and Fair Value Measurements.”
None of our indebtedness discussed in footnote 5 to the consolidated financial statements—”Debt” above bears interest at a variable rate.
Based upon our overall interest rate exposure at December 31, 2009, we do not believe that a hypothetical 10 percent change in interest rates over a one-year period would have a material impact on our earnings, fair values or cash flows from interest rate risk sensitive instruments discussed above.
55
Table of Contents
| ITEM 8. | FINANCIAL STATEMENTS AND SUPPLEMENTARY DATA |
INDEX TO CONSOLIDATED FINANCIAL STATEMENTS
| Page | ||
| 57 | ||
| 58 | ||
| 59 | ||
| 60 | ||
| 61 | ||
| 62 | ||
| Report of Independent Registered Public Accounting Firm on Internal Control Over Financial Reporting |
80 |
56
Table of Contents
Report of Independent Registered Public Accounting Firm
To the Board of Directors and Shareholders of
Neutral Tandem, Inc.
Chicago, Illinois
We have audited the accompanying consolidated balance sheets of Neutral Tandem, Inc. and subsidiaries (the “Company”) as of December 31, 2009 and 2008, and the related consolidated statements of income, shareholders’ equity (deficit), and cash flows for each of the three years in the period ended December 31, 2009. Our audits also included the financial statement schedule listed in the Index at Item 15. These financial statements and financial statement schedule are the responsibility of the Company’s management. Our responsibility is to express an opinion on the financial statements and financial statement schedule based on our audits.
We conducted our audits in accordance with the standards of the Public Company Accounting Oversight Board (United States). Those standards require that we plan and perform the audit to obtain reasonable assurance about whether the financial statements are free of material misstatement. An audit includes examining, on a test basis, evidence supporting the amounts and disclosures in the financial statements. An audit also includes assessing the accounting principles used and significant estimates made by management, as well as evaluating the overall financial statement presentation. We believe that our audits provide a reasonable basis for our opinion.
In our opinion, such consolidated financial statements present fairly, in all material respects, the financial position of Neutral Tandem, Inc. and subsidiaries as of December 31, 2009 and 2008, and the results of their operations and their cash flows for each of the three years in the period ended December 31, 2009, in conformity with accounting principles generally accepted in the United States of America. Also, in our opinion, such financial statement schedule, when considered in relation to the basic consolidated financial statements taken as a whole, presents fairly, in all material respects, the information set forth therein.
We have also audited, in accordance with the standards of the Public Company Accounting Oversight Board (United States), the Company’s internal control over financial reporting as of December 31, 2009, based on the criteria established in Internal Control—Integrated Framework issued by the Committee of Sponsoring Organizations of the Treadway Commission and our report dated February 19, 2010 expressed an unqualified opinion on the Company’s internal control over financial reporting.
/s/ DELOITTE & TOUCHE LLP
Chicago, Illinois
February 19, 2010
57
Table of Contents
NEUTRAL TANDEM, INC. AND SUBSIDIARIES
CONSOLIDATED BALANCE SHEETS
(In thousands, except share and per share amounts)
| December 31, 2009 |
December 31, 2008 | |||||
| ASSETS |
||||||
| Current assets: |
||||||
| Cash and cash equivalents |
$ | 161,411 | $ | 110,414 | ||
| Receivables |
24,836 | 16,785 | ||||
| Deferred income taxes-current |
800 | 2,341 | ||||
| Other current assets |
18,912 | 1,795 | ||||
| Total current assets |
205,959 | 131,335 | ||||
| Property and equipment—net |
49,679 | 45,266 | ||||
| Restricted cash |
440 | 440 | ||||
| Other assets |
512 | 18,802 | ||||
| Total assets |
$ | 256,590 | $ | 195,843 | ||
| LIABILITIES AND SHAREHOLDERS’ EQUITY |
||||||
| Current liabilities: |
||||||
| Accounts payable |
$ | 1,235 | $ | 258 | ||
| Accrued liabilities: |
||||||
| Taxes payable |
429 | 657 | ||||
| Circuit cost |
4,012 | 3,358 | ||||
| Rent |
1,073 | 1,183 | ||||
| Payroll and related items |
1,914 | 952 | ||||
| Other |
2,704 | 1,535 | ||||
| Current installments of long-term debt |
235 | 2,961 | ||||
| Total current liabilities |
11,602 | 10,904 | ||||
| Other liabilities |
— | 191 | ||||
| Deferred income taxes-noncurrent |
4,157 | 4,647 | ||||
| Long-term debt—excluding current installments |
— | 235 | ||||
| Total liabilities |
15,759 | 15,977 | ||||
| Shareholders’ equity: |
||||||
| Preferred stock—par value of $.001; 50,000,000 authorized shares; no shares issued and outstanding at December 31, 2009 and December 31, 2008 |
— | — | ||||
| Common stock—par value of $.001; 150,000,000 authorized shares; 33,628,501 shares and 32,357,383 shares issued and outstanding at December 31, 2009 and December 31, 2008, respectively |
34 | 32 | ||||
| Additional paid-in capital |
171,381 | 151,733 | ||||
| Retained earnings |
69,416 | 28,101 | ||||
| Total shareholders’ equity |
240,831 | 179,866 | ||||
| Total liabilities and shareholders’ equity |
$ | 256,590 | $ | 195,843 | ||
See notes to consolidated financial statements.
58
Table of Contents
NEUTRAL TANDEM, INC. AND SUBSIDIARIES
CONSOLIDATED STATEMENTS OF INCOME
(In thousands, except per share amounts)
| Year Ended December 31, | ||||||||||||
| 2009 | 2008 | 2007 | ||||||||||
| Revenue |
$ | 168,906 | $ | 120,902 | $ | 85,555 | ||||||
| Operating expense: |
||||||||||||
| Network and facilities expense (excluding depreciation and amortization) |
50,648 | 40,327 | 30,163 | |||||||||
| Operations |
19,798 | 16,929 | 15,536 | |||||||||
| Sales and marketing |
1,996 | 1,940 | 1,770 | |||||||||
| General and administrative |
17,958 | 12,104 | 9,426 | |||||||||
| Depreciation and amortization |
14,594 | 14,023 | 11,076 | |||||||||
| Impairment of fixed assets |
— | 195 | — | |||||||||
| Gain on disposal of fixed assets |
(53 | ) | (11 | ) | (144 | ) | ||||||
| Total operating expense |
104,941 | 85,507 | 67,827 | |||||||||
| Income from operations |
63,965 | 35,395 | 17,728 | |||||||||
| Other (income) expense: |
||||||||||||
| Interest expense, including debt discount of $52, $95 and $139, respectively |
293 | 924 | 1,668 | |||||||||
| Interest income |
(801 | ) | (3,474 | ) | (1,321 | ) | ||||||
| Change in fair value of warrants |
— | — | 4,919 | |||||||||
| Other (income) expense |
(370 | ) | 1,131 | — | ||||||||
| Total other (income) expense |
(878 | ) | (1,419 | ) | 5,266 | |||||||
| Income before income taxes |
64,843 | 36,814 | 12,462 | |||||||||
| Provision for income taxes |
23,528 | 12,794 | 6,204 | |||||||||
| Net income |
$ | 41,315 | $ | 24,020 | $ | 6,258 | ||||||
| Net income per share: |
||||||||||||
| Basic |
$ | 1.25 | $ | 0.76 | $ | 0.68 | ||||||
| Diluted |
$ | 1.22 | $ | 0.72 | $ | 0.24 | ||||||
| Weighted average number of shares outstanding: |
||||||||||||
| Basic |
33,156 | 31,790 | 9,248 | |||||||||
| Diluted |
33,912 | 33,236 | 26,378 | |||||||||
See notes to consolidated financial statements.
59
Table of Contents
NEUTRAL TANDEM, INC. AND SUBSIDIARIES
CONSOLIDATED STATEMENTS OF SHAREHOLDERS’ EQUITY (DEFICIT)
(Dollars in thousands)
| Shares Outstanding | Common Shares |
Warrants | Additional Paid-In Capital |
Accum Deficit/ Retained Earnings |
Total Shareholders’ Equity(Deficit) |
|||||||||||||||||||
| Common Shares |
Warrants | |||||||||||||||||||||||
| Balance at December 31, 2006 |
5,319,434 | — | 6 | — | 806 | (2,177 | ) | (1,365 | ) | |||||||||||||||
| Net income and comprehensive income |
— | — | — | — | — | 6,258 | 6,258 | |||||||||||||||||
| Proceeds from issuance of common shares, net of costs |
7,248,700 | — | 7 | — | 93,104 | — | 93,111 | |||||||||||||||||
| Preferred conversion to common shares |
18,000,230 | — | 18 | — | 37,982 | — | 38,000 | |||||||||||||||||
| Reclassification of warrants |
— | 402,236 | — | 6,920 | — | — | 6,920 | |||||||||||||||||
| Exercise of stock options |
264,575 | — | 1 | — | 91 | — | 92 | |||||||||||||||||
| Stock option expense |
— | — | — | — | 906 | — | 906 | |||||||||||||||||
| Balance at December 31, 2007 |
30,832,939 | 402,236 | 32 | 6,920 | 132,889 | 4,081 | 143,922 | |||||||||||||||||
| Net income and comprehensive income |
— | — | — | — | — | 24,020 | 24,020 | |||||||||||||||||
| Retirement of common shares |
(16,500 | ) | — | — | — | — | — | — | ||||||||||||||||
| Exercise of warrants |
356,921 | (402,236 | ) | — | (6,920 | ) | 6,920 | — | — | |||||||||||||||
| Excess tax benefit associated with stock option exercise |
— | — | — | — | 7,600 | — | 7,600 | |||||||||||||||||
| Exercise of stock options |
1,184,023 | — | — | — | 1,257 | — | 1,257 | |||||||||||||||||
| Stock option expense |
— | — | — | — | 3,067 | — | 3,067 | |||||||||||||||||
| Balance at December 31, 2008 |
32,357,383 | — | 32 | — | 151,733 | 28,101 | 179,866 | |||||||||||||||||
| Net income and comprehensive income |
— | — | — | — | — | 41,315 | 41,315 | |||||||||||||||||
| Excess tax benefit associated with stock option exercise |
— | — | — | — | 9,543 | — | 9,543 | |||||||||||||||||
| Exercise of stock options |
1,271,118 | — | 2 | — | 4,448 | — | 4,450 | |||||||||||||||||
| Stock option and non-vested share expense |
— | — | — | — | 5,657 | — | 5,657 | |||||||||||||||||
| Balance at December 31, 2009 |
33,628,501 | — | $ | 34 | $ | — | $ | 171,381 | $ | 69,416 | $ | 240,831 | ||||||||||||
See notes to consolidated financial statements.
60
Table of Contents
NEUTRAL TANDEM, INC. AND SUBSIDIARIES
CONSOLIDATED STATEMENTS OF CASH FLOWS
(Dollars in thousands)
| Year Ended December 31, | ||||||||||||
| 2009 | 2008 | 2007 | ||||||||||
| Cash Flows From Operating Activities: |
||||||||||||
| Net income |
$ | 41,315 | $ | 24,020 | $ | 6,258 | ||||||
| Adjustments to reconcile net cash flows from operating activities: |
||||||||||||
| Depreciation and amortization |
14,594 | 14,023 | 11,076 | |||||||||
| Deferred income taxes |
1,051 | 2,453 | 526 | |||||||||
| Impairment of fixed assets |
— | 195 | — | |||||||||
| Gain on disposal of fixed assets |
(53 | ) | (11 | ) | (144 | ) | ||||||
| Non-cash share-based compensation |
5,657 | 3,067 | 906 | |||||||||
| Amortization of debt discount |
52 | 95 | 139 | |||||||||
| Changes in fair value of warrants |
— | — | 4,919 | |||||||||
| Changes in fair value of ARS |
(1,034 | ) | 1,957 | — | ||||||||
| Changes in fair value of ARS Rights |
664 | (1,376 | ) | — | ||||||||
| Excess tax benefit associated with stock option exercise |
(9,543 | ) | (7,600 | ) | — | |||||||
| Changes in assets and liabilities: |
||||||||||||
| Receivables—net |
(8,051 | ) | (4,681 | ) | (4,228 | ) | ||||||
| Other current assets |
(203 | ) | (844 | ) | (150 | ) | ||||||
| Other noncurrent assets |
46 | 247 | 174 | |||||||||
| Accounts payable |
102 | (25 | ) | (671 | ) | |||||||
| Accrued liabilities |
11,799 | 3,534 | 5,228 | |||||||||
| Noncurrent liabilities |
— | 98 | 108 | |||||||||
| Net cash flows from operating activities |
56,396 | 35,152 | 24,141 | |||||||||
| Cash Flows From Investing Activities: |
||||||||||||
| Purchase of equipment |
(18,134 | ) | (22,301 | ) | (20,149 | ) | ||||||
| Proceeds from sale of equipment |
55 | 11 | 224 | |||||||||
| Increase in restricted cash |
— | (21 | ) | (22 | ) | |||||||
| Purchase of auction rate securities |
— | (25,150 | ) | — | ||||||||
| Proceeds from the redemption of ARS |
1,700 | 6,325 | — | |||||||||
| Net cash flows from investing activities |
(16,379 | ) | (41,136 | ) | (19,947 | ) | ||||||
| Cash Flows From Financing Activities: |
||||||||||||
| Proceeds from the issuance of common shares associated with stock option exercise |
4,450 | 1,257 | 1,924 | |||||||||
| Proceeds from issuance of common shares, net of issuance cost |
— | — | 91,279 | |||||||||
| Excess tax benefit associated with stock option exercise |
9,543 | 7,600 | — | |||||||||
| Principal payments on long-term debt |
(3,013 | ) | (4,479 | ) | (5,461 | ) | ||||||
| Net cash flows from financing activities |
10,980 | 4,378 | 87,742 | |||||||||
| Net Increase (Decrease) In Cash And Cash Equivalents |
50,997 | (1,606 | ) | 91,936 | ||||||||
| Cash And Cash Equivalents—Beginning |
110,414 | 112,020 | 20,084 | |||||||||
| Cash And Cash Equivalents—End |
$ | 161,411 | $ | 110,414 | $ | 112,020 | ||||||
| Supplemental Disclosure Of Cash Flow Information: |
||||||||||||
| Cash paid for interest |
$ | 875 | $ | 1,022 | $ | 1,258 | ||||||
| Cash paid for taxes |
$ | 15,148 | $ | 3,264 | $ | 3,385 | ||||||
| Cash refunded for taxes |
$ | — | $ | — | $ | 542 | ||||||
| Supplemental Disclosure Of Noncash Flow Items: |
||||||||||||
| Investing Activity—Accrued purchases of equipment |
$ | 1,046 | $ | 171 | $ | 463 | ||||||
See notes to consolidated financial statements.
61
Table of Contents
NEUTRAL TANDEM, INC. AND SUBSIDIARIES
NOTES TO CONSOLIDATED FINANCIAL STATEMENTS
| 1. | DESCRIPTION OF THE BUSINESS |
Organization—Neutral Tandem, Inc. (the Company) provides tandem interconnection services principally to competitive carriers, including wireless, wireline, cable and broadband telephony companies. Competitive carriers use tandem switches to interconnect and exchange local and long distance traffic between their networks without the need to establish direct switch-to-switch connections. Prior to the introduction of the Company’s service, the primary method for competitive carriers to exchange traffic indirectly was through tandem switches of the incumbent local exchange carriers, or ILECs. The tandem switching services offered by ILECs consist of transit services, which are provided in connection with local calls, and access services, which are provided in connection with long distance calls. Under certain interpretations of the Telecommunications Act of 1996 and implementing regulations, ILECs are required to provide tandem transit services to competitive carriers. ILECs generally set per minute rates and other charges for tandem transit services according to rate schedules approved by state public utility commissions, although the methodology used to review these rate schedules varies from state to state. ILECs are also required to offer access services to competing telecommunications carriers under the Telecommunications Act of 1996 and implementing regulations. ILECs generally set per minute rates and other charges for access services according to mandated rate schedules set by the Federal Communications Commission, or FCC, for interstate calls and by state public utility commissions for intrastate calls. The Company’s solution enables competitive carriers to exchange traffic between their networks without using an ILEC tandem for both local and long distance calls.
Initial Public Offering—In November 2007, the Company completed its initial public offering (IPO) of common stock in which it sold 7,247,489 shares of its common stock, including 997,489 shares sold pursuant to the underwriter’s full exercise of their over-allotment option, at an issue price of $14.00 per share. The Company raised a total of $101.5 million in gross proceeds from its IPO, or $91.3 million in net proceeds after deducting underwriting discounts and commissions of $7.1 million and other offering costs of $3.1 million. Upon the closing of the IPO, all shares of convertible preferred stock outstanding automatically converted into 18.0 million shares of common stock.
Secondary Offering—In April 2008, certain shareholders of the Company completed a secondary offering in which 4.9 million shares of the Company’s common stock were sold at a price of $18.00 per share. The Company did not sell any shares of its common stock and received no proceeds from the secondary offering. The Company paid approximately $0.6 million of certain expenses related to the offering and recorded the entire amount as other expense in the first quarter 2008.
| 2. | SUMMARY OF SIGNIFICANT ACCOUNTING POLICIES |
Principles of Consolidation—The consolidated financial statements include the accounts of the Company and its wholly owned subsidiaries. All intercompany balances and transactions have been eliminated in consolidation.
Use of Estimates—The Company’s consolidated financial statements are prepared in accordance with accounting principles generally accepted in the United States of America. These accounting principles require management to make certain estimates and assumptions that can affect the reported amounts of assets and liabilities and disclosure of contingent liabilities at the date of the consolidated financial statements, as well as the reported amounts of revenues and expenses during the periods presented. Significant estimates and assumptions made by management include the determination of fair value of investments and fair value of stock-based compensation. The Company believes that the estimates and assumptions upon which it relies are reasonable based upon information available to it at the time that these estimates and assumptions are made. To the extent there are material differences between these estimates and actual results, the Company’s consolidated financial statements will be affected.
62
Table of Contents
Cash and Cash Equivalents—The Company considers all highly liquid investments with an original maturity of 90 days or less to be cash equivalents. The carrying values approximate fair value. At December 31, 2009 the Company had $4.0 million of cash in banks and $157.4 million in two money market mutual funds. At December 31, 2008, the Company had $3.5 million of cash in banks and $106.9 million in one money market mutual fund.
Short-term Investments—The Company considers all investments with remaining time to maturity of one year or less to be short-term investments. At December 31, 2009, the Company’s short-term investments consisted of $17.1 million (par value) of auction rate securities (ARS) recorded within the other current assets category of the Company’s balance sheet. The Company did not have any short-term investments at December 31, 2008.
The Company’s ARS were classified as long-term investments available-for-sale through the Company’s third quarter 2008.
In the fourth quarter 2008, the Company entered into a settlement with UBS related to the ARS, pursuant to which the Company elected to participate in a rights offering that provides it with certain rights (ARS Rights) to sell $18.8 million (par value) of the ARS, back to UBS at par value, at any time during a two-year sale period beginning June 30, 2010. By electing to participate in the settlement and receive the ARS Rights, the Company granted UBS the right, exercisable at any time prior to June 30, 2010 or during the two-year sale period, to purchase or cause the sale of the Company’s ARS.
The Company’s ARS Rights are required to be recognized as a free-standing asset, separate from the Company’s ARS. The Company elected to treat its ARS and ARS Rights as trading securities and to measure the ARS Rights at fair value in order to match the changes in the fair value of the ARS. The Company recorded a loss of $0.7 million related to the ARS Rights and a gain of $1.0 million on the Company’s ARS portfolio related to the change in fair value during 2009. The Company recorded a gain of $1.4 million related to the ARS Rights provided by the settlement and a loss of $2.0 million on the Company’s ARS portfolio during 2008. The ARS Rights and the ARS, which are classified as trading securities, are recorded in current other assets in the accompanying consolidated balance sheet as of December 31, 2009 and recorded in non-current other assets in the accompanying consolidated balance sheet as of December 31, 2008.
The Company does not intend to hold these securities until final maturity because it intends to exercise its rights under the ARS Rights agreement. The ARS and ARS Rights will be revalued to fair market value on a quarterly basis until the sale of these securities has been completed.
Fair Value of Financial Instruments—The Company’s financial instruments include cash and cash equivalents, receivables, accounts payable, debt, ARS and ARS Rights. The types of instruments valued based on unobservable inputs in which there is little or no market data, which require the Company to develop its own assumptions, include the Company’s ARS and related ARS Rights. See Note 9 to the Consolidated Financial Statements for further details on investment and fair value measurements.
The Company has not elected to measure its debt at fair value under the Financial Account Standards Board (FASB) Accounting Standards Codification (ASC) section 825-10-50, Financial Instruments: Disclosure (formerly FASB Staff Position (FSP) No. 107-1 and APB 28-1, Interim Disclosures about Fair Value of Financial Instruments). The estimated fair value of the Company’s debt at December 31, 2009 was $0.4 million compared to the carrying value of $0.2 million. The estimated fair value of the Company’s debt at December 31, 2008 was $3.8 million compared to the carrying amount of $3.2 million included in the consolidated balance sheet. The Company’s estimated fair value of its debt is determined by discounting the future cash flows using a discount rate of approximately 15.0%. This discount rate includes the final interest payment which is required at the end of the loan term. The carrying amounts of our cash and cash equivalents, receivables and accounts payable approximate fair value.
63
Table of Contents
The Company applies a discounted cash flow model approach to value its financial assets and liabilities, which include its ARS and ARS Rights. The discounted cash flow model approach takes into consideration the anticipated coupon rate for the securities, a market-based discount rate, an illiquidity premium and an anticipated workout period, or likely timeframe to redemption or liquidation in the open market. The fair value disclosures required by ASC section 820-10-50, Fair Value Measurements and Disclosures: Disclosure (formerly Statement of Financial Accounting Standards (SFAS) No. 157, Fair Value Measurements (SFAS 157)), are included in Note 9, Investments and Fair Value Measurements.
Property and Equipment—Property and equipment are recorded at historical cost. These costs are depreciated over the estimated useful lives of the individual assets using the straight-line method. Any gains and losses from the disposition of property and equipment are included in operations as incurred. The estimated useful life for switch equipment and tools and test equipment is five years. The estimated useful life for computer equipment, computer software and furniture and fixtures is three years. Leasehold improvements are amortized on a straight-line basis over an estimated useful life of five years or the life of the lease, whichever is less. As discussed in further detail below, the impairment of long-lived assets is periodically evaluated when events or changes in circumstances indicate that a potential impairment has occurred.
Long-lived Assets—The carrying value of long-lived assets, primarily property and equipment, is evaluated whenever events or changes in circumstances indicate that a potential impairment has occurred. A potential impairment has occurred if projected undiscounted cash flows are less than the carrying value of the assets. The estimated cash flows include management’s assumptions of cash inflows and outflows directly resulting from the use of that asset in operations. The impairment test is a two-step process. If the carrying value of the asset exceeds the expected future cash flows from the asset, impairment is indicated. The impairment loss recognized is the excess of the carrying value of the asset over its fair value. Typically, the fair value of the asset is determined by discounting the estimated future cash flows associated with the asset.
In July 2007, the Company decided to invest in new switch equipment, which replaced existing equipment in February 2008 in its New York location. The new equipment provides greater functionality that improves network efficiency and performance. The equipment that was replaced has no further use in the network. The Company completed a test for impairment consistent with the two-step process described above. As a result, there was no impairment of the existing switch equipment in New York, however, the Company accelerated the depreciation on the switch equipment. The new equipment in New York became operational during the first quarter of 2008.
In June 2008, the Company decided to invest in new switch equipment in its Michigan and Ohio locations. The new equipment provides greater functionality that will improve network efficiency and performance. The equipment being replaced has no further use in the network. The Company completed a test for impairment consistent with the two-step process described above. As a result, the Company recorded a charge of approximately $0.2 million related to the combined asset impairment and accelerated the depreciation on the switch equipment. In both markets, the new equipment was installed and became operational in the fourth quarter 2008. There were no adjustments to the carrying value of long-lived assets during the year ended December 31, 2009.
Freestanding Convertible Preferred Stock Warrants—In accordance with the terms of the credit facility, The Company issued warrants to the note holders to purchase shares of its preferred stock. In 2004, the Company issued 200,000 warrants, 92,812 warrants and 21,885 warrants with an exercise price of $1.00, $1.48 and $6.28 each, respectively. In 2006, the Company issued 87,539 warrants with an exercise price of $6.28 each. The warrants were exercisable at any time up to eight years after their issuance. On February 21, 2008 the note holders elected to exercise all of the outstanding warrants. Pursuant to the terms of the warrants the note holders elected to exercise the warrants on a net basis based upon the average closing price of the Company’s common stock during the three days prior to such exercise. Based upon the closing prices of the Company’s common stock on February 20, 2008, February 19, 2008 and February 15, 2008 the Company issued a total of 356,921 shares of common stock on February 25, 2008 in full satisfaction of all outstanding warrants.
64
Table of Contents
Upon the closing of the Company’s initial public offering (IPO) in November 2007, warrants to purchase shares of the Company’s convertible preferred stock became warrants to purchase shares of the Company’s common stock. At November 2007, the aggregate fair value of these warrants of $6.9 million was reclassified from current liabilities to warrants, a component of stockholders’ equity, and the Company has ceased to record any further periodic fair value adjustments.
In 2007 (through the completion of its IPO) and 2006, the Company recorded $4.9 million and $0.8 million, respectively, of expense reflected in change in fair value of warrants, a component of other (income) expense, net to reflect the increase in fair value during the period.
Revenue Recognition—The Company generates revenue from sales of its tandem interconnection services. The Company maintains executed service agreements with each of its customers in which specific fees and rates are determined. Revenue is recorded each month based upon documented minutes of traffic switched for which service is provided and when collection is probable. The Company provides service primarily to large, well-established competitive carriers, including wireless, wireline and cable and broadband telephony.
Earnings Per Share—Basic earnings per share is computed based on the weighted average number of common shares outstanding. Diluted earnings per share is computed based on the weighted average number of common shares outstanding adjusted by the number of additional shares that would have been outstanding during the period had the potentially dilutive common shares been issued. Potentially dilutive shares of common stock include stock options, non-vested shares, convertible warrants, Series A Convertible Preferred Stock, Series B-1 Convertible Preferred Stock, Series B-2 Convertible Preferred Stock and Series C Convertible Preferred Stock. During periods in which a net loss is incurred, diluted earnings per share amounts are the same as the basic per share amounts because the effect of all options, non-vested shares, convertible warrants, Series A Convertible Preferred Stock, Series B-1 Convertible Preferred Stock, Series B-2 Convertible Preferred Stock and Series C Convertible Preferred Stock is anti-dilutive. The following table presents a reconciliation of the numerators and denominators of basic and diluted earnings per common share:
| Years Ended December 31, | |||||||||
| (In thousands, except per share amounts) | 2009 | 2008 | 2007 | ||||||
| Numerator: |
|||||||||
| Net income applicable to common stockholders |
$ | 41,315 | $ | 24,020 | $ | 6,258 | |||
| Denominator: |
|||||||||
| Weighted average common shares outstanding |
33,156 | 31,790 | 9,248 | ||||||
| Effect of dilutive securities: |
|||||||||
| Stock options |
756 | 1,392 | 1,567 | ||||||
| Non-vested shares |
— | — | — | ||||||
| Warrants |
— | 54 | 275 | ||||||
| Series A Preferred Stock |
— | — | 7,644 | ||||||
| Series B-1 Preferred Stock |
— | — | 4,873 | ||||||
| Series B-2 Preferred Stock |
— | — | 1,149 | ||||||
| Series C Preferred Stock |
— | — | 1,622 | ||||||
| Denominator for diluted earnings per share |
33,912 | 33,236 | 26,378 | ||||||
| Net earnings per share: |
|||||||||
| Basic—as reported |
$ | 1.25 | $ | 0.76 | $ | 0.68 | |||
| Diluted—as reported |
$ | 1.22 | $ | 0.72 | $ | 0.24 | |||
Options to purchase 1,408,000, 1,551,500 and 93,000 shares of common stock were outstanding during the year ended December 31, 2009, 2008 and 2007, respectively, but were not included in the computation of diluted earnings per share because the effect would have been anti-dilutive.
65
Table of Contents
355,660 non-vested shares of common stock were issued and outstanding at December 31, 2009, but were not included in the computation of diluted earnings per share because the effect would have been anti-dilutive.
Comprehensive Income—Comprehensive income includes all changes in equity during a period from non-owner sources. Comprehensive income was the same as net income for the years ended December 31, 2009, 2008 and 2007.
Accounting for Stock-Based Compensation—The fair value of stock options is determined using the Black-Scholes valuation model. This model takes into account the exercise price of the stock option, the fair value of the common stock underlying the stock option as measured on the date of grant and an estimation of the volatility of the common stock underlying the stock option. Such value is recognized as expense over the service period, net of estimated forfeitures, using the straight-line method. The estimation of stock awards that will ultimately vest requires judgment, and to the extent actual results or updated estimates differ from the Company’s current estimates, such amounts will be recorded as a cumulative adjustment in the period estimates are revised. The Company considers many factors when estimating expected forfeitures, including types of awards, employee class, and historical experience. Actual results, and future changes in estimates, may differ from the Company’s current estimates.
The amount of share-based expense recorded in the years ended December 31, 2009, 2008 and 2007, is $5.7 million, $3.1 million, and $0.9 million, respectively.
Compensation expense for non-vested shares is measure based upon the quoted closing market price for the stock on the date of grant. The compensation cost is recognized on a straight-line basis over the vesting period. See Note 11, “Stock Options and Non-vested Shares”.
Income Taxes—Deferred income tax assets and liabilities are recognized for future income tax consequences attributable to temporary differences between the financial statement carrying amounts of existing assets and liabilities and their respective income tax bases and for net operating loss and tax credit carryforwards. Deferred income tax assets and liabilities are measured using enacted tax rates expected to apply to taxable income in the years in which those temporary differences are expected to be recovered or settled. The effect on deferred income tax assets and liabilities of a change in income tax rates is recorded in earnings in the period of enactment. A valuation allowance is provided for deferred income tax assets whenever it is more likely than not that future tax benefits will not be realized. Deferred income tax assets are reviewed on a quarterly basis to determine if a valuation allowance is necessary based on current and historical performance, along with other relevant factors.
Income tax provision includes U.S. federal, state, and local income taxes and is based on pre-tax income or loss.
Concentrations—For the years ended 2009, 2008 and 2007, the aggregate revenues of four customers accounted for 57%, 56% and 54% of total revenues, respectively. At December 31, 2009 and 2008, the aggregate accounts receivable of four customers accounted for 50% and 53% of the Company’s total trade accounts receivable, respectively.
In 2009, the Company had three customers in excess of ten percent of sales, which were 23%, 14% and 13% of the Company’s total revenue, respectively. At December 31, 2009, the Company had two customers who accounted for 18% and 15% of the Company’s accounts receivable balance, respectively.
In 2008, the Company had two customers in excess of ten percent of sales, which were 25% and 15% of the Company’s total revenue, respectively. At December 31, 2008, the Company had three customers who accounted for 20%, 14% and 11% of the Company’s accounts receivable balance, respectively.
66
Table of Contents
In 2007, the Company had two customers in excess of ten percent of sales, which were 26% and 14% of the Company’s total revenue, respectively. At December 31, 2007, the Company had three customers who accounted for 22%, 14% and 11% of the Company’s accounts receivable balance, respectively.
At December 31, 2009, the Company had $161.4 million in cash and cash equivalents. Of this amount, approximately $157.4 million was invested in two money market funds. Investment policies have been implemented that limit investments to highly liquid investments with an original maturity of 90 days or less.
Recent Accounting Pronouncements—In June 2009, the FASB issued ASC No. 105, Generally Accepted Accounting Principles (ASC 105 or FASB Codification) (formerly Statement of Financial Accounting Standards (SFAS) No. 168, The FASB Accounting Standards Codification and the Hierarchy of Generally Accepted Accounting Principles—a replacement of FASB Statement No 162 (SFAS 168)). The effective date for use of the FASB Codification is for interim and annual periods ending after September 15, 2009. Companies should account for the adoption of the guidance on a prospective basis. Effective July 1, 2009, the Company adopted the FASB Codification and its adoption did not have a material impact on its condensed consolidated financial statements. The Company has appropriately updated its disclosures with the appropriate FASB Codification references during the year ended December 31, 2009. As such, all the notes to the condensed consolidated financial statements below as well as the critical accounting policies in the Management’s Discussion and Analysis section have been updated with the appropriate FASB Codification references.
In April 2009, the FASB issued No. 820-10-35, Fair Value Measurements and Disclosures—Subsequent Measurement (ASC 820-10-35) (formerly FSP SFAS 157-4, Determining Fair Value When the Volume and Level of Activity for the Asset or Liability Have Significantly Decreased and Identifying Transactions That Are Not Orderly), which provides additional guidance on estimating fair value when the volume and level of activity for the asset or liability have significantly decreased. ASC 820-10-35 provides additional guidance on estimating fair value when the volume and level of activity for an asset or liability have significantly decreased in relation to normal market activity for the asset or liability. ASC 820-10-35 also provides additional guidance on circumstances that may indicate that a transaction is not orderly. The above provision is effective for interim and annual periods ending after June 15, 2009. The Company adopted the provisions relating to determining the fair value when the volume and level of activity for the asset or liability have significantly decreased and identifying transactions that are not orderly under ASC 820-10-35 during the second quarter of 2009, and its application had no impact on the Company’s consolidated financial statements.
In May 2009, the FASB issued ASC No. 855, Subsequent Events (ASC 855) (formerly SFAS No. 165, Subsequent Events). ASC 855 establishes general standards of accounting for and disclosure of events that occur after the balance sheet date but before the financial statements are issued or are available to be issued. Although the standard is based on the same principles as those that currently exist in the auditing standards, it includes a new required disclosure of the date through which an entity has evaluated subsequent events. The Company adopted this standard effective April 1, 2009 and the Company’s adoption did not have a material impact on its consolidated financial statements. The company evaluated subsequent events through the date the accompanying financial statements were issued, which was February 19, 2010.
67
Table of Contents
| 3. | PROPERTY AND EQUIPMENT |
Property and equipment as of December 31, 2009 and 2008 consists of the following:
| (Dollars in thousands) | December 31, 2009 |
December 31, 2008 |
||||||
| Switch equipment |
$ | 68,190 | $ | 58,579 | ||||
| Computer software |
1,608 | 1,469 | ||||||
| Computer equipment |
1,994 | 1,727 | ||||||
| Tools and test equipment |
583 | 471 | ||||||
| Furniture and fixtures |
398 | 348 | ||||||
| Leasehold improvements |
4,793 | 3,138 | ||||||
| 77,566 | 65,732 | |||||||
| Less accumulated depreciation |
(31,775 | ) | (25,083 | ) | ||||
| 45,791 | 40,649 | |||||||
| Construction in process |
3,888 | 4,617 | ||||||
| Property and equipment-net |
$ | 49,679 | $ | 45,266 | ||||
| 4. | RECEIVABLES |
Receivables as of December 31, 2009 and 2008 consist of the following:
| (Dollars in thousands) | December 31, 2009 |
December 31, 2008 | ||||
| Billed receivables |
$ | 19,852 | $ | 13,724 | ||
| Unbilled receivables |
2,608 | 2,549 | ||||
| Other receivables |
2,376 | 512 | ||||
| 24,836 | 16,785 | |||||
| Less allowance for doubtful accounts |
— | — | ||||
| Receivables—net of allowance for doubtful accounts |
$ | 24,836 | $ | 16,785 | ||
The Company primarily invoices customers for services occurring through the 24th of each month. The Company accrues revenue each month for services from the 25th through the end of the month resulting in unbilled receivables. The unbilled receivables at the end of each month are billed as part of the following month’s billing cycle.
At December 31, 2009, other receivables include $2.3 million of state and federal income tax prepayments. At December 31, 2008, other receivables include $0.3 million of state income tax prepayments.
| 5. | DEBT |
In May 2004, the Company entered into an equipment loan and security agreement with an affiliate of Western Technology Investment (WTI) that provided for borrowings of up to $4.0 million for the Company’s capital purchases through July 31, 2004. The agreement was amended in December 2004 to allow for an additional $5.5 million of borrowings and amended in January 2006 to allow for $10.0 million of additional borrowings for an aggregate of $19.5 million.
Under the terms of its debt agreement, the Company must comply with certain negative covenants that limit our ability to declare or pay dividends, incur additional indebtedness, incur liens, dispose of significant assets, make acquisitions or significantly change the nature of its business without the permission of the lender. For the periods ended December 31, 2009, 2008 and 2007, the Company was in compliance with all the covenants under its debt agreements.
68
Table of Contents
The Company uses cash collateralized letters of credit issued by Bank of America, N.A. to secure certain facility leases and other obligations. At December 31, 2009 there was $440,000 of restricted cash used as collateral for $336,000 in letters of credit outstanding.
Long-term debt is summarized as follows:
| (Dollars in thousands) | December 31, 2009 |
December 31, 2008 |
||||||
| Secured term loan, interest payable at 9.0%. Principal repaid in 36 equal installments commencing August 1, 2006. A final payment of 9.6% of the borrowed amount is required in July 2009 |
— | 536 | ||||||
| Secured term loan, interest payable at 9.25%. Principal repaid in 36 equal installments commencing October 1, 2006. A final payment of 9.6% of the borrowed amount is required in September 2009 |
— | 686 | ||||||
| Secured term loan, interest payable at 9.5%. Principal repaid in 36 equal installments commencing January 1, 2007. A final payment of 9.6% of the borrowed amount is required in December 2009 |
— | 906 | ||||||
| Secured term loan, interest payable at 9.5%. Principal repaid in 36 equal installments commencing April 1, 2007. A final payment of 9.6% of the borrowed amount is required in March 2010 |
235 | 1,120 | ||||||
| Less—discount on debt associated with the issuance of warrants |
— | (52 | ) | |||||
| Total long-term debt |
235 | 3,196 | ||||||
| Less—current installments |
(235 | ) | (2,961 | ) | ||||
| Long-term debt—excluding current installments |
$ | — | $ | 235 | ||||
| 6. | 401(k) SAVINGS PLAN |
The Company sponsors a 401(k) plan covering substantially all employees. The plan is a defined contribution savings plan in which employees may contribute up to 87% of their salary, subject to certain limitations. The Company may elect to make discretionary contributions into the Plan. The Company contributed $0.4 million, $0.3 million and $0.1 million to this plan during the year ended December 31, 2009, December 31, 2008 and December 31, 2007, respectively.
| 7. | COMMON STOCK |
The Company’s total authorized capital stock consists of 150,000,000 shares of common stock, par value $0.001 per share.
Voting—Each holder of common stock has one vote in respect to each share of stock held on record for the election of directors and on all matters submitted to a vote of shareholders of the Company.
Dividends—Subject to the preferential rights of any outstanding preferred stock, the holders of shares of common stock are entitled to receive, when and if declared by the Board of Directors, out of assets of the Company which are by law available therefore, dividends payable either in cash, in property or in shares of capital stock.
Liquidation—In the event of any liquidation, dissolution or winding up of the Company, after distribution in full of the preferential amounts, if any, to be distributed to the holders of shares of any outstanding preferred stock, holders of all common stock shares, including converted preferred stock, are entitled to receive all of the remaining assets of the Company of whatever kind available for distribution to shareholders ratably in proportion to the number of shares of common stock held by them respectively.
69
Table of Contents
| 8. | COMMITMENTS AND CONTINGENCIES |
Operating Leases—The Company leases its facilities and certain equipment under operating leases which expire through February 2025. Rental expense for the years ended December 2009, 2008 and 2007 was $4.3 million, $4.0 million, and $3.2 million, respectively.
The following table represents future lease payments under the operating leases having lease terms in excess of one year:
| (Dollars in thousands) | December 31, 2009 | ||
| 2010 |
$ | 4,571 | |
| 2011 |
4,252 | ||
| 2012 |
2,930 | ||
| 2013 |
2,677 | ||
| 2014 |
2,304 | ||
| Thereafter |
4,461 | ||
| Total |
$ | 21,195 | |
Purchase Commitment—We have a service agreement with one of our major transport providers, where we have committed to purchase a minimum of service through 2011. We purchased the minimum amount of service in 2009 in the ordinary course of business. There was no purchase commitment as of December 31, 2008 and December 31, 2007.
Legal Proceedings—From time to time, the Company is a party to legal or regulatory proceedings arising in the normal course of its business. Aside from the matters discussed below, management does not believe that the Company is party to any pending legal action that could reasonably be expected to have a material adverse effect on its business or operating results.
Peerless Network, LLC. On June 12, 2008, the Company commenced a patent infringement action against Peerless Network, LLC, Peerless Network of Illinois, LLC and John Barnicle in the United States District Court for the Northern District of Illinois to enforce U.S. Patent No. 7,123,708 (Neutral Tandem, Inc. v Peerless Network, LLC, Peerless Network of Illinois, LLC and John Barnicle, 08 CV 3402). On July 28, 2008, the defendants filed a response to the Company’s complaint denying liability and asserting various affirmative defenses and counterclaims. The defendants generally allege (i) that the Company’s patent is invalid and unenforceable under a variety of theories, (ii) that assertion of the patent amounts to patent misuse and violation of certain monopolization laws, and (iii) that certain conduct surrounding the litigation gave rise to tortious interference and business disparagement claims and Lanham Act violations. On December 4, 2008, the United States District Court for the Northern District of Illinois granted the Company’s motion to dismiss the claims alleging business disparagement and Lanham Act violations but denied the Company’s motion to dismiss the claims related to the alleged violation of certain monopolization laws. On November 30, 2009 and December 1, 2009, the court heard the Company’s motion dated August 25, 2009 for preliminary injunctive relief seeking to enjoin Peerless Network, LLC and Peerless Network of Illinois, LLC from providing certain tandem transit services. The court has not yet ruled on the request for injunctive relief and is not required to do so by any specific date. On January 27, 2010, the court issued an order construing each of the disputed terms in the patent in the manner the Company had proposed. The full trial in this action is currently scheduled to be held in the fall of 2010. The parties are currently completing discovery on the Company’s claims and the defendants’ remaining counterclaims. The Company believes that the defendants’ remaining allegations have no merit and intends to vigorously defend itself against these remaining counterclaims.
On January 28, 2010, Peerless Network filed a request with the United States Patent and Trademark Office (“USPTO”) requesting that the USPTO reexamine the patent at issue. The USPTO has not yet ruled on Peerless
70
Table of Contents
Network’s request, although the PTO typically accepts reexamination requests. If the USPTO grants Peerless Network’s request, the reexamination proceeding could result in the USPTO determining that some or all of the claims in the reexamined patent remain patentable over the prior art without requiring any amendment, that some or all of the claims must be amended to distinguish over the prior art, or that some or all of the claims are not patentable over the prior art.
| 9. | INVESTMENTS AND FAIR VALUE MEASUREMENTS |
Investments
The following is a summary of investments as of December 31, 2009 and December 31, 2008 (in thousands):
| December 31, 2009 | |||||||||||||
| Amortized Cost |
Gross Unrealized Gains |
Gross Unrealized Losses |
Estimated Fair Value | ||||||||||
| ARS—trading securities |
$ | 17,125 | $ | — | $ | (923 | ) | $ | 16,202 | ||||
| ARS rights |
$ | — | $ | 712 | $ | — | $ | 712 | |||||
| December 31, 2008 | |||||||||||||
| Amortized Cost |
Gross Unrealized Gains |
Gross Unrealized Losses |
Estimated Fair Value | ||||||||||
| ARS—trading securities |
$ | 18,825 | $ | — | $ | (1,957 | ) | $ | 16,868 | ||||
| ARS rights |
$ | — | $ | 1,376 | $ | — | $ | 1,376 | |||||
The following is a summary of the carrying values and balance sheet classification as of December 31, 2009 and December 31, 2008:
| December 31, 2009 |
December 31, 2008 | |||||
| (In thousands) | ||||||
| Cash in banks |
$ | 3,978 | $ | 3,547 | ||
| Money market |
157,433 | 106,867 | ||||
| ARS—trading securities |
16,202 | 16,868 | ||||
| ARS rights |
712 | 1,376 | ||||
| Restricted cash |
440 | 440 | ||||
| Total |
$ | 178,765 | $ | 129,098 | ||
| Reported as: |
||||||
| Cash and cash equivalents |
$ | 161,411 | $ | 110,414 | ||
| Other current assets |
16,914 | — | ||||
| Non-current other assets |
— | 18,244 | ||||
| Non-current restricted cash |
440 | 440 | ||||
| Total |
$ | 178,765 | $ | 129,098 | ||
At December 31, 2009 and December 31, 2008, the Company held approximately $17.1 million (par value) and $18.8 million (par value), respectively, of auction rate securities investments in municipal notes. These investments were reclassified to trading securities from available-for-sale securities in the fourth quarter of 2008. Accordingly, they were valued at fair value as of December 31, 2009 and December 31, 2008. The Company’s auction rate securities had an auction reset feature whose underlying assets are generally student loans which are
71
Table of Contents
insured in part by the federal government under the Federal Family Education Loan Programs (FFELP). In February 2008, auctions began to fail for these securities and each auction since then has failed. The Company has since been able to liquidate $8.0 million of the securities at par value through issuer redemptions.
The ARS securities were valued using a discounted cash flow model that takes into consideration the following factors among others:
| • | The anticipated coupon rate for the securities |
| • | a market-based discount rate |
| • | an illiquidity premium |
| • | an anticipated workout period, or the likely timeframe to redemption or liquidation in the open market |
In the fourth quarter 2008, the Company entered into a settlement with UBS related to the ARS, pursuant to which the Company elected to participate in a rights offering that provides it with certain rights (ARS Rights) to sell $18.8 million (par value) of the ARS, back to UBS at par value, at any time during a two-year sale period beginning June 30, 2010. By electing to participate in the settlement and receive the ARS Rights, the Company granted UBS the right, exercisable at any time prior to June 30, 2010 or during the two-year sale period, to purchase or cause the sale of the Company’s ARS. The ARS Rights have value in that they provide the Company with the ability to limit the length of the workout period to 18 months from the date of agreement, absent redemptions by the issuer or liquidation in the open market. The ARS Rights were valued by analyzing the value of the underlying ARS on a stand-alone basis compared to their value along with the ARS Rights. The additional value of the ARS with the ARS Rights over the calculated value of the ARS on a stand-alone basis represents the value of the ARS Rights.
The Company’s ARS Rights are required to be recognized as a free-standing asset, separate from the Company’s ARS. The Company elected to treat its ARS and related ARS Rights as trading securities and to measure the ARS Rights at fair value in order to match the changes in the fair value of the ARS. The Company recorded a loss of $0.7 million related to the ARS Rights and a gain of $1.0 million on the Company’s ARS portfolio related to the change in fair value during 2009. The Company recorded a gain of $1.4 million related to the ARS Rights provided by the settlement and a loss of $2.0 million on the Company’s ARS portfolio during 2008. The ARS Rights and the ARS, which are classified as trading securities, are recorded in current other assets in the accompanying consolidated balance sheet as of December 31, 2009 and recorded in non-current other assets in the accompanying consolidated balance sheet as of December 31, 2008.
The Company does not intend to hold these securities until final maturity in accordance with the ARS Rights which allow the Company to sell its ARS back to UBS beginning June 30, 2010, which is consistent with the Company’s investment intent. The ARS and ARS Rights will be revalued to fair market value on a quarterly basis until the sale of these securities has been completed.
Fair Value Measurement
ASC section 820-10-30, Fair Value Measurements and Disclosures: Initial Measurement (formerly SFAS No. 157), notes that fair value is an exit price, representing the amount that would be received to sell an asset or paid to transfer a liability in an orderly transaction between market participants. As such, fair value is a market-based measurement that should be determined based on assumptions that market participants would use in pricing an asset or liability. As a basis for considering such assumptions, ACS section 820-10-35 establishes a three-tier value hierarchy, which prioritizes the inputs used in measuring fair value as follows: (Level I) observable inputs such as quoted prices in active markets; (Level II) inputs other than the quoted prices in active markets that are observable either directly or indirectly; and (Level III) unobservable inputs in which there is little or no market data, which requires the Company to develop its own assumptions. This hierarchy requires the Company to use observable market data, when available, and to minimize the use of unobservable inputs when determining fair value. On a recurring basis, the Company measures its ARS and ARS Rights at fair value.
72
Table of Contents
The Company’s ARS and ARS Rights are valued based on unobservable inputs in which there is little or no market data. As a result of auction failures related to the auction rate securities during the years 2009 and 2008, market inputs were not available as of December 31, 2009 and December 31, 2008. A discounted cash flow model has therefore been used to determine the estimated fair value of the Company’s investment in ARS as of December 31, 2009 and December 31, 2008. The assumptions used in preparing the discounted cash flow model include estimates for interest rates, discount rates and timing and amounts of cash flows, including assumptions about the expected holding periods of these securities. Such instruments are generally classified as Level III in the fair value hierarchy.
The Company’s ARS Rights were valued by determining the value of the underlying auction rate securities on a stand-alone basis compared to their value along with the ARS Rights. The Company utilized the same factors that were used to value its investment in ARS.
The Company does not have liabilities to measure at fair value on a recurring basis. The following table summarizes the Company’s assets that are measured at fair value on a recurring basis:
| December 31, 2009 | ||||||||||||
| Level I | Level II | Level III | Total | |||||||||
| (In thousands) | ||||||||||||
| ARS—Trading securities |
$ | — | $ | — | $ | 16,202 | $ | 16,202 | ||||
| ARS Rights |
— | — | 712 | 712 | ||||||||
| Total assets measured at fair value |
$ | — | $ | — | $ | 16,914 | $ | 16,914 | ||||
Unrealized gains and losses associated with Level III financial instruments were recorded in the Company’s statement of operations as other (income) expense. The unrealized gain associated with ARS-trading securities was approximately $1.0 million for the year ended December 31, 2009 and the unrealized loss was approximately $2.0 million for the year ended December 31, 2008. The unrealized loss associated with the ARS Rights was approximately $0.7 million for the year ended December 31, 2009 and the unrealized gain was approximately $1.4 million for the year-ended December 31, 2008
The following table summarizes the change in balance sheet carrying value associated with Level III financial instruments carried at fair value during the years ended December 31, 2009 and December 31, 2009 (in thousands):
| December 31, 2008 |
Payment, Purchases (Sales), Net |
Transfers In (Out), Net |
Gains (Losses) | December 31, 2009 | ||||||||||||||||
| Realized | Unrealized | |||||||||||||||||||
| ARS—Trading securities |
$ | 16,868 | $ | (1,700 | ) | $ | — | $ | — | $ | 1,034 | $ | 16,202 | |||||||
| ARS Rights |
1,376 | — | — | — | (664 | ) | 712 | |||||||||||||
| Total |
$ | 18,244 | $ | (1,700 | ) | $ | — | $ | — | $ | 370 | $ | 16,914 | |||||||
73
Table of Contents
| 10. | INCOME TAXES |
Deferred income taxes reflect the net tax effects of temporary differences between the carrying amount of assets and liabilities for financial reporting purposes and the amounts used for income tax purposes and of net operating loss carryforwards. Significant components of the Company’s deferred income taxes are as follows:
| (Dollars in thousands) |
December 31, 2009 |
December 31, 2008 |
||||||
| Deferred tax assets and liabilities |
||||||||
| Deferred tax assets: |
||||||||
| Stock option compensation |
$ | 2,731 | $ | 1,462 | ||||
| State credit carry forward |
2,168 | 1,317 | ||||||
| Accrued direct costs |
649 | 831 | ||||||
| Accrued rent |
423 | 478 | ||||||
| Accrued fees |
20 | 127 | ||||||
| Accrued other |
68 | 161 | ||||||
| State bonus depreciation |
414 | 221 | ||||||
| Auction rate securities unrealized loss |
364 | 791 | ||||||
| Total deferred tax assets |
6,837 | 5,388 | ||||||
| Deferred tax liabilities: |
||||||||
| Depreciation |
(8,509 | ) | (6,243 | ) | ||||
| Prepaids |
(711 | ) | (590 | ) | ||||
| Auction rate securities rights agreement |
(281 | ) | (556 | ) | ||||
| Federal effect of state deferreds |
(693 | ) | (305 | ) | ||||
| Total deferred tax liabilities |
(10,194 | ) | (7,694 | ) | ||||
| Net deferred income tax liabilities |
$ | (3,357 | ) | $ | (2,306 | ) | ||
The components of the Company’s income tax provision for the years ended December 31, 2009, 2008 and 2007 are as follows:
| December 31, | |||||||||
| (Dollars in thousands) | 2009 | 2008 | 2007 | ||||||
| Deferred provision |
$ | 1,051 | $ | 2,453 | $ | 526 | |||
| Current provision |
|||||||||
| Federal |
20,144 | 9,365 | 5,181 | ||||||
| State |
2,333 | 976 | 497 | ||||||
| $ | 23,528 | $ | 12,794 | $ | 6,204 | ||||
A reconciliation of the federal statutory rate to our effective tax rate is as follows:
| December 31, | |||||||||
| 2009 | 2008 | 2007 | |||||||
| Statutory federal rate |
35 | % | 35.0 | % | 34.0 | % | |||
| State income tax, net of federal benefit |
2.8 | % | 3.3 | % | 4.9 | % | |||
| Illinois State EDGE Credit, net of federal benefit |
(1.0 | )% | (1.4 | )% | (1.6 | )% | |||
| Change in fair value of warrants |
— | % | — | % | 13.4 | % | |||
| Tax exempt interest, benefit |
(0.4 | )% | (2.2 | )% | (1.4 | )% | |||
| Other |
(0.1 | )% | 0.1 | % | 0.5 | % | |||
| Effective tax rate |
36.3 | % | 34.8 | % | 49.8 | % | |||
74
Table of Contents
Income taxes were computed using an effective tax rate. The Company’s estimated effective income tax rate was 36.3% for the year ended December 31, 2009, compared to 34.8% for the same period last year. The increase in the tax rate was primarily due to less tax exempt interest benefit.
The Company files income tax returns in the U.S. federal jurisdiction, and various states and local jurisdictions. With a few exceptions, the Company is no longer subject to U.S. federal, state or local examinations for years before 2006. The State of Illinois commenced an examination of Illinois state income tax returns the Company filed for the years 2006 and 2007. The Company anticipates the audit to be completed during the first quarter with no significant changes. At December 31, 2008 and December 31, 2009, the Company did not have any income tax liability due to uncertain tax positions.
The Company’s State income tax credit carry forward, primarily the Illinois EDGE credit, can be carried forward 5 years and will begin to expire in 2010. The company has not recorded a valuation allowance against the credit as the Company believes it is more likely than not that future taxable income will be sufficient to realize the full benefit of the credit.
| 11. | STOCK OPTIONS AND NON-VESTED SHARES |
The Company established the 2003 Stock Option and Stock Incentive Plan (2003 Plan), which provided for issuance of up to 4,650,000 options and non-vested shares to eligible employees, officers, and independent contractors of the Company. In 2007 the Company adopted the Neutral Tandem, Inc. 2007 Long-Term Equity Incentive Plan (2007 Plan) and ceased awarding equity grants under the 2003 plan. As of December 31, 2009, the Company had granted a total of 886,903 options that remained outstanding under the 2003 Plan.
At December 31, 2009, the Company had granted a total of 2,252,500 options that remained outstanding under the 2007 Plan. During 2009, the Company cancelled 49,250 options related to the 2007 Plan. Option awards for 1,136,511 shares, representing approximately 3.4% of the Company’s outstanding common stock as of December 31, 2009, remained available for additional grants under the 2007 Plan.
The Company currently records stock-based compensation expense in connection with any grant of options and non-vested shares to its employees and independent contractors. The Company records stock-based compensation expense associated with its stock option and non-vested share grants. The Company calculates the expense associated with its stock options and non-vested shares by determining the fair value of the options and non-vested shares.
The amount of share-based expense recorded in the years ended December 31, 2009, 2008 and 2007, is $5.7 million, $3.1 million, and $0.9 million, respectively. The related tax benefit for the years ended December 31, 2009, 2008 and 2007, is $2.1 million, $1.1 million, and $0.4 million, respectively.
75
Table of Contents
All options granted under the 2003 Plan and the 2007 Plan have an exercise price equal to the market value of the underlying common stock on the date of the grant. The options typically vest annually over a four-year period with a life of 10 years. The following table shows the exercise price of one share of the Company’s common stock on each stock option grant date during the years ended December 31, 2008 and the December 31, 2009:
| Grant Date |
Number of Stock Options Issued |
Weighted average Exercise Price of One Share of Common Stock | |||
| First Quarter 2008 |
9,000 | $ | 19.11 | ||
| Second Quarter 2008 |
1,360,000 | $ | 17.91 | ||
| Third Quarter 2008 |
109,000 | $ | 18.23 | ||
| Fourth Quarter 2008 |
62,000 | $ | 16.87 | ||
| First Quarter 2009 |
23,000 | $ | 19.50 | ||
| Second Quarter 2009 |
13,000 | $ | 28.90 | ||
| Third Quarter 2009 |
812,000 | $ | 26.06 | ||
| Fourth Quarter 2009 |
34,000 | $ | 23.17 | ||
| Total |
2,422,000 | ||||
The fair value of each option granted is estimated on the date of grant using the Black- Scholes option-pricing model for the years ended December 31, 2009, 2008 and 2007 with the following assumptions:
| December 31, 2009 |
December 31, 2008 |
December 31, 2007 | ||||
| Expected life |
6.3 – 7.15 years | 6.3 – 6.5 years | 7.7 – 10.0 years | |||
| Risk-free interest rate range |
2.1% – 3.3% | 2.4% – 3.8% | 3.8% – 4.9% | |||
| Expected dividends |
— | — | — | |||
| Volatility |
53.3% – 55.6% | 41.9% –50.8% | 39.6% – 40.1% |
The Company utilized the simple average volatility of three telecommunication companies that share similar business characteristics for estimating the fair value of options granted through December 31, 2008. The simple average volatility of the three companies selected ranged from 39.6% at the beginning of 2007 to 50.8% at December 31, 2008. The Company calculated the volatility of its own stock for the period between November 2, 2007 and December 31, 2008 and found that it was not materially different than the results of the three company average. As of January 1, 2009, the Company calculated and utilized its own volatility for estimated the fair value of options during 2009.
Beginning in November 2007, the Company elected to use the simplified method to estimate the expected term for valuation of stock options, as permitted by the Securities and Exchange Commission (SEC) under ASC 718-10, Compensation – Stock Compensation (formerly SEC Staff Accounting Bulletin 107), due to the unknown effect on option holder behavior of the increased liquidity of the underlying options following the Company’s IPO. The Company used the simplified method in 2008 and the first quarter of 2009. During the second quarter of 2009, the Company determined that sufficient historical data exists regarding the actual term that employees hold their options and began to utilize its own expected term.
The weighted-average fair value of options granted, as determined by using the Black-Scholes valuation model, during the period was $14.41, $8.48 and $3.88 for the years ended December 31, 2009, 2008 and 2007, respectively. The total grant date fair value of options that vested during years ended December 31, 2009, 2008 and 2007 was approximately $5.1 million, $1.0 million and $1.0 million, respectively.
76
Table of Contents
The following summarizes activity under the Company’s stock option plan:
| Shares (000) |
Weighted- Average Exercise Price |
Aggregate Intrinsic Value ($000) |
Weighted- Average Remaining Term (yrs) | ||||||||
| Options outstanding—December 31, 2007 |
3,328 | $ | 1.98 | ||||||||
| Granted |
1,540 | 17.90 | |||||||||
| Exercised |
(1,184 | ) | 1.06 | ||||||||
| Cancelled |
(81 | ) | 4.13 | ||||||||
| Options outstanding—December 31, 2008 |
3,603 | $ | 9.03 | ||||||||
| Granted |
882 | 25.81 | |||||||||
| Exercised |
(1,271 | ) | 3.50 | ||||||||
| Cancelled |
(75 | ) | 13.62 | ||||||||
| Options outstanding—December 31, 2009 |
3,139 | $ | 15.87 | $ | 24,421 | 8.19 | |||||
| Vested or expected to vest-December 31, 2009 |
2,963 | $ | 15.87 | $ | 23,053 | 8.19 | |||||
| Exercisable-December 31, 2009 |
902 | $ | 8.96 | $ | 12,466 | 7.17 | |||||
The estimation of stock awards that will ultimately vest requires judgment, and to the extent actual results or updated estimates differ from the Company’s current estimates, such amounts will be recorded as a cumulative adjustment in the period estimates are revised. The Company considers many factors when estimating expected forfeitures, including types of awards, employee class, and historical experience. Actual results, and future changes in estimates, may differ from current estimates. In 2009, the Company’s forfeiture rate was 5.6%
The unrecognized compensation cost associated with options outstanding at December 31, 2009 and 2008 is $19.0 million and $12.5 million, respectively. The weighted average remaining term that the compensation will be recorded is 3.0 years and 2.8 years as of December 31, 2009 and 2008, respectively.
Non-vested Shares
During 2009, the Company’s Board of Directors granted approximately 0.4 million non-vested shares to members of the Company’s executive management team as well as various employees within the Company. The non-vested shares were issued as part of the 2007 Plan. The shares typically vest over a four-year period. The fair value of the non-vested shares is determined using the Company’s closing stock price on the grant date. Compensation cost, measured using the grant date fair value, is recognized over the requisite service period on a straight-line basis.
A summary of the Company’s non-vested share activity and related information for the year ended December 31, 2009 is as follows:
| Shares (000) |
Weighted- Average Exercise Price |
Aggregate Intrinsic Value ($000) | ||||||
| Non-vested at January 1, 2009 |
— | $ | — | $ | — | |||
| Granted |
356 | $ | 25.65 | $ | 9,131 | |||
| Non-vested at December 31, 2009 |
356 | $ | 25.65 | $ | 9,131 | |||
The unrecognized compensation cost associated with non-vested shares at December 31, 2009 is $8.4 million. The weighted average remaining term that the compensation will be recorded is 3.7 years.
77
Table of Contents
| 12. | SEGMENT AND GEOGRAPHIC INFORMATION |
ASC 280, Segment Reporting (formerly SFAS No. 131, Disclosures about Segments of an Enterprise and Related Information), establishes standards for reporting information about operating segments. Operating segments are defined as components of an enterprise about which separate financial information is available that is evaluated regularly by the chief operating decision maker, or decision making group, in deciding how to allocate resources and in assessing performance.
The Company’s chief operating decision maker is the Chief Executive Officer. The Chief Executive Officer reviews financial information presented on a consolidated basis. The Company operates in one industry segment, which is to provide tandem interconnection services to competitive carriers, including wireless, wireline, cable and broadband telephony providers. Therefore, the Company has concluded that it has only one operating segment.
| 13. | QUARTERLY FINANCIAL DATA (UNAUDITED) |
| 2009 Quarter Ended | ||||||||||||||||
| March 31, | June 30, | September 30, | December 31, | |||||||||||||
| (In thousands, except per share amounts) | ||||||||||||||||
| Revenue |
$ | 38,249 | $ | 41,235 | $ | 44,692 | $ | 44,730 | ||||||||
| Operating expense |
||||||||||||||||
| Network and facilities expense (excluding depreciation and amortization) |
11,462 | 12,432 | 13,093 | 13,661 | ||||||||||||
| Operations |
4,955 | 4,849 | 4,991 | 5,003 | ||||||||||||
| Sales and marketing |
524 | 474 | 467 | 531 | ||||||||||||
| General and administrative |
3,389 | 3,704 | 5,375 | 5,490 | ||||||||||||
| Depreciation and amortization |
4,041 | 3,199 | 3,506 | 3,848 | ||||||||||||
| Gain on disposal of fixed assets |
(25 | ) | — | (28 | ) | — | ||||||||||
| Total operating expense |
24,346 | 24,658 | 27,404 | 28,533 | ||||||||||||
| Income from operations |
13,903 | 16,577 | 17,288 | 16,197 | ||||||||||||
| Other (income) expense |
||||||||||||||||
| Interest expense |
133 | 94 | 49 | 17 | ||||||||||||
| Interest income |
(291 | ) | (257 | ) | (159 | ) | (94 | ) | ||||||||
| Other (income) expense (2) |
(242 | ) | 1 | (65 | ) | (64 | ) | |||||||||
| Total other (income) expense |
(400 | ) | (162 | ) | (175 | ) | (141 | ) | ||||||||
| Income before income taxes |
14,303 | 16,739 | 17,463 | 16,338 | ||||||||||||
| Provision for income taxes |
5,259 | 6,065 | 6,377 | 5,827 | ||||||||||||
| Net income |
$ | 9,044 | $ | 10,674 | $ | 11,086 | $ | 10,511 | ||||||||
| Earnings per common share-basic (1) |
$ | 0.28 | $ | 0.32 | $ | 0.33 | $ | .31 | ||||||||
| Earnings per common share-diluted (1) |
$ | 0.27 | $ | 0.31 | $ | 0.32 | $ | .31 | ||||||||
| Weighted average number of shares outstanding-basic: |
32,529 | 33,018 | 33,494 | 33,569 | ||||||||||||
| Weighted average number of shares outstanding-diluted: |
33,533 | 33,948 | 34,181 | 34,116 | ||||||||||||
78
Table of Contents
| 2008 Quarter Ended | ||||||||||||||||
| March 31, | June 30, | September 30, | December 31, | |||||||||||||
| (In thousands, except per share amounts) | ||||||||||||||||
| Revenue |
$ | 26,226 | $ | 28,578 | $ | 31,154 | $ | 34,944 | ||||||||
| Operating expense |
||||||||||||||||
| Network and facilities expense (excluding depreciation and amortization) |
9,110 | 9,386 | 11,215 | 10,616 | ||||||||||||
| Operations |
4,072 | 4,125 | 4,288 | 4,444 | ||||||||||||
| Sales and marketing |
544 | 451 | 466 | 479 | ||||||||||||
| General and administrative |
3,018 | 3,194 | 2,801 | 3,091 | ||||||||||||
| Depreciation and amortization |
3,263 | 2,823 | 3,561 | 4,376 | ||||||||||||
| Impairment of fixed assets |
— | 195 | — | — | ||||||||||||
| Gain on disposal of fixed assets |
— | — | — | (11 | ) | |||||||||||
| Total operating expense |
20,007 | 20,174 | 22,331 | 22,995 | ||||||||||||
| Income from operations |
6,219 | 8,404 | 8,823 | 11,949 | ||||||||||||
| Other (income) expense |
||||||||||||||||
| Interest expense |
299 | 250 | 208 | 167 | ||||||||||||
| Interest income |
(898 | ) | (799 | ) | (870 | ) | (907 | ) | ||||||||
| Other expense (2) |
550 | — | — | 581 | ||||||||||||
| Total other (income) expense |
(49 | ) | (549 | ) | (662 | ) | (159 | ) | ||||||||
| Income before income taxes |
6,268 | 8,953 | 9,485 | 12,108 | ||||||||||||
| Provision for income taxes |
2,245 | 3,309 | 3,321 | 3,919 | ||||||||||||
| Net income |
$ | 4,023 | $ | 5,644 | $ | 6,164 | $ | 8,189 | ||||||||
| Earnings per common share-basic (1) |
$ | 0.13 | $ | 0.18 | $ | 0.19 | $ | 0.25 | ||||||||
| Earnings per common share-diluted (1) |
$ | 0.12 | $ | 0.17 | $ | 0.19 | $ | 0.25 | ||||||||
| Weighted average number of shares outstanding-basic: |
31,094 | 31,771 | 32,009 | 32,277 | ||||||||||||
| Weighted average number of shares outstanding-diluted: |
33,163 | 33,210 | 33,312 | 33,379 | ||||||||||||
Revenue has increased sequentially in each of the quarters presented due to increases in the number of minutes billed to new and existing customers. In the second quarter of 2008, the Company recorded $0.2 million of impairment of fixed assets for switch equipment at its Michigan and Ohio locations, see footnote 2—Long-lived assets.
| (1) | The sum of the four quarters is not necessarily the same as the total for the year. |
| (2) | See our discussion of other expense found within Item 7—Management’s Discussion and Analysis of Financial Condition and Results of Operations. |
| ITEM 9. | CHANGES IN AND DISAGREEMENTS WITH ACCOUNTANTS ON ACCOUNTING AND FINANCIAL DISCLOSURE |
None.
79
Table of Contents
| ITEM 9A. | CONTROLS AND PROCEDURES |
(a) Evaluation of Disclosure Controls and Procedures
Our Chief Executive Officer and Chief Financial Officer, after evaluating the effectiveness of our “disclosure controls and procedures” (as defined in Rule 13a-15(e) promulgated under the Securities Exchange Act of 1934, or the “Act”), have concluded that, as of the end of the fiscal year covered by this report, our disclosure controls and procedures were effective to provide reasonable assurance that information required to be disclosed by us in the reports that we file or submit under the Act is recorded, processed, summarized and reported within the time periods specified in the Securities and Exchange Commission’s rules and forms. Disclosure controls and procedures include, without limitation, controls and procedures designed to ensure that information required to be disclosed by an issuer in the reports that it files or submits under the Act is accumulated and communicated to the issuer’s management, including its principal executive officer or officers and principal financial officer or officers, or persons performing similar functions, as appropriate to allow timely decisions regarding required disclosure.
(b) Management Report on Internal Control over Financial Reporting
Our management is responsible for establishing and maintaining adequate internal control over financial reporting. Our internal control system was designed to provide reasonable assurance to management and our Board of Directors regarding the preparation and fair presentation of published financial statements.
All internal control systems, no matter how well designed, have inherent limitations. Therefore, even those systems determined to be effective can provide only reasonable assurance with respect to financial statement preparation and presentation.
Management assessed the effectiveness of our internal control over financial reporting as of December 31, 2009. In making this assessment, management used the criteria set forth by the Committee of Sponsoring Organizations of the Treadway Commission, or COSO, in Internal Control—Integrated Framework . Based on its assessment, management believes that, as of December 31, 2009, our internal control over financial reporting is effective based on those criteria.
Our independent registered public accounting firm has issued an attestation report on our internal control over financial reporting. This report appears below.
(c) Report of Independent Registered Public Accounting Firm
To the Board of Directors and Shareholders of
Neutral Tandem, Inc.
Chicago, Illinois
We have audited the internal control over financial reporting of Neutral Tandem, Inc. and subsidiaries (the “Company”) as of December 31, 2009, based on criteria established in Internal Control—Integrated Framework issued by the Committee of Sponsoring Organizations of the Treadway Commission. The Company’s management is responsible for maintaining effective internal control over financial reporting and for its assessment of the effectiveness of internal control over financial reporting, included in the accompanying Management’s Report on Internal Control Over Financial Reporting. Our responsibility is to express an opinion on the Company’s internal control over financial reporting based on our audit.
We conducted our audit in accordance with the standards of the Public Company Accounting Oversight Board (United States). Those standards require that we plan and perform the audit to obtain reasonable assurance about whether effective internal control over financial reporting was maintained in all material respects. Our audit included obtaining an understanding of internal control over financial reporting, assessing the risk that a
80
Table of Contents
material weakness exists, testing and evaluating the design and operating effectiveness of internal control based on the assessed risk, and performing such other procedures as we considered necessary in the circumstances. We believe that our audit provides a reasonable basis for our opinion.
A company’s internal control over financial reporting is a process designed by, or under the supervision of, the company’s principal executive and principal financial officers, or persons performing similar functions, and effected by the company’s board of directors, management, and other personnel to provide reasonable assurance regarding the reliability of financial reporting and the preparation of financial statements for external purposes in accordance with generally accepted accounting principles. A company’s internal control over financial reporting includes those policies and procedures that (1) pertain to the maintenance of records that, in reasonable detail, accurately and fairly reflect the transactions and dispositions of the assets of the company; (2) provide reasonable assurance that transactions are recorded as necessary to permit preparation of financial statements in accordance with generally accepted accounting principles, and that receipts and expenditures of the company are being made only in accordance with authorizations of management and directors of the company; and (3) provide reasonable assurance regarding prevention or timely detection of unauthorized acquisition, use, or disposition of the company’s assets that could have a material effect on the financial statements.
Because of the inherent limitations of internal control over financial reporting, including the possibility of collusion or improper management override of controls, material misstatements due to error or fraud may not be prevented or detected on a timely basis. Also, projections of any evaluation of the effectiveness of the internal control over financial reporting to future periods are subject to the risk that the controls may become inadequate because of changes in conditions, or that the degree of compliance with the policies or procedures may deteriorate.
In our opinion, the Company maintained, in all material respects, effective internal control over financial reporting as of December 31, 2009, based on the criteria established in Internal Control—Integrated Framework issued by the Committee of Sponsoring Organizations of the Treadway Commission.
We have also audited, in accordance with the standards of the Public Company Accounting Oversight Board (United States), the consolidated financial statements and financial statement schedule as of and for the year ended December 31, 2009 of the Company and our report dated February 19, 2010 expressed an unqualified opinion on those financial statements and financial statement schedule.
DELOITTE & TOUCHE LLP
Chicago, Illinois
February 19, 2010
(d) Changes in Internal Control over Financial Reporting
There were no changes in our “internal control over financial reporting” (as defined in Rule 13a-15(f) promulgated under the Act) identified in connection with the evaluation required by Rule 13a-15(d) promulgated under the Act that occurred during the recently completed fiscal quarter ended December 31, 2009 that have materially affected, or are reasonably likely to materially affect, our internal control over financial reporting.
| ITEM 9B. | OTHER INFORMATION |
None.
81
Table of Contents
PART III
| ITEM 10. | DIRECTORS, EXECUTIVE OFFICERS AND CORPORATE GOVERNANCE |
The information required by this item with respect to Neutral Tandem’s directors and executive officers is incorporated by reference to the information set forth in Neutral Tandem’s proxy statement for the 2010 Annual Meeting of Stockholders to be filed with the Commission within 120 days after the end of Neutral Tandem’s fiscal year ended December 31, 2009. For information pertaining to executive officers and directors of Neutral Tandem, refer to the “Management” section of Part 1, Item 1 of this annual report on Form 10-K.
| ITEM 11. | EXECUTIVE COMPENSATION |
Information responsive to this item is incorporated herein by reference to Neutral Tandem’s definitive proxy statement with respect to our 2010 Annual Meeting of Stockholders to be filed with the SEC within 120 days after the end of the fiscal year covered by this annual report on Form 10-K.
| ITEM 12. | SECURITY OWNERSHIP OF CERTAIN BENEFICIAL OWNERS AND MANAGEMENT AND RELATED STOCKHOLDER MATTERS |
Information with respect to the security ownership of any person that we know to beneficially own more than 5% of Neutral Tandem’s common stock and by each Neutral Tandem director, each Neutral Tandem named executive officer, and all directors and executive officers as a group, can be found in Neutral Tandem’s definitive proxy statement with respect to our 2010 Annual Meeting of Stockholders to be filed with the SEC within 120 days after the end of the fiscal year covered by this annual report on Form 10-K.
Information relating to securities authorized under our equity compensation plans as of December 31, 2009 is set forth in Footnote 11 to the audited financial statements included in this Annual Report on Form 10-K. Each plan reflected therein was approved by our security holders.
| ITEM 13. | CERTAIN RELATIONSHIPS AND RELATED TRANSACTIONS, AND DIRECTOR INDEPENDENCE |
Information responsive to this item is incorporated herein by reference to Neutral Tandem’s definitive proxy statement with respect to our 2010 Annual Meeting of Stockholders to be filed with the SEC within 120 days after the end of the fiscal year covered by this annual report on Form 10-K.
| ITEM 14. | PRINCIPAL ACCOUNTANT FEES AND SERVICES |
Information responsive to this item is incorporated herein by reference to Neutral Tandem’s definitive proxy statement with respect to our 2010 Annual Meeting of Stockholders to be filed with the SEC within 120 days after the end of the fiscal year covered by this annual report on Form 10-K.
82
Table of Contents
PART IV
| ITEM 15. | EXHIBITS, FINANCIAL STATEMENT SCHEDULES |
(a)(1) Consolidated Financial Statements
This Annual Report on Form 10-K contains the following financial statements which appear under Part II, Item 8 of this Form 10-K on the pages noted below:
| Page | ||
| 57 | ||
| 58 | ||
| 59 | ||
| 60 | ||
| 61 | ||
| 62 | ||
| Report of Independent Registered Public Accounting Firm on Internal Control over Financial Reporting |
80 |
(a)(2) Financial Statement Schedules
Schedule II: Valuation and Qualifying Accounts
| Beginning Balance |
Additions Charged to Operations |
Write- offs |
Ending Balance | |||||||||
| (In thousands) | ||||||||||||
| Trade receivable allowances for the year ended: |
||||||||||||
| December 31, 2007 |
$ | — | $ | 77 | (77 | ) | — | |||||
| December 31, 2008 |
$ | — | $ | 8 | $ | (8 | ) | — | ||||
| December 31, 2009 |
$ | — | $ | — | $ | — | — | |||||
Schedules not listed above have been omitted because the information required to be set forth therein is not applicable or is shown in the consolidated financial statements or notes thereto.
(a)(3) Exhibits.
See Index to Exhibits. The Exhibits listed in the accompanying Index to Exhibits are filed or incorporated by reference as part of this annual report on Form 10-K.
| Exhibit |
Description of Exhibit | |
| 3.1 | Amended and Restated Certificate of Incorporation of Neutral Tandem, Inc. (1) | |
| 3.2 | Amended and Restated Bylaws of Neutral Tandem, Inc. (1) | |
| 4.1 | Specimen certificate evidencing shares of common stock (1) | |
| 4.2 | Voting Agreement, dated November 19, 2004, by and between Neutral Tandem, Inc., and DCM III, L.P., DCM III-A. L.P., DCM Affiliates Fund III, L.P., New Enterprise Associates 10, Limited Partnership, NEA Ventures 2003, Limited Partnership, James P. Hynes, Ronald W. Gavillet, Christopher F. Swenson, John Barnicle, Robert M. Junkroski and Jeffrey C. Wells (1) | |
83
Table of Contents
| Exhibit |
Description of Exhibit | |
| 4.3 | Second Amended and Restated Stockholders Agreement dated as of February 2, 2006, by and between Neutral Tandem, Inc., DCM III, L.P., DCM III-A, L.P., DCM Affiliates Fund III, L.P., New Enterprise Associates 10, Limited Partnership, NEA Ventures 2003, Limited Partnership, Mesirow Capital Partners VIII, L.P., Montagu Newhall Global Partners II-A, L.P, Montagu Newhall Global Partners II, L.P, Montagu Newhall Global Partners II-B, L.P, Wasatch Small Cap Growth Fund, Wasatch Ultra Growth Fund, Wasatch Global Science & Technology Fund, James P. Hynes, Bob Hawk, Edward M. Greenberg, Joseph Onstott, Elizabeth Ann Petty, Ronald W. Gavillet, Robert M. Junkroski, Joseph Tighe, John Barnicle, Doreen Kluber, C. Ann Brown, Louise D’Amato, Karen L. Linsley, Paul Oakley, Bill Capraro, Paul W. Chisholm, David Weisman, Robert C. Atkinson, Lawrence M. Ingeneri, Irrevocable Trust for Katherine Vance Hynes, Jon Clopton, Jack W. Swenson, Eric Carlson, Christopher F. Swenson, Alexander P. & Heather B. Doll Family Trust, Dave Redmon, Dixon & Sarah Doll Jr. Family Trust, Kathleen Starr, Andrew J. Doll, Michael E. Hawk, Jeffrey C. Wells, Jonathan B. Junkroski Trust, Sharon van Alstine, Jeffrey H. Hartzell, Julia K. Junkroski Trust, Stephanie G. Hawk, Janice Hewitt, Christopher G. Hawk, David Lopez, David Tatak, R. Casey Hawk, The Dixon and Carol Doll Family Trust, Ralph Valente, Charles and Janine Junkroski, as joint tenants, Irrevocable Trust for Alanna Marie Hynes, and Richard Anderson (1) | |
| 4.4 | First Amendment to Second Amended and Restated Stockholders Agreement dated as of October 31, 2006, by and between Neutral Tandem, Inc., DCM III, L.P., DCM III-A, L.P., DCM Affiliates Fund III, L.P., New Enterprise Associates 10, Limited Partnership, NEA Ventures 2003, Limited Partnership, Mesirow Capital Partners VIII, L.P., Montagu Newhall Global Partners II-A, L.P, Montagu Newhall Global Partners II, L.P, Montagu Newhall Global Partners II-B, L.P, Wasatch Small Cap Growth Fund, Wasatch Ultra Growth Fund, Wasatch Global Science & Technology Fund, James P. Hynes, Bob Hawk, Edward M. Greenberg, David Weisman, Doreen Kluber, C. Ann Brown, Louise D’Amato, Bill Capraro, Joseph Onstott, Elizabeth Ann Petty, Ronald W. Gavillet, Robert M. Junkroski, Joseph Tighe, John Barnicle, Doreen Kluber, C. Ann Brown, Louise D’Amato, Karen L. Linsley, Paul Oakley, Bill Capraro, Paul W. Chisholm, David Weisman, Robert C. Atkinson, Lawrence M. Ingeneri, Irrevocable Trust for Katherine Vance Hynes, Gavillet Grantor Annuity Trust, Swenson Grantor Annuity Trust, Jon Clopton, Jack W. Swenson, Eric Carlson, Christopher F. Swenson, Alexander P. & Heather B. Doll Family Trust, Dave Redmon, Dixon & Sarah Doll Jr. Family Trust, Kathleen Starr, Andrew J. Doll, Michael E. Hawk, Jeffrey C. Wells, Jonathan B. Junkroski Trust, Sharon van Alstine, Jeffrey H. Hartzell, Julia K. Junkroski Trust, Stephanie G. Hawk, Janice Hewitt, Christopher G. Hawk, David Lopez, David Tatak, R. Casey Hawk, The Dixon and Carol Doll Family Trust, Ralph Valente, Charles and Janine Junkroski, as joint tenants, Irrevocable Trust for Alanna Marie Hynes, Richard Anderson, Everett Mark Virdin, Jorge Pizano, Thomas Carter, John Leland and David Wojcik (1) | |
| 4.5 | Second Amended and Restated Registration Rights Agreement, dated February 2, 2006, by and between Neutral Tandem, Inc., and DCM III, L.P., DCM III-A. L.P., DCM Affiliates Fund III, L.P., New Enterprise Associates 10, Limited Partnership, NEA Ventures 2003, Limited Partnership, Mesirow Capital Partners VIII, L.P., Montagu Newhall Global Partners II, L.P., Montagu Newhall Global Partners II-A, L.P., Montagu Newhall Global Partners II-B, L.P., Robert M. Junkroski, Wasatch Small Cap Growth Fund, Wasatch Ultra Growth Fund, Wasatch Global Science & Technology Fund, James P. Hynes, Robert C. Hawk, Edward M. Greenberg, Karen L. Linsley, Paul Oakley, Paul W. Chisholm, Joseph Tighe, John Barnicle, Ronald W. Gavillet, Lawrence M. Ingeneri; Christopher Swenson, Jeffrey C. Wells, Jeffrey Hartzell, Janice Hewitt, David Lopez, The Dixon and Carol Doll Family Trust, Irrevocable Trust for Alanna Marie Hynes, Irrevocable Trust for Katherine Vance Hynes, Alexander P. & Heather B. Doll Family Trust, Dixon & Sarah Doll Jr. Family Trust, Andrew J. Doll, Jonathan B. Junkroski Trust, Julia K. Junkroski Trust, David Tatak, Ralph Valente, Richard Anderson, Jon Clopton, Eric Carlson, Dave Redmon and Kathleen Starr (1) | |
84
Table of Contents
| Exhibit |
Description of Exhibit | |
| 4.6 | Option Agreement, dated November 26, 2003 by and between Neutral Tandem, Inc., DCM III, L.P., DCM III-A. L.P., DCM Affiliates Fund III, L.P., New Enterprise Associates 10, Limited Partnership, NEA Ventures 2003, Limited Partnership, James P. Hynes, Robert C. Hawk, Ronald W. Gavillet, Christopher F. Swenson, John Barnicle, Robert M. Junkroski, Jeffrey C. Wells, Jeffrey H. Hartzell, Janice Hewitt, David Lopez and the Dixon and Carol Doll Family Trust (1) | |
| 4.7 | Warrant, dated May 28, 2004 issued by Neutral Tandem, Inc. to Venture Lending & Leasing IV, LLC (1) | |
| 4.8 | Warrant, dated December 20, 2004 issued by Neutral Tandem, Inc. to Venture Lending & Leasing IV, LLC (1) | |
| 4.9 | Warrant, dated April 29, 2006 issued by Neutral Tandem, Inc. to Venture Lending & Leasing IV, LLC (1) | |
| 4.10 | Warrant dated December 20, 2004 issued by Neutral Tandem, Inc. to Venture Lending & Leasing IV, LLC (1) | |
| 4.11 | Supplement to Warrant dated January 18, 2006 issued by Neutral Tandem, Inc. to Venture Lending & Leasing IV, LLC (1) | |
| 4.12 | Supplement to Warrant dated January 18, 2006 issued by Neutral Tandem, Inc. to Venture Lending & Leasing IV, LLC (1) | |
| 10.1 | Employment Agreement dated February 6, 2006, by and between Rian Wren and Neutral Tandem, Inc. (1) | |
| 10.2 | Employment Agreement dated May 9, 2006, by and between Robert Junkroski and Neutral Tandem, Inc. (1) | |
| 10.3 | Employment Agreement dated May 9, 2006, by and between Ronald Gavillet and Neutral Tandem, Inc. (1) | |
| 10.4 | Employment Agreement dated May 9, 2006, by and between Surendra Saboo and Neutral Tandem, Inc. (1) | |
| 10.5 | Employment Agreement dated November 3, 2006 by and between David Lopez and Neutral Tandem, Inc. (1) | |
| 10.6 | Form of Indemnification Agreement (1) | |
| 10.7 | Form of Proprietary Information and Inventions Agreement (1) | |
| 10.8 | Stock Purchase Agreement dated as of November 26, 2003, by and among Neutral Tandem, Inc., DCM III, L.P., DCM III-A, L.P., DCM Affiliates Fund III, L.P., New Enterprise Associates 10, Limited Partnership, NEA Ventures 2003 Limited Partnership and Bob Hawk (1) | |
| 10.9 | Stock Purchase Agreement dated as of November 19, 2004, by and among Neutral Tandem, Inc., DCM III, L.P., DCM III-A, L.P., DCM Affiliates Fund III, L.P., New Enterprise Associates 10, Limited Partnership, Three Shores Partners, LLC, Mesirow Capital Partners VIII, L.P., James P. Hynes, Bob Hawk, Robert C. Atkinson, David Weisman, Ed Greenberg, Elizabeth Ann Petty, Doreen Kluber, Louise D’Amato, Karen L. Linsley, Paul Oakley, Bill Capraro, Paul W. Chisholm, Lawrence M. Ingeneri, Joseph Tighe, Joseph Onstott, Robert M. Junkroski, Ronald W. Gavillet and John Barnicle (1) | |
| 10.10 | First Amendment to Stock Purchase Agreement dated as of November 19, 2004 by and among Neutral Tandem, Inc., DCM III, L.P., DCM III-A, L.P., DCM Affiliates Fund III, L.P., Three Shores Partners, LLC, New Enterprise Associates 10, Limited Partnership, NEA Ventures 2003, Limited Partnership and James P. Hynes (1) | |
85
Table of Contents
| Exhibit |
Description of Exhibit | |
| 10.11 | Second Amendment to Stock Purchase Agreement dated as of June 17, 2005 by and among Neutral Tandem, Inc., DCM III, L.P., DCM III-A, L.P., DCM Affiliates Fund III, L.P., New Enterprise Associates 10, Limited Partnership and James P. Hynes (1) | |
| 10.12 | Stock Purchase Agreement, dated as of February 2, 2006, by and among Neutral Tandem, Inc., DCM III, L.P., DCM III-A, L.P., DCM Affiliates Fund III, L.P., New Enterprise Associates 10, Limited Partnership, Mesirow Capital Partners VIII, L.P., Montagu Newhall Global Partners II, L.P., Montagu Newhall Global Partners II-A, L.P., Montagu Newhall Global Partners II-B, L.P., Wasatch Small Cap Growth Fund, Wasatch Ultra Growth Fund, Wasatch Global Science & Technology Fund, Bob Hawk, Edward M. Greenberg, Paul W. Chisholm, Lawrence M. Ingeneri, Joseph Tighe and John Barnicle (1) | |
| 10.13 | Management Rights Agreement dated as of November 26, 2003 among Neutral Tandem, Inc. and DCM III, L.P., DCM III-A, L.P. and DCM Affiliates Fund III, L.P. (1) | |
| 10.14 | Management Rights Agreement dated as of November 26, 2003 among Neutral Tandem, Inc. and New Enterprise Associates 10, Limited Partnership (1) | |
| 10.15 | Observation Rights Agreement dated as of November 19, 2004 between Neutral Tandem, Inc. and Mesirow Capital Partners VIII, L.P. (1) | |
| 10.16 | Observation Rights Agreement dated as of February 2, 2006 between Neutral Tandem, Inc. and Montagu Newhall Global Partners II, L.P. (1) | |
| 10.17 | Observation Rights Agreement dated as of February 2, 2006 among Neutral Tandem, Inc. and Wasatch Small Capital Growth Fund, Wasatach Ultra Growth Fund and Wasatach Global Science & Technology Fund (1) | |
| 10.18 | Restricted Stock Agreement, dated November 8, 2004, by and between Neutral Tandem, Inc. and David Lopez (1) | |
| 10.19 | Restricted Stock Agreement, dated October 2006, by and between Neutral Tandem, Inc. and Dixon Doll (1) | |
| 10.20 | Neutral Tandem, Inc. 2007 Long Term Equity Incentive Plan (1) | |
| 10.21 | Standard Purchase and License Terms, dated January 10, 2005, between Sonus Networks, Inc. and Neutral Tandem, Inc. (1) | |
| 10.22 | Standard Purchase and License Terms, dated May 25, 2005, between Sonus Networks, Inc. and Neutral Tandem, Inc. (1) | |
| 10.23 | Loan and Security Agreement, dated May 28, 2004, by and between Neutral Tandem, Inc. and Venture Lending and Leasing IV, Inc. (1) | |
| 10.24 | Supplement to the Loan and Security Agreement, dated May 28, 2004, by and between Neutral Tandem, Inc. and Lending and Leasing IV, Inc. (1) | |
| 10.25 | Supplement No. 2, dated December 20, 2004, to the Loan and Security Agreement dated as of May 28, 2004, by and between Neutral Tandem, Inc. and Venture Lending and Leasing IV, Inc. (1) | |
| 10.26 | Intellectual Property Security Agreement, dated May 28, 2004, by and between Neutral Tandem, Inc. and Venture Lending and Leasing IV, Inc. (1) | |
| 10.27 | Lease Agreement dated May 1, 1999 between 717 South Wells, L.L.C. and Neutral Tandem, Inc., as assignee (1) | |
86
Table of Contents
| Exhibit |
Description of Exhibit | |
| 10.28 | Lease, dated October 20, 2003, by and between 717 South Wells, L.L.C. and Neutral Tandem, Inc. (1) | |
| 10.29 | Lease, dated May 10, 2004, by and between 75 Broad, LLC and Neutral Tandem, Inc. (1) | |
| 10.30 | Assignment and Assumption Agreement, dated June 1, 2005 by and between Switch and Data Five LLC f/k/a Layer One Chicago, LLC and Neutral Tandem, Inc. (1) | |
| 10.31 | Form of Customer Agreement (1) | |
| 10.32 | Neutral Tandem, Inc. 2003 Stock Incentive Plan (1) | |
| 10.33 | Amendment No. 1 to Neutral Tandem, Inc. 2003 Stock Incentive Plan (1) | |
| 10.34 | Amendment No. 2 Neutral Tandem, Inc. 2003 Stock Incentive Plan (1) | |
| 10.35 | Amendment No. 3 Neutral Tandem, Inc. 2003 Stock Incentive Plan (1) | |
| 10.36 | Amended and Restated Restricted Stock Agreement, dated November 26, 2003, by and between Neutral Tandem, Inc. and James P. Hynes (1) | |
| 10.37 | Amended and Restated Restricted Stock Agreement, dated November 26, 2003, by and between Neutral Tandem, Inc. and Ronald W. Gavillet (1) | |
| 10.38 | Amendment No. 1 to Amended and Restated Restricted Stock Agreement, dated March 1, 2005, by and between Neutral Tandem, Inc., and Ronald W. Gavillet (1) | |
| 10.39 | Amendment No. 2 to Amended and Restated Restricted Stock Agreement, dated June 10, 2005, by and between Neutral Tandem, Inc., and Ronald W. Gavillet (1) | |
| 10.40 | Restricted Stock Agreement, dated October 28, 2003, by and between Neutral Tandem, Inc. and Robert M. Junkroski (1) | |
| 10.41 | Amendment No. 1 to Restricted Stock Agreement, dated June 10, 2005, by and between Neutral Tandem, Inc. and Robert M. Junkroski (1) | |
| 10.42 | Restricted Stock Agreement, dated as of June 30, 2004, by and between Neutral Tandem, Inc. and Bob Hawk (1) | |
| 10.43 | Restricted Stock Agreement dated as of November 8, 2004, by and between Neutral Tandem, Inc. and James P. Hynes (1) | |
| 10.44 | Amended and Restated Restricted Stock Agreement dated as of December 14, 2004, by and between James P. Hynes and Neutral Tandem, Inc. (1) | |
| 10.45 | Amendment No. 1 to Amended and Restated Restricted Stock Agreement, dated June 10, 2005, by and between Neutral Tandem, Inc. and James P. Hynes (1) | |
| 10.46 | Restricted Stock Agreement dated as of November 8, 2004 by and between Robert M. Junkroski and Neutral Tandem, Inc. (1) | |
| 10.47 | Amended and Restated Restricted Stock Agreement, dated December 14, 2004, by and between Neutral Tandem, Inc. and Robert M. Junkroski (1) | |
| 10.48 | Amendment No. 1 to Amended and Restated Restricted Stock Agreement, dated June 10, 2005, by and between Neutral Tandem, Inc. and Robert M. Junkroski (1) | |
| 10.49 | Restricted Stock Agreement, dated November 10, 2003, by and between Neutral Tandem, Inc. and David Lopez (1) | |
| 10.50 | Amendment No. 1 to Restricted Stock Agreement, dated June 10, 2005, by and between Neutral Tandem, Inc. and David Lopez (1) | |
87
Table of Contents
| Exhibit |
Description of Exhibit | |
| 10.51 | Addendum to Standard Purchase and License Terms, dated August 17, 2006, between Neutral Tandem, Inc. and Sonus Networks, Inc. (1) | |
| 10.52 | Addendum No. 2 to Standard Purchase and License Terms, dated August 17, 2006, between Neutral Tandem, Inc. and Sonus Networks, Inc. (1) | |
| 10.53 | Addendum to Standard Purchase and License Terms, dated August 27, 2007, between Neutral Tandem, Inc. and Sonus Networks, Inc. (1) | |
| 10.54 | Amendment to Employment Agreement dated January 21, 2008 between Rian Wren and Neutral Tandem, Inc. (2) | |
| 10.55 | Amendment to Employment Agreement dated January 21, 2008 between Surendra Saboo and Neutral Tandem, Inc. (2) | |
| 10.56 | Amendment to Employment Agreement dated January 21, 2008 between Robert Junkroski and Neutral Tandem, Inc. (2) | |
| 10.57 | Amendment to Employment Agreement dated January 21, 2008 between the Ronald Gavillet and Neutral Tandem, Inc. (2) | |
| 10.58 | Form of non-director and executive officer option award agreement under the 2007 Long Term Equity Incentive Plan (5) | |
| 10.59 | Form of restricted stock award agreement under the 2007 Long Term Equity Incentive Plan (5) | |
| 10.60 | Joinder Agreement dated March 13, 2008 between Neutral Tandem, Inc. and Rian J. Wren (3) | |
| 10.61 | Joinder Agreement dated March 13, 2008 between Neutral Tandem, Inc. and Surendra Saboo (3) | |
| 10.62 | Second Amendment to Employment Agreement dated November 21, 2008 between Rian Wren and Neutral Tandem, Inc. (4) | |
| 10.63 | Second Amendment to the Employment Agreement dated November 21, 2008 between Surendra Saboo and Neutral Tandem, Inc. (4) | |
| 10.64 | Second Amendment to the Employment Agreement dated November 21, 2008 between Robert Junkroski and Neutral Tandem, Inc. (4) | |
| 10.65 | Amendment to Employment Agreement dated January 21, 2008 between David Lopez and Neutral Tandem, Inc. (4) | |
| 10.66 | Form of director and executive officer option award agreement under the 2007 Long Term Equity Incentive Plan (6) | |
| 10.67 | Employment Agreement dated February 5, 2008 between Richard Monto and Neutral Tandem, Inc. (6) | |
| 10.68 | Amendment to Employment Agreement dated November 21, 2008 between Richard Monto and Neutral Tandem, Inc. (6) | |
| 10.69 | UBS Financial Services Inc. Acceptance Letter Relating to Auction Rate Securities dated November 14, 2008 (6) | |
| 10.70 | Neutral Tandem, Inc. Amended and Restated 2007 Long Term Equity Incentive Plan (6) | |
| 10.71 | Third Amendment to Employment Agreement dated December 28, 2009 between Rian Wren and Neutral Tandem, Inc. (7) | |
| 21.1 | Subsidiaries of the Registrant * | |
| 23.1 | Consent of Deloitte & Touche LLP * | |
| 31.1 | Certification of Chief Executive Officer pursuant to Rule 13a-14(a) and Rule 15d-14(a) of the Securities Act of 1934, as amended, as adopted pursuant to Section 302 of the Sarbanes-Oxley Act of 2002. * | |
88
Table of Contents
| Exhibit |
Description of Exhibit | |
| 31.2 | Certification of Chief Financial Officer pursuant to Rule 13a-14(a) and Rule 15d-14(a) of the Securities Act of 1934, as amended, as adopted pursuant to Section 302 of the Sarbanes-Oxley Act of 2002. * | |
| 32.1 | Certification of Chief Executive Officer pursuant to 18 U.S.C. Section 1350, as adopted pursuant to Section 906 of the Sarbanes-Oxley Act of 2002. * | |
| 32.2 | Certification of Chief Financial Officer pursuant to 18 U.S.C. Section 1350, as adopted pursuant to Section 906 of the Sarbanes-Oxley Act of 2002. * | |
| * | Filed herewith |
| (1) | Filed as an exhibit to Registration Statement on Form S-1 (File No. 333-140127) and incorporated herein by reference. |
| (2) | Filed as an exhibit to the Registrant’s Form 8-K filed on January 22, 2008 and incorporated herein by reference. |
| (3) | Filed as an exhibit to the Registrant’s Form 8-K filed on March 13, 2008 and incorporated herein by reference. |
| (4) | Filed as an exhibit to the Registrant’s Form 8-K filed on November 24, 2008 and incorporated herein by reference. |
| (5) | Filed as an exhibit to the Registrant’s Form 10-K filed on March 5, 2008 and incorporated herein by reference. |
| (6) | Filed as an exhibit to the Registrant’s Form 10-K filed on March 13, 2009 and incorporated herein by reference. |
| (7) | Filed as an exhibit to the Registrant’s Form 8-K filed on December 31, 2009 and incorporated herein by reference. |
89
Table of Contents
SIGNATURES
Pursuant to the requirements of Section 13 or 15(d) of the Securities Exchange Act of 1934, the registrant has duly caused this report to be signed on its behalf by the undersigned, thereunto duly authorized on February 19, 2010.
| NEUTRAL TANDEM, INC. | ||
| By: | /s/ RIAN WREN | |
| Rian Wren, Chief Executive Officer | ||
Pursuant to the requirements of the Securities Exchange Act of 1934, this report has been signed by the following persons on behalf of the registrant and in the capacities indicated below on February 19, 2010.
| Signature |
Title | |
| /S/ RIAN J. WREN Rian J. Wren |
President, Chief Executive Officer and Director (Principal Executive Officer) | |
| /S/ ROBERT M. JUNKROSKI Robert M. Junkroski |
Chief Financial Officer (Principal Financial and Accounting Officer) | |
| /S/ JAMES P. HYNES James P. Hynes |
Director, Chairman | |
| /S/ DIXON R. DOLL Dixon R. Doll |
Director | |
| /S/ PETER J. BARRIS Peter J. Barris |
Director | |
| /S/ ROBERT C. HAWK Robert C. Hawk |
Director | |
| /S/ LAWRENCE M. INGENERI Lawrence M. Ingeneri |
Director | |
| /S/ EDWARD EVANS Edward Evans |
Director | |
90