Attached files
| file | filename |
|---|---|
| EX-24 - POWER OF ATTORNEY - HKN, Inc. | ex24.htm |
| EX-21 - SUBSIDIARIES - HKN, Inc. | ex21.htm |
| EX-23.1 - CONSENT OF IRPAF - HKN, Inc. | ex23-1.htm |
| EX-32.1 - SECTION 906 CERTIFICATION - CEO - HKN, Inc. | ex32-1.htm |
| EX-23.2 - CONSENT OF ENGINEERS & GEOLOGISTS - HKN, Inc. | ex23-2.htm |
| EX-99.1 - COLLARINI RESERVE REPORT SUMMARY - HKN, Inc. | ex99-1.htm |
| EX-99.2 - CREST RESERVE REPORT SUMMARY - HKN, Inc. | ex99-2.htm |
| EX-31.1 - CEO CERTIFICATION - HKN, Inc. | ex31-1.htm |
| EX-31.2 - CFO CERTIFICATION - HKN, Inc. | ex31-2.htm |
| EX-23.3 - CONSENT OF ENGINEERS & GEOLOGISTS - HKN, Inc. | ex23-3.htm |
| EX-32.2 - SECTION 906 CERTIFICATION - CFO - HKN, Inc. | ex32-2.htm |
SECURITIES
AND EXCHANGE COMMISSION
Washington, D.C.
20549
FORM
10-K
x ANNUAL REPORT PURSUANT TO SECTION 13
OR 15(d)
OF
THE SECURITIES EXCHANGE ACT OF 1934
For
the fiscal year ended December 31, 2009
o TRANSITION REPORT PURSUANT TO SECTION
13 OR 15(d)
OF
THE SECURITIES EXCHANGE ACT OF 1934
For the transition period from
___________ to ___________
Commission
file number 1-10262
HKN,
INC.
(Exact
name of registrant as specified in its charter)
|
Delaware
|
95-2841597
|
|
(State
or other jurisdiction of
|
(I.R.S.
Employer
|
|
incorporation
or organization)
|
Identification
No.)
|
|
180
State Street, Suite 200
|
76092
|
|
Southlake,
Texas
|
(Zip
Code)
|
|
(Address
of principal executive offices)
|
Registrant’s
telephone number, including area code (817)424-2424
Securities
registered pursuant to Section 12(b) of the Act:
|
Title
of each class:
|
Name
of each exchange on which registered:
|
|
Common
Stock, Par Value $0.01 Per Share
|
NYSE
AMEX
|
Securities
registered pursuant to Section 12(g) of the Act: None
Indicate
by check mark if the registrant is a well-known seasoned issuer, as defined in
Rule 405 of the Securities
Act. ¨ Yes þ No
Indicate
by check mark if the registrant is not required to file reports pursuant to
Section 13 or 15(d) of the Securities Exchange Act of 1934. Yes No þ
Indicate
by check mark whether the registrant (1) has filed all reports required to be
filed by Section 13 or 15(d) of the Securities Exchange Act of 1934
during the preceding 12 months (or for such shorter period that the registrant
was required to file such reports), and (2) has been subject to such filing
requirements for the past 90 days. þ Yes ¨ No.
Indicate
by checkmark whether the registrant has submitted electronically and posted on
its corporate Website, if any, every Interactive Data File required to be
submitted and posted pursuant to Rule 405 of Regulation S-T
(§ 232.405 of this chapter) during the preceding 12 months (or for
such shorter period that the registrant was required to submit and post such
files). ¨ Yes þ No
Indicate
by check mark if disclosure of delinquent filers pursuant to Item 405 of
Regulation S-K is not contained herein, and will not be contained, to the
best of registrant’s knowledge, in definitive proxy or information statements
incorporated by reference in Part III of this Form 10-K or any amendment to
this
Form 10-K. ¨
Indicate
by check mark whether the registrant is a large accelerated filer, an
accelerated filer, a non-accelerated filer, or a smaller reporting company. See
definition of “accelerated filer and large accelerated filer” and “smaller
reporting company” in Rule 12b-2 of the Exchange Act (Check one):
Large
accelerated filer ¨ Accelerated
filer ¨ Non-accelerated
filer ¨
Smaller reporting company þ
Indicate by check mark whether the
registrant is a shell company (as defined in Rule 12b-2 of the Exchange
Act). ¨
Yes þ No
The
aggregate market value of the voting Common Stock, par value $0.01 per share,
held by non affiliates of the Registrant as of June 30, 2009 was approximately
$25 million. For purposes of the determination of the above stated amount only,
all directors, executive officers and 5% or more stockholders of the Registrant
are presumed to be affiliates.
The
number of shares of Common Stock, par value $0.01 per share, outstanding as of
February 1, 2010 was 9,553,847.
DOCUMENTS
INCORPORATED BY REFERENCE
Specified portions of the registrant’s
definitive Proxy Statement for the 2010 Annual Meeting of Shareholders, to be
filed pursuant to Regulation 14A with the Securities and Exchange Commission not
later than 120 days after the end of this fiscal year covered by this report,
are incorporated by reference in Part III of this report.
2
TABLE OF CONTENTS
| Page | ||
| PART I. | ||
|
ITEM 1.
|
Business
|
4
|
|
|
||
|
ITEM 1A.
|
Risk
Factors
|
10
|
|
ITEM 1B.
|
Unresolved
Staff Comments
|
18
|
|
ITEM 2.
|
Properties
|
18
|
|
ITEM 3.
|
Legal
Proceedings
|
18
|
|
ITEM 4.
|
Submission
of Matters to a Vote of Security Holders
|
18
|
|
PART
II.
|
||
|
ITEM 5.
|
Market
for Registrant’s Common Equity, Related Stockholder Matters and Issuer
Purchases of Equity Securities
|
19
|
|
ITEM 6.
|
Selected
Financial Data
|
21
|
|
ITEM 7.
|
Management’s
Discussion and Analysis of Financial Condition and Results
of Operations
|
22 |
|
ITEM 7A.
|
Quantitative
and Qualitative Disclosures about Market Risk
|
42 |
|
ITEM 8.
|
Financial
Statements and Supplementary Data
|
42
|
|
ITEM 9.
|
Changes
in and Disagreements with Accountants on Accounting and Financial
Disclosure
|
76
|
|
ITEM 9A.
|
Controls
and Procedures
|
76
|
|
PART
III.
|
||
|
ITEM
10.
|
Directors
and Executive Officers and Corporate Governance
|
79
|
|
ITEM
11.
|
Executive
Compensation
|
79
|
|
ITEM
12.
|
Security
Ownership of Certain Beneficial Owners and Management and Related
Stockholder Matters
|
79
|
|
ITEM
13.
|
Certain
Relationships and Related Transactions and Director
Independence
|
79
|
|
ITEM
14.
|
Principal
Accounting Fees and Services
|
79
|
|
PART
IV.
|
||
|
|
||
|
ITEM
15.
|
Exhibits
and Financial Statement Schedules
|
80
|
3
The
following discussion is intended to assist you in understanding our business and
the results of our operations. It should be read in conjunction with
the Consolidated Financial Statements and the related notes that appear
elsewhere in this report. Certain statements made in our discussion
may be forward looking. Forward-looking statements involve risks and
uncertainties and a number of factors could cause actual results or outcomes to
differ materially from our expectations. Unless the context requires
otherwise, when we refer to “we,” “us” and “our,” we are describing HKN, Inc.
and its consolidated subsidiaries on a consolidated basis.
PART
I
ITEM
1. BUSINESS
Overview
Our business strategy is focused on
enhancing value for our stockholders through the development of a well-balanced
portfolio of energy-based assets. Currently, the majority of the
value of our assets is derived from our ownership in Gulf Coast oil and gas
properties and in our coalbed methane prospects in Indiana and
Ohio. We consider these assets to be strategic for us, and our
objective in 2010 is to build the value of these properties by:
|
·
|
Monitoring
and reducing operating costs
|
|
·
|
Reducing
operational, environmental, financial and third-party dependency
risks
|
|
·
|
Pursuing
possibilities for “expanding our footprint” in these
areas
|
|
·
|
Performing
economic upgrades and improvements
|
We are also seeking to identify further
investment opportunities in undervalued energy-based assets or companies which
could provide future value for our shareholders.
We were
incorporated in 1973 in the State of California and reincorporated in 1979 in
the State of Delaware. Our corporate offices are located at 180 State Street,
Suite 200, Southlake, Texas 76092. Our telephone number is (817) 424-2424, and
our web site is accessed at www.hkninc.com. We make available, free of charge,
on our website, our Code of Business Conduct and Ethics, Code of Ethics for
Senior Financial Officers, Audit Committee Charter and Nominating and Corporate
Governance Committee Charter as well as our annual report on Form 10-K,
quarterly reports on Form 10-Q, current reports on Form 8-K and all amendments
to those reports as soon as is reasonably practical after such materials are
electronically filed with, or furnished to, the Securities and Exchange
Commission (SEC).
Oil
and Gas Development and Production Operations
During
the three years ended December 31, 2009, we drilled or participated in the
drilling of 22 oil and gas wells in North America, completing 20 of the wells
drilled. During 2009, we participated in the completion of 2 development wells.
As of December 31, 2009, we operate or own a non-operating working interest in
69 oil wells, 65 gas wells and 12 injection wells in the Gulf Coast area of the
United States. All of our proved oil and gas reserves are concentrated in the
Gulf Coast region of Louisiana and Texas.
Prospect Acreage - In
addition to the producing property interests discussed above, we own, through
certain wholly-owned subsidiaries, interests in a variety of domestic prospect
acreage in the Creole, East Lake Verret and Lapeyrouse fields of Cameron,
Assumption and Terrebonne Parishes, respectively, in Louisiana.
See Note
14 – “Other Information” in the Notes to Consolidated Financial Statements
contained in Part II, Item 8 of this Annual Report on Form 10-K for financial
information about our oil and gas interests.
4
Oil
and Gas Customers
During
2009, one domestic customer, Shell, purchased approximately 61% of our
consolidated oil and gas sales. During 2008, three domestic customers, Shell,
Louis Dreyfus and Sequent, purchased approximately 56% of our consolidated oil
and gas sales. During 2007, three domestic customers, Shell, Chevron and Noble,
purchased approximately 60% of our consolidated oil and gas sales.
Oil
and Natural Gas Marketing
Generally, but not always, the demand
for natural gas decreases during the summer months and increases during the
winter months. Seasonal anomalies such as mild winters or hot summers
sometimes lessen this fluctuation. The spot market for oil and gas is
subject to volatility as supply and demand factors fluctuate. We may
periodically enter into financial hedging arrangements with a portion of our oil
and gas production. In December 2009, we purchased a crude oil
commodity floor contract at a premium of $30 thousand. These
activities are intended to support targeted price levels and to manage our
exposure to price fluctuations. See “Item 7A. Quantitative and
Qualitative Disclosures About Market Risk.”
Oil
and Gas Properties and Locations
Production and Revenues – See
also Note 16 – “Oil and Gas Disclosures” in the Notes to Consolidated Financial
Statements contained in Part II, Item 8 of this Annual Report on Form 10-K for
certain information about our proved oil and gas reserves. A summary
of our ownership in our most significant producing properties at December 31,
2009 is as follows:
|
Average
Working
Interest
|
Average
Revenue
Interest
|
||
|
Lake
Raccourci
|
40%
|
27%
|
|
|
Lapeyrouse
|
12%
|
7%
|
|
|
Raymondville
|
22%
|
16%
|
|
|
Main
Pass Block 35
|
91%
|
72%
|
|
|
Creole
|
15%
|
11%
|
5
The
following table shows, for the periods indicated, operating information
attributable to our oil and gas interests:
|
2009
|
2008
|
2007
|
||||||||||
|
Production:
|
||||||||||||
|
Natural
Gas (Mcf)
|
388,000 | 703,000 | 986,000 | |||||||||
|
Oil
(Bbls)
|
148,000 | 149,000 | 172,000 | |||||||||
|
Revenues:
|
||||||||||||
|
Natural
Gas
|
$ | 1,542,000 | $ | 6,913,000 | $ | 7,881,000 | ||||||
|
Oil
|
8,643,000 | 15,293,000 | 12,538,000 | |||||||||
|
Total
|
$ | 10,185,000 | $ | 22,206,000 | $ | 20,419,000 | ||||||
|
Unit
Prices:
|
||||||||||||
|
Natural
Gas (per Mcf)
|
$ | 3.97 | $ | 9.83 | $ | 7.99 | ||||||
|
Oil
(per Bbl)
|
$ | 58.48 | $ | 102.35 | $ | 72.95 | ||||||
|
Production
costs per
equivalent
Mcfe
|
$ | 6.73 | $ | 6.75 | $ | 4.29 | ||||||
|
Amortization
per
equivalent
Mcfe
|
$ | 2.30 | $ | 2.87 | $ | 2.72 | ||||||
Acreage and Wells -- At
December 31, 2009, we owned interests in the following oil and gas wells
and acreage.
| Gross Wells | Net Wells | Developed Acreage | Undeveloped Acreage | |||||||||||||||||||||||||||||
|
State
|
Oil
|
Gas
|
Oil
|
Gas
|
Gross
|
Net
|
Gross
|
Net
|
||||||||||||||||||||||||
|
Texas
|
- | 31 | - | 4.53 | 1,573 | 304 | 2,811 | 237 | ||||||||||||||||||||||||
|
Louisiana
|
69 | 34 | 44.38 | 3.93 | 7,293 | 2,204 | 7,453 | 2,157 | ||||||||||||||||||||||||
|
Other
|
- | 12 | - | 6.44 | - | - | 1,862 | 1,210 | ||||||||||||||||||||||||
|
Total
|
69 | 77 | 44.38 | 14.90 | 8,866 | 2,508 | 12,126 | 3,604 | ||||||||||||||||||||||||
Drilling Activity - A well is
considered “drilled” when it is completed. A productive well is completed when
permanent equipment is installed for the production of oil or gas. A
dry hole is completed when it has been plugged as required and its abandonment
is reported to the appropriate government agency. The following tables summarize
certain information concerning our drilling activity:
| Number of Gross Wells Drilled | ||||||||||||||||||||||||
| Exploratory | Developmental | Total | ||||||||||||||||||||||
|
Productive
|
Drilled
|
Productive
|
Drilled
|
Productive
|
Drilled
|
|||||||||||||||||||
|
2007
|
2 | 3 | 2 | 2 | 4 | 5 | ||||||||||||||||||
|
2008
|
2 | 2 | 1 | 2 | 3 | 4 | ||||||||||||||||||
|
2009
|
0 | 0 | 2 | 2 | 2 | 2 | ||||||||||||||||||
|
Total
|
4 | 5 | 5 | 6 | 9 | 11 | ||||||||||||||||||
6
| Number of Net Wells Drilled | ||||||||||||||||||||||||
| Exploratory | Developmental | Total | ||||||||||||||||||||||
|
Productive
|
Drilled
|
Productive
|
Drilled
|
Productive
|
Drilled
|
|||||||||||||||||||
|
2007
|
0.33 | 0.44 | 0.30 | 0.30 | 0.63 | 0.74 | ||||||||||||||||||
|
2008
|
0.35 | 0.35 | 0.02 | 0.04 | 0.37 | 0.39 | ||||||||||||||||||
|
2009
|
0.00 | 0.00 | 0.30 | 0.30 | 0.30 | 0.30 | ||||||||||||||||||
|
Total
|
0.68 | 0.79 | 0.62 | 0.64 | 1.30 | 1.43 | ||||||||||||||||||
Reserve Information - Our domestic reserve
estimates at December 31, 2009, 2008 and 2007 have been prepared by Collarini
Associates and Crest Engineering Services, Inc., both of which are independent,
registered members of a professional engineering society in the state of Texas.
We internally tested these reports to ensure the inputs and assumptions used are
reasonable, as well as reviewed the qualifications of both Collarini and Crest.
Proved oil and gas reserves are defined as the estimated quantities of crude
oil, natural gas, and natural gas liquids which geological and engineering data
demonstrate with reasonable certainty to be recoverable in future years from
known reservoirs under existing economic and operating
conditions. Reservoirs are considered proved if economic
productibility is supported by either actual production or conclusive formation
tests. The area of a reservoir considered proved includes that portion
delineated by drilling and defined by gas-oil and/or oil-water contacts, if any,
and the immediately adjoining portions not yet drilled, but which can be
reasonably judged as economically productive on the basis of available
geological and engineering data. In the absence of information on fluid
contacts, the lowest known structural occurrence of hydrocarbons controls the
lower proved limit of the reservoir. Reserves which can be produced economically
through application of improved recovery techniques are included in the “proved”
classification when successful testing by a pilot project or the operation of an
installed program in the reservoir, provides support for the engineering
analysis on which the project or program was based.
The
reliability of reserve information is considerably affected by several factors.
Reserve information is imprecise due to the inherent uncertainties in, and the
limited nature of, the data based upon which the estimating of reserve
information is predicated. Moreover, the methods and data used in estimating
reserve information are often necessarily indirect or analogical in character
rather than direct or deductive. Furthermore, estimating reserve information by
applying generally accepted petroleum engineering and evaluation principles
involves numerous judgments based upon the engineer’s educational background,
professional training and professional experience. The extent and
significance of the judgments to be made are, in themselves, sufficient to
render reserve information inherently imprecise.
7
|
(Unaudited)
|
||||||||
|
Total
(1)
|
||||||||
|
Oil
(Barrels)
|
Gas (Mcf)
|
|||||||
|
(in
thousands)
|
||||||||
|
Proved
reserves:
|
||||||||
|
As
of December 31, 2006
|
1,856 | 7,005 | ||||||
|
Extensions
and discoveries
|
220 | 311 | ||||||
|
Revisions
|
486 | (1,135 | ) | |||||
|
Production
|
(172 | ) | (986 | ) | ||||
|
Purchases
of reserves in place
|
- | - | ||||||
|
Sales
of reserves in place
|
(21 | ) | (175 | ) | ||||
|
As of December 31, 2007
(2)
|
2,369 | 5,020 | ||||||
|
Extensions
and discoveries
|
371 | 601 | ||||||
|
Revisions
|
(1,132 | ) | (703 | ) | ||||
|
Production
|
(149 | ) | (703 | ) | ||||
|
Purchases
of reserves in place
|
- | - | ||||||
|
Sales
of reserves in place
|
- | - | ||||||
|
As of December 31, 2008
(2)
|
1,459 | 4,215 | ||||||
|
Extensions
and discoveries
|
221 | 203 | ||||||
|
Revisions
|
82 | (1,016 | ) | |||||
|
Production
|
(148 | ) | (388 | ) | ||||
|
Purchases
of reserves in place
|
1 | 61 | ||||||
|
Sales
of reserves in place
|
- | - | ||||||
|
As of December 31, 2009
(2)
|
1,615 | 3,075 | ||||||
|
Proved
developed reserves at:
|
||||||||
|
December
31, 2007 (3)
|
1,880 | 4,619 | ||||||
|
December
31, 2008 (3)
|
925 | 1,013 | ||||||
|
December
31, 2009 (3)
|
1,425 | 2,890 | ||||||
|
(1)
|
All
reserves were held within the United States for the years ended December
31, 2009, 2008 and 2007.
|
|
(2)
|
Not
included are our proportional interests of 236,750 barrels and 272,000
Mcf, 237,330 barrels and 240,300 Mcf and 225,750 barrels and 262,750 Mcf
of proved reserves from our equity investment in Spitfire at December 31,
2007, 2008 and 2009 respectively. Spitfire’s reserve report
information is as of March 31, 2007, 2008 and 2009 (their fiscal
year-end). Their reserve report is not compiled in accordance with the SEC
guidelines.
|
|
(3)
|
Not
included are our proportional interests of 201,000 barrels and 228,750 Mcf
, 190,350 barrels and 156,060 Mcf and 163,750 barrels and 220,250 Mcf of
proved developed reserves from our equity investment in Spitfire at
December 31, 2007, 2008 and 2009, respectively. Spitfire’s
reserve report information is as of March 31, 2007, 2008 and 2009 (their
fiscal year-end). Their reserve report is not compiled in
accordance with the SEC guidelines.
|
8
At
December 31, 2009, we had two fields, Main Pass and Creole Field, that contained
15% or more of our total proved reserves. The following table shows the
production for these fields for the year ended December 31:
|
2009
|
2008
|
2007
|
||||||||||||||||||||||
|
Field:
|
Oil
(Bbls)
|
Gas
(Mcf)
|
Oil
(Bbls)
|
Gas
(Mcf)
|
Oil
(Bbls)
|
Gas
(Mcf)
|
||||||||||||||||||
|
Main
Pass
|
104,965 | - | 100,508 | - | 119,815 | - | ||||||||||||||||||
|
Creole
Field
|
23,720 | 66,342 | 17,610 | 22,831 | 6,848 | 6,958 | ||||||||||||||||||
Coalbed
Methane Prospects – Indiana and Ohio
At
December 31, 2009, we currently hold two coalbed methane exploration and
development agreements in Indiana and Ohio. These prospects each provide for an
area of mutual interest of approximately 400,000 acres. The agreements provide
for a phased delineation, pilot and development program with corresponding
staged expenditures. Third party consultants with a long track record in
successful coalbed methane development provide expert advice for these
projects. Currently, we are in the dewatering phase in which the
pilot wells are produced to maximize fluid (water) production in order to lower
reservoir pressure so that desorption of gas can occur in the pilot test wells
on the Indiana Posey Contract area. We continue to evaluate their
progress. With the decline in oil and gas commodity prices, resource
plays, such as coalbed methane prospects, can become uneconomical in low price
environments particularly since all well, facility and flowline costs as well
as operating costs during the dewatering/desorption process must be
incurred before revenues can generated. Our discretionary capital
expenditures, including costs related to our coalbed methane prospects, may be
curtailed at our discretion in the future. Such expenditure curtailments could
result in us losing certain prospect acreage or reducing our interest in future
development projects.
International
Energy Investment – Global Energy Development PLC
At
December 31, 2009 and 2008, we held an investment in Global Energy Development
PLC (“Global”) through our ownership of approximately 34% of Global’s ordinary
shares. We account for our ownership of Global shares as a cost method
investment. Global is a petroleum exploration and production company focused on
Latin America. Global’s shares are traded on the AIM, a market operated by the
London Stock Exchange. See Note 3 – “Other Investments” in the Notes
to Consolidated Financial Statements contained in Part II, Item 8 of this Annual
Report on Form 10-K for further information. Additional information regarding
Global’s operations may be found on their website, www.globalenergydevelopmentplc.com.
Canadian
Energy Investment – Spitfire Energy, Ltd.
At
December 31, 2009 and 2008, we held an investment in Spitfire Energy, Ltd.
(“Spitfire”) through the ownership of approximately 25% and 27%, respectively,
of Spitfire’s currently outstanding common shares. Spitfire is an independent
public company (TSX-V; SEL) engaged in the exploration, development and
production of crude oil, natural gas and natural gas liquids in Western
Canada. At December 31, 2009, we owned 9.9 million common shares of
Spitfire and 1.3 million warrants to acquire common shares of Spitfire. As a
result of our ownership of Spitfire’s outstanding common shares, we are deemed
to have the ability to exert significant influence over Spitfire’s operating and
financial policies. Accordingly, we reflect our investment in Spitfire as an
equity method investment. During 2009, we sold approximately 1.2
million shares of Spitfire in the market for total proceeds of $212 thousand.
Additional information regarding Spitfire’s operations may be found on their
website, www.spitfireenergy.com.
9
Investment
in BriteWater International, LLC (formerly UniPureEnergy)
In
June 2009, we acquired a 19.5% interest in a private company,
BriteWater International, LLC (“BWI”), formerly known as UniPureEnergy
Acquisition, LLC (“UniPure Energy”), which holds patents to the emulsion
breaking “OHSOL” technology. This environmentally-clean process can
be used to purify oilfield emulsions by breaking and separating the emulsions
into oil, water and solids. This technology has been successfully tested using a
mobile OHSOL unit in a demonstration in Prudhoe Bay, Alaska, which demonstrated
the effectiveness of the OHSOL emulsion breaking technology to recover valuable
hydrocarbons and reduce wastes. BWI is currently pursuing opportunities to
commercialize the OHSOL technology by performing emulsion testing of the OHSOL
plant equipment both internationally and domestically.
Discontinued
Operations – Canergy Management Company and Canergy Growth Fund
In 2008, we created the Canergy Growth
Fund to invest in the Canadian junior oil and gas market. As a result
of the dramatic decline in the U.S. and foreign stock markets, and in order to
avoid future additional significant losses, Canergy Growth Fund divested of all
of its common stock holdings in Canadian junior oil and gas companies during
2008. With the continued economic volatility in 2009, we did not participate in
any additional investments during 2009. In the fourth quarter 2009,
we chose to dissolve the Canergy Growth Fund and Canergy Management Company. The
results of operations have been reclassified to discontinued operations in our
Consolidated Financial Statements. See Note 13 – “Discontinued Operations” in
the Notes to Consolidated Financial Statements contained in Part III, Item 8 of
this Annual Report on Form 10-K for further information.
Energy-Based
Trading Investments
In 2008, due to the dramatic volatility
in the U.S. and international stock markets, we terminated all our common stock
and common stock derivative contracts used for trading purposes. We had
previously maintained an investment portfolio of investments in energy industry
and foreign currency securities traded on domestic securities
exchanges. We did not participate in the trading of energy-based
investments in 2009. Therefore, we had no total potential obligations or
exposure associated with such instruments as of December 31,
2009. See “Note 3 – Other Investments” in the Notes to Consolidated
Financial Statements contained in Part II, Item 8 of this Annual Report on Form
10-K for financial information regarding our trading activities.
Employees
At
December 31, 2009, we had 16 employees. We have experienced no work
stoppages or strikes as a result of labor disputes and consider relations with
our employees to be satisfactory. We maintain group medical, dental, surgical
and hospital insurance plans for our employees.
ITEM
1A. RISK FACTORS
We wish to caution you that there are
risks and uncertainties that could cause our actual results to be materially
different from those indicated by forward-looking statements that we make from
time to time in filings with the SEC, news releases, reports, proxy statements,
registration statements and other written communications, as well as oral
forward-looking statements made from time to time by our representatives. These
risks and uncertainties include, but are not limited to, the risks described
below. Because of the following factors, as well as other variables affecting
our operating results, past financial performance may not be a reliable
indicator of future performance, and historical trends should not be used to
anticipate results or trends in future periods. We do not assume any obligation
to update forward-looking statements.
10
Risks
associated with our crude oil and natural gas operations:
Oil
and gas price fluctuations in the market may adversely affect the results of our
operations.
Our
profitability, cash flows and the carrying value of our oil and natural gas
properties are highly dependent upon the market prices of oil and natural gas.
Substantially all of our sales of oil and natural gas are made in the spot
market, or pursuant to contracts based on spot market prices, and not pursuant
to long-term, fixed-price contracts. Accordingly, the prices received
for our oil and natural gas production are dependent upon numerous factors
beyond our control. These factors include the level of consumer product demand,
governmental regulations and taxes, the price and availability of alternative
fuels, the level of foreign imports of oil and natural gas and the overall
economic environment. Historically, the oil and natural gas markets
have proven cyclical and volatile as a result of factors that are beyond our
control. Any additional declines in oil and natural gas prices or any
other unfavorable market conditions could have a material adverse effect on our
financial condition and on the carrying value of our proved
reserves. During 2009, commodity pricing for both crude oil and
natural gas has continued to average below pricing from the respective prior
year period. During 2009, based on NYMEX pricing, the price for a barrel (bbl)
of oil ranged from a high of $81.37 to a low of $33.98 and the price for a Mmbtu
of gas ranged from a high of $6.10 to a low of $1.92.
Our future success depends on our
ability to find, develop and produce oil and gas
reserves.
As is generally the case, our producing
properties in the Gulf of Mexico and the onshore Gulf Coast often have high
initial production rates which are followed by steep declines. To maintain
production levels, we must locate and develop or acquire new oil and gas
reserves to replace those depleted by production. Without successful exploration
or acquisition activities, our reserves, production and revenues will decline
rapidly. We may be unable to find, develop or produce additional reserves at an
acceptable cost. In addition, substantial capital is required to replace and
grow reserves. If lower oil and gas prices or operating constraints or
production difficulties result in our cash flow from operations being less than
expected, we may be unable to expend the capital necessary to locate and develop
or acquire new oil and gas reserves.
Actual quantities of recoverable oil
and gas reserves and future cash flows from those reserves most likely will vary
from our estimates.
Estimating accumulations of oil and gas
is complex. The process relies on interpretations of available geological,
geophysical, engineering and production data. The extent, quality and
reliability of this data can vary. The process also requires certain economic
assumptions, some of which are mandated by the SEC, such as oil and gas prices,
drilling and operating expenses, capital expenditures, taxes and availability of
funds. The accuracy of a reserve estimate is a function of:
|
•
|
the
quality and quantity of available data;
|
|
•
|
the
interpretation of that data;
|
|
•
|
the
accuracy of various mandated economic
assumptions; and
|
|
•
|
the
judgment of the persons preparing the
estimate.
|
The
proved reserve information set forth in this report is based on estimates we
prepared in accordance with the definition of proved reserves prepared in
accordance with Financial Accounting Standards Board’s Accounting Standards
Codification 932, Extractive
Activities- Oil and Gas (“ASC 932”), which was adopted for the
disclosures for the year December 31, 2009.
Estimates
prepared by others might differ materially from our estimates. Actual quantities
of recoverable oil and gas reserves, future production, oil and gas prices,
revenues, taxes, development expenditures and operating expenses most likely
will vary from our estimates. Any significant variance could materially affect
the quantities and net present value of our reserves. In addition, we may adjust
estimates of proved reserves to reflect production history, results of
exploration and development and prevailing oil and gas prices. Our reserves also
may be susceptible to drainage by operators on adjacent properties.
11
You
should not assume that the present value of future net cash flows is the current
market value of our estimated proved oil and gas reserves. In accordance with
new reserve disclosure requirements, we calculate the estimated discounted
future net cash flows from proved reserves using twelve (12) month average
prices and costs. Actual future prices and costs may be materially higher or
lower than the prices and costs we used.
Our
operations require significant expenditures of capital that may not be
recovered.
We
require significant expenditures of capital in order to locate and develop
producing properties and to drill exploratory and exploitation
wells. In conducting exploration, exploitation and development
activities from a particular well, the presence of unanticipated pressure or
irregularities in formations, miscalculations or accidents may cause our
exploration, exploitation, development and production activities to be
unsuccessful, potentially resulting in abandonment of the well. This
could result in a total loss of our investment. In addition, the cost
and timing of drilling, completing and operating wells is difficult to
predict.
We
are dependent on other operators who influence our productivity.
We have
limited influence over the nature and timing of exploration and development on
oil and natural gas properties we do not operate, including limited control over
the maintenance of both safety and environmental standards. In 2009,
approximately 46% of our production and 37% of our reserves were from our
non-operated properties. The operators of those properties may:
|
·
|
refuse
to initiate exploration or development
projects,
|
|
·
|
initiate
exploration or development projects on a slower schedule than we prefer;
or
|
|
·
|
drill
more wells or build more facilities on a project than we can adequately
fund, which may limit our participation in those projects or limit our
percentage of the revenues from those
projects.
|
The
occurrence of any of the foregoing events could have a material adverse effect
on our anticipated exploration and development activities.
Our
working interest owners may face cash flow and liquidity concerns.
If oil
and natural gas prices decline, many of our working interest owners could
experience liquidity and cash flow problems. These problems may lead
to their attempting to delay the pace of drilling or project development in
order to conserve cash. Any such delay could be detrimental to our
projects. Some working interest owners may be unwilling or unable to
pay their share of the project costs as they become due. A working
interest owner may declare bankruptcy and refuse or be unable to pay its share
of the project costs, and we would be obligated to pay that working interest
owner’s share of the project costs.
12
The
oil and gas we produce may not be readily marketable at the time of
production.
Crude
oil, natural gas, condensate and other oil and gas products are generally sold
to other oil and gas companies, government agencies and other
industries. The availability of ready markets for oil and gas that we
might discover and the prices obtained for such oil and gas depend on many
factors beyond our control, including:
|
·
|
the
extent of local production and imports of oil and
gas,
|
|
·
|
the
proximity and capacity of pipelines and other transportation
facilities,
|
|
·
|
fluctuating
demand for oil and gas,
|
|
·
|
the
marketing of competitive fuels, and
|
|
·
|
the
effects of governmental regulation of oil and gas production and
sales.
|
Natural
gas associated with oil production is often not marketable due to demand or
transportation limitations and is often flared at the producing well
site. Pipeline facilities do not exist in certain areas of
exploration and, therefore, any actual sales of discovered oil and gas might be
delayed for extended periods until such facilities are constructed.
We
may encounter operating hazards that may result in substantial
losses.
We are
subject to operating hazards normally associated with the exploration and
production of oil and gas, including hurricanes, blowouts, explosions, oil
spills, cratering, pollution, earthquakes, labor disruptions and
fires. The occurrence of any such operating hazards could result in
substantial losses to us due to injury or loss of life and damage to or
destruction of oil and gas wells, formations, production facilities or other
properties. We maintain insurance coverage limiting financial loss
resulting from certain of these operating hazards. We do not maintain
full insurance coverage for all matters that may adversely affect our
operations, including war, terrorism, nuclear reactions, government fines,
treatment of waste, blowout expenses, wind damage and business
interruptions. Losses and liabilities arising from uninsured or
underinsured events could reduce our revenues or increase our costs. There can
be no assurance that any insurance will be adequate to cover losses or
liabilities associated with operational hazards. We cannot predict
the continued availability of insurance, or its availability at premium levels
that justify its purchase.
Oil
and gas wells particularly in certain regions of the United States could be
hindered by hurricanes, earthquakes and other weather-related operating
risks.
Our
operations in the Texas and Louisiana Gulf Coast area are subject to risks from
hurricanes and other natural disasters. Damage caused by wind, hurricanes,
earthquakes or other operating hazards could result in substantial losses to us.
In the past, our oil and gas operations have been affected by tropical storms
and hurricanes on occasion resulting in additional costs and reduced oil and gas
volumes during those periods.
We
face strong competition from larger oil and gas companies, which could result in
adverse effects on our business.
The
exploration and production business is highly competitive. Many of
our competitors have substantially larger financial resources, staffs and
facilities. Our competitors in the United States include numerous
major oil and gas exploration and production companies. Our
investments in Spitfire and Global may be affected as a result of the
competition faced in Canada, Colombia, Peru and Panama.
13
Our
operations are subject to various litigation that could have an adverse effect
on our business.
From time
to time we are a defendant in various litigation matters. The nature of our
operations expose us to further possible litigation claims in the future. There
is risk that any matter in litigation could be adversely decided against us
regardless of our belief, opinion and position, which could have a material
adverse effect on our financial condition and results of operations. Litigation
is highly costly and the costs associated with defending litigation could also
have a material adverse effect on our financial condition.
Compliance
with, or breach of, environmental laws can be costly and could limit our
operations.
Our
operations are subject to numerous and frequently changing laws and regulations
governing the discharge of materials into the environment or otherwise relating
to environmental protection. We own or lease, and have in the past
owned or leased, properties that have been used for the exploration and
production of oil and gas and these properties and the wastes disposed on these
properties may be subject to the Comprehensive Environmental Response,
Compensation and Liability Act, the Oil Pollution Act of 1990, the Resource
Conservation and Recovery Act, the Federal Water Pollution Control Act and
analogous state laws. Under such laws, we could be required to remove
or remediate previously released wastes or property
contamination. Laws and regulations protecting the environment have
generally become more stringent and may, in some cases, impose “strict
liability” for environmental damage. Strict liability means that we
may be held liable for damage without regard to whether we were negligent or
otherwise at fault. Environmental laws and regulations may expose us
to liability for the conduct of or conditions caused by others or for acts that
were in compliance with all applicable laws at the time they were
performed. Failure to comply with these laws and regulations may
result in the imposition of administrative, civil and criminal
penalties.
Although
we believe that our operations are in substantial compliance with existing
requirements of governmental bodies, our ability to conduct continued operations
is subject to satisfying applicable regulatory and permitting controls. Our
current permits and authorizations and ability to get future permits and
authorizations may be susceptible on a going forward basis, to increased
scrutiny, greater complexity resulting in increased costs, or delays in
receiving appropriate authorizations.
We
may be affected by global climate change or by legal, regulatory, or market
responses to such change.
The
growing political and scientific sentiment is that increased concentrations of
carbon dioxide and other greenhouse gases in the atmosphere are influencing
global weather patterns. Changing weather patterns, along with the increased
frequency or duration of extreme weather conditions, could impact the
availability or increase the cost to produce our products. Additionally, the
sale of our products can be impacted by weather conditions.
Concern
over climate change, including global warming, has led to legislative and
regulatory initiatives directed at limiting the greenhouse gas (“GHG”)
emissions. For example, proposals that would impose mandatory requirements on
GHG emissions continue to be considered by policy makers in the territories we
operate. Laws enacted that directly or indirectly affect our oil and gas
production could impact our business and financial results.
Risk
factors associated with our financial condition:
We
have a history of losses and may suffer losses in the future.
We
reported a net loss of approximately $3.3 million and $27 million for the years
ended December 31, 2009 and 2008, respectively. We have reported net losses in
three of the last five fiscal years. Our ability to generate net
income is strongly affected by, among other factors, the market price of crude
oil and natural gas. During 2008, we recorded a write-down of the
carrying value of our oil and gas properties of approximately $19.9 million
which was primarily due to the significant decline in the market price of crude
oil and natural gas at December 31, 2008. We had no such write-down in 2009;
however, we may report losses in the future. Consequently, future
losses may adversely affect our business, prospects, financial condition,
results of operations and cash flows.
14
If
estimated discounted future net cash flows continue to decrease, we may be
required to take additional write-downs.
We
periodically review the carrying value of our oil and gas properties under
applicable full-cost accounting rules. These rules require a write-down of the
carrying value of oil and gas properties if the carrying value exceeds the
applicable estimated discounted future net cash flows from proved oil and gas
reserves. Given the volatility of oil and gas prices, it is reasonably possible
that the estimated discounted future net cash flows could change in the near
term. If oil and gas prices decline in the future, even if only for a short
period of time, it is possible that write-downs of oil and gas properties could
occur. Whether we will be required to take such a charge will depend on the
average prices for oil and gas during the period and the effect of reserve
additions or revisions, property sales and capital expenditures during such
quarter.
Our
financial condition may suffer if estimates of our oil and gas reserve
information are adjusted, and fluctuations in oil and gas prices and other
factors affect our oil and gas reserves.
Our oil
and gas reserve information is based upon criteria prepared in accordance with
Financial Accounting Standards Board’s Accounting Standards Codification 932,
Extractive Activities- Oil and
Gas (“ASC 932”) and the Securities and Exchange Commission’s Final Rule,
Modernization of the Oil and
Gas Reporting Requirements, and reflects only estimates of the
accumulation of oil and gas and the economic recoverability of those
volumes. Our future production, revenues and expenditures with
respect to such oil and gas reserves could be different from estimates, and any
material differences may negatively affect our business, financial condition and
results of operations.
Petroleum
engineering is a subjective process of estimating underground accumulations of
oil and gas that cannot be measured in an exact manner. Estimates of
economically recoverable oil and gas reserves and of future net cash flows
necessarily depend upon a number of variable factors and
assumptions.
Because
all reserve estimates are to some degree subjective, each of the following items
may prove to differ materially from that assumed in estimating
reserves:
|
·
|
the
quantities of oil and gas that are ultimately
recovered,
|
|
·
|
the
production and operating costs
incurred,
|
|
·
|
the
amount and timing of future development expenditures,
and
|
|
·
|
future
oil and gas sales prices.
|
Furthermore,
different reserve engineers may make different estimates of reserves and cash
flow based on the same available data.
The estimated discounted future net
cash flows described in this Annual Report for the year ended December 31, 2009
should not be considered as the current market value of the estimated oil and
gas reserves attributable to our properties from proved
reserves. Such estimates are prepared in compliance with the ASC 932,
Oil
and Gas Reserve Estimation and Disclosures and the Securities and Exchange
Commission’s Final Rule, Modernization of
the Oil and Gas Reporting Requirements, and, as such, are based on average
prices and costs as of the date of the estimate, while future prices and costs
may be materially higher or lower. The Standard requires that we
report our oil and natural gas reserves using a 12-month average price,
calculated as the unweighted arithmetic average of the first-day-of-the-month
price for each month within the 12-month period prior to the end of the
reporting period, unless prices are defined by contractual arrangements,
excluding escalations based upon future conditions. Using lower values in
forecasting reserves will result in a shorter life being given to producing oil
and natural gas properties because such properties, as their production levels
are estimated to decline, will reach an uneconomic limit, with lower prices, at
an earlier date. There can be no assurance that a decrease in oil and
gas prices or other differences in our estimates of its reserve will not
adversely affect our financial condition and results of
operations.
15
If
the market value of our investments in Global and Spitfire continue to decrease,
the value of our common stock could be negatively impacted.
At
December 31, 2009, we held investments in both Global and Spitfire through our
ownership of approximately 34% and 25%, respectively, of their outstanding
ordinary shares. Both investments represent a substantial part of our
balance sheet at December 31, 2009. The market value of Global’s
common shares increased while the value of Spitfire’s common shares decreased
slightly during 2009, as compared to the prior year period, but there can be no
assurance that their common stock will continue to improve in the future. A
potential decrease in the value of their common stock could adversely affect our
financial statements and the value of our common stock.
We
may suffer losses on our investments from exchange rate
fluctuations.
We
account for our investments in Global and Spitfire using the U.S. dollar as the
functional currency. The shares of common stock associated with our
investments in Global and Spitfire are denominated in British sterling pounds
and Canadian dollars, respectively. We could suffer losses in our
investments if the value of the British sterling pound and the Canadian dollar
were to drop relative to the value of the U.S. dollar. Any
substantial currency fluctuations could create a material adverse effect on the
value of our investments.
One
of our shareholders owns a significant amount of our common stock and exercises
significant control over us.
As of
December 31, 2009, Lyford Investments Enterprises Ltd. (“Lyford”) beneficially
owned approximately 33% of the combined voting power of our outstanding common
stock. Lyford is in a position to significantly influence decisions with respect
to:
|
·
|
our
direction and policies, including the election and removal of
directors,
|
|
·
|
mergers
or other business combinations,
|
|
·
|
the
acquisition or disposition of our
assets,
|
|
·
|
future
issuances of our common stock or other
securities,
|
|
·
|
our
incurrence of debt, and
|
|
·
|
the
payment of dividends, if any, on our common stock, and amendments to our
certificate of incorporation and
bylaws.
|
Lyford’s
concentration of ownership may also have the effect of delaying, deferring or
preventing a future change of control.
16
Risks
associated with market conditions:
Our
stock price is volatile and the value of any investment in our common stock may
fluctuate.
Our stock
price has been and is highly volatile, and we believe this volatility is due to,
among other things:
|
·
|
commodity
prices of oil and natural gas,
|
|
·
|
the
volatility of the market in
general,
|
|
·
|
the
results of our drilling,
|
|
·
|
current
expectations of our future financial
performance.
|
For
example, our common stock price has fluctuated from a high of $13.10 per share
to a low of $1.40 per share over the three years ended December 31,
2009. This volatility may affect the market value of our common stock
in the future. See Part II, Item 5: Market for Registrant’s Common
Equity, Related Stockholder Matters and Issuer Purchases of Equity
Securities.
Future
sales of our common stock may affect the market price of our common
stock.
There are
currently several registration statements with respect to our common stock that
are effective, pursuant to which certain of our stockholders may sell shares of
common stock. Any such sale of stock may also decrease the market
price of our common stock.
Any
conversions of our Series G1 Preferred or Series G2 Preferred Stock involving a
large issuance of shares of our common stock could result in a dilution of
stockholders’ ownership percentage of our common stock and may result in a
decrease in the market value of our common stock. In addition, we may
elect to issue a significant number of additional shares of common stock for
financing or other purposes, which could result in a decrease in the market
price of our common stock.
We
have issued shares of preferred stock with greater rights than our common stock
and may issue additional shares of preferred stock in the future.
We are
permitted under our charter to issue up to 1.0 million shares of preferred
stock. We can issue shares of our preferred stock in one or more
series and can set the terms of the preferred stock without seeking any further
approval from our common
stockholders. Any preferred stock that we issue may rank ahead of our
common stock in terms of dividend priority or liquidation premiums and may have
greater voting rights than our common stock. At December 31, 2009, we
had outstanding 1,000 shares of Series G1 Preferred and 1,000 shares of Series
G2 Preferred. These shares of preferred stock have rights senior to our common
stock with respect to dividends and liquidation.
We
may issue additional shares of common stock which may dilute the value of our
common stock and adversely affect the market price of our common
stock.
Pursuant
to the terms of our investment in BWI and the related Agreement, HKN and the
other BWI unitholders granted to one another put and call options with respect
to 3,050 units of BWI in exchange for issuance of 725 thousand restricted shares
of our common stock. These options are exercisable only if certain
conditions are satisfied prior to June 2012.
17
A large
issuance of shares of common stock could decrease the ownership percentage of
current outstanding stockholders and could result in a decrease in the market
price of our common stock. In addition, we may elect to issue
additional shares of common stock for financing or other purposes, which could
result in a decrease in the market price of our common stock.
ITEM
1B. UNRESOLVED STAFF COMMENTS
None.
ITEM
2. PROPERTIES
See
Item 1. “Business” for discussion of oil and gas properties and
locations.
We have
an office in Southlake, Texas. We have a lease for approximately 4,062 square
feet in Southlake, Texas, which runs through April 30, 2011. We
sublease approximately 1,866 square feet of office space in Katy, Texas to a
third-party. This lease runs through July 31, 2011. The average
annual cost of our leases is approximately $190 thousand. See “Liquidity and
Capital Resources – Obligations and Commitments – Consolidated Contractual
Obligations” contained in Part II, Item 7, Management’s Discussion and Analysis
of Financial Condition and Results of Operations.
ITEM
3. LEGAL PROCEEDINGS
IRS Examination - On August
6, 2008, we received a Revenue Agent’s Report in which the Internal Revenue
Service (“IRS”) proposed an adjustment to our federal tax liability for the
calendar year 2005. The proposed adjustment relates to the
calculation of the adjusted current earnings (“ACE”) component of the
alternative minimum tax and asserts that the Company should have recognized a
gain for ACE purposes on the sale of the Global PLC stock in 2005. In
its proposed adjustment, the IRS alleges that the Company owes approximately
$3.6 million in tax for the year ended December 31, 2005. Penalties and interest
calculated through December 31, 2009 in the amount of $2.1 million could also be
assessed. In response to the proposed adjustment and corresponding tax
assessment, the Company filed a written protest and request for conference on
September 5, 2008 to address the proposed adjustment with the Appeals division
of the IRS. In October 2008, we received an acknowledgement of
receipt of our written protest and request for conference from the IRS Appeals
Office. In April 2009, we filed our supplement to the written protest
filed with the IRS. Based on correspondence received to date, the IRS
Appeals Office is still considering the matter.
We have
recorded an income tax contingency, including interest and penalties, as of
December 31, 2009, of $225 thousand in our consolidated financial statements
based, in part, on a preliminary indication of a probability-weighted fair value
assessment of the Global stock. We intend to vigorously defend the proposed
adjustment and strongly believe that the Company has meritorious
defenses.
ITEM
4. SUBMISSION OF MATTERS TO A VOTE OF SECURITY HOLDERS
There were no matters submitted to a
vote of security holders during the fourth quarter of 2009.
18
PART
II
ITEM
5. MARKET FOR REGISTRANT’S COMMON EQUITY, RELATED STOCKHOLDER MATTERS
AND ISSUER PURCHASES OF EQUITY SECURITIES
Price
Range of Common Stock
Beginning
March 1991 until June 2007, our common stock was listed on the American Stock
Exchange and traded under the symbol HEC. In June 2007, the trading symbol of
our common stock was changed to the symbol HKN. The American Stock Exchange was
acquired by NYSE Euronext during 2008 and renamed NYSE Amex. Our common stock is
currently traded on this exchange under the symbol HKN. At December
31, 2009, there were 891 holders of record of our common stock.
The
following table sets forth, for the periods indicated, the reported high and low
closing sales prices of our common stock on the American Stock Exchange
Composite Tape.
|
Prices
|
|||||||||||
|
High
|
Low
|
||||||||||
| 2008-- |
First
Quarter
|
$ | 9.02 | $ | 7.61 | ||||||
|
Second
Quarter
|
13.10 | 8.38 | |||||||||
|
Third
Quarter
|
11.55 | 7.85 | |||||||||
|
Fourth
Quarter
|
8.35 | 2.39 | |||||||||
| 2009-- |
First
Quarter
|
$ | 3.19 | $ | 1.48 | ||||||
|
Second
Quarter
|
2.75 | 1.40 | |||||||||
|
Third
Quarter
|
3.09 | 2.15 | |||||||||
|
Fourth
Quarter
|
3.90 | 2.91 | |||||||||
Dividends
We have not paid any cash dividends on
common stock since our organization, and we do not contemplate that any cash
dividends will be paid on shares of our common stock in the foreseeable future.
Dividends may not be paid to holders of common stock prior to all dividend
obligations related to our Series G1 Preferred Stock and Series G2 Preferred
Stock being satisfied.
For discussion of dividends paid to
holders of our preferred stock and the terms of our preferred stock outstanding,
see Part II, Item 8, Notes to Consolidated Financial Statements, “Note 11 –
Stockholders’ Equity.”
Equity
Compensation Plans
We have no equity compensation plans.
There are no shares currently authorized for issuance related to equity
compensation.
Performance
of the Common Stock
The following performance graph shall
not be deemed incorporated by reference by any general statement incorporating
by reference in the Annual Report on Form 10-K into any filing under the
Securities Act of 1933 or the Securities Exchange Act of 1934, except to the
extent that we specifically incorporate this information by reference, and shall
not otherwise be deemed filed under such Acts.
19
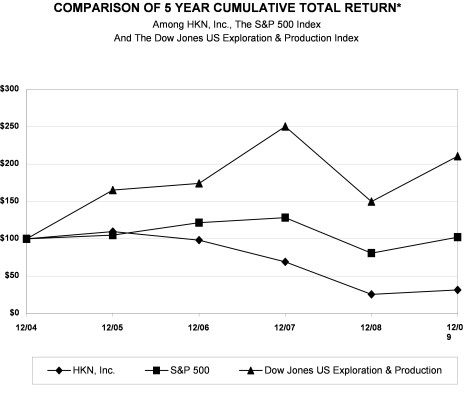
The graph below compares the cumulative
total stockholder return on the Common Stock for the last five fiscal years with
the cumulative total return on the S&P 500 Index and the Dow Jones
Exploration and Production Index over the same period (assuming the investment
of $100 in the Common Stock, the S&P 500 Index and the Dow Jones Secondary
Oils Stock Index on December 31, 2004 and reinvestment of all
dividends).
Comparison
of Cumulative Total Return
Assumes
Initial Investment of $100 on December 31, 2004
Information
on Share Repurchases
The following table provides
information about purchases by us pursuant to our previously announced share
repurchase program during the three months ended December 31, 2009, of our
Common Stock:
|
Total
Number
|
Total
Number
of
Shares
Purchased
as
part
of Publicly
|
Maximum
Number
of Shares
that
May Yet Be
Purchased
Under
|
||||||||||||||
|
of
Shares
|
Average
Price
|
Announced
|
the
Plans or
|
|||||||||||||
|
Period
|
Purchased
|
Paid
per Share
|
Program
|
Programs
|
||||||||||||
|
October
1, 2009 through October 31, 2009
|
- | $ | - | 664,924 | 572,356 | |||||||||||
|
November
1, 2009 through November 30, 2009
|
42,752 | $ | 4.00 | 707,676 | 529,604 | |||||||||||
|
December
1, 2009 through December 31, 2009
|
18 | $ | 3.68 | 707,694 | 529,586 | |||||||||||
|
Total
|
42,770 | $ | 4.00 | 707,694 | 529,586 | |||||||||||
20
|
ITEM
6. SELECTED FINANCIAL
DATA
|
The
information set forth below is not necessarily indicative of results of future
operations, and should be read in conjunction with Item 7, “Management’s
Discussion and Analysis of Financial Condition and Results of Operations”: and
the consolidated financial statements and related notes thereto included in Item
8 of this Form 10-K to fully understand factors that may affect the
comparability of the information presented below.
|
December
31,
|
||||||||||||||||||||
|
2009 (4)
|
2008
|
2007
|
2006 (3)
|
2005
|
||||||||||||||||
|
(in
thousands, except for share amounts)
|
||||||||||||||||||||
|
Operating
Data:
|
||||||||||||||||||||
|
Revenues
and other
|
$ | 12,368 | $ | 20,263 | $ | 24,298 | $ | 30,273 | $ | 40,062 | ||||||||||
|
Net
income/(loss) before cumulative effect of change in
|
||||||||||||||||||||
|
accounting
principle
|
$ | (3,345 | ) | $ | (25,905 | ) | $ | 3,229 | $ | 13 | $ | 42,655 | ||||||||
|
Net
income/(loss)
|
$ | (3,345 | ) | $ | (26,954 | ) | $ | 3,229 | $ | (855 | ) | $ | 42,655 | |||||||
|
Net
income/(loss) attributed to common stock
|
$ | (3,469 | ) | $ | (27,108 | ) | $ | 2,965 | $ | (2,244 | ) | $ | 42,068 | |||||||
|
Basic income/(loss) per common
share: (1)
|
||||||||||||||||||||
|
Net
income/(loss) before cumulative effect of change in
|
||||||||||||||||||||
|
accounting
principle
|
$ | (0.37 | ) | $ | (2.83 | ) | $ | 0.30 | $ | (0.14 | ) | $ | 4.30 | |||||||
|
Net
income/(loss)
|
$ | (0.37 | ) | $ | (2.83 | ) | $ | 0.30 | $ | (0.23 | ) | $ | 4.30 | |||||||
|
Diluted income/(loss) per common
share: (1)
|
||||||||||||||||||||
|
Net
income/(loss) before cumulative effect of change in
|
||||||||||||||||||||
|
accounting
principle
|
$ | (0.37 | ) | $ | (2.83 | ) | $ | 0.30 | $ | (0.14 | ) | $ | 3.95 | |||||||
|
Net
income/(loss)
|
$ | (0.37 | ) | $ | (2.83 | ) | $ | 0.30 | $ | (0.23 | ) | $ | 3.95 | |||||||
|
Balance Sheet
Data:
|
||||||||||||||||||||
|
Current
assets
|
$ | 9,432 | $ | 19,479 | $ | 30,015 | $ | 41,589 | $ | 62,662 | ||||||||||
|
Current
liabilities
|
3,443 | 3,377 | 5,482 | 12,627 | 19,045 | |||||||||||||||
|
Working
capital
|
$ | 5,989 | $ | 16,102 | $ | 24,533 | $ | 28,962 | $ | 43,617 | ||||||||||
|
Total
assets
|
$ | 68,215 | $ | 68,773 | $ | 110,465 | $ | 125,035 | $ | 156,163 | ||||||||||
|
Long-term
obligations:
|
||||||||||||||||||||
|
Share
based compensation liability
|
$ | - | $ | - | $ | - | $ | - | $ | 10,687 | ||||||||||
|
Global
senior convertible notes
|
- | - | - | - | 12,500 | |||||||||||||||
|
Accrued
preferred stock dividends
|
- | - | 10 | - | - | |||||||||||||||
|
Asset
retirement obligation
|
6,193 | 5,472 | 5,187 | 7,407 | 6,301 | |||||||||||||||
|
Deferred
income taxes
|
748 | 20 | 20 | - | - | |||||||||||||||
| - | - | - | - | - | ||||||||||||||||
|
Total
|
$ | 6,941 | $ | 5,492 | $ | 5,217 | $ | 7,407 | $ | 29,488 | ||||||||||
|
Stockholders'
equity
|
$ | 57,831 | $ | 59,904 | $ | 99,766 | $ | 105,001 | $ | 90,267 | ||||||||||
|
Series G1 preferred stock
outstanding (2)
|
1,000 | 1,600 | 1,600 | 1,600 | 1,600 | |||||||||||||||
|
Series G2 preferred stock
outstanding (2)
|
1,000 | 1,000 | 1,000 | 1,000 | 1,000 | |||||||||||||||
|
Series M preferred stock
outstanding (2)
|
- | 44,000 | 44,000 | 44,000 | 50,000 | |||||||||||||||
|
Weighted average common shares
outstanding (1)
|
9,269,565 | 9,587,952 | 9,799,332 | 9,952,742 | 9,793,296 | |||||||||||||||
|
(1)
|
Per
share amounts and weighted average common shares outstanding calculations
reflect the impact of a one-for-22.4 reverse stock split which was
effective June 2007.
|
|
(2)
|
See
"Notes to Consolidated Financial Statements, Note 11 - Stockholders'
Equity contained in Part II, Item 8, for further discussion of our
preferred stock.
|
|
(3)
|
During
2006, we deconsolidated Global from our Financial
Statements.
|
|
(4)
|
During
2009, we deconsolidated the Canergy Management Company and Canergy Growth
Fund from our financial Statements. See "Notes to Consolidated Financial
Statements, Note 13 – Discontinued Operations" contained in Part II, Item
8, for further discussion.
|
21
ITEM
7. MANAGEMENT’S DISCUSSION AND ANALYSIS OF FINANCIAL CONDITION
AND RESULTS OF OPERATIONS.
The
following discussion is intended to assist you in understanding our business and
the results of our operations. It should be read in conjunction with
the Consolidated Financial Statements and the related notes that appear
elsewhere in this report. Certain statements made in our discussion
may be forward looking. Forward-looking statements involve risks and
uncertainties and a number of factors could cause actual results or outcomes to
differ materially from our expectations. See “Cautionary Statements”
at the beginning of this report on Form 10-K for additional discussion of some
of these risks and uncertainties. Unless the context requires
otherwise, when we refer to “we,” “us” and “our,” we are describing HKN, Inc.
and its consolidated subsidiaries on a consolidated basis.
BUSINESS
OVERVIEW
Our business strategy is focused on
enhancing value for our stockholders through the development of a well-balanced
portfolio of energy-based assets. Currently, the majority of the
value of our assets is derived from our ownership in Gulf Coast oil and gas
properties and in our coalbed methane prospects in Indiana and
Ohio. We consider these assets to be strategic for us, and our
objective in 2010 is to build the value of these properties by:
|
·
|
Monitoring
and reducing operating costs
|
|
·
|
Reducing
operational, environmental, financial and third-party dependency
risks
|
|
·
|
Pursuing
possibilities for “expanding our footprint” in these
areas
|
|
·
|
Performing
economic upgrades and improvements
|
2009
Recap and 2010 Outlook
During 2009, commodity pricing for both
crude oil and natural gas averaged well below pricing from the respective prior
year period. In 2009, industry-wide drilling costs did not reduce in
comparison to the dramatic drop in commodity prices. In order to
allow our operations to continue to generate cash flow from operating
activities, we focused on reducing our costs by cutting our operating expenses
by 20% and our general and administrative costs by 39% over prior
year. However, oil and gas commodity prices during the year averaged
approximately 43% and 60% lower, respectively, than 2008. In 2010,
our objective is to continue to maintain and/or improve our working capital and
to increase our operating margin as compared to prior year. We
believe in the long-term fundamentals of our industry.
In 2009, we used our discretionary
cash to simplify our capital structure by redeeming the remaining 44
thousand shares of our Series M Preferred Stock and six hundred shares of our G1
Preferred Stock for a total of approximately $4.4 million. The Series
M Preferred had an 8% cash coupon rate which was scheduled to increase to 10% in
October 2009. As of December 31, 2009, our Series M Preferred is no
longer outstanding. In accordance with our share buyback program, in 2009, we
also repurchased 708 thousand of our common shares in the market (approximately
7% of our outstanding shares) at a total cost of approximately $1.9
million.
During 2009, we enhanced the value of
our Main Pass 35 field, located offshore Louisiana in the Gulf of Mexico, by
performing various process and structural upgrades and improvements to the
facility and its equipment. We believe our Main Pass 35 asset
has unique characteristics such as low-decline oil production, behind-pipe
development potential as well as third-party oil, gas and water processing and
handling services for neighboring fields in the area. We consider our
Main Pass 35 field a strategic asset for us in 2010.
22
During 2009, we acquired an interest in
a private company, BriteWater International, LLC (“BWI”), formerly known as
UniPureEnergy Acquisition, LLC, which holds patents to the emulsion breaking
“OHSOL” technology. This environmentally-clean process can be used to
purify oilfield emulsions by breaking and separating the emulsions into oil,
water and solids. This technology has been successfully tested using
a mobile OHSOL unit in a demonstration in Prudhoe Bay, Alaska, which
demonstrated the effectiveness of the OHSOL emulsion breaking technology to
recover valuable hydrocarbons and reduce wastes. We are currently
pursuing opportunities to commercialize the OHSOL technology by performing
emulsion testing of the OHSOL plant equipment both internationally and
domestically. We are deemed the primary beneficiary of BWI, and as a
result, effective June 30, 2009 (the investment date) we began consolidating the
assets and liabilities and results of operations of BWI as of the investment
date.
We are also seeking to identify further
investment opportunities in undervalued energy-based assets or companies which
could provide future value for our shareholders.
Each year we evaluate our assets to
determine which may have reached their full potential, do not have an
expectation of near-term value enhancement or represent a disproportionate
concentration of value in one asset and should be targeted for
monetization. In 2010, we are targeting certain of our non-strategic
Gulf Coast oil and gas properties for divestiture in order to mitigate possible
future losses of these end-of-life properties.
We
continue to have access to capital, and we have a cash balance of approximately
$7 million at December 31, 2009. We also anticipate our operating cash flow and
other capital resources, if needed, will adequately fund our planned capital
expenditures and other capital uses over the near-term. Based on
industry outlook for 2010, prices for oil and natural gas are expected to
increase as compared to the prior year. In addition, with savings expected due
to cost-cutting measures already implemented, we have budgeted our 2010
operations to remain cash-flow positive.
Capital
Deployment Update
During 2009, we continued our efforts
to deploy assets into energy-based opportunities to build annual measurable
value and/or cash flow as follows:
|
§
|
We
deployed capital expenditures of approximately $831 thousand to enhance
the value of our Main Pass 35 field through process, structural,
environmental and operational improvements to the
facility.
|
|
§
|
We
deployed capital expenditures of approximately $1.3 million for oil and
gas exploratory and development drilling at our Creole Field, as well as
other projects.
|
|
§
|
In
accordance with our share buyback program, in 2009, we repurchased 708
thousand of our common shares in the market (approximately 7% of our
outstanding shares) for total proceeds of approximately $1.9
million.
|
|
§
|
We
simplified our capital structure by redeeming 44 thousand shares of our
Series M Preferred Stock and six hundred shares of our G1 Preferred Stock
for a total of approximately $4.4 million. As of December 31,
2009, our Series M Preferred Stock is no longer
outstanding.
|
Gulf
Coast Oil and Gas Properties
During 2009, our results of operations
reflect decreased oil and natural gas revenues as compared to 2008 as a result
of decreased commodity prices. During the current year, the realized
price of oil averaged $58.48 per barrel (“Bbl”), approximately 43% lower than
2008. Natural gas prices realized in 2009 averaged $3.97 per metric
cubic foot (“Mcf”), approximately 60% lower than prior
year. Substantially all of our production is concentrated in twelve
oil and gas fields along the onshore and offshore Texas and Louisiana Gulf
Coast. As of December 31, 2009, our net domestic
production rate was averaging approximately 519 barrels of oil equivalent
(“boe”) per day.
23
Our revenues are primarily derived from
sales from our oil and gas properties. Approximately 54% of our
production comes from our operated properties all located in the United States.
These revenues are a function of the oil and gas volumes produced and the
prevailing commodity price at the time of production, and certain quality and
transportation discounts. The commodity prices for crude oil and natural gas as
well as the timing of production volumes have a significant impact on our
operating income. During 2009, our oil and gas revenues were comprised of
approximately 85% oil sales and 15% natural gas production.
The
following field data updates the status of our operations through December 31,
2009:
Main
Pass, Plaquemines Parish – Louisiana
During 2009, we enhanced the value of
our Main Pass 35 field, located offshore Louisiana in the Gulf of Mexico, by
performing various process and structural upgrades and improvements to the
facility and its equipment. We believe our Main Pass 35 asset has
unique characteristics such as low-decline oil production, behind-pipe
development potential as well as third-party oil, gas and water processing and
handling services for neighboring fields in the area. We consider our
Main Pass 35 field a strategic asset for us in 2010.
We have an average 91% interest in Main
Pass 35 and are the field operator. This field contains a ten-platform facility
complex including separation, injection, compression, processing and
transportation terminals for oil, water and gas. The field also contains 66
wellbores (60 oil and 6 injection wells), of which 33 are active, and an eight
mile oil transport line with pump/metering facilities. Our Main Pass 35 facility
is located approximately six miles offshore in state waters off the Gulf Coast
of Louisiana. We currently have license to 21 square miles of 3D seismic data
covering the area held by productive leases. Gross production during 2009
averaged approximately 400 boe per day. In order to lower our gas lift expense
in the field, we are currently planning a recompletion project of at least one
gas zone soon after some required modifications to the gas sales line that
services the field are completed.
Creole
Field, Terrebonne Parish - Louisiana
We hold an average 15% non-operated
working interest in this offshore field. Gross daily production from the wells
(nine completions) was approximately 952 boe per day during 2009. Three
completions in two wells drilled in late 2008 were put on production in 2009
after significant weather delays. In mid-2009, we participated with one of the
other working interest owners in a revised third party reserve study. The study
was based in large part on a new geologic interpretation which incorporated the
latest drilling results and a significantly improved speculative 3D seismic
volume. As a result of this study, three new proved undeveloped locations,
six new probable locations and twenty new possible locations have been
identified and documented. Two re-entries, one major workover and one new well
are anticipated in 2010.
Lapeyrouse
Field, Terrebonne Parish – Louisiana
We hold an average non-operated working
interest of approximately 12% in the production from nine wells in this field.
Gross field production averaged approximately 198 boe per day for
2009. Evaluation efforts by the operator are still ongoing with
additional diagnostic work planned by the operator to address the field pressure
decline and to utilize all available wellbores. We are considering
this field for divestiture in 2010, although no final decision has been made at
this time.
24
|
Lake
Raccourci Field, Lafourche Parish –
Louisiana
|
We hold an average 40% operated working
interest in each of our Lake Raccourci wells. Gross production for this field
averaged 78 boe per day for 2009. Production decreased significantly this
quarterly period primarily due to the fact that the SL 14284-1 well ceased
production in February 2009. Diagnostic work indicated that the well
ceased production due to sand build up in the tubing. Coiled tubing
work was carried out, but failed to restore production. We are currently
evaluating the economic potential of a recompletion to the Tex 16 zone behind
pipe, as well as several other zones in our two other producing wells in the
field. We are considering this field for divestiture in 2010, although no final
decision has been made at this time.
Point-a-la-Hache
Field, Plaquemines Parish – Louisiana
We
maintain a 25% operated working interest in one producing well in this field.
Average gross production for 2009 was approximately 40 boe per
day. Production remains steady from this one well field.
East
Lake Verret, Assumption Parish – Louisiana
We have an average 5% non-operated
working interest in this field. Gross daily production from the two development
wells on this project was approximately 699 boe per day during
2009.
|
Point-au-Fer
Field, Terrebonne Parish –
Louisiana
|
We own a
12.5% non-operated working interest in this approximate 56 square mile area.
Gross production for this field was approximately 33 boe per day for 2009.
Several prospects have been identified in the area, but due to the low oil and
gas pricing, we expect additional drilling and work over activity will be
delayed by the operator.
|
Branville
Bay Field, St. Bernard Parish –
Louisiana
|
We own a
12.5% non-operated working interest in two state leases in the Branville Bay
area of Chandeleur Sound Block 71. Gross production for this field was
approximately 221 boe per day for 2009.
BP
2D Texas Gulf Coast Project, Various Counties - Texas
We own a 25% non-operated working
interest in the Boquillas #1 well. Gross production from this well is steady and
was approximately 170 boe per day for 2009.
NW
Speaks Field, Lavaca County – Texas
We own approximately 2% to 7% in
various leases in the NW Speaks area. Current gross production for this field
averaged approximately 92 boe per day during 2009 from two wells.
Allen
Ranch Field, Colorado County – Texas
We own an
11.25% non-operated working interest in this area. Gross production for this
field was approximately 57 boe per day during 2009 primarily from the initial
well, the Hancock Gas Unit #1 which is the only well currently producing from
the field. Another development location has been identified, but future
development of the field is currently on hold pending higher natural gas
pricing.
25
Raymondville
Field, Willacy County – Texas
We own an average 22% non-operated
working interest in this area. Current gross production for this field averaged
approximately 336 boe per day during 2009. Field production continues to decline
as fewer behind pipe zones remain. Several wells ceased production in 2009 and
have no remaining recompletion potential. We are considering this
field for divestiture in 2010, although no final decision has been made at this
time.
Lucky
Field, Matagorda County - Texas
We own a
7.5% non-operated working interest in this area. Current gross production for
this field averaged approximately 46 boe per day during 2009.
Coalbed
Methane Prospects – Indiana and Ohio
We hold two exploration and
development agreements in Indiana and Ohio which provide for an area of mutual
interest of approximately 400,000 acres each respectively. The agreements
provide for a phased delineation, pilot and development program, with
corresponding staged expenditures. Contracted third parties with a long track
record in successful Coalbed Methane development provide expert advice for these
projects.
On the Indiana Posey Prospect, we
completed Phase I – Core Samples work on the Indiana Prospect which consisted of
obtaining and analyzing coal samples. Based on the positive outcome of the
coring analysis, we elected into Phase II which consists of exploratory
work. During 2007, all five pilot producing wells were drilled,
completed and put on pump-down production for gas desorption via newly installed
pumps, lines and facilities. In addition, a produced water disposal well was
drilled and completed to service the pilot wells. Some gas production
has begun and is being used throughout the field for fuel gas
needs. The extent of water influx is under evaluation to enhance
desorption efforts. In 2008, chemical treatments to enhance well
fluid productivity was begun with fracture stimulation under evaluation as
desorption pump-down continues. Also in 2008, a fracture stimulation was
performed to increase desorption pumpdown rates. Alternative design stimulations
are under evaluation as pumpdown continues as the initial fracture treatments
are evaluated.
We elected to proceed with a second
pilot well project. A monitor well was drilled, completed and tested for
permeability determination in late 2007. During 2008, five pilot producers and
the water disposal well were completed with specialized fracture stimulation
completed in late fourth quarter 2008. Currently, we are in the
dewatering phase in which the pilot wells are produced to maximize fluid (water)
production in order to lower reservoir pressure so that desorption of gas can
occur in the pilot test wells on the Indiana Posey Contract area. We
continue to evaluate their progress. Following an evaluation period
of these two pilot areas, we will evaluate a Phase III – Development election
and funding of a development well program as contemplated by the
agreements.
On the
Ohio Cumberland Prospect, we completed Phase I – Core Samples work on the Ohio
Prospect which consisted of obtaining and analyzing coal samples. With regard to
Phase II, we made an additional $500 thousand prospect acquisition payment and
intend to fund the first of two pilot well projects on the Cumberland
Prospect. This Phase II project has been temporarily suspended until
such time as oil and gas commodity pricing increases. We continue to
focus our efforts on the Indiana Posey Contract.
With low
oil and gas commodity prices, resource plays, such as coalbed methane prospects,
can become uneconomical particularly since all well, facility and flowline costs
as well as operating costs during the dewatering/desorption process
must be incurred before revenues can generated.
Our discretionary capital expenditures, including costs related to our coalbed
methane prospects, may be curtailed at our discretion in the future. Such
expenditure curtailments could result in us losing certain prospect acreage or
reducing our interest in future development projects.
26
INVESTMENT
IN BRITEWATER INTERNATIONAL, LLC.
In June 2009, we acquired a 19.5%
interest in a privately-held company, BWI, formerly referred to as UniPure, with
a patented oilfield emulsion breaking “OHSOL” technology. We are deemed to be
the primary beneficiary, and accordingly, we have consolidated the assets and
liabilities of BWI as of the investment date. The results of operations for the
six months ended December 31, 2009 have been consolidated in our results of
operations. See Note 2 – Investment in BriteWater International, LLC.” in the
Notes to Consolidated Financial Statements contained in Part II, Item 8 of this
Annual Report on Form 10-K for further information.
INVESTMENT
IN GLOBAL
At December 31, 2009 and 2008, we owned
approximately 34% of Global’s ordinary shares. At December 31, 2009 and 2008,
our investment in Global was equal to the market value of our 11.9 million
shares of Global’s common stock as follows (in thousands, except share
amounts):
|
December
30, 2009
|
December
31, 2008
|
|||||||
|
Shares
of Global Stock held by HKN
|
11,893,463 | 11,893,463 | ||||||
|
Closing
price of Global Stock
|
£ | 0.66 | £ | 0.68 | ||||
|
Foreign
Currency Exchange Rate
|
1.6221 | 1.4619 | ||||||
|
Market
Value of Investment in Global
|
$ | 12,637 | $ | 11,824 | ||||
The
foreign currency translation adjustment of approximately $789 thousand and the
unrealized gain on investment of $24 thousand for these changes in market value
between the two periods were recorded to other comprehensive income in
stockholders’ equity during the year ending December 31, 2009.
Global’s asset base and financial
information continue to be strong; therefore we intend to hold our shares of
Global until the London market improves. For information on Global’s
operations and financial statements, visit their website at www.globalenergyplc.com.
INVESTMENT
IN SPITFIRE
At
December 31, 2009 and 2008, we held an investment in Spitfire through the
ownership of approximately 25% and 27%, respectively, of Spitfire’s currently
outstanding common shares. Spitfire is an independent public company (TSX-V;
SEL) engaged in the exploration, development and production of crude oil,
natural gas and natural gas liquids in Western Canada.
At December 31, 2009, we owned 9.9
million common shares of Spitfire and 1.3 million warrants to acquire common
shares of Spitfire. As a result of our ownership of Spitfire’s
outstanding common shares, we are deemed to have the ability to exert
significant influence over Spitfire’s operating and financial policies.
Accordingly, we reflect our investment in Spitfire as an equity method
investment. Due to timing differences in our filing requirements and the lack of
availability of financial information for the current quarterly period, we
record our share of Spitfire’s financial activity on a three-month lag. During
June 2008, our representatives on the Spitfire board of directors resigned due
to scheduling and corporate strategy conflicts.
During 2009, we sold approximately 1.2
million of our Spitfire shares in the market for cash proceeds of $212
thousand. In 2010, we may continue to sell a portion of our Spitfire
shares in the market while we pursue strategic alternatives for this Canadian
investment. For information on Spitfire’s operations and financial statements,
visit their website at www.spitfireenergy.com.
27
CRITICAL
ACCOUNTING ESTIMATES AND ASSUMPTIONS
Our consolidated financial statements
have been prepared in accordance with U.S. GAAP which requires us to use
estimates and make assumptions that affect the reported amounts of assets,
liabilities, revenues and expenses. Our estimates and assumptions are
based on historical experience, industry conditions and various other factors
which we believe are appropriate. Actual results could vary significantly from
our estimates and assumptions as additional information becomes
known. The more significant critical accounting estimates and
assumptions are described below.
Property and Equipment – We
follow the full cost method of accounting for our investments in oil and natural
gas properties. All costs incurred with the acquisition, exploration and
development of oil and natural gas properties, including unproductive wells, are
capitalized. Under the full cost method of accounting, such costs may be
incurred both prior to or after the acquisition of a property and include lease
acquisitions, geological and geophysical services, drilling, completion and
equipment. Included in capitalized costs are general and administrative costs
that are directly related to acquisition, exploration and development
activities, and which are not related to production, general corporate overhead
or similar activities. For the years 2009, 2008, and 2007, such capitalized
general and administrative costs totaled $295 thousand, $248 thousand, and $904
thousand, respectively. General and administrative costs related to production
and general overhead are expensed as incurred.
Proceeds from the sale of oil and natural
gas properties are credited to the full cost pool, except in transactions where
the proceeds received from the sale would significantly alter the relationship
between capitalized costs and proved reserves, in which case a gain or loss
would be recognized.
Future
development, site restoration, and dismantlement and abandonment costs, net of
salvage values, are estimated property by property based upon current economic
conditions and are included in our amortization of our oil and natural gas
property costs.
The
provision for depletion and amortization of oil and natural gas properties is
computed by the unit-of-production method. Under this computation, the total
unamortized costs of oil and natural gas properties (including future
development, site restoration, and dismantlement and abandonment costs, net of
salvage value), excluding costs of unproved properties, are divided by the total
estimated units of proved oil and natural gas reserves at the beginning of the
period to determine the depletion rate. This rate is multiplied by the physical
units of oil and natural gas produced during the period. Changes in
the quantities of our reserves can significantly impact our provision for
depletion and amortization of oil and natural gas properties.
The cost
of unevaluated oil and natural gas properties not being amortized is assessed
quarterly to determine whether such properties have been impaired. In
determining impairment, an evaluation is performed on current drilling results,
lease expiration dates, current oil and natural gas industry conditions, and
available geological and geophysical information. Any impairment assessed is
added to the cost of proved properties being amortized. At
December 31, 2009, we had approximately $5.1 million allocated to our
unevaluated coalbed methane properties.
Full-Cost Ceiling Test – At
the end of each quarter, the unamortized cost of oil and natural gas properties,
after deducting the asset retirement obligation, net of related deferred income
taxes, is limited to the sum of the estimated future net revenues from proved
properties using average monthly prices, discounted at 10%, and the lower of
cost or fair value of unproved properties adjusted for related income tax
effects.
The
calculation of the ceiling test and the provision for depletion are based on
estimates of proved reserves. There are numerous uncertainties inherent in
estimating quantities of proved reserves and in projecting the future rates of
production, timing, and plan of development. The accuracy of any reserves
estimate is a function of the quality of available data and of engineering and
geological interpretation and judgment. Results of drilling, testing, and
production subsequent to the date of the estimate may justify a revision of such
estimate. Accordingly, reserve estimates are often different from the quantities
of oil and natural gas that are ultimately recovered.
28
Based on
the twelve (12) month average commodity pricing in 2009 of $3.87 per Mmbtu for
natural gas and $61.18 per barrel for crude oil, we did not have an impairment
of our oil and natural gas properties under the full cost method of
accounting. Due
to the imprecision in estimating oil and natural gas revenues as well as the
potential volatility in oil and natural gas prices and their effect on the
carrying value of our proved oil and natural gas reserves, there can be no
assurance that write-downs in the future will not be required as a result of
factors that may negatively affect the present value of proved oil and natural
gas reserves and the carrying value of oil and natural gas
properties, including volatile oil and
natural gas prices, downward revisions in estimated proved oil and natural gas
reserve quantities and unsuccessful drilling activities. For a complete
discussion of our proved oil and gas reserves, see Note 16 – “Oil and Gas
Disclosures” in the Notes to the Consolidated Financial statements contained in
Part II, Item 8 of the Annual Report of Form 10-K.
Fair Value of Financial
Instruments – Financial instruments are stated at fair value as
determined in good faith by management. Factors considered in valuing individual
investments may include, without limitation, available market prices, reported
net asset values, type of security, purchase price, purchases of the same or
similar securities by other investors, marketability, restrictions on
disposition, current financial position and operating results, and other
pertinent information.
We carry our financial instruments
including cash, our investment in ordinary shares of Global and our oil
commodity derivative contracts at their estimated fair values. The fair value of
our investment in the ordinary shares of Global is based on prices quoted in an
active market. The fair values of our oil commodity derivatives are
based on pricing provided by our counter parties.
With the
exception of our investment in common shares of Spitfire, which is accounted for
as an equity method investment, all of our investments in equity securities have
been designated as available for sale. Our investment in Global is classified as
a non-current asset in our accompanying balance sheets. The associated
unrealized gains and losses on our available for sale investments are recorded
to other comprehensive income until realized and are reclassified into earnings
using specific identification.
Equity Method Investments –
For investments in which we have the ability to exercise significant influence
but do not control, we follow the equity method of accounting. Our equity
investment in Spitfire is classified as a non-current asset in our accompanying
balance sheets. Initial investments are recorded at cost and adjusted by the
proportionate share of the investee’s earnings and capital transactions. Our
share of investee earnings and our share of their capital transactions are
recorded to our income statement. We evaluate these investments for
other-than-temporary declines in value each quarter; any impairment found is
recognized through earnings.
Translation of Non-U.S. Currency
Amounts - Assets and liabilities of our equity investment in Spitfire
Energy, whose functional currency is the Canadian dollar, are translated into
U.S. dollars at exchange rates in effect at each balance sheet date.
Revenue and expense items are translated at average exchange rates prevailing
during the periods. Our investment in Global is also subject to foreign currency
exchange rate risk as our ownership of Global’s ordinary shares are denominated
in British sterling pounds. Translation adjustments are included in other
comprehensive income until the investment is sold.
Consolidation of variable interest
entities - ASC 810-10-25, Consolidation, requires the
primary beneficiary of a variable interest entity’s (“VIE”) activities to
consolidate the VIE and defines a VIE as an entity in which the equity investors
do not have substantive voting rights and there is not sufficient equity at risk
for the entity to finance its activities without additional subordinated
financial support. The primary beneficiary is the party that absorbs a majority
of the expected losses and/or receives a majority of the expected residual
returns of the VIE’s activities. We have determined that our
investment in BWI meets the requirements of ASC 810-10-25, and we are the
primary beneficiary, as defined. Accordingly, we have consolidated the assets
and liabilities of BWI as of the investment date. The results of
operations for the six months ended December 31, 2009 are consolidated in our
results of operations.
29
As of December 31, 2009, we owned less
than a majority of the common shares of Global and did not possess the legal
power to direct the operating policies and procedures of Global through our
direct ownership, combined with the ownership by Lyford in Global shares. In
addition, we have concluded that Global was not a VIE at December 31, 2009 as
contemplated by ASC 810-10-25.
Proved Reserves - Our
estimates of proved reserves are based on quantities of oil and gas reserves
which current engineering data indicates are recoverable from known reservoirs
under existing economic and operating conditions. Estimates of proved
reserves are key elements in determining our depletion and expense and our full
cost ceiling limitation. Estimates of proved reserves are inherently imprecise
because of uncertainties in projecting rates of production and timing of
developmental expenditures, interpretations of geological, geophysical,
engineering and production data and the quality and quantity of available
data. Changing economic conditions also may affect our estimates of
proved reserves due to changes in developmental costs and changes in commodity
prices that may impact reservoir economics. We utilize independent
reserve engineers to estimate our proved reserves annually. See Note
16 - “Oil and Gas Disclosures” in the Notes to Consolidated Financial Statements
contained in Part II, Item 8 of this Annual Report on Form 10-K.
Income Taxes – We account for income taxes
under the liability method. Deferred tax assets and liabilities are determined
based on differences between financial reporting and tax bases of assets and
liabilities and are measured using the enacted tax rates and laws that will be
in effect when the differences are expected to reverse. We measure and record
income tax contingency accruals in accordance with ASC 740, Income Taxes.
We
recognize liabilities for uncertain income tax positions based on a two-step
process. The first step is to evaluate the tax position for recognition by
determining if the weight of available evidence indicates that it is more likely
than not that the position will be sustained on audit, including resolution of
related appeals or litigation processes, if any. The second step requires us to
estimate and measure the tax benefit as the largest amount that is more than 50%
likely to be realized upon ultimate settlement. It is inherently difficult and
subjective to estimate such amounts, as we must determine the probability of
various possible outcomes. We reevaluate these uncertain tax positions on a
quarterly basis or when new information becomes available to management. These
reevaluations are based on factors including, but not limited to, changes in
facts or circumstances, changes in tax law, successfully settled issues under
audit, expirations due to statutes, and new audit activity. Such a change in
recognition or measurement could result in the recognition of a tax benefit or
an increase to the tax accrual.
We
classify interest related to income tax liabilities as income tax expense, and
if applicable, penalties are recognized as a component of income tax expense.
The income tax liabilities and accrued interest and penalties that are
anticipated to be due within one year of the balance sheet date are presented as
current liabilities in our consolidated balance sheets.
Fair Value of Derivatives -
We are exposed to risk from fluctuations in crude oil and natural gas
prices. To reduce the impact of this risk in earnings and to increase
the predictability of our cash flow, from time to time we enter into certain
derivative contracts, primarily collars and floors for a portion of our oil and
gas operations. Fair values of our commodity derivatives are obtained
from the third-party broker / dealer portfolio appraisal statement and are used
as the primary evidence for the fair value of the financial instrument. Our
Spitfire warrants are not exchange-traded derivatives. Management estimates the
fair value of these derivatives using the Black Scholes Valuation
model. We have not designated any of our derivative instruments as
hedges under ASC 815, Derivates and Hedging. All
gains and losses related to these positions are recognized in
earnings.
30
Recent Accounting
Pronouncements – In December 2007, FASB issued guidance
related to Business Combinations under ASC 805, Business Combinations, and
guidance related to the accounting and reporting of noncontrolling interest
under ASC 810-10-65-1, Consolidation. This guidance
significantly changes the accounting for and reporting of business combination
transactions and noncontrolling (minority) interests in consolidated financial
statements. This guidance became effective January 1, 2009. We applied this
guidance to our investment in BWI. Please see Note 2 – “Investment in BriteWater
International, LLC” in the Notes to Consolidated Financial Statements for
additional information.
In March
2008, the FASB issued guidance related to the disclosures about derivative
instruments and hedging activities under FASB ASC 815-10-50, Derivatives and Hedging. This
guidance requires companies to provide enhanced disclosures about (a) how
and why they use derivative instruments, (b) how derivative instruments and
related hedged items are accounted for under applicable guidance, and
(c) how derivative instruments and related hedged items affect a company's
financial position, financial performance, and cash flows. These disclosure
requirements are effective for financial statements issued for fiscal years and
interim periods beginning after November 15, 2008. Our adoption of ASC
815-10-50 on January 1, 2009 did not have a material impact on our consolidated
financial statements. See Note 5 – “Derivative Instruments” in the Notes to
Consolidated Financial Statements for additional information.
In June
2008, the FASB issued guidance to evaluate whether an instrument (or embedded
feature) is indexed to an entity’s own stock under ASC 815-40-15, Derivatives and Hedging. The
guidance requires entities to evaluate whether an equity-linked financial
instrument (or embedded feature) is indexed to its own stock in order to
determine if the instrument should be accounted for as a derivative under the
scope of ASC 815-10-15. This guidance is effective for financial statements
issued for fiscal years beginning after December 15, 2008 and interim periods
within those fiscal years. We adopted ASC 815-40-15 beginning January 1,
2009. We applied this guidance to the conversion feature in our
Series M Convertible Preferred Stock (“Series M Preferred”). See Note 5 –
“Derivative Instruments” in the Notes to Consolidated Financial Statements for
additional information.
In
November 2008, the FASB issued guidance related to accounting considerations for
equity method investments under ASC 323-10-35, Investments – Equity Method and
Joint Ventures. This guidance states that an equity method investor shall
account for a share issuance by an investee as if the investor had sold a
proportionate share of its investment. Any gain or loss to the investor
resulting from an investee's share issuance should be recognized in earnings.
Previous to this, changes in equity for both issuances and repurchases were
recognized in equity. This guidance is effective for financial statements issued
for fiscal years beginning after December 15, 2008 and interim periods within
those fiscal years. We adopted ASC 323-10-35 beginning January 1,
2009. We applied this guidance to our equity investment in Spitfire
Energy. See Note 4 – “Equity Investment in Spitfire Energy” in the Notes to
Consolidated Financial Statements for additional information.
In December 2008, the Securities and
Exchange Commission published a Final Rule, Modernization of the Oil and Gas
Reporting Requirements. The new rule permits the use of new technologies
to determine proved reserves if those technologies have been demonstrated to
lead to reliable conclusions about reserves volumes. The new requirements also
allow companies to disclose their probable and possible reserves to investors.
In addition, the new disclosure requirements require companies to:
(a) report the independence and qualifications of its reserves preparer or
auditor; (b) file reports when a third party is relied upon to prepare
reserves estimates or conducts a reserves audit; and (c) report oil and gas
reserves using an average price based upon the prior 12-month period rather than
year-end prices. The use of average prices will affect future impairment and
depletion calculations. In January 2010, the FASB issued Accounting Standards
Update No. 2010-03, Oil and
Gas Reserve Estimation and Disclosure, to align the oil and gas reserve
estimation and disclosure requirement of the SEC Final Rule with the ASC 932.
The new disclosure requirements are effective for annual reports on
Form 10-K for fiscal years ending on or after December 31, 2009. Our
adoption of this Final rule for this annual reported dated December 31, 2009
affected our oil and gas disclosures but had no material effect on our financial
position and results of operations. See Note 16 - “Oil and Gas Disclosures” in
the Notes to Consolidated Financial Statements contained in Part II, Item 8 of
this Annual Report on Form 10-K.
31
In May 2009, the FASB issued guidance
related to subsequent events under ASC 855-10, Subsequent Events. This
guidance sets forth the period after the balance sheet date during which
management or a reporting entity should evaluate events or transactions that may
occur for potential recognition or disclosure, the circumstances under which an
entity should recognize events or transactions occurring after the balance sheet
date, and the disclosures that an entity should make about events or
transactions that occurred after the balance sheet date. It requires disclosure
of the date through which an entity has evaluated subsequent events and the
basis for that date, whether that date represents the date the financial
statements were issued or were available to be issued. This guidance is
effective for interim and annual periods ending after June 15, 2009. We adopted
ASC 855-10 in 2009 and have included the required disclosures in our
consolidated financial statements. See Note 18 – “Subsequent Events” in the
Notes to Consolidated Financial Statements for additional
information.
In June 2009, the FASB issued an
amendment to ASC 810-10, Consolidation. As a result,
in December 2009, the FASB issued ASC 2009-17, Improvements to Financial Reporting
by Enterprises Involved with Variable Interest Entities. This guidance
amends ASC 810-10-15 to replace the quantitative-based risks and rewards
calculation for determining which enterprise has a controlling financial
interest in a VIE with a primarily qualitative approach focused on identifying
which enterprise has the power to direct the activities of a VIE that most
significantly impact the entity’s economic performance. It also requires ongoing
assessments of whether an enterprise is the primary beneficiary of a VIE and
requires additional disclosures about an enterprise’s involvement in VIEs. This
guidance is effective as of the beginning of the reporting entity’s first annual
reporting period that begins after November 15, 2009 and earlier adoption is not
permitted. We are currently evaluating the potential impact, if any, of the
adoption of ASC 2009-17 on our consolidated financial statements.
In June 2009, the FASB issued
Accounting Standards Update No. 2009-01 which amends ASC 105, Generally Accepted Accounting
Principles. This guidance states that the ASC will become the source of
authoritative U.S. GAAP recognized by the FASB to be applied by nongovernmental
entities. Once effective, the Codification’s content will carry the same level
of authority. Thus, the U.S. GAAP hierarchy will be modified to include only two
levels of U.S. GAAP: authoritative and non-authoritative. This is effective for
financial statements issued for interim and annual periods ending after
September 15, 2009. We adopted ASC 105 as of September 30, 2009 and
thus have incorporated the new Codification citations in place of the
corresponding references to legacy accounting pronouncements.
In August 2009, the FASB issued
Accounting Standards Update No. 2009-05, Measuring Liabilities at Fair Value,
which amends ASC 820, Fair Value Measurements and
Disclosures. This Update provides clarification that in circumstances in
which a quoted price in an active market for the identical liability is not
available, a reporting entity is required to measure the fair value using one or
more of the following techniques: a valuation technique that uses the quoted
price of the identical liability or similar liabilities when traded as an asset,
which would be considered a Level 1 input, or another valuation technique that
is consistent with ASC 820. This Update is effective for the first reporting
period (including interim periods) beginning after issuance. Thus, we adopted
this guidance as of September 30, 2009, which did not have a material impact on
our consolidated financial statements.
32
RESULTS
OF OPERATIONS
For the purposes of discussion and
analysis, we are presenting a summary of our consolidated results of operations
followed by more detailed discussion and analysis of our operating
results. The primary components of our net income / (net loss) from
continuing operations for each of the years in the three year period ended
December 31, 2009, were as follows (in thousands, except per-share
data):
| Year Ended December 31, | Year Ended December 31, | |||||||||||||||||||||||
| 2009 | 2008 | %Change | 2008 | 2007 | %Change | |||||||||||||||||||
|
Oil
and gas operating profit (1)
|
$ | 1,594 | $ | 11,405 | (86 | %) | $ | 11,405 | $ | 11,771 | (3 | %) | ||||||||||||
|
Gas
sales revenues
|
$ | 1,542 | $ | 6,913 | (78 | %) | $ | 6,913 | $ | 7,881 | (12 | %) | ||||||||||||
|
Gas
production (mcf)
|
388,153 | 703,360 | (45 | %) | 703,360 | 986,279 | (29 | %) | ||||||||||||||||
|
Gaspricepermcf
|
$ | 3.97 | $ | 9.83 | (60 | %) | $ | 9.83 | $ | 7.99 | 23 | % | ||||||||||||
|
Oil
sales revenues
|
$ | 8,643 | $ | 15,293 | (43 | %) | $ | 15,293 | $ | 12,538 | 22 | % | ||||||||||||
|
Oil
production (bbls)
|
147,784 | 149,414 | (1 | %) | 149,414 | 171,866 | (13 | %) | ||||||||||||||||
|
Oilpriceperbbl
|
$ | 58.48 | $ | 102.35 | (43 | %) | $ | 102.35 | $ | 72.95 | 40 | % | ||||||||||||
|
Trading
losses (2)
|
$ | - | $ | (4,344 | ) | 100 | % | $ | (4,344 | ) | $ | 680 | (739 | %) | ||||||||||
|
Other
revenues, net
|
$ | 2,183 | $ | 2,401 | (9 | %) | $ | 2,401 | $ | 3,199 | (25 | %) | ||||||||||||
|
General
and administrative expenses, net
|
$ | 3,197 | $ | 5,281 | (39 | %) | $ | 5,281 | $ | 5,950 | (11 | %) | ||||||||||||
|
Provision
for doubtful accounts
|
$ | 183 | $ | 41 | 346 | % | $ | 41 | $ | (106 | ) | 139 | % | |||||||||||
|
Depreciation,
depletion, amortization and accretion
|
$ | 3,524 | $ | 5,224 | (33 | %) | $ | 5,224 | $ | 6,107 | (14 | %) | ||||||||||||
|
Other
losses
|
$ | 33 | $ | 121 | (73 | %) | $ | 121 | $ | 390 | (69 | %) | ||||||||||||
|
Impairment
of investment in Spitfire
|
$ | - | $ | 4,618 | (100 | %) | $ | 4,618 | $ | - | 100 | % | ||||||||||||
|
Impairment
of facilities
|
$ | - | $ | 97 | (100 | %) | $ | 97 | $ | - | 100 | % | ||||||||||||
|
Full
costpool impairment
|
$ | - | $ | 19,906 | (100 | %) | $ | 19,906 | $ | - | 100 | % | ||||||||||||
|
Equity
in losses (earnings) in Spitfire
|
$ | 225 | $ | (196 | ) | 215 | % | $ | (196 | ) | $ | 50 | (492 | %) | ||||||||||
|
Income
tax expense (benefit)
|
$ | (40 | ) | $ | 275 | (115 | %) | $ | 275 | $ | 30 | 817 | % | |||||||||||
|
Net
income (loss) from continuing operations
|
$ | (3,345 | ) | $ | (25,905 | ) | (87 | %) | $ | (25,905 | ) | $ | 3,229 | (902 | %) | |||||||||
|
Loss
from discontinued operations, net of taxes
|
$ | - | $ | (841 | ) | 100 | % | $ | (841 | ) | $ | - | 100 | % | ||||||||||
|
Net
loss attributed to noncontrolling interests
|
$ | 295 | $ | - | 100 | % | $ | - | $ | - | 100 | % | ||||||||||||
|
Net
income (loss) attributed to HKN
|
$ | (3,050 | ) | $ | (26,746 | ) | (89 | %) | $ | (26,746 | ) | $ | 3,229 | (928 | %) | |||||||||
|
Net
income (loss) attributed to common stock
|
$ | (3,469 | ) | $ | (27,108 | ) | (87 | %) | $ | (27,108 | ) | $ | 2,965 | (1014 | %) | |||||||||
|
Net
income (loss) per common share:
|
||||||||||||||||||||||||
|
From continuing operations
|
$ | (0.37 | ) | $ | (2.74 | ) | 86 | % | $ | (2.74 | ) | $ | 0.30 | (1013 | %) | |||||||||
|
From discontinued operations
|
$ | - | $ | (0.09 | ) | 100 | % | $ | (0.09 | ) | $ | - | 100 | % | ||||||||||
|
Basic and diluted
|
$ | (0.37 | ) | $ | (2.83 | ) | 87 | % | $ | (2.83 | ) | $ | 0.30 | (1042 | %) | |||||||||
|
(1)
|
Oil
and gas operating profit is calculated as oil and gas revenues less oil
and gas operating expenses
|
|
(2)
|
The
Canergy Fund and Canergy Management segments were deconsolidated from our
financial statements during the fourth quarter of 2009. However, both the
Canergy Fund and Canergy Management had no results from operations for the
year ended December 31, 2009.
|
The following is our discussion and
analysis of significant components of our continuing operations which have
affected our operating results and balance sheet during the periods included in
the accompanying consolidated financial statements.
Operating
Results:
Oil
and Gas Revenues and Oil and Gas Expenses for the Year Ended December 31, 2009
Compared to December 31, 2008
In
correlation with lower oil and gas commodity pricing in the markets during 2009,
our oil and gas revenues decreased from $22.2 million in the prior year period
to $10.2 million for the current year period. This decrease was
primarily due to the significantly lower oil and gas prices received during the
period.
33
Our
natural gas revenues decreased from approximately $6.9 million during 2008 to
$1.5 million for 2009. The prices realized for natural gas sales decreased 60%,
averaging $3.97 per mcf in during 2009 compared to $9.83 per mcf during
2008. Natural gas production decreased 45% in 2009 as compared to the
prior year period due primarily to decreased production from Lapeyrouse,
Raymondville and Lake Raccourci fields. These fields are under
evaluation for possible divesture in 2010.
Our oil
revenues decreased to approximately $8.7 million during 2009 from approximately
$15.3 million during 2008. We realized a 43% decrease in oil prices received,
decreasing from an average of $102.35 per barrel in 2008 to $58.48 per barrel in
the current year. Overall oil production remained fairly steady by
only decreasing by 1% in 2009 as compared to the prior year due primarily to
decreased oil production at our Lake Raccourci and Raymondville fields. These
decreases were mostly offset by production gains from our Creole
field.
Our oil
and gas operating expense decreased 20%, decreasing from approximately $10.8
million during 2008 to $8.6 million during 2009 due primarily to lower operating
costs at Main Pass 35, lower production taxes which resulted from lower prices
realized on our oil and gas sales during the current year, as well as
hurricane-related repair costs incurred during 2008.
Oil
and Gas Revenues and Oil and Gas Expenses for the Year Ended December 31, 2008
Compared to December 31, 2007
Our oil
and gas revenues increased from $20.4 million in 2007 to $22.2 million for
2008. This increase was due to the higher oil and gas prices received
during the period.
During August and September 2008, two
hurricanes hit the Gulf of Mexico Coast effectively shutting in most of the oil
& gas production in the Texas and Louisiana coastal
area. Production from our operated oil and gas properties (Main Pass
35, Lake Raccourci and Point a la Hache) along with most of our non-operated
properties was shut-in during late August and September. The
estimated effect of the loss of net oil and gas revenue from the hurricanes was
approximately $3.1million.
Our
natural gas revenues decreased from $7.9 million in 2007 to $6.9 million in
2008. The prices realized for natural gas sales increased 23%, averaging $9.83
per mcf in 2008 compared to $7.99 per mcf during 2007. The effects of the
hurricanes during August and September 2008 contributed to the decrease in our
natural gas sales volumes during the year.
Our oil
revenues increased to approximately $15.3 million during 2008 from approximately
$12.5 million during 2007. We realized a 40% increase in oil prices received,
increasing from an average of $72.95 per barrel in 2007 to $102.35 per barrel in
2008. Overall oil production decreased 13% in 2008 as compared to the
prior year due primarily to the effects of the hurricanes.
Our oil
and gas operating expense increased 25%, increasing from approximately $8.7
million during 2007 to $10.8 million during the year due primarily to $1.1
million related to our insurance deductible and repair costs in excess of
insured values associated with the hurricanes.
34
Trading
Revenues, net
We had no trading activity during the
year ended December 31, 2009. As a result of our
trading activities of investments in energy industry securities in 2008 and
2007, we recognized the following net trading revenues (losses) (in
thousands):
|
December
31, 2008
|
December
31, 2007
|
|||||||
| Unrealized loss on written call positions | $ | - | $ | (50 | ) | |||
| Unrealized gain on written put positions | - | 68 | ||||||
|
Unrealized
gain (loss) on written commodity calls
|
37 | (37 | ) | |||||
|
Unrealized
gain (loss) on commodity puts
|
18 | (61 | ) | |||||
|
Realized
gain (loss) on written put options
|
(2,795 | ) | 919 | |||||
|
Realized
loss on crude futures
|
(1,229 | ) | - | |||||
|
Realized
gain on foreign currency
|
97 | - | ||||||
|
Realized
loss on purchased commodity puts
|
(16 | ) | (85 | ) | ||||
|
Realized
loss on common stock
|
(535 | ) | (90 | ) | ||||
|
Realized
gain on written call positions
|
79 | 16 | ||||||
|
Total
trading income (loss)
|
(4,344 | ) | $ | 680 | ||||
Fees,
Interest and Other Income, net
Fees,
interest and other income decreased from $2.4 million in 2008 to $2.2 million in
2009, primarily due to lower interest rates earned from cash and treasury
securities during 2009 along with a gain from the sale of assets recognized
during 2008.
Fees,
interest and other income decreased from $3.2 million during 2007 to $2.4
million during 2008, primarily due to lower interest income rates during the
year.
General
and Administrative Expense
General
and administrative expenses decreased 39% from $5.3 million for 2008 to $3.2
million for 2009 primarily due to continued cost cutting measures which resulted
in overall lower salary and personnel costs along with decreased office and
consultant expenses.
General
and administrative expenses decreased 11% from $6 million in 2007 to $5.3
million for 2008 primarily from overall lower salary and personnel costs due to
fewer employees and lower bonuses during 2008 as compared to the prior year
period.
Provision
for Doubtful Accounts
We
recognized a provision for doubtful accounts of approximately $183 thousand
during 2009 compared to $41 thousand in 2008 primarily due to one of our oil and
gas processing and handling customers filing Chapter 11
bankruptcy. We recognized a benefit for doubtful accounts of $106
thousand in 2007.
35
Depreciation,
Depletion, Amortization and Accretion Expense
Depreciation,
depletion, amortization and accretion (DD&A) expense decreased 33% in 2009
when compared to prior year due to lower production volumes. The
average depletion rate per boe on our properties decreased from $17.22 per boe
in 2008 to $15.21 per boe in 2009.
Depreciation,
depletion, amortization and accretion (DD&A) expense decreased 14% during
2008 when compared to 2007 due to lower oil and gas production volumes. Our
annual depletion rate per boe on our properties increased from $16.32 to $17.22
as a result of decreased proved reserve volumes at December 31,
2008.
Impairment
of Investment in Spitfire
In 2008, we recognized a $4.6 million
impairment of our equity investment in Spitfire based on the
other-than-temporary decline in the fair value of Spitfire’s common shares. No
such impairment was recognized in 2009 or 2007.
Other
Losses
During
2009, 2008 and 2007, we recognized the changes in the fair value of our Spitfire
warrants in other losses in our consolidated financials.
Full
Cost Impairment
Due to a decline in oil and gas prices
at December 31, 2008, we recorded a non-cash full cost pool impairment of
approximately $19.9 million in 2008 related to our oil and gas properties under
the full cost method of accounting. The valuation was based on the present
value, discounted at ten percent, of our proved oil and gas reserves based on
year-end prices. We had no full cost valuation impairments in 2009 or
2007.
Impairment
of Long-Lived Assets
During
2008, we recognized an impairment of approximately $97 thousand for our Lake
Raccourci facility, as the carrying value of such facility was in excess of its
fair market value subsequent to the damage it sustained during the
Hurricanes. We had no impairments of long-lived assets in 2009 or
2007.
Income
Tax Expense
We
recognized an income tax benefit of $40 thousand during 2009 due to an
adjustment made in the current period to our 2008 state and federal income tax
liability. During 2008, we recognized income tax expense of $271
thousand due primarily to an income tax contingency related to a proposed
adjustment to our federal tax liability for the calendar year
2005. See Note 10 – Income Taxes for further
discussion. We had no other income tax contingencies in the current
year or 2007.
36
Accrual
of Dividends related to Preferred Stock
All of our preferred stock issues
contain dividend provisions. Dividends related to all of our preferred stock are
cumulative and may be paid in cash or common stock at our option, depending on
the respective preferred agreement. We accrue the dividends at their cash
liquidation value and reflect the accrual of dividends as a reduction to net
income (loss) to arrive at net income (loss) attributed to common stock.
Accruals of dividends related to preferred stock for each of the three years
ended December 31, 2009 are as follows:
|
2009
|
2008
|
2007
|
||||||||||
|
Series
G1
|
$ | 12,000 | $ | 13,000 | $ | 13,000 | ||||||
|
Series
G2
|
8,000 | 8,000 | 8,000 | |||||||||
|
Series
M
|
260,000 | 284,000 | 196,000 | |||||||||
|
Total
|
$ | 280,000 | $ | 305,000 | $ | 217,000 | ||||||
Payments
of Preferred Stock Dividends and Preferred Stock Redemptions
At December 31, 2009, 2008 and 2007,
the following shares of our Preferred Stock issuances were
outstanding:
|
2009
|
2008
|
2007
|
||||||||||
|
Series
G1
|
1,000 | 1,600 | 1,600 | |||||||||
|
Series
G2
|
1,000 | 1,000 | 1,000 | |||||||||
|
Series
M
|
- | 44,000 | 44,000 | |||||||||
|
Total
|
2,000 | 46,600 | 46,600 | |||||||||
Payment of Preferred Stock Dividends
-- During 2009, 2008 and 2007, we paid the accrued dividends related to
preferred stock for the Series G1 and G2 Preferred with shares of our common
stock issuing approximately 157, 249 and 83 shares, respectively, of our common
stock as payment for the accrued dividends related to the Series G1 and G2
Preferred. The difference between the fair value of the shares of our common
stock and the carrying value of the dividend liability, net of withholding taxes
paid on behalf of the preferred shareholders, is considered a debt
extinguishment gain of $18 thousand, $29 thousand and $9 thousand in 2009, 2008
and 2007, respectively, and is reflected as payment of preferred stock dividends
as an increase to net income (loss) to arrive at net income (loss) attributed to
common stock.
During
the three years ended December 31, 2009, the accounting for the modification and
payment of dividends of our preferred stocks were reflected as either increases
or decreases to net income (loss) attributed to common stock. In June
2009 upon issuance of our common shares, the conversion price of the Series M
Preferred decreased from $13.22 to $11.85 per share. The incremental intrinsic
value of the change in the Series M Preferred conversion price of $76 thousand
is reflected as a payment of preferred stock dividends in our consolidated
statement of operations for the year ended December 31, 2009.
37
The net effect of these preferred stock
modifications and payments of preferred stock dividends for the three years
ended December 31, 2009 is as follows:
|
2009
|
2008
|
2007
|
||||||||||
|
Series
G1
|
$ | 7,000 | $ | 18,000 | $ | 6,000 | ||||||
|
Series
G2
|
8,000 | 10,000 | 3,000 | |||||||||
|
Series
M
|
(154,000 | ) | (85,000 | ) | (56,000 | ) | ||||||
|
Total
|
$ | (139,000 | ) | $ | (57,000 | ) | $ | (47,000 | ) | |||
LIQUIDITY AND CAPITAL STRUCTURE
Financial
Condition
|
December
31,
|
December
31,
|
|||||||
|
(Thousands
of dollars)
|
2009
|
2008
|
||||||
|
Current
ratio
|
2.74
to 1
|
5.77
to 1
|
||||||
|
Working
capital (1)
|
$ | 5,989 | $ | 16,102 | ||||
|
Total
debt
|
$ | - | $ | - | ||||
|
Total
cash and marketable securities less debt
|
$ | 7,030 | $ | 15,219 | ||||
|
Total
stockholders' equity
|
$ | 57,831 | $ | 59,904 | ||||
|
Total
liabilities to equity
|
0.18
to 1
|
0.15
to 1
|
||||||
(1)
Working capital is the difference between current assets and current
liabilities.
The
decreases in our current ratio and our working capital as of December 31, 2009
as compared to December 31, 2008 are primarily due to the discretionary use of
cash for current year capital projects as well as repurchases of our common and
preferred shares. We deployed cash of $4.4 million to redeem 44,000
shares of our Series M Preferred and $1.9 million to repurchase shares of our
common stock during 2009. We have no debt outstanding as of December 31, 2009.
We deployed approximately $2.6 million during the 2009 period for capital
projects. The majority of these capital expenditures were used for
upgrades and improvements at our Main Pass 35 facility as well as the completion
of two producing wells at our Creole field, increasing both our reserves and
production from this field.
During 2009, oil and natural gas prices
declined sharply as compared to the prior year period. However, we reduced our
controllable costs in order to maintain positive cash flow from operations
during this low commodity pricing environment. We have a cash balance of
approximately $7 million at December 31, 2009. In 2010, we anticipate our
operating cash flow and other capital resources, if needed, will adequately fund
our planned capital expenditures and other capital uses over the
near-term. Based on industry outlook for 2010, prices for oil and
natural gas are expected to be higher as compared to 2009.
We may
continue to deploy cash for discretionary capital expenditures, long-term
investments or seek to raise financing through the issuance of debt, equity and
convertible debt instruments, if needed, for utilization of acquisition,
development or investment opportunities as they arise. We may also reduce our
ownership interest in Spitfire’s and Global’s common shares through strategic
sales under certain conditions.
38
At
December 31, 2009, if our remaining convertible preferred stock were converted
and the put/call option was exercised, we would be required to issue the
following amounts of our common stock:
|
Shares
of Common
|
||||||||
|
Stock
Issuable at
|
||||||||
|
Instrument
|
Conversion
Price (a)
|
December
31, 2009
|
||||||
|
Series
G1 Preferred
|
$ | 280.00 | 357 | |||||
|
BWI
Put/Call Option
|
725,000 | |||||||
|
Series
G2 Preferred
|
$ | 67.20 | 1,488 | |||||
|
Common
Stock Potentially Issued Upon Conversion
|
726,845 | |||||||
|
(a)
Certain conversion prices are subject to adjustment under certain
circumstances.
|
||||||||
Option to Issue Common Shares
– In 2009, pursuant to the terms of our investment in BWI and the related
Agreement, HKN and the other BWI unitholders granted to one another put and call
options with respect to 3,050 units of BWI (or 30.5% of the outstanding units)
in exchange for issuance of 725 thousand restricted shares of our common
stock. These options are exercisable only if certain conditions are
satisfied prior to June 2012. None of these conditions have been met
as of December 31, 2009 or as of the date of this filing. Please see
Note 2 –“Investment in BriteWater International, LLC” for additional information
of our investment.
Significant
Ownership of our Stock
As of December 31, 2009, Lyford
beneficially owned approximately 33% of the combined voting power of our common
stock. Lyford is in a position to exercise significant influence over
the election of our board of directors and other
matters.
Cash
Flows
Net cash
flow provided by operating activities during 2009 was $10.3 million, as compared
to net cash used of $7.3 million in 2008. The increase in cash flow provided by
operating activities as compared to the prior year period was primarily caused
by a $9.5 million conversion of marketable securities into cash, collection of
our previously outstanding hurricane insurance receivable, and a reduction in
our operating, general and administrative costs as a result of cost-cutting
efforts. Our cash on hand at December 31, 2009 totaled approximately $7
million.
Net cash used in financing activities
during 2009 and 2008 totaled approximately $6.6 million and $4.6 million,
respectively, due to repurchases of our preferred and common stock. Net cash
used in investing activities during 2009 totaled approximately $2.3 million and
was primarily comprised of capital expenditures associated with completion costs
for two wells in our outside-operated Creole field and upgrades and improvements
made at our Main Pass 35 facility.
Obligations
and Commitments
Oil, Natural Gas and Coalbed Methane
Commitments – During 2009, we expended approximately $2.6 million of
capital expenditures and workovers in the United States. The majority of these
capital expenditures were associated with completion costs for the Creole field
in south Texas and upgrades and improvements made at our Main Pass 35 facility
in offshore Louisiana. During 2009, we limited our capital
expenditures while oil and natural gas prices remained low. In 2009,
industry-wide drilling costs did not reduce in comparison to the dramatic drop
in commodity prices. In 2010, we expect to fund our capital
expenditures with available cash on hand and through projected cash flow from
operations. Our capital expenditures for 2010 are discretionary and,
as a result, will be curtailed if sufficient funds are not available. Such
expenditure curtailments, however, could result in us losing certain prospect
acreage or reducing our interest in future development projects.
39
BriteWater Contingencies – In
2009, BWI recorded a contingent liability of $800 thousand which may be payable
to a vendor upon the conclusion of certain testing events of the OHSOL plant
equipment. This contingent liability is included in other accrued liabilities
within our consolidated condensed balance sheet.
Deferred Tax Liability – In
2009, upon our investment in BWI, we recorded a deferred tax liability in the
amount of $729 thousand, calculated by applying the domestic statutory tax rates
to the difference between the book purchase price and the estimated tax
basis. Information and research regarding the tax basis of the assets
at the date of the acquisition is not complete at this time and the deferred tax
may be adjusted as more information becomes available.
Operational Contingencies
– Our operations are
subject to stringent and complex environmental laws and regulations governing
the discharge of materials into the environment or otherwise relating to
environmental protection. These laws and regulations are subject to changes that
may result in more restrictive or costly operations. Failure to comply with
applicable environmental laws and regulations may result in the imposition of
administrative, civil and criminal penalties or injunctive relief.
We recognize the full amount of asset
retirement obligations beginning in the period in which they are incurred if a
reasonable estimate of a fair value can be made. At December 31, 2009, our asset
retirement obligation liability totaled approximately $6.2 million.
From time to time, we provide for
reserves related to contingencies when a loss is probable and the amount is
reasonably estimable.
Consolidated Contractual Obligations
– The
following table presents a summary of our consolidated contractual obligations
and commercial commitments as of December 31, 2009 (in thousands):
|
Payments
Due by Period
|
||||||||||||||||||||||||
|
Contractual
Obligations
|
2010
|
2011
|
2012
|
2013
|
Thereafter
|
Total
|
||||||||||||||||||
|
Office
Leases
|
$ | 189 | $ | 78 | $ | - | $ | - | $ | - | $ | 267 | ||||||||||||
|
Oil, Gas and Coalbed Methane
Commitments (1)
|
$ | - | $ | - | $ | - | $ | - | $ | - | - | |||||||||||||
|
Asset
Retirement Obligation
|
$ | 43 | $ | 378 | $ | 197 | $ | 137 | $ | 5,438 | 6,193 | |||||||||||||
|
Total
Contractual Cash Obligations
|
$ | 232 | $ | 456 | $ | 197 | $ | 137 | $ | 5,438 | $ | 6,460 | ||||||||||||
(1) Our 2010 capital
expenditures are discretionary and, as a result, will be curtailed if sufficient
funds are not available.
In
addition to the above commitments, during 2009 and afterward, government
authorities under our Louisiana state leases and other operators may also
request us to participate in the cost of drilling additional exploratory and
development wells. We may fund these future expenditures at our discretion.
Further, the cost of drilling or participating in the drilling of any such
exploratory and development wells cannot be quantified at this time since the
cost will depend on factors out of our control, such as the timing of the
request, the depth of the wells and the location of the property. As of December
31, 2009, we had no material purchase obligations.
40
Off-Balance Sheet Arrangements
-- As part of our ongoing business, we do not participate in transactions
that generate relationships with unconsolidated entities or financial
partnerships, such as entities often referred to as structured finance or
special purpose entities ("SPEs"), which would have been established for the
purpose of facilitating off-balance sheet arrangements or other contractually
narrow or limited purposes. As of December 31, 2009, we were not involved in any
unconsolidated SPE transactions. We have no off-balance sheet
arrangements.
Treasury Stock – In January
2009, our Board of Directors authorized an amendment to the existing repurchase
plan allowing us to repurchase an additional 1 million shares of our common
stock. During the year ended December 31, 2009, we repurchased approximately 708
thousand shares of our common stock. This included a repurchase of 500 thousand
shares of our common stock for $1.3 million from a shareholder in a privately
negotiated transaction pursuant to our repurchase program. During the year ended
December 31, 2009, we retired approximately 715 thousand treasury shares. As of
December 31, 2009 approximately 530 thousand shares remained available for
repurchase under our repurchase program.
During
2008, we repurchased 507 thousand shares of our common stock in the open market
at a cost of approximately $4.4 million pursuant to our repurchase program. In
2008, we cancelled 500 thousand of these shares. At December 31,
2008, we held 6,869 shares of treasury stock, and approximately 237 thousand
shares remained available for repurchase under our repurchase
program.
Redemption of Series M Preferred
– During 2009, we
redeemed all 44 thousand shares of our Series M Preferred with a liquidation
value of $100 per share for $4.4 million in cash. In addition, we paid
approximately $124 thousand in accrued dividends on these shares.
Redemption of Series G1 Preferred
– During 2009, we
redeemed six hundred shares of our Series G1 Preferred with a liquidation value
of $100 per share and 18 Common stock for $5 thousand in cash. In addition, we
paid approximately $2 thousand in accrued dividends on these
shares.
Adequacy
of Capital Sources and Liquidity
We believe that we have the ability to
provide for our operational needs, our planned capital expenditures and possible
investments through projected operating cash flow and cash on hand. Our
operating cash flow would be adversely affected by continued declines in oil and
natural gas prices, which can be volatile. However, we have worked to
reduce our controllable costs in order to maintain positive cash flow from
operations during this low commodity pricing environment. Should
projected operating cash flow decline, we may further reduce our capital
expenditures and possible investments and/or consider the issuance of debt,
equity and convertible debt instruments, if needed, for utilization for the
capital expenditure program or possible energy-based investment
opportunities. We may also continue to reduce our ownership interest
in Spitfire’s and Global’s common shares through strategic sales under certain
conditions.
We have no debt outstanding at December
31, 2009. If we seek to raise equity or debt financing to fund
capital expenditures or other acquisition and development opportunities, those
transactions may be affected by the market value of our common
stock. If the price of our common stock declines, our ability to
utilize our stock either directly or indirectly through convertible instruments
for raising capital could be negatively affected. Further, raising additional
funds by issuing common stock or other types of equity securities could dilute
our existing stockholders, which dilution could be substantial if the price of
our common stock decreases. Any securities we issue may have rights, preferences
and privileges that are senior to our existing equity securities. Borrowing
money may also involve pledging some or all of our assets.
41
ITEM
7A. QUANTITATIVE AND QUALITATIVE DISCLOSURES ABOUT MARKET
RISK
Our oil
and gas operations are exposed to market risks primarily as a result of changes
in commodity prices.
Foreign Currency Exchange Rate
Risk – Our investment in Global is subject to foreign currency exchange
rate risk as our ownership of Global’s ordinary shares are denominated in
British sterling pounds. Also, our investment in Spitfire is subject to foreign
currency exchange rate risk as our ownership of Spitfire’s ordinary shares are
denominated in Canadian dollars. Any substantial fluctuation in these
exchange rates as compared to the United States dollar could have a material
effect on our balance sheet.
Commodity Price Risk –
Commodity derivatives are used to mitigate the price risk inherent in our oil
and gas operations. We have purchased put options to protect against significant
decreases in commodity prices and will continue to consider various arrangements
to realize commodity prices that we consider favorable. We have not designated
these instruments as hedges under ASC 815.
ITEM
8. FINANCIAL STATEMENTS AND SUPPLEMENTARY DATA
The
following financial statements appear on pages 43 through 78 in this Annual
Report.
| Page | |
|
Report
of Independent Registered Public Accounting Firms
|
43
|
|
|
|
|
Consolidated
Balance Sheets -- December 31, 2009 and 2008
|
44
|
|
Consolidated
Statements of Operations --
|
|
|
Years
ended December 31, 2009, 2008 and 2007
|
45
|
|
Consolidated
Statements of Stockholders’ Equity --
|
|
|
Years
ended December 31, 2009, 2008 and 2007
|
46
|
|
Consolidated
Statements of Cash Flows --
|
|
|
Years
ended December 31, 2009, 2008 and 2007
|
47
|
|
Notes
to Consolidated Financial Statements
|
48
|
42
REPORT
OF INDEPENDENT REGISTERED PUBLIC ACCOUNTING FIRM
To the
Board of Directors
HKN,
Inc.
We have
audited the accompanying consolidated balance sheets of HKN, Inc as of December
31, 2009 and 2008, and the related consolidated statements of operations,
stockholders’ equity and cash flows for each of the three years in the period
ended December 31, 2009. These financial statements are the
responsibility of the Company's management. Our responsibility is to
express an opinion on these financial statements based on our
audits.
We
conducted our audits in accordance with the standards of the Public Company
Accounting Oversight Board (United States). Those standards require
that we plan and perform the audit to obtain reasonable assurance about whether
the financial statements are free of material misstatement. An audit
includes examining, on a test basis, evidence supporting the amounts and
disclosures in the financial statements. An audit also includes
assessing the accounting principles used and significant estimates made by
management, as well as evaluating the overall financial statement
presentation. We believe that our audits provide a reasonable basis
for our opinion.
In our
opinion, the consolidated financial statements referred to above present fairly,
in all material respects, the financial position of HKN, Inc. as of December 31,
2009 and 2008, and the results of their operations and their cash flows for each
of the three years in the period ended December 31, 2009, in conformity with
U.S. generally accepted accounting principles.
We also
have audited, in accordance with the standards of the Public Company Accounting
Oversight Board (United States), HKN, Inc.'s internal control over financial
reporting as of December 31, 2009, based on criteria established in Internal
Control—Integrated Framework issued by the Committee of Sponsoring Organizations
of the Treadway Commission (COSO) and our report dated February 18, 2010
expressed an unqualified opinion on the effectiveness of HKN, Inc.’s internal
control over financial reporting.
HEIN & ASSOCIATES
LLP
Dallas,
Texas
February
18, 2010
43
HKN, INC.
CONSOLIDATED
BALANCE SHEETS
(in thousands, except for share
amounts)
|
Assets
|
December
31,
|
December
31,
|
||||||
|
2009
|
2008
|
|||||||
|
Current
Assets:
|
||||||||
|
Cash
and temporary investments
|
$ | 7,030 | $ | 5,722 | ||||
|
Marketable
securities (Treasury bills)
|
- | 9,497 | ||||||
|
Accounts
receivable, net
|
1,969 | 3,778 | ||||||
|
Prepaid
expenses and other current assets
|
433 | 482 | ||||||
|
Total
Current Assets
|
9,432 | 19,479 | ||||||
|
Unevaluated
oil and gas properties
|
5,099 | 4,874 | ||||||
|
Evaluated
oil and gas properties, net
|
29,355 | 29,628 | ||||||
|
OHSOL
equipment, net
|
7,027 | - | ||||||
|
Other
equipment, net
|
697 | 856 | ||||||
|
Property
and Equipment, net
|
42,178 | 35,358 | ||||||
|
Intangible
assets
|
1,946 | - | ||||||
|
Investment
in Global
|
12,637 | 11,824 | ||||||
|
Investment
in Spitfire, equity method
|
1,608 | 1,820 | ||||||
|
Other
Assets
|
414 | 292 | ||||||
| $ | 68,215 | $ | 68,773 | |||||
|
Liabilities and Stockholders'
Equity
|
||||||||
|
Current
Liabilities:
|
||||||||
|
Trade
payables
|
$ | 498 | $ | 639 | ||||
|
Accrued
liabilities and other
|
2,153 | 1,826 | ||||||
|
Income
tax contingency
|
225 | 225 | ||||||
|
Revenues
and royalties payable
|
567 | 687 | ||||||
|
Total
Current Liabilities
|
3,443 | 3,377 | ||||||
|
Asset
Retirement Obligation
|
6,193 | 5,472 | ||||||
|
Deferred
Income Taxes
|
748 | 20 | ||||||
|
Total
Liabilities
|
10,384 | 8,869 | ||||||
|
Commitments
and Contingencies (Note 19)
|
||||||||
|
Stockholders’
Equity:
|
||||||||
|
Series
G1 Preferred Stock, $1.00 par value; $100 thousand and $160 thousand
liquidation value, respectively;
|
||||||||
|
700,000
shares authorized; 1,000 and 1,600 shares outstanding,
respectively
|
1 | 2 | ||||||
|
Series
G2 Preferred Stock, $1.00 par value; $100 thousand liquidation
value
|
||||||||
|
100,000
shares authorized; 1,000 shares outstanding
|
1 | 1 | ||||||
|
Series
M Preferred Stock, $1.00 par value; $0 and $4.4 million liquidation value,
respectively;
|
||||||||
|
50,000
shares authorized; 0 and 44,000 shares outstanding,
respectively
|
- | 44 | ||||||
|
Common
stock, $0.01 par value; 24,000,000 shares authorized;
|
||||||||
|
9,553,847
and 9,268,253 shares issued, respectively
|
96 | 93 | ||||||
|
Additional
paid-in capital
|
437,877 | 442,642 | ||||||
|
Accumulated
deficit
|
(388,644 | ) | (385,171 | ) | ||||
|
Accumulated
other comprehensive income
|
3,213 | 2,312 | ||||||
|
Treasury
stock, at cost, 0 and 6,869 shares held, respectively
|
- | (19 | ) | |||||
|
Total
HKN, Inc. Stockholders’ Equity
|
52,544 | 59,904 | ||||||
|
Noncontrolling
interest
|
5,287 | - | ||||||
|
Total
Stockholders' Equity
|
57,831 | 59,904 | ||||||
| $ | 68,215 | $ | 68,773 | |||||
The
accompanying Notes to Consolidated Financial Statements are
an
integral part of these Statements.
44
HKN,
INC.
CONSOLIDATED
STATEMENTS OF OPERATIONS
(in thousands except for share and per share amounts)
|
Year
Ended December 31,
|
||||||||||||
|
2009
|
2008
|
2007
|
||||||||||
|
Revenues
and other:
|
||||||||||||
|
Domestic
oil and gas operations
|
$ | 10,185 | $ | 22,206 | $ | 20,419 | ||||||
|
Trading
revenues (losses), net
|
- | (4,344 | ) | 680 | ||||||||
|
Interest
and other income
|
2,183 | 2,401 | 3,199 | |||||||||
| 12,368 | 20,263 | 24,298 | ||||||||||
|
Costs
and Expenses:
|
||||||||||||
|
Domestic
oil and gas operating expenses
|
8,591 | 10,801 | 8,648 | |||||||||
|
General
and administrative expenses
|
3,197 | 5,281 | 5,950 | |||||||||
|
Provision
(benefit) for doubtful accounts
|
183 | 41 | (106 | ) | ||||||||
|
Depreciation,
depletion, amortization and accretion
|
3,524 | 5,224 | 6,107 | |||||||||
|
Equity
in losses (gains) of Spitfire
|
225 | (196 | ) | 50 | ||||||||
|
Impairment
of facilities
|
- | 97 | - | |||||||||
|
Impairment
of investment in Spitfire
|
- | 4,618 | - | |||||||||
|
Full
cost impairment
|
- | 19,906 | - | |||||||||
|
Interest
expense and other losses
|
33 | 121 | 390 | |||||||||
| 15,753 | 45,893 | 21,039 | ||||||||||
|
Income
(loss) from continuing operations before income taxes
|
$ | (3,385 | ) | $ | (25,630 | ) | $ | 3,259 | ||||
|
Income
tax expense (benefit)
|
(40 | ) | 275 | 30 | ||||||||
|
Income
(loss) from continuing operations
|
$ | (3,345 | ) | $ | (25,905 | ) | $ | 3,229 | ||||
|
Loss
from discontinued operations, net of taxes
|
- | (1,049 | ) | - | ||||||||
|
Net
income (loss)
|
$ | (3,345 | ) | $ | (26,954 | ) | $ | 3,229 | ||||
|
Net
loss attributable to noncontrolling interests
|
295 | - | - | |||||||||
|
Net
loss from discontinued operations attributable to noncontrolling
interests
|
- | 208 | - | |||||||||
|
Net
income (loss) attributable to HKN, Inc.
|
$ | (3,050 | ) | $ | (26,746 | ) | $ | 3,229 | ||||
|
Accrual
of dividends related to preferred stock
|
(280 | ) | (305 | ) | (217 | ) | ||||||
|
Payments
of dividends and modification of preferred stock and common stock
warrants
|
(139 | ) | (57 | ) | (47 | ) | ||||||
|
Net
income (loss) attributed to common stock
|
$ | (3,469 | ) | $ | (27,108 | ) | $ | 2,965 | ||||
|
Basic
and diluted net income (loss) per common share:
|
||||||||||||
|
Net
income (loss) per common share from continuing operations
|
$ | (0.37 | ) | $ | (2.74 | ) | $ | 0.30 | ||||
|
Net
loss per common share from discontinued operations
|
- | (0.09 | ) | - | ||||||||
|
Net
income (loss) per common share
|
$ | (0.37 | ) | $ | (2.83 | ) | $ | 0.30 | ||||
|
Weighted
average common shares outstanding
|
9,269,565 | 9,587,952 | 9,799,332 | |||||||||
The
accompanying Notes to Consolidated Financial Statements are
an
integral part of these Statements.
45
HKN,
INC.
CONSOLIDATED
STATEMENTS OF STOCKHOLDERS' EQUITY
(in
thousands)
|
|
Accumulated
|
|||||||||||||||||||||||||||||||||||||||
|
Additional
|
Other
|
|||||||||||||||||||||||||||||||||||||||
|
Preferred
Stock
|
Common
|
Paid-In
|
Treasury
|
Noncontrolling
|
Accumulated
|
Comprehensive
|
||||||||||||||||||||||||||||||||||
| G1 | G2 | M |
Stock
|
Capital
|
Stock
|
Interest
|
Deficit
|
Income
|
Total
|
|||||||||||||||||||||||||||||||
|
Balance, December
31, 2006
|
$ | 2 | $ | 1 | $ | 44 | $ | 100 | $ | 449,218 | $ | (1,670 | ) | $ | - | $ | (361,028 | ) | $ | 18,334 | $ | 105,001 | ||||||||||||||||||
|
Accrual
of preferred stock dividends
|
- | - | - | - | - | - | - | (264 | ) | - | (264 | ) | ||||||||||||||||||||||||||||
|
Issuance
of preferred stock dividends
|
- | - | - | - | 1 | - | - | - | - | 1 | ||||||||||||||||||||||||||||||
|
Reverse
stock split
|
- | - | - | - | (10 | ) | - | - | - | - | (10 | ) | ||||||||||||||||||||||||||||
|
Treasury
stock repurchase
|
- | - | - | - | - | (679 | ) | - | - | - | (679 | ) | ||||||||||||||||||||||||||||
|
Treasury
stock retirements
|
- | - | - | (2 | ) | (2,347 | ) | 2,349 | - | - | - | - | ||||||||||||||||||||||||||||
|
Equity
in stock issuances by Spitfire
|
- | - | - | - | 111 | - | - | - | - | 111 | ||||||||||||||||||||||||||||||
|
Comprehensive
loss:
|
||||||||||||||||||||||||||||||||||||||||
|
Net
income
|
- | - | - | - | - | - | - | 3,229 | - | |||||||||||||||||||||||||||||||
|
Unrealized
holding loss on available for sale investments
|
(8,469 | ) | ||||||||||||||||||||||||||||||||||||||
|
Reclassification
of holding loss on available for sale investment into
earnings
|
207 | |||||||||||||||||||||||||||||||||||||||
|
Unrealized
foreign currency gain
|
639 | |||||||||||||||||||||||||||||||||||||||
|
Total
comprehensive loss
|
(4,394 | ) | ||||||||||||||||||||||||||||||||||||||
|
Balance, December
31, 2007
|
$ | 2 | $ | 1 | $ | 44 | $ | 98 | $ | 446,973 | $ | - | $ | - | $ | (358,063 | ) | $ | 10,711 | $ | 99,766 | |||||||||||||||||||
|
Accrual
of preferred stock dividends
|
- | - | - | - | - | - | - | (362 | ) | - | (362 | ) | ||||||||||||||||||||||||||||
|
Issuance
of preferred stock dividends
|
- | - | - | - | 2 | - | - | - | - | 2 | ||||||||||||||||||||||||||||||
|
Treasury
stock repurchase
|
- | - | - | - | - | (4,404 | ) | - | - | - | (4,404 | ) | ||||||||||||||||||||||||||||
|
Treasury
stock retirements
|
- | - | - | (5 | ) | (4,380 | ) | 4,385 | - | - | - | - | ||||||||||||||||||||||||||||
|
Equity
in stock issuances by Spitfire
|
- | - | - | - | 47 | - | - | - | - | 47 | ||||||||||||||||||||||||||||||
|
Comprehensive
loss:
|
||||||||||||||||||||||||||||||||||||||||
|
Net
loss
|
- | - | - | - | - | - | - | (26,746 | ) | - | ||||||||||||||||||||||||||||||
|
Unrealized
holding loss on available for sale investments
|
(2,172 | ) | ||||||||||||||||||||||||||||||||||||||
|
Unrealized
foreign currency loss
|
(6,227 | ) | ||||||||||||||||||||||||||||||||||||||
|
Total
comprehensive loss
|
(35,145 | ) | ||||||||||||||||||||||||||||||||||||||
|
Balance, December
31, 2008
|
$ | 2 | $ | 1 | $ | 44 | $ | 93 | $ | 442,642 | $ | (19 | ) | $ | - | $ | (385,171 | ) | $ | 2,312 | $ | 59,904 | ||||||||||||||||||
|
Issuance
of restricted shares related to investment, net of
|
||||||||||||||||||||||||||||||||||||||||
|
issuance
costs of $35 thousand
|
- | - | - | 10 | 1,307 | - | - | - | - | 1,317 | ||||||||||||||||||||||||||||||
|
Cumulative
effect of Series M Preferred conversion feature
|
- | - | - | - | - | - | - | (4 | ) | - | (4 | ) | ||||||||||||||||||||||||||||
|
Adjustment
of Series M conversion price
|
- | - | - | - | 76 | - | - | (76 | ) | - | - | |||||||||||||||||||||||||||||
|
Accrual
of preferred stock dividends
|
- | - | - | - | - | - | - | (280 | ) | - | (280 | ) | ||||||||||||||||||||||||||||
|
Issuance
of preferred stock dividends
|
- | - | - | - | 1 | - | - | (63 | ) | - | (62 | ) | ||||||||||||||||||||||||||||
|
Preferred
stock redemption
|
(1 | ) | - | (44 | ) | - | (4,356 | ) | - | - | - | - | (4,401 | ) | ||||||||||||||||||||||||||
|
Treasury
stock repurchase
|
- | - | - | - | - | (1,890 | ) | - | - | - | (1,890 | ) | ||||||||||||||||||||||||||||
|
Treasury
stock retirements
|
- | - | - | (7 | ) | (1,902 | ) | 1,909 | - | - | - | - | ||||||||||||||||||||||||||||
|
Equity
in stock repurchases by Spitfire
|
- | - | - | - | 109 | - | - | - | - | 109 | ||||||||||||||||||||||||||||||
|
Comprehensive
loss:
|
||||||||||||||||||||||||||||||||||||||||
|
Net
loss
|
(3,050 | ) | - | |||||||||||||||||||||||||||||||||||||
|
Unrealized
holding gain on available for sale investments
|
24 | |||||||||||||||||||||||||||||||||||||||
|
Unrealized
foreign currency gain
|
877 | |||||||||||||||||||||||||||||||||||||||
|
Total
comprehensive loss
|
(2,149 | ) | ||||||||||||||||||||||||||||||||||||||
|
Noncontrolling
interest in investment
|
- | - | - | - | - | - | 5,287 | - | - | 5,287 | ||||||||||||||||||||||||||||||
|
Balance,
December 31, 2009
|
$ | 1 | $ | 1 | $ | - | $ | 96 | $ | 437,877 | $ | - | $ | 5,287 | $ | (388,644 | ) | $ | 3,213 | $ | 57,831 | |||||||||||||||||||
The
accompanying Notes to Consolidated Financial Statements
are
an integral part of these Statements.
46
HKN,
INC.
CONSOLIDATED
STATEMENTS OF CASH FLOWS
(in
thousands)
|
For
the Year Ended
|
||||||||||||
|
2009
|
2008
|
2007
|
||||||||||
|
Cash
flows from operating activities:
|
||||||||||||
|
Net
income (loss)
|
$ | (3,345 | ) | $ | (26,954 | ) | $ | 3,229 | ||||
|
Adjustments
to reconcile net income (loss) to net cash
|
||||||||||||
|
(used)
provided by operating activities:
|
||||||||||||
|
Depreciation,
depletion, amortization and accretion
|
3,524 | 5,224 | 6,107 | |||||||||
|
Loss
on trading investments
|
- | 534 | 91 | |||||||||
|
Loss
(gain) on trading derivatives
|
- | 3,810 | (779 | ) | ||||||||
|
Equity
in losses (gains) of Spitfire
|
225 | (196 | ) | 50 | ||||||||
|
Realized
gain from sale of Spitfire shares
|
(30 | ) | - | - | ||||||||
|
Impairment
of investment in Spitfire
|
- | 4,618 | - | |||||||||
|
Impairment
of facilities
|
- | 97 | - | |||||||||
|
Full
cost impairment
|
- | 19,906 | - | |||||||||
|
Operating
cash flows from discontinued operations
|
- | 804 | - | |||||||||
|
Other
|
- | (224 | ) | (117 | ) | |||||||
|
Change
in operating assets and liabilities:
|
||||||||||||
|
Decrease
(increase) in marketable securities
|
9,497 | (9,497 | ) | 5,000 | ||||||||
|
Decrease
in accounts receivable and other
|
1,796 | 537 | 4,211 | |||||||||
|
Decrease
in margin deposits posted with brokers
|
- | 123 | 587 | |||||||||
|
(Decrease)
increase in derivative liabilities
|
- | (3,872 | ) | 388 | ||||||||
|
Decrease
in trade payables and other
|
(1,385 | ) | (2,231 | ) | (6,299 | ) | ||||||
|
Net
cash provided (used) by operating activities
|
10,282 | (7,321 | ) | 12,468 | ||||||||
|
Cash
flows from investing activities:
|
||||||||||||
|
Net
proceeds from sales of assets
|
- | 337 | 1,281 | |||||||||
|
Capital
expenditures
|
(2,552 | ) | (6,896 | ) | (10,867 | ) | ||||||
|
Sales
of investments
|
- | 2,265 | 1,530 | |||||||||
|
Purchase
of available for sale investments
|
- | (1,634 | ) | - | ||||||||
|
Investing
cash flows from discontinued operations
|
- | (1,969 | ) | - | ||||||||
|
Purchase
of common shares in Spitfire
|
- | (77 | ) | (3,900 | ) | |||||||
|
Proceeds
from sale of Spitfire common shares
|
212 | - | - | |||||||||
|
Net
cash used in investing activities
|
(2,340 | ) | (7,974 | ) | (11,956 | ) | ||||||
|
Cash
flows from financing activities:
|
||||||||||||
|
Redemption
of preferred stock
|
(4,401 | ) | - | - | ||||||||
|
Financing
cash flows from discontinued operations
|
- | 208 | - | |||||||||
|
Payments
of preferred dividends
|
(343 | ) | (368 | ) | (196 | ) | ||||||
|
Cash
paid for partial shares in reverse split
|
- | - | (10 | ) | ||||||||
|
Treasury
shares purchased
|
(1,890 | ) | (4,404 | ) | (679 | ) | ||||||
|
Net
cash used in financing activities
|
(6,634 | ) | (4,564 | ) | (885 | ) | ||||||
|
Net
increase (decrease) in cash and temporary investments
|
1,308 | (19,859 | ) | (373 | ) | |||||||
|
Cash
and temporary investments at beginning of year
|
5,722 | 25,581 | 25,954 | |||||||||
|
Cash
and temporary investments at end of year
|
$ | 7,030 | $ | 5,722 | $ | 25,581 | ||||||
The
accompanying Notes to Consolidated Financial Statements
are
an integral part of these Statements.
47
HKN,
INC.
NOTES
TO CONSOLIDATED FINANCIAL STATEMENTS
|
(1)
|
SUMMARY
OF SIGNIFICANT ACCOUNTING POLICIES
|
HKN, Inc.
(HKN) (a Delaware Corporation) is an independent energy company engaged both in
the development and production of crude oil, natural gas and coalbed methane
assets and in the management of investments in energy industry securities. Our
crude oil and natural gas operations consist of development and production
efforts in the United States, principally in the onshore and offshore Gulf Coast
regions of South Texas and Louisiana, as well as coalbed methane exploration and
development activities in Indiana and Ohio.
At
December 31, 2009, we held an investment in Global Energy Development PLC
(“Global”) through our ownership of approximately 34% of Global’s ordinary
shares which we account for as a cost method investment. Global is a
petroleum exploration and production company focused on Latin
America. Global’s shares are traded on the AIM, a market operated by
the London Stock Exchange.
At
December 31, 2009, we also held an investment in Spitfire Energy Ltd.
(“Spitfire”) through the ownership of approximately 25% of Spitfire’s currently
outstanding common shares. Spitfire is an independent public company (TSX-V;
SEL) engaged in the exploration, development and production of crude oil,
natural gas and natural gas liquids in Western Canada. Our
consolidated financial statements retroactively reflect the effect of the change
in the accounting for our investment in Spitfire from the cost method to the
equity method.
Principles of Consolidation and
Presentation - The consolidated financial statements include the
accounts of HKN and all of the companies that we, through our direct or indirect
ownership or share holding, were provided the ability to control the operating
policies and procedures. All significant intercompany balances and transactions
have been eliminated. During the fourth quarter of 2009, we discontinued
operations of the Canergy Growth Fund and Canergy Management from our
consolidated financial statements. We reflected the deconsolidation
retrospectively. See Note 13 – “Discontinued Operations” for further
discussion.
The preparation of financial statements
in conformity with accounting principles generally accepted in the United States
of America (U.S. GAAP) requires management to make estimates and assumptions
that affect the reported amounts of assets and liabilities and disclosure of
contingent assets and liabilities at the date of the financial statements and
the reported amounts of revenues and expenses during the reported period.
Significant estimates are required for proved oil and gas reserves which, as
described in Note 7 – Oil and Gas Properties, may have a material impact on the
carrying value of oil and gas property. Actual results could differ from those
estimates and such differences could be material. Certain prior year amounts
have been reclassified to conform with the 2009 presentation.
Consolidation of Variable Interest
Entity - Our investment in BriteWater International, LLC (“BWI”),
formerly referred to as UniPureEnergy, is considered to be a variable interest,
as defined in ASC 810-10, Consolidation. ASC 810-10-25
requires the primary beneficiary of a variable interest entity’s (“VIE”)
activities to consolidate the VIE. ASC 810-10-15 defines a VIE as an entity in
which the equity investors do not have substantive voting rights and there is
not sufficient equity at risk for the entity to finance its activities without
additional subordinated financial support. We have determined that our
investment in BWI meets the requirements of ASC 810-10, and we are the primary
beneficiary, as defined. Accordingly, we began consolidating the assets and
liabilities of BWI as of June 30, 2009 (the investment date). The
results of operations for the six months ended December 31, 2009 are
consolidated in our results of operations.
48
Our investments in the Canergy Growth
Fund and Canergy Management were variable interests, as defined in ASC 810-10,
and we were the primary beneficiary, as defined. Therefore, we consolidated the
assets, liabilities and results of operations of the Canergy Growth Fund for the
period from May 14, 2008, the formation date, through the third quarter of 2009.
During the fourth quarter of 2009, we discontinued operations of the Canergy
Growth Fund and Canergy Management. In 2009, we have retrospectively reported
the assets, liabilities and results of operations of the Canergy Growth Fund and
Canergy Management as discontinued operations in our consolidated financial
statements.
Statement of Cash Flows
- For purposes of the Consolidated Statements of Cash Flows, we
consider all highly liquid investments and treasury bills purchased with an
original maturity of three months or less to be cash equivalents. We paid no
cash for interest during 2009, 2008 and 2007. Treasury bills with original
maturities of greater than three months are classified as marketable securities.
At December 31, 2009 and 2008, we held zero marketable securities and $9.5
million in marketable securities, respectively.
Concentrations of Credit Risk
- Although our cash and temporary investments and accounts receivable are
exposed to potential credit loss, we do not believe such risk to be significant.
Cash and temporary investments include investments in certificates of deposit
and money markets placed with highly rated financial institutions. Most of our
accounts receivable are from a broad and diverse group of industry partners,
many of which are major oil and gas companies and do not in total represent a
significant credit risk.
Hurricane Damage Repairs – In
2008, we recognized $1.1 million as expense damages incurred from hurricanes
Gustav and Ike primarily related to our insurance deductible and repair costs in
excess of insured values. At December 31, 2008, our remaining insurance claim
receivable was $1.4 million on our consolidated balance sheet. These insurance
proceeds were received in early 2009.
Allowance for Doubtful Accounts -
Accounts receivable are customer obligations due under normal trade
terms. We sell our oil and gas production to companies involved in the
transportation and refining of crude oil and natural gas. Our net trade
receivables from our oil and gas production were approximately $1.7 million and
$2.1 million at December 31, 2009 and 2008, respectively. We perform continuing
credit evaluations of our customers’ financial condition, and, although we
generally do not require collateral, letters of credit may be required from our
customers in certain circumstances.
Senior
management reviews accounts receivable to determine if any receivables will
potentially be uncollectible. We include provisions for any accounts receivable
balances that are determined to be uncollectible in the allowance for doubtful
accounts. After all attempts to collect a receivable have failed, the receivable
is written off against the allowance. One of our oil and gas processing and
handling customers filed for Chapter 11 bankruptcy in 2009, and we accrued a
provision for the receivable balances associated with their
account. Based on the information available, we believe the allowance
for doubtful accounts of $181 thousand as of December 31, 2009 is adequate.
However, actual write-offs could exceed the recorded allowance.
49
Comprehensive Income (Loss) –
Comprehensive income (loss) includes changes in stockholders’ equity
during the periods that do not result from transactions with stockholders. Our
total comprehensive income (loss) is as follows (in thousands):
|
Years
Ended December 31,
|
||||||||||||
|
2009
|
2008
|
2007
|
||||||||||
|
Net
(loss) income attributable to HKN
|
$ | (3,050 | ) | $ | (26,746 | ) | $ | 3,229 | ||||
|
Foreign
currency translation adjustment
|
||||||||||||
|
on
investment
|
877 | (6,227 | ) | 639 | ||||||||
|
Reclassification
of holding gain on
|
||||||||||||
|
available
for sale investments into earnings
|
- | - | 207 | |||||||||
|
Unrealized
(loss) gain on investments
|
24 | (2,172 | ) | (8,469 | ) | |||||||
|
Total
comprehensive loss
|
$ | (2,149 | ) | $ | (35,145 | ) | $ | (4,394 | ) | |||
Financial Instruments - We
carry our financial instruments including cash and our common stock investment
in Global Energy Development PLC (“Global”) at their estimated fair values. Our
investment in ordinary shares of Global has been designated as available for
sale, not as a trading security. The associated unrealized gains and losses on
our available for sale investments are recorded to other comprehensive income
until realized and are reclassified into earnings using specific
identification.
Derivative Instruments – We
have not designated any of our derivative instruments as hedges under FASB Accounting Standards
Codification (“ASC”) 815, Derivatives and Hedging. All
gains and losses related to our derivative instruments are recognized in Other
losses (gains). Please see Note 5 – “Derivative Instruments” for additional
information.
Equity Method Investments –
For investments in which we have the ability to exercise significant influence
but do not control, we follow the equity method of
accounting. Initial investments are recorded at cost and adjusted by
the proportionate share of the investee’s earnings and capital
transactions. Our share of investee earnings and our share of their
capital transactions are recorded to our income statement. We
evaluate these investments for other-than-temporary declines in value each
quarter; any impairment found to be other than temporary is recorded through
earnings. Please see Note 4 – “Equity Investment in Spitfire Energy”
for additional information.
Translation of Non-U.S. Currency
Amounts - Assets and liabilities of our equity investment in Spitfire,
whose functional currency is the Canadian dollar, are translated into
U.S. dollars at exchange rates in effect at each balance sheet date.
Revenue and expense items are translated at average exchange rates prevailing
during the periods. Our investment in Global is also subject to foreign currency
exchange rate risk as our ownership of Global’s ordinary shares are denominated
in British sterling pounds. Translation adjustments are included in other
comprehensive income until the investment is sold.
Property and Equipment – We
follow the full cost method of accounting for our investments in oil and natural
gas properties. All costs incurred in the acquisition, exploration and
development of oil and natural gas properties, including unproductive wells, are
capitalized. Included in capitalized costs are general and administrative costs
that are directly related with acquisition, exploration and development
activities. Amortization of unevaluated property costs begins when the
properties become proved or their values become impaired. Under the rules of
full cost method of accounting, the net carrying value of oil and natural gas
properties, reduced by the asset retirement obligation, is limited to the sum of
the present value (10% discount rate) of the estimated future net cash flows
from proved reserves, based on the previous twelve (12) month average prices and
costs, plus the lower of cost or estimated fair market value of unproved
properties adjusted for related income tax effects.
50
Capitalized
costs of proved oil and natural gas properties are depleted on a units of
production method using proved oil and natural gas reserves. Such depletion of
our domestic oil and gas properties was $2.30, $2.87 and $2.72 per equivalent
Mcf produced during 2009, 2008 and 2007, respectively. Costs depleted include
net capitalized costs subject to depletion and estimated future dismantlement,
restoration, and abandonment costs. Estimated future abandonment, dismantlement
and site restoration costs include costs to dismantle, relocate and dispose of
our offshore production platforms, gathering systems, wells and related
structures, considering related salvage values.
Other
property and equipment, which includes computer equipment, computer hardware and
software, furniture and fixtures, leasehold improvements and two automobiles, is
recorded at cost and is generally depreciated on a straight-line basis over the
estimated useful lives of the assets, which range in periods of three to
eighteen years. We have recorded accumulated depreciation related to our other
property and equipment of $536 thousand and $449 thousand at December 31, 2009
and 2008, respectively. Repairs and maintenance are charged to expense as
incurred.
Sales of Oil and Gas Properties -
We account for sales of oil and gas properties as adjustments of
capitalized costs to the full cost pool, with no gain or loss recognized, unless
such adjustments would significantly alter the relationship between capitalized
costs and proved reserves of oil and gas attributable to the full cost pool.
During 2009 and 2008, we did not sell any oil and gas properties. During 2007,
we sold certain of our oil and gas properties at auction for net cash proceeds
of approximately $1.3 million and no gain or loss was recognized from the
sale.
Intangible Assets
– We assess the recoverability of our
intangible assets at least annually or whenever events or changes in
circumstances indicate the carrying amount of the intangible assets may not be
fully recoverable. Recoverability is measured by a comparison of the carrying
value of the intangible asset over its fair value. Any excess of the carrying
value of the intangible asset over its fair value is recognized as an impairment
loss. The estimated fair value is determined based on a discounted cash flow
model. However, at December 31, 2009, our intangible assets consisted of patents
acquired in connection with the investment in BWI. The fair value of these
patents was estimated based on the historical cost of the patents and the final
valuation is pending a third party valuation. Impairment losses are recorded in
other operating expenses. No such impairment was recognized as of December 31,
2009.
Other Assets – At December
31, 2009, other assets included $410 thousand of prepaid drilling
costs.
During
2008, we sold other assets for cash proceeds of approximately $337 thousand and
recognized a gain on the sale of $182 thousand. At December 31, 2008, other
assets included $287 thousand of prepaid drilling costs.
Provision for Asset
Impairments - Assets that are used in our operations and not held for
resale, are carried at cost, less accumulated depreciation and
amortization. We review our long-lived assets, other than our
investment in oil and gas properties, whenever events or changes in
circumstances indicate that the carrying amount of an asset may not be
recoverable. When evidence indicates that operations will not produce sufficient
cash flows to cover the carrying amount of the related asset, and when the
carrying amount of the related asset cannot be realized through sale, a
permanent impairment is recorded and the asset value is written down to fair
value. As a result of the hurricane damages in late 2008, we recorded
an impairment to our Lake Raccourci facilities of $97 thousand at December 31,
2008.
General and Administrative
Expenses – We reflect general and administrative expenses net of operator
overhead charges and other amounts billed to joint interest owners. General and
administrative expenses are net of $295 thousand, $286 thousand and $276
thousand for such amounts during 2009, 2008 and 2007, respectively.
51
Revenue Recognition - We use
the sales method of accounting for natural gas and crude oil revenues. Under
this method, revenues are recognized based on actual volumes of oil and gas sold
to purchasers. The volumes sold may differ from the volumes to which we are
entitled based on our interests in the properties. Approximately 46% of our 2009
oil and gas production was from wells operated by outside parties. With respect
to these properties, we typically receive actual sales information approximately
sixty to ninety days after the date of sale on these properties. With respect to
these non-operated properties, our estimates of production and revenue may
differ from actual production and revenues received. Differences can create
imbalances that are recognized as a liability only when the estimated remaining
reserves will not be sufficient to enable the under produced owner to recoup its
entitled share through production. There are no significant balancing
arrangements or obligations related to our operations.
Income Taxes – We account for income taxes
under the liability method. Deferred tax assets and liabilities are determined
based on differences between financial reporting and tax bases of assets and
liabilities and are measured using the enacted tax rates and laws that will be
in effect when the differences are expected to reverse. We measure and record
income tax contingency accruals in accordance with ASC 740, Income Taxes.
We
recognize liabilities for uncertain income tax positions based on a two-step
process. The first step is to evaluate the tax position for recognition by
determining if the weight of available evidence indicates that it is more likely
than not that the position will be sustained on audit, including resolution of
related appeals or litigation processes, if any. The second step requires us to
estimate and measure the tax benefit as the largest amount that is more than 50%
likely to be realized upon ultimate settlement. It is inherently difficult and
subjective to estimate such amounts, as we must determine the probability of
various possible outcomes. We reevaluate these uncertain tax positions on a
quarterly basis or when new information becomes available to management. These
reevaluations are based on factors including, but not limited to, changes in
facts or circumstances, changes in tax law, successfully settled issues under
audit, expirations due to statutes, and new audit activity. Such a change in
recognition or measurement could result in the recognition of a tax benefit or
an increase to the tax accrual.
We
classify interest related to income tax liabilities as income tax expense, and
if applicable, penalties are recognized as a component of income tax expense.
The income tax liabilities and accrued interest and penalties that are
anticipated to be due within one year of the balance sheet date are presented as
current liabilities in our condensed consolidated balance sheets.
Recent Accounting
Pronouncements – In
December 2007, FASB issued guidance related to Business Combinations under ASC
805, Business
Combinations, and guidance related to the accounting and reporting of
noncontrolling interest under ASC 810-10-65-1, Consolidation. This guidance
significantly changes the accounting for and reporting of business combination
transactions and noncontrolling (minority) interests in consolidated financial
statements. This guidance became effective January 1, 2009. We applied this
guidance to our investment in BWI, formerly referred to as UniPure. Please see
Note 2 – “Investment in BriteWater International, LLC” in the Notes to
Consolidated Financial Statements for additional information.
In March
2008, the FASB issued guidance related to the disclosures about derivative
instruments and hedging activities under FASB ASC 815-10-50, Derivatives and Hedging. This
guidance requires companies to provide enhanced disclosures about (a) how
and why they use derivative instruments, (b) how derivative instruments and
related hedged items are accounted for under applicable guidance, and
(c) how derivative instruments and related hedged items affect a company's
financial position, financial performance, and cash flows. These disclosure
requirements are effective for financial statements issued for fiscal years and
interim periods beginning after November 15, 2008. Our adoption of ASC
815-10-50 on January 1, 2009 did not have a material impact on our consolidated
financial statements. See Note 5 – “Derivative Instruments” in the Notes to
Consolidated Financial Statements for additional information.
52
In June
2008, the FASB issued guidance to evaluate whether an instrument (or embedded
feature) is indexed to an entity’s own stock under ASC 815-40-15, Derivatives and Hedging. The
guidance requires entities to evaluate whether an equity-linked financial
instrument (or embedded feature) is indexed to its own stock in order to
determine if the instrument should be accounted for as a derivative under the
scope of ASC 815-10-15. This guidance is effective for financial statements
issued for fiscal years beginning after December 15, 2008 and interim periods
within those fiscal years. We adopted ASC 815-40-15 beginning January 1,
2009. We applied this guidance to the conversion feature in our
Series M Convertible Preferred Stock (“Series M Preferred”). See Note 5 –
“Derivative Instruments” in the Notes to Consolidated Financial Statements for
additional information.
In
November 2008, the FASB issued guidance related to accounting considerations for
equity method investments under ASC 323-10-35, Investments – Equity Method and
Joint Ventures. This guidance states that an equity method investor shall
account for a share issuance by an investee as if the investor had sold a
proportionate share of its investment. Any gain or loss to the investor
resulting from an investee's share issuance should be recognized in earnings.
Previous to this, changes in equity for both issuances and repurchases were
recognized in equity. This guidance is effective for financial statements issued
for fiscal years beginning after December 15, 2008 and interim periods within
those fiscal years. We adopted ASC 323-10-35 beginning January 1,
2009. We applied this guidance to our equity investment in Spitfire
Energy. See Note 4 – “Equity Investment in Spitfire Energy” in the Notes to
Consolidated Financial Statements for additional information.
In
December 2008, the Securities and Exchange Commission published a Final Rule,
Modernization of the Oil and
Gas Reporting Requirements. The new rule permits the use of new
technologies to determine proved reserves if those technologies have been
demonstrated to lead to reliable conclusions about reserves volumes. The new
requirements also allow companies to disclose their probable and possible
reserves to investors. In addition, the new disclosure requirements require
companies to: (a) report the independence and qualifications of its
reserves preparer or auditor; (b) file reports when a third party is relied
upon to prepare reserves estimates or conducts a reserves audit; and
(c) report oil and gas reserves using an average price based upon the prior
12-month period rather than year-end prices. The use of average prices will
affect future impairment and depletion calculations. In January 2010, the FASB
issued Accounting Standards Update No. 2010-03, Oil and Gas Reserve Estimation and
Disclosure, to align the oil and gas reserve estimation and disclosure
requirement of the SEC Final Rule with the ASC 932. The new
disclosure requirements are effective for annual reports on Form 10-K for
fiscal years ending on or after December 31, 2009. Our adoption of this
Final rule for this annual reported dated December 31, 2009 affected our oil and
gas disclosures but had no material effect on our financial position and results
of operations. See Note 16 - “Oil and Gas Disclosures” in the Notes to
Consolidated Financial Statements.
In May
2009, the FASB issued guidance related to subsequent events under ASC 855-10,
Subsequent Events. This
guidance sets forth the period after the balance sheet date during which
management or a reporting entity should evaluate events or transactions that may
occur for potential recognition or disclosure, the circumstances under which an
entity should recognize events or transactions occurring after the balance sheet
date, and the disclosures that an entity should make about events or
transactions that occurred after the balance sheet date. It requires disclosure
of the date through which an entity has evaluated subsequent events and the
basis for that date, whether that date represents the date the financial
statements were issued or were available to be issued. This guidance is
effective for interim and annual periods ending after June 15, 2009. We adopted
ASC 855-10 beginning June 30, 2009 and have included the required disclosures in
our consolidated financial statements. See Note 18 – “Subsequent Events” in the
Notes to Consolidated Financial Statements for additional
information.
53
In June
2009, the FASB issued an amendment to ASC 810-10, Consolidation. As a result,
in December 2009, the FASB issued ASC 2009-17, Improvements to Financial Reporting
by Enterprises Involved with Variable Interest Entities. This guidance
amends ASC 810-10-15 to replace the quantitative-based risks and rewards
calculation for determining which enterprise has a controlling financial
interest in a VIE with a primarily qualitative approach focused on identifying
which enterprise has the power to direct the activities of a VIE that most
significantly impact the entity’s economic performance. It also requires ongoing
assessments of whether an enterprise is the primary beneficiary of a VIE and
requires additional disclosures about an enterprise’s involvement in VIEs. This
guidance is effective as of the beginning of the reporting entity’s first annual
reporting period that begins after November 15, 2009 and earlier adoption is not
permitted. We are currently evaluating the potential impact, if any, of the
adoption of ASC 2009-17 on our consolidated financial statements.
In June
2009, the FASB issued Accounting Standards Update No. 2009-01 which amends ASC
105, Generally Accepted
Accounting Principles. This guidance states that the ASC will become the
source of authoritative U.S. GAAP recognized by the FASB to be applied by
nongovernmental entities. Once effective, the Codification’s content will carry
the same level of authority. Thus, the U.S. GAAP hierarchy will be modified to
include only two levels of U.S. GAAP: authoritative and non-authoritative. This
is effective for financial statements issued for interim and annual periods
ending after September 15, 2009. We adopted ASC 105 as of September
30, 2009 and thus have incorporated the new Codification citations in place of
the corresponding references to legacy accounting pronouncements.
In August
2009, the FASB issued Accounting Standards Update No. 2009-05, Measuring Liabilities at Fair Value,
which amends ASC 820, Fair Value Measurements and
Disclosures. This Update provides clarification that in circumstances in
which a quoted price in an active market for the identical liability is not
available, a reporting entity is required to measure the fair value using one or
more of the following techniques: a valuation technique that uses the quoted
price of the identical liability or similar liabilities when traded as an asset,
which would be considered a Level 1 input, or another valuation technique that
is consistent with ASC 820. This Update is effective for the first reporting
period (including interim periods) beginning after issuance. Thus, we adopted
this guidance as of September 30, 2009, which did not have a material impact on
our consolidated financial statements.
|
(2)
|
INVESTMENT
IN BRITEWATER INTERNATIONAL, LLC.
|
In June
2009, we acquired an interest in a privately-held company, BWI, with a patented
oilfield emulsion breaking “OHSOL” technology by entering into a Securities
Exchange Agreement (the “Agreement”) pursuant to which we issued an aggregate of
1 million restricted shares of our common stock in exchange for 1,950 units of
BWI, which constitutes 19.5% of BWI’s outstanding membership units. The shares
are deemed to be restricted because they were not issued in a transaction
registered under the Securities Act of 1933 and are therefore not freely
transferable. Pursuant to the terms of our investment, HKN and the other BWI
unitholders have granted to one another put and call options with respect to an
additional 3,050 units of BWI in exchange for an additional issuance of 725
thousand restricted shares of our common stock. These options are
exercisable only if the following conditions are satisfied prior to June
2012:
The Call
Option may be exercised upon the occurrence of any of the following
events:
|
o
|
Execution
by BWI of a material contract regarding any of the BWI patented
technologies
|
|
o
|
BWI
achieves positive Operating Margins during two consecutive
quarters
|
|
o
|
BWI
achieves positive Net Income during two consecutive
quarters
|
|
o
|
BWI
receives a qualified offer to sell substantially all of its assets or to
merge with another entity and BWI declines such
offer
|
|
o
|
A
Change of Control occurs at BWI
|
|
o
|
The
average closing price of HKN common stock is above $3.50 for any
consecutive 30 day trading period
|
|
o
|
Any
BWI transaction that dilutes HKN’s ownership of BWI by more than
10%
|
|
o
|
BWI
consummates a securities offering under the 1933 Act that results in
aggregate net cash proceeds to BWI of at least $10
million
|
54
The Put
Option may be exercised upon the occurrence of any of these events:
|
o
|
BWI
incurs net losses for any four consecutive
quarters
|
|
o
|
A
Change of Control occurs at HKN
|
|
o
|
The
average closing price of HKN common stock is below $1.50 per share or
above $4.00 per share for any consecutive 30 day trading
period
|
In June
2009, we entered into a Loan Agreement with BWI under which we may make secured
loans to BWI up to a maximum amount of $2.5 million. These loans are
secured by all assets of BWI and are due and payable on or before June 30, 2012.
As of December 31, 2009, we have made approximately $1 million in aggregate
secured loans to BWI. The Loan Agreement earns interest at 8.0% per annum.
Accrued and unpaid interest on the outstanding principal amount of the Loan
shall be due and payable on the last day of each calendar quarter. BWI shall
repay the entire unpaid principal amount of the loan, together with all accrued
and unpaid interest, on or before June 30, 2012.
The
assets, liabilities and non-controlling interest associated with our investment
were consolidated into our financial statements per ASC 810-10, Consolidation, using the
acquisition method of accounting in accordance with ASC 805, Business
Combinations. See Note 1 – “Summary of Significant Accounting
Policies” for further explanation for consolidating our investment in
BWI. Our acquisition-related costs of approximately $87 thousand are
included in general and administrative expenses within our consolidated
statement of operations for the year ended December 31, 2009.
Valuation of Investment in BWI
–The fair value of the total consideration paid for our investment which
includes 1.0 million restricted shares of common stock issued along with the
put/call option to issue 725 thousand restricted shares of our common stock was
measured using a third-party Fair Market Value Restricted Stock Study, which
valued the aggregate restricted shares at the investment date at $2.01 per
share. Under the ASC 820, Fair
Value Measurements and Disclosures, we consider this valuation method for
our restricted stock to be a Level 2 classification. See Note 6 – “Fair Value
Measurements” for further discussion of Level 2 valuation definitions. This
valuation considered several factors, including the closing market price of our
common stock at the acquisition date of $2.55 per share and the diminished
marketability caused by the restrictive nature of the shares issued. We applied
the discounted value of $2.01 per share to the total of the 1.0 million
restricted shares transferred and the potential 725 thousand restricted shares
to be issued upon the exercise of the put or call options in order to calculate
the fair value of our interest in the net assets acquired.
55
The
following table is the preliminary calculation of the consideration paid for our
initial 19.5% ownership in the BWI investment, the allocation to assets and
liabilities assumed and the fair value of the noncontrolling interest in BWI as
of the investment date. This purchase price allocation as of December 31, 2009
is subject to adjustment, pending the final valuation of the fair value of
certain assets acquired and liabilities assumed.
|
(in
thousands, except share amounts)
|
||||
|
Consideration
issued to BWI:
|
||||
|
1.0
million shares of restricted common stock
|
$ | 1,352 | ||
|
Fair
value of total consideration transferred
|
$ | 1,352 | ||
|
Recognized
amounts of identifiable assets aquired and liabilities assumed, at
estimated fair values
|
||||
|
Cash
and cash equivalents
|
$ | 7 | ||
|
Equipment
|
6,900 | |||
|
Intangible
assets
|
1,946 | |||
|
Accounts
payable
|
(380 | ) | ||
|
Accrued
liabilities
|
(10 | ) | ||
|
Deferred
income taxes
|
(729 | ) | ||
|
Contingent
liability
|
(800 | ) | ||
|
Total
identifiable net assets
|
$ | 6,934 | ||
|
Noncontrolling
interest (80.5 %)
|
(5,582 | ) | ||
|
Fair
value of our interest in net assets aquired (19.5 %)
|
$ | 1,352 | ||
The
intangible assets consist of patents related to the OHSOL process. The fair
value of the acquired patents of $1.9 million was estimated based on the
historical cost of the patents; the final valuation is pending a third party
valuation in 2010. Unless renewed, the patents will expire during the
next 6-12 years. The fair value of the OHSOL plant equipment of $6.9 million was
estimated as the replacement cost of the equipment. The valuation of the
equipment is also pending a third party valuation to be completed in
2010. We consider these valuations for our patents and equipment to
be Level 3 classifications. See Note 6 – “Fair Value Measurements” for further
discussion of Level 3 valuation definitions. The contingent liability of $800
thousand may be payable to a vendor upon the conclusion of certain testing
events of the OHSOL plant equipment. This contingent liability is included in
other accrued liabilities within the consolidated balance sheet.
A
deferred tax liability in the amount of $729 thousand was calculated by applying
the domestic statutory tax rates to the difference between the book purchase
price and the estimated tax basis. Information and research regarding
the tax basis of the assets at the date of the acquisition is not complete at
this time and the deferred tax may be adjusted as more information becomes
available.
BWI Results of Operations –
For the year ended December 31, 2009, we recognized losses of $387
thousand related to our investment in BWI in our consolidated statement of
operations, of which $295 thousand was related to noncontrolling interests. We
do not consider BWI’s pre-acquisition activity to significantly impact our
proforma results of operations.
|
(3)
|
OTHER
INVESTMENTS
|
Marketable Securities – We
held no marketable securities at December 31, 2009. Our marketable securities at
December 31, 2008 consisted of $9.5 million in Treasury bills with original
maturities of six months. These investments were recorded at their fair value at
the balance sheet date. There were no significant gains or losses on these
securities for any period covered by this report.
56
Investment in Global – As we
do not have the ability to obtain Global's US GAAP adjusted financial
information, we account for our investment in Global's shares as an
available-for-sale cost method invesment. Investments in equity securities that
do not qualify as trading investments and are not likely to be sold within a
year are classified as non-current available-for-sale
investments. Our non-current available-for-sale investment consists
of our ownership of approximately 34% of Global’s outstanding ordinary
shares. At December 31, 2009 and December 31, 2008, our investment in
Global was equal to the market value of our 11.9 million shares of Global’s
ordinary shares as follows (in thousands, except share amouonts):
|
December
31, 2009
|
December
31, 2008
|
|||||||
|
Shares
of Global Stock held by HKN
|
11,893,463 | 11,893,463 | ||||||
|
Closing
price of Global Stock
|
£ | 0.66 | £ | 0.68 | ||||
|
Foreign
Currency Exchange Rate
|
1.6221 | 1.4619 | ||||||
|
Market
Value of Investment in Global
|
$ | 12,637 | $ | 11,824 | ||||
The
foreign currency translation adjustment of approximately $789 thousand and the
unrealized gain on investment of $24 thousand for these changes in market value
between the two periods were recorded to other comprehensive income in
stockholders’ equity during the year ending December 31, 2009.
|
(4)
|
EQUITY
INVESTMENT IN SPITFIRE ENERGY
|
At
December 31, 2009 and 2008, we held an investment in Spitfire through the
ownership of approximately 25% and 27%, respectively, of Spitfire’s currently
outstanding common shares. Spitfire is an independent public company (TSX-V;
SEL) engaged in the exploration, development and production of crude oil,
natural gas and natural gas liquids in Western Canada.
At December 31, 2009, we owned 9.9
million common shares of Spitfire and 1.3 million warrants to acquire common
shares of Spitfire. As a result of our ownership of Spitfire’s
outstanding common shares, we are deemed to have the ability to exert
significant influence over Spitfire’s operating and financial policies.
Accordingly, we reflect our investment in Spitfire as an equity method
investment. Due to timing differences in our filing requirements and the lack of
availability of financial information for the current quarterly period, we
record our share of Spitfire’s financial activity on a three-month
lag.
During the 2009, we sold approximately
1.2 million shares of Spitfire common shares for $212 thousand using the average
cost method. We recognized a foreign currency gain of $6 thousand in other
comprehensive income and a realized gain on sale of assets of $30 thousand which
is included in other income in the consolidated statement of
operations.
During 2008, we purchased shares of
Spitfire common stock in the market by acquiring 236 thousand shares at a total
cost of $77 thousand. We reflected our additional purchases of shares in
Spitfire as a step acquisition of an equity method investment. No goodwill was
recorded as a result of these purchases. Also during 2008, Spitfire’s share
price declined significantly and we recorded an impairment charge of $4.6
million to write down the carrying value of our investment to its market value
of $1.8 million as of December 31, 2008. In 2009, there were no other
impairments to this investment. However, further declines in Spitfire’s share
price and the Canadian stock markets in the future may require additional
impairment of our investment in Spitfire if these declines are deemed to be
other-than-temporary.
In accordance with the equity method of
accounting, our investment was initially recorded at cost and adjusted to
reflect our share of changes in Spitfire’s capital. It has been
subsequently adjusted to recognize our share of their earnings as they occur,
rather than as dividends or other distributions are received. Our
share of their earnings also includes any other-than-temporary declines in fair
value recognized during the period. On January 1, 2009, we adopted guidance
under ASC 323-10-35,
Investments- Equity Method and Joint Ventures. As a result, changes in
our proportionate share of the underlying equity of Spitfire which result from
their issuance of additional equity securities are also recognized in our share
of their earnings in our results of operations.
57
Our investment in Spitfire is reported
in our balance sheet at its adjusted carrying value as a non-current asset, and
our earnings are reported net of tax as a single line on our income
statement. At December 31, 2009 and 2008, our carrying value of this
investment was $1.6 million and $1.8 million, respectively.
|
(5)
|
DERIVATIVE
INSTRUMENTS
|
Trading Derivatives- As part
of our treasury activities during 2008 and 2007, we engaged in the active
management of investments and derivative instruments in energy industry
securities traded on domestic securities exchanges. We used these derivatives as
a tool to enhance investment returns or to minimize the risk in our energy
industry portfolio. These derivatives were not designated as hedges under ASC
815, and we recognized gains and losses related to these positions in current
earnings.
We currently do not hold any open
trading derivative positions as of December 31, 2009. During 2008, we closed all
of our open trading derivative positions. For the year ended December 31, 2008
we recognized realized losses of $2.7 million related to these derivatives
within trading revenues in our consolidated statement of operations. For the
year ended December 31, 2007 we included unrealized gains of $18 thousand and
realized gains of $935 thousand related to these derivatives within trading
revenues in our consolidated statement of operations.
Commodity Derivatives - We
enter into certain commodity derivative instruments which are effective in
mitigating commodity price risk associated with a portion of our future monthly
natural gas and crude oil production and related cash flows. Our oil and gas
operating revenues and cash flows are impacted by changes in commodity product
prices, which are volatile and cannot be accurately predicted. Our objective for
holding these commodity derivatives is to protect the operating revenues and
cash flows related to a portion of our future crude oil sales from the risk of
significant declines in commodity prices. We have not designated any of our
commodity derivatives as hedges under ASC 815.
In
December 2009, we purchased crude oil commodity floor contracts for $30
thousand. Our
purchased commodity derivatives are recorded at their estimated fair values
within other current assets in the accompanying consolidated balance sheets.
Estimated fair values of our purchased commodity derivatives were as follows (in
thousands):
|
As
of December 31,
|
||||||||||||||||||||||
|
Commodity
|
Type
|
Volume/Day
|
Duration
|
Price
|
2009
|
2008
|
2007
|
|||||||||||||||
|
Crude
Oil
|
Floor
|
9,000
bbls
|
Feb
08 - Mar 08
|
$ | 80.00 | $ | - | $ | - | $ | 3 | |||||||||||
|
Crude
Oil
|
Floor
|
5,000
bbls
|
Jan
10 - May 10
|
$ | 60.00 | 15 | - | - | ||||||||||||||
| $ | 15 | $ | - | $ | 3 | |||||||||||||||||
We have recorded net losses related to
crude oil and natural gas derivative transactions for the years ended December
31, 2009, 2008 and 2007 of $16 thousand, $1.2 million and $182 thousand. These
amounts are included in other losses for 2009 and trading losses in 2008 and
2007 in our consolidated statement of operations.
As of December 31, 2009, neither we nor
any of our consolidated companies hold any derivative instruments which are
designated as fair value hedges, cash flow hedges or foreign currency hedges.
Settlements of our oil and gas commodity derivatives are based on the difference
between fixed option prices and the New York Mercantile Exchange closing prices
for each month during the life of the contracts. We monitor our crude oil and
natural gas production prices compared to New York Mercantile Exchange prices to
assure our commodity derivatives are effective in mitigating our commodity price
risk.
58
Foreign Currency Derivative
Contracts - During 2008, we entered into certain foreign currency
derivative instruments to mitigate the foreign currency price risk associated
with our investment in Global’s ordinary shares. Our investment in Global is
impacted by changes in the British Sterling Pound exchange rate to U.S. dollars.
We did not designate any of our foreign currency derivatives as hedges under ASC
815. During 2008, we closed all of our open foreign currency derivatives and we
realized gains of $97 thousand in trading revenues in our consolidated statement
of operations. We did not hold any foreign currency derivative contracts in
2009.
We had no trading revenues for the year
ended December 31, 2009. For years ended December 31, 2008 and 2007, we have
included the following unrealized and realized gains and losses related to our
trading derivatives within trading revenues in our consolidated statement of
operations (in thousands):
|
For
the Year Ended
|
||||||||
|
Type
of Instrument
|
December
31, 2008
|
December
31, 2007
|
||||||
|
Commidity
|
$ | 39 | $ | (183 | ) | |||
|
Equity
|
(3,251 | ) | 863 | |||||
|
Crude
Futures
|
(1,229 | ) | - | |||||
|
Foreign
Currency
|
97 | - | ||||||
|
Total
trading revenue (loss)
|
$ | (4,344 | ) | $ | 680 | |||
Spitfire Warrants - In
association with our investment in Spitfire, we also hold 1.3 million warrants
to acquire common shares of Spitfire. We account for these warrants
as derivatives in accordance with ASC 815. The expiration date of the warrants
is August 1, 2010. At December
31, 2008, we reflected these warrants at their estimated fair value of $16
thousand in our balance sheet and included losses of $96 thousand within
interest expense and other losses in our consolidated statement of operations
for the year ended December 31, 2008. We did not assign any value to
these warrants at December 31, 2009. For the year ended December 31, 2009, we
have included unrealized losses of $16 thousand within other losses in our
consolidated statement of operations. These amounts are related
primarily to the change in the underlying price of Spitfire’s common
shares.
Series M Preferred Conversion
Feature – Prior to its redemption during 2009, our Series M Convertible
Preferred Stock (“Series M Preferred”) was convertible at the holders’ option
into common stock at a conversion price of $11.85 per share. This conversion
price was subject to continued adjustment in the event we subsequently issued
shares of our common stock at a price lower than this conversion price or in
response to certain transactions that are in effect equity restructuring
transactions. Under ASC 815-40-15, this anti-dilution provision allowing for the
conversion price to be adjusted represented an embedded derivative that required
it to be classified as a liability. We would only incur the liability, equal to
the current stock price times the number of additional shares that would be
required to fulfill the conversion, if we were to issue common stock at a price
less than the Series M Preferred conversion price. At January 1, 2009, we
recorded a Series M Preferred conversion liability with an initial estimated
fair value of $5 thousand as a cumulative effect adjustment. As further
described in Note 11 – Stockholders’ Equity”, we fully redeemed all of the
outstanding Series M Preferred in 2009, therefore there is no Series M Preferred
conversion liability at December 31, 2009. In 2009, we have included
unrealized gains of $5 thousand within other gains in our consolidated statement
of operations related primarily to extinguishment of this
liability.
59
We did not hold any derivative
instruments designated as hedging instruments under ASC 815 as of December 31,
2009. A summary of the fair values of our derivative instruments not designated
as hedging instruments under ASC 815 as of December 31, 2009 and 2008 are as
follows (in thousands):
|
Fair
Value
|
||||||||||
|
Asset
Derivatives
|
Balance
Sheet Location
|
Year
Ended
December
31, 2009
|
Year
Ended
December
31, 2008
|
|||||||
|
Spitfire
warrants
|
Other
assets
|
$ | - | $ | 16 | |||||
|
Commodity
contracts
|
Other
assets
|
15 | - | |||||||
|
Total
derivatives
|
$ | 15 | $ | 16 | ||||||
Any gains or losses related to our
derivative instruments are included in the consolidated statement of operations
for the years ended December 31, 2009, 2008 and 2007 as follows (in
thousands):
|
Amount
of Loss or (Gain) Recognized in Income on Derivatives
|
||||||||||||||
|
Derivatives
|
Location
of Loss or
(Gain)
Recognized in
Income
on Derivatives
|
Year
Ended December 31, 2009
|
Year
Ended December 31, 2008
|
Year
Ended December 31, 2007
|
||||||||||
|
Spitfire
warrants
|
Other
losses
|
$ | 16 | $ | 96 | $ | 353 | |||||||
|
Commodity
contracts
|
Other
losses
|
16 | - | - | ||||||||||
|
Series
M Preferred conversion feature
|
Other
income
|
(5 | ) | - | - | |||||||||
| $ | 27 | $ | 96 | $ | 353 | |||||||||
|
(6)
|
FAIR
VALUE MEASUREMENTS
|
Beginning January 1, 2009, we applied
ASC 820, Fair Value
Measurements and Disclosures, to nonrecurring, nonfinancial assets and
liabilities, which were previously deferred by the FASB. We applied
this guidance to our financial assets and liabilities beginning January 1, 2009
with no material impact on our consolidated statement of operations or financial
condition.
ASC 820 defines fair value as the price
that would be received to sell an asset or paid to transfer a liability in an
orderly transaction between market participants at the measurement date. ASC 820
also establishes a framework for measuring fair value and a valuation hierarchy
based upon the transparency of inputs used in the valuation of an asset or
liability. Classification within the hierarchy is based upon the
lowest level of input that is significant to the fair value
measurement. The valuation hierarchy contains three
levels:
|
·
|
Level
1 – Valuation inputs are unadjusted quoted market prices for identical
assets or liabilities in active
markets.
|
|
·
|
Level
2 – Valuation inputs are quoted prices for identical assets or liabilities
in markets that are not active, quoted market prices for similar assets
and liabilities in active markets and other observable inputs directly or
indirectly related to the asset or liability being
measured.
|
|
·
|
Level
3 – Valuation inputs are unobservable and significant to the fair value
measurement.
|
60
We used the following fair value
measurements for certain of our assets and liabilities during the year ended
December 31, 2009:
Level 1
Classification:
Investment in Global –
Global’s ordinary shares are publicly traded on the Alternative Investment
Market (“AIM”) of the London Stock Exchange with quoted prices in active
markets. Accordingly, the fair value measurements of these securities have been
classified as Level 1.
Commodity contracts –Our
purchased commodity derivatives have quoted prices in active markets.
Accordingly, the fair value measurements of these securities have been
classified as Level 1.
Level 2
Classification:
Valuation of Our Restricted Stock
Utilized as Consideration for our Investment in BWI – Our BWI purchase
price allocation utilized fair values under ASC 805, Business Combinations, on a
nonrecurring basis. Please see Note 2 – “Investment in BriteWater
International, LLC.” for further discussion on the valuation of this
investment.
Level 3
Classification:
Asset Retirement Obligations
– Our asset retirement obligation is classified as a Level 3 liability. The
significant unobservable inputs to this fair value measurement include estimates
of plugging, abandonment and remediation costs, inflation rate and the expected
remaining life of wells. The inputs are calculated utilizing historical data,
current estimated costs and expectations for the future costs and production of
the wells. See Note 9 – “Asset Retirement Obligations” for additional
information of our asset retirement obligation as of December 31,
2009.
Valuation of BWI Equipment and
Patents – The fair value of the acquired patents of $1.9 million is
non-recurring and was estimated based on the historical cost of the patents; the
final valuation is pending a third party valuation in 2010. Unless
renewed, the patents will expire during the next 6-12 years. The fair value of
the OHSOL plant equipment of $6.9 million is also non-recurring and was
estimated as the replacement cost of the equipment. The valuation of the
equipment is also pending a third party valuation to be completed in 2010. We
consider these valuations for the OHSOL patents and equipment to be Level 3
classifications.
The following table presents recurring
financial assets and liabilities which are carried at fair value as of December
31, 2009 (in thousands):
|
Level
1
|
Level
2
|
Level
3
|
||||||||||
|
Investment
in Global (cost method)
|
$ | 12,637 | $ | - | $ | - | ||||||
|
Commodity
contracts
|
15 | - | - | |||||||||
|
Total
assets at fair value
|
$ | 12,652 | $ | - | $ | - | ||||||
|
Level
1
|
Level
2
|
Level
3
|
||||||||||
|
Asset
retirement obligation
|
$ | - | $ | - | $ | 6,193 | ||||||
|
Total
liabilities at fair value
|
$ | - | $ | - | $ | 6,193 | ||||||
61
The table above does not include our
equity investment in Spitfire because we are deemed to have a significant
influence and, as such, the investment is not accounted for at fair value under
ASC 820, Fair Value
Measurements and Disclosures, at December 31, 2009.
The reconciliation of the fair value
for our Level 3 assets and liabilities (the Spitfire warrants and Series M
Preferred conversion feature), including net purchases and sales, realized gains
and change in unrealized gains, is set out below (in thousands):
|
For
the Year Ended December 31, 2009
|
||||||||
|
Level
3 Asset
|
Level
3 Liability
|
|||||||
|
Spitfire
Warrants
|
Series
M Preferred Conversion Feature
|
|||||||
|
Beginning
balance
|
$ | 16 | $ | 5 | ||||
|
Total
realized and unrealized losses included in earnings
|
(16 | ) | (5 | ) | ||||
|
Net
purchases and sales
|
- | - | ||||||
|
Ending
balance
|
$ | - | $ | - | ||||
|
(7)
|
OIL
AND GAS PROPERTIES
|
Under
full cost method of accounting, we assess realizability of unevaluated
properties on at least an annual basis or when there has been an indication that
an impairment in value may have occurred, such as for a relinquishment of
contract acreage. Impairment of unevaluated prospects is assessed based on
management’s intention with regard to future exploration and development of
individually significant properties and the ability to obtain funds to finance
such exploration and development. At December 31, 2009, we carried total costs
of $5.1 million related to the exploration and development of our coalbed
methane prospects within the Indiana Posey area in our unevaluated oil and gas
properties. We anticipate our unevaluated property costs to remain as
unevaluated for no longer than three years.
Under
full cost accounting rules for each cost center, capitalized costs of evaluated
oil and gas properties, including asset retirement costs, less accumulated
amortization and related deferred income taxes, may not exceed an amount (the
“cost ceiling”) equal to the sum of (a) the present value of future net cash
flows from estimated production of proved oil and gas reserves, based on current
economic and operating conditions, discounted at 10%, plus (b) the cost of
properties not being amortized, plus (c) the lower of cost or estimated fair
value of any unproved properties included in the costs being amortized, less (d)
any income tax effects related to differences between the book and tax basis of
the properties involved. If capitalized costs exceed this limit, the excess is
charged to earnings.
For
purposes of the ceiling test, we remove the discounted present value included in
our future development costs on our reserve report for which we have already
booked an obligation under ASC 410-20, Asset Retirement Obligations.
For purposes of our depletion calculation, we include in future development
costs any estimated plugging and abandonment costs, net of estimated salvage
values, for proved undeveloped wells. For purposes of both of these
calculations, we do not include plugging and abandonment costs in our future
development costs on developed properties for which we have booked an obligation
under ASC 410-20.
As a
result of low oil and gas prices in the fourth quarter of 2008, our capitalized
costs of evaluated oil and gas properties exceeded the cost ceiling, and we
recorded an impairment of $19.9 million to our oil and gas properties for the
year ended December 31, 2008. No such impairment was recorded for the year ended
December 31, 2009.
62
|
(8)
|
UNEVALUATED
PROPERTIES - COALBED METHANE
PROJECT
|
Indiana Posey - In 2005 we
entered into an exploration and development agreement (the “Indiana Posey
Agreement”) with Indiana Posey L.P., a Texas limited partnership, for the joint
exploration and development of coalbed methane within the Posey Prospect area
consisting of approximately 400,000 acres in Posey, Gibson and Vanderburgh
counties of Indiana.
The
Indiana Posey Agreement provides for the project to be conducted in three
separate phases. Our potential obligations under the Indiana Posey Agreement, if
we elect to all phases of the project, include funding 100% of the initial $7.5
million in costs to carry out the joint exploration and development of the
project in return for a non-operating 65% interest in the Posey Prospect Area.
The Indiana Posey Agreement also provides that we are to receive an 82.5% net
revenue interest. At December 31, 2009, we carried total costs of $5.1 million
related to the exploration and development of our coalbed methane prospects
within the Indiana Posey area in our unevaluated oil and gas
properties.
Ohio Cumberland - In 2005, we
entered into an exploration and development agreement (the “Ohio Cumberland
Agreement”) with Ohio Cumberland, L.P., a Texas limited partnership, for the
joint exploration and development of coalbed methane within the Cumberland
Prospect Area consisting of approximately 400,000 acres in Guernsey, Noble,
Muskingum, Washington and Morgan Counties of Ohio.
The Ohio
Cumberland Agreement had an effective date of April 1, 2005 and provides for the
project to be conducted in three separate phases. Our potential obligations
under the Ohio Cumberland Agreement, if we elect to all phases of the project,
include funding 100% of the initial $7.5 million in costs to carry out the joint
exploration and development of the project in return for a non-operating 65%
interest in the Cumberland Prospect Area. The Ohio Cumberland Agreement also
provides that we are to receive a 82.5% net revenue interest. This Phase II
project has been temporarily suspended until such time as oil and gas commodity
pricing increases. All costs associated with the Ohio Cumberland Agreement,
approximately $1.6 million, were reclassed to evaluated oil and gas properties
in 2008. At this time, we are focusing our efforts on the Indiana Posey
Contract.
With the
decline in oil and gas commodity prices, resource plays, such as coalbed methane
prospects, can become uneconomical in low price environments particularly since
all well, facility and flowline costs as well as operating costs
during the dewatering/desorption process must be incurred before revenues can be
generated. Our discretionary capital expenditures, including costs related to
our coalbed methane prospects, may be curtailed at our discretion in the future.
Such expenditure curtailments could result in us losing certain prospect acreage
or reducing our interest in future development projects.
|
(9)
|
ASSET
RETIREMENT OBLIGATIONS
|
We recognize the present value of asset
retirement obligations beginning in the period in which they are incurred if a
reasonable estimate of a fair value can be made. The associated asset retirement
costs are capitalized as part of the carrying amount of the long-lived asset. A
summary of our assets with required asset retirement obligations as of December
31, 2009 is as follows (in thousands):
|
Asset
Retirement
|
|||||
|
Asset
Category
|
Obligation
Liability
|
Estimated
Life
|
|||
|
Oil
and gas producing properties
|
$ | 4,648 |
1-18
years
|
||
|
Facilities
and other property
|
1,545 |
3-25
years
|
|||
| $ | 6,193 | ||||
63
The following table describes all
changes to our asset retirement obligation liability during the years ended
December 31, 2009 and 2008 (in thousands):
|
2009
|
2008
|
|||||||
|
Asset
retirement obligation at beginning of year
|
$ | 5,472 | $ | 5,187 | ||||
|
Additions
during the year
|
60 | 45 | ||||||
|
Disposals
during the year
|
(9 | ) | (123 | ) | ||||
|
Revisions
of estimates
|
278 | - | ||||||
|
Accretion
expense
|
392 | 363 | ||||||
|
Asset
retirement obligation at end of year
|
$ | 6,193 | $ | 5,472 | ||||
During 2009, we revised our asset
retirement obligation estimates mainly due to increases in the expected costs
related to our wells and facilities. We had no revisions during
2008.
|
(10)
|
INCOME
TAXES
|
The total
provision for income taxes consists of the following:
|
Year
Ended December 31,
|
||||||||||||
|
2009
|
2008
|
2007
|
||||||||||
|
(in
thousands)
|
||||||||||||
|
Current
Taxes:
|
||||||||||||
|
Federal
|
$ | - | $ | 260 | $ | - | ||||||
|
State
|
(40 | ) | 15 | 10 | ||||||||
|
Foreign
|
- | - | - | |||||||||
|
Deferred:
|
||||||||||||
|
Federal
|
- | - | - | |||||||||
|
State
|
- | - | 20 | |||||||||
|
Total
|
$ | (40 | ) | $ | 275 | $ | 30 | |||||
The
following is a reconciliation of the reported amount of income tax expense
(benefit) for the years ended December 31, 2009, 2008 and 2007 to the amount of
income tax expense that would result from applying domestic federal statutory
tax rates to pretax income:
|
Year
Ended December 31,
|
||||||||||||
|
2009
|
2008
|
2007
|
||||||||||
|
(in
thousands)
|
||||||||||||
|
Statutory
tax expense (benefit)
|
$ | (1,037 | ) | $ | (9,000 | ) | $ | 1,108 | ||||
|
Increase
(decrease) in valuation allowances related to:
|
||||||||||||
|
Capital
losses
|
- | 1,763 | - | |||||||||
|
Net
operating losses
|
1,037 | 7,229 | (1,111 | ) | ||||||||
|
Alternative
minimum tax
|
- | 35 | - | |||||||||
|
Other
|
- | 8 | 3 | |||||||||
|
FIN
48 accrual
|
- | 225 | - | |||||||||
|
State
Tax
|
(40 | ) | 15 | 30 | ||||||||
|
Total
tax expense (benefit)
|
$ | (40 | ) | $ | 275 | $ | 30 | |||||
64
At December 31, 2009, we had available
for U.S. federal income tax reporting purposes, a net operating loss (NOL)
carryforward for regular tax purposes of approximately $96 million which expires
in varying amounts during the tax years 2010 through 2029, an alternative
minimum tax NOL carryforward of approximately $80 million which expires in
varying amounts during the tax years 2010 through 2029, and a statutory
depletion carryforward of approximately $9 million which can be carried forward
indefinitely to offset our future taxable income, subject to certain limitations
imposed by the Internal Revenue Code. Additionally, at December 31,
2009, we have a capital loss carryforward of approximately $91 million which
will expire in 2010 and 2014. Current federal income tax law allows corporations
to deduct capital losses only if they offset capital gains. In 2003, we
underwent a change in ownership, within the meaning of Internal Revenue Code
Section 382 that will significantly restrict our ability to utilize our domestic
NOLs and capital losses.
In June
2009, we acquired a 19.5% interest in BWI and as a result, we consoldiated BWI
in our consolidated financial statements per ASC 805, Business
Combinations. Pursuant to our investment in BWI, a deferred
tax liability in the amount of $729 thousand was calculated by applying the
domestic statutory tax rates to the difference between the book purchase price
and the estimated tax basis. Information and research regarding the
tax basis of the assets at the date of the acquisition is not complete at this
time and the deferred tax may be adjusted as more information becomes
available.
The components of our income taxes were
as follows for the years ended December 31, 2009 and 2008:
|
2009
|
2008
|
|||||||
|
(in
thousands)
|
||||||||
|
Deferred
tax assets:
|
||||||||
|
Net
operating losses (NOL) carryover
|
$ | 32,633 | $ | 32,318 | ||||
|
Depletion
carryover
|
3,128 | 3,094 | ||||||
|
Deferred
book liabilities
|
2,106 | 1,860 | ||||||
|
Book
vs. tax basis in investments
|
23,855 | 24,235 | ||||||
|
Capital
loss carryover
|
30,940 | 35,835 | ||||||
|
Property
and equipment
|
- | 1,272 | ||||||
|
Total
gross deferred tax assets
|
92,662 | 98,614 | ||||||
|
Deferred
tax liabilities:
|
||||||||
|
Property
and equipment
|
(1,049 | ) | - | |||||
|
Net
deferred tax assets
|
91,613 | 98,614 | ||||||
|
Less
valuation allowances
|
(92,361 | ) | (98,634 | ) | ||||
|
Deferred
tax liabilities, net of valuation allowance
|
$ | (748 | ) | $ | (20 | ) | ||
Our
policy is to recognize potential interest and penalties accrued related to
unrecognized tax benefits within income tax expense. The tax years 2005-2008
remain open to examination for federal income tax purposes and by the other
major taxing jurisdictions to which we are subject. The tax years
2005-2009 also remain open for examination purposes for the Texas Franchise
tax.
In May
2006, the Governor of Texas signed into law a Texas margin tax (H.B. No. 3)
which restructured the state business tax by replacing the taxable capital and
earned surplus components of the current franchise tax with a new “taxable
margin” component. Specifically, we became subject to an entity level
tax on the portion of our total revenue (as that term is defined in the
legislation) that is generated in Texas beginning in our tax year ending
December 31, 2007. Specifically, the Texas margin tax is imposed at a maximum
effective rate of 0.7% of our total revenue that is apportioned to
Texas. We recorded a deferred tax liability in 2007 related
to the Texas Margin Tax of $20 thousand. There have been no changes to the
Texas Margin Tax in 2008 or 2009.
65
On August
6, 2008, we received a Revenue Agent’s Report in which the Internal Revenue
Service (“IRS”) proposed an adjustment to our federal tax liability for the
calendar year 2005. The proposed adjustment relates to the
calculation of the adjusted current earnings (“ACE”) component of the
alternative minimum tax and asserts that the Company recognized gain for ACE
purposes on the sale of the Global PLC stock in 2005. In its proposed
adjustment, the IRS alleges that the Company owes approximately $3.6 million in
tax for the year ended December 31, 2005. Penalties and interest calculated
through December 31, 2009 in the amount of $2.1 million could also be assessed.
In response to the proposed adjustment and corresponding tax assessment, the
Company filed a written protest and request for conference on September 5, 2008
to address the proposed adjustment with the Appeals division of the
IRS. On October 29, 2008, we received an acknowledgement of receipt
of our written protest and request for conference from the IRS Appeals Office.
In April 2009, we filed our supplement to the written protest filed with the
IRS. Based on correspondence received to date, the IRS Appeals Office is still
considering the matter.
ASC 740,
Income Taxes,
prescribes a recognition threshold of more-likely-than-not to be sustained upon
examination. ASC 740 also provides guidance on de-recognition, classification,
interest and penalties, accounting in interim periods, disclosures and
transition. Based on the requirements of ASC 740, we have recorded an
income tax contingency, including interest and penalties, as of December 31,
2009, of $225 thousand in our consolidated financial statements based, in part,
on a preliminary indication of a probability-weighted fair value assessment of
the Global stock. We intend to vigorously defend the proposed adjustment and
strongly believe that the Company has meritorious defenses.
The
following table illustrates changes in our gross unrecognized tax benefits (in
thousands) for the years ending December 31, 2009 and 2008. We had no
unrecognized tax benefits during 2007.
|
2009
|
2008
|
|||||||
|
Unrecognized
tax benefits at January 1,
|
$ | 225 | $ | - | ||||
|
Increases
for positions taken in current year
|
- | 225 | ||||||
|
Decreases
for positions taken in current year
|
- | - | ||||||
|
Decreases
for settlements with taxing authorities
|
- | - | ||||||
|
Decreases
for lapses in the applicable statute of limitations
|
- | - | ||||||
|
Unrecognized
tax benefits at December 31,
|
$ | 225 | $ | 225 | ||||
|
(11)
|
STOCKHOLDERS’
EQUITY
|
Common Stock – We have
authorized 24 million shares of $.01 par common stock. At December 31,
2009 and 2008, we had 9,553,847 and 9,268,253 shares, respectively, issued and
outstanding. Dividends may not be paid to holders of our common stock prior to
the satisfaction of all dividend obligations related to our Series G1 and Series
G2 Preferred stock.
Treasury Stock – In 2005, our
Board of Directors authorized a stock repurchase program allowing us to buy back
a total of 1.2 million shares of our common stock (adjusted for the 2007 reverse
stock split). During 2008, we repurchased 507 thousand shares of our
common stock in the open market at a cost of approximately $4.4 million pursuant
to our repurchase program. In 2008, we cancelled 500 thousand of these
shares. At December 31, 2008, we held 6,869 shares of treasury stock,
and approximately 237 thousand shares remained available for repurchase under
our repurchase program.
66
In
January 2009, our Board of Directors authorized an amendment to the existing
repurchase plan allowing us to repurchase an additional 1.0 million shares of
our common stock. During 2009, we repurchased approximately 708
thousand shares of our common stock. This included a repurchase of 500 thousand
shares of our common stock for $1.3 million from a shareholder in a privately
negotiated transaction pursuant to our repurchase program. During the year ended
December 31, 2009, we retired approximately 715 thousand treasury shares. As of
December 31, 2009 approximately 530 thousand shares remained available for
repurchase under our repurchase program.
Series G1 Convertible Preferred
Stock - Our Series G1 Convertible Preferred Stock (the “Series G1
Preferred”), which was issued in 2000, has a liquidation value of $100 per
share, is non-voting, and is convertible at the holder’s option into our common
stock at a conversion price of $280.00 per share. At December 31,
2009 and 2008, there were 1,000 shares and 1,600 shares, respectively, of Series
G1 Preferred issued and outstanding.
The
Series G1 Preferred holders shall be entitled to receive dividends at an annual
rate equal to $8.00 per share when, as and if declared by our Board of
Directors. All dividends on the Series G1 Preferred are cumulative and payable
semi-annually in arrears on June 30 and December 30. At our option, dividends
may also be payable in our common stock valued at $280.00 per share. The Series
G1 Preferred dividend and liquidation rights shall rank junior to all claims of
creditors, but senior to our common stockholders and to any subsequent series of
our preferred stock, unless otherwise provided, except for the Series G2
Preferred, which shall rank equal to the Series G1 Preferred.
Redemption of Series G1 Preferred
– During 2009, we
redeemed six hundred shares of our Series G1 Preferred with a liquidation value
of $100 per share for $5 thousand in cash. In addition, we paid approximately $2
thousand in accrued dividends on these shares.
Series G2 Convertible Preferred
Stock - Our Series G2 Preferred Stock (“Series G2 Preferred”), which was
issued in 2000, has a liquidation value of $100 per share, is non-voting, and is
convertible at the holder’s option into our common stock at a conversion price
of $67.20 per share. The Series G2 Preferred is also convertible by
us into shares of our common stock if for any period of twenty consecutive
calendar days the average of the closing prices of our common stock during such
period shall have equaled or exceeded $84.00 per share. At
December 31, 2009 and 2008, there were 1,000 shares of Series G2 Preferred
issued and outstanding.
The
Series G2 Preferred holders shall be entitled to receive dividends at an annual
rate equal to $8.00 per share when, as and if declared by our Board of
Directors. All dividends on the Series G2 Preferred are cumulative and payable
semi-annually in arrears on June 30 and December 30. At our option, dividends
may also be payable in our common stock at $67.20 per share of our common stock.
The Series G2 Preferred dividend and liquidation rights shall rank junior to all
claims of creditors but senior to our common stockholders and to any subsequent
series of our preferred stock, unless otherwise provided. The Series G2
Preferred shall rank equal to the Series G1 Preferred.
Series M Preferred – Our
Series M Preferred, which was issued in 2004, had a liquidation value of $100
per share, was non-voting and was convertible at the holders’ option into common
stock at a conversion price of $13.44 per share which was later adjusted to
$13.22. This conversion price was subject to continued adjustment in the event
we subsequently issued shares of our common stock at a price lower than this
conversion price or in response to certain transactions that are in effect
equity restructuring transactions. During 2009, we paid $260
thousand in preferred dividends, of which $124 thousand was paid in connection
with the redemption of the 44,000 shares of Series M Preferred during 2009.
During 2008, we paid $284 thousand in preferred dividends.
67
Change in the Conversion Price of
the Series M Preferred – In June 2009 upon the issuance of our shares for
our investment in BWI, the conversion price of the Series M Preferred decreased
from $13.22 to $11.85 per share. The incremental intrinsic value of the change
in the Series M Preferred conversion price of $76 thousand is reflected as a
payment of preferred stock dividends in our consolidated statement of operations
during the year ended December 31, 2009.
Redemption of Series M Preferred
– During 2009, we
redeemed all 44 thousand shares of our Series M Preferred with a liquidation
value of $100 per share for $4.4 million in cash. In addition, we paid
approximately $124 thousand in accrued dividends on these shares.
The number of common and preferred
shares outstanding and shares held in treasury during 2009 and 2008
are as follows:
|
Number
of Shares
|
||||||||||||||||||||
|
Description
|
Preferred
G1
|
Preferred
G2
|
Preferred
M
|
Common
|
Treasury
|
|||||||||||||||
|
Balance
as of December 31, 2007
|
1,600 | 1,000 | 44,000 | 9,768,261 | - | |||||||||||||||
|
Issuances
of preferred stock dividends
|
- | - | - | 249 | - | |||||||||||||||
|
Treasury
Stock repurchase
|
- | - | - | - | 507,126 | |||||||||||||||
|
Treasury
Stock cancellation
|
- | - | - | (500,257 | ) | (500,257 | ) | |||||||||||||
|
Balance
as of December 31, 2008
|
1,600 | 1,000 | 44,000 | 9,268,253 | 6,869 | |||||||||||||||
|
Issuances
of preferred stock dividends
|
- | - | - | 157 | - | |||||||||||||||
|
Preferred
stock redemption
|
(600 | ) | - | (44,000 | ) | - | - | |||||||||||||
|
Issuance
of restricted shares for investment
|
- | - | - | 1,000,000 | - | |||||||||||||||
|
Treasury
Stock repurchase
|
- | - | - | - | 707,694 | |||||||||||||||
|
Treasury
Stock cancellation
|
- | - | - | (714,563 | ) | (714,563 | ) | |||||||||||||
|
Balance
as of December 31, 2009
|
1,000 | 1,000 | - | 9,553,847 | - | |||||||||||||||
Noncontrolling Interest –In June 2009, we recorded $5.6 million attributable
to noncontrolling interests in our consolidated balance sheet which represents
the fair value of the other BWI unitholders’ 80.5% interest in the net assets of
our investment in BWI. During year ended December 31, 2009, we recorded losses
of $295 thousand related to the results of operations of BWI to noncontrolling
interest which resulted in a noncontrolling interest of $5.3 million at December
31, 2009. Please see Note 2 –“Investment in BriteWater International, LLC.” for
additional information of our investment in BWI.
Put/Call Option to Issue Common
Shares – Pursuant
to the terms of our investment in BWI and the related agreement, HKN and the
other BWI unitholders have granted to one another put and call options with
respect to 3,050 units of BWI in exchange for issuance of 725 thousand
restricted shares of our common stock. These options are exercisable only if
certain conditions are satisfied prior to June 2012. None of these conditions
have been met as of December 31, 2009.
At
December 31, 2009, if our remaining convertible preferred stock was converted
and the put/call option was exercised, we would be required to issue the
following amounts of common stock:
|
Shares
of Common
|
||||||||
|
Stock
Issuable at
|
||||||||
|
Instrument
|
Conversion
Price (a)
|
December
31, 2009
|
||||||
|
Series
G1 Preferred
|
$ | 280.00 | 357 | |||||
|
BWI
Put/Call Option
|
725,000 | |||||||
|
Series
G2 Preferred
|
$ | 67.20 | 1,488 | |||||
|
Common
Stock Potentially Issued Upon Conversion
|
726,845 | |||||||
|
(a)
Certain conversion prices are subject to adjustment under certain
circumstances.
|
||||||||
68
Stockholder Rights Plan -- In
April 1998, we adopted a rights agreement (the “Rights Agreement”) whereby a
dividend of one preferred share purchase right (a “Right”) was paid for each
outstanding share of our common stock. The Rights will be exercisable
only if a person acquires beneficial ownership of 15% or more of our common
stock (an “Acquiring Person”), or commences a tender offer which would result in
beneficial ownership of 15% or more of such stock. When they become exercisable,
each Right entitles the registered holder to purchase from us one one-thousandth
of one share of Series E Junior Participating Preferred Stock (“Series E
Preferred Stock”), at a price of $35.00 per one one-thousandth of a share of
Series E Preferred Stock, subject to adjustment under certain circumstances.
During 2002, our Board of Directors amended the Rights Agreement to exclude from
the definition of an Acquiring Person certain parties who have received or would
receive beneficial ownership pursuant to certain transactions.
Upon the
occurrence of certain events specified in the Rights Agreement, each holder of a
Right (other than an Acquiring Person) will have the right to purchase, at the
Right’s then current exercise price, shares of our common stock having a value
of twice the Right’s exercise price. In addition, if, after a person
becomes an Acquiring Person, we are involved in a merger or other business
combination transaction with another person in which we are not the surviving
corporation, or under certain other circumstances, each Right will entitle its
holder to purchase, at the Right’s then current exercise price, shares of common
stock of the other person having a value of twice the Right’s exercise
price.
In 2008,
we amended the Rights Agreement. Under this amendment, the expiration of the
Rights was extended ten years, from April 6, 2008 to April 6, 2018. We will
generally be entitled to redeem the Rights in whole, but not in part, at $.01
per Right, subject to adjustment. No Rights were exercisable under
the Rights Agreement at December 31, 2009. The terms of the Rights generally may
be amended by us without the approval of the holders of the Rights prior to the
public announcement by us or an Acquiring Person that a person has become an
Acquiring Person.
|
(12)
|
RELATED
PARTY TRANSACTIONS
|
As described in Note 2 –“Investment in
BriteWater International, LLC”, in June 2009, we entered into an Agreement in
which we issued an aggregate of 1 million restricted shares of our common stock
in exchange for 1,950 units of BWI, formerly referred to as UniPure. In June
2009, we entered into a Loan Agreement with BWI under which we may make secured
loans to BWI up to a maximum amount of $2.5 million. These loans are
secured by all assets of BWI and are due and payable on or before June 30,
2012. As of December 31, 2009, we have made approximately $1 million
in aggregate secured loans to BWI. Two of the BWI existing
unitholders, Quadrant Management, Inc., (“Quadrant”) and UniPureEnergy
Acquisition, Ltd. (“UEA”) are affiliates of the Quasha family. Alan
G. Quasha is the Chairman of the Board of Directors of HKN. There
were no related party transactions during 2008 and 2007.
|
(13)
|
DISCONTINUED
OPERATIONS
|
In 2008, we created Canergy Growth Fund
LLC (“Canergy Growth Fund”), a U.S. Virgin Islands non-registered investment
fund, to invest in the Canadian junior oil and gas market, and Canergy
Management, a U.S. Virgin Islands company, to manage the Canergy Growth Fund as
well as other future possible Canadian investment opportunities. Our
investments in the Canergy Growth Fund and Canergy Management were variable
interests. Therefore, we consolidated the assets, liabilities and results of
operations for these two entities. With the dramatic decline in the U.S. and
foreign stock markets, and in order to avoid future additional significant
losses, late in 2008, Canergy Growth Fund divested of all of its common stock
holdings in Canadian junior oil and gas companies. In addition, the third-party
investor exercised their right to voluntarily withdraw from the Canergy Growth
Fund and Canergy Management, and HKN became the sole participant in both the
Canergy Growth Fund and Canergy Management. In the fourth quarter of 2009,
management decided to discontinue the Canergy Growth Fund and Canergy
Management.
69
As
discontinued operations, the operations for Canergy Growth Fund and Canergy
Management for all periods presented have been combined into a single line item,
net of taxes. The following tables provide summarized income statement
information related to Canergy Growth Fund’s and Canergy Mangement’s
discontinued operations:
|
Years
Ended December 31,
|
||||||||||||
|
2009
|
2008
|
2007
|
||||||||||
|
Trading
losses and other income from discontinued operations, net
|
$ | - | $ | (740 | ) | $ | - | |||||
|
Loss
from discontinued operations before income tax expense
|
- | (1,049 | ) | - | ||||||||
|
Income
tax expense
|
- | - | - | |||||||||
|
Loss
from discontinued operations
|
$ | - | $ | (1,049 | ) | $ | - | |||||
|
(14)
|
OTHER
INFORMATION
|
Quarterly Data --
(Unaudited) – The following tables summarize selected quarterly
financial data for 2009 and 2008 expressed in thousands, except per share
amounts:
|
Quarter
Ended
|
Total
|
|||||||||||||||||||
|
March
31
|
June
30
|
September
30
|
December
31
|
Year
|
||||||||||||||||
|
2009
|
||||||||||||||||||||
|
Revenues
and other
|
$ | 2,728 | $ | 3,394 | $ | 3,099 | $ | 3,147 | $ | 12,368 | ||||||||||
|
Net
loss
|
(1,118 | ) | (159 | ) | (614 | ) | (1,454 | ) | (3,345 | ) | ||||||||||
|
Net
loss attributed to common stock
|
(1,211 | ) | (348 | ) | (527 | ) | (1,383 | ) | (3,469 | ) | ||||||||||
|
Basic
and diluted loss per common share
|
$ | (0.13 | ) | $ | (0.04 | ) | $ | (0.05 | ) | $ | (0.15 | ) | $ | (0.37 | ) | |||||
|
2008 (1)
|
||||||||||||||||||||
|
Revenues
and other
|
$ | 6,280 | $ | 7,073 | $ | 5,751 | $ | 1,159 | $ | 20,263 | ||||||||||
|
Net
income (loss)
|
1,114 | 2,345 | (3,265 | ) | (27,148 | ) | (26,954 | ) | ||||||||||||
|
Net
income (loss) attributed to common stock
|
1,053 | 2,256 | (3,276 | ) | (27,141 | ) | (27,108 | ) | ||||||||||||
|
Basic
and diluted income (loss) per common share
|
$ | 0.11 | $ | 0.23 | $ | (0.34 | ) | $ | (2.83 | ) | $ | (2.83 | ) | |||||||
(1) In
the fourth quarter 2009, we discontinued the Canergy Fund and Canergy Management
segment which were created in June 2008. Therefore, the quarterly data was
restated retroactively.
Significant Customers – In
2009, we had one domestic purchaser of our Gulf Coast production which
represented approximately 61% of our consolidated revenues. We do not
feel that the loss of a significant purchaser would significantly impact our
operations due to the availability of other potential purchasers for our oil and
gas production.
Operating Segment Information
– We engage primarily in oil and gas development and production
activities in the onshore and offshore Gulf Coast regions of South Texas and
Louisiana as well as coalbed methane exploration and development activities in
Indiana and Ohio. Our coalbed methane and oil and gas operations
efforts in the United States are managed and evaluated by us as one operation.
We operate primarily through traditional ownership of mineral interests in the
various states in which we operate.
In the second quarter 2009, we created
a new operating segment to reflect the consolidation of our investment in BWI.
This entity holds the patents and equipment for OHSOL technology can be used to
purify oilfield emulsions by breaking and separating the emulsions into oil,
water and solids and to reduce the environmental impact for disposition of
residual fuels and waste materials. Please see Note 2 –“Investment in BriteWater
International, LLC.” for further discussion.
70
Our
accounting policies for each of our operating segments were the same as those
for our consolidated financial statements. There were no intersegment sales or
transfers for the periods presented.
See Note
16 – “Oil and Gas Disclosures” for geographic information regarding our
long-lived assets. Our financial information, expressed in thousands,
for our operating segments is as follows for each of the three years in the
period ended December 31, 2009:
|
For the Year Ended December 31,
2009
|
||||||||||||||||
|
HKN
|
BWI
|
Eliminations
|
Consolidated
|
|||||||||||||
|
Oil
and gas revenues
|
$ | 10,185 | $ | - | $ | - | $ | 10,185 | ||||||||
|
Interest
and other income
|
2,209 | - | (26 | ) | 2,183 | |||||||||||
|
Oil
and gas operating expenses
|
8,591 | - | - | 8,591 | ||||||||||||
|
General
and administrative expenses
|
2,836 | 361 | - | 3,197 | ||||||||||||
|
Provision
for doubtful accounts
|
183 | - | - | 183 | ||||||||||||
|
Depreciation,
depletion, amortization and accretion
|
3,524 | - | - | 3,524 | ||||||||||||
|
Other
losses (gains)
|
33 | 26 | (26 | ) | 33 | |||||||||||
|
Equity
in losses of Spitfire
|
225 | - | - | 225 | ||||||||||||
|
Income
tax benefit
|
(40 | ) | - | - | (40 | ) | ||||||||||
|
Segment
loss from continuing operations
|
$ | (2,958 | ) | $ | (387 | ) | $ | - | $ | (3,345 | ) | |||||
|
Capital
Expenditures
|
$ | 2,425 | $ | 127 | $ | - | $ | 2,552 | ||||||||
|
Total
Assets
|
$ | 61,473 | $ | 9,094 | $ | (2,352 | ) | $ | 68,215 | |||||||
|
Equity
investment in Spitfire
|
$ | 1,608 | $ | - | $ | - | $ | 1,608 | ||||||||
|
For the Year Ended December 31,
2008
|
||||||||||||||||
|
HKN
|
BWI
|
Eliminations
|
Consolidated
|
|||||||||||||
|
Oil
and gas revenues
|
$ | 22,206 | $ | - | $ | - | $ | 22,206 | ||||||||
|
Trading
losses
|
(4,344 | ) | - | - | (4,344 | ) | ||||||||||
|
Interest
and other income
|
2,401 | - | - | 2,401 | ||||||||||||
|
Oil
and gas operating expenses
|
10,801 | - | - | 10,801 | ||||||||||||
|
General
and administrative expenses
|
5,281 | - | - | 5,281 | ||||||||||||
|
Provision
for doubtful accounts
|
41 | - | - | 41 | ||||||||||||
|
Depreciation,
depletion, amortization and accretion
|
5,224 | - | - | 5,224 | ||||||||||||
|
Other
losses, net
|
121 | - | - | 121 | ||||||||||||
|
Equity
in earnings of Spitfire
|
(196 | ) | - | - | (196 | ) | ||||||||||
|
Impairment
of investment in Spitfire
|
4,618 | - | - | 4,618 | ||||||||||||
|
Impairment
of facilities
|
97 | - | - | 97 | ||||||||||||
|
Full
cost impairment
|
19,906 | - | - | 19,906 | ||||||||||||
|
Income
tax expense
|
275 | - | - | 275 | ||||||||||||
|
Segment
loss from continuing operations
|
$ | (25,905 | ) | $ | - | $ | - | $ | (25,905 | ) | ||||||
|
Capital
Expenditures
|
$ | 6,896 | $ | - | $ | - | $ | 6,896 | ||||||||
|
Total
Assets
|
$ | 68,773 | $ | - | $ | - | $ | 68,773 | ||||||||
|
Equity
investment in Spitfire
|
$ | 1,820 | $ | - | $ | - | $ | 1,820 | ||||||||
71
|
For the Year Ended December 31,
2007
|
||||||||||||||||
|
HKN
|
BWI
|
Eliminations
|
Consolidated
|
|||||||||||||
|
Oil
and gas revenues
|
$ | 20,419 | $ | - | $ | - | $ | 20,419 | ||||||||
|
Trading
revenues
|
680 | - | - | 680 | ||||||||||||
|
Interest
and other income
|
3,199 | - | - | 3,199 | ||||||||||||
|
Oil
and gas operating expenses
|
8,648 | - | - | 8,648 | ||||||||||||
|
General
and administrative expenses
|
5,950 | - | - | 5,950 | ||||||||||||
|
Provision
for doubtful accounts
|
(106 | ) | - | - | (106 | ) | ||||||||||
|
Depreciation,
depletion, amortization and accretion
|
6,107 | - | - | 6,107 | ||||||||||||
|
Other
losses, net
|
390 | - | - | 390 | ||||||||||||
|
Equity
in losses of Spitfire
|
50 | - | - | 50 | ||||||||||||
|
Income
tax expense
|
30 | - | - | 30 | ||||||||||||
|
Segment
income from continuing operations
|
$ | 3,229 | $ | - | $ | - | $ | 3,229 | ||||||||
|
Capital
Expenditures
|
$ | 10,867 | $ | - | $ | - | $ | 10,867 | ||||||||
|
Total
Assets
|
$ | 110,465 | $ | - | $ | - | $ | 110,465 | ||||||||
|
Equity
investment in Spitfire
|
$ | 6,517 | $ | - | $ | - | $ | 6,517 | ||||||||
|
(15)
|
EARNINGS
(LOSS) PER SHARE
|
Basic
earnings (loss) per share include no dilution and is computed by dividing income
or loss attributed to common stockholders by the weighted-average number of
common shares outstanding for the period. Diluted earnings (loss) per share
reflects the potential dilution that could occur if security interests were
exercised or converted into common stock.
The
following table sets forth the computation of basic and diluted earnings (loss)
per share for the years ended December 31, 2009, 2008 and 2007 (in
thousands).
|
2009
|
2008
|
2007
|
||||||||||||||||||||||||
|
Net
Loss Attributed to Common Stock
|
Weighted-Average
Shares
|
Per
Share Loss
|
Net
Loss Attributed to Common Stock
|
Weighted-Average
Shares
|
Per
Share Loss
|
Net
Income Attributed to Common Stock
|
Weighted-Average
Shares
|
Per
Share Income
|
||||||||||||||||||
|
Basic
EPS:
|
||||||||||||||||||||||||||
|
Income
(loss) from continuing ops
|
||||||||||||||||||||||||||
|
before
cumulative effect
|
$ | (3,469 | ) | 9,270 | $ | (0.37 | ) | $ | (27,108 | ) | 9,588 | $ | (2.83 | ) | $ | 2,965 | 9,799 | $ | 0.30 | |||||||
|
Effect
of dilutive securities
|
||||||||||||||||||||||||||
|
Preferred
stock and warrants (A)
|
- | - | - | - | - | - | - | - | - | |||||||||||||||||
|
Diluted
earnings per share
|
$ | (3,469 | ) | 9,270 | $ | (0.37 | ) | $ | (27,108 | ) | 9,588 | $ | (2.83 | ) | $ | 2,965 | 9,799 | $ | 0.30 | |||||||
|
(A)
|
Our
Series G1, Series G2 and Series M Preferred and common stock warrants
which were outstanding in the periods presented were excluded from the
calculation of diluted earnings per share as their effect would have been
antidilutive.
|
72
|
(16)
|
OIL
AND GAS DISCLOSURES (unaudited)
|
Costs
incurred in property acquisition, exploration and development activities,
expressed in thousands:
| Year ended December 31, | ||||||||||||
|
2009
|
2008
|
2007
|
||||||||||
|
Domestic
costs incurred:
|
||||||||||||
|
Acquisition of properties
|
||||||||||||
|
Evaluated
|
$ | - | $ | - | $ | - | ||||||
|
Unevaluated
|
- | - | - | |||||||||
|
Exploration
|
71 | 837 | 5,000 | |||||||||
|
Development
|
2,017 | 4,442 | 5,734 | |||||||||
|
Total
domestic costs incurred
|
$ | 2,088 | $ | 5,279 | $ | 10,734 | ||||||
Capitalized
Costs Relating to Oil and Gas Producing Activities, expressed in
thousands:
| As of December 31, | ||||||||||||
|
2009
|
2008
|
2007
|
||||||||||
|
Capitalized
costs:
|
||||||||||||
|
Unevaluated
properties
|
$ | 5,099 | $ | 4,874 | $ | 7,768 | ||||||
|
Evaluated
properties
|
200,197 | 197,534 | 187,817 | |||||||||
| Production facilities | 1,004 | 1,023 | 1,152 | |||||||||
|
Total
capitalized costs
|
206,300 | 203,431 | 196,737 | |||||||||
|
Less
accumulated depreciation, amortization and
full
cost impairment
|
(171,243 | ) | (168,227 | ) | (143,760 | ) | ||||||
|
Net
capitalized costs
|
$ | 35,057 | $ | 35,204 | $ | 52,977 | ||||||
Results
of Operations from Oil and Natural Gas Producing Activities
(thousands
of dollars)
|
Year
Ended December 31,
|
||||||||||||
|
2009
|
2008
|
2007
|
||||||||||
|
Oil
and natural gas revenues
|
$ | 10,185 | $ | 22,206 | $ | 20,419 | ||||||
|
Less:
|
||||||||||||
|
Oil
and natural gas operating costs
|
8,591 | 10,801 | 8,648 | |||||||||
|
Depreciation
and amortization
|
2,936 | 4,593 | 5,481 | |||||||||
|
Accretion
expense
|
392 | 363 | 379 | |||||||||
|
Income
tax expense (benefit)
|
(40 | ) | 50 | 30 | ||||||||
| 11,879 | 15,807 | 14,538 | ||||||||||
|
Results
of operations from oil and natural gas producing
activities
|
$ | (1,694 | ) | $ | 6,399 | $ | 5,881 | |||||
Oil and Gas Reserve Data
-- (Unaudited) -- The following information is presented with
regard to our proved oil and gas reserves. The reserve values and
cash flow amounts reflected in the following reserve disclosures are based on a
simple average of the first day of the month price for the period of January 1,
2009 to December 1, 2009, in accordance with ASC 932, Oil and Gas Reserve Estimation and
Disclosure and the Securities and Exchange Commission’s Final
Rule, Modernization of the Oil
and Gas Reporting Requirements, which were adopted for the disclosures
for the year December 31, 2009.
73
We were
unable to obtain the reserve information necessary from our equity method
investment in Spitfire since Spitfire’s most recent reserve report data is based
on a calendar year end of March 31, 2009. After contacting Spitfire for updated
reserve estimates as of December 31, 2009, they indicated these estimates are
not available and would not be available to the public. In addition, their
reserve report is not compiled in accordance with the SEC guidelines. Therefore,
Spitfire has not been included in our Standardized Measure of Discounted Future
Net Cash Flows relating to proved oil and gas reserves.
“Standardized
measure” relates to the estimated discounted future net cash flows, as adjusted
for our asset retirement obligations, and major components of that calculation
relating to proved reserves at the end of the year in the aggregate and by
geographic area, based on average prices, costs, and statutory tax rates and
using a 10% annual discount rate. Prices at December 31, 2009 were based on a
simple average of the first day of the month price for the period of January 1,
2009 to December 1, 2009 of $61.18 per barrel and $3.87 per mmbtu, as adjusted
by field for quality, transportation and regional price
differentials. Prices at December 31, 2008 were based on the
NYMEX prices of $44.60 per barrel and $5.62 per mmbtu, as adjusted by field for
quality, transportation and regional price differentials.
Standardized
Measure of Discounted Future Net Cash Flows Relating to Proved Oil and Gas
Reserves:
|
Unaudited,
in
thousands
|
||||
|
December
31, 2008:
|
||||
|
Future
cash inflows
|
$ | 93,494 | ||
|
Production
costs
|
(48,254 | ) | ||
|
Development
costs
|
(17,103 | ) | ||
|
Future
income taxes
|
- | |||
|
Future
net cash flows
|
28,137 | |||
|
10%
discount factor
|
(4,877 | ) | ||
|
Standardized
measure of discounted future
net
cash flows (1)
|
$ | 23,260 | ||
|
December
31, 2009:
|
||||
|
Future
cash inflows
|
$ | 110,189 | ||
|
Production
costs
|
(55,121 | ) | ||
|
Development
costs
|
(17,957 | ) | ||
|
Future
income taxes
|
- | |||
|
Future
net cash flows
|
37,111 | |||
|
10%
discount factor
|
(9,517 | ) | ||
| Standardized
measure of discounted future
net
cash flows (1)
|
$ | 27,594 | ||
|
(1)
|
Cash
flows associated with asset retirement obligations are included in the
Standardized Measure of Discounted Future Net Cash
Flows.
|
74
|
(Unaudited)
|
||||||||||||
|
2009
|
2008
|
2007
|
||||||||||
|
(in
thousands)
|
||||||||||||
| Total | ||||||||||||
|
Standardized
measure -- beginning of year
|
$ | 23,260 | $ | 93,939 | $ | 50,879 | ||||||
|
Increase
(decrease)
|
||||||||||||
|
Sales,
net of production costs
|
(3,906 | ) | (11,405 | ) | (11,889 | ) | ||||||
|
Net
change in prices, net of production costs
|
6,866 | (55,617 | ) | 36,902 | ||||||||
|
Development
costs incurred
|
(17 | ) | (1,251 | ) | (1,361 | ) | ||||||
|
Change
in future development costs
|
(647 | ) | 2,579 | 2,420 | ||||||||
|
Change
in future income taxes
|
- | - | - | |||||||||
|
Revisions
of quantity estimates
|
(1,688 | ) | (21,614 | ) | 9,832 | |||||||
|
Accretion
of discount
|
2,292 | 9,394 | 5,088 | |||||||||
|
Changes
in production rates, timing and other
|
(3,679 | ) | (921 | ) | (5,254 | ) | ||||||
|
Extensions
and discoveries, net of future costs
|
4,898 | 8,156 | 8,976 | |||||||||
|
Sales
of reserves-in-place
|
- | - | (1,654 | ) | ||||||||
|
Purchases
of reserves-in-place
|
215 | - | - | |||||||||
|
Standardized
measure -- end of year
|
$ | 27,594 | (1) | $ | 23,260 | (1) | $ | 93,939 | (1) | |||
|
(1)
|
Not
included are our proportional interests of $4.1 million, $4.0 million and
$4.2 million of the standardized measure of discounted future net cash
flows related to the proved reserves from our equity investment in
Spitfire at December 31, 2007, 2008 and 2009,
respectively. Spitfire’s reserve report information is as of
March 31, 2007, 2008 and 2009 (their fiscal year-end) and is not compiled
in accordance with the SEC
guidelines.
|
|
(17)
|
COMMITMENTS
AND CONTINGENCIES
|
Operating Leases -- We
lease our corporate and other office space. Total office lease payments during
2009, 2008 and 2007 totaled $196 thousand, $144 thousand and $360 thousand,
respectively, net of applicable sublease arrangements. Future minimum rental
payments required under all leases that have initial or remaining noncancellable
lease terms in excess of one year as of December 31, 2009 are as
follows:
|
Year
|
Amount
|
|||
|
2010
|
$ | 189,000 | ||
|
2011
|
78,000 | |||
|
2012
|
-- | |||
|
2013
|
-- | |||
| Thereafter | -- | |||
| Total minimum payments required | $ | 267,000 | ||
BriteWater Contingencies –
Please See Note 2 – Investment in BriteWater International, LLC for further
discussion on BWI contingencies.
75
IRS Examination - On August 6,
2008, we received a Revenue Agent’s Report in which the Internal Revenue Service
(“IRS”) proposed an adjustment to our federal tax liability for the calendar
year 2005. The proposed adjustment relates to the calculation of the
adjusted current earnings (“ACE”) component of the alternative minimum tax and
asserts that the Company recognized gain for ACE purposes on the sale of the
Global PLC stock in 2005. In its proposed adjustment, the IRS alleges
that the Company owes approximately $3.6 million in tax for the year ended
December 31, 2005. Penalties and interest calculated through December 31, 2009
in the amount of $2.1 million could also be assessed. In response to the
proposed adjustment and corresponding tax assessment, the Company filed a
written protest and request for conference on September 5, 2008 to address the
proposed adjustment with the Appeals division of the IRS. On October
29, 2008, we received an acknowledgement of receipt of our written protest and
request for conference from the IRS Appeals Office. In April 2009, we filed our
supplement to the written protest filed with the IRS. Based on
correspondence received to date, the IRS Appeals Office is still considering the
matter.
ASC 740,
Income Taxes prescribes
a recognition threshold of more-likely-than-not to be sustained upon
examination. ASC 740 also provides guidance on de-recognition, classification,
interest and penalties, accounting in interim periods, disclosures and
transition. Based on the requirements of ASC 740, we have recorded an
income tax contingency, including interest and penalties, as of December 31,
2009, of $225 thousand in our consolidated financial statements based, in part,
on a preliminary indication of a probability-weighted fair value assessment of
the Global stock. We intend to vigorously defend the proposed adjustment and
strongly believe that the Company has meritorious defenses.
Operational Contingencies
-- The exploration, development and production of oil and gas assets
are subject to various, federal and state laws and regulations designed to
protect the environment. Compliance with these regulations is part of our
day-to-day operating procedures. Infrequently, accidental discharge of such
materials as oil, natural gas or drilling fluids can occur and such accidents
can require material expenditures to correct. We maintain levels of insurance we
believe to be customary in the industry to limit its financial exposure. We are
unaware of any material capital expenditures required for environmental control
during this fiscal year.
|
(18)
|
SUBSEQUENT
EVENTS
|
We have evaluated events after the date
of these financial statements, December 31, 2009 through February 18, 2010, the
date that these financial statements were issued. There were no material
subsequent events as of that date.
ITEM
9. CHANGES IN AND DISAGREEMENTS WITH ACCOUNTANTS ON ACCOUNTING
AND FINANCIAL DISCLOSURE
None.
ITEM
9A. CONTROLS AND PROCEDURES
Evaluation
of Disclosure Controls and Procedures
The
Company maintains disclosure controls and procedures that are designed to ensure
that information required to be disclosed in its filings with the Securities and
Exchange Commission (SEC) are recorded, processed, summarized and reported
within the time period specified in the SEC’s rules and forms, and that such
information is accumulated and communicated to management, including its chief
executive and chief financial officers, as appropriate, to allow timely
decisions regarding required disclosure based on the definition of “disclosure
controls and procedures” as defined in Rule 13a-15(e) promulgated under the
Securities Exchange Act of 1934, as amended (the “Exchange Act”). In designing
and evaluating the disclosure controls and procedures, management has recognized
that any controls and procedures, no matter how well designed and operated, can
provide only reasonable assurance of achieving the desired control objectives,
and management is required to apply judgment in evaluating its controls and
procedures. As of the end of the period covered by this report, and under the
supervision and with the participation of management, including the Company’s
Chief Executive Officer and Chief Financial Officer, the Company evaluated the
effectiveness of the design and operation of these disclosure controls and
procedures. Based on this evaluation, the Company’s Chief Executive Officer and
Chief Financial Officer have concluded that the Company’s disclosure controls
and procedures were effective as of the end of the period covered by this annual
report.
76
Changes
in Internal Control over Financial Reporting
There
have been no significant changes in the Company’s internal control over the
financial reporting that occurred during the quarter ended December 31, 2009
that have materially affected, or are reasonably likely to materially affect,
our internal control over financial reporting.
Management’s
Report on Internal Control Over Financial Reporting
Management
of the Company is responsible for establishing and maintaining adequate internal
control over financial reporting as defined in Rules 13a-15(f) and 15d-15(f)
under the Exchange Act. The Company’s internal control over financial reporting
is designed, under the supervision of the Company’s chief executive and chief
financial officers, to provide reasonable assurance regarding the reliability of
financial reporting and the preparation of financial statements for external
purposes in accordance with accounting principles generally accepted in the
United States of America (GAAP). The Company’s internal control over
financial reporting includes those policies and procedures that: (i) pertain to
the maintenance of records that, in reasonable detail, accurately and fairly
reflect the transactions and dispositions of the assets of the Company; (ii)
provide reasonable assurance that transactions are recorded as necessary to
permit preparation of financial statements in accordance with GAAP, and that
receipts and expenditures of the Company are being made only in accordance with
authorizations of management and directors of the Company; and (iii) provide
reasonable assurance regarding prevention or timely detection of unauthorized
acquisition, use or disposition of the Company’s assets that could have a
material effect on the financial statements.
The
Company conducted an evaluation of the effectiveness of its internal control
over financial reporting as of December 31, 2009. This evaluation was
based on the framework in “Internal Control – Integrated Framework” issued by
the Committee of Sponsoring Organizations of the Treadway Commission (COSO). All
internal control systems, no matter how well designed, have inherent
limitations. Therefore, even those systems determined to be effective
can provide only reasonable assurance regarding the reliability of financial
reporting and the preparation of financial statements for external purposes in
accordance with GAAP.
Based on
the Company’s evaluation under the framework in Internal Control – Integrated
Framework, our Chief Executive Officer and Chief Financial Officer
concluded that internal control over financial reporting was effective as of
December 31, 2009.
The
Company's independent auditors, Hein & Associates, LLP, with direct access
to the Company's Board of Directors through its Audit Committee, have audited
the consolidated financial statements prepared by the Company. Their report on
the consolidated financial statements is included in Part II, Item 8.
Financial Statements and Supplementary Data. Hein & Associates, LLP’s report
on the Company's internal control over financial reporting appears on the
following page.
77
REPORT
OF INDEPENDENT REGISTERED PUBLIC ACCOUNTING FIRM
To the
Board of Directors
HKN,
Inc.
We have
audited HKN, Inc's internal control over financial reporting as of December 31,
2009, based on criteria established in Internal Control—Integrated Framework
issued by the Committee of Sponsoring Organizations of the Treadway Commission
(COSO). HKN’s management is responsible for maintaining effective internal
control over financial reporting and for its assessment of the effectiveness of
internal control over financial reporting included in the accompanying
Management’s Report on Internal Control Over Financial Reporting. Our
responsibility is to express an opinion on the company's internal control over
financial reporting based on our audit.
We
conducted our audit in accordance with the standards of the Public Company
Accounting Oversight Board (United States). Those standards require
that we plan and perform the audit to obtain reasonable assurance about whether
effective internal control over financial reporting was maintained in all
material respects. Our audit included obtaining an understanding of internal
control over financial reporting, assessing the risk that a material weakness
exists, and testing and evaluating the design and operating effectiveness of
internal control based on the assessed risk. Our audit also included
performing such other procedures as we considered necessary in the
circumstances. We believe that our audit provides a reasonable basis
for our opinion.
A
company's internal control over financial reporting is a process designed to
provide reasonable assurance regarding the reliability of financial reporting
and the preparation of financial statements for external purposes in accordance
with generally accepted accounting principles. A company's internal control over
financial reporting includes those policies and procedures that (1) pertain to
the maintenance of records that, in reasonable detail, accurately and fairly
reflect the transactions and dispositions of the assets of the company; (2)
provide reasonable assurance that transactions are recorded as necessary to
permit preparation of financial statements in accordance with generally accepted
accounting principles, and that receipts and expenditures of the company are
being made only in accordance with authorizations of management and directors of
the company; and (3) provide reasonable assurance regarding prevention or timely
detection of unauthorized acquisition, use, or disposition of the company's
assets that could have a material effect on the financial
statements.
Because
of its inherent limitations, internal control over financial reporting may not
prevent or detect misstatements. Also, projections of any evaluation
of effectiveness to future periods are subject to the risk that controls may
become inadequate because of changes in conditions, or that the degree of
compliance with the policies or procedures may deteriorate.
In our
opinion, HKN, Inc. maintained, in all material respects, effective internal
control over financial reporting as of December 31, 2009, based on criteria
established in Internal Control—Integrated Framework issued by the Committee of
Sponsoring Organizations of the Treadway Commission (COSO).
We have
also audited, in accordance with the standards of the Public Company Accounting
Oversight Board (United States), the consolidated balance sheets of HKN, Inc. as
of December 31, 2009 and 2008, and the related consolidated statements of
operations, stockholders’ equity, and cash flows for each of the three years in
the period ended December 31, 2009 and our report dated February 18, 2010
expressed an unqualified opinion.
HEIN & ASSOCIATES
LLP
Dallas,
Texas
February
18, 2010
78
PART
III
|
ITEM
10. DIRECTORS, EXECUTIVE OFFICERS AND CORPORATE
GOVERNANCE
|
Information regarding HKN’s directors
and executive officers is set forth under “Proposal One: Election of Directors”,
“Executive Officers of HKN” and “Section 16(a) Beneficial-Ownership Reporting
Compliance” in HKN’s Proxy Statement, to be filed on or before April 30, 2010,
which information is incorporated herein by reference.
Information regarding corporate
governance is set forth under “Corporate Governance” in HKN’s Proxy Statement,
to be filed on or before April 30, 2010, which information is incorporated
herein by reference.
HKN has adopted a code of ethics that
applies to all members of Board of Directors and employees of HKN, including,
the principal executive officer, principal financial officer, principal
accounting officer or controller, or persons performing similar
functions. HKN has posted a copy of the code on HKN’s internet
website at the internet address:
http://www.hkninc.com/corpgov.html. Copies of the code of ethics may
be obtained free of charge from HKN’s website at the above internet
address.
ITEM
11. EXECUTIVE COMPENSATION
Information
regarding HKN’s compensation of its Chief Executive Officer, Chief Financial
Officer and other named executive officers is set forth under “Executive
Compensation” in HKN’s Proxy Statement, to be filed on or before April 30, 2010,
which information is incorporated herein by reference. Information regarding
HKN’s compensation of its directors is set forth under “Director Compensation”
in the Proxy Statement, which information is incorporated herein by
reference.
ITEM
12. SECURITY OWNERSHIP OF CERTAIN BENEFICIAL OWNERS AND MANAGEMENT AND RELATED
STOCKHOLDER MATTERS
Information
regarding security ownership of certain beneficial owners and management is set
forth under “Ownership of Common Stock” in HKN’s Proxy Statement, to be filed on
or before April 30, 2010, which information is incorporated herein by
reference.
ITEM
13. CERTAIN RELATIONSHIPS AND RELATED TRANSACTIONS AND DIRECTOR
INDEPENDENCE
Information
regarding certain relationships and related transactions is set forth under
“Certain Relationships and Related Transactions” in HKN’s Proxy Statement, to be
filed on or before April 30, 2010, which information is incorporated herein by
reference. Information regarding director independence is set forth under
“Corporate Governance” in HKN’s Proxy Statement to be filed on or before April
30, 2010, which information is to be incorporated herein by
reference.
ITEM
14. PRINCIPAL ACCOUNTING FEES AND SERVICES
The
information required by this item is set forth under “Independent Registered
Public Accountants” in HKN’s Proxy Statement to be filed on or before April 30,
2010, which information is incorporated by reference herein from HKN’s Proxy
Statement, which will be filed with the SEC on or before April 30,
2010.
79
PART
IV
ITEM
15. EXHIBITS, FINANCIAL STATEMENT SCHEDULES AND REPORTS ON FORM 8-K
(a) The
following documents are filed as a part of this Annual Report:
|
|
(1)
|
Financial
Statements included in Part II of this Annual
Report:
|
| Page | |
| HKN, Inc. and Subsidiaries | |
|
--
Report of Independent Registered Public Accounting Firms
|
43
|
|
--
Consolidated Balance Sheets -- December 31, 2009 and
2008
|
44
|
|
--
Consolidated Statements of Operations for the three years
ended
|
|
|
December 31,
2009
|
45
|
|
--
Consolidated Statements of Stockholders’ Equity for the three years
ended
|
|
|
December 31,
2009
|
46
|
|
--
Consolidated Statements of Cash Flows for the three years
ended
|
|
|
December 31,
2009
|
47
|
|
--
Notes to Consolidated Financial Statements
|
48
|
|
|
(2)
|
The
information required by Schedule I is either provided in the related
financial statements or in a note thereto, or is not applicable to HKN,
Inc. The information required by all other Schedules is not applicable to
HKN, Inc.
|
|
|
(3)
|
Exhibits
|
|
3.1
|
Restated
Certificate of Incorporation of HKN, Inc. (filed as Exhibit 3.1
to HKN’s Form 10-K dated February 28, 2006, File No. 1-10262, and
incorporated herein by reference).
|
|
3.2
|
Certificate
of Amendment to Restated Certificate of Incorporation of Harken Energy
Corporation dated June 4, 2007 (filed as Exhibit 3.2 to HKN’s Form 10-Q
dated August 7, 2007, File No. 1-10262, and incorporated by reference
herein).
|
|
3.3
|
Certificate
of Amendment to Restated Certificate of Incorporation of HKN, Inc. dated
June 24, 2008 and effective June 26, 2008
|
|
3.4
|
Amended
and Restated Bylaws of HKN, Inc. (filed as Exhibit 3.7 to HKN’s Annual
Report on Form 10-K for fiscal year ended December 31, 2002, File No.
1-10262, and incorporated by reference herein).
|
|
4.1
|
Form
of certificate representing shares of HKN, Inc. common stock, par value
$.01 per share (filed as Exhibit 4.1 to HKN’s Form 10-Q dated August 7,
2007, File No. 1-10262, and incorporated by reference
herein).
|
|
4.2
|
Rights
Agreement, dated as of April 6, 1998, by and between Harken Energy
Corporation and ChaseMellon Shareholder Services L.L.C., as Rights Agent
(filed as Exhibit 4 to Harken’s Current Report on Form 8-K dated April 7,
1998, file No. 1-10262, and incorporated by reference
herein).
|
|
4.3
|
Amendment
to Rights Agreement by and between Harken Energy Corporation and American
Stock Transfer and Trust Company (successor to Mellon Investor Services
LLC, (formerly known as ChaseMellon Shareholder Services L.L.C.), as
Rights Agent, dated June 18, 2002 (filed as Exhibit 4.11 to Harken’s
Quarterly Report on Form 10-Q for the period ended September 30, 2002,
File No. 1-10262, and incorporated by reference
herein).
|
80
|
4.4
|
Amendment
to Rights Agreement by and between Harken Energy Corporation and American
Stock Transfer and Trust Company (successor to Mellon Investor Services
LLC, (formerly known as ChaseMellon Shareholder Services L.L.C.), as
Rights Agent, dated August 27, 2002 (filed as Exhibit 4.12 to Harken’s
Quarterly Report on Form 10-Q for the period ended September 30, 2002,
File No. 1-10262, and incorporated by reference
herein).
|
|
4.5
|
Certificate
of Designations of Series E Junior Participating Preferred Stock (filed as
Exhibit A to Exhibit 4 to Harken’s Current Report on Form 8-K dated April
7, 1998, file No. 1-10262, and incorporated by reference
herein).
|
|
4.6
|
Certificate
of Increase of Series E Junior Participating Preferred Stock of Harken
Energy Corporation (filed as Exhibit 4.6 to Harken’s Annual Report on Form
10-K for the fiscal year ended December 31, 2002, File No. 1-10262, and
incorporated by reference herein).
|
|
4.7
|
Certificate
of Designations of Series G1 Convertible Preferred Stock (filed as Exhibit
3.7 to Harken’s Current Report on Form 8-K dated February 13, 2003, File
No. 1-10262, and incorporated by reference herein).
|
|
4.8
|
Certificate
of Increase of Series G1 Convertible Preferred Stock
of Harken Energy Corporation (filed as Exhibit 3.8
to Harken’s Current Report on Form 8-K dated February 13, 2003, File No.
1-10262, and incorporated by reference herein).
|
|
4.9
|
Certificate
of Designations of Series G2 Convertible Preferred Stock (filed as Exhibit
4.10 to Harken’s Annual Report on Form 10-K, as amended, for the fiscal
year ended December 31, 2001, File No. 1-10262, and incorporated by
reference herein).
|
|
4.15
|
Certificate
of Designations of Series M Cumulative Convertible Preferred Stock (filed
as Exhibit 4.1 to Harken’s Current Report on Form 8-K dated October 8,
2004, File No. 1-10262, and incorporated by reference
herein).
|
|
4.16
|
Amendment
to Rights Agreement by and between HKN, Inc. and American Stock
Transfer and Trust Company, as Rights Agent, dated April 4, 2008
(filed as Exhibit 4.1 to HKN’s current report on Form 8-K dated
April 4, 2008, file No. 1-10262, and incorporated by reference
herein).
|
|
10.1
|
Exploration
and Development Agreement – Indiana Posey (filed as Exhibit 10.1 to
Harken’s Current Report on Form 8-K, dated March 22, 2005, File No.
001-10262, and incorporated herein by reference).
|
|
10.2
|
Exploration
and Development Agreement – Ohio Cumberland (filed as Exhibit 10.1 to
Harken’s Current Report on Form 8-K, dated March 29, 2005, File No.
001-10262, and incorporated herein by reference).
|
|
10.3
|
Form
of Executive Retention Agreement (filed as Exhibit 10.1 to HKN’s Current
Report on Form 8-K dated July 2, 2008, File No. 001-10262, and
incorporated by reference herein)
|
|
*21
|
Subsidiaries
of HKN, Inc.
|
81
|
*23.1
|
Consent
of Independent Registered Public Accounting Firm – Hein & Associates,
LLP
|
|
*23.2
|
Consent
of Collarini & Associates (Independent Reserve
Engineers)
|
|
*23.3
|
Consent
of Crest Engineering Services (Independent Reserve
Engineers)
|
|
*24
|
Power
of Attorney
|
|
*31.1
|
Certificate
of the Chief Executive Officer of HKN, Inc. pursuant to section 302 of the
Sarbanes-Oxley Act of 2002 (“S.O. Act”)
|
|
*31.2
|
Certificate
of the Chief Financial Officer of HKN, Inc. pursuant to section 302 of the
S.O. Act
|
|
*32.1
|
Certificate
of the Chief Executive Officer of HKN, Inc. pursuant to section 906 of the
S.O. Act
|
|
*32.2
|
Certificate
of the Chief Financial Officer of HKN, Inc. pursuant to section 906 of the
S.O. Act
|
|
*99.1
|
Collarini
Reserve Report Summary
|
|
*99.2
|
Crest
Reserve Report Summary
|
* Filed
herewith
82
SIGNATURES
Pursuant
to the requirements of the Section 13 or 15(d) of the Securities Exchange Act of
1934, the Registrant has duly caused this Report to be signed on its behalf by
the undersigned, thereunto duly authorized, on February 18, 2010.
| HKN, INC. | ||
|
|
/s/ Anna M. Williams | |
|
By:
Anna M. Williams, Senior Vice President –
and
Chief Financial Officer (Principal Financial
Officer
and Principal Accounting Officer)
|
Pursuant
to the requirements of the Securities Exchange Act of 1934, as amended, this
report has been signed below by the following persons on behalf of the
registrant and in the capacities on February 18, 2010.
|
Signature
|
Title | |
|
/s/ Anna M. Williams
|
Senior
Vice President and Chief Financial Officer
|
|
|
Anna
M. Williams
|
(Principal Financial Officer and Principal Accounting Officer) | |
|
/s/ Mikel D. Faulkner
|
Director,
Chief Executive Officer and President
|
|
|
Mikel
D. Faulkner
|
(Principal Executive Officer) | |
|
/s/ Michael M. Ameen *
|
Director
|
|
|
Michael
M. Ameen
|
||
|
/s/ J. William Petty *
|
Director
|
|
|
J.
William Petty
|
||
|
/s/ Alan G. Quasha *
|
Director
|
|
|
Alan
G. Quasha
|
||
|
/s/ H.A. Smith *
|
Director
|
|
|
H.
A. Smith
|
||
| /s/ Anna M. Williams | ||
| * By: Anna M. Williams, Attorney in-fact |
83