Attached files
| file | filename |
|---|---|
| 8-K - FORM 8-K - Energy Future Holdings Corp /TX/ | d8k.htm |
| EX-99.1 - PRESS RELEASE - Energy Future Holdings Corp /TX/ | dex991.htm |
 EFH
Corp. Q4 09 Investor Call February 19, 2010 Exhibit 99.2 |
 1 Safe Harbor Statement This presentation contains forward-looking statements, which are subject to various
risks and uncertainties. Discussion of risks and uncertainties that
could cause actual results to differ materially from management's current
projections, forecasts, estimates and expectations is contained in EFH Corp.'s
filings with the Securities and Exchange Commission (SEC). In addition
to the risks and uncertainties set forth in EFH Corp.'s SEC filings, the
forward-looking statements in this presentation regarding the company’s long- term hedging program could be affected by, among other things: any change in the ERCOT
electricity market, including a regulatory or legislative change, that results
in wholesale electricity prices not being largely correlated to natural gas
prices; any decrease in market heat rates as the long-term hedging program
generally does not mitigate exposure to changes in market heat rates; the
unwillingness or failure of any hedge counterparty or the lender under the
commodity collateral posting facility to perform its obligations; or any other
unforeseen event that results in the inability to continue to use a first lien
to secure a substantial portion of the hedges under the long-term hedging
program. In addition, the forward-looking statements in this
presentation regarding the company’s new generation plants could be
affected by, among other things, any adverse judicial rulings with respect to the plants’ construction and operating permits. Regulation G This presentation includes certain non-GAAP financial measures. A reconciliation of
these measures to the most directly comparable GAAP measures is included in
the appendix to this presentation. |
 2 Today’s Agenda Paul Keglevic Executive Vice President & CFO Financial and Operational Overview 2009 Review Q&A |
 3 22 22 - Land (310) - 310 Intangible assets (147) - 147 Natural gas-fueled generation
plants (8,860) - 8,860 Goodwill 171 - (171) Goodwill impairment applicable to minority interests Non-cash impairment charges: (56) (56) - Debt extinguishment gain - November 2009 debt
exchange (367) 1 983 (1,642) (8,855) Q4 08 16 (351) Adjusted (non-GAAP) operating
income (loss) attributable to EFH Corp. (1,093) (110) Unrealized mark-to-market net losses (gains) on interest rate swaps (14) (330) 137 Q4 09 (15) Other (noncash) 1,312 Unrealized commodity-related mark-to-market net (gains) losses Items excluded from
adjusted (non-GAAP) operating earnings (after tax): 8,992 GAAP net income (loss) attributable to EFH Corp. Change Factor Consolidated: reconciliation of GAAP net income (loss) to adjusted (non-GAAP) operating results 1 Q4 08 vs. Q4 09; $ millions, after tax 1 See Appendix for Regulation G reconciliations and definitions. 2 Q4 08 includes impairment of trade name and emissions allowances. 3 Q4 09 represents a $14 million (after tax) adjustment to a liability recorded in
purchase accounting related to a terminated outsourcing agreement. EFH Corp.
Adjusted (Non-GAAP) Operating Results - QTR 2 3 |
 4 22 22 - Land (632) - 632 Intangible assets (147) - 147 Natural gas-fueled generation plants (8,770) 90 8,860 Goodwill 171 - (171) Goodwill impairment applicable to minority interests Non-cash impairment charges: (56) (56) - Debt extinguishment gain - November 2009 debt
exchange (876) 34 960 (1,500) (9,838) FY 08 24 (852) Adjusted (non-GAAP) operating
income (loss) attributable to EFH Corp. (1,412) (452) Unrealized mark-to-market net losses (gains) on interest rate swaps (12) (788) 344 FY 09 (46) Other (noncash) 712 Unrealized commodity-related mark-to-market net (gains) losses Items excluded from
adjusted (non-GAAP) operating earnings (after tax): 10,182 GAAP net income (loss) attributable to EFH Corp. Change Factor Consolidated: reconciliation of GAAP net income (loss) to adjusted (non-GAAP) operating results 1 FY 08 vs. FY 09; $ millions, after tax 1 See Appendix for Regulation G reconciliations and definitions. 2 2008 includes impairment of trade name and emissions allowances. 3 2008 includes $17 million (after tax) representing a reserve established against
accounts receivable (excluding termination-related costs) from affiliates of Lehman Brothers Holdings, Inc. arising from commodity hedging and trading activities, all of which were terminated in
September 2008. 2009 includes $16 million (after tax) representing a write-off of rate case disallowed regulatory assets, $14 million (after tax) arising from the reversal of a use
tax accrual recorded in purchase accounting related to periods prior to the merger in October 2007 and $14 million (after tax) representing an adjustment to a liability recorded in
purchase accounting related to a terminated outsourcing agreement. EFH Corp.
Adjusted (Non-GAAP) Operating Results - FY 2 3 |
 5 5 Consolidated: key drivers of the change in EFH Corp. (non-GAAP) operating results Q4 09 vs. Q4 08; $ millions,
after tax (6) Higher amortization of retail intangible assets arising from purchase accounting
(8) Higher marketing costs and employee related expenses 18 Improvement in the effective tax rate due to lower interest rates applied to uncertain tax
positions (4) Higher retail bad debt expense (11) (31) Higher costs reflecting amort. of reg. assets approved for recovery, AMS implementation
& higher transmission fees (8) Higher operating costs due to the new plants (11) Higher interest expense primarily due to lower capitalized interest 25 Impact of new lignite-fueled generation units Description/Drivers Better (Worse) Than Q4 08 Competitive business : Higher margin from asset management & the retail business 39 Lower amortization of intangibles arising from purchase accounting 13 Lower purchased power costs during unplanned plant outages 10 Contribution margin 87 Higher depreciation reflecting new lignite-fueled generation facilities & ongoing
generation fleet investment (22) All other - net 4 Total increase – Competitive business 39 Regulated Delivery segment: Higher revenues driven by rate increases including tariffs approved in the 2009 rate
order 26 Higher depreciation reflecting infrastructure investment & higher depreciation rates
approved in the 2009 rate order (19) Total decrease – Regulated Delivery segment (24) Net income attributable to noncontrolling interests 1 Total change in adjusted (non-GAAP) operating results 16 1 Competitive business consists of Competitive Electric segment and Corp. &
Other. EFH Corp. Adjusted (Non-GAAP) Operating Results – QTR 1 Lower other income – primarily due to insurance proceeds received in 2008 related to a mining equipment
claim |
 6 6 (23) Higher retail bad debt expense due to customer losses, new system conversion & general
economic conditions 20 Lower nuclear plant maintenance costs reflecting two nuclear refueling outages in 2008 vs.
one in 2009 (25) Higher amortization of retail intangible assets arising from purchase accounting
(26) Higher depreciation reflecting the new lignite-fueled generation facilities &
ongoing generation fleet investment (18) Higher operating costs due to the new plants (32) Higher costs related to the transition of outsourced services & new retail customer
care system (71) Higher costs reflecting higher transmission fees, amort. of reg. assets approved for
recovery & AMS implementation 30 Higher output from nuclear-fueled plants 25 Impact of new lignite-fueled generation units Description/Drivers Better (Worse) Than FY 08 Competitive business : Higher margin from asset management & the retail business 108 Lower purchased power costs during unplanned plant outages 68 Lower amortization of intangibles arising from purchase accounting 43 Effect on retail business of Hurricane Ike in 2008 13 Contribution margin 287 Higher interest expense reflecting increased amortization of interest rate hedge
losses (66) All other – net 4 Total increase - Competitive business 121 Regulated Delivery segment: Higher revenues driven by rate increase, partially offset by the effects of milder weather & weaker economy 71 Higher depreciation reflecting infrastructure investment & higher depreciation rates
approved in the 2009 rate order (42) All other - net (2) Total decrease – Regulated Delivery segment (44) Net income attributable to non-controlling interests (53) Total change in adjusted (non-GAAP) operating results 24 1 Competitive business consists of Competitive Electric segment and Corp. &
Other. EFH Corp. Adjusted (Non-GAAP) Operating Results – FY 1 Consolidated key drivers of the change in EFH Corp. (non-GAAP) operating
results FY 09 vs. FY 08; $ millions, after tax |
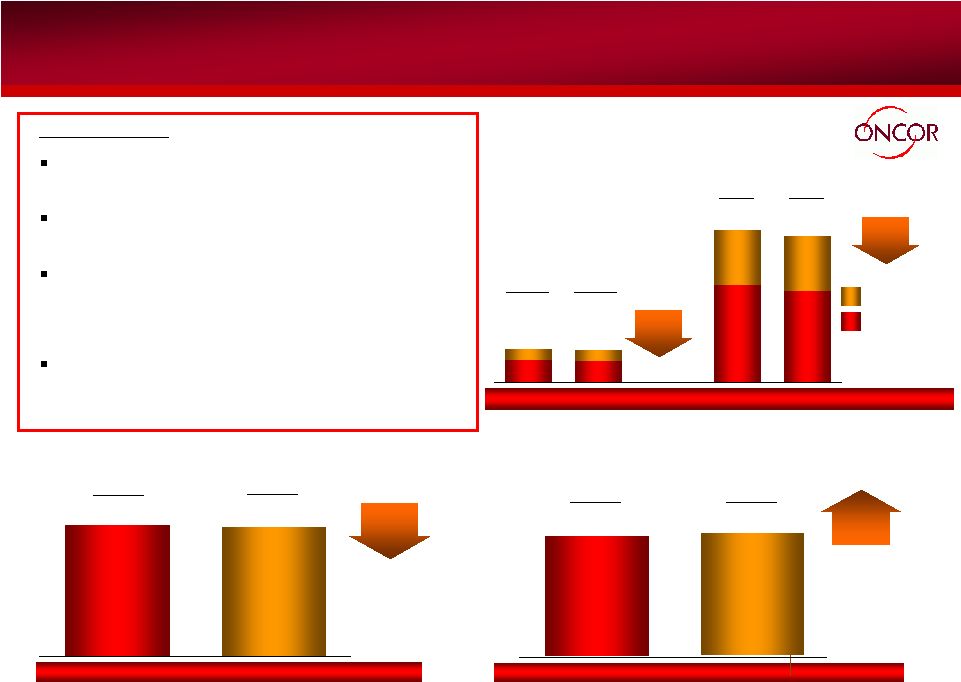
 7 1 See Appendix for Regulation G reconciliations and definitions. 2 Twelve months ended December 31. FY 08 and FY 09 include $21 million and $13 million, respectively, of Corp. & Other Adjusted EBITDA. EFH Corp. had solid earnings performance despite the difficult economic environment
largely due to the effectiveness of our hedge program and operational
improvements. EFH Corp. Adjusted EBITDA (non-GAAP) FY 09 vs. FY 08 ; $ millions TCEH Oncor FY 08 FY 09 6% EFH Corp. Earnings Performance 4,857 4,578 3,242 3,505 1,315 1,339 2% 8% 1 2 |
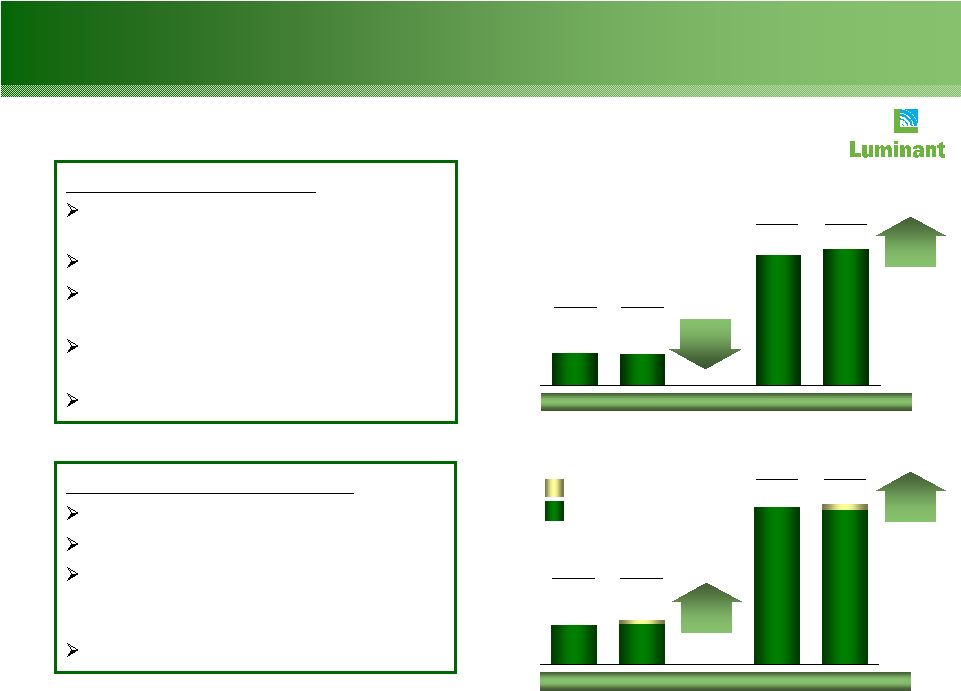 8 Luminant Operational Results Nuclear-fueled generation; GWh 20,104 4,592 FY 08 Q4 08 Coal-fueled generation; GWh 11,226 12,769 FY 09 Q4 08 2% QTR Q4 09 FY 08 44,923 45,684 4,770 19,218 Q4 09 FY 09 1 Q4 09 and FY 09 generation from Sandow 5 and Oak Grove 1 of 1,348 GWh and 1,443 GWh, respectively. 2 Variance does not include generation from Sandow 5 and Oak Grove 1. Oak Grove & Sandow 5 Legacy coal plants 2009 Nuclear Plant Results: One outage in 2009 vs. two outages in 2008 Company record safety performance Completed 4% up-rate of Units 1 (late 2008) & 2 (2009) 4th shortest refueling outage in Luminant history Top decile industry performance 2009 Lignite/Coal Plant Results: Company record safety performance New plants produced 1.3 TWh Better plant performance of ~70 GWh offset by higher economic backdown of ~750 GWh Top quartile industry performance 5% FY 2% FY 4% QTR 1 2 Strong performance from the nuclear fleet in FY 09. Improved performance from the coal fleet in FY 09. |
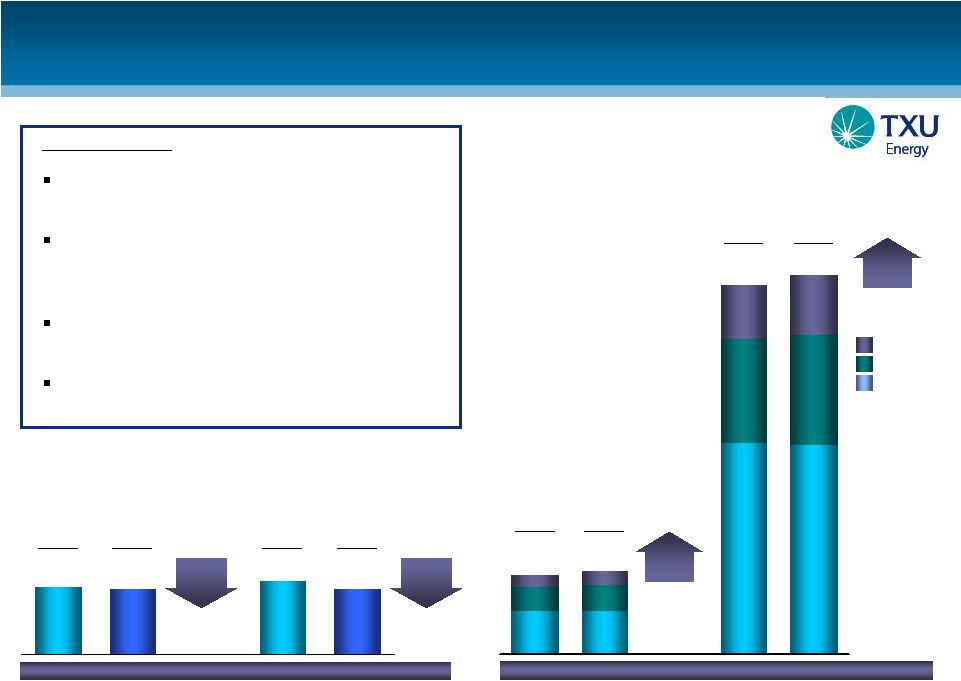 9 9 TXU Energy Operational Results Competitive activity continues. FY 09 business customer growth offset economic impacts. Q4 08 Q4 09 Total residential customers End of period, thousands Retail electricity sales volumes by customer class; GWh 1,876 1,862 2009 Results Lower residential sales volumes driven by lower customer counts Business load growth attributable to new customers offset by reduced customer usage as a result of a weaker economy Lower residential customer counts reflect competitive activity in the marketplace Highest recorded level of overall customer satisfaction 1 Small business customers 2 Large commercial and industrial customers FY 09 3% FY SMB LCI Residential FY 08 49,443 50,581 10,537 11,136 6% QTR Q4 09 Q3 09 1,914 1,862 Q4 09 Q4 08 1% QTR 2% FY 5,982 5,734 2,994 3,668 1,734 1,561 28,135 28,046 14,573 13,945 7,962 7,363 1 2 |
 10 16,169 15,483 69,100 65,077 38,728 38,299 7,704 7,800 Oncor Operational Results Electricity distribution points of delivery End of period, thousands of meters Electric energy billed volumes; GWh Q4 08 Q4 09 Q4 08 Q4 09 SMB & LCI volumes in Q4 09 & FY 09 declined 4% & 6%, respectively. Growth below ERCOT estimated CAGR of 2.5% 2009 Results Lower energy volumes due to a weaker economy Improved reliability – shorter interruption durations Execution of AMS plan – ~350,000 advanced meters installed during the fourth quarter; 9 of 14 CREZ-related Certificates of Convenience and Necessity filed with the Public Utility Commission of Texas (PUC) SAIDI (nonstorm) ; Minutes Q4 08 Q4 09 84.5 85.4 Shorter interruption durations 1 System Average Interruption Duration Index (nonstorm) is the average number of minutes
electric service is interrupted per consumer in a year. 2 SMB – small business; LCI – large commercial and industrial Residential SMB & LCI 3% QTR 1% 2008 2009 23,187 23,969 103,376 107,828 3,123 3,145 4% FY 1% 1 2 ~660,000 through December 31, 2009 |
 11 Short Term Investments
EFH Corp. Liquidity Management 2,700 953 1,721 1,250 851 399 490 1,161 Facility Limit LOCs/Cash Borrowings Availability 3,771 1,804 3,950 EFH Corp. (excluding Oncor) available liquidity As of 12/31/09; $ millions 4 • Liquidity does not reflect $500 million principal amount of 10% Senior Secured Notes due 2020 issued in January 2010. • Liquidity reflected in the table does not include the unlimited capacity available under the Commodity Collateral Posting Facility for ~600 million MMBtu of natural gas hedges. Cash and Equivalents TCEH Letter of Credit Facility 1 TCEH Revolving Credit Facility 2 EFH Corp. and TCEH have sufficient liquidity to meet their anticipated short-term
needs, but 1 Facility to be used for issuing letters of credit for general corporate purposes. Cash borrowings of $1.250
billion were drawn on this facility in October 2007, and, except for $115 million related to a
letter of credit drawn in June 2009, have been retained as restricted cash. Outstanding letters of credit are supported by the restricted cash. 2 Facility availability includes $141 million of undrawn commitments from a subsidiary of Lehman Brothers
that has filed for bankruptcy. These funds are only available from the fronting banks and
the swingline lender, and exclude $26 million of requested draws not funded by the Lehman subsidiary. 3 Includes $425 million cash and $65 million letter of credit investment, maturing on 3/31/10, in collateral
funding transactions with counterparties to certain interest rate swaps and commodity hedging
transactions. 4 Pursuant to the Public Utility Commission of Texas (PUC) rules, TCEH is required to maintain available
liquidity to assure adequate credit worthiness of TCEH’s retail electric provider subsidiaries, including the ability to return customer deposits, if necessary. As a result, at
12/31/09, the total availability under the TCEH credit facilities should be further reduced by $228 million. will continue to monitor market conditions to ensure financial flexibility. 3 |
 12 1 Current Maturity Profile EFH Corp. debt maturities (excluding Oncor), 2010-2020 and thereafter As of 12/31/09; $ millions 19,338 1,952 1,029 4,857 4,632 2010 2011 2012 2013 2014 2015 2016 2017 2018 2019 2020+ 309 665 251 305 20,369 2 4,880 1,973 4,672 11 TCEH-Secured EFH Corp EFCH TCEH-Revolver TCEH-Unsecured 1,500 2,545 2 267 $2.70 billion Revolving Credit Facility expires in 2013 $1.25 billion LOC Facility expires in 2014 Nov. 2009 Exchange - $115 million of New EFH Debt and $141 million of New EFIH Debt both due 2019 was exchanged for $357 million of Old Debt Nov. 2009 Exchange reduced 2017 maturities by $181 million Issued $500 million of New Debt due 2020 in Jan. 2010 Nov. 2009 Exchange reduced 2015 maturities by $143 million EFH continues to explore opportunities to improve the enterprise’s maturity profile. 983
EFIH 1 Includes amortization of the $4.1 billion Delayed Draw Term Loan and additional debt issued in May and
November 2009 related to the PIK election of the EFH and TCEH Toggle Notes. 2 Excludes borrowings under the TCEH Revolving Credit Facility maturing in 2013, the Deposit Letter of Credit
maturing in 2014 and unamortized discounts and premiums. |
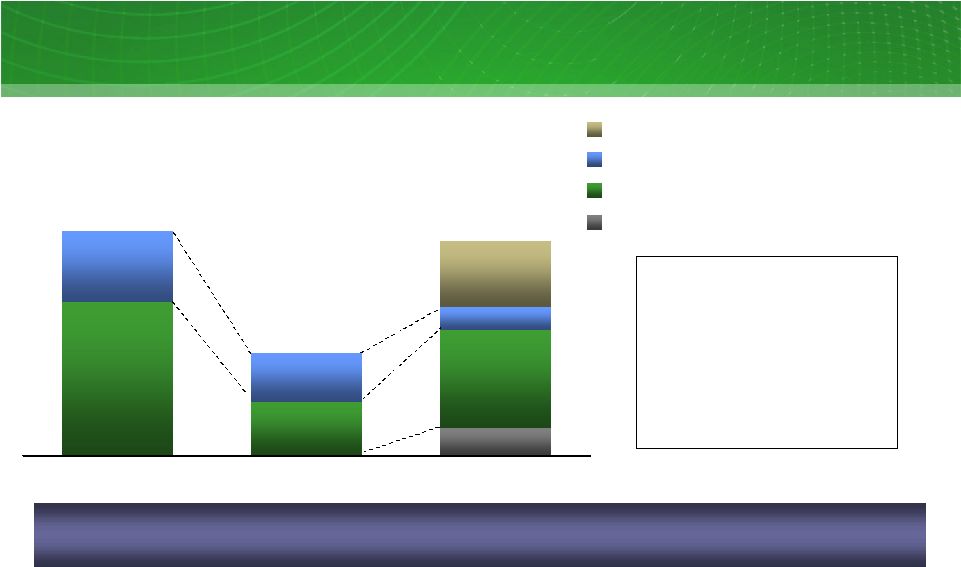
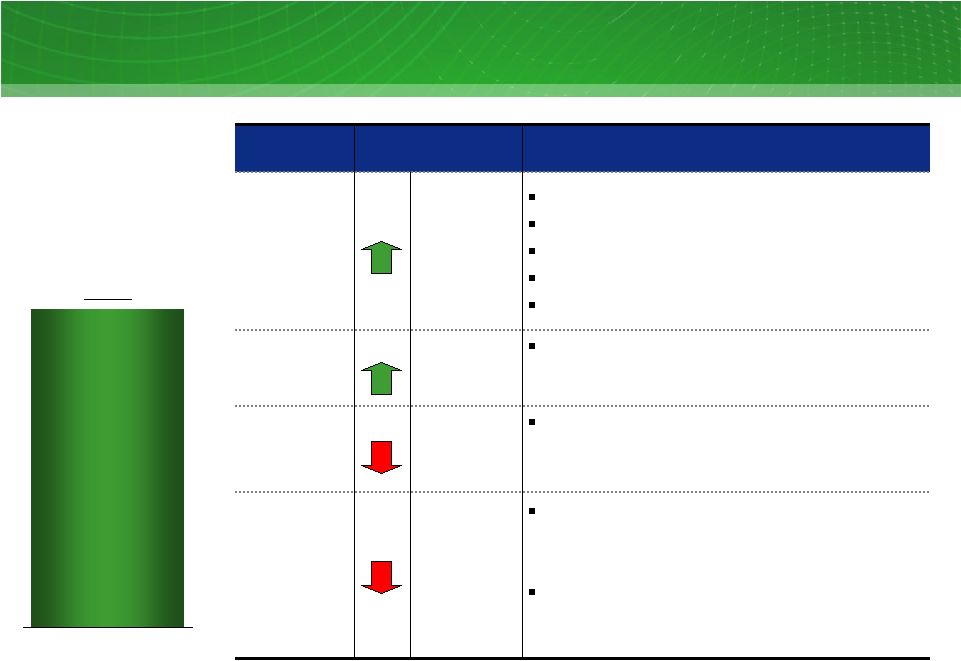 13 2010 TCEH Adjusted EBITDA (Non-GAAP) Key Drivers No Guidance for 2010 $300 - $400 $100 - $200 $0 - $100 $325 - $425 2010 Est. Impact vs. 2009 (millions) Drivers Assumptions New Build 11-13 TWh $7.80/MMBtu hedge price 7.2-7.4 heat rate $56-$58/MWh power price $34-$37/MWh margin Retail Potential retail margin improvement
driven by lower commodity environment and reduced bad debt PRB Higher delivered PRB coal costs $10-$12/ton 10-15 million tons Commodity Lower effective NG hedge $0.34/MMBtu 500-550 MMBtu Lower effective HR hedge $2-$3/MWh 60-70 TWh 1 See Appendix for Regulation G reconciliations and definitions. 2 Total new build generation for 2010. Assumes performance for initial start-up year
of operations for Oak Grove 1 and Sandow 5 and mid-year substantial completion for Oak Grove 2. Illustrative for discussion purposes 3,505 TCEH Adjusted EBITDA $ millions 2009 1 2 - - - - - - |
 14 1 Open EBITDA estimates assume generation is sold at market observed forward prices less production costs and
retail volumes are sold at market observed retail rates and historical retail profitability
percentage. Estimates exclude all impacts of natural gas and power hedging activities, specifically the impacts of the TCEH Long-Term Hedging Program and any heat rate hedges. Additionally, this calculation includes provisions for fuel
expense and O&M based on expected power generation output along with purchased power for
sales to retail customers, and SG&A based on the generation output and sales to retail customers. The inability to predict the timing and amount of future items makes a detailed reconciliation of the projections to a GAAP measure impracticable. See Appendix for
Regulation G definition. 2 Estimated wholesale power prices for 2010 are based on average ERCOT NZ prices as of 12/31/09. 3 Includes fuel (excluding nuclear fuel amortization), O&M and SG&A expenses. 4 Based on an 11¢ / kWh average residential new offer pricing as reflected on the Power to Choose
website at www.powertochoose.org and ~50 TWh of historical TXU Energy total sales. 5 Calculation assumes a 35.0% overall tax rate. TCEH Open EBITDA (Non-GAAP) Estimate 2010E % $ $/MWh $/MWh TWh Units 5-10% $5.3 - $5.7B $25 - $27 $42 - $44 72 – 78 2010E Estimated power price Assumptions Retail Revenues Profitability percentage (after tax) Wholesale Total baseload generation Average baseload cost TCEH Open EBITDA (non-GAAP) Estimate 10E: $ millions $1,600 - $2,200 1 2 3 4 5 |
 15 Today’s Agenda John Young President & CEO 2009 Review Financial and Operational Overview Q&A |
    16 Today’s Agenda EFH Corp. Senior Executive Team 2009 Review Q&A Financial and Operational Overview |
 17 Questions & Answers |
 18 Appendix – Additional Slides and Regulation G Reconciliations Appendix |
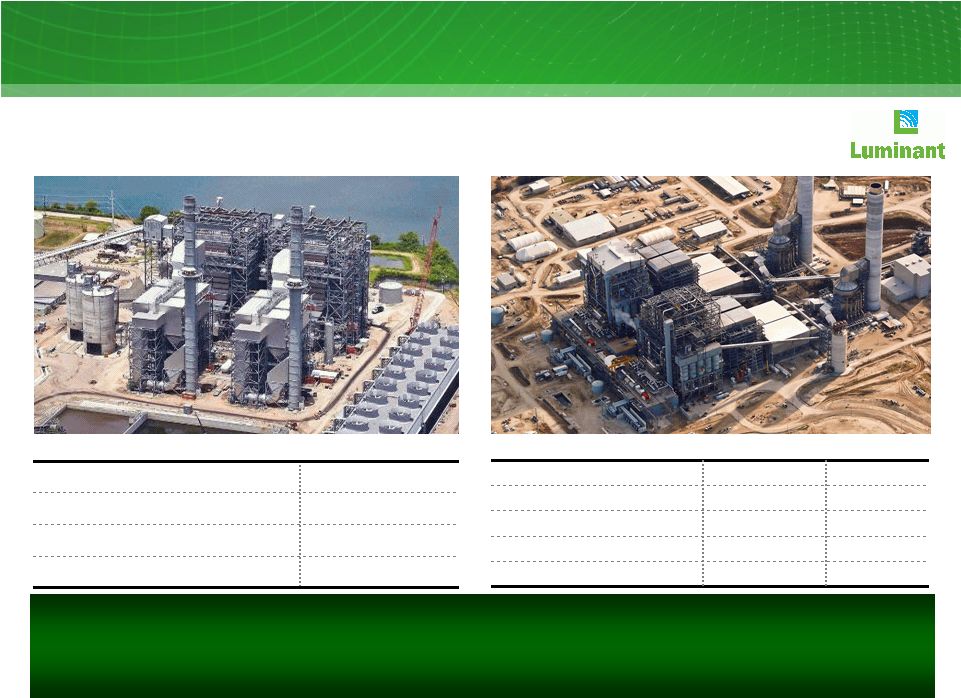 19 19 Luminant Solid-Fuel Development Program Sandow Power Plant Unit 5 Rockdale, Texas Oak Grove Power Plant Robertson County, Texas Texas lignite Texas lignite Primary fuel ~94% 100% Percent complete at 12/31/09 January 2010 August 2009 Initial synchronization December 2009 ~800 MW Unit 1 Unit 2 Estimated net capacity ~800 MW Substantial completion date Mid-2010 Estimated net capacity ~580 MW Primary fuel Texas lignite Initial synchronization July 2009 Substantial completion date September 2009 • Sandow 5 and Oak Grove 1 lignite-fueled generating units achieved substantial completion on September 30 th and December 22 nd , respectively. • Luminant’s construction of the new Oak Grove 2 lignite-fueled generating unit continues to
track on time and on budget . 1 Substantial completion date is the contractual milestone when Luminant takes over
operations of the unit from the EPC contractor. 1 1 |
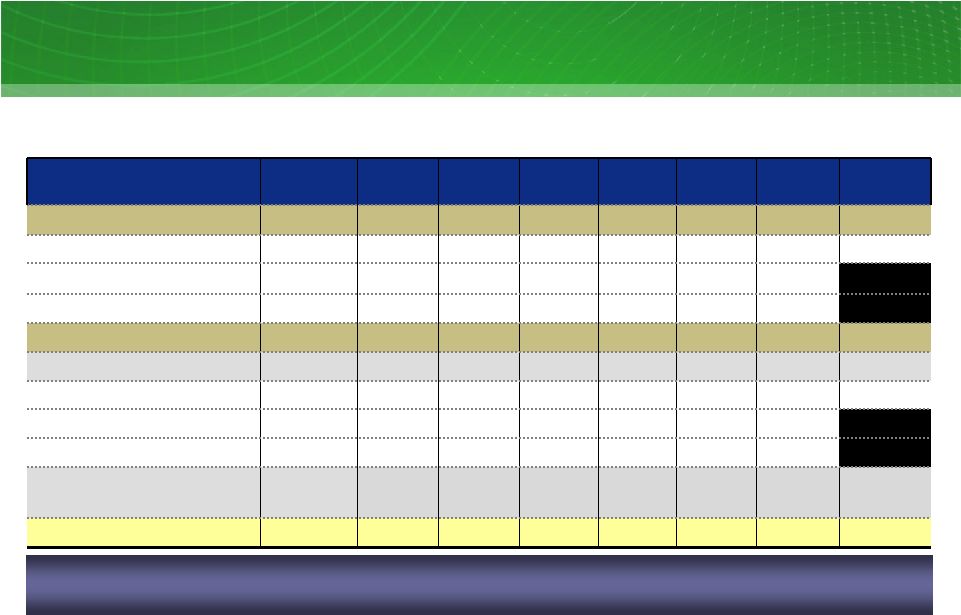 20 20 20 Unrealized Mark-To-Market Impact Of Hedging Unrealized mark-to-market impact of hedging program 12/31/09 vs. 12/31/08; mixed measures, pre-tax ~($0.4) -- -- -- -- ~$0.4 ~$6.11 ~$8.16 ~173 2009 Factor Measure 2010 2011 2012 2013 2014 Total or Avg. 12/31/08 Natural gas hedges mm MMBtu ~450 ~502 ~492 ~300 ~101 ~2,018 Wtd. avg. hedge price 1 $/MMBtu ~$7.82 ~$7.56 ~$7.36 ~$7.19 ~$7.80 Natural gas prices $/MMBtu ~$7.13 ~$7.31 ~$7.23 ~$7.15 ~$7.15 Cum. MtM gain at 12/31/08 2 $ billions ~$0.3 ~$0.0 ~$0.0 ~$0.0 ~$0.2 ~$0.9 12/31/09 Natural gas hedges 3 mm MMBtu ~240 ~447 ~490 ~300 ~97 ~1,574 Wtd. avg. hedge price 1 $/MMBtu ~$7.79 ~$7.56 ~$7.36 ~$7.19 ~$7.80 Natural gas prices $/MMBtu ~$5.79 ~$6.34 ~$6.53 ~$6.67 ~$6.84 Cum. MtM gain at 12/31/09 2 $ billions ~$0.8 ~$0.4 ~$0.4 ~$0.2 ~$0.2 ~$2.0 2009 MtM gain $ billions ~$0.5 ~$0.4 ~$0.4 ~$0.2 ~$0.0 ~$1.1 Decreases in natural gas prices during 2009 resulted in a ~$1.1 billion (~$710 million after tax) unrealized mark-to-market net gain in GAAP income for
2009. 1 Weighted average prices are based on NYMEX Henry Hub
prices of forward natural gas sales positions in the long-term hedging program (excluding the impact of offsetting purchases for rebalancing and pricing
point basis transactions). Where collars are reflected, sales price represents the collar floor price. 12/31/09 prices for 2010 represent January 1, 2010 through December 31, 2010 values. 2 MtM values include the effects of all transactions in the long-term hedging program including
offsetting purchases (for re-balancing) and natural gas basis deals. 3
As of 12/31/09. 2010 represents January 1, 2010 through December 31, 2010 volumes. Where
collars are reflected, the volumes are estimated based on the natural gas price sensitivity
(i.e., delta position) of the derivatives. The notional volumes for collars are approximately 150 million MMBtu, which corresponds to a delta position of approximately 97 million MMBtu in 2014. |
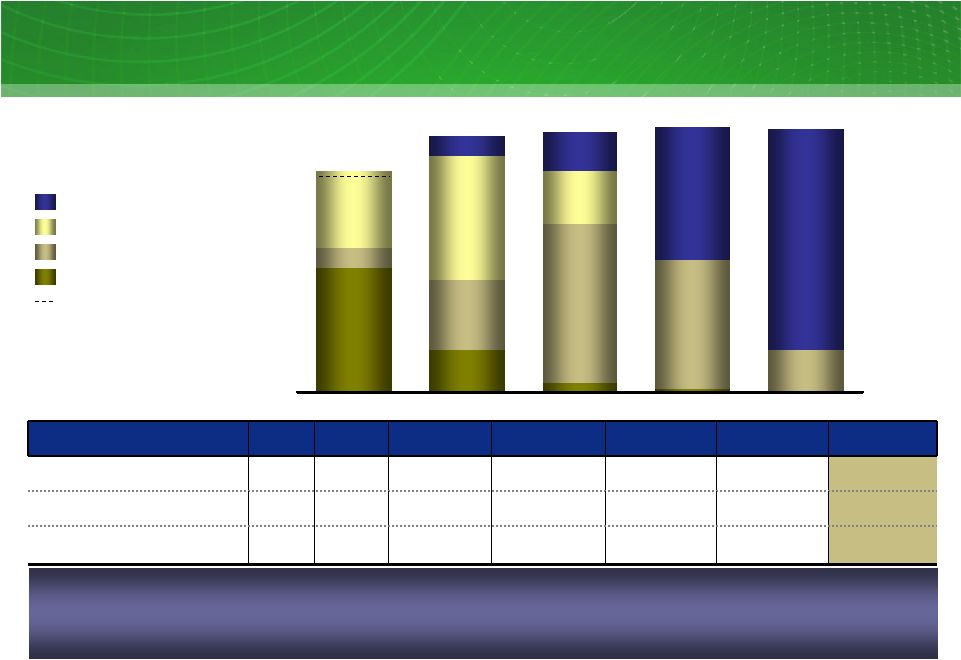 21 21 21 TCEH Natural Gas Exposure TCEH Natural Gas Position 10-14 1 ; million MMBtu Hedges Backed by Asset First Lien Open Position 1 As of 12/31/09. Balance of 2010 is from February 1, 2010 to December 31,
2010. Assumes conversion of electricity positions based on a ~8.0 heat rate with natural gas being on the margin ~75-90% of the time (i.e. when other technologies are forecast to be on the margin, no natural gas position is assumed to be generated). 2 Includes estimated retail/wholesale effects. 2010 position includes ~10 million
MMBtu of short gas positions associated with proprietary trading positions; excluding these positions, 2010 position is ~99% hedged. 286 98 22 161 366 286 124 45 89 512 590 601 5 47 97 300 177 308 501 609 613 BAL 10 2011 2012 2013 2014 100% Hedge Level ~411 — ~5 ~22 ~98 ~286 million MMBtu TXUE and Luminant net positions Factor Measure BAL 10 2011 2012 2013 2014 Total or Average Natural gas hedging program million MMBtu ~224 ~447 ~490 ~300 ~97 ~1,558 Overall estimated percent of total NG position hedged percent ~102% ~92% ~85% ~50% ~16% ~68% TXUE and Luminant Net Positions Hedges Backed by CCP 2 TCEH has hedged approximately 68% of its estimated Henry Hub-based natural gas price exposure from February 1, 2010 through December 31, 2014 . More than 99% of the NG Hedges
are supported directly by a first lien or by the TCEH Commodity Collateral Posting Facility. |
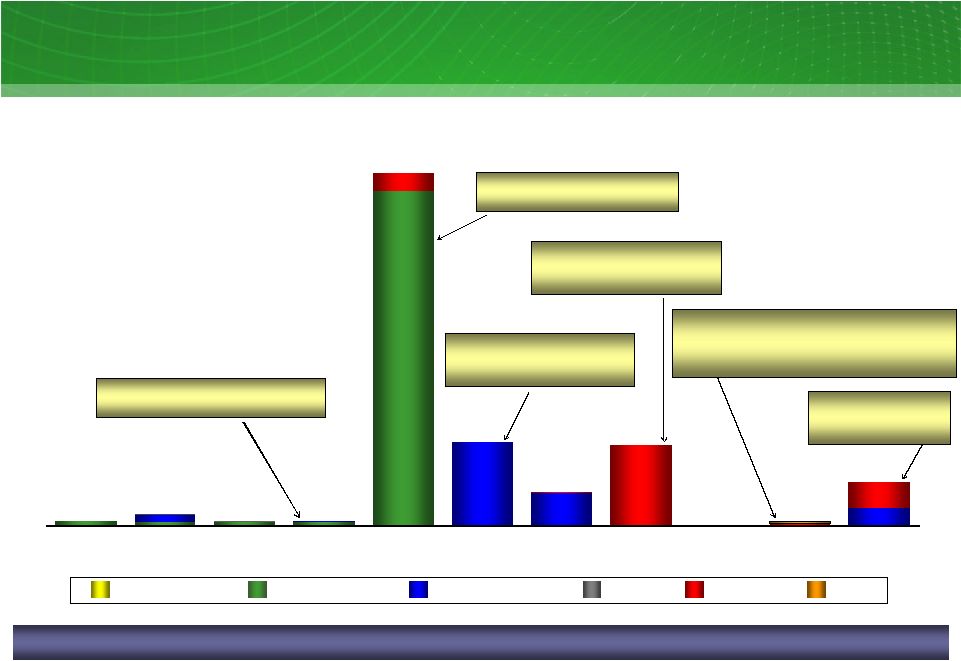
 22 22 22 EFH Corp. Adjusted EBITDA Sensitivities Commodity Percent Hedged at December 31, 2009 Change 10E Impact $ millions 7X24 market heat rate (MMbtu/MWh) ~75 0.1 MMBtu/MWh ~10 NYMEX gas price ($/MMBtu) ~100 $1/MMBtu ~9 Texas gas vs. NYMEX Henry Hub price ($/MMBtu) >95 $0.10/MMBtu ~1 Diesel ($/gallon) >95 $1/gallon ~1 Base coal ($/ton) ~90 $5/ton ~10 Nuclear fuel ($/lb) ~100 $10/lb. ~0 Generation operations Baseload generation (TWh) n.a. 1 TWh ~25 Retail operations Balance of 2010 Residential contribution margin ($/MWh) 28 TWh $1/MWh ~28 Residential consumption 28 TWh 1% ~8 Business markets consumption 23 TWh 1% ~5 Impact on EFH Corp. Adjusted EBITDA 10E; mixed measures The majority of 2010 commodity-related risks are significantly mitigated. 3,4 3 2 5 6 1 1 2010 estimate based on commodity positions as of 12/31/09, net of long-term hedges and wholesale/retail
effects, excludes gains and losses incurred prior to December 31, 2009. See Appendix for
definition. 2 Simplified representation of heat rate position in a single TWh position. In reality, heat rate
impacts are differentiated across plants and respective pricing periods: baseload (linked primarily to changes in North Zone 7x24), natural gas plants (primarily North Zone 5x16) and wind
(primarily West Zone 7x8). 3 Assumes conversion of electricity positions based on a ~8.0 market heat rate with natural gas being on the
margin ~75-90% of the time (i.e., when coal is forecast to be on the margin, no natural gas
position is assumed to be generated). 4 The percentage hedged represents the amount of estimated natural gas exposure based on Houston Ship Channel
(HSC) gas price sensitivity as a proxy for Texas gas price. 5 Includes positions related to fuel surcharge on rail transportation. 6 Excludes fuel surcharge on rail transportation. |
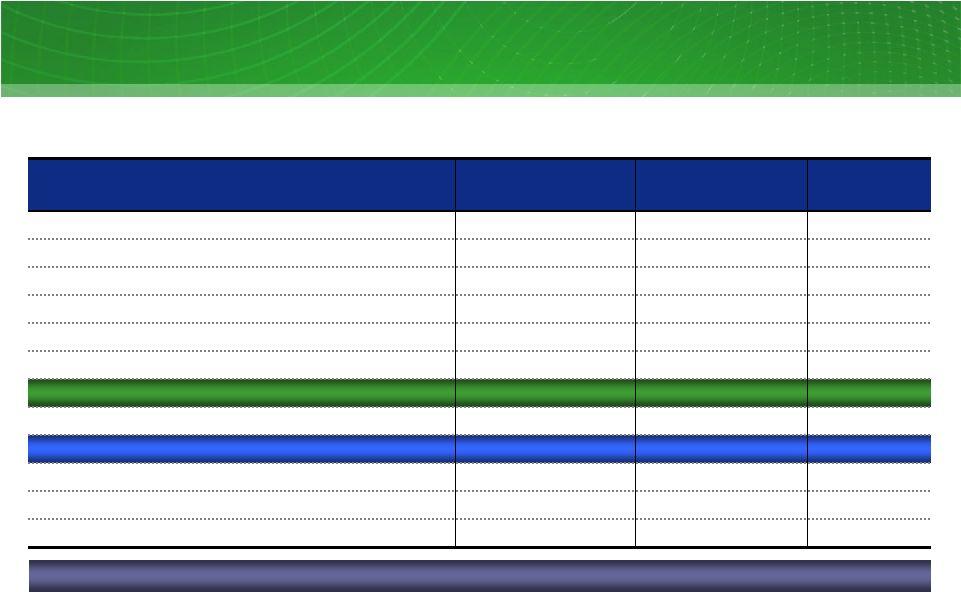
 23 23 23 Commodity Prices 2.94% $9.28 $1.85 $40.88 6.92 $5.93 $6.38 Q4 08 Actual Commodity Units Q4 09 Actual FY 09 Actual BOY 10E NYMEX gas price $/MMBtu $4.26 $3.92 $5.79 HSC gas price $/MMBtu $4.25 $3.75 $5.73 7x24 market heat rate (HSC) MMbtu/MWh 7.52 8. 09 7.49 North Zone 7x24 power price $/MWh $31.68 $29.78 $42.84 Gulf Coast ultra-low sulfur diesel $/gallon $1.96 $1.66 $2.17 PRB 8400 coal $/ton $7.18 $9.15 $8.50 LIBOR interest rate percent 0.52% 1.11% 0.98% Commodity prices 1 Q4 08, Q4 09, FY 09 and BOY 10E; mixed measures 1 BOY 10 estimate based on commodity prices as of 12/31/09 for January 2010 through
December 2010. 2 Based on NYMEX forward curve 3 Based on market clearing price for energy 2 3 |
 24 Operating revenues less fuel, purchased power costs, and delivery fees, plus or minus net gain (loss) from
commodity hedging and trading activities, which on an adjusted (non-GAAP) basis,
exclude unrealized gains and losses. The purchase method of accounting for a business
combination as prescribed by GAAP, whereby the purchase price of a business combination is
allocated to identifiable assets and liabilities (including intangible assets) based upon their fair values. The excess of the purchase price over the fair values of assets and liabilities is recorded as goodwill. Depreciation
and amortization due to purchase accounting represents the net increase in such noncash
expenses due to recording the fair market values of property, plant and equipment, debt and
other assets and liabilities, including intangible assets such as emission allowances, customer relationships and sales and purchase contracts with pricing favorable to market prices at the date of the Merger.
Amortization is reflected in revenues, fuel, purchased power costs and delivery fees,
depreciation and mortization, other income and interest expense in the income statement. Open EBITDA estimates assume generation is sold at market observed forward prices less production costs and
retail volumes are sold at market observed retail rates and historical retail
profitability percentage. Estimates exclude all impacts of natural gas and power hedging activities, specifically the impacts of the TCEH Long-Term Hedging Program and any heat rate hedges.
Additionally, this calculation includes provisions for fuel expense and O&M based on
expected power generation output along with purchased power for sales to retail customers, and SG&A based on the generation output and sales to retail customers. Financial Definitions Refers to the results of the Regulated Delivery segment, which consists of Oncor.
Regulated Delivery segment Results Open EBITDA (non-GAAP) Refers to the combined results of the Competitive Electric segment and Corporate &
Other. Contribution Margin (non- GAAP) Net income (loss) from continuing operations before interest expense and related charges,
and income tax expense (benefit) plus depreciation and amortization.
EBITDA (non-GAAP) Generally accepted accounting principles. GAAP Purchase Accounting Net income (loss) adjusted for items representing income or losses that are not
reflective of underlying operating results. These items include unrealized mark-to-market gains and losses, noncash impairment charges and other
charges, credits or gains that are unusual or nonrecurring. EFH Corp.
uses adjusted (non-GAAP) operating earnings as a measure of performance and believes that analysis of its business by external users is enhanced by visibility to both net income (loss) prepared in accordance with
GAAP and adjusted (non-GAAP) operating earnings (losses). Adjusted (non-GAAP) Operating Results EBITDA adjusted to exclude interest income, noncash items, unusual items, interest
income, income from discontinued operations and other adjustments allowable
under the EFH Corp. Senior Notes bond indenture. Adjusted EBITDA plays an important role in respect of certain covenants contained in the EFH Corp. Senior Notes. Adjusted EBITDA is not intended
to be an alternative to GAAP results as a measure of operating performance or
an alternative to cash flows from operating activities as a measure of liquidity or an alternative to any other measure of financial performance presented in accordance with GAAP, nor is it intended to be used
as a measure of free cash flow available for EFH Corp.’s discretionary
use, as the measure excludes certain cash requirements such as interest payments, tax payments and other debt service requirements. Because not all companies use identical calculations, Adjusted EBITDA
may not be comparable to similarly titled measures of other companies.
Adjusted EBITDA (non-GAAP) Definition Measure Competitive Business Results |
 25 Table 1: EFH Corp. Adjusted EBITDA Reconciliation Twelve Months Ended December 31, 2008 and 2009 $ millions (10) - Amortization of ”day one” net loss on Sandow 5 power purchase agreement (87) - Net gain on debt exchange offers 64 (160) Net income (loss) attributable to noncontrolling interests 3 - EBITDA amount attributable to consolidated unrestricted subsidiaries (1,225) (2,329) Unrealized net (gain) loss resulting from hedging transactions 29 1,221 8,000 460 76 (27) 1,582 (496) (3,764) 1,610 4,935 (471) (9,838) FY 08 12 Losses on sale of receivables 90 Impairment of goodwill 42 Impairment of assets and inventory write-down 4 346 Purchase accounting adjustments (45) Interest income 95 Amortization of nuclear fuel Adjustments to EBITDA (pre-tax): (1,354) Oncor EBITDA 216 Oncor distributions/dividends 2,912 Interest expense and related charges 5,377 1,754 367 344 FY 09 Net income (loss) attributable to EFH Corp. Income tax expense (benefit) Depreciation and amortization EBITDA Factor Note: Table and footnotes to this table continue on following page 1 2 3 |
 26 1 2008 amount includes $1.253 billion distribution proceeds from the sale of Oncor noncontrolling
interests. 2 Includes amortization of the intangible net asset value of retail and wholesale power sales agreements,
environmental credits, coal purchase contracts, nuclear fuel contracts and power purchase
agreements and the stepped-up value of nuclear fuel. Also includes certain credits not recognized in net income due to purchase accounting. 3 2009 amount reflects the completion in the first quarter of 2009 of the fair value calculation supporting
the goodwill impairment charge that was recorded in the fourth quarter of 2008.
4 Includes impairment of emissions allowances and trade name intangible assets, impairment of land and the
natural gas-fueled generation fleet and charges related to the cancelled development of
coal-fueled generation facilities. 5 Accounted for under accounting standards related to stock compensation and exclude capitalized amounts.
6 Includes amounts incurred related to outsourcing, restructuring and other amounts deemed to be in excess of
normal recurring amounts. 7 Includes professional fees primarily for retail billing and customer care systems enhancements and
incentive compensation. 8 Includes costs related to the Merger and abandoned strategic transactions, outsourcing transition costs,
administrative costs related to the cancelled program to develop coal-fueled facilities, the
Sponsor management fee, costs related to certain growth initiatives and costs related to the Oncor sale of noncontrolling interests. 9 Includes the amount received for property damage to certain mining equipment. 10 2009 amount primarily represents reversal of certain liabilities accrued in purchase accounting and
recorded as other income, partially offset by restructuring and nonrecurring activities.
2008 amount includes a litigation accrual, a charge related to the bankruptcy of a subsidiary of Lehman Brothers Holdings Inc., and other restructuring initiatives and nonrecurring activities. 11 Reflects noncapital outage costs. - (21) Insurance settlement proceeds 9 4,857 1,123 3,734 100 (14) 81 22 10 11 FY 09 4,578 (267) 4,845 100 35 64 45 3 27 FY 08 Severance expense 6 Non-cash compensation expense 5 Adjusted EBITDA per Incurrence Covenant Adjusted EBITDA per Restricted Payments Covenant Expenses incurred to upgrade or expand a generation station 11 Add back Oncor adjustments Transaction and merger expenses 8 Transition and business optimization costs 7 Restructuring and other 10 Factor Table 1: EFH Adjusted EBITDA Reconciliation (continued from previous page) Twelve Months Ended December 31, 2008 and 2009 $ millions |
 27 Table 2: TCEH Adjusted EBITDA Reconciliation Twelve Months Ended December 31, 2008 and 2009 $ millions 3 10 29 - - (2,329) - 1,210 8,000 413 76 (60) (4,263) 1,092 3,918 (411) (8,862) FY 08 6 Corp. depreciation, interest and income tax expense included in SG&A 12 Losses on sale of receivables (10) Amortization of ”day one” net loss on Sandow 5 power purchase agreement 10 Severance expense 5 1 Non-cash compensation expense 4 70 Impairment of goodwill 3 EBITDA amount attributable to consolidated unrestricted subsidiaries 36 Impairment of assets and inventory write-down 299 Purchase accounting adjustments (64) Interest income 95 Amortization of nuclear fuel (1,225) Unrealized net (gain) loss resulting from hedging transactions Adjustments to EBITDA (pre-tax): 1,833 Interest expense and related charges 4,161 1,172 447 709 FY 09 Net income (loss) Income tax expense (benefit) Depreciation and amortization EBITDA Factor Note: Table and footnotes to this table continue on following page 3 2 1 |
 28 Table 2: TCEH Adjusted EBITDA Reconciliation (continued from previous page) Twelve Months Ended December 31, 2008 and 2009 $ millions - (21) Insurance settlement proceeds 8 3,507 15 250 3,242 100 31 10 33 FY 08 25 Transition and business optimization costs 6 5 Transaction and merger expenses 7 38 Other adjustments allowed to determine Adjusted EBITDA per Maintenance Covenant 11 3,505 Adjusted EBITDA per Incurrence Covenant 3,634 Adjusted EBITDA per Maintenance Covenant 100 Expenses incurred to upgrade or expand a generation station 10 91 Expenses related to unplanned generation station outages 10 (19) FYD 09 Restructuring and other 9 Factor 1 Includes amortization of the intangible net asset value of retail and wholesale power
sales agreements, environmental credits, coal purchase contracts, nuclear fuel contracts and power purchase agreements and the stepped up value of nuclear fuel. Also includes certain credits not recognized in net income due to purchase accounting. 2 2009 amount reflects the completion in the first quarter of 2009 of the fair value calculation supporting the goodwill impairment charge that was recorded in the fourth quarter of 2008. 3 Includes impairment of emission allowances and trade name intangible assets and
impairment of land and the natural gas-fueled generation fleet. 4
Accounted for under accounting standards related to stock compensation and excludes
capitalized amounts. 5 Includes amounts incurred related to outsourcing, restructuring and other amounts deemed
to be in excess of normal recurring amounts. 6 Includes professional fees primarily for retail billing and customer care systems
enhancements and incentive compensation. 7 Includes costs related to the Merger, outsourcing transition costs and costs related to
certain growth initiatives. 8 Includes the amount received for property damage to certain mining equipment. 9 2009 amount primarily represents reversal of certain liabilities accrued in purchase accounting and recorded as other income, partially offset by restructuring and nonrecurring activities. 2008 amount includes a charge related to the bankruptcy of a subsidiary of Lehman Brothers Holdings Inc. and other restructuring initiatives and nonrecurring activities. 10 Reflects noncapital outage costs. 11 Primarily pre-operating expenses related to Oak Grove and Sandow 5 generation facilities. |
 29 Purchase accounting adjustments consist of amounts related to the accretion of an adjustment (discount) to
regulatory assets resulting from purchase accounting. 1 Table 3: Oncor Adjusted EBITDA Reconciliation Twelve Months Ended December 31, 2008 and 2009 $ millions - 860 Impairment of goodwill (43) (45) Interest income 1,315 1 (43) 542 492 316 221 (487) FY 08 (39) Purchase accounting adjustments 1 1,396 EBITDA 1,339 Adjusted EBITDA 25 Transition and business optimization costs and other 346 Interest expense and related charges 557 173 320 FY 09 Net income Income tax expense Depreciation and amortization Factor |