Attached files
Table of Contents
UNITED STATES
SECURITIES AND EXCHANGE COMMISSION
Washington, D.C. 20549
Form 10-K
(Mark One)
| þ | ANNUAL REPORT PURSUANT TO SECTION 13 OR 15(d) OF THE SECURITIES EXCHANGE ACT OF 1934 |
For the fiscal year ended December 31, 2009
or
| ¨ | TRANSITION REPORT PURSUANT TO SECTION 13 OR 15(d) OF THE SECURITIES EXCHANGE ACT OF 1934 |
For the transition period from to
Commission file number 1-14601
Arch Chemicals, Inc.
(Exact name of registrant as specified in its charter)
| Virginia | 06-1526315 | |
| (State or other jurisdiction of incorporation or organization) |
(I.R.S. Employer Identification No.) | |
| 501 Merritt 7 Norwalk, CT |
06851 | |
| (Address of principal executive offices) | (Zip Code) | |
Registrant’s telephone number, including area code:
(203) 229-2900
Securities registered pursuant to Section 12(b) of the Act:
| Title of each class |
Name of each exchange on which registered | |
| Common Stock | New York Stock Exchange |
Securities Registered Pursuant to Section 12(g) of the Act: None
Indicate by check mark if the registrant is a well-known seasoned issuer, as defined in Rule 405 of the Securities Act. Yes þ No .
Indicate by check mark if the registrant is not required to file reports pursuant to Section 13 or Section 15(d) of the Act. Yes ¨ No þ.
Indicate by check mark whether the registrant (1) has filed all reports required to be filed by Section 13 or 15(d) of the Securities Exchange Act of 1934 during the preceding 12 months (or for such shorter period that the registrant was required to file such reports), and (2) has been subject to such filing requirements for the past 90 days. Yes þ No ¨.
Indicate by check mark whether the registrant has submitted electronically and posted on its corporate Web site, if any, every Interactive Data File required to be submitted and posted pursuant to Rule 405 of Regulation S-T (§232.405 of this chapter) during the preceding 12 months (or for such shorter period that the registrant was required to submit and post such files). Yes ¨ No ¨.
Indicate by check mark if disclosure of delinquent filers pursuant to Item 405 of Regulation S-K (§229.405 of this chapter) is not contained herein, and will not be contained, to the best of registrant’s knowledge, in definitive proxy or information statements incorporated by reference in Part III of this Form 10-K or any amendment to this Form 10-K. þ
Indicate by check mark whether the registrant is a large accelerated filer, an accelerated filer, a non-accelerated filer or a smaller reporting company. See the definitions of “large accelerated filer,” “accelerated filer” and “smaller reporting company” in Rule 12b-2 of the Exchange Act. (Check One)
Large accelerated filer þ Accelerated filer ¨ Non-accelerated filer ¨ (do not check if a smaller reporting company) Smaller reporting company ¨
Indicate by check mark whether the registrant is a shell company (as defined in Rule 12b-2 of the Act). Yes ¨ No þ.
As of June 30, 2009, the aggregate market value of registrant’s voting and non-voting common equity held by non-affiliates of registrant was $826,669,937.
As of January 31, 2010, 25,096,529 shares of the registrant’s common stock were outstanding.
DOCUMENTS INCORPORATED BY REFERENCE
Portions of the following documents are incorporated by reference in this Form 10-K as indicated herein:
| Document |
Part of Form 10-K into which incorporated | |
| Proxy Statement relating to Arch’s 2010 Annual Meeting of Shareholders |
Part III |
Table of Contents
FORM 10-K
| Page No. | ||||
| PART I | ||||
| Item 1 |
1 | |||
| Item 1A |
11 | |||
| Item 1B |
18 | |||
| Item 2 |
19 | |||
| Item 3 |
22 | |||
| Item 4 |
22 | |||
| PART II | ||||
| Item 5 |
24 | |||
| Item 6 |
26 | |||
| Item 7 |
Management’s Discussion and Analysis of Financial Condition and Results of Operations |
29 | ||
| Item 7A |
58 | |||
| Item 8 |
60 | |||
| Item 9 |
Changes in and Disagreements With Accountants on Accounting and Financial Disclosure |
109 | ||
| Item 9A |
109 | |||
| Item 9B |
110 | |||
| PART III | ||||
| Item 10 |
111 | |||
| Item 11 |
111 | |||
| Item 12 |
Security Ownership of Certain Beneficial Owners and Management and Related Stockholder Matters |
111 | ||
| Item 13 |
Certain Relationships and Related Transactions, and Director Independence |
112 | ||
| Item 14 |
112 | |||
| PART IV | ||||
| Item 15 |
113 | |||
Table of Contents
| Item 1. | Business |
General
Arch Chemicals, Inc. (“Arch”, the “Company” or “We”) is a global biocides company providing chemistry-based and related solutions to destroy and control the growth of harmful microbes selectively. We are focused on delivering profitable global growth driven by innovation. Our focus is in water treatment, hair and skin care products, wood treatment, preservation and protection applications such as for paints and building products, and health and hygiene applications. The principal business segments in which we compete are Treatment Products and Performance Products. Our ability and willingness to provide superior levels of technical service, chemical formulation skills, regulatory expertise and customer support, the manufacturing flexibility of many of our facilities, and the cultivation of close customer relationships are the core skills on which we rely to serve our global markets and customers.
The Company was organized under the laws of the Commonwealth of Virginia on August 25, 1998 as a wholly owned subsidiary of Olin Corporation (“Olin”) for the purpose of effecting a tax-free distribution of Olin’s specialty chemical businesses (the “Distribution”) to the shareholders of Olin. The Distribution occurred on February 8, 1999 (the “Distribution Date”) upon which the Company became a separate, independent, publicly-held corporation.
The term “Company,” “We” or “Our” as used in Parts I and II of this Report means Arch Chemicals, Inc. and its subsidiaries unless the context indicates otherwise. The Company’s products and services described in this Report may be sold, distributed, manufactured or provided by Arch Chemicals, Inc. or by one or more of its subsidiaries, affiliates, or joint ventures.
We make available through our Internet website, which is located at http://www.archchemicals.com, our Annual Report on Form 10-K, our Quarterly Reports on Form 10-Q, our Current Reports on Form 8-K, and amendments to those reports filed or furnished pursuant to Section 13(a) or 15(d) of the Securities Exchange Act of 1934 as soon as reasonably practicable after they are electronically filed with or furnished to the Securities and Exchange Commission (“SEC”). We do not charge any fees to view, print or access these reports on our website. Interested persons may read and copy these reports, proxy statements and other information at the SEC’s Public Reference Room at 100 F Street, N.E., Washington, D.C. 20549 and may obtain information on the operation of the Public Reference Room by calling the SEC at 1-800-SEC-0330. The SEC also maintains an Internet website, located at http://www.sec.gov, that contains reports, proxy statements and other information regarding registrants, such as the Company.
2009 Developments
On January 29, 2009, our shareholder rights plan (Series A Participating Cumulative Preferred Stock Purchase Rights) expired and was not replaced.
We entered into an unsecured Credit Agreement dated as of February 13, 2009 (the “Credit Agreement”), with the lenders party thereto, Bank of America, N.A., as administrative agent, RBS Citizens, N.A., as syndication agent, KeyBank, N.A. and Wachovia Bank, N.A., as co-documentation agents, and Banc of America Securities LLC and Greenwich Capital Markets, Inc., as joint lead arrangers and joint book managers. The Company borrowed $100 million under the Credit Agreement, which matures on June 15, 2011. The Credit Agreement permits the maximum borrowing amount to be increased from $100 million up to a maximum of $125 million, subject to additional lender commitments. The Credit Agreement is subject to quarterly amortization of principal equal to 5% of the principal amount of the Credit Agreement beginning September 30, 2009. The Credit Agreement contains various representations and financial and other covenants that are consistent with our previously existing revolving credit agreement, including (i) an interest coverage ratio covenant and leverage ratio covenant and (ii) a restricted payments covenant. The restricted payments covenant restricts the payment of dividends and the repurchase of Company shares to $65 million plus 50 percent of
1
Table of Contents
cumulative adjusted net income (loss) for the period beginning June 15, 2006. The Credit Agreement also contains standard events of default (the occurrence of which may trigger an acceleration of amounts outstanding under the Credit Agreement).
On August 28, 2009, we entered into a Note Purchase and Private Shelf Agreement (the “Shelf Agreement”) with Prudential Investment Management, Inc. (“Prudential”), Gibraltar Life Insurance Co., Ltd, United of Omaha Life Insurance Company and Prudential Retirement Insurance and Annuity Company. Pursuant to the Shelf Agreement, we issued $75 million aggregate principal amount of its Series A Senior Notes (the “Notes”). The Notes bear interest at a rate of 6.70% per annum and mature on August 28, 2016. The Shelf Agreement contains customary events of default (the occurrence of which may result in all of the Notes then outstanding becoming immediately due and payable) and covenants related to limitations on indebtedness and the maintenance of certain financial ratios consistent with those in our existing Credit Agreement dated February 13, 2009. Proceeds from the issuance of the Notes were used to pay down debt and for general corporate purposes.
The Shelf Agreement provides for the purchase, prior to August 2012, of additional senior promissory notes (“Shelf Notes”) in amounts to be agreed up to a maximum amount of $75 million on terms to be determined. The Shelf Notes will have a maturity date of no more than ten years from the date of issuance, and an average life of no more than seven years and such other terms, including interest rate, as the parties may agree upon.
On October 6, 2009, we entered into an accounts receivable securitization program with Market Street Funding LLC and PNC Bank, National Association (“PNC Bank”) by way of an assignment and assumption of our then existing program with Three Pillars Funding LLC and SunTrust Capital Markets, Inc. Under the Amended and Restated Receivables Sale Agreement, dated as of October 6, 2009, we will continue to sell, without recourse, certain accounts receivable to our wholly owned subsidiary, Arch Chemicals Receivables Corp. (“ACRC”), a special-purpose corporation. Under the Amended and Restated Receivables Purchase Agreement, dated as of October 6, 2009, ACRC will sell, on an ongoing basis, these accounts receivable to Market Street Funding LLC. The amount of funding that can be received under the program is subject to change based on the level of eligible receivables with a maximum amount of $80 million. PNC Bank will act as administrator for Market Street Funding LLC under the program. Market Street Funding LLC will fund its purchases through the issuance of commercial paper or borrowings from PNC Bank under a liquidity facility. The Amended and Restated Receivables Purchase Agreement and the liquidity facility expire on October 5, 2010, subject to renewal on the initial or any subsequent expiration date for an additional 364 days. We agreed to provide servicing for the accounts receivable collections.
Products and Services
Our products and services fall within two business segments: Treatment Products and Performance Products. For financial information about each of our segments, and foreign and domestic and export sales and long-lived assets, see Note 18 of Notes to Consolidated Financial Statements contained in Item 8 of this Report. The principal products of each of our businesses are described below. For customer concentrations, see “Business and Credit Concentrations” contained in Note 1 of Notes to Consolidated Financial Statements contained in Item 8 of this Report.
Treatment Products
Within our Treatment Products segment, we manufacture and sell water treatment chemicals, industrial and personal care biocides and specialty ingredients, and wood treatment chemicals and industrial coatings and related services.
HTH Water Products. We sell chemicals and equipment on a worldwide basis for the sanitization and treatment of residential and commercial pool and spa water, drinking water, surface water and water used in industrial applications. We sell both chlorine-based products (calcium hypochlorite and chlorinated
2
Table of Contents
isocyanurates) and non-chlorine-based products (poly (hexamethylene biguanide) hydrochloride (“PHMB”)) as sanitizers. Our pool chemical products are sold primarily under the widely recognized HTH® brand name, the POOLIFE® brand name, the Baquacil® and Baqua Spa® brand names and the Advantis brand names of GLB® Pool & Spa® and Leisure Time®. We also sell commercial pool products under the Pulsar® brand name. Our water chemical products are also distributed as private label brands. In addition to calcium hypochlorite-, chlorinated isocyanurate- and PHMB-based water sanitizing chemicals, we sell ancillary chemicals and accessories for the maintenance of residential and commercial pools and spas, such as algaecides, clarifiers, foam reducers, stain preventers, feeders, fragrances and test strips. We are a leading worldwide producer and seller of calcium hypochlorite with various concentrations of available chlorine. We have a competitive advantage through the ownership of strong brand names as well as in part through ownership of several patents covering the manufacture and use of pool chemicals and equipment. We are a major manufacturer and seller of PHMB-based pool and spa treatment chemicals that are sold primarily to U.S. pool and spa owners through an extensive network of authorized, independent retailers, rather than through mass market retailers.
Our water products are also sold in the municipal water market for the purification of potable water. We sell calcium hypochlorite to purify potable water in a number of countries outside the U.S. and for sanitization in the food preparation market in the U.S., Latin America and South Africa. We are working to expand our presence in the municipal and industrial water market both domestically and internationally and in the food sanitization market.
Our surface water business manufactures a range of branded products, including products under the Applied Biochemists® brand name, and provides technical support for controlling algae and nuisance aquatic vegetation. End-use applications include turf and ornamental (golf course and park) ponds, agricultural irrigation, potable water reservoirs, wastewater systems, industrial water supplies, aquaculture facilities, and private lakes and ponds of homeowners. Contract services for aquatic vegetation control and lake and pond management technologies are also provided from several branch locations around the U.S.
In 2009, approximately 65% of our water products sales were within North America, and the remaining 35% were throughout the rest of the world. In North America, we sell water chemical products to retail merchants, distributors and pool dealers. Our Brazilian subsidiary, Arch Quimica Brasil Ltda., manufactures and distributes calcium hypochlorite and other water chemical products in Brazil and other South American countries.
In Europe, we package and sell chemicals, equipment and accessories for pools and spas mainly in France and the United Kingdom (“U.K.”). In South Africa, we manufacture and sell chemicals, equipment and accessories for pools and spas mainly through our wholly owned subsidiary, Arch Water Products South Africa (Proprietary) Limited, which also operates a calcium hypochlorite plant.
Personal Care and Industrial Biocides. We are a leading global supplier of biocides for preservation of industrial and consumer products. We manufacture biocides that control dandruff on the scalp and, in various other applications, the growth of micro-organisms, particularly fungi and algae. We also develop, manufacture and market biocides for anti-bacterial applications. Most of our biocide products are marketed under well-recognized trademarks, such as Omadine®, Omacide®, Triadine®, Proxel®, Purista®, Vantocil®, Reputex®, Cosmocil® and Densil® biocides. A large portion of the biocide chemicals we produce are based on the zinc, sodium and copper salts of the pyrithione molecule. These pyrithione-based biocides include over twenty products with differing active concentrations, forms and salts, and we believe we are a worldwide leader in these biocide products. Our other biocide chemicals are based on iodopropargyl-n-butylcarbamate (“IPBC”), a broad-spectrum fungicide serving the metalworking fluids and coatings markets. The IPBC-based biocides currently consist of five variations with others in development stages. Our offerings also include two well-established molecules—1,2 benzisothiazolin (“BIT”) and PHMB. We are a leading seller of BIT, which we source from China, and PHMB into the global biocides market and supply biocides used in health and hygiene applications. Biocides make up a small portion of the content of the customer’s end products, and therefore must be highly
3
Table of Contents
effective at low concentrations as well as compatible with the formulation’s other components. Meeting the biocide customer’s needs requires a high degree of technical support and the expertise to do business in a highly regulated environment. Our ability to meet these needs makes us a preferred supplier in the biocides market. We have a U.S. Environmental Protection Agency registration for our biocides used in consumer products which utilize our Purista® brand. We also participate in the personal care market with products sold primarily to manufacturers in the global cosmetic, toiletries and personal care ingredients industries. We provide these customers with biotechnological and other active ingredients, delivery systems, preservation systems, proteins, botanicals and functional ingredients, primarily for use in skin and hair care formulations.
Wood Protection and Industrial Coatings. We are a leading producer of wood treatment chemical solutions that enhance the properties of wood. These products are critical to the performance and value of end-use products. Our wood preservatives and fire retardants are sold under the brand names Wolman®, Dricon®, Tanalith®, Vacsol™, and Resistol™ in markets around the world. These products protect wood against rot, fungal decay, or termites and other insects or retard the combustibility of wood. Our principal customers are sawmills and treaters of softwoods that require chemical treatment, thus giving softwoods the performance of naturally durable wood species in service.
In the U.S. and Canada, the majority of our customers are wood treaters that use our products pursuant to a license agreement. The program includes the use of the brand name for sale of the products produced by the licensee as well as an extensive support package comprised of marketing, technical, engineering and environmental services. Our customers sell their treated wood products into the construction, utility, residential and agricultural markets. We supply our chromated copper arsenate wood preservative (“CCA”) products for industrial applications such as the treatment of wood used in marine pilings, utility poles and highway materials. Our Wolman® E and Tanalith® E patented products are offered to treaters and are used in non-industrial applications. In 2005, the Good Housekeeping Institute announced that Genuine Wolmanized® Outdoor® wood, a product which is based on our patented copper azole chemistry, earned the Good Housekeeping Seal. This wood is used in decks, gazebos, walkways, landscaping and other exposed projects. Additionally, in 2006, wood treated with our Dricon® fire retardant also earned the Good Housekeeping Seal.
In Asia-Pacific, our sales are primarily in Australia and New Zealand, where our local subsidiaries manufacture and distribute wood treatment chemicals.
We also manufacture and sell a wide range of industrial wood coatings for a variety of applications in markets primarily located in Europe. These finishes are primarily industrial-applied or consumer-applied products for the surface decoration and protection of wood, including stains, polyester-based and polyurethane-based coatings, and water-based coatings and UV systems that incorporate newer technology. These coatings products are sold primarily under the brand names Sayerlack® and LineaBlu®. The major applications for these products include home and office furniture, window and door frames, picture frames, and other specialty applications. We have a strong presence in several areas of Europe, including the strategic Italian market, France, and the U.K. We also have operations in Spain and sales and technical support facilities in the U.S. and Singapore that support sales efforts in North America and Asia. Major customers for these coatings require a high degree of applications assistance, and the development of a total coatings solution, including product development, is key to the growth of this business. As a result, we have many long-standing customers and our customer base includes many of the leading furniture and joinery manufacturers in Europe.
Performance Products
Performance Urethanes. Our Performance Products segment manufactures and sells a broad range of urethane intermediate products with diverse end uses. Our urethanes products impart physical characteristics that are critical to the performance and value of the customer’s end-use products. Custom manufacturing services are also provided. The business is characterized by close customer relationships with entities who are leaders in the markets in which they compete. The flexibility afforded by batch manufacturing in some operations, combined with our ability and willingness to provide superior technical support, enables us to respond to the specific needs
4
Table of Contents
of a diverse group of customers. This gives us an advantage over competitors whose manufacturing processes and related cost structure constrain their ability to respond cost effectively to smaller volume customers.
Our performance urethane products business includes flexible polyols, specialty polyols, glycols and glycol ethers. Specialty polyols, which are used as ingredients in elastomers, adhesives, coatings, sealants and flexible and rigid foams, are manufactured at our Brandenburg, Kentucky facility. Our Brandenburg facility also manufactures glycols and glycol ethers for use as ingredients in cleaners, personal care products and antifreeze, and provides custom manufacturing of specialty chemicals for a small group of companies.
Hydrazine. We supply hydrazine hydrates and hydrazine derivatives for a variety of end uses. Hydrazine hydrate products are sold for use in chemical blowing agents, water treatment chemicals, agricultural products, pharmaceutical intermediates and other chemical products. The hydrazine hydrates are supplied in various concentrations and in packaging containers that include bulk, tote bins and drums. We currently purchase hydrazine hydrates from a third party supplier for resale to our customers and as an ingredient for our formulated hydrazine products.
We supply propellant grade hydrazine and hydrazine derivatives for use as fuel in satellites, expendable launch vehicles and auxiliary and emergency power units. These propellant grade hydrazine products include Ultra Pure™ hydrazine (“UPH”), anhydrous hydrazine (“AH”), unsymmetrical dimethyl hydrazine (“UDMH”), monomethyl hydrazine (“MMH”) and hydrazine fuel blends. In 2005, the U.S. Government awarded the Company a long-term contract for the production, storage, distribution and handling of its hydrazine-based propellants. In addition to space-related applications in satellites and launch vehicles, auxiliary power from hydrazine-driven units is used on the NASA Space Shuttle for maneuvering its rocket engine nozzles and for operating valves, brakes and landing gear. Emergency power from hydrazine is also provided to jet aircraft such as the F-16 to operate electrical and hydraulic units in the event of an engine flameout. We also supply special packaging containers including cylinders to improve the safe handling and storage of hydrazine propellants.
Customers
Our customer base is diverse and includes pool and spa retailers, world-renowned consumer product companies, major big box retailers, furniture manufacturers, national and regional chemical and equipment distributors, wood treaters, sawmills, other chemical manufacturers and the U.S. Government. No single customer has accounted for more than 10% of our total annual sales in 2009, 2008 or 2007. A significant portion of sales of the Treatment Products segment (approximately 18% in 2009, 17% in 2008 and 18% in 2007) is dependent upon two customers, with one customer accounting for a significant portion of the sales of the HTH water products business and the other customer accounting for a significant portion of the sales of the personal care and industrial biocides businesses. For additional information about customers, see the information under the caption “Business and Credit Concentrations” in Item 7 of this Report.
Our Performance Products segment is highly dependent on contract manufacturing arrangements with various terms. The annual operating results for this segment will decrease by approximately $12 million after December 31, 2009 due to the anticipated conclusion of a long-term contract manufacturing arrangement. The Company believes that its overall organic growth, and pipeline of new product offerings, should offset this impact.
Raw Materials and Energy
We utilize a variety of raw materials in the manufacture of products for our businesses. Outlined below are the principal raw materials for our businesses. The majority of our raw material requirements are purchased and many are provided pursuant to written agreements. Overall, principal raw materials have historically been readily available to the Company as a whole.
Treatment Products. The principal raw materials for HTH water products include chlorine, caustic soda, lime and chlorinated isocyanurates.
5
Table of Contents
The principal raw materials for industrial biocide treatment chemicals and personal care specialty ingredient chemicals are pyridine, zinc sulfate, iodine, dipropylene glycol, caustic soda, chlorine, cyanamide liquor and propynyl butyl carbamate.
The principal raw materials for wood protection products include scrap copper, chromic acid, monoethanolamine, tebuconazole, propiconazole, basic copper carbonate, arsenic trioxide, cupric oxide and organic biocides. Copper is subject to significant price volatility. The raw materials for the industrial coatings products include a wide variety of polyester and polyurethane resin systems, organic solvents, nitrocellulose, acrylic resins, acrylic and vinyl emulsions, isocyanates, titanium dioxide and various other pigments.
Performance Products. The principal raw materials for urethanes products are propylene oxide and ethylene oxide. Chlorine, caustic soda and ammonia are the key raw materials for the hydrazine business. For this segment, propylene oxide is the most significant raw material that is subject to significant price volatility.
Electricity for our manufacturing facilities is mostly supplied by public or government utilities while other third parties supply us at shared sites. Natural gas used for steam production is an important energy source for several of our U.S. manufacturing sites, particularly the Brandenburg, Kentucky facility, and is purchased from multiple suppliers.
Research and Development and Patents
Our research activities are conducted at several sites including Cheshire, Connecticut; New Castle, Delaware; South Plainfield, New Jersey; Conley, Georgia; Salto, Brazil; Blackley, England; and Pianoro, Italy. Company-sponsored research expenditures were $22.7 million in 2009, $21.8 million in 2008 and $20.1 million in 2007. Expenditures on customer-sponsored research were immaterial in each of the last three years.
In general, intellectual property is important to us, but no one technology, patent or license or group thereof related to a specific process or product is of material importance to the Company as a whole.
We believe that our broad patent portfolio in the Treatment Products segment provides a sustainable competitive advantage for the treatment chemical businesses.
The Company has a significant patent portfolio related to HTH water products that includes 33 U.S. patents and numerous foreign counterpart patents. Most of these patents continue at least until 2012. Another significant patent, which expires in 2015, is for the multifunctional formulated trichloro-isocyanuric (“trichlor”) tablets. These multifunctional tablets offer enhanced benefits to our water treatment customers as distinguished from basic pure trichlor tablets. We have three other material U.S. composition patents for formulated pool chemical products that provide us with advantages in product shipping and storage. Of these three composition patents, one will expire in 2022 and two will expire in 2023. The other patents cover manufacturing processes, other multifunctional formulated products, and chemical feeder systems for residential/commercial pool and municipal water treatment applications. We have been awarded a patent covering a dissolving chamber design for chlorinator systems. This patent expires in 2021.
We have an expansive biocides patent portfolio that includes 65 U.S. patents, including process, composition and application patents and numerous foreign counterpart patents. Our biocides business holds several U.S. patents relating to antifouling additives for paints. These patents expire in 2010 and 2012. A substantial majority of our other biocides patents do not expire until after 2012. Patents for our key targeted growth areas in our marine antifouling paint and building product biocides businesses include those relating to a small particle copper pyrithione process for stable biocide dispersions, gel-free paint containing zinc pyrithione, and “in-can” and “dry film” antimicrobial coating compositions. Biocide patents supporting our personal care ingredients business include those relating to non-spherical and non-platelet crystalline forms of zinc pyrithione and a method for producing distinct particles of pyrithione salts.
6
Table of Contents
We own a significant U.S. composition of matter patent in our wood protection business. This patent, which expires in 2013, is on our WOLMAN® E and Tanalith® E preservative formulation. Our patent portfolio also includes patents, both granted and pending, covering fire retardant and other wood preservation technologies.
Seasonality
We usually experience our highest sales and profits in the second quarter primarily due to sales of our water treatment products in that quarter. The purchase of water treatment products by consumers in the residential pool market is concentrated in the U.S. between Memorial Day and the Fourth of July. The HTH water products business principally distributes directly to retail merchants and distributors. Sales of these products are strongest in the second and third quarters with the second quarter having the highest sales of these products. Our working capital needs peak during the second quarter as inventories increase to meet the demand requirements of the U.S. residential swimming pool season and accounts receivable increase as a result of the higher sales. We anticipate that these working capital requirements will be financed by our credit facilities and accounts receivable securitization program which will be reduced by subsequent seasonal reductions in inventory and accounts receivable. In addition, weather can have a significant effect on water treatment and wood treatment sales during any given year with unseasonably wet or cool weather negatively impacting sales.
Backlog
The amount of our backlog orders is immaterial as a whole and to any particular segment, which is consistent with prior years.
U.S. Government Contracts and Other Regulatory Matters
In 2005, we obtained a 20-year contract, valued at $149 million, with the Defense Energy Support Center (“DESC”) for the production, storage and distribution and handling services of our hydrazine-based propellants products. We began receiving monthly maintenance fee payments in 2006 under this long-term contract. Production is scheduled to begin in 2010. The terms of the contract call for an initial 10-year supply contract beginning in 2005, followed by two five-year renewal terms at the option of the government. We will utilize our existing hydrazine production facility in Lake Charles, Louisiana, to provide products and services under this contract. The contract provides that the U.S. Government may terminate the contract for convenience with a termination fee to be negotiated by the parties at time of termination. In the first quarter of 2007, we recorded a pre-tax gain of $12.8 million, or approximately $0.32 per share, net of tax, for the final payment related to the completion of our storage contract with the U.S. Government of our former McIntosh, Alabama site.
As a government contractor, we are subject to extensive and complex U.S. Government procurement laws and regulations. These laws and regulations provide for ongoing government audits and reviews of contract procurement, performance and administration. Failure to comply, even inadvertently, with these laws and regulations and with laws governing the export of controlled products and commodities could subject us or one or more of our businesses to civil and criminal penalties and under certain circumstances, suspension and debarment from future government contracts and the exporting of products for a specified period of time.
In addition to governmental regulations affecting government contractors, we, as a chemical manufacturer, are subject to numerous other regulations regarding the sale of our products. Several of our products are registered with the U.S. EPA under the Federal Insecticide, Fungicide, and Rodenticide Act (“FIFRA”) and as such are subject to various regulations regarding use and disclosure requirements. FIFRA covers the sale, distribution and use of our biocides. This law requires that all biocides be registered by the U.S. EPA prior to sale or distribution, and that the safety of our biocides be supported by U.S. EPA required data. Additionally, FIFRA provides for the periodic re-registration of biocides, which ensures that all data supporting registrations meet current guidelines. In addition to the U.S. EPA, each of the various states requires that biocides be registered by the relevant state regulatory agency prior to sale and distribution in that state. In addition, in Europe, our biocide products are subject to the European Biocidal Products Directive (“BPD”), which requires the re-registration of all biocide products, and the Registration, Evaluation and Authorization of Chemical Substances regulation
7
Table of Contents
(“REACH”), which requires all chemical products to be re-registered in the EU. See Risk Factors in Item 1A of this Report for additional information. In addition to Europe and the U.S., we are subject to regulatory schemes in other countries such as Brazil and China.
Competition
The industry segments in which we operate are highly competitive, and we encounter strong competition across our product lines from other manufacturers worldwide. This competition, from other manufacturers of the same products and from manufacturers of different products designed for the same uses, is expected to continue in both the U.S. and foreign markets. Depending on the product involved, various types of competition are encountered, including price, delivery, service, performance, product innovation, product recognition and quality. Overall, we believe our principal product groups are competitive with many other products of other producers.
Export Sales
Our export sales from the U.S. to unaffiliated customers were $93.1 million in 2009, $110.7 million in 2008 and $115.3 million in 2007. For financial information about geographic areas, see Note 18 of Notes to Consolidated Financial Statements contained in Item 8 of this Report.
Employees
As of December 31, 2009, we had approximately 3,076 full-time employees, approximately 1,588 of whom were working outside the U.S. In addition, we also employed at such date approximately 176 seasonal or temporary employees, primarily in the HTH water products business. Approximately 172 of the hourly paid U.S. employees of the Company located at its Brandenburg, Kentucky and Conley, Georgia facilities are represented for purposes of collective bargaining by several different labor organizations, and we are a party to seven labor contracts relating to such employees. These labor contracts extend for four- and five-year terms and expire in the years 2010 and 2011. Certain European employees are also represented by unions in various countries. As of December 31, 2009, in the U.K. and Ireland, approximately 52 employees were covered under different labor organizations with employment terms that are renewed annually and in Italy, approximately 330 employees, of which 60 are union members, are covered under collective bargaining arrangements with employment terms that were renegotiated in 2009. Generally speaking, in other European countries applicable labor agreements are statutory. In South Africa, approximately 70 employees belong to unions with labor terms negotiated annually. In Brazil, the Company has a total of approximately 242 employees subject to collective bargaining agreements, which are negotiated annually in Brazil. No material work stoppages have occurred in the last three years. While relations between the Company and its employees and their various representatives are generally considered satisfactory, there can be no assurance that new labor contracts can be entered into without work stoppages.
Responsible Care® Commitment
First adopted as a condition of membership by the American Chemistry Council (“ACC”) in 1988, the Responsible Care® initiative was developed to encourage member companies to improve their performance in the realms of health, safety and the environment continuously.
The ACC’s Responsible Care® initiative encompasses seven critical performance areas: employee health and safety, pollution prevention, manufacturing process safety, security, distribution safety, product stewardship and community awareness and emergency response. Ultimately, this initiative is aimed at making health, safety, security and environmental protection an integral part of a product’s life cycle—from manufacture, marketing and distribution to use, recycling and disposal.
We have developed a management system to drive improvement in all seven areas under Responsible Care®. To make this complex and multifaceted process more compelling and to give it a sense of urgency, we have developed what we call “The Goal is Zero” initiative. This initiative recognizes a fundamental truth at the heart of Responsible Care®—that no amount of harm to people or the environment is acceptable.
8
Table of Contents
Our manufacturing plant in Rochester, New York, which makes industrial biocides and ingredients for personal care products, was the first plant in the U.S. to be certified under the new Responsible Care® RC 14001 standard, which broadly covers performance in all seven performance areas under Responsible Care®. The plant received this certification after a rigorous series of audits by ABS Quality Evaluations (“ABS”), an independent registrar based in Houston, Texas. Using standards developed by the Registrars Accreditation Board, auditors from ABS examined the Rochester plant’s management systems and related quality controls related to Responsible Care®. In addition, we were the first ACC member whose corporate headquarters earned certification under the new Responsible Care® Management System (“RCMS”) requirements. In addition, our water chemicals plant in Charleston, Tennessee, and wood protection plants in Conley, Georgia; Valparaiso, Indiana; and Kalama, Washington, all received RCMS certification. In 2007, consistent with the requirements of ACC member companies, our corporate headquarters was audited by ABS and achieved its re-certification under RCMS. In addition, our Performance Products plants in Brandenburg, Kentucky and Lake Charles, Louisiana and our Personal Care facility in South Plainfield, New Jersey are RCMS certified. In 2008, Arch expanded our RCMS program by providing internal verification of RCMS at four of our international manufacturing sites and external re-certification at four of our U.S. manufacturing sites. In 2009, our RCMS program was expanded again with internal certification of five international manufacturing sites and external re-certification of four U.S. sites.
As its very name implies, our “The Goal is Zero” initiative is indeed aimed at achieving zero employee and contractor injuries, zero manufacturing process incidents, zero distribution incidents and zero environmental incidents. We have made improvements and we are continuing to work to drive these metrics toward zero. The following summarizes our performance in each of “The Goal is Zero” targeted areas:
Goal One: Zero Recordable Injuries. While some of our facilities have achieved this goal, overall, our rate of employee recordable injuries (the number of work-related injuries per 200,000 hours worked) has declined from 1.51 in 2004 to 0.98 in 2009. By contrast, the average recordable injury rate for all U.S. manufacturers was 5.4 in 2007, the most recent year available. Our recordable injury incident rate for contractors was .28 in 2004 and 2.8 in 2009 which was much higher than in prior years. This represented a total of six contractor injuries in 2009.
Goal Two: Zero Manufacturing Process Safety Incidents. These incidents are defined to include fires, explosions and chemical releases that result in a reportable quantity release, a lost-time injury, off-site consequences or greater than $25,000 of damages. We reduced the number of these incidents from four in 2004 to zero in 2009.
Goal Three: Zero Environmental Incidents. This goal refers to incidents such as chemical spills or emissions that are reportable because they exceed strict limits established in state, federal or foreign laws and regulations. Our performance has significantly improved, moving from nine environmental incidents in 2004 to three in 2009.
Goal Four: Zero Distribution Incidents. Under this goal, we strive to achieve zero incidents such as spills during the transportation of our products. Performance is measured in terms of distribution incidents per 1,000 shipments, and this rate has declined from 0.50 in 2004 to 0.42 in 2009.
We are pleased with the progress and results derived from our Responsible Care® Program. We remain committed, however, to achieving further improvements and realizing the ultimate goal—“The Goal is Zero” for each of the above categories.
Environmental Matters
We operate manufacturing facilities throughout the world and as a result are subject to a broad array of environmental laws and regulations in various countries. We also implement a variety of voluntary programs to reduce air emissions, eliminate or reduce the generation of hazardous waste and to decrease the amount of
9
Table of Contents
wastewater discharges. The establishment and implementation of U.S. Federal, state and local standards to regulate air and water quality and to govern contamination of land and groundwater has affected and will continue to affect substantially all of our U.S. manufacturing locations. Federal legislation providing for regulation of the manufacture, transportation, use and disposal of hazardous and toxic substances has imposed additional regulatory requirements on industry in general, and particularly on the chemicals industry. In addition, the implementation of environmental laws, such as the Resource Conservation and Recovery Act, the Clean Air Act and the Comprehensive Environmental Response, Compensation and Liability Act of 1980, as amended by the Superfund Amendments and Reauthorization Act of 1986, has required and will continue to require new capital expenditures and will increase operating costs. Additionally, growing concerns about climate change may result in the imposition of additional regulation. Some form of federal regulation may be forthcoming with respect to greenhouse gas emissions (including carbon dioxide (CO2)) and/or “cap and trade” legislation, compliance with which could result in additional environmental regulation requirements.
The Distribution Agreement, dated as of February 1, 1999 (the “Distribution Agreement”), between the Company and Olin relating to the Distribution, specifies that we are only responsible for certain environmental liabilities at our then current facilities and certain off-site locations with respect to the businesses acquired from Olin in the Distribution. We have also become subject to environmental exposures and potential liabilities in the U.S. and abroad with respect to the businesses we purchased following the Distribution. In connection with the acquisitions of Hickson International (“Hickson”) and Koppers Arch Wood Protection (Aust) Pty Ltd. (“KAWP”), we acquired certain environmental exposures and potential liabilities of current and past operating sites. The known Hickson and KAWP environmental exposures have been accrued for in our consolidated financial statements.
In connection with the disposition of the majority of our microelectronic materials business on November 30, 2004, we provided indemnification to the buyer for potential environmental liabilities. For identified environmental liabilities as of the transaction date, there is no limit to the liability we retained. We estimate such potential liability to be less than $1.0 million. For other pre-closing environmental liabilities the purchaser was liable over a five-year period from the closing date, which ended November 30, 2009.
In connection with the disposition of our sulfuric acid business on July 2, 2003, we provided environmental covenants to the buyer in which we are solely liable for the costs of any environmental claim for remediation of any hazardous substances that were generated, managed, treated, stored or disposed of prior to the closing date of the sale. We will be released, under the sales agreement, from this obligation, which cannot exceed $22.5 million, 20 years from the closing date. See “Legal Matters” in Item 7 of this Report.
As part of the Hickson organics business disposition in August 2003, we continue to be responsible for known environmental matters. Such matters have previously been accrued for in our environmental reserve included in the consolidated financial statements. Additionally, regarding any unknown environmental matters that are identified subsequent to the sale, we agreed to share responsibility with the purchaser over a seven-year period, with our share decreasing to zero over the seven-year period. Our maximum aggregate liability for such unknown environmental matters is £5.0 million. However, in September 2005, the purchaser went into liquidation and is highly unlikely to be able to honor its environmental indemnification commitments to us. We do not believe there has been a change in our environmental exposure at the site.
We do not anticipate that the environmental indemnifications for the microelectronic materials, sulfuric acid and Hickson organics dispositions will have a material adverse effect on our consolidated financial condition, cash flow or results of operations.
Associated costs of investigatory and remedial activities are provided for in accordance with generally accepted accounting principles governing probability and the ability to reasonably estimate future costs. Charges to income for investigatory and remedial efforts of $1.0 million, $1.7 million and $2.7 million were recorded in 2009, 2008 and 2007, respectively, and may be material in future years.
10
Table of Contents
Cash outlays for normal plant operations for the disposal of waste and the operation and maintenance of pollution control equipment and facilities to ensure compliance with mandated and voluntarily imposed environmental quality standards are charged to income. Cash outlays for remedial activities are charged to reserves. Historically, we have funded our environmental capital expenditures through cash flows from operations and expect to do so in the future.
Cash outlays for environmental related activities for 2009, 2008 and 2007 were as follows:
| Years Ended December 31, | |||||||||
| 2009 | 2008 | 2007 | |||||||
| ($ in millions) | |||||||||
| Environmental Cash Outlays | |||||||||
| Capital Projects |
$ | 1.0 | $ | 0.6 | $ | 0.5 | |||
| Plant Operations |
7.1 | 7.7 | 6.8 | ||||||
| Remedial Activities |
0.7 | 1.8 | 2.4 | ||||||
| Total Environmental Cash Outlays |
$ | 8.8 | $ | 10.1 | $ | 9.7 | |||
Our consolidated balance sheets include liabilities for future environmental expenditures to investigate and remediate known sites amounting to $8.2 million at December 31, 2009, of which $1.5 million is classified as current liabilities, and $7.1 million at December 31, 2008, of which $1.3 million is classified as current liabilities. Our estimated environmental liability relates to 15 sites, seven of which are in the U.S. and none of which is on the U.S. National Priority List. These amounts do not take into account any discounting of future expenditures, any consideration of insurance recoveries or any advances in technology. These liabilities are reassessed periodically to determine if environmental circumstances have changed or if the costs of remediation efforts can be better estimated. As a result of these reassessments, future charges to income may be made for additional liabilities.
Annual environmental-related cash outlays for site investigation and remediation, capital projects and normal plant operations are expected to range from $8 million to $12 million over the next several years. While we do not anticipate a material increase in the projected annual level of our environmental-related costs, there is always the possibility that such increases may occur in the future in view of the uncertainties associated with environmental exposures.
Environmental exposures are difficult to assess for numerous reasons, including the identification of new sites, developments at sites resulting from investigatory studies and remedial activities, advances in technology, changes in environmental laws and regulations and their application, the scarcity of reliable data pertaining to identified sites, the difficulty in assessing the involvement and financial capability of other potentially responsible parties and our ability to obtain contributions from other parties and the lengthy time periods over which site remediation occurs. It is possible that some of these matters (the outcomes of which are subject to various uncertainties) may be resolved unfavorably against us and may have a materially adverse impact on our business. At December 31, 2009, we had estimated additional contingent environmental liabilities of approximately $9 million.
| Item 1A. | Risk Factors |
Investing in our securities involves risks. Investors should carefully evaluate these risks including the factors discussed below when evaluating investments in our securities.
Our Treatment Products segment is seasonal in nature and is affected by the weather.
Our HTH water products business is subject to seasonal fluctuations in demand. We typically experience reduced sales in the first and fourth quarters of each year, as sales in the residential pool market are concentrated in the U.S. between Memorial Day and the Fourth of July. Our working capital needs peak during the second
11
Table of Contents
quarter. Unseasonably wet or cool weather can also have a negative impact on the sale of our water and wood treatment products. Further, drought conditions which result in water restrictions on the use of pools may negatively affect our sales of pool products and may interfere with production at our plants. With respect to our HTH water products business, the impact of global weather changes is uncertain and will depend on the overall change, if any, in wet and dry weather conditions.
An increase in the cost of our purchased raw materials and energy would lead to higher cost of goods sold, thereby reducing our operating margins.
We purchase large amounts of raw materials, including propylene oxide, chlorinated isocyanurates, monoethanolamine, scrap copper, basic copper carbonate, chromic acid, pyridine, zinc sulfate, iodine, dipropylene glycol, phthalic anhydride, sodium hypochlorite, chlorine and caustic soda and energy for our businesses. Many of our raw material requirements are purchased and provided pursuant to written agreements, some of which provide for fixed or formula-based pricing and others of which provide for market or spot pricing. The price and availability of commodity chemicals is generally determined by global supply and demand. Fluctuations in supply and demand and increases in anti-dumping duty rates could have a material adverse effect on our cost of goods sold and, as a result, our margins. Price increases of raw materials may increase our working capital needs, which could reduce our liquidity and cash flows. Energy prices, particularly for electricity, natural gas and fuel oil, have been volatile in recent years. Higher diesel fuel prices may affect our product shipping costs.
In addition, we purchase energy and, in some cases, raw materials and site services, from third parties at our manufacturing plants that are located on sites that we share with such third parties. For example, we share our Charleston, Tennessee site with Olin and we share our Lake Charles, Louisiana site with Lyondell Chemical Company (“Lyondell”). If these other companies shut down their operations at these shared sites, it may significantly increase our costs to operate at these sites and make it difficult for us to obtain the necessary energy, services or raw materials and, in the worst case, cause us to have to suspend or abandon production at these facilities. Under agreements with these third parties, we may have to pay some of the site’s shutdown costs, which might be significant.
During 2009, Lyondell, a key supplier to our hydrazine business, filed to reorganize under Chapter 11 of the U.S. Bankruptcy Code. In connection with the bankruptcy case, this vendor has filed a motion with the court to terminate all service agreements with us for our Lake Charles, Louisiana site. The bankruptcy court has granted the motion with the result that services could be cancelled at any time. While we have replaced a few of the services with new vendors, we are currently negotiating with Lyondell and with Chemtura Corporation (“Chemtura”), another company in bankruptcy which operates next to our site, in an attempt to enter into new service agreements that would allow our Lake Charles operation to continue to receive the other needed services for an extended period or at least to give the operation enough time to obtain the ability to perform such services for itself. If these services are terminated and we are unable to enter into new service agreements with Lyondell or Chemtura or arrange for alternative suppliers, the outcome could have a material impact on this business’ operating income in the future starting in 2010. We do not believe that there will be any significant impact on our operating results in 2010, although there may be higher capital expenditures in 2010, which we are currently evaluating, in order for us to be able to perform the services that are currently being performed by the vendor. In addition, the Long-lived assets (exclusive of Other assets), related to this business of $5.0 million at December 31, 2009, could become impaired. There is no Goodwill recorded for this business.
We may purchase forward contracts to hedge certain of our raw material costs or utilize purchasing strategies to mitigate the adverse effect of material price increases. However, there is no assurance that these strategies will be effective and may in fact result in higher costs than would otherwise be incurred. We may be unable to pass on increases in our cost of goods sold to our customers. The level of our profitability depends, in part, on our ability to maintain the differential between our product prices and energy and raw material prices, and we cannot guarantee that we will be able to maintain an appropriate differential at all times.
12
Table of Contents
The industry segments in which we operate are highly competitive, and such competition may negatively impact us.
The industry segments in which we operate are highly competitive, and we face intense competition from numerous manufacturers for each of our product lines. This competition results from many developments, including new competitors in lower-cost production countries such as China and India and technological advances creating new competing products or improving existing competing products. We compete on the basis of a number of factors, including price, product quality and properties, regulatory and toxicological expertise, customer relationships and services.
In addition, we face increased competition due to a trend toward consolidation. In recent years, there has been substantial consolidation and convergence among companies in the chemicals industry. Several of our competitors are larger or have greater financial resources than we do. We may not be able to address effectively the competitive factors in our industry in the future and, as a result, our financial condition and results of operations may be adversely affected.
Our Treatment Products segment’s customer base is concentrated, and the loss of business from a major customer could have a material adverse effect on us. In addition, contract manufacturing is significant to our Performance Products segment.
Although no one customer accounted for over 10% of our 2009, 2008 or 2007 sales, approximately 18% of our Treatment Products segment sales in 2009, 17% in 2008 and 18% in 2007 were attributable in the aggregate to two customers, with one customer accounting for a significant portion of our HTH water products business sales and the other customer accounting for a significant portion of the sales of our personal care and industrial biocides business. We cannot assure investors that these or any other significant customer will not terminate their relationships with us or significantly change, reduce or delay the amount of products ordered. The loss of any such significant customer would have a material adverse effect on the net sales and operating results of the Treatment Products segment, which, in turn, could adversely impact our business, financial condition, results of operations and cash flows. In addition, this customer concentration gives such customers additional leverage in negotiating terms that may negatively impact our margins.
Our Performance Products segment is highly dependent on contract manufacturing arrangements with various terms. Our annual operating results for this segment will decrease by approximately $12 million after December 31, 2009 due to the anticipated conclusion of a long-term contract manufacturing arrangement. We believe that overall organic growth and our pipeline of new product offerings should mitigate a portion of this impact. However, if there is a further deterioration of market conditions or if the Company and/or segment is unsuccessful with new product offerings, the operating income of the Performance Products segment, and perhaps the Company as a whole, could be materially reduced. Additionally, the performance urethanes business’ Long-lived assets (exclusive of Goodwill and Other assets) and Goodwill, $14.8 million and $4.4 million, respectively, at December 31, 2009, could become impaired.
We may need to build manufacturing facilities in lower-cost or developing countries to remain competitive in our industry and this entails certain risks. Also, our customers or markets may migrate to lower-cost countries where we do not have a presence.
In recent years, there has been a shift of production capacity in the chemicals industry to developing countries with lower costs of production, such as China. We may be required to invest in such countries in order to offer competitive product prices to our customers. Customers may require that we build manufacturing facilities or make additional investments in a lower-cost or developing country in order to retain their business. In fact, we recently built a plant in China to meet the needs of a significant customer. The building of plants also increases risks of cost overruns, start-up problems, and construction delays, any of which may impact customer sales and relations. Further, additional manufacturing capacity may make some of our existing manufacturing
13
Table of Contents
sites redundant or create excess capacity, causing us to have to reduce production at or shut down such other manufacturing sites which might increase our costs significantly and might trigger shutdown costs and charges including severance payments and writeoffs. If we are required to build additional manufacturing facilities overseas, our capital expenditures would increase to reflect not only the cost of the construction of the facilities, but also their long-term maintenance. These capital expenditures may increase our costs, which may negatively impact our margins. Finally, the relocation of some production facilities to lower-cost countries by an industry may result in lower pricing worldwide for certain products, which may also negatively impact our margins worldwide for such products.
In connection with the shift to countries with low-cost production, our customers or the markets for our products may shift to countries where we may not have a sufficient presence. For example, our coatings business has been negatively impacted by the decline of local furniture production in several major European economies as a result of such a shift. This has been but one factor, among a variety of others, including competitive pressures, that has led to a decrease in operating results for the industrial coatings business from operating income of approximately $7 million in 2003 to an operating loss of approximately $2 million in 2009. Despite the market shift and increased competitive pressures, capital spending for the business has not changed significantly over the past six years, and we do not foresee a significant change to capital spending in the future.
We are subject to risks related to our international operations, including exchange rate fluctuations, which could adversely affect our business, financial condition, results of operations and cash flows.
We have significant operations in Australia, Brazil, China, England, Italy, New Zealand and South Africa and other foreign countries, and we sell to customers in a number of other countries, including Canada, France and Japan. Approximately 50% of our 2009 sales were outside the United States. International sales and operations are subject to significant risks, including, among others:
| • | political and economic instability; |
| • | restrictive trade policies; |
| • | economic conditions in local markets; |
| • | difficulty of enforcing agreements and collecting receivables through certain foreign legal systems; |
| • | difficulties in managing international manufacturing operations; |
| • | local legal and regulatory requirements, including those relating to the European Biocidal Products Directive, which requires biocide manufacturers, including the Company, to re-register their biocidal products for sale in the European Union (“EU”) and REACH; |
| • | potential difficulties in protecting intellectual property; |
| • | potential adverse tax consequences, including imposition of withholding or other taxes on payments by subsidiaries; |
| • | the imposition of product tariffs and duties and the burden of complying with a wide variety of international and U.S. export laws; |
| • | changes in Chinese taxes relating to exports from China; and |
| • | changes in legislation for U.K. taxes regarding the timing of deductions for interest expense for U.K. |
Our effective tax rate has historically been reduced due to a tax benefit related to our U.K. financing structure. Recently enacted U.K. legislation could limit the tax benefit of this structure, thereby increasing our future effective tax rate. In addition, if the operating results of our U.K. operations fall below our current expectations, we have certain deferred tax assets related to our U.K. operations that may no longer be likely to be realized. Therefore, we may be required to record a valuation allowance against such assets, which totaled $51.9 million at December 31, 2009.
14
Table of Contents
The functional currency for most of our international operations is the applicable local currency. The Company enters into forward sales and purchase contracts to manage currency risk resulting from purchase and sale commitments denominated in foreign currencies (principally the Australian dollar, British pound, euro, Canadian dollar, Japanese yen and New Zealand dollar) and relating to particular anticipated but not yet committed purchases and sales expected to be denominated in those currencies. Although we implement foreign currency hedging and risk management strategies to reduce our exposure to fluctuations in earnings and cash flows associated with changes in foreign exchange rates, there can be no assurance that foreign currency fluctuations will not have an adverse effect on our business, results of operations or financial condition.
If we continue to expand our business globally, our success will depend, in large part, on our ability to anticipate and effectively manage these and other risks associated with our international operations. However, any of these factors could adversely affect our international operations and, consequently, our operating results.
We cannot assure investors that our operations will continue to be in compliance with applicable customs, currency exchange control regulations, transfer pricing regulations or any other laws or regulations to which we may be subject. We also cannot assure investors that these laws will not be modified.
Our manufacturing facilities process chemicals and, as a result, subject us to operating risks that could adversely affect our results of operations.
We have approximately 30 manufacturing facilities. Our operations are subject to various risks associated with manufacturing, transportation, storage and handling of chemicals, including chemical spills, discharges or releases of toxic or hazardous substances or gases, fires, mechanical failures, storage tank leaks, unscheduled downtime, explosions, severe weather and natural disasters, terrorist attacks, natural resource damage and other environmental risks. Our suppliers of chemical raw materials are subject to similar risks that may impact our supplies. These risks can cause personal injury and loss of life, catastrophic damage to or destruction of property and equipment and environmental and natural resource damage, and may result in an unanticipated interruption or suspension of operations and the imposition of civil claims and criminal penalties. For example, an unplanned outage at our HTH water products manufacturing facility during peak seasonal demands could result in product availability shortfalls or increased costs resulting from the need to source product from alternative manufacturing sources or competitors. The loss or shutdown over an extended period of operations at any of our major manufacturing facilities or any losses related to any such claims could have a material adverse effect on our business, financial condition, results of operations or cash flows. In addition, if we cannot maintain or upgrade equipment as we require or ensure regulatory compliance, we could be required to cease or curtail some of our manufacturing operations, or we may become unable to manufacture products that compete effectively in our industry. While we have insurance to mitigate some of these risks, such insurance includes deductibles and policy limits that may not be sufficient to cover our total exposure. In addition, there is usually a lag between payments by us of the insured liability and reimbursement by the insurance carrier, which lag may negatively impact our cash flow.
We are subject to environmental and regulatory risks.
Environmental and regulatory laws have affected, and will continue to affect, substantially all of our operations. We are subject to strict requirements regarding air emissions, wastewater discharges and the handling and disposal of hazardous and toxic substances. Environmental laws will likely become more stringent over time, thereby requiring new capital expenditures and increases in operating costs. In addition, we are responsible or potentially responsible for clean-up costs at several of our current operating sites. Although Olin has agreed to be responsible for certain environmental legacies, there is no assurance that Olin will be able to honor its contractual commitments to us. Business acquisitions by us have also caused us to inherit potential environmental liabilities. We believe that we have adequate reserves to cover the cost of our investigation and remediation obligations at each of these sites. However, unanticipated environmental conditions or the discovery of new sites or conditions requiring remediation may have a material adverse effect on our operating results and financial condition.
15
Table of Contents
Additionally, growing concerns about climate change may result in the imposition of additional regulation. Some form of Federal regulation may be forthcoming with respect to greenhouse gas emissions (including carbon dioxide (CO2)) and/or “cap and trade” legislation, compliance with which could result in the creation of substantial additional costs to us. The U.S. Congress is considering climate change legislation and the Environmental Protection Agency issued a rule which regulates larger emitters of greenhouse gases. Since the industry segments that we operate in are highly competitive, we may not be able to recover the cost of compliance with new or more stringent environmental laws and regulations which could adversely affect our business. Although it is not expected that the costs of complying with current environmental regulations will have a material adverse effect on our financial position, results of operations or cash flows, no assurance can be made that the costs of complying with environmental regulations in the future will not have such an effect.
In addition, many of our products are required to be registered with the U.S. EPA and with comparable state and foreign governmental agencies and such registration is subject to periodic review and is subject to producing certain data regarding human and environmental safety. Our key biocides are currently going through the U.S. EPA’s Registration Eligibility Decision process as required by FIFRA and will be subject to such data production. EU authorities have issued the BPD which requires all biocidal products sold in the EU to re-register there. The EU has also adopted legislation known as REACH that requires the registration of all chemical products that are manufactured or imported into the EU. In connection with these programs, such products must demonstrate their continued safety. This registration will require extensive testing of those products if current supporting data is insufficient. In addition, the cost of testing resulting from these new regulations may increase costs which may reduce our profit margins. While we generally expect that testing will support re-registration approval, it is possible that such testing will not support registration or that those agencies will find the test results or supporting data unsatisfactory. In such a case, sale of some of our products may be restricted (or in the extreme case, banned) in the EU.
As provided in the BPD, the EU is reviewing the classification and labeling of a number of chemicals under a new, more wide-ranging procedure. One of our products, PHMB, which has been on the market for many years providing valuable disinfection, cleaning and hygiene functions, is one of the chemicals under review. France, in its role as a lead reviewer of PHMB under the BPD, is proposing a reclassification of PHMB. Nevertheless, if the new classification is upheld, there is the potential for customer-based restrictions on the use of products containing PHMB and such restrictions could also extend beyond the EU. We are defending our classification of the product as well as developing alternative products. If we are unsuccessful, this change in classification and labeling may adversely affect our sales and could cause approximately $15 million of PHMB-related intangible assets to become impaired. In 2009, we had approximately $10 million of PHMB sales in Europe and we had approximately $33 million of PHMB sales worldwide.
In addition, Olin, who is a major supplier of chlorine and caustic soda to our HTH Water Treatment business, may be required by pending regulatory legislation to shut down or convert its mercury cell chlorine-caustic plant in Charleston, Tennessee. Any shutdown may adversely affect our Charleston plant which is supplied there by Olin. We do not believe that there will be any significant impact on our operating results in 2010, but if the chlorine-caustic plant in Charleston, Tennessee were to shut down, we would have to arrange for alternative suppliers or build our own plant, which could have a material impact on this business’ operating income and cash flows in the future.
Our products may be rendered obsolete or less attractive by changes in regulatory, legislative or industry requirements.
Changes in regulatory, legislative or industry requirements may render certain of our products obsolete or less attractive in many ways. Our ability to anticipate changes in these requirements, especially changes in regulatory standards, will be a significant factor in our ability to remain competitive. Further, movement to “Green” or “greener” products may impact us if we are unable to offer comparable products. We may not be able to comply in the future with new regulatory, legislative and/or industrial standards that may be necessary for us to remain competitive and certain of our products may, as a result, become obsolete or less attractive to our customers. For example, enactment of additional laws regarding domestic security of chemical plants may
16
Table of Contents
significantly increase our spending on security and negatively impact our margins, particularly compared to foreign competitors who might not be subject to such laws. In addition, changes in government appropriations may impact our hydrazine propellants business.
We are subject to certain litigation risks due to the nature of some of our products.
We produce chemicals that require appropriate procedures and care in their use, handling, storage and transportation. As a result of the risks inherent in the nature of some of our chemical products, including the risk of product misuse, we have faced and will continue to face product liability claims relating to incidents involving our products, including claims for adverse health effects and personal injury and even death. Further, although we carry insurance that covers certain litigation risks, such insurance may be insufficient to cover a claim and even if sufficient for a claim, there may be a lag between the time of payment of the claim by us and reimbursement of such payment from our insurers.
Several years ago, the Company and/or its CCA-formulating subsidiary Arch Wood Protection, Inc. were named, along with several other CCA manufacturers, several CCA customers and various retailers, in five putative class action lawsuits filed in various state and Federal courts regarding the marketing and use of CCA-treated wood. All of these cases were subsequently dismissed and in two of the cases, the courts ruled that the requirements for a class action had not been met and denied class action status. In addition, there currently are fewer than ten other CCA-related lawsuits in which the Company and/or one or more of the Company’s subsidiaries are involved. These additional cases are not putative class actions. They are actions by individual claimants alleging various personal injuries allegedly due to exposure to CCA-treated wood.
The Company and its subsidiaries denied the material allegations of all the various CCA-related claims and have vigorously defended and will continue to vigorously defend against them. As a result, legal defense and related costs associated with these cases may be significant in the future. In addition, there is no assurance that subsequent CCA cases, including additional purported class actions, will not be brought.
We are subject to liquidity risks.
We borrow under our $350 million revolving credit facility regularly. When we borrow under this facility, we are required to certify that certain representations and warranties are true. We also must comply with covenants, including certain financial ratios. If we are not able to make a representation or fail to comply with a covenant, we may not be able to borrow under the facility. In addition, the Company has other financial covenants under its Term Loan and Shelf Agreement. If we were to fail to comply with a covenant, we may be required to repay the outstanding balances. There can be no assurance that we would be successful in our efforts to modify or waive the financial covenants under the agreements or secure other financing. If we were unable to do so, we could experience liquidity difficulties that would have a material adverse effect on our financial position and results of operations. Our accounts receivable securitization program with PNC Bank expires on October 5, 2010. While we expect to replace or extend the receivables arrangement, there can be no assurances that it will be successful. If we are unable to replace or extend the program, the diversity of our liquidity options will diminish, which may make us more susceptible to a reduction in our available liquidity.
In addition, recent volatile and uncertain market conditions could potentially reduce the sources of our future liquidity. This could, among other things, limit our ability to make future acquisitions, significant capital expenditures or to respond to unanticipated cash needs.
Our ability to pay dividends on our shares of common stock is subject to compliance with certain debt covenants and liquidity restrictions.
Our major domestic debt agreements permit the payment of dividends and repurchases of shares based on a financial formula. At December 31, 2009, dividends and share repurchases were limited to $84.6 million under
17
Table of Contents
these facilities. These limits are adjusted quarterly pursuant to a formula that is increased by 50% of earnings and decreased by 50% of losses, dividends paid and share repurchases. If we suffer losses or certain write-offs or lack earnings, these covenants may limit or eliminate our ability to pay dividends. Additionally, the recent turmoil in the financial markets has resulted in a contraction in the availability of credit in the marketplace. This could potentially reduce the sources of liquidity for the Company. If Company earnings or cash flows were to fall significantly below current expectations, a risk exists that the Company would not have enough liquidity to meet its operating needs or pay dividends. We paid $20.0 million in dividends in 2009.
Our pension obligations are currently underfunded. We may have to make significant cash payments to our pension plans, which would reduce the cash available for our business.
As of December 31, 2009, our accumulated benefit obligation under our U.S. and U.K. defined benefit pension plans exceeded the fair value of plan assets by approximately $159 million. During the years ended December 31, 2009, 2008 and 2007, we contributed $58.4 million, $26.2 million and $63.6 million, respectively, to these pension plans. Additional contributions will be required in future years. We currently anticipate making approximately $25 million of contributions to the qualified U.S. pension plan in 2010. However, we will evaluate all of our funding options in 2010 after the year-end funding position is remeasured. The minimum funding requirements for our U.K. pension plans are currently expected to be approximately $15 million to $20 million in 2010. If the performance of the assets in our pension plans does not meet our expectations or other actuarial assumptions are modified, our contributions to our pension plans could be materially higher than we expect, which would reduce the cash available for our businesses. In addition, if we were to cease to have active employees participating in our U.K. pension plan or if our U.K. subsidiaries that sponsor the plan become insolvent and in certain other situations, we may be required to wind up the U.K. plan. The statutory funding requirements for a plan in wind-up are materially higher than those for an ongoing plan to allow for the purchase of annuities for all the participants in the plan. While we believe a mandated wind-up of the U.K. plan to be highly unlikely, if it were to occur, it would have a material adverse effect on our business, cash flow and financial condition.
Adverse conditions in the global economy and disruption of financial markets could negatively impact our customers and suppliers and therefore our results of operations.
An economic downturn in the business or geographic areas in which we sell our products could reduce demand for these products and result in a decrease in sales volume that could have a negative impact on our results of operations. For example, our wood treatment and industrial biocides businesses were negatively affected by the recent drop in housing demand and construction, and our performance urethanes business was negatively affected by a depressed economy. Volatility and disruption of financial markets could limit our customers’ ability to obtain adequate financing to maintain operations and result in a decrease in sales volume that could have a negative impact on our results of operations. In addition, these conditions may negatively impact our suppliers. This may make it difficult for us to obtain necessary raw materials from its suppliers or, in order to obtain them, we may incur greater cost, and this may negatively impact our results of operations.
| Item 1B. | Unresolved Staff Comments |
Not applicable.
18
Table of Contents
| Item 2. | Properties |
The table below sets forth the primary locations where we have offices or conduct operations along with a brief description of the activities conducted at each identified location. A more detailed description of our principal facilities follows the table. We believe that our facilities are sufficiently maintained and suitable and adequate for our immediate needs and that additional space is available to accommodate expansion. Unless otherwise noted below, the identified location is owned by the Company.
| Location |
Primary Activities | |
| Cheshire, Connecticut (2) |
Research and development facility and offices for Treatment Products | |
| Norwalk, Connecticut (2) |
Worldwide corporate headquarters | |
| New Castle, Delaware |
Research laboratory and testing site for HTH water products and personal care and industrial biocides | |
| Conley, Georgia |
Technical center and manufacturing facility for wood protection and technical center for HTH water products | |
| Atlanta, Georgia (2) |
Office facility for Treatment Products | |
| Bethalto, Illinois (2) |
Corporate data center | |
| Brandenburg, Kentucky |
Manufacturing facility for Performance Products and technical center for industrial coatings | |
| Lake Charles, Louisiana |
Manufacturing facility for Performance Products | |
| Alpharetta, Georgia (2) |
Office, distribution and manufacturing facility for HTH water products | |
| South Plainfield, New Jersey |
Research and development facility and office space for personal care | |
| Rochester, New York |
Manufacturing facility for personal care and industrial biocides | |
| Charleston, Tennessee (4) |
Manufacturing facility for HTH water products | |
| Germantown, Wisconsin (2) |
Office facility for HTH water products | |
| Trentham, Victoria, Australia |
Office and manufacturing facility for wood protection | |
| Igarassu, Brazil |
Manufacturing facility for HTH water products | |
| Salto, Brazil |
Office and manufacturing facility for HTH water products and blending facility for industrial biocides and personal care | |
| Suzhou, China (1) |
Manufacturing facility, warehouse and technical support center for personal care and industrial biocides | |
| Blackley, England (2) |
Office facility and laboratory for personal care and industrial biocides | |
| Castleford, England (4) |
Office, manufacturing facility and technical center for Treatment Products | |
| Huddersfield, England (3) |
Manufacturing and laboratory facilities for personal care, industrial biocides and wood protection | |
| Knottingley, England (2) |
Office, manufacturing facilities and technical center for industrial coatings | |
| Amboise, France (2) |
Office, manufacturing, distribution and warehouse facility for HTH water products | |
| Les Mureaux, France |
Office, manufacturing and laboratory facility for industrial coatings | |
| Swords, Ireland |
Manufacturing facility for personal care and industrial biocides | |
| Mariano Comense, Italy |
Manufacturing and research and development facility for industrial coatings | |
19
Table of Contents
| Location |
Primary Activities | |
| Pianoro, Italy |
Manufacturing, research and development and office facility for industrial coatings | |
| Penang, Malaysia |
Manufacturing and warehouse facility for wood protection | |
| Auckland, New Zealand (2) |
Office and manufacturing facility for wood protection | |
| Grangemouth, Scotland (3) |
Manufacturing facility for personal care and industrial biocides and HTH water products | |
| Kempton Park, South Africa |
Office and manufacturing facility for HTH water products | |
| Port Shepstone, South Africa |
Office and manufacturing, facility for wood protection | |
| Valencia, Spain |
Office, manufacturing and laboratory facility for industrial coatings | |
| (1) | Land only is leased. |
| (2) | Leased facility. |
| (3) | Land and building owned by a third party. |
| (4) | Portions are leased and portions are owned. |
We also lease several sales offices and warehouse facilities in the U.S. and in foreign countries.
Principal Manufacturing Facilities
Our principal manufacturing properties are described below. We also have products that are produced by third parties at their manufacturing sites under contract manufacturing arrangements.
Alpharetta, Georgia. This 200,000-square foot leased facility produces, packages and distributes liquid and dry products for the HTH water products business, including branded and private label products. Offices and warehousing primarily support the businesses for swimming pool, spa and surface water products.
Conley, Georgia. This RCMS-certified site is the major manufacturing and technical center facility for our wood protection business in the U.S. Currently, most of our CCA is produced at this location and some of it is sent by rail to our Kalama, Washington facility for distribution to customers in the Western U.S. CCA is also bulk shipped from this plant to our other CCA customers and to our Valparaiso, Indiana facility. This site also produces our CCA-replacement products. Office facilities and a technical center for Treatment Products are also located at this facility.
Brandenburg, Kentucky. This ISO 9001:2000-certified plant covers an area of 200 acres, surrounded by approximately 1,140 acres of land that provides both a buffer zone and expansion capability. The plant contains multiple manufacturing facilities producing a wide range of products. Many of these products are derivatives of ethylene oxide and propylene oxide. A broad line of specialty polyols are produced in a flexible batch facility and sold into urethane coatings, adhesives, sealant and elastomer applications. Under a contract manufacturing agreement with the purchaser of the majority of the operations of our microelectronic chemicals business, we produce chemical intermediates for such microelectronic business in a separate manufacturing facility dedicated to this purpose at this site. There is an applications and technical center at the site that supports the development and technical service needs of the polyol and glycol products and wood coatings products. We also operate other facilities on the site to produce commodity and specialty chemicals for third parties under long-term contractual arrangements.
Lake Charles, Louisiana. This facility consists of two manufacturing operations that produce various hydrazine products. Both operations are ISO 9001:2008 certified. One operation produces propellant grade hydrazine products, including unsymmetrical dimethyl hydrazine and monomethyl hydrazine for use as fuel in satellites, expendable launch vehicles and the space shuttle orbital maneuvering systems. The second operation at this site produces propellant grade Ultra Pure™ hydrazine, the world’s purest grade of anhydrous hydrazine, principally for satellite propulsion.
20
Table of Contents
Rochester, New York. This ISO 9001:2000- and RC 14001-certified facility manufactures a large number of chemicals for the specialty chemicals industry. Many of these chemicals are biocides used to control dandruff on the scalp and to control the growth of micro-organisms, particularly fungi and algae. The largest 2-Chloropyridine production facility in the world is located here. 2-Chloropyridine is the key intermediate used to produce our Omadine® biocides. These products are based on the salts of the pyrithione molecule. We manufacture over a dozen pyrithione products at this site by modifying these salts by concentration, form or combining them with other biocides. This plant also manufactures our Triadine® brand of biocides, which are a combination of pyrithione and triazine, a bactericide purchased from a supplier. This facility also produces the Omacide® IPBC brand biocide, which is based upon iodopropargyl-n-butylcarbamate, a broad-spectrum fungicide. This facility also manufactures specialty ingredients for our personal care product line.
Charleston, Tennessee. This ISO 9001:2000- and RCMS-certified facility primarily produces, packages and stores calcium hypochlorite for the HTH water products business. At this plant, products are packaged into containers that range in size from two pounds to 2,000 pounds per container. Liquid and dry pool maintenance products are also formulated, packaged and stored at this site.
Trentham, Victoria, Australia. This facility produces CCA-based wood preservatives for the Australian market. The office services the Victoria, South Australian and Western Australian markets. The site is ISO 9001:2000-certified.
Igarassu and Salto, Brazil. These facilities produce and package calcium hypochlorite for the HTH water products business within Brazil. We also have a blending and repackaging facility in Salto, Brazil. The Salto facility also blends products for the biocides and personal care businesses.
Suzhou, China. This is our newest manufacturing facility. Beginning in 2009, this facility began producing a number of Omadine® biocides for personal care and industrial biocides products primarily for Asian markets. Omadine® biocides are based on the sodium, zinc, and copper salts of the pyrithione molecule and are used to control fungi and algae in a wide range of applications. In addition to manufacturing, this facility includes warehousing, sales, customer service and a technical support center for personal care and industrial biocides. Part of the manufacturing plant is already ISO 9001 certified.
Huddersfield, England. This ISO 9001:2000-certified facility formulates and packages Proxel® and Densil® biocide blends (which are based on BIT) for sale by our industrial biocides business and Tanalith® E preservative, one of the primary wood protection products. The products are packed in a variety of sizes from 25kg to full tank truck shipments. There are approximately 25 different product offerings.
Les Mureaux, France. This ISO 9001:2000-certified facility is located just northwest of Paris, France and serves as French headquarters for personal care ingredient products, timber products and industrial coating products. It also manufactures a limited supply of industrial coatings for the French market.
Swords, Ireland. This facility is located just north of Dublin, Ireland. 2-Chloropyridine is imported from our Rochester, New York facility and other sources and converted into zinc and copper salts of the pyrithione molecule. The products are ultimately shipped to customers in over fifty countries around the world. This facility is both ISO 9001:2000- and ISO 14001-certified.
Mariano Comense, Italy. This ISO 9001:2000-certified facility serves as the primary manufacturing location for our UV-based product line for our industrial coatings business. It also serves as a distribution location. Some product development work is also performed here.
Pianoro, Italy. This ISO 9001:2000-certified and ISO 14001-certified facility serves as the primary manufacturing location and research and development center for the industrial coatings business. It produces the Sayerlack® and LineaBlu® branded products that include both solvent- and water-borne urethane systems, stains and colors. In addition, the management for the distribution of these products throughout Italy and various export markets is located here.
21
Table of Contents
Auckland, New Zealand. This ISO 9001:2000-certified facility produces CCA-based wood preservatives and other wood preservative chemicals for the New Zealand market and serves as the commercial office for the New Zealand business.
Grangemouth, Scotland. This manufacturing site is owned and operated by Kemfine under a toll manufacturing arrangement with the Company. We own all of the equipment used in the direct manufacture of PHMB products as well as the HMBDA (Hexamethylene-1,6-Bis-Dicyandiamide) intermediate. The PHMB product is produced in various solutions and in a solid format.
Kempton Park, South Africa. This facility produces and packages calcium hypochlorite for the HTH water products business principally within the Southern Africa region. Other products for the swimming pool and water treatment markets are also packaged at this site. The site also includes office space.
| Item 3. | Legal Proceedings |
In connection with the Distribution, we assumed substantially all non-environmental liabilities for legal proceedings relating to our businesses as conducted prior to the Distribution Date. In addition, in the normal course of business, we are subject to other proceedings, lawsuits and other claims, including proceedings under laws and regulations related to environmental and other matters. All such matters are subject to many uncertainties and outcomes that are not predictable with assurance. While these other matters could materially affect operating results when resolved in future periods, it is management’s opinion that after final disposition, any monetary liability or financial impact to us beyond that provided in the Consolidated Balance Sheet as of December 31, 2009, would not be material to our consolidated financial position or annual results of operations.
| Item 4. | Submission of Matters to a Vote of Security Holders |
No matter was submitted to a vote of security holders during the three months ended December 31, 2009.
Executive Officers of the Registrant
The biographical information of the executive officers of the Company as of February 15, 2010 is noted below.
| Name and Age |
Office | |
| Michael E. Campbell (62) |
Chairman of the Board, President and Chief Executive Officer | |
| Hayes Anderson (49) |
Corporate Vice President, Human Resources | |
| Steven C. Giuliano (40) |
Corporate Senior Vice President and Chief Financial Officer | |
| Sarah A. O’Connor (50) |
Corporate Senior Vice President, Strategic Development and Chief Legal Officer | |
| Joseph H. Shaulson (44) |
Corporate Senior Vice President, Wood Protection, Industrial Coatings and Personal Care Ingredients | |
| Michael A. Cook (54) |
Senior Vice President, HTH Water Products | |
| Rick L. Walden (56) |
Senior Vice President, Health and Hygiene and Preservation and Protection Biocides, Performance Products and Asia Pacific | |
| W. Paul Bush (59) |
Vice President and Treasurer | |
| Meghan DeMasi (34) |
Controller |
No family relationship exists between any of the above named executive officers or between any of them and any Director of the Company. Such officers were elected or appointed to serve as such, subject to the Bylaws, until their respective successors are chosen.
Mr. Campbell was elected Chairman of the Board and Chief Executive Officer on February 7, 1999. On July 27, 2000, he was given the additional title of President. Prior to the Distribution, he was Executive Vice President of Olin and had global management responsibility for all of Olin’s businesses. Prior to his election as an Executive Vice President of Olin, Mr. Campbell served as President of Olin’s Microelectronic Materials Division. Prior to that time and since 1987, he served as Olin’s Corporate Vice President, Human Resources.
22
Table of Contents
Mr. Anderson was elected Corporate Vice President, Human Resources effective December 1, 2000. Prior to that, he had served as Vice President and General Manager, Semiconductor Chemicals and Services since June 8, 1999. Prior to that position and since February 19, 1999, Mr. Anderson was Business Director, Process Chemicals and Chemical Management Services. Prior to serving as Business Director and prior to the Distribution, Mr. Anderson served as Business Director, Chemical Management Services of Olin since 1995 and from 1993 to 1995 was Business Manager, Chemical Management Services at Olin.
Mr. Giuliano was elected Corporate Senior Vice President and Chief Financial Officer on September 23, 2009. From May 25, 2007 until then, he held the position of Vice President and Chief Financial Officer. Prior to that date and since January 27, 1999, he was Controller. Prior to the Distribution, Mr. Giuliano was an Audit Senior Manager for KPMG LLP and prior to that and since 1991, he held various positions of increasing responsibility for KPMG LLP, where he had overall responsibility for services provided in connection with audits, SEC filings, private offerings and other services for certain domestic and multinational clients.
Ms. O’Connor was elected Corporate Senior Vice President, Strategic Development, Chief Legal Officer and Secretary on September 23, 2009. Prior to then and since February 7, 1999, she was Corporate Vice President, General Counsel and Secretary. She was elected a Vice President of the Company on October 13, 1998 when the Company was a wholly owned subsidiary of Olin. Prior to the Distribution and since 1995, Ms. O’Connor served as Olin’s Director, Planning and Development. Ms. O’Connor became an Associate Counsel in the Olin Corporate Legal Department in 1989 and was promoted to Counsel in 1992 and to Senior Counsel in January 1995. She ceased to be Corporate Secretary on January 28, 2010.
Mr. Shaulson was elected Senior Vice President, Wood Protection, Industrial Coatings and Personal Care Ingredients on September 23, 2009. Prior to that and since August 8, 2008, he served as our Corporate Vice President, Strategic Development. Prior to that, and since 2001, he had served as President of the Reinforcements Business Unit of Hexcel Corporation, a leading advanced structural materials company. Prior to 2001, he served at Hexcel in various other executive positions, including Vice President of Corporate Planning & Chief Information Officer and Vice President of Corporate Development. Prior to joining Hexcel, Mr. Shaulson was a corporate associate in the law firm of Skadden, Arps, Slate, Meagher & Flom LLP from 1991 to 1996.
Mr. Cook was appointed Senior Vice President, HTH Water Products on September 23, 2009. Prior to that appointment, he served as Vice President and General Manager, Industrial Coatings, since 2007. Prior to that assignment, he was Director, HTH Water Products Marketing, from 2003 to 2007. Mr. Cook joined the Company in 1978 and has held various positions of increasing responsibility in marketing, international business, strategic sourcing and manufacturing.
Mr. Walden was appointed Senior Vice President, Health and Hygiene and Preservation and Protection Biocides, Performance Products and Asia-Pacific, on September 23, 2009. Prior to that and since January 2007, he served as Vice President and General Manager, Industrial Biocides and Performance Products. Before that and since May 2005, he was Director of Performance Products and also led the hydrazine business and the sulfuric acid business until the latter was divested in 2003.
Mr. Bush was elected Treasurer on February 7, 1999 and also appointed a Vice President on that date. Prior to the Distribution and since February 1998, Mr. Bush was a consultant to Olin. Prior to February 1998, and since March 1994, he was Vice President, Treasurer and then Vice President, Investments of Johnson & Higgins, an insurance brokerage and benefits consulting firm. Prior to 1994, he held various managerial positions, including Vice President and Treasurer and Vice President, Financial Planning and Analysis for Squibb Corporation.
Ms. DeMasi was elected Controller on May 25, 2007. Prior to this date and since April 1, 2006, Ms. DeMasi was Assistant Controller and prior to that and since April 2003, she was the Director of Financial Reporting and Corporate Accounting. Prior to April 2003, she was an Audit Manager for KPMG LLP, where she had overall responsibility for services provided in connection with audits and SEC filings.
23
Table of Contents
| Item 5. | Market for the Registrant’s Common Equity, Related Stockholder Matters and Issuer Purchases of Equity Securities |
As of January 31, 2010, there were approximately 4,120 record holders of the Company’s common stock.
The Company’s common stock is traded on the New York Stock Exchange (“NYSE”) under the symbol “ARJ.” In 2009, the Company submitted without qualification the required Section 303A.12(a) CEO annual certification to the NYSE and has filed as Exhibits 31.1 and 31.2 to this Report the certifications required by Section 302 of the Sarbanes-Oxley Act.
Information concerning the high and low sales prices of the Company’s common stock and dividends paid on common stock during each quarterly period for the last two most recent fiscal years is set forth in Note 24 of Notes to Consolidated Financial Statements contained in Item 8 of this Report.
Among the provisions the Company’s major domestic debt agreements are restrictions relating to the payments of dividends and the repurchase by the Company of its common stock based on a financial formula. As of December 31, 2009, dividends and stock repurchases were limited to $84.6 million.
The Company has not repurchased any shares of the Company’s common stock in the three months ending December 31, 2009.
See Item 12 of this Report for Equity Compensation Plan information.
24
Table of Contents
Comparison of Five Year Cumulative Total Return Among Arch Chemicals, Inc.,
the S&P 500 Index and the S&P Chemicals (Specialty) Index and the S&P 500 Chemicals Index
The graph below compares the cumulative total shareholder return of the Company’s common stock to the Standard & Poor’s 500 Index, the Standard & Poor’s Chemicals (Specialty) Index and the Standard & Poor’s 500 Chemicals Index for the period from December 31, 2004 to December 31, 2009, the last trading day of the Company’s fiscal year. The graph assumes that the value of the investment in the common stock and each index was $100 at close of December 31, 2004 and that all dividends were reinvested. The total cumulative dollar returns shown on the graph represent the value that such investments would have had on December 31, 2009.
The Company has added the Standard & Poor’s 500 Chemicals Index for the first time and will use this index to replace the Standard & Poor’s Chemicals (Specialty) Index in future performance graphs. With The Dow Chemical Company’s acquisition of the Rohm and Haas Company on April 1, 2009, the Standard & Poor’s Chemicals (Specialty) Index is now comprised of just three companies; namely, Ecolab Inc., International Flavors & Fragrances Inc. and Sigma-Aldrich Corporation. All three of these companies are included in the Standard & Poor’s 500 Chemicals Index, along with ten other chemical companies. Therefore, we believe the Standard & Poor’s 500 Chemicals Index provides a broader and more accurate basis to compare our performance.
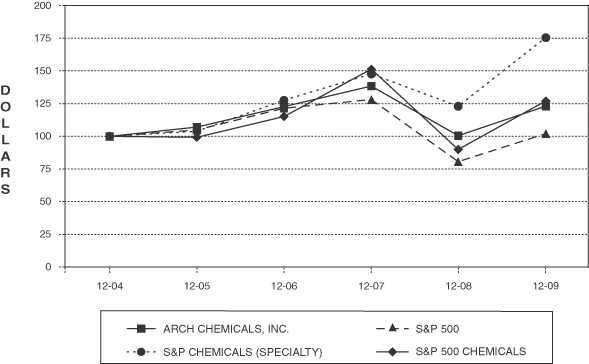
| Years Ending December 31 | ||||||||||||||||||
| 2004 | 2005 | 2006 | 2007 | 2008 | 2009 | |||||||||||||
| ARCH CHEMICALS, INC. |
$ | 100.0 | $ | 107.2 | $ | 122.6 | $ | 138.4 | $ | 100.6 | $ | 122.9 | ||||||
| S&P 500 |
100.0 | 104.9 | 121.5 | 128.2 | 80.7 | 102.1 | ||||||||||||
| S&P CHEMICALS (SPECIALTY) |
100.0 | 103.9 | 127.5 | 147.6 | 123.0 | 175.2 | ||||||||||||
| S&P 500 CHEMICALS |
100.0 | 99.3 | 115.3 | 151.4 | 90.1 | 126.8 | ||||||||||||
25
Table of Contents
| Item 6. | Selected Financial Data |
The following table summarizes certain selected historical financial and operating information with respect to the Company and is derived from the Consolidated Financial Statements of the Company. The financial data as of and for each of the years in the three-year period ended December 31, 2009 were derived from the audited financial statements included elsewhere herein. Such historical financial data may not be indicative of the Company’s future performance. The information set forth below should be read in conjunction with “Management’s Discussion and Analysis of Financial Condition and Results of Operations” and the historical Consolidated Financial Statements and Notes thereto included elsewhere in this Form 10-K. The following information is qualified in its entirety by the information and financial statements appearing elsewhere in this Form 10-K. See Note 1 of the Notes to Consolidated Financial Statements for additional information.
| As of and For the Years Ended December 31, | ||||||||||||||||||||
| 2009 | 2008 | 2007 | 2006 | 2005 | ||||||||||||||||
| ($ in millions, except per share amounts) | ||||||||||||||||||||
| Operations |
||||||||||||||||||||
| Sales |
$ | 1,391.9 | $ | 1,492.1 | $ | 1,487.6 | $ | 1,402.9 | $ | 1,270.6 | ||||||||||
| Cost of Goods Sold (1) |
979.3 | 1,063.3 | 1,055.7 | 1,029.3 | 922.7 | |||||||||||||||
| Selling and Administration (2) |
305.4 | 295.5 | 309.7 | 282.1 | 263.7 | |||||||||||||||
| Research and Development |
22.7 | 21.8 | 20.1 | 18.2 | 21.2 | |||||||||||||||
| Other (Gains) and Losses (3) |
— | (1.8 | ) | (12.8 | ) | (2.4 | ) | (3.9 | ) | |||||||||||
| Impairment, Restructuring and Other Expense (4) |
1.1 | 27.1 | 16.0 | 23.5 | 0.9 | |||||||||||||||
| Interest Expense, net (5) |
12.2 | 10.7 | 13.3 | 20.3 | 19.5 | |||||||||||||||
| Income from Continuing Operations Before Taxes, Equity in Earnings of Affiliated Companies and Cumulative Effect of Accounting Change |
71.2 | 75.5 | 85.6 | 31.9 | 46.5 | |||||||||||||||
| Equity in Earnings of Affiliated Companies |
0.6 | 0.4 | 0.5 | 0.8 | 13.1 | |||||||||||||||
| Income Tax Expense |
24.7 | 38.9 | 36.8 | 18.6 | 19.8 | |||||||||||||||
| Income from Continuing Operations Before Cumulative Effect of Accounting Change |
47.1 | 37.0 | 49.3 | 14.1 | 39.8 | |||||||||||||||
| Income (Loss) from Discontinued Operations, net of tax (6) |
— | — | (14.0 | ) | 0.1 | 1.2 | ||||||||||||||
| Cumulative Effect of Change in Accounting, net of tax (7) |
— | — | — | — | (0.5 | ) | ||||||||||||||
| Net Income |
$ | 47.1 | $ | 37.0 | $ | 35.3 | $ | 14.2 | $ | 40.5 | ||||||||||
| Diluted Income Per Share |
$ | 1.88 | $ | 1.49 | $ | 1.43 | $ | 0.58 | $ | 1.70 | ||||||||||
| Common Dividends Per Share |
0.80 | 0.80 | 0.80 | 0.80 | 0.80 | |||||||||||||||
| Other |
||||||||||||||||||||
| Capital Expenditures |
29.9 | 53.3 | 41.6 | 26.7 | 18.3 | |||||||||||||||
| Depreciation |
34.7 | 34.5 | 34.8 | 35.4 | 39.2 | |||||||||||||||
| Amortization of Intangibles |
12.0 | 11.0 | 10.2 | 8.9 | 7.4 | |||||||||||||||
| Effective Tax Rate (8) |
34.4 | % | 51.3 | % | 42.7 | % | 56.9 | % | 33.2 | % | ||||||||||
| Financial Position |
||||||||||||||||||||
| Working Capital (9) |
$ | 192.5 | $ | 219.9 | $ | 178.0 | $ | 143.2 | $ | 129.1 | ||||||||||
| Property, Plant and Equipment, net |
214.9 | 212.2 | 201.4 | 193.3 | 191.4 | |||||||||||||||
| Total Assets |
1,210.5 | 1,232.4 | 1,188.2 | 1,149.6 | 1,068.8 | |||||||||||||||
| Long-Term Debt, excluding current portion |
257.7 | 314.5 | 178.8 | 62.4 | 217.8 | |||||||||||||||
| Shareholders’ Equity |
404.9 | 361.9 | 474.4 | 366.2 | 365.0 | |||||||||||||||
| Capitalization |
695.6 | 694.9 | 682.6 | 583.2 | 591.8 | |||||||||||||||
Notes to Selected Financial Data appear on the next page.
26
Table of Contents
| (1) | Cost of Goods Sold for 2009 includes a benefit of $2.9 million related to a LIFO decrement and a benefit of $1.0 million related to the 2009 favorable antidumping ruling which impacted purchases made by the Company from June 1, 2007 to May 31, 2008. Cost of Goods Sold for 2008 includes a benefit of $11.5 million related to the 2008 favorable antidumping ruling which impacted purchases made by the Company from June 1, 2006 to May 31, 2007. Cost of Goods Sold for 2007 includes a benefit of $16.9 million related to the 2007 favorable antidumping ruling which impacted purchases made by the Company from December 16, 2004 to May 31, 2006. Additionally, Cost of Goods Sold for 2007 includes a $0.4 million charge related to the disposal of inventory resulting from the Company’s decision to discontinue the manufacturing of its BIT molecule. Cost of Goods Sold for 2006 includes a charge of $3.6 million for an early termination of a supply contract. |
| (2) | Selling and Administration expenses for 2007 include $6.3 million of costs as a result of the favorable antidumping duty ruling. |
| (3) | Other (Gains) and Losses for 2008 represents the reversal of penalties and interest related to a Brazilian state import tax claim recorded in 2004 of $1.4 million due to the expiration of the statute of limitations and a $0.4 million gain from a revised estimate of shutdown costs related to the completion of a contract with the U.S. Government in 2007. Other (Gains) and Losses for 2007 represents a gain for the completion of a contract with the U.S. Government. Other (Gains) and Losses for 2006 represents the pre-tax gain on the sale of excess land of $0.8 million, a pre-tax gain on the sale of certain assets in Brazil of $0.4 million and a pre-tax gain of $1.2 million from the sale of an investment in an industrial coatings business. Other (Gains) and Losses for 2005 represents the pre-tax gain on the sale of excess land in Brandenburg, Kentucky of $5.8 million that was partially offset by a charge for Brazilian state import tax claims of $1.9 million. |
| (4) | Impairment, Restructuring and Other Expense consist of the following: |
| Impairment Charge — | 2008 represents a $24.6 million charge for the impairment of goodwill related to the Company’s industrial coatings business and a $1.2 million charge for certain manufacturing assets in the wood protection and industrial coatings businesses. 2007 includes a charge of $7.9 million for the impairment of manufacturing assets in conjunction with the Company’s decision to discontinue the manufacturing of its BIT molecule. 2006 represents a charge for the impairment of goodwill related to the Company’s industrial coatings business. 2005 includes a $0.9 million charge for land located in China that the Company transferred to the Chinese government in exchange for additional land. | |
| Restructuring and Other Expense — | 2009 represents executive severance. 2008 represents a $1.3 million cash charge related to a pension settlement associated with executive severance recorded in 2007. 2007 includes a $7.2 million charge relating to the Company’s decision to discontinue the manufacturing of its BIT molecule. Additionally, 2007 includes $0.9 million of executive severance costs. | |
| (5) | Interest Expense, net for 2008 includes $1.2 million of interest income related to the favorable antidumping ruling for the period from June 1, 2006 to May 31, 2007. Interest Expense, net for 2007 includes $1.5 million of interest income related to the favorable antidumping ruling for the period from December 16, 2004 to May 31, 2006. |
27
Table of Contents
| (6) | The following details the components of Income (Loss) from Discontinued Operations, net of tax: |
| ($ in millions) |
As of and For the Years Ended December 31, | |||||||||||||||||
| 2009 | 2008 | 2007 | 2006 | 2005 | ||||||||||||||
| Discontinued Operations, Results of Operations: |
||||||||||||||||||
| Performance Urethanes Venezuelan business (a) |
$ | — | $ | — | $ | 0.9 | $ | 0.8 | $ | — | ||||||||
| Microelectronic Materials (b) |
— | — | — | (0.7 | ) | (1.6 | ) | |||||||||||
| Gain (Loss) on Sales of Discontinued Operations: |
||||||||||||||||||
| Performance Urethanes Venezuelan business (c) |
— | — | (14.9 | ) | — | — | ||||||||||||
| Hickson organics operations (d) |
— | — | — | — | 2.8 | |||||||||||||
| Total Income (Loss) from Discontinued Operations, net of tax |
$ | — | $ | — | $ | (14.0 | ) | $ | 0.1 | $ | 1.2 | |||||||
| (a) | Represents the results of operations, net of tax, for the performance urethanes business in Venezuela for all years presented through the date of sale in September 2007. |
| (b) | Represents the results of operations, net of tax, for the chemical management services business through December 31, 2006. |
| (c) | Represents the loss on sale of the performance urethanes business in Venezuela. |
| (d) | 2005 represents the recovery of £1.7 million (approximately $2.9 million pre-tax) related to two outstanding notes from the sale of the Hickson organics Castleford operations, that were previously reserved due to uncertainty concerning the collectibility. |
| (7) | 2005 reflects the impact of adoption of Financial Accounting Standards Board (“FASB”) Accounting Standards Codification (“ASC”) 410 “Asset Retirement and Environmental Obligations” (formerly FASB Interpretation No. 47, “Accounting for Conditional Asset Retirement Obligations—An Interpretation of FASB Statement No. 143”). |
| (8) | The effective tax rate is based on continuing operations before cumulative effect of accounting change. The 2009 effective income tax rate was 34.4%. The 2008 effective income tax rate of 51.3% is impacted by the non-deductible goodwill impairment charge of $24.6 million. Excluding the goodwill impairment charge, the effective tax rate was 38.7%. In 2007, legislation was finalized in the U.K. which reduced the corporate tax rate from 30% to 28%. Included in 2007 is $3.0 million of tax expense that represents the reduction of a tax benefit previously recorded directly through equity, related to the U.K. pension liabilities. The original tax benefit was not recorded in the income statement. Additionally, 2007 includes a $1.8 million benefit resulting from the impact of a change in the Italian corporate tax rate on deferred tax liabilities which were recorded in purchase accounting. Additionally, the net impact of Other (Gains) and Losses and Restructuring and Impairment was to increase the effective tax rate for 2007 by approximately three percent. Excluding the effect of the U.K. and Italy tax legislation noted above, Other (Gains) and Losses, and the Restructuring and Impairment charges, the effective tax rate for 2007 is 36.6%. The 2006 effective income tax rate of 56.9% includes the non-deductible Impairment charge of $23.5 million. Excluding the Impairment, the effective tax rate was 33.1%. |
| (9) | Working capital excludes cash, short-term debt and assets held for sale. |
28
Table of Contents
| Item 7. | Management’s Discussion and Analysis of Financial Condition and Results of Operations |
This Management’s Discussion and Analysis of Financial Condition and Results of Operations should be read in conjunction with the Company’s Consolidated Financial Statements and Notes thereto included elsewhere herein. Sales consist of sales to third parties net of any discounts. Gross Margin is defined as Sales less Cost of Goods Sold, which includes raw materials, labor, overhead and depreciation associated with the manufacture of the Company’s various products and shipping and handling costs. In addition, segment operating income excludes restructuring (income) expense and impairment. The Company believes the exclusion of restructuring and impairment expense from segment operating income provides additional perspective on the Company’s underlying business trends and provides useful information to investors by excluding amounts from the Company’s results that the Company does not believe are indicative of ongoing operating results. Other gains and losses that are directly related to the segments are included in segment operating results.
The recent turmoil in the global economy has impacted the operating performance of several of the Company’s businesses towards the end of 2008 and throughout 2009. In particular, the overall economic environment for our wood protection and industrial coatings businesses was depressed in 2008 and this has persisted throughout 2009. New housing starts are down significantly and consumers continue to be faced with general economic uncertainty, fueled by weak consumer credit markets and lagging consumer confidence as a result of the volatile and often erratic financial markets experienced over recent years. All of these factors have negatively impacted consumer demand for furniture as well as decreased demand for lumber and other construction materials. This has put pressure on the operating results and cash flows of these businesses. Additionally, the depressed economy in 2009 has impacted our performance urethanes business, reducing its overall operating results, through its inability to fully pass along price increases. If the results for these businesses were to continue to decline further and if there is no recovery over the next several years, the earnings and the cash flows for these businesses may be significantly impacted, which could impair certain long-lived assets for these businesses.
Results of Operations
Consolidated
| Years Ended December 31, | |||||||||||
| 2009 | 2008 | 2007 | |||||||||
| (in millions, except per share amounts) |
|||||||||||
| Sales |
$ | 1,391.9 | $ | 1,492.1 | $ | 1,487.6 | |||||
| Gross Margin |
412.6 | 428.8 | 431.9 | ||||||||
| Selling and Administration |
305.4 | 295.5 | 309.7 | ||||||||
| Research and Development |
22.7 | 21.8 | 20.1 | ||||||||
| Other (Gains) and Losses |
— | (1.8 | ) | (12.8 | ) | ||||||
| Restructuring and Other Expense |
1.1 | 1.3 | 8.1 | ||||||||
| Impairment Charge |
— | 25.8 | 7.9 | ||||||||
| Interest Expense, net |
12.2 | 10.7 | 13.3 | ||||||||
| Equity in Earnings of Affiliated Companies |
0.6 | 0.4 | 0.5 | ||||||||
| Income Tax Expense |
24.7 | 38.9 | 36.8 | ||||||||
| Income from Discontinued Operations, net of tax |
— | — | 0.9 | ||||||||
| Loss on the Sale of Discontinued Operations, net of tax. |
— | — | (14.9 | ) | |||||||
| Net Income |
$ | 47.1 | $ | 37.0 | $ | 35.3 | |||||
| Basic Income Per Share |
$ | 1.89 | $ | 1.49 | $ | 1.44 | |||||
| Diluted Income Per Share |
$ | 1.88 | $ | 1.49 | $ | 1.43 | |||||
| Weighted Average Common Stock Outstanding: |
|||||||||||
| Basic |
25.0 | 24.8 | 24.5 | ||||||||
| Diluted |
25.1 | 24.9 | 24.7 | ||||||||
29
Table of Contents
The Company is a global biocides company providing chemistry-based and related solutions to selectively destroy and control the growth of harmful microbes. Our concentration is in water treatment, hair and skin care products, wood treatment, preservation and protection applications such as for paints and building products, and health and hygiene applications. The Company is a global market leader in supplying biocides for incorporation into interior and exterior paints, wallboard, ceiling tiles and other building products to deter the growth of mold and mildew, the major causes of the Sick Building Syndrome. The Company operates in two segments: Treatment Products and Performance Products.
Arch’s Treatment Products business segment generates approximately 80%—90% of the Company’s annual sales. It includes three reportable business units: HTH water products, personal care and industrial biocides, and wood protection and industrial coatings.
The core competencies of the Treatment Products segment are superior microbiology, analytical chemistry and chemical formulation skills as well as extensive knowledge of—and expertise in—the regulatory procedures that govern the use of these biocide products, and particularly excellence in toxicology on which those regulations are based. The Company must understand the biological and chemical effects of its products and excel at both developing new products and finding new applications for existing ones. The Company has invested in upgrading and expanding its technical strengths in these disciplines to meet increasingly global regulatory requirements, including those relating to the European Biocidal Products Directive (“BPD”), which requires biocide manufacturers to re-register their biocidal products for sale in the EU, and the EU’s Registration, Evaluation and Authorization of Chemical Substances (REACH) legislation. While some companies view these increasing foreign regulations as a hindrance or barrier, and while such regulations can create uncertainty in the marketplace, overall, the Company sees it as a competitive advantage due to our expertise and commitment to regulatory requirements.
Critical success factors for the Company include finding innovative ways to develop new products to meet its customers’ needs; reducing overall product sourcing costs; optimizing its overall global manufacturing facilities to maximize efficiencies in the manufacturing processes; leveraging toxicological, regulatory and microbiological technical strengths to achieve global compliance of the Company’s products under existing and new legislation such as the BPD and REACH; and fixing or eliminating unprofitable businesses. In addition, several of its customers generally require that the Company demonstrate improved efficiencies, through cost reductions and/or price decreases. The Company’s continued growth will come from organic growth and through strategic acquisitions.
The Company’s major sales, distribution and production facilities are located in North America and Europe. Additional facilities are based in Latin America, Asia, Australia and South Africa. Approximately 50% of sales and total long-lived assets, excluding goodwill, are outside the U.S. Accordingly, the Company has exposure to fluctuations in foreign currency exchange rates. These fluctuations impact the translation of sales, earnings, assets and liabilities from the local functional currency to the U.S. dollar. Operating units outside the U.S. that purchase raw materials in U.S. dollars are also impacted by fluctuations in foreign currency exchange rates.
The Company has an annual compensation plan and a long-term incentive compensation plan for its executives and other employees. The annual plan’s financial targets for corporate and senior management are diluted earnings per share and cash flow. The numerator for diluted earnings per share is net income adjusted for any extraordinary income or expense, special charges or gains, impairment charges, and gains or losses on sales of businesses or sales not in the ordinary course of business (“adjusted net income”). Cash flow is defined as EBITDA, plus or minus the change in working capital, less capital spending. The annual plan’s financial targets for the business units are pre-tax income and cash flow. The Company’s long-term incentive plan target is Return on Equity (“ROE”). ROE is defined as adjusted net income divided by average shareholder’s equity (the average calculated using the shareholder’s equity at the beginning and the end of the fiscal year, excluding the impact on ending shareholder’s equity of any adjustments to net income). These financial metrics are key performance indicators utilized by the Company to evaluate its performance against stated goals. In addition, the estimated and actual performance against such targets can have a significant impact on the amount of incentive compensation expense recorded by the Company. In 2008, the Company modified certain of its long-term
30
Table of Contents
incentive plan awards so that a portion are paid out in stock and a portion are paid out in cash. The portion of the award paid out in cash is based upon market price of the Company’s common stock, and therefore, the amount of incentive compensation expense would vary based upon the market price of the Company’s stock at the end of each reporting period. During the fourth quarter of 2008, the Company entered into equity total return swap agreements in order to minimize earnings volatility related to the long-term incentive plan. For additional information, see Note 13 of Notes to the Consolidated Financial Statements.
The Company has a disciplined acquisition process aimed at complementing its strengths and advancing its business strategies. The Company focuses on acquisition opportunities in its core biocides business areas and screens them against specific strategic criteria we have identified in those areas. Acquisition opportunities are also screened against specific financial targets. Any acquisition must be cash accretive in year one and earnings accretive no later than the end of the first year. When an opportunity meets our strategic and financial criteria, a detailed integration plan is developed prior to completing the acquisition.
The Company’s 2009 net sales benefited from a full year of sales from the 2008 acquisition of the water treatment chemicals business of Advantis Technologies (“Advantis”).
Year Ended December 31, 2009 Compared to 2008
Sales decreased $100.2 million or seven percent. Excluding the impact of the acquisition of Advantis, $49.1 million or three percent, sales decreased $149.3 million, or 10 percent, due to lower volumes. Higher pricing, two percent, was offset by unfavorable foreign exchange, two percent. The lower volumes were across all businesses as unfavorable weather patterns in North America impacted the HTH water products business and the continued downturn in the economy impacted the remaining businesses. The higher pricing was principally driven by the HTH water products business.
Gross margin percentage was 29.6% and 28.7% for 2009 and 2008, respectively. The margin improvement was principally due to improved pricing in the HTH water products business, which offset higher raw material costs for that business. Additionally, gross margin percentage benefited from lower raw material costs in the industrial coatings business and higher pricing in the wood protection business. During 2009 the Company recorded a $2.9 million benefit related to a LIFO decrement, which partially offset higher unabsorbed costs. Included in the 2009 and 2008 gross margins were $1.0 million and $11.5 million, respectively, of antidumping duty benefits related to final determinations from the U.S. Department of Commerce (“DOC”).
Selling and administration expenses as a percentage of sales were 21.9% in 2009 and 19.8% in 2008. The increase in Selling and administration expenses as a percentage of sales in 2009 was principally due to lower sales volumes. Selling and administration expenses increased $9.9 million from 2008 principally due to a full year of the Advantis acquisition, higher pension expense and lower compensation-related expense in 2008 as a result of the mark-to-market impact of the Company’s lower stock price on the Company’s performance-based stock awards and deferred compensation plans. These increases to Selling and administration expenses were partially offset by favorable foreign exchange and lower selling costs.
Other (gains) and losses for 2008 represents the reversal of penalties and interest related to a Brazilian state import tax claim recorded in 2004 of $1.4 million due to the expiration of the statute of limitations and a $0.4 million gain from a revised estimate of shutdown costs related to the completion of a contract with the U.S. Government in 2007.
Restructuring and other expense in 2009 relates to executive severance and in 2008 relates to a pension settlement associated with executive severance recorded in 2007.
The impairment charge of $25.8 million in 2008 represents a $24.6 million charge for the impairment of the remaining goodwill related to the Company’s industrial coatings business and a $1.2 million non-cash charge related to certain manufacturing assets in the Company’s wood protection and industrial coatings businesses.
31
Table of Contents
Interest expense, net, increased $1.5 million as the 2008 results included interest income of $1.2 million related to the final determination from the DOC for the second period of review. Additionally, higher net debt during 2009, due to the acquisition of Advantis, was partially offset by lower cost of borrowings.
The tax rate on income from continuing operations for 2009 and 2008 was 34.4% and 51.3%, respectively. The 2009 effective income tax rate was lower due to the benefits from the recognition of additional tax deductions in conjunction with the completion of the examination of certain tax returns and the expiration of the statute of limitations for certain tax matters. The 2008 effective income tax rate of 51.3% included the non-deductible goodwill impairment charge of $24.6 million. Excluding the goodwill impairment charge, the effective tax rate was 38.7%.
Antidumping Rulings
During the fourth quarter of 2009, the DOC made its final determination that reduced the Company’s antidumping duty rate to 20% for chlorinated isocyanurates (“isos”) that the Company imported from a major Chinese supplier for the period from June 1, 2007 through May 31, 2008. As a result of the final determination, the Company began paying cash deposits for imports at a rate of approximately 20% in December of 2009 and recorded a pre-tax benefit of $1.0 million in the fourth quarter of 2009. Since this determination was not appealed, the cash refund is expected to be received during 2010.
During the third quarter of 2008, the DOC made its final determination that reduced the Company’s antidumping duty rate from 76% to less than 1% for isos that the Company imported from a major Chinese supplier for the period from June 1, 2006 through May 31, 2007. As a result of the final determination, the Company recorded a pre-tax benefit of $12.7 million, including $1.2 million of interest, in the third quarter of 2008. An appeal is pending with the Court of International Trade contesting the DOC’s determination. The appeal is delaying the cash refund of the duty to the Company and may result in a change of the duty rate for this review period. The Company does not expect that the resolution of this matter will have a material adverse effect on the Company.
During the fourth quarter of 2007, the DOC made its final determination that reduced the Company’s antidumping duty rate from 76% to 20% for isos that the Company imported from a major Chinese supplier for the period from December 16, 2004 through May 31, 2006. As a result of the final determination and the revised rate, the Company recorded a net pre-tax benefit of $12.1 million, including $1.5 million of interest, in the fourth quarter of 2007. The DOC’s determination was appealed to the Court of International Trade, which has delayed the processing of the full refund the Company was expecting to receive. On July 13, 2009, the Court of International Trade issued its decision which required the DOC to review additional information and revise the rate accordingly. The DOC complied, but has asked the Court’s permission to continue its review. The revised rate could be favorable to the Company by up to $3 million and the Company expects a final ruling in 2010. The Company does not expect that the resolution of this matter will have a material adverse effect on the Company.
An administrative review has also commenced to determine the final rate for the period of June 1, 2008 to May 31, 2009.
Significant Contracts
The Performance Products segment is highly dependent on contract manufacturing arrangements with various terms. The annual operating results for this segment will decrease by approximately $12 million after December 31, 2009 due to the anticipated conclusion of a long-term contract manufacturing arrangement. The Company believes that its overall organic growth, and pipeline of new product offerings, should offset this impact.
32
Table of Contents
2010 Outlook
The Company expects full-year 2010 sales to increase by approximately eight to ten percent as a result of strong organic growth from the biocides businesses. Earnings per share are forecast to be in the $1.90 to $2.10 range. This forecast reflects the long-planned reduction in contract manufacturing of $12 million, or approximately $0.30 per share, in the non-core performance urethanes business. Depreciation and amortization is estimated to be in the $45 to $50 million range, while capital spending should be in the $35 to $40 million range. The effective tax rate is estimated to be in the 35% to 36% range.
The Company’s 2010 outlook assumes modestly improving market conditions in many of the Company’s key regions and normal weather patterns in North America. The HTH water products business is expected to report higher profits driven by improved volumes in North America, Latin America and South Africa. The guidance assumes the Company will recognize a pre-tax benefit (approximately $3 million) from a lower antidumping duty rate due to the expected favorable final ruling in 2010 of the first administrative period under appeal, which covers isos purchased from December 31, 2004 to May 31, 2006. This estimated benefit is expected to be offset by a pre-tax charge from an anticipated higher antidumping duty rate for the fourth administrative period under review covering isos purchased from June 1, 2008 to May 31, 2009.
The Company expects improved operating results for personal care and industrial biocides due to higher volumes, favorable raw material and sourcing costs and increased production rates, which should more than offset increased spending for regulatory and toxicology compliance. The increased demand for the Company’s biocides is expected in health and hygiene applications and in industrial applications for building products and plastics as a result of improving market conditions and market penetration. Wood protection and industrial coatings results are forecast to improve as a result of a moderate recovery in the global housing and construction markets in 2010, in addition to new customer acquisitions and new applications in the wood protection business. Performance products results are expected to be significantly below 2009 due to the anticipated reduction in contract manufacturing business in the performance urethanes business and higher plant costs related to manufacturing hydrazine propellants for the U.S. government. In addition, the Company expects to have higher pension expense and increased interest expense.
For the first quarter, the Company anticipates earnings per share to be in the breakeven to $0.10 per share range, compared to earnings of $0.13 per share during the first quarter of 2009. The expected decrease in first quarter results is due to lower performance urethanes results caused by a reduction in its contract manufacturing business. The Company is projecting a year-over-year improvement from its wood protection and industrial coatings business in the quarter to be offset by lower HTH water products results due to timing. In addition, the Company anticipates higher pension expense.
Year Ended December 31, 2008 Compared to 2007
The Company’s 2008 net sales of $1,492.1 million were comparable to the prior year’s net sales of $1,487.6 million. Excluding the impact of the acquisition of the remaining 51 percent share of the Company’s Australian joint venture, Koppers Arch Wood Protection (Aust) Pty Ltd (“KAWP”) ($35.7 million or two percent), and the impact of the acquisition of the water treatment chemicals business of Advantis ($21.8 million or two percent), sales decreased $53.0 million, or four percent, as lower volumes (eight percent) were partially offset by improved pricing (four percent). The lower volumes were principally in the performance urethanes and wood protection businesses. The higher pricing was driven by the performance urethanes, HTH water products and wood protection businesses.
Gross margin percentage was 28.7% and 29.0% for 2008 and 2007, respectively. Higher pricing for the performance urethanes, HTH water products and wood protection businesses, and the benefit from the Company’s margin-improvement programs for the industrial biocides business, which included improvements in customer mix and the sourcing of the BIT molecule from third-party suppliers, were offset by higher raw material costs for the performance urethanes and wood protection businesses and lower sales volumes. Included
33
Table of Contents
in the 2008 and 2007 gross margin was an $11.5 million and a $16.9 million, respectively, antidumping duty benefit related to a final determination from the DOC. Additionally, included in cost of goods sold for 2007 is $0.4 million of inventory disposal costs related to the Company’s decision to discontinue the manufacturing of its BIT molecule.
Selling and administration expenses as a percentage of sales decreased to 19.8% in 2008 from 20.8% in 2007. The $14.2 million decrease in selling and administration expenses is due to lower compensation-related expense, principally as a result of the mark-to-market impact of the lower stock price during 2008 on the Company’s performance-based stock awards and deferred compensation plans, lower pension expense and favorable foreign exchange, partially offset by increased selling and administration expenses due to the KAWP and Advantis acquisitions.
Other (gains) and losses for 2008 represents the reversal of penalties and interest related to a Brazilian state import tax claim recorded in 2004 of $1.4 million due to the expiration of the statute of limitations and a $0.4 million gain from a revised estimate of shutdown costs related to the completion of a contract with the U.S. Government in 2007. Other (gains) and losses for 2007 represents a gain for the completion of a contract with the U.S. Government.
Restructuring and other expense during 2008 relates to a pension settlement associated with executive severance which was recorded in 2007. Restructuring expense of $8.1 million during 2007 includes $4.0 million for severance costs principally related to headcount reductions in the industrial biocides business resulting from the Company’s decision to discontinue the manufacturing of its BIT molecule at two U.K. manufacturing locations and begin sourcing from third-party suppliers. In addition, restructuring expense includes $3.2 million primarily for service agreements at the two U.K. sites from which the Company will no longer receive any economic benefit. Included in restructuring is $0.9 million related to executive severance.
The impairment charge of $25.8 million in 2008 represents a $24.6 million charge for the impairment of the remaining goodwill related to the Company’s industrial coatings business and a $1.2 million non-cash charge related to certain manufacturing assets in the Company’s wood protection and industrial coatings businesses. The impairment charge of $7.9 million in 2007 is related to the manufacturing assets in the Seal Sands, England and Huddersfield, England manufacturing locations that were impacted by the Company’s decision to discontinue the manufacturing of its BIT molecule and to source the material from third-party suppliers.
Interest expense, net, decreased $2.6 million primarily as a result of lower cost borrowings, partially offset by higher net debt during the period.
The tax rate on income from continuing operations for 2008 and 2007 was 51.3% and 42.7%, respectively. The 2008 effective income tax rate of 51.3% includes the non-deductible goodwill impairment charge of $24.6 million. Excluding the goodwill impairment charge, the effective tax rate was 38.7%. The effective tax rate for 2007 was 36.6%, excluding the effect of the U.K. and Italy tax legislation, other (gains) and losses, restructuring and impairment charges. The increase from 2007 is due to higher non-deductible expense and an increase in foreign remitted earnings.
The 2007 tax rate was impacted by legislation that was finalized in the U.K. which reduced the corporate tax rate from 30% to 28%. The Company has significant U.K. deferred tax assets principally related to the Company’s U.K. pension plans. As a result of the tax rate change, the Company’s deferred tax assets were reduced, with a corresponding increase in tax expense. Included in 2007 is $3.0 million of non-cash tax expense that represents the reduction of a tax benefit previously recorded directly through equity, related to the U.K. pension liabilities. The original tax benefit was not recorded in the income statement. Additionally, 2007 includes a $1.8 million benefit resulting from the impact of a change in the Italian corporate tax rate on deferred tax liabilities which were recorded in purchase accounting. As a result of the tax rate change from 37.3% to 31.4%,
34
Table of Contents
the Company’s deferred tax liabilities were reduced, with a corresponding tax benefit. The net impact of other (gains) and losses, restructuring and impairment charges was to increase the effective tax rate for 2007 by approximately three percent.
Income from discontinued operations, net of tax, represented the results of operations for the non-strategic performance urethanes business in Venezuela, until its sale in September 2007.
The loss on sales of discontinued operations, net of tax, during 2007 relates to the divestiture of the non-strategic performance urethanes business in Venezuela. The Company recorded a non-cash, after-tax loss of $14.9 million on this transaction due to the recognition of historical foreign currency translation losses.
Segment Operating Results
The Company has organized its business portfolio into two operating segments to reflect the Company’s business strategy. The two segments are Treatment Products and Performance Products. The Treatment Products segment includes three reportable business units: the HTH water products business, the personal care and industrial biocides business, and the wood protection and industrial coatings business. Segment operating income includes the equity in earnings of affiliated companies and excludes restructuring (income) expense and impairment expense. The Company believes the exclusion of restructuring and impairment expense from segment operating income provides additional perspective on the Company’s underlying business trends and provides useful information to investors by excluding amounts from the Company’s results that the Company does not believe are indicative of ongoing operating results.
The Company includes the equity income (loss) of affiliates in its segment operating results as it believes it to be relevant and useful information for investors as these affiliates are the means by which certain segments participate in certain geographic regions. Furthermore, the Company includes it to measure the performance of the segment. Other gains and losses that are directly related to the segments are included in segment operating results.
Treatment Products
| Years Ended December 31, | ||||||||||
| 2009 | 2008 | 2007 | ||||||||
| ($ in millions) | ||||||||||
| Results of Operations |
||||||||||
| Sales |
||||||||||
| HTH Water Products |
$ | 551.1 | $ | 501.6 | $ | 482.8 | ||||
| Personal Care & Industrial Biocides |
295.0 | 315.6 | 321.0 | |||||||
| Wood Protection & Industrial Coatings |
378.9 | 459.2 | 449.1 | |||||||
| Total Treatment Products |
$ | 1,225.0 | $ | 1,276.4 | $ | 1,252.9 | ||||
| Operating Income (Loss) |
||||||||||
| HTH Water Products |
$ | 65.2 | $ | 65.9 | $ | 64.7 | ||||
| Personal Care & Industrial Biocides |
43.6 | 62.1 | 54.2 | |||||||
| Wood Protection & Industrial Coatings |
(3.0 | ) | 2.4 | 13.9 | ||||||
| Total Treatment Products |
$ | 105.8 | $ | 130.4 | $ | 132.8 | ||||
Year Ended December 31, 2009 Compared to 2008
Sales decreased $51.4 million or four percent. Excluding the impact of the acquisition of Advantis ($49.1 million or four percent), sales decreased $100.5 million, or eight percent, as lower volumes across all businesses (10 percent) and unfavorable foreign exchange (three percent) were partially offset by improved pricing (five percent).
35
Table of Contents
Operating income decreased $24.6 million. The decrease was partially due to the fact that 2008 included an $11.5 million benefit in HTH water products related to the final determination from the DOC which reduced the antidumping duty rate from the Company’s supplier of isos from 76% to less than 1% for purchases made by the Company from June 1, 2006 through May 31, 2007. Additionally, lower operating results for the personal care and industrial biocides and wood protection and industrial coatings businesses more than offset improved operating income for the HTH water products business, excluding the impact of the antidumping duty ruling.
HTH Water Products
Sales increased $49.5 million, or 10 percent. Excluding the impact of the acquisition of Advantis ($49.1 million), sales were consistent with 2008. Improved pricing (nine percent), across all regions, was offset by lower volumes (seven percent) and unfavorable foreign exchange (two percent). Lower volumes, principally in North America, were partially offset by improved volumes in South Africa and Brazil. The lower volumes in North America were principally due to unfavorable weather patterns, primarily in the Northeast and Midwest U.S. and in Canada, which led to reduced demand for the Company’s branded products in the mass retail and professional pool dealer segments.
Operating income decreased $0.7 million. Included in 2009 and 2008 operating income are the benefits related to the favorable antidumping duty rulings of $1.0 million and $11.5 million, respectively. Excluding the impact of the rulings, operating income increased $9.8 million as improved pricing and the positive contribution from the acquisition of Advantis more than offset lower volumes, higher product costs, as well as unfavorable foreign exchange.
Personal Care and Industrial Biocides
Sales decreased $20.6 million, or seven percent, due to lower volumes. Improved pricing (one percent) was offset by unfavorable foreign exchange. The lower volumes, which were due to the downturn of the global economy and which were across most industrial biocides applications, were partially offset by higher volumes in health and hygiene applications for household and industrial disinfectant applications. The improved pricing principally related to health and hygiene products.
Operating income decreased $18.5 million as lower volumes, higher unabsorbed costs resulting from an inventory reduction program and higher plant costs related to the new manufacturing facilities in China were partially offset by improved pricing, lower freight costs and lower raw material costs. Additionally, operating results for 2008 included foreign currency gains and $0.9 million of income from the sale of rights to certain intellectual property.
Wood Protection and Industrial Coatings
Sales decreased $80.3 million, or 18 percent, as significantly lower volumes (15 percent), due to the continued downturn in the economy, and unfavorable foreign exchange (five percent) were partially offset by improved pricing (two percent). In the wood protection business, lower volumes across all regions for the residential and industrial sectors, due to the continued downturn in the global construction market, were partially offset by higher global prices. In the industrial coatings business, lower volumes were attributable to poor economic conditions throughout Europe.
Operating results were $5.4 million below the prior year as lower volumes for both businesses and unfavorable foreign exchange more than offset higher pricing for the wood protection business, lower raw material costs for the industrial coatings business and lower selling costs for both businesses due to cost reduction initiatives.
36
Table of Contents
Year Ended December 31, 2008 Compared to 2007
Sales increased $23.5 million or two percent. Excluding the impact of the acquisition of the remaining 51 percent share of the Company’s Australian joint venture, KAWP ($35.7 million or three percent), and the impact of the acquisition of Advantis ($21.8 million or two percent), sales decreased $34.0 million, or three percent, as lower volumes (six percent) were partially offset by improved pricing (three percent).
Operating income decreased $2.4 million as improvement in the industrial biocides business was more than offset by lower operating income in the wood protection business.
HTH Water Products
Sales increased $18.8 million, or four percent. Excluding the impact of the acquisition of Advantis ($21.8 million or four percent), sales decreased $3.0 million as lower volumes (three percent) were offset by improved pricing (three percent). The lower volumes were due to unfavorable weather patterns in Europe, a slow start to the Latin America pool season and lower demand in the North American dealer segment, partially offset by improved volumes in the domestic repacker market. Improved pricing in Latin America and South Africa and favorable mix in the U.S. and Europe were partially offset by lower pricing in Canada.
Operating income increased by $1.2 million as price increases, lower antidumping duties on current purchases, and the positive contribution of Advantis more than offset increased freight and distribution costs and lower volumes. In addition, included in 2008 and 2007 operating income are benefits of $11.5 million and $14.1 million, respectively, related to the favorable antidumping duty rulings.
Personal Care and Industrial Biocides
Sales decreased $5.4 million, or two percent, as lower volumes (four percent) more than offset higher pricing (one percent) and favorable foreign exchange (one percent). Lower volumes for biocides used in building products, principally due to the downturn in the global construction market, and in antidandruff products were partially offset by increased demand for biocides used in marine antifouling paints. The improved pricing related to health and hygiene products and favorable product mix for ingredients used in personal care products.
Operating income increased $7.9 million, due to the benefit from the Company’s margin-improvement programs, which included improvements in customer mix and the sourcing of the BIT molecule from third-party suppliers for the industrial biocides business. In addition, lower operating expenses, principally due to the timing of toxicology and regulatory spending, favorable foreign exchange and improved pricing were mostly offset by higher raw material costs, lower volumes and increased freight and distribution costs. Included in the operating results for 2008 is income from the sale of rights to certain intellectual property of $0.9 million.
Wood Protection and Industrial Coatings
Sales increased $10.1 million, or two percent, due to the acquisition of the remaining 51 percent share of the Company’s Australian joint venture KAWP ($35.7 million or eight percent) in July 2007. Excluding the impact of the acquisition, sales decreased $25.6 million, or six percent, as lower volumes (10 percent) more than offset improved pricing (three percent) and favorable foreign exchange (one percent). In the wood protection business, lower volumes in the North America residential sector, driven by the downturn in the U.S. construction market that began impacting the business in the second quarter of 2007, and in the European residential sector, more than offset global price increases for products used in both residential and industrial applications. In the industrial coatings business, lower volumes in the western European region, resulting principally from poor economic conditions, were partially offset by increased demand in the eastern European region and price increases.
Operating income decreased $11.5 million as lower sales volumes, higher raw material costs for both businesses, and increased freight and distribution costs for the wood protection business more than offset the improved pricing.
37
Table of Contents
Performance Products
| Years Ended December 31, | |||||||||||
| 2009 | 2008 | 2007 | |||||||||
| ($ in millions) | |||||||||||
| Results of Operations |
|||||||||||
| Sales |
|||||||||||
| Performance Urethanes |
$ | 150.2 | $ | 197.0 | $ | 216.8 | |||||
| Hydrazine |
16.7 | 18.7 | 17.9 | ||||||||
| Total Performance Products |
$ | 166.9 | $ | 215.7 | $ | 234.7 | |||||
| Operating Income |
|||||||||||
| Performance Urethanes |
$ | 8.9 | $ | 16.1 | $ | 11.9 | |||||
| Hydrazine |
3.4 | 1.1 | 13.5 | ||||||||
| Total Performance Products |
$ | 12.3 | $ | 17.2 | $ | 25.4 | |||||
| Less: contract completion gain |
— | (0.4 | ) | (12.8 | ) | ||||||
| Total Performance Products, excluding gain |
$ | 12.3 | $ | 16.8 | $ | 12.6 | |||||
Year Ended December 31, 2009 Compared to 2008
Sales decreased $48.8 million, or 23 percent, due to lower pricing (12 percent) and lower volumes (11 percent). Operating income decreased by $4.5 million.
The Performance Products segment is highly dependent on contract manufacturing arrangements with various terms. The annual operating results for this segment will decrease by approximately $12 million after December 31, 2009 due to the anticipated conclusion of a long-term contract manufacturing arrangement. The Company believes that its overall organic growth, and pipeline of new product offerings, should offset this impact.
Performance Urethanes
Performance urethanes sales decreased $46.8 million, or 24 percent. Pricing was 13 percent lower than 2008 due to lower raw material costs. Volumes were also lower than prior year (11 percent) due to the downturn in the U.S. economy. Operating income decreased by $7.2 million from 2008. Included in 2008 operating income is a $1.1 million gain related to a revised estimate of the Company’s liability for Brazilian state import tax claims. Excluding the gain, operating income decreased $6.1 million principally due to the lower pricing.
Hydrazine
Hydrazine sales were lower than 2008 as hydrazine hydrate sales decreased due to depressed market conditions. Operating income was higher than 2008 due to lower operating costs.
During 2009, a key supplier to our hydrazine business filed to reorganize under Chapter 11 of the U.S. Bankruptcy Code. In connection with the bankruptcy case, this vendor filed a motion with the court to terminate all service agreements with the Company for its Lake Charles site. The Company filed an objection to the motion, which was rejected by the court. The Company does not believe that there will be any significant impact on our operating results in 2010, but if the Company is unable to enter into new service agreements with this key supplier, or arrange for alternative suppliers, the outcome could have a material impact on this business’ operating income in the future.
38
Table of Contents
Year Ended December 31, 2008 Compared to 2007
Sales decreased $19.0 million, or eight percent, as lower volumes more than offset improved pricing. Operating income increased $4.2 million from prior year, excluding the gain from the completion of a contract with the U.S. Government.
Performance Urethanes
Performance urethanes sales decreased $19.8 million, or approximately nine percent, as lower volumes (19 percent) were partially offset by improved pricing (10 percent). The lower volumes in the polyol and glycol markets were principally due to the slowing U.S. economy. The improved pricing was for polyol and glycol products in response to rising raw material costs during the first nine months of 2008. Operating income increased $4.2 million from 2007. Included in 2008 operating income is a $1.1 million gain related to a revised estimate of the Company’s liability for Brazilian state import tax claims. Excluding the gain, operating income increased by $3.1 million principally due to lower raw material costs in the fourth quarter of 2008 as propylene settled at a six-year low.
Hydrazine
Hydrazine sales were comparable to the prior year. Operating income decreased by $12.4 million from 2007. Excluding the gain from the completion of a contract with the U.S. Government, operating income was comparable to the prior year.
Corporate Expenses (Unallocated)
| Years Ended December 31, | |||||||||
| 2009 | 2008 | 2007 | |||||||
| ($ in millions) | |||||||||
| Results of Operations |
|||||||||
| Unallocated Corporate Expenses |
$ | 34.1 | $ | 33.9 | $ | 42.4 | |||
Year Ended December 31, 2009 Compared to 2008
Unallocated corporate expenses were consistent with prior year. Increases to unallocated corporate expenses included higher compensation-related expense, due to 2008 including lower compensation-related expense principally as a result of the mark-to-market impact of the lower stock price during 2008 on the Company’s performance-based stock awards and deferred compensation plans, the absence of a royalty stream that ended in 2008, executive severance costs and higher annual incentive compensation expense. These increases were offset by 2008 including unfavorable foreign exchange associated with certain dollar-denominated loans of the Company’s foreign subsidiaries and lower U.K. pension expense in 2009.
Year Ended December 31, 2008 Compared to 2007
The decrease in unallocated corporate expenses was due to lower compensation-related expense principally as a result of the mark-to-market impact of the lower stock price during 2008 on the Company’s performance-based stock awards and deferred compensation plans. In addition, a decrease in pension expense and lower environmental remediation expenses were partially offset by unfavorable foreign exchange associated with certain dollar-denominated loans of the Company’s foreign subsidiaries.
Environmental
The Company operates manufacturing facilities throughout the world and as a result is subject to a broad array of environmental laws and regulations in various countries. The Company also implements a variety of voluntary programs to reduce air emissions, eliminate or reduce the generation of hazardous waste and to
39
Table of Contents
decrease the amount of wastewater discharges. The establishment and implementation of U.S. federal, state and local standards to regulate air and water quality and to govern contamination of land and groundwater has affected, and will continue to affect, substantially all of the Company’s U.S. manufacturing locations. Federal legislation providing for regulation of the manufacture, transportation, use and disposal of hazardous and toxic substances has imposed additional regulatory requirements on industry in general, and particularly on the chemicals industry. In addition, the implementation of environmental laws, such as the Resource Conservation and Recovery Act, the Clean Air Act and the Comprehensive Environmental Response, Compensation and Liability Act of 1980, as amended by the Superfund Amendments and Reauthorization Act of 1986, has required and will continue to require, new capital expenditures and will increase operating costs. Additionally, growing concerns about climate change may result in the imposition of additional regulation. Some form of federal regulation may be forthcoming with respect to greenhouse gas emissions (including carbon dioxide (CO2)) and/or “cap and trade” legislation, compliance with which could result in additional environmental regulation requirements.
The Distribution Agreement specifies that the Company is only responsible for certain environmental liabilities at the Company’s then current operating plant sites and certain off-site locations. Olin retained the liability for all former Olin plant sites and former waste disposal sites. The Company has also become subject to environmental exposures and potential liabilities in the U.S. and abroad with respect to the businesses it purchased. In connection with the acquisitions of Hickson International and KAWP, the Company acquired certain environmental exposures and potential liabilities of current and past operation sites which have been accrued for in the accompanying Consolidated Financial Statements.
In connection with the disposition of the majority of the microelectronic materials business on November 30, 2004, the Company provided indemnification for potential environmental liabilities. For identified environmental liabilities as of the transaction date, there is no limit to the liability retained by the Company. The Company estimates such potential liability to be less than $1.0 million. For other pre-closing environmental liabilities the purchaser was liable over a five-year period from the closing date, which ended on November 30, 2009.
In connection with the disposition of the sulfuric acid business on July 2, 2003, the Company provided environmental covenants to the purchaser in which the Company is solely liable for the costs of any environmental claim for remediation of any hazardous substances that were generated, managed, treated, stored or disposed of prior to the closing date of the sale. The Company will be released, under the sales agreement, from its obligation, which cannot exceed $22.5 million, 20 years from the closing date. See “Legal Matters” for a discussion of a claim from the current owner of the business.
As part of the Hickson organics disposition in August 2003, the Company continues to be responsible for known environmental matters at the Castleford, England site. Such matters have previously been accrued for in its environmental reserve included in the consolidated financial statements. Additionally, regarding any unknown environmental matters that are identified subsequent to the sale, the Company has agreed to share responsibility with the purchaser over a seven-year period, with the Company’s share decreasing to zero over the seven-year period. The Company’s maximum aggregate liability for such unknown environmental matters is £5.0 million. However, in September 2005, the purchaser went into liquidation and is highly unlikely to be able to honor its environmental indemnification commitments to the Company. The Company does not believe there has been any change in its environmental exposure at the site.
The Company does not anticipate that the environmental indemnifications for the microelectronic materials, sulfuric acid and Hickson organics dispositions will have a material adverse effect on its consolidated financial condition, cash flow or results of operations.
40
Table of Contents
Associated costs of investigatory and remedial activities are provided for in accordance with generally accepted accounting principles governing probability and the ability to reasonably estimate future costs. Charges to income for investigatory and remedial efforts of $1.0 million, $1.7 million, and $2.7 million were recorded in 2009, 2008 and 2007, respectively, and may be material in future years.
Cash outlays for normal plant operations for the disposal of waste and the operation and maintenance of pollution control equipment and facilities to ensure compliance with mandated and voluntarily imposed environmental quality standards were charged to income. Cash outlays for remedial activities are charged to reserves. Historically, the Company has funded its environmental capital expenditures through cash flows from operations and expects to do so in the future.
Cash outlays for environmental related activities for 2009, 2008 and 2007 were as follows:
| Years Ended December 31, | |||||||||
| 2009 | 2008 | 2007 | |||||||
| ($ in millions) | |||||||||
| Environmental Cash Outlays |
|||||||||
| Capital Projects |
$ | 1.0 | $ | 0.6 | $ | 0.5 | |||
| Plant Operations |
7.1 | 7.7 | 6.8 | ||||||
| Remedial Activities |
0.7 | 1.8 | 2.4 | ||||||
| Total Environmental Cash Outlays |
$ | 8.8 | $ | 10.1 | $ | 9.7 | |||
The Company’s Consolidated Balance Sheets included liabilities for future environmental expenditures to investigate and remediate known sites amounting to $8.2 million at December 31, 2009, of which $1.5 million is classified as current liabilities and $7.1 million at December 31, 2008, of which $1.3 million is classified as current liabilities. The Company’s estimated environmental liability relates to 15 sites, seven of which are in the United States and none of which is on the U.S. National Priority List. These amounts did not take into account any discounting of future expenditures, any consideration of insurance recoveries or any advances in technology. These liabilities are reassessed periodically to determine if environmental circumstances have changed or if the costs of remediation efforts can be better estimated. As a result of these reassessments, future charges to income may be made for additional liabilities.
Annual environmental-related cash outlays for site investigation and remediation, capital projects and normal plant operations are expected to range from $8 million to $12 million over the next several years. While the Company does not anticipate a material increase in the projected annual level of its environmental-related costs, there is always the possibility that such increases may occur in the future in view of the uncertainties associated with environmental exposures.
Environmental exposures are difficult to assess for numerous reasons, including the identification of new sites, developments at sites resulting from investigatory studies and remedial activities, advances in technology, changes in environmental laws and regulations and their application, the scarcity of reliable data pertaining to identified sites, the difficulty in assessing the involvement and financial capability of the other potentially responsible parties and the Company’s ability to obtain contributions from other parties and the lengthy time periods over which site remediation occurs. It is possible that some of these matters (the outcomes of which are subject to various uncertainties) may be resolved unfavorably against the Company. At December 31, 2009, the Company had estimated additional contingent environmental liabilities of approximately $9 million.
Legal Matters
There are a variety of non-environmental legal proceedings pending or threatened against the Company.
In May 2005, the DOC assessed antidumping duties ranging from approximately 76% to 286% against Chinese producers of isos. The Company’s primary Chinese supplier of isos was subject to the 76% rate. As a
41
Table of Contents
result, upon importing isos from this supplier, the Company made cash deposits at the rate of 76% of the value of the imported product. At the request of the U.S. isos producers and the Company’s supplier, the DOC conducted a review of the duty rate for the period of December 16, 2004 to May 31, 2006. Upon conclusion of its review, the DOC determined that the rate should be reduced to approximately 20%. As a result of the final determination and the revised rate, the Company recorded a net pre-tax benefit of $12.1 million in the fourth quarter of 2007. The net cash proceeds related to the ruling are expected to be approximately $11 million. The DOC’s determination was appealed to the Court of International Trade which has delayed the processing of the full refund the Company was expecting to receive. On July 13, 2009, the Court of International Trade issued its decision which required the DOC to review additional information and revise the rate accordingly. The DOC complied, but has asked the Court’s permission to continue its review. The revised rate could be favorable to the Company by up to $3 million and the Company expects a final ruling in 2010. The Company does not expect that the resolution of this matter will have a material adverse effect on the Company.
At the request of the Company’s supplier, the DOC also initiated an administrative review to determine the final rate for the period of June 1, 2006 through May 31, 2007, during which time the 76% rate also applied. The DOC has determined that the final rate for the Company’s supplier for this period should be reduced from 76% to less than 1%. As a result, the Company recorded a net pre-tax benefit of $12.7 million in the third quarter of 2008 (which included $1.2 million of interest income). An appeal is pending with the Court of International Trade contesting the DOC’s determination. The appeal is delaying the cash refund of the duty to the Company and may result in a change of the duty rate for this review period. The Company does not expect that the resolution of this matter will have a material adverse effect on the Company.
At the request of the Company’s supplier, the DOC also initiated an administrative review to determine the final rate for the period of June 1, 2007 through May 31, 2008, during which time the Company paid duty rates of 76% for part of the period and 20% for the remainder of the period. During the fourth quarter of 2009, the DOC made its final determination that reduced the Company’s antidumping duty rate for the entire period to 20%. As a result of the final determination, the Company recorded a pre-tax benefit of $1.0 million in the fourth quarter of 2009. Since this determination was not appealed, the cash refund is expected to be received during 2010.
Based upon the final determination for the period of June 1, 2007 through May 31, 2008, the Company began paying cash deposits for imports at a rate of approximately 20% in December of 2009.
An administrative review has also commenced to determine the final rate for the period of June 1, 2008 to May 31, 2009.
Along with its primary Comprehensive General Liability (“CGL”) insurer, Arch Coatings France S.A. (“ACF”), a subsidiary of the Company, is a defendant in a lawsuit filed in France by a builder of pleasure boats. The suit alleges that the formulation of certain varnish coatings previously supplied by ACF for application to interior woodwork on approximately 5,200 boats made by plaintiff was defective in that, under certain conditions, the varnish will bubble and peel. As of December 31, 2009, the plaintiff had identified 545 boats in need of repair and the plaintiff claimed that it had expended €4.5 million (approximately $6.5 million) to repair 513 of those boats. There is no trial date set for this case, and a court-appointed expert is in the process of determining the technical cause of the problem, as well as the extent of the damages. In August 2008, ACF was advised by its primary CGL insurer that it was denying coverage for this loss. The Company has advised the insurer that it disagrees with its position and is currently evaluating its options. At December 31, 2009, ACF had €0.8 million (approximately $1.1 million) accrued for this matter. The Company believes the high end of the range of possible outcomes is €4.5 million (approximately $6.5 million). However, it is possible that the high end of the range could ultimately increase or decrease based upon the findings of the court-appointed expert. Due to the multiple variables involved in the case (i.e., the uncertainty surrounding the number of boats which were damaged, the costs to repair the damages, the cause of the alleged damage, the Company’s responsibility for the alleged costs of repair), it is currently not possible to make an estimate of any amount above the amount of the
42
Table of Contents
current stated claim. An unfavorable outcome related to this matter could have a material adverse effect on the Company’s results of operations and cash flows.
In December 2007, as a result of an income tax audit of Nordesclor, the Company was notified by the Brazilian tax authorities that the Company would be assessed R$4.9 million (approximately $2.8 million) for alleged tax deficiencies related to the 2002 tax year. In accordance with the purchase agreement that was signed in conjunction with the acquisition of Nordesclor, our former joint venture partner is responsible for approximately 50% of this assessment. The Company believes the deficiency notice is without merit and, in January 2008, the Company protested the assessment. The Company believes the resolution of this case is not likely to have a material adverse effect on its consolidated financial condition, cash flow or results of operations.
During 2003, the Company sold its sulfuric acid business. The Company has received a claim from the current owner of that business. The claimant asserts that, under certain provisions of the agreement for the sale of the business, the Company must indemnify the claimant for certain environmental penalties and compliance costs the claimant will incur under a settlement the claimant reached with the U.S. Environmental Protection Agency. The claimant alleges that such penalties and costs approximate $2.4 million. The Company is currently investigating the validity of the claimant’s assertions. The Company does not believe that the resolution of this matter is likely to have a material adverse effect on its consolidated financial condition, cash flow or results of operations.
Arch Wood Protection (NZ) Limited (“AWPNZ”) has been named as a defendant in a suit filed by one of its competitors. The suit alleges that AWPNZ and several other defendants are jointly and severally liable for defamatory statements made about a product of the competitor in that they secured, contributed to, or encouraged the publication of such statements. The plaintiff is seeking a total of NZ $7.5 million (approximately $5.3 million) in compensatory damages, as well as attorney’s fees and costs and other relief deemed appropriate by the court. The Company believes that the claims asserted against AWPNZ are without merit. The Company does not believe that the resolution of this matter is likely to have a material adverse effect on its consolidated financial condition, cash flow or results of operations.
The Company is being sued by the current owner of a former Hickson site in Italy for environmental contaminants on that site. The owner is seeking compensation of €2.2 million (approximately $3.2 million) for the remediation of the site. The matter is currently within the Italian court system. The Company has worked with the local authorities to resolve any risk based remediation issues at the site. Remediation actions were completed in 2008, and the Company believes that it has no further obligation at the site.
The Company has been notified by the Brazilian tax authorities of various assessments, totaling approximately R$9 million (approximately $5 million), related to alleged non-income tax deficiencies for tax years ranging from 1988 to 2003. The Company has recorded a liability of R$2.7 million (approximately $1.6 million) for any assessments for which it is probable that the Company will be unable to successfully defend itself. The Company believes that the remainder of the assessments are without merit and the Company does not believe that the resolution of these assessments is likely to have a material adverse effect on its consolidated financial condition, cash flow or results of operations.
There are fewer than ten CCA-related personal injury lawsuits in which the Company and/or one or more of the Company’s subsidiaries is named a defendant. Individuals in these lawsuits allege injury occurred as a result of exposure to CCA-treated wood. The Company does not believe the resolution of these pending cases is likely to have a material adverse effect on its consolidated financial condition, cash flow or results of operations. The Company has no CCA-related purported class action lawsuits pending against it, those lawsuits having been dismissed or otherwise resolved in prior years.
43
Table of Contents
Business and Credit Concentrations
A significant portion of sales of the Treatment Products segment (approximately 18%) is dependent upon two customers, one of which accounts for a significant portion of the sales of the HTH water products business and the other of which accounts for a significant portion of the sales of the personal care and industrial biocides businesses. Sales to these two customers are individually less than 10% of the Company’s 2009 consolidated sales. However, the loss of either of these customers would have a material adverse effect on the sales and operating results of the Company, respective segment and businesses if such customer was not replaced.
Sales of the HTH water products business are seasonal in nature as its products are primarily used in the U.S. residential pool market. Historically, approximately 40% of the sales in the HTH water products business occur in the second quarter of the fiscal year, as retail sales in the U.S. residential pool market are concentrated between Memorial Day and the Fourth of July. Therefore, interim results for this segment are not necessarily indicative of the results to be expected for the entire fiscal year.
Liquidity, Investment Activity and Other Financial Data
Cash Flow Data
| Years Ended December 31, | ||||||||||||
| 2009 | 2008 | 2007 | ||||||||||
| ($ in millions) | ||||||||||||
| Provided By (Used For) |
||||||||||||
| Accounts Receivable Securitization Program |
$ | — | $ | — | $ | — | ||||||
| Change in Working Capital |
38.6 | (60.2 | ) | (22.9 | ) | |||||||
| Change in Noncurrent Liabilities |
(31.5 | ) | (10.4 | ) | (32.1 | ) | ||||||
| Net Operating Activities from Continuing Operations |
116.4 | 45.4 | 54.2 | |||||||||
| Capital Expenditures |
(29.9 | ) | (53.3 | ) | (41.6 | ) | ||||||
| Businesses Acquired in Purchase Transactions, net of Cash |
0.3 | (125.5 | ) | (14.3 | ) | |||||||
| Proceeds from Sale of a Business, net |
1.2 | 3.7 | 11.6 | |||||||||
| Proceeds from Sale of Land and Property |
— | 0.7 | 2.8 | |||||||||
| Net Investing Activities |
(28.4 | ) | (174.4 | ) | (42.4 | ) | ||||||
| Debt Borrowings (Repayments), net |
(48.5 | ) | 128.4 | (19.4 | ) | |||||||
| Net Financing Activities |
(68.3 | ) | 109.8 | (22.4 | ) | |||||||
Operating Activities:
For 2009, $116.4 million was provided by operating activities from continuing operations compared to $45.4 million for 2008. During 2009, the Company focused its efforts on reducing working capital. Cash flows improved principally due to inventory reduction programs for the industrial biocides and performance urethanes businesses and continued focus on collections of receivables and tight credit controls. The cash flows from operations included $42.3 million of voluntary contributions to the U.S. pension plan during 2009. During 2010 the Company expects to have a use of cash flows from working capital of approximately $10 million due to higher sales volumes.
Accounts receivable, net, at December 31, 2009 were 12 percent lower than at December 31, 2008, despite the fact that sales were higher during the fourth quarter of 2009 than during the fourth quarter of 2008. At December 31, 2009, days sales outstanding (“DSO”) was 60 days, as compared to 67 days at December 31, 2008. The improvement is due to the Company’s continued focus on collections and tight credit controls. The Company’s acquisition of Advantis did not impact DSO at December 31, 2009 and the impact of the acquisition was to increase DSO by three days as of December 31, 2008. The Company continues to closely monitor its accounts receivable balances and assess the allowance for doubtful accounts. The allowance was $11.3 million at December 31, 2009 compared to $9.1 million at December 31, 2008. The increase is principally due to several
44
Table of Contents
specific customers in our industrial coatings and wood protection businesses and the impact of foreign exchange. None of these customers is material to the Company’s Accounts receivable or results of operations individually or in the aggregate.
Inventories, net at December 31, 2009 were 21 percent lower than at December 31, 2008. At December 31, 2009 the Company’s inventory months on hand (“MOH”) was 3.0 compared to 4.2 at December 31, 2008. The impact of the Company’s acquisition of Advantis did not significantly change the MOH for either December 31, 2009 or December 31, 2008. The decrease in MOH at December 31, 2009 versus December 31, 2008 is principally due to inventory reduction programs for the industrial biocides and performance urethanes businesses. Many of the Company’s products are not subject to rapid obsolescence and do not have short shelf lives, but the Company continues to closely monitor its inventory balances and to assess for obsolescence. The obsolescence reserve was $13.7 million at December 31, 2009, compared to $10.2 million at December 31, 2008. The increase is principally due to the impact of foreign exchange, unsalable equipment and non-conforming product in certain geographic locations.
For 2008, $45.4 million was provided by operating activities from continuing operations compared to $54.2 million for 2007. The larger use of working capital in 2008 was principally due to the seasonal build in working capital for the newly acquired Advantis pool and spa business, higher incentive compensation payments in 2008 earned under the Company’s annual and long-term incentive plans in 2007 and an increase in income tax payments. 2007 includes approximately $13 million of cash received upon the completion of a contract with the U.S. Government and a $36.4 million voluntary contribution to the Company’s U.S. pension plan.
Investing Activities:
Capital Expenditures:
Capital expenditures for 2009 were $23.4 million lower than 2008 principally due to decreased spending for the personal care and industrial biocides businesses as a result of the completion of construction of two new biocides plants in China to meet growing demand for biocides used in antidandruff products and marine antifouling paints.
Capital expenditures for 2008 increased $11.7 million principally due to the construction of the two new biocides plants in China and due to the Company’s expansion of its water chemicals manufacturing capacity in Brazil and South Africa.
Capital expenditures for 2010 are expected to be in the $35 to $40 million range.
Businesses Acquired in Purchase Transactions, net of cash:
On October 10, 2008, the Company completed the acquisition of the water treatment chemicals business of Advantis, a North American manufacturer and marketer of branded swimming pool, spa and surface water treatment chemicals. The purchase price was $125.0 million, free of debt and inclusive of expenses paid, and a final post-closing working capital adjustment of $0.3 million, which was received by the Company in the first quarter of 2009. The acquisition was financed by borrowings from the Company’s existing credit facility. For additional information concerning the acquisition see Note 19 of Notes to Consolidated Financial Statements.
Businesses acquired in purchase transaction in 2007 principally relates to the Company’s purchase of the remaining 51 percent share of its Australian joint venture, KAWP, from its joint venture partner on July 5, 2007. The purchase price was $19.0 million, consisting of a cash payment of $15.5 million and the assumption of 51 percent of the joint venture net debt of $6.8 million. Additionally, the purchase price included a working capital adjustment. The purchase price, net of the working capital adjustment, was paid during 2007. The acquisition was financed from available cash. For additional information concerning the acquisition see Note 19 of Notes to Consolidated Financial Statements.
45
Table of Contents
On December 28, 2005, the Company completed the acquisition of the remaining 50 percent share of its HTH water products joint venture, Nordesclor. The total purchase price, net of cash received, was $16.8 million, inclusive of expenses paid and a working capital adjustment, which was paid in 2006. The purchase price was further subject to a contingent payment based on cumulative earnings over the next year. During 2007, the Company made the first installment of the contingent payment of $0.3 million. During 2008, the Company made the final installment of the contingent payment of $0.2 million. The acquisition was financed through local borrowings and available cash. For additional information concerning the acquisition see Note 19 of Notes to Consolidated Financial Statements.
Proceeds from Sale of a Business, net:
In September 2007, the Company completed the sale of its non-strategic performance urethanes business in Venezuela. During 2009 and 2008, $1.2 million and $3.7 million, respectively, of the proceeds were received. Total proceeds, net of expenses, from the sale are expected to be $16.7 million, $16.5 million of which had been received as of December 31, 2009. The balance is included in Accounts receivable, net in the Consolidated Balance Sheet.
Proceeds from Sale of Land and Property:
Proceeds from sale of land and property in 2008 represents land sold in conjunction with the Company’s decision to discontinue the manufacturing of its BIT molecule.
Cash proceeds in 2007 includes the repayment of an outstanding note from the sale of land on September 30, 2003.
Financing Activities:
Debt repayments, net of borrowings, were $48.5 million during 2009 due to the Company using excess cash, which was principally generated from the Company’s working capital reduction efforts, to pay down debt. Debt borrowings, net of repayments, were $128.4 million in 2008 due to the fact that the Company used its credit facility to finance the acquisition of Advantis, which was purchased for approximately $125 million.
In March 2009, the Company used its unsecured $350.0 million senior revolving credit facility (“credit facility”) to repay $62.0 million of Series B notes which came due.
In March 2007, the Series A notes of $149.0 million came due. The Company used its senior revolving credit facility to pay off the Series A notes at their maturity. Net debt repayments and dividends paid to shareholders, $19.6 million, more than offset the proceeds from exercised stock options.
Liquidity
On June 15, 2006, the Company entered into an unsecured $350.0 million senior revolving credit facility, which expires in June 2011. The Company’s credit facility contains a quarterly leverage ratio (Debt/EBITDA) covenant not to exceed 3.5. At December 31, 2009, the Company’s quarterly leverage ratio, as defined in the credit facility, was 2.2. Additionally, the credit facility contains an interest coverage ratio (EBITDA/total interest expense) covenant not to be less than 3.0. At December 31, 2009, the Company’s interest coverage ratio, as defined in the credit facility, was 9.5. The Company was in compliance with both of these covenants throughout 2009. The credit facility also restricts the payment of dividends and repurchase of stock to $65.0 million plus 50% of cumulative net income (loss) subject to certain limitations beginning June 15, 2006. Restricted payments were limited to $84.6 million at December 31, 2009. The facility fees can range from 0.100% to 0.225% depending on the Company’s quarterly leverage ratios. The Company may select various floating rate borrowing options, including, but not limited to, LIBOR plus a spread that can range from 0.4% to 0.9% depending on the Company’s quarterly leverage ratios. At December 31, 2009, the Company had $236.8 million of available borrowings under the credit facility.
46
Table of Contents
On February 13, 2009, the Company entered into an unsecured $100.0 million credit agreement (“term loan”) with a number of banks, which matures in June 2011. The entire $100.0 million was drawn at closing and $90.0 million remained outstanding at December 31, 2009. The term loan provides for quarterly amortization of principal equal to five percent of the original principal amount of the term loan beginning September 30, 2009. Therefore, $20.0 million of the outstanding balance at December 31, 2009 was included in Current portion of long-term debt in the Consolidated Balance Sheet. The term loan contains a quarterly leverage ratio covenant not to exceed 3.5 and an interest coverage ratio covenant not to be less than 3.0, both of which are consistent with the existing credit facility. At December 31, 2009 the Company’s quarterly leverage ratio, as defined in the term loan, was 2.2 and the Company’s interest coverage ratio, as defined in the term loan, was 9.5. The Company has been in compliance with both of these covenants since the inception of the term loan. Additionally, consistent with the credit facility, this term loan restricts the payment of dividends and repurchase of stock to $65.0 million plus 50% of cumulative adjusted net income (loss) for the period beginning June 15, 2006. At December 31, 2009, restricted payments were limited to $84.6 million. The Company may select various floating rate borrowing options, including, but not limited to, LIBOR plus a spread that can range from 2.25% to 3.25% depending on the Company’s quarterly leverage ratios.
On August 28, 2009, the Company entered into a $150.0 million note purchase and private shelf agreement (the “shelf agreement”) with Prudential Investment Management, Inc. (“Prudential”) and immediately issued $75.0 million of unsecured senior notes (the “Notes”). The Notes will mature in August 2016 and bear a fixed annual interest rate of 6.70%. The shelf agreement provides for the additional purchase by Prudential of notes, in amounts to be mutually agreed, up to a maximum of $75.0 million through August 2012, on terms to be determined. The shelf agreement contains a quarterly leverage ratio covenant not to exceed 3.5 and an interest coverage ratio covenant not to be less than 3.0, both of which are consistent with the existing credit facility and term loan. At December 31, 2009 the Company’s quarterly leverage ratio, as defined in the shelf agreement, was 2.2 and the Company’s interest coverage ratio, as defined in the shelf agreement, was 9.5. The Company has been in compliance with both of these covenants since the inception of the shelf agreement. Additionally, the shelf agreement restricts the payment of dividends and repurchase of stock to $88.1 million plus 50% of cumulative adjusted net income (loss) for the period beginning June 30, 2009. At December 31, 2009, restricted payments were limited to $84.6 million.
In 2005, the Company entered into an accounts receivable securitization program with Three Pillars Funding LLC (“Three Pillars”), an affiliate of SunTrust Bank, and SunTrust Capital Markets, Inc. (“Sun Trust”), through which the Company sold undivided participation interests in certain domestic trade accounts receivable, without recourse, through its wholly-owned subsidiary, Arch Chemicals Receivables Corporation (“ACRC”), a special-purpose entity which is consolidated for financial reporting purposes. In connection with the securitization program, SunTrust entered into a Liquidity Agreement with Three Pillars to support its purchases of the Company’s accounts receivable annually. On October 6, 2009, the Company entered into an accounts receivable securitization program with Market Street Funding LLC and PNC Bank, National Association (“PNC Bank”) by way of an assignment and assumption of the Company’s existing program with Three Pillars and SunTrust. Under the amended program, the Company can sell domestic trade accounts receivable, and certain Canadian trade accounts receivable, to Market Street Funding LLC through ACRC. Additionally, the program provides ACRC with the ability to issue letters of credit. The amount of funding that the Company can obtain under the program is subject to change based upon the level of eligible receivables with a maximum amount of $80 million. No more than $30 million of such funding can relate to letters of credit. The amended program is subject to annual renewal and has similar terms to the Company’s previous accounts receivable securitization program. At December 31, 2009 and 2008, the Company, through ACRC, had not sold any trade accounts receivable. See Note 2 of Notes to Consolidated Financial Statements.
In March 2002, the Company issued $211.0 million of unsecured senior notes to certain institutional investors in two series. The Company used its credit facility to pay off the Series A notes in March 2007 and to pay off the entire balance of the Series B notes, $62.0 million, in March 2009.
47
Table of Contents
Other borrowings at December 31, 2009 included $14.8 million of borrowings under international credit facilities and $2.9 million of capitalized leases. Such credit facilities and capitalized leases have interest rates ranging from 3% to 18%.
At December 31, 2009, the Company had $31.6 million of outstanding letters of credit, $5.2 million of which reduced availability under the Company’s credit facility. Additionally, at December 31, 2009, the Company had $2.4 million of outstanding letters of guarantee.
The recent turmoil in the financial markets could potentially reduce the sources of liquidity for the Company. Nonetheless, the Company believes that the credit facility, which the Company intends to refinance during 2010, new term loan, new shelf agreement, accounts receivable securitization program and cash provided by operations are adequate to satisfy its liquidity needs for the near future, including financing capital expenditures. However, if the Company’s earnings or cash flows were to fall significantly below current expectations and/or a default condition were triggered under its funding agreements or if the Company’s funding providers do not honor their commitments, a risk exists that the Company would not have enough liquidity to meet its operating needs.
The recent turmoil in the global economy has impacted the operating performance of the Company’s business units towards the end of 2008 and throughout 2009. In addition, the decline in housing related activity in 2008 and 2009 has also impacted the operating performance of the Company’s industrial coatings and wood protection businesses. As a result, the estimated fair values have decreased for some of the Company’s reporting units, in particular the industrial coatings and wood protection reporting units, and the assets of such reporting units. If these conditions were to continue to decline or persist at current depressed levels throughout the next several years, the following assets could become impaired: Goodwill for the wood protection business of $44.3 million, and/or Long-lived assets (exclusive of Goodwill, Other assets and Investments and advances—affiliated companies at equity) for the industrial coatings and wood protection businesses of $63.0 million and $59.3 million, respectively. Additionally, the Company’s performance urethanes business has a significant contract that expired at the end of 2009 and the annual operating income will decrease by approximately $12 million after December 31, 2009. We believe that organic growth and our pipeline of new product offerings should mitigate a portion of this. If the performance urethanes business’ earnings and/or cash flows were to fall below current expectations due to a further deterioration of market conditions, or if the business is unsuccessful with new product offerings, the following assets could become impaired: Goodwill of $4.4 million, and/or Long-lived assets (exclusive of Goodwill, Other assets and Investments and advances—affiliated companies at equity) of $14.8 million.
The Company has been evaluating all strategic options for the non-core industrial coatings business, including the potential disposition, restructuring and / or change to the current distribution methods. In February 2010, the Company signed a definitive agreement to sell substantially all of its industrial coatings business. The Company expects the transaction will result in a breakeven to a modest pretax gain. The net assets of the industrial coatings business, exclusive of unrecognized foreign currency translation gains, were $65.8 million at December 31, 2009 (see Note 25 of Notes to Consolidated Financial Statements for more information).
In addition, the Company’s performance urethanes and hydrazine businesses are non-core to its portfolio and are managed for cash, which is invested in growing our core Biocides portfolio. Since the Company considers these businesses non-core, the Company does not believe that they will be in the portfolio in the long-term. Although the Company currently does not have any plans in place, the Company continues to evaluate various strategic options for these businesses, which include possible divestiture. At December 31, 2009, the net assets of the performance urethanes and hydrazine businesses were $29.5 million and $1.1 million, respectively.
During 2009, the Company made $42.3 million of voluntary contributions to the Company’s qualified U.S. pension plan. As a result of the contributions, the Company has met the full funding phase-in thresholds set forth in the current U.S. pension legislation. Although there are no minimum funding requirements for the Company’s U.S. pension plans in 2010, the Company currently anticipates making approximately $25 million of voluntary contributions to the qualified plan in order to continue to meet the full funding phase-in thresholds.
48
Table of Contents
The minimum funding requirements for the Company’s U.K. pension plans are currently expected to be approximately $15 million to $20 million per year.
Contractual Obligations
The following table details the Company’s contractual obligations as of December 31, 2009:
| Payments Due by Period | ||||||||||||||||||
| Total | Less than 1 Year |
1 to 3 Years |
3 to 5 Years |
More than 5 Years |
All Other | |||||||||||||
| ($ in millions) | ||||||||||||||||||
| Debt and capital lease obligations (1) |
$ | 290.7 | $ | 33.0 | $ | 181.4 | $ | 1.3 | $ | 75.0 | $ | — | ||||||
| Operating lease commitments |
48.3 | 11.5 | 16.2 | 13.2 | 7.4 | — | ||||||||||||
| Other contractual purchase obligations |
40.9 | 33.7 | 6.1 | 0.7 | 0.4 | — | ||||||||||||
| Unrecognized tax benefits |
13.2 | — | — | — | — | 13.2 | ||||||||||||
| Other long-term liabilities |
9.2 | — | 3.1 | 1.3 | 4.8 | — | ||||||||||||
| Total |
$ | 402.3 | $ | 78.2 | $ | 206.8 | $ | 16.5 | $ | 87.6 | $ | 13.2 | ||||||
| (1) | Excluded from the debt and capital lease obligations are the related interest payments, which are estimated to be $9.7 million in 2010, $7.1 million in 2011, $5.3 million in 2012, $5.1 million in 2013, $5.1 million in 2014 and $8.3 million thereafter. The interest payments have been calculated using the variable interest rates in effect as of December 31, 2009. |
The amounts above exclude the Company’s minimum pension funding requirements as set forth by the Employee Retirement Income Security Act of 1974 (“ERISA”). The Company’s minimum funding requirements are dependent on several factors, including the discount rate and investment returns, and any changes in legislation. At the current time it is not possible to reasonably predict future contributions by year. Based upon the assumption that interest rates will remain at or near the levels at December 31, 2009, that the annual rate of return on assets will be 8.50%, that mortality rates will remain consistent with December 31, 2009 assumptions, and there are no changes in existing legislation, it would be reasonable to assume that contributions to the qualified U.S. plan over the next seven years will total to an amount broadly equal to the current funding deficit (approximately $74 million) plus an annual amount equal to the current service cost (approximately $8 million in 2009) over the period. The Company also has payments due under other postretirement benefit plans. These plans are pay as you go, and therefore not required to be funded in advance. The Company has minimum funding requirements for its U.K. pension plans, which are expected to be approximately $15 million to $20 million per year.
Other Financial Data
On October 28, 1999, Arch’s Board of Directors approved a stock repurchase program whereby the Company was authorized to buy back up to 1.2 million shares of its common stock, representing approximately 5% of outstanding shares. The program was suspended in 2000. In October 2003, the Board of Directors unanimously agreed to continue the previous suspension of its stock repurchase program. The Company had repurchased approximately 893,000 shares of the 1.2 million authorized, or approximately 75%, at a cost of approximately $16 million. In connection with the acquisition of the Avecia pool & spa and protection & hygiene businesses, the Company reissued 744,538 shares with a value of $17.4 million.
On January 28, 2010, the Company declared a quarterly dividend of $0.20 on each share of the Company’s common stock. The dividend is payable on March 16, 2010 to shareholders of record at the close of business on February 16, 2010.
49
Table of Contents
Critical Accounting Policies
The Company’s Consolidated Financial Statements are based on the accounting policies used. Certain accounting policies require that estimates and assumptions be made by management for use in the preparation of the financial statements. Critical accounting policies are those that are central to the presentation of the Company’s financial condition and results and that require subjective or complex estimates by management. These include the following:
Goodwill and Other Intangible Assets
The Company evaluates goodwill and identified intangible assets on a business-by-business basis (“reporting unit”) for impairment. The Company evaluates each reporting unit for impairment based upon a two-step approach. First, the Company compares the fair value of the reporting unit with its carrying value. Second, if the carrying value of the reporting unit exceeds its fair value, the Company compares the implied fair value of the reporting unit’s goodwill to its carrying amount to measure the amount of impairment loss. In measuring the implied fair value of goodwill, the Company would allocate the fair value of the reporting unit to each of its assets and liabilities (including any unrecognized intangible assets). Any excess of the fair value of the reporting unit over the amounts assigned to its assets and liabilities is the implied fair value of goodwill.
The Company measures the fair value of a reporting unit as the estimated discounted future cash flows, including a terminal value, which assumes the business continues in perpetuity. The long-term terminal growth assumptions reflect our current long-term view of the marketplace. The discount rate is based upon our weighted average cost of capital of each reporting unit. Each year the Company re-evaluates the assumptions in the discounted cash flow model to address changes in the business and marketplace conditions.
Considerable management judgment is necessary to estimate discounted future cash flows in conducting an impairment test for goodwill and other intangible assets, which may be impacted by future actions taken by the Company and its competitors and the volatility in the markets in which the Company conducts business. A change in assumptions in the Company’s cash flows could have a significant impact on the fair value of the Company’s reporting units, which could then result in a material impairment charge to the Company’s results of operations.
Based upon the annual impairment analysis, which was completed in the first quarter of 2009, the estimated fair value of the reporting units exceeded their carrying value and as a result, the Company did not need to proceed to the second step of the impairment test. Since the first quarter of 2009, no events or changes in circumstances, have occurred to indicate that an impairment could exist.
Fourth Quarter 2008 Goodwill Impairment:
Background Information:
The industrial coatings business was negatively impacted by the decline in the local furniture maker market in several of the major European economies as a result of the shift of manufacturing to countries with low-cost production. The Company’s industrial coatings business is principally concentrated in Europe, unlike our other businesses that are more geographically diversified. The industrial coatings business, to a greater extent, was also being impacted by competitive activities within Europe, principally in Italy (the business’ largest sales region), as competitors attempted to gain market share, in particular, one competitor began recruiting and hiring several of the Company’s employees, agents and distributors. In response to these activities, the business was unable to maintain profitability in the face of rising raw material prices. As a result, the business began to see declines in sales volumes and overall margins. The Company’s industrial coatings export business took advantage of its strong positions in growing markets in Russia and Eastern Europe to offset some of the shortfalls in volumes in the other regions. Consequently, the operating income for the business declined from approximately $7 million in
50
Table of Contents
2003 to slightly positive for 2007 and 2008. Additionally, the industrial coatings cash flows had declined from $9 million in 2003 to $6 million in 2008.
When the Company performed its annual goodwill impairment test during January 2008, it considered the factors above and concluded that the goodwill of its industrial coatings business was not impaired. Assumptions underlying this conclusion included expected volume growth driven by geographic expansion and market growth supported by new product introductions and price increases in order to achieve profit improvement.
The rapid deterioration of the global economy during the fourth quarter of 2008, which could not be foreseen in January 2008, significantly compounded the existing adverse factors identified above, and was the principal reason for the interim test. This economic slowdown intensified throughout the fourth quarter of 2008 as weakness spread to the broader worldwide economy, negatively impacting many of our customers in the industrial coatings business and our expectations of a recovery in these markets. At this point, the business began seeing volumes decline 20% to 40% from the prior year levels and that the industrial coatings market was going to continue to contract through most of 2009 and that there would be a slow recovery. The United Kingdom was also adversely impacted by the weakening of the British pound versus the euro, since it purchases much of its materials in euros. Due to the competitive environment, the Company was not able to pass along price increases to offset the foreign exchange impact on the cost of imported materials. As a result, the Company’s projected future cash flows (for 2009 and beyond) were adversely impacted and were significantly lower in December 2008 than the projections used in the Company’s January 2008 annual impairment review.
The goodwill impairment testing process involves the use of significant assumptions, estimates and judgments by management, and is subject to inherent uncertainties and subjectivity, which include estimating a reporting unit’s discounted cash flows, selecting a discount rate and long-term growth assumptions. Estimating a reporting unit’s discounted cash flows involves the use of significant assumptions, estimates and judgments with respect to a variety of factors, including sales, gross margin, operating expenses, working capital fluctuations, capital expenditures and cash flows, all of which are based on the Company’s annual strategic business plan or other forecasted results. The Company’s historical annual cash flow projections, on average, have been consistent with actual cash flows. The Company uses the prevailing foreign exchange rates at the time of the forecast for all years included in the projections. The discount rate is based on the weighted average cost of capital for each of the reporting units. The long-term terminal growth assumptions reflect our current long-term view of each business. Additionally, the allocation of the estimated fair value of the Company’s reporting units to the estimated fair value of their net assets also involves the use of significant assumptions, estimates and judgments. Both the estimates of the fair value of the Company’s reporting units and the allocation of the estimated fair value of the reporting units to their net assets are based on the best information available to the Company’s management as of the date of the assessment. As part of the impairment review process, the Company compares the value of the Company’s reporting units, which is derived from the discounted cash flows, to the Company’s market capitalization. At the end of 2008, the Company’s market capitalization had not declined, and was not a factor for the interim impairment test.
Change in Assumptions from the annual impairment review to the interim impairment review:
The material change in assumptions from the January 2008 annual impairment test to the December 2008 interim impairment test was principally related to projected lower volumes for the business in 2010 through 2012, and to a lesser extent, lower margins. Due to the aforementioned items, the Company reduced its base volume assumptions as well as the estimated volume growth in its projections for 2010 through 2012, as the Company no longer expected the magnitude and pace of the growth and recovery of profitability that was anticipated earlier driven by geographic expansion and new product introductions. To the contrary, in the fourth quarter of 2008, the Company believed that the industrial coatings market was going to continue to contract through most of 2009 and that there would be a slow recovery. Additionally, price increases to achieve profit improvement and to offset rising raw material costs, were lower due to the competitive pressures. Although the industrial coatings business saw increased competitive activities during the fourth quarter of 2008, the change in
51
Table of Contents
forecasted cash flows was not due to the business losing any major customers and the Company does not believe that it has seen a reduction to its percentage of market share. The projected lower volumes for the business were mainly the result of an overall contraction of the market.
Although the industrial coatings business’ 2008 cash flows were consistent with original projections, the Company’s December 2008 projections of future cash flows were significantly lower than the projections used in the Company’s January 2008 annual impairment review for 2009 and beyond, as a result of this rapid deterioration of the global economy in the fourth quarter of 2008. The assumption of lower volumes and lower margins significantly impacted the estimated future cash flows of the business. The Company’s January 2008 impairment test estimated cash flows of approximately $5 million in 2008 increasing to approximately $9 to $10 million annually in future years. The December 2008 projected cash flows decreased from approximately $5 million in 2008 to slightly positive in 2010, $1 million in 2011 and recovering to approximately $4 to $5 million annually thereafter, which, after considering the change in the discount rate, resulted in a decrease of the net present value for the cash flows of approximately $70 million. The Company adjusted the discount rate from 8.8% in the January 2008 test to 9.2% in December 2008 in order to reflect current market risks. Approximately $10 million of the decrease in estimated fair value of the business is due to the change in discount rate. The Company has kept its long-term growth rate consistent in both calculations at 3.3%, based on our long-term assessment of the market subsequent to 2012.
Fourth Quarter 2008 Interim Impairment Assessment:
As a result of the update to the Company’s financial forecast, due to the aforementioned items and in connection with the 2008 year-end review of our accounts, the Company conducted an interim impairment review using a combination of valuation methodologies, including a discounted cash flow model. Such review indicated that there was an impairment on the goodwill of the industrial coatings business. As the updated estimate of the reporting unit’s fair value was less than the carrying value of the reporting unit, the Company performed Step 2 of the goodwill impairment test. Based upon an analysis of fair value, the Company recorded a non-cash goodwill impairment charge of $24.6 million, which eliminated the remaining carrying amount of goodwill related to the industrial coatings business acquired in conjunction with the Company’s acquisition of Hickson International PLC in August of 2000.
For additional information, see Note 8 of Notes to Consolidated Financial Statements.
Income Taxes
The Company’s effective tax rate is based on pre-tax income, statutory tax rates and tax planning strategies. Significant management judgment is required in determining the effective tax rate and in evaluating the Company’s tax position.
The Company’s accompanying Consolidated Balance Sheets include certain deferred tax assets resulting from net operating loss carryforwards and deductible temporary differences, which are expected to reduce future taxable income. These assets are based on management’s estimate of realizability based upon forecasted taxable income. Realizability of these assets is reassessed at the end of each reporting period based upon the Company’s forecast of future taxable income and available tax planning strategies, and may result in the recording of a valuation reserve. Failure to achieve forecasted taxable income or ability to implement tax planning strategies could affect the ultimate realization of certain deferred tax assets. For additional information, see Note 14 of Notes to Consolidated Financial Statements.
Pension and Postretirement Benefits
The Company’s accompanying Consolidated Balance Sheets include significant pension and postretirement benefit obligations. The determination of defined benefit pension and postretirement plan obligations and their associated expenses requires the use of actuarial valuations to estimate the benefits the employees earn while
52
Table of Contents
working, as well as the present value of those benefits. Inherent in these valuations are financial assumptions including expected returns on plan assets, discount rates at which liabilities could be settled, rates of increase of health care costs, rates of future compensation increases as well as employee demographic assumptions such as retirement patterns, mortality and turnover. The Company reviews the assumptions annually with its actuarial advisors. The actuarial assumptions used may differ materially from actual results due to changing market and economic conditions, higher or lower turnover rates or longer or shorter life spans of participants. The following is a discussion of the most significant estimates and assumptions used in connection with the Company’s U.S. and the Hickson U.K. employee benefit plans. The pension expense for other defined benefit plans for the Company’s other foreign subsidiaries was not significant, and accordingly assumptions and sensitivity analyses regarding these plans are not included in the discussion below.
Key Assumptions
The assets, liabilities and assumptions used to measure expense for any fiscal year are determined as of January 1 of the current plan year. Accumulated and projected benefit obligations represent the present value of future cash payments.
The expected return on plan assets reflects the average rate of earnings expected on the funds invested to provide for the benefits included in the benefit obligations. The assumption reflects long-term expectations for future rates of return for the investment portfolio over the life of the benefit obligations, with consideration given to the distribution of investments by asset class and historical rates of return for each individual asset class. The Company’s expected long-term rate of return on assets assumption for the Hickson U.K. pension plans includes a 0.25% reduction to allow for administration expenses.
The discount rate reflects the yields available on high-quality fixed income instruments. The discount rate for the U.S. plans is based on the review of the following: Moody’s Aa Corporate Bond Index, a pension liability index and a yield curve constructed from a large population of high quality non-callable corporate bonds, modeled to match the expected timing of the benefit payments over the life of the benefit obligation. The discount rate for the Hickson U.K. plans is based upon a review of corporate bond yields.
Sensitivity Analysis
The sensitivity of changes in key assumptions for our principal pension and postretirement plans’ expense are as follows:
| • | Discount rate—A 25-basis point change in the discount rate would increase or decrease the expense of the Company’s U.S. pension plans and Hickson U.K. pension benefit plans by approximately $1 million and approximately $0.5 million, respectively. In addition, a similar change in the discount rate would increase or decrease the projected benefit obligation by approximately $9 million for the Company’s U.S. plans and approximately $14 million for the Hickson U.K. plans. |
| • | Expected return on plan assets—A 25-basis point change in the expected return on plan assets would increase or decrease the expense for the Company’s U.S. and Hickson U.K. pension benefit plans by approximately $0.6 million and $0.8 million, respectively. This change would have no impact on the projected benefit obligation for either plan. |
| • | Mortality assumptions—A change in mortality tables for the Company’s U.S. pension plans that increases/or decreases age-65 life expectancy by one year would increase or decrease the pension expense by approximately $2 million and increase or decrease the projected benefit obligation by approximately $8 million. A 10 percent change in the mortality rates for the Hickson U.K. plans would increase or decrease the pension expense and projected benefit obligation by approximately $1 million and $9 million, respectively. |
For further information about our pension and postretirement plans see Note 15 of Notes to Consolidated Financial Statements.
53
Table of Contents
Valuation of Long-Lived Assets
The impairment of tangible and intangible assets is assessed when changes in circumstances (such as, but not limited to, a decrease in market value of an asset, current and historical operating losses or a change in business strategy) indicate that their carrying value may not be recoverable. This assessment is based on estimates of future cash flows, salvage values or net sales proceeds. These estimates take into account management’s expectations and judgments regarding future business and economic conditions, future market values and disposal costs. Actual results and events could differ significantly from management estimates.
Environmental Liabilities
Liabilities for environmental matters are accrued for when it is probable that a liability has been incurred and the amount of the liability can be reasonably estimated. These estimates take into account current law, existing technologies and management’s judgment about future changes in regulation.
Each quarter, and when there are changes in circumstances, the Company formally evaluates known and potential sites. The Company reviews estimates for future remediation, and maintenance and management costs directly related to remediation, to determine appropriate environmental reserve amounts. For each site, a determination is made of the specific measures that are believed to be required to remediate the site, the estimated total cost to carry out the remediation plan, the portion of the total remediation costs to be borne by the Company and the anticipated time frame over which payments toward the remediation plan will occur. The Company’s estimate of environmental remediation liabilities may change in the future should additional sites be identified, further remediation measures be required or undertaken or current laws and regulations be changed. For additional information, see the Environmental discussion in Note 20 of Notes to Consolidated Financial Statements.
Legal Contingencies
The Company is subject to proceedings, lawsuits and other claims in the normal course of business. Each quarter, the Company formally evaluates its current proceedings, lawsuits and other claims with counsel and when there are changes in circumstances. These contingencies require management judgment in order to assess the likelihood of any adverse judgments or outcomes and the potential range of probable losses. Liabilities for legal matters are accrued for when it is probable that a liability has been incurred and the amount of the liability can be reasonably estimated, based upon current law and existing information. The Company assesses its legal liabilities separately from any potential insurance recovery or indemnification. As such, we record legal liabilities on a gross basis, unless a right of set-off exists. Any benefit from the insurance recoveries or that result from an indemnification by another party are recorded when the Company is reasonably certain the other party will fulfill its obligation. The Company’s insurance coverage provides coverage on a reimbursement basis; therefore, there may be a lag between any payment ultimately paid by the Company and reimbursement of such payment from the Company’s insurers. Estimates of contingencies may change in the future due to new developments or changes in legal approach. For additional information, see Note 20 of Notes to Consolidated Financial Statements.
Incentive Compensation
The Company maintains a long-term employee incentive compensation plan that is intended to reward eligible employees for their contributions to the Company’s long-term success. Provisions for employee incentive compensation are included in Accrued Liabilities and Other Liabilities on the Company’s Consolidated Balance Sheets. The Company’s financial target for the long-term incentive plan is return on equity to be achieved in three years, which can be accelerated and earned in two years. The financial targets are set annually by the Compensation Committee of the Board of Directors. If the financial targets are not going to be achieved at the end of year three, one-half of the award is forfeited and the remaining award is earned over the remaining three year period. Therefore, changes in the Company’s estimated financial performance could have a significant
54
Table of Contents
impact on the amount of compensation expense recorded by the Company in any given period. Since certain awards in the Company’s long-term incentive plan are paid out in cash based upon market price of the Company’s common stock, the amount of incentive compensation expense will vary based upon the market price of the Company’s stock at the end of each reporting period. The Company has entered into equity total return swap agreements in order to minimize earnings volatility related to fluctuations in the Company’s stock price. See Note 13 to Consolidated Financial Statements for further detail.
For additional information about significant accounting policies, see Note 1 of Notes to Consolidated Financial Statements.
New Accounting Pronouncements
In October 2009, the FASB issued Accounting Standards Update (“ASU”) 2009-13 “Revenue Recognition (Topic 605)—Multiple Deliverable Revenue Arrangements”. FASB ASU 2009-13 addresses the accounting for multiple-deliverable arrangements to enable vendors to account for products or services (deliverables) separately rather than as a combined unit. This guidance establishes a selling price hierarchy for determining the selling price of a deliverable, which is based on: (a) vendor-specific objective evidence; (b) third-party evidence; or (c) estimates. This guidance also eliminates the residual method of allocation and requires that arrangement consideration be allocated at the inception of the arrangement to all deliverables using the relative selling price method. In addition, this guidance significantly expands required disclosures related to a vendor’s multiple-deliverable revenue arrangements. The new standard will be effective for the Company on January 1, 2011. The Company is currently evaluating the impact of the adoption of the pronouncement, if any.
In December 2009, the FASB issued Accounting Standards Update 2009-16 “Transfers and Servicing (Topic 860)—Accounting for Transfers of Financial Assets” (formerly Statement of Financial Accounting Standards (“SFAS”) No. 166, “Accounting for Transfers of Financial Assets”) and FASB ASU 2009-17, “Consolidations (Topic 810)—Improvements to Financial Reporting by Enterprises Involved with Variable Interest Entities” (formerly SFAS No. 167, “Amendments to FASB Interpretation No. 46(R)”). FASB ASU 2009-16 is a revision to SFAS No. 140, “Accounting for Transfers and Servicing of Financial Assets and Extinguishments of Liabilities” and will require more information about transfers of financial assets, including securitization transactions, and where entities have continuing exposure to the risks related to transferred financial assets. It eliminates the concept of a “qualifying special-purpose entity,” changes the requirements for derecognizing financial assets, and requires additional disclosures. FASB ASU 2009-17 is a revision to FASB Interpretation No. 46 (Revised December 2003), “Consolidation of Variable Interest Entities”, and changes how a reporting entity determines when an entity that is insufficiently capitalized or is not controlled through voting (or similar rights) should be consolidated. The determination of whether a reporting entity is required to consolidate another entity is based on, among other things, the other entity’s purpose and design and the reporting entity’s ability to direct the activities of the other entity that most significantly impact the other entity’s economic performance. The new standards, which will also require a number of new disclosures, were effective for the Company on January 1, 2010. The adoption of this pronouncement will not have any impact on the Company’s Consolidated Financial Statements.
Derivative Financial Instruments
Derivative instruments are recognized as assets or liabilities in the Company’s Consolidated Balance Sheets and are measured at fair value. The change in the fair value of a derivative designated as a fair value hedge and the change in the fair value of the hedged item attributable to the hedged risk are recognized in earnings. For derivatives which qualify for designation as cash flow hedges, the effective portion of the changes in fair value is recognized as part of other comprehensive income until the underlying transaction that is being hedged is recognized in earnings. The ineffective portion of the change in fair value of cash flow hedges is recognized in earnings currently. Changes in fair value for other derivatives, which do not qualify as a hedge for accounting purposes, are recognized in current period earnings.
55
Table of Contents
The Company enters into forward sales and purchase contracts, cross-currency swap agreements and currency options to manage currency risk resulting from purchase and sale commitments denominated in foreign currencies (principally British pound, euro, Australian dollar, New Zealand dollar, Canadian dollar and Japanese yen) and relating to particular anticipated but not yet committed purchases and sales expected to be denominated in those currencies. Most of the Company’s currency derivatives expire within one year. At December 31, 2009, the Company had forward contracts to sell foreign currencies with U.S. dollar equivalent value of $15.8 million and forward contracts to buy foreign currencies with U.S. dollar equivalent value of $1.3 million. Additionally, at December 31, 2009, the Company had cross-currency swap agreements with a notional value of approximately $3 million. The Company had no outstanding option contracts to sell or buy foreign currencies at December 31, 2009. At December 31, 2008, the Company had forward contracts to sell foreign currencies with U.S. dollar equivalent value of $22.2 million and forward contracts to buy foreign currencies with U.S. dollar equivalent value of $7.3 million. The Company had no outstanding cross-currency swap agreements or option contracts to sell or buy foreign currencies at December 31, 2008.
The Company is exposed to stock price risk related to its deferred compensation and long-term incentive plans (“plans”) as, for some of the awards, the underlying liabilities are tied to the Company’s stock price. As the Company’s stock price changes such liabilities are adjusted and the impact is recorded in the Company’s Consolidated Statement of Income. The Company has entered into equity total return swap agreements with a total notional value of 400,000 shares in order to minimize earnings volatility related to the plans. The Company did not designate the swaps as hedges. Rather, the Company marks the swaps to market and records the impact in Selling and Administration expenses in the Company’s Consolidated Statement of Income. The adjustments to the values of the swaps offset the adjustments to the carrying values of the Company’s deferred compensation and long-term incentive plan liabilities, which are also recorded in Selling and Administration expenses in the Company’s Consolidated Statement of Income.
The Company is exposed to interest rate risk on its outstanding borrowings that are subject to floating rates. In April 2008, the Company entered into interest rate swap agreements with a notional value of $20 million. The swaps effectively convert the LIBOR based variable rate interest on $20.0 million of debt outstanding under the credit facility to a fixed rate of 2.72%. Additionally, in October 2008, the Company entered into an interest rate swap agreement with a notional value of $30 million. The swap effectively converts the LIBOR based variable rate interest on an additional $30.0 million of debt to a fixed rate of 3.18%. The Company has designated the swap agreements as a cash flow hedge of the risk of variability in future interest payments attributable to changes in the LIBOR rate.
Cautionary Statement under Federal Securities Laws
Except for historical information contained herein, the information set forth in this Form 10-K contains forward-looking statements that are based on management’s beliefs, certain assumptions made by management and management’s current expectations, outlook, estimates and projections about the markets and economy in which the Company and its various businesses operate. Words such as “anticipates,” “believes,” “estimates,” “expects,” “forecasts,” “intends,” “opines,” “plans,” “predicts,” “projects,” “should,” “targets” and variations of such words and similar expressions are intended to identify such forward-looking statements. These statements are not guarantees of future performance and involve certain risks, uncertainties and assumptions (“Future Factors”), which are difficult to predict. Therefore, actual outcomes and results may differ materially from what is expected or forecasted in such forward-looking statements. The Company undertakes no obligation to update publicly any forward-looking statements, whether as a result of future events, new information or otherwise. Future Factors which could cause actual results to differ materially from those discussed include but are not limited to: general economic and business and market conditions; no improvement or weakening in U.S., European and Asian economies; increases in interest rates; changes in foreign currencies against the U.S. dollar; customer acceptance of new products; efficacy of new technology; changes in U.S. or foreign laws and regulations; increased competitive and/or customer pressure; loss of key customers; the Company’s ability to maintain chemical price increases; higher-than-expected raw material and energy costs and availability for
56
Table of Contents
certain chemical product lines; unexpected changes in the antidumping duties on certain products; increased foreign competition in the calcium hypochlorite markets; inability to obtain transportation for our chemicals; unfavorable court decisions, including unfavorable decisions in appeals of antidumping rulings, arbitration or jury decisions or tax matters; the supply/demand balance for the Company’s products, including the impact of excess industry capacity; failure to achieve targeted cost-reduction programs; capital expenditures in excess of those scheduled; environmental costs in excess of those projected; the occurrence of unexpected manufacturing interruptions/outages at customer or Company plants; a decision by the Company not to start up the hydrates manufacturing facility; unfavorable weather conditions for swimming pool use; inability to expand sales in the professional pool dealer market; the impact of global weather changes; changes in the Company’s stock price; ability to obtain financing at attractive rates; financial market disruptions that impact our customers or suppliers; and gains or losses on derivative instruments.
57
Table of Contents
| Item 7A. | Quantitative and Qualitative Disclosures about Market Risk |
The Company is exposed to various market risks, including changes in foreign currency exchange rates, interest rates, commodity prices and stock prices. The Company does not enter into derivatives or other financial instruments for trading or speculative purposes in the normal course of business.
Interest Rates
The Company is exposed to interest rate risk on approximately 60 percent of its outstanding borrowings that are subject to floating rates. Based on the Company’s expected 2010 borrowing levels, an increase in interest rates of 100 basis points would decrease the Company’s annual results of operations and annual cash flows by approximately $1.1 million.
See Note 13 to the Consolidated Financial Statements for detail of the Company’s interest rate swap agreements.
Foreign Currency Risk
Approximately 40 percent of the Company’s sales and expenses are denominated in currencies other than the U.S. dollar. As a result, the Company is subject to risks associated with its foreign operations, including currency devaluations and fluctuations in currency exchange rates. These exposures from foreign exchange fluctuations can affect the Company’s equity investments and its respective share of earnings (losses), the Company’s net investment in foreign subsidiaries, translation of the Company’s foreign operations for U.S. GAAP reporting purposes and purchase and sales commitments denominated in foreign currencies. The Company enters into forward sales and purchase contracts, cross-currency swap agreements and currency options to manage currency risk from actual and anticipated purchase and sales commitments denominated or expected to be denominated in a foreign currency (principally British pound, euro, Australian dollar, New Zealand dollar, Canadian dollar and Japanese yen). It is the Company’s policy to hedge up to 80% of these transactions during a calendar year. The counterparties to the options and contracts are major financial institutions.
Holding other variables constant, if there were a 10 percent change in foreign currency exchange rates, the net effect on the Company’s annual cash flows would be an increase (decrease) of between $2 million to $3 million related to the unhedged portion. Any increase (decrease) in cash flows resulting from the Company’s hedge forward contracts would be offset by an equal (decrease) increase in cash flows on the underlying transaction being hedged. The application of U.S. GAAP may cause increased volatility in the Company’s results of operations in the future if the Company changes its policies, or if some of the derivative instruments do not meet the requirements for hedge accounting.
See Note 13 to the Consolidated Financial Statements for detail of the Company’s foreign currency forward contracts and cross-currency swap agreements.
Commodity Price Risk
The Company is exposed to commodity price risk related to the price volatility of natural gas utilized at certain manufacturing sites. Depending on market conditions, the Company may purchase derivative commodity instruments to minimize the risk of price fluctuations. It is the Company’s policy to hedge up to 80 percent of its natural gas and copper purchases during a calendar year. In general, the Company’s guideline is to hedge a minimum of approximately 50 percent of the Company’s rolling twelve-month copper requirements. At December 31, 2009, the Company had purchase commitments but had no forward contracts to purchase natural gas and copper. In addition, the Company is exposed to price risk related to the price volatility of certain other raw materials including the ongoing purchase of propylene oxide, ethylene oxide, scrap copper metal, chromic
58
Table of Contents
acid, monoethanolamine (“MEA”) and resins. Holding other variables constant, a 10 percent adverse change in the price of either chromic acid, resins, propylene oxide or copper would decrease the Company’s annual results of operations and annual cash flows between $1 million to $2 million. Additionally, holding other variables constant, a 10 percent adverse change in the price of either natural gas or ethylene oxide would decrease the Company’s annual results of operations and annual cash flows by approximately $1 million.
Stock Price Risk
The Company is exposed to stock price risk related to its deferred compensation and long-term incentive plans as a portion of the underlying liabilities are tied to the Company’s stock price. The Company has entered into equity total return swap agreements in order to minimize earnings volatility related to fluctuations in the Company’s stock price. See Note 13 to the Consolidated Financial Statements for further detail.
59
Table of Contents
| Item 8. | Financial Statements and Supplementary Data |
REPORT OF INDEPENDENT REGISTERED PUBLIC ACCOUNTING FIRM
The Board of Directors and Shareholders
Arch Chemicals, Inc.:
We have audited the accompanying consolidated balance sheets of Arch Chemicals, Inc. and subsidiaries (the “Company”) as of December 31, 2009 and 2008, and the related consolidated statements of income, shareholders’ equity and comprehensive income (loss), and cash flows for each of the years in the three-year period ended December 31, 2009. We also have audited the Company’s internal control over financial reporting as of December 31, 2009, based on criteria established in Internal Control—Integrated Framework issued by the Committee of Sponsoring Organizations of the Treadway Commission (COSO). The Company’s management is responsible for these consolidated financial statements, for maintaining effective internal control over financial reporting, and for its assessment of the effectiveness of internal control over financial reporting, included in the accompanying Management Report. Our responsibility is to express an opinion on these consolidated financial statements and an opinion on the Company’s internal control over financial reporting based on our audits.
We conducted our audits in accordance with the standards of the Public Company Accounting Oversight Board (United States). Those standards require that we plan and perform the audit to obtain reasonable assurance about whether the financial statements are free of material misstatement and whether effective internal control over financial reporting was maintained in all material respects. Our audits of the consolidated financial statements included examining, on a test basis, evidence supporting the amounts and disclosures in the financial statements, assessing the accounting principles used and significant estimates made by management, and evaluating the overall financial statement presentation. Our audit of internal control over financial reporting included obtaining an understanding of internal control over financial reporting, assessing the risk that a material weakness exists, and testing and evaluating the design and operating effectiveness of internal control based on the assessed risk. Our audits also included performing such other procedures as we considered necessary in the circumstances. We believe that our audits provide a reasonable basis for our opinions.
A company’s internal control over financial reporting is a process designed to provide reasonable assurance regarding the reliability of financial reporting and the preparation of financial statements for external purposes in accordance with generally accepted accounting principles. A company’s internal control over financial reporting includes those policies and procedures that (1) pertain to the maintenance of records that, in reasonable detail, accurately and fairly reflect the transactions and dispositions of the assets of the company; (2) provide reasonable assurance that transactions are recorded as necessary to permit preparation of financial statements in accordance with generally accepted accounting principles, and that receipts and expenditures of the company are being made only in accordance with authorizations of management and directors of the company; (3) provide reasonable assurance regarding prevention or timely detection of unauthorized acquisition, use, or disposition of the company’s assets that could have a material effect on the financial statements.
Because of its inherent limitations, internal control over financial reporting may not prevent or detect misstatements. Also, projections of any evaluation of effectiveness to future periods are subject to the risk that controls may become inadequate because of changes in conditions, or that the degree of compliance with the policies or procedures may deteriorate.
In our opinion, the consolidated financial statements referred to above present fairly, in all material respects, the financial position of the Company as of December 31, 2009 and 2008, and the results of its operations and its cash flows for each of the years in the three-year period ended December 31, 2009, in conformity with U.S. generally accepted accounting principles. Also in our opinion, the Company maintained, in all material respects, effective internal control over financial reporting as of December 31, 2009, based on criteria established in Internal Control—Integrated Framework issued by the Committee of Sponsoring Organizations of the Treadway Commission (COSO).
60
Table of Contents
In 2007, the Company adopted Financial Accounting Standards Board (FASB) Interpretation No. 48, Accounting for Uncertainty in Income Taxes (included in FASB ASC Topic 740, Income Taxes.)
/s/ KPMG LLP
Stamford, Connecticut
February 19, 2010
61
Table of Contents
ARCH CHEMICALS, INC. and SUBSIDIARIES
CONSOLIDATED BALANCE SHEETS
| December 31, | ||||||||
| 2009 | 2008 | |||||||
| (in millions, except per share amounts) |
||||||||
| ASSETS | ||||||||
| Current Assets: |
||||||||
| Cash and Cash Equivalents |
$ | 70.1 | $ | 50.8 | ||||
| Accounts Receivables, net |
161.3 | 184.2 | ||||||
| Short-Term Investment |
76.0 | 56.0 | ||||||
| Inventories, net |
171.1 | 216.1 | ||||||
| Other Current Assets |
16.3 | 19.6 | ||||||
| Total Current Assets |
494.8 | 526.7 | ||||||
| Investments and Advances—Affiliated Companies at Equity |
2.0 | 1.5 | ||||||
| Property, Plant and Equipment, net |
214.9 | 212.2 | ||||||
| Goodwill |
205.8 | 199.6 | ||||||
| Other Intangibles |
180.3 | 183.0 | ||||||
| Other Assets |
112.7 | 109.4 | ||||||
| Total Assets |
$ | 1,210.5 | $ | 1,232.4 | ||||
| LIABILITIES AND SHAREHOLDERS’ EQUITY | ||||||||
| Current Liabilities: |
||||||||
| Short-Term Borrowings |
$ | 11.1 | $ | 18.5 | ||||
| Current Portion of Long-Term Debt |
21.9 | — | ||||||
| Accounts Payable |
148.0 | 180.1 | ||||||
| Accrued Liabilities |
84.2 | 75.9 | ||||||
| Total Current Liabilities |
265.2 | 274.5 | ||||||
| Long-Term Debt |
257.7 | 314.5 | ||||||
| Other Liabilities |
282.7 | 281.5 | ||||||
| Total Liabilities |
805.6 | 870.5 | ||||||
| Commitments and Contingencies |
||||||||
| Shareholders’ Equity: |
||||||||
| Common Stock, par value $1 per share, Authorized 100.0 shares: |
||||||||
| 25.0 shares issued and outstanding (24.8 in 2008) |
25.0 | 24.8 | ||||||
| Additional Paid-in Capital |
461.4 | 457.2 | ||||||
| Retained Earnings |
91.2 | 64.1 | ||||||
| Accumulated Other Comprehensive Loss |
(172.7 | ) | (184.2 | ) | ||||
| Total Shareholders’ Equity |
404.9 | 361.9 | ||||||
| Total Liabilities and Shareholders’ Equity |
$ | 1,210.5 | $ | 1,232.4 | ||||
See accompanying notes to the consolidated financial statements.
62
Table of Contents
ARCH CHEMICALS, INC. and SUBSIDIARIES
CONSOLIDATED STATEMENTS OF INCOME
| Years Ended December 31, | |||||||||||
| 2009 | 2008 | 2007 | |||||||||
| (in millions, except per share amounts) |
|||||||||||
| Sales |
$ | 1,391.9 | $ | 1,492.1 | $ | 1,487.6 | |||||
| Cost of Goods Sold |
979.3 | 1,063.3 | 1,055.7 | ||||||||
| Selling and Administration |
305.4 | 295.5 | 309.7 | ||||||||
| Research and Development |
22.7 | 21.8 | 20.1 | ||||||||
| Other (Gains) and Losses |
— | (1.8 | ) | (12.8 | ) | ||||||
| Restructuring and Other Expense |
1.1 | 1.3 | 8.1 | ||||||||
| Impairment Charge |
— | 25.8 | 7.9 | ||||||||
| Interest Expense |
13.7 | 14.2 | 17.1 | ||||||||
| Interest Income |
1.5 | 3.5 | 3.8 | ||||||||
| Income From Continuing Operations Before Taxes and Equity in Earnings of Affiliated Companies |
71.2 | 75.5 | 85.6 | ||||||||
| Equity in Earnings of Affiliated Companies |
0.6 | 0.4 | 0.5 | ||||||||
| Income Tax Expense |
24.7 | 38.9 | 36.8 | ||||||||
| Income From Continuing Operations |
47.1 | 37.0 | 49.3 | ||||||||
| Income from Discontinued Operations (net of tax expense of $0.4 million) |
— | — | 0.9 | ||||||||
| Loss on Sale of Discontinued Operations (net of tax expense of $0.3 million) |
— | — | (14.9 | ) | |||||||
| Net Income |
$ | 47.1 | $ | 37.0 | $ | 35.3 | |||||
| Net Income (Loss) Per Common Share—Basic: |
|||||||||||
| Continuing Operations |
$ | 1.89 | $ | 1.49 | $ | 2.01 | |||||
| Income From Discontinued Operations |
— | — | 0.04 | ||||||||
| Loss on Sale of Discontinued Operations |
— | — | (0.61 | ) | |||||||
| Basic Net Income Per Common Share |
$ | 1.89 | $ | 1.49 | $ | 1.44 | |||||
| Net Income (Loss) Per Common Share—Diluted: |
|||||||||||
| Continuing Operations |
$ | 1.88 | $ | 1.49 | $ | 2.00 | |||||
| Income From Discontinued Operations |
— | — | 0.03 | ||||||||
| Loss on Sale of Discontinued Operations |
— | — | (0.60 | ) | |||||||
| Diluted Net Income Per Common Share |
$ | 1.88 | $ | 1.49 | $ | 1.43 | |||||
| Weighted Average Common Stock Outstanding—Basic |
25.0 | 24.8 | 24.5 | ||||||||
| Weighted Average Common Stock Outstanding—Diluted |
25.1 | 24.9 | 24.7 | ||||||||
See accompanying notes to the consolidated financial statements.
63
Table of Contents
ARCH CHEMICALS, INC. and SUBSIDIARIES
CONSOLIDATED STATEMENTS OF CASH FLOWS
| Years Ended December 31, | ||||||||||||
| 2009 | 2008 | 2007 | ||||||||||
| ($ in millions) | ||||||||||||
| Operating Activities: |
||||||||||||
| Net Income |
$ | 47.1 | $ | 37.0 | $ | 35.3 | ||||||
| Adjustments to Reconcile Net Income to Net Cash and Cash Equivalents Provided by Operating Activities, Net of Businesses Acquired: |
||||||||||||
| Income from Discontinued Operations |
— | — | (0.9 | ) | ||||||||
| Loss on Sale of Discontinued Operations |
— | — | 14.9 | |||||||||
| Equity in Earnings of Affiliates |
(0.6 | ) | (0.4 | ) | (0.5 | ) | ||||||
| Other (Gains) and Losses |
— | (1.8 | ) | (12.8 | ) | |||||||
| Depreciation and Amortization |
46.7 | 45.5 | 45.0 | |||||||||
| Deferred Taxes |
17.0 | 18.2 | 8.0 | |||||||||
| Restructuring Expense |
— | 1.3 | 8.1 | |||||||||
| Restructuring Payments |
(0.2 | ) | (2.1 | ) | (6.7 | ) | ||||||
| Impairment Charge |
— | 25.8 | 7.9 | |||||||||
| Change in Assets and Liabilities, Net of Purchases and Sales of Businesses: |
||||||||||||
| Accounts Receivable Securitization Program |
— | — | — | |||||||||
| Receivables |
14.6 | (12.4 | ) | (5.9 | ) | |||||||
| Inventories |
56.8 | (17.9 | ) | (17.1 | ) | |||||||
| Other Current Assets |
2.1 | 1.3 | (4.6 | ) | ||||||||
| Accounts Payable and Accrued Liabilities |
(34.9 | ) | (31.2 | ) | 4.7 | |||||||
| Noncurrent Liabilities |
(31.5 | ) | (10.4 | ) | (32.1 | ) | ||||||
| Other Operating Activities |
(0.7 | ) | (7.5 | ) | 10.9 | |||||||
| Net Operating Activities from Continuing Operations |
116.4 | 45.4 | 54.2 | |||||||||
| Cash Flow of Discontinued Operations |
— | — | (1.6 | ) | ||||||||
| Net Operating Activities |
116.4 | 45.4 | 52.6 | |||||||||
| Investing Activities: |
||||||||||||
| Capital Expenditures |
(29.9 | ) | (53.3 | ) | (41.6 | ) | ||||||
| Businesses Acquired in Purchase Transactions, Net of Cash Acquired |
0.3 | (125.5 | ) | (14.3 | ) | |||||||
| Proceeds from Sale of a Business, net |
1.2 | 3.7 | 11.6 | |||||||||
| Proceeds from Sale of Land and Property |
— | 0.7 | 2.8 | |||||||||
| Cash Flow of Discontinued Operations |
— | — | — | |||||||||
| Other Investing Activities |
— | — | (0.9 | ) | ||||||||
| Net Investing Activities |
(28.4 | ) | (174.4 | ) | (42.4 | ) | ||||||
| Financing Activities: |
||||||||||||
| Long-Term Debt Borrowings |
201.3 | 150.0 | 150.0 | |||||||||
| Long-Term Debt Repayments |
(239.4 | ) | (14.6 | ) | (184.8 | ) | ||||||
| Short-Term (Repayments) Borrowings, net |
(10.4 | ) | (7.0 | ) | 15.4 | |||||||
| Dividends Paid |
(20.0 | ) | (19.9 | ) | (19.6 | ) | ||||||
| Cash Flow of Discontinued Operations |
— | — | (0.8 | ) | ||||||||
| Other Financing Activities |
0.2 | 1.3 | 17.4 | |||||||||
| Net Financing Activities |
(68.3 | ) | 109.8 | (22.4 | ) | |||||||
| Effect of Exchange Rate Changes on Cash and Cash Equivalents |
(0.4 | ) | (3.7 | ) | 3.5 | |||||||
| Net Increase (Decrease) in Cash and Cash Equivalents |
19.3 | (22.9 | ) | (8.7 | ) | |||||||
| Cash and Cash Equivalents, Beginning of Year |
50.8 | 73.7 | 82.4 | |||||||||
| Cash and Cash Equivalents, End of Year |
$ | 70.1 | $ | 50.8 | $ | 73.7 | ||||||
| Supplemental Cash Flow Information for: |
||||||||||||
| Income Taxes Paid, net of refunds |
$ | 6.3 | $ | 28.9 | $ | 17.0 | ||||||
| Interest Paid |
$ | 15.6 | $ | 12.8 | $ | 21.5 | ||||||
See accompanying notes to the consolidated financial statements.
64
Table of Contents
ARCH CHEMICALS, INC. and SUBSIDIARIES
CONSOLIDATED STATEMENTS OF SHAREHOLDERS’ EQUITY
AND COMPREHENSIVE INCOME (LOSS)
| Common Stock | Additional Paid-in Capital |
Retained Earnings |
Accumulated Other Comprehensive Loss |
Total Shareholders’ Equity |
Comprehensive Income(Loss) |
|||||||||||||||||||
| Shares | Amount | |||||||||||||||||||||||
| (in millions, except per share amounts) | ||||||||||||||||||||||||
| Balance at December 31, 2006 |
24.1 | $ | 24.1 | $ | 434.8 | $ | 31.3 | $ | (124.0 | ) | $ | 366.2 | ||||||||||||
| Net Income |
— | — | — | 35.3 | — | 35.3 | 35.3 | |||||||||||||||||
| Foreign Currency Translation Adjustments |
— | — | — | — | 38.2 | 38.2 | 38.2 | |||||||||||||||||
| Change in Fair Value of Derivatives |
— | — | — | — | (0.8 | ) | (0.8 | ) | (0.8 | ) | ||||||||||||||
| Pension Liability Adjustment, net of taxes of $17.6 |
— | — | — | — | 37.7 | 37.7 | 37.7 | |||||||||||||||||
| Stock issued |
— | — | 0.1 | — | — | 0.1 | — | |||||||||||||||||
| Tax Benefit on Stock Options |
— | — | 1.9 | — | — | 1.9 | — | |||||||||||||||||
| Stock Options Exercised |
0.6 | 0.6 | 14.8 | — | — | 15.4 | — | |||||||||||||||||
| Cash Dividends ($0.80 per share) |
— | — | — | (19.6 | ) | — | (19.6 | ) | — | |||||||||||||||
| Balance at December 31, 2007 |
24.7 | 24.7 | 451.6 | 47.0 | (48.9 | ) | 474.4 | $ | 110.4 | |||||||||||||||
| Net Income |
— | — | — | 37.0 | — | 37.0 | 37.0 | |||||||||||||||||
| Foreign Currency Translation Adjustments |
— | — | — | — | (59.8 | ) | (59.8 | ) | (59.8 | ) | ||||||||||||||
| Change in Fair Value of Derivatives, net of taxes of $0.8 |
— | — | — | — | (1.9 | ) | (1.9 | ) | (1.9 | ) | ||||||||||||||
| Pension Liability Adjustment, net of taxes of $34.2 |
— | — | — | — | (73.6 | ) | (73.6 | ) | (73.6 | ) | ||||||||||||||
| Stock issued |
— | — | 0.2 | — | — | 0.2 | — | |||||||||||||||||
| Tax Benefit on Stock Options |
— | — | 0.1 | — | — | 0.1 | — | |||||||||||||||||
| Stock Options Exercised |
0.1 | 0.1 | 1.1 | — | — | 1.2 | — | |||||||||||||||||
| Share-Based Compensation |
— | — | 4.2 | — | — | 4.2 | — | |||||||||||||||||
| Cash Dividends ($0.80 per share) |
— | — | — | (19.9 | ) | — | (19.9 | ) | — | |||||||||||||||
| Balance at December 31, 2008 |
24.8 | 24.8 | 457.2 | 64.1 | (184.2 | ) | 361.9 | $ | (98.3 | ) | ||||||||||||||
| Net Income |
— | — | — | 47.1 | — | 47.1 | 47.1 | |||||||||||||||||
| Foreign Currency Translation Adjustments |
— | — | — | — | 30.9 | 30.9 | 30.9 | |||||||||||||||||
| Change in Fair Value of Derivatives, net of taxes of $0.3 |
— | — | — | — | 1.2 | 1.2 | 1.2 | |||||||||||||||||
| Pension Liability Adjustment, net of taxes of $10.2 |
— | — | — | — | (20.6 | ) | (20.6 | ) | (20.6 | ) | ||||||||||||||
| Tax Benefit on Stock Options |
— | — | 0.1 | — | — | 0.1 | — | |||||||||||||||||
| Stock Options Exercised |
0.1 | 0.1 | 1.4 | — | — | 1.5 | — | |||||||||||||||||
| Share-Based Compensation |
0.1 | 0.1 | 2.7 | — | — | 2.8 | — | |||||||||||||||||
| Cash Dividends ($0.80 per share) |
— | — | — | (20.0 | ) | — | (20.0 | ) | — | |||||||||||||||
| Balance at December 31, 2009 |
25.0 | $ | 25.0 | $ | 461.4 | $ | 91.2 | $ | (172.7 | ) | $ | 404.9 | $ | 58.6 | ||||||||||
See accompanying notes to the consolidated financial statements.
65
Table of Contents
ARCH CHEMICALS, INC. and SUBSIDIARIES
NOTES TO CONSOLIDATED FINANCIAL STATEMENTS
| 1. | Description of Business and Summary of Significant Accounting Policies |
Formation of Arch Chemicals, Inc.
Arch Chemicals, Inc. (“Arch” or the “Company”) was organized under the laws of the Commonwealth of Virginia on August 25, 1998. The Company is a global biocides company providing chemistry-based and related solutions to destroy and control the growth of harmful microbes selectively. Our focus is in water treatment, hair and skin care products, wood treatment, preservation and protection applications such as for paints and building products, and health and hygiene applications. The Company operates in two segments: Treatment Products and Performance Products. The Treatment Products segment includes three reportable business units: the HTH water products, the personal care and industrial biocides products and the wood protection and industrial coatings products businesses. The Performance Products segment includes two reportable business units: the performance urethanes business and the hydrazine business.
The Company has organized its segments around differences in products and services, which is how the Company manages its businesses.
The Treatment Products businesses manufacture and sell water treatment chemicals, industrial biocides and personal care specialty ingredients and wood treatment and industrial coatings products. HTH water products produces chemicals for the sanitization and treatment of residential pool and commercial pool and spa water, water used in industrial applications and the purification of potable water. Additionally, the surface water business of HTH water products manufacturers a range of branded products, including products under the Applied Biochemists® brand name and provides technical support for controlling algae and nuisance aquatic vegetation. The Company sells both chlorine-based products (calcium hypochlorite and chlorinated isocyanurates) and non-chlorine-based products (poly (hexamethylene biguanide) hydrochloride (“PHMB”)) as sanitizers. Consumer brands include HTH®, Baquacil®, Baqua Spa®, POOLIFE®, GLB® Pool & Spa®, and Leisure Time®. The personal care and industrial biocides business manufactures biocides that control dandruff on the scalp and control the growth of micro-organisms particularly fungi and algae. It markets products such as Zinc Omadine® biocide, the most widely used antidandruff agent in the world, as well as actives and functional products sold primarily to manufacturers of skin care and hair care products. The Company’s industrial biocides are used in mildew-resistant paints, coatings and lubricants. The Company also develops, manufactures and markets biocides primarily for anti-bacterial applications; it is a leading global supplier of biocides for the industrial preservation and consumer segments of the biocides market. The biocides products are marketed under the well-recognized trademarks, such as Omadine®, Omacide®, Triadine®, Proxel®, Purista®, Vantocil®, Reputex®, Cosmocil® and Densil® biocides. The Company’s wood protection business sells wood treatment chemicals solutions that enhance the properties of wood. Its wood preservatives and fire retardants are sold under the brand names Wolman®, Tanalith®, Vacsol®, Resistol® and Dricon®. The Company’s industrial coatings business manufactures a wide range of coatings for a variety of applications for wood and other materials, which are industrial or consumer applied products for the surface decoration and protection of wood. These products are sold under brand names such as Sayerlack® and Linea Blu®.
Performance Products consist of performance urethanes and hydrazine. Performance urethanes manufacture a variety of specialty polyols, which are used as an ingredient for elastomers, adhesives, coatings, sealants and rigid foam. The business also manufactures glycols and glycol ethers for use as an ingredient in cleaners, personal care products and antifreeze. Hydrazine hydrates are used in chemical blowing agents, water treatment chemicals, agricultural products and pharmaceutical intermediates. Propellant-grade hydrazine and hydrazine derivatives are used by NASA, the U.S. Air Force and other customers as fuel in satellites, expendable launch vehicles and auxiliary and emergency power units. Ultra Pure™ hydrazine propellants are the highest purity anhydrous propellant in the industry and can extend the working life of satellites.
66
Table of Contents
Basis of Presentation
The Consolidated Financial Statements include the accounts of the Company and its majority-owned subsidiaries. Intercompany balances and transactions between entities included in these Consolidated Financial Statements have been eliminated. Investments in 20-50% owned affiliates are accounted for on the equity method.
The Company has evaluated subsequent events through the date of the filing of this Form 10-K.
Use of Estimates
The preparation of the Consolidated Financial Statements requires estimates and assumptions that affect amounts reported and disclosed in the Consolidated Financial Statements and related Notes. Estimates are used when accounting for allowance for uncollectible accounts receivable, inventory obsolescence, valuation of assets held for sale, depreciation and amortization, employee benefit plans, performance-based incentive compensation, taxes, impairment of assets, environmental and legal liabilities and contingencies, among others. Actual results could differ from those estimates.
Cash and Cash Equivalents
Cash equivalents consist of highly liquid investments with an original maturity of three months or less.
Inventories
Inventories are stated at the lower of cost or net realizable value. Inventories are valued by the dollar value last-in, first-out (“LIFO”) method of inventory accounting for the domestic operations of the HTH water products, personal care and industrial biocides, performance urethanes and hydrazine businesses. Costs for all other inventories have been determined principally by the first-in, first-out (“FIFO”) method. Elements of costs in inventories include raw materials, direct labor and manufacturing overhead.
Assets Held for Sale
The Company accounts for assets held for sale in accordance with Financial Accounting Standards Board (“FASB”) Accounting Standards Codification (“ASC”) 360, “Property, Plant, and Equipment”, which addresses financial accounting and reporting for the impairment or disposal of long-lived assets.
As a result of the sale of the performance urethanes business in Venezuela in September 2007, the Company has included the results of this business prior to its sale and the loss on the disposition as a component of discontinued operations.
Property, Plant and Equipment
Property, plant and equipment are recorded at cost. Depreciation is computed on a straight-line basis over the following estimated useful lives:
| Improvements to land |
5 to 20 years | |
| Building and building equipment |
5 to 40 years | |
| Machinery and equipment |
3 to 12 years |
Leasehold improvements are amortized over the term of the lease or the estimated useful life of the improvement, whichever is shorter. Start-up costs are expensed as incurred. Maintenance and repairs are expensed as incurred.
67
Table of Contents
New Accounting Pronouncements
In September 2006, the FASB issued updated guidance in FASB ASC 820, “Fair Value Measurements and Disclosures” (formerly SFAS No. 157, “Fair Value Measurements”), which establishes a framework for reporting fair value and expands disclosures about fair value measurements. Effective January 1, 2009, the Company adopted the updated guidance in FASB ASC 820 for non-financial instruments that are recognized or disclosed in the financial statements at fair value on a non-recurring basis. See Note 23 for further detail.
In December 2007, the FASB issued updated guidance in FASB ASC 805, “Business Combinations” (formerly SFAS No. 141(R), “Business Combinations”) and FASB ASC 810 “Consolidations” (formerly SFAS No. 160, “Noncontrolling Interests in Consolidated Financial Statements—an amendment to ARB No. 51”) . The updated guidance in FASB ASC 805 and FASB ASC 810 requires most identifiable assets, liabilities, noncontrolling interests, and goodwill acquired in a business combination to be recorded at “full fair value” and require noncontrolling interests (previously referred to as minority interests) to be reported as a component of equity, which changes the accounting for transactions with noncontrolling interest holders. The updated guidance was adopted by the Company on January 1, 2009. Such adoption did not have a material impact on the Company’s consolidated financial statements for 2009. The Company expects that the updated guidance in FASB ASC 805 will have an impact on the Company’s future consolidated financial statements, although the nature and magnitude of the impact will depend upon the terms of the Company’s future business combinations.
In June 2008, the FASB issued updated guidance in FASB ASC 260, “Earnings per Share” (formerly FASB Staff Position No. EITF 03-6-1, “Determining Whether Instruments Granted in Share-Based Payment Transactions Are Participating Securities”). The Company adopted the updated guidance in FASB ASC 260 on January 1, 2009 and it did not have any impact on the Company’s consolidated financial statements.
In May 2009, the FASB issued updated guidance in FASB ASC 855, “Subsequent Events” (formerly SFAS No. 165, “Subsequent Events”). This updated guidance establishes general standards of accounting for and disclosure of events that occur after the balance sheet date but before financial statements are issued or are available to be issued. Specifically, FASB ASC 855 provides: the period after the balance sheet date during which management of a reporting entity should evaluate events or transactions that may occur for potential recognition or disclosure in the financial statements; the circumstances under which an entity should recognize events or transactions occurring after the balance sheet date in its financial statements; and the disclosures that an entity should make about events or transactions that occurred after the balance sheet date. The Company adopted the updated guidance in FASB ASC 855 effective April 1, 2009. The adoption did not have a material impact on the Company’s consolidated financial statements.
In July 2009, the FASB issued FASB ASC 105, “Generally Accepted Accounting Principles” (formerly Statement of Financial Accounting Standard (“SFAS”) No. 168 “The FASB Accounting Standards Codification and the Hierarchy of Generally Accepted Accounting Principles”). FASB ASC 105 was effective for financial statements issued for interim and annual periods ending after September 15, 2009. The ASC is an aggregation of previously issued authoritative U.S. generally accepted accounting principles (“GAAP”) in one comprehensive set of guidance organized by subject area. The Company adopted FASB ASC 105 on July 1, 2009 with no impact to its consolidated financial statements, except for the changes related to the referencing of financial accounting standards.
Asset Retirement Obligations
The Company accounts for asset retirement obligations in accordance with FASB ASC 410, “Asset Retirement and Environmental Obligations.”
The Company has not recorded asset retirement obligations associated with certain owned or leased buildings and manufacturing facilities because the retirement obligations have an indeterminate settlement date
68
Table of Contents
and cannot be reasonably estimated. These asset retirement obligations are associated with removal and disposal of asbestos at certain Company sites and the shutdown of other assets (e.g., landfill and waste treatment facilities). The Company’s asset retirement obligation is to remove and dispose of asbestos properly if (i) the asbestos were to become exposed or become a health hazard or (ii) the facility containing the asbestos is demolished or undergoes major renovations. Currently, the asbestos is not exposed and is not a health hazard and the Company has no plans or expectations to demolish or undertake major renovations of these facilities. In addition, these facilities are expected to be maintained by normal repair and maintenance activities that would not involve the removal of the asbestos. The Company cannot estimate the settlement date or range of settlement dates of when the asbestos would be exposed. As for the other assets, the Company’s asset retirement obligation is based upon the future shutdown of the location or reaching capacity in the case of the landfill. Although the Company can estimate the current cost associated with these retirement obligations, the Company has no plans of ceasing operations of these facilities and the potential for reaching capacity at the landfill is estimated to be at least 50 years and potentially significantly longer. Therefore, the range of estimated settlement dates is so wide and so far out in the future as to preclude the Company from reasonably estimating the fair value of the obligation. Therefore, the Company concluded the retirement obligations had indeterminate settlement dates or such a wide range of potential settlement dates that no value could reasonably be estimated for the asset retirement obligations. The Company continues to monitor these assets as well as plans relating to these assets and their site locations and will record an asset retirement obligation as appropriate if circumstances change.
Goodwill
Goodwill represents the excess of the purchase price of acquired businesses over the fair value of the respective net assets.
The Company accounts for goodwill in accordance with FASB ASC 350, “Intangibles—Goodwill and Other”, which requires that goodwill no longer be amortized, but instead be tested for impairment at least annually in accordance with the provisions of FASB ASC 350. The Company tests goodwill for impairment as of January 1 of each year and when an event occurs or circumstances change that would more likely than not reduce the fair value of a reporting unit below its carrying amount. An impairment charge is recognized for the amount, if any, by which the carrying amount of goodwill exceeds its fair value. Fair values are established using discounted cash flows and when available and as appropriate, comparative market multiples are used.
Other Intangibles
Other intangibles consist primarily of trademarks, developed technology, toxicology database, non-compete agreements and customer relationships.
In accordance with FASB ASC 350, intangible assets with indefinite useful lives are not amortized. Intangible assets with definite useful lives are amortized over their respective estimated useful lives to their estimated residual values in proportion to the economic benefits consumed, principally over 2 to 29 years and generally on a straight-line basis. Intangible assets with an indefinite life are reviewed at least annually for impairment in accordance with FASB ASC 350.
Securitizations and Transfers of Financial Instruments
The Company may sell trade accounts or notes receivables with or without recourse in the normal course of business. Receivables sold under the Company’s accounts receivable securitization program are removed from Accounts Receivable, net on the accompanying Consolidated Balance Sheet at the time of sale. The purchase price of any such receivables sold for which payment has been deferred is recorded based on fair value as a Short-Term Investment on the accompanying Consolidated Balance Sheet. Sales and transfers that do not meet the criteria for surrender of control would be accounted for as secured borrowings.
69
Table of Contents
Long-Lived Assets
The impairment of tangible long-lived assets, other than goodwill and intangible assets with definite lives, is assessed when changes in circumstances indicate that their current carrying value may not be recoverable. A determination of impairment, if any, is made based on the undiscounted value of estimated future cash flows, salvage value or expected net sales proceeds, depending on the circumstances. Asset impairment losses are measured as the excess of the carrying value over the estimated fair value of such assets.
Environmental Liabilities and Expenditures
Accruals for environmental matters are recorded when it is probable that a liability has been incurred and the amount of the liability can be reasonably estimated, based upon current law and existing technologies. These amounts, which are not discounted and are exclusive of claims against third parties, are adjusted periodically as assessment and remediation efforts progress or additional technical or legal information becomes available. Environmental remediation costs are charged to reserves. Environmental costs are capitalized if the costs increase the value of the property and/or mitigate or prevent contamination from future operations.
Financial Instruments
The carrying values of cash and cash equivalents, accounts receivable and accounts payable approximated fair values due to the short-term maturities of these instruments.
The fair value of the Company’s borrowings, if any, under its existing credit facility, approximates book value due to the relatively short period such debt is expected to be outstanding and the fact that the interest rates on the borrowings are reset every one to six months. The fair value of the borrowings under the term loan approximates book value as the interest rates on the borrowings are reset every one to six months. The fair value of the Company’s $75.0 million of borrowings under the shelf agreement was approximately $82 million at December 31, 2009. The fair value of the Company’s Short-term borrowings approximates the book value due to the floating interest rate terms and the short maturity of the instruments.
Derivative Instruments
Derivative instruments are recognized as assets or liabilities in the Company’s Consolidated Balance Sheets and are measured at fair value. The change in the fair value of a derivative designated as a fair value hedge and the change in the fair value of the hedged item attributable to the hedged risk are recognized in earnings. For derivatives which qualify for designation as cash flow hedges, the effective portion of the changes in fair value is recognized as part of other comprehensive income until the underlying transaction that is being hedged is recognized in earnings. The ineffective portion of the change in fair value of cash flow hedges is recognized in earnings currently. Changes in fair value for other derivatives which do not qualify as hedges for accounting purposes are recognized in current period earnings.
Revenue Recognition
Substantially all of the Company’s revenues are derived from the sale of products. Revenue is recognized when risk of loss of, and title to, the product is transferred to the customer, which usually occurs at the time shipment is made. The majority of the Company’s products are sold FOB (“free on board”) shipping point or on an equivalent basis, that is, when product is delivered to the carrier. There are certain limited situations where the risk of loss and transfer of title passes upon delivery to the customer. In those circumstances, sales are recognized upon receipt by the customer. Allowances for estimated returns, discounts and retailer promotions and incentives are recognized when sales are recorded and are based on various market data, historical trends and information from customers. Actual returns, discounts and retail promotions and incentives have not been materially different from estimates. Certain of the Company’s product lines have extended payment terms due to the seasonal nature of the business. There are no conditions of acceptance, warranties or price protection that prohibit revenue recognition when risk of loss of, and title to, the product is transferred to the customer.
70
Table of Contents
Shipping and Handling Costs
Shipping and handling fees billed to customers are included in Sales and shipping and handling costs are included in Cost of Goods Sold in the accompanying Consolidated Statements of Income.
U.S. Government Contracts
The Company has supply and storage contracts with the U.S. Defense Energy Support Center which principally consist of a fixed-price facility management fee for which revenue is recognized ratably over the contract period and the sale of product at a fixed price per pound, adjusted annually for agreed-upon cost escalations. Revenue is recognized for the U.S. Government’s product purchases when risk of loss of, and title to, the product is transferred to the U.S. Government which occurs after the product is inspected and accepted by the U.S. Government and sent to storage. Consequently, such revenue may be recognized prior to the U.S. Government taking physical possession. (See Note 21 for more information.)
Foreign Currency Translation
Foreign affiliates generally use their local currency as their functional currency. Accordingly, foreign affiliate balance sheet amounts are translated at the exchange rates in effect at year-end, and income statement and cash flow amounts are translated at the average rates of exchange prevailing during the year. Translation adjustments are included in the Other Accumulated Comprehensive Loss component of shareholders’ equity. Where foreign affiliates operate in highly inflationary economies, non-monetary amounts are translated to U.S. dollars at historical exchange rates while monetary assets and liabilities are translated to U.S. dollars at the current rate with the related adjustments reflected in the Consolidated Statements of Income.
Stock-Based Payments
The Company accounts for stock-based compensation under FASB ASC 718, “Compensation—Stock Compensation”, which requires companies to recognize expense over the requisite service period in the income statement for the grant-date fair value of awards of share based payments including equity instruments and stock appreciation rights to employees.
Income Taxes
The Company provides for income taxes in accordance with FASB ASC 740, “Income Taxes”, which requires the recognition of deferred tax liabilities and assets for the expected future tax consequences of temporary differences between the financial statement carrying amounts and the tax bases of assets and liabilities. The Company maintains valuation allowances where it is more likely than not all or a portion of a deferred tax asset will not be realized. Changes in valuation allowances from period to period are included in the Company’s tax provision in the period of change. In determining whether a valuation allowance is warranted, the Company takes into account such factors as future taxable income and available tax planning strategies. Failure to achieve forecasted taxable income could affect the ultimate realization of certain deferred tax assets.
The Company provides for income taxes for uncertain tax positions in accordance with FASB ASC 740, which requires the Company to recognize and measure tax benefits associated with tax positions and disclose uncertainties related to income tax positions in its financial statements. The Company cannot recognize a tax benefit in its financial statements unless it concludes the benefit is more likely than not of being sustained on audit by the taxing authority based solely on the technical merits of the associated tax position. The Company assesses the tax benefits of the income tax positions in its financial statements. The Company assesses these income tax positions based on our experience with similar tax positions, information obtained during the examination process, and the advice of experts. The Company recognizes previously unrecognized tax benefits upon the earlier of the expiration of the period to assess tax in the applicable taxing jurisdiction or when the matter is constructively settled and upon changes in statues or regulations and new case law or rulings.
71
Table of Contents
Earnings Per Common Share
Basic earnings per common share are computed by dividing net income available to common shareholders by the weighted-average number of common shares outstanding during the period. Diluted earnings per common share are calculated in a similar manner except that the weighted-average number of common shares outstanding during the period includes the potential dilution that could occur if stock options or other contracts to issue common stock were exercised and the dilutive effect of performance awards which will be settled in shares.
The reconciliations between basic and diluted shares outstanding for the years ended December 31, 2009, 2008 and 2007 are as follows:
| Years Ended December 31, | ||||||
| (in millions) | 2009 | 2008 | 2007 | |||
| Basic |
25.0 | 24.8 | 24.5 | |||
| Common equivalent shares from stock options and performance awards using the treasury stock method |
0.1 | 0.1 | 0.2 | |||
| Diluted |
25.1 | 24.9 | 24.7 | |||
For the years ended December 31, 2009, 2008 and 2007, there were no stock options with exercise prices greater than the average market price.
In 2004, the Company established a Rabbi Trust for several deferred compensation plans (see Note 15 for more information). The Company’s stock held in the Rabbi Trust is treated in a manner similar to treasury stock. At December 31, 2009, the trust held approximately 0.1 million shares, which it had previously purchased on the open market.
Comprehensive Income (Loss)
The Company’s other comprehensive income (loss) consists of the changes in the cumulative foreign currency translation gains and losses, the change in the fair value of derivative financial instruments which qualify for hedge accounting, net of tax, and the pension liability adjustment, net of tax. The Company does not provide for U.S. income taxes on foreign currency translation adjustments since it does not provide for such taxes on undistributed earnings of foreign subsidiaries, except for affiliated companies at equity, since the Company intends to continue to reinvest these earnings.
Employee Benefit Plans
Pension and postretirement health care and life insurance benefits earned during the year as well as interest on projected benefit obligations are accrued currently. Prior service costs and credits resulting from changes in plan benefits are amortized over the average remaining service period of employees expected to receive benefits. Curtailment gains and losses are recognized as incurred. Settlement gains and losses are recognized when significant pension obligations are settled and the gain or loss is determinable. The Company’s policy, in general, is to fund, at a minimum, amounts as are necessary to provide assets sufficient to meet the benefits to be paid to plan members in accordance with the relevant regulatory requirements governing such plans. In addition, FASB ASC 715, “Compensation—Retirement Benefits”, requires plan sponsors of defined benefit pension and other postretirement benefit plans (collectively, “postretirement benefit plans”) to recognize the funded status of their postretirement benefit plans in the statement of financial position, measure the fair value of plan assets and benefit obligations as of the date of the fiscal year-end statement of financial position, and provide additional disclosures.
72
Table of Contents
Business and Credit Concentrations
A significant portion of sales of the Treatment Products segment (approximately 18%) is dependent upon two customers, one of which accounts for a significant portion of the sales of the HTH water products business and the other of which accounts for a significant portion of the sales of the personal care and industrial biocides businesses. Sales to these two customers are individually less than 10% of the Company’s 2009 consolidated sales. However, the loss of either of these customers would have a material adverse effect on the sales and operating results of the Company, respective segment and businesses if such customer was not replaced.
Sales of the HTH water products business are seasonal in nature as its products are primarily used in the U.S. residential pool market. Historically, approximately 40% of the sales in the HTH water products business occur in the second quarter of the fiscal year, as retail sales in the U.S. residential pool market are concentrated between Memorial Day and the Fourth of July. Therefore, interim results for this segment are not necessarily indicative of the results to be expected for the entire fiscal year.
| 2. | Accounts Receivable/Short-Term Investment |
Accounts receivable at December 31, 2009 and 2008 include the following:
| December 31, | ||||||||
| ($ in millions) | 2009 | 2008 | ||||||
| Accounts receivable, trade |
$ | 150.3 | $ | 167.2 | ||||
| Accounts receivable, other |
22.3 | 26.1 | ||||||
| 172.6 | 193.3 | |||||||
| Less allowance for doubtful accounts |
(11.3 | ) | (9.1 | ) | ||||
| Accounts receivable, net |
$ | 161.3 | $ | 184.2 | ||||
Included in Accounts receivable, other is a receivable related to a favorable antidumping ruling for the period of review from December 16, 2004 through May 31, 2006 (see Note 20 for further discussion). The receivable, which includes interest, was $13.5 million and $13.4 million at December 31, 2009 and December 31, 2008, respectively. Additionally, included in Accounts receivable, other is a receivable related to the sale of the performance urethanes business in Venezuela (see Note 5 for further discussion). The receivable was $0.7 million and $1.2 million at December 31, 2009 and December 31, 2008, respectively.
Changes in the allowance for doubtful accounts for the years ended December 31, 2009, 2008, and 2007 are as follows:
| ($ in millions) | Year Ended December 31, 2009 |
Year Ended December 31, 2008 |
Year Ended December 31, 2007 |
|||||||||
| Beginning balance |
$ | (9.1 | ) | $ | (7.8 | ) | $ | (6.3 | ) | |||
| Provision for doubtful accounts |
(3.2 | ) | (4.7 | ) | (2.3 | ) | ||||||
| Bad debt write-offs, net of recoveries |
2.1 | 2.7 | 1.3 | |||||||||
| Foreign exchange and other |
(1.0 | ) | 0.6 | (0.5 | ) | |||||||
| Reclassification to (from) short-term investment |
(0.1 | ) | 0.1 | — | ||||||||
| Ending balance |
$ | (11.3 | ) | $ | (9.1 | ) | $ | (7.8 | ) | |||
In 2005 the Company entered into an accounts receivable securitization program with Three Pillars Funding LLC (“Three Pillars”), an affiliate of SunTrust Bank (“SunTrust”), and SunTrust Capital Markets, Inc., through which the Company sold undivided participation interests in certain domestic trade accounts receivable, without recourse, through its wholly-owned subsidiary, Arch Chemicals Receivables Corporation (“ACRC”), a special-purpose entity which is consolidated for financial reporting purposes. In connection with the securitization
73
Table of Contents
program, SunTrust entered into a Liquidity Agreement with Three Pillars to support its purchases of the Company’s accounts receivable annually. The Liquidity Agreement expired in October 2009 and at that time the Company entered into a new securitization program with Market Street Funding LLC and PNC Bank, National Association (“PNC Bank”) by way of an assignment and assumption of the Company’s existing program with Three Pillars and Sun Trust. Under the amended program, the Company can sell domestic trade accounts receivable, and certain Canadian trade accounts receivable, to Market Street Funding LLC through ACRC. Additionally, the program provides ACRC with the ability to issue letters of credit. The amount of funding that the Company can obtain under the program is subject to change based upon the level of eligible receivables, with a maximum amount of $80 million. No more than $30 million of such funding can relate to letters of credit. The amended program is subject to annual renewal and has similar terms to the Company’s previous accounts receivable securitization program.
Under the amended program, the fair value of receivables, for which payment of the purchase price by Market Street Funding LLC is deferred, is recorded separately from Accounts Receivable, net as a Short-Term Investment on the accompanying Consolidated Balance Sheets. The fair value of these receivables was $76.0 million at December 31, 2009. Under the original program, ACRC retained the balance of the participation interests in the pool of receivables purchased from the Company which were not purchased by Three Pillars. To reflect this interest, which was subordinated, the fair value of the retained undivided interest of $56.0 million at December 31, 2008 was classified separately from Accounts Receivable, net as a Short-Term Investment on the accompanying Consolidated Balance Sheet. Fair value of the receivable from the conduit at December 31, 2009 and undivided interest at December 31, 2008 included a reserve for credit losses ($0.9 million at December 31, 2009 and $1.0 million at December 31, 2008) and had not been discounted due to the short-term nature of the underlying financial assets.
The costs of the programs for the years ended December 31, 2009, 2008 and 2007 of $1.4 million, $1.3 million and $2.0 million, respectively, are included in Selling and Administration expenses in the accompanying Consolidated Statements of Income. Under the amended program, the Company pays a facility fee which is equal to 0.75% of the committed amount of the facility. The Company also incurs costs based on the fair market value of the receivables which are sold under the program and for which payment to Market Street Funding LLC has not been deferred. Such costs are based on the cost of commercial paper issued by Market Street Funding LLC plus a margin of 0.75%. The Company has not recorded an asset or liability related to the servicing responsibility retained as the fees earned for servicing were estimated to approximate fair value.
| 3. | Inventories |
Inventories at December 31, 2009 and 2008 include the following:
| December 31, | ||||||||
| ($ in millions) | 2009 | 2008 | ||||||
| Raw materials and supplies |
$ | 66.8 | $ | 77.5 | ||||
| Work-in-progress |
10.6 | 14.3 | ||||||
| Finished goods |
149.4 | 190.6 | ||||||
| Inventories, gross |
226.8 | 282.4 | ||||||
| LIFO reserves |
(55.7 | ) | (66.3 | ) | ||||
| Inventories, net |
$ | 171.1 | $ | 216.1 | ||||
74
Table of Contents
Inventory valued using the LIFO method comprised approximately 45 percent of the total inventory at December 31, 2009 and 2008. Gross inventory values approximate replacement cost. During 2009, the Company recorded a $2.9 million benefit in Cost of goods sold related to a LIFO decrement.
| 4. | Other Current Assets |
Other current assets at December 31, 2009 and 2008 include the following:
| December 31, | ||||||
| ($ in millions) | 2009 | 2008 | ||||
| Deferred income taxes (Note 14) |
$ | 6.7 | $ | 8.5 | ||
| Other |
9.6 | 11.1 | ||||
| Other current assets |
$ | 16.3 | $ | 19.6 | ||
| 5. | Assets Held for Sale/Discontinued Operations |
Performance Urethanes Business in Venezuela
In September 2007, the Company completed the sale of its non-strategic performance urethanes business in Venezuela. Total proceeds, net of expenses, from the sale are expected to be $16.7 million, which includes a post-closing working capital adjustment. As a result of the sale, the Company recorded a non-cash after-tax loss of $14.9 million, which included $15.1 million of historical foreign currency translation losses that were recognized at the time of the sale. As of December 31, 2009, the Company has received $16.5 million of the total proceeds, with the balance included in Accounts receivable, net in the Consolidated Balance Sheet.
The loss is reflected in Loss on Sale of Discontinued Operations for 2007, as follows:
| ($ in millions) | ||||
| Net Assets Sold: |
||||
| Net working capital |
$ | 17.1 | ||
| Non-current liabilities |
(0.9 | ) | ||
| Net assets sold |
$ | 16.2 | ||
| Loss on Sale: |
||||
| Total proceeds |
$ | 17.2 | ||
| Net assets sold |
(16.2 | ) | ||
| Transaction costs incurred |
(0.5 | ) | ||
| Subtotal |
0.5 | |||
| Foreign currency translation realized |
(15.1 | ) | ||
| Pre-tax loss |
(14.6 | ) | ||
| Tax expense |
(0.3 | ) | ||
| Net loss |
$ | (14.9 | ) | |
Income From Discontinued Operations
Income from Discontinued Operations until the date of the sale of the non-strategic performance urethanes business in Venezuela includes the following for the year ended December 31, 2007:
| ($ in millions) | ||||
| Sales |
$ | 23.8 | ||
| Earnings before taxes |
$ | 1.3 | ||
| Tax expense |
(0.4 | ) | ||
| Income from discontinued operations |
$ | 0.9 | ||
75
Table of Contents
| 6. | Investments and Advances—Affiliated Companies at Equity |
Prior to July 2007 the Company had a 49% investment in Koppers Arch Wood Protection (Aust) Pty Ltd (“KAWP”), which manufactures CCA-based and other wood preservatives, and is principally located in Australia and New Zealand. On July 5, 2007, the Company completed the acquisition of the remaining 51 percent share of KAWP. See Note 19 for more information.
The amount of cumulative unremitted earnings of joint ventures included in consolidated retained earnings at December 31, 2009 was $0.8 million. During the years ended December 31, 2009, 2008 and 2007, distributions of $0.2 million, $0.3 million and $0.2 million, respectively, were received from joint ventures.
| 7. | Property, Plant and Equipment |
Property, plant and equipment at December 31, 2009 and 2008 include the following:
| December 31, | ||||||||
| ($ in millions) | 2009 | 2008 | ||||||
| Land and improvements to land |
$ | 29.0 | $ | 28.8 | ||||
| Buildings and building equipment |
132.4 | 113.5 | ||||||
| Machinery and equipment |
655.5 | 631.8 | ||||||
| Leasehold improvements |
12.5 | 11.8 | ||||||
| Construction-in-progress |
15.0 | 43.3 | ||||||
| Property, plant and equipment |
844.4 | 829.2 | ||||||
| Less accumulated depreciation |
(629.5 | ) | (617.0 | ) | ||||
| Property, plant and equipment, net |
$ | 214.9 | $ | 212.2 | ||||
Maintenance and repairs charged to operations amounted to $29.4 million, $28.9 million and $27.5 million in 2009, 2008 and 2007, respectively.
During the fourth quarter of 2008, the Company recorded a $1.2 million impairment charge of certain manufacturing assets for the wood protection and industrial coatings businesses. The write-off is recorded in Impairment Charge in the Company’s 2008 Consolidated Statement of Income.
| 8. | Goodwill and Other Intangibles |
Goodwill
The changes in the carrying amount of goodwill for the years ended December 31, 2009 and 2008 are as follows:
| ($ in millions) | HTH Water Products |
Personal Care and Industrial Biocides |
Wood Protection and Industrial Coatings |
Total Treatment |
Performance Urethanes |
Total | |||||||||||||||||
| Balance, December 31, 2007 |
$ | 39.0 | $ | 85.6 | $ | 77.8 | $ | 202.4 | $ | 4.4 | $ | 206.8 | |||||||||||
| Acquisitions |
42.6 | — | — | 42.6 | — | 42.6 | |||||||||||||||||
| Post acquisition adjustment |
(1.2 | ) | — | (7.0 | ) | (8.2 | ) | — | (8.2 | ) | |||||||||||||
| Impairment |
— | — | (24.6 | ) | (24.6 | ) | — | (24.6 | ) | ||||||||||||||
| Foreign exchange |
(2.0 | ) | (10.5 | ) | (4.5 | ) | (17.0 | ) | — | (17.0 | ) | ||||||||||||
| Balance, December 31, 2008 |
78.4 | 75.1 | 41.7 | 195.2 | 4.4 | 199.6 | |||||||||||||||||
| Foreign exchange |
0.7 | 2.9 | 2.6 | 6.2 | — | 6.2 | |||||||||||||||||
| Balance, December 31, 2009 |
$ | 79.1 | $ | 78.0 | $ | 44.3 | $ | 201.4 | $ | 4.4 | $ | 205.8 | |||||||||||
76
Table of Contents
The industrial coatings business was negatively impacted by the decline in the local furniture maker market in several of the major European economies as well as competitive activities within Europe, principally in Italy. The rapid deterioration of the global economy during the fourth quarter of 2008, significantly compounded the existing adverse factors previously identified. This economic slowdown intensified throughout the fourth quarter of 2008 as weakness spread to the broader worldwide economy, negatively impacting many of our customers in the industrial coatings business and our expectations of a recovery in these markets. As a result of an update to the Company’s financial forecast, due to the aforementioned items, during the fourth quarter of 2008 the Company conducted an interim impairment review which indicated that there was an impairment on the goodwill of the industrial coatings business and the Company recorded a non-cash goodwill impairment charge of $24.6 million, which eliminated the remaining carrying amount of goodwill related to the industrial coatings business. Including this charge, since the adoption of FASB ASC 350 on January 1, 2002, the Company has cumulatively recorded $48.1 million of goodwill impairment charges related to its industrial coatings business.
On October 10, 2008, the Company completed the acquisition of the water treatment chemicals business of Advantis, a North American manufacturer and marketer of branded swimming pool, spa and surface water treatment chemicals. The Company allocated the excess purchase price of $42.6 million to goodwill. See Note 19 for further discussion.
On July 5, 2007, the Company completed the acquisition of the remaining 51 percent share of its Australian joint venture, KAWP. During 2008 the Company completed its purchase price allocation related to the acquisition, which resulted in the recording of $8.5 million of identifiable intangible assets, $2.4 million of contingent liabilities, and an $0.8 million increase in the value of property, plant and equipment. The goodwill balance was adjusted to reflect the purchase price allocation. See Note 19 for further discussion.
Other Intangibles
The gross carrying amount and accumulated amortization for other intangible assets as of December 31, 2009 and 2008 are as follows:
| December 31, 2009 | December 31, 2008 | |||||||||||||||||
| ($ in millions) | Gross Carrying Amount |
Accumulated Amortization |
Net Carrying Amount |
Gross Carrying Amount |
Accumulated Amortization |
Net Carrying Amount | ||||||||||||
| Patents |
$ | 0.2 | $ | 0.2 | $ | — | $ | 0.2 | $ | 0.2 | $ | — | ||||||
| Customer lists |
106.6 | 39.2 | 67.4 | 100.7 | 28.4 | 72.3 | ||||||||||||
| Toxicology database |
14.6 | 5.7 | 8.9 | 13.3 | 4.3 | 9.0 | ||||||||||||
| Developed technology |
16.4 | 5.1 | 11.3 | 15.5 | 3.7 | 11.8 | ||||||||||||
| Other |
13.9 | 5.4 | 8.5 | 15.9 | 7.0 | 8.9 | ||||||||||||
| Total amortizable other Intangibles |
151.7 | 55.6 | 96.1 | 145.6 | 43.6 | 102.0 | ||||||||||||
| Total non-amortizable other Intangibles—Trademarks |
84.5 | 0.3 | 84.2 | 81.3 | 0.3 | 81.0 | ||||||||||||
| Total other intangibles |
$ | 236.2 | $ | 55.9 | $ | 180.3 | $ | 226.9 | $ | 43.9 | $ | 183.0 | ||||||
Amortization
Amortization expense for the years ended December 31, 2009, 2008 and 2007 was $12.0 million, $11.0 million and $10.2 million, respectively. Estimated amortization expense is $12.5 million for the year ended December 31, 2010, $12.0 million for the year ended December 31, 2011 and $11.6 million for the years ended December 31, 2012, December 31, 2013 and December 31, 2014.
| 9. | Other Assets |
Included in other assets at December 31, 2009 and 2008 are the following:
| December 31, | ||||||
| ($ in millions) | 2009 | 2008 | ||||
| Deferred taxes (Note 14) |
$ | 80.8 | $ | 84.7 | ||
| Other |
31.9 | 24.7 | ||||
| Other assets |
$ | 112.7 | $ | 109.4 | ||
77
Table of Contents
Included in Other assets is a receivable related to a favorable antidumping ruling for the period of review from June 1, 2006 through May 31, 2007 (see Note 20 for further discussion). The receivable, which includes interest, was $13.2 million and $12.8 million at December 31, 2009 and December 31, 2008, respectively.
| 10. | Accrued Liabilities |
Included in accrued liabilities at December 31, 2009 and 2008 are the following:
| December 31, | ||||||
| ($ in millions) | 2009 | 2008 | ||||
| Accrued compensation |
$ | 28.4 | $ | 26.9 | ||
| Accrued litigation |
5.2 | 4.0 | ||||
| Environmental reserves |
1.5 | 1.3 | ||||
| Other |
49.1 | 43.7 | ||||
| Accrued liabilities |
$ | 84.2 | $ | 75.9 | ||
| 11. | Debt |
Included in short-term borrowings and long-term debt at December 31, 2009 and 2008 are the following:
| December 31, | ||||||||
| ($ in millions) | 2009 | 2008 | ||||||
| Senior revolving credit facility |
$ | 108.0 | $ | 252.5 | ||||
| Term loan |
90.0 | — | ||||||
| Series A Senior Notes due August 2016 |
75.0 | — | ||||||
| Series B Senior Notes due March 2009 |
— | 62.0 | ||||||
| Other borrowings |
17.7 | 18.5 | ||||||
| Total debt |
290.7 | 333.0 | ||||||
| Less: current portion of long-term debt |
(21.9 | ) | — | |||||
| Less: short-term borrowings |
(11.1 | ) | (18.5 | ) | ||||
| Long-term debt |
$ | 257.7 | $ | 314.5 | ||||
Credit Facility
On June 15, 2006, the Company entered into an unsecured $350.0 million senior revolving credit facility (“credit facility”), which expires in June 2011. The Company’s credit facility contains a quarterly leverage ratio (Debt/EBITDA) covenant not to exceed 3.5. At December 31, 2009, the Company’s quarterly leverage ratio, as defined in the credit facility, was 2.2. Additionally, the credit facility contains an interest coverage ratio (EBITDA/total interest expense) covenant not to be less than 3.0. At December 31, 2009 the Company’s interest coverage ratio, as defined in the credit facility, was 9.5. The Company was in compliance with both of these covenants throughout 2009. The credit facility also restricts the payment of dividends and repurchase of stock to $65.0 million plus 50% of cumulative net income (loss) subject to certain limitations beginning June 15, 2006. At December 31, 2009, restricted payments were limited to $84.6 million. The facility fees can range from 0.100% to 0.225% depending on the Company’s quarterly leverage ratios (facility fees were 0.125% at December 31, 2009). The Company may select various floating rate borrowing options, including, but not limited to, LIBOR plus a spread that can range from 0.4% to 0.9% depending on the Company’s quarterly leverage ratios (the spread was 0.5% at December 31, 2009). There was $108.0 million debt outstanding under the credit facility at December 31, 2009 and $252.5 million outstanding at December 31, 2008.
78
Table of Contents
Term Loan
On February 13, 2009, the Company entered into an unsecured $100.0 million credit agreement (“term loan”) with a number of banks, which matures in June 2011. The entire $100.0 million was drawn at closing. The term loan provides for quarterly amortization of principal equal to 5% of the original principal amount of the loan beginning September 30, 2009. Therefore, at December 31, 2009, $90.0 million was outstanding and $20.0 million of the outstanding balance was included in Current portion of long-term debt in the Consolidated Balance Sheet. The term loan contains a quarterly leverage ratio covenant not to exceed 3.5 and an interest coverage ratio covenant not to be less than 3.0, both of which are consistent with the existing credit facility. At December 31, 2009 the Company’s quarterly leverage ratio, as defined in the term loan, was 2.2 and the Company’s interest coverage ratio, as defined in the term loan, was 9.5. The Company has been in compliance with both of these covenants since the inception of the term loan. Additionally, consistent with the credit facility, this term loan restricts the payment of dividends and repurchase of stock to $65.0 million plus 50% of cumulative adjusted net income (loss) for the period beginning June 15, 2006. At December 31, 2009, restricted payments were limited to $84.6 million. The Company may select various floating rate borrowing options, including, but not limited to, LIBOR plus a spread that can range from 2.25% to 3.25% depending on the Company’s quarterly leverage ratios (the spread was 2.50% at December 31, 2009).
Shelf Agreement
On August 28, 2009, the Company entered into a $150.0 million note purchase and private shelf agreement (the “shelf agreement”) with Prudential Investment Management, Inc. (“Prudential”) and immediately issued $75.0 million of unsecured Series A senior notes (the “Notes”). The notes will mature in August 2016 and bear a fixed annual interest rate of 6.70%. The shelf agreement provides for the additional purchase by Prudential of notes, in amounts to be mutually agreed, up to a maximum of $75.0 million through August 2012, on terms to be determined. The shelf agreement contains a quarterly leverage ratio covenant not to exceed 3.5 and an interest coverage ratio covenant not to be less than 3.0, both of which are consistent with the existing credit facility and term loan. At December 31, 2009, the Company’s quarterly leverage ratio, as defined in the shelf agreement, was 2.2 and the Company’s interest coverage ratio, as defined in the shelf agreement, was 9.5. The Company has been in compliance with both of these covenants since the inception of the shelf agreement. Additionally, the shelf agreement restricts the payment of dividends and repurchase of stock to $88.1 million plus 50% of cumulative adjusted net income (loss) for the period beginning June 30, 2009. At December 31, 2009, restricted payments were limited to $84.6 million.
Senior Notes
In March 2002, the Company issued $211.0 million of unsecured senior notes to certain institutional investors in two series. The Company used its unsecured $350.0 million senior revolving credit facility to repay the Series A notes in March 2007 and to repay the Series B notes, $62.0 million, in March 2009.
Other Borrowings
Other borrowings at December 31, 2009 included $14.8 million of borrowings under international credit facilities and $2.9 million of capitalized leases. Such credit facilities and capitalized leases have interest rates ranging from 3% to 18%.
At December 31, 2009, the Company had $31.6 million of outstanding letters of credit, $5.2 million of which reduced availability under the Company’s credit facility. Additionally, at December 31, 2009, the Company had $2.4 million of outstanding letters of guarantee.
Interest Rate Swaps
In April 2008, the Company entered into interest rate swap agreements with a notional value of $20 million. In October 2008, the Company entered into an additional interest rate swap agreement with a notional value of $30 million. See Note 13 for further discussion.
79
Table of Contents
Fair Value of Debt
The fair value of the Company’s borrowings, if any, under its existing credit facility, approximates book value due to the relatively short period such debt is expected to be outstanding and the fact that the interest rates on the borrowings are reset every one to six months. The fair value of the borrowings under the term loan approximates book value as the interest rates on the borrowings are reset every one to six months. The fair value of the Company’s $75.0 million of borrowings under the shelf agreement was approximately $82 million at December 31, 2009. The fair value of the Company’s short-term borrowings approximates the book value due to the floating interest rate terms and the short maturity of the instruments.
| 12. | Other Liabilities |
Included in other non-current liabilities at December 31, 2009 and 2008 are the following:
| December 31, | ||||||
| ($ in millions) | 2009 | 2008 | ||||
| Pensions and other postretirement employee benefit obligations (Note 15) |
$ | 218.7 | $ | 225.5 | ||
| Deferred long-term incentive compensation (Note 15 and Note 16) |
16.4 | 11.9 | ||||
| Deferred tax liability (Note 14) |
13.2 | 12.4 | ||||
| Environmental reserves (Note 20) |
6.7 | 5.8 | ||||
| Unrecognized tax benefits (Note 1 and Note 14) |
13.2 | 12.6 | ||||
| Other |
14.5 | 13.3 | ||||
| Other liabilities |
$ | 282.7 | $ | 281.5 | ||
| 13. | Derivative Financial Instruments |
Foreign Currency
The Company uses foreign currency forward contracts as a means of hedging exposure to foreign currency risk. It is the Company’s policy to hedge up to 80% of its anticipated purchase and sales commitments denominated or expected to be denominated in a foreign currency (principally British pound, euro, Australian dollar, New Zealand dollar, Canadian dollar and Japanese yen). Most of the Company’s currency derivatives expire within one year. During 2009, 2008 and 2007, the majority of the Company’s foreign currency forward contracts qualified as effective cash flow hedges. The remainder of the foreign currency contracts did not meet the criteria to qualify for hedge accounting. Additionally, during 2009 the Company entered into cross-currency swap agreements to hedge its exposure to the variability of future foreign currency cash flows through August 2014. The cross-currency swap agreements do not meet the criteria to qualify for hedge accounting.
At December 31, 2009, the Company had forward contracts to sell foreign currencies with U.S. dollar equivalent value of $15.8 million and forward contracts to buy foreign currencies with U.S. dollar equivalent value of $1.3 million. Additionally, at December 31, 2009, the Company had cross-currency swap agreements with a notional value of approximately $3 million. At December 31, 2008, the Company had forward contracts to sell foreign currencies with U.S. dollar equivalent value of $22.2 million and forward contracts to buy foreign currencies with U.S. dollar equivalent value of $7.3 million. The Company did not have any cross-currency swap agreements at December 31, 2008.
The counterparties to the Company’s forwards contracts are major financial institutions. The risk of loss to the Company in the event of nonperformance by a counterparty is not significant. The Company does not use financial instruments for speculative or trading purposes; nor is the Company a party to leveraged derivatives.
80
Table of Contents
The following table displays the fair values at December 31, 2009 and December 31, 2008 of the Company’s foreign currency forward contracts which were designated as hedging instruments, as well as the classification of such amounts in the Company’s Consolidated Balance Sheets:
| ($ in millions) | December 31, 2009 |
December 31, 2008 | ||||
| Assets |
||||||
| Other current assets |
$ | 0.2 | $ | 0.1 | ||
| Liabilities |
||||||
| Accrued liabilities |
$ | 0.1 | $ | 1.0 | ||
During 2009, 2008 and 2007, the amounts which were excluded from effectiveness testing for foreign currency forward contracts that were designated as hedging instruments were immaterial. During 2007 amounts recognized in Accumulated Other Comprehensive Loss (“AOCL”) and amounts reclassified from AOCL into the Consolidated Statement of Income were immaterial. As of December 31, 2009 and December 31, 2008, the fair values of the Company’s foreign currency forward contracts that were not designated as hedging instruments were immaterial. Additionally, during 2009, 2008 and 2007 amounts recorded in the Company’s Consolidated Statements of Income related to such instruments were immaterial.
As of December 31, 2009, the fair value of the Company’s cross-currency swap agreements was immaterial. Additionally, during 2009, the amount recorded in the Company’s Consolidated Statement of Income related to such swap agreements was immaterial.
Foreign currency exchange (gains) losses, net of taxes, were $0.6 million in 2009, $(4.4) million in 2008 and $(0.1) million in 2007.
Compensation
The Company is exposed to stock price risk related to its deferred compensation and long-term incentive plans (“plans”) as, for some of the awards, the underlying liabilities are tied to the Company’s stock price. As the Company’s stock price changes such liabilities are adjusted and the impact is recorded in the Company’s Consolidated Statement of Income. During 2008, the Company entered into equity total return swap agreements with a total notional value of 400,000 shares in order to minimize earnings volatility related to the plans. The Company has not designated the swaps as hedges. Rather, the Company marks the swaps to market and records the impact in Selling and Administration expenses in the Company’s Consolidated Statement of Income. The adjustments to the values of the swaps offset the adjustments to the carrying values of the Company’s deferred compensation and long-term incentive plan liabilities, which are also recorded in Selling and Administration expenses, and there is no impact on the Company’s Consolidated Statement of Income.
The counterparty to the agreements is a major financial institution. The agreements will mature in July 2011, at which time cash settlement will occur. The counterparty can terminate the swap on 200,000 shares if the Company’s stock price falls below $11.37 and it can terminate the swap on the remaining 200,000 shares if the stock price falls below $11.05.
The following table displays the fair values at December 31, 2009 and December 31, 2008 of the Company’s equity total return swap derivatives which were not designated as hedging instruments as well as the classification of such amounts in the Company’s Consolidated Balance Sheets:
| ($ in millions) | December 31, 2009 |
December 31, 2008 | ||||
| Assets |
||||||
| Other assets |
$ | 2.4 | $ | 0.5 | ||
During 2009 and 2008, the Company recognized gains of $1.9 million and $0.5 million, respectively, in Selling and administration expenses related to the equity total return swap agreements.
81
Table of Contents
Debt and Interest
In April 2008, the Company entered into interest rate swap agreements with a notional value of $20 million. The swaps effectively convert the LIBOR based variable rate interest on $20.0 million of debt outstanding under the credit facility (see Note 11) to a fixed rate of 2.72%. The counterparties to the swap agreements are major financial institutions. The agreements expire in June 2010. The Company has designated the swap agreements as cash flow hedges of the risk of variability in future interest payments attributable to changes in the LIBOR rate. Any ineffectiveness for the swap agreements is not material.
In October 2008, the Company entered into an interest rate swap agreement with a notional value of $30 million. The swap effectively converts the LIBOR based variable rate interest on an additional $30.0 million of debt outstanding under the credit facility to a fixed rate of 3.18%. The counterparty to the swap agreement is a major financial institution. The agreement expires in January 2012. The Company has designated the swap agreement as a cash flow hedge of the risk of variability in future interest payments attributable to changes in the LIBOR rate. Any ineffectiveness for the swap agreement is not material.
The following table displays the fair values at December 31, 2009 and December 31, 2008 of the Company’s interest rate swap derivatives which were designated as cash flow hedges. Additionally, the table displays the classification of such amounts in the Company’s Consolidated Balance Sheets:
| ($ in millions) | December 31, 2009 |
December 31, 2008 | ||||
| Liabilities |
||||||
| Accrued liabilities |
$ | 0.8 | $ | 0.7 | ||
| Other liabilities |
0.6 | 1.1 | ||||
| Total Liabilities |
$ | 1.4 | $ | 1.8 | ||
The following table displays the effect of derivative instruments that are designated as cash flow hedges on the Company’s Consolidated Statement of Income and Consolidated Balance Sheet during 2009:
| ($ in millions) | AOCL as of 12/31/08 |
Effective Portion Recorded in AOCL |
Effective Portion Reclassified from AOCL to Selling and administration |
Effective Portion Reclassified from AOCL to Interest expense |
AOCL Balance as of 12/31/09 |
|||||||||||||
| Type of derivative |
||||||||||||||||||
| Interest Rate Swap Agreements |
$ | 1.0 | $ | 0.5 | $ | — | $ | (0.7 | ) | $ | 0.8 | |||||||
| Foreign Currency Forward Contracts |
0.9 | 0.6 | (1.6 | ) | — | (0.1 | ) | |||||||||||
| Total |
$ | 1.9 | $ | 1.1 | $ | (1.6 | ) | $ | (0.7 | ) | $ | 0.7 | ||||||
The following table displays the effect of derivative instruments that are designated as cash flow hedges on the Company’s Consolidated Statement of Income and Consolidated Balance Sheet during 2008:
| ($ in millions) | AOCL as of 12/31/07 |
Effective Portion Recorded in AOCL |
Effective Portion Reclassified from AOCL to Selling and administration |
Effective Portion Reclassified from AOCL to Interest expense |
AOCL Balance as of 12/31/08 | ||||||||||
| Type of derivative |
|||||||||||||||
| Interest Rate Swap Agreements |
$ | — | $ | 1.0 | $ | — | $ | — | $ | 1.0 | |||||
| Foreign Currency Forward Contracts |
— | 0.7 | 0.2 | — | 0.9 | ||||||||||
| Total |
$ | — | $ | 1.7 | $ | 0.2 | $ | — | $ | 1.9 | |||||
82
Table of Contents
Upon the expiration of foreign currency forward contracts and settlement dates for the interest rate swap agreements, during 2010, $0.4 million of the $0.7 million balance which was recorded in AOCL at December 31, 2009 will be reclassified into earnings.
| 14. | Income Taxes |
Components of Pretax Income from Continuing Operations
| Years Ended December 31, | |||||||||
| ($ in millions) | 2009 | 2008 | 2007 | ||||||
| Domestic |
$ | 44.7 | $ | 62.0 | $ | 77.5 | |||
| Foreign |
27.1 | 13.9 | 8.6 | ||||||
| Pretax income |
$ | 71.8 | $ | 75.9 | $ | 86.1 | |||
Components of Income Tax Expense from Continuing Operations
| Years Ended December 31, | |||||||||||
| ($ in millions) | 2009 | 2008 | 2007 | ||||||||
| Currently payable (receivable): |
|||||||||||
| Federal |
$ | (1.4 | ) | $ | 10.6 | $ | 14.1 | ||||
| State |
1.1 | (0.3 | ) | 2.6 | |||||||
| Foreign |
8.0 | 10.4 | 11.9 | ||||||||
| Deferred |
17.0 | 18.2 | 8.2 | ||||||||
| Income tax expense |
$ | 24.7 | $ | 38.9 | $ | 36.8 | |||||
The following table accounts for the difference between the actual tax provision and the amounts obtained by applying the statutory U.S. federal income tax rate of 35% to the income before taxes.
Effective Tax Rate Reconciliation
| Years Ended December 31, | |||||||||
| 2009 | 2008 | 2007 | |||||||
| Income tax provision (benefit) at U.S. federal income tax rate |
35.0 | % | 35.0 | % | 35.0 | % | |||
| Foreign effective tax rate differential |
(1.1 | ) | (0.7 | ) | (0.3 | ) | |||
| State income taxes, net |
2.9 | 2.5 | 4.3 | ||||||
| Additional tax provision on foreign income |
2.0 | 2.8 | 1.6 | ||||||
| Brazil tax holiday |
(2.3 | ) | (1.3 | ) | (2.1 | ) | |||
| China tax holiday |
(0.7 | ) | — | — | |||||
| Research and development credit |
(0.7 | ) | (0.7 | ) | (0.5 | ) | |||
| Tax benefit from U.K. financing |
(3.2 | ) | (3.4 | ) | (2.9 | ) | |||
| Non-deductible goodwill impairment and restructuring charges |
— | 11.4 | 2.8 | ||||||
| Enacted tax rate change |
— | — | 1.1 | ||||||
| Other, net |
2.5 | 5.7 | 3.7 | ||||||
| Effective tax rate |
34.4 | % | 51.3 | % | 42.7 | % | |||
83
Table of Contents
Components of Deferred Tax Assets and Liabilities
| Years Ended December 31, | ||||||||
| ($ in millions) | 2009 | 2008 | ||||||
| Deferred tax assets: |
||||||||
| Certain accrued expenses and non-current liabilities |
$ | 38.2 | $ | 30.4 | ||||
| Net operating losses and other carryforwards |
44.3 | 41.2 | ||||||
| Pension liability adjustments |
98.0 | 87.8 | ||||||
| Property, plant and equipment |
2.6 | 0.4 | ||||||
| Other miscellaneous items |
— | 2.6 | ||||||
| Valuation allowance |
(42.8 | ) | (37.7 | ) | ||||
| Total deferred tax assets |
140.3 | 124.7 | ||||||
| Deferred tax liabilities: |
||||||||
| Goodwill and other intangibles |
34.6 | 30.4 | ||||||
| Other miscellaneous items |
31.4 | 13.6 | ||||||
| Total deferred tax liabilities |
66.0 | 44.0 | ||||||
| Net deferred tax asset |
$ | 74.3 | $ | 80.7 | ||||
| Years Ended December 31, | ||||||||
| ($ in millions) | 2009 | 2008 | ||||||
| Deferred tax asset—current |
$ | 6.7 | $ | 8.5 | ||||
| Deferred tax asset—non-current |
80.8 | 84.7 | ||||||
| Deferred tax liability—current |
— | (0.1 | ) | |||||
| Deferred tax liability—non-current |
(13.2 | ) | (12.4 | ) | ||||
| Net deferred tax assets |
$ | 74.3 | $ | 80.7 | ||||
Unrecognized Tax Benefits
The following table reconciles the total amounts of unrecognized tax benefits at the beginning and end of 2009 and 2008:
| Years Ended December 31, | ||||||||
| ($ in millions) | 2009 | 2008 | ||||||
| Beginning balance, January 1 |
$ | 12.6 | $ | 10.9 | ||||
| Additions for tax positions of prior years |
1.9 | 1.8 | ||||||
| Additions for tax positions of the current year |
1.2 | 0.5 | ||||||
| Reductions for tax positions of prior years |
— | (0.5 | ) | |||||
| Reductions for lapse of statute of limitations |
(1.5 | ) | (0.1 | ) | ||||
| Reductions for settlements |
(1.0 | ) | — | |||||
| Ending balance, December 31 |
$ | 13.2 | $ | 12.6 | ||||
The remaining $13.2 million of unrecognized tax benefits will impact the Company’s annual effective tax rate if recognized. The Company expects to recognize $1.4 million of the remaining $13.2 million of unrecognized tax benefits prior to December 31, 2010, upon the expiration of the period to assess tax in various federal, state and foreign taxing jurisdictions.
The Company’s policy regarding the classification of interest and penalties recognized is to classify them as income tax expense in its financial statements. During 2009 and 2008, the total amount of interest and penalties recognized as a component of income tax expense was $0.5 million and $0.4 million, respectively.
84
Table of Contents
The Company is subject to U.S. federal income tax, as well as income tax of multiple foreign and state jurisdictions. During 2009, the Company filed the federal income tax return for 2008, which is open to possible examination and adjustment. The tax years 2004 through 2008 remain open to examination in both the U.K. and Italy, which are major taxing jurisdictions where the Company is subject to foreign taxes.
The valuation allowance of $42.8 million relates to state net operating losses and tax credits, net operating losses and certain tax assets and other carryforwards of foreign entities for which management believes are not more likely than not to be realized. The increase in the Company’s valuation allowance in 2009 is principally due to a $4.0 million increase to the valuation allowance for foreign net operating loss carryforwards, which includes a foreign exchange impact of $2.9 million. Additionally, the valuation allowance for state net operating losses and credits increased by $1.1 million.
A full valuation allowance has not been established because the Company believes it is more likely than not that the results of future operations will generate sufficient taxable income to realize the net deferred tax assets. Taxable income is expected to be sufficient to recover the net benefit within the period in which these remaining differences are expected to reverse, assuming no change to the current tax laws.
The Company has net deferred tax assets of $1.5 million related to state and foreign net operating loss carryforwards with a significant portion of these carryforwards expiring between 2015 and 2027.
The Company’s effective tax rate was reduced by a Brazilian regional tax holiday granted to the former Nordesclor business that the Company acquired at the end of 2005. The holiday will reduce its Brazilian corporate income tax by 75% through 2014 for certain of the Company’s earnings in Brazil. The Company’s effective tax rate was also reduced by a tax holiday in China. The tax rates in China increase as follows: 0% in 2009, 11% in 2010, 12% in 2011, 12.5% in 2012, and 25% in 2013 and future years.
The Company’s estimated annual effective tax rate reflects the tax benefit from our United Kingdom (“U.K”) financing structure. During July 2009, tax legislation was enacted in the U.K. which could limit the tax benefit of the Company’s U.K. financing structure, thereby increasing the Company’s future effective tax rate beginning in 2011 and may impact previously recorded deferred tax assets.
The Company provides for deferred taxes on temporary differences between the financial statement and tax bases of assets using the enacted tax rates that are expected to apply to taxable income when the temporary differences are expected to reverse. At December 31, 2009, the Company’s share of cumulative undistributed earnings of foreign subsidiaries was approximately $247 million. No provision has been made for U.S. or additional foreign taxes on the undistributed earnings of foreign subsidiaries, except for its Canadian subsidiaries, since the Company intends to continue to reinvest these earnings. Foreign tax credits could be available to reduce or eliminate any amount of additional U.S. tax that might be payable on these foreign earnings in the event of distributions or sale.
| 15. | Employee Benefit Plans |
Pension Plans and Retirement Benefits
The Company provides a defined benefit pension plan covering most U.S. employees. The Company also maintains two nonqualified supplemental pension plans. These plans were established to provide additional retirement benefits for certain key employees. The assets of the Arch plan consist primarily of investments in commingled funds administered by independent investment advisors. The Company’s policy, in general, is to fund, at a minimum, amounts as are necessary on an actuarial basis to provide assets sufficient to meet the benefits to be paid to plan members in accordance with the requirements of the Employee Retirement Income Security Act of 1974.
The Company also provides a retiree medical and death benefits plan that covers most domestic employees. The Company is liable for the payment of all retiree medical and death benefits earned by Company employees prior to and following the Distribution who retire after the Distribution. This Arch plan is an unfunded plan.
85
Table of Contents
The following tables provide a reconciliation of the changes in the plans’ projected benefit obligations, fair value of plan assets and funded status of the Arch retirement plans.
| Pension Benefits | Other Postretirement Benefits |
|||||||||||||||
| ($ in millions) | 2009 | 2008 | 2009 | 2008 | ||||||||||||
| Reconciliation of Projected Benefit Obligation: |
||||||||||||||||
| Projected benefit obligation at beginning of year |
$ | 286.0 | $ | 268.0 | $ | 14.6 | $ | 15.1 | ||||||||
| Service cost (benefits earned during the period) |
8.1 | 7.3 | 0.5 | 0.5 | ||||||||||||
| Interest cost on the projected benefit obligation |
18.6 | 17.4 | 0.9 | 0.9 | ||||||||||||
| Plan amendments |
2.6 | — | — | — | ||||||||||||
| Actuarial loss (gain) |
23.7 | 8.4 | (0.5 | ) | (1.2 | ) | ||||||||||
| Benefits paid |
(11.0 | ) | (15.1 | ) | (0.8 | ) | (0.7 | ) | ||||||||
| Projected benefit obligation at end of year |
$ | 328.0 | $ | 286.0 | $ | 14.7 | $ | 14.6 | ||||||||
| Reconciliation of Fair Value of Plan Assets: |
||||||||||||||||
| Fair value of plan assets at beginning of year |
$ | 150.3 | $ | 231.7 | $ | — | $ | — | ||||||||
| Employer contributions |
42.8 | 8.3 | 0.8 | 0.7 | ||||||||||||
| Benefits paid |
(11.0 | ) | (15.1 | ) | (0.8 | ) | (0.7 | ) | ||||||||
| Actual return on plan assets (net of expenses) |
41.4 | (74.6 | ) | — | — | |||||||||||
| Fair value of plan assets at end of year |
$ | 223.5 | $ | 150.3 | $ | — | $ | — | ||||||||
| Funded Status |
$ | (104.5 | ) | $ | (135.7 | ) | $ | (14.7 | ) | $ | (14.6 | ) | ||||
| Items not yet Recognized as a Component of Net Periodic Pension Cost: |
||||||||||||||||
| Net actuarial loss |
$ | 145.2 | $ | 148.7 | $ | 1.4 | $ | 1.9 | ||||||||
| Prior service cost (credit) |
2.1 | (0.2 | ) | (0.6 | ) | (0.8 | ) | |||||||||
| Total |
$ | 147.3 | $ | 148.5 | $ | 0.8 | $ | 1.1 | ||||||||
| Amounts Recognized in the Balance Sheet Consist of: |
||||||||||||||||
| Total accrued benefit cost (Accrued Liabilities) |
$ | (0.6 | ) | $ | (0.7 | ) | $ | (1.3 | ) | $ | (1.4 | ) | ||||
| Total non-current benefit costs (Other Liabilities) |
(103.9 | ) | (135.0 | ) | (13.4 | ) | (13.2 | ) | ||||||||
In 2009, the Company’s non-qualified pension plan for senior executives was amended to provide more competitive benefits and to encourage retention. The impact on the Company’s future pension expense is not material.
Included in Benefits paid in 2008 is $4.5 million related to a lump-sum retirement payment for a former executive.
The following information is required to be separately disclosed for pension plans with an accumulated benefit obligation in excess of plan assets. The Company’s qualified pension plan has an accumulated benefit obligation in excess of plan assets as of December 31, 2009. The Company’s nonqualified pension plan is unfunded.
| Qualified Pension Plan | Nonqualified Pension Plan | |||||||||||
| ($ in millions) | 2009 | 2008 | 2009 | 2008 | ||||||||
| Accumulated benefit obligation |
$ | 271.2 | $ | 242.9 | $ | 28.4 | $ | 18.0 | ||||
| Projected benefit obligation |
297.0 | 265.4 | 31.0 | 20.6 | ||||||||
| Fair value of plan assets |
223.5 | 150.3 | — | — | ||||||||
During 2009, the Company made $42.3 million of voluntary contributions to the Company’s qualified U.S. pension plan. As a result of the contributions, the Company has met the full funding phase-in thresholds set forth in the current U.S. pension legislation. Although there are no minimum funding requirements for the Company’s U.S. pension plans in 2010, the Company currently anticipates making approximately $25 million of voluntary contributions to the qualified plan in order to continue to meet the full funding phase-in thresholds. The Company also has payments due under the postretirement benefit plans. These plans are pay as you go, and therefore not required to be funded in advance. Pension expense in 2010 is expected to be $3–$4 million higher than 2009.
86
Table of Contents
Benefit costs presented below were determined based on actuarial methods and include the following components:
| Pension Benefits | Other Postretirement Benefits |
|||||||||||||||||||||||
| ($ in millions) | 2009 | 2008 | 2007 | 2009 | 2008 | 2007 | ||||||||||||||||||
| Net Periodic Benefit Expense: |
||||||||||||||||||||||||
| Service cost including expenses (benefits earned during the period) |
$ | 8.5 | $ | 7.9 | $ | 7.6 | $ | 0.5 | $ | 0.5 | $ | 0.5 | ||||||||||||
| Interest cost on the projected benefit obligation |
18.6 | 17.4 | 16.2 | 0.9 | 0.9 | 0.9 | ||||||||||||||||||
| Expected return on plan assets |
(19.8 | ) | (19.3 | ) | (16.1 | ) | — | — | — | |||||||||||||||
| Amortization of prior service cost (credit) |
0.2 | — | — | (0.2 | ) | (0.2 | ) | (0.3 | ) | |||||||||||||||
| Curtailment/Settlement |
— | 1.3 | 0.3 | — | — | — | ||||||||||||||||||
| Recognized actuarial loss |
5.2 | 3.3 | 4.9 | — | 0.1 | 0.3 | ||||||||||||||||||
| Net periodic benefit cost |
$ | 12.7 | $ | 10.6 | $ | 12.9 | $ | 1.2 | $ | 1.3 | $ | 1.4 | ||||||||||||
Included in Restructuring and other expense in the Company’s 2008 Consolidated Statement of Income is a $1.3 million charge related to a pension settlement associated with severance recorded in 2007 (see Note 22).
The amounts in AOCL that are expected to be recognized as components of net periodic benefit expense during the next fiscal year are as follows:
| ($ in millions) | Pension Benefits |
Other Postretirement Benefits |
|||||
| Prior service cost (credit) |
$ | 0.2 | $ | (0.2 | ) | ||
| Net actuarial loss |
8.4 | 0.1 | |||||
The weighted average assumptions used to determine the benefit obligation for the pension and the postretirement plans at December 31 were:
| Pension Benefits | Other Postretirement Benefits |
|||||||||||
| 2009 | 2008 | 2009 | 2008 | |||||||||
| Weighted Average Rate Assumptions: |
||||||||||||
| Discount rate |
6.00 | % | 6.50 | % | 6.00 | % | 6.50 | % | ||||
| Rate of compensation increase |
4.60 | % | 4.60 | % | — | — | ||||||
The weighted average assumptions used to determine the net periodic benefit cost for the years ending December 31 were:
| Pension Benefits | Other Postretirement Benefits |
|||||||||||||||||
| 2009 | 2008 | 2007 | 2009 | 2008 | 2007 | |||||||||||||
| Weighted Average Rate Assumptions: |
||||||||||||||||||
| Discount rate |
6.50 | % | 6.50 | % | 6.00 | % | 6.50 | % | 6.50 | % | 6.00 | % | ||||||
| Rate of compensation increase |
4.60 | % | 4.60 | % | 4.60 | % | — | — | — | |||||||||
| Long-term rate of return on assets |
8.50 | % | 8.50 | % | 8.50 | % | — | — | — | |||||||||
For 2009, the Company’s expected long-term rate of return on assets assumption was 8.50%. This assumption represents the average long-term rate of return expected on the funds invested or to be invested to provide for the benefits included in the benefit obligation. The assumption reflects expectations regarding future long-term rates of return for the investment portfolio, with consideration given to the distribution of investments by asset class and historical rates of return for each individual asset class.
87
Table of Contents
The Company’s pension plan asset allocation at December 31, 2009 and 2008 were:
| Pension Benefits | ||||||
| 2009 | 2008 | |||||
| Asset Category: |
||||||
| Equity |
66 | % | 71 | % | ||
| Fixed Income |
34 | % | 29 | % | ||
| Total |
100 | % | 100 | % | ||
At December 31, 2009, the Company’s target allocation of the pension plan assets is 40% large-cap equity funds, 10% mid-cap equity funds, 10% small-cap equity funds, 10% international equity funds and emerging markets equity funds and 30% fixed income funds. Fixed income funds include investments in government obligations, corporate bonds, agency obligations and asset-backed securities. The principal objective of the Company’s investment strategy is to ensure sufficient resources are available to meet the plan’s benefit obligations. The assets are invested in a diversified portfolio consisting of an array of asset classes that attempt to maximize returns while minimizing volatility. The current asset categories are listed in the table below. In the future, the Company may invest in other asset categories, including real estate.
Other than cash and cash equivalents, all U.S. pension plan assets are valued at their net asset values based on a combination of quoted prices from active markets and prices from inactive markets.
The fair values of the Company’s U.S. pension plan assets at December 31, 2009, by asset category, are as follows:
| ($ in millions) | Quoted Prices in Active Markets for Identical Assets (Level 1) |
Significant Observable Inputs (Level 2) |
Significant Unobservable Inputs (Level 3) |
Total | ||||||||
| Asset Category |
||||||||||||
| Large-Cap Equity Funds |
$ | — | $ | 82.9 | $ | — | $ | 82.9 | ||||
| Mid-Cap Equity Funds |
— | 16.0 | — | 16.0 | ||||||||
| Small-Cap Equity Funds |
— | 13.6 | — | 13.6 | ||||||||
| International Equity Funds |
— | 29.2 | — | 29.2 | ||||||||
| Emerging Markets Equity Funds |
— | 4.8 | — | 4.8 | ||||||||
| Government Obligations |
— | 12.8 | — | 12.8 | ||||||||
| Corporate Bonds |
— | 14.4 | — | 14.4 | ||||||||
| Agency Obligations |
— | 4.7 | — | 4.7 | ||||||||
| Asset-Backed Securities |
— | 40.8 | — | 40.8 | ||||||||
| Cash and Cash Equivalents |
4.3 | — | — | 4.3 | ||||||||
| Total |
$ | 4.3 | $ | 219.2 | $ | — | $ | 223.5 | ||||
The following table represents the benefits expected to be paid for the Arch retirement plans:
| ($ in millions) | Pension Benefits |
Other Postretirement Benefits | ||||
| 2010 |
$ | 12.5 | $ | 1.4 | ||
| 2011 |
13.4 | 1.5 | ||||
| 2012 |
15.5 | 1.5 | ||||
| 2013 |
36.1 | 1.6 | ||||
| 2014 |
16.3 | 1.6 | ||||
| Years 2015 to 2019 |
97.3 | 7.7 | ||||
88
Table of Contents
The expected benefits to be paid are based on the same assumptions used to measure the Company’s benefit obligation at December 31, 2009 and include estimated future employee service.
The annual measurement date is December 31 for the pension benefits and other postretirement benefits. For measurement purposes, the assumed health care cost trend rate used for pre-65 non-HMO plans and pre-65 HMO plans was 9.00% and 9.50% in 2009 and 2008, respectively, decreasing to an ultimate trend rate of 4.5% in 2018. For non-bargained participants, Arch’s subsidy for pre-65 coverage is limited to $10,000/retiree with all future cost increases to be paid by the retiree. For post-65 retirees, the Company provides a fixed dollar benefit that is not subject to escalation.
The assumed health care cost trend rate assumptions can have an impact on the amounts reported. A one percent increase or decrease each year in the health care cost trend rate utilized would have the following effects at December 31, 2009:
| ($ in millions) | One Percentage Point | ||||||
| Increase | Decrease | ||||||
| Effect on the net periodic postretirement benefit costs |
$ | — | $ | — | |||
| Effect on the postretirement benefit obligation |
0.2 | (0.2 | ) | ||||
As part of the acquisition of Hickson, the Company acquired the liability for the Hickson U.K. and the Hickson U.K. Senior Executive retirement plans. The following tables provide a reconciliation of the changes in the plans’ projected benefit obligations, fair value of plan assets, funded status, certain assumptions and components of net periodic pension expense of the Hickson U.K. and the Hickson U.K. Senior Executive retirement plans for the years ended December 31, 2009 and 2008.
| ($ in millions) | Pension Benefits | |||||||
| 2009 | 2008 | |||||||
| Reconciliation of Projected Benefit Obligation: |
||||||||
| Projected benefit obligation at beginning of year |
$ | 283.6 | $ | 408.3 | ||||
| Service cost (benefits earned during the period) |
1.6 | 1.4 | ||||||
| Interest cost on the projected benefit obligation |
19.0 | 22.3 | ||||||
| Participant contributions |
0.3 | 0.3 | ||||||
| Actuarial loss (gain) |
46.6 | (28.4 | ) | |||||
| Benefits paid |
(16.6 | ) | (18.3 | ) | ||||
| Foreign exchange impact |
27.3 | (102.0 | ) | |||||
| Projected benefit obligation at end of year |
$ | 361.8 | $ | 283.6 | ||||
| Reconciliation of Fair Value of Plan Assets: |
||||||||
| Fair value of plan assets at beginning of year |
$ | 215.7 | $ | 331.5 | ||||
| Employer contributions |
15.6 | 17.9 | ||||||
| Benefits paid |
(16.6 | ) | (18.3 | ) | ||||
| Participant contributions |
0.3 | 0.3 | ||||||
| Actual return on plan assets (net of expenses) |
38.6 | (36.8 | ) | |||||
| Foreign exchange impact |
20.7 | (78.9 | ) | |||||
| Fair value of plan assets at end of year |
$ | 274.3 | $ | 215.7 | ||||
| Funded Status |
$ | (87.5 | ) | $ | (67.9 | ) | ||
| Items not yet Recognized as a Component of Net Periodic Pension Cost: |
||||||||
| Net actuarial loss |
$ | 138.3 | $ | 104.7 | ||||
| Amounts Recognized in the Balance Sheet Consist of: |
||||||||
| Total non-current benefit costs (Other Liabilities) |
$ | (87.5 | ) | $ | (67.9 | ) | ||
89
Table of Contents
The following information is required to be separately disclosed for pension plans with an accumulated benefit obligation in excess of plan assets. The Company’s Hickson U.K. and the Hickson U.K. Senior Executive plans have an accumulated benefit obligation in excess of plan assets as of December 31, 2009 and 2008.
| ($ in millions) | Hickson U.K. Plan | Hickson U.K. Senior Executive Plan | ||||||||||
| 2009 | 2008 | 2009 | 2008 | |||||||||
| Accumulated benefit obligation |
$ | 344.6 | $ | 271.0 | $ | 12.6 | $ | 10.2 | ||||
| Projected benefit obligation |
349.2 | 273.4 | 12.6 | 10.2 | ||||||||
| Fair value of plan assets |
263.9 | 207.0 | 10.4 | 8.7 | ||||||||
The Company’s current policy is to fund, at a minimum, amounts as are necessary to provide assets sufficient to meet the benefits to be paid to plan members in accordance with statutory requirements. The minimum funding requirements for the Company’s U.K. pension plans are currently expected to be approximately $15 million to $20 million in 2010. Pension expense in 2010 is expected to be $2–$3 million higher than 2009.
Benefit costs presented below were determined based on actuarial methods and include the following components:
| ($ in millions) | 2009 | 2008 | 2007 | |||||||||
| Net Periodic Benefit Expense: |
||||||||||||
| Service cost (benefits earned during the period) |
$ | 1.6 | $ | 1.4 | $ | 2.1 | ||||||
| Interest cost on the projected benefit obligation |
19.0 | 22.3 | 22.6 | |||||||||
| Expected return on plan assets |
(17.2 | ) | (19.7 | ) | (19.6 | ) | ||||||
| Recognized actuarial loss |
1.9 | 3.2 | 5.1 | |||||||||
| Net periodic benefit cost |
$ | 5.3 | $ | 7.2 | $ | 10.2 | ||||||
The weighted average assumptions used to determine the benefit obligation for the U.K. pension plans at December 31 were:
| Pension Benefits | ||||||
| 2009 | 2008 | |||||
| Weighted Average Rate Assumptions: |
||||||
| Discount rate |
5.75 | % | 6.50 | % | ||
| Rate of compensation increase |
4.75 | % | 4.00 | % | ||
The weighted average assumptions used to determine the net periodic benefit cost for the years ending December 31 were:
| Pension Benefits | |||||||||
| 2009 | 2008 | 2007 | |||||||
| Weighted Average Rate Assumptions: |
|||||||||
| Discount rate |
6.50 | % | 6.00 | % | 5.25 | % | |||
| Rate of compensation increase |
4.00 | % | 4.50 | % | 4.15 | % | |||
| Long-term rate of return on assets |
6.50 | % | 6.50 | % | 6.50 | % | |||
For 2009 and 2008, the Company’s expected long-term rate of return on assets assumption was 6.75%, which was reduced by 0.25% to allow for administration expenses, which have been removed from the service cost. This assumption represents the average long-term rate of return expected on the funds invested or to be invested to provide for the benefits included in the benefit obligation. The assumption reflects expectations regarding future long-term rates of return for the investment portfolio, with consideration given to the distribution of investments by asset class and historical rates of return for each individual asset class.
90
Table of Contents
The amounts in accumulated other comprehensive loss that are expected to be recognized as components of net periodic benefit expense during the next fiscal year are as follows:
| ($ in millions) | Pension Benefits | ||
| Net actuarial loss |
$ | 3.8 | |
The Company’s U.K. pension plan asset allocation at December 31, 2009 and 2008 were:
| Hickson U.K. Pension Plan |
Hickson U.K. Senior Executive Plan |
|||||||||||
| 2009 | 2008 | 2009 | 2008 | |||||||||
| Asset Category: |
||||||||||||
| Equity Funds |
42 | % | 40 | % | 34 | % | 33 | % | ||||
| Fixed Income Funds |
58 | % | 60 | % | 66 | % | 67 | % | ||||
| Total |
100 | % | 100 | % | 100 | % | 100 | % | ||||
The target allocation for the pension plan assets is 43% in equity funds and 57% fixed income funds for the Hickson U.K. plan and 32% in equity funds and 68% fixed income funds for the Hickson U.K. Senior Executive plan. Fixed income funds include investments in corporate bonds, asset-backed securities, government obligations and agency obligations. The investment strategy for the plans includes meeting the plan objectives, generating competitive investment returns and investing in a diversified portfolio consisting of an array of asset classes that attempts to maximize returns while minimizing volatility. The current asset categories are listed in the table below. In the future, the Company may invest in other asset categories, including real estate.
The fair values of the Company’s U.K. pension plan assets at December 31, 2009, by asset category, are as follows:
| ($ in millions) | Quoted Prices in Active Markets for Identical Assets (Level 1) |
Significant Observable Inputs (Level 2) |
Significant Unobservable Inputs (Level 3) |
Total | ||||||||
| Asset Category |
||||||||||||
| Equity Funds (a) |
$ | — | $ | 113.3 | $ | — | $ | 113.3 | ||||
| Government Obligations |
36.5 | 41.1 | — | 77.6 | ||||||||
| Corporate Bonds |
34.9 | 35.6 | — | 70.5 | ||||||||
| Agency Obligations |
3.7 | — | — | 3.7 | ||||||||
| Asset-Backed Securities |
8.9 | — | — | 8.9 | ||||||||
| Cash and Cash Equivalents |
0.3 | — | — | 0.3 | ||||||||
| Total |
$ | 84.3 | $ | 190.0 | $ | — | $ | 274.3 | ||||
| (a) | This category includes funds that principally invest in companies in the U.K. and other European countries. |
The following table represents the benefits expected to be paid for the Hickson U.K. retirement plans:
| (£ in millions) | Pension Benefits | ||
| 2010 |
£ | 9.4 | |
| 2011 |
9.3 | ||
| 2012 |
9.6 | ||
| 2013 |
10.1 | ||
| 2014 |
10.4 | ||
| Years 2015 to 2019 |
58.3 | ||
The expected benefits to be paid are based on the same assumptions used to measure the Company’s benefit obligation at December 31, 2009 and include the impact of estimated future employee service.
91
Table of Contents
As part of the acquisition of Avecia’s pool & spa and protection & hygiene businesses, the Company acquired certain liabilities for prior service associated with its U.K. defined benefit pension plan. Subsequent to the acquisition, a defined contribution plan was established for the transferred employees and no further future service benefit will be accrued in the defined benefit plan. As of December 31, 2009 and 2008, respectively, the projected benefit obligation of the plan was £15.5 million ($24.9 million) and £10.9 million ($16.0 million), the accumulated benefit obligation was £12.3 million ($19.8 million) and £9.1 million ($13.3 million), net assets of £13.0 million ($20.7 million) and £10.1 million ($14.8 million) and the accrued benefit was £2.6 million ($4.1 million) and £0.8 million ($1.2 million). The net assets primarily consist of equities and bonds and such assets are valued using quoted prices. The assumptions for the valuation are consistent with that of the Company’s other U.K. plans. During 2009, 2008 and 2007 the Company incurred £0.1 million ($0.1 million), £0.2 million ($0.4 million) and £0.2 million ($0.5 million), respectively, of net periodic benefit cost related to this plan.
The Company’s other foreign subsidiaries maintain pension and other benefit plans that are consistent with statutory practices and are not significant to the consolidated financial statements.
Deferred Compensation Plans
The Board of Directors of the Company had previously adopted three deferred compensation plans, namely, the 1999 Stock Plan for Non-employee Directors (the “Directors Plan”), the Supplemental Contributing Employee Ownership Plan and the Employee Deferral Plan. The non-employee Directors participate only in the Directors Plan while officers and certain other key employees are eligible to participate in the other two plans. These plans permit or require their participants to defer a portion of their compensation. The participants’ compensation deferrals are adjusted for changes in value of phantom shares of common stock of the Company and in other phantom investment vehicles. The Company established a rabbi trust for each of these plans (collectively, the “Rabbi Trust”).
The Company has entered into equity total return swap agreements with a total notional value of 400,000 shares in order to minimize earnings volatility related to these awards and performance awards granted under the 1999 Long Term Incentive Plan and the 2009 Long Term Incentive Plan (see Note 16 for further detail on the performance awards). The Company did not designate the swaps as hedges. Rather, the Company marks the swaps to market and records the impact in Selling and Administration expenses in the Company’s Consolidated Statement of Income. The adjustments to the values of the swaps offset the adjustments to the carrying values of the Company’s deferred compensation liabilities, which are also recorded in Selling and Administration expenses, and there is no impact on the Company’s Consolidated Statement of Income. See Note 13 for further detail.
The assets in the Rabbi Trust are invested in shares of Arch common stock, marketable securities and a cash surrender life insurance policy, which generally are expected to generate returns consistent with those credited to the participants. The assets of the Rabbi Trust are available to satisfy the claims of the Company’s creditors in the event of bankruptcy or insolvency of the Company. The Company’s stock held in the Rabbi Trust is treated in a manner similar to treasury stock, with no subsequent changes in fair value and recorded as a reduction of shareholders’ equity ($1.9 million at both December 31, 2009 and 2008), with an offsetting amount reflected as a deferred compensation liability of the Company. The carrying value of the deferred compensation liability related to the Company’s stock is adjusted to fair market value each reporting period by a charge or credit to operations in Selling and Administration on the Company’s Consolidated Statements of Income. The other assets of the Rabbi Trust are reported at fair market value in Other assets in the Consolidated Balance Sheets ($8.8 million and $7.7 million at December 31, 2009 and 2008, respectively). The deferred compensation liability in Other liabilities in the Consolidated Balance Sheets reflects the fair market value of the plan participants’ compensation deferrals ($12.4 million and $8.5 million at December 31, 2009 and 2008, respectively). Changes in the market value of the marketable securities and the deferred compensation liability are adjusted to fair market value each reporting period by a charge or credit to operations in Selling and Administration on the Company’s Consolidated Statements of Income.
92
Table of Contents
Contributing Employee Ownership Plan
The Company has established the Arch Chemicals, Inc. Contributing Employee Ownership Plan (“CEOP”), which is a defined contribution plan available to all U.S. employees. The matching contribution allocable to Company employees under the CEOP has been included in costs and expenses in the accompanying Consolidated Statements of Income and was $3.9 million, $3.3 million and $3.8 million in 2009, 2008 and 2007, respectively.
| 16. | Stock Option and Shareholder Rights Plans |
Stock Option Plans
The Company accounts for its stock option plans in accordance with FASB ASC 718, which requires all share-based payments to employees, including grants of employee stock options, to be recognized in the consolidated financial statements based on their fair values. The five stock-based compensation plans are described below:
| • | The 1988 and 1996 Olin Stock Option Plans. At the time of the distribution (“Distribution”) of the Company from Olin Corporation (“Olin”), outstanding Olin options were converted into both an option to purchase Company common stock (“Company Options”) and an option to purchase Olin common stock (“New Olin Options”) with the same aggregate “intrinsic value” at the time of the Distribution as the old award. Options granted to such employees under the Olin 1988 Stock Option Plan or the Olin 1996 Stock Option Plan retained the original term of the option. No additional Company Options will be granted under the 1988 and 1996 Olin Stock Option Plans and there were no Company Options or New Olin Options outstanding at December 31, 2009. |
| • | 1999 Long Term Incentive Plan seeks to encourage selected salaried employees to acquire a proprietary interest in the Company’s growth and performance and to attract and retain qualified individuals. The plan provides for the ability to issue stock options, restricted stock and restricted stock units, and performance awards. The Plan requires that options be granted at an exercise price representing the fair market value of the common stock on the grant date. In general, the employee options vest and become exercisable within one to three years and all options are exercisable up to ten years from the date of grant. During 2009, the plan expired and no additional awards may be granted under this plan. |
| • | 1999 Stock Plan for Nonemployee Directors is a directors compensation plan under which stock options and other stock awards may be granted to nonemployee directors. The Plan requires that options be granted at an exercise price representing the fair market value of the common stock on the grant date. In general, the directors’ options are exercisable upon grant and all options are exercisable up to ten years from the date of grant. |
| • | 2009 Long Term Incentive Plan seeks to encourage selected salaried employees to acquire a proprietary interest in the Company’s growth and performance, to generate an increased incentive to contribute to the Company’s future success and to enhance the ability of the Company to attract and retain qualified individuals. The plan provides for the ability to issue stock options, stock appreciation rights, restricted share awards, restricted stock units, performance compensation awards, performance units, cash incentive awards and other equity-based or equity-related awards. |
When originally adopted, total shares authorized for grant under the 1999 Stock Plan for Nonemployee Directors and the 2009 Long Term Incentive Plan were 1,650,000.
93
Table of Contents
The following table summarizes stock option activity during 2009, 2008 and 2007 (number of options in thousands):
| Stock Options |
Weighted Average Price |
Range of Exercise Prices | ||||||
| Balance, December 31, 2006 |
1,157 | $ | 22.99 | $ | 16.53 – 31.92 | |||
| Options exercised |
657 | 24.43 | 16.53 – 31.92 | |||||
| Options cancelled or forfeited |
13 | 28.33 | 17.38 – 28.58 | |||||
| Balance, December 31, 2007 |
487 | 20.91 | 17.38 – 31.92 | |||||
| Options exercised |
126 | 21.36 | 17.38 – 31.92 | |||||
| Options cancelled or forfeited |
38 | 31.56 | 18.22 – 31.92 | |||||
| Balance, December 31, 2008 |
323 | 19.46 | 17.38 – 23.00 | |||||
| Options exercised |
154 | 19.52 | 17.38 – 22.72 | |||||
| Options expired |
1 | 19.41 | 19.41 – 19.41 | |||||
| Balance, December 31, 2009 |
168 | $ | 19.40 | $ | 17.38 – 23.00 | |||
At December 31, 2009 and 2008, options covering 167,661 and 322,631 shares, respectively, were exercisable at weighted average exercise prices of $19.40 and $19.46, respectively. The average remaining contractual life was approximately two years.
The total intrinsic value of stock options exercised during the twelve months ended December 31, 2009 was $0.8 million.
As part of the 1999 Long Term Incentive Plan and the 2009 Long Term Incentive Plan, the Company currently grants selected executives and other key employees performance awards whose vesting is contingent upon meeting various performance measures and contains a retention feature. This component of compensation is designed to encourage the long-term retention of key executives and to tie a major part of executive compensation directly to Company performance and the long-term enhancement of shareholder value. The award of performance units was designed to recognize and reward targeted return on equity (“ROE”). The performance awards, which are settled partly in cash and partly in shares of the Company’s stock, are earned at the end of the three-year period provided the ROE target is achieved for that third year. There is an opportunity for accelerated payout of the performance awards if the ROE target is met or exceeded by the end of the second year after the grant. If the ROE target is not achieved by the end of year three, 50% of the performance awards will be forfeited and 50% of the performance awards will be paid out as soon as administratively feasible following the end of year six if the executive is still employed at the Company.
The Company accounts for the portion of the award to be settled in shares as an equity-based award, which requires share-based compensation cost to be measured at the grant date, or approval date if awards are amended, based on the fair value of the award. The fair value of the awards is determined and fixed based on the quoted market value of the Company’s stock. The Company uses the straight-line method to recognize the share-based compensation costs related to the awards over the remaining service period. As of December 31, 2009, there were 696,000 performance awards granted; of these awards approximately 299,000 will be paid out in shares of Company stock, if earned. The grant date fair value for the awards to be paid out in shares was $8.7 million.
For the performance awards which are settled in cash, the amount of the payments is based on the market price of the Company’s stock at the time of settlement. During the service period, compensation cost is recognized proportionately based on the Company’s estimate of achieving the financial targets. The performance awards are remeasured to reflect the market price of the Company’s stock at each financial statement date until the award is settled.
94
Table of Contents
The Company has entered into equity total return swap agreements with a total notional value of 400,000 shares in order to minimize earnings volatility related to these awards and the Company’s deferred compensation awards (see Note 15 for further detail). The Company did not designate the swaps as hedges. Rather, the Company marks the swaps to market and records the impact in Selling and Administration expenses in the Company’s Consolidated Statement of Income. The adjustments to the values of the swaps offset the adjustments to the carrying values of the Company’s long-term incentive plan liabilities, which are also recorded in Selling and Administration expenses in the Company’s Consolidated Statement of Income, and there is no impact on the Company’s Consolidated Statement of Income. See Note 13 for further detail.
Not including the impact of the equity total return swap agreements, total compensation expense of $6.6 million, $4.7 million and $12.3 million was recognized for the years ended December 31, 2009, 2008 and 2007, respectively. See Note 13 for a discussion of the impact of the equity total return swap agreements on the Company’s Consolidated Statements of Income. At December 31, 2009, there was $9.0 million of total unrecognized compensation cost related to the unearned payment arrangements, which is expected to be recognized over a weighted-average period of two years based on current financial forecasts.
The following table summarizes the performance award activity for the year ended December 31, 2009 (number of awards in thousands):
| Performance Awards | ||
| Balance, December 31, 2008 |
565 | |
| Awarded |
410 | |
| Paid out |
237 | |
| Cancelled or forfeited |
42 | |
| Balance, December 31, 2009 |
696 | |
At December 31, 2009 the closing stock price was $30.88. Of the 696,000 performance awards outstanding at December 31, 2009, approximately 109,000 vested and will be paid out in the first quarter of 2010, as employees achieved the service requirements of the retention feature of the awards.
Shareholder Rights Plan
The Board of Directors adopted a Shareholder Rights Plan in 1999. This plan was designed to prevent a potential acquirer from gaining control of the Company without offering a fair price to all shareholders. The rights expired on January 29, 2009 and was not replaced.
| 17. | Shareholders’ Equity |
Common Stock
On February 8, 1999, Olin, the sole shareholder of the Company, distributed (on a 1-for-2 basis) all the issued and outstanding shares of common stock, par value $1 per share, of the Company, to the shareholders of record of Olin’s common stock as of February 1, 1999, upon which the Company became a separate, independent company. The total number of shares distributed was approximately 22,980,000.
At December 31, 2009, the Company has reserved 2,192,977 shares of its authorized but unissued common stock for possible future issuance in connection with the exercise of stock options, restricted stock, and performance share units.
In 2004, the Company established a Rabbi Trust for several deferred compensation plans (see Note 15 for more information), that permit or require their participants to defer a portion of their compensation. The Company’s stock held in the Rabbi Trust is treated in a manner similar to treasury stock, with no subsequent changes in fair value and recorded as a reduction of shareholders’ equity.
95
Table of Contents
On October 28, 1999, the Company’s Board of Directors approved a stock repurchase program whereby the Company is authorized to buy back up to 1.2 million shares of its common stock, representing approximately five percent of outstanding shares. The program was suspended in 2000. In October 2003, the Board of Directors unanimously agreed to continue the previous suspension of its stock repurchase program. The Company had previously repurchased 893,000 shares of the 1.2 million shares authorized, or approximately 75 percent, at a cost of approximately $16 million. In connection with the acquisition of the Avecia pool & spa and protection & hygiene businesses, the Company reissued 744,538 shares with a value of $17.4 million.
Series A Participating Cumulative Preferred Stock
The Company has 40,000 authorized shares of $1 par value Series A Participating Cumulative Preferred Stock, of which none is outstanding.
Retained Earnings
Retained earnings as of December 31, 2009 and 2008 include earnings (losses) since the Distribution.
Accumulated Other Comprehensive Loss
Accumulated other comprehensive loss includes cumulative foreign currency translation adjustments, pension liability adjustments, net of tax and accumulated net unrealized gain (loss) on derivative instruments, net of tax.
| Foreign Currency Translation Adjustments |
Pension Liability Adjustments |
Change in Fair Market Value of Derivative Contracts |
Accumulated Other Comprehensive Loss |
|||||||||||||
| ($ in millions) | ||||||||||||||||
| Balance at December 31, 2006 |
$ | 27.4 | $ | (152.2 | ) | $ | 0.8 | $ | (124.0 | ) | ||||||
| 2007 activity |
38.2 | 37.7 | (0.8 | ) | 75.1 | |||||||||||
| Balance at December 31, 2007 |
65.6 | (114.5 | ) | — | (48.9 | ) | ||||||||||
| 2008 activity |
(59.8 | ) | (73.6 | ) | (1.9 | ) | (135.3 | ) | ||||||||
| Balance at December 31, 2008 |
5.8 | (188.1 | ) | (1.9 | ) | (184.2 | ) | |||||||||
| 2009 activity |
30.9 | (20.6 | ) | 1.2 | 11.5 | |||||||||||
| Balance at December 31, 2009 |
$ | 36.7 | $ | (208.7 | ) | $ | (0.7 | ) | $ | (172.7 | ) | |||||
96
Table of Contents
| 18. | Segment Reporting |
The Company has organized its business portfolio into two operating segments to reflect the Company’s business strategy. The two segments are Treatment Products and Performance Products. The Treatment Products segment includes three reportable business units: the HTH water products business, the personal care and industrial biocides business and the wood protection and industrial coatings business.
Segment results for the three years ended December 31 were as follows:
| ($ in millions) | 2009 | 2008 | 2007 | |||||||||
| Sales: |
||||||||||||
| Treatment Products: |
||||||||||||
| HTH Water Products |
$ | 551.1 | $ | 501.6 | $ | 482.8 | ||||||
| Personal Care and Industrial Biocides |
295.0 | 315.6 | 321.0 | |||||||||
| Wood Protection and Industrial Coatings |
378.9 | 459.2 | 449.1 | |||||||||
| Total Treatment Products |
1,225.0 | 1,276.4 | 1,252.9 | |||||||||
| Performance Products: |
||||||||||||
| Performance Urethanes |
150.2 | 197.0 | 216.8 | |||||||||
| Hydrazine |
16.7 | 18.7 | 17.9 | |||||||||
| Total Performance Products |
166.9 | 215.7 | 234.7 | |||||||||
| Total Sales |
$ | 1,391.9 | $ | 1,492.1 | $ | 1,487.6 | ||||||
| Segment Operating Income (Loss), including Equity Income in Affiliated Companies: |
||||||||||||
| Treatment Products: |
||||||||||||
| HTH Water Products |
$ | 65.2 | $ | 65.9 | $ | 64.7 | ||||||
| Personal Care and Industrial Biocides |
43.6 | 62.1 | 54.2 | |||||||||
| Wood Protection and Industrial Coatings |
(3.0 | ) | 2.4 | 13.9 | ||||||||
| Total Treatment Products |
105.8 | 130.4 | 132.8 | |||||||||
| Performance Products: |
||||||||||||
| Performance Urethanes |
8.9 | 16.1 | 11.9 | |||||||||
| Hydrazine |
3.4 | 1.1 | 13.5 | |||||||||
| Total Performance Products |
12.3 | 17.2 | 25.4 | |||||||||
| Corporate Unallocated |
(34.1 | ) | (33.9 | ) | (42.4 | ) | ||||||
| Total Segment Operating Income, including Equity Income in |
||||||||||||
| Affiliated Companies |
84.0 | 113.7 | 115.8 | |||||||||
| Restructuring Expense |
— | (1.3 | ) | (8.5 | ) | |||||||
| Impairment Expense |
— | (25.8 | ) | (7.9 | ) | |||||||
| Equity in Earnings of Affiliated Companies |
(0.6 | ) | (0.4 | ) | (0.5 | ) | ||||||
| Total Operating Income |
83.4 | 86.2 | 98.9 | |||||||||
| Interest expense, net |
(12.2 | ) | (10.7 | ) | (13.3 | ) | ||||||
| Total Income from Continuing Operations before Taxes and Equity in Earnings of Affiliated Companies |
$ | 71.2 | $ | 75.5 | $ | 85.6 | ||||||
| Equity Income in Affiliated Companies: |
||||||||||||
| Treatment Products: |
||||||||||||
| Wood Protection and Industrial Coatings |
$ | 0.6 | $ | 0.4 | $ | 0.5 | ||||||
| Total Equity Income in Affiliated Companies |
$ | 0.6 | $ | 0.4 | $ | 0.5 | ||||||
97
Table of Contents
| ($ in millions) | 2009 | 2008 | 2007 | ||||||
| Depreciation Expense: |
|||||||||
| Treatment Products: |
|||||||||
| HTH Water Products |
$ | 11.0 | $ | 10.2 | $ | 10.6 | |||
| Personal Care and Industrial Biocides |
10.8 | 9.5 | 10.3 | ||||||
| Wood Protection and Industrial Coatings |
7.9 | 8.8 | 7.6 | ||||||
| Total Treatment Products |
29.7 | 28.5 | 28.5 | ||||||
| Performance Products: |
|||||||||
| Performance Urethanes |
4.0 | 4.2 | 4.1 | ||||||
| Hydrazine |
1.0 | 1.8 | 2.2 | ||||||
| Total Performance Products |
5.0 | 6.0 | 6.3 | ||||||
| Total Depreciation Expense |
$ | 34.7 | $ | 34.5 | $ | 34.8 | |||
| Amortization Expense: |
|||||||||
| Treatment Products: |
|||||||||
| HTH Water Products |
$ | 5.2 | $ | 2.4 | $ | 1.4 | |||
| Personal Care and Industrial Biocides |
4.1 | 5.8 | 6.2 | ||||||
| Wood Protection and Industrial Coatings |
2.5 | 2.6 | 2.4 | ||||||
| Total Treatment Products |
11.8 | 10.8 | 10.0 | ||||||
| Performance Products |
0.2 | 0.2 | 0.2 | ||||||
| Total Amortization Expense |
$ | 12.0 | $ | 11.0 | $ | 10.2 | |||
| Capital Spending: |
|||||||||
| Treatment Products: |
|||||||||
| HTH Water Products |
$ | 13.3 | $ | 13.8 | $ | 8.2 | |||
| Personal Care and Industrial Biocides |
8.1 | 29.0 | 19.8 | ||||||
| Wood Protection and Industrial Coatings |
6.0 | 7.8 | 10.0 | ||||||
| Total Treatment Products |
27.4 | 50.6 | 38.0 | ||||||
| Performance Products: |
|||||||||
| Performance Urethanes |
2.0 | 2.5 | 3.3 | ||||||
| Hydrazine |
0.5 | 0.2 | 0.3 | ||||||
| Performance Products |
2.5 | 2.7 | 3.6 | ||||||
| Total Capital Spending |
$ | 29.9 | $ | 53.3 | $ | 41.6 | |||
| Total Assets: |
|||||||||
| Treatment Products: |
|||||||||
| HTH Water Products |
$ | 399.2 | $ | 403.5 | $ | 270.6 | |||
| Personal Care and Industrial Biocides |
291.7 | 308.3 | 330.7 | ||||||
| Wood Protection and Industrial Coatings |
325.0 | 324.0 | 378.2 | ||||||
| Total Treatment Products |
1,015.9 | 1,035.8 | 979.5 | ||||||
| Performance Products: |
|||||||||
| Performance Urethanes |
50.6 | 74.0 | 77.3 | ||||||
| Hydrazine |
7.7 | 8.3 | 11.1 | ||||||
| Total Performance Products |
58.3 | 82.3 | 88.4 | ||||||
| Other |
136.3 | 114.3 | 120.3 | ||||||
| Total Assets |
$ | 1,210.5 | $ | 1,232.4 | $ | 1,188.2 | |||
| Investment & Advances—Affiliated Companies at Equity: |
|||||||||
| Treatment Products: |
|||||||||
| Wood Protection and Industrial Coatings |
$ | 2.0 | $ | 1.5 | $ | 1.9 | |||
| Total Investment & Advances—Affiliated Companies at Equity |
$ | 2.0 | $ | 1.5 | $ | 1.9 | |||
98
Table of Contents
Segment operating income includes the equity in earnings of affiliated companies and excludes restructuring (income) expense and impairment expense, if any. The Company includes the equity income (loss) of affiliates in its segment operating results as it believes it to be relevant and useful information for investors as these affiliates are the means by which certain segments participate in certain geographic regions. Furthermore, the Company includes equity income (loss) as a component of segment operating results because the Company includes it to measure the performance of the segment. Other (gains) and losses that are directly related to the segments are included in segment operating results. Included in the hydrazine operating results for 2008 and 2007 are gains of $0.4 million and $12.8 million, respectively, related to the completion of a U.S. Government contract (see Note 21 for more information), which are recorded in Other (gains) and losses in the Company’s statements of income. The Company believes the exclusion of restructuring and impairment expenses from segment operating income provides additional perspective on the Company’s underlying business trends and provides useful information to investors by excluding amounts from the Company’s results that the Company believes are not indicative of ongoing operating results. Cost of Goods Sold for 2007 includes a $0.4 million charge related to the disposal of inventory resulting from the Company’s decision to discontinue the manufacturing of its BIT molecule. This charge has been excluded from the operating income of personal care and industrial biocides in the table above and the charge has been included in restructuring expense (see Note 22 for more information). Included in the HTH water products operating income for 2009 and 2008 are benefits of $1.0 million and $11.5 million, respectively, related to the favorable antidumping duty rulings for the review periods of June 1, 2007 through May 31, 2008 and June 1, 2006 through May 31, 2007 (see Note 20 for more information). Included in the HTH water products operating income for 2007 is a benefit of approximately $14 million and included in corporate unallocated is an expense of approximately $3 million related to the favorable antidumping duty ruling for the review period of December 16, 2004 through May 31, 2006 (see Note 20 for more information).
Segment assets include only those assets that are directly identifiable to a segment and do not include such items as cash, certain deferred taxes, LIFO reserves, assets held for sale, and certain other assets. Sales by reportable business unit substantially represent sales for the major product lines of the Company.
Geographic area information for the periods ended December 31, were as follows:
| ($ in millions) | 2009 | 2008 | 2007 | ||||||
| Sales |
|||||||||
| United States |
$ | 677.9 | $ | 702.2 | $ | 740.9 | |||
| Europe, Africa and the Middle East |
412.7 | 473.0 | 466.6 | ||||||
| Latin America and Canada |
157.2 | 162.2 | 146.1 | ||||||
| Pacific Rim |
144.1 | 154.7 | 134.0 | ||||||
| Total Foreign Sales |
714.0 | 789.9 | 746.7 | ||||||
| Total Sales |
$ | 1,391.9 | $ | 1,492.1 | $ | 1,487.6 | |||
| Long-lived Assets (excludes Goodwill) |
|||||||||
| United States |
$ | 249.4 | $ | 263.9 | $ | 172.9 | |||
| Italy |
48.2 | 49.6 | 52.5 | ||||||
| England |
109.7 | 103.0 | 136.8 | ||||||
| Europe (remaining), Africa and the Middle East |
23.9 | 19.2 | 19.9 | ||||||
| Latin America and Canada |
25.2 | 16.8 | 22.0 | ||||||
| Pacific Rim |
53.5 | 53.6 | 24.1 | ||||||
| Total Foreign Long-lived Assets |
260.5 | 242.2 | 255.3 | ||||||
| Total Long-lived Assets |
$ | 509.9 | $ | 506.1 | $ | 428.2 | |||
Sales to external customers are attributed to geographic areas based on country of destination. Transfers between geographic areas are priced generally at prevailing market prices. Export sales from the United States to unaffiliated customers were $93.1 million, $110.7 million and $115.3 million in 2009, 2008 and 2007, respectively.
99
Table of Contents
| 19. | Acquisitions |
Advantis
On October 10, 2008 the Company completed the acquisition of the water treatment chemicals business of Advantis, a North American manufacturer and marketer of branded swimming pool, spa and surface water treatment chemicals. The acquisition expands and improves the Company’s participation in the specialty pool and spa dealer and distribution channels as well as adding products and technologies that complement its existing product portfolio and supports its strategy of growing the non-residential water business. The purchase price was $125.0 million, free of debt and inclusive of expenses paid, and a final post-closing working capital adjustment of $0.3 million, which was received by the Company in the first quarter of 2009. The acquisition was financed by borrowings from the Company’s existing credit facility.
During 2008 the Company performed a purchase price allocation related to the acquisition, which resulted in the recording of $42.6 million of tax-deductible goodwill and $62.2 million of identifiable intangible assets. Of the $62.2 million of acquired intangible assets, $29.9 million was assigned to customer lists (10-year life) and $22.5 million was assigned to trademarks, which are not subject to amortization as they have indefinite lives. The remaining $9.8 million of acquired intangible assets include a non-compete agreement of $3.7 million (7-year life), a license arrangement of $3.4 million (9-year life) and developed technology of $2.7 million (9-year life). Excluding the trademarks, which are not subject to amortization, the intangible assets have a weighted-average useful life of approximately 10 years.
The supplemental cash flow information of the business acquired is as follows:
| ($ in millions) | |||
| Working Capital |
$ | 16.4 | |
| Property, plant and equipment, net |
3.8 | ||
| Intangible assets |
62.2 | ||
| Goodwill. |
42.6 | ||
| Cash paid |
$ | 125.0 | |
Supplemental Pro Forma Information
The table below presents unaudited pro forma financial information in connection with the Advantis acquisition as if it had occurred on January 1, 2007 and 2008. The unaudited pro forma information is presented for illustrative purposes only and is not necessarily indicative of the operating results or financial position that would have occurred if the acquisition had been completed at the dates indicated. The unaudited pro forma information reflects pro forma adjustments which are based upon currently available information and certain estimates and assumptions, and therefore the actual results may differ from the pro forma results. However, management believes that the assumptions provide a reasonable basis for presenting the significant effects of the transaction, and that the pro forma adjustments give appropriate effect to those assumptions and are properly applied in the pro forma financial information. The information does not necessarily indicate the future operating results or financial position of the Company. The Advantis business is seasonal in nature as its products are primarily used in the U.S. residential pool, spa and surface water treatment markets.
100
Table of Contents
The impact of any revenue and cost synergies that may result from the acquisition are not included in the pro forma results.
| ($ in millions, except per share amounts) | Twelve Months Ended December 31, | |||||
| 2008 | 2007 | |||||
| Sales |
$ | 1,547.0 | $ | 1,558.8 | ||
| Income from continuing operations |
$ | 35.6 | $ | 48.9 | ||
| Net Income |
$ | 35.6 | $ | 34.9 | ||
| Basic income per common share |
||||||
| Continuing operations |
$ | 1.43 | $ | 1.99 | ||
| Net Income |
$ | 1.43 | $ | 1.42 | ||
| Diluted income per common share |
||||||
| Continuing operations |
$ | 1.43 | $ | 1.98 | ||
| Net Income |
$ | 1.43 | $ | 1.41 | ||
KAWP
On July 5, 2007, the Company completed the acquisition of the remaining 51 percent share of its Australian joint venture, KAWP. KAWP produces and markets a full line of wood preservative products tailored for the wood processing and forestry industries in Australia, New Zealand, South Africa, Asia and the Pacific Islands.
The purchase price was $19.0 million, consisting of a cash payment of $15.5 million and the assumption of 51 percent of the joint venture net debt of $6.8 million. Additionally, the purchase agreement included a working capital adjustment. The purchase price, net of the working capital adjustment, was paid during 2007. The acquisition was financed from available cash.
Annual sales for KAWP for the year ended December 31, 2007 was $62.2 million. Net income for the year ended December 31, 2007 was $1.7 million. Prior to the acquisition, the Company recorded its proportionate share of the results of operations of this joint venture as a component of Equity in Earnings of Affiliated Companies in the Consolidated Income Statement. As of July 5, 2007, the Company has consolidated the balance sheet and effectively eliminated the investment of the affiliated company from its consolidated balance sheet.
During 2008, the Company completed its purchase price allocation related to the acquisition of KAWP, which primarily resulted in the recording of $8.5 million of identifiable intangible assets, $2.4 million of contingent liabilities and an $0.8 million increase in the value of property, plant and equipment. These assets have been reclassified from the original goodwill balance. Of the $8.5 million of acquired intangible assets, $4.2 million was assigned to trademarks, which are not subject to amortization as they have indefinite lives. The remaining $4.3 million of acquired intangible assets include customer lists of $4.1 million (15-year life) and non-compete agreements of $0.2 million (3-year life).
The supplemental cash flow information, which includes the final working capital adjustment, of the business acquired is as follows:
| ($ in millions) | ||||
| Working Capital (including cash) |
$ | 12.1 | ||
| Property, plant and equipment, net |
4.1 | |||
| Intangible assets |
8.5 | |||
| Goodwill. |
6.9 | |||
| Non-Current Assets and Liabilities (including debt). |
(10.5 | ) | ||
| Investment & Advances—Affiliated Companies at Equity. |
(5.6 | ) | ||
| Cash paid |
$ | 15.5 | ||
101
Table of Contents
Nordesclor
On December 28, 2005, the Company completed the acquisition of the remaining 50 percent share of its HTH water products joint venture, Nordesclor. The total purchase price, net of cash received, was $16.8 million, inclusive of expenses paid and a working capital adjustment, which was paid in 2006. The purchase price was further subject to a contingent payment based on cumulative earnings over the next year. During 2007, the Company made the first installment of the contingent payment of $0.3 million. During 2008, the Company made the final installment of the contingent payment of $0.2 million. The acquisition was financed through local borrowings and available cash.
| 20. | Commitments and Contingencies |
Leases
The Company leases certain properties, such as manufacturing, warehousing and office space and data processing and office equipment. Leases covering these properties may contain escalation clauses based on increased costs of the lessor, primarily property taxes, maintenance and insurance and have renewal or purchase options. Total rent expense charged to operations amounted to $19.2 million in 2009, $18.0 million in 2008 and $15.8 million in 2007 (sublease income and contingent rent expense is not significant).
Future minimum rent payments under operating leases having initial or remaining noncancelable lease terms in excess of one year at December 31, 2009 are as follows: $11.5 million in 2010; $8.9 million in 2011; $7.3 million in 2012; $6.7 million in 2013; $6.5 million in 2014 and $7.4 million thereafter.
Litigation
There are a variety of non-environmental legal proceedings pending or threatened against the Company.
In May 2005, the Department of Commerce (“DOC”) assessed antidumping duties ranging from approximately 76% to 286% against Chinese producers of isos. The Company’s primary Chinese supplier of isos was subject to the 76% rate. As a result, upon importing isos from this supplier, the Company made cash deposits at the rate of 76% of the value of the imported product. At the request of the U.S. chlorinated isocyanurates (“isos”) producers and the Company’s supplier, the DOC conducted a review of the duty rate for the period of December 16, 2004 to May 31, 2006. Upon conclusion of its review, the DOC determined that the rate should be reduced to approximately 20%. As a result of the final determination and the revised rate, the Company recorded a net pre-tax benefit of $12.1 million in the fourth quarter of 2007. The net cash proceeds related to the ruling are expected to be approximately $11 million. The DOC’s determination was appealed to the Court of International Trade which has delayed the processing of the full refund the Company was expecting to receive. On July 13, 2009, the Court of International Trade issued its decision which required the DOC to review additional information and revise the rate accordingly. The DOC complied, but has asked the Court’s permission to continue its review. The revised rate could be favorable to the Company by up to $3 million and the Company expects a final ruling in 2010. The Company does not expect that the resolution of this matter will have a material adverse effect on the Company.
At the request of the Company’s supplier, the DOC also initiated an administrative review to determine the final rate for the period of June 1, 2006 through May 31, 2007, during which time the 76% rate also applied. The DOC has determined that the final rate for the Company’s supplier for this period should be reduced from 76% to less than 1%. As a result, the Company recorded a net pre-tax benefit of $12.7 million in the third quarter of 2008 (which included $1.2 million of interest income). An appeal is pending with the Court of International Trade contesting the DOC’s determination. The appeal is delaying the cash refund of the duty to the Company and may result in a change of the duty rate for this review period. The Company does not expect that the resolution of this matter will have a material adverse effect on the Company.
102
Table of Contents
At the request of the Company’s supplier, the DOC also initiated an administrative review to determine the final rate for the period of June 1, 2007 through May 31, 2008, during which time the Company paid duty rates of 76% for part of the period and 20% for the remainder of the period. During the fourth quarter of 2009, the DOC made its final determination that reduced the Company’s antidumping duty rate for the entire period to 20%. As a result of the final determination, the Company recorded a pre-tax benefit of $1.0 million in the fourth quarter of 2009. Since this determination was not appealed, the cash refund is expected to be received during 2010.
Based upon the final determination for the period of June 1, 2007 through May 31, 2008, the Company began paying cash deposits for imports at a rate of approximately 20% in December of 2009.
An administrative review has also commenced to determine the final rate for the period of June 1, 2008 to May 31, 2009.
Along with its primary Comprehensive General Liability (“CGL”) insurer, Arch Coatings France S.A. (“ACF”), a subsidiary of the Company, is a defendant in a lawsuit filed in France by a builder of pleasure boats. The suit alleges that the formulation of certain varnish coatings previously supplied by ACF for application to interior woodwork on approximately 5,200 boats made by plaintiff was defective in that, under certain conditions, the varnish will bubble and peel. As of December 31, 2009, the plaintiff had identified 545 boats in need of repair and the plaintiff claimed that it had expended €4.5 million (approximately $6.5 million) to repair 513 of those boats. There is no trial date set for this case, and a court-appointed expert is in the process of determining the technical cause of the problem, as well as the extent of the damages. In August 2008, ACF was advised by its primary CGL insurer that it was denying coverage for this loss. The Company has advised the insurer that it disagrees with its position and is currently evaluating its options. At December 31, 2009, ACF had €0.8 million (approximately $1.1 million) accrued for this matter. The Company believes the high end of the range of possible outcomes is €4.5 million (approximately $6.5 million). However, it is possible that the high end of the range could ultimately increase or decrease based upon the findings of the court-appointed expert. Due to the multiple variables involved in the case (i.e., the uncertainty surrounding the number of boats which were damaged, the costs to repair the damages, the cause of the alleged damage, the Company’s responsibility for the alleged costs of repair), it is currently not possible to make an estimate of any amount above the amount of the current stated claim. An unfavorable outcome related to this matter could have a material adverse effect on the Company’s results of operations and cash flows.
In December 2007, as a result of an income tax audit of Nordesclor, the Company was notified by the Brazilian tax authorities that the Company would be assessed R$4.9 million (approximately $2.8 million) for alleged tax deficiencies related to the 2002 tax year. In accordance with the purchase agreement that was signed in conjunction with the acquisition of Nordesclor, our former joint venture partner is responsible for approximately 50% of this assessment. The Company believes the deficiency notice is without merit and, in January 2008, the Company protested the assessment. The Company believes the resolution of this case is not likely to have a material adverse effect on its consolidated financial condition, cash flow or results of operations.
During 2003, the Company sold its sulfuric acid business. The Company has received a claim from the current owner of that business. The claimant asserts that, under certain provisions of the agreement for the sale of the business, the Company must indemnify the claimant for certain environmental penalties and compliance costs the claimant will incur under a settlement the claimant reached with the U.S. Environmental Protection Agency. The claimant alleges that such penalties and costs approximate $2.4 million. The Company is currently investigating the validity of the claimant’s assertions. The Company does not believe that the resolution of this matter is likely to have a material adverse effect on its consolidated financial condition, cash flow or results of operations.
Arch Wood Protection (NZ) Limited (“AWPNZ”) has been named as a defendant in a suit filed by one of its competitors. The suit alleges that AWPNZ and several other defendants are jointly and severally liable for
103
Table of Contents
defamatory statements made about a product of the competitor in that they secured, contributed to, or encouraged the publication of such statements. The plaintiff is seeking a total of NZ $7.5 million (approximately $5.3 million) in compensatory damages, as well as attorney’s fees and costs and other relief deemed appropriate by the court. The Company believes that the claims asserted against AWPNZ are without merit. The Company does not believe that the resolution of this matter is likely to have a material adverse effect on its consolidated financial condition, cash flow or results of operations.
The Company is being sued by the current owner of a former Hickson site in Italy for environmental contaminants on that site. The owner is seeking compensation of €2.2 million (approximately $3.2 million) for the remediation of the site. The matter is currently within the Italian court system. The Company has worked with the local authorities to resolve any risk based remediation issues at the site. Remediation actions were completed in 2008, and the Company believes that it has no further obligation at the site.
The Company has been notified by the Brazilian tax authorities of various assessments, totaling approximately R$9 million (approximately $5 million), related to alleged non-income tax deficiencies for tax years ranging from 1988 to 2003. The Company has recorded a liability of R$2.7 million (approximately $1.6 million) for any assessments for which it is probable that the Company will be unable to successfully defend itself. The Company believes that the remainder of the assessments are without merit and the Company does not believe that the resolution of these assessments is likely to have a material adverse effect on its consolidated financial condition, cash flow or results of operations.
There are fewer than ten CCA-related personal injury lawsuits in which the Company and/or one or more of the Company’s subsidiaries is named a defendant. Individuals in these lawsuits allege injury occurred as a result of exposure to CCA-treated wood. The Company does not believe the resolution of these pending cases is likely to have a material adverse effect on its consolidated financial condition, cash flow or results of operations. The Company has no CCA-related purported class action lawsuits pending against it, those lawsuits having been dismissed or otherwise resolved in prior years.
There are a variety of non-environmental legal proceedings pending or threatened against the Company. Those matters that are probable have been accrued for in the accompanying Consolidated Financial Statements. Any contingent amounts in excess of amounts accrued are not expected to have a material adverse effect on results of operations, financial position or liquidity of the Company.
Environmental
Olin and the Company have entered into an agreement, which specifies that the Company is only responsible for certain environmental liabilities at the Company’s then current operating plant sites and certain offsite locations. Olin retained the liability for all former Olin plant sites and former waste disposal sites. The Company has also become subject to environmental exposures and potential liabilities in the U.S. and abroad with respect to the businesses it purchased. In connection with the acquisitions of Hickson International and KAWP, the Company acquired certain environmental exposures and potential liabilities of current and past operation sites which have been accrued for in the accompanying consolidated financial statements.
In connection with the disposition of the majority of the microelectronic materials business on November 30, 2004, the Company provided indemnification for potential environmental liabilities. For identified environmental liabilities as of the transaction date, there is no limit to the liability retained by the Company. The Company estimates such potential liability to be less than $1.0 million. For other pre-closing environmental liabilities the purchaser was liable over a five-year period from the closing date, which ended on November 30, 2009.
104
Table of Contents
In connection with the disposition of the sulfuric acid business on July 2, 2003, the Company provided environmental covenants to the purchaser in which the Company is solely liable for the costs of any environmental claim for remediation of any hazardous substances that were generated, managed, treated, stored or disposed of prior to the closing date of the sale. The Company will be released, under the sales agreement, from its obligation, which cannot exceed $22.5 million, 20 years from the closing date. See “Litigation” for a discussion of a claim from the current owner of the business.
As part of the Hickson organics disposition in August 2003, the Company continues to be responsible for known environmental matters at the Castleford, England site. Such matters have previously been accrued for in its environmental reserve included in the consolidated financial statements. Additionally, regarding any unknown environmental matters that are identified subsequent to the sale, the Company has agreed to share responsibility with the purchaser over a seven-year period, with the Company’s share decreasing to zero over the seven-year period. The Company’s maximum aggregate liability for such unknown environmental matters is £5.0 million. However, in September 2005, the purchaser went into liquidation and is highly unlikely to be able to honor its environmental indemnification commitments to the Company. The Company does not believe there has been any change in its environmental exposure at the site.
The Company does not anticipate that the environmental indemnifications for the microelectronic materials, sulfuric acid and Hickson organics dispositions will have a material adverse effect on its consolidated financial condition, cash flow or results of operations.
The Company’s Consolidated Balance Sheets included liabilities for future environmental expenditures to investigate and remediate known sites amounting to $8.2 million and $7.1 million at December 31, 2009 and 2008, respectively. The Company’s estimated environmental liability relates to 15 sites, seven of which are in the United States and none of which are on the U.S. National Priority List. These amounts did not take into account any discounting of future expenditures, any consideration of insurance recoveries or any advances in technology. These liabilities are reassessed periodically to determine if environmental circumstances have changed or if the costs of remediation efforts can be better estimated. As a result of these reassessments, future charges to income may be made for additional liabilities.
Environmental exposures are difficult to assess for numerous reasons, including the identification of new sites, developments at sites resulting from investigatory studies and remedial activities, advances in technology, changes in environmental laws and regulations and their application, the scarcity of reliable data pertaining to identified sites, the difficulty in assessing the involvement and financial capability of other potentially responsible parties and the Company’s ability to obtain contributions from other parties and the lengthy time periods over which site remediation occurs. It is possible that some of these matters (the outcomes of which are subject to various uncertainties) may be resolved unfavorably against the Company. At December 31, 2009, the Company had estimated additional contingent environmental liabilities of approximately $9 million.
| 21. | U.S. Government Contract |
On March 29, 2005, the Company was notified by the U.S. Defense Energy Support Center (“DESC”) that it had been awarded a 20-year hydrazine propellant supply contract for approximately $149 million for the production, storage, distribution and handling of hydrazine propellants for the U.S. Government. The Company began receiving monthly maintenance fee payments in the first quarter of 2006. Production is scheduled to begin in 2010.
In 2009, 2008 and 2007, the Company’s Performance Products segment sales include $7.8 million, $7.4 million, $7.9 million, respectively, related to these agreements.
The Company’s previous supply contract included a storage and distribution services agreement with the U.S. Government. At the completion of the contract, there was a final payment due of $13.4 million from the U.S. Government upon non-renewal. In 2007, the Company began the shutdown of the site and the necessary
105
Table of Contents
decommission, demolition and severance and recorded an estimated liability for these costs of $0.6 million. As a result, the Company recorded the gain, net of expenses, of $12.8 million as a component of Other (gains) and losses in the Company’s 2007 Consolidated Statement of Income. During 2008 the Company completed the shutdown of the site and as a result recorded a $0.4 million gain in Other (gains) and losses from a revised estimate of the total shutdown costs.
| 22. | Restructuring and Other Expense and Other (Gains) and Losses |
Restructuring and Other Expense
Included in Restructuring and other expense during 2009 is a $1.1 million charge related to executive severance.
Included in Restructuring and other expense during 2008 is a $1.3 million cash charge related to a pension settlement associated with executive severance recorded in 2007. The Company recorded a charge of approximately $0.9 million related to this severance in 2007.
On April 30, 2007, the Company decided to discontinue the manufacturing of its BIT molecule and begin sourcing from third-party suppliers in an effort to reduce the overall cost of certain of its products in the industrial biocides business. The Company continued to produce formulations containing BIT in both the United States and England for global end-market uses. As a result of this decision, the Company closed its Seal Sands, England manufacturing location and downsized manufacturing at its Huddersfield, England location. This resulted in the termination of approximately 40 employees as well as termination of several service agreements. During 2007, the Company recorded a pre-tax charge of $16.4 million. $0.4 million of the pre-tax charge relates to inventory disposal costs and is included in Cost of goods sold in the accompanying Consolidated Statements of Income. The charge during 2007 included a non-cash portion which was associated with the impairment of the manufacturing assets. At December 31, 2009, the Company had a liability of $0.2 million recorded on its Consolidated Balance Sheet related to this restructuring.
The following table summarizes the activity related to the restructuring costs:
| ($ in millions) | Severance Costs |
Asset Write-downs |
Other Costs |
Total | ||||||||||||
| Provision |
$ | 4.9 | $ | 7.9 | $ | 3.6 | $ | 16.4 | ||||||||
| Payments |
(4.6 | ) | — | (2.0 | ) | (6.6 | ) | |||||||||
| Utilized |
— | (7.9 | ) | (0.5 | ) | (8.4 | ) | |||||||||
| Balance at December 31, 2007 |
0.3 | — | 1.1 | 1.4 | ||||||||||||
| Payments |
(0.3 | ) | — | (0.5 | ) | (0.8 | ) | |||||||||
| Foreign Exchange |
— | — | (0.2 | ) | (0.2 | ) | ||||||||||
| Balance at December 31, 2008 |
— | — | 0.4 | 0.4 | ||||||||||||
| Payments |
— | — | (0.2 | ) | (0.2 | ) | ||||||||||
| Balance at December 31, 2009 |
$ | — | $ | — | $ | 0.2 | $ | 0.2 | ||||||||
Other (Gains) and Losses
Other (gains) and losses in 2008 is principally comprised of a reversal of penalties and interest related to a Brazilian state import tax claim recorded in 2004 of $1.4 million due to the expiration of the statute of limitations.
Other (gains) and losses in 2007 primarily represents a gain for the completion of a contract with the U.S. Government of $13.4 million (see Note 21), offset by estimated shutdown costs of $0.6 million. During 2008 the Company changed its estimate of the total shutdown costs and recorded a $0.4 million gain in Other (gains) and losses.
106
Table of Contents
| 23. | Fair Value Measurements |
Effective January 1, 2009, the Company adopted the updated guidance in FASB ASC 820 for non-financial instruments that are recognized or disclosed in the financial statements at fair value on a non-recurring basis. Although such adoption did not have a material impact on the Company’s consolidated financial statements during 2009, the pronouncement may impact the Company’s accounting for future business combinations, impairment charges and restructuring charges.
FASB ASC 820 establishes a new framework for measuring fair value and expands related disclosures. The framework requires fair value to be determined based on the exchange price that would be received for an asset or paid to transfer a liability (an exit price) in the principal or most advantageous market for the asset or liability in an orderly transaction between market participants.
The valuation techniques required by FASB ASC 820 are based upon observable and unobservable inputs. Observable inputs reflect market data obtained from independent sources, while unobservable inputs reflect the Company’s market assumptions. These two types of inputs create the following fair value hierarchy:
| • | Level 1 – Quoted prices (unadjusted) for identical assets and liabilities in active markets that the Company has the ability to access at the measurement date. |
| • | Level 2 – Quoted prices for similar assets and liabilities in active markets; quoted prices for identical or similar assets and liabilities in markets that are not active; and inputs other than quoted prices that are observable for the asset or liability, including interest rates, yield curves and credit risks, or inputs that are derived principally from or corroborated by observable market data through correlation. |
| • | Level 3 – Significant inputs to the valuation model are unobservable and are primarily based on internally derived assumptions surrounding the timing and amount of expected cash flows. |
The following section describes the valuation methodologies the Company uses to measure different assets and liabilities at fair value.
Rabbi Trust and Deferred Compensation Liability
All investments in the Company’s Rabbi Trust are recorded at fair value, except for the Company’s common stock, which is recorded at cost. Additionally, the related deferred compensation liability is recorded at fair value. The Company uses market prices to determine the fair values of these investments and the deferred compensation liability. The investments and the deferred compensation liability are included in Level 1.
Derivatives
The Company has foreign currency forward contracts, cross-currency swaps, interest rate swaps and equity total return swaps recorded at fair value. The fair value for the foreign currency forward contracts uses prices from active over-the-counter markets. The cross-currency swap agreements are valued using models which are based on market observable inputs, including foreign currency spot rates. The interest rate swap agreements are valued using models which are based on market observable inputs, including yield curves. The Company’s equity total return swap agreements are also valued using models which are based on market observable inputs. All derivatives are included in Level 2.
Securitization
Under the Company’s amended securitization program, the Company records receivables for which payment of the purchase price by Market Street Funding LLC has been deferred, at fair value as a Short-Term Investment on the accompanying Consolidated Balance Sheets. Such fair value includes a reserve for credit losses. The receivables are not discounted due to the short-term nature of the underlying financial assets. The Short-Term Investment is included in Level 2.
107
Table of Contents
The following table displays, by level, the fair values of each of the Company’s assets and liabilities that are measured at fair value on a recurring basis at December 31, 2009:
| ($ in millions) | Level 1 | Level 2 | Level 3 | Total | ||||||||
| Assets |
||||||||||||
| Investments in the Rabbi Trust which are recorded at fair value |
$ | 8.8 | $ | — | $ | — | $ | 8.8 | ||||
| Short-Term Investment |
— | — | 76.0 | 76.0 | ||||||||
| Derivatives |
— | 2.6 | — | 2.6 | ||||||||
| Total Assets |
$ | 8.8 | $ | 2.6 | $ | 76.0 | $ | 87.4 | ||||
| Liabilities |
||||||||||||
| Deferred Compensation |
$ | 12.4 | $ | — | $ | — | $ | 12.4 | ||||
| Derivatives |
— | 1.8 | — | 1.8 | ||||||||
| Total Liabilities |
$ | 12.4 | $ | 1.8 | $ | — | $ | 14.2 | ||||
The following table displays, by level, the fair values of each of the Company’s assets and liabilities that are measured at fair value on a recurring basis at December 31, 2008:
| ($ in millions) | Level 1 | Level 2 | Level 3 | Total | ||||||||
| Assets |
||||||||||||
| Investments in the Rabbi Trust which are recorded at fair value |
$ | 7.7 | $ | — | $ | — | $ | 7.7 | ||||
| Derivatives |
— | 0.6 | — | 0.6 | ||||||||
| Total Assets |
$ | 7.7 | $ | 0.6 | $ | — | $ | 8.3 | ||||
| Liabilities |
||||||||||||
| Deferred Compensation |
$ | 8.5 | $ | — | $ | — | $ | 8.5 | ||||
| Derivatives |
— | 2.8 | — | 2.8 | ||||||||
| Total Liabilities |
$ | 8.5 | $ | 2.8 | $ | — | $ | 11.3 | ||||
| 24. | Quarterly Financial Data (Unaudited) |
| ($ in millions, except per share amounts) | First Quarter |
Second Quarter |
Third Quarter |
Fourth Quarter |
Year | |||||||||||
| 2009 |
||||||||||||||||
| Sales |
$ | 293.7 | $ | 414.2 | $ | 350.5 | $ | 333.5 | $ | 1,391.9 | ||||||
| Gross margin (a) |
88.6 | 131.7 | 100.4 | 91.9 | 412.6 | |||||||||||
| Net income (a) |
3.2 | 30.9 | 10.3 | 2.7 | 47.1 | |||||||||||
| Diluted income per share |
0.13 | 1.23 | 0.41 | 0.11 | 1.88 | |||||||||||
| Stock market price: |
||||||||||||||||
| High |
26.38 | 29.92 | 32.22 | 31.31 | 32.22 | |||||||||||
| Low |
15.00 | 18.42 | 22.38 | 25.95 | 15.00 | |||||||||||
| Close (at end of quarter) |
18.96 | 24.59 | 29.99 | 30.88 | 30.88 | |||||||||||
| Common dividend paid per share |
0.20 | 0.20 | 0.20 | 0.20 | 0.80 | |||||||||||
| 2008 |
First Quarter |
Second Quarter |
Third Quarter |
Fourth Quarter |
Year | |||||||||||
| Sales |
$ | 347.1 | $ | 469.6 | $ | 367.9 | $ | 307.5 | $ | 1,492.1 | ||||||
| Gross margin |
93.7 | 136.7 | 109.2 | 89.2 | 428.8 | |||||||||||
| Net income (loss) (b) |
5.7 | 33.2 | 17.0 | (18.9 | ) | 37.0 | ||||||||||
| Diluted income (loss) per share |
0.23 | 1.33 | 0.68 | (0.75 | ) | 1.49 | ||||||||||
| Stock market price: |
||||||||||||||||
| High |
38.55 | 40.75 | 43.01 | 35.65 | 43.01 | |||||||||||
| Low |
30.35 | 32.63 | 29.47 | 20.54 | 20.54 | |||||||||||
| Close (at end of quarter) |
37.26 | 33.15 | 35.30 | 26.07 | 26.07 | |||||||||||
| Common dividend paid per share |
0.20 | 0.20 | 0.20 | 0.20 | 0.80 | |||||||||||
108
Table of Contents
| (a) | Gross margin and net income in the fourth quarter of 2009 includes a $2.9 million pre-tax benefit related to a LIFO decrement. |
| (b) | Net income in the fourth quarter of 2008 includes the $24.6 million impairment to the industrial coatings goodwill. |
| 25. | Subsequent Event |
In February 2010, the Company signed a definitive agreement to sell substantially all of its industrial coatings business to Sherwin-Williams Company. The purchase price will be approximately 40 million euros (approximately $54 million), and is subject to a post-closing working capital adjustment. The transaction is targeted to close on March 31, 2010 and is subject to customary closing conditions. The Company expects the transaction to result in a breakeven to a modest pre-tax gain. Proceeds from the sale will be used for general corporate purposes. The business had sales for the twelve months ended December 31, 2009 of $147.1 million, and an operating loss of approximately $2 million, which included an allocation of corporate expenses. The Company does not expect the conclusion of this transaction to have a material impact to earnings from continuing operations in 2010. Further relevant financial information will be disclosed subsequent to the closing of this transaction.
| Item 9. | Changes in and Disagreements with Accountants on Accounting and Financial Disclosure |
Not Applicable.
| Item 9A. | Controls and Procedures |
As of the end of the period covered by this Report, the Company conducted an evaluation, under the supervision and with the participation of the Company’s chief executive officer and chief financial officer, of the effectiveness of the Company’s disclosure controls and procedures as defined in Rule 13a-15(e) and 15d-15(e) under the Securities Exchange Act of 1934, as amended (the “Exchange Act”). Based on this evaluation, as of December 31, 2009, the Company’s chief executive officer and chief financial officer concluded that as of the end of such period such disclosure controls and procedures were effective to provide reasonable assurance that they were designed to ensure that information required to be disclosed by the Company in reports it files or submits under the Exchange Act (i) is recorded, processed, summarized and reported within the time period specified in the rules and forms of the Securities and Exchange Commission and (ii) is accumulated and communicated to its management, including its principal executive and principal financial officers, or persons performing similar functions, as appropriate to allow timely decisions regarding required disclosure.
There were no changes in the Company’s internal control over financial reporting (as defined in Rule 13a-15(f) and 15d-15(f) promulgated under the Exchange Act) during the three months ending December 31, 2009 that materially affected, or are reasonably likely to materially affect, the Company’s internal control over financial reporting.
109
Table of Contents
MANAGEMENT REPORT
Management is responsible for the preparation and integrity of the Consolidated Financial Statements appearing in this Annual Report. The Consolidated Financial Statements were prepared in conformity with accounting principles generally accepted in the United States and include amounts based on management’s estimates and judgments.
Management is also responsible for establishing and maintaining an adequate system of internal control over financial reporting as defined in Rules 13a-15(f) and 15d-l5(f) promulgated under the Securities Exchange Act of 1934. We maintain a system of internal controls that is designed to provide reasonable assurance as to the fair and reliable preparation and presentation of the Consolidated Financial Statements in accordance with generally accepted accounting principles, as well as to safeguard assets from unauthorized use or disposition.
Our control environment is the foundation for our system of internal control over financial reporting and is embodied in our Code of Conduct. Our internal control over financial reporting includes written policies and procedures that:
| • | pertain to the maintenance of records that, in reasonable detail, accurately and fairly reflect the transactions of the Company; |
| • | provide reasonable assurance that transactions are recorded as necessary to permit preparation of financial statements in accordance with generally accepted accounting principles; |
| • | provide reasonable assurance that receipts and expenditures of the Company are made in accordance with the appropriate authorization of management and the directors of the Company; and |
| • | provide reasonable assurance regarding prevention or timely detection of unauthorized acquisition, use or disposition of assets that could have a material effect on the consolidated financial statements. Internal control over financial reporting includes the controls themselves, monitoring and internal auditing practices and remedial actions to correct deficiencies as they are identified. |
Management evaluated the effectiveness of the Company’s internal control over financial reporting as of December 31, 2009. Management based such assessment upon the criteria set forth in Internal Control—Integrated Framework issued by the Committee of Sponsoring Organizations of the Treadway Commission. This evaluation included review of the documentation of controls, evaluation of the design effectiveness of controls, testing of the operating effectiveness of controls and a conclusion on this evaluation. Although there are inherent limitations in the effectiveness of any system of internal controls over financial reporting, based on our evaluation, we have concluded that our internal controls over financial reporting were effective as of December 31, 2009.
KPMG LLP, an independent registered public accounting firm, has audited the consolidated financial statements included in this Report and, as part of their audit, has issued their report, included herein in Item 8, on the effectiveness of our internal control over financial reporting.
| Michael E. Campbell Chairman of the Board, President and Chief Executive Officer |
Steven C. Giuliano Senior Vice President and Chief Financial Officer |
| Item 9B. | Other Information |
Not applicable.
110
Table of Contents
| Item 10. | Directors, Executive Officers and Corporate Governance |
The information relating to the members of our Board of Directors under the heading “Who are the persons nominated by the Board in this election to serve as directors?” and “Who are the other remaining directors and when are their terms scheduled to end?” in the section entitled “Item 1—Election of Directors” in the Proxy Statement relating to the Company’s 2010 Annual Meeting of Shareholders (the “Proxy Statement”) is incorporated by reference into this Report. See also the list of executive officers following Item 4 of this Report. The information regarding compliance with Section 16 of the Securities Exchange Act of 1934, as amended, under the heading “Section 16(a) Beneficial Ownership Reporting Compliance” in the section entitled “Security Ownership of Directors and Officers” in the Proxy Statement is incorporated by reference into this Report. The information under the heading “Has the Company adopted a Code of Ethics and a policy regarding approval of related party transactions?” in the section entitled “Additional Information Regarding the Board of Directors” in the Proxy Statement is incorporated by reference into this Report. The information under “Audit Committee” and “Committee Charters” under the heading “What are the committees of the Board” in the section entitled “Additional Information Regarding the Board of Directors” in the Proxy Statement is incorporated by reference into this Report.
| Item 11. | Executive Compensation |
The information in the sections entitled “Executive Compensation,” including the Compensation Committee Report, and “Director Compensation” in the Proxy Statement is incorporated by reference into this Report.
| Item 12. | Security Ownership of Certain Beneficial Owners and Management and Related Stockholder Matters |
The information concerning holdings of Company stock by certain beneficial owners contained in the section entitled “Certain Beneficial Owners” in the Proxy Statement and the information concerning beneficial ownership of the Company’s common stock by directors and officers of the Company in the section entitled “Security Ownership of Directors and Officers” in the Proxy Statement are incorporated by reference into this Report.
Equity Compensation Plan Information as of December 31, 2009
| Plan category |
Number of outstanding awards payable in shares, including options, deferred compensation and phantom share units(1) |
Weighted-average exercise price of outstanding options, warrants and rights(2) |
Number of securities remaining available for future issuance under equity compensation plans (excluding securities reflected in column(a))(3) | ||||
| (a) | (b) | (c) | |||||
| Equity compensation plans approved by security holders |
516,082 | $ | 19.40 | 1,511,035 | |||
| Equity compensation plans not approved by security holders |
0 | N/A | N/A | ||||
| Total |
516,082 | $ | 19.40 | 1,511,035 | |||
| (1) | This figure represents all outstanding grants, which consist of 167,661 stock options, 18,292 phantom shares payable in shares and held in director and employee deferral plans and 330,129 phantom share unit awards payable in shares. |
| (2) | This figure is calculated using only the stock options included in column (a) and no other grants. |
| (3) | Shares remaining available at December 31, 2009 for future issuance by plan are: 1,473,930 under the 2009 Long Term Incentive Plan, 20,356 under the 1999 Stock Plan for Non-Employee Directors and 16,749 under the Employee Deferral Plan. |
111
Table of Contents
| Item 13. | Certain Relationships and Related Transactions, and Director Independence |
The information under the headings “Has the Board of Directors adopted Principles of Corporate Governance?”, “What is the categorical independence standard used by the Board to determine whether Board members are independent?” and “Has the Company adopted a Code of Ethics and a policy regarding approval of related party transactions?” in the section entitled “Additional Information Regarding the Board of Directors” in the Proxy Statement is incorporated by reference into this Report.
| Item 14. | Principal Accountant Fees and Services |
The information contained under the headings “What were KPMG audit fees in 2008 and 2009?” and “Pre-Approval Policies and Provisions” in the section entitled “Item 3—Ratification of Appointment of Independent Registered Public Accounting Firm” in the Proxy Statement is incorporated by reference into this Report.
112
Table of Contents
| Item 15. | Exhibits and Financial Statement Schedules |
(a) 1. Financial Statements
The following is a list of the Financial Statements included in Item 8 of this Report:
2. Financial Statement Schedules
Except as noted below, schedules not included herein are omitted because they are inapplicable or not required or because the required information is given in the Consolidated Financial Statements and Notes thereto.
Separate financial statements of the remaining 50% or less owned companies accounted for by the equity method are not summarized herein and have been omitted because they would not constitute a significant subsidiary.
3. Exhibits
Management contracts and compensatory plans and arrangements are listed as Exhibits 10.6 through 10.19 below.
| 2.1 | Share Purchase Agreement, dated August 11, 2003, among Hickson Limited, Greentag (8) Limited, Hickson International Limited, Arch Chemicals, Inc. and Hickson & Welch Chemical Products Limited—Exhibit 2 to the Company’s Current Report on Form 8-K, filed August 18, 2003.* | |
| 2.2 | Restated Sale and Purchase Agreement dated as of 8th March 2004, among Avecia Investments Limited, the other parties thereto and Arch Chemicals, Inc., restating an agreement made between the parties on 4th March 2004—Exhibit 2.1 to the Company’s Current Report on Form 8-K, filed March 8, 2004.* | |
| 2.3 | Stock and Asset Purchase Agreement dated as of October 24, 2004 between Arch Chemicals, Inc. and Fuji Photo Film Co., Ltd.—Exhibit 2 to the Company’s Current Report on Form 8-K, filed October 25, 2004.* | |
| 2.4 | First Amendment dated as of November 30, 2004 to the Stock and Asset Purchase Agreement dated as of October 24, 2004 between Arch Chemicals, Inc. and Fuji Photo Film Co., Ltd.—Exhibit 2 to the Company’s Current Report on Form 8-K, filed December 6, 2004.* | |
| 2.5 | Asset Purchase Agreement, dated as of September 5, 2008, among Rockwood Specialties, Inc., Advantis Technologies, Inc., Arch Chemicals, Inc. and Rockwood Holdings Inc.—Exhibit 2.1 to the Company’s Current Report on Form 8-K, filed September 5, 2008.* | |
| 3.1 | Amended and Restated Articles of Incorporation of the Company—Exhibit 3.1 to the Company’s Current Report on Form 8-K, filed February 17, 1999.* | |
| 3.2 | Bylaws of the Company effective July 23, 2009—Exhibit 3 to the Company’s Current Report on Form 8-K, filed July 29, 2009.* | |
| * | Previously filed as indicated and incorporated herein by reference. Exhibits incorporated by reference are located in SEC File No. 1-14601 unless otherwise indicated. |
113
Table of Contents
| 4.1 | Specimen Common Share certificate—Exhibit 4.1 to the Company’s Registration Statement on Form 10, as amended.* | |
| 4.2 | Amended and Restated Articles of Incorporation of the Company (filed as Exhibit 3.1 hereto).* | |
| 4.3 | Bylaws of the Company (filed as Exhibit 3.2 hereto).* | |
| 4.4 | Revolving Credit Agreement, dated as of June 15, 2006 among Arch Chemicals, Inc., The Lenders Party hereto, JPMorgan Chase Bank, as Administrative Agent, J.P. Morgan Securities Inc., as Joint Lead Arranger and Joint Book Manager, Banc of America Securities, L.L.C., as Joint Lead Arranger and Joint Book Manager, SunTrust Bank, as Documentation Agent, and Bank of America, National Association and Citizens Bank of Massachusetts, as Co-Syndication Agents,—Exhibit 4 to the Company’s Current Report on Form 8-K filed June 20, 2006.* | |
| 4.5(a) | Note Purchase Agreement, dated as of March 20, 2002, among the Company and the purchasers named therein, relating to the Company’s $149,000,000 Senior Notes, Series A, due March 20, 2007 and $62,000,000 Senior Notes, Series B, due March 20, 2009—Exhibit 4.8 to the Company’s Annual Report on Form 10-K for the period ending December 31, 2001.* | |
| 4.5(b) | First Amendment entered into as of February 27, 2004 relating to the Note Purchase Agreement dated as of March 20, 2002 among the Company and the purchasers named therein, relating to the Company’s $149,000,000 Senior Notes, Series A, due March 20, 2007 and $62,000,000 Senior Notes, Series B, due March 20, 2009—Exhibit 4.2 to the Company’s Current Report on Form 8-K, filed March 8, 2004.* | |
| 4.5(c) | Second Amendment, dated as of May 12, 2006, to Note Purchase Agreement, dated as of March 20, 2002, among the Company and the purchasers named therein, relating to the Company’s $149,000,000 Senior Notes, Series A, due March 20, 2007 and $62,000,000 Senior Notes, Series B, due March 20, 2009—Exhibit 4 to the Company’s Quarterly Report on Form 10-Q for the period ending June 30, 2006.* | |
| 4.6(a) | Credit Agreement, dated as of February 13, 2009, among Arch Chemicals, Inc., the Lenders party thereto, Bank of America, N.A., as Administrative Agent, RBS Citizens, N.A., as Syndication Agent, Banc of America Securities LLC and Greenwich Capital Markets, Inc., as Joint Lead Arrangers and Joint Book Managers—Exhibit 10.1 to the Company’s Current Report on Form 8-K filed on February 17, 2009.* | |
| 4.6(b) | Schedule 2.01 to Credit Agreement, dated as of February 13, 2009, among Arch Chemicals, Inc., the Lenders Party Thereto, Bank of America, N.A., as Administrative Agent, RBS Citizens, N.A., as Syndication Agent, Banc of America Securities LLC and Greenwich Capital Markets, Inc., as Joint Lead Arrangers and Joint Book Managers—Exhibit 4 to the Company’s Quarterly Report on Form 10-Q for the period ending June 30, 2009.* | |
| 4.7 | Note Purchase and Private Shelf Agreement, dated as of August 28, 2009, among Arch Chemicals Inc., Prudential Investment Management, Inc., Gibraltar Life Insurance Co., Ltd, United of Omaha Life Insurance Company and Prudential Retirement Insurance and Annuity Company—Exhibit 10.1 to the Company’s Current Report on Form 8-K, filed on September 3, 2009.* | |
| 10.1 | Distribution Agreement, dated as of February 1, 1999, between the Company and Olin—Exhibit 2 to the Company’s Current Report on Form 8-K, filed February 17, 1999.* | |
| 10.2 | Form of Employee Benefits Allocation Agreement between the Company and Olin—Exhibit 10.4 to the Company’s Annual Report on Form 10-K for the period ending December 31, 1998.* | |
| 10.3 | Form of Intellectual Property Transfer and License Agreement between the Company and Olin—Exhibit 10.9 to the Company’s Registration Statement on Form 10, as amended.* | |
| 10.4 | Tax Sharing Agreement, dated as of February 8, 1999, between the Company and Olin—Exhibit 10.9 to the Company’s Annual Report on Form 10-K for the period ending December 31, 1998.* | |
| 10.5 | Charleston Services Agreement, dated as of February 8, 1999, between the Company and Olin—Exhibit 10.10 to the Company’s Annual Report on Form 10-K for the period ending December 31, 1998.* | |
| 10.6 | Form of Amended and Restated Executive Agreement—Exhibit 10.1 to the Company’s Current Report on Form 8-K, filed December 19, 2008.* | |
| 10.7 | Form of Change in Control Agreement (Tier II Agreement).—Exhibit 10.7 to the Company’s Annual Report on Form 10-K for the period ending December 31, 2008.* | |
| * | Previously filed as indicated and incorporated herein by reference. Exhibits incorporated by reference are located in SEC File No. 1-14601 unless otherwise indicated. |
114
Table of Contents
| 10.8 | Arch Chemicals, Inc. 1999 Stock Plan for Non-Employee Directors, as Amended and Restated through December 30, 2008—Exhibit 10.8 to the Company’s Annual Report on Form 10-K for the period ending December 31, 2008.* | |
| 10.9(a) | 1999 Long Term Incentive Plan, as amended through February 9, 2005—Exhibit 10.9 to the Company’s Annual Report on Form 10-K for the period ending December 31, 2004.* | |
| 10.9(b) | Award Description and Agreement for Performance Retention Share Awards Granted under the Arch Chemicals, Inc. 1999 Long Term Incentive Plan Granted January 28, 2009 for Senior Executive Officers—Exhibit 10.9(b) to the Company’s Annual Report on Form 10-K for the period ending December 31, 2008.* | |
| 10.9(c) | Award Description and Agreement for Performance Share Awards Granted under the Arch Chemicals, Inc. 1999 Long Term Incentive Plan Granted January 28, 2009 for Senior Executive Officers—Exhibit 10.9(c) to the Company’s Annual Report on Form 10-K for the period ending December 31, 2008.* | |
| 10.9(d) | Award Description and Agreement for Performance Retention Share Awards Granted under the Arch Chemicals, Inc. 1999 Long Term Incentive Plan Granted January 28, 2009 for Non-Senior Executive Officers and other participants—Exhibit 10.9(d) to the Company’s Annual Report on Form 10-K for the period ending December 31, 2008.* | |
| 10.9(e) | Award Description and Agreement for Performance Share Awards Granted under the Arch Chemicals, Inc. 1999 Long Term Incentive Plan Granted January 28, 2009 for Non-Senior Executive Officers and other participants—Exhibit 10.9(e) to the Company’s Annual Report on Form 10-K for the period ending December 31, 2008.* | |
| 10.9(f) | Award Description and Agreement for Performance Retention Share Awards Granted under the Arch Chemicals, Inc. 1999 Long Term Incentive Plan Granted March 5, 2008 to H. Anderson, M. E. Campbell, S. C. Giuliano, L. S. Massimo and S. A. O’Connor as Amended April 25, 2008—Exhibit 10.3 to Company’s Quarterly Report on Form 10-Q for the period ending March 31, 2008.* | |
| 10.9(g) | Award Description and Agreement for Performance Retention Share Awards Granted under the Arch Chemicals, Inc. 1999 Long Term Incentive Plan Granted March 5, 2008 as Amended April 25, 2008 (other than for H. Anderson, M. E. Campbell, S. C. Giuliano, L.S. Massimo and S. A. O’Connor)—Exhibit 10.4 to Company’s Quarterly Report on Form 10-Q for the period ending March 31, 2008.* | |
| 10.9(h) | Award Description and Agreement for Performance Share Awards Granted under the Arch Chemicals, Inc. 1999 Long Term Incentive Plan Granted March 5, 2008 to H. Anderson, M. E. Campbell, S. C. Giuliano, L. S. Massimo and S. A. O’Connor as Amended April 25, 2008—Exhibit 10.5 to Company’s Quarterly Report on Form 10-Q for the period ending March 31, 2008.* | |
| 10.9(i) | Award Description and Agreement for Performance Share Awards Granted under the Arch Chemicals, Inc. 1999 Long Term Incentive Plan Granted March 5, 2008 as Amended April 25, 2008 (other than for H. Anderson, M. E. Campbell, S. C. Giuliano, L.S. Massimo and S. A. O’Connor)—Exhibit 10.6 to Company’s Quarterly Report on Form 10-Q for the period ending March 31, 2008.* | |
| 10.9(j) | Form of Award Description and Agreement for Performance Retention Share Awards granted under the Arch Chemicals, Inc. 1999 Long Term Incentive Plan—Exhibit 10.19 to the Company’s Annual Report on Form 10-K for the period ending December 31, 2004.* | |
| 10.9(k) | Restricted Stock Unit Certificate and related Award Description and Agreement for Restricted Stock Unit Award Granted under the Arch Chemicals, Inc. 1999 Long Term Incentive Plan dated August 8, 2008 for Joseph Shaulson—Exhibit 10.9(l) to the Company’s Annual Report on Form 10-K for the period ending December 31, 2008.* | |
| 10.10 | 2009 Long Term Incentive Plan—Exhibit A to the Company’s Definitive Proxy Statement on Schedule 14A for the April 30, 2009 Annual Meeting of Shareholders.* | |
| 10.11 | Arch Chemicals, Inc. Supplemental Contributing Employee Ownership Plan, Amended and Restated as of January 1, 2009—Exhibit 10.10 to the Company’s Annual Report on Form 10-K for the period ending December 31, 2008.* | |
| * | Previously filed as indicated and incorporated herein by reference. Exhibits incorporated by reference are located in SEC File No. 1-14601 unless otherwise indicated. |
115
Table of Contents
| 10.12 | Arch Senior Executive Pension Plan, effective as of January 1, 2009—Exhibit 10.1 to the Company’s Current Report on Form 8-K, filed November 5, 2009.* | |
| 10.13 | Arch Supplementary and Deferral Benefit Pension Plan—Exhibit 10.2 to the Company’s Current Report on Form 8-K, filed November 5, 2009.* | |
| 10.14 | Arch Chemicals, Inc. Employee Deferral Plan, Amended and Restated as of January 1, 2009—Exhibit 10.13 to the Company’s Annual Report on Form 10-K for the period ending December 31, 2008.* | |
| 10.15 | Arch Senior Executive Pension Plan II, effective as of October 30, 2009. | |
| 10.16 | Senior Executive Life Insurance Plan (effective December 6, 2005)—Exhibit 10.3 to the Company’s Quarterly Report on Form 10-Q for the period ending September 30, 2005.* | |
| 10.17 | Arch Chemicals, Inc. Annual Incentive Plan, as amended December 9, 1999 and April 27, 2000—Exhibit 10.21 to the Company’s Annual Report on Form 10-K for the period ending December 31, 2000.* | |
| 10.18 | Arch Chemicals, Inc. Senior Management Incentive Compensation Plan (As Amended and Restated Effective January 1, 2010 for Awards Granted After December 31, 2009)—Exhibit 10.3 to the Company’s Current Report on Form 8-K, filed November 5, 2009.* | |
| 10.19 | Agreement between Arch Chemicals, Inc. and Louis S. Massimo, dated November 2, 2009—Exhibit 10.1 to the Company’s Current Report on Form 8-K, filed November 16, 2009.* | |
| 10.20(a) | Omnibus Assumption and Assignment Agreement, dated as of October 6, 2009, among Arch Chemicals Receivables Corp., Arch Chemicals, Inc., Three Pillars Funding LLC, SunTrust Robinson Humphrey, Inc. (f/k/a SunTrust Capital Markets, Inc.), Market Street Funding LLC and PNC Bank, National Association—Exhibit 10.1 to the Company’s Current Report on Form 8-K, filed October 9, 2009.* | |
| 10.20(b) | Amended and Restated Receivables Sale Agreement, dated as of October 6, 2009, among Arch Chemicals, Inc., as an Originator, Arch Treatment Technologies, Inc., as an Originator, Arch Wood Protection, Inc., as an Originator, Arch Personal Care Products, L.P., as an Originator, and Arch Chemicals Receivables Corp., as Buyer—Exhibit 10.2 to the Company’s Current Report on Form 8-K, filed October 9, 2009.* | |
| 10.20(c) | Amended and Restated Receivables Purchase Agreement, dated as of October 6, 2009, among Arch Chemicals Receivables Corp., as Seller, Arch Chemicals, Inc., as Initial Servicer, Market Street Funding LLC and PNC Bank, National Association, as Administrator and as LC Bank—Exhibit 10.3 to the Company’s Current Report on Form 8-K, filed October 9, 2009.* | |
| 21. | List of Subsidiaries. | |
| 23. | Consent of KPMG LLP. | |
| 31.1 | Certification of Chief Executive Officer pursuant to Rule 13a-14(a) or Rule 15d-14(a). | |
| 31.2 | Certification of Chief Financial Officer pursuant to Rule 13a-14(a) or Rule 15d-14(a). | |
| 32 | Certification of Chief Executive Officer and Chief Financial Officer pursuant to 18 U.S.C. 1350. | |
| * | Previously filed as indicated and incorporated herein by reference. Exhibits incorporated by reference are located in SEC File No. 1-14601 unless otherwise indicated. |
116
Table of Contents
SIGNATURES
Pursuant to the requirements of Section 13 or 15(d) of the Securities Exchange Act of 1934, the registrant has duly caused this report to be signed on its behalf by the undersigned, thereunto duly authorized.
| ARCH CHEMICALS, INC. | ||
| By | /s/ MICHAEL E. CAMPBELL | |
| Michael E. Campbell Chairman of the Board, President and Chief Executive Officer | ||
Date: February 19, 2010
Pursuant to the requirements of the Securities Exchange Act of 1934, this report has been signed below by the following persons on behalf of the registrant and in the capacities and on the date indicated.
| Signature |
Title | |
| /s/ MICHAEL E. CAMPBELL Michael E. Campbell |
Chairman of the Board, President, Chief Executive Officer and Director (Principal Executive Officer) | |
| /s/ RICHARD E. CAVANAGH Richard E. Cavanagh |
Director | |
| /s/ DAVID LILLEY David Lilley |
Director | |
| /s/ WILLIAM H. POWELL William H. Powell |
Director | |
| /s/ DANIEL S. SANDERS Daniel S. Sanders |
Director | |
| /s/ JANICE J. TEAL Janice J. Teal |
Director | |
| /s/ DOUGLAS J. WETMORE Douglas J. Wetmore |
Director | |
| /s/ STEVEN C. GIULIANO Steven C. Giuliano |
Senior Vice President and Chief Financial Officer (Principal Financial Officer) | |
| /s/ MEGHAN E. DEMASI Meghan E. DeMasi |
Controller (Principal Accounting Officer) | |
Date: February 19, 2010
117
Table of Contents

Printed on Recycled Paper