Attached files
| file | filename |
|---|---|
| EX-23 - EXHIBIT 23 - 1ST SOURCE CORP | ex23.htm |
| EX-31.1 - EXHIBIT 31.1 - 1ST SOURCE CORP | ex31_1.htm |
| EX-31.2 - EXHIBIT 31.2 - 1ST SOURCE CORP | ex31_2.htm |
| EX-32.1 - EXHIBIT 32.1 - 1ST SOURCE CORP | ex32_1.htm |
| EX-32.2 - EXHIBIT 32.2 - 1ST SOURCE CORP | ex32_2.htm |
| EX-99.2 - EXHIBIT 99.2 - 1ST SOURCE CORP | ex99_2.htm |
| EX-99.1 - EXHIBIT 99.1 - 1ST SOURCE CORP | ex99_1.htm |
UNITED
STATES
SECURITIES
AND EXCHANGE COMMISSION
Washington,
D.C. 20549
FORM
10-K
x ANNUAL REPORT PURSUANT
TO SECTION 13 OR 15(d)
OF
THE SECURITIES EXCHANGE ACT OF 1934
For
the fiscal year ended December 31, 2009
OR
o TRANSITION REPORT PURSUANT TO SECTION 13 OR
15(d)
OF THE SECURITIES EXCHANGE ACT OF
1934
For
the transition
from____________to____________
Commission
file number 0-6233

1ST
SOURCE CORPORATION
(Exact
name of registrant as specified in its charter)
|
Indiana
|
35-1068133
|
|
|
(State
or other jurisdiction of incorporation or organization)
|
(I.R.S.
Employer
Identification
No.)
|
|
100 North Michigan Street
|
||
|
South Bend, Indiana
|
46601
|
|
|
(Address
of principal executive offices)
|
(Zip
Code)
|
Registrant’s
telephone number, including area code: (574) 235-2000
Securities
registered pursuant to Section 12(b) of the Act:
|
Title of Class
|
Name of Each Exchange on Which
Registered
|
|
Common
Stock — without par value
|
The
NASDAQ Stock Market LLC
|
Securities
registered pursuant to Section 12(g) of the Act: None
Indicate
by check mark if the registrant is a well-known seasoned issuer, as defined in
Rule 405 of the Securities Act. Yes o
No x
Indicate
by check mark if the registrant is not required to file reports pursuant to
Section 13 or Section 15(d) of the Act. Yes o No x
Indicate
by check mark whether the registrant (1) has filed all reports required to be
filed by Section 13 or 15(d) of the Securities Exchange Act of 1934 during the
preceding 12 months (or for such shorter period that the registrant was required
to file such reports), and (2) has been subject to such filing requirements for
the past 90 days. Yes x
No o
Indicate by check mark whether the
registrant has submitted electronically and posted on its Web site, if any,
every Interactive Data File required to be submitted and posted pursuant to Rule
405 of Regulation S-T (§229.405 of this chapter) during the proceeding 12 months
(or for such shorter period that the registrant was required to submit and post
such files). Yes o
No o
Indicate
by check mark if disclosure of delinquent filers pursuant to Item 405 of
Regulation S-K is not contained herein, and will not be contained, to the best
of registrant’s knowledge, in definitive proxy or information statements
incorporated by reference in Part III of this Form 10-K or any amendment to this
Form 10-K. o
Indicate
by check mark whether the registrant is a large accelerated filer, an
accelerated filer, a non-accelerated filer, or a smaller reporting company. See
the definitions of “large accelerated filer,” “accelerated filer” and
“smaller reporting company” in Rule 12b-2 of the Exchange Act.
|
Large
accelerated filer
|
o |
Accelerated
filer
|
x |
Non-accelerated
filer
|
o |
Smaller
reporting company
|
o |
Indicate
by check mark whether the registrant is a shell company (as defined in Rule
12b-2 of the Act). Yes o No
x
The aggregate market value of the voting common stock held by non-affiliates of the registrant as of June 30, 2009 was $235,847,079
The
number of shares outstanding of each of the registrant’s classes of stock as of
February 15, 2010:
Common
Stock, without par value –– 24,283,209 shares
DOCUMENTS
INCORPORATED BY REFERENCE
Portions
of the annual proxy statement for the 2010 annual meeting of shareholders to be
held April 22, 2010, are incorporated by reference into Part III.
- 1
-
|
Part
I
|
||
|
Item
1.
|
3 | |
|
Item
1A.
|
7 | |
|
Item
1B.
|
10 | |
|
Item
2.
|
10 | |
|
Item
3.
|
10 | |
|
Item
4.
|
10 | |
|
Part
II
|
||
|
Item
5.
|
11 | |
|
Item
6.
|
12 | |
|
Item
7.
|
12 | |
|
Item
7A.
|
26 | |
|
Item
8.
|
27 | |
| 27 | ||
| 29 | ||
| 30 | ||
| 31 | ||
| 32 | ||
| 33 | ||
|
Item
9.
|
55 | |
|
Item
9A.
|
55 | |
|
Item
9B.
|
56 | |
|
Part
III
|
||
|
Item
10.
|
56 | |
|
Item
11.
|
56 | |
|
Item
12.
|
56 | |
|
Item
13.
|
56 | |
|
Item
14.
|
56 | |
|
Part
IV
|
||
|
Item
15.
|
57 | |
| 58 | ||
| Exhibit 23 | ||
| Exhibit 31.1 | ||
| Exhibit 31.2 | ||
| Exhibit 32.1 | ||
| Exhibit 32.2 | ||
| Exhibit 99.1 | ||
| Exhibit 99.2 | ||
Part
I
1st Source
Corporation
1st
Source Corporation, an Indiana corporation incorporated in 1971, is a bank
holding company headquartered in South Bend, Indiana that provides, through our
subsidiaries (collectively referred to as "1st Source"), a broad array of
financial products and services. 1st Source Bank ("Bank"), our banking
subsidiary, offers commercial and consumer banking services, trust and
investment management services, and insurance to individual and business clients
through most of our 76 banking center locations in 17 counties in Indiana and
Michigan. 1st Source Bank's Specialty Finance Group, with 23 locations
nationwide, offers specialized financing services for new and used private and
cargo aircraft, automobiles and light trucks for leasing and rental agencies,
medium and heavy duty trucks, construction equipment, and environmental
equipment. While concentrated in certain equipment types, we serve a diverse
client base. We are not dependent upon any single industry or client. At
December 31, 2009, we had consolidated total assets of $4.54 billion, loans and
leases of $3.09 billion, deposits of $3.65 billion, and total shareholders’
equity of $570.32 million.
Our
principal executive office is located at 100 North Michigan Street, South Bend,
Indiana 46601 and our telephone number is 574 235-2000. Access to our annual
report on Form 10-K, quarterly reports on Form 10-Q, current reports on Form
8-K, and all amendments to those reports is available, free of charge, at
www.1stsource.com soon after the material is electronically filed with the
Securities and Exchange Commission (SEC).
1st Source
Bank
1st
Source Bank is a wholly owned subsidiary of 1st Source Corporation that offers a
broad range of consumer and commercial banking services through its lending
operations, retail branches, and fee based businesses.
Commercial, Agricultural, and Real
Estate Loans — 1st Source Bank provides commercial, small business,
agricultural, and real estate loans to primarily privately owned business
clients mainly located within our regional market area. Loans are made for a
wide variety of general corporate purposes, including financing for industrial
and commercial properties, financing for equipment, inventories and accounts
receivable, and acquisition financing. Other services include commercial leasing
and cash management services.
Consumer Services — 1st Source
Bank provides a full range of consumer banking services, including checking
accounts, on-line banking including bill payment, telephone banking, savings
programs, installment and real estate loans, home equity loans and lines of
credit, drive-through and night deposit services, safe deposit facilities,
automated teller machines, overdraft facilities, debit and credit card services,
financial literacy seminars and brokerage services.
Trust Services — 1st Source
Bank provides a wide range of trust, investment, agency, and custodial services
for individual, corporate, and not-for-profit clients. These services include
the administration of estates and personal trusts, as well as the management of
investment accounts for individuals, employee benefit plans, and charitable
foundations.
Specialty Finance Group
Services — 1st Source Bank, through its Specialty Finance
Group, provides a broad range of comprehensive equipment loan and
lease finance products addressing the financing needs of a broad array of
companies. This group can be broken down into five areas: auto and light trucks;
environmental equipment; medium and heavy duty trucks; new and used aircraft;
and construction equipment.
The auto
and light truck division consists of financings to automobile rental and leasing
companies, light truck rental and leasing companies, and special purpose
vehicles. The auto and light truck finance receivables generally range from
$100,000 to $14 million with fixed or variable interest rates and terms of one
to five years.
Environmental
equipment financing handles trash and recycling equipment for municipalities and
private businesses as well as equipment for landfills. Receivables generally
range from $50,000 to $4 million with fixed or variable interest rates and terms
of one to seven years.
The
medium and heavy duty truck division provides financing for highway tractors and
trailers and delivery trucks to the commercial trucking industry. Medium and
heavy duty truck finance receivables generally range from $500,000 to $9 million
with fixed or variable interest rates and terms of three to seven
years.
Aircraft
financing consists of financings for new and used general aviation aircraft for
private and corporate aircraft users, aircraft distributors and dealers, air
charter operators, air cargo carriers, and other aircraft operators. We have
selectively entered the business aircraft markets of Argentina, Brazil, Canada,
Luxembourg, Mexico and Uruguay on a limited basis where desirable aircraft
financing opportunities exist. Aircraft finance receivables generally range from
$500,000 to $14 million with fixed or variable interest rates and terms of one
to ten years.
Construction
equipment financing includes financing of equipment (i.e., asphalt and concrete
plants, bulldozers, excavators, cranes, and loaders, etc.) to the construction
industry. Construction equipment finance receivables generally range from
$100,000 to $14 million with fixed or variable interest rates and terms of three
to seven years.
We also
generate equipment rental income through the leasing of construction equipment,
various trucks, and other equipment to clients through operating
leases.
Specialty Finance Group
Subsidiaries
The
Specialty Finance Group also consists of separate wholly owned subsidiaries of
1st Source Bank which include: Michigan Transportation Finance Corporation, 1st
Source Specialty Finance, Inc., SFG Aircraft, Inc., 1st Source Intermediate
Holding, LLC, 1st Source Commercial Aircraft Leasing, Inc., and SFG Equipment
Leasing Corporation I.
First National Bank,
Valparaiso
First
National Bank, Valparaiso (First National) was a wholly owned subsidiary of 1st
Source Corporation that was acquired on May 31, 2007 for $134.19 million. On
June 6, 2008, First National was merged with 1st Source Bank.
Trustcorp Mortgage
Company
Trustcorp
Mortgage Company (Trustcorp) is a mortgage banking company and is a wholly owned
subsidiary of 1st Source Corporation. During 2007, its mortgage activity was
merged with 1st Source Bank and the company is now inactive.
1st Source Insurance,
Inc.
1st
Source Insurance, Inc. is a wholly owned subsidiary of 1st Source Bank that
provides insurance products and services to individuals and businesses covering
corporate and personal property, casualty insurance, and individual and group
health and life insurance. 1st Source Insurance, Inc. has seven
offices.
1st Source Corporation
Investment Advisors, Inc.
1st
Source Corporation Investment Advisors, Inc. (Investment Advisors) is a wholly
owned subsidiary of 1st Source Bank that provides investment advisory services
to trust and investment clients of 1st Source Bank. Investment
Advisorsis registered as an investment advisor with the Securities and
Exchange Commission under the Investment Advisors Act of 1940. Investment
Advisors serves strictly in an advisory capacity and, as such, does not hold any
client securities.
Other Consolidated
Subsidiaries
We have
other subsidiaries that are not significant to the consolidated
entity.
1st Source Capital Trust IV
and 1st Source Master Trust
Our
unconsolidated subsidiaries include 1st Source Capital Trust IV and 1st Source
Master Trust. These subsidiaries were created for the purposes of issuing $30.00
million and $57.00 million of trust preferred securities, respectively, and
lending the proceeds to 1st Source. We guarantee, on a limited basis, payments
of distributions on the trust preferred securities and payments on redemption of
the trust preferred securities. 1st Source Capital Trust II and 1st Source
Capital Trust III were dissolved during 2008.
Competition
The
activities in which we and the Bank engage in are highly competitive. Our
businesses and the geographic markets we serve require us to compete with other
banks, some of which are affiliated with large bank holding companies
headquartered outside of our principal market. We generally compete on the basis
of client service and responsiveness to client needs, available loan and deposit
products, the rates of interest charged on loans and leases, the rates of
interest paid for funds, other credit and service charges, the quality of
services rendered, the convenience of banking facilities, and in the case of
loans and leases to large commercial borrowers, relative lending
limits.
In
addition to competing with other banks within our primary service areas, the
Bank also competes with other financial service companies, such as credit
unions, industrial loan associations, securities firms, insurance companies,
small loan companies, finance companies, mortgage companies, real estate
investment trusts, certain governmental agencies, credit organizations, and
other enterprises.
Additional
competition for depositors’ funds comes from United States Government
securities, private issuers of debt obligations, and suppliers of other
investment alternatives for depositors. Many of our non-bank competitors are not
subject to the same extensive Federal regulations that govern bank holding
companies and banks. Such non-bank competitors may, as a result, have certain
advantages over us in providing some services.
We
compete against these financial institutions by being convenient to do business
with, and by taking the time to listen and understand our clients' needs. We
deliver personalized, one on one banking through knowledgeable local members of
the community, offering a full array of products and highly personalized
services. We rely on our history and our reputation in northern Indiana dating
back to 1863.
Employees
At
December 31, 2009, we had approximately 1,170 employees on a full-time
equivalent basis. We provide a wide range of employee benefits and consider
employee relations to be good.
Regulation and
Supervision
General — 1st Source and the
Bank are extensively regulated under Federal and State law. To the extent that
the following information describes statutory or regulatory provisions, it is
qualified in its entirety by reference to the particular statutory and
regulatory provisions. Any change in applicable laws or regulations may have a
material effect on our business and our prospective business. Our operations may
be affected by legislative changes and by the policies of various regulatory
authorities. We are unable to predict the nature or the extent of the effects on
our business and earnings that fiscal or monetary policies, economic controls,
or new Federal or State legislation may have in the future.
We are a
registered bank holding company under the Bank Holding Company Act of 1956
(BHCA) and, as such, we are subject to regulation, supervision, and examination
by the Board of Governors of the Federal Reserve System (Federal Reserve). We
are required to file annual reports with the Federal Reserve and to provide the
Federal Reserve such additional information as it may require.
1st
Source Bank, as an Indiana state bank and member of the Federal Reserve System,
is supervised by the Indiana Department of Financial Institutions (DFI) and the
Federal Reserve. As such, 1st Source Bank is regularly examined by and subject
to regulations promulgated by the DFI and the Federal Reserve. Because the
Federal Deposit Insurance Corporation (FDIC) provides deposit insurance to 1st
Source Bank, we are also subject to supervision and regulation by the FDIC (even
though the FDIC is not our primary Federal regulator).
Bank Holding Company Act —
Under the BHCA, as amended, our activities are limited to business so closely
related to banking, managing, or controlling banks as to be a proper incident
thereto. We are also subject to capital requirements applied on a consolidated
basis in a form substantially similar to those required of the Bank. The BHCA
also requires a bank holding company to obtain approval from the Federal Reserve
before (i) acquiring, or holding more than 5% voting interest in any bank or
bank holding company, (ii) acquiring all or substantially all of the assets of
another bank or bank holding company, or (iii) merging or consolidating with
another bank holding company.
The BHCA
also restricts non-bank activities to those which, by statute or by Federal
Reserve regulation or order, have been identified as activities closely related
to the business of banking or of managing or controlling banks. As discussed
below, the Gramm-Leach-Bliley Act, which was enacted in 1999, established a new
type of bank holding company known as a "financial holding company" that has
powers that are not otherwise available to bank holding companies.
Financial Institutions Reform,
Recovery and Enforcement Act of 1989 — The Financial Institutions Reform,
Recovery and Enforcement Act of 1989 (FIRREA) reorganized and reformed the
regulatory structure applicable to financial institutions
generally.
The Federal Deposit Insurance
Corporation Improvement Act of 1991 — The Federal Deposit Insurance
Corporation Improvement Act of 1991 (FDICIA) was adopted to supervise and
regulate a wide variety of banking issues. In general, FDICIA provides for the
recapitalization of the Bank Insurance Fund (BIF), deposit insurance reform,
including the implementation of risk-based deposit insurance premiums, the
establishment of five capital levels for financial institutions ("well
capitalized," "adequately capitalized," "undercapitalized," "significantly
undercapitalized," and "critically undercapitalized") that would impose more
scrutiny and restrictions on less capitalized institutions, along with a number
of other supervisory and regulatory issues. At December 31, 2009, the Bank was
categorized as "well capitalized," meaning that our total risk-based capital
ratio exceeded 10.00%, our Tier 1 risk-based capital ratio exceeded 6.00%, our
leverage ratio exceeded 5.00%, and we are not subject to a regulatory order,
agreement, or directive to meet and maintain a specific capital level for any
capital measure.
Federal Deposit Insurance Reform
Act — On February 1, 2006, Congress approved the Federal Deposit
Insurance Reform Act of 2005 (FDIRA). Among other things, the FDIRA provides for
the merger of the Bank Insurance Fund with the Savings Association Insurance
Fund and for an immediate increase in Federal deposit insurance for certain
retirement accounts up to $250,000. The statute further provides for the
indexing of the maximum deposit insurance coverage for all types of deposit
accounts in the future to account for inflation. The FDIRA also requires the
FDIC to provide certain banks and thrifts that were in existence prior to
December 31, 1996 with one-time credits against future premiums based on the
amount of their payments to the Bank Insurance Fund or Savings Association
Insurance Fund prior to that date.
FDIC Deposit Insurance
Assessments — On October 16, 2008, in response to the problems facing the
financial markets and the economy, the Federal Deposit Insurance Corporation
published a restoration plan (Restoration Plan) designed to replenish the
Deposit Insurance Fund (DIF) such that the reserve ratio would return to 1.15
percent within five years. On December 16, 2008, the FDIC adopted a final rule
increasing risk-based assessment rates uniformly by seven basis points, on an
annual basis, for the first quarter 2009.
On
February 27, 2009, the FDIC concluded that the problems facing the financial
services sector and the economy at large constituted extraordinary circumstances
and amended the Restoration Plan and extended the time within which the reserve
ratio would return to 1.15 percent from five to seven years (Amended Restoration
Plan). In May 2009, Congress amended the statutory provision governing
establishment and implementation of a Restoration Plan to allow the FDIC eight
years to bring the reserve ratio back to 1.15 percent, absent extraordinary
circumstances.
On May
22, 2009, the FDIC adopted a final rule imposing a five basis point special
assessment on each insured depository institution's assets minus Tier 1 capital
as of June 30, 2009. The special assessment was collected on September 30,
2009.
In a
final rule issued on September 29, 2009, the FDIC amended the Amended
Restoration Plan as follows:
|
·
|
The
period of the Amended Restoration Plan was extended from seven to eight
years.
|
|
·
|
The
FDIC announced that it will not impose any further special assessments
under the final rule it adopted in May 2009.
|
|
·
|
The
FDIC announced plans to maintain assessment rates at their current levels
through the end of 2010. The FDIC also immediately adopted a uniform three
basis point increase in assessment rates effective January 1, 2011 to
ensure that the DIF returns to 1.15 percent within the Amended Restoration
Plan period of eight years.
|
|
·
|
The
FDIC announced that, at least semi-annually following the adoption of the
Amended Restoration Plan, it will update its loss and income projections
for the DIF. The FDIC also announced that it may, if necessary, adopt a
new rule prior to the end of the eight-year period to increase assessment
rates in order to return the reserve ratio to 1.15
percent.
|
On
November 12, 2009, the FDIC adopted a final rule to require insured institutions
to prepay their quarterly risk-based deposit insurance assessments for the
fourth quarter of 2009, and for all of 2010, 2011 and 2012, on December 30,
2009. Our payment was $20.26 million.
Temporary Liquidity Guarantee
Program — On November 21, 2008, the FDIC Board of Directors adopted a
final rule implementing the Temporary Liquidity Guarantee Program (TLGP). The
TLGP consists of two basic components: a guarantee of newly issued senior
unsecured debt of banks, thrifts, and certain holding companies (the debt
guarantee program) and full guarantee of non-interest bearing deposit
transaction accounts, such as business payroll accounts, regardless of dollar
amount (the transaction account guarantee program). The purpose of the guarantee
of transaction accounts and the debt guarantee is to reduce funding costs and
allow banks and thrifts to increase lending to consumers and businesses. All
insured depository institutions were automatically enrolled in both programs
unless they elected to opt out by a specified date. 1st Source did not elect to
opt out and thus participates in both programs. On March 17, 2009, the FDIC
extended the debt guarantee portion of the TLGP from June 30, 2009 to October
31, 2009 and imposed a surcharge on debt issued with a maturity of one year or
more beginning in the second quarter to gradually phase out the program. The
transaction account guarantee program is in effect until June 30,
2010.
Emergency Economic Stabilization Act
of 2008 —
On October 3, 2008, President George W. Bush signed the Emergency
Economic Stabilization Act of 2008 (EESA). This Act temporarily raises the basic
limit on federal deposit insurance coverage from $100,000 to $250,000 per
depositor effective immediately. This temporary increase in the deposit
insurance limit expires on December 31, 2013.
Under the
Troubled Asset Relief Program established by EESA, the U.S. Treasury Department
announced a Capital Purchase Program (CPP). CPP is designed to encourage U.S.
financial institutions to build capital to increase the flow of financing to
U.S. businesses and consumers and support the U.S. economy. Under the program,
Treasury will purchase up to $250 billion of senior preferred shares on
standardized terms as described in the program's term sheet. The program is
available to qualifying U.S. controlled banks, savings associations, and certain
bank and savings and loan holding companies engaged only in financial activities
that elect submitted applications to Treasury by November 14, 2008. EESA
provides for Treasury to determine an applicant’s eligibility to participate in
the CPP after consulting with the appropriate federal banking
agency.
1st
Source submitted an application to participate in the CPP and obtained Treasury
approval on December 11, 2008. On January 23, 2009, 1st Source issued preferred
stock valued at $111.00 million and a warrant to acquire 837,947 shares of its
common stock to Treasury pursuant to the CPP. The warrant is exercisable at any
time during the ten-year period following issuance at an exercise price of
$19.87.
Securities and Exchange Commission
(SEC) and The Nasdaq Stock Market (Nasdaq) — We are under the
jurisdiction of the SEC and certain state securities commissions for matters
relating to the offering and sale of our securities and our investment advisory
services. We are subject to the disclosure and regulatory requirements of the
Securities Act of 1933, as amended, and the Securities Exchange Act of 1934, as
amended, as administered by the SEC. We are listed on the Nasdaq Global Select
Market under the trading symbol "SRCE," and we are subject to the rules of
Nasdaq for listed companies.
Riegle-Neal Interstate Banking and
Branching Efficiency Act of 1994 — Congress enacted the Riegle-Neal
Interstate Banking and Branching Efficiency Act of 1994 (Interstate Act) in
September 1994. Beginning in September 1995, bank holding companies have the
right to expand, by acquiring existing banks, into all states, even those which
had theretofore restricted entry. The legislation also provides that, subject to
future action by individual states, a holding company has the right to convert
the banks which it owns in different states to branches of a single bank. The
states of Indiana and Michigan have adopted the interstate branching provisions
of the Interstate Act.
Economic Growth and Regulatory
Paperwork Reduction Act of 1996 — The Economic Growth and Regulatory
Paperwork Reduction Act of 1996 (EGRPRA) was signed into law on September 30,
1996. Among other things, EGRPRA streamlined the non-banking activities
application process for well-capitalized and well-managed bank holding
companies.
Gramm-Leach-Bliley Act of 1999
— The Gramm-Leach-Bliley Act of 1999 (GLBA) is intended to modernize the banking
industry by removing barriers to affiliation among banks, insurance companies,
the securities industry, and other financial service providers. It provides
financial organizations with the flexibility of structuring such affiliations
through a holding company structure or through a financial subsidiary of a bank,
subject to certain limitations. The GLBA establishes a new type of bank holding
company, known as a financial holding company, which may engage in an expanded
list of activities that are "financial in nature," which include securities and
insurance brokerage, securities underwriting, insurance underwriting, and
merchant banking. The GLBA also sets forth a system of functional regulation
that makes the Federal Reserve the "umbrella supervisor" for holding companies,
while providing for the supervision of the holding company’s subsidiaries by
other Federal and state agencies. A bank holding company may not become a
financial holding company if any of its subsidiary financial institutions are
not well-capitalized or well-managed. Further, each bank subsidiary of the
holding company must have received at least a satisfactory Community
Reinvestment Act (CRA) rating. The GLBA also expands the types of financial
activities a national bank may conduct through a financial subsidiary, addresses
state regulation of insurance, generally prohibits unitary thrift holding
companies organized after May 4, 1999 from participating in new activities that
are not financial in nature, provides privacy protection for nonpublic customer
information of financial institutions, modernizes the Federal Home Loan Bank
system, and makes miscellaneous regulatory improvements. The Federal Reserve and
the Secretary of the Treasury must coordinate their supervision regarding
approval of new financial activities to be conducted through a financial holding
company or through a financial subsidiary of a bank. While the provisions of the
GLBA regarding activities that may be conducted through a financial subsidiary
directly apply only to national banks, those provisions indirectly apply to
state-chartered banks. In addition, the Bank is subject to other provisions of
the GLBA, including those relating to CRA and privacy, regardless of whether we
elect to become a financial holding company or to conduct activities through a
financial subsidiary. We do not, however, currently intend to file notice with
the Board to become a financial holding company or to engage in expanded
financial activities through a financial subsidiary.
Financial Privacy — In
accordance with the GLBA, Federal banking regulators adopted rules that limit
the ability of banks and other financial institutions to disclose non-public
information about customers to nonaffiliated third parties. These limitations
require disclosure of privacy policies to consumers and, in some circumstances,
allow consumers to prevent disclosure of certain personal information to a
nonaffiliated third party. The privacy provisions of the GLBA affect how
consumer information is transmitted through diversified financial companies and
conveyed to outside vendors.
USA Patriot Act of 2001 — The
USA Patriot Act of 2001 (USA Patriot Act) was signed into law following the
terrorist attacks of September 11, 2001. The USA Patriot Act is comprehensive
anti-terrorism legislation that, among other things, substantially broadened the
scope of anti-money laundering laws and regulations by imposing significant new
compliance and due diligence obligations on financial institutions.
The
regulations adopted by the United States Treasury Department under the USA
Patriot Act impose new obligations on financial institutions to maintain
appropriate policies, procedures and controls to detect, prevent and report
money laundering, and terrorist financing. Additionally, the regulations require
that we, upon request from the appropriate Federal regulatory agency, provide
records related to anti-money laundering, perform due diligence of private
banking and correspondent accounts, establish standards for verifying customer
identity, and perform other related duties.
Failure
of a financial institution to comply with the USA Patriot Act's requirements
could have serious legal and reputational consequences for the
institution.
Regulations Governing Capital
Adequacy — The Federal bank regulatory agencies use capital adequacy
guidelines in their examination and regulation of bank holding companies and
banks. If capital falls below the minimum levels established by these
guidelines, a bank holding company or bank will be required to submit an
acceptable plan for achieving compliance with the capital guidelines and will be
subject to denial of applications and appropriate supervisory enforcement
actions. The various regulatory capital requirements that we are subject to are
disclosed in Part II, Item 8, Financial Statements and Supplementary Data — Note
20 of the Notes to Consolidated Financial Statements. Our management believes
that the risk-weighting of assets and the risk-based capital guidelines do not
have a material adverse impact on our operations or on the operations of the
Bank.
Community Reinvestment Act —
The Community Reinvestment Act of 1977 requires that, in connection with
examinations of financial institutions within their jurisdiction, the Federal
banking regulators must evaluate the record of the financial institutions in
meeting the credit needs of their local communities, including low and moderate
income neighborhoods, consistent with the safe and sound operation of those
banks. Federal banking regulators are required to consider a financial
institution's performance in these areas as they review applications filed by
the institution to engage in mergers or acquisitions or to open a branch or
facility.
Regulations Governing Extensions of
Credit — 1st Source Bank is subject to certain restrictions imposed by
the Federal Reserve Act on extensions of credit to 1st Source or our
subsidiaries, or investments in our securities and on the use of our securities
as collateral for loans to any borrowers. These regulations and restrictions may
limit our ability to obtain funds from the Bank for our cash needs, including
funds for acquisitions and for payment of dividends, interest and operating
expenses. Further, the BHCA, certain regulations of the Federal Reserve, state
laws and many other Federal laws govern the extensions of credit and generally
prohibit a bank from extending credit, engaging in a lease or sale of property,
or furnishing services to a customer on the condition that the customer obtain
additional services from the bank’s holding company or from one of its
subsidiaries.
1st
Source Bank is also subject to certain restrictions imposed by the Federal
Reserve Act on extensions of credit to executive officers, directors, principal
shareholders, or any related interest of such persons. Extensions of credit (i)
must be made on substantially the same terms, including interest rates and
collateral, and subject to credit underwriting procedures that are at least as
stringent as those prevailing at the time for comparable transactions with non
affiliates, and (ii) must not involve more than the normal risk of repayment or
present other unfavorable features. The Bank is also subject to certain lending
limits and restrictions on overdrafts to such persons.
Reserve Requirements — The
Federal Reserve requires all depository institutions to maintain reserves
against their transaction account deposits. The Bank must maintain reserves of
3.00% against net transaction accounts greater than $10.70 million and up to
$44.50 million (subject to adjustment by the Federal Reserve) and reserves of
10.00% must be maintained against that portion of net transaction accounts in
excess of $44.50 million.
Dividends — The ability of the
Bank to pay dividends is limited by state and Federal Regulations that require
1st Source Bank to obtain the prior approval of the DFI before paying a dividend
that, together with other dividends it has paid during a calendar year, would
exceed the sum of its retained net income for the year to date combined with its
retained net income for the previous two years. The amount of dividends the Bank
may pay may also be limited by certain covenant agreements and by the principles
of prudent bank management. See Part II, Item 5, Market for
Registrant's Common Equity, Related Stockholder Matters and Issuer Purchases of
Equity Securities for further discussion of dividend limitations.
Monetary Policy and Economic
Control — The commercial banking business in which we engage is affected
not only by general economic conditions, but also by the monetary policies of
the Federal Reserve. Changes in the discount rate on member bank borrowing,
availability of borrowing at the "discount window," open market operations, the
imposition of changes in reserve requirements against member banks deposits and
assets of foreign branches, and the imposition of, and changes in, reserve
requirements against certain borrowings by banks and their affiliates are some
of the instruments of monetary policy available to the Federal Reserve. These
monetary policies are used in varying combinations to influence overall growth
and distributions of bank loans, investments, and deposits, and such use may
affect interest rates charged on loans and leases or paid on deposits. The
monetary policies of the Federal Reserve have had a significant effect on the
operating results of commercial banks and are expected to do so in the future.
The monetary policies of the Federal Reserve are influenced by various factors,
including inflation, unemployment, short-term and long-term changes in the
international trade balance, and in the fiscal policies of the U.S. Government.
Future monetary policies and the effect of such policies on our future business
and earnings, and the effect on the future business and earnings of the Bank
cannot be predicted.
Sarbanes-Oxley Act of 2002 —
On July 30, 2002, the Sarbanes-Oxley Act of 2002 (SOA) was signed into law. The
SOA's stated goals include enhancing corporate responsibility, increasing
penalties for accounting and auditing improprieties at publicly traded companies
and protecting investors by improving the accuracy and reliability of corporate
disclosures pursuant to the securities laws. The SOA generally applies to all
companies that file or are required to file periodic reports with the SEC under
the Securities Exchange Act of 1934 (Exchange Act.)
Among
other things, the SOA creates the Public Company Accounting Oversight Board as
an independent body subject to SEC supervision with responsibility for setting
auditing, quality control, and ethical standards for auditors of public
companies. The SOA also requires public companies to make faster and
more-extensive financial disclosures, requires the chief executive officer and
the chief financial officer of public companies to provide signed certifications
as to the accuracy and completeness of financial information filed with the SEC,
and provides enhanced criminal and civil penalties for violations of the Federal
securities laws.
The SOA
also addresses functions and responsibilities of audit committees of public
companies. The statute, by mandating certain stock exchange listing
rules, makes the audit committee directly responsible for the appointment,
compensation, and oversight of the work of the company's outside auditor, and
requires the auditor to report directly to the audit committee. The SOA
authorizes each audit committee to engage independent counsel and other
advisors, and requires a public company to provide the appropriate funding, as
determined by its audit committee, to pay the company's auditors and any
advisors that its audit committee retains. The SOA also requires public
companies to prepare an internal control report and assessment by management,
along with an attestation to this report prepared by the company's registered
public accounting firm, in their annual reports to stockholders.
Pending Legislation — Because
of concerns relating to competitiveness and the safety and soundness of the
banking industry, Congress often considers a number of wide-ranging proposals
for altering the structure, regulation, and competitive relationships of the
nation’s financial institutions. On December 11, 2009, the House of
Representatives passed the Wall Street Reform and Consumer Protection Act of
2009 (H.R. 3996) that, among other things, would create a Consumer Financial
Protection Agency, a new federal banking agency with the sole mission of
protecting consumers when they borrow money, make deposits, or obtain other
financial products and services. The bill also specifically targets systemic
risk within the financial system, focusing primarily on the potential harm that
regulatory gaps involving large, interconnected companies can pose to the
economy. We cannot predict whether or in what form Congress may adopt final
legislation incorporating the provisions of H.R. 3996, or whether it may adopt
other legislation, or the extent to which our business may be affected
thereby.
An
investment in our common stock is subject to risks inherent to our business. The
material risks and uncertainties that we believe affect us are described below.
See “Forward Looking Statements” under Item 7 of this report for a discussion of
other important factors that can affect our business.
Fluctuations
in interest rates could reduce our profitability and affect the value of our
assets — Like other financial institutions, we are subject to interest
rate risk. Our primary source of income is net interest income, which is the
difference between interest earned on loans and leases and investments, and
interest paid on deposits and borrowings. We expect that we will periodically
experience imbalances in the interest rate sensitivities of our assets and
liabilities and the relationships of various interest rates to each other. Over
any defined period of time, our interest-earning assets may be more sensitive to
changes in market interest rates than our interest-bearing liabilities, or
vice-versa. In addition, the individual market interest rates underlying our
loan and lease and deposit products may not change to the same degree over a
given time period. In any event, if market interest rates should move contrary
to our position, earnings may be negatively affected. In addition,
loan and lease volume and quality and deposit volume and mix can be affected by
market interest rates as can the businesses of our clients. Changes in levels of
market interest rates could have a material adverse affect on our net interest
spread, asset quality, origination volume, and overall
profitability.
Market
interest rates are beyond our control, and they fluctuate in response to general
economic conditions and the policies of various governmental and regulatory
agencies, in particular, the Federal Reserve Board. Changes in monetary policy,
including changes in interest rates, may negatively affect our ability to
originate loans and leases, the value of our assets and our ability to realize
gains from the sale of our assets, all of which ultimately could affect our
earnings.
Future
expansion involves risks — In the future, we may acquire all or part of
other financial institutions and we may establish de novo branch offices. There
could be considerable costs involved in executing our growth strategy. For
instance, new branches generally require a period of time to generate sufficient
revenues to offset their costs, especially in areas in which we do not have an
established presence. Accordingly, any new branch expansion could be expected to
negatively impact earnings for some period of time until the branch reaches
certain economies of scale. Acquisitions and mergers involve a number of risks,
including the risk that:
|
·
|
We
may incur substantial costs identifying and evaluating potential
acquisitions and merger partners, or in evaluating new markets, hiring
experienced local managers, and opening new offices;
|
|
·
|
Our
estimates and judgments used to evaluate credit, operations, management,
and market risks relating to target institutions may not be
accurate;
|
|
·
|
There
may be substantial lag-time between completing an acquisition or opening a
new office and generating sufficient assets and deposits to support costs
of the expansion;
|
|
·
|
We
may not be able to finance an acquisition, or the financing we obtain may
have an adverse effect on our operating results or dilution of our
existing shareholders;
|
|
·
|
The
attention of our management in negotiating a transaction and integrating
the operations and personnel of the combining businesses may be diverted
from our existing business;
|
|
·
|
Acquisitions
typically involve the payment of a premium over book and market values
and; therefore, some dilution of our tangible book value and net income
per common share may occur in connection with any future
transaction;
|
|
·
|
We
may enter new markets where we lack local experience;
|
|
·
|
We
may incur goodwill in connection with an acquisition, or the goodwill we
incur may become impaired, which results in adverse short-term effects on
our operating results; or
|
|
·
|
We
may lose key employees and clients.
|
Competition
from other financial services providers could adversely impact our results of
operations — The banking
and financial services business is highly competitive. We face competition in
making loans and leases, attracting deposits and providing insurance,
investment, trust, and other financial services. Increased competition in the
banking and financial services businesses may reduce our market share, impair
our growth or cause the prices we charge for our services to decline. Our
results of operations may be adversely impacted in future periods depending upon
the level and nature of competition we encounter in our various market
areas.
We are
dependent upon the services of our management team — Our future success
and profitability is substantially dependent upon our management and the banking
abilities of our senior executives. We believe that our future results will also
depend in part upon our ability to attract and retain highly skilled and
qualified management. We are especially dependent on a limited number of key
management personnel, many of whom do not have employment agreements with us.
The loss of the chief executive officer and other senior management and key
personnel could have a material adverse impact on our operations because other
officers may not have the experience and expertise to readily replace these
individuals. Many of these senior officers have primary contact with our clients
and are important in maintaining personalized relationships with our client
base. The unexpected loss of services of one or more of these key employees
could have a material adverse effect on our operations and possibly result in
reduced revenues if we were unable to find suitable replacements promptly.
Competition for senior personnel is intense, and we may not be successful in
attracting and retaining such personnel. Changes in key personnel and their
responsibilities may be disruptive to our businesses and could have a material
adverse effect on our businesses, financial condition, and results of
operations.
Technology security breaches and
constant technological change — Any compromise of our security also could
deter our clients from using our internet banking services that involve the
transmission of confidential information. We rely on standard internet security
systems to provide the security and authentication necessary to effect secure
transmission of data. These precautions may not protect our systems from
compromises or breaches of our security measures that could result in damage to
our reputation and business.
The
financial services industry is constantly undergoing rapid technological change
with frequent introductions of new technology-driven products and services. The
effective use of technology increases efficiency and enables financial
institutions to better service clients and reduce costs. Our future success
depends, in part, upon our ability to address the needs of our clients by using
technology to provide products and services that will satisfy client demands, as
well as create additional efficiencies within our operations. Many of our
competitors have substantially greater resources to invest in technological
improvements. We may not be able to effectively implement new technology-driven
products and services or be successful in marketing these products and services
to our clients. Failure to successfully keep pace with technological change
affecting the financial services industry could have a material adverse impact
on our business and, in turn, our financial condition and results of
operations.
We are subject to credit risks
relating to our loan and lease portfolios — We have certain lending
policies and procedures in place that are designed to optimize loan and lease
income within an acceptable level of risk. Our management reviews and approves
these policies and procedures on a regular basis. A reporting system supplements
the review process by providing our management with frequent reports related to
loan and lease production, loan quality, concentrations of credit, loan and
lease delinquencies, and nonperforming and potential problem loans and leases.
Diversification in the loan and lease portfolios is a means of managing risk
associated with fluctuations and economic conditions.
We
maintain an independent loan review department that reviews and validates the
credit risk program on a periodic basis. Results of these reviews are presented
to our management. The loan and lease review process complements and reinforces
the risk identification and assessment decisions made by lenders and credit
personnel, as well as our policies and procedures.
In the
financial services industry, there is always a risk that certain borrowers may
not repay borrowings. Our reserve for loan and lease losses may not be
sufficient to cover the loan and lease losses that we may actually incur. If we
experience defaults by borrowers in any of our businesses, our earnings could be
negatively affected. Changes in local economic conditions could adversely affect
credit quality, particularly in our local business loan and lease portfolio.
Changes in national economic conditions could also adversely affect the quality
of our loan and lease portfolio and negate, to some extent, the benefits of
national diversification through our Specialty Finance Group’s
portfolio.
Commercial
and commercial real estate loans generally involve higher credit risks than
residential real estate and consumer loans. Because payments on loans secured by
commercial real estate or equipment are often dependent upon the successful
operation and management of the underlying assets, repayment of such loans may
be influenced to a great extent by conditions in the market or the economy. We
seek to minimize these risks through our underwriting standards. We obtain
financial information and perform credit risk analysis on our customers. Credit
criteria may include, but are not limited to, assessments of income, cash flows,
and net worth; asset ownership; bank and trade credit reference; credit bureau
report; and operational history.
Commercial
real estate or equipment loans are underwritten after evaluating and
understanding the borrower's ability to operate profitably and generate positive
cash flows. Our management examines current and projected cash flows of the
borrower to determine the ability of the borrower to repay their obligations as
agreed. Underwriting standards are designed to promote relationship banking
rather than transactional banking. Most commercial and industrial loans are
secured by the assets being financed or other business assets; however, some
loans may be made on an unsecured basis. Our credit policy sets different
maximum exposure limits both by business sector and our current and historical
relationship and previous experience with each customer.
We offer
both fixed-rate and adjustable-rate consumer mortgage loans secured by
properties, substantially all of which are located in our primary market area.
Adjustable-rate mortgage loans help reduce our exposure to changes in interest
rates; however, during periods of rising interest rates, the risk of default on
adjustable-rate mortgage loans may increase as a result of repricing and the
increased payments required from the borrower. Additionally, most residential
mortgages are sold into the secondary market and serviced by our principal
banking subsidiary, 1st Source Bank.
Consumer
loans are primarily all other non-real estate loans to individuals in our
regional market area. Consumer loans can entail risk, particularly in the case
of loans that are unsecured or secured by rapidly depreciating assets. In these
cases, any repossessed collateral may not provide an adequate source of
repayment of the outstanding loan balance. The remaining deficiency often does
not warrant further substantial collection efforts against the borrower beyond
obtaining a deficiency judgment. In addition, consumer loan collections are
dependent on the borrower’s continuing financial stability, and thus are more
likely to be adversely affected by job loss, divorce, illness, or personal
bankruptcy.
The 1st
Source Specialty Finance Group loan and lease portfolio consists of commercial
loans and leases secured by construction and transportation equipment, including
aircraft, autos, trucks, and vans. Finance receivables for this Group generally
provide for monthly payments and may include prepayment penalty
provisions.
Our
construction and transportation related businesses could be adversely affected
by slow downs in the economy. Clients who rely on the use of assets financed
through the Specialty Finance Group to produce income could be negatively
affected, and we could experience substantial loan and lease losses. By the
nature of the businesses these clients operate in, we could be adversely
affected by rapid increases of fuel costs. Since some of the relationships in
these industries are large (up to $25 million), a slow down could have a
significant adverse impact on our performance.
Our
construction and transportation related businesses could be adversely impacted
by the negative effects caused by high fuel costs, terrorist and other potential
attacks, and other destabilizing events. These factors could contribute to the
deterioration of the quality of our loan and lease portfolio, as they could have
a negative impact on the travel sensitive businesses for which our specialty
finance businesses provide financing.
In
addition, our leasing and equipment financing activity is subject to the risk of
cyclical downturns, industry concentration and clumping, and other adverse
economic developments affecting these industries and markets. This area of
lending, with transportation in particular, is dependent upon general economic
conditions and the strength of the travel, construction, and transportation
industries.
The soundness of other financial
institutions could adversely affect us — Financial services institutions
are interrelated as a result of trading, clearing, counterparty, or other
relationships. We have exposure to many different industries and counterparties,
and we routinely execute transactions with counterparties in the financial
services industry, including commercial banks, brokers and dealers, investment
banks, and other institutional clients. Many of these transactions expose us to
credit risk in the event of a default by our counterparty or client. In
addition, our credit risk may be exacerbated when the collateral held by us
cannot be realized or is liquidated at prices not sufficient to recover the full
amount of the credit or derivative exposure due us. Any such losses could have a
material adverse affect on our financial condition and results of
operations.
Adverse changes in economic
conditions could impair our financial condition and results of operations
— We are impacted by general business and economic conditions in the United
States and abroad. These conditions include short-term and long-term interest
rates, inflation, money supply, political issues, legislative and regulatory
changes, fluctuations in both debt and equity capital markets, broad trends in
industry and finance, unemployment, and the strength of the U.S. economy and the
local economies in which we operate, all of which are beyond our control. A
deterioration in economic conditions could result in an increase in loan
delinquencies and non-performing assets, decreases in loan collateral values and
a decrease in demand for our products and services.
We are subject to extensive
government regulation and supervision — Our operations are subject to
extensive federal and state regulation and supervision. Banking regulations are
primarily intended to protect depositors' funds, federal deposit insurance funds
and the banking system as a whole, not security holders. These regulations
affect our lending practices, capital structure, investment practices, dividend
policy and growth, among other things. Congress and federal regulatory agencies
continually review banking laws, regulations and policies for possible change.
Changes to statutes, regulations or regulatory policies, including changes in
interpretation or implementation of statutes, regulation or policies, could
affect us in substantial and unpredictable ways. Such changes could subject us
to additional costs and limit the types of financial services and products we
may offer. Failure to comply with laws, regulations or policies could result in
sanctions by regulatory agencies, civil money penalties and/or reputation
damage, which could have a material adverse effect on our business, financial
condition and results of operations. While we have policies and procedures
designed to prevent any such violations, there can be no assurance that such
violations will not occur.
We rely on dividends from our
subsidiaries — Our parent company, 1st Source Corporation, receives
substantially all of its revenue from dividends from our subsidiaries. These
dividends are the principal source of funds to pay dividends on our common stock
and interest and principal on our debt. Various federal and/or state laws and
regulations limit the amount of dividends that our subsidiaries may pay to our
parent company. In the event our subsidiaries are unable to pay dividends to our
parent company, we may not be able to service debt, pay obligations or pay
dividends on our common stock. The inability to receive dividends from our
subsidiaries could have a material adverse affect on our business, financial
condition and results of operations.
Changes in accounting standards could
impact reported earnings — Current accounting and tax rules, standards,
policies and interpretations influence the methods by which financial
institutions conduct business, implement strategic initiatives and tax
compliance, and govern financial reporting and disclosures. These laws,
regulations, rules, standards, policies and interpretations are constantly
evolving and may change significantly over time. Events that may not have a
direct impact on us, such as bankruptcy of major U.S. companies, have resulted
in legislators, regulators, and authoritative bodies, such as the Financial
Accounting Standards Board, the Securities and Exchange Commission, the Public
Company Accounting Oversight Board and various taxing authorities, responding by
adopting and/or proposing substantive revision to laws, regulations, rules,
standards, policies and interpretations. New accounting pronouncements and
varying interpretations of accounting pronouncements have occurred and may occur
in the future. A change in accounting standards may adversely affect reported
financial condition and results of operations.
New economic stabilization
legislation and our participation in the programs could affect us
adversely— The Emergency Economic Stabilization Act of 2008 (the "EESA")
is intended to stabilize and provide liquidity to the U.S. financial markets.
There can be no assurance, however, as to the long term impact that the EESA and
its regulations and other governmental programs will have on the financial
markets. The failure of the financial markets to stabilize and a worsening of
current financial market conditions could adversely affect our business,
financial condition and results of operations. The programs
established or to be established under the EESA and Troubled Asset Relief
Program may have adverse effects on us. We may face increased regulation of our
industry. Compliance with such regulation may increase our costs and
limit our ability to pursue business opportunities.
Our
participation in the Treasury’s Capital Purchase Program may adversely affect
the value of our common stock and the rights of our common shareholders
— The terms of the
preferred stock we issued under the Treasury’s Capital Purchase Program
could reduce investment returns to our common shareholders by restricting
dividends, diluting existing shareholders’ ownership interests, and restricting
capital management practices. Without the prior consent of the Treasury, we will
be prohibited from increasing our common stock dividends for the first three years
while the Treasury holds the preferred stock.
Also, the
preferred stock requires quarterly dividends to be paid at the rate of 5% per
annum for the first five years and 9% per annum thereafter until the stock is
redeemed by us. The payments of these dividends will decrease the excess cash we
otherwise have available to pay dividends on our common stock and to use for
general corporate purposes, including working capital.
Finally,
we will be prohibited from continuing to pay dividends on our common stock
unless we have fully paid all required dividends on the preferred stock issued
to the Treasury. Although we fully expect to be able to pay all required
dividends on the preferred stock (and to continue to pay dividends on its common
stock at current levels), there is no guarantee that we will be able to do so in
the future.
Our deposit insurance premiums could
be substantially higher in the future which will have an adverse effect on our
future earnings —Under the Federal
Deposit Insurance Act, the FDIC, absent extraordinary circumstances, must
establish and implement a plan to restore the deposit insurance reserve ratio to
1.15% of insured deposits, over an eight-year period, at any time that the
reserve ratio falls below 1.15%. The FDIC expects a higher rate of insured
institution failures in the next few years, which may result in a continued
decline in the reserve ratio.
As a
member institution of the FDIC, we are required to pay semi-annual deposit
insurance premium assessments to the FDIC. Due to the continued failures of FDIC
insured depository institutions, FDIC insurance premiums have increased. We
anticipate that our FDIC deposit insurance premiums may increase in the future,
perhaps significantly, which will adversely impact our future
earnings.
None
Our
headquarters building is located in downtown South Bend. In 1982, the land was
leased from the City of South Bend on a 49-year lease, with a 50-year renewal
option. The building is part of a larger complex, including a 300-room hotel and
a 500-car parking garage. Also, in 1982, we sold the building and entered into a
leaseback agreement with the purchaser for a term of 30 years. The building is a
structure of approximately 160,000 square feet, with 1st Source and our
subsidiaries occupying approximately 65% of the available office space and
approximately 35% subleased to unrelated tenants.
At
December 31, 2009, we also owned property and/or buildings on which 55 of the
1st Source Bank's 76 banking centers were located, including the facilities in
Allen, Elkhart, Fulton, Huntington, Kosciusko, LaPorte, Marshall, Porter, St.
Joseph, Starke, and Wells Counties in the State of Indiana and Berrien and Cass
Counties in the State of Michigan, as well as an operations center, warehouse,
and our former headquarters building, which is utilized for additional business
operations. The Bank leases additional property and/or buildings to and from
third parties under lease agreements negotiated at arms-length.
1st Source
and our subsidiaries are involved in various legal proceedings incidental to the
conduct of our businesses. Our management does not expect that the outcome of
any such proceedings will have a material adverse effect on our consolidated
financial position or results of operations.
None
Part
II
Our
common stock is traded on the Nasdaq Global Select Market under the symbol
"SRCE." The following table sets forth for each quarter the high and low sales
prices for our common stock, as reported by Nasdaq, and the cash dividends paid
per share for each quarter.
|
2009
Sales Price
|
Cash
Dividends
|
2008
Sales Price
|
Cash
Dividends
|
|||||||||||||||||||||
|
Common
Stock Prices (quarter
ended)
|
High
|
Low
|
Paid
|
High
|
Low
|
Paid
|
||||||||||||||||||
|
March
31
|
$ | 23.92 | $ | 14.16 | $ | .14 | $ | 21.81 | $ | 15.13 | $ | .14 | ||||||||||||
|
June
30
|
21.98 | 15.36 | .14 | 22.62 | 16.10 | .14 | ||||||||||||||||||
|
September
30
|
17.94 | 14.52 | .15 | 30.00 | 14.54 | .14 | ||||||||||||||||||
|
December
31
|
16.60 | 13.84 | .16 | 25.56 | 12.61 | .16 | ||||||||||||||||||
|
As
of December 31, 2009, there were 967 holders of record of 1st Source
common stock
|
||||||||||||||||||||||||
Comparison of Five Year Cumulative
Total Return*
Among 1st
Source, Morningstar Market Weighted NASDAQ Index** and Peer Group
Index***
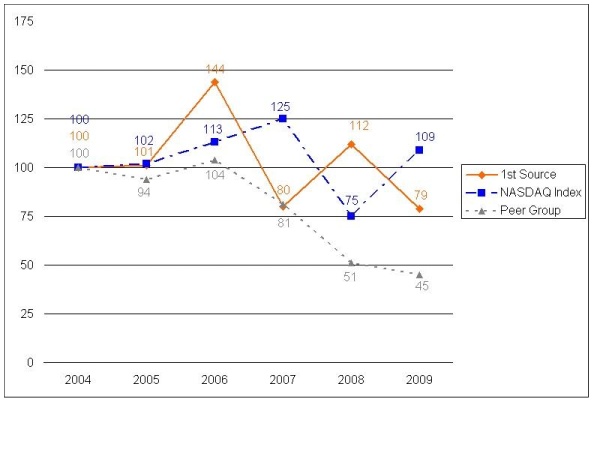
*
Assumes $100 invested on December 31, 2004, in 1st Source Corporation common
stock, NASDAQ market index, and peer group index.
**
The Morningstar Weighted NASDAQ Index Return is calculated using all companies
which trade as NASD Capital Markets, NASD Global Markets or NASD Global Select.
It includes both domestic and foreign companies. The index is weighted by the
then current shares outstanding and assumes dividends reinvested. The return is
calculated on a monthly basis.
*** The
peer group is a market-capitalization-weighted stock index of 124 banking
companies in Illinois, Indiana, Michigan, Ohio, and Wisconsin.
NOTE:
Total return assumes reinvestment of dividends.
The
following table summarizes our share repurchase activity during the three months
ended December 31, 2009.
|
Total
Number of
|
Maximum
Number (or Approximate
|
|||
|
Shares
Purchased as
|
Dollar
Value) of Shares that
|
|||
|
Total
Number of
|
Average
Price
|
Part
of Publicly Announced
|
may
yet be Purchased Under
|
|
|
Period
|
Shares
Purchased
|
Paid
Per Share
|
Plans
or Programs*
|
the
Plans or Programs
|
|
October
01 - 31, 2009
|
4,000
|
$14.79
|
4,000
|
1,390,572
|
|
November
01 - 30, 2009
|
21,533
|
14.29
|
21,533
|
1,369,039
|
|
December
01 - 31, 2009
|
4,900
|
14.39
|
4,900
|
1,364,139
|
|
*1st
Source maintains a stock repurchase plan that was authorized by the Board
of Directors on April 26, 2007. Under the terms of the plan, 1st Source
may repurchase up to
|
||||
|
2,000,000
shares of its common stock when favorable conditions exist on the open
market or through private transactions at various prices from time to
time. Since the inception
|
||||
|
of
the plan, 1st Source has repurchased a total of 635,861
shares.
|
||||
Federal
laws and regulations contain restrictions on the ability of 1st Source and the
Bank to pay dividends. For information regarding restrictions on dividends, see
Part I, Item 1, Business - Regulation and Supervision - Dividends and Part II,
Item 8, Financial Statements and Supplementary Data - Note 20 of the Notes to
Consolidated Financial Statements. In addition, as a result of our participation
in the TARP Capital Purchase Program, we may not increase the quarterly
dividends we pay on our common stock above $0.16 per share during the three-year
period ending January 23, 2012, without the consent of the U.S. Treasury
Department, unless the Treasury Department no longer holds shares of the Series
A Preferred Stock we issued in the TARP Capital Purchase Program.
The
following selected financial data should be read in conjunction with our
Consolidated Financial Statements and the accompanying notes presented elsewhere
herein.
|
(Dollars
in thousands, except per share amounts)
|
2009
|
2008
|
2007
(2)
|
2006
|
2005
|
|||||||||||||||
| $ | 200,412 | $ | 235,308 | $ | 253,587 | $ | 208,994 | $ | 168,532 | |||||||||||
|
Interest
expense
|
72,200 | 103,148 | 134,677 | 102,561 | 70,104 | |||||||||||||||
|
Net
interest income
|
128,212 | 132,160 | 118,910 | 106,433 | 98,428 | |||||||||||||||
|
Provision
for (recovery of) loan and lease losses
|
31,101 | 16,648 | 7,534 | (2,736 | ) | (5,855 | ) | |||||||||||||
|
Net
interest income after provision for (recovery of)
|
||||||||||||||||||||
|
loan
and lease losses
|
97,111 | 115,512 | 111,376 | 109,169 | 104,283 | |||||||||||||||
|
Noninterest
income
|
85,530 | 84,003 | 70,619 | 76,585 | 68,533 | |||||||||||||||
|
Noninterest
expense
|
151,123 | 153,114 | 140,312 | 126,211 | 123,439 | |||||||||||||||
|
Income
before income taxes
|
31,518 | 46,401 | 41,683 | 59,543 | 49,377 | |||||||||||||||
|
Income
taxes
|
6,028 | 13,015 | 11,144 | 20,246 | 15,626 | |||||||||||||||
|
Net
income
|
25,490 | 33,386 | 30,539 | 39,297 | 33,751 | |||||||||||||||
|
Net
income available to common shareholders
|
$ | 19,074 | $ | 33,386 | $ | 30,539 | $ | 39,297 | $ | 33,751 | ||||||||||
|
Assets
at year-end
|
$ | 4,542,100 | $ | 4,464,174 | $ | 4,447,104 | $ | 3,807,315 | $ | 3,511,277 | ||||||||||
|
Long-term
debt and mandatorily redeemable
|
||||||||||||||||||||
|
securities
at year-end
|
19,761 | 29,832 | 34,702 | 43,761 | 23,237 | |||||||||||||||
|
Shareholders’
equity at year-end (3)
|
570,320 | 453,664 | 430,504 | 368,904 | 345,576 | |||||||||||||||
|
Basic
net income per common share (1)
|
0.79 | 1.38 | 1.30 | 1.74 | 1.48 | |||||||||||||||
|
Diluted
net income per common share (1)
|
0.79 | 1.37 | 1.28 | 1.72 | 1.46 | |||||||||||||||
|
Cash
dividends per common share (1)
|
.590 | .580 | .560 | .534 | .445 | |||||||||||||||
|
Dividend
payout ratio
|
74.68 | % | 42.34 | % | 43.75 | % | 31.05 | % | 30.48 | % | ||||||||||
|
Return
on average assets
|
0.57 | % | 0.76 | % | 0.74 | % | 1.11 | % | 1.00 | % | ||||||||||
|
Return
on average common equity
|
4.07 | % | 7.52 | % | 7.47 | % | 10.98 | % | 10.12 | % | ||||||||||
|
Average
common equity to average assets
|
10.40 | % | 10.09 | % | 9.85 | % | 10.07 | % | 9.89 | % | ||||||||||
|
(1)
The computation of per common share data gives retroactive recognition to
a 10% stock dividend declared July 27, 2006.
|
||||||||||||||||||||
|
(2)
Results for 2007 and later include the acquisition of FINA Bancorp,
Inc.
|
||||||||||||||||||||
|
(3)
Results for 2009 include the issuance of Preferred Stock under TARP. Refer
to Note 13 of the Notes to Consolidated Financial Statements for further
details.
|
||||||||||||||||||||
The
purpose of this analysis is to provide the reader with information relevant to
understanding and assessing our results of operations for each of the past three
years and financial condition for each of the past two years. In order to fully
appreciate this analysis the reader is encouraged to review the consolidated
financial statements and statistical data presented in this
document.
Forward-Looking
Statements
This
report, including Management’s Discussion and Analysis of Financial Condition
and Results of Operations, contains forward-looking statements. Forward-looking
statements include statements with respect to our beliefs, plans, objectives,
goals, expectations, anticipations, assumptions, estimates, intentions, and
future performance, and involve known and unknown risks, uncertainties and other
factors, which may be beyond our control, and which may cause actual results,
performance or achievements to be materially different from future results,
performance or achievements expressed or implied by such forward-looking
statements.
All
statements other than statements of historical fact are statements that could be
forward-looking statements. Words such as “believe”, “contemplate”, “seek”,
“estimate”, “plan”, “project”, “anticipate”, “possible”, “assume”, “expect”,
“intend”, “targeted”, “continue”, “remain”, “will”, “should”, “indicate”,
“would”, “may” and other similar expressions are intended to identify
forward-looking statements but are not the exclusive means of identifying such
statements. Forward-looking statements provide current expectations or forecasts
of future events and are not guarantees of future performance, nor should they
be relied upon as representing management’s views as of any subsequent date.
All
written or oral forward-looking statements that are made by or attributable to
us are expressly qualified in their entirety by this cautionary notice. We have
no obligation and do not undertake to update, revise, or correct any of the
forward-looking statements after the date of this report, or after the
respective dates on which such statements otherwise are made. We have expressed
our expectations, beliefs, and projections in good faith and we believe they
have a reasonable basis. However, we make no assurances that our expectations,
beliefs, or projections will be achieved or accomplished. These forward-looking
statements may not be realized due to a variety of factors, including, without
limitation, the following:
|
·
|
Local,
regional, national, and international economic conditions and the impact
they may have on us and our clients and our assessment of that
impact.
|
|
·
|
Changes
in the level of nonperforming assets and charge-offs.
|
|
·
|
Changes
in estimates of future cash reserve requirements based upon the periodic
review thereof under relevant regulatory and accounting
requirements.
|
|
·
|
The
effects of and changes in trade and monetary and fiscal policies and laws,
including the interest rate policies of the Federal Reserve
Board.
|
|
·
|
Inflation,
interest rate, securities market, and monetary fluctuations.
|
|
·
|
Political
instability.
|
|
·
|
Acts
of war or terrorism.
|
|
·
|
Substantial
increases in the cost of fuel.
|
|
·
|
The
timely development and acceptance of new products and services and
perceived overall value of these products and services by
others.
|
|
·
|
Changes
in consumer spending, borrowings, and savings habits.
|
|
·
|
Changes
in the financial performance and/or condition of our
borrowers.
|
|
·
|
Technological
changes.
|
|
·
|
Acquisitions
and integration of acquired businesses.
|
|
·
|
The
ability to increase market share and control expenses.
|
|
·
|
Changes
in the competitive environment among bank holding companies.
|
|
·
|
The
effect of changes in laws and regulations (including laws and regulations
concerning taxes, banking, securities, and insurance) with which we and
our subsidiaries must comply.
|
|
·
|
The
effect of changes in accounting policies and practices and auditing
requirements, as may be adopted by the regulatory agencies, as well as the
Public Company Accounting Oversight Board, the Financial Accounting
Standards Board, and other accounting standard setters.
|
|
·
|
Changes
in our organization, compensation, and benefit plans.
|
|
·
|
The
costs and effects of legal and regulatory developments including the
resolution of legal proceedings or regulatory or other governmental
inquires and the results of regulatory examinations or
reviews.
|
|
·
|
Greater
than expected costs or difficulties related to the integration of new
products and lines of business.
|
|
·
|
Our
success at managing the risks described in Item 1A. Risk
Factors.
|
Application of Critical
Accounting Policies and Estimates
Our
consolidated financial statements are prepared in accordance with U. S.
generally accepted accounting principles (GAAP) and follow general practices
within the industries in which we operate. Application of these principles
requires our management to make estimates or judgments that affect the amounts
reported in the financial statements and accompanying notes. These estimates or
judgments reflect our management’s view of the most appropriate manner in which
to record and report our overall financial performance. Because these estimates
or judgments are based on current circumstances, they may change over time or
prove to be inaccurate based on actual experience. As such, changes in these
estimates, judgments, and/or assumptions may have a significant impact on our
financial statements. All accounting policies are important, and all policies
described in Part II, Item 8, Financial Statements and Supplementary Data, Note
1 (Note 1), should be reviewed for a greater understanding of how our financial
performance is recorded and reported.
We have
identified three policies as being critical because they require our management
to make particularly difficult, subjective, and/or complex estimates or
judgments about matters that are inherently uncertain and because of the
likelihood that materially different amounts would be reported under different
conditions or using different assumptions. These policies relate to the
determination of the reserve for loan and lease losses, the valuation of
mortgage servicing rights, and fair value measurements. Our management has used
the best information available to make the estimations or judgments necessary to
value the related assets and liabilities. Actual performance that differs from
estimates or judgments and future changes in the key variables could change
future valuations and impact net income. Our management has reviewed the
application of these policies with the Audit Committee of the Board of
Directors. Following is a discussion of the areas we view as our most
critical accounting policies.
Reserve for Loan and Lease
Losses — The reserve for loan and lease losses represents our
management’s estimate of probable losses inherent in the loan and lease
portfolio and the establishment of a reserve that is sufficient to absorb those
losses. In determining an adequate reserve, our management makes numerous
judgments, assumptions, and estimates based on continuous review of the loan and
lease portfolio, estimates of client performance, collateral values, and
disposition, as well as historical loss rates and expected cash flows. In
assessing these factors, our management benefits from a lengthy organizational
history and experience with credit decisions and related outcomes. Nonetheless,
if our management’s underlying assumptions prove to be inaccurate, the reserve
for loan and lease losses would have to be adjusted. Our accounting policy
related to the reserve is disclosed in Note 1 under the heading "Reserve for
Loan and Lease Losses."
Fair Value Measurements — We
use fair value measurements to record certain financial instruments and to
determine fair value disclosures. Available-for-sale securities, mortgage loans
held for sale, and interest rate swap agreements are financial instruments
recorded at fair value on a recurring basis. Additionally, from time to time, we
may be required to record at fair value other financial assets on a nonrecurring
basis. These nonrecurring fair value adjustments typically involve write-downs
of, or specific reserves against, individual assets. GAAP establishes
a three-level hierarchy for disclosure of assets and liabilities recorded at
fair value. The classification of assets and liabilities within the hierarchy is
based on whether the inputs to the valuation methodology used in the measurement
are observable or unobservable. Observable inputs reflect market-driven or
market-based information obtained from independent sources, while unobservable
inputs reflect our estimates about market data.
The
degree of management judgment involved in determining the fair value of a
financial instrument is dependent upon the availability of quoted market prices
or observable market data. For financial instruments that trade actively and
have quoted market prices or observable market data, there is minimal
subjectivity involved in measuring fair value. When observable market prices and
data are not fully available, management judgment is necessary to estimate fair
value. In addition, changes in the market conditions may reduce the availability
of quoted prices or observable data. For example, reduced liquidity in the
capital markets or changes in secondary market activities could result in
observable market inputs becoming unavailable. Therefore, when market data is
not available, we use valuation techniques that require more management judgment
to estimate the appropriate fair value measurement. Fair value is discussed
further in Note 1 under the heading "Fair Value Measurements" and in Note 21,
"Fair Values of Financial Instruments."
Mortgage Servicing Rights
Valuation — We recognize as assets the rights to service mortgage loans
for others, known as mortgage servicing rights, whether the servicing rights are
acquired through purchases or through originated loans. Mortgage servicing
rights do not trade in an active open market with readily observable market
prices. Although sales of mortgage servicing rights do occur, the precise terms
and conditions may not be readily available. As such, the value of mortgage
servicing assets are established and valued using discounted cash flow modeling
techniques which require management to make estimates regarding estimated future
net servicing cash flows, taking into consideration actual and expected mortgage
loan prepayment rates, discount rates, servicing costs, and other economic
factors. The expected rates of mortgage loan prepayments are the most
significant factors driving the value of mortgage servicing assets. Increases in
mortgage loan prepayments reduce estimated future net servicing cash flows
because the life of the underlying loan is reduced. In determining the fair
value of the mortgage servicing assets, mortgage interest rates (which are used
to determine prepayment rates), and discount rates are held constant over the
estimated life of the portfolio. Expected mortgage loan prepayment rates are
derived from a third-party model and adjusted to reflect our actual prepayment
experience. Mortgage servicing assets are carried at the lower of amortized
cost or fair value. The values of these assets are sensitive to changes in the
assumptions used and readily available market pricing does not exist. The
valuation of mortgage servicing assets is discussed further in Note 21, "Fair
Values of Financial Instruments."
Earnings
Summary
Net
income in 2009 was $25.49 million, down from $33.39 million in 2008 and down
from $30.54 million in 2007. Diluted net income per common share was $0.79 in
2009, $1.37 in 2008, and $1.28 in 2007. Return on average total assets was 0.57%
in 2009 compared to 0.76% in 2008, and 0.74% in 2007. Return on average common
shareholders' equity was 4.07% in 2009 versus 7.52% in 2008, and 7.47% in
2007.
Net
income in 2009 was negatively impacted by a $14.45 million or 86.82% increase in
provision for loan and lease losses over 2008 and a reduction of $11.49 million
gain due to sale of certain assets of Investment Advisors in 2008, which was
offset by an improvement of $11.68 million or 116.88% in investment securities
due to impairment recorded in 2008 that was not present in 2009. Net income in
2008, as compared to 2007, was favorably affected by a $13.25 million or 11.14%
increase in net interest income, the $11.49 million gain on the sale of certain
assets of Investment Advisors and increased noninterest income. However, these
increases were offset by increased provision for loan and lease losses,
investment securities impairment and increased noninterest
expenses.
Dividends
paid on common stock in 2009 amounted to $0.59 per share, compared to $0.58 per
share in 2008, and $0.56 per share in 2007. The level of earnings reinvested and
dividend payouts are based on management’s assessment of future growth
opportunities and the level of capital necessary to support them.
Acquisition
of First National Bank, Valparaiso — On May 31, 2007,
we acquired FINA Bancorp (FINA), the parent company of First National Bank,
Valparaiso for $134.19 million. First National was a full service bank with 16
banking facilities, as of December 31, 2007, located in Porter and LaPorte
Counties of Indiana. Pursuant to the definitive agreement, FINA shareholders
were able to choose whether to receive 1st Source common stock and/or cash
pursuant to the election procedures described in the definitive agreement. Under
the terms of the transaction, FINA was acquired in exchange for 2,124,974 shares
of 1st Source common stock valued at $53.68 million and $80.51 million in cash.
The value of the common stock was $25.26 per share. We believe that the purchase
of FINA is a natural extension of our service area and is consistent with our
growth and market expansion initiatives. On June 6, 2008, First
National was merged with 1st Source Bank.
Net Interest Income — Our
primary source of earnings is net interest income, the difference between income
on earning assets and the cost of funds supporting those assets. Significant
categories of earning assets are loans and securities while deposits and
borrowings represent the major portion of interest-bearing liabilities. For
purposes of the following discussion, comparison of net interest income is done
on a tax equivalent basis, which provides a common basis for comparing yields on
earning assets exempt from federal income taxes to those which are fully
taxable.
Net
interest margin (the ratio of net interest income to average earning assets) is
affected by movements in interest rates and changes in the mix of earning assets
and the liabilities that fund those assets. Net interest margin on a fully
taxable equivalent basis was 3.14% in 2009 compared to 3.34% in 2008, and 3.18%
in 2007. The lower margin in 2009 reflects the decline in yields on earning
assets which was partially offset by lower funding costs. Net interest income
was $128.21 million for 2009, compared to $132.16 million for 2008.
Tax-equivalent net interest income totaled $132.00 million for 2009, a decrease
of $3.75 million from the $135.75 million reported for 2008. The $3.75 million
decrease is mainly due to changes in rates.
During
2009, average earning assets increased $130.90 million while average
interest-bearing liabilities decreased $67.19 million over the comparable period
in 2008. The yield on average earning assets decreased 101 basis points to 4.86%
for 2009 from 5.87% for 2008. The rate earned on assets was negatively impacted
by decreases in market rates. Total cost of average interest-bearing liabilities
decreased 84 basis points during 2009 as liabilities were also impacted by
decreases in market rates. The result was a decrease of 20 basis points to net
interest spread, or the difference between interest income on earning assets and
expense on interest-bearing liabilities.
The
largest contributor to the decrease in the yield on average earning assets in
2009 was the 77 basis point decrease in the loan and lease portfolio yield. The
decrease in the loan and lease portfolio yield was further impacted by a
decrease in net loan and lease outstandings. Average net loans and leases
decreased $108.46 million or 3.32% in 2009 from 2008.
During
2009, the tax-equivalent yield on securities available for sale decreased 132
basis points to 3.28% while the average balance increased $121.21
million.
Average
mortgages held for sale increased $40.25 million during 2009; however the yield
decreased 83 basis points.
Average
interest-bearing deposits increased $149.31 million during 2009 while the
effective rate paid on those deposits decreased 88 basis points. Average non
interest-bearing demand deposits increased $50.07 million during
2009.
Average
short-term borrowings decreased $201.20 million during 2009 while the effective
rate paid decreased 137 basis points. Average subordinated notes which represent
our trust preferred borrowings decreased $1.27 million during 2009, while the
effective rate decreased three basis points. Average long-term debt decreased
$14.02 million during 2009 as the effective rate decreased 76 basis
points.
The
following table provides an analysis of net interest income and illustrates
interest income earned and interest expense charged for each major component of
interest earning assets and the interest bearing liabilities. Yields/rates are
computed on a tax-equivalent basis, using a 35% rate. Nonaccrual loans and
leases are included in the average loan and lease balance
outstanding.
|
2009
|
2008
|
2007
|
|||||||||||||
|
Interest
|
Interest
|
Interest
|
|||||||||||||
|
Average
|
Income/
|
Yield/
|
Average
|
Income/
|
Yield/
|
Average
|
Income/
|
Yield/
|
|||||||
|
(Dollars
in thousands)
|
Balance
|
Expense
|
Rate
|
Balance
|
Expense
|
Rate
|
Balance
|
Expense
|
Rate
|
||||||
|
ASSETS
|
|||||||||||||||
|
Investment
securities:
|
|||||||||||||||
|
Taxable
|
$ 629,229
|
$ 17,594
|
2.80
|
%
|
$ 491,061
|
$ 22,170
|
4.51
|
%
|
$ 510,949
|
$ 25,136
|
4.92
|
%
|
|||
|
Tax-exempt
|
205,796
|
9,801
|
4.76
|
222,751
|
10,692
|
4.80
|
225,849
|
10,800
|
4.78
|
||||||
|
Mortgages
held for sale
|
74,173
|
3,907
|
5.27
|
33,925
|
2,069
|
6.10
|
28,913
|
1,892
|
6.54
|
||||||
|
Net
loans and leases
|
3,154,820
|
171,669
|
5.44
|
3,263,276
|
202,539
|
6.21
|
2,992,540
|
214,725
|
7.18
|
||||||
|
Other
investments
|
135,494
|
1,228
|
0.91
|
57,601
|
1,425
|
2.47
|
94,478
|
4,657
|
4.93
|
||||||
|
Total
earning assets
|
4,199,512
|
204,199
|
4.86
|
4,068,614
|
238,895
|
5.87
|
3,852,729
|
257,210
|
6.68
|
||||||
|
Cash
and due from banks
|
59,626
|
83,270
|
81,714
|
||||||||||||
|
Reserve
for loan and
|
|||||||||||||||
|
lease
losses
|
(85,095
|
) |
(71,358
|
) |
(61,555
|
) | |||||||||
|
Other
assets
|
331,809
|
319,997
|
278,421
|
||||||||||||
|
Total
assets
|
$ 4,505,852
|
$ 4,400,523
|
$
4,151,309
|
||||||||||||
|
LIABILITIES AND SHAREHOLDERS’
EQUITY
|
|||||||||||||||
|
Interest
bearing deposits
|
$ 3,146,135
|
$ 63,521
|
2.02
|
%
|
$ 2,996,830
|
$ 86,903
|
2.90
|
%
|
$
2,918,756
|
$ 115,113
|
3.94
|
%
|
|||
|
Short-term
borrowings
|
185,647
|
1,115
|
0.60
|
386,850
|
7,626
|
1.97
|
271,377
|
10,935
|
4.03
|
||||||
|
Subordinated
notes
|
89,692
|
6,589
|
7.35
|
90,960
|
6,714
|
7.38
|
82,414
|
6,051
|
7.34
|
||||||
|
Long-term
debt and
|
|||||||||||||||
|
mandatorily
redeemable
|
|||||||||||||||
|
securities
|
20,448
|
975
|
4.77
|
34,472
|
1,905
|
5.53
|
42,265
|
2,578
|
6.10
|
||||||
|
Total
interest bearing liabilities
|
3,441,922
|
72,200
|
2.10
|
3,509,112
|
103,148
|
2.94
|
3,314,812
|
134,677
|
4.06
|
||||||
|
Noninterest
bearing deposits
|
427,513
|
377,440
|
351,050
|
||||||||||||
|
Other
liabilities
|
69,953
|
69,823
|
76,472
|
||||||||||||
|
Shareholders'
equity
|
566,464
|
444,148
|
408,975
|
||||||||||||
|
Total
liabilities and
|
|||||||||||||||
|
shareholders’
equity
|
$ 4,505,852
|
$ 4,400,523
|
$
4,151,309
|
||||||||||||
|
Net
interest income
|
$ 131,999
|
$ 135,747
|
$ 122,533
|
||||||||||||
|
Net
interest margin on a tax
|
|||||||||||||||
|
equivalent
basis
|
3.14
|
%
|
3.34
|
%
|
3.18
|
%
|
|||||||||
The
change in interest due to both rate and volume has been allocated to volume and
rate changes in proportion to the relationship of the absolute dollar amounts of
the change in each. The following table shows changes in tax equivalent interest
earned and interest paid, resulting from changes in volume and changes in
rates:
|
Increase
(Decrease) due to
|
||||||||||||
|
(Dollars
in thousands)
|
Volume
|
Rate
|
Net
|
|||||||||
|
2009
compared to 2008
|
||||||||||||
|
Interest
earned on:
|
||||||||||||
|
Investment
securities:
|
||||||||||||
|
Taxable
|
$ | 12,787 | $ | (17,363 | ) | $ | (4,576 | ) | ||||
|
Tax-exempt
|
(803 | ) | (88 | ) | (891 | ) | ||||||
|
Mortgages
held for sale
|
2,077 | (239 | ) | 1,838 | ||||||||
|
Net
loans and leases
|
(6,405 | ) | (24,465 | ) | (30,870 | ) | ||||||
|
Other
investments
|
(371 | ) | 174 | (197 | ) | |||||||
|
Total
earning assets
|
$ | 7,285 | $ | (41,981 | ) | $ | (34,696 | ) | ||||
|
Interest
paid on:
|
||||||||||||
|
Interest
bearing deposits
|
$ | 4,560 | $ | (27,942 | ) | $ | (23,382 | ) | ||||
|
Short-term
borrowings
|
(2,787 | ) | (3,724 | ) | (6,511 | ) | ||||||
|
Subordinated
notes
|
(98 | ) | (27 | ) | (125 | ) | ||||||
|
Long-term
debt and mandatorily redeemable securities
|
(695 | ) | (235 | ) | (930 | ) | ||||||
|
Total
interest bearing liabilities
|
$ | 980 | $ | (31,928 | ) | $ | (30,948 | ) | ||||
|
Net
interest income
|
$ | 6,305 | $ | (10,053 | ) | $ | (3,748 | ) | ||||
|
2008
compared to 2007
|
||||||||||||
|
Interest
earned on:
|
||||||||||||
|
Investment
securities:
|
||||||||||||
|
Taxable
|
$ | (927 | ) | $ | (2,039 | ) | $ | (2,966 | ) | |||
|
Tax-exempt
|
(153 | ) | 45 | (108 | ) | |||||||
|
Mortgages
held for sale
|
290 | (113 | ) | 177 | ||||||||
|
Net
loans and leases
|
24,816 | (37,002 | ) | (12,186 | ) | |||||||
|
Other
investments
|
(1,417 | ) | (1,815 | ) | (3,232 | ) | ||||||
|
Total
earning assets
|
$ | 22,609 | $ | (40,924 | ) | $ | (18,315 | ) | ||||
|
Interest
paid on:
|
||||||||||||
|
Interest
bearing deposits
|
$ | 3,045 | $ | (31,255 | ) | $ | (28,210 | ) | ||||
|
Short-term
borrowings
|
16,581 | (19,890 | ) | (3,309 | ) | |||||||
|
Subordinated
notes
|
630 | 33 | 663 | |||||||||
|
Long-term
debt and mandatorily redeemable securities
|
(447 | ) | (226 | ) | (673 | ) | ||||||
|
Total
interest bearing liabilities
|
$ | 19,809 | $ | (51,338 | ) | $ | (31,529 | ) | ||||
|
Net
interest income
|
$ | 2,800 | $ | 10,414 | $ | 13,214 | ||||||
Noninterest Income — Noninterest income increased $1.53 million or 1.82% in 2009 from 2008 following a $13.38 million or 18.95% increase in 2008 over 2007. Noninterest income for the most recent three years ended December 31 was as follows:
|
(Dollars
in thousands)
|
2009
|
2008
|
2007
|
|||||||||
|
Noninterest
income:
|
||||||||||||
|
Trust
fees
|
$ | 15,036 | $ | 18,599 | $ | 15,567 | ||||||
|
Service
charges on deposit accounts
|
20,645 | 22,035 | 20,470 | |||||||||
|
Mortgage
banking income
|
8,251 | 2,994 | 2,868 | |||||||||
|
Insurance
commissions
|
4,930 | 5,363 | 4,666 | |||||||||
|
Equipment
rental income
|
25,757 | 24,224 | 21,312 | |||||||||
|
Other
income
|
9,224 | 9,293 | 8,864 | |||||||||
|
Gain
on sale of certain Investment Advisor assets
|
- | 11,492 | - | |||||||||
|
Investment
securities and other investment gains (losses)
|
1,687 | (9,997 | ) | (3,128 | ) | |||||||
|
Total
noninterest income
|
$ | 85,530 | $ | 84,003 | $ | 70,619 | ||||||
Trust
fees (which include investment management fees, estate administration fees,
mutual fund fees, annuity fees, and fiduciary fees) decreased by $3.56 million
or 19.16% in 2009 from 2008 compared to an increase of $3.03 million or 19.48%
in 2008 over 2007. Trust fees are largely based on the size of client
relationships and the market value of assets under management. The market value
of trust assets under management at December 31, 2009 and 2008 was $2.80 billion
and $2.65 billion, respectively. At December 31, 2009, these trust assets were
comprised of $1.65 billion of personal and agency trusts, $0.77 billion of
employee benefit plan assets, $294.90 million of estate administration assets
and individual retirement accounts, and $81.82 million of custody assets. The
decline in trust fees in 2009 was primarily due to a reduction in our investment
advisory management fees received from the 1st Source Monogram Funds due to the
sale of assets related to the management of such funds in December 2008. The
reduction in investment advisory management fees is partially offset by earnout
fees on the sale of $2.10 million which are reflected in other
income.
Service
charges on deposit accounts decreased $1.39 million or 6.31% in 2009 from 2008
compared to an increase of $1.57 million or 7.65% in 2008 from 2007. The decline
in service charges on deposit accounts in 2009 reflects a lower volume of
overdraft and nonsufficient fund transactions. The growth in service charges on
deposit accounts in 2008 from 2007 reflects growth in the number of deposit
accounts due to the May 2007 acquisition of First National and a higher volume
of fee generating transactions, primarily overdrafts, debit card and
nonsufficient funds transactions.
Mortgage
banking income increased $5.26 million or 175.58% in 2009 over 2008, compared to
an increase of $0.13 million or 4.39% in 2008 over 2007. In 2009, we had $2.07
million in recoveries of mortgage servicing rights impairment and increased gain
on sale of loans. The increase in 2008 was primarily due to gains on mortgage
loan sales which were offset by $1.91 million in mortgage servicing rights
impairment. During 2009, 2008 and 2007, we determined that no permanent
write-down was necessary for previously recorded impairment on mortgage
servicing assets.
Insurance
commissions were down $0.43 million or 8.07% in 2009 from 2008 compared to an
increase of $0.70 million or 14.94% in 2008 from 2007. The lower commission
income in 2009 was mainly due to lower premiums as a result of market conditions
and a reduction in customer accounts. The increase for 2008 was mainly
attributed to an acquisition of an insurance agency in the Fort Wayne
area.
Equipment
rental income generated from operating leases grew by $1.53 million or 6.33%
during 2009 from 2008 compared to an increase of $2.91 million or 13.66% during
2008 from 2007. Revenues from operating leases for transportation equipment,
aircraft and special purpose vehicles increased as clients responded positively
to our strong marketing efforts and entered into new lease
agreements.
On August
25, 2008, Investment Advisors entered into a Purchase and Sale Agreement with WA
Holdings, Inc. ("Buyer") whereby Investment Advisors agreed to sell certain
assets to Buyer and to enter into a long-term strategic partnership with Buyer.
Pursuant to the Purchase and Sale Agreement, in December 2008, Buyer and its
wholly-owned subsidiary, Wasatch Advisors, Inc., investment advisor of the
Wasatch Funds, Inc., acquired assets of Investment Advisors related to the
management of the 1st Source Monogram Mutual Funds - the Income Equity Fund, the
Long/Short Fund and the Income Fund. The 1st Source Monogram Mutual Funds were
reorganized into the Wasatch - 1st Source Income Equity Fund, the Wasatch - 1st
Source Long/Short Fund, and the Wasatch - 1st Source Income Fund. Investment
Advisors recorded a net gain of $11.49 million at closing, which was net of
$1.51 million of legal and compensation expense.
Investment
securities and other investment gains totaled $1.69 million for the year ended
2009 compared to losses of $10.00 million for the year ended 2008 and losses of
$3.13 million for the year ended 2007. In 2008 and 2007, we took $10.82 million
and $4.11 million, respectively, in impairment charges on investments in the
Federal National Mortgage Association (FNMA) and the Federal Home Loan Mortgage
Corporation (FHLMC) preferred stock and other preferred equities as a result of
the deterioration in the residential mortgage business and government
intervention at the FNMA and the FHLMC. Due to the uncertainty of future market
conditions and how they might impact the financial performance of the FNMA and
the FHLMC, we sold our remaining shares of the FHLMC and FNMA preferred stock in
2009 realizing gains of $390 thousand. Also due to market uncertainty, we sold
our remaining shares of corporate preferred stocks, realizing losses of $688
thousand.
Other
income remained relatively stable in 2009 from 2008 and in 2008 from
2007.
Noninterest Expense —
Noninterest expense decreased $1.99 million or 1.30% in 2009 over 2008 following a $12.80 million
or 9.12% increase in 2008 from
2007. Noninterest expense for the recent three years ended December 31
was as follows:
|
(Dollars
in thousands)
|
2009
|
2008
|
2007
|
|||||||||
|
Noninterest
expense:
|
||||||||||||
|
Salaries
and employee benefits
|
$ | 72,483 | $ | 76,965 | $ | 73,944 | ||||||
|
Net
occupancy expense
|
9,185 | 9,698 | 9,030 | |||||||||
|
Furniture
and equipment expense
|
13,980 | 15,095 | 15,145 | |||||||||
|
Depreciation
— leased equipment
|
20,515 | 19,450 | 17,085 | |||||||||
|
Professional
fees
|
4,399 | 8,446 | 4,575 | |||||||||
|
Supplies
and communications
|
5,916 | 6,782 | 5,987 | |||||||||
|
Business
development and marketing expense
|
3,488 | 3,749 | 4,788 | |||||||||
|
Loan
and lease collection and repossession expense
|
4,283 | 1,162 | 1,123 | |||||||||
|
FDIC
and other insurance
|
8,362 | 2,601 | 1,190 | |||||||||
|
Intangible
asset amortization
|
1,352 | 1,393 | 874 | |||||||||
|
Other
expense
|
7,160 | 7,773 | 6,571 | |||||||||
|
Total
noninterest expense
|
$ | 151,123 | $ | 153,114 | $ | 140,312 | ||||||
Total
salaries and employee benefits decreased $4.48 million or 5.82% in 2009 from
2008, following a $3.02 million or 4.09% increase in 2008 from
2007.
Employee
salaries decreased $0.63 million or 1.02% in 2009 from 2008 compared to an
increase of $2.20 million or 3.69% in 2008 from 2007. The decline in 2009 was
the result of a lower work force offset by a decline in salaries deferred
relating to the origination of loans. The increase in 2008 was due to a full
year of First National staff and a decline in salaries deferred relating to the
origination of loans.
Employee
benefits decreased $3.85 million or 25.56% in 2009 from 2008, compared to an
increase of $0.82 million or 5.74% in 2008 from 2007. The decrease in 2009 was
primarily due to lower group insurance costs and a reversal of post retirement
benefit obligations due to the termination of the post retirement benefit plan
for new retirees. The increase in 2008 was primarily due to increased group
insurance costs.
Occupancy
expense decreased $0.51 million or 5.29% in 2009 from 2008, compared to an
increase of $0.67 million or 7.40% in 2008 from 2007. The decrease in 2009 was
mainly a result of lower repair costs on our premises. The increase in 2008 was
primarily due to the increase in number of locations following the acquisition
of First National.
Furniture
and equipment expense, including depreciation, declined $1.12 million or 7.39%
in 2009 from 2008 compared to a slight decline in 2008 from 2007. The decrease
in 2009 was caused by lower depreciation expense and lower computer processing
charges. During 2008 increased computer processing charges offset declines in
repairs and depreciation.
Depreciation
on equipment owned under operating leases increased $1.07 million or 5.48% in
2009 from 2008, following a $2.37 million or 13.84% increase in 2008 from 2007.
In 2009 and 2008, depreciation on equipment owned under operating leases
increased in conjunction with the increase in equipment rental income as some of
our clients opted to enter into new lease arrangements rather than purchase
equipment.
Professional
fees decreased $4.05 million or 47.92% in 2009 from 2008, compared to a $3.87
million or 84.61% increase in 2008 from 2007. In 2008, professional fees were
higher due to expenses recorded for a systems security breach that occurred in
May 2008 and other consulting expenses. In 2009, professional fees returned to
the 2007 level.
Supplies
and communications expense decreased $0.87 million or 12.77% in 2009 from 2008
after a $0.80 million or 13.28% increase in 2008 as compared to 2007. The
decrease in 2009 was primarily a result of lower postage expense and printing
and supplies expense. The increase in 2008 was due to increased printing cost,
freight expense and data line expense.
Business
development and marketing expense decreased $0.26 million or 6.96% in 2009 from
2008 compared to a $1.04 million or 21.70% decrease in 2008 from 2007. The
decrease in 2009 and 2008 was related to lower retail marketing and
institutional marketing expenses.
Loan and
lease collection and repossession expenses increased $3.12 million or 268.59% in
2009 from 2008 compared to remaining stable in 2008 from 2007. The increase in
2009 was due to increased collection and repossession activity as our
nonperforming assets increased.
FDIC and
other insurance expense increased $5.76 million or 221.49% in 2009 over 2008
versus a $1.41 million or 118.57% increase in 2008 over 2007. The increase in
2009 was due to higher Federal Deposit Insurance Corporation (FDIC) insurance
premiums as insurance rates increased and a $1.98 million special FDIC insurance
assessment which was calculated at 5 basis points of assets minus tier 1 capital
as of June 30, 2009. The increase in 2008 was due to higher FDIC insurance
premiums.
Intangible
asset amortization decreased $0.04 million or 2.94% in 2009 from 2008 compared
to a $0.52 million or 59.38% increase in 2008 from 2007. The decrease in 2009
was due to carrying value adjustments relating to a prior acquisition. The
increase in intangible asset amortization for 2008 was due to the amortization
of intangibles related to the First National acquisition.
Other
expenses decreased $0.61 million or 7.89% in 2009 as compared to 2008 following
an increase of $1.20 million or 18.29% in 2008 from 2007. The decrease in 2009
was due to higher deferred costs on originated loans, lower convention costs,
lower trust preferred amortization expense and lower filing expenses offset by
higher mortgage loan payoff expense and lower gain on sale of operating
equipment. Increased correspondent bank fees and write-downs of former bank
premises held for sale contributed to the 2008 increase.
Income Taxes — 1st Source
recognized income tax expense in 2009 of $6.03 million, compared to $13.02
million in 2008, and $11.14 million in 2007. The effective tax rate in 2009 was
19.13% compared to 28.05% in 2008, and 26.74% in 2007. The effective tax rate
decreased in 2009 compared to 2008 due to a one time benefit of $2.60 million
and an increase in tax-exempt interest in relation to income before taxes. The
2009 benefit was the result of a reduction in our tax contingency reserve due to
the resolution of tax audits. The effective tax rate increased in 2008 compared
to 2007 due to a decrease in tax-exempt interest in relation to income before
taxes as well as an increase in state tax expense. For detailed analysis of 1st
Source’s income taxes see Part II, Item 8, Financial Statements and
Supplementary Data — Note 17 of the Notes to Consolidated Financial
Statements.
Financial
Condition
Loan and Lease Portfolio — The
following table shows 1st Source’s loan and lease distribution at the end of
each of the last five years as of December 31:
|
(Dollars
in thousands)
|
2009
|
2008
|
2007
|
2006
|
2005
|
|||||||||||||||
|
Commercial
and agricultural loans
|
$ | 546,222 | $ | 643,440 | $ | 593,806 | $ | 478,310 | $ | 453,197 | ||||||||||
|
Auto,
light truck and environmental equipment
|
349,741 | 353,838 | 305,238 | 317,604 | 310,786 | |||||||||||||||
|
Medium
and heavy duty truck
|
204,545 | 243,375 | 300,469 | 341,744 | 302,137 | |||||||||||||||
|
Aircraft
financing
|
617,384 | 632,121 | 587,022 | 498,914 | 459,645 | |||||||||||||||
|
Construction
equipment financing
|
313,300 | 375,983 | 377,785 | 305,976 | 224,230 | |||||||||||||||
|
Loans
secured by real estate
|
952,223 | 918,749 | 881,646 | 632,283 | 601,077 | |||||||||||||||
|
Consumer
loans
|
109,735 | 130,706 | 145,475 | 127,706 | 112,359 | |||||||||||||||
|
Total
loans and leases
|
$ | 3,093,150 | $ | 3,298,212 | $ | 3,191,441 | $ | 2,702,537 | $ | 2,463,431 | ||||||||||
|
At
December 31, 2009, 11.6% of total loans and leases were concentrated with
construction end users.
|
||||||||||||||||||||
Average
loans and leases, net of unearned discount, decreased $108.46 million or 3.32%
and increased $270.74 million or 9.05% in 2009 and 2008, respectively. Loans and
leases, net of unearned discount, at December 31, 2009, were $3.09 billion and
were 68.10% of total assets, compared to $3.30 billion and 73.88% of total
assets at December 31, 2008.
Commercial
and agricultural lending, excluding those loans secured by real estate,
decreased $97.22 million or 15.11% in 2009 over 2008. Commercial and
agricultural lending outstandings were $546.22 million and $643.44 million at
December 31, 2009 and December 31, 2008, respectively. This decrease
was
mainly
due to the weak economy in our geographic markets. Businesses reduced their
working capital line of credit borrowings given lower accounts receivable and
inventory levels caused by a decline in their sales. The weak economy also
accounted for a reduction in term loan financing attributed to less equipment
purchases by companies in our market.
Loans
secured by real estate increased $33.47 million or 3.64% during 2009 over 2008.
Loans secured by real estate outstanding at December 31, 2009 were $952.22
million and $918.75 million at December 31, 2008. Loans on commercial real
estate, the majority of which is owner occupied, were $580.71 million at
December 31, 2009 and $574.39 million at December 31, 2008. Residential mortgage
lending was $371.51 million at December 31, 2009 and $344.36 million at December
31, 2008. The increase in residential mortgage lending was primarily due to a
higher volume of refinance activity as a result of lower market interest rates
and our decision to retain more loans in our portfolio.
Auto,
light truck, and environmental equipment financing decreased $4.10 million or
1.16% in 2009 over 2008. At December 31, 2009, auto, light truck, and
environmental equipment financing had outstandings of $349.74 million and
$353.84 million at December 31, 2008.
Medium
and heavy duty truck loans and leases decreased $38.83 million or 15.95%, in
2009. Medium and heavy duty truck financing at December 31, 2009 and 2008 had
outstandings of $204.55 million and $243.38 million, respectively. Most of the
decrease at December 31, 2009 from December 31, 2008 can be attributed to a
reduced need for funding as over-capacity issues caused our customer base to
downsize their fleets.
Aircraft
financing at year-end 2009 decreased $14.74 million or 2.33% from year-end 2008.
Aircraft financing at December 31, 2009 and 2008 had outstandings of $617.38
million and $632.12 million, respectively. The demand for aircraft financing in
the United States declined while international demand increased.
Construction
equipment financing decreased $62.68 million or 16.67% in 2009 compared to 2008.
Construction equipment financing at December 31, 2009 had outstandings of
$313.30 million, compared to outstandings of $375.98 million at December 31,
2008. The decrease in this category was primarily due to a national decrease in
construction related activity and a substantial decrease in sales of both new
and used construction equipment.
Consumer
loans decreased $20.97 million or 16.04% in 2009 over 2008. Consumer loans
outstanding at December 31, 2009, were $109.74 million and $130.71 million at
December 31, 2008. The decrease during 2009 was due to the economic slow down
which caused an increase in the unemployment rates in our primary markets,
thereby decreasing the demand for consumer loans.
The
following table shows the maturities of loans and leases in the categories of
commercial and agriculture, auto, light truck and environmental equipment,
medium and heavy duty truck, aircraft and construction equipment outstanding as
of December 31, 2009. The amounts due after one year are also classified
according to the sensitivity to changes in interest rates.
|
(Dollars
in thousands)
|
0-1
Year
|
1-5
Years
|
Over
5 Years
|
Total
|
||||||||||||
|
Commercial
and agricultural loans
|
$ | 320,731 | $ | 203,362 | $ | 22,129 | $ | 546,222 | ||||||||
|
Auto,
light truck and environmental equipment
|
182,983 | 163,220 | 3,538 | 349,741 | ||||||||||||
|
Medium
and heavy duty truck
|
88,320 | 114,946 | 1,279 | 204,545 | ||||||||||||
|
Aircraft
financing
|
205,095 | 353,945 | 58,344 | 617,384 | ||||||||||||
|
Construction
equipment financing
|
129,965 | 182,006 | 1,329 | 313,300 | ||||||||||||
|
Total
|
$ | 927,094 | $ | 1,017,479 | $ | 86,619 | $ | 2,031,192 | ||||||||
|
Rate
Sensitivity (Dollars in
thousands)
|
Fixed
Rate
|
Variable
Rate
|
Total
|
|||||||||
|
1 –
5 Years
|
$ | 613,928 | $ | 403,551 | $ | 1,017,479 | ||||||
|
Over
5 Years
|
7,031 | 79,588 | 86,619 | |||||||||
|
Total
|
$ | 620,959 | $ | 483,139 | $ | 1,104,098 | ||||||
Most of the Bank's residential mortgages are sold into the secondary market. Mortgage loans held for sale were $26.65 million at December 31, 2009 and were $46.69 million at December 31, 2008. Although 1st Source Bank is participating in the U.S. Treasury Making Home Affordable programs, we do not feel it has a material effect on our financial condition or results of operations.
A loan is
considered a restructured loan in cases where a borrower experiences financial
difficulties and we make certain concessionary modifications to contractual
terms. Loans restructured at a rate equal to or greater than that of a new loan
with comparable risk at the time the contract is modified may be excluded from
restructured loan disclosures after a period of six months if they are in
compliance with the modified terms. Restructured loans that are accruing
interest total $18.31 million at December 31, 2009 and $6.74 million at December
31, 2008.
Credit
Experience
Reserve for Loan and Lease
Losses — Our reserve for loan and lease losses is provided for by direct
charges to operations. Losses on loans and leases are charged against the
reserve and likewise, recoveries during the period for prior losses are credited
to the reserve. Our management evaluates the adequacy of the reserve quarterly,
reviewing all loans and leases over a fixed-dollar amount ($100,000) where the
internal credit rating is at or below a predetermined classification, actual and
anticipated loss experience, current economic events in specific industries, and
other pertinent factors including general economic conditions. Determination of
the reserve is inherently subjective as it requires significant estimates,
including the amounts and timing of expected future cash flows or fair value of
collateral on collateral-dependent impaired loans and leases, estimated losses
on pools of homogeneous loans and leases based on historical loss experience,
and consideration of economic trends, all of which may be susceptible to
significant and unforeseen changes. We review the status of the loan and lease
portfolio to identify borrowers that might develop financial problems in order
to aid borrowers in the handling of their accounts and to mitigate losses. See
Part II, Item 8, Financial Statements and Supplementary Data — Note 1 of the
Notes to Consolidated Financial Statements for additional information on
management’s evaluation of the adequacy of the reserve for loan and lease
losses.
The
reserve for loan and lease losses at December 31, 2009, totaled $88.24 million
and was 2.85% of loans and leases, compared to $79.78 million or 2.42% of loans
and leases at December 31, 2008 and $66.60 million or 2.09% of loans and leases
at December 31, 2007. It is our opinion that the reserve for loan and lease
losses was adequate to absorb losses inherent in the loan and lease portfolio as
of December 31, 2009.
Charge-offs
for loan and lease losses were $28.22 million for 2009, compared to $8.39
million for 2008 and $7.37 million for 2007. Charge-offs increased in 2009 and
2008 as a result of an increase in nonperforming loans and leases related to
weaker economic conditions.
The
provision for loan and lease losses was $31.10 million for 2009, compared to the
provision for loan and lease losses of $16.65 million for 2008 and the provision
for loan and lease losses of $7.53 million for 2007. The increased provision for
loan and lease losses in 2009 and 2008 was due to the deterioration in the loan
portfolio mainly due to the deterioration in the economy.
The
following table summarizes our loan and lease loss experience for each of the
last five years ended December 31:
|
(Dollars
in thousands)
|
2009
|
2008
|
2007
|
2006
|
2005
|
|||||||||||||||
|
Amounts
of loans and leases outstanding
|
||||||||||||||||||||
|
at
end of period
|
$ | 3,093,150 | $ | 3,298,212 | $ | 3,191,441 | $ | 2,702,537 | $ | 2,463,431 | ||||||||||
|
Average
amount of net loans and leases outstanding
|
||||||||||||||||||||
|
during
period
|
$ | 3,154,820 | $ | 3,263,276 | $ | 2,992,540 | $ | 2,566,217 | $ | 2,348,690 | ||||||||||
|
Balance
of reserve for loan and lease losses
|
||||||||||||||||||||
|
at
beginning of period
|
$ | 79,776 | $ | 66,602 | $ | 58,802 | $ | 58,697 | $ | 63,672 | ||||||||||
|
Charge-offs:
|
||||||||||||||||||||
|
Commercial
and agricultural loans
|
8,809 | 1,580 | 1,841 | 1,038 | 1,478 | |||||||||||||||
|
Auto,
light truck and environmental equipment
|
2,750 | 234 | 1,770 | 340 | 630 | |||||||||||||||
|
Medium
and heavy duty truck
|
2,071 | 924 | 569 | - | 15 | |||||||||||||||
|
Aircraft
financing
|
7,812 | 462 | 378 | 1,126 | 2,424 | |||||||||||||||
|
Construction
equipment financing
|
1,476 | 1,695 | 799 | 118 | - | |||||||||||||||
|
Loans
secured by real estate
|
2,753 | 879 | 356 | 129 | 167 | |||||||||||||||
|
Consumer
loans
|
2,544 | 2,619 | 1,654 | 1,203 | 858 | |||||||||||||||
|
Total
charge-offs
|
28,215 | 8,393 | 7,367 | 3,954 | 5,572 | |||||||||||||||
|
Recoveries:
|
||||||||||||||||||||
|
Commercial
and agricultural loans
|
3,193 | 1,177 | 2,356 | 1,594 | 1,308 | |||||||||||||||
|
Auto,
light truck and environmental equipment
|
310 | 330 | 446 | 430 | 1,140 | |||||||||||||||
|
Medium
and heavy duty truck
|
5 | 248 | 64 | 59 | 174 | |||||||||||||||
|
Aircraft
financing
|
983 | 2,230 | 1,779 | 3,612 | 2,255 | |||||||||||||||
|
Construction
equipment financing
|
444 | 139 | 19 | 753 | 1,065 | |||||||||||||||
|
Loans
secured by real estate
|
36 | 171 | 169 | 31 | 89 | |||||||||||||||
|
Consumer
loans
|
603 | 624 | 421 | 316 | 421 | |||||||||||||||
|
Total
recoveries
|
5,574 | 4,919 | 5,254 | 6,795 | 6,452 | |||||||||||||||
|
Net
charge-offs (recoveries)
|
22,641 | 3,474 | 2,113 | (2,841 | ) | (880 | ) | |||||||||||||
|
Provision
for (recovery of provision for) loan and lease losses
|
31,101 | 16,648 | 7,534 | (2,736 | ) | (5,855 | ) | |||||||||||||
|
Reserves
acquired in acquisitions
|
- | - | 2,379 | - | - | |||||||||||||||
|
Balance
at end of period
|
$ | 88,236 | $ | 79,776 | $ | 66,602 | $ | 58,802 | $ | 58,697 | ||||||||||
|
Ratio
of net charge-offs (recoveries) to average net
|
||||||||||||||||||||
|
loans
and leases outstanding
|
0.72 | % | 0.11 | % | 0.07 | % | (0.11 | )% | (0.04 | )% | ||||||||||
|
Ratio
of reserve for loan and lease losses to net loans
|
||||||||||||||||||||
|
and
leases outstanding end of period
|
2.85 | % | 2.42 | % | 2.09 | % | 2.18 | % | 2.38 | % | ||||||||||
|
Coverage
ratio of reserve for loan and lease losses to
|
||||||||||||||||||||
|
non-performing
loans and leases
|
104.84 | % | 212.30 | % | 592.49 | % | 374.75 | % | 349.45 | % | ||||||||||
Net
charge-offs (recoveries) as a percentage of average loans and leases by
portfolio type follow:
|
2009
|
2008
|
2007
|
2006
|
2005
|
||||||
|
Commercial
and agricultural loans
|
0.95%
|
|
0.06%
|
|
(0.09)%
|
|
(0.12)%
|
|
0.04%
|
|
|
Auto,
light truck and environmental equipment
|
0.73
|
(0.03)
|
0.40
|
(0.03)
|
(0.17)
|
|||||
|
Medium
and heavy duty truck
|
0.93
|
0.25
|
0.16
|
(0.02)
|
(0.06)
|
|||||
|
Aircraft
financing
|
1.09
|
(0.30)
|
(0.26)
|
(0.54)
|
0.04
|
|||||
|
Construction
equipment financing
|
0.30
|
0.41
|
0.22
|
(0.24)
|
(0.51)
|
|||||
|
Loans
secured by real estate
|
0.30
|
0.08
|
0.02
|
0.02
|
0.01
|
|||||
|
Consumer
loans
|
1.63
|
1.44
|
0.88
|
0.74
|
0.41
|
|||||
|
Total
net charge-offs (recoveries) to average portfolio loans and
leases
|
0.72%
|
|
0.11%
|
|
0.07%
|
|
(0.11)%
|
|
(0.04)%
|
|
The
reserve for loan and lease losses has been allocated according to the amount
deemed necessary to provide for the estimated probable losses that have been
incurred within the categories of loans and leases set forth in the table below.
The amount of such components of the reserve at December 31 and the ratio of
such loan and lease categories to total outstanding loan and lease balances, are
as follows:
|
2009
|
2008
|
2007
|
2006
|
2005
|
||||||||||||||||||||||||||||||||||||
|
Percent
of
|
Percent
of
|
Percent
of
|
Percent
of
|
Percent
of
|
||||||||||||||||||||||||||||||||||||
|
Loans
and
|
Loans
and
|
Loans
and
|
Loans
and
|
Loans
and
|
||||||||||||||||||||||||||||||||||||
|
Leases
|
Leases
|
Leases
|
Leases
|
Leases
|
||||||||||||||||||||||||||||||||||||
|
in
Each
|
in
Each
|
in
Each
|
in
Each
|
in
Each
|
||||||||||||||||||||||||||||||||||||
|
Category
|
Category
|
Category
|
Category
|
Category
|
||||||||||||||||||||||||||||||||||||
|
to
Total
|
to
Total
|
to
Total
|
to
Total
|
to
Total
|
||||||||||||||||||||||||||||||||||||
|
Reserve
|
Loans
and
|
Reserve
|
Loans
and
|
Reserve
|
Loans
and
|
Reserve
|
Loan
and
|
Reserve
|
Loans
and
|
|||||||||||||||||||||||||||||||
|
(Dollars
in thousands)
|
Amount
|
Leases
|
Amount
|
Leases
|
Amount
|
Leases
|
Amount
|
Leases
|
Amount
|
Leases
|
||||||||||||||||||||||||||||||
|
Commercial
and agricultural loans
|
$ | 23,852 | 17.66 | % | $ | 23,025 | 19.51 | % | $ | 17,393 | 18.61 | % | $ | 14,547 | 17.70 | % | $ | 15,472 | 18.40 | % | ||||||||||||||||||||
|
Auto,
light truck, and environmental equipment
|
10,334 | 11.31 | 9,852 | 10.73 | 7,242 | 9.57 | 7,022 | 11.75 | 6,877 | 12.62 | ||||||||||||||||||||||||||||||
|
Medium
and heavy duty truck
|
6,095 | 6.61 | 8,915 | 7.38 | 8,775 | 9.41 | 6,337 | 12.65 | 6,131 | 12.26 | ||||||||||||||||||||||||||||||
|
Aircraft
financing
|
24,594 | 19.96 | 19,163 | 19.17 | 17,761 | 18.39 | 18,621 | 18.46 | 19,583 | 18.66 | ||||||||||||||||||||||||||||||
|
Construction
equipment financing
|
8,839 | 10.13 | 10,672 | 11.40 | 6,171 | 11.84 | 5,030 | 11.32 | 4,235 | 9.10 | ||||||||||||||||||||||||||||||
|
Loans
secured by real estate
|
11,162 | 30.78 | 4,602 | 27.85 | 6,320 | 27.62 | 4,672 | 23.40 | 4,058 | 24.40 | ||||||||||||||||||||||||||||||
|
Consumer
loans
|
3,360 | 3.55 | 3,547 | 3.96 | 2,940 | 4.56 | 2,573 | 4.72 | 2,341 | 4.56 | ||||||||||||||||||||||||||||||
|
Total
|
$ | 88,236 | 100.00 | % | $ | 79,776 | 100.00 | % | $ | 66,602 | 100.00 | % | $ | 58,802 | 100.00 | % | $ | 58,697 | 100.00 | % | ||||||||||||||||||||
Nonperforming Assets —
Nonperforming assets include nonaccrual loans, restructured loans not performing
in accordance with modified terms, other real estate, former bank premises held
for sale, repossessions and other nonperforming assets we own. Our policy is to
discontinue the accrual of interest on loans and leases where principal or
interest is past due and remains unpaid for 90 days or more, or when an
individual analysis of a borrower's credit worthiness indicates a credit should
be placed on nonperforming status, except for residential mortgage loans, which
are placed on nonaccrual at the time the loan is placed in foreclosure and
consumer loans that are both well secured and in the process of collection.
Nonperforming assets amounted to $101.01 million at December 31, 2009, compared
to $44.17 million at December 31, 2008, and $18.48 million at December 31, 2007.
Included in nonperforming loans were restructured loans that are not accruing
interest of $2.63 million at December 31, 2009 and none at December 31, 2008.
During 2009, interest income on nonaccrual loans and leases would have increased
by approximately $5.17 million compared to $1.54 million in 2008 if these loans
and leases had earned interest at their full contract rate.
Nonperforming
assets at December 31, 2009 increased from December 31, 2008, mainly due to
increases in nonaccrual loans and leases. The increase in nonaccrual loans and
leases was spread among the various loan portfolios. The largest dollar
increases during the most recent year occurred in the commercial and aircraft
portfolios. As of December 31, 2009, the industry with the largest dollar
exposure was with borrowers whose primary source of income was derived from
commercial real estate. These loans totaled approximately $25.74 million which
were comprised of $20.77 million secured by commercial real estate and included
in loans secured by real estate and $4.98 million secured by aircraft and
included in aircraft financing. We have limited exposure to commercial real
estate. However, our borrowers with commercial real estate exposure, whether
they be local real estate developers in our commercial portfolio or customers in
our niche portfolios such as aircraft whose underlying business is dependent on
developing, marketing and managing real estate properties, have suffered as a
result of declining real estate values and minimal sales activity. Furthermore,
aircraft values declined during 2009, increasing the risk in aircraft secured
transactions. Medium and heavy duty trucks are also a large exposure area for
us. Medium and heavy duty trucks non-accrual loans and leases increased to
$11.62 million as of December 31, 2009, up from $7.80 million as of December 31,
2008. The trucking industry has suffered from overcapacity, underutilization,
aging fleets and declining collateral values which are expected to remain weak
through 2011.
As of
December 31, 2008, we had $0.29 million of loans classified as troubled debt
restructuring. There were no loans classified as troubled debt restructurings at
December 31, 2009.
|
Nonperforming
assets at December 31 (Dollars in
thousands)
|
2009
|
2008
|
2007
|
2006
|
2005
|
|||||||||||||||
|
Loans
past due over 90 days
|
$ | 628 | $ | 1,022 | $ | 1,105 | $ | 116 | $ | 245 | ||||||||||
|
Nonaccrual
loans and leases and restructured loans:
|
||||||||||||||||||||
|
Commercial
and agricultural loans
|
7,953 | 5,399 | 1,597 | 1,768 | 3,701 | |||||||||||||||
|
Auto,
light truck and environmental equipment
|
9,200 | 709 | 507 | 481 | 812 | |||||||||||||||
|
Medium
and heavy duty truck
|
11,624 | 7,801 | 277 | 1,755 | 17 | |||||||||||||||
|
Aircraft
financing
|
6,024 | 9,975 | 1,846 | 8,219 | 7,641 | |||||||||||||||
|
Construction
equipment financing
|
7,218 | 1,934 | 1,196 | 853 | 2,513 | |||||||||||||||
|
Loans
secured by real estate
|
41,387 | 9,147 | 3,581 | 2,214 | 1,475 | |||||||||||||||
|
Consumer
loans
|
131 | 1,590 | 1,132 | 285 | 393 | |||||||||||||||
|
Total
nonaccrual loans and leases and restructured loans
|
83,537 | 36,555 | 10,136 | 15,575 | 16,552 | |||||||||||||||
|
Total
nonperforming loans and leases
|
84,165 | 37,577 | 11,241 | 15,691 | 16,797 | |||||||||||||||
|
Other
real estate
|
4,039 | 1,381 | 783 | 800 | 960 | |||||||||||||||
|
Former
bank premises held for sale
|
2,490 | 3,356 | 4,038 | - | - | |||||||||||||||
|
Repossessions:
|
||||||||||||||||||||
|
Commercial
and agricultural loans
|
164 | 53 | 45 | 2 | - | |||||||||||||||
|
Auto,
light truck and environmental equipment
|
336 | 226 | 183 | 178 | 128 | |||||||||||||||
|
Medium
and heavy duty truck
|
- | 1,248 | 54 | - | - | |||||||||||||||
|
Aircraft
financing
|
9,391 | 16 | 1,850 | 300 | 4,073 | |||||||||||||||
|
Construction
equipment financing
|
238 | 67 | 92 | 400 | - | |||||||||||||||
|
Consumer
loans
|
36 | 59 | 67 | 95 | 83 | |||||||||||||||
|
Total
repossessions
|
10,165 | 1,669 | 2,291 | 975 | 4,284 | |||||||||||||||
|
Operating
leases
|
154 | 185 | 126 | 201 | - | |||||||||||||||
|
Total
nonperforming assets
|
$ | 101,013 | $ | 44,168 | $ | 18,479 | $ | 17,667 | $ | 22,041 | ||||||||||
|
Nonperforming
loans and leases to loans and leases,
|
||||||||||||||||||||
|
net
of unearned discount
|
2.72 | % | 1.14 | % | 0.35 | % | 0.58 | % | 0.68 | % | ||||||||||
|
Nonperforming
assets to loans and leases and operating leases,
|
||||||||||||||||||||
|
net
of unearned discount
|
3.15 | % | 1.30 | % | 0.56 | % | 0.64 | % | 0.87 | % | ||||||||||
Potential Problem Loans —
Potential problem loans consist of loans that are performing but for which
management has concerns about the ability of a borrower to continue to comply
with repayment terms because of the borrower’s potential operating or financial
difficulties. Management monitors these loans closely and reviews their
performance on a regular basis. As of December 31, 2009, we had $12.08 million
in loans of this type which are not included in either of the non-accrual or 90
days past due loan categories. At December 31, 2009, potential problem loans
consisted of seven credit relationships. Weakness in these companies' operating
performance has caused us to heighten attention given to these
credits.
Foreign Outstandings — Our
foreign loan and lease outstandings denominated in U.S. dollars were $131.18
million and $88.03 million as of December 31, 2009 and 2008,
respectively. Foreign loans and leases are in aircraft financing.
Loan and lease outstandings to borrowers in Brazil were $87.66 million and
$54.52 million as of December 31, 2009 and 2008, respectively. Outstanding
balances to borrowers in other countries were insignificant.
Investment
Portfolio
The
amortized cost of securities at year-end 2009 increased 24.89% from 2008,
following a 7.80% decrease from year-end 2007 to year-end 2008. The amortized
cost of securities at December 31, 2009 was $893.44 million or 19.67% of total
assets, compared to $715.38 million or 16.02% of total assets at December 31,
2008. The increase in the investment portfolio in 2009 was due to the investment
of excess funds as deposit outstandings increased and loan outstandings
decreased.
The
amortized cost of securities available-for-sale as of December 31 is summarized
as follows:
|
(Dollars
in thousands)
|
2009
|
2008
|
2007
|
|||||||||
|
U.S.
Treasury and Federal agencies securities
|
$ | 390,189 | $ | 293,461 | $ | 284,214 | ||||||
|
U.S.
States and political subdivisions securities
|
188,706 | 198,640 | 258,260 | |||||||||
|
Mortgage-backed
securities - Federal agencies
|
286,415 | 207,954 | 199,382 | |||||||||
|
Corporate
debt securities
|
26,166 | 10,494 | 6,631 | |||||||||
|
Foreign
government securities
|
675 | 435 | 665 | |||||||||
|
Marketable
equity securities
|
1,288 | 4,396 | 26,770 | |||||||||
|
Total
investment securities available-for-sale
|
$ | 893,439 | $ | 715,380 | $ | 775,922 | ||||||
Yields on
tax-exempt obligations are calculated on a fully tax equivalent basis assuming a
35% tax rate. The following table shows the maturities of securities
available-for-sale at December 31, 2009, at the amortized costs and weighted
average yields of such securities:
|
(Dollars
in thousands)
|
Amount
|
Yield
|
||||||
|
U.S.
Treasury and Federal agencies securities
|
||||||||
|
Under
1 year
|
$ | 20,004 | 0.92 | % | ||||
|
1 –
5 years
|
228,239 | 2.60 | ||||||
|
5 –
10 years
|
141,946 | 3.45 | ||||||
|
Over
10 years
|
- | - | ||||||
|
Total
U.S. Treasury and Federal agencies securities
|
390,189 | 2.83 | ||||||
|
U.S.
States and political subdivisions securities
|
||||||||
|
Under
1 year
|
35,466 | 4.49 | ||||||
|
1 –
5 years
|
78,590 | 5.48 | ||||||
|
5 –
10 years
|
58,817 | 5.64 | ||||||
|
Over
10 years
|
15,833 | 1.26 | ||||||
|
Total
U.S. States and political subdivisions securities
|
188,706 | 4.99 | ||||||
|
Corporate
debt securities
|
||||||||
|
Under
1 year
|
10,996 | 1.28 | ||||||
|
1 –
5 years
|
15,170 | 1.82 | ||||||
|
5 –
10 years
|
- | - | ||||||
|
Over
10 years
|
- | - | ||||||
|
Total
Corporate debt securities
|
26,166 | 1.59 | ||||||
|
Foreign
government securities
|
||||||||
|
Under
1 year
|
100 | 4.05 | ||||||
|
1 –
5 years
|
575 | 3.77 | ||||||
|
5 –
10 years
|
- | - | ||||||
|
Over
10 years
|
- | - | ||||||
|
Total
Foreign government securities
|
675 | 3.81 | ||||||
|
Mortgage-backed
securities - Federal agencies
|
286,415 | 3.97 | ||||||
|
Marketable
equity securities
|
1,288 | 9.45 | ||||||
|
Total
investment securities available-for-sale
|
$ | 893,439 | 3.62 | % | ||||
Deposits
The
average daily amounts of deposits and rates paid on such deposits are summarized
as follows:
|
2009
|
2008
|
2007
|
||||||||||||||||||||||
|
(Dollars
in thousands)
|
Amount
|
Rate
|
Amount
|
Rate
|
Amount
|
Rate
|
||||||||||||||||||
|
Noninterest
bearing demand deposits
|
$ | 427,513 | - | % | $ | 377,440 | - | % | $ | 351,050 | - |
%
|
||||||||||||
|
Interest
bearing demand deposits
|
1,209,800 | 0.62 | 1,137,491 | 1.82 | 988,308 | 3.10 | ||||||||||||||||||
|
Savings
deposits
|
325,801 | 0.29 | 285,538 | 0.63 | 250,927 | 1.21 | ||||||||||||||||||
|
Other
time deposits
|
1,610,534 | 3.42 | 1,573,801 | 4.09 | 1,679,521 | 4.85 | ||||||||||||||||||
|
Total
deposits
|
$ | 3,573,648 | $ | 3,374,270 | $ | 3,269,806 | ||||||||||||||||||
See Part II, Item 8, Financial Statements and Supplementary Data — Note 10 of the Notes to Consolidated Financial Statements for additional information on deposits.
Short-Term
Borrowings
The
following table shows the distribution of our short-term borrowings and the
weighted average interest rates thereon at the end of each of the last three
years. Also provided are the maximum amount of borrowings and the average amount
of borrowings, as well as weighted average interest rates for the last three
years.
|
Federal
Funds
|
||||||||||||||||
|
Purchased
and
|
||||||||||||||||
|
Security
|
Other
|
|||||||||||||||
|
Repurchase
|
Commercial
|
Short-Term
|
Total
|
|||||||||||||
|
(Dollars
in thousands)
|
Agreements
|
Paper
|
Borrowings
|
Borrowings
|
||||||||||||
|
2009
|
||||||||||||||||
|
Balance
at December 31, 2009
|
$ | 123,787 | $ | 4,726 | $ | 21,597 | $ | 150,110 | ||||||||
|
Maximum
amount outstanding at any month-end
|
275,407 | 5,392 | 23,863 | 304,662 | ||||||||||||
|
Average
amount outstanding
|
161,529 | 4,048 | 20,070 | 185,647 | ||||||||||||
|
Weighted
average interest rate during the year
|
0.40 | % | 0.34 | % | 2.30 | % | 0.60 | % | ||||||||
|
Weighted
average interest rate for outstanding amounts at
|
||||||||||||||||
|
December
31, 2009
|
0.25 | % | 0.43 | % | 1.80 | % | 0.48 | % | ||||||||
|
2008
|
||||||||||||||||
|
Balance
at December 31, 2008
|
$ | 272,529 | $ | 4,461 | $ | 19,185 | $ | 296,175 | ||||||||
|
Maximum
amount outstanding at any month-end
|
359,452 | 9,875 | 247,828 | 617,155 | ||||||||||||
|
Average
amount outstanding
|
270,503 | 7,694 | 108,653 | 386,850 | ||||||||||||
|
Weighted
average interest rate during the year
|
1.97 | % | 2.35 | % | 1.95 | % | 1.97 | % | ||||||||
|
Weighted
average interest rate for outstanding amounts at
|
||||||||||||||||
|
December
31, 2008
|
0.49 | % | 0.29 | % | 2.92 | % | 0.65 | % | ||||||||
|
2007
|
||||||||||||||||
|
Balance
at December 31, 2007
|
$ | 303,429 | $ | 10,783 | $ | 23,620 | $ | 337,832 | ||||||||
|
Maximum
amount outstanding at any month-end
|
327,623 | 15,478 | 42,784 | 385,885 | ||||||||||||
|
Average
amount outstanding
|
246,792 | 12,598 | 11,987 | 271,377 | ||||||||||||
|
Weighted
average interest rate during the year
|
3.92 | % | 4.84 | % | 5.49 | % | 4.03 | % | ||||||||
|
Weighted
average interest rate for outstanding amounts at
|
||||||||||||||||
|
December
31, 2007
|
2.98 | % | 4.04 | % | 2.60 | % | 2.99 | % | ||||||||
Liquidity
Core Deposits — Our major
source of investable funds is provided by stable core deposits consisting of all
interest bearing and noninterest bearing deposits, excluding brokered
certificates of deposit and certain certificates of deposit of $100,000 and
over. In 2009, average core deposits equaled 68.13% of average total assets,
compared to 66.31% in 2008 and 67.12% in 2007. The effective cost rate of core
deposits in 2009 was 1.54%, compared to 2.36% in 2008 and 3.25% in
2007.
Average
demand deposits (noninterest bearing core deposits) increased 13.27% in 2009
compared to an increase of 7.52% in 2008. These represented 13.93% of total core
deposits in 2009, compared to 12.93% in 2008, and 12.60% in 2007.
Purchased Funds — We use
purchased funds to supplement core deposits, which include certain certificates
of deposit of $100,000 and over, brokered certificates of deposit, over-night
borrowings, securities sold under agreements to repurchase, commercial paper,
and other short-term borrowings. Purchased funds are raised from customers
seeking short-term investments and are used to manage the Bank’s interest rate
sensitivity. During 2009, our reliance on purchased funds decreased to 15.30% of
average total assets from 19.16% in 2008.
Shareholders’ Equity — Average
shareholders’ equity equated to 12.57% of average total assets in 2009 compared
to 10.09% in 2008. Shareholders’ equity was 12.56% of total assets at year-end
2009, compared to 10.16% at year-end 2008. We include unrealized
gains (losses) on available-for-sale securities, net of income taxes, in
accumulated other comprehensive income (loss) which is a component of
shareholders’ equity. While regulatory capital adequacy ratios exclude
unrealized gains (losses), it does impact our equity as reported in the audited
financial statements. The unrealized gains (losses) on available-for-sale
securities, net of income taxes, were $5.09 million and $5.82 million at
December 31, 2009 and 2008, respectively.
Our sale
of preferred shares under the TARP Capital Purchase Program in January 2009
increased our shareholders' equity by $111.00 million. Our company plans to
repay the TARP funding when the national economic conditions and their impact on
our markets stabilize. The company maintains the cash and the capital necessary
to pay the TARP back once we are sure there is a sustainable recovery and a low
likelihood of another downward trend in the economy.
Liquidity Risk Management —
The Bank's liquidity is monitored and closely managed by the Asset/Liability
Management Committee (ALCO), whose members are comprised of the Bank's senior
management. Asset and liability management includes the management of interest
rate sensitivity and the maintenance of an adequate liquidity position. The
purpose of interest rate sensitivity management is to stabilize net interest
income during periods of changing interest rates.
Liquidity
management is the process by which the Bank ensures that adequate liquid funds
are available to meet financial commitments on a timely basis. Financial
institutions must maintain liquidity to meet day-to-day requirements of
depositors and borrowers, take advantage of market opportunities and provide a
cushion against unforeseen needs.
Liquidity
of the Bank is derived primarily from core deposits, principal payments received
on loans, the sale and maturity of investment securities, net cash provided by
operating activities, and access to other funding sources. The most stable
source of liability-funded liquidity is deposit growth and retention of the core
deposit base. The principal source of asset-funded liquidity is
available-for-sale investment securities, cash and due from banks, overnight
investments, securities purchased under agreements to resell, and loans and
interest bearing deposits with other banks maturing within one year.
Additionally, liquidity is provided by repurchase agreements, and the ability to
borrow from the Federal Reserve Bank and Federal Home Loan Bank.
Interest Rate Risk Management
— ALCO monitors and manages the relationship of earning assets to interest
bearing liabilities and the responsiveness of asset yields, interest expense,
and interest margins to changes in market interest rates. In the normal course
of business, we face ongoing interest rate risks and uncertainties. We
occasionally utilize interest rate swaps to partially manage the primary market
exposures associated with the interest rate risk related to underlying assets,
liabilities, and anticipated transactions.
A
hypothetical change in earnings was modeled by calculating an immediate 100
basis point (1.00%) change in interest rates across all maturities. At December
31, 2009, the aggregate hypothetical increase in pre-tax earnings was estimated
to be $3.38 million on an annualized basis on all rate-sensitive financial
instruments, based on a hypothetical increase of a 100 basis point change in
interest rates and the aggregate hypothetical decrease in pre-tax earnings was
estimated to be $6.67 million on an annualized basis on all rate-sensitive
financial instruments based on a hypothetical decrease of a 100 basis point
change in interest rates. At December 31, 2008, the aggregate hypothetical
increase in pre-tax earnings was estimated to be $2.95 million on an annualized
basis on all rate-sensitive financial instruments, based on a hypothetical
increase of a 100 basis point change in interest rates and the aggregate
hypothetical decrease in pre-tax earnings was estimated to be $9.94 million on
an annualized basis on all rate-sensitive financial instruments based on a
hypothetical decrease of a 100 basis point change in interest rates. The
earnings simulation model excludes the earnings dynamics related to how fee
income and noninterest expense may be affected by changes in interest
rates. Actual results may differ materially from those projected. The
use of this methodology to quantify the market risk of the balance sheet should
not be construed as an endorsement of its accuracy or the accuracy of the
related assumptions. At December 31, 2009 and 2008, the impact of these
hypothetical fluctuations in interest rates on our derivative holdings was not
significant, and, as such, separate disclosure is not presented.
We manage
the interest rate risk related to loan commitments by entering into contracts
for future delivery of loans with outside parties. See Part II, Item 8,
Financial Statements and Supplementary Data — Note 18 of the Notes to
Consolidated Financial Statements.
Off-Balance Sheet
Arrangements and Contractual Obligations
In the
ordinary course of operations, we enter into certain contractual obligations.
Such obligations include the funding of operations through debt issuances as
well as leases for premises and equipment. The following table summarizes our
significant fixed, determinable, and estimated contractual obligations, by
payment date, at December 31, 2009, except for obligations associated with
short-term borrowing arrangements. Payments for borrowings do not include
interest. Further discussion of the nature of each obligation is included in the
referenced note to the consolidated financial statements.
Contractual
obligation payments by period follows:
|
Indeterminate
|
||||||||||||||||||||||||||||
|
(Dollars
in thousands)
|
Note
|
0 –
1 Year
|
1 –
3 Years
|
3 –
5 Years
|
Over
5 Years
|
maturity
|
Total
|
|||||||||||||||||||||
|
Deposits
without stated maturity
|
- | $ | 2,167,087 | $ | - | $ | - | $ | - | $ | - | $ | 2,167,087 | |||||||||||||||
|
Certificates
of deposit
|
- | 1,006,850 | 362,101 | 102,175 | 14,251 | - | 1,485,377 | |||||||||||||||||||||
|
Long-term
debt
|
11 | 10,317 | 265 | 105 | 873 | 8,201 | 19,761 | |||||||||||||||||||||
|
Subordinated
notes
|
12 | - | - | - | 89,692 | - | 89,692 | |||||||||||||||||||||
|
Operating
leases
|
18 | 2,597 | 3,504 | 1,055 | 1,144 | - | 8,300 | |||||||||||||||||||||
|
Purchase
obligations
|
- | 16,562 | 2,817 | 11 | - | - | 19,390 | |||||||||||||||||||||
|
Total
contractual obligations
|
$ | 3,203,413 | $ | 368,687 | $ | 103,346 | $ | 105,960 | $ | 8,201 | $ | 3,789,607 | ||||||||||||||||
We routinely enter into contracts for services. These contracts may require payment for services to be provided in the future and may also contain penalty clauses for early termination of the contract. We have made a diligent effort to estimate such payments and penalties, where applicable. Additionally, where necessary, we have made reasonable estimates as to certain purchase obligations as of December 31, 2009. Our management has used the best information available to make the estimations necessary to value the related purchase obligations. Our management is not aware of any additional commitments or contingent liabilities which may have a material adverse impact on our liquidity or capital resources at year-end 2009. In 2009, we incurred new long-term obligations under our preferred shares issued under the TARP Capital Purchase Program. See Part II, Item 8, Financial Statements and Supplementary Data —Note 13 of the Notes to Consolidated Financial Statements.
We also
enter into derivative contracts under which we are required to either receive
cash from, or pay cash to, counterparties depending on changes in interest
rates. Derivative contracts are carried at fair value on the consolidated
balance sheet with the fair value representing the net present value of expected
future cash receipts or payments based on market interest rates as of the
balance sheet date. The fair value of the contracts change daily as market
interest rates change. Because the derivative assets and liabilities recorded on
the balance sheet at December 31, 2009 do not necessarily represent the amounts
that may ultimately be paid under these contracts, these assets and liabilities
are not included in the table of contractual obligations presented
above.
In
addition, due to the uncertainty with respect to the timing of future cash flows
associated the with our unrecognized tax benefits at December 31, 2009, we are
unable to make reasonably reliable estimates of the period of cash settlement
with the respective taxing authority. Therefore, $1.85 million of unrecognized
tax benefits have been excluded from the contractual obligations table above.
See Note 17 of the Notes to Consolidated Financial Statements for a discussion
on income taxes.
Assets
under management and assets under custody are held in fiduciary or custodial
capacity for our clients. In accordance with U. S. generally accepted accounting
principles, these assets are not included on our balance sheet.
We are
also party to financial instruments with off-balance sheet risk in the normal
course of business to meet the financing needs of our clients. These financial
instruments include commitments to extend credit and standby letters of credit.
Further discussion of these commitments is included in Part II, Item 8,
Financial Statements and Supplementary Data — Note 18 of the Notes to
Consolidated Financial Statements.
Quarterly Results of
Operations
The
following table sets forth unaudited consolidated selected quarterly statement
of operations data for the years ended December 31, 2009 and 2008.
|
Three
Months Ended (Dollars in
thousands, except per share amounts)
|
March
31
|
June
30
|
September
30
|
December
31
|
||||||||||||
|
2009
|
||||||||||||||||
|
Interest
income
|
$ | 50,676 | $ | 50,630 | $ | 49,741 | $ | 49,365 | ||||||||
|
Interest
expense
|
19,954 | 18,717 | 17,695 | 15,834 | ||||||||||||
|
Net
interest income
|
30,722 | 31,913 | 32,046 | 33,531 | ||||||||||||
|
Provision
for loan and lease losses
|
7,785 | 8,487 | 6,469 | 8,360 | ||||||||||||
|
Investment
securities and other investment (losses) gains
|
(469 | ) | 426 | 716 | 1,014 | |||||||||||
|
Income
before income taxes
|
4,846 | 8,782 | 9,263 | 8,627 | ||||||||||||
|
Net
income
|
6,251 | 6,283 | 6,733 | 6,223 | ||||||||||||
|
Net
income available to common shareholders
|
4,938 | 4,587 | 5,032 | 4,517 | ||||||||||||
|
Diluted
net income per common share
|
0.20 | 0.19 | 0.21 | 0.19 | ||||||||||||
|
2008
|
||||||||||||||||
|
Interest
income
|
$ | 62,124 | $ | 58,579 | $ | 58,065 | $ | 56,540 | ||||||||
|
Interest
expense
|
29,827 | 25,455 | 24,668 | 23,198 | ||||||||||||
|
Net
interest income
|
32,297 | 33,124 | 33,397 | 33,342 | ||||||||||||
|
Provision
for loan and lease losses
|
1,539 | 4,493 | 3,571 | 7,045 | ||||||||||||
|
Investment
securities and other investment gains (losses)
|
623 | (1,066 | ) | (8,816 | ) | (738 | ) | |||||||||
|
Income
before income taxes
|
13,884 | 10,603 | 3,889 | 18,025 | ||||||||||||
|
Net
income
|
9,354 | 7,245 | 4,472 | 12,315 | ||||||||||||
|
Net
income available to common shareholders
|
9,354 | 7,245 | 4,472 | 12,315 | ||||||||||||
|
Diluted
net income per common share
|
0.38 | 0.30 | 0.18 | 0.50 | ||||||||||||
Net
income was $6.22 million for the fourth quarter of 2009, compared to the $12.32
million of net income reported for the fourth quarter of 2008. The 2008 fourth
quarter net income was positively impacted by the sale of certain assets of 1st
Source Corporation Investment Advisors to Wasatch Advisors, Inc. which resulted
in an $11.49 million pre-tax (after-tax $7.14 million) gain. Diluted net income
per common share for the fourth quarter of 2009 amounted to $0.19, compared to
$0.50 per common share reported in the fourth quarter of 2008.
The net
interest margin was 3.27% for the fourth quarter of 2009 versus 3.30% for the
same period in 2008. Tax-equivalent net interest income was $34.49 million for
the fourth quarter
of 2009, up slightly from 2008’s fourth quarter.
Our
provision for loan and lease losses was $8.36 million in the fourth quarter of
2009 compared to provision for loan and lease losses of $7.05 million in the
fourth quarter of 2008. Net charge-offs were $5.63
million for the fourth quarter 2009, compared to net charge-offs of $2.88
million a year ago.
Noninterest
income for the fourth quarter of 2009 was $22.02 million, compared to $30.23
million for the fourth quarter of 2008. The predominate factor causing the
decrease was the sale of certain assets of Investment Advisors for a gain of
$11.49 million in the fourth quarter 2008. This decrease was offset by an
increase in investment securities and other investment gains and mortgage
banking income. Noninterest expense for the fourth quarter of 2009 was $38.56
million and was relatively unchanged compared to the fourth quarter of
2008.
For
information regarding Quantitative and Qualitative Disclosures about Market
Risk, see Part II, Item 7, Management’s Discussion and Analysis of Financial
Condition and Results of Operations, Interest Rate Risk Management.
Report of Independent Registered Public Accounting
Firm
The Board
of Directors and Shareholders of 1st Source
Corporation
We have
audited 1st Source Corporation’s internal control over financial reporting as of
December 31, 2009, based on criteria established in Internal Control—Integrated
Framework issued by the Committee of Sponsoring Organizations of the Treadway
Commission (the COSO criteria). 1st Source Corporation’s management is
responsible for maintaining effective internal control over financial reporting,
and for its assessment of the effectiveness of internal control over financial
reporting included in the accompanying Management’s Report on Internal Control
over Financial Reporting. Our responsibility is to express an opinion
on the company’s internal control over financial reporting based on our
audit.
We
conducted our audit in accordance with the standards of the Public Company
Accounting Oversight Board (United States). Those standards require that we plan
and perform the audit to obtain reasonable assurance about whether effective
internal control over financial reporting was maintained in all material
respects. Our audit included obtaining an understanding of internal control over
financial reporting, assessing the risk that a material weakness exists, testing
and evaluating the design and operating effectiveness of internal control based
on the assessed risk, and performing such other procedures as we considered
necessary in the circumstances. We believe that our audit provides a reasonable
basis for our opinion.
A
company’s internal control over financial reporting is a process designed to
provide reasonable assurance regarding the reliability of financial reporting
and the preparation of financial statements for external purposes in accordance
with generally accepted accounting principles. A company’s internal control over
financial reporting includes those policies and procedures that (1) pertain to
the maintenance of records that, in reasonable detail, accurately and fairly
reflect the transactions and dispositions of the assets of the company; (2)
provide reasonable assurance that transactions are recorded as necessary to
permit preparation of financial statements in accordance with generally accepted
accounting principles, and that receipts and expenditures of the company are
being made only in accordance with authorizations of management and directors of
the company; and (3) provide reasonable assurance regarding prevention or timely
detection of unauthorized acquisition, use or disposition of the company’s
assets that could have a material effect on the financial
statements.
Because
of its inherent limitations, internal control over financial reporting may not
prevent or detect misstatements. Also, projections of any evaluation of
effectiveness to future periods are subject to the risk that controls may become
inadequate because of changes in conditions, or that the degree of compliance
with the policies or procedures may deteriorate.
In our
opinion, 1st Source Corporation maintained, in all material respects, effective
internal control over financial reporting as of December 31, 2009, based on the COSO criteria.
We also
have audited, in accordance with the standards of the Public Company Accounting
Oversight Board (United States), the consolidated statements of financial
condition of 1st Source Corporation as of December 31, 2009 and 2008, and the
related consolidated statements of income, shareholders’ equity and cash flows
for each of the three years in the period ended December 31, 2009 and our report
dated February 19, 2010 expressed an unqualified opinion
thereon.
/s/ Ernst &
Young LLP
Chicago,
Illinois
February
19, 2010
Report of
Independent Registered Public Accounting Firm
The Board
of Directors and Shareholders of 1st Source Corporation
We have
audited the accompanying consolidated statements of financial condition of 1st
Source Corporation and subsidiaries as of December 31, 2009 and 2008, and the
related consolidated statements of income, shareholders’ equity, and cash flows
for each of the three years in the period ended December 31,
2009. These financial statements are the responsibility of the
Company’s management. Our responsibility is to express an opinion on
these financial statements based on our audits.
We
conducted our audits in accordance with the standards of the Public Company
Accounting Oversight Board (United States). Those standards require
that we plan and perform the audit to obtain reasonable assurance about whether
the financial statements are free of material misstatement. An audit
includes examining, on a test basis, evidence supporting the amounts and
disclosures in the financial statements. An audit also includes
assessing the accounting principles used and significant estimates made by
management, as well as evaluating the overall financial statement
presentation. We believe that our audits provide a reasonable basis
for our opinion.
In our
opinion, the financial statements referred to above present fairly, in all
material respects, the consolidated financial position of 1st Source Corporation
and subsidiaries at December 31, 2009 and 2008, and the consolidated results of
their operations and their cash flows for each of the three years in the period
ended December 31, 2009, in conformity with U.S. generally accepted accounting
principles.
We also
have audited, in accordance with the standards of the Public Company Accounting
Oversight Board (United States), 1st Source Corporation’s internal control over
financial reporting as of December 31, 2009, based on criteria established in
Internal Control-Integrated Framework issued by the Committee of Sponsoring
Organizations of the Treadway Commission and our report dated February 19, 2010
expressed an unqualified opinion thereon.
/s/ Ernst &
Young LLP
Chicago,
Illinois
February
19, 2010
|
CONSOLIDATED
STATEMENTS OF FINANCIAL CONDITION
|
||||||||
|
December
31
(Dollars in thousands)
|
2009
|
2008
|
||||||
|
ASSETS
|
||||||||
|
Cash
and due from banks
|
$ | 72,872 | $ | 119,771 | ||||
|
Federal
funds sold and interest bearing deposits with other banks
|
141,166 | 6,951 | ||||||
|
Investment
securities available-for-sale
|
||||||||
|
(amortized
cost of $893,439 and $715,380 at December 31, 2009 and December 31, 2008,
respectively)
|
901,638 | 724,754 | ||||||
|
Other
investments
|
21,012 | 18,612 | ||||||
|
Trading
account securities
|
125 | 100 | ||||||
|
Mortgages
held for sale
|
26,649 | 46,686 | ||||||
|
Loans
and leases, net of unearned discount:
|
||||||||
|
Commercial
and agricultural loans
|
546,222 | 643,440 | ||||||
|
Auto,
light truck and environmental equipment
|
349,741 | 353,838 | ||||||
|
Medium
and heavy duty truck
|
204,545 | 243,375 | ||||||
|
Aircraft
financing
|
617,384 | 632,121 | ||||||
|
Construction
equipment financing
|
313,300 | 375,983 | ||||||
|
Loans
secured by real estate
|
952,223 | 918,749 | ||||||
|
Consumer
loans
|
109,735 | 130,706 | ||||||
|
Total
loans and leases
|
3,093,150 | 3,298,212 | ||||||
|
Reserve
for loan and lease losses
|
(88,236 | ) | (79,776 | ) | ||||
|
Net
loans and leases
|
3,004,914 | 3,218,436 | ||||||
|
Equipment
owned under operating leases, net
|
97,004 | 83,062 | ||||||
|
Net
premises and equipment
|
37,907 | 40,491 | ||||||
|
Goodwill
and intangible assets
|
90,222 | 91,691 | ||||||
|
Accrued
income and other assets
|
148,591 | 113,620 | ||||||
|
Total
assets
|
$ | 4,542,100 | $ | 4,464,174 | ||||
|
LIABILITIES
|
||||||||
|
Deposits:
|
||||||||
|
Noninterest
bearing
|
$ | 450,608 | $ | 416,960 | ||||
|
Interest
bearing
|
3,201,856 | 3,097,582 | ||||||
|
Total
deposits
|
3,652,464 | 3,514,542 | ||||||
|
Short-term
borrowings:
|
||||||||
|
Federal
funds purchased and securities sold under agreements to
repurchase
|
123,787 | 272,529 | ||||||
|
Other
short-term borrowings
|
26,323 | 23,646 | ||||||
|
Total
short-term borrowings
|
150,110 | 296,175 | ||||||
|
Long-term
debt and mandatorily redeemable securities
|
19,761 | 29,832 | ||||||
|
Subordinated
notes
|
89,692 | 89,692 | ||||||
|
Accrued
expenses and other liabilities
|
59,753 | 80,269 | ||||||
|
Total
liabilities
|
3,971,780 | 4,010,510 | ||||||
|
SHAREHOLDERS' EQUITY
|
||||||||
|
Preferred
stock; no par value
|
||||||||
|
Authorized
10,000,000 shares; issued 111,000 shares in 2009 and none in
2008
|
104,930 | - | ||||||
|
Common
stock; no par value
|
||||||||
|
Authorized
40,000,000 shares; issued 25,643,506 shares in 2009
and 2008
|
350,269 | 342,982 | ||||||
|
Retained
earnings
|
142,407 | 136,877 | ||||||
|
Cost
of common stock in treasury (1,532,483 shares in 2009 and 1,532,576 shares
in 2008)
|
(32,380 | ) | (32,019 | ) | ||||
|
Accumulated
other comprehensive income
|
5,094 | 5,824 | ||||||
|
Total
shareholders' equity
|
570,320 | 453,664 | ||||||
|
Total
liabilities and shareholders' equity
|
$ | 4,542,100 | $ | 4,464,174 | ||||
|
The
accompanying notes are a part of the consolidated financial
statements.
|
||||||||
|
CONSOLIDATED
STATEMENTS OF INCOME
|
||||||||||||
|
Year
Ended December 31 (Dollars in
thousands, except per share data)
|
2009
|
2008
|
2007
|
|||||||||
|
Interest
income:
|
||||||||||||
|
Loans
and leases
|
$ | 174,885 | $ | 204,006 | $ | 216,186 | ||||||
|
Investment
securities, taxable
|
17,594 | 22,170 | 25,136 | |||||||||
|
Investment
securities, tax-exempt
|
6,705 | 7,707 | 7,608 | |||||||||
|
Other
|
1,228 | 1,425 | 4,657 | |||||||||
|
Total
interest income
|
200,412 | 235,308 | 253,587 | |||||||||
|
Interest
expense:
|
||||||||||||
|
Deposits
|
63,521 | 86,903 | 115,113 | |||||||||
|
Short-term
borrowings
|
1,115 | 7,626 | 10,935 | |||||||||
|
Subordinated
notes
|
6,589 | 6,714 | 6,051 | |||||||||
|
Long-term
debt and mandatorily redeemable securities
|
975 | 1,905 | 2,578 | |||||||||
|
Total
interest expense
|
72,200 | 103,148 | 134,677 | |||||||||
|
Net
interest income
|
128,212 | 132,160 | 118,910 | |||||||||
|
Provision
for loan and lease losses
|
31,101 | 16,648 | 7,534 | |||||||||
|
Net
interest income after provision for loan and lease losses
|
97,111 | 115,512 | 111,376 | |||||||||
|
Noninterest
income:
|
||||||||||||
|
Trust
fees
|
15,036 | 18,599 | 15,567 | |||||||||
|
Service
charges on deposit accounts
|
20,645 | 22,035 | 20,470 | |||||||||
|
Mortgage
banking income
|
8,251 | 2,994 | 2,868 | |||||||||
|
Insurance
commissions
|
4,930 | 5,363 | 4,666 | |||||||||
|
Equipment
rental income
|
25,757 | 24,224 | 21,312 | |||||||||
|
Other
income
|
9,224 | 9,293 | 8,864 | |||||||||
|
Gain
on sale of certain Investment Advisor assets
|
- | 11,492 | - | |||||||||
|
Investment
securities and other investment gains (losses)
|
1,687 | (9,997 | ) | (3,128 | ) | |||||||
|
Total
noninterest income
|
85,530 | 84,003 | 70,619 | |||||||||
|
Noninterest
expense:
|
||||||||||||
|
Salaries
and employee benefits
|
72,483 | 76,965 | 73,944 | |||||||||
|
Net
occupancy expense
|
9,185 | 9,698 | 9,030 | |||||||||
|
Furniture
and equipment expense
|
13,980 | 15,095 | 15,145 | |||||||||
|
Depreciation
- leased equipment
|
20,515 | 19,450 | 17,085 | |||||||||
|
Professional
fees
|
4,399 | 8,446 | 4,575 | |||||||||
|
Supplies
and communications
|
5,916 | 6,782 | 5,987 | |||||||||
|
Business
development and marketing expense
|
3,488 | 3,749 | 4,788 | |||||||||
|
Loan
and lease collection and repossession expense
|
4,283 | 1,162 | 1,123 | |||||||||
|
FDIC
and other insurance
|
8,362 | 2,601 | 1,190 | |||||||||
|
Other expense
|
8,512 | 9,166 | 7,445 | |||||||||
|
Total
noninterest expense
|
151,123 | 153,114 | 140,312 | |||||||||
|
Income
before income taxes
|
31,518 | 46,401 | 41,683 | |||||||||
|
Income
taxes
|
6,028 | 13,015 | 11,144 | |||||||||
|
Net
income
|
25,490 | 33,386 | 30,539 | |||||||||
|
Preferred
stock dividends and discount accretion
|
(6,416 | ) | - | - | ||||||||
|
Net
income available to common shareholders
|
$ | 19,074 | $ | 33,386 | $ | 30,539 | ||||||
|
Basic
net income per common share
|
$ | 0.79 | $ | 1.38 | $ | 1.30 | ||||||
|
Diluted
net income per common share
|
$ | 0.79 | $ | 1.37 | $ | 1.28 | ||||||
|
The
accompanying notes are a part of the consolidated financial
statements.
|
||||||||||||
|
CONSOLIDATED STATEMENTS OF SHAREHOLDERS'
EQUITY
|
|||||||||||||||||||
|
Cost
of
|
Accumulated
|
||||||||||||||||||
|
Common
|
Other
|
||||||||||||||||||
|
Preferred
|
Common
|
Retained
|
Stock
|
Comprehensive
|
|||||||||||||||
|
(Dollars
in thousands, except per share data)
|
Total
|
Stock
|
Stock
|
Earnings
|
in
Treasury
|
Income
(Loss), Net
|
|||||||||||||
|
Balance
at January 1, 2007
|
$ | 368,904 | $ | - | $ | 289,163 | $ | 99,572 | $ | (19,571 | ) | $ | (260 | ) | |||||
|
Comprehensive
income, net of tax:
|
|||||||||||||||||||
|
Net
income
|
30,539 | - | - | 30,539 | - | - | |||||||||||||
|
Change
in unrealized appreciation of
|
|||||||||||||||||||
|
available-for-sale
securities, net of tax
|
2,782 | - | - | - | - | 2,782 | |||||||||||||
|
Total
comprehensive income
|
33,321 | - | - | - | - | - | |||||||||||||
|
Issuance
of 40,349 common shares per
|
|||||||||||||||||||
|
stock
based compensation awards, including
|
|||||||||||||||||||
|
related
tax effects
|
545 | - | - | 384 | 161 | - | |||||||||||||
|
Cost
of 569,310 shares of common
|
|||||||||||||||||||
|
stock
acquired for treasury
|
(12,821 | ) | - | - | - | (12,821 | ) | - | |||||||||||
|
Common
stock dividend ($.560 per share)
|
(13,122 | ) | - | - | (13,122 | ) | - | - | |||||||||||
|
Issuance
of 2,124,974 shares of common
|
|||||||||||||||||||
|
stock
for FINA Bancorp purchase
|
53,677 | - | 53,677 | - | - | - | |||||||||||||
|
Balance
at December 31, 2007
|
$ | 430,504 | $ | - | $ | 342,840 | $ | 117,373 | $ | (32,231 | ) | $ | 2,522 | ||||||
|
Comprehensive
income, net of tax:
|
|||||||||||||||||||
|
Net
income
|
33,386 | - | - | 33,386 | - | - | |||||||||||||
|
Change
in unrealized appreciation of
|
|||||||||||||||||||
|
available-for-sale
securities, net of tax
|
3,302 | - | - | - | - | 3,302 | |||||||||||||
|
Total
comprehensive income
|
36,688 | - | - | - | - | - | |||||||||||||
|
Issuance
of 18,820 common shares per
|
|||||||||||||||||||
|
stock
based compensation awards, including
|
|||||||||||||||||||
|
related
tax effects
|
341 | - | - | 129 | 212 | - | |||||||||||||
|
Stock
based compensation
|
142 | - | 142 | - | - | - | |||||||||||||
|
Common
stock dividend ($.580 per share)
|
(14,011 | ) | - | - | (14,011 | ) | - | - | |||||||||||
|
Balance
at December 31, 2008
|
$ | 453,664 | $ | - | $ | 342,982 | $ | 136,877 | $ | (32,019 | ) | $ | 5,824 | ||||||
|
Comprehensive
income, net of tax:
|
|||||||||||||||||||
|
Net
income
|
25,490 | - | - | 25,490 | - | - | |||||||||||||
|
Change
in unrealized appreciation of
|
|||||||||||||||||||
|
available-for-sale
securities, net of tax
|
(730 | ) | - | - | - | - | (730 | ) | |||||||||||
|
Total
comprehensive income
|
24,760 | - | - | - | - | - | |||||||||||||
|
Issuance
of 83,402 common shares per
|
|||||||||||||||||||
|
stock
based compensation awards, including
|
|||||||||||||||||||
|
related
tax effects
|
1,663 | - | - | 725 | 938 | - | |||||||||||||
|
Cost
of 83,309 shares of common
|
|||||||||||||||||||
|
stock
acquired for treasury
|
(1,299 | ) | - | - | - | (1,299 | ) | - | |||||||||||
|
Issuance
of preferred stock
|
103,725 | 103,725 | - | - | - | - | |||||||||||||
|
Preferred
stock discount accretion
|
- | 1,205 | - | (1,205 | ) | - | - | ||||||||||||
|
Issuance
of warrants to purchase common stock
|
7,275 | - | 7,275 | - | - | - | |||||||||||||
|
Preferred
stock dividend (accrued and/or paid)
|
(5,211 | ) | - | - | (5,211 | ) | - | - | |||||||||||
|
Stock
based compensation
|
12 | - | 12 | - | - | - | |||||||||||||
|
Common
stock dividend ($.590 per share)
|
(14,269 | ) | - | - | (14,269 | ) | - | - | |||||||||||
|
Balance
at December 31, 2009
|
$ | 570,320 | $ | 104,930 | $ | 350,269 | $ | 142,407 | $ | (32,380 | ) | $ | 5,094 | ||||||
|
The
accompanying notes are a part of the consolidated financial
statements.
|
|||||||||||||||||||
|
CONSOLIDATED STATEMENTS OF
CASH FLOW
|
||||||||||||
|
Year
Ended December 31 (Dollars in
thousands)
|
2009
|
2008
|
2007
|
|||||||||
|
Operating
activities:
|
||||||||||||
|
Net
income
|
$ | 25,490 | $ | 33,386 | $ | 30,539 | ||||||
|
Adjustments
to reconcile net income to net cash provided by operating
activities:
|
||||||||||||
|
Provision
for loan and lease losses
|
31,101 | 16,648 | 7,534 | |||||||||
|
Depreciation
of premises and equipment
|
4,605 | 5,312 | 5,364 | |||||||||
|
Depreciation
of equipment owned and leased to others
|
20,515 | 19,450 | 17,085 | |||||||||
|
Amortization
of investment security premiums and accretion of discounts,
net
|
5,304 | 2,232 | (356 | ) | ||||||||
|
Amortization
of mortgage servicing rights
|
3,331 | 2,838 | 2,403 | |||||||||
|
Mortgage
servicing asset (recoveries)/impairment
|
(2,072 | ) | 1,913 | 143 | ||||||||
|
Deferred
income taxes
|
5,687 | (10,779 | ) | (4,558 | ) | |||||||
|
Realized
investment securities (gains) losses
|
(1,687 | ) | 9,997 | 3,128 | ||||||||
|
Originations/purchases
of loans held for sale, net of principal collected
|
(577,949 | ) | (380,920 | ) | (327,679 | ) | ||||||
|
Proceeds
from the sales of loans held for sale
|
602,126 | 362,444 | 352,114 | |||||||||
|
Net
gain on sale of loans held for sale
|
(4,140 | ) | (2,289 | ) | (197 | ) | ||||||
|
Change
in trading account securities
|
(25 | ) | (100 | ) | - | |||||||
|
Change
in interest receivable
|
1,723 | 1,383 | (1,296 | ) | ||||||||
|
Change
in interest payable
|
(3,944 | ) | (6,710 | ) | (380 | ) | ||||||
|
Change
in other assets
|
(37,069 | ) | (15,980 | ) | (8,587 | ) | ||||||
|
Change
in other liabilities
|
(21,937 | ) | 21,345 | 4,003 | ||||||||
|
Other
|
794 | 4,070 | 5,101 | |||||||||
|
Net
change in operating activities
|
51,853 | 64,240 | 84,361 | |||||||||
|
Investing
activities:
|
||||||||||||
|
Cash
paid for acquisition, net
|
- | - | (55,977 | ) | ||||||||
|
Proceeds
from sales of investment securities
|
240,325 | 8,548 | 121,671 | |||||||||
|
Proceeds
from maturities of investment securities
|
515,216 | 519,847 | 496,324 | |||||||||
|
Purchases
of investment securities
|
(937,217 | ) | (480,082 | ) | (518,041 | ) | ||||||
|
Net
change in short-term and other investments
|
(136,615 | ) | 15,191 | 195,337 | ||||||||
|
Loans
sold or participated to others
|
17,805 | - | - | |||||||||
|
Net
change in loans and leases
|
164,616 | (110,246 | ) | (252,929 | ) | |||||||
|
Net
change in equipment owned under operating
leases
|
(34,457 | ) | (20,552 | ) | (22,734 | ) | ||||||
|
Purchases
of premises and equipment
|
(2,256 | ) | (3,726 | ) | (14,467 | ) | ||||||
|
Net
change in investing activities
|
(172,583 | ) | (71,020 | ) | (50,816 | ) | ||||||
|
Financing
activities:
|
||||||||||||
|
Net
change in demand deposits, NOW accounts and savings
accounts
|
317,699 | (72,780 | ) | (14,260 | ) | |||||||
|
Net
change in certificates of deposit
|
(179,777 | ) | 117,659 | (86,502 | ) | |||||||
|
Net
change in short-term borrowings
|
(146,065 | ) | (41,656 | ) | 96,930 | |||||||
|
Proceeds
from issuance of long-term debt
|
1,014 | 10,826 | 1,159 | |||||||||
|
Proceeds
from issuance of subordinated notes
|
- | - | 58,764 | |||||||||
|
Payments
on subordinated notes
|
- | (10,310 | ) | (17,784 | ) | |||||||
|
Payments
on long-term debt
|
(11,382 | ) | (16,413 | ) | (11,225 | ) | ||||||
|
Net
proceeds from issuance of treasury stock
|
1,663 | 341 | 545 | |||||||||
|
Acquisition
of treasury stock
|
(1,299 | ) | - | (12,821 | ) | |||||||
|
Net
proceeds from issuance of preferred stock & common stock
warrants
|
111,000 | - | - | |||||||||
|
Cash
dividends paid on preferred stock
|
(4,502 | ) | - | - | ||||||||
|
Cash
dividends paid on common stock
|
(14,520 | ) | (14,253 | ) | (13,345 | ) | ||||||
|
Net
change in financing activities
|
73,831 | (26,586 | ) | 1,461 | ||||||||
|
Net
change in cash and cash equivalents
|
(46,899 | ) | (33,366 | ) | 35,006 | |||||||
|
Cash
and cash equivalents, beginning of year
|
119,771 | 153,137 | 118,131 | |||||||||
|
Cash
and cash equivalents, end of year
|
$ | 72,872 | $ | 119,771 | $ | 153,137 | ||||||
|
Supplemental
Information:
|
||||||||||||
|
Cash
paid for:
|
||||||||||||
|
Interest
|
$ | 76,145 | $ | 109,858 | $ | 137,397 | ||||||
|
Income
taxes
|
8,903 | 19,187 | 13,314 | |||||||||
|
The
accompanying notes are a part of the consolidated financial
statements.
|
||||||||||||
Notes to Consolidated Financial Statements
Note
1 — Accounting Policies
1st
Source Corporation is a bank holding company headquartered in South Bend,
Indiana that provides, through our subsidiaries (collectively referred to as
"1st Source"), a broad array of financial products and services. 1st Source Bank
("Bank"), our banking subsidiary, offers commercial and consumer banking
services, trust and investment management services, and insurance to individual
and business clients in Indiana and Michigan. The following is a summary of
significant accounting policies followed in the preparation of the consolidated
financial statements.
Basis of Presentation — The
financial statements consolidate 1st Source and our subsidiaries (principally
the Bank). All significant intercompany balances and transactions have been
eliminated. For purposes of the parent company only financial information
presented in Note 22, investments in subsidiaries are carried at equity in our
underlying net assets.
Use of Estimates in the Preparation
of Financial Statements — Financial statements prepared in accordance
with U. S. generally accepted accounting principles require our management to
make estimates and assumptions that affect the reported amounts of assets and
liabilities and disclosure of contingent assets and liabilities at the date of
the financial statements and the reported amounts of income and expenses during
the reporting period. Actual results could differ from those
estimates.
Business Combinations —
Business combinations are accounted for under the purchase method of accounting.
Under the purchase method, assets and liabilities of the business acquired are
recorded at their estimated fair values as of the date of acquisition with any
excess of the cost of the acquisition over the fair value of the net tangible
and intangible assets acquired recorded as goodwill. Results of operations of
the acquired business are included in the income statement from the date of
acquisition.
Cash Flow — For purposes of
the consolidated and parent company only statements of cash flows, we consider
cash and due from banks as cash and cash equivalents.
Securities — Securities that
we have the ability and positive intent to hold to maturity are classified as
investment securities held-to-maturity. Held-to-maturity investment securities,
when present, are carried at amortized cost. As of December 31, 2009, we hold no
securities classified as held-to-maturity. Securities that may be sold in
response to, or in anticipation of, changes in interest rates and resulting
prepayment risk, or for other factors, are classified as available-for-sale and
are carried at fair value. Unrealized gains and losses on these securities are
reported, net of applicable taxes, as a separate component of accumulated other
comprehensive income (loss) in shareholders’ equity.
The
initial indication of other-than-temporary impairment (OTTI) for both debt and
equity securities is a decline in fair value below amortized cost. Quarterly,
the impaired securities are analyzed on a qualitative and quantitative basis in
determining OTTI. Declines in the fair value of available-for-sale debt
securities below their cost that are deemed to be other-than-temporary are
reflected in earnings as realized losses to the extent the impairment is related
to credit losses. The amount of impairment related to other factors is
recognized in other comprehensive income. In estimating OTTI impairment losses,
we consider among other things, (i) the length of time and the extent to which
fair value has been less than cost, (ii) the financial condition and near-term
prospects of the issuer, and (iii) whether it is more likely than not that we
will not have to sell any such securities before an anticipated recovery of
cost.
Debt and
equity securities that are purchased and held principally for the purpose of
selling them in the near term are classified as trading account securities and
are carried at fair value with unrealized gains and losses reported in earnings.
Realized gains and losses on the sales of all securities are reported in
earnings and computed using the specific identification cost basis.
Other
investments consist solely of shares of Federal Home Loan Bank and Federal
Reserve Bank stock. These investments are carried at cost and reviewed for
impairment at least annually or sooner if events or changes in circumstances
indicate the carrying value may not be reasonable. When evaluating the stocks
for impairment, the value is determined based on the ultimate recoverability of
the par value rather than by recognizing temporary declines in value. Both cash
and stock dividends received on the stocks are reported as income.
Loans and Leases — Loans are
stated at the principal amount outstanding, net of unamortized deferred loan
origination fees and costs and net of unearned income. Interest income is
accrued as earned based on unpaid principal balances. Origination fees and
direct loan and lease origination costs are deferred and the net amount
amortized to interest income over the estimated life of the related loan or
lease. Loan commitment fees are deferred and amortized into other income over
the commitment period.
Direct
financing leases are carried at the aggregate of lease payments plus estimated
residual value of the leased property, less unearned income. Interest income on
direct financing leases is recognized over the term of the lease to achieve a
constant periodic rate of return on the outstanding investment.
The
accrual of interest on loans and leases is discontinued when a loan or lease
becomes contractually delinquent for 90 days, or when an individual analysis of
a borrower's credit worthiness indicates a credit should be placed on
nonperforming status, except for residential mortgage loans and consumer loans
that are well secured and in the process of collection. Residential mortgage
loans are placed in nonaccrual at the time the loan is placed in foreclosure.
When interest accruals are discontinued, interest credited to income in the
current year is reversed and interest accrued in the prior year is charged to
the reserve for loan and lease losses. However, in some cases, management may
elect to continue the accrual of interest when the net realizable value of
collateral is sufficient to cover the principal and accrued interest. When a
loan or lease is classified as nonaccrual and the future collectibility of the
recorded loan or lease balance is doubtful, collections on interest and
principal are applied as a reduction to principal outstanding. Loans are
returned to accrual status when all principal and interest amounts contractually
due are brought current and future payments are reasonably assured.
A loan or
lease is considered impaired, based on current information and events, if it is
probable that we will be unable to collect the scheduled payments of principal
or interest when due according to the contractual terms of the loan or lease
agreement. Interest on impaired loans and leases, which are not classified as
nonaccrual, is recognized on the accrual basis. We evaluate loans and leases
exceeding $100,000 for impairment and establish an allowance as a component of
the reserve for loan and lease losses when it is probable all amounts due will
not be collected pursuant to the contractual terms of the loan and lease and the
recorded investment in the loan or lease exceeds its fair value.
A loan is
considered a restructured loan in cases where a borrower experiences financial
difficulties and we make certain concessionary modifications to contractual
terms. Loans restructured at a rate equal to or greater than that of a new loan
with comparable risk at the time the contract is modified may be excluded from
restructured loan disclosures after a period of six months if they are in
compliance with the modified terms.
1st
Source Bank sells mortgage loans to the Government National Mortgage Association
(GNMA) in the normal course of business and retains the servicing rights. The
GNMA programs under which the loans are sold allow us to repurchase individual
delinquent loans that meet certain criteria from the securitized loan pool. At
our option, and without GNMA's prior authorization, we may repurchase a
delinquent loan for an amount equal to 100% of the remaining principal balance
on the loan. Once we have the unconditional ability to repurchase a delinquent
loan, we are deemed to have regained effective control over the loan and we are
required to recognize the loan on our balance sheet and record an offsetting
liability, regardless of our intent to repurchase the loan. At December 31, 2009
and 2008, residential real estate portfolio loans included $8.70 million and
$5.72 million, respectively, of loans available for repurchase under the GNMA
optional repurchase programs with the offsetting liability recorded within other
short-term borrowings.
Mortgage Banking Activities —
Loans held for sale are primarily composed of performing one-to-four family
residential mortgage loans originated for resale. Prior to January 1, 2008, all
loans held for sale were carried at the lower of cost or fair value as
determined on an aggregate basis. Effective January 1, 2008, management has
elected to carry mortgage loans originated with the intent to sell at fair
value.
We
recognize the rights to service mortgage loans for others as separate assets,
whether the servicing rights are acquired through a separate purchase or through
the sale of originated loans with servicing rights retained. We allocate a
portion of the total cost of a mortgage loan to servicing rights based on the
fair value. These assets are amortized as reductions of mortgage servicing fee
income over the estimated servicing period in proportion to the estimated
servicing income to be received. Gains and losses on the sale of mortgage
servicing rights are recognized as noninterest income in the period in which
such rights are sold.
Mortgage
servicing assets are evaluated for impairment. For purposes of impairment
measurement, mortgage servicing assets are stratified based on the predominant
risk characteristics of the underlying servicing, principally by loan type and
interest rate. If temporary impairment exists within a tranche, a valuation
allowance is established through a charge to income equal to the amount by which
the carrying value exceeds the fair value. If it is later determined all or a
portion of the temporary impairment no longer exists for a particular tranche,
the valuation allowance is reduced through a recovery of income.
Mortgage
servicing assets are also reviewed for other-than-temporary impairment.
Other-than-temporary impairment exists when recoverability of a recorded
valuation allowance is determined to be remote considering historical and
projected interest rates, prepayments, and loan pay-off activity. When this
situation occurs, the unrecoverable portion of the valuation allowance is
applied as a direct write-down to the carrying value of the mortgage servicing
asset. Unlike a valuation allowance, a direct write-down permanently reduces the
carrying value of the mortgage servicing asset and the valuation allowance,
precluding subsequent recoveries.
As part
of mortgage banking operations, we enter into commitments to purchase or
originate loans whereby the interest rate on these loans is determined prior to
funding ("rate lock commitments"). Similar to loans held for sale, the fair
value of rate lock commitments is subject to change primarily due to changes in
interest rates. Under our risk management policy, these fair values are hedged
primarily by selling forward contracts on agency securities. The rate lock
commitments on mortgage loans intended to be sold and the related hedging
instruments are recorded at fair value with changes in fair value recorded in
current earnings.
Reserve for Loan and Lease
Losses — The reserve for loan and lease losses is maintained at a level
believed to be adequate by management to absorb probable losses inherent in the
loan and lease portfolio. The determination of the reserve requires significant
judgment reflecting management’s best estimate of probable loan and lease losses
related to specifically identified impaired loans and leases as well as probable
losses in the remainder of the various loan and lease portfolios. The
methodology for assessing the appropriateness of the reserve consists of several
key elements, which include: specific reserves for impaired loans, percentage
allocations for special attention loans and leases (classified loans and leases
and internal watch list credits) without specific reserves, formula reserves for
each business lending division portfolio, and reserves for pooled homogenous
loans and leases. Management’s evaluation is based upon a continuing review of
these portfolios, estimates of customer performance, collateral values and
dispositions, and assessments of economic and geopolitical events, all of which
are subject to judgment and will change.
Specific
reserves are established for certain business and specialty finance credits
based on a regular analysis of special attention loans and leases. This analysis
is performed by the Credit Policy Committee, the Loan Review Department, Credit
Administration, and the Loan Workout Departments. The specific reserves are
based on an analysis of underlying collateral values, cash flow considerations
and, if applicable, guarantor capacity.
The
formula reserves determined for each business lending division portfolio are
calculated quarterly by applying loss factors to outstanding loans and leases
and certain unfunded commitments based upon a review of historical loss
experience and qualitative factors, which include but are not limited to,
economic trends, current market risk assessment by industry, recent loss
experience in particular segments of the portfolios, movement in equipment
values collateralizing specialized industry portfolios, concentrations of
credit, delinquencies, trends in volume, experience and depth of relationship
managers and division management, and the effects of changes in lending policies
and practices, including changes in quality of the loan and lease origination,
servicing and risk management processes. Special attention loans and leases
without specific reserves receive a higher percentage allocation ratio than
credits not considered special attention.
Pooled
loans and leases are smaller credits and are homogenous in nature, such as
consumer credits and residential mortgages. Pooled loan and lease loss reserves
are based on historical net charge-offs, adjusted for delinquencies, the effects
of lending practices and programs and current economic conditions, and current
trends in the geographic markets which we serve.
A
comprehensive analysis of the reserve is performed by management on a quarterly
basis. Although management determines the amount of each element of the reserve
separately and relies on this process as an important credit management tool,
the entire reserve is available for the entire loan and lease portfolio. The
actual amount of losses incurred can vary significantly from the estimated
amounts both positively and negatively. Management’s methodology includes
several factors intended to minimize the difference between estimated and actual
losses. These factors allow management to adjust our estimate of losses based on
the most recent information available.
Loans and
leases, which are deemed uncollectible or have a low likelihood of collection,
are charged off and deducted from the reserve, while recoveries of amounts
previously charged off are credited to the reserve. A (recovery of) provision
for loan and lease losses is credited or charged to operations based on
management’s periodic evaluation of the factors previously mentioned, as well as
other pertinent factors.
Equipment Owned Under Operating
Leases — We finance various types of construction equipment, medium and
heavy duty trucks, and automobiles under leases classified as operating leases.
Revenue consists of the contractual lease payments and is recognized on a
straight-line basis over the lease term. Lease terms range from three to seven
years. Leased assets are being depreciated on a straight-line method over the
lease term to the estimate of the equipment’s fair market value at lease
termination, also referred to as "residual" value. For automobile leases, fair
value was based upon published industry market guides. For other equipment
leases, fair value may be based upon observable market prices, third-party
valuations, or prices received on sales of similar assets at the end of the
lease term. These residual values are reviewed periodically to ensure the
recorded amount does not exceed the fair market value at the lease
termination.
Other Real Estate — Other real
estate acquired through partial or total satisfaction of nonperforming loans is
included in other assets and recorded at the estimated fair value less
anticipated selling costs based upon the property’s appraised value at the date
of transfer, with any difference between the fair value of the property less
cost to sell, and the carrying value of the loan charged to the reserve for loan
losses. Other real estate also includes bank premises qualifying as held for
sale. Bank premises are
transferred at the lower of carrying value or estimated fair value less
anticipated selling costs. Fair value write-downs, property maintenance costs,
and gains or losses recognized upon the sale of foreclosed assets are recognized
in noninterest expense on the income statement. Gains or losses not previously
recognized resulting from the sale of other real estate are recognized on the
date of sale. As of December 31, 2009 and 2008, other real estate had carrying
values of $6.53 million and $4.74 million, respectively, and is included in
Other Assets in the Statements of Financial Condition.
Repossessed Assets —
Repossessed assets may include fixtures and equipment, inventory and
receivables, aircraft, construction equipment, and vehicles acquired through
foreclosure or in lieu of foreclosure from our business banking activities and
our specialty finance activities. Repossessed assets are included in other
assets at the lower of cost or fair value of the equipment or vehicle. At the
time of foreclosure, the recorded amount of the loan or lease is written down,
if necessary, to the fair value of the equipment or vehicle by a charge to the
reserve for loan and lease losses. Subsequent write-downs are included in
noninterest expense. Gains or losses not previously recognized resulting from
the sale of repossessed assets are recognized on the date of sale. Repossessed
assets totaled $10.17 million and $1.67 million, as of December 31, 2009 and
2008, respectively, and is included in Other Assets in the Statements of
Financial Condition.
Premises and Equipment —
Premises and equipment are stated at cost, less accumulated depreciation and
amortization. The provision for depreciation is computed by the straight-line
method, primarily with useful lives ranging from three to 31.5 years.
Maintenance and repairs are charged to expense as incurred, while improvements,
which extend the useful life, are capitalized and depreciated over the estimated
remaining life.
Goodwill and Intangibles —
Goodwill represents the excess of the cost of businesses acquired over the fair
value of the net assets acquired. Other intangible assets represent purchased
assets that also lack physical substance but can be distinguished from goodwill
because of contractual or other legal rights or because the asset is capable of
being sold or exchanged either on its own or in combination with a related
contract, asset, or liability. Goodwill is reviewed for impairment at least
annually or on an interim basis if an event occurs or circumstances change that
would more likely than not reduce the carrying amount. Intangible assets that
have finite lives are amortized over their estimated useful lives and are
subject to impairment testing. All of our other intangible assets have finite
lives and are amortized on a straight-line basis over varying periods not
exceeding eight years. We performed the required annual impairment test of
goodwill during the first quarter of 2009 and determined that no impairment
exists.
Venture
Capital Investment — We account for
our investments in venture capital partnerships for which we own three percent
or more of the partnership on the equity method. The venture capital
partnerships which we have investments in account for their investments at fair
value pursuant to the guidance in the AICPA Investment Company Guide. As a
result, our investments in these venture capital partnerships reflect the
underlying fair value of the partnerships’ investments. We account for our
investments in venture capital partnerships of which we own less than three
percent at the lower of cost or fair value. Venture capital
investments in partnerships are included in Other Assets in the Statements of
Financial Condition. The balances as of December 31, 2009 and 2008 were $1.77
million and $1.86 million, respectively.
Short-Term Borrowings —
Short-term borrowings consist of Federal funds purchased, securities sold under
agreements to repurchase, commercial paper, U.S. Treasury demand notes, Federal
Home Loan Bank notes, and borrowings from non-affiliated banks. Federal funds
purchased, securities sold under agreements to repurchase, and other short-term
borrowings mature within one to 365 days of the transaction date. Commercial
paper matures within seven to 270 days. Other short-term borrowings in the
Statements of Financial Condition include our liability related to mortgage
loans available for repurchase under GNMA optional repurchase
programs.
Securities
purchased under agreements to resell and securities sold under agreements to
repurchase are treated as collateralized financing transactions and are recorded
at the amounts at which the securities were acquired or sold plus accrued
interest. The fair value of collateral either received from or provided to a
third party is continually monitored and additional collateral obtained or
requested to be returned to us as deemed appropriate.
Trust Fees — Trust fees are
recognized on the accrual basis.
Income Taxes — 1st Source and
our subsidiaries file a consolidated Federal income tax return. The provision
for incomes taxes is based upon income in the consolidated financial statements,
rather than amounts reported on our income tax return. Deferred tax assets and
liabilities are recognized for the future tax consequences attributable to
differences between the financial statement carrying amounts of existing assets
and liabilities and their respective tax bases. Deferred tax assets and
liabilities are measured using enacted tax rates expected to apply to taxable
income in the years in which those temporary differences are expected to be
recovered or settled. The effect on deferred tax assets and liabilities of a
change in tax rates is recognized as income or expense in the period that
includes the enactment date. A valuation allowance, if needed, reduces deferred
tax assets to the expected amount most likely to be realized. Realization of
deferred tax assets is dependent upon the generation of a sufficient level of
future taxable income and recoverable taxes paid in prior
years. Although realization is not assured, we believe it is more
likely than not that all of the deferred tax assets will be
realized.
Positions
taken in our tax returns may be subject to challenge by the taxing authorities
upon examination. Uncertain tax positions are initially recognized in the
financial statements when it is more likely than not the position will be
sustained upon examination by the tax authorities. Such tax positions are both
initially and subsequently measured as the largest amount of tax benefit that is
greater than 50% likely of being realized upon settlement with the tax
authority, assuming full knowledge of the position and all relevant facts. We
provide for interest and, in some cases, penalties on tax positions that may be
challenged by the taxing authorities. Interest expense is recognized beginning
in the first period that such interest would begin accruing. Penalties are
recognized in the period that we claim the position in the tax return. Interest
and penalties on income tax uncertainties are classified within income tax
expense in the Statements of Income.
Net Income Per Common Share
— Basic earnings per common share is computed by dividing net income
available to common shareholders by the weighted-average number of shares of
common stock outstanding. Diluted earnings per common share is computed by
dividing net income available to common shareholders by the weighted-average
number of shares of common stock outstanding, plus the dilutive effect of
outstanding stock options and nonvested stock-based compensation
awards.
Stock-Based
Employee Compensation — We recognize
stock-based compensation as compensation cost in the Statements of Income
based on their fair values on the measurement date, which, for our purposes, is
the date of grant. We transitioned to fair-value based accounting for
stock-based compensation using the modified prospective application and,
therefore, have not restated results for prior periods. This transition method
applies to new awards for service periods beginning on or after January 1, 2006,
and to awards modified, repurchased, or cancelled after January 1, 2006.
Additionally, compensation cost for the portion of stock option awards for which
the requisite service has not been rendered (generally referring to non-vested
award) which were granted prior to January 1, 2006 will be recognized as the
remaining requisite service is rendered.
Segment Information — In our
management's opinion, 1st Source has one principal business segment, commercial
banking. While our chief decision makers monitor the revenue streams of various
products and services, the identifiable segments' operations are managed and
financial performance is evaluated on a company-wide basis. Accordingly, all of
our financial service operations are considered by management to be aggregated
in one reportable operating segment.
Derivative Financial
Instruments — We occasionally enter into derivative financial instruments
as part of our interest rate risk management strategies. These derivative
financial instruments consist primarily of interest rate swaps. All derivative
instruments are recorded on the Statements of Financial Condition, as either an
asset or liability, at their fair value. The accounting for the gain or loss
resulting from the change in fair value depends on the intended use of the
derivative. For a derivative used to hedge changes in fair value of a recognized
asset or liability, or an unrecognized firm commitment, the gain or loss on the
derivative will be recognized in earnings together with the offsetting loss or
gain on the hedged item. This results in an earnings impact only to the extent
that the hedge is ineffective in achieving offsetting changes in fair value. If
it is determined that the derivative instrument is not highly effective as a
hedge, hedge accounting is discontinued and the adjustment to fair value of the
derivative instrument is recorded in earnings. For a derivative used to hedge
changes in cash flows associated with forecasted transactions, the gain or loss
on the effective portion of the derivative will be deferred, and reported as
accumulated other comprehensive income, a component of shareholders’ equity,
until such time the hedged transaction affects earnings. For derivative
instruments not accounted for as hedges, changes in fair value are recognized in
noninterest income/expense. Deferred gains and losses from derivatives that are
terminated and were in a cash flow hedge are amortized over the shorter of the
original remaining term of the derivative or the remaining life of the
underlying asset or liability.
Fair Value Measurements — We
record certain assets and liabilities at fair value. Fair value is defined as
the price that would be received to sell an asset or paid to transfer a
liability in an orderly transaction between market participants at the
measurement date. Securities available for sale, trading securities, mortgage
loans held for sale, and derivative instruments are carried at fair value on a
recurring basis. Fair value measurements are also utilized to determine the
initial value of certain assets and liabilities, to perform impairment
assessments, and for disclosure purposes. We use quoted market prices and
observable inputs to the maximum extent possible when measuring fair value. In
the absence of quoted market prices, various valuation techniques are utilized
to measure fair value. When possible, observable market data for identical or
similar financial instruments are used in the valuation. When market data is not
available, fair value is determined using valuation models that incorporate
management’s estimates of the assumptions a market participant would use in
pricing the asset or liability.
Fair
value measurements are classified within one of three levels based on the
observability of the inputs used to determine fair value, as
follows:
Level 1 —
The valuation is based on quoted prices in active markets for identical
instruments.
Level 2 —
The valuation is based on observable inputs such as quoted prices for similar
instruments in active markets, quoted prices for identical or similar
instruments in markets that are not active, and model-based valuation techniques
for which all significant assumptions are observable in the market.
Level 3 —
The valuation is based on unobservable inputs that are supported by minimal or
no market activity and that are significant to the fair value of the instrument.
Level 3 valuations are typically performed using pricing models, discounted cash
flow methodologies, or similar techniques that incorporate management’s own
estimates of assumptions that market participants would use in pricing the
instrument, or valuations that require significant management judgment or
estimation.
Reclassifications — Certain
amounts in the prior period consolidated financial statements have been
reclassified to conform with the current year presentation. These
reclassifications had no effect on total assets, shareholders’ equity or net
income as previously reported.
Note
2 — Recent Accounting Pronouncements
Consolidations: In
December 2009, the Financial Accounting Standards Board (FASB) issued Accounting
Standards Update (ASU) No. 2009-17 (formerly Statement No. 167), “Consolidations (Topic 810) –
Improvements to Financial Reporting for Enterprises involved with Variable
Interest Entities”. ASU 2009-17 amends the consolidation guidance
applicable to variable interest entities. The amendments to the consolidation
guidance affect all entities, as well as qualifying special-purpose entities
(QSPEs) that are currently excluded from previous consolidation guidance. ASU
2009-17 is effective as of the beginning of the first annual reporting period
that begins after November 15, 2009. ASU 2009-17 is not expected to have a
material impact on our financial condition, results of operations, or
disclosures.
Accounting
for Transfers of Financial Assets: In December 2009, the FASB
issued ASU No. 2009-16 (formerly Statement No. 166), “Transfers and Servicing (Topic 860)
– Accounting for Transfers of Financial Assets”. ASU 2009-16 amends the
derecognition accounting and disclosure guidance. ASU 2009-16 eliminates the
exemption from consolidation for QSPEs and also requires a transferor to
evaluate all existing QSPEs to determine whether they must be consolidated. ASU
2009-16 is effective as of the beginning of the first annual reporting period
that begins after November 15, 2009. ASU 2009-16 is not expected to have a
material impact on our financial condition, results of operations, or
disclosures.
Investments
in Certain Entities that Calculate Net Asset Value per
Share: In September 2009, the FASB issued ASU No. 2009-12,
“Fair Value Measurements and
Disclosures (Topic 820) – Investments in Certain Entities that Calculate Net
Asset Value per Share (or its Equivalent)”. This ASU permits, as a
practical expedient, a reporting entity to measure the fair value of an
investment that is within the scope of the amendments in this ASU on the basis
of the net asset value per share of the investment (or its equivalent) if the
net asset value of the investment (or its equivalent) is calculated in a manner
consistent with the measurement principles of Financial Services – Investment
Companies (Topic 946) as of the reporting entity’s measurement date. The ASU
also requires disclosures by major category of investment about the attributes
of investments within the scope of the Update. ASU 2009-12 was effective for
interim and annual periods ending after December 15, 2009. ASU 2009-05 did not
have an impact on our financial condition, results of operations, or
disclosures.
Measuring
Liabilities at Fair Value: In August 2009, the FASB issued ASU
No. 2009-05, “Fair Value
Measurements and Disclosures (Topic 820) – Measuring Liabilities at Fair
Value”. This ASU provides amendments for fair value measurements of
liabilities. It provides clarification that in circumstances in which a quoted
price in an active market for the identical liability is not available, a
reporting entity is required to measure fair value using one or more techniques.
ASU 2009-05 also clarifies that when estimating a fair value of a liability, a
reporting entity is not required to include a separate input or adjustment to
other inputs relating to the existence of a restriction that prevents the
transfer of the liability. ASU 2009-05 was effective for the first reporting
period (including interim periods) beginning after issuance or fourth quarter
2009. ASU 2009-05 did not have an impact on our financial condition or results
of operations.
FASB
Accounting Standards Codification™ (ASC or Codification): In
June 2009, the FASB issued ASU No. 2009-01 (formerly Statement No. 168), “Topic 105 - Generally Accepted
Accounting Principles - FASB Accounting Standards Codification™ and the Hierarchy of Generally
Accepted Accounting Principles.” The Codification is the
single source of authoritative nongovernmental U.S. generally accepted
accounting principles (GAAP). The Codification does not change current GAAP, but
is intended to simplify user access to all authoritative GAAP by providing all
the authoritative literature related to a particular topic in one place. All
existing accounting standard documents are superseded and all other accounting
literature not included in the Codification is considered nonauthoritative.
The
Codification was effective for interim or annual reporting periods ending after
September 15, 2009. We have made the appropriate changes to GAAP references in
our financial statements.
Subsequent
Events: In May 2009, the FASB issued ASC 855 (formerly
Statement No. 165), “Subsequent Events”. ASC 855
establishes general standards of accounting for and disclosure of events that
occur after the Statement of Financial Condition date but before financial
statements are issued or available to be issued. We adopted the provisions of
ASC 855 and this change is reflected in Note 23 - Subsequent
Events.
FASB
Amends Disclosures about Fair Value of Financial
Instruments: In April 2009, the FASB issued ASC 825 (formerly
FASB Staff Position (FSP) 107-1 and APB 28-1), “Interim Disclosures about Fair
Value of Financial Instruments.” ASC 825 requires a public entity to
provide disclosures about fair value of financial instruments in interim
financial information. We adopted the provisions of ASC 825 on April 1, 2009 and
included the appropriate disclosures in our quarterly reports.
FASB
Clarifies Other-Than-Temporary Impairment: In April 2009,
the
FASB issued ASC 320 (formerly FSP FAS 115-2, FAS124-2 and EITF 99-20-2), “Recognition and Presentation of
Other-Than-Temporary-Impairment.” ASC 320 (i) changes existing guidance
for determining whether an impairment is other than temporary to debt securities
and (ii) replaces the existing requirement that the entity’s management assert
it has both the intent and ability to hold an impaired security until recovery
with a requirement that management assert: (a) it does not have the intent to
sell the security; and (b) it is more likely than not it
will
not have to sell the security before recovery of its cost basis. Under ASC 320,
declines in the fair value of held-to-maturity and available-for-sale securities
below their cost that are deemed to be other than temporary are reflected in
earnings as realized losses to the extent the impairment is related to credit
losses. The amount of impairment related to other factors is recognized in other
comprehensive income. We adopted the provisions of ASC 320 on April 1, 2009.
Details related to the adoption of ASC 320 and the impact on our disclosures are
more fully discussed in Note 3 – Investment Securities. The provisions of ASC
320 did not have an impact on our financial condition or results of
operations.
FASB
Clarifies Application of Fair Value Accounting: In April
2009, the FASB issued ASC 820 (formerly FSP FAS 157-4), “Determining Fair Value When the
Volume and Level of Activity for the Asset or Liability Have Significantly
Decreased and Identifying Transactions That Are Not Orderly.” ASC 820
affirms the objective of fair value when a market is not active, clarifies and
includes additional factors for determining whether there has been
a significant decrease in market activity, eliminates the presumption that all
transactions are not distressed unless proven otherwise, and requires an entity
to disclose a change in valuation technique. We adopted the provisions of ASC
820 on April 1, 2009. The provisions of ASC 820 did not have an impact on our
financial condition or results of operations.
Earnings
Per Share (EPS): In June
2008, the FASB issued ASC 260 (formerly FSP EITF 03-6-1), “Determining Whether Instruments
Granted in Shared-Based Payment Transactions are Participating
Securities.” ASC 260 clarifies that unvested share-based payment awards
with a right to receive nonforfeitable dividends are participating securities.
ASC 260 also provides guidance on how to allocate earnings to participating
securities and compute EPS using the two-class method. ASC 260 was effective for
financial statements issued for fiscal years beginning after December 15, 2008,
and interim periods within those years. All prior-period EPS data presented
shall be adjusted retrospectively (including interim financial statements,
summaries of earnings, and selected financial data) to conform with the
provisions of ASC 260. The provisions of ASC 260 did not have a material impact
on our EPS calculation.
Disclosures
About Derivative Instruments and Hedging Activities: In March
2008, the FASB issued ASC 815 (formerly Statement No. 161), “Disclosures About Derivative
Instruments and Hedging Activities”. ASC 815 requires qualitative
disclosures about objectives and strategies for using derivatives, quantitative
disclosures about fair value amounts of and gains and losses on derivative
instruments, and disclosures about credit-risk-related contingent features in
derivative agreements. We adopted the provisions of ASC 815 on January 1, 2009.
The required disclosures are included in Note 19– Derivative Financial
Instruments.
Note
3 — Investment Securities
Investment
securities available-for-sale were as follows:
|
Amortized
|
Gross
|
Gross
|
||||||||||||||
|
(Dollars
in thousands)
|
Cost
|
Unrealized
Gains
|
Unrealized
Losses
|
Fair
Value
|
||||||||||||
|
December
31, 2009
|
||||||||||||||||
|
U.S.
Treasury and Federal agencies securities
|
$ | 390,189 | $ | 760 | $ | (1,780 | ) | $ | 389,169 | |||||||
|
U.S.
States and political subdivisions securities
|
188,706 | 5,450 | (2,337 | ) | 191,819 | |||||||||||
|
Mortgage-backed
securities - Federal agencies
|
286,415 | 5,996 | (1,434 | ) | 290,977 | |||||||||||
|
Corporate
debt securities
|
26,166 | 194 | (38 | ) | 26,322 | |||||||||||
|
Foreign
government securities
|
675 | - | - | 675 | ||||||||||||
|
Total
debt securities
|
892,151 | 12,400 | (5,589 | ) | 898,962 | |||||||||||
|
Marketable
equity securities
|
1,288 | 1,417 | (29 | ) | 2,676 | |||||||||||
|
Total
investment securities available-for-sale
|
$ | 893,439 | $ | 13,817 | $ | (5,618 | ) | $ | 901,638 | |||||||
|
December
31, 2008
|
||||||||||||||||
|
U.S.
Treasury and Federal agencies securities
|
$ | 293,461 | $ | 2,892 | $ | (2 | ) | $ | 296,351 | |||||||
|
U.S.
States and political subdivisions securities
|
198,640 | 3,995 | (1,686 | ) | 200,949 | |||||||||||
|
Mortgage-backed
securities - Federal agencies
|
207,954 | 3,553 | (1,499 | ) | 210,008 | |||||||||||
|
Corporate
debt securities
|
10,494 | 51 | (1 | ) | 10,544 | |||||||||||
|
Foreign
government securities
|
435 | - | - | 435 | ||||||||||||
|
Total
debt securities
|
710,984 | 10,491 | (3,188 | ) | 718,287 | |||||||||||
|
Marketable
equity securities
|
4,396 | 2,091 | (20 | ) | 6,467 | |||||||||||
|
Total
investment securities available-for-sale
|
$ | 715,380 | $ | 12,582 | $ | (3,208 | ) | $ | 724,754 | |||||||
At December 31, 2009, the residential mortgage-backed securities we held consisted primarily of GNMA, FNMA and FHLMC pass-through certificates which are guaranteed by those respective agencies of the United States government (or Government Sponsored Enterprise, GSEs).
At
December 31, 2009, we held no preferred equity securities. At December 31, 2009,
we held $3.11 million (amortized cost) in preferred equity securities which were
included in marketable equity securities of which only $159 thousand were
GSEs.
The
contractual maturities of investments in securities available-for-sale at
December 31, 2009, are shown below. Expected maturities will differ from
contractual maturities, because borrowers may have the right to call or prepay
obligations with or without call or prepayment penalties.
|
Amortized
|
||||||||
|
(Dollars
in thousands)
|
Cost
|
Fair
Value
|
||||||
|
Due
in one year or less
|
$ | 66,566 | $ | 66,962 | ||||
|
Due
after one year through five years
|
322,574 | 326,082 | ||||||
|
Due
after five years through ten years
|
200,763 | 201,095 | ||||||
|
Due
after ten years
|
15,833 | 13,846 | ||||||
|
Mortgage-backed
securities
|
286,415 | 290,977 | ||||||
|
Total
debt securities available for sale
|
$ | 892,151 | $ | 898,962 | ||||
The
following table shows the gross realized gains and losses on sale of securities
from the securities available-for-sale portfolio, including marketable equity
securities.
|
(Dollars
in thousands)
|
2009
|
2008
|
2007
|
|||||||||
|
Gross
realized gains
|
$ | 2,108 | $ | 830 | $ | 1,057 | ||||||
|
Gross
realized losses
|
(707 | ) | (11,050 | ) | (4,119 | ) | ||||||
|
Net
realized gains (losses)
|
$ | 1,401 | $ | (10,220 | ) | $ | (3,062 | ) | ||||
The gross
losses in 2008 and 2007 reflect OTTI writedowns of $10.82 million and $4.11
million, respectively, on FNMA, FHLMC, Farmer Mac common stock and other
corporate preferred stock. There have been no OTTI writedowns in
2009.
There
were net gains of $25 thousand and $0 recorded on $0.13 million and $0.10
million in trading securities outstanding at December 31, 2009 and December 31,
2008, respectively.
The
following tables summarize our gross unrealized losses and fair value by
investment category and age:
|
Less
than 12 Months
|
12
months or Longer
|
Total
|
||||||||||||||||||||||
|
Fair
|
Unrealized
|
Fair
|
Unrealized
|
Fair
|
Unrealized
|
|||||||||||||||||||
|
(Dollars
in thousands)
|
Value
|
Losses
|
Value
|
Losses
|
Value
|
Losses
|
||||||||||||||||||
|
December
31, 2009
|
||||||||||||||||||||||||
|
U.S.
Treasury and Federal agencies securities
|
$ | 245,921 | $ | (1,780 | ) | $ | - | $ | - | $ | 245,921 | $ | (1,780 | ) | ||||||||||
|
U.S.
States and political subdivisions securities
|
9,501 | (178 | ) | 16,718 | (2,159 | ) | 26,219 | (2,337 | ) | |||||||||||||||
|
Mortgage-backed
securities - Federal agencies
|
90,592 | (1,137 | ) | 22,330 | (297 | ) | 112,922 | (1,434 | ) | |||||||||||||||
|
Corporate
debt securities
|
7,149 | (38 | ) | - | - | 7,149 | (38 | ) | ||||||||||||||||
|
Total
debt securities
|
353,163 | (3,133 | ) | 39,048 | (2,456 | ) | 392,211 | (5,589 | ) | |||||||||||||||
|
Marketable
equity securities
|
2 | (2 | ) | 4 | (27 | ) | 6 | (29 | ) | |||||||||||||||
|
Total
temporarily impaired available-for-sale securities
|
$ | 353,165 | $ | (3,135 | ) | $ | 39,052 | $ | (2,483 | ) | $ | 392,217 | $ | (5,618 | ) | |||||||||
|
December
31, 2008
|
||||||||||||||||||||||||
|
U.S.
Treasury and Federal agencies securities
|
$ | 19,998 | $ | (2 | ) | $ | - | $ | - | $ | 19,998 | $ | (2 | ) | ||||||||||
|
U.S.
States and political subdivisions securities
|
29,594 | (1,686 | ) | - | - | 29,594 | (1,686 | ) | ||||||||||||||||
|
Mortgage-backed
securities - Federal agencies
|
14,840 | (229 | ) | 34,721 | (1,270 | ) | 49,561 | (1,499 | ) | |||||||||||||||
|
Corporate
debt securities
|
493 | (1 | ) | - | - | 493 | (1 | ) | ||||||||||||||||
|
Total
debt securities
|
64,925 | (1,918 | ) | 34,721 | (1,270 | ) | 99,646 | (3,188 | ) | |||||||||||||||
|
Marketable
equity securities
|
11 | (18 | ) | 2 | (2 | ) | 13 | (20 | ) | |||||||||||||||
|
Total
temporarily impaired available-for-sale securities
|
$ | 64,936 | $ | (1,936 | ) | $ | 34,723 | $ | (1,272 | ) | $ | 99,659 | $ | (3,208 | ) | |||||||||
At
December 31, 2009, we do not have the intent to sell any of the
available-for-sale securities in the table above and believe that it is more
likely than not that we will not have to sell any such securities before an
anticipated recovery of cost. The unrealized losses are due to increases in
market interest rates over the yields available at the time the underlying
securities were purchased and market illiquidity on adjustable rate coupon
securities which are reflected in U.S. States and Political subdivisions. The
fair value is expected to recover on all debt securities as they approach their
maturity date or repricing date or if market yields for such investments
decline. We do not believe any of the securities are impaired due to reasons of
credit quality. Accordingly, as of December 31, 2009, we believe the impairments
detailed in the table above are temporary and no impairment loss has been
realized in our consolidated statements of income.
At
December 31, 2009 and 2008, investment securities with carrying values of
$351.84 million and $434.12 million, respectively, were pledged as collateral to
secure government deposits, security repurchase agreements, and for other
purposes.
Note
4 — Loans and Lease Financings
Total
loans and leases outstanding were recorded net of unearned income and deferred
loan fees and costs at December 31, 2009 and 2008, and totaled $3.09 billion and
$3.30 billion, respectively. At December 31, 2009 and 2008, net deferred loan
and lease costs were $3.18 million and $4.58 million, respectively.
The loan
and lease portfolio includes direct financing leases, which are included in
auto, light truck and environmental equipment, medium and heavy duty truck,
aircraft financing, and construction equipment financing on the consolidated
balance sheet.
A summary
of the gross investment in lease financing and the components of the investment
in lease financing at December 31, 2009 and 2008, follows:
|
(Dollars
in thousands)
|
2009
|
2008
|
||||||
|
Direct
finance leases:
|
||||||||
|
Rentals
receivable
|
$ | 207,666 | $ | 183,818 | ||||
|
Estimated
residual value of leased assets
|
29,696 | 33,711 | ||||||
|
Gross
investment in lease financing
|
237,362 | 217,529 | ||||||
|
Unearned
income
|
(34,753 | ) | (31,630 | ) | ||||
|
Net
investment in lease financing
|
$ | 202,609 | $ | 185,899 | ||||
At
December 31, 2009, the minimum future lease payments receivable for each of the
years 2010 through 2014 were $46.13 million, $37.49 million, $27.99 million,
$21.13 million, and $16.72 million, respectively.
In the
ordinary course of business, we have extended loans to certain directors,
executive officers, and principal shareholders of equity securities of 1st
Source and to their affiliates. In the opinion of management, these loans are
made on substantially the same terms, including interest rates and collateral,
as those prevailing at the time for comparable transactions with other parties
and are consistent with sound banking practices and within applicable regulatory
and lending limitations. The aggregate dollar amounts of these loans were $9.58
million and $9.16 million at December 31, 2009 and 2008, respectively. During
2009, $3.92 million of new loans and other additions were made and repayments
and other reductions totaled $3.50 million.
Note
5 — Reserve for Loan and Lease Losses
Changes
in the reserve for loan and lease losses for each of the three years ended
December 31 are shown below.
|
(Dollars
in thousands)
|
2009
|
2008
|
2007
|
|||||||||
|
Balance,
beginning of year
|
$ | 79,776 | $ | 66,602 | $ | 58,802 | ||||||
|
Provision
for loan and lease losses
|
31,101 | 16,648 | 7,534 | |||||||||
|
Charge-offs
|
(28,215 | ) | (8,393 | ) | (7,367 | ) | ||||||
|
Recoveries
|
5,574 | 4,919 | 5,254 | |||||||||
|
Reserves
acquired in acquisitions
|
- | - | 2,379 | |||||||||
|
Balance,
end of year
|
$ | 88,236 | $ | 79,776 | $ | 66,602 | ||||||
At
December 31, 2009 and 2008, nonaccrual loans and leases, restructured loans and
leases not in compliance with their modified terms and troubled debt
restructured loans and leases, substantially all of which are collateralized,
were $83.54 million and $36.55 million, respectively. Interest income for the
years ended December 31, 2009, 2008, and 2007, would have increased by
approximately $5.17 million, $1.54 million, and $0.72 million, respectively, if
these loans and leases had earned interest at their full contract
rate.
As of
December 31, 2009 and 2008, impaired loans and leases totaled $80.54 million and
$30.94 million respectively, of which $39.67 million and $21.36 million had
corresponding specific reserves for loan and lease losses totaling $8.92 million
and $4.54 million, respectively. The remaining balances of impaired loans and
leases had no specific reserves for loan and lease losses associated with them.
As of December 31, 2009, a total of $74.18 million of the impaired loans and
leases were nonaccrual loans and leases. For 2009, 2008, and 2007 the average
recorded investment in impaired loans and leases was $65.87 million, $15.25
million and $8.35 million, respectively, and interest income recognized on
impaired loans and leases totaled $1.93 million, $1.68 million, and $0.04
million, respectively.
Note
6 — Operating Leases
We
finance various types of construction equipment, medium and heavy duty trucks,
automobiles, and miscellaneous production equipment under leases principally
classified as operating leases. The equipment underlying the operating leases is
reported at cost, net of accumulated depreciation, in the Statements of
Financial Condition. These operating lease arrangements require the lessee to
make a fixed monthly rental payment over a specified lease term, typically from
three to seven years. Rental income is earned on the operating lease assets and
reported as noninterest income. These operating lease assets are depreciated
over the term of the lease to the estimated fair value of the asset at the end
of the lease. The depreciation of these operating lease assets is reported as a
component of noninterest expense. At the end of the lease, the operating lease
asset is either purchased by the lessee or returned to us.
Operating
lease equipment at December 31, 2009 and 2008 was $97.00 million and $83.06
million, respectively, net of accumulated depreciation of $48.48 million and
$39.65 million, respectively. Depreciable lives for operating lease equipment
generally range from three to seven years.
The
minimum future lease rental payments due from clients on operating lease
equipment at December 31, 2009, totaled $64.06 million, of which $25.47 million
is due in 2010, $20.01 million in 2011, $12.96 million in 2012, $4.51 million in
2013, $1.06 million in 2014, and $0.05 million in 2015. Depreciation expense
related to operating lease equipment for the year ended December 31, 2009 was
$20.52 million.
Note
7 — Premises and Equipment
Premises
and equipment as of December 31 consisted of the following:
|
(Dollars
in thousands)
|
2009
|
2008
|
||||||
|
Land
|
$ | 11,052 | $ | 10,788 | ||||
|
Buildings
and improvements
|
47,771 | 47,832 | ||||||
|
Furniture
and equipment
|
36,261 | 35,861 | ||||||
|
Total
premises and equipment
|
95,084 | 94,481 | ||||||
|
Accumulated
depreciation and amortization
|
(57,177 | ) | (53,990 | ) | ||||
|
Net
premises and equipment
|
$ | 37,907 | $ | 40,491 | ||||
Depreciation
and amortization of properties and equipment totaled $4.61 million in 2009,
$5.31 million in 2008, and $5.36 million in 2007.
Note
8 — Mortgage Servicing Assets
The
unpaid principal balance of residential mortgage loans serviced for third
parties was $1.03 billion at December 31, 2009, compared to $0.78 billion at
December 31, 2008, and $0.76 billion at December 31, 2007.
Changes
in the carrying value of mortgage servicing assets and the associated valuation
allowance follow:
|
(Dollars
in thousands)
|
2009
|
2008
|
||||||
|
Mortgage
servicing assets:
|
||||||||
|
Balance
at beginning of year
|
$ | 6,708 | $ | 7,440 | ||||
|
Additions
|
7,143 | 5,488 | ||||||
|
Amortization
|
(3,331 | ) | (2,838 | ) | ||||
|
Sales
|
(1,771 | ) | (3,382 | ) | ||||
|
Carrying
value before valuation allowance at end of year
|
8,749 | 6,708 | ||||||
|
Valuation
allowance:
|
||||||||
|
Balance
at beginning of year
|
(2,073 | ) | (161 | ) | ||||
|
Impairment
recoveries (charges)
|
2,072 | (1,912 | ) | |||||
|
Balance
at end of year
|
$ | (1 | ) | $ | (2,073 | ) | ||
|
Net
carrying value of mortgage servicing assets at end of year
|
$ | 8,748 | $ | 4,635 | ||||
|
Fair
value of mortgage servicing assets at end of year
|
$ | 10,180 | $ | 4,715 | ||||
During
2009, management determined that it was not necessary to permanently write-down
any previously established valuation allowance. At December 31, 2009, the fair
value of mortgage servicing assets exceeded the carrying value reported in the
consolidated balance sheet by $1.43 million. This difference represents
increases in the fair value of certain mortgage servicing assets that could not
be recorded above cost basis.
The key
economic assumptions used to estimate the fair value of the mortgage servicing
rights as of December 31 follow:
|
2009
|
2008
|
|||||||
|
Expected
weighted-average life (in years)
|
2.95 | 3.02 | ||||||
|
Weighted-average
constant prepayment rate (CPR)
|
18.73 | % | 40.40 | % | ||||
|
Weighted-average
discount rate
|
8.96 | % | 8.45 | % | ||||
Funds held in trust at 1st Source for the payment of principal, interest, taxes and insurance premiums applicable to mortgage loans being serviced for others, were approximately $16.78 million and $13.21 million at December 31, 2009 and December 31, 2008, respectively. Mortgage loan contractual servicing fees, including late fees and ancillary income, were $3.74 million, $3.05 million, and $2.85 million for 2009, 2008, and 2007, respectively. Mortgage loan contractual servicing fees are included in Mortgage banking income on the consolidated statement of income.
Note
9 — Intangible Assets and Goodwill
At
December 31, 2009, intangible assets consisted of goodwill of $83.33 million and
other intangible assets of $6.89 million, which is net of accumulated
amortization of $3.78 million. At December 31, 2008, intangible assets consisted
of goodwill of $83.33 million and other intangible assets of $8.36 million,
which is net of accumulated amortization of $2.43 million. Intangible asset
amortization was $1.35 million, $1.39 million, and $0.87 million for 2009, 2008,
and 2007, respectively. Amortization on other intangible assets is expected to
total $1.32 million, $1.29 million, $1.19 million, $1.02 million, and $0.83
million in 2010, 2011, 2012, 2013, and 2014, respectively.
A summary
of core deposit intangible and other intangible assets as of December 31
follows:
|
(Dollars
in thousands)
|
2009
|
2008
|
||||||
|
Core
deposit intangibles:
|
||||||||
|
Gross
carrying amount
|
$ | 10,421 | $ | 10,537 | ||||
|
Less:
accumulated amortization
|
(3,699 | ) | (2,378 | ) | ||||
|
Net
carrying amount
|
$ | 6,722 | $ | 8,159 | ||||
|
Other
intangibles:
|
||||||||
|
Gross
carrying amount
|
$ | 254 | $ | 254 | ||||
|
Less:
accumulated amortization
|
(82 | ) | (50 | ) | ||||
|
Net
carrying amount
|
$ | 172 | $ | 204 | ||||
Note
10 — Deposits
The
amount of certificates of deposit of $100,000 or more and other time deposits of
$100,000 or more outstanding at December 31, 2009, by time remaining until
maturity is as follows:
|
(Dollars
in thousands)
|
||||
|
Under
3 months
|
$ | 103,958 | ||
|
4 –
6 months
|
70,820 | |||
|
7 –
12 months
|
169,341 | |||
|
Over
12 months
|
165,961 | |||
|
Total
|
$ | 510,080 | ||
Scheduled
maturities of time deposits, including both private and public funds, at
December 31, 2009 were as follows:
|
(Dollars
in thousands)
|
||||
|
2010
|
$ | 1,006,850 | ||
|
2011
|
289,050 | |||
|
2012
|
73,051 | |||
|
2013
|
51,888 | |||
|
2014
|
50,287 | |||
|
Thereafter
|
14,251 | |||
|
Total
|
$ | 1,485,377 | ||
Note
11 — Borrowed Funds and Mandatorily Redeemable Securities
Details
of long-term debt and mandatorily redeemable securities as of December 31, 2009
and 2008 are as follows:
|
(Dollars
in thousands)
|
2009
|
2008
|
||||||
|
Term
loan
|
$ | 10,000 | $ | 10,000 | ||||
|
Federal
Home Loan Bank borrowings (4.77%–6.54%)
|
955 | 10,981 | ||||||
|
Mandatorily
redeemable securities
|
8,201 | 7,905 | ||||||
|
Other
long-term debt
|
605 | 946 | ||||||
|
Total
long-term debt and mandatorily redeemable securities
|
$ | 19,761 | $ | 29,832 | ||||
Annual maturities of long-term debt outstanding at December 31, 2009, for the next five years beginning in 2010, are as follows (in thousands): $10,317; $216; $49; $51; and $54.
During
2007, we entered into a line of credit agreement whereby 1st Source may borrow
up to $30.00 million. During 2008, $10.00 million was drawn on this line and
converted to a term loan bearing a fixed interest rate of 4.28%. Interest is
payable quarterly with principal due at the October 30, 2010 maturity. The Loan
Agreement contains, among other provisions, certain covenants relating to
capital structure financial requirements. $20.00 million remains available on
the line of credit at December 31, 2009. The line of credit matures on October
30, 2010.
At
December 31, 2009, the Federal Home Loan Bank borrowings represented a source of
funding for certain residential mortgage activities and consisted of five fixed
rate notes with maturities ranging from 2016 to 2022. These notes were
collateralized by $1.19 million of certain real estate loans.
Short-term
borrowings include federal funds purchased, security repurchase agreements,
commercial paper and other short-term borrowings. Federal funds purchased were
$0.00 million and $105.50 million as of December 31, 2009 and 2008. Securities
sold under agreement to repurchase were $123.79 million and $167.03 million as
of December 31, 2009 and 2008. Commercial paper was $4.73 million and $4.46
million as of December 31, 2009 and 2008. Other short-term borrowings
were $21.60 million and $19.19 million as of December 31, 2009 and
2008. Weighted average interest rates on short term borrowings as of
December 31, 2009 and 2008 were 0.25% and 0.49% for federal funds purchased and
security repurchase agreements, 0.43% and 0.29% for commercial paper and 1.80%
and 2.92% for other short-term borrowings, respectively.
Mandatorily
redeemable securities as of December 31, 2009, of $8.20 million reflected the
"book value" shares under the 1st Source Executive Incentive Plan. See Note 16 -
Employee Stock Benefit Plans for additional information. Dividends paid on these
shares and changes in book value per share are recorded as other interest
expense. Total interest expense recorded for 2009, 2008, and 2007 was $0.45
million, $0.66 million, and $0.80 million, respectively.
Note
12 — Subordinated Notes
As of
December 31, 2009, we sponsored two trusts, 1st Source Capital Trust IV and 1st
Source Master Trust (Capital Trusts) of which 100% of the common equity is owned
by 1st Source. The Capital Trusts were formed for the purpose of issuing
corporation-obligated mandatorily redeemable capital securities (the capital
securities) to third-party investors and investing the proceeds from the sale of
the capital securities solely in junior subordinated debenture securities of 1st
Source (the subordinated notes). The subordinated notes held by each Capital
Trust are the sole assets of that Capital Trust. The Capital Trusts are reported
in the financial statements as unconsolidated subsidiaries. The
junior subordinated debentures are reflected as subordinated notes in the
Statements of Financial Condition.
Distributions
on the capital securities issued by the Capital Trusts are payable quarterly at
a rate per annum equal to the interest rate being earned by the Capital Trust on
the subordinated notes held by that Capital Trust. The capital securities are
subject to mandatory redemption, in whole or in part, upon repayment of the
subordinated notes. We have entered into agreements which, taken collectively,
fully and unconditionally guarantee the capital securities subject to the terms
of each of the guarantees. The capital securities held by the Capital Trusts
qualify as Tier 1 capital under Federal Reserve Board guidelines.
The
subordinated notes are summarized as follows, at December 31, 2009:
|
Amount
of
|
|||||||||
|
Subordinated
|
Interest
|
Maturity
|
|||||||
|
(Dollars
in thousands)
|
Notes
|
Rate
|
Date
|
||||||
|
September
2004 issuance-fixed rate
|
$ | 30,928 | 7.66 | % |
12/15/34
|
||||
|
June
2007 issuance-fixed rate
|
41,238 | 7.22 | % |
06/15/37
|
|||||
|
August
2007 issuance-fixed rate
|
17,526 | 7.10 | % |
09/15/37
|
|||||
|
Total
|
$ | 89,692 | |||||||
Note
13 — Preferred Stock
On
January 23, 2009, we entered into a Letter Agreement with the United States
Department of the Treasury (the “Treasury”), pursuant to which we issued and
sold (i) 111,000 shares of our Fixed Rate Cumulative Perpetual Preferred Stock,
Series A (the “Series A Preferred Stock”) and (ii) a warrant (the “Warrant”) to
purchase 837,947 shares of our common stock, without par value (the “Common
Stock”), for an aggregate purchase price of $111,000,000 in cash.
The
$111.00 million proceeds were allocated to the Series A Preferred Stock and the
Warrant based on the relative fair value of the instruments. The fair value of
the warrants was estimated using the binomial method. The expected volatility
was based on the historical volatility for the ten year estimated life of the
warrants. The following assumptions were used to value the warrants: a risk-free
interest rate of 3.49%; an expected dividend yield of 3.21%; an expected
volatility factor of 40.48%; and an expected warrant life of ten years. The fair
value of the preferred stock was estimated using a discounted cash flow approach
assuming a preferred stock life of five years and a 13.00% discount rate. The
difference between the initial carrying value of $103.73 million that was
allocated to the Series A Preferred Stock and its redemption value of $111.00
million will be charged to retained earnings (with a corresponding increase in
the carrying value of the Series A Preferred Stock) over the first five years of
the contract as an adjustment to the dividend yield using the effective yield
method.
The
Series A Preferred Stock qualifies as Tier 1 capital and pays cumulative
dividends at a rate of 5% per annum for the first five years, and 9% per annum
thereafter. The Series A Preferred Stock is non-voting except with respect to
certain matters affecting the rights of the holders thereof, and may be redeemed
by us after notice to the Treasury and our primary federal regulator, the Board
of Governors of the Federal Reserve System (“Federal Reserve Bank”) and subject
to consultation between the Treasury and Federal Reserve Bank. At the time of
redemption, if we do not choose to exercise our option to repurchase the
warrants, the Secretary of Treasury intends to sell the warrants through an
auction process.
The
Warrant has a 10-year term and is immediately exercisable upon its issuance,
with an exercise price, subject to anti-dilution adjustments, equal to $19.87
per share of the Common Stock.
In
addition, we may not increase the quarterly dividend we pay on our common stock
above $0.16 per share during the three-year period ending January 23, 2012,
without consent of the Treasury, unless the Treasury no longer holds shares of
the Series A Preferred Stock.
Note
14 — Earnings Per Share
Earnings
per common share is computed using the two-class method. Basic earnings per
common share is computed by dividing net income available to common shareholders
by the weighted-average number of common shares outstanding during the
applicable period, excluding outstanding participating securities. Participating
securities include non-vested restricted stock awards. Non-vested restricted
stock awards are considered participating securities to the extent the holders
of these securities receive non-forfeitable dividends at the same rate as
holders of common stock. Diluted earnings per common share is computed using the
weighted-average number of shares determined for the basic earnings per common
share computation plus the dilutive effect of stock compensation using the
treasury stock method.
The
following table presents a reconciliation of the number of shares used in the
calculation of basic and diluted earnings per common share for the three years
end December 31.
|
(Dollars
in thousands - except per share amounts)
|
2009
|
2008
|
2007
|
|||||||||
|
Distributed
earnings allocated to common stock
|
$ | 14,247 | $ | 13,980 | $ | 13,102 | ||||||
|
Undistributed
earnings allocated to common stock
|
4,735 | 19,035 | 17,094 | |||||||||
|
Net
earnings allocated to common stock
|
18,982 | 33,015 | 30,196 | |||||||||
|
Net
earnings allocated to participating securities
|
92 | 371 | 343 | |||||||||
|
Net
income allocated to common stock and participating
securities
|
$ | 19,074 | $ | 33,386 | $ | 30,539 | ||||||
|
Weighted
average shares outstanding for basic earnings per common
share
|
24,157,179 | 24,105,753 | 23,516,342 | |||||||||
|
Dilutive
effect of stock compensation
|
6,510 | 281,979 | 293,525 | |||||||||
|
Weighted
average shares outstanding for diluted earnings per common
share
|
24,163,689 | 24,387,732 | 23,809,867 | |||||||||
|
Basic
earnings per common share
|
$ | 0.79 | $ | 1.38 | $ | 1.30 | ||||||
|
Diluted
earnings per common share
|
$ | 0.79 | $ | 1.37 | $ | 1.28 | ||||||
Note 15 — Employee Benefit Plans
The 1st
Source Corporation Employee Stock Ownership and Profit Sharing Plan (as amended,
the “Plan”) includes an employee stock ownership component, which is designed to
invest in and hold 1st Source common stock, and a 401(k) plan component, which
holds all Plan assets not invested in 1st Source common stock. The Plan also
includes a number of features that encourage diversification of investments with
more opportunities to change investment elections and contribution
levels.
Employees
are eligible to participate in the Plan the first of the month following 90 days
of employment. We match dollar for dollar on the first 4% of deferred
compensation, plus 50 cents on the dollar of the next 2% deferrals. We will also
contribute to the Plan an amount designated as a fixed 2% employer contribution.
The amount of fixed contribution is equal to two percent of compensation.
Additionally, each year we may, in our sole discretion, make a discretionary
profit sharing contribution. As of December 31, 2009 and 2008, there were
1,262,509 and 1,191,749 shares, respectively, of 1st Source Corporation common
stock held in relation to employee benefit plans.
Our
contribution is allocated among the participants on the basis of compensation.
Each participant’s account is credited with cash and/or shares of 1st Source
common stock based on that participant’s compensation earned during the year.
After completing five years of service in which they worked at least 1,000 hours
per year, a participant will be completely vested in their employer’s
contribution. An employee is always 100% vested in their deferral. Plan
participants are entitled to receive distributions from their Plan accounts upon
termination of service, which includes retirement or death.
Contribution
expense for the years ended December 31, 2009, 2008, and 2007, amounted to $2.83
million, $2.90 million, and $2.74 million, respectively.
The fixed
2% component of the Plan is based on 2% of participants’ eligible compensation.
For the years ended December 31, 2009, 2008, and 2007, total pension expense for
this plan amounted to $1.10 million, $1.37 million, and $1.06 million,
respectively.
In
addition to the 1st Source Corporation Employee Stock Ownership and Profit
Sharing Plan, we provide certain health care and life insurance benefits for
substantially all of our retired employees. Effective March 31, 2009, we amended
the plan so that no new retirees will be covered by the plan. The amendment will
have no effect on the coverage for retirees covered at the time of the
amendment. Prior to amendment, all of our full-time employees became eligible
for these retiree benefits upon reaching age 55 with 20 years of credited
service. The medical plan pays a stated percentage of eligible medical expenses
reduced for any deductibles and payments made by government programs and other
group coverage. The lifetime maximum benefit payable under the medical plan is
$15,000 and for life insurance is $3,000.
Our net
periodic post retirement benefit (recovery) cost recognized in the consolidated
financial statements for the years ended December 31, 2009, 2008, and 2007
amounted to $(1.43) million, $0.13 million, and $(0.01) million, respectively.
Our accrued postretirement benefit cost was not material at December 31, 2009,
2008, and 2007.
Note
16 — Employee Stock Benefit Plans
As of
December 31, 2009, we had five stock-based employee compensation plans. These
plans include two stock option plans, namely, the 1992 Stock Option Plan, and
the 2001 Stock Option Plan; two executive stock award plans, namely, the
Executive Incentive Plan, and the Restricted Stock Award Plan; and the Employee
Stock Purchase Plan. These stock-based employee compensation plans were
established to help retain and motivate key employees. All of the plans have
been approved by the shareholders of 1st Source Corporation. The Executive
Compensation and Human Resources Committee (the "Committee") of the 1st Source
Corporation Board of Directors has sole authority to select the employees,
establish the awards to be issued, and approve the terms and conditions of each
award under the stock-based compensation plans.
A
combined summary of activity regarding our active stock option plans and stock
award plans is presented in the following table.
|
Non-Vested
Stock
|
Stock
Options
|
|||||||||||||||||||
|
Awards
Outstanding
|
Outstanding
|
|||||||||||||||||||
|
Weighted-
|
Weighted-
|
|||||||||||||||||||
|
Shares
|
Number
of
|
Average
|
Average
|
|||||||||||||||||
|
Available
|
Shares
|
Grant-Date
|
Number
of
|
Exercise
|
||||||||||||||||
|
for
Grant
|
Fair
Value
|
Shares
|
Price
|
|||||||||||||||||
|
Balance,
January 1, 2007
|
2,407,659 | 410,148 | $ | 13.90 | 489,475 | $ | 26.04 | |||||||||||||
|
Shares
authorized --2007 EIP
|
97,250 | - | - | - | - | |||||||||||||||
|
Granted
|
(131,796 | ) | 129,100 | 18.90 | 2,696 | 28.40 | ||||||||||||||
|
Stock
options exercised
|
- | - | - | (20,654 | ) | 15.63 | ||||||||||||||
|
Stock
awards vested
|
- | (48,530 | ) | 15.43 | - | - | ||||||||||||||
|
Forfeited
|
555 | (20,516 | ) | 12.33 | - | - | ||||||||||||||
|
Canceled
|
- | - | - | - | - | |||||||||||||||
|
Balance,
December 31, 2007
|
2,373,668 | 470,202 | 15.18 | 471,517 | 26.51 | |||||||||||||||
|
Shares
authorized --2008 EIP
|
64,847 | - | - | - | - | |||||||||||||||
|
Granted
|
(66,847 | ) | 66,847 | 17.96 | - | - | ||||||||||||||
|
Stock
options exercised
|
- | - | - | - | - | |||||||||||||||
|
Stock
awards vested
|
- | (37,070 | ) | 16.92 | - | - | ||||||||||||||
|
Forfeited
|
15,902 | (64,508 | ) | 15.10 | (390,569 | ) | 28.17 | |||||||||||||
|
Canceled
|
- | - | - | - | - | |||||||||||||||
|
Balance,
December 31, 2008
|
2,387,570 | 435,471 | 15.47 | 80,948 | 18.51 | |||||||||||||||
|
Shares
authorized --2009 EIP
|
46,261 | - | - | - | - | |||||||||||||||
|
Granted
|
(87,761 | ) | 87,761 | 17.75 | - | - | ||||||||||||||
|
Stock
options exercised
|
- | - | - | - | - | |||||||||||||||
|
Stock
awards vested
|
- | (34,395 | ) | 16.99 | - | - | ||||||||||||||
|
Forfeited
|
2,047 | (66,930 | ) | 11.85 | (9,185 | ) | 21.03 | |||||||||||||
|
Canceled
|
- | - | - | - | - | |||||||||||||||
|
Balance,
December 31, 2009
|
2,348,117 | 421,907 | $ | 16.40 | 71,763 | $ | 18.19 | |||||||||||||
Stock Option Plans — Our incentive stock option plans include the 1992 Stock Option Plan (the "1992 Plan") and the 2001 Stock Option Plan (the "2001 Plan"). As of December 31, 2009, there were 7,508 stock options remaining exercisable under the 1992 Plan, all of which will expire no later than January 2011. We have not issued any awards from the 1992 Plan since 2001, as the 1992 Plan was terminated, except for outstanding options, after the 2001 Plan was approved by the shareholders. Options under the 2001 Plan vest in one to eight years from date of grant. As of December 31, 2009, there were 64,255 shares available for issuance upon exercise and 2,119,922 shares available for issuance under the 2001 Plan.
Each
award from all plans is evidenced by an award agreement that specifies the
option price, the duration of the option, the number of shares to which the
option pertains, and such other provisions as the Committee determines. The
option price is equal to the fair market value of a share of 1st Source
Corporation's common stock on the date of grant. Options granted expire at such
time as the Committee determines at the date of grant and in no event does the
exercise period exceed a maximum of ten years. Upon merger, consolidation, or
other corporate consolidation in which 1st Source Corporation is not the
surviving corporation, as defined in the plans, all outstanding options
immediately vest.
Proceeds
from stock option exercises totaled $0.32 million in 2007. There were no stock
option exercises during 2008 or 2009. All shares issued in connection
with stock option exercises and non-vested stock awards are issued from
available treasury stock.
The total
intrinsic value of outstanding stock options and outstanding exercisable stock
options was $0.09 million and $0.07 million at December 31, 2009. The total
intrinsic value of stock options exercised was $0.27 million in 2007. The total
fair value of share awards vested was $0.72 million during 2009, $0.66 million
in 2008, and $0.98 million in 2007.
Other
information regarding stock options outstanding and exercisable as of December
31, 2009, is as follows:
|
Options
Outstanding
|
Options
Exercisable
|
|||||
|
Weighted-Average
|
||||||
|
Number
of
|
Remaining
Contractual
|
Weighted-Average
|
Number
of
|
Weighted-Average
|
||
|
Range
of Exercise Prices
|
Shares
|
Life
(Years)
|
Exercise
Price
|
Shares
|
Exercise
Price
|
|
|
$12.04
to $17.99
|
29,508
|
2.73
|
$13.38
|
24,008
|
$13.69
|
|
|
$18.00
to $26.99
|
36,700
|
1.58
|
20.43
|
36,700
|
20.43
|
|
|
$27.00
to $29.46
|
5,555
|
1.81
|
28.95
|
5,555
|
28.95
|
|
As stated in Note 1 - Accounting Policies, effective January 1, 2006, we adopted the fair value recognition provisions which require that stock-based compensation to employees be recognized as compensation cost in the income statement based on their fair values on the measurement date, which, for
1st
Source, is the date of grant. Stock-based compensation expense is recognized
ratably over the requisite service period for all awards. We recognized
additional stock-based compensation expense related to stock options of $12,362
for 2009, $15,364 for 2008 and $65,174 for 2007 (not subject to
tax).
The fair
value of each option on the date of grant was estimated using the Black-Scholes
option pricing model. Expected volatility is based on the historical volatility
estimated over a period equal to the expected life of the options. In estimating
the fair value of stock options under the Black-Scholes valuation model,
separate groups of employees that have similar historical exercise behavior are
considered separately. The expected life of the options granted is derived based
on past experience and represents the period of time that options granted are
expected to be outstanding. The following weighted-average assumptions were used
in the option pricing model for options granted in 2007 (no options were granted
in 2008 or 2009): a risk-free interest rate of 4.10%; an expected
dividend yield of 1.94%; an expected volatility factor of 30.46%; and an
expected option life of 4.67 years. The weighted-average grant date per share
fair value of options granted was $7.67 for 2007.
Stock Award Plans — Our
incentive stock award plans include the Executive Incentive Plan (EIP) and the
Restricted Stock Award Plan (RSAP). The EIP is also administered by the
Committee. Awards under the EIP include "book value" shares and "market value"
shares of common stock. These shares are awarded annually based on weighted
performance criteria and generally vest over a period of five years. The EIP
book value shares may only be sold to 1st Source and such sale is mandatory in
the event of death, retirement, disability, or termination of employment. The
RSAP is designed for key employees. Awards under the RSAP are made to employees
recommended by the Chief Executive Officer and approved by the Committee. Shares
granted under the RSAP vest over a two to ten year period and vesting is based
upon meeting certain various criteria, including continued employment with 1st
Source.
Stock-based
compensation expense relating to the EIP and RSAP totaled $1.03 million in 2009,
$0.32 million in 2008, and $0.16 million in 2007. The total income tax benefit
recognized in the accompanying consolidated statements of income related to
stock-based compensation was $0.85 million in 2009, $0.93 million in 2008, and
$0.69 million in 2007. Unrecognized stock-based compensation expense related to
stock options (2001 Plan) totaled $16,121 at December 31, 2009. At such date,
the weighted-average period over which this unrecognized expense was expected to
be recognized was 1.3 years. Unrecognized stock-based compensation expense
related to non-vested stock awards (EIP/RSAP) was $2.71 million at December 31,
2009. At such date, the weighted-average period over which this unrecognized
expense was expected to be recognized was 3.77 years.
The fair
value of non-vested stock awards for the purposes of recognizing stock-based
compensation expense is market price of the stock on the measurement date,
which, for our purposes is the date of the award.
Employee Stock Purchase Plan —
We offer an Employee Stock Purchase Plan (ESPP) for substantially all employees
with at least two years of service on the effective date of an offering under
the plan. Eligible employees may elect to purchase any dollar amount of stock,
so long as such amount does not exceed 25% of their base rate of pay and the
aggregate stock accrual rate for all offerings does not exceed $25,000 in any
calendar year. The purchase price for shares offered is the lower of the closing
market bid price for the offering date or the average market bid price for the
five business days preceding the offering date. The purchase price and discount
to the actual market closing price on the offering date for the 2009, 2008, and
2007 offerings were $17.63 (0.05%), $20.70 (0.05%), and $25.58 (1.69%),
respectively. Payment for the stock is made through payroll deductions over the
offering period, and employees may discontinue the deductions at any time and
exercise the option or take the funds out of the program. The most recent
offering began June 1, 2009 and runs through May 31, 2011, with $216,390 in
stock value to be purchased at $17.63 per share.
Note
17 — Income Taxes
Income
tax expense was comprised of the following:
|
Year
Ended December 31 (Dollars in
thousands)
|
2009
|
2008
|
2007
|
|||||||||
|
Current:
|
||||||||||||
|
Federal
|
$ | (983 | ) | $ | 21,112 | $ | 14,630 | |||||
|
State
|
1,324 | 2,682 | 1,072 | |||||||||
|
Total
current
|
341 | 23,794 | 15,702 | |||||||||
|
Deferred:
|
||||||||||||
|
Federal
|
6,172 | (9,446 | ) | (4,191 | ) | |||||||
|
State
|
(485 | ) | (1,333 | ) | (367 | ) | ||||||
|
Total
deferred
|
5,687 | (10,779 | ) | (4,558 | ) | |||||||
|
Total
provision
|
$ | 6,028 | $ | 13,015 | $ | 11,144 | ||||||
The
reasons for the difference between income tax expense and the amount computed by
applying the statutory federal income tax rate (35%) to income before income
taxes are as follows:
|
2009
|
2008
|
2007
|
||||||||||||||||||||||
|
Percent
of
|
Percent
of
|
Percent
of
|
||||||||||||||||||||||
|
Pretax
|
Pretax
|
Pretax
|
||||||||||||||||||||||
|
Year
Ended December 31 (Dollars in
thousands)
|
Amount
|
Income
|
Amount
|
Income
|
Amount
|
Income
|
||||||||||||||||||
|
Statutory
federal income tax
|
$ | 11,031 | 35.0 | % | $ | 16,240 | 35.0 | % | $ | 14,589 | 35.0 | % | ||||||||||||
|
(Decrease)
increase in income taxes resulting from:
|
||||||||||||||||||||||||
|
Tax-exempt
interest income
|
(2,539 | ) | (8.1 | ) | (2,412 | ) | (5.2 | ) | (2,380 | ) | (5.7 | ) | ||||||||||||
|
Settlements
with taxing authorities
|
(2,170 | ) | (6.9 | ) | - | - | - | - | ||||||||||||||||
|
State
taxes, net of federal income tax benefit
|
545 | 1.7 | 877 | 1.9 | 458 | 1.1 | ||||||||||||||||||
|
Dividends
received deduction
|
(76 | ) | (0.2 | ) | (171 | ) | (0.4 | ) | (343 | ) | (0.8 | ) | ||||||||||||
|
Other
|
(763 | ) | (2.4 | ) | (1,519 | ) | (3.2 | ) | (1,180 | ) | (2.9 | ) | ||||||||||||
|
Total
|
$ | 6,028 | 19.1 | % | $ | 13,015 | 28.1 | % | $ | 11,144 | 26.7 | % | ||||||||||||
|
The
tax expense (benefit) applicable to securities gains for the years 2009,
2008, and 2007 was $639,000 , $(3,786,000), and $(1,185,000),
respectively.
|
||||||||||||||||||||||||
|
Deferred
tax assets and liabilities as of December 31, 2009 and 2008 consisted of
the following:
|
||||||||
|
(Dollars
in thousands)
|
2009
|
2008
|
||||||
|
Deferred
tax assets:
|
||||||||
|
Reserve
for loan and lease losses
|
$ | 33,809 | $ | 30,583 | ||||
|
Accruals
for employee benefits
|
2,785 | 3,323 | ||||||
|
Alternative
minimum tax
|
1,678 | - | ||||||
|
Capital
loss carryover
|
459 | - | ||||||
|
Securities
valuation reserve
|
82 | 6,368 | ||||||
|
Other
|
1,770 | 521 | ||||||
|
Total
deferred tax assets
|
40,583 | 40,795 | ||||||
|
Deferred
tax liabilities:
|
||||||||
|
Differing
depreciable bases in premises and leased equipment
|
31,884 | 29,782 | ||||||
|
Differing
bases in assets related to acquisitions
|
3,242 | 2,783 | ||||||
|
Net
unrealized gains on securities available-for-sale
|
3,105 | 3,550 | ||||||
|
Mortgage
servicing
|
3,018 | 1,206 | ||||||
|
Capitalized
loan costs
|
1,306 | 1,879 | ||||||
|
Other
|
1,472 | 1,010 | ||||||
|
Total
deferred tax liabilities
|
44,027 | 40,210 | ||||||
|
Net
deferred tax (liability)/asset
|
$ | (3,444 | ) | $ | 585 | |||
No valuation allowance for deferred tax assets was recorded at December 31, 2009 and 2008 as we believe it is more likely than not that all of the deferred tax assets will be realized. As of December 31, 2009, we have $1.7 million of Alternative Minimum Tax Credits which have an indefinite life. We expect to fully utilize the amounts carried forward.
A
reconciliation of the beginning and ending amounts of unrecognized tax benefits
is as follows:
|
(Dollars
in thousands)
|
2009
|
2008
|
2007
|
|||||||||
|
Balance,
beginning of year
|
$ | 7,601 | $ | 7,063 | $ | 5,795 | ||||||
|
Additions
based on tax positions related to the current year
|
409 | 1,271 | 1,268 | |||||||||
|
Additions
for tax positions of prior years
|
771 | 693 | - | |||||||||
|
Reductions
for tax positions of prior years
|
(52 | ) | (136 | ) | - | |||||||
|
Reductions
due to lapse in statute of limitations
|
(837 | ) | (1,290 | ) | - | |||||||
|
Settlements
|
(4,849 | ) | - | - | ||||||||
|
Balance,
end of year
|
$ | 3,043 | $ | 7,601 | $ | 7,063 | ||||||
The total
amount of unrecognized tax benefits that would affect the effective tax rate if
recognized was $1.30 million at December 31, 2009, $4.19 million at December 31,
2008 and $4.25 million at December 31, 2007. Interest and penalties are
recognized through the income tax provision. For the years 2009, 2008 and 2007,
we recognized approximately $(0.73) million, $0.14 million and $0.26 million in
interest, net of tax effect, and penalties, respectively. Interest and penalties
of approximately $0.55 million, $1.27 million and $1.13 million were accrued at
December 31, 2009, 2008 and 2007, respectively.
Tax years
that remain open and subject to audit include the federal 2006–2009 years and
the Indiana 2006–2009 years. During the first quarter 2009, we reached a
resolution of audit examinations for the 2002-2007 years and as a result
recorded a reduction of unrecognized tax benefits in the amount of $4.85 million
that affected the effective tax rate and increased earnings in the amount of
$2.60 million. We do not anticipate a significant change in the amount of
uncertain tax positions within the next 12 months.
Note
18 — Contingent Liabilities, Commitments, and Financial Instruments with
Off-Balance-Sheet Risk
Contingent Liabilities —1st
Source and our subsidiaries are defendants in various legal proceedings arising
in the normal course of business. In the opinion of management, based upon
present information including the advice of legal counsel, the ultimate
resolution of these proceedings will not have a material effect on our
consolidated financial position or results of operations.
Commitments — 1st Source and
our subsidiaries are obligated under operating leases for certain office
premises and equipment. In 1982, we sold the headquarters building and entered
into a leaseback agreement with the purchaser. At December 31, 2009, the
remaining term of the lease was three years with options to renew for up to 15
additional years. Approximately 35% of the facility is subleased to other
tenants.
Future
minimum rental commitments for all noncancellable operating leases total
approximately, $2.60 million in 2010, $2.28 million in 2011, $1.22 million in
2012, $0.58 million in 2013, $0.47 million in 2014, and $1.14 million,
thereafter. As of December 31, 2009, future minimum rentals to be received under
noncancellable subleases totaled $2.82 million.
Rental
expense of office premises and equipment and related sublease income were as
follows:
|
Year
Ended December 31 (Dollars in
thousands)
|
2009
|
2008
|
2007
|
|||||||||
|
Gross
rental expense
|
$ | 3,016 | $ | 3,116 | $ | 3,255 | ||||||
|
Sublease
rental income
|
(1,516 | ) | (1,523 | ) | (1,640 | ) | ||||||
|
Net
rental expense
|
$ | 1,500 | $ | 1,593 | $ | 1,615 | ||||||
Financial Instruments with
Off-Balance-Sheet Risk —To meet the financing needs of our clients, 1st
Source and our subsidiaries are parties to financial instruments with
off-balance-sheet risk in the normal course of business. These off-balance-sheet
financial instruments include commitments to originate, purchase and sell loans,
and standby letters of credit. The instruments involve, to varying degrees,
elements of credit and interest rate risk in excess of the amount recognized in
the consolidated statements of financial condition.
Our
exposure to credit loss in the event of nonperformance by the other party to the
financial instruments for loan commitments and standby letters of credit is
represented by the dollar amount of those instruments. We use the same credit
policies and collateral requirements in making commitments and conditional
obligations as we do for on-balance-sheet instruments.
Loan
commitments generally have fixed expiration dates or other termination clauses
and may require payment of a fee. Since many of the commitments are expected to
expire without being drawn upon, the total commitment amounts do not necessarily
represent future cash requirements. The Bank grants mortgage loan commitments to
borrowers, subject to normal loan underwriting standards. The interest rate risk
associated with these loan commitments is managed by entering into contracts for
future deliveries of loans.
Standby
letters of credit are conditional commitments issued to guarantee the
performance of a client to a third party. The credit risk involved in and
collateral obtained when issuing standby letters of credit are essentially the
same as those involved in extending loan commitments to clients. Standby letters
of credit totaled $19.02 million and $82.18 million at December 31, 2009 and
2008, respectively. Standby letters of credit generally have terms ranging from
six months to one year.
Note
19 — Derivative Financial Instruments
Commitments
to originate or purchase residential mortgage loans held for sale and forward
commitments to sell residential mortgage loans are considered derivative
instruments. See Note 18 for further information.
We have
certain interest rate derivative positions that are not designated as hedging
instruments. These derivative positions relate to transactions in which we enter
into an interest rate swap with a client while at the same time entering into an
offsetting interest rate swap with another financial institution. In connection
with each transaction, we agree to pay interest to the client on a notional
amount at a variable interest rate and receive interest from the client on the
same notional amount at a fixed interest rate. At the same time, we agree to pay
another financial institution the same fixed interest rate on the same notional
amount and receive the same variable interest rate on the same notional amount.
The transaction allows our client to effectively convert a variable rate loan to
a fixed rate. Because the terms of the swaps with our customers and the other
financial institution offset each other, with the only difference being
counterparty credit risk, changes in the fair value of the underlying derivative
contracts are not materially different and do not significantly impact our
results of operations.
At
December 31, 2009 and 2008, the amounts of non-hedging derivative financial
instruments are shown in the chart below:
|
(Dollars
in thousands)
|
Asset
derivatives
|
Liability
derivatives
|
|||||||||
|
Notional
or
|
Statement
of
|
Statement
of
|
|||||||||
|
contractual
|
Financial
Condition
|
Fair
|
Financial
Condition
|
Fair
|
|||||||
|
amount
|
location
|
value
|
location
|
value
|
|||||||
|
Interest
rate swap contracts
|
$ | 412,717 |
Other
assets
|
$ | 13,516 |
Other
liabilities
|
$ | 13,988 | |||
|
Loan
commitments
|
48,821 |
Mortgages
held for sale
|
77 | N/A | - | ||||||
|
Forward
contracts
|
38,940 |
Mortgages
held for sale
|
411 | N/A | - | ||||||
|
Total
- December 31, 2009
|
$ | 14,004 | $ | 13,988 | |||||||
|
Interest
rate swap contracts
|
$ | 421,283 |
Other
assets
|
$ | 22,663 |
Other
liabilities
|
$ | 23,003 | |||
|
Loan
commitments
|
93,317 |
Mortgages
held for sale
|
1,582 | N/A | - | ||||||
|
Forward
contracts
|
97,555 |
N/A
|
- |
Mortgages
held for sale
|
1,385 | ||||||
|
Total
- December 31, 2008
|
$ | 24,245 | $ | 24,388 | |||||||
At
December 31, 2009, 2008 and 2007, the amounts included in the consolidated
statements of income for non-hedging derivative financial instruments are shown
in the chart below:
|
|
|||||||||||||
|
Statement
of
|
Gain
(loss)
|
||||||||||||
| (Dollars in thousands) |
Income
location
|
2009
|
2008
|
2007
|
|||||||||
|
Interest
rate swap contracts
|
Other
expense
|
$ | (431 | ) | $ | (271 | ) | $ | (69 | ) | |||
|
Loan
commitments
|
Mortgage
banking income
|
(1,505 | ) | 1,595 | 193 | ||||||||
|
Forward
contracts
|
Mortgage
banking income
|
1,796 | (1,131 | ) | (513 | ) | |||||||
|
Total
|
$ | (140 | ) | $ | 193 | $ | (389 | ) | |||||
Note 20 — Regulatory Matters
We are
subject to various regulatory capital requirements administered by the Federal
banking agencies. Failure to meet minimum capital requirements can result in
certain mandatory and possible additional discretionary actions by regulators
that, if undertaken, could have a material effect on our financial statements.
Under capital adequacy guidelines and the regulatory framework for prompt
corrective action, we must meet specific capital guidelines that involve
quantitative measures of our assets, liabilities, and certain off-balance-sheet
items as calculated under regulatory accounting practices. Our capital amounts
and classification are subject to qualitative judgments by the regulators about
components, risk weightings, and other factors.
Quantitative
measures established by regulation to ensure capital adequacy require us to
maintain minimum amounts and ratios of total capital and Tier I capital to
risk-weighted assets and of Tier I capital to average assets. We believe that we
meet all capital adequacy requirements to which we are subject.
The most
recent notification from the Federal bank regulators categorized 1st Source
Bank, the largest of our subsidiaries, as "well capitalized" under the
regulatory framework for prompt corrective action. To be categorized as "well
capitalized" we must maintain minimum total risk-based, Tier I risk-based, and
Tier I leverage ratios as set forth in the table below. There are no conditions
or events since that notification that we believe will have changed the
institution’s category.
As
discussed in Note 12, the capital securities held by the Capital Trusts qualify
as Tier 1 capital under Federal Reserve Board guidelines. As discussed in Note
13, preferred stock issued under the TARP program qualifies as Tier 1 capital as
well.
The
actual and required capital amounts and ratios for 1st Source Corporation and
1st Source Bank as of December 31, 2009, are presented in the table
below:
|
To
Be Well
|
||||||||||||||||||||||||
|
Capitalized
Under
|
||||||||||||||||||||||||
|
Minimum
Capital
|
Prompt
Corrective
|
|||||||||||||||||||||||
|
Actual
|
Adequacy
|
Action
Provisions
|
||||||||||||||||||||||
|
(Dollars
in thousands)
|
Amount
|
Ratio
|
Amount
|
Ratio
|
Amount
|
Ratio
|
||||||||||||||||||
|
Total
Capital (to Risk-Weighted Assets):
|
||||||||||||||||||||||||
|
1st
Source Corporation
|
$ | 605,793 | 17.72 | % | $ | 273,568 | 8.00 | % | $ | 341,961 | 10.00 | % | ||||||||||||
|
1st
Source Bank
|
571,328 | 16.78 | % | 272,404 | 8.00 | % | 340,505 | 10.00 | % | |||||||||||||||
|
Tier
I Capital (to Risk-Weighted Assets):
|
||||||||||||||||||||||||
|
1st
Source Corporation
|
561,862 | 16.43 | % | 136,784 | 4.00 | % | 205,176 | 6.00 | % | |||||||||||||||
|
1st
Source Bank
|
528,184 | 15.51 | % | 136,202 | 4.00 | % | 204,303 | 6.00 | % | |||||||||||||||
|
Tier
I Capital (to Average Assets):
|
||||||||||||||||||||||||
|
1st
Source Corporation
|
561,862 | 12.74 | % | 176,346 | 4.00 | % | 220,433 | 5.00 | % | |||||||||||||||
|
1st
Source Bank
|
528,184 | 12.03 | % | 175,577 | 4.00 | % | 219,471 | 5.00 | % | |||||||||||||||
The Bank is required to maintain noninterest bearing cash balances with the Federal Reserve Bank. The average balance of these deposits for the years ended December 31, 2009 and 2008, was approximately $3.00 million and $3.33 million, respectively.
Dividends
that may be paid by a subsidiary bank to the parent company are subject to
certain legal and regulatory limitations and also may be affected by capital
needs, as well as other factors. Without regulatory approval, the Bank can pay
dividends in 2010 of up to $27.97 million, plus an additional amount equal to
its net profits for 2010, as defined by statute, up to the date of any such
dividend declaration.
Due to
our mortgage activities, 1st Source Bank is required to maintain minimum net
worth capital requirements established by various governmental agencies. 1st
Source Bank's net worth requirements are governed by the Department of Housing
and Urban Development and GNMA. As of December 31, 2009, 1st Source Bank met its
minimum net worth capital requirements.
Note
21 — Fair Values of Financial Instruments
We
elected fair value accounting for new mortgages held for sale originations
starting on January 1, 2008. We believe the election for mortgages held for sale
(which are hedged with free-standing derivatives (economic hedges)) will reduce
certain timing differences and better match changes in the value of these assets
with changes in the value of derivatives used as economic hedges for these
assets. There was no transition adjustment required for mortgages held for sale
because we continued to account for mortgages held for sale originated prior to
January 1, 2008 at the lower of cost or fair value. At December 31, 2009 and
2008, all mortgages held for sale are carried at fair value.
The
following table reflects the differences between fair value carrying amount of
mortgages held for sale measured at fair value and the aggregate unpaid
principal amount we are contractually entitled to receive at maturity on
December 31, 2009 and 2008:
| (Dollars in thousands) |
Fair
value carrying amount
|
Aggregate
unpaid principal
|
Excess
of fair value carrying amount over (under) unpaid
principal
|
|||||||||||
| December 31, 2009 | ||||||||||||||
|
Mortgages held for sale reported at fair
value:
|
||||||||||||||
|
Total Loans
|
$ | 26,649 | $ | 25,758 | $ | 891 | (1 | ) | ||||||
|
Nonaccrual Loans
|
- | - | - | |||||||||||
|
Loans 90 days or more past due and still
accruing
|
- | - | - | |||||||||||
| December 31, 2008 | ||||||||||||||
|
Mortgages
held for sale reported at fair value:
|
||||||||||||||
|
Total
Loans
|
$ | 46,686 | $ | 45,141 | $ | 1,545 | (1 | ) | ||||||
|
Nonaccrual
Loans
|
- | - | - | |||||||||||
|
Loans
90 days or more past due and still accruing
|
- | - | - | |||||||||||
(1) The
excess of fair value carrying amount over unpaid principal is included in
mortgage banking income and includes changes in fair value at and subsequent to
funding, gains and losses on
the related loan commitment prior to funding, and premiums on acquired
loans.
We also deferred until January 1, 2009 the application of Fair Value Measurements to nonfinancial assets and nonfinancial liabilities not recognized or disclosed at least annually at fair value. Items affected by this deferral included goodwill, repossessions and other real estate, all for which any necessary impairment analyses are performed using fair value measurements.
We
determine the fair values of our financial instruments based on the fair value
hierarchy, which requires an entity to maximize the use of quoted price and
observable inputs and to minimize the use of unobservable inputs when measuring
fair value. The following is a description of the valuation methodologies used
for financial instruments measured at fair value on a recurring
basis:
Investment
securities available for sale are valued primarily by a third party pricing
agent and both the market and income valuation approaches are implemented using
the following types of inputs:
|
·
|
U.S.
treasuries are priced using the market approach and utilizing live data
feeds from active market exchanges for identical
securities.
|
|
·
|
Government-sponsored
agency debt securities and corporate bonds are primarily priced using
available market information through processes such as benchmark curves,
market valuations of like securities, sector groupings and matrix
pricing.
|
|
·
|
Other
government-sponsored agency securities, mortgage-backed securities and
some of the actively traded REMICs and CMOs, are primarily priced using
available market information including benchmark yields, prepayment
speeds, spreads and volatility of similar
securities.
|
|
·
|
Other
inactive government-sponsored agency securities are primarily priced using
consensus pricing and dealer
quotes.
|
|
·
|
State
and political subdivisions are largely grouped by characteristics, i.e.,
geographical data and source of revenue in trade dissemination systems.
Since some securities are not traded daily and due to other grouping
limitations, active market quotes are often obtained using benchmarking
for like securities. Local tax anticipation warrants, with very little
market activity, are priced using an appropriate market yield
curve.
|
|
·
|
Marketable
equity (common) securities are primarily priced using the market approach
and utilizing live data feeds from active market exchanges for identical
securities.
|
|
·
|
Marketable
equity (preferred) securities are primarily priced using available market
information through processes such as benchmark curves, benchmarking of
like securities, sector groupings and matrix
pricing.
|
Trading
account securities are priced using the market approach and utilizing live data
feeds from active market exchanges for identical securities.
Mortgages
held for sale and the related loan commitments and forward contracts (hedges)
are valued using a market value approach and utilizing an appropriate current
market yield and a loan commitment closing rate based on historical
analysis.
Interest
rate swap positions, both assets and liabilities, are valued by a third-party
pricing agent using an income approach and utilizing models that use as their
basis readily observable market parameters. This valuation process considers
various factors including interest rate yield curves, time value and volatility
factors.
The table
below presents the balance of assets and liabilities at December 31, 2009 and
2008, measured at fair value on a recurring basis.
|
(Dollars
in thousands)
|
Level
1
|
Level
2
|
Level
3
|
Total
|
||||||||||||
|
Assets:
|
||||||||||||||||
|
Investment
securities available for sale:
|
||||||||||||||||
|
U.S.
Treasury and Federal agencies securities
|
$ | 20,052 | $ | 369,117 | $ | - | $ | 389,169 | ||||||||
|
U.S.
States and political subdivisions securities
|
- | 173,509 | 18,310 | 191,819 | ||||||||||||
|
Mortgage-backed
securities - Federal agencies
|
- | 290,977 | - | 290,977 | ||||||||||||
|
Corporate
debt securities
|
- | 26,322 | - | 26,322 | ||||||||||||
|
Foreign
government securities
|
- | - | 675 | 675 | ||||||||||||
|
Total
debt securities
|
20,052 | 859,925 | 18,985 | 898,962 | ||||||||||||
|
Marketable
equity securities
|
2,667 | - | 9 | 2,676 | ||||||||||||
|
Total
investment securities available for sale
|
22,719 | 859,925 | 18,994 | 901,638 | ||||||||||||
|
Trading
account securities
|
125 | - | - | 125 | ||||||||||||
|
Mortgages
held for sale
|
- | 26,649 | - | 26,649 | ||||||||||||
|
Accrued
income and other liabilities (interest rate swap
agreements)
|
- | 13,516 | - | 13,516 | ||||||||||||
|
Total
- December 31, 2009
|
$ | 22,844 | $ | 900,090 | $ | 18,994 | $ | 941,928 | ||||||||
|
Liabilities:
|
||||||||||||||||
|
Accrued
expenses and other liabilities (interest rate swap
agreements)
|
$ | - | $ | 13,988 | $ | - | $ | 13,988 | ||||||||
|
Total
- December 31, 2009
|
$ | - | $ | 13,988 | $ | - | $ | 13,988 | ||||||||
|
Assets:
|
||||||||||||||||
|
Investment
securities available for sale:
|
||||||||||||||||
|
U.S.
Treasury and Federal agencies securities
|
$ | 81,621 | $ | 214,730 | $ | - | $ | 296,351 | ||||||||
|
U.S.
States and political subdivisions securities
|
- | 181,977 | 18,972 | 200,949 | ||||||||||||
|
Mortgage-backed
securities - Federal agencies
|
- | 210,008 | - | 210,008 | ||||||||||||
|
Corporate
debt securities
|
- | 10,544 | - | 10,544 | ||||||||||||
|
Foreign
government securities
|
- | - | 435 | 435 | ||||||||||||
|
Total
debt securities
|
81,621 | 617,259 | 19,407 | 718,287 | ||||||||||||
|
Marketable
equity securities
|
3,249 | 3,209 | 9 | 6,467 | ||||||||||||
|
Total
investment securities available for sale
|
84,870 | 620,468 | 19,416 | 724,754 | ||||||||||||
|
Trading
account securities
|
100 | - | - | 100 | ||||||||||||
|
Mortgages
held for sale
|
- | 46,686 | - | 46,686 | ||||||||||||
|
Accrued
income and other liabilities (interest rate swap
agreements)
|
- | 22,663 | - | 22,663 | ||||||||||||
|
Total
- December 31, 2008
|
$ | 84,970 | $ | 689,817 | $ | 19,416 | $ | 794,203 | ||||||||
|
Liabilities:
|
||||||||||||||||
|
Accrued
expenses and other liabilities (interest rate swap
agreements)
|
$ | - | $ | 23,003 | $ | - | $ | 23,003 | ||||||||
|
Total
- December 31, 2008
|
$ | - | $ | 23,003 | $ | - | $ | 23,003 | ||||||||
The changes in Level 3 assets and liabilities at December 31, 2009 and 2008, measured at fair value on a recurring basis are summarized as follows:
|
(Dollars
in thousands)
|
U.S.
States and political subdivisions securities
|
Foreign
government securities
|
Marketable
equity securities
|
Other
investments
|
Investment
securities available-for-sale
|
|||||||||||||||
|
Beginning
balance January 1, 2009
|
$ | 18,972 | $ | 435 | $ | 9 | $ | - | $ | 19,416 | ||||||||||
|
Total
gains or losses (realized/unrealized):
|
||||||||||||||||||||
|
Included
in earnings
|
- | - | - | - | - | |||||||||||||||
|
Included
in other comprehensive income
|
362 | - | - | - | 362 | |||||||||||||||
|
Purchases
and issuances
|
20,116 | 400 | - | - | 20,516 | |||||||||||||||
|
Settlements
|
- | - | - | - | - | |||||||||||||||
|
Expirations
|
(21,140 | ) | (160 | ) | - | - | (21,300 | ) | ||||||||||||
|
Transfers
in and/or out of Level 3
|
- | - | - | - | - | |||||||||||||||
|
Ending
balance December 31, 2009
|
$ | 18,310 | $ | 675 | $ | 9 | $ | - | $ | 18,994 | ||||||||||
|
Beginning
balance January 1, 2008
|
$ | 37,342 | $ | 665 | $ | 2,562 | $ | 1,643 | $ | 42,212 | ||||||||||
|
Total
gains or losses (realized/unrealized):
|
||||||||||||||||||||
|
Included
in earnings
|
(42 | ) | - | 789 | - | 747 | ||||||||||||||
|
Included
in other comprehensive income
|
(589 | ) | - | (773 | ) | - | (1,362 | ) | ||||||||||||
|
Purchases
and issuances
|
24,714 | - | - | - | 24,714 | |||||||||||||||
|
Settlements
|
- | - | - | - | - | |||||||||||||||
|
Expirations
|
(47,199 | ) | (230 | ) | (2,569 | ) | - | (49,998 | ) | |||||||||||
|
Transfers
in and/or out of Level 3
|
4,746 | - | - | (1,643 | ) | 3,103 | ||||||||||||||
|
Ending
balance December 31, 2008
|
$ | 18,972 | $ | 435 | $ | 9 | $ | - | $ | 19,416 | ||||||||||
There
were no gains or losses for the period included in earnings attributable to the
change in unrealized gains or losses relating to assets and liabilities still
held at December 31, 2009.
We may be
required, from time to time, to measure certain other financial assets at fair
value on a nonrecurring basis. These other financial assets include loans
measured for impairment, venture capital partnership investments, mortgage
servicing rights, goodwill, repossessions and other real estate.
Impaired
loans and related write-downs are based on the fair value of the underlying
collateral if repayment is expected solely from the collateral. Collateral
values are estimated using customized discounting criteria, appraisals and
dealer and trade magazine quotes which are used in a market valuation approach.
Repossessions are similarly valued.
Venture
capital partnership investments and the adjustments to fair value primarily
result from application of lower-of-cost-or-fair value accounting. The
partnership investments are priced using financial statements provided by the
partnerships.
Mortgage
servicing rights (MSRs) and related adjustments to fair value result from
application of lower-of-cost-or-fair value accounting. For purposes of
impairment, MSRs are stratified based on the predominant risk characteristics of
the underlying servicing, principally by loan type and interest rate. The fair
value of each tranche of the servicing portfolio is estimated by calculating the
present value of estimated future net servicing cash flows, taking into
consideration actual and expected mortgage loan prepayment rates, discount
rates, servicing costs, and other economic factors. A fair value analysis is
also obtained from an independent third party agent. MSRs do not trade in an
active, open market with readily observable prices and though sales of MSRs do
occur, precise terms and conditions typically are not readily available and the
characteristics of our servicing portfolio may differ from those of any
servicing portfolios that do trade.
Goodwill
is reviewed for impairment at least annually, or on an interim basis if an event
occurs or circumstances change that would more likely than not reduce the
carrying amount. Goodwill is allocated into two reporting units. Fair value for
each reporting unit is estimated using stock price multiples or revenue
multiples. We do not believe there is a reasonable possibility that either of
our reporting units are at risk of failing a future Step 1 impairment
test.
Other
real estate is based on the fair value of the underlying collateral less
expected selling costs. Collateral values are estimated primarily using
appraisals and reflect a market value approach.
For
assets measured at fair value on a nonrecurring basis the following represents
impairment charges (recoveries) recognized on these assets during the year ended
December 31, 2009 and 2008, respectively: impaired loans - $16.06 million and
$2.54 million; venture capital partnership investments - $(0.45) million and
$0.13 million; mortgage servicing rights - $(2.07) million and $1.91 million;
goodwill - $0.00 million and $0.00 million; repossessions - $0.30 million and
$0.22 million, and other real estate - $0.16 million and $0.07
million.
For
assets measured at fair value on a nonrecurring basis at December 31, 2009 and
2008, the following table provides the level of valuation assumptions used to
determine each valuation and the carrying value of the related
assets.
|
(Dollars
in thousands)
|
Level
1
|
Level
2
|
Level
3
|
Total
|
||||||||||||
| December 31, 2009 | ||||||||||||||||
|
Loans
|
$ | - | $ | - | $ | 80,537 | $ | 80,537 | ||||||||
|
Accrued
income and other assets (venture capital partnership
investments)
|
- | - | 2,662 | 2,662 | ||||||||||||
|
Accrued
income and other assets (mortgage servicing rights)
|
- | - | 8,748 | 8,748 | ||||||||||||
|
Goodwill
and intangible assets (goodwill)
|
- | 83,329 | - | 83,329 | ||||||||||||
|
Accrued
income and other assets (repossessions)
|
- | - | 10,165 | 10,165 | ||||||||||||
|
Accrued
income and other assets (other real estate)
|
- | - | 6,529 | 6,529 | ||||||||||||
|
Total
|
$ | - | $ | 83,329 | $ | 108,641 | $ | 191,970 | ||||||||
| December 31, 2008 | ||||||||||||||||
|
Loans
|
$ | - | $ | - | $ | 30,941 | $ | 30,941 | ||||||||
|
Accrued
income and other assets (venture capital partnership
investments)
|
- | - | 2,253 | 2,253 | ||||||||||||
|
Accrued
income and other assets (mortgage servicing rights)
|
- | - | 4,715 | 4,715 | ||||||||||||
|
Total
|
$ | - | $ | - | $ | 37,909 | $ | 37,909 | ||||||||
The fair
values of our financial instruments as of December 31, 2009 and 2008 are
summarized in the table below.
|
2009
|
2008
|
|||||||||||||||
|
Carrying
or
|
Carrying
or
|
|||||||||||||||
|
(Dollars
in thousands)
|
Contract
Value
|
Fair
Value
|
Contract
Value
|
Fair
Value
|
||||||||||||
|
Assets:
|
||||||||||||||||
|
Cash
and due from banks
|
$ | 72,872 | $ | 72,872 | $ | 119,771 | $ | 119,771 | ||||||||
|
Federal
funds sold and interest bearing deposits with other banks
|
141,166 | 141,166 | 6,951 | 6,951 | ||||||||||||
|
Investment
securities, available-for-sale
|
901,638 | 901,638 | 724,754 | 724,754 | ||||||||||||
|
Other
investments and trading account securities
|
21,137 | 21,137 | 18,712 | 18,712 | ||||||||||||
|
Mortgages
held for sale
|
26,649 | 26,649 | 46,686 | 46,686 | ||||||||||||
|
Loans
and leases, net of reserve for loan and lease losses
|
3,004,914 | 3,042,251 | 3,218,436 | 3,239,567 | ||||||||||||
|
Cash
surrender value of life insurance policies
|
51,342 | 51,342 | 38,837 | 38,837 | ||||||||||||
|
Mortgage
servicing rights
|
8,748 | 10,180 | 4,635 | 4,715 | ||||||||||||
|
Interest
rate swaps
|
13,516 | 13,516 | 22,663 | 22,663 | ||||||||||||
|
Liabilities:
|
||||||||||||||||
|
Deposits
|
$ | 3,652,464 | $ | 3,692,203 | $ | 3,514,542 | $ | 3,486,609 | ||||||||
|
Short-term
borrowings
|
150,110 | 150,110 | 296,175 | 296,175 | ||||||||||||
|
Long-term
debt and mandatorily redeemable securities
|
19,761 | 19,831 | 29,832 | 29,674 | ||||||||||||
|
Subordinated
notes
|
89,692 | 81,118 | 89,692 | 73,972 | ||||||||||||
|
Interest
rate swaps
|
13,988 | 13,988 | 23,003 | 23,003 | ||||||||||||
|
Off-balance-sheet
instruments *
|
- | 150 | - | 297 | ||||||||||||
|
*
Represents estimated cash outflows required to currently settle the
obligations at current market rates.
|
||||||||||||||||
GAAP
requires disclosure of the fair value of financial assets and financial
liabilities, including those financial assets and financial liabilities that are
not measured and reported at fair value on a recurring or non-recurring basis.
The methodologies for estimating fair value of financial assets and financial
liabilities that are measured at fair value on a recurring or non-recurring
basis are discussed above. The estimated fair value approximates carrying value
for cash and cash equivalents and cash surrender value of life insurance
policies. The methodologies for other financial assets and financial liabilities
are discussed below:
Loans and
Leases — For variable rate loans and leases that reprice frequently and
with no significant change in credit risk, fair values are based on carrying
values. The fair values of loans and leases are estimated using discounted cash
flow analyses which use interest rates currently being offered for loans and
leases with similar terms to borrowers of similar credit quality (except as
noted in the following sentence). The fair values for certain real estate loans
(e.g., one-to-four family residential mortgage loans) are based on quoted market
prices of similar loans sold in conjunction with securitization transactions,
adjusted for differences in loan characteristics.
Deposits
— The fair values for all deposits other than time deposits are equal to the
amounts payable on demand (the carrying value). Fair values of variable rate
time deposits are equal to their carrying values. Fair values for fixed rate
time deposits are estimated using discounted cash flow analyses using interest
rates currently being offered for deposits with similar remaining
maturities.
Short-Term
Borrowings — The carrying values of Federal funds purchased, securities
sold under repurchase agreements, and other short-term borrowings, including our
liability related to mortgage loans available for repurchase under GNMA optional
repurchase programs, approximate their fair values.
Long-Term
Debt and Mandatorily Redeemable Securities — The fair values of long-term
debt are estimated using discounted cash flow analyses, based on our current
estimated incremental borrowing rates for similar types of borrowing
arrangements. The carrying values of mandatorily redeemable securities are based
on approximate fair values.
Subordinated
Notes — Fair values are based on quoted market prices, where available.
If quoted market prices are not available, fair values are estimated based on
calculated market prices of comparable securities.
Off-Balance-Sheet
Instruments — Contract and fair values for certain of our
off-balance-sheet financial instruments (guarantees) are estimated based on fees
currently charged to enter into similar agreements, taking into account the
remaining terms of the agreements and the counterparties’ credit
standing.
Limitations
— Fair value estimates are made at a specific point in time based on relevant
market information and information about the financial instruments. Because no
market exists for a significant portion of our financial instruments, fair value
estimates are based on judgments regarding future expected loss experience,
current economic conditions, risk characteristics of various financial
instruments, and other such factors.
These
estimates do not reflect any premium or discount that could result from offering
for sale at one time our entire holdings of a particular financial instrument.
These estimates are subjective in nature and require considerable judgment to
interpret market data. Accordingly, the estimates presented herein are not
necessarily indicative of the amounts we could realize in a current market
exchange, nor are they intended to represent the fair value of 1st Source as a
whole. The use of different market assumptions and/or estimation methodologies
may have a material effect on the estimated fair value amounts. The fair value
estimates presented herein are based on pertinent information available to
management as of the respective balance sheet date. Although management is not
aware of any factors that would significantly affect the estimated fair value
amounts, such amounts have not been comprehensively revalued since the
presentation dates, and therefore, estimates of fair value after the balance
sheet date may differ significantly from the amounts presented
herein.
Other
significant assets, such as premises and equipment, other assets, and
liabilities not defined as financial instruments, are not included in the above
disclosures. Also, the fair value estimates for deposits do not include the
benefit that results from the low-cost funding provided by the deposit
liabilities compared to the cost of borrowing funds in the market.
Note
22 — 1st Source Corporation (Parent Company Only) Financial
Information
|
STATEMENTS
OF FINANCIAL CONDITION
|
||||||||
|
December
31 (Dollars in
thousands)
|
2009
|
2008
|
||||||
|
ASSETS
|
||||||||
|
Cash
|
$ | 1 | $ | 2 | ||||
|
Short-term
investments with bank subsidiary
|
45,695 | 15,368 | ||||||
|
Investment
securities, available-for-sale
|
||||||||
|
(amortized
cost of $6,175 and $4,742 at December 31, 2009 and 2008,
respectively)
|
7,581 | 6,811 | ||||||
|
Trading
account securities
|
125 | 100 | ||||||
|
Investments
in:
|
||||||||
|
Bank
subsidiaries
|
621,265 | 534,586 | ||||||
|
Non-bank
subsidiaries
|
2,396 | 3,091 | ||||||
|
Premises
and equipment, net
|
2,240 | 2,264 | ||||||
|
Other
assets
|
7,124 | 6,803 | ||||||
|
Total
assets
|
$ | 686,427 | $ | 569,025 | ||||
|
LIABILITIES AND SHAREHOLDERS’
EQUITY
|
||||||||
|
Commercial
paper borrowings
|
$ | 5,113 | $ | 5,344 | ||||
|
Other
liabilities
|
2,518 | 1,739 | ||||||
|
Long-term
debt and mandatorily redeemable securities
|
108,476 | 108,278 | ||||||
|
Total
liabilities
|
116,107 | 115,361 | ||||||
|
Shareholders’
equity
|
570,320 | 453,664 | ||||||
|
Total
liabilities and shareholders’ equity
|
$ | 686,427 | $ | 569,025 | ||||
|
STATEMENTS
OF INCOME
|
||||||||||||
|
Year
Ended December 31 (Dollars in
thousands)
|
2009
|
2008
|
2007
|
|||||||||
|
Income:
|
||||||||||||
|
Dividends
from bank and non-bank subsidiaries
|
$ | 23,104 | $ | 17,468 | $ | 58,051 | ||||||
|
Rental
income from subsidiaries
|
2,391 | 2,412 | 2,442 | |||||||||
|
Other
|
507 | 994 | 2,077 | |||||||||
|
Investment
securities and other investment (losses) gains
|
(426 | ) | (1,053 | ) | 3 | |||||||
|
Total
income
|
25,576 | 19,821 | 62,573 | |||||||||
|
Expenses:
|
||||||||||||
|
Interest
on long-term debt and mandatorily redeemable securities
|
7,477 | 7,773 | 7,294 | |||||||||
|
Interest
on commercial paper and other short-term borrowings
|
16 | 209 | 639 | |||||||||
|
Rent
expense
|
1,090 | 1,060 | 1,057 | |||||||||
|
Other
|
1,339 | 1,850 | 1,572 | |||||||||
|
Total
expenses
|
9,922 | 10,892 | 10,562 | |||||||||
|
Income
before income tax benefit and equity in undistributed (distributed in
excess of) income of subsidiaries
|
15,654 | 8,929 | 52,011 | |||||||||
|
Income
tax benefit
|
2,899 | 3,308 | 2,380 | |||||||||
|
Income
before equity in undistributed (distributed in excess of) income of
subsidiaries
|
18,553 | 12,237 | 54,391 | |||||||||
|
Equity
in undistributed (distributed in excess of) income of
subsidiaries:
|
||||||||||||
|
Bank
subsidiaries
|
6,996 | 21,235 | (23,028 | ) | ||||||||
|
Non-bank
subsidiaries
|
(59 | ) | (86 | ) | (824 | ) | ||||||
|
Net
income
|
$ | 25,490 | $ | 33,386 | $ | 30,539 | ||||||
|
STATEMENTS
OF CASH FLOW
|
||||||||||||
|
Year
Ended December 31 (Dollars in
thousands)
|
2009
|
2008
|
2007
|
|||||||||
|
Operating
activities:
|
||||||||||||
|
Net
income
|
$ | 25,490 | $ | 33,386 | $ | 30,539 | ||||||
|
Adjustments
to reconcile net income to net cash provided by operating
activities:
|
||||||||||||
|
Equity
(undistributed) distributed in excess of income of
subsidiaries
|
(6,937 | ) | (21,149 | ) | 23,852 | |||||||
|
Depreciation
of premises and equipment
|
428 | 377 | 316 | |||||||||
|
Realized
and unrealized investment securities losses (gains)
|
426 | 1,053 | (3 | ) | ||||||||
|
Change
in trading account securities
|
(25 | ) | (100 | ) | - | |||||||
|
Other
|
919 | 2,732 | (629 | ) | ||||||||
|
Net
change in operating activities
|
20,301 | 16,299 | 54,075 | |||||||||
|
Investing
activities:
|
||||||||||||
|
Proceeds
from sales and maturities of investment securities
|
46,294 | 2,879 | 18,752 | |||||||||
|
Purchases
of investment securities
|
(48,513 | ) | - | (10,499 | ) | |||||||
|
Net
change in premises and equipment
|
(404 | ) | (405 | ) | (410 | ) | ||||||
|
Change
in short-term investments with bank subsidiary
|
(30,327 | ) | (4,148 | ) | 3,222 | |||||||
|
Change
in loans made to subsidiaries, net
|
- | - | 3,030 | |||||||||
|
Capital
contributions to subsidiaries
|
(80,000 | ) | - | - | ||||||||
|
Return
of capital from subsidiaries
|
636 | 5,950 | 5,106 | |||||||||
|
Cash
paid for acquisition, net
|
- | - | (78,348 | ) | ||||||||
|
Net
change in investing activities
|
(112,314 | ) | 4,276 | (59,147 | ) | |||||||
|
Financing
activities:
|
||||||||||||
|
Net
change in commercial paper
|
(231 | ) | (6,131 | ) | 3 | |||||||
|
Proceeds
from issuance of subordinated notes
|
- | - | 58,764 | |||||||||
|
Payments
on subordinated notes
|
- | (10,310 | ) | (17,784 | ) | |||||||
|
Proceeds
from issuance of long-term debt
|
153 | 10,000 | - | |||||||||
|
Payments
on long-term debt
|
(252 | ) | (252 | ) | (10,259 | ) | ||||||
|
Net
proceeds from issuance of treasury stock
|
1,663 | 341 | 545 | |||||||||
|
Proceeds
from issuance of preferred stock and common stock warrants
|
111,000 | - | - | |||||||||
|
Acquisition
of treasury stock
|
(1,299 | ) | - | (12,821 | ) | |||||||
|
Cash
dividends paid on preferred stock
|
(4,502 | ) | ||||||||||
|
Cash
dividends paid on common stock
|
(14,520 | ) | (14,253 | ) | (13,345 | ) | ||||||
|
Net
change in financing activities
|
92,012 | (20,605 | ) | 5,103 | ||||||||
|
Net
change in cash and cash equivalents
|
(1 | ) | (30 | ) | 31 | |||||||
|
Cash
and cash equivalents, beginning of year
|
2 | 32 | 1 | |||||||||
|
Cash
and cash equivalents, end of year
|
$ | 1 | $ | 2 | $ | 32 | ||||||
Note
23 — Subsequent Events
We have
evaluated subsequent events through the date our financial statements were
issued, or February 19, 2010. We do not believe any subsequent events have
occurred that would require further disclosure or adjustment to our financial
statements.
Item 9. Changes in and Disagreements with
Accountants on Accounting and Financial Disclosure.
None
Item 9A. Controls and Procedures.
1st
Source carried out an evaluation, under the supervision and with the
participation of our management, including the Chief Executive Officer and Chief
Financial Officer, of the effectiveness of the design and operation of our
disclosure controls and procedures (as defined in Rule 13a-15(e) under the
Securities Exchange Act of 1934) pursuant to Exchange Act Rule 13a-14. Based
upon that evaluation, the Chief Executive Officer and Chief Financial Officer
concluded that, at December 31, 2009, our disclosure controls and procedures
were effective in ensuring that information required to be disclosed by 1st
Source in reports that it files or submits under the Exchange Act is recorded,
processed, summarized and reported within the time periods specified in the
Securities and Exchange Commission’s rules and forms and are designed to ensure
that information required to be disclosed in those reports is accumulated and
communicated to management as appropriate to allow timely decisions regarding
required disclosure.
In
addition, there were no changes in our internal control over financial reporting
(as defined in Exchange Act Rule 13a-15(f)) during the fourth fiscal quarter of
2009 that have materially affected, or are reasonably likely to materially
affect, our internal controls over financial reporting.
MANAGEMENT
REPORT ON INTERNAL CONTROL OVER FINANCIAL REPORTING
Management
of 1st Source Corporation ("1st Source") is responsible for establishing and
maintaining adequate internal control over financial reporting. 1st Source’s
internal control over financial reporting includes policies and procedures
pertaining to 1st Source’s ability to record, process, and report reliable
information. Actions are taken to correct any deficiencies as they are
identified through internal and external audits, regular examinations by bank
regulatory agencies, 1st Source’s formal risk management process, and other
means. 1st Source’s internal control system is designed to provide reasonable
assurance to 1st Source’s management and Board of Directors regarding the
preparation and fair presentation of 1st Source’s published financial
statements.
All
internal control systems, no matter how well designed, have inherent
limitations. Therefore, even those systems determined to be effective can
provide only reasonable assurance with respect to financial statement
preparation and presentation. Further, because of changes in conditions, the
effectiveness of internal control may vary over time.
1st
Source’s management assessed the effectiveness of internal control over
financial reporting as of December 31, 2009. In making this assessment,
management used the criteria set forth by the Committee of Sponsoring
Organizations of the Treadway Commission (COSO) in Internal Control – Integrated
Framework. Based on management’s assessment, we believe that, as of
December 31, 2009, 1st Source’s internal control over financial reporting is
effective based on those criteria.
Ernst
& Young LLP, independent registered public accounting firm, has issued an
attestation report on management’s assessment of 1st Source’s internal control
over financial reporting. This report appears on page
27.
By /s/ CHRISTOPHER J. MURPHY
III
Christopher J. Murphy III, Chief
Executive Officer
By /s/ LARRY E.
LENTYCH
Larry E. Lentych, Treasurer and Chief
Financial Officer
South
Bend, Indiana
Item 9B. Other Information.
None
Part
III
Item 10. Directors, Executive Officers and
Corporate Governance.
The
information under the caption "Proposal Number 1: Election of Directors," "Board
Committees and Other Corporate Governance Matters," and "Section 16(a)
Beneficial Ownership Reporting Compliance" of the 2010 Proxy Statement is
incorporated herein by reference.
Item 11. Executive Compensation.
The
information under the caption "Compensation Discussion and Analysis" of the 2010
Proxy Statement is incorporated herein by reference.
Item 12. Security Ownership of Certain Beneficial
Owners and Management and Related Stockholder Matters.
The
information under the caption "Voting Securities and Principal Holders Thereof"
and "Proposal Number 1: Election of Directors" of the 2010 Proxy Statement is
incorporated herein by reference.
Equity
Compensation Plan Information:
|
Number
of Securities
|
|||||||||||||
|
Remaining
Available
|
|||||||||||||
|
for
Future Issuance
|
|||||||||||||
|
Number
of Securities to be
|
Weighted-average
|
Under
Equity
|
|||||||||||
|
Issued
upon Exercise of
|
Exercise
Price of
|
Compensation
Plans
|
|||||||||||
|
Outstanding
Options,
|
Outstanding
Options,
|
[excluding
securities
|
|||||||||||
|
Warrants
and Rights
|
Warrants
and Rights
|
reflected
in column (a)]
|
|||||||||||
|
Equity
compensation plans
|
|||||||||||||
|
approved
by shareholders
|
|||||||||||||
|
1992
stock option plan
|
7,508 | $17.31 | - | ||||||||||
|
2001
stock option plan
|
64,255 | 18.29 | 2,119,922 | ||||||||||
|
1997
employee stock purchase plan
|
27,639 | 19.34 | 150,160 | ||||||||||
|
1982
executive incentive plan
|
- | - | 96,230 | (1 | )(2) | ||||||||
|
1982
restricted stock award plan
|
- | - | 131,965 | (1 | ) | ||||||||
|
Total
plans approved by shareholders
|
99,402 | $18.51 | 2,498,277 | ||||||||||
|
Equity
compensation plans
|
|||||||||||||
|
not
approved by shareholders
|
- | - | - | ||||||||||
|
Total
equity compensation plans
|
99,402 | $18.51 | 2,498,277 | ||||||||||
|
(1)Amount is to be awarded by grants
administered by the Executive Compensation Committee of the 1st Source
Board of Directors.
|
|||||||||||||
|
(2)Amount includes market value
stock only. Book value shares used for annual awards may only be sold to
1st Source
|
|||||||||||||
Item 13. Certain Relationships and Related
Transactions, and Director Independence.
The
information under the caption "Proposal Number 1: Election of Directors" of the
2010 Proxy Statement is incorporated herein by reference.
Item 14. Principal Accounting Fees and
Services.
The
information under the caption "Relationship with Independent Registered Public
Accounting Firm" of the 2010 Proxy Statement is incorporated herein by
reference.
Part
IV
Item 15. Exhibits and Financial Statement
Schedules.
(a)
Financial Statements and Schedules:
The
following Financial Statements and Supplementary Data are filed as part of this
annual report:
Reports
of Independent Registered Public Accounting Firm
Consolidated
statements of financial condition — December 31, 2009 and 2008
Consolidated
statements of income — Years ended December 31, 2009, 2008, and
2007
Consolidated
statements of shareholders’ equity — Years ended December 31, 2009, 2008, and
2007
Consolidated
statements of cash flows — Years ended December 31, 2009, 2008, and
2007
Notes to
consolidated financial statements — December 31, 2009, 2008, and
2007
Financial
statement schedules required by Article 9 of Regulation S-X are not required
under the related instructions, or are inapplicable and, therefore, have been
omitted.
(b)
Exhibits (numbered in accordance with Item 601 of Regulation S-K):
|
3(a)
|
Articles
of Incorporation of Registrant, as amended April 30, 1996, and filed as
exhibit to Form 10-K, dated December 31, 1996, and incorporated herein by
reference.
|
|
|
3(b)
|
By-Laws
of Registrant, as amended July 30, 2009, filed as exhibit to Form 8-K,
dated July 30, 2009, and incorporated herein by reference.
|
|
|
3(c)
|
Certificate
of Designations for Series A Preferred Stock, dated January 23, 2009,
filed as exhibit to Form 8-K, dated January 23, 2009, and incorporated
herein by reference.
|
|
|
4(a)
|
Form
of Common Stock Certificates of Registrant filed as exhibit to
Registration Statement 2-40481 and incorporated herein by
reference.
|
|
|
4(b)
|
1st
Source agrees to furnish to the Commission, upon request, a copy of each
instrument defining the rights of holders of Senior and Subordinated debt
of 1st Source.
|
|
|
4(c)
|
Form
of Certificate for Series A Preferred Stock, dated January 23, 2009, filed
as exhibit to Form 8-K, dated January 23, 2009, and incorporated herein by
reference.
|
|
|
4(d)
|
Warrant
for Purchase of Shares of Common Stock, dated January 23, 2009, filed as
exhibit to Form 8-K, dated January 23, 2009, and incorporated herein by
reference.
|
|
|
10(a)(1)
|
Employment
Agreement of Christopher J. Murphy III, dated January 1, 2008, filed as
exhibit to Form 8-K, dated March 17, 2008, and incorporated herein by
reference.
|
|
|
10(a)(2)
|
Employment
Agreement of Wellington D. Jones III, dated January 1, 2008, filed as
exhibit to Form 8-K, dated March 17, 2008, and incorporated herein by
reference.
|
|
|
10(a)(4)
|
Employment
Agreement of Larry E. Lentych, dated January 1, 2008, filed as exhibit to
Form 8-K, dated March 17, 2008, and incorporated herein by
reference.
|
|
|
10(a)(6)
|
Employment
Agreement of John B. Griffith, dated January 1, 2008, filed as exhibit to
Form 8-K, dated March 17, 2008, and incorporated herein by
reference.
|
|
|
10(b)
|
1st
Source Corporation Employee Stock Purchase Plan dated April 17, 1997,
filed as exhibit to Form 10-K, dated December 31, 1997, and incorporated
herein by reference.
|
|
|
10(c)
|
1st
Source Corporation 1982 Executive Incentive Plan, amended January 17,
2003, and filed as exhibit to Form 10-K, dated December 31, 2003, and
incorporated herein by reference.
|
|
|
10(d)
|
1st
Source Corporation 1982 Restricted Stock Award Plan, amended January
17, 2003, and filed as exhibit to Form 10-K, dated December 31, 2003, and
incorporated herein by reference.
|
|
|
10(e)
|
1st
Source Corporation 2001 Stock Option Plan, amended July 27, 2006, and
filed as an exhibit to 1st Source Corporation Proxy Statement dated March
7, 2001, and incorporated herein by reference.
|
|
|
10(g)(1)
|
1st
Source Corporation 1992 Stock Option Plan, amended July 27, 2006, and
dated April 23, 1992, as amended December 11, 1997, filed as exhibit to
Form 10-K, dated December 31, 1997, and incorporated herein by
reference.
|
|
|
10(g)(2)
|
An
amendment to 1st Source Corporation 1992 Stock Option Plan, dated July 18,
2000, and filed as exhibit to Form 10-K, dated December 31, 2000, and
incorporated herein by reference.
|
|
|
10(h)
|
1st
Source Corporation 1998 Performance Compensation Plan, dated February 19,
1998, filed as exhibit to Form 10-K, dated December 31, 1998, and
incorporated herein by reference.
|
|
|
10(j)
|
Contract
with Fiserv Solutions, Inc. dated November 23, 2005, filed as exhibit to
Form 10-K, dated, December 31, 2005, and incorporated herein by
reference.
|
|
|
10(k)
|
Letter
Agreement dated January 23, 2009 by and between 1st Source Corporation and
the United States Department of the Treasury, including the
Securites Purchase Agreement – Standard Terms, filed as exhibit to Form
8-K, dated January 23, 2009, and incorporated herein by
reference.
|
|
|
10(l)
|
Form
of CPP Compensation Limitation Agreement, dated January 23, 2009, filed as
exhibit to Form 8-K, dated January 23, 2009, and incorporated herein by
reference.
|
|
|
21
|
Subsidiaries
of Registrant (unless otherwise indicated, each subsidiary does business
under its own name):
|
|
|
Name
|
Jurisdiction
|
|
|
1st
Source Bank
|
Indiana
|
|
|
SFG
Aircraft, Inc. * (formerly
known as SFG Equipment Leasing, Inc.)
|
Indiana
|
|
|
1st
Source Insurance, Inc. *
|
Indiana
|
|
|
1st
Source Specialty Finance, Inc. *
|
Indiana
|
|
|
FBT
Capital Corporation (Inactive)
|
Indiana
|
|
|
1st
Source Leasing, Inc.
|
Indiana
|
|
|
1st
Source Capital Corporation *
|
Indiana
|
|
|
Trustcorp
Mortgage Company (Inactive)
|
Indiana
|
|
|
1st
Source Capital Trust IV
|
Delaware
|
|
|
1st
Source Master Trust
|
Delaware
|
|
|
Michigan
Transportation Finance Corporation *
|
Michigan
|
|
|
1st
Source Intermediate Holding, LLC
|
Delaware
|
|
|
1st
Source Funding, LLC
|
Delaware
|
|
|
1st
Source Corporation Investment Advisors, Inc. *
|
Indiana
|
|
|
SFG
Commercial Aircraft Leasing, Inc. *
|
Indiana
|
|
|
SFG
Equipment Leasing Corporation I*
|
Indiana
|
|
|
Washington
and Michigan Insurance, Inc.*
|
Arizona
|
|
|
*Wholly-owned
subsidiaries of 1st Source Bank
|
||
|
23
|
Consent
of Ernst & Young LLP, Independent Registered Public Accounting
Firm.
|
|
|
31.1
|
Certification
of Christopher J. Murphy III, Chief Executive Officer (Rule
13a-14(a)).
|
|
|
31.2
|
Certification
of Larry E. Lentych, Chief Financial Officer (Rule
13a-14(a)).
|
|
|
32.1
|
Certification
of Christopher J. Murphy III, Chief Executive Officer.
|
|
|
32.2
|
Certification
of Larry E. Lentych, Chief Financial Officer.
|
|
|
99.1
|
First
fiscal year certification of the Principal Executive Officer pursuant to
Section 111(b) of the Emergency Economic Stabilization Act of 2008 for the
fiscal year ended December 31, 2009.
|
|
|
99.2
|
First
fiscal year certification of the Principal Financial Officer pursuant to
Section 111(b) of the Emergency Economic Stabilization Act of 2008 for the
fiscal year ended December 31,
2009.
|
|
(c)
Financial Statement Schedules — None.
Pursuant
to the requirements of Section 13 or 15(d) of the Securities Exchange Act of
1934, the registrant has duly caused this report to be signed on its behalf by
the undersigned, thereunto duly authorized.
1st
SOURCE CORPORATION
By
/s/ CHRISTOPHER J.
MURPHY III
Christopher
J. Murphy III, Chairman of the Board,
President
and Chief Executive Officer
Date:
February 19, 2010
Pursuant
to the requirements of the Securities Exchange Act of 1934, this report has been
signed below by the following persons on behalf of the registrant and in the
capacities and on the dates indicated.
|
Signature
|
Title
|
Date
|
|
/s/
CHRISTOPHER J. MURPHY III
|
Chairman
of the Board, President and Chief Executive Officer
|
February
19, 2010
|
|
Christopher
J. Murphy III
|
|
|
|
/s/
WELLINGTON D. JONES III
|
Executive
Vice President and Director
|
February
19, 2010
|
|
Wellington
D. Jones III
|
|
|
|
/s/
LARRY E. LENTYCH
|
Treasurer,
Chief Financial Officer and Principle Accounting Officer
|
February
19, 2010
|
|
Larry
E. Lentych
|
|
|
|
/s/
JOHN B. GRIFFITH
|
Secretary
and General Counsel
|
February
19, 2010
|
|
John
B. Griffith
|
|
|
|
/s/
DANIEL B. FITZPATRICK
|
Director
|
February
19, 2010
|
|
Daniel
B. Fitzpatrick
|
||
|
/s/
TERRY L. GERBER
|
Director
|
February
19, 2010
|
|
Terry
L. Gerber
|
||
|
/s/
LAWRENCE E. HILER
|
Director
|
February
19, 2010
|
|
Lawrence
E. Hiler
|
||
|
/s/
WILLIAM P. JOHNSON
|
Director
|
February
19, 2010
|
|
William
P. Johnson
|
|
/s/
CRAIG A. KAPSON
|
Director
|
February
19, 2010
|
|
Craig
A. Kapson
|
|
/s/
REX MARTIN
|
Director
|
February
19, 2010
|
|
Rex
Martin
|
||
|
/s/
DANE A. MILLER
|
Director
|
February
19, 2010
|
|
Dane
A. Miller
|
||
|
/s/
TIMOTHY K. OZARK
|
Director
|
February
19, 2010
|
|
Timothy
K. Ozark
|
||
|
/s/
JOHN T. PHAIR
|
Director
|
February
19, 2010
|
|
John
T. Phair
|
||
|
/s/
MARK D. SCHWABERO
|
Director
|
February
19, 2010
|
|
Mark
D. Schwabero
|
||
- 59
-