Attached files
 2010
CAGNY Presentation Boca Raton, Florida February 18, 2010 Exhibit 99.2 |
 Statements in this presentation that are not reported financial results or other
historical information are “forward-looking statements” within the meaning of the Private Securities Litigation Reform Act of 1995. Such forward-looking
statements are based on current plans, estimates and expectations, and are
not guarantees of future performance. They are based on
management’s expectations that involve a number of business risks and
uncertainties, any of which could cause actual results to differ materially
from those expressed in or implied by the forward-looking statements.
The Company undertakes no obligation to publicly update or revise any
forward-looking statement other than in the normal course of its public
disclosure obligations. The risks and uncertainties relating to the
forward-looking statements in this presentation include those described
under the caption “Cautionary Factors that May Affect Future
Results” in the Company’s Annual Report and its Quarterly
Reports on Form 10-Q. Reconciliations of non-GAAP measures included in this presentation to the
most comparable GAAP measures are available on the Company’s website
at www.altria.com. Safe Harbor Statement |
 Mike Szymanczyk Chairman and Chief Executive Officer, Altria Dave Beran EVP and Chief Financial Officer, Altria Craig Johnson EVP, Altria Marty Barrington EVP, Chief Compliance &
Administrative Officer,
Altria Murray Garnick SVP of
Litigation, ALCS Altria’s Executive Management
|
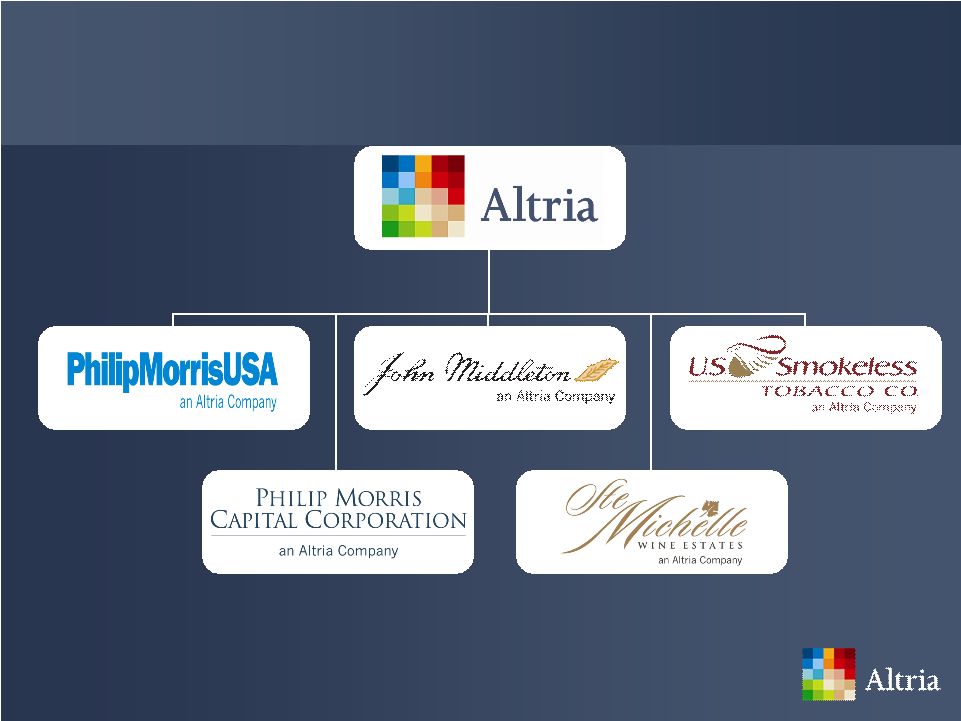 Altria’s Operating Companies Evolution |
 Our Mission is to own and develop financially disciplined businesses that are leaders in responsibly providing adult tobacco and wine consumers with superior branded products. Integrity, Trust and Respect Executing with Quality Sharing with Others Passion to Succeed Driving Creativity into Everything We Do Altria’s Mission and Values |
 Remain under economic pressure Impacting their mindset Nearly 75% have a different set of priorities Important implications for CPG companies Source: Yankelovich Monitor Perspective, Dollars & Consumer Sense 2009 Economy Impacting Adult Consumers |
 Shifting spending patterns Nearly 60% say they do not plan to spend the way they did in the past Companies need to create relevant and innovative brands Source: Yankelovich Monitor Perspective, Dollars & Consumer Sense 2009 Economy Impacting Adult Consumers |
 Significant federal excise tax (FET) increases on tobacco products in April 2009 – Cigarettes +158% – Smokeless tobacco products +158% – Machine-made large cigars +155% Federal Excise Tax Environment in 2009 Source: ALCS Government Affairs |
 Cigarette State Excise Tax Environment Source: ALCS Government Affairs, ALCS MICR; Note: Year-end average state excise tax
is volume weighted by state $1.12 $1.01 $0.88 $0.87 $0.78 $0.70 $0.66 $0.44 $0.43 $0.40 $1.26 $0.00 $1.50 1999 2000 2001 2002 2003 2004 2005 2006 2007 2008 2009 |
 MT UT AL ME OR WY TN WA KS NV NM MO MN IL LA GA WV SC MD VA 2009 Cigarette SET Legislation – Defeated Source: ALCS Government Affairs |
 UT NY AL MS WA KS CA NM MO MD TN IL GA 2010 Cigarette SET Environment Source: ALCS Government Affairs 2010 Cigarette Excise Tax Proposals |
 Smokeless Tobacco SETs Source: ALCS Government Affairs MT IA ND UT AZ NY AL ME RI NJ DE CT KY VT OR NE WY TX DC OR NE WY TX DC ME Converted to weight- based in 2009 |
 Smokeless Tobacco SETs Source: ALCS Government Affairs MT IA ND UT AZ NY AL ME RI NJ DE CT KY VT OR NE WY TX DC OR NE WY TX DC ME Ad Valorem MT IA ND UT AZ NY AL ME RI NJ DE CT KY VT OR NE WY TX DC MS TN WA KS NV CA ID NM OK AR MO MN IL MI LA IN PA NC GA WV SC FL OH NH MA MD WI CO SD AK VA Weight-based |
 FDA assumed regulatory oversight over tobacco products Did not agree with every element of this law Supported enactment Thoughtfully implemented federal regulation should benefit tobacco consumers in the long-term FDA Regulatory Authority |
 In
March, FDA is expected to issue regulations regarding sale, promotion and
advertising of cigarettes and smokeless tobacco products In June, cigarette manufacturers are required to remove descriptors, and smokeless tobacco manufacturers also must make warning notice label changes In August, Tobacco Products Scientific Advisory Committee is expected to issue a report on the impact of menthol on public health Significant FDA Regulatory Events in 2010 Source: FDA legislation (HR 1256) |
 Maximizing income while maintaining share momentum on Marlboro in cigarette category Quickly integrating USSTC into the Altria family of companies and returning Copenhagen and Skoal to growth Profitably assuming share leadership in the machine-made large cigar category driven by the growth of Black & Mild Growing income from Ste. Michelle Wine Estates Growth Strategies of Altria’s Operating Companies |
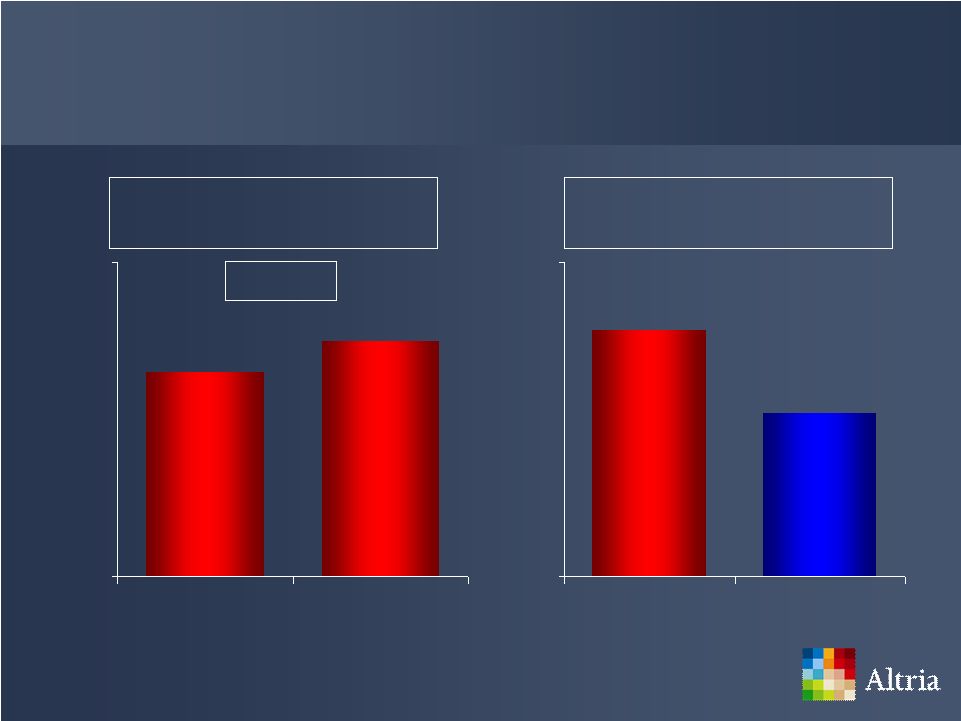
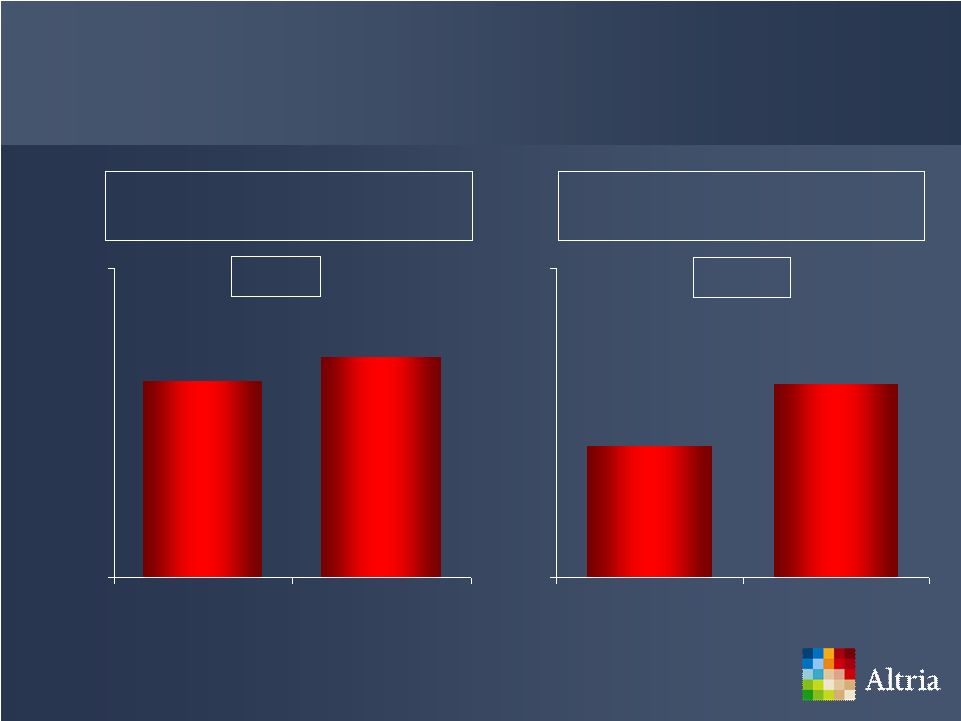
 +5.5% Adjusted OCI* ($ in Billions) Source: Altria company reports, IRI/Capstone Integrated Retail Panel * For reconciliation of non-GAAP to GAAP numbers visit www.altria.com 2009 Cigarettes Segment’s Performance -0.1pp Marlboro’s Retail Share 41.8% 41.9% 40% 43% 2008 2009 $5.3 $5.0 $4 $6 2008 2009 |
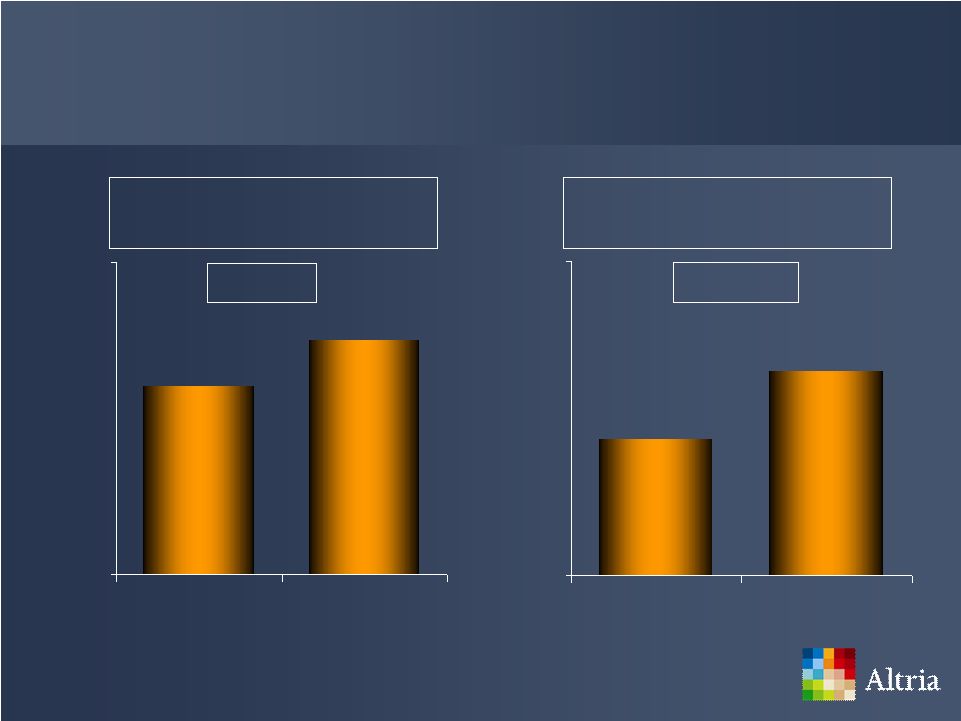
 Cigarette Manufacturers’ Income Performance PM USA’s Adjusted OCI* ($ in Billions) OCI* Profit Growth ($ in Millions) 2007 – 2009 * For reconciliation of non-GAAP to GAAP numbers visit www.altria.com Source: Altria company reports; Lorillard, Inc. and Reynolds American Inc. company reports and
ALCS estimates. Adjusted underlying OCI for RJRT is reported, RJRT adjusted
operating income plus reported RAI amortization expense. Adjusted underlying OCI for Lorillard is reported operating income, plus $66 million in reported one time legal expenses in 2007. $5.3 $4.9 $4 $6 2007 2009 $400 $267 RJRT Lorillard $0 $600 PM USA RJRT & LO |
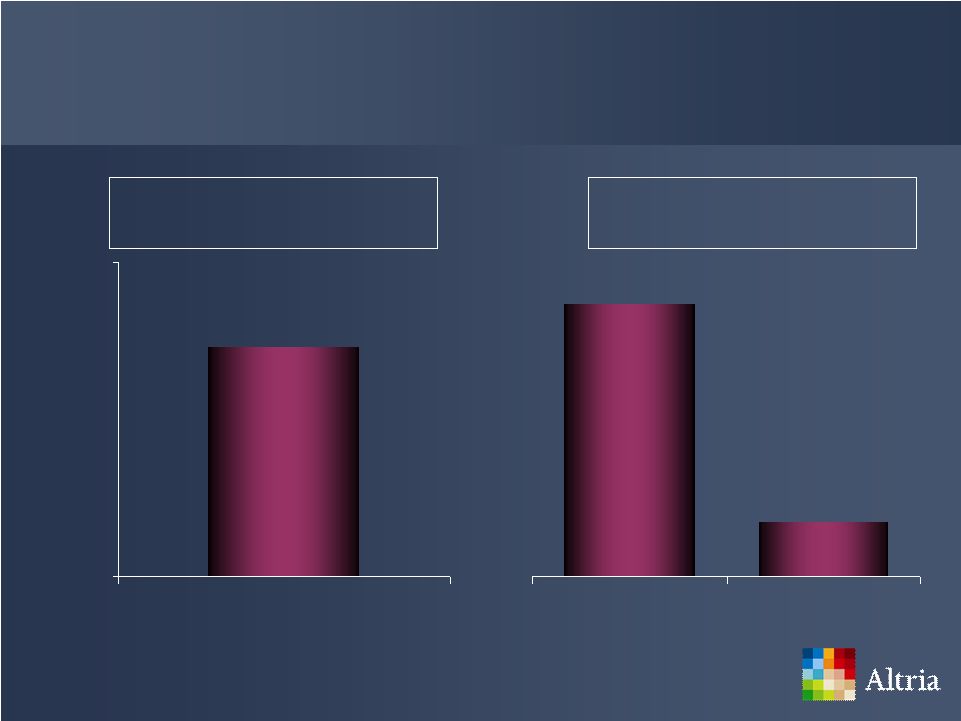
 Cigarette Manufacturers’ Metrics - 2007 to 2009 Adjusted OCI* Per Pack (Percent Change) Adjusted OCI* Margins (Percentage Point Change) * For reconciliation of non-GAAP to GAAP numbers visit www.altria.com 4.0pp 3.0pp 1.0pp 0 8 PM USA RJRT Lorillard 27% 23% 16% 5% 35% PM USA RJRT Lorillard Source: Altria company reports, Lorillard, Inc. and Reynolds American Inc. company reports, and ALCS
estimates. Adjusted underlying OCI for RJRT is reported, RJRT adjusted operating income
plus reported RAI amortization expense. Adjusted underlying OCI for Lorillard is reported operating income, plus $66 million in reported one time legal expenses in 2007. Adjusted OCI margins is adjusted
underlying OCI divided by reported net revenue excluding FET. Adjusted OCI per pack is
adjusted underlying OCI divided by reported domestic pack volume. |
 as
high as 2009 yearly average 38% Marlboro’s Price Gap Source: IRI/Capstone Inventory and Price Gap in C-Stores; Note: Marlboro excludes
Marlboro 72mm 51% 70% 0% 80% 2001 2002 2003 2004 2005 2006 2007 2008 2009 |
 |
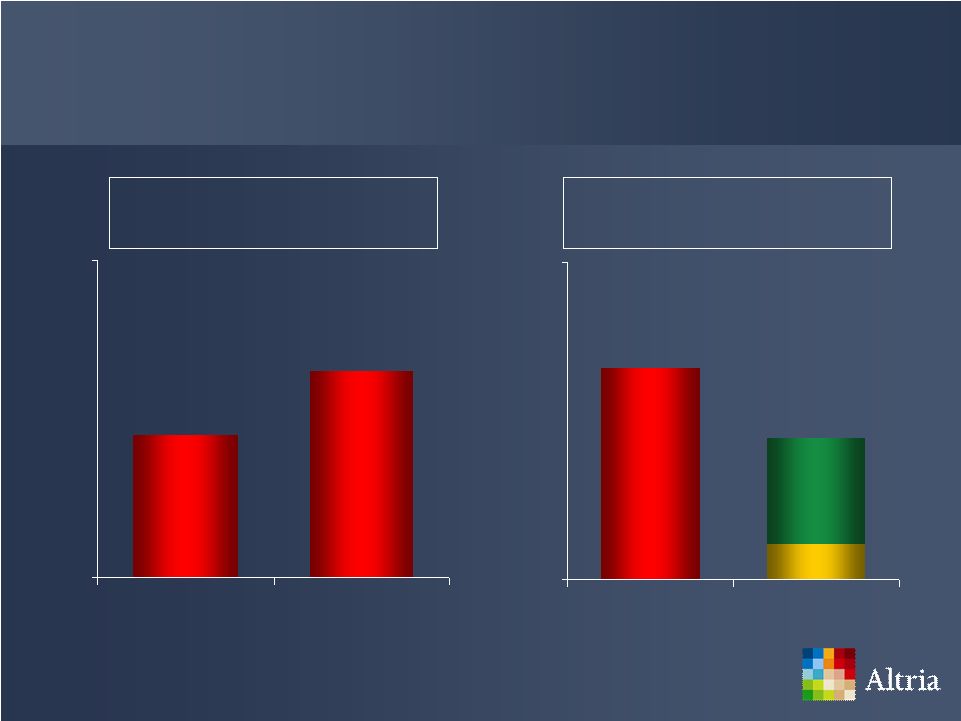
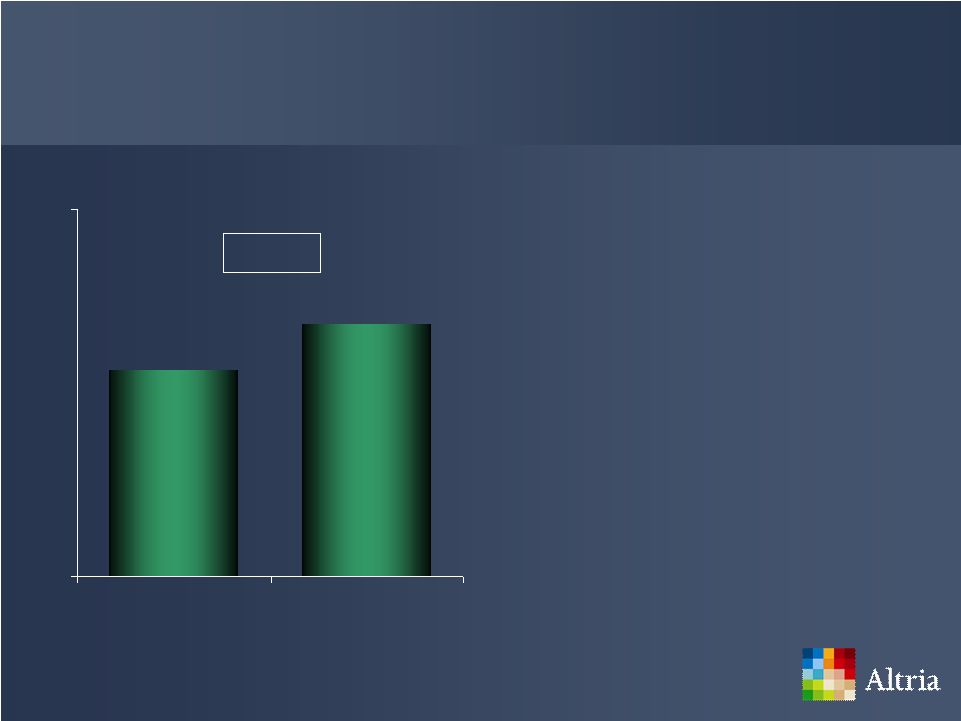
 Historic Retail Share Performance Retail Share 48.1% 46.8% 42% 50% Q3 09 Q4 09 47% 50% 53% 56% 60% 64% 68% 70% 40% 75% '01 '02 '03 '04 '05 '06 '07 '08 Copenhagen and Skoal’s Retail Share Performance Source: USSTC RAD/SVT ending December 2008; ALCS company reports, InfoScan Smokeless Tobacco Database
|
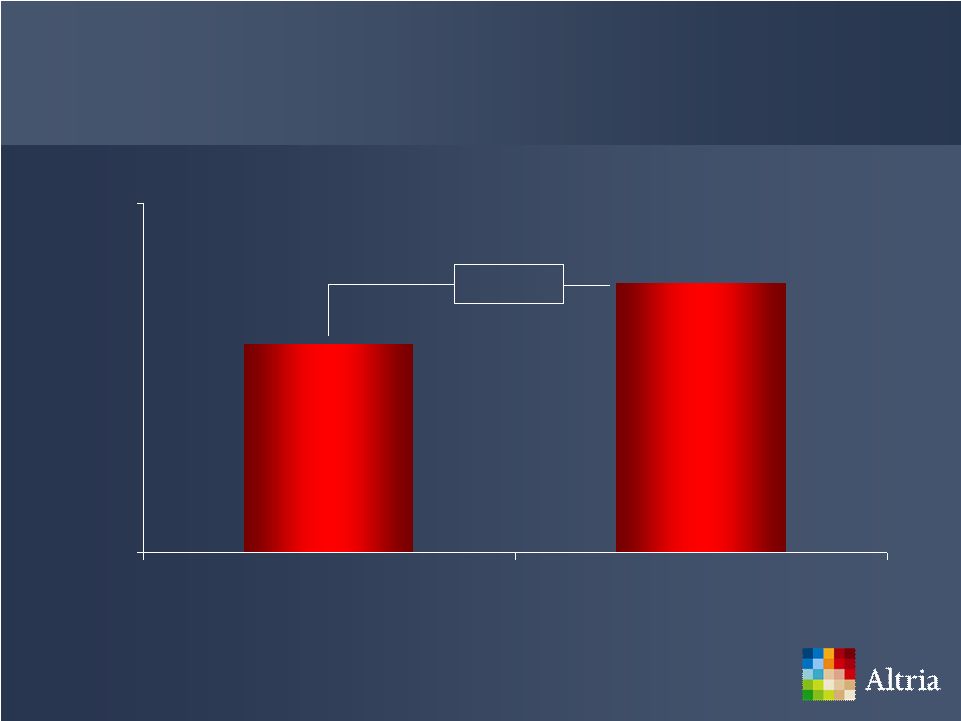
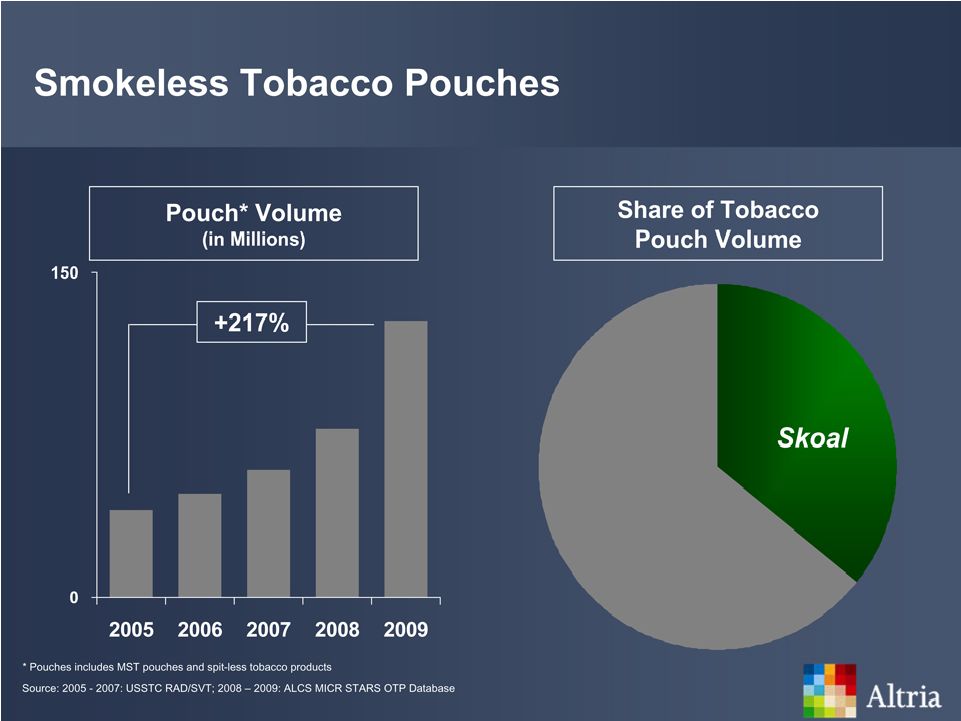
 +7.8% Volume (Cans in Millions) Source: ALCS company reports 144.6 134.1 125 155 Q4 08 Q4 09 Copenhagen and Skoal’s Volume Performance |
 2009
Cigars Segment’s Performance Source: ALCS company reports, InfoScan
Cigar Database for machine-made large cigars * For reconciliation of
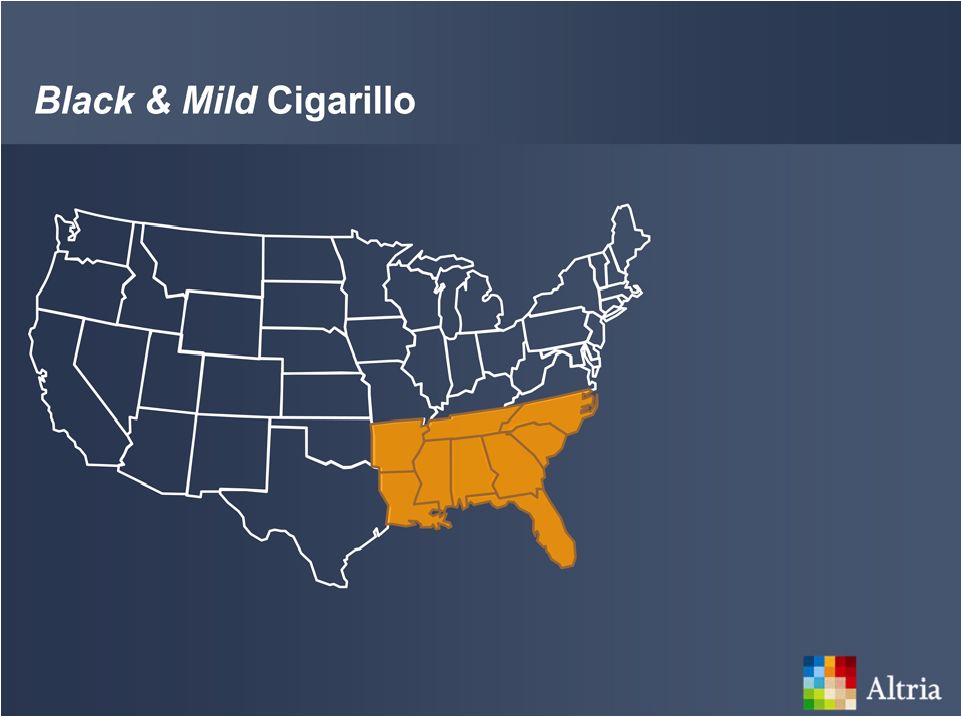
non-GAAP to GAAP numbers visit www.altria.com Black &
Mild’s Retail Share +1.3pp +1.6% Adjusted OCI* ($ in Millions) $185 $182 $170 $190 2008 2009 29.9% 28.6% 26% 32% 2008 2009 |
 Adjusted OCI* ($ in Millions) Source: Altria company reports; Nielsen Total Wine Database – U.S. Food & Drug 2009 Wine Segment’s Performance Retail Volume Change (2009 vs. 2008) * For reconciliation of non-GAAP to GAAP numbers visit www.altria.com 10% 2% Ste. Michelle Wine Industry $73 $0 $100 2009 |
 Source: Altria and UST company reports; pro forma calculation from UST reports with
comparable data Ste. Michelle Wine Estates’ Financial Performance * For reconciliation of non-GAAP to GAAP numbers visit www.altria.com Adjusted OCI* ($ in Millions) +17.9% CAGR $73 $38 $10 $110 2005 2009 |
 *
For reconciliation of non-GAAP to GAAP numbers visit www.altria.com; **assumes reinvestment of dividend Source: Altria company reports; Bloomberg Yearly Return ending December 2009 Altria’s 2009 Financial Performance Adjusted Earnings Per Share* +6.1% Total Shareholder Return** 25.9% 39.1% 0% 50% Altria S&P 500 $1.75 $1.65 $1 $2 2008 2009 |
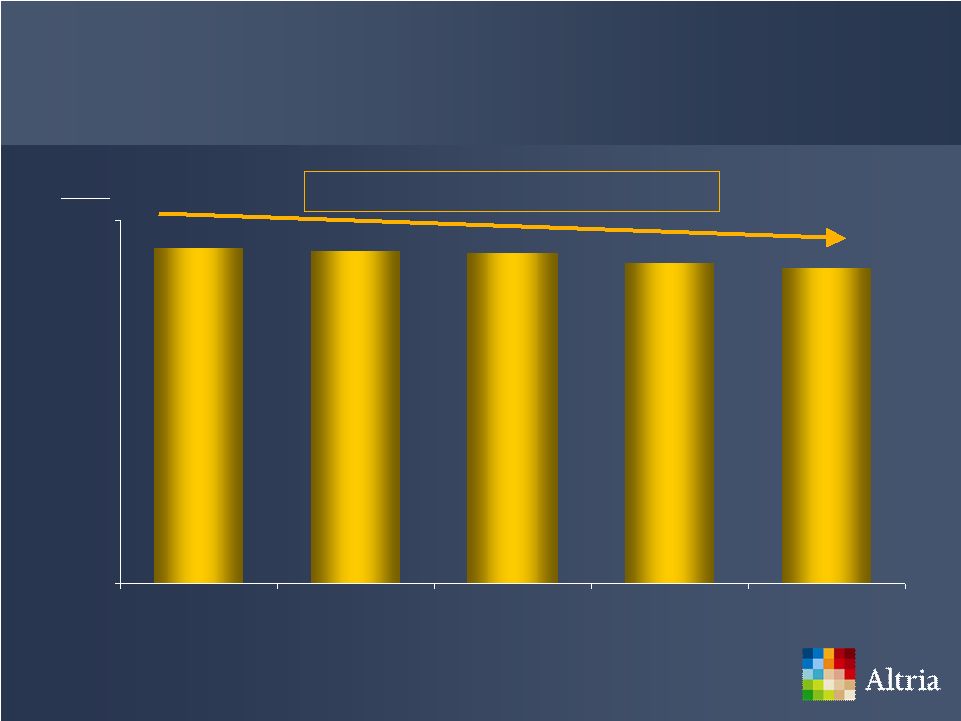 Pounds in Millions Source: ALCS MICR Industry estimates for cigarettes; TTB all other tobacco segments;
cigarettes, small cigars & RYO based on 0.0325 oz./stick [FY 2008] 5 year
CAGR (~1%) Historical Total Tobacco Volume 0 1,100 2004 2005 2006 2007 2008 |
 Source: IRI/Capstone Integrated Retail Panel Cigarette Retail Pack Price in Convenience Stores +22% $1.00 $6.00 2008 2009 |
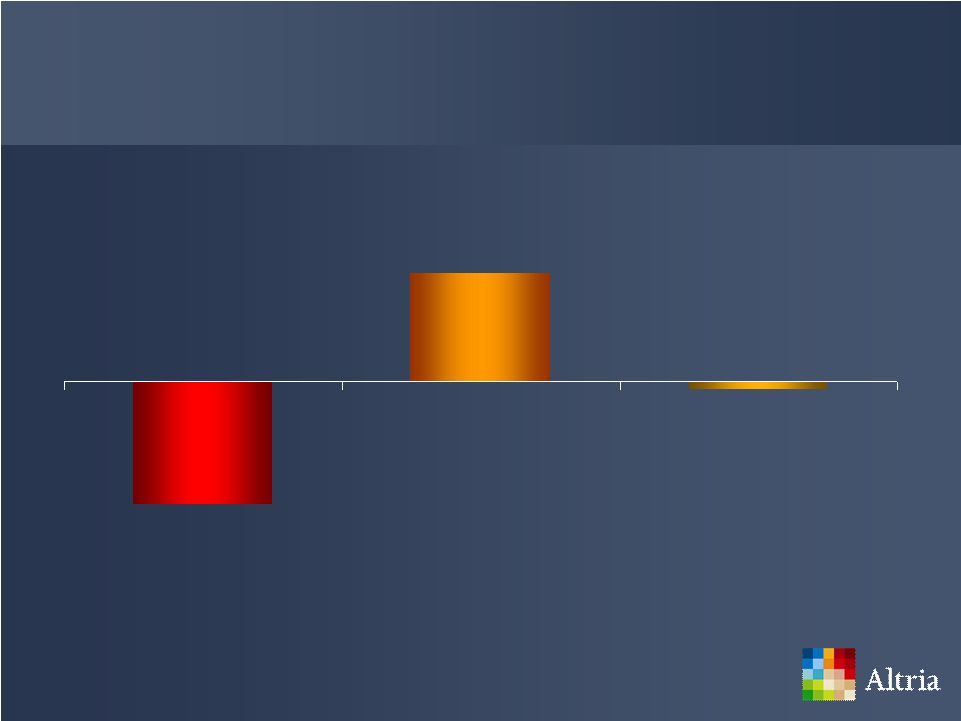 Tobacco Categories’ 2009 Volume Performance Source: ALCS MICR estimates; Note: Smokeless is defined as moist smokeless tobacco and
spit-less tobacco products ~7% (~0.5%) (~8%) Cigarettes Smokeless Machine-made Large Cigars |
 |
 Altria’s Share of Profit Pool +8.0pp * * Excludes USSTC Total Profit Pool ($ in Billions) +2.0% Tobacco Manufacturers’ Profit Pool Source: Company reports; ALCS BS&D estimates $11.4 $11.6 $9.5 $12.5 2008 2009 47% 55% 30% 70% 2008 2009 |
 Switch between tobacco categories and use different kinds of tobacco products Our tobacco companies believe that there are different groups of adult tobacco consumers Seeking different characteristics in their tobacco products Source: ALCS MICR Adult Tobacco Consumers |
 Adult
Tobacco Consumers Adult Smokers Adult Smokers Looking for Smokeless Tobacco Alternatives Adults Who Use Both Smokable Products and Traditional MST Products Traditional Adult Dippers |
 Increasing number of adult tobacco consumers are exploring alternatives to cigarettes and traditional MST products The business opportunity: – Filling the increasing demand for new smokeless products – Continuing to appeal to traditional adult smokers and dippers Altria’s tobacco operating companies are positioning their brands to meet evolving adult consumer preferences Source: ALCS MICR Satisfying Adult Tobacco Consumers |
 +0.5pp Source: IRI/Capstone Integrated Retail Panel Marlboro Menthol’s Retail Share Performance 5.2% 5.7% 3% 7% 2008 2009 |
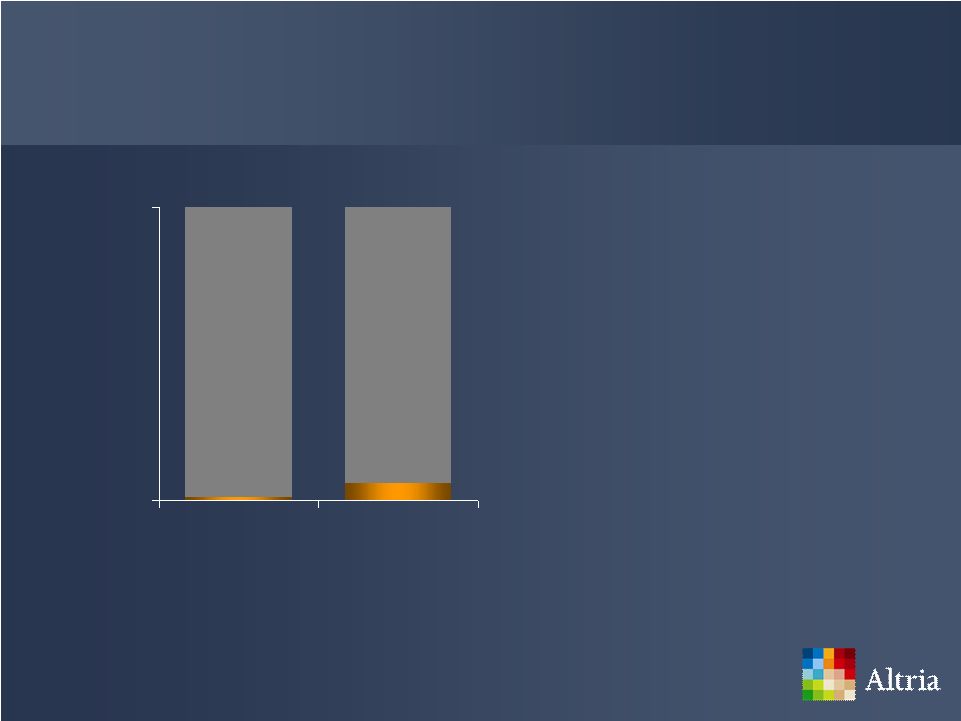 Copenhagen’s Growth Opportunities Source: InfoScan Smokeless Tobacco Database ending December 2009 0% 100% Share of Wintergreen Segment Share of Straight Segment |
 History of smokeless product innovation Uniquely positioned to capitalize on growth in number of adult tobacco consumers seeking smokeless tobacco alternatives Skoal’s Heritage |
 |
 Offers pouches in an easier to manage package at a compelling value proposition Skoal plans to introduce many other new products Skoal’s New “Slim Can”
|
 |
 Source: CASTS Database [Marlboro 2009 YTD ending 11/09; Black & Mild YTD ending 09/09] Marlboro Adult Tobacco Consumer Demographics Black & Mild 25% 45% Overall Share 21 - 29 30% 50% Overall Share 21 - 29 30 - 39 |
 Source: CASTS Database [Skoal and Copenhagen 2009 YTD ending 09/09] Skoal Copenhagen Adult Tobacco Consumer Demographics 15% 35% Overall Share 30 - 49 20% 40% Overall Share 21 - 29 |
 Substantial success in managing litigation Downward trend in individual cases, with exception of the Engle progeny cases PM USA has not tried an individual smoking and health case other than the Engle progeny trials and retrials in 48 months Litigation Environment |
 Only three statewide “Lights” class action cases have been certified – One case, Curtis, has already been dismissed on merits and is on appeal In federal court, “Lights” cases have been consolidated in a single federal district court Have achieved substantial success on class certification issue “Lights” Class Action Litigation |
 PM
USA has strong factual and legal defenses The Eleventh Circuit heard an
appeal whether plaintiffs’ theories violate state law and due
process In state cases, overwhelming majority of cases are inactive,
although PM USA has tried some cases with varying results PM USA intends to appeal any loss and raise state law and constitutional challenges Bond cap applies to state suits and limits any bond PM USA would have to post pending appeal Engle Progeny Cases |
 Successfully managed litigation, notwithstanding significant challenges Vigorously defended these claims for decades and intend to continue doing so Litigation Environment |
 Growing income by investing in four strong brands, Marlboro, Copenhagen, Skoal and Black & Mild Returning cash to shareholders in the form of dividends Preserving a strong balance sheet Reducing interest expense Strategies to Achieve Long-term Growth |
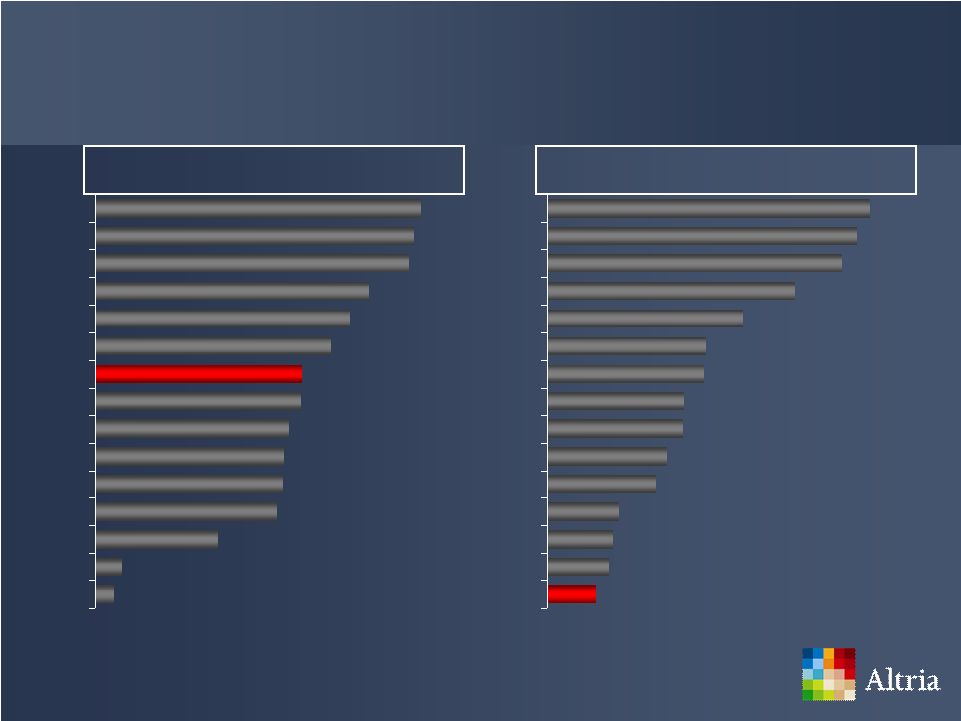
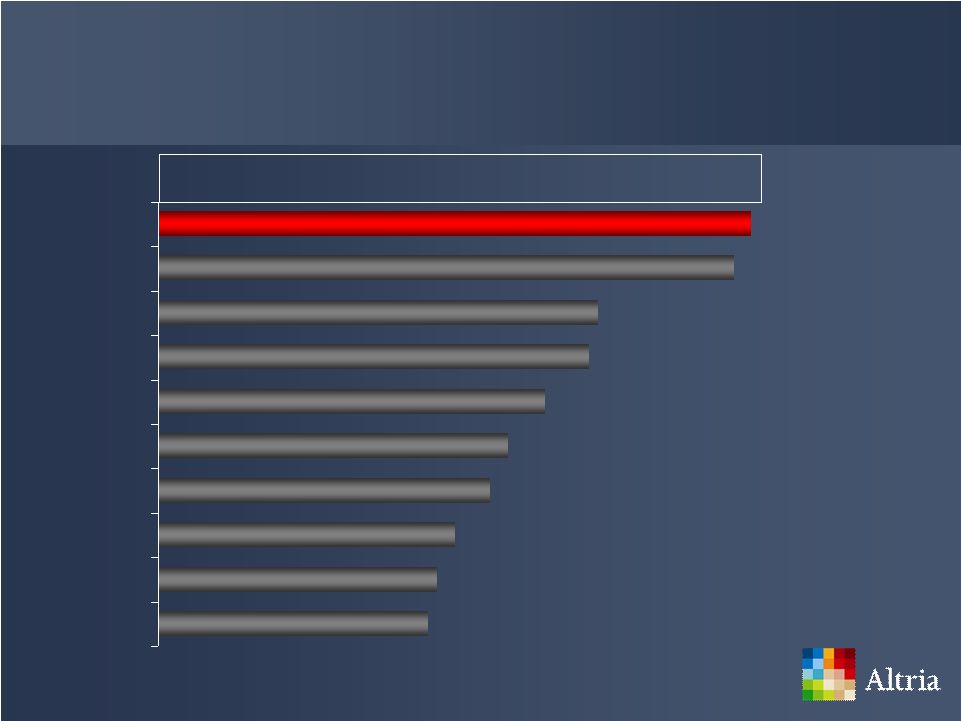 Percent of Market Capitalization Source: Bloomberg and company filings: CPG companies with a market capitalization
greater than $10 billion as of year-end 2009 Altria’s Dividend
6.6% 6.4% 4.9% 4.8% 4.3% 3.9% 3.7% 3.3% 3.1% 3.0% MO RAI LO PM KFT HNZ KMB CAG CPB PG |
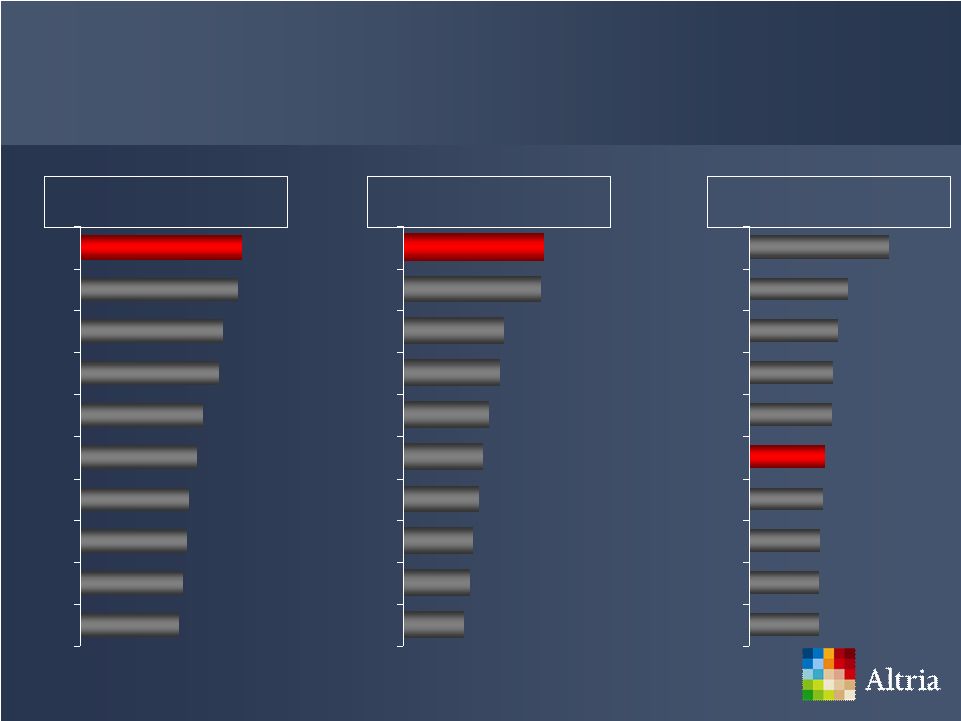 Payout Ratios Yield S&P 500 Source: Bloomberg and company filings: Payout ratio and yield compares CPG
companies with a market capitalization greater than $10 billion as of year-end 2009. Altria’s stated 80% payout ratio is a target. S&P 500
compares all companies in the Index and ranks the top-ten companies as of year-end 2009 Altria’s Dividend 9.1% 8.1% 7.7% 7.6% 6.5% 6.4% 6.4% 6.8% 6.9% FTR WIN DO CTL Q MO RAI TEG PBI POM 12.8% 6.9% 6.8% 5.0% 4.8% 4.3% 3.9% 3.8% 3.5% 3.3% 3.0% MO RAI LO PM KFT HNZ KMB CAG CPB PEP 80% 78% 71% 69% 61% 58% 54% 53% 51% 49% MO RAI PM LO HNZ KFT KO KMB AVP PEP |
 Payout ratio and yield are compelling Consistent history of dividend growth – Forty-two times in the last forty years Altria’s Dividend |
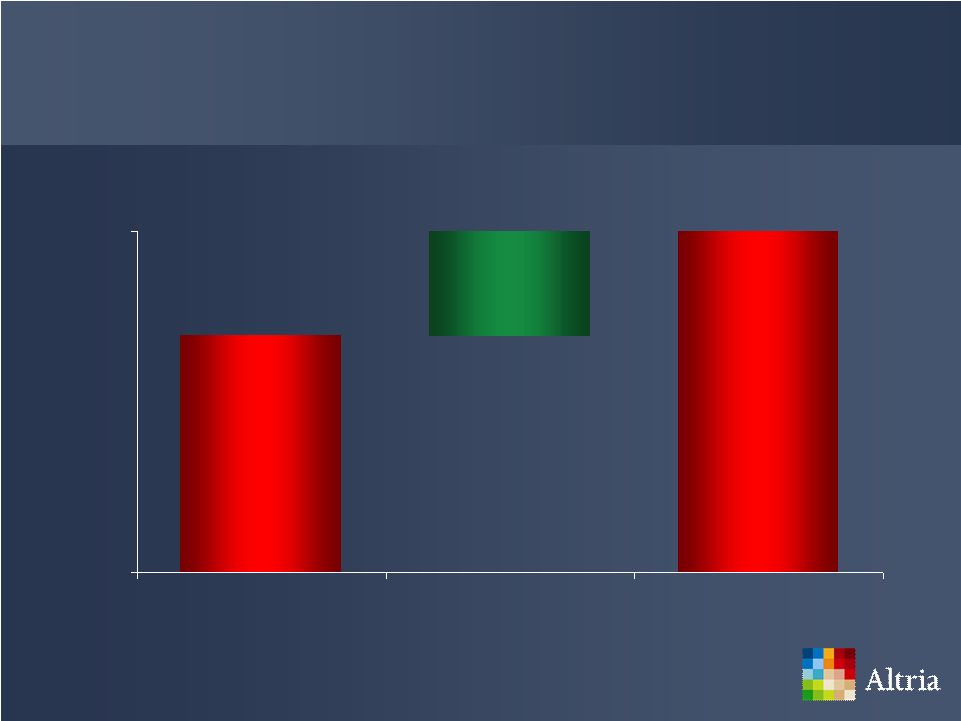
 +6.3% Source: Altria company reports and press releases (Note: Annualized Dividend
Rate) 2009 Since PMI Spin-off +17.2% Altria’s Dividend Growth $1.16 $1.36 2008 2009 $1.28 $1.36 $1.00 $1.50 Aug-08 Aug-09 |
 Past dividend increases are not predictive of future ones All future dividend payments are subject to the discretion of Altria’s Board of Directors Expect to increase dividends in-line with adjusted earnings per share growth Altria’s Dividend |
 Continue to make excellent progress on $1.5 billion program 2009 initiatives: – Ceasing production at Cabarrus, NC cigarette manufacturing facility – Integrating UST – Reshaping corporate structure Cost Reduction Program |
 ($
in Millions) Source: Altria company reports Altria’s Cost Management Program $462 $1,500 $1,038 $0 $1,500 2007- 2009 Savings Add. Cost Savings Expected by 2011 2007 - 2011 |
 Increasing earnings Improving efficiencies Reinvesting in brand building initiatives Altria’s service companies and PM USA are appropriately sized for the post-FET environment Benefits of Cost Reduction Program |
 Continue reducing cigarette related infrastructure ahead of volume declines Redesign business processes to enhance productivity in the smokeless tobacco and machine-made large cigar businesses Cost Management Strategy |
 Operating companies offer adults many types of products and compete in different categories and segments Tobacco operating companies have leadership positions in major tobacco categories Compare ourselves against other leading CPG companies with similar scale and scope Altria’s Transformation |
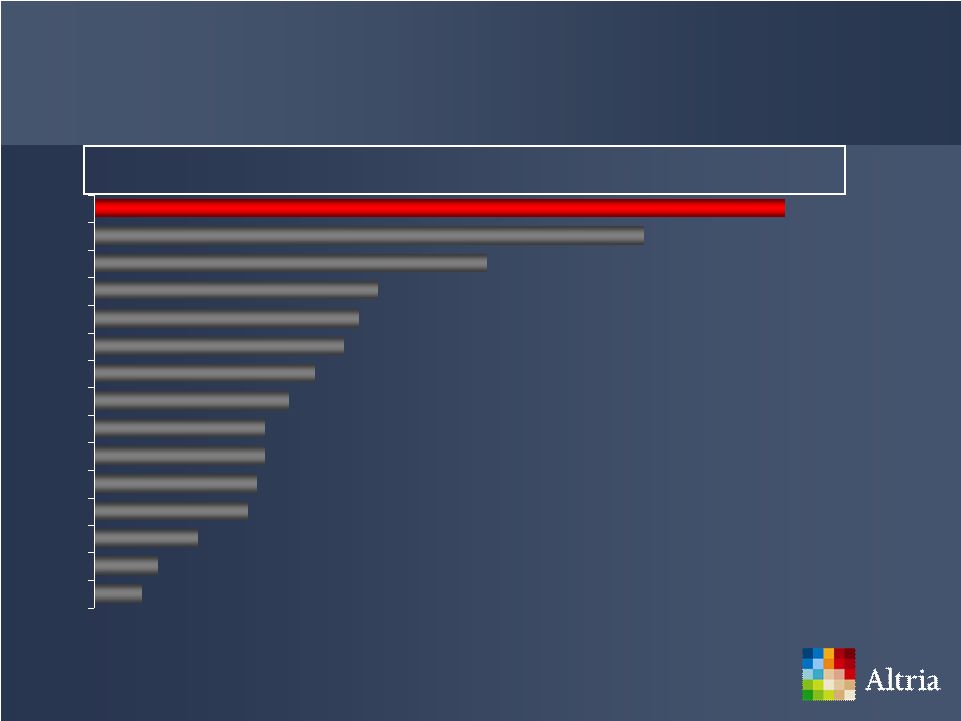
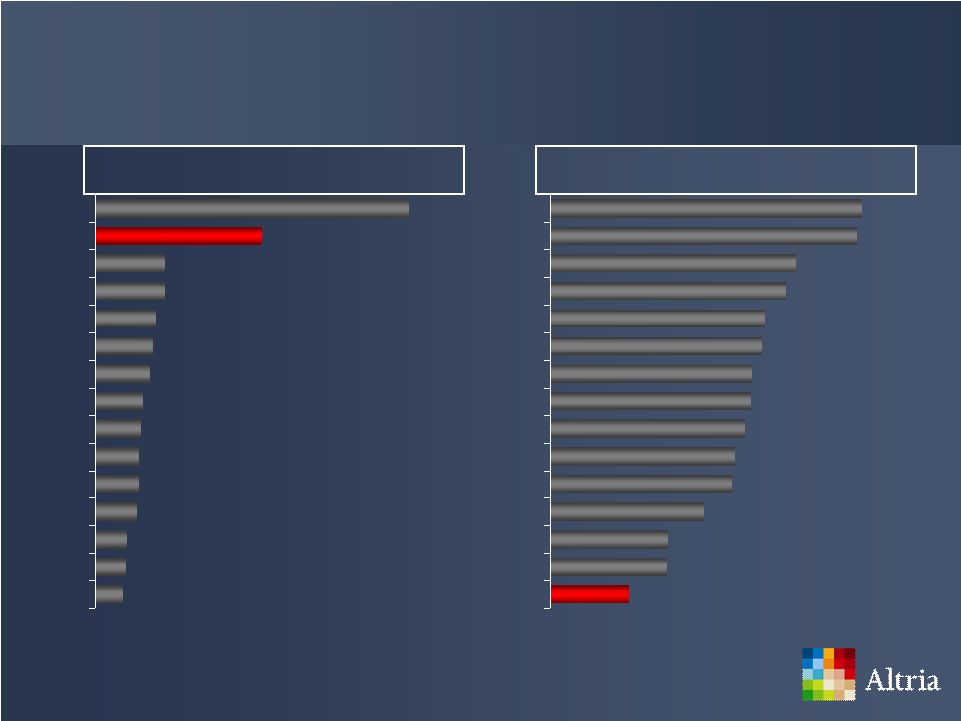 Source: Company filings: Compares CPG companies with net revenues, excluding excise
taxes, greater than $10 billion in the S&P Food, Beverage & Tobacco Index. Based on most recently available employee count per 10-K filings. COGS for peers are adjusted
to exclude certain one-time items. For reconciliations of non-GAAP to GAAP numbers visit www.altria.com. * Reflects Altria’s 2009 Net Revenues of $11,806 million (Net revenues of $23,556
million less government payments and excise taxes of $11,750 million), COGS of $2,797 million (Costs of goods sold of $7,990 million less government payments of $5,018 million, and
implementation and UST acquisition-related costs of $175 million). Year-end employee count was ~10,000 employees. For the purposes of this presentation, Altria’s
net revenue excludes excise taxes as well as contractual payments to government entities (e.g. MSA, quota buy-out, & FDA) as reconciled. Corresponding adjustments to revenues have not been made for other companies listed in this chart, except for PM which excludes excise taxes. ** Nearest comparable period to LTM 12/09 is used where 12/09 data not available as of February 15, 2010 (CAG, GIS, HNZ, KFT). Altria’s Financial Profile Net Revenues Per Employee (Twelve Months ending 12/09** – $ in Millions) COGS as a % of Net Revenues (Twelve Months ending 12/09**) $0.95 $0.94 $0.75 $0.72 $0.65 $0.65 $0.62 $0.61 $0.59 $0.56 $0.56 $0.47 $0.36 $0.36 $0.24 ADM TSN CAG** DF KFT** HNZ** CCE SLE GIS** K PBG PEP PM KO MO* $2.21 $1.18 $0.49 $0.49 $0.43 $0.41 $0.39 $0.34 $0.33 $0.31 $0.31 $0.30 $0.23 $0.22 $0.20 ADM MO* GIS** CAG** DF KFT** K KO PM HNZ** SLE CCE TSN PEP PBG |
 Altria’s Financial Profile Source: Company filings: Compares CPG companies with net revenues, excluding excise
taxes, greater than $10 billion in the S&P Food, Beverage & Tobacco Index. Adjusted EBITDA peer comparisons exclude certain one-time items and restructuring costs. For
reconciliations of non-GAAP to GAAP numbers visit www.altria.com. *
Reflects Altria’s 2009 Net Revenues ex. government payments and excise taxes of $11,806 million, adjusted SG&A of $2,725 million (Marketing, administration and research costs of $2,931 million, less UST acquisition-related transaction costs of $60
million, Reduction of Kraft receivable of $88 million and integration costs of $58 million), and adjusted EBITDA of $6,554 million as reconciled. For the purposes of this presentation, Altria’s net revenues exclude excise taxes as
well as contractual payments to government entities (e.g. MSA, quota buy-out, & FDA) as reconciled. Corresponding adjustments to revenues have not been made for other companies listed in this chart, except for PM which excludes excise taxes. ** Nearest comparable period to LTM 12/09 is used where 12/09 data not available as of February 15, 2010 (CAG, GIS, HNZ, KFT). SG&A as a % of Net Revenues (Twelve Months ending 12/09**) SG&A as a % of EBITDA (Twelve Months ending 12/09**) 273% 262% 249% 210% 166% 135% 133% 116% 115% 101% 92% 61% 56% 53% 42% PBG DF CCE SLE PEP KFT** K KO HNZ** CAG** GIS** TSN ADM PM MO* 37% 36% 35% 31% 29% 27% 23% 23% 22% 21% 21% 20% 14% 3% 2% KO PBG PEP CCE SLE K MO* PM DF KFT** GIS** HNZ** CAG** TSN ADM |
 Source: Company filings: Compares CPG companies with net revenues, excluding excise
taxes, greater than $10 billion in the S&P Food, Beverage & Tobacco Index. Adjusted EBITDA peer comparisons exclude certain one-time items and restructuring costs. For
reconciliations of non-GAAP to GAAP numbers visit www.altria.com. *
Reflects Altria’s 2009 Net Revenues ex. government payments and excise taxes of $11,806 million and adjusted EBITDA of $6,554 million as reconciled. For the purposes of this presentation, Altria’s net revenues exclude excise taxes as well as contractual payments to government entities (e.g. MSA, quota buy-out, & FDA) as reconciled. Corresponding adjustments to revenues have not been made for other companies listed in
this chart, except for PM which excludes excise taxes. ** Nearest comparable period to LTM 12/09 is used where 12/09 data not available as of February 15, 2010 (CAG, GIS, HNZ, KFT). Altria’s Financial Profile EBITDA as a % of Net Revenues (Twelve Months ending 12/09**) 56% 44% 32% 23% 21% 20% 18% 16% 14% 14% 13% 12% 8% 5% 4% MO* PM KO GIS** PEP K HNZ** KFT** CAG** SLE PBG CCE DF TSN ADM |
 Altria’s Strong Balance Sheet Important to continue delivering sustainable and predictable earnings growth over time to grow the dividend Protects the company’s investment grade credit rating Preserves access to the capital markets Secures cash flow generated by operating companies |
 Altria’s Investment Grade Credit Rating Access to commercial paper backstopped with revolving credit facilities Replaced prior $3.4 billion credit facility with two new facilities in November 2009 – $2.4 billion 3-year facility – $0.6 billion 364-day facility |
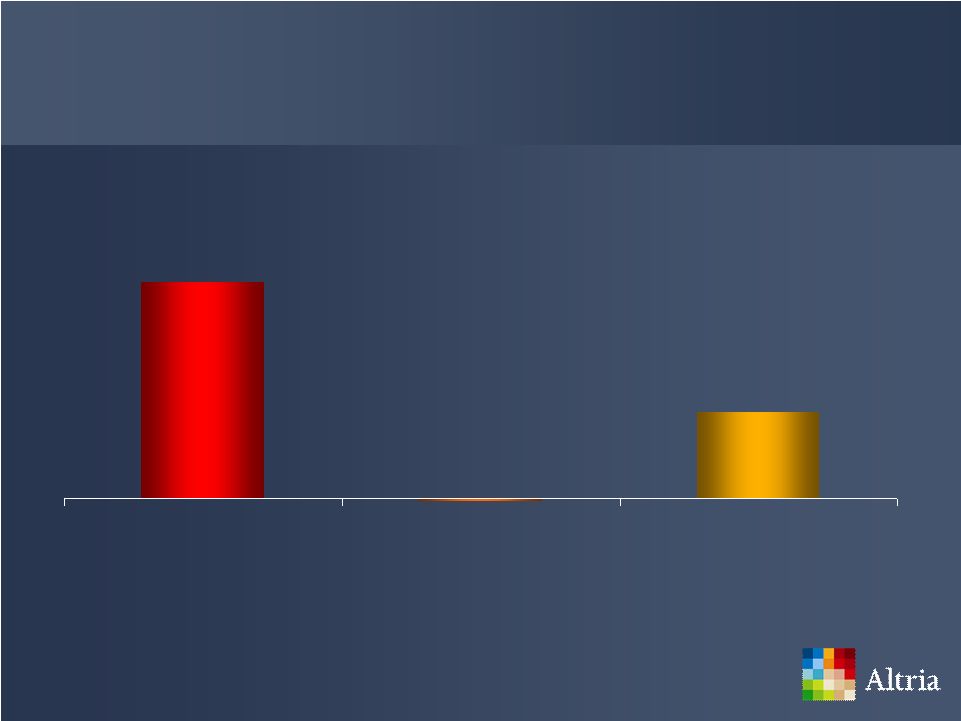
 Altria’s Economic Interest in SABMiller Equity Earnings ($ in Millions) Source: Altria company reports; Bloomberg Closing Stock Price in GBP converted to USD as
of February 12, 2010. +12.5% (CAGR) Market Value ($ in Billions) $3.4 $11.3 $0 $18 Jul-02 Feb-10 $296 $600 $0 $800 2003 2009 |
 Currently intend to maintain position for the foreseeable future Monetizing position would weaken Altria’s balance sheet and be dilutive to Altria’s earnings per share Sale would have significant tax implications and potential overhang in SABMiller’s stock price Retention of a portion of any sale proceeds as an asset on balance sheet to maintain strength and liquidity Altria’s Economic Interest in SABMiller |
 Altria’s Strong Balance Sheet Enables Altria to maximize cash returned to shareholders in the form of dividends Maintain a conservative financial profile |
 Altria’s Cash Flow Majority of cash flow generated from operations is expected to be returned to shareholders as dividends Capital expenditures for next several years are expected to be under 2% of net revenues Since the share repurchase program is suspended indefinitely, we expect to use excess cash, above that needed for dividends and capital expenditures to reduce interest expense
|
 Debt to EBITDA ratio at the end of 2009 was 1.9 to 1 Ratio in-line with peers, and supports investment grade credit rating Reducing interest expense would further strengthen balance sheet, improve cash flow and increase earnings per share and dividends Altria’s Debt |
 Altria’s Debt $3.4 billion in debt coming due over next four years, which has over $260 million in annual interest Decision to refinance or retire debt depends upon: – Conditions of the capital markets – Interest rates – Business needs and conditions |
 Altria’s Adjusted EPS Growth Objective Delivered average adjusted EPS growth of 8% over the past two years Within the long-term objective of 8% to 10% outlined at time of PMI spin Dramatic change in operating environment since March 2008 More appropriate mid-term adjusted EPS growth objective of
7% to 9% in today’s environment |
 2010
Business Environment Adult consumers remain under economic pressure and face
high unemployment Remain cautious about state excise tax environment and competitive environment |
 Altria’s 2010 Adjusted EPS Guidance Source: Altria company filings * For reconciliation of non-GAAP to GAAP numbers visit www.altria.com Partially due to FET-related pricing strategies in 2009, income growth comparisons are expected to be more challenging for the first and second quarters of 2010 Expect adjusted EPS growth to build in the second half of 2010 Altria forecasts that 2010 adjusted* diluted EPS will grow to a range of $1.85 to $1.89 |
 +17.2% Source: Altria company filings; Bloomberg Yearly Return Dividend Growth Delivering Superior Returns to Shareholders 2009 Total Shareholder Return* * Assumes reinvestment of dividends 39.1% 25.9% 21.6% Altria S&P 500 S&P Food, Beverage & Tobacco $1.16 $1.36 2008 2009 |
 Source: Bloomberg Total Shareholder Return Note : Top ten defined as the 10 largest U.S. Consumer Packaged Goods by market
capitalization as of Dec. 31, 2009; TSR as of Dec. 31, 2009 Market Cap.
2009 Company Name Industry ($ in Millions) TSR (%) 1 Altria Group, Inc. Tobacco $40,678 39.1 2 Coca-Cola Co Beverages 132,079 29.5 3 Kimberly-Clark Corp Household Products 26,464 25.4 4 Kellogg Co Food Products 20,185 24.6 5 Colgate-Palmolive Co Household Products 40,844 22.4 6 General Mills Inc Food Products 23,335 19.5 7 Philip Morris International Inc Tobacco 91,787 15.9 8 PepsiCo Inc Beverages 94,875 14.3 9 Kraft Foods Inc Food Products 40,172 5.6 10 Procter & Gamble Co Household Products 177,145 0.9 |
 Source: Bloomberg Altria’s Total Shareholder Return – 1999 to 2009 174.4% -2.9% 69.3% Altria S&P 500 S&P 500 Food, Beverage & Tobacco |
 High dividend yield with strong EPS growth prospects – ~80% dividend payout ratio target – +6.5% dividend yield – Opportunity to grow both EPS and dividends by 7% to 9% per year Compelling Investment Note: Dividend yield is based on the closing stock price as of 2/12/2010
|
 Altria’s Solid Business Model Tobacco space profit pool is growing Tobacco operating companies have leading positions in all major tobacco categories Relatively unaffected by currency issues, input costs and private label brand competition from the trade Potentially more earnings predictability than other CPG company investment alternatives |
 |
 Non-GAAP Financial Measures Altria reports its consolidated financial results in accordance with generally accepted
accounting principles (GAAP). Today’s remarks may contain various
operating results on both a reported basis and on an adjusted basis, which
excludes items that affect the comparability of reported results. Altria’s management reviews OCI, which is defined as operating income before
corporate expenses and amortization of intangibles, to evaluate segment
performance and allocate resources. Altria’s management also
reviews OCI, operating margins and earnings per share (EPS) on an adjusted
basis, which excludes certain income and expense items that management
believes are not part of underlying operations because such items can obscure underlying business trends. Management believes it is appropriate to
disclose these measures to help investors analyze underlying business
performance and trends. Such adjusted measures are regularly provided
to management for use in the evaluation of segment performance and
allocation of resources. All references in the remarks are to continuing
operations, unless otherwise noted. Reconciliations of any non-GAAP
financial measures to the most directly comparable GAAP measures can be
found posted to our website at www.altria.com. |
 For full reconciliation, visit www.altria.com/investors Regulation G Disclosure |
 Cigarettes Segment’s Adjusted Operating Companies Income (OCI) for Year Ended December 31, 2007 (dollars in millions) Reported
OCI $4,511 Asset impairment and exit costs 344 Implementation costs 27 Provision for Scott
Case
26 Adjusted OCI $4,908 Source: ALCS Finance, reconciliation between GAAP and non-GAAP financial
measures |
 Cigarettes Segment’s Adjusted Operating Companies Income (OCI) Margin for Year Ended December 31, 2007 (dollars in millions) Adjusted
OCI $4,908 Revenues
18,470 Less Excise
taxes
(3,449) Net Revenues excluding excise
taxes $15,021 Adjusted OCI margin 32.7% Source: ALCS Finance, reconciliation between GAAP and non-GAAP financial
measures |
 Cigarettes Segment’s Adjusted Operating Companies Income (OCI) for Year Ended December 31, 2008 (dollars in millions) Reported
OCI $4,866 Exit costs 97 Implementation costs 69 Adjusted OCI $5,032 Source: ALCS Finance, reconciliation between GAAP and non-GAAP financial
measures |
 Cigarettes Segment’s Adjusted Operating Companies Income (OCI) for Year Ended December 31, 2009 (dollars in millions) Reported
OCI $5,055 Exit costs 115 Implementation costs 139 Adjusted OCI $5,309 Source: ALCS Finance, reconciliation between GAAP and non-GAAP financial
measures |
 Cigarettes Segment’s Adjusted Operating Companies Income (OCI) for Year Ended December 31 (dollars in millions) 2008 adjusted OCI $5,032 2009 adjusted OCI $5,309 % change 2009 adjusted OCI versus prior-year period 5.5% Source: ALCS Finance, reconciliation between GAAP and non-GAAP financial
measures |
 Adjusted
OCI $5,309 Revenues
20,919 Less Excise
taxes
(6,465) Net Revenues excluding excise
taxes $14,454 Adjusted OCI margin 36.7% Source: ALCS Finance, reconciliation between GAAP and non-GAAP financial
measures Cigarettes Segment’s Adjusted Operating Companies Income (OCI) Margin for Year Ended December 31, 2009 (dollars in millions) |
 Cigarettes Segment’s Adjusted Operating Companies Income (OCI) Margin for Year Ended December 31 2007 adjusted OCI margin 32.7% 2009 adjusted OCI margin 36.7% % point change 2009 adjusted OCI margin
versus 2007 adjusted OCI margin 4.0pp Source: ALCS Finance, reconciliation between GAAP and non-GAAP financial
measures |
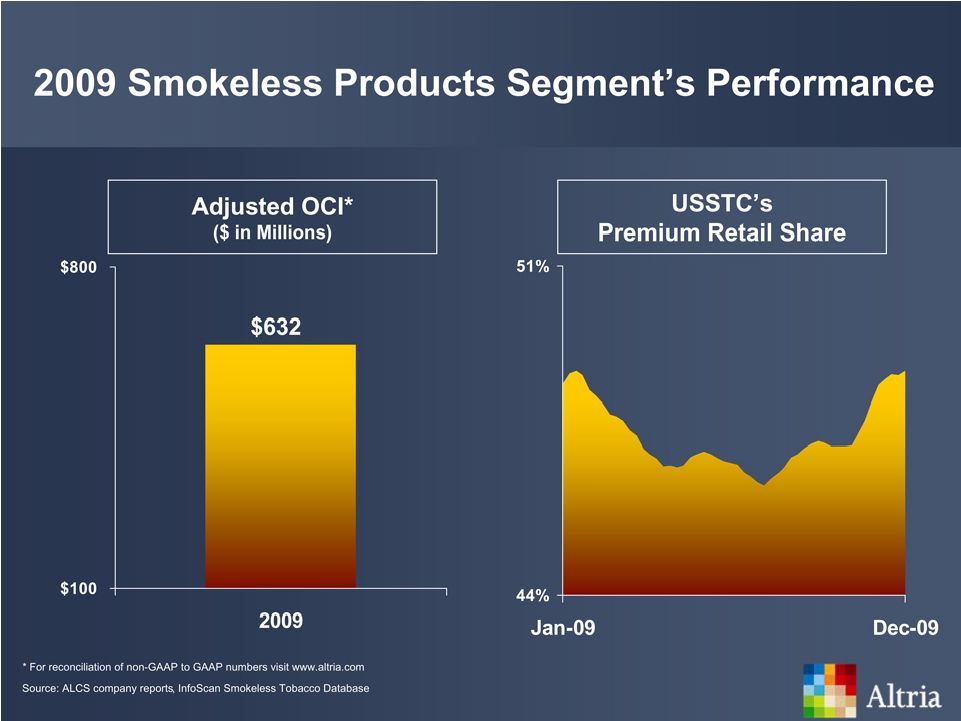
 Smokeless Products Segment’s Adjusted Operating Companies Income (OCI) for Year Ended December 31, 2009 (dollars in millions) Reported
OCI $381 Asset impairment and exit costs 193 Integration costs 43 UST acquisition-related costs* 15 Adjusted OCI $632 Source: ALCS Finance, reconciliation between GAAP and non-GAAP financial
measures * Excludes asset impairment, exit and integration costs
|
 Cigars Segment’s Adjusted Operating Companies Income (OCI) for Year Ended December 31, 2008 (dollars in millions) Reported OCI $164 Integration costs 18 Adjusted OCI $182 Source: ALCS Finance, reconciliation between GAAP and non-GAAP financial
measures |
 Cigars Segment’s Adjusted Operating Companies Income (OCI) for Year Ended December 31, 2009 (dollars in millions) Source: ALCS Finance, reconciliation between GAAP and non-GAAP financial
measures Reported OCI $176 Integration costs 9 Adjusted OCI $185 |
 Cigars Segment’s Adjusted Operating Companies Income (OCI) for Year Ended December 31 (dollars in millions) 2008 adjusted OCI $182 2009 adjusted OCI $185 % change 2009 adjusted OCI versus prior-year period 1.6% Source: ALCS Finance, reconciliation between GAAP and non-GAAP financial
measures |
 Wine
Segment’s Adjusted Operating Companies Income (OCI) for Year Ended December 31, 2009 (dollars in millions) Reported
OCI $43 Exit costs 3 Integration costs 6 UST acquisition-related
costs*
21 Adjusted OCI $73 Source: ALCS Finance, reconciliation between GAAP and non-GAAP financial
measures * Excludes exit and integration costs |
 Adjusted Diluted Earnings per Share (EPS) from Continuing Operations Attributable to Altria for Year Ended December 31, 2007 Reported diluted EPS from continuing operations $1.48 Asset impairment, exit and implementation costs 0.15 Interest on tax reserve transfers to Kraft Foods Inc. (Kraft) 0.02 Recoveries from airline industry exposure (0.06) Tax items (0.09) Adjusted diluted EPS from continuing operations $1.50 Source: ALCS Finance, reconciliation between GAAP and non-GAAP financial
measures |
 Adjusted Diluted Earnings per Share (EPS) from Continuing Operations Attributable to Altria for Year Ended December 31, 2008 Reported diluted EPS from continuing operations $1.48 Tax Items (0.03) Gain on sale of corporate headquarters building (0.12) Loss on early extinguishment of debt 0.12 SABMiller special items 0.03 UST acquisition-related costs* 0.02 Exit, integration and implementation
costs 0.15 Adjusted diluted EPS from continuing operations $1.65 * Excludes exit and integration costs Source: ALCS Finance, reconciliation between GAAP and non-GAAP financial
measures |
 Adjusted Diluted Earnings per Share (EPS) Attributable to Altria for Year Ended December 31, 2009 Reported diluted EPS $1.54 Tax Items (0.04) UST acquisition-related costs* 0.06 Asset impairment, exit, integration and implementation costs 0.19 Adjusted diluted EPS $1.75 * Excludes asset impairment, exit and integration costs Source: ALCS Finance, reconciliation between GAAP and non-GAAP financial
measures |
 2007
adjusted diluted EPS from continuing operations $1.50 2008 adjusted diluted EPS from continuing operations $1.65 % change in 2008 adjusted diluted EPS from continuing operations versus prior-year period 10.0% Source: ALCS Finance, reconciliation between GAAP and non-GAAP financial
measures Adjusted Diluted Earnings per Share (EPS) Attributable to Altria for Year Ended December 31 |
 2008
adjusted diluted EPS from continuing operations $1.65 2009 adjusted diluted EPS from continuing operations $1.75 % change in 2009 adjusted diluted EPS from continuing operations versus prior-year period 6.1% Source: ALCS Finance, reconciliation between GAAP and non-GAAP financial
measures Adjusted Diluted Earnings per Share (EPS) from Continuing Operations Attributable to Altria for Year Ended December 31 |
 Projected Full-Year Adjusted Diluted Earnings per Share (EPS) Attributable to Altria for Year Ending December 31, 2010 Projected reported diluted EPS $1.78 to $1.82 Exit, integration and implementation costs 0.04 UST acquisition-related costs* 0.01 SABMiller special items 0.02 Projected adjusted diluted EPS $1.85 to $1.89 * Excludes exit and integration costs Source: ALCS Finance, reconciliation between GAAP and non-GAAP financial
measures |
 Projected Full-Year Adjusted Diluted Earnings per Share (EPS) Attributable to Altria for Year Ending December 31 2009 adjusted diluted EPS $1.75 2010 projected adjusted diluted EPS $1.85 to $1.89 % change in 2010 projected full-year adjusted diluted EPS versus the prior-year period 6% - 8% Source: ALCS Finance, reconciliation between GAAP and non-GAAP financial
measures |
 Altria Earnings Before Interest Taxes, Depreciation & Amortization (EBITDA) for the Debt Covenant Year Ended December 31,
2009 (dollars in millions) Source: ALCS Finance, reconciliation between GAAP and non-GAAP financial
measures. Net earnings attributable to Altria Group, Inc. $3,206 Equity earnings and minority interest, net (599) Dividends from less than 50% owned affiliates 254 Provision for income taxes 1,669 Depreciation & Amortization 291 Asset impairment and exit costs 421 Interest and other debt expense, net 1,185 Consolidated EBITDA attributable
to Altria Group,
Inc.
$6,427 |
 Altria Total Debt for EBITDA calculation Year Ended December 31, 2009 (dollars in millions) Current portion of Long-term
debt $775 Long-term debt 11,185 Discount on debt 41 Third-party guarantees 12 Total debt $12,013 Source: ALCS Finance, reconciliation between GAAP and non-GAAP financial
measures. |
 Altria Revenues Net of Excise Taxes and Government Payments for the Year Ended December 31,
2009 (dollars in millions) Source: ALCS Finance, reconciliation between GAAP and non-GAAP financial
measures. Revenues $23,556 Less Excise taxes (6,732) Net revenues net of excise taxes $16,824 Less MSA, quota & FDA (5,018) Net revenues net of excise taxes and $11,806 government payments |
 Altria Adjusted Earnings Before Interest, Taxes, Depreciation & Amortization (EBITDA) for the Year Ended December 31,
2009 (dollars in millions) Source: ALCS Finance, reconciliation between GAAP and non-GAAP financial
measures. * Excludes exit and integration costs Net earnings attributable to Altria $3,206 Equity earnings and minority interest, net (599) Provision for income taxes 1,669 Depreciation & Amortization 291 Interest and other debt expense, net 1,185 Consolidated EBITDA attributable to Altria $5,752 Asset impairment and exit costs 421 Integration and implementation costs 197 UST transaction and acquisition-related costs* 96 Reduction to Kraft Receivable 88 Consolidated Adjusted EBITDA attributable to Altria $6,554 |
 |