Attached files
| file | filename |
|---|---|
| 8-K - FORM 8-K - NEWFIELD EXPLORATION CO /DE/ | nfx8k-02162010.htm |
| EX-99.2 - EARNINGS PRESS RELEASE - NEWFIELD EXPLORATION CO /DE/ | nfx8k-02162010ex992.htm |
| EX-99.1 - RESERVES PRESS RELEASE - NEWFIELD EXPLORATION CO /DE/ | nfx8k-02162010ex991.htm |
Exhibit
99.3

@NFX is
periodically published to keep shareholders aware of current operating
activities at Newfield. It may include estimates of expected production volumes,
costs and expenses, recent changes to hedging positions and commodity
pricing.
February
16, 2010
This
edition of @NFX includes:
|
·
|
2009
HIGHLIGHTS & 2010 PLANS2009 FOURTH QUARTER DRILLING ACTIVITY BY
AREA
|
|
·
|
OPERATIONAL
SUMMARIES BY FOCUS AREA
|
|
·
|
UPDATED
TABLES DETAILING COMPLETE HEDGE
POSITIONS
|
Fourth Quarter 2009 Drilling
Activity*
|
NFX
Operated
|
Non-Operated
|
Gross
Wells
|
Dry
Holes
|
|||||||||||||
|
Mid-Continent
|
30 | 5 | 35 | 0 | ||||||||||||
|
Rocky
Mount.
|
54 | 7 | 61 | 0 | ||||||||||||
|
Onshore
GC
|
2 | 1 | 3 | 0 | ||||||||||||
|
Gulf
of Mexico
|
1 | 1 | 2 | 1 | ||||||||||||
|
International
|
3 | 1 | 4 | 0 | ||||||||||||
|
Total:
|
90 | 15 | 105 | 1 | ||||||||||||
*Represents
a 99% success rate
2009
total gross wells: 422; dry wells: 7
2009
HIGHLIGHTS
|
·
|
Full
year 2009 production was 257 Bcfe, an increase of 9% over 2008 production
volumes. Production was in the top half of our original 2009 guidance
(250-260 Bcfe), despite curtailment of 3 Bcfe in 3Q09 related to low
natural gas prices.
|
|
·
|
Our
proved reserves increased 23% in 2009 and at year-end were 3.6 Tcfe. The
Company replaced approximately 250% of its 2009 production with the
addition of new reserves (excluding the impact of the new SEC rules).
Proved reserves in Newfield’s two largest divisions – the Mid-Continent
and Rocky Mountains – increased 34% and represent more than 80% of the
Company’s total proved reserves. Approximately 53% of the Company’s proved
reserves were proved developed and 72% were natural gas. The Company’s
proved reserve life index is approximately 14 years, reflecting continued
growth in longer-lived resource plays. A detailed news release on our
proved reserves for 2009 was released on February 16,
2010.
|
|
·
|
We
allocated our capital more effectively in 2009. We lived within our cash
flow from operations in 2009, while reducing our debt by approximately
$200 million. Some 2009 projects were deferred into future periods and we
added new projects to our original budget totaling approximately $100
million. Capital investments for 2009 totaled $1.4
billion.
|
|
·
|
In
recent months, we added more than 500,000 net acres in long-lived,
domestic resource plays. New ventures include: acquisition of Maverick
Basin assets from TXCO Resources, Inc (>300,000 acres), Marcellus Shale
entry through an exploration agreement with Hess Corp (approximately
35,000 acres), and a joint venture on Blackfeet Tribal acreage in northern
Montana’s Southern Alberta Basin (approximately 156,000
acres).
|
1
2010
CAPITAL INVESTMENT PLANS AND PRODUCTION GUIDANCE
Newfield’s
2010 capital budget is $1.6 billion (including approximately $124 million in
capitalized interest and overhead). This budget approximates the Company’s
estimate of 2010 cash flow from operations and includes approximately $100
million for planned investments on the acreage recently acquired in the Maverick
Basin of Texas. The budget excludes the recent $215 million purchase price for
the acquisition of assets from TXCO Resources, Inc.

Our
production for 2010 is expected to be 278 – 288 Bcfe, an increase of 8 – 12%
over 2009. In 2010, we will invest approximately 70% of our budget, or
approximately $1 billion, in domestic resource plays. More than one-third of the
budget will be directed to oil plays. The following pie chart details our
expected 2010 production by area.

Newfield
has ample liquidity and, following our recent issuance of $700 million of 6 7/8%
Senior Subordinated Notes, we have no outstanding borrowings under our $1.25
billion credit facility. Approximately 70% of our expected 2010 gas production
is hedged at a weighted average minimum price of approximately $6.60 per MMbtu.
Approximately 65% of our expected 2010 domestic oil production is hedged at a
weighted average minimum price of approximately $108.00 per barrel. Complete
hedging details are found at the end of this edition of @NFX.
2
RECENT
ACTIVITTY BY AREA AND 2010 PLANS
ONSHORE
TEXAS
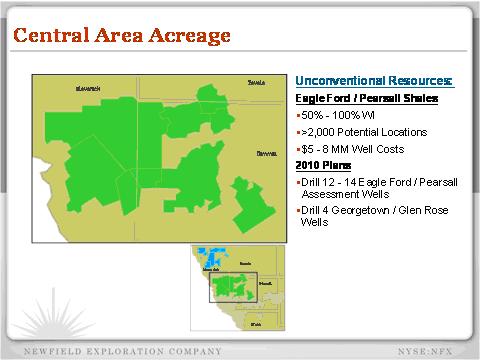
For 2010,
the primary focus of our activity will be on the acreage that we recently
acquired in the Maverick Basin from TXCO Resources. This transaction closed on
February 11, 2010. In 2010, we expect to invest approximately $100 million in
the asset, with drilling programs beginning in the second quarter.
This
transaction marked our entry into the Maverick Basin of Texas. We now have
300,000 net acres located primarily in Maverick and Dimmit Counties, Texas.
Current production from the assets totals about 1,300 BOEPD. There are multiple
geologic horizons on the acreage, with prospects ranging from dry gas to
oil. The following cross section details the prospective formations
throughout our acreage.

Our 2010
plans are aggressive. We will begin work immediately and expect to be running at
least three operated rigs here by summer. Our efforts will be primarily focused
on three plays – the Eagle Ford, Pearsall Shales and the Georgetown
formation.
3

MID-CONTINENT
Our net
production from the Mid-Continent grew 18% in 2009. The growth is being driven
by the Granite Wash and Woodford Shale plays. Gross production from the
Mid-Continent is currently more than 500 MMcfe/d, or approximately 320 MMcfe/d
net. Approximately 40% of our 2010 budget will be allocated to our activities in
the Mid-Continent.
The
Granite Wash
In
today’s fourth quarter and full year 2009 earnings and operating release, we
announced results from six additional completions in our horizontal Granite Wash
play. In total, we have results from 13 Granite Wash horizontal completions.
Average initial production rates for our first 12 wells was 20 MMcfe/d. Our
13th
well, the Britt 8-6H, commenced production this week and the rate continues to
rise following fracture stimulation. We have six additional horizontal Granite
Wash wells that are in various stages of completion at this time. The following
chart shows our results to date.
4

Since
2002, we have drilled approximately 150 vertical wells in our Granite Wash play
(primarily Stiles/Britt Ranch fields, Wheeler County, Texas). We know from this
drilling that there are multiple productive horizons within the four primary
geologic targets – Marmaton, Red Fork, Cherokee and Atoka. In the table above,
the wells with high condensate yields were located in the Marmaton, the
shallowest of the four targets. Of our recent wells (6) were completed in the
Atoka, a known dry-gas producer. We plan to drill horizontal wells in 4-6
additional horizons in 2010.
We
continue to optimize our drilling and completion practices in the Granite Wash.
Lateral lengths in our most recent wells are 4,300’ - 4,700’ and our “best in
class” drill and complete costs to date is approximately $7.3 million. Our drill
and case cost per lateral foot is down approximately 20% when comparing our
first seven wells with our most recent wells.
We are
running a four rig program today and expect that this level of activity will
allow us to drill about 20 horizontal wells in 2010. Although extensive work is
underway to determine our overall development plan, we estimate that there are
about 250 remaining horizontal locations in our Granite Wash play. We have more
than 40,000 net acres in this play.
The
Woodford Shale
Our
production in the Woodford continues to grow. Gross operated production is
approximately 329 MMcfe/d, or approximately 191 MMcfe/d net. Our 2009 volumes in
the Woodford grew 25% and we expect that our production will increase more than
25% during 2010. Today, we have 166,500 net acres in the play and substantially
all of the acreage is held by production.
In 2010,
we expect to run 6-8 operated rigs in our Woodford Shale area. Although this is
fewer operated rigs than we have run in previous years, our efficiency gains are
allowing us to drill and complete more lateral feet per year, per rig. The
following chart depicts these efficiency gains.
5

We expect
to drill approximately 50 horizontal wells in our Woodford play in 2010. Our
average lateral length is expected to be approximately 6,000’. We define wells
with lateral lengths in excess of 5,000’ as “Super Extended Laterals,” or SXLs.
About one-third of our 2010 wells in the Woodford are expected to be SXLs. Our
efficiencies have been improved through lengthened laterals and operational
gains. Our average lateral length in 2009 was approximately 5,000’, compared to
an average of approximately 4,000’ in 2008 and less than 2,500’ in
2006-07.
To date,
the Company has drilled 11 SXLs with an average lateral length of nearly 9,000’.
As previously reported, the first five SXL wells had average initial production
rates of approximately 10 MMcfe/d gross. The remainder of the SXLs (6) are in
various stages of completion.
Today, we
have more than 300 horizontal wells producing in the Woodford Shale. Since
October 2009, we have completed and turned a total of 34 Woodford wells to sales
(SXLs, standard completions and multi-well pads). The average initial
gross production rate for all wells is 6 MMcfe/d.
Since the
beginning of 2009, our drill and complete costs in the Woodford have decreased
about 20%.
ROCKY
MOUNTAINS
Our net
production from the Rocky Mountains grew 10% in 2009 and is expected to grow by
a comparable amount in 2010. Nearly 25% of our 2010 budget will be allocated to
our activities in the Rocky Mountains. Our primary areas of focus will be the
Uinta, Williston and Southern Alberta Basins.
Monument
Butte
Our
largest oil asset is Monument Butte, located in the Uinta Basin of northeast
Utah. The Monument Butte field covers approximately 180,000 net acres (includes
63,000 Ute Tribal acres). Our production from this field is currently 17,000
BOPD (gross). In 2010, we expect to run a 5-rig program and to drill about 275
wells. Our Monument Butte production is expected to increase 15% in
2010.
Recent
drilling results on our Ute Tribal acreage have exceeded our expectations. To
date, we have drilled 75 wells on this acreage, located north and adjacent to
Monument Butte. We have two rigs active on this acreage today. Recent wells have
“stepped out” as far as 10 miles from core development drilling areas and
initial production rates have ranged from 100 – 1,500 BOPD. Our interest on the
Ute Tribal acreage is approximately 70%. The following map shows our acreage in
the Monument Butte area.
6

There are
more than 1,300 producing wells in the Monument Butte field, of which
approximately 900 have been drilled since we acquired the field in 2004. The
average initial gross production rate for a typical Monument Butte well has
ranged from 65 – 80 BOPD.
Williston /
Southern Alberta Basins
Over the
last several years, we have assembled a large acreage position in the Williston
and Southern Alberta Basins. Newfield has approximately 150,000 net acres in
prospective development areas, located primarily on the Nesson Anticline and
west of the Nesson. In addition, Newfield owns interest in approximately 54,000
net acres in the Elm Coulee field. In addition, we have 221,000 net acres in the
Southern Alberta Basin of northern Montana. Our activity levels in these regions
are increasing and we expect that our Williston production will grow by about
40% in 2010. We have more than 80 development locations, located primarily along
the Nesson Anticline. Our current net production is approximately 3,000
BOEPD.
Due to
strong oil prices, we recently increased our operated rig count in the Williston
to three rigs. Two of the rigs will be dedicated to our development areas,
located along the Nesson Anticline. The third rig will be used to continue to
assess our acreage west of the Nesson. We have drilled 14 successful oil wells
in the North Dakota portion of the Williston Basin since entering the region in
late 2007. The following chart details our results to date:
7

In late
2009, we signed an agreement with the Blackfeet Nation, adding 156,000 net acres
in the Southern Alberta Basin. This was additive to our existing acreage and we
now own interests in 221,000 net acres in Glacier County, Montana. The area is
geologically similar to the Williston Basin. Our prospective oil targets
include: the Bakken, Three Forks and Lodgepole. We expect to begin assessment
drilling in the region in April 2010 and, depending on success, plan to drill as
many as 10 operated wells during 2010.
MARCELLUS
SHALE / APPALACHIAN BASIN
In late
2009, we entered the Marcellus Shale through a joint exploration agreement with
Hess. To date, we have leased interests in approximately 35,000 net acres,
primarily in Susquehanna and Wayne Counties, Pennsylvania. We operate the
venture with a 50 percent working interest.
We
recently filed permits to drill up to 10 vertical assessment wells in Wayne
County in 2010. Our first well is expected to spud this summer.
GULF
OF MEXICO
Approximately
15% of our 2010 budget will be allocated to our activities in the deepwater Gulf
of Mexico. Our GOM production is expected to increase more than 60% in 2010. We
have five active deepwater developments that we expect to add significant
production growth in 2010 -12. In addition to these developments, we anticipate
participating in 2-3 deepwater exploration wells in 2010.
GOM
Deepwater Developments
|
·
|
Fastball: Fastball
(Viosca Knoll 1003) commenced production in late 2009. This field is
currently producing 41 MMcf/d and 3,000 BOPD gross. We operate with a 66%
working interest.
|
|
·
|
Sargent: We
are currently developing Sargent (Garden Banks 339), which was a 2008
discovery with a single well tie back to existing infrastructure. We have
a 25% interest in this non-operated development and expect first
production in April 2010.
|
|
·
|
Gladden: In
December 2009, we gained an additional 10% interest in our Gladden
development through a trade for our remaining interest in the Anduin West
development (Mississippi Canyon 754). Gladden (Mississippi Canyon 800) is
expected to commence production in late 2010. We operate with a 57.5%
working interest.
|
8
|
·
|
Dalmatian:
The Dalmatian development (DeSoto Canyon 48) is underway with first
production expected in 2011. Newfield has a 37.5% non-operated interest in
this development. Additional exploration opportunities exist around
Dalmatian.
|
|
·
|
Pyrenees: In
mid-2009, we announced a significant operated discovery at Pyrenees
(Garden Banks 293). Development of the field is underway with first
production expected in late 2011. Additional drilling prospects remain on
an 11-block area around Pyrenees. We operate the development with a 40%
working interest.
|
2010
GOM Deepwater Exploration
Our 2010
planned exploration wells in the deepwater GOM are shown below:
Saluki
prospect: Our operated Saluki prospect (Garden Banks 425) will spud in late
February 2010. We have recently taken additional partners in the well and will
have a 50% working interest (35% cost interest). The prospect is located in
close proximity to our Pyrenees development.
Axe:
Located in close proximity to our outside-operated Dalmatian development, Axe
(DeSoto Canyon 4) is expected to spud in March 2010. We will have a 23%
non-operated interest in Axe.
We expect
to drill 1-2 additional deepwater prospects in 2010, including Lyell (Green
Canyon 551) where we have a 25% substantially-carried interest.
INTERNATIONAL
Our
international activities in 2010 will comprise about 15% of our planned capital
budget. Our activities are focused solely on our offshore Malaysia and China
assets (Bohai Bay and Pearl River Mouth Basin). Our production from our
international division was up 40% in 2009. It is expected to decline in 2010,
but will grow significantly in 2011 and 2012 due to new field
developments.
Malaysia
Total
liftings from Malaysia in 2009 totaled 5.3 MMBbls, or 14,500 BOPD (net). Our
production benefitted from new developments East Belumut and Chermingat, located
on PM 323.
East Belumut and
Chermingat – In late 2009, we accelerated planned development drilling in
our East Belumut field, offshore Malaysia. We are now drilling our sixth of
seven planned development wells from an existing platform. The program is
expected to add approximately 1 MMBbls of incremental oil production in 2010 due
to its accelerated timing. Our interest in PM 323, which we operate, is
approximately 60%.
9
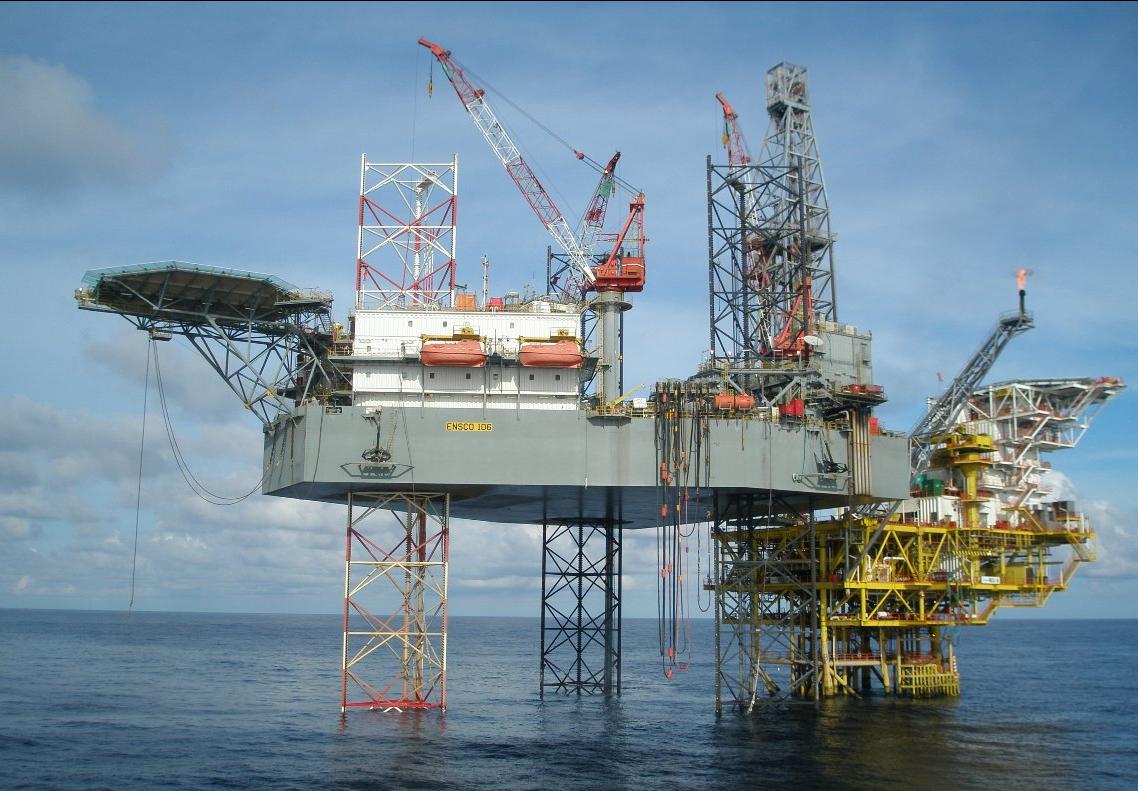
Phase
II drilling operations on Newfield’s East Belumut platform
Horizontal drilling is not only
applied in U.S. resource plays… in fact, we have been increasing our
lateral lengths overseas, as well. Our development wells in the East Belumut
field are all horizontal wells and recent completions are nearly
6,000’.
China
Our Bohai
Bay production is approximately 2,500 BOPD net. We have a 12% non-operated
interest in a unit where more than 20 planned development wells are expected to
be drilled during 2010.
In the
Pearl River Mouth Basin, our recent Jade exploration test was unsuccessful. The
dry hole was drilled to test a fault separated structure approximately 10 miles
northeast of our Pearl discovery. The well was drilled for approximately $10
million and material exploration opportunities remain in the area.
Our
operated Pearl development is underway with first production expected in late
2012. We recently completed the first phase of the regulatory approval process,
which we anticipate be concluded by the end of 2010.
We have two additional exploration
wells planned offshore China in 2010.
10
FIRST
QUARTER 2010 ESTIMATES
|
1Q10
Estimates
|
||||||||||||
|
Domestic
|
Int’l
|
Total
|
||||||||||
|
Production/Liftings
|
||||||||||||
|
Natural
gas – Bcf
|
45.6 – 50.4 | – | 45.6 – 50.4 | |||||||||
|
Oil
and condensate – MMBbls
|
1.6 – 1.7 | 1.3 – 1.4 | 2.9 – 3.1 | |||||||||
|
Total
Bcfe
|
54.9 – 60.7 | 7.7 – 8.5 | 62.6 – 69.2 | |||||||||
|
Average
Realized Prices
|
||||||||||||
|
Natural
gas – $/Mcf
|
Note
1
|
|||||||||||
|
Oil
and condensate – $/Bbl
|
Note
2
|
Note
3
|
||||||||||
|
Mcf
equivalent – $/Mcfe
|
||||||||||||
|
Operating
Expenses:
|
||||||||||||
|
Lease
operating
|
||||||||||||
|
Recurring
($MM)
|
$ | 54.9 - $60.7 | $ | 14.2 - $15.7 | $ | 69.1 - $76.4 | ||||||
|
per/Mcfe
|
$ | 1.01 - $1.03 | $ | 1.82 - $1.86 | $ | 1.11 - $1.13 | ||||||
|
Major
(workover, repairs, etc.) ($MM)
|
$ | 9.1 - $10.1 | $ | 0.4 - $0.5 | $ | 9.5 - $10.5 | ||||||
|
per/Mcfe
|
$ | 0.16 - $0.17 | $ | 0.04 - $0.05 | $ | 0.15 - $0.16 | ||||||
|
Production and other taxes
($MM)Note
4
|
$ | 17.1 - $18.9 | $ | 11.7 - $12.9 | $ | 28.8 - $31.8 | ||||||
|
per/Mcfe
|
$ | 0.31 - $0.32 | $ | 1.50 - $1.53 | $ | 0.46 - $0.47 | ||||||
|
General and administrative
(G&A), net ($MM)
|
$ | 34.2 - $37.8 | $ | 1.1 - $1.2 | $ | 35.3 - $39.0 | ||||||
|
per/Mcfe
|
$ | 0.63 - $0.64 | $ | 0.14 - $0.15 | $ | 0.57 - $0.58 | ||||||
|
Capitalized
internal costs ($MM)
|
$ | (19.4 - $21.5 | ) | |||||||||
|
per/Mcfe
|
$ | (0.31 - $0.32 | ) | |||||||||
|
Interest
expense ($MM)
|
$ | 39.0 - $43.1 | ||||||||||
|
per/Mcfe
|
$ | 0.62 - $0.64 | ||||||||||
|
Capitalized
interest ($MM)
|
$ | (11.5 - $12.7 | ) | |||||||||
|
per/Mcfe
|
$ | (0.18 - $0.19 | ) | |||||||||
|
Tax
rate (%)Note
5
|
35% - 37 | % | ||||||||||
|
Income
taxes (%)
|
||||||||||||
|
Current
|
14% - 16 | % | ||||||||||
|
Deferred
|
84% - 86 | % | ||||||||||
|
Note
1: The price that we receive for natural gas production from the Gulf of
Mexico and onshore Gulf Coast, after basis differentials, transportation
and handling charges, typically averages $0.25 - $0.50 per MMBtu less than
the Henry Hub Index. Realized natural gas prices for our
Mid-Continent properties, after basis differentials, transportation and
handling charges, typically average 85-90% of the Henry Hub
Index.
Note
2: The price we receive for our Gulf Coast oil production typically
averages about 90-95% of the NYMEX West Texas Intermediate (WTI) price.
The price we receive for our oil production in the Rocky Mountains is
currently averaging about $12-$14 per barrel below the WTI price. Oil
production from our Mid-Continent properties typically averages 80-85% of
the WTI price.
Note
3: Oil sales from our operations in Malaysia typically sell at a slight
discount to Tapis, or about 90-95% of WTI. Oil sales from our operations
in China typically sell at $4-$6 per barrel less than the WTI
price.
Note
4: Guidance for production taxes determined using $70/Bbl oil and
$5.50/MMBtu gas.
Note
5: Tax rate applied to earnings excluding unrealized gains or losses
on commodity derivatives.
|
||||||||||||
11
NATURAL GAS HEDGE
POSITIONS
Please
see the tables below for our complete hedging positions.
The
following hedge positions for the first quarter of 2010 and beyond are as of
February 15, 2010:
First Quarter
2010
|
Weighted
Average
|
Range
|
|||||||||||||||||||
|
Volume
|
Fixed
|
Floors
|
Collars
|
Floor
|
Ceiling
|
|||||||||||||||
|
31,800
MMMBtus
|
$ | 6.79 | — | — | — | — | ||||||||||||||
|
5,700
MMMBtus
|
— | — | $ | 8.50 — $10.44 | $ | 8.50 | $ | 10.00 — $11.00 | ||||||||||||
Second Quarter
2010
|
Weighted
Average
|
Range
|
|||||||||||||||||||
|
Volume
|
Fixed
|
Floors
|
Collars
|
Floor
|
Ceiling
|
|||||||||||||||
|
34,850
MMMBtus
|
$ | 6.41 | — | — | — | — | ||||||||||||||
Third Quarter
2010
|
Weighted
Average
|
Range
|
|||||||||||||||||||
|
Volume
|
Fixed
|
Floors
|
Collars
|
Floor
|
Ceiling
|
|||||||||||||||
|
35,200
MMMBtus
|
$ | 6.41 | — | — | — | — | ||||||||||||||
Fourth Quarter
2010
|
Weighted
Average
|
Range
|
|||||||||||||||||||
|
Volume
|
Fixed
|
Floors
|
Collars
|
Floor
|
Ceiling
|
|||||||||||||||
|
28,320
MMMBtus
|
$ | 6.49 | — | — | — | — | ||||||||||||||
First Quarter
2011
|
Weighted
Average
|
Range
|
|||||||||||||||||||
|
Volume
|
Fixed
|
Floors
|
Collars
|
Floor
|
Ceiling
|
|||||||||||||||
|
18,900
MMMBtus
|
$ | 6.55 | — | — | — | — | ||||||||||||||
|
9,900
MMMBtus*
|
— | — | $ | 6.00 — $7.91 | $ | 6.00 | $ | 7.75 — $8.03 | ||||||||||||
Second Quarter
2011
|
Weighted
Average
|
Range
|
|||||||||||||||||||
|
Volume
|
Fixed
|
Floors
|
Collars
|
Floor
|
Ceiling
|
|||||||||||||||
|
19,110
MMMBtus
|
$ | 6.55 | — | — | — | — | ||||||||||||||
|
10,010
MMMBtus*
|
— | — | $ | 6.00 — $7.91 | $ | 6.00 | $ | 7.75 — $8.03 | ||||||||||||
Third Quarter
2011
|
Weighted
Average
|
Range
|
|||||||||||||||||||
|
Volume
|
Fixed
|
Floors
|
Collars
|
Floor
|
Ceiling
|
|||||||||||||||
|
19,320
MMMBtus
|
$ | 6.55 | — | — | — | — | ||||||||||||||
|
10,120
MMMBtus*
|
— | — | $ | 6.00 — $7.91 | $ | 6.00 | $ | 7.75 — $8.03 | ||||||||||||
Fourth Quarter
2011
|
Weighted
Average
|
Range
|
|||||||||||||||||||
|
Volume
|
Fixed
|
Floors
|
Collars
|
Floor
|
Ceiling
|
|||||||||||||||
|
6,510
MMMBtus
|
$ | 6.55 | — | — | — | — | ||||||||||||||
|
8,290
MMMBtus*
|
— | — | $ | 6.00 — $7.94 | $ | 6.00 | $ | 7.75 — $8.03 | ||||||||||||
*These 3-way collar contracts
are standard natural gas collar contracts with respect to the periods, volumes
and prices stated above. The contracts have floor and ceiling prices per MMMBtu
as per the table above until the price drops below a weighted average price of
$4.50 per MMMBtu. Below $4.50 per MMMBtu, these contracts effectively result in
realized prices that are on average $1.50 per MMMBtu higher than the cash price
that otherwise would have been realized.
12
The
following table details the expected impact to pre-tax income from the
settlement of our derivative contracts, outlined above, at various NYMEX gas
prices.
|
Gas
Prices
|
||||||||||||||||||||||||
| $ | 4.00 | $ | 5.00 | $ | 6.00 | $ | 7.00 | $ | 8.00 | $ | 9.00 | |||||||||||||
|
2010
|
||||||||||||||||||||||||
|
1st
Quarter
|
$ | 114 | $ | 77 | $ | 40 | $ | 2 | $ | (35 | ) | $ | (70 | ) | ||||||||||
|
2nd
Quarter
|
$ | 84 | $ | 49 | $ | 14 | $ | (21 | ) | $ | (56 | ) | $ | (91 | ) | |||||||||
|
3rd
Quarter
|
$ | 85 | $ | 49 | $ | 14 | $ | (21 | ) | $ | (56 | ) | $ | (91 | ) | |||||||||
|
4th
Quarter
|
$ | 70 | $ | 43 | $ | 14 | $ | (14 | ) | $ | (43 | ) | $ | (71 | ) | |||||||||
|
Total
2010
|
$ | 353 | $ | 218 | $ | 82 | $ | (54 | ) | $ | (190 | ) | $ | (323 | ) | |||||||||
|
2011
|
||||||||||||||||||||||||
|
1st
Quarter
|
$ | 63 | $ | 39 | $ | 10 | $ | (8 | ) | $ | (28 | ) | $ | (57 | ) | |||||||||
|
2nd
Quarter
|
$ | 64 | $ | 40 | $ | 10 | $ | (9 | ) | $ | (29 | ) | $ | (58 | ) | |||||||||
|
3rd
Quarter
|
$ | 64 | $ | 40 | $ | 11 | $ | (9 | ) | $ | (29 | ) | $ | (58 | ) | |||||||||
|
4th
Quarter
|
$ | 29 | $ | 18 | $ | 4 | $ | (3 | ) | $ | (10 | ) | $ | (25 | ) | |||||||||
|
Total
2011
|
$ | 220 | $ | 137 | $ | 35 | $ | (29 | ) | $ | (96 | ) | $ | (198 | ) | |||||||||
In the Rocky Mountains, we
hedged basis associated with approximately 15 Bcf of our natural gas production
from January 2010 through December 2012 to lock in the differential at a
weighted average of $0.95 per MMBtu less than the Henry Hub Index. In
total, this hedge and the 8,000 MMBtu per day we have sold on a fixed physical
basis for the same period results in an average basis hedge of $0.95 per
MMBtu.
In the Mid-Continent, we
hedged basis associated with approximately 12 Bcf of our anticipated
Stiles/Britt Ranch natural gas production from January 2010 through August
2011. In total, this hedge and the 30,000 MMBtu per day we have sold
on a fixed physical basis for the same period results in an average basis hedge
of $0.52 per MMBtu. We have also hedged basis associated with
approximately 23 Bcf of our natural gas production from this area for the period
September 2011 through December 2012 at an average of $0.55 per
MMBtu.
Approximately 12% of our
natural gas production correlates to Houston Ship Channel, 13% to Columbia Gulf,
13% to Texas Gas Zone 1, 9% to Southern Natural Gas, 9% to Tenn 100, 5% to
CenterPoint/East, 22% to Panhandle Eastern Pipeline, 6% to Waha, 6% to Colorado
Interstate, and 5% to others.
CRUDE
OIL HEDGE POSITIONS
The
following hedge positions for the first quarter of 2010 and beyond are as of
February 15, 2010:
First Quarter
2010
|
Weighted
Average
|
Range
|
|||||||||||||||||||
|
Volume
|
Fixed
|
Floors
|
Collars
|
Floor
|
Ceiling
|
|||||||||||||||
|
90,000 Bbls
|
$ | 93.40 | — | — | — | — | ||||||||||||||
|
810,000
Bbls
|
— | — | $ | 127.97— $170.00 | $ | 125.50 — $130.50 | $ | 170.00 | ||||||||||||
|
360,000
Bbls*
|
— | — | $ | 67.50 — $106.28 | $ | 60.00 — $75.00 | $ | 100.00 —$112.10 | ||||||||||||
Second Quarter
2010
|
Weighted
Average
|
Range
|
|||||||||||||||||||
|
Volume
|
Fixed
|
Floors
|
Collars
|
Floor
|
Ceiling
|
|||||||||||||||
|
90,000 Bbls
|
$ | 93.40 | — | — | — | — | ||||||||||||||
|
819,000
Bbls
|
— | — | $ | 127.97— $170.00 | $ | 125.50 — $130.50 | $ | 170.00 | ||||||||||||
|
364,000
Bbls*
|
— | — | $ | 67.50 — $106.28 | $ | 60.00 — $75.00 | $ | 100.00 —$112.10 | ||||||||||||
13
Third Quarter
2010
|
Weighted
Average
|
Range
|
|||||||||||||||||||
|
Volume
|
Fixed
|
Floors
|
Collars
|
Floor
|
Ceiling
|
|||||||||||||||
|
90,000 Bbls
|
$ | 93.40 | — | — | — | — | ||||||||||||||
|
828,000
Bbls
|
— | — | $ | 127.97— $170.00 | $ | 125.50 — $130.50 | $ | 170.00 | ||||||||||||
|
368,000
Bbls*
|
— | — | $ | 67.50 — $106.28 | $ | 60.00 — $75.00 | $ | 100.00 —$112.10 | ||||||||||||
Fourth Quarter
2010
|
Weighted
Average
|
Range
|
|||||||||||||||||||
|
Volume
|
Fixed
|
Floors
|
Collars
|
Floor
|
Ceiling
|
|||||||||||||||
|
90,000 Bbls
|
$ | 93.40 | — | — | — | — | ||||||||||||||
|
828,000
Bbls
|
— | — | $ | 127.97— $170.00 | $ | 125.50 — $130.50 | $ | 170.00 | ||||||||||||
|
368,000
Bbls*
|
— | — | $ | 67.50 — $106.28 | $ | 60.00 — $75.00 | $ | 100.00 —$112.10 | ||||||||||||
First Quarter
2011
|
Weighted
Average
|
Range
|
|||||||||||||||||||
|
Volume
|
Fixed
|
Floors
|
Collars
|
Floor
|
Ceiling
|
|||||||||||||||
|
360,000
Bbls*
|
— | — | $ | 77.50 — $119.94 | $ | 75.00 — $80.00 | $ | 118.50—$121.50 | ||||||||||||
Second Quarter
2011
|
Weighted
Average
|
Range
|
|||||||||||||||||||
|
Volume
|
Fixed
|
Floors
|
Collars
|
Floor
|
Ceiling
|
|||||||||||||||
|
364,000
Bbls*
|
— | — | $ | 77.50 — $119.94 | $ | 75.00 — $80.00 | $ | 118.50—$121.50 | ||||||||||||
Third Quarter
2011
|
Weighted
Average
|
Range
|
|||||||||||||||||||
|
Volume
|
Fixed
|
Floors
|
Collars
|
Floor
|
Ceiling
|
|||||||||||||||
|
368,000
Bbls*
|
— | — | $ | 77.50 — $119.94 | $ | 75.00 — $80.00 | $ | 118.50—$121.50 | ||||||||||||
Fourth Quarter
2011
|
Weighted
Average
|
Range
|
|||||||||||||||||||
|
Volume
|
Fixed
|
Floors
|
Collars
|
Floor
|
Ceiling
|
|||||||||||||||
|
368,000
Bbls*
|
— | — | $ | 77.50 — $119.94 | $ | 75.00 — $80.00 | $ | 118.50—$121.50 | ||||||||||||
*These
3-way collar contracts are standard crude oil collar contracts with respect to
the periods, volumes and prices stated above. The contracts have floor and
ceiling prices per Bbl as per the table above until the price drops below a
weighted average price of $58.75 per Bbl. Below $58.75 per Bbl, these contracts
effectively result in realized prices that are on average $13.75 per Bbl higher
than the cash price that otherwise would have been realized.
The following table details the
expected impact to pre-tax income from the settlement of our derivative
contracts, outlined above, at various NYMEX oil prices, net of premiums paid for
these contracts (in millions).
|
Oil
Prices
|
||||||||||||||||||||||||||||
| $ | 40.00 | $ | 50.00 | $ | 60.00 | $ | 70.00 | $ | 80.00 | $ | 90.00 | $ | 100.00 | |||||||||||||||
|
2010
|
||||||||||||||||||||||||||||
|
1st
Quarter
|
$ | 73 | $ | 64 | $ | 53 | $ | 43 | $ | 33 | $ | 23 | $ | 14 | ||||||||||||||
|
2nd
Quarter
|
$ | 74 | $ | 65 | $ | 54 | $ | 43 | $ | 33 | $ | 24 | $ | 15 | ||||||||||||||
|
3rd
Quarter
|
$ | 74 | $ | 65 | $ | 54 | $ | 43 | $ | 33 | $ | 24 | $ | 15 | ||||||||||||||
|
4th
Quarter
|
$ | 75 | $ | 65 | $ | 54 | $ | 43 | $ | 33 | $ | 24 | $ | 15 | ||||||||||||||
|
Total
2010
|
$ | 296 | $ | 259 | $ | 215 | $ | 172 | $ | 132 | $ | 95 | $ | 59 | ||||||||||||||
|
2011
|
||||||||||||||||||||||||||||
|
1st
Quarter
|
$ | 5 | $ | 5 | $ | 5 | $ | 2 | $ | - | $ | - | $ | - | ||||||||||||||
|
2nd
Quarter
|
$ | 5 | $ | 5 | $ | 5 | $ | 3 | $ | - | $ | - | $ | - | ||||||||||||||
|
3rd
Quarter
|
$ | 6 | $ | 6 | $ | 6 | $ | 3 | $ | - | $ | - | $ | - | ||||||||||||||
|
4th
Quarter
|
$ | 6 | $ | 6 | $ | 6 | $ | 3 | $ | - | $ | - | $ | - | ||||||||||||||
|
Total
2011
|
$ | 22 | $ | 22 | $ | 22 | $ | 11 | $ | - | $ | - | $ | - | ||||||||||||||
14
We
provide information regarding our outstanding hedging positions in our annual
and quarterly reports filed with the SEC and in our electronic publication --
@NFX. This publication can be found on Newfield’s web page at
http://www.newfield.com. Through the web page, you may elect to receive @NFX
through e-mail distribution.
Newfield
Exploration Company is an independent crude oil and natural gas exploration and
production company. The Company relies on a proven growth strategy of growing
reserves through the drilling of a balanced risk/reward portfolio and select
acquisitions. Newfield's domestic areas of operation include the U.S. onshore
Gulf Coast, the Anadarko and Arkoma Basins of the Mid-Continent, the Rocky
Mountains and the Gulf of Mexico. The Company has international operations in
Malaysia and China.
**This
publication contains forward-looking information. All information other than
historical facts included in this publication, such as information regarding
estimated or anticipated first quarter 2010 results, estimated capital
expenditures, cash flow, production and cost reductions, drilling and
development plans and the timing of activities, is forward-looking information.
Although Newfield believes that these expectations are reasonable, this
information is based upon assumptions and anticipated results that are subject
to numerous uncertainties and risks. Actual results may vary significantly from
those anticipated due to many factors, including drilling results, oil and gas
prices, industry conditions, the prices of goods and services, the availability
of drilling rigs and other support services, the availability of refining
capacity for the crude oil Newfield produces from its Monument Butte field in
Utah, the availability and cost of capital resources, labor conditions and
severe weather conditions (such as hurricanes). In addition, the drilling of oil
and gas wells and the production of hydrocarbons are subject to governmental
regulations and operating risks.
15