Attached files
| file | filename |
|---|---|
| EX-23 - EXHIBIT 23 - IMS HEALTH INC | a2196431zex-23.htm |
| EX-21 - EXHIBIT 21 - IMS HEALTH INC | a2196431zex-21.htm |
| EX-31.1 - EXHIBIT 31.1 - IMS HEALTH INC | a2196431zex-31_1.htm |
| EX-32.1 - EXHIBIT 32.1 - IMS HEALTH INC | a2196431zex-32_1.htm |
| EX-31.2 - EXHIBIT 31.2 - IMS HEALTH INC | a2196431zex-31_2.htm |
UNITED STATES
SECURITIES AND EXCHANGE COMMISSION
WASHINGTON, D.C. 20549
FORM 10-K
ý |
ANNUAL REPORT PURSUANT TO SECTION 13 OR 15(d) OF THE SECURITIES EXCHANGE ACT OF 1934 |
|
For the fiscal year ended December 31, 2009 |
||
OR |
||
o |
TRANSITION REPORT PURSUANT TO SECTION 13 OR 15(d) OF THE SECURITIES EXCHANGE ACT OF 1934 |
|
For the transition period from to |
||
Commission file number: 001-14049

IMS Health Incorporated
(Exact name of registrant as specified in its charter)
| Delaware (State or other jurisdiction of incorporation or organization) |
06-1506026 (I.R.S. Employer Identification No.) |
|
901 Main Avenue, Norwalk, Connecticut (Address of principal executive offices) |
06851 (Zip Code) |
|
(203) 845-5200 (Registrant's telephone number, including area code) |
||
(Former name, former address and former fiscal year, if changed since last report)
Securities registered pursuant to Section 12(b) of the Act:
| Title of each class | Name of each exchange on which registered | |
|---|---|---|
| Common Stock, $.01 par value per share | New York Stock Exchange |
Securities registered pursuant to Section 12(g) of the Act: None
Indicate by check mark if the registrant is a well-known seasoned issuer, as defined in Rule 405 of the Securities Act. Yes ý No o
Indicate by check mark if the registrant is not required to file reports pursuant to Section 13 or Section 15(d) of the Exchange Act. Yes o No ý
Indicate by check mark whether the registrant (1) has filed all reports required to be filed by Section 13 or 15(d) of the Securities Exchange Act of 1934 during the preceding 12 months (or for such shorter period that the registrant was required to file such reports), and (2) has been subject to such filing requirements for the past 90 days. Yes ý No o
Indicate by check mark whether the registrant has submitted electronically and posted on its corporate Web site, if any, every Interactive Data File required to be submitted and posted pursuant to Rule 405 of Regulation S-T (Section 232.405 of this chapter) during the preceding 12 months (or for such shorter period that the registrant was required to submit and post such files). Yes o No o
Indicate by check mark if disclosure of delinquent filers pursuant to Item 405 of Regulation S-K is not contained herein, and will not be contained, to the best of registrant's knowledge, in definitive proxy or information statements incorporated by reference in Part III of this Form 10-K or any amendment to this Form 10-K. ý
Indicate by check mark whether the registrant is a large accelerated filer, an accelerated filer, a non-accelerated filer, or a smaller reporting company. See the definitions of "large accelerated filer", "accelerated filer" and "smaller reporting company" in Rule 12b-2 of the Exchange Act.
| Large accelerated filer ý | Accelerated filer o | Non-accelerated filer o (Do not check if a smaller reporting company) |
Smaller reporting company o |
Indicate by check mark whether the registrant is a shell company (as defined in Rule 12b-2 of the Exchange Act). Yes o No ý
As of June 30, 2009, the aggregate market value of the registrant's Common Stock held by non-affiliates of the registrant was approximately $2,316 million based on the closing transaction price on the New York Stock Exchange Composite Tape.
Indicate the number of shares outstanding of each of the issuer's classes of Common Stock, as of the latest practicable date.
| Class | Outstanding at February 12, 2010 | |
|---|---|---|
Common Stock, $.01 par value per share |
183,222,336 shares |
DOCUMENTS INCORPORATED BY REFERENCE
None.
The Index to Exhibits is located on Pages 183 to 195.
Except where the context indicates otherwise, when we use the terms "IMS," "Company," "we," "us" and "our," we mean IMS Health Incorporated and all subsidiaries consolidated in the financial statements contained or incorporated by reference herein. Dollars in thousands, except per share data.
IMS is the leading global provider of market intelligence to the pharmaceutical and healthcare industries. We offer leading-edge market intelligence products and services that are integral to our clients' day-to-day operations, including product and portfolio management capabilities; commercial effectiveness innovations; managed care and consumer health offerings; and consulting and services solutions that improve productivity and the delivery of quality healthcare worldwide. Our information products are developed to meet client needs by using data secured from a worldwide network of suppliers in more than 100 countries. Our business lines are:
- •
- Commercial Effectiveness to increase clients' productivity across end-to-end sales, marketing,
promotional and performance management processes;
- •
- Product and Portfolio Management to provide clients with insights into market measurement so they can optimize their
product portfolio and strategies; and
- •
- New Business Areas that support pharmaceutical client business initiatives in managed markets, consumer health, and pricing and market access, and that also serve payer and government audiences.
Within these business lines, we provide consulting and services that use in-house capabilities and methodologies to assist clients in analyzing and evaluating market trends, strategies and tactics, and to help in the development and implementation of customized software applications and data warehouse tools.
IMS was incorporated under the laws of the State of Delaware in 1998 and we operate in more than 100 countries.
Segment financial information, including financial information about domestic and foreign generated revenue, is set forth in Note 18 to the Consolidated Financial Statements in Part II, Item 8 of this Annual Report on Form 10-K.
Additional information regarding changes to and the development of our business is contained in "Management's Discussion and Analysis of Financial Condition and Results of Operations," "Quantitative and Qualitative Disclosures about Market Risk" and in the Notes to the Consolidated Financial Statements in Part II, Items 7, 7A and 8 of this Annual Report on Form 10-K.
We provide critical business intelligence, including information, analytics and consulting services to the pharmaceutical and healthcare industries worldwide. Our market intelligence products and services serve our clients' needs which we group into three broad areas: commercial effectiveness, product and portfolio management, and new business areas. We provide information services covering more than 100 countries and maintain offices in 75 countries on six continents, with approximately 63% of our total 2009 revenue generated outside the U.S.
On November 5, 2009, we entered into an Agreement and Plan of Merger (the "Merger Agreement") with Healthcare Technology Holdings, Inc., a Delaware corporation ("Parent"), and Healthcare Technology Acquisition, Inc., a Delaware corporation and wholly owned subsidiary of Parent
3
("Merger Sub"), providing for the merger of Merger Sub with and into IMS (the "Merger"), with IMS surviving the Merger as a wholly owned subsidiary of Parent. Parent and Merger Sub are affiliates of TPG Capital, L.P. ("TPG") and Canada Pension Plan Investment Board ("CPPIB").
On February 8, 2010, a special meeting of our stockholders was held (the "Special Meeting"). At the Special Meeting our stockholders approved the proposal presented at the Special Meeting to adopt the Merger Agreement.
At the effective time of the Merger, each share of our Common Stock issued and outstanding (except for certain shares held by Parent, us and certain of our subsidiaries, and shares held by stockholders who have properly demanded appraisal rights) will convert into the right to receive the per share Merger consideration of $22.00 in cash, without interest, less any applicable withholding taxes.
The respective obligations of IMS, Parent and Merger Sub to consummate the Merger are subject to the satisfaction or waiver of certain customary conditions, including without limitation the absence of any law enacted, issued, enforced or entered by any court or governmental entity of competent jurisdiction that restrains, enjoins or otherwise prohibits the consummation of the Merger or otherwise makes consummation of the Merger illegal, the accuracy of representations and warranties (subject to customary materiality qualifiers) made by the parties to the Merger Agreement, and compliance, in all material respects, with the parties' respective covenants and agreements contained in the Merger Agreement at or prior to the date of the closing of the Merger. The consummation of the Merger is subject to certain other conditions which, as of the date of this Annual Report on Form 10-K, have been satisfied. Completion of the Merger is expected to occur by the end of the first quarter of 2010.
We anticipate that the total funds needed to complete the Merger will be approximately $5,900,000. We expect this amount to be funded through a combination of:
- •
- equity financing of approximately $2,800,000 to be provided or secured by investment funds affiliated with TPG and a
wholly owned subsidiary of CPPIB, or other parties to whom they assign a portion of their commitments;
- •
- a $2,000,000 senior secured term loan facility;
- •
- the issuance of $1,000,000 in principal amount of senior unsecured notes (supplemented, if some or all of those notes
cannot be sold at closing, by a senior unsecured term loan facility); and
- •
- approximately $100,000 of cash on hand of IMS.
Parent has obtained equity and debt financing commitments. The funding under those commitments is subject to conditions, including conditions that do not relate directly to the Merger Agreement.
Pursuant to a limited guarantee delivered by TPG Partners V, L.P., TPG Partners VI, L.P. and CPP Investment Board Private Holdings Inc. (collectively, the "Guarantors") in favor of IMS, dated November 5, 2009, the Guarantors have agreed to guarantee, severally but not jointly, the due and punctual performance and discharge of the obligations of Parent and Merger Sub under the Merger Agreement to pay a termination fee of $275,000 to us, as and when due, the direct expenses incurred by Parent or Merger Sub in connection with the arrangement of the financing of the Merger, and certain reimbursement obligations of Parent and Merger Sub with respect to IMS, which direct expenses and reimbursement obligations shall not in the aggregate exceed $6,000.
The Merger Agreement contains certain termination rights for IMS and Parent. If the Merger Agreement is terminated, under certain specified circumstances in the Merger Agreement, we may be required to pay a termination fee equal to $115,000, in addition to reimbursing Parent for all out-of-pocket fees and expenses incurred by Parent or Merger Sub in connection with the Merger Agreement or the transactions contemplated therein up to $5,000. In the event we terminate the Merger Agreement due to certain actions or inactions by Parent, Parent must pay us a fee of $275,000,
4
less the sum of amounts paid by Parent with respect to Parent's liability for certain reimbursement obligations and certain direct expenses incurred by Parent in connection with the financing up to $6,000 in the aggregate.
For further information regarding the Merger Agreement, please refer to the Merger Agreement and the Definitive Proxy Statement on Schedule 14A filed with the U.S. Securities and Exchange Commission ("SEC") by IMS on December 29, 2009, which are incorporated by reference as exhibits to this Annual Report on Form 10-K.
Factual disclosures about IMS contained in this Annual Report on Form 10-K or in our other public reports filed with the SEC may supplement, update or modify the factual disclosures about IMS contained in the Merger Agreement and the Definitive Proxy Statement on Schedule 14A filed with the SEC by IMS on December 29, 2009. The representations, warranties and covenants made in the Merger Agreement by IMS, Parent and Merger Sub were qualified and subject to important limitations agreed to by IMS, Parent and Merger Sub in connection with negotiating the terms of the Merger Agreement. In particular, the representations and warranties were negotiated with the principal purposes of establishing the circumstances in which a party to the Merger Agreement may have the right not to close the Merger if the representations and warranties of the other party prove to be untrue due to a change in circumstance or otherwise, and allocating risk between the parties to the Merger Agreement, rather than establishing matters as facts. The representations and warranties may also be subject to a contractual standard of materiality different from those generally applicable to stockholders and reports and documents filed with the SEC and in some cases were qualified by disclosures that were made by each party to the other, which disclosures were not reflected in the Merger Agreement. Moreover, information concerning the subject matter of the representations and warranties, which do not purport to be accurate as of the date of this Annual Report on Form 10-K, may have changed since the date of the Merger Agreement and subsequent developments or new information qualifying a representation or warranty may have been included in this Annual Report on Form 10-K.
COMMERCIAL EFFECTIVENESS OFFERINGS. Our Commercial Effectiveness Offerings represented approximately 51% of our worldwide revenue in 2009. Using a total solutions approach, IMS Commercial Effectiveness drives smart business decisions, shapes sales management and marketing strategies, and supports sales processes. Offering actionable insight for markets worldwide, services within the Commercial Effectiveness business area provide in-depth intelligence that supports the planning, development and execution of critical business processes, including segmentation, sales force sizing and deployment, performance assessment and compensation, and territory management.
Commercial Effectiveness Offerings provide our clients with valuable insight as to which physicians are seeing significant numbers of patients that are likely to benefit from a specific therapy. These innovative solutions facilitate the optimization of market share and revenue potential using sub-national prescription patterns, easy-to-use access tools, and an array of consulting services. These capabilities enable fast and effective communication of vital information that can accelerate meaningful innovation, public safety news alerts in the event of inappropriate prescribing and drug recalls, as well as the appropriate distribution of samples. IMS Commercial Effectiveness informs critical business decisions and optimizes overall performance. Our Commercial Effectiveness Offerings provide the in-depth information, market intelligence and analysis that enhance the efficient allocation of resources in a manner that reduces cost and saves valuable time.
Our principal Commercial Effectiveness Offerings are as follows:
- •
- Sales Territory Reporting. Sales territory reporting is the principal sales management service that we offer to our pharmaceutical clients. Sales territory reports can be precisely tailored for each
5
- •
- Prescription Tracking
Reporting. Our prescription tracking reporting services are designed to monitor prescription activity and to track the movement of
pharmaceutical products out of retail channels. Prescription tracking services are used by pharmaceutical companies to facilitate product marketing at the prescriber level. In the U.S., our
Xponent® service monitors prescription activity from retail pharmacies, long-term care and mail service pharmacies using a patented statistical methodology to project the
prescription activity of nearly 1.4 million individual prescribers on a weekly and monthly basis. The European Xponent database is built from prescription data collected from retail pharmacies
and coding centers, which are linked to the geographical area in which the prescription was written. Xponent is available in over 10 countries. We also offer Early ViewTM, a sales
optimization solution, providing weekly prescriber level activity, highlighting competitive prescribing trends for clients' key prescribers directly to clients' sales representatives electronically.
- •
- Sales & Account Management Consulting and
Services. Our Sales & Account Management practice focuses on helping customers assess the effectiveness of their sales strategies
and better design and deploy their sales forces. Using evidence-based research, our offerings in this practice help clients better segment their customer base, determine the optimal size and structure
of their sales force based on that segmentation, and design call plans that optimally deploy the various sales resources across channels to better meet their customers' needs and increase their sales
force effectiveness. Our Information Management practice helps clients organize, integrate, warehouse and analyze valuable data assets from multiple sources. We also provide Client Services within
this business line. Along with product set-up, installation and implementation, Client Services provides customer training and a variety of ongoing, post-sales services.
- •
- Promotional Audits and Promotion Management
Consulting. Our promotional audits contain national estimates of pharmaceutical promotional activities for individual branded products,
including sales-force promotion and journal and mail advertising, based on information received from panels of physicians and from monitoring medical journals and direct mail. In the U.S., spending on
direct-to-consumer advertising is also measured. IMS currently publishes promotional audit reports covering approximately 10 countries and over 90% of the promoted markets.
This evidential information is used by our consulting teams to help clients evaluate and optimize the allocation and effectiveness of their promotional messages, mix and delivery around the globe.
- •
- Launch and Brand Management Offerings. We combine information, analytical tools and consulting and services to address client needs relevant to the management of each stage of the life cycle of their pharmaceutical brands. The areas covered include: brand planning, which helps clients with market assessment and forecasting, market segmentation and product positioning; promotion management, which helps clients measure, assess effectiveness and optimize promotion investment, channel mix and messaging; and, performance management, which helps clients measure diagnosis and optimization for new product launches and in-line brands.
client and measure the sales of a client's own products and those of competitors within specified geographical configurations. These reports are designed to provide marketing and sales managers with a reliable measurement of each salesperson's activity and effectiveness in his or her sales territory. Our sales territory reporting services cover more than 50 countries and are used by our customers for applications such as sales-force compensation, resource allocation, territory alignment, market analyses and distribution management. We make reports available to clients in a variety of frequencies, such as on a weekly, monthly and quarterly basis.
PRODUCT AND PORTFOLIO MANAGEMENT OFFERINGS. Product and Portfolio Management Offerings represented approximately 31% of our worldwide revenue in 2009. IMS Product and Portfolio Management provides customers with the intelligence and tools to identify and optimize
6
pharmaceutical product portfolios, including currently marketed products and the new product pipeline. Providing a comprehensive range of offerings, Product and Portfolio Management enables customers to evaluate, assess, understand, and implement strategies and tactics to improve bottom-line performance and set the course for the future. Integrating prescriptions, sales, disease/treatment, and industry intelligence, Product and Portfolio Management services provide a comprehensive picture of the worldwide market. From a national viewpoint down to regional and local level data, customers can complete a thorough market analysis, exploring all options to set the pace for brand leadership. Using in-depth business intelligence, analysis and forecasting, IMS offerings provide customers with the facts, interpretation and guidance to make the best portfolio optimization decisions.
Our principal Product and Portfolio Management Offerings include the following:
- •
- Pharmaceutical
Audits. These audits measure the sale of pharmaceutical products into pharmacies, supplemented in some countries by data collected from
dispensing physicians, retail chains and discount stores. These audits contain data projected to national estimates, showing product sales by therapeutic class broken down by package size and dosage
form. We publish pharmaceutical audits covering approximately 80 countries.
- •
- Medical
Audits. These audits are based on information collected from panels of practicing office-based physicians and contain projected national
estimates of the number of consultations for each diagnosed disease with details of the therapy prescribed. These audits also analyze the use physicians make of individual drugs by listing the
diseases for which they are prescribed, the potential therapeutic action the physician is expecting, other drugs prescribed at the same time, and estimates of the total number of drugs used for each
disease. We publish medical audits covering over 40 countries.
- •
- Hospital
Audits. These audits contain data projected to national and regional estimates and show the sale of pharmaceutical products to hospitals
by therapeutic class. Related reports provide audits of laboratory diagnostic supplies, hospital supplies and hospital records. We publish hospital audits covering approximately 50 countries.
- •
- Prescription
Audits. These audits contain projected national estimates of the rate at which drugs move out of the pharmacy and into the hands of the
consumer. They measure what is actually dispensed at the pharmacy. We publish prescription audits covering over 15 countries.
- •
- MIDAS®
Services. MIDAS is an on-line multinational integrated data analysis tool that harnesses our worldwide databases and is used
by the pharmaceutical industry to assess and analyze global pharmaceutical information and trends in multiple markets. Our MIDAS Quantum offering gives clients on-line access to
pharmaceutical, medical, promotional and chemical data that we compile. Using MIDAS Quantum, our clients are able to view information from the national databases compiled by us and produce statistical
reports in the format required by the client. MIDAS contains information covering more than 70 countries.
- •
- LifeLink
Services. These services provide longitudinal analyses of anonymized prescription and/or medical records. Clients use them to understand
detailed treatment patterns, disease progression, therapeutic switching and concomitant disease/treatments. We have LifeLink services in approximately 10 countries.
- •
- Oncology Analyzer and Consulting. Our Oncology Analyzer audit collects longitudinal patient information regarding the diagnosis and treatment in the critical area of Oncology across the major pharmaceutical markets. This information helps clients understand markets, treatment patterns and patient opportunities and is used by clients and by our consulting teams to help clients plan and execute successful market entry and life cycle management strategies for their Oncology franchises.
7
- •
- Forecasting
Portfolio. Our forecasting portfolio includes both syndicated and customizable, single or multi-country forecasts of 'demand' and/or
market performance for individual brands or therapy categories. These offerings bring together extensive analytical and methodological expertise from our consulting teams with the rich global
information assets of IMS to provide clients with accurate and long-term views of their portfolios.
- •
- Other Product and Portfolio Management
Reports. These include Market Research Publications including the Pharmaceutical World ReviewTM; personal care reports,
which estimate the sale of medical surgical device product purchases; and reports on bulk chemical shipments and molecules for research and development. We have developed, in certain countries,
disease and treatment information at the patient level (in which information is not identifiable at the individual patient level) that gives participants in the healthcare industry new insights into
the treatment of diseases. The availability, scope and frequency of the foregoing reports vary on a country-by-country basis.
- •
- Consulting & Services. Consultants in our Management Consulting group bring a unique mix to management of complex portfolios with deep expertise in key therapies and all aspects of pharmaceutical strategies. Product and Portfolio Strategy leverages the best cross functional understanding of scientific and commercial trends, deep competencies in decision theory and portfolio analysis, forecasting, competitive intelligence and industry thought leadership to help clients make strategic decisions. We help clients value difficult-to-value assets, gain clarity on a complex mix of decisions with a focused view of strategy, with emphasis on alternatives and risks in the face of uncertainty.
NEW BUSINESS AREAS. Offerings in New Business Areas represented approximately 18% of our worldwide revenue in 2009 and support pharmaceutical client business initiatives in managed markets, consumer health, and pricing and market access, and also serve payer and government audiences.
The principal offerings under the New Business Areas business line include:
- •
- Pricing and Market Access
Consulting. This portfolio of offerings has two main components, both of which provide clients with critical, relevant insights needed
to maximize the lifetime value of their brands and leverage the deep and rich information assets of IMS and, in particular, our LifeLink information.
- •
- Health Economics and Outcomes Research
Offerings. Our Health Economics and Outcomes Research Offerings help clients demonstrate the value of their medicines using our suite of
evidence-based health economic evaluations and real world outcomes on a globally consistent basis. Clients can access our LifeLink information to support product evaluations and help them maximize
market access.
- •
- Pricing and Reimbursement
Offerings. Through our consulting teams, we help clients to achieve optimal reimbursed prices for new products, ensuring the shortest
timeframe to market, which contribute to rapid and broad market penetration.
- •
- Managed Markets. Our Managed Markets Offerings provide an array of information and consulting insights to quantify the effects of managed markets on the pharmaceutical and healthcare industries. Managed Markets Offerings are used by clients to assist in evaluating the impact of managed markets on the pharmaceutical marketplace and in enhancing the performance of their products through better contracting strategies, formulary management and tracking, plan performance tracking and monitoring plan relationships with organizations, such as large medical groups, that may influence prescribing behavior. The types of reports include measurement of prescriptions at the plan level, formulary assessment and tracking, and tracking of prescription payment by type, such as cash, Medicaid or third-party payment. This service is
8
- •
- Consumer
Health. Our consumer health services provide detailed product movement, market share and pricing information for
over-the-counter, personal care, patient care and nutritional products. Consumer Health Offerings assist over-the-counter and pharmaceutical
manufacturers in understanding consumer purchasing dynamics and promotional impact, examining and assessing segmentation and sales force management, strategic business planning, market opportunity and
performance management. We publish reports on the global consumer health market and provide related services. PharmaTrend is our tracking service for consumer purchases of healthcare products.
- •
- Payer
Solutions. Our Payer Solutions offerings help clients deliver more cost-effective, efficient business processes by helping
them understand the actual practice and consumption of healthcare services. Our solution suite provides targeted intelligence in the following areas: Network Intelligence, Pharmacy Management, Medical
Management, Members Service and Informatics.
- •
- Government Solutions. We provide clients—including federal, state, and local government or regulatory agencies in the U.S.—with data, analytics, tools and services that facilitate healthcare operations and strategic decision making.
available both in the U.S. and Canada. In addition, to address emerging Medicare needs in the U.S., we make the following services available to our clients: strategic consulting, tactical consulting, rebate validation and performance evaluation. IMS also provides services that assist pharmaceutical clients with drug rebate data validation and adjudication of Managed Care and Medicare Part D contracts.
Over the past five decades, we generally have developed and maintained strong relationships with our data suppliers in each market in which we operate. We have historical connections with many of the relevant trade associations and professional associations, including for example, in the U.S., where we have been designated as a database licensee by the American Medical Association (referred to in this document as AMA) for use and sublicensing of the AMA's physician database. As the supply of pharmaceutical data is critical to our business, we devote significant human and financial resources to our data collection efforts.
Sales to traditional pharmaceutical companies accounted for approximately 85% of our revenue in 2009. All major pharmaceutical and biotechnology companies are our customers, and many of these companies subscribe to reports and services in several countries. Our customer base is broad in scope and enables us to avoid dependence on any single customer. None of our customers accounted for more than 7% of our gross revenues in 2009, 2008 or 2007.
While no competitor provides the geographical reach or breadth of our services, we generally compete in the countries in which we operate with other information services companies, as well as with the in-house capabilities of our customers. Generally, competition has arisen on a country-by-country basis. In Europe, certain of our services compete with those offered by competitors such as Taylor Nelson and Cegedim in various European countries, in addition to competition from smaller niche competitors in various local markets. In the U.S., certain of our sales management services, including our sales territory and prescription tracking reports, compete with the offerings of various companies, particularly Wolters Kluwer. Also, various companies compete with us in the U.S. with respect to our market research services, including SDI. Our consulting and services businesses compete with various consulting firms around the world. Service, quality, coverage and speed of delivery of information services and products are the principal differentiators in our markets.
9
We create, own and maintain a wide array of intellectual property assets which, in the aggregate, are of material importance to our business. Our intellectual property assets include patents and patent applications related to our innovations, products and services; trademarks related to our brands, products and services; copyrights in software and databases; trade secrets relating to data processing, statistical methodologies, editing and bridging techniques, business rules and other aspects of the IMS business; and other intellectual property rights and licenses of various kinds. We are licensed to use certain technology and other intellectual property rights owned and controlled by others, and similarly, other companies are licensed to use certain technology and other intellectual property rights owned and controlled by us.
We seek to protect our intellectual property assets through patent, copyright, trade secret, trademark and other laws of the U.S. and other jurisdictions, and through confidentiality procedures and contractual provisions. A patent generally has a term of twenty years from the time the full patent application is filed. As IMS builds a patent portfolio over time, the terms of individual patents will vary. While patents can help maintain the competitive differentiation of certain products and services and maximize the return on research and development investments, no single patent is in itself essential to the IMS business as a whole or any of our principal business segments. Further, in order to replace expiring patents and licenses or replace obsolete intellectual property, we obtain new intellectual property through a combination of our ongoing research and development activities, acquisitions of other companies and licensing of intellectual property from third parties. We enter into confidentiality and invention assignment agreements with employees and contractors, and non-disclosure agreements with third parties with whom we conduct business, in order to secure ownership rights to, limit access to, and restrict disclosure of our proprietary information.
The technology and other intellectual property rights owned and licensed by us are of importance to our business, although our management believes that our business, as a whole, is not dependent upon any one intellectual property or group of such properties. We consider the IMS trademark and related names, marks and logos to be of material importance to our business, and we have registered these trademarks in the U.S. and other jurisdictions and aggressively seek to protect them.
The names of our products and services referred to in this document are trademarks, service marks, registered trademarks or registered service marks owned by or licensed to us.
We had approximately 7,250 employees worldwide as of December 31, 2009. Almost all of these employees are full-time. None of our U.S. employees are represented by a union. In Belgium, France, Germany, Italy, the Netherlands and Spain, we have Works Councils, which are a legal requirement in those countries. We also have a European Works Council, which is a requirement under European Union laws. Management considers its relations with our employees to be good and to have been maintained in a normal and customary manner.
We make available free of charge on or through our Internet website our annual reports on Form 10-K, quarterly reports on Form 10-Q, current reports on Form 8-K and amendments to those reports filed or furnished pursuant to Section 13(a) or 15(d) of the Securities Exchange Act of 1934 ("Exchange Act"), as well as proxy statements, as soon as reasonably practicable after we electronically file such material with, or furnish it to, the SEC. Also posted on our website, and available in print upon the request of any shareholder to our Investor Relations Department, are our certificate of incorporation and by-laws, the charters for our Audit Committee, Human Resources Committee and Nominating and Governance Committee, our Corporate Governance Guidelines, our Policy on Business
10
Conduct governing our directors, officers and employees, our Code of Ethics for Principal Executive Officer and Senior Financial Officers, our Guidelines for Determining Director Independence and our Policy and Procedures Governing Related-Person Transactions. Within the time period required by the SEC and the New York Stock Exchange ("NYSE"), we will post on our website any amendment to the Policy on Business Conduct or the Code of Ethics for Principal Executive Officer and Senior Financial Officers or any waiver of either such policy applicable to any of our senior financial officers, executive officers or directors. In addition, our website includes information concerning purchases and sales of our equity securities by our executive officers and directors, as well as disclosure relating to certain non-GAAP financial measures (as defined in the SEC's Regulation G) that we make public orally, telephonically, by webcast, by broadcast or similar means. Our Internet address is http://www.IMSHEALTH.com and the information described above can be found in the Company Information and the Investors sections of that website. Our Investor Relations Department can be contacted at IMS Health Incorporated, 901 Main Avenue, Norwalk, Connecticut 06851, Attn: Investor Relations: (203) 845-5200, e-mail: askir@imshealth.com.
In addition to the other information included or incorporated by reference into this Annual Report on Form 10-K, including the matters addressed under the caption "Forward-Looking Statements," set forth below are some of the risks and uncertainties that, if they were to occur, could materially adversely affect our business or that could cause our actual results to differ materially from the results contemplated by the forward-looking statements contained in this report and other public statements we make.
Our data suppliers might restrict our use of or refuse to license data, which could lead to our inability to provide certain products or services.
Our products and services incorporate data that we collect from third parties. These suppliers of data may increase restrictions on our use of such data, fail to adhere to our quality control standards or refuse altogether to license the data to us. For example, in 2002 certain of our data suppliers in Japan began withholding certain data from us. This interruption in data supply led us to discontinue one of our Japanese products and adversely affected our operating results. If the suppliers of a significant amount of data that we use for one or more of our products or services were to impose additional contractual restrictions on our use of or access to data, fail to adhere to our quality control standards, or refuse to provide data, now or in the future, our ability to provide products and services to our clients could be materially adversely impacted, which could result in decreased revenue, net income and earnings per share.
Laws restricting the use of information may restrict our product and service offerings.
We provide several product and service offerings to clients in the U.S. that involve the license, use and transfer of prescriber-identifiable information for commercial purposes. New Hampshire, Vermont and Maine have passed laws placing certain restrictions on the license, use or transfer of such information for commercial purposes. We challenged all three laws in Federal court, asking the courts to declare these laws unconstitutional.
- •
- With respect to the New Hampshire law, the Federal District Court in Concord, New Hampshire ruled on April 30, 2007 that the law violated the First Amendment and was therefore unconstitutional and enjoined its enforcement. However, that decision was overturned by the U.S. Court of Appeals for the First Circuit, which declared the law constitutional. The appeals court vacated the lower court's injunction and the New Hampshire statute became effective on February 9, 2009. On March 27, 2009, we filed a petition for certiorari to the U.S. Supreme Court asking that the Supreme Court review the appeals court's decision in this matter. On
11
- •
- With respect to the Maine law, the Federal District Court in Bangor, Maine issued a preliminary injunction on
December 21, 2007, prohibiting enforcement of the Maine law. The Maine Attorney General has appealed the preliminary injunction ruling to the U.S. Court of Appeals for the First
Circuit.
- •
- With respect to the Vermont law, the Federal District Court in Brattleboro, Vermont held a full trial ending on August 1, 2008. On April 23, 2009 the court issued its decision upholding the Vermont law. We appealed the district court's decision to the U.S. Court of Appeals for the Second Circuit. The data restrictions in the Vermont law became effective on July 1, 2009. We have modified our offerings and believe we are operating in compliance with the Vermont law.
June 29, 2009, the Supreme Court announced that it would not hear the case. We have modified our offerings and believe we are operating in compliance with the New Hampshire law.
These three states collectively represent approximately one percent of prescription activity in the U.S., so the potential financial impact of these laws on our business, financial condition and results of operations is not expected to be material. However, there have been a significant number of state legislative initiatives over the past several years that seek to impose similar restrictions on the commercial use of prescriber-identifiable information. During 2009, these initiatives were introduced in 23 states; all were unsuccessful. As in past years, we expect that these initiatives will be introduced or reintroduced in various states during 2010. We are unable to predict whether, in which states and in what form these initiatives will be introduced or reintroduced or whether the Federal government will seek to enact similar or more restrictive legislation or regulation of such information. In addition, while we will continue to seek to adapt our products and service offerings (including consulting and services offerings) to comply with the requirements of these laws, there can be no assurance that our efforts to adapt our offerings will be successful and provide the same financial contribution to us. There can also be no assurance that these kinds of legislative initiatives will not adversely affect our ability to generate or assemble data or to develop or market current or future offerings, which could, over time, result in a material adverse impact on our revenues, net income and earnings per share.
Data protection and privacy laws may restrict our current and future activities.
Data protection and privacy laws affect our collection, use, storage and transfer of personally identifiable information both abroad and in the U.S. Compliance with such laws may require investment or may dictate that we not offer certain types of products and services. Failure to comply with such laws may result in, among other things, civil and criminal liability, negative publicity, data being blocked from use and liability under contractual warranties.
In addition, there is an increasing public concern regarding data protection and privacy issues and the number of jurisdictions with data protection and privacy laws has been increasing. For example, as discussed under "—Laws restricting the use of information may restrict our product and service offerings," laws have been passed in Maine, New Hampshire and Vermont restricting the use of prescriber identifiable data. In addition, there have also been other legislative and regulatory initiatives in the U.S. and abroad in the area of access to medical data. These initiatives tend to seek to place restrictions on the use and disclosure of patient-identifiable information without consent and, in some cases, seek to extend restrictions to non-patient-identifiable information, e.g., prescriber identifiable information, or to the process of anonymizing data. There can be no assurance that these initiatives or future initiatives will not adversely affect our ability to generate or assemble data or to develop or market current or future products or services and therefore our revenues and net income.
12
Hardware and software failures, delays in the operation of our computer and communications systems or the failure to implement system enhancements may harm our business.
Our success depends on the efficient and uninterrupted operation of our computer and communications systems. A failure of our network or data gathering procedures could impede the processing of data, delivery of databases and services, client orders and day-to-day management of our business and could result in the corruption or loss of data. While many of our operations have appropriate disaster recovery plans in place, we currently do not have full backup facilities everywhere in the world to provide redundant network capacity in the event of a system failure. Despite any precautions we may take, damage from fire, floods, hurricanes, power loss, telecommunications failures, computer viruses, break-ins, sabotage, breaches of security, epidemics and similar events at our various computer facilities could result in interruptions in the flow of data to our servers and from our servers to our clients. In addition, any failure by our computer environment to provide our required data communications capacity could result in interruptions in our service. In the event of a delay in the delivery of data, we could be required to transfer our data collection operations to an alternative provider of server hosting services. Such a transfer could result in significant delays in our ability to deliver our products and services to our clients. Additionally, significant delays in the planned delivery of system enhancements, improvements and inadequate performance of the systems once they are completed could damage our reputation and harm our business. Finally, long-term disruptions in the infrastructure caused by events such as natural disasters, the outbreak of war, the escalation of hostilities, epidemics and acts of terrorism (particularly involving cities in which we have offices) could adversely affect our businesses. Although we carry property and business interruption insurance, our coverage may not be adequate to compensate us for all losses that may occur.
Consolidation in the industries in which our clients operate may reduce the volume of products and services purchased by consolidated clients following an acquisition or merger, leading to decreased earnings.
Consolidation in the pharmaceutical industry could reduce the volume of our information products and services purchased by consolidated clients. When companies consolidate, overlapping products and services they previously purchased separately are usually now purchased only once by the combined entity, leading to contract compression and loss of revenue. While we have experienced success in mitigating the revenue impact of client consolidation, there can be no assurance as to the degree to which we will be able to continue to do so as consolidation continues.
Our business is subject to exchange rate fluctuations and our revenue, net income and financial position may suffer due to currency translations.
We operate globally, deriving approximately 63% of our 2009 revenue from non-U.S. operations. As a result, fluctuations in the value of foreign currencies relative to the U.S. dollar increase the volatility of U.S. dollar denominated operating results. Emerging markets currencies tend to be considerably less stable than those in established markets, which may further contribute to volatility in our U.S. dollar-denominated operating results.
As a result of devaluations and fluctuations in currency exchange rates or the imposition of limitations on conversion of foreign currencies into dollars, we are subject to currency translation exposure on the profits and financial position of our operations, in addition to economic exposure.
Our international operations present risks to our current businesses that could impede growth in the future.
International operations are subject to various risks that could adversely affect our business, including:
- •
- costs of customizing services for foreign clients;
13
- •
- reduced protection for intellectual property rights in some countries;
- •
- the burdens of complying with a wide variety of foreign laws;
- •
- exposure to local economic conditions; and
- •
- exposure to local political conditions, including the risks of an outbreak of war, the escalation of hostilities, acts of terrorism and nationalization, expropriation, price controls or other restrictive government actions.
We may be unsuccessful in identifying acquisition candidates or evaluating the material risks involved in any acquisition.
An important aspect of our business strategy in the past has been growth through acquisitions or joint ventures and we may continue to acquire or make investments in complementary businesses, technologies, services or products. There can be no assurance that we will be able to continue to identify and consummate acquisitions or joint ventures on satisfactory terms. Moreover, every acquisition and joint venture entails some degree of uncertainty and risk. For example, we may be unsuccessful in identifying and evaluating business, legal or financial risks as part of the due diligence process associated with a transaction. In addition, some acquisitions will have contingent consideration components that may require us to pay additional amounts in the future in relation to future performance results of the acquired business. If we do not properly assess these risks, or if we fail to realize the benefits from one or more acquisitions, our business, results of operations and financial condition could be adversely affected.
We may be unsuccessful in integrating any acquired operations with our existing business.
We may experience difficulties in integrating operations acquired from other companies. These difficulties include the diversion of management's attention from other business concerns and the potential loss of key employees of the acquired operations. Acquisitions also frequently involve significant costs, often related to integrating information technology, accounting and management services and rationalizing personnel levels. If we experience difficulties in integrating one or more acquisitions, our business, results of operations and financial condition could be adversely affected.
Changes in tax laws or their application may adversely affect our reported results.
We operate in more than 100 countries worldwide and our earnings are subject to taxation in many differing jurisdictions and at differing rates. We seek to organize our affairs in a tax efficient manner, taking account of the jurisdictions in which we operate. Tax laws that apply to our business may be amended by the relevant authorities as a result of changes in fiscal circumstances or priorities. Such amendments, or their application to our business, may adversely affect our reported results.
We are involved in tax related matters that could have a material effect on us.
We (and our predecessors) have entered, and we continue to enter, into global tax planning initiatives in the normal course of business. These activities are subject to review by applicable tax authorities and courts. As a result of the review process, uncertainties exist and it is possible that some of these matters could be resolved adversely to us, including those tax related matters described in Part I, Item 3 of this Annual Report on Form 10-K. Moreover, there can be no assurance that we will be able to maintain our effective tax rate.
We are, and may become, involved in litigation that could harm the value of our business.
In the normal course of our business, we are involved in lawsuits, claims, audits and investigations, such as those described in Part I, Item 3 of this Annual Report on Form 10-K. The outcome of these
14
matters could have a material adverse effect on our business, results of operation or financial condition. In addition, we may become subject to future lawsuits, claims, audits and investigations that could result in substantial costs and divert our attention and resources.
Significant technological changes could render our products and services obsolete. We may not be able to develop the technology necessary for our business, or to do so efficiently.
We operate in businesses that require sophisticated data collection and processing systems and software and other technology. Some of the technologies supporting the industries we serve are changing rapidly and we must continue to develop cost-effective technologies for data collection and processing to accommodate such changes. We also must continue to deliver data to our clients in forms that are easy to use while simultaneously providing clear answers to complex questions. There can be no guarantee that we will be able to develop new technologies for data collection, processing and delivery or that we will be able to do so as quickly or cost-effectively as our competition. Significant technological change could render our products and services obsolete.
Moreover, the introduction of new products and services embodying new technologies and the emergence of new industry standards could render existing products and services obsolete. Our continued success will depend on our ability to adapt to changing technologies, manage and process ever-increasing amounts of data and information and improve the performance, features and reliability of our products and services in response to changing client and industry demands. We may experience difficulties that could delay or prevent the successful design, development, testing, introduction or marketing of our products and services. New products and services, or enhancements to existing products and services, may not adequately meet the requirements of current and prospective clients or achieve any degree of significant market acceptance.
Government imposed price restrictions on pharmaceutical companies could reduce demand for our products and services.
A number of countries in which we operate have enacted regulations limiting the prices pharmaceutical companies may charge for drugs. We believe that such cost containment measures will cause pharmaceutical companies to seek more effective means of marketing their products (which will benefit us in the medium and long-term). However, such governmental regulation may cause pharmaceutical companies to revise or reduce their marketing programs in the near term, which may in turn reduce the demand for certain of our products and services. This could result in decreased revenue, net income and earnings per share.
The success of our business will largely depend on the performance of the pharmaceutical and healthcare industries.
The vast majority of our revenues are generated from sales to the pharmaceutical and healthcare industries. To the extent the businesses we serve, especially our clients in the pharmaceutical and healthcare industries, are subject to financial pressures of, for example, price controls, increased costs or reduced demand for their products, the demand for our products and services, or the price our clients are willing to pay for those products and services, may decline.
Our success will depend on our ability to protect our intellectual property rights.
The success of our businesses will continue to depend, in part, on:
- •
- obtaining patent protection for our technology, products and services;
- •
- defending our patents, copyrights and other intellectual property;
15
- •
- preserving our trade secrets and maintaining the security of our know-how; and
- •
- operating without infringing upon patents and proprietary rights held by third parties.
We rely on a combination of contractual provisions, confidentiality procedures and patent, copyright, trademark, service mark and trade secret laws to protect the proprietary aspects of our products, services, databases and technologies. There can be no assurance that these protections will be adequate, or that we will adequately employ each and every one of these protections at all times, to provide sufficient protection in the future to prevent the use or misappropriation of our data, technology and other products and services. Further, our competitors may develop products, services, databases or technologies that are substantially equivalent or superior to our products, services, databases or technologies. Although we believe that our products, services, databases, technologies and related proprietary rights do not infringe upon the proprietary rights of third parties, there can be no assurance that third parties will not assert infringement claims against us in the future. Litigation may be necessary to enforce our intellectual property rights, to protect our trade secrets and to determine the validity and scope of our proprietary rights. For example, we have been involved in litigation with Insight Health GmbH & Co. KG in Germany in order to protect our proprietary mapping software. In addition, the growing need for global data, along with increased competition and technological advances, puts increasing pressure on us to share our intellectual property for client applications. Any future litigation, regardless of outcome, could result in substantial expense and diversion of resources with no assurance of success and could seriously harm our business, financial condition and operating results.
If we are unable to attract, retain and motivate employees, we will not be able to compete effectively and will not be able to expand our business.
Our success and ability to grow are dependent, in part, on our ability to hire, retain and motivate sufficient numbers of talented people, with the increasingly diverse skills needed to serve clients and expand our business, in many locations around the world. Competition for highly qualified technical and managerial, and particularly consulting personnel is intense. Recruiting, training and retention costs and benefits place significant demands on our resources. The inability to attract qualified employees in sufficient numbers to meet particular demands or the loss of a significant number of our employees could have a serious negative effect on us, including our ability to obtain and successfully complete important client engagements and thus maintain or increase our revenues.
Our businesses are subject to significant or potential competition that is likely to intensify in the future.
Our future growth and success will be dependent on our ability to successfully compete with other companies that provide similar services in the same markets, some of which may have financial, marketing, technical and other advantages.
Disruptions in commerce could adversely affect our business.
Commerce could be disrupted by various political, economic, world health or other conditions. Examples of such disruptions that could adversely affect our business include:
- •
- terrorist activity, the threat of such activity, and responses to and results of such activity and threats, including but
not limited to effects, domestically and/or internationally, on us, our personnel and facilities, our customers and suppliers, financial markets and general economic conditions;
- •
- an outbreak of SARS, avian influenza (Bird Flu), the H1N1 virus or other epidemic, the fear of such an epidemic, and responses to and results of such an epidemic or fear thereof, including
16
- •
- credit market disruptions, the threat of such disruptions, and responses to and results of such disruptions and threats, including but not limited to effects, domestically and/or internationally, on us, our customers and suppliers, financial markets and general economic conditions.
but not limited to effects, domestically and/or internationally, on us, our personnel and facilities, our customers and suppliers, financial markets and general economic conditions; and
If such disruptions result in cancellations of or reductions in customer orders or contribute to a general decrease in economic activity, or directly impact our marketing, collection, production, delivery, financial and logistics functions, our results of operations and financial condition could be materially adversely affected.
The Merger is subject to satisfaction or waiver of certain customary conditions.
Completion of the Merger is subject to the satisfaction or waiver of certain customary conditions, including without limitation the absence of any law enacted, issued, enforced or entered by any court or governmental entity of competent jurisdiction that restrains, enjoins or otherwise prohibits the consummation of the Merger or otherwise makes consummation of the Merger illegal, the accuracy of representations and warranties (subject to customary materiality qualifiers) made by the parties to the Merger Agreement, and compliance, in all material respects, with the parties' respective covenants and agreements contained in the Merger Agreement at or prior to the date of the closing of the Merger. Completion of the Merger is expected to occur by the end of the first quarter of 2010. However, no assurances can be given that the transaction contemplated by the Merger Agreement will be consummated or, if not consummated, that we will enter into a comparable or superior transaction with another party.
The Merger may not be completed if sufficient financing is not funded.
Parent has obtained equity and debt financing commitments. The funding under those commitments is subject to conditions, including conditions that do not relate directly to the Merger Agreement. We believe the committed amounts will be sufficient to complete the transaction, but cannot provide any assurance to that effect. Those amounts might be insufficient if, among other things, a substantial change in the dollar-yen exchange rate substantially increases the cost of refinancing our yen denominated debt or we have substantially less cash on hand (net of any applicable repatriation taxes) or substantially less net proceeds from the equity and debt financings than we currently expect.
Although the debt financing described herein is not subject to due diligence or a typical "market out" provision, which allows lenders not to fund their commitments if certain conditions in the financial markets prevail, there is still a risk that such financing may not be funded when required. As of the date of this Annual Report on Form 10-K, no alternative financing arrangements or alternative financing plans have been made in the event the debt financing described herein is not available as anticipated. Even though obtaining the equity or debt financing is not a condition to the completion of the Merger, the failure of Parent and Merger Sub to obtain sufficient financing is likely to result in the failure of the Merger to be completed. In that case, Parent may be obligated to pay us a fee of $275,000. That obligation is severally guaranteed by the Guarantors.
17
Our future business and financial position may be adversely affected if the Merger is not completed.
If the Merger Agreement is terminated and the Merger is not consummated, we will have incurred substantial expenses without realizing the expected benefits of the Merger. In addition, we may also be subject to additional risks including, without limitation:
- •
- depending on the reasons for termination of the Merger Agreement, the requirement that we pay a termination fee equal to
$115,000 in addition to the payment to Parent of all out-of-pocket fees and expenses incurred by Parent or Merger Sub in connection with the Merger Agreement or the
transactions contemplated therein up to $5,000;
- •
- substantial costs related to the Merger, such as legal, accounting and financial advisory fees, must be paid regardless of
whether the Merger is completed;
- •
- potential disruption to the current plan, operations, businesses and distraction of our workforce and management team;
and
- •
- potential difficulties in employee retention as a result of termination of the proposed Merger.
Failure to complete the Merger could adversely affect our stock price.
If the Merger is not completed for any reason, the price of our Common Stock may decline significantly to the extent that the market price of our Common Stock reflects positive market assumptions that the Merger will be completed.
For further information regarding the Merger Agreement, please refer to the Merger Agreement and the Definitive Proxy Statement on Schedule 14A filed with the SEC by us on December 29, 2009, which are incorporated by reference as exhibits to this Annual Report on Form 10-K.
Item 1B. Unresolved Staff Comments
There are no unresolved written comments that were received from the SEC staff 180 days or more before the end of our 2009 fiscal year.
Our executive offices are located at 901 Main Avenue, Norwalk, Connecticut in a leased property (approximately 41,000 square feet).
Our property is geographically distributed to meet our sales and operating requirements worldwide. Our properties and equipment are generally considered to be both suitable and adequate to meet current operating requirements and virtually all space is being utilized.
Our owned properties located within the U.S. include two facilities. These properties are located in Plymouth Meeting (approximately 212,000 square feet) and West Norriton, Pennsylvania (approximately 17,000 square feet).
Our active owned properties located outside the U.S. include: one property in each of Buenos Aires, Argentina (approximately 12,000 square feet); Santiago, Chile (approximately 4,000 square feet); Caracas, Venezuela (two properties totaling approximately 12,000 square feet); and London (approximately 102,000 square feet).
Our operations are also conducted from 18 leased offices located throughout the U.S. and 98 leased offices in non-U.S. locations.
We own or lease a variety of computers and other equipment for our operational needs. We continue to upgrade and expand our computers and related equipment in order to increase efficiency, enhance reliability and provide the necessary base for business expansion.
18
We are involved in legal and tax proceedings, claims and litigation arising in the ordinary course of business. We periodically assess our liabilities and contingencies in connection with these matters based upon the latest information available. For those matters where we currently believe it is probable that we will incur a loss and that the probable loss or range of loss can be reasonably estimated, we have recorded reserves in the Consolidated Financial Statements based on our best estimates of such loss. In other instances, because of the uncertainties related to either the probable outcome or the amount or range of loss, we are unable to make a reasonable estimate of a liability, if any. However, even in many instances where we have recorded a reserve, we are unable to predict with certainty the final outcome of the matter or whether resolution of the matter will materially affect our results of operations, financial position or cash flows. As additional information becomes available, we adjust our assessment and estimates of such liabilities accordingly.
We routinely enter into agreements with our suppliers to acquire data and with our customers to sell data, all in the normal course of business. In these agreements, we sometimes agree to indemnify and hold harmless the other party for any damages such other party may suffer as a result of potential intellectual property infringement and other claims related to the use of the data. These indemnities typically have terms of approximately two years. We have not accrued a liability with respect to these matters, as the exposure is considered remote.
Based on our review of the latest information available, we believe our ultimate liability in connection with pending tax and legal proceedings, claims and litigation will not have a material effect on our results of operations, cash flows or financial position, with the possible exception of the matters described below.
D&B LEGACY AND RELATED TAX MATTERS
SHARING DISPUTES. In 1996, the company then known as The Dun & Bradstreet Corporation ("D&B") and now known as R.H. Donnelley Corporation ("Donnelley") separated into three public companies by spinning off ACNielsen Corporation ("ACNielsen") and the company then known as Cognizant Corporation ("Cognizant") (the "1996 Spin-Off"). Cognizant is now known as Nielsen Media Research, Inc., a subsidiary of The Nielsen Company, formerly known as VNU N.V. ("NMR"). The agreements effecting the 1996 Spin-Off allocated tax-related liability with respect to certain prior business transactions between D&B and Cognizant. The D&B portion of such liability is now shared among Donnelley and certain of its former affiliates (the "Donnelley Parties"), and the Cognizant portion of such liability is shared between NMR and us pursuant to the agreements effecting Cognizant's spin-off of us in 1998 (the "1998 Spin-Off").
The underlying tax controversies with the Internal Revenue Service ("IRS") have substantially all been resolved and we paid to the IRS the amounts that we believed were due and owing. In the first quarter of 2006, Donnelley indicated that it disputed the amounts contributed by us toward the resolution of these matters based on the Donnelley Parties' interpretation of the allocation of liability under the 1996 Spin-Off agreements. In August 2006, the Donnelley Parties commenced arbitration regarding one of these disputes (referred to herein as the "Dutch Partnership Dispute"). The Dutch Partnership Dispute was resolved during the third quarter of 2008 when the parties consented to the entry of a consent award by the arbitration panel. Pursuant to the terms of the consent award, in the third quarter of 2008, we made a payment of $4,600 ($3,100 net of tax benefit) and an additional interest and cost payment of $2,600 ($1,700 net of tax benefit) to the Donnelley Parties. The remaining disputes were resolved during the second quarter of 2009 by agreement among the parties. Pursuant to the 2009 settlement agreement, we made a payment of $10,750 ($8,000 net of tax benefit) to the Donnelley Parties in full satisfaction of our liability with respect to the remaining disputes.
19
THE PARTNERSHIP (TAX YEAR 1997). During the fourth quarter of 2008, we entered into a final agreement with the IRS in which the IRS disallowed certain items of partnership expense for tax year 1997 with respect to a partnership now substantially owned by us (the "Partnership"). During 1997, the Partnership was substantially owned by Cognizant, but liability for this matter was allocated to us pursuant to the agreements effecting the 1998 Spin-Off. Pursuant to the settlement, during the second quarter of 2009, we paid $20,400 (tax and interest, net of tax benefit) to the IRS in full satisfaction of our liability with respect to the Partnership for tax year 1997.
In addition to these matters, we and our predecessors have entered, and we continue to enter, into global tax planning initiatives in the normal course of our businesses. These activities are subject to review by applicable tax authorities. As a result of the review process, uncertainties exist and it is possible that some of these matters could be resolved adversely to us.
LITIGATION RELATING TO THE MERGER
As previously disclosed in more detail in the Definitive Proxy Statement on Schedule 14A filed with the SEC by us on December 29, 2009, in connection with the Merger, between November 6, 2009 and November 10, 2009 three putative stockholder class action lawsuits were filed in the Delaware Court of Chancery and two in the Superior Court of Connecticut, Judicial District of Stamford-Norwalk. These lawsuits generally alleged breaches of fiduciary duty by our directors in connection with the Merger.
On December 2, 2009, the three putative shareholder class action lawsuits filed in Delaware were consolidated into a single action, captioned In re IMS Health Inc. Shareholder Litigation, C.A. No. 5057-CC (the "Delaware Action"). On January 14, 2010, the plaintiffs in the Delaware Action filed a Notice and Order of Voluntary Dismissal of all their claims, without prejudice, in which they represented that no compensation in any form has passed directly or indirectly from defendants to plaintiffs or plaintiffs' attorneys and that no promise to give any such compensation has been made. The Court of Chancery granted the dismissal on January 15, 2010.
One of the two putative shareholder class action lawsuits filed in Connecticut, styled Trust for the Benefit of Sylvia B. Piven v. IMS Health Incorporated, et al., CV09-5013110-S, was filed on November 6, 2009, and the other, styled John Felhaber v. David R. Carlucci, et al., CV09-5013139-S, was filed on November 10, 2009. On December 8, 2009, plaintiff Felhaber filed an amended complaint asserting, among other things, that our directors had breached their duty of disclosure in the Preliminary Proxy Statement on Schedule 14A filed with the SEC by us on November 25, 2009. On December 18, 2009, our director defendants filed motions to dismiss for failure to properly effect service, and on December 21, 2009 we filed motions to strike the Piven complaint and the Felhaber amended complaint filed in the Superior Court of Connecticut. On January 5, 2010, plaintiff Felhaber filed an application for temporary injunction seeking, among other things, disclosure-based relief in advance of the February 8, 2010 Special Meeting of our stockholders, and on January 11, 2010, we and our directors filed an objection to the application. During a January 13, 2010 hearing before the Superior Court of Connecticut, our director defendants withdrew their motions to dismiss.
On January 27, 2010, we entered into a memorandum of understanding with the plaintiffs regarding the settlement of the two putative stockholder class action lawsuits filed in the Superior Court of Connecticut, Judicial District of Stamford-Norwalk. We believe that no further supplemental disclosure is required under applicable laws; however, to avoid the risk of the putative stockholder class actions delaying or adversely affecting the Merger and to minimize the expense of defending such actions, we have agreed, pursuant to the terms of the proposed settlement, to make certain supplemental disclosures related to the proposed Merger. Subject to completion of certain confirmatory discovery by counsel to the plaintiffs, the memorandum of understanding contemplates that the parties will enter into a stipulation of settlement. The stipulation of settlement will be subject to customary
20
conditions, including court approval following notice to our stockholders. In the event that the parties enter into a stipulation of settlement, a hearing will be scheduled at which the Superior Court will consider the fairness, reasonableness, and adequacy of the settlement. If the settlement is finally approved by the court, it will resolve and release all claims in all actions that were or could have been brought challenging any aspect of the proposed Merger, the Merger Agreement, and any disclosure made in connection therewith (but excluding claims for appraisal under Section 262 of the Delaware General Corporation Law), pursuant to terms that will be disclosed to stockholders prior to final approval of the settlement. In addition, in connection with the settlement, the parties contemplate that plaintiffs' counsel will file a petition in the Superior Court for an award of attorneys' fees and expenses to be paid by us or our successor, which the defendants may oppose. We or our successor shall pay or cause to be paid those attorneys' fees and expenses awarded by the Court. There can be no assurance that the parties will ultimately enter into a stipulation of settlement or that the Superior Court will approve the settlement even if the parties were to enter into such stipulation. In such event, the proposed settlement as contemplated by the memorandum of understanding may be terminated.
IMS HEALTH GOVERNMENT SOLUTIONS VOLUNTARY DISCLOSURE PROGRAM PARTICIPATION
Our wholly-owned subsidiary, IMS Government Solutions Inc., is primarily engaged in providing services and products under contracts with the U.S. government. U.S. government contracts are subject to extensive legal and regulatory requirements and, from time to time, agencies of the U.S. government have the ability to investigate whether contractors' operations are being conducted in accordance with such requirements. U.S. government investigations, whether relating to these contracts or conducted for other reasons, could result in administrative, civil or criminal liabilities, including repayments, fines or penalties being imposed on us, or could lead to suspension or debarment from future U.S. government contracting. U.S. government investigations often take years to complete and may result in no adverse action against us.
IMS Government Solutions discovered potential noncompliance with various contract clauses and requirements under its General Services Administration Contract which was awarded in 2002 to its predecessor company, Synchronous Knowledge Inc. (Synchronous Knowledge Inc. was acquired by IMS in May 2005). Upon discovery of the potential noncompliance, we began remediation efforts, promptly disclosed the potential noncompliance to the U.S. government, and were accepted into the Department of Defense Voluntary Disclosure Program. We filed our Voluntary Disclosure Program Report ("Disclosure Report") on August 29, 2008. Based on our findings as disclosed in the Disclosure Report, we recorded a reserve of approximately $3,748 for this matter in the third quarter of 2008. We are currently unable to determine the outcome of this matter pending the resolution of the Voluntary Disclosure Program process and our ultimate liability arising from this matter could exceed our current reserve.
Item 4. Submission of Matters to a Vote of Security Holders
There were no matters submitted to a vote of security holders during the fourth quarter of our fiscal year ended December 31, 2009.
21
Item 5. Market for the Registrant's Common Equity, Related Stockholder Matters and Issuer Purchases of Equity Securities
The principal market on which our Common Stock is traded is the NYSE. Information relating to the high and low sales prices per share of our Common Stock for each full quarterly period during 2009 and 2008 is set forth under the heading "IMS Health Common Stock Information" in Part II, Item 7 of this Annual Report on Form 10-K. As of February 12, 2010, there were 3,424 holders of record of our Common Stock.
Information relating to our payment of dividends during 2009 and 2008 is set forth under the heading "Dividends" in Part II, Item 7 of this Annual Report on Form 10-K.
The following table provides information about our purchases during the quarter ended December 31, 2009 of equity securities that are registered by us pursuant to Section 12 of the Exchange Act.
Period
|
Total Number of Shares Purchased |
Average Price Paid per Share |
Total Number of Shares Purchased Under Publicly Announced Programs |
Maximum Number of Shares that May Yet Be Purchased Under the Programs(1) |
|||||||||
|---|---|---|---|---|---|---|---|---|---|---|---|---|---|
October 1 – 31, 2009 |
— | — | — | 9,505,300 | |||||||||
November 1 – 30, 2009 |
— | — | — | 9,505,300 | |||||||||
December 1 – 31, 2009 |
— | — | — | 9,505,300 | |||||||||
Total |
— | — | — | 9,505,300 | |||||||||
- (1)
- In December 2007, the Board of Directors authorized a stock repurchase program to buy up to 20,000,000 shares. As of December 31, 2009, 9,505,300 shares remained available for repurchase under the December 2007 program. Unless terminated earlier by resolution of our Board of Directors, this program will expire when we have repurchased all shares authorized for repurchase thereunder.
Information relating to compensation plans under which our equity securities are authorized for issuance is set forth in Part III, Item 12 of this Annual Report on Form 10-K.
The following graph is a comparison of the five-year cumulative return of our common stock, the Standard & Poor's 500 Index (the "S&P 500 Index"), and the Standard & Poor's Pharmaceuticals Index (the "S&P Pharmaceuticals Index"), a peer group index. The graph assumes that $100 was invested on December 31, 2004 in our common stock, the S&P Index and the S&P 500 Pharmaceutical Index and that all dividends were reinvested without the payment of any commissions. There can be no assurance that the performance of our common stock will continue in line with the same or similar trends depicted in the graph below.
22
PERFORMANCE GRAPH
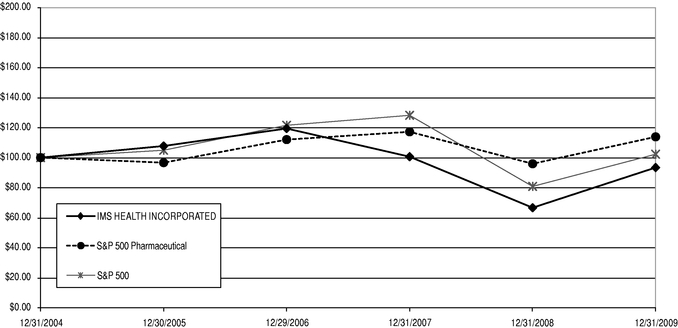
| |
12/31/2004 | 12/30/2005 | 12/29/2006 | 12/31/2007 | 12/31/2008 | 12/31/2009 | Compound Annual Return Rate |
|||||||||||||||
|---|---|---|---|---|---|---|---|---|---|---|---|---|---|---|---|---|---|---|---|---|---|---|
IMS HEALTH INCORPORATED |
$ | 100.00 | $ | 107.74 | $ | 119.38 | $ | 100.61 | $ | 66.67 | $ | 93.40 | (1.4 | )% | ||||||||
S&P 500 Pharmaceutical |
100.00 | 96.65 | 112.00 | 117.18 | 95.93 | 113.83 | 2.6 | % | ||||||||||||||
S&P 500 |
100.00 | 104.92 | 121.53 | 128.16 | 80.86 | 102.26 | 0.4 | % | ||||||||||||||
The cumulative total shareholder return graph and accompanying information set forth above is being furnished and shall not be deemed filed for purposes of Section 18 of the Securities Exchange Act of 1934, as amended, or otherwise subject to the liabilities of such section. The cumulative total shareholder return graph and accompanying information set forth above shall not be incorporated by reference into any registration statement or other document pursuant to the Securities Act of 1933, as amended.
Item 6. Selected Financial Data
The Selected Financial Data table is set forth in Part II, Item 8 of this Annual Report on Form 10-K.
23
Item 7. Management's Discussion and Analysis of Financial Condition and Results of Operations
Dollars and shares in thousands, except per share data.
This discussion and analysis should be read in conjunction with the accompanying Consolidated Financial Statements and related notes.
Executive Summary
OUR BUSINESS
IMS Health Incorporated ("IMS," "we," "us" or "our") is the leading global provider of market intelligence to the pharmaceutical and healthcare industries. We offer leading-edge market intelligence products and services that are integral to our clients' day-to-day operations, including product and portfolio management capabilities; commercial effectiveness innovations; managed care and consumer health offerings; and consulting and services solutions that improve productivity and the delivery of quality healthcare worldwide. Our information products are developed to meet client needs by using data secured from a worldwide network of suppliers in more than 100 countries. Our business lines are:
- •
- Commercial Effectiveness to increase clients' productivity across end-to-end sales, marketing,
promotional and performance management processes;
- •
- Product and Portfolio Management to provide clients with insights into market measurement so they can optimize their
product portfolio and strategies; and
- •
- New Business Areas that support pharmaceutical client business initiatives in managed markets, consumer health, and pricing and market access, and that also serve payer and government audiences.
Within these business lines, we provide consulting and services that use in-house capabilities and methodologies to assist clients in analyzing and evaluating market trends, strategies and tactics, and to help in the development and implementation of customized software applications and data warehouse tools.
We operate in more than 100 countries.
We manage on a global business model with global leaders for the majority of our critical business processes and accordingly have one reportable segment.
We believe that important measures of our financial condition and results of operations include operating revenue, constant dollar revenue growth, operating income, constant dollar operating income growth, operating margin and cash flows.
THE MERGER AGREEMENT
On November 5, 2009, we entered into an Agreement and Plan of Merger (the "Merger Agreement") with Healthcare Technology Holdings, Inc., a Delaware corporation ("Parent"), and Healthcare Technology Acquisition, Inc., a Delaware corporation and wholly owned subsidiary of Parent ("Merger Sub"), providing for the merger of Merger Sub with and into IMS (the "Merger"), with IMS surviving the Merger as a wholly owned subsidiary of Parent. Parent and Merger Sub are affiliates of TPG Capital, L.P. ("TPG") and Canada Pension Plan Investment Board ("CPPIB").
On February 8, 2010, a special meeting of our stockholders was held (the "Special Meeting"). At the Special Meeting our stockholders approved the proposal presented at the Special Meeting to adopt the Merger Agreement.
At the effective time of the Merger, each share of our Common Stock issued and outstanding (except for certain shares held by Parent, us and certain of our subsidiaries, and shares held by stockholders who have properly demanded appraisal rights) will convert into the right to receive the per share Merger consideration of $22.00 in cash, without interest, less any applicable withholding taxes.
24
The respective obligations of IMS, Parent and Merger Sub to consummate the Merger are subject to the satisfaction or waiver of certain customary conditions, including without limitation the absence of any law enacted, issued, enforced or entered by any court or governmental entity of competent jurisdiction that restrains, enjoins or otherwise prohibits the consummation of the Merger or otherwise makes consummation of the Merger illegal, the accuracy of representations and warranties (subject to customary materiality qualifiers) made by the parties to the Merger Agreement, and compliance, in all material respects, with the parties' respective covenants and agreements contained in the Merger Agreement at or prior to the date of the closing of the Merger. The consummation of the Merger is subject to certain other conditions which, as of the date of this Annual Report on Form 10-K, have been satisfied. Completion of the Merger is expected to occur by the end of the first quarter of 2010.
We anticipate that the total funds needed to complete the Merger will be approximately $5,900,000. We expect this amount to be funded through a combination of:
- •
- equity financing of approximately $2,800,000 to be provided or secured by investment funds affiliated with TPG and a
wholly owned subsidiary of CPPIB, or other parties to whom they assign a portion of their commitments;
- •
- a $2,000,000 senior secured term loan facility;
- •
- the issuance of $1,000,000 in principal amount of senior unsecured notes (supplemented, if some or all of those notes
cannot be sold at closing, by a senior unsecured term loan facility); and
- •
- approximately $100,000 of cash on hand of IMS.
Parent has obtained equity and debt financing commitments. The funding under those commitments is subject to conditions, including conditions that do not relate directly to the Merger Agreement.
Pursuant to a limited guarantee delivered by TPG Partners V, L.P., TPG Partners VI, L.P. and CPP Investment Board Private Holdings Inc. (collectively, the "Guarantors") in favor of IMS, dated November 5, 2009, the Guarantors have agreed to guarantee, severally but not jointly, the due and punctual performance and discharge of the obligations of Parent and Merger Sub under the Merger Agreement to pay a termination fee of $275,000 to us, as and when due, the direct expenses incurred by Parent or Merger Sub in connection with the arrangement of the financing of the Merger, and certain reimbursement obligations of Parent and Merger Sub with respect to IMS, which direct expenses and reimbursement obligations shall not in the aggregate exceed $6,000.
The Merger Agreement contains certain termination rights for IMS and Parent. If the Merger Agreement is terminated, under certain specified circumstances in the Merger Agreement, we may be required to pay a termination fee equal to $115,000, in addition to reimbursing Parent for all out-of-pocket fees and expenses incurred by Parent or Merger Sub in connection with the Merger Agreement or the transactions contemplated therein up to $5,000. In the event we terminate the Merger Agreement due to certain actions or inactions by Parent, Parent must pay us a fee of $275,000, less the sum of amounts paid by Parent with respect to Parent's liability for certain reimbursement obligations and certain direct expenses incurred by Parent in connection with the financing up to $6,000 in the aggregate.
For further information regarding the Merger Agreement, please refer to the Merger Agreement and the Definitive Proxy Statement on Schedule 14A filed with the SEC by IMS on December 29, 2009, which are incorporated by reference as exhibits to this Annual Report on Form 10-K.
PERFORMANCE OVERVIEW
Operating revenue declined 6.0% to $2,189,745 in 2009 compared to $2,329,528 in 2008. The decrease in our operating revenue resulted from revenue declines in all three of our business lines. Our operating income decreased 45.6% to $270,888 in 2009 compared to $498,305 in 2008. The decrease in
25
operating income was a result of decreased operating revenue, an increase of $134,877 in severance, impairment and other charges and a related $4,190 non-cash charge for accelerated depreciation and $11,000 of merger costs, partially offset by decreases in our operating costs, as discussed below. Our net income attributable to IMS was $258,455 in 2009, a decrease of $52,795 as compared to $311,250 in 2008, due to the decrease in operating income, partially offset by a decrease in the Non-Operating Loss, net items discussed below and certain tax items as discussed in Note 12 of the Consolidated Financial Statements. Our diluted earnings per share of Common Stock decreased to $1.42 for 2009 as compared to $1.70 for 2008.
Results of Operations
RECLASSIFICATIONS. Certain prior-year amounts have been reclassified to conform to the 2009 presentation.
REFERENCES TO CONSTANT DOLLAR RESULTS AND RESULTS EXCLUDING THE EFFECT OF FOREIGN CURRENCY TRANSLATIONS. We report results in U.S. dollars, but we do business on a global basis. Exchange rate fluctuations affect the rate at which we translate foreign revenues and expenses into U.S. dollars and may have significant effects on our results. In order to illustrate these effects, the discussion of our business in this report sometimes describes the magnitude of changes in constant dollar terms or results excluding the effect of foreign currency translations. We believe this information facilitates a comparative view of our business. See "How Exchange Rates Affect Our Results" and the discussion of "Market Risk" in the Management's Discussion and Analysis of Financial Condition and Results of Operations section below for a more complete discussion regarding the impact of foreign currency translation on our business.
REFERENCES TO SELLING AND ADMINISTRATIVE EXPENSES, OPERATING INCOME AND OPERATING MARGIN EXCLUDING SEVERANCE, IMPAIRMENT AND OTHER CHARGES, NON-CASH CHARGES FOR ACCELERATED DEPRECIATION AND AMORTIZATION, MERGER COSTS AND THE GOVERNMENT SOLUTIONS CHARGE. We discuss below what our selling and administrative expenses, operating income and operating margin for the years ended December 31, 2009, 2008 and 2007 would have been had we not recorded severance, impairment and other charges, non-cash charges for accelerated depreciation and amortization, merger costs and the Government Solutions charge. Because we did not record similar charges in the prior periods, we believe providing these non-GAAP measures is useful to investors as it facilitates comparisons across the periods presented and more clearly indicates trends. Management uses these non-GAAP measures in its global decision-making,
26
including developing budgets and managing expenditures. See "Reconciliation of U.S. GAAP Measures to Non-GAAP Measures" at the end of this Item 7.
| |
|
|
|
% Variance | ||||||||||||
|---|---|---|---|---|---|---|---|---|---|---|---|---|---|---|---|---|
| |
Years ended December 31, | |||||||||||||||
| |
2009 vs. 2008 |
2008 vs. 2007 |
||||||||||||||
| |
2009 | 2008 | 2007 | |||||||||||||
Information and analytics revenue (I&A) |
$ | 1,706,744 | $ | 1,787,487 | $ | 1,700,244 | (4.5 | )% | 5.1 | % | ||||||
Consulting and services revenue (C&S) |
483,001 | 542,041 | 492,327 | (10.9 | ) | 10.1 | ||||||||||
Operating Revenue |
2,189,745 | 2,329,528 | 2,192,571 | (6.0 | ) | 6.2 | ||||||||||
Operating costs of I&A |
715,766 | 756,987 | 713,168 | 5.4 | (6.1 | ) | ||||||||||
Direct and incremental costs of C&S |
250,411 | 275,246 | 244,289 | 9.0 | (12.7 | ) | ||||||||||
External-use software amortization |
40,361 | 49,728 | 48,609 | 18.8 | (2.3 | ) | ||||||||||
Selling and administrative expenses |
661,510 | 650,218 | 626,888 | (1.7 | ) | (3.7 | ) | |||||||||
Depreciation and other amortization |
95,524 | 89,636 | 77,648 | (6.6 | ) | (15.4 | ) | |||||||||
Severance, impairment and other charges |
144,285 | 9,408 | 88,690 | — | — | |||||||||||
Merger costs |
11,000 | — | — | — | — | |||||||||||
Operating Income |
$ | 270,888 | $ | 498,305 | $ | 393,279 | (45.6 | )% | 26.7 | % | ||||||
OPERATING INCOME
Our operating income for 2009 declined $227,417 to $270,888 from $498,305 in 2008. This was due to the decrease in our operating revenue, an increase of $134,877 in severance, impairment and other charges and a related $4,190 non-cash charge for accelerated depreciation and amortization (see Note 6 to our Consolidated Financial Statements), an increase in our selling and administrative expenses and $11,000 of merger costs related to the proposed acquisition of IMS by Healthcare Technology Holdings, Inc., an entity created by certain affiliates of TPG Capital, L.P. and the Canada Pension Plan Investment Board (see Note 16 to our Consolidated Financial Statements), partially offset by decreases in our operating costs driven by decreased cost of data and tight controls on hiring. Our operating income decreased $249,301 or 54.4% in constant dollar terms. Absent the impact of severance, impairment and other charges in 2009 and 2008 and the related non-cash charge for accelerated depreciation and amortization in 2009, the merger costs in 2009 and the 2008 Government Solutions charge of $3,748 (see Note 15 to our Consolidated Financial Statements), non-GAAP operating income would have decreased 15.9% at reported rates and 22.6% in constant dollar terms from 2008 (see "Reconciliation of U.S. GAAP Measures to Non-GAAP Measures" at the end of this Item 7).
Our operating income for 2008 grew 26.7% to $498,305 from $393,279 in 2007. This was due to the increase in our operating revenue and decreases in severance, impairment and other charges, offset by increases in operating costs and selling and administrative expenses driven by increased cost of data, investments in consulting and services ("C&S") capabilities and expense associated with a charge related to our Government Solutions business (see Note 15 to our Consolidated Financial Statements). Our 2008 operating income increased 18.3% in constant dollar terms from 2007. Absent the impact of 2008 impairment charges associated with the write-off of certain capitalized software assets resulting from the discontinuation of certain products (See Note 6 to our Consolidated Financial Statements), the Government Solutions charge and 2007 severance, impairment and other charges, non-GAAP operating income would have increased by 6.1% at reported exchange rates and remained flat in constant dollar terms (see "Reconciliation of U.S. GAAP Measures to Non-GAAP Measures" at the end of this Item 7).
27
OPERATING REVENUE
Our operating revenue for 2009 declined 6.0% to $2,189,745 from $2,329,528 in 2008 and grew 6.2% in 2008 to $2,329,528 from $2,192,571 in 2007. On a constant dollar basis our operating revenue declined 4.1% in 2009 and grew 3.1% in 2008. On a constant dollar basis, acquisitions completed in 2008 contributed approximately 0.5 percentage points of revenue growth during 2009, partially offsetting our operating revenue decline. On a constant dollar basis, acquisitions completed in 2008 and 2007 contributed approximately 2.0 percentage points of our operating revenue growth during 2008. The decrease in our operating revenue for 2009 resulted from revenue declines in all three of our business lines, together with the effect of approximately $49,000 of currency translation for 2009 as compared to 2008. The increase in our operating revenue for 2008 resulted from growth in revenue due to higher purchases of products and C&S offerings from existing customers in all three of our business lines, together with the effect of approximately $70,000 of currency translation for 2008 as compared to 2007.
SUMMARY OF OPERATING REVENUE
| |
|
|
|
% Variance 2009 vs. 2008 |
% Variance 2008 vs. 2007 |
|||||||||||||||||
|---|---|---|---|---|---|---|---|---|---|---|---|---|---|---|---|---|---|---|---|---|---|---|
| |
Years ended December 31, | |||||||||||||||||||||
| |
|
Constant Dollar |
|
Constant Dollar |
||||||||||||||||||
| |
2009 | 2008 | 2007 | Reported | Reported | |||||||||||||||||
Commercial Effectiveness |
$ | 1,103,896 | $ | 1,153,501 | $ | 1,112,995 | (4.3 | )% | (3.1 | )% | 3.6 | % | 0.2 | % | ||||||||
Product & Portfolio Management |
683,854 | 721,357 | 704,898 | (5.2 | ) | (3.0 | ) | 2.3 | (0.5 | ) | ||||||||||||
New Business Areas |
401,995 | 454,670 | 374,678 | (11.6 | ) | (8.3 | ) | 21.3 | 18.8 | |||||||||||||
Operating Revenue |
$ | 2,189,745 | $ | 2,329,528 | $ | 2,192,571 | (6.0 | )% | (4.1 | )% | 6.2 | % | 3.1 | % | ||||||||
- •
- Commercial
Effectiveness: EMEA contributed more than one-half and the Americas contributed more than one-third to the
constant dollar revenue decline in 2009. The Americas and Asia Pacific each contributed approximately one-half to the constant dollar revenue growth in 2008.
- •
- Product & Portfolio
Management: EMEA contributed more than one-half and the Americas contributed more than one-third to the constant
dollar revenue decline in 2009. Asia Pacific was the primary contributor to the constant dollar revenue growth in 2008 offset by the revenue decline in EMEA.
- •
- New Business Areas: EMEA and the Americas each contributed approximately one-half toward the constant dollar revenue decline in 2009. The Americas and EMEA each contributed approximately one-half to the constant dollar revenue growth in 2008.
C&S revenue, as included in the business lines above, was $483,001 in 2009, down 10.9% from $542,041 in 2008 (down 8.7% on a constant dollar basis). C&S revenue was $542,041 in 2008, up 10.1% from $492,327 in 2007 (up 7.7% on a constant dollar basis).
OPERATING COSTS OF INFORMATION AND ANALYTICS
Operating costs of information and analytics ("I&A") include costs of data, data processing and collection and costs attributable to personnel involved in production, data management and delivery of our I&A offerings.
Our operating costs of I&A declined 5.4% to $715,766 in 2009 from $756,987 in 2008. In 2008, our operating costs of I&A grew 6.1% to $756,987 from $713,168 in 2007.
- •
- Foreign Currency Translation: The effect of foreign currency translation decreased our operating costs of I&A by approximately $25,000 in 2009 as compared to 2008 and increased our operating costs of I&A by approximately $22,000 for 2008 as compared to 2007.
28
Excluding the effect of foreign currency translation, our operating costs of I&A declined 2.2% in 2009 as compared to 2008 and grew 3.2% in 2008 compared to 2007.
- •
- Data: Data costs decreased by approximately $16,000 in 2009 as compared to 2008 and
increased by approximately $26,000 in 2008 as compared to 2007.
- •
- Production, Client Services and Other: Production, client services and other costs remained relatively constant in 2009 compared to 2008 and decreased by approximately $3,000 in 2008 compared to 2007.
DIRECT AND INCREMENTAL COSTS OF CONSULTING AND SERVICES
Direct and incremental costs of C&S include the costs of consulting staff directly involved with delivering revenue-generating engagements, related accommodations and the costs of primary market research data purchased specifically for certain individual C&S engagements. Direct and incremental costs of C&S do not include an allocation of direct costs of data that are included within I&A.
Our direct and incremental costs of C&S declined 9.0% to $250,411 in 2009 from $275,246 in 2008. Our direct and incremental costs of C&S grew 12.7% to $275,246 in 2008 from $244,289 in 2007.
- •
- Foreign Currency Translation: The effect of foreign currency translation decreased our direct and incremental costs of C&S by approximately $13,000 in 2009 as compared to 2008 and increased our direct and incremental costs of C&S by approximately $6,000 in 2008 as compared to 2007.
Excluding the effect of foreign currency translation, our direct and incremental costs of C&S declined 4.5% in 2009 compared to 2008 and grew 10.3% in 2008 as compared to 2007.
- •
- C&S costs decreased by approximately $12,000 in 2009 as compared to 2008 due to decreased labor cost. C&S costs increased by approximately $24,000 in 2008 as compared to 2007 due to increased labor, accommodations and primary market research data expense, all directly related to C&S revenue growth.
EXTERNAL-USE SOFTWARE AMORTIZATION
Our external-use software amortization charges represent the amortization associated with capitalized software to be sold, leased, or otherwise marketed. Our external-use software amortization charges declined 18.8% to $40,361 in 2009 from $49,728 in 2008 due to decreased software amortization associated with assets that were fully amortized or written-down to their net realizable values. Our external-use software amortization charges grew 2.3% to $49,728 in 2008 from $48,609 in 2007 due to increased software amortization associated with new products.
SELLING AND ADMINISTRATIVE EXPENSES
Our selling and administrative expenses consist primarily of the expenses attributable to sales, marketing and administration, including human resources, legal, management and finance. Our selling and administrative expenses grew 1.7% in 2009, to $661,510 from $650,218 in 2008. Absent the 2008 Government Solutions charge (see Note 15 to our Consolidated Financial Statements), our non-GAAP selling and administrative expenses would have grown 2.3% in 2009 compared to 2008 (see "Reconciliation of U.S. GAAP Measures to Non-GAAP Measures" at the end of this Item 7). Our selling and administrative expenses grew 3.7% in 2008, to $650,218 from $626,888 in 2007. Absent the 2008 Government Solutions charge, our non-GAAP selling and administrative expenses would have
29
grown 3.1% in 2008 compared to 2007 (see "Reconciliation of U.S. GAAP Measures to Non-GAAP Measures" at the end of this Item 7).
- •
- Foreign Currency Translation: The effect of foreign currency translation decreased our selling and administrative expenses by approximately $32,000 for 2009 as compared to 2008 and increased our selling and administrative expenses by approximately $9,000 in 2008 as compared to 2007.
Excluding the effect of foreign currency translation and the Government Solutions charge, our selling and administrative expenses grew 7.5% in 2009 compared to 2008. Excluding the effect of foreign currency translation and the Government Solutions charge, our selling and administrative expenses grew 1.6% in 2008 compared to 2007.
- •
- Sales and
Marketing: Sales and marketing expense decreased by approximately $8,000 in 2009 as compared to 2008 and decreased by approximately
$5,000 in 2008 as compared to 2007.
- •
- Consulting and
Services: C&S expenses increased by approximately $15,000 in 2009 as compared to 2008. Absent the Government Solutions charge, C&S
expenses would have increased by approximately $19,000 in 2009 as compared to 2008. C&S expenses increased by approximately $2,000 in 2008 as compared to 2007. Absent the Government Solutions charge,
C&S expenses would have decreased by approximately $2,000 in 2008 as compared to 2007.
- •
- Administrative and Other: Administrative and other expenses increased by approximately $37,000 in 2009 as compared to 2008 and increased by approximately $18,000 in 2008 as compared to 2007.
DEPRECIATION AND OTHER AMORTIZATION
Our depreciation and other amortization charges increased 6.6% to $95,524 in 2009 from $89,636 in 2008 primarily due to $4,190 of accelerated depreciation and amortization recorded in 2009 related to exited facilities as part of the streamlining program noted below. Our depreciation and other amortization charges increased 15.4% to $89,636 in 2008 from $77,648 in 2007 due to increased depreciation related to new facilities and technology to upgrade our financial systems and increased amortization related to internal-use software.
SEVERANCE, IMPAIRMENT AND OTHER CHARGES
During the third and fourth quarters of 2009, we recorded $105,573 in charges as a component of operating income for employee termination benefits and facility exit costs related to the streamlining program announced by us in July 2009 in response to accelerating healthcare marketplace dynamics compounded by a sustained economic downturn. Additionally, during the second and fourth quarters of 2009, we recorded $38,712 in charges as a component of operating income, of which $28,480 related to non-cash impairment charges for the write-down of certain assets in all regions to their net realizable values, $8,218 related to supplier contract-related charges for which we will not realize any future economic benefit, $2,904 related to capital contributed by selling shareholders of a previously acquired business and $890 of reversals related to our 2007 restructuring plan. During the fourth quarter of 2008, we recorded a $9,408 non-cash charge in severance, impairment and other charges related to the write-off of certain capitalized software assets resulting from the discontinuation of certain of our products in our EMEA region and Japan at the end of 2008. During the fourth quarter of 2007, we recorded $88,690 in charges as a component of operating income related to a plan to streamline the business. The charge consisted of termination benefits, asset impairment charges and related contract payments to be incurred with no future economic benefit based on our decision to abandon certain products in our EMEA region. See Note 6 to our Consolidated Financial Statements.
30
MERGER COSTS
In the fourth quarter of 2009, we recorded $11,000 of expense primarily for professional services consisting of investment banker, legal and accounting fees related to the proposed acquisition of IMS. See Note 16 to our Consolidated Financial Statements.
TRENDS IN OUR OPERATING MARGINS
Our operating margin for 2009 was 12.4%, as compared to 21.4% in 2008. Margins were negatively impacted by revenue declines, the severance, impairment and other charges and related accelerated depreciation and amortization and merger costs, partially offset by decreased costs of data and decreased sales and marketing costs. Excluding the severance, impairment and other charges and related accelerated depreciation and amortization, the 2009 merger costs and the 2008 charge related to our Government Solution business, our non-GAAP operating margin decreased from 22.0% in 2008 to 19.7% in 2009 (see "Reconciliation of U.S. GAAP Measures to Non-GAAP Measures" at the end of this Item 7).
Our operating margin for 2008 was 21.4%, as compared to 17.9% in 2007. In 2008 and 2007 we incurred severance, impairment and other charges of $9,408 and $88,690, respectively, as discussed above. In addition, in 2008 we incurred a $3,748 charge related to our Government Solution business. Excluding these charges, our non-GAAP operating margin remained constant at 22.0% in 2008 compared to 2007 (see "Reconciliation of U.S. GAAP Measures to Non-GAAP Measures" at the end of this Item 7). In addition, our 2008 margins were negatively impacted by increased cost of data and our continuing investments in new products and C&S capabilities.
We have several offerings in the U.S. that utilize prescriber-identifiable information. Over the past several years, there have been a number of state legislative initiatives seeking to impose restrictions on the commercial use of such information. To date, three states, New Hampshire, Vermont and Maine, have passed laws placing certain restrictions on the license, use or transfer of prescriber-identifiable information for commercial purposes. Collectively, these three states represent approximately one percent of prescription activity in the U.S. and therefore the impact of these laws on our business, financial condition and results of operations is not expected to be material. For additional information regarding the status of the laws passed in the three states noted above and related legislative developments in other jurisdictions, see Part II. Item 1A. Risk Factors.
NON-OPERATING LOSS, NET
Our non-operating loss, net decreased to $34,274 in 2009 from $75,513 in 2008. Our non-operating loss, net increased to $75,513 in 2008 from $35,888 in 2007. The annual changes were due to the following factors:
Interest Expense, net: Net interest expense was $33,009 in 2009, compared with $34,451 in 2008 due to lower debt levels and lower borrowing costs. Net interest expense was $34,451 in 2008, compared with $29,746 in 2007 due to higher debt levels.
Gains from Investments, net: Gains from investments, net, totaled $41 in 2009, compared to $379 in 2008 and $2,317 in 2007. The net gains in 2009 and 2008 were the result of the sale of marketable securities. The net gain in 2007 was the result of the final distribution from our Enterprise portfolio, offset by related management fees, and the sale of marketable securities and venture capital investments.
Other Expense, net: Other expense, net, decreased by $40,135 in 2009 to $1,306 from $41,441 in 2008. This decrease was a result of net foreign exchange losses of $3,400, partially offset by $2,342 of gains on the sale of assets in 2009 as compared to net foreign exchange losses of $29,260, partially
31
offset by $4,041 of gains on the sale of assets in 2008. In addition, this decrease was the result of a foreign exchange loss of $16,071 in 2008 related to the liquidation of non-functional currency Venezuela Bolívars held at our Swiss operating subsidiary (see Note 9 to our Consolidated Financial Statements). Other expense, net, increased by $32,982 in 2008 to $41,441 from $8,459 in 2007. This increase was the result of net foreign exchange losses of $29,260 in 2008 compared with net foreign exchange losses of $9,565 in 2007 and the foreign exchange loss of $16,071 related to the liquidation of non-functional currency Venezuela Bolívars held at our Swiss operating subsidiary, partially offset by gains on the sale of assets (see Note 4 to our Consolidated Financial Statements) in 2008.
TAXES
Our effective tax rate was (10.2%) in 2009, compared with 25.1% in 2008 and 33.0% in 2007. Our effective tax rate for 2009 was favorably impacted by $12,200 as a result of reorganizations of certain non-U.S. subsidiaries, $69,300 due to foreign exchange losses recognized for tax purposes, $21,900 as a result of the expiration of certain statutes of limitation and $16,300 from the settlement of a certain state tax matter. For the twelve months ended December 31, 2009, we recorded $18,500 of tax expense related to unrecognized tax benefits that if recognized, would favorably affect the effective tax rate. Included in this amount is $3,800 of interest and penalties. As of December 31, 2009, we had $10,700 recorded for interest and penalties.
The effective tax rate for 2008 was favorably impacted by $20,700 as a result of a non-U.S. reorganization involving several IMS subsidiaries, $11,000 due to audit settlements with taxing authorities, $9,700 as a result of the termination of a non-U.S. agreement, $9,700 in connection with the resolution of certain legacy tax matters (see Note 15 to our Consolidated Financial Statements) and $4,400 due to the expiration of certain statutes of limitation. For the twelve months ended December 31, 2008, we recorded $18,800 of tax expense related to unrecognized tax benefits that if recognized, would favorably affect the effective tax rate. Included in this amount is $9,200 of interest and penalties. As of December 31, 2008, we had $19,600 recorded for interest and penalties.
The effective tax rate for 2007 was impacted by a tax reduction of $16,500 arising from a favorable non-U.S. audit settlement for tax years 1998 through 2002, a tax charge of $7,500 to revalue net deferred tax assets arising from the reduction of the German federal tax rate from 25% to 15% and a tax reduction of $12,440 arising from a reorganization of certain non-U.S. subsidiaries.
On January 1, 2007, we adopted authoritative guidance related to accounting for uncertainty in income taxes. As a result of this adoption, we recognized an increase in liabilities for uncertain tax positions of $51,800 and a corresponding reduction to the January 1, 2007 retained earnings balance. As of the adoption date, we had $117,200 of gross unrecognized tax benefits and interest and penalties of $13,500. For the twelve months ended December 31, 2007, we recorded $21,100 of tax expense related to uncertain tax positions that if recognized, would favorably affect the effective tax rate. Included in this amount is $12,600 of interest and penalties. We recognize interest expense and penalties related to unrecognized tax benefits in income tax expense.
We file numerous consolidated and separate income tax returns in the U.S. (federal and state) and non-U.S. jurisdictions. We are no longer subject to U.S. federal income tax examination by tax authorities for years before 2006. We are no longer subject to state and local income tax examination by tax authorities for years before 1997. Further, with few exceptions, we are no longer subject to examination by tax authorities in our material non-U.S. jurisdictions prior to 2004. It is reasonably possible that within the next twelve months we could realize $32,400 of unrecognized tax benefits as a result of the expiration of certain statutes of limitation.
For all periods presented, our effective tax rate was reduced as a result of global tax planning initiatives. While we intend to continue to seek global tax planning initiatives, there can be no assurance that we will be able to successfully identify and implement such initiatives to reduce or maintain our overall tax rate.
32
OPERATING RESULTS BY GEOGRAPHIC REGION
The following represents selected geographic information for the regions in which we operate as of and for the years ended December 31, 2009, 2008 and 2007.
| |
Americas(1) | EMEA(2) | Asia Pacific(3) |
Corporate & Other |
Total IMS | |||||||||||
|---|---|---|---|---|---|---|---|---|---|---|---|---|---|---|---|---|
Year Ended December 31, 2009: |
||||||||||||||||
Operating Revenue(4) |
$ | 966,314 | $ | 880,887 | $ | 342,544 | — | $ | 2,189,745 | |||||||
Operating Income (Loss)(5) |
$ | 279,422 | $ | 113,890 | $ | 120,533 | $ | (242,957 | ) | $ | 270,888 | |||||
Total Assets |
$ | 714,477 | $ | 962,279 | $ | 241,554 | $ | 304,405 | $ | 2,222,715 | ||||||
Year Ended December 31, 2008: |
||||||||||||||||
Operating Revenue(4) |
$ | 1,017,424 | $ | 984,385 | $ | 327,719 | — | $ | 2,329,528 | |||||||
Operating Income (Loss)(5) |
$ | 314,005 | $ | 125,364 | $ | 121,475 | $ | (62,539 | ) | $ | 498,305 | |||||
Total Assets |
$ | 779,437 | $ | 848,014 | $ | 225,556 | $ | 234,130 | $ | 2,087,137 | ||||||
Year Ended December 31, 2007: |
||||||||||||||||
Operating Revenue(4) |
$ | 975,754 | $ | 925,405 | $ | 291,412 | — | $ | 2,192,571 | |||||||
Operating Income (Loss)(5) |
$ | 326,283 | $ | 117,610 | $ | 111,119 | $ | (161,733 | ) | $ | 393,279 | |||||
Total Assets |
$ | 773,857 | $ | 982,998 | $ | 216,021 | $ | 271,328 | $ | 2,244,204 | ||||||
Notes to Geographical Financial Information:
- (1)
- Americas
includes the U.S., Canada and Latin America. Operating Revenue in the U.S. was $801,661, $842,004 and $801,017 in 2009, 2008 and 2007,
respectively, and Total Assets were $563,782, $644,786 and $613,146 in 2009, 2008 and 2007, respectively.
- (2)
- EMEA
includes countries in Europe, the Middle East and Africa.
- (3)
- Asia
Pacific includes Japan, Australia and other countries in the Asia Pacific region.
- (4)
- Operating
Revenue relates to external customers and is based on the location of the customer. The Operating Revenue for the geographic regions includes the
impact of foreign exchange in converting results into U.S. dollars.
- (5)
- Operating Income for the three geographic regions does not reflect the allocation of certain expenses that are maintained in Corporate and Other and as such, is not a true measure of the respective regions' profitability. The Operating Income amounts for the geographic segments include the impact of foreign exchange in converting results into U.S. dollars. For the year ended December 31, 2009, Severance, impairment and other charges of $20,946, $109,033 and $2,613 for the Americas, EMEA and Asia Pacific, respectively, are presented in Corporate and Other. For the year ended December 31, 2008, Severance, impairment and other charges of $4,684 and $4,724 for EMEA and Asia Pacific, respectively, are presented in Corporate & Other. For the year ended December 31, 2007, Severance, impairment and other charges of $16,217, $62,849 and $4,386 for the Americas, EMEA and Asia Pacific, respectively, are presented in Corporate and Other.
AMERICAS REGION
Operating revenue in the Americas region declined 5.0% in 2009 compared to 2008 and grew 4.3% in 2008 versus 2007. Excluding the effect of foreign currency translations, operating revenue declined 4.0% in 2009 compared to 2008 and grew 4.1% in 2008 compared to 2007. The revenue decline in 2009 was driven more than one-third by each of Commercial Effectiveness and New Business Areas. The revenue growth in 2008 was driven more than three-quarters by New Business Areas.
Operating income in the Americas region declined 11.0% in 2009 compared to 2008 and 3.8% in 2008 compared to 2007. The operating income decline in 2009 compared to 2008 reflects revenue
33
decline in the region partially offset by decreases in operating expenses of $17,000. Excluding the effect of foreign currency translations and the Government Solutions charge in 2008 (see Note 15 to our Consolidated Financial Statements), operating income declined by 11.4% in 2009 as compared to 2008.
EMEA REGION
Operating revenue in the EMEA region declined 10.5% in 2009 compared to 2008 and grew 6.4% in 2008 versus 2007. Excluding the effect of foreign currency translations, operating revenue declined 5.7% in 2009 compared to 2008 and grew 1.5% in 2008 compared to 2007. The revenue decline in 2009 was driven more than one-third by each of Commercial Effectiveness and New Business Areas and approximately one-quarter by Product & Portfolio Management. The growth in 2008 was driven by New Business Areas.
Operating income in the EMEA region declined 9.2% in 2009 compared to 2008 and grew 6.6% in 2008 compared to 2007. The operating income decline reflects revenue declines in the region offset by decreases in operating expenses of $92,000. Excluding the effect of foreign currency translations, operating income declined by 29.4% in 2009 as compared to 2008.
ASIA PACIFIC REGION
Operating revenue in the Asia Pacific region grew by 4.5% in 2009 compared to 2008 and 12.5% in 2008 compared to 2007. Excluding the effect of foreign currency translations, operating revenue grew 0.3% in 2009 compared to 2008 and 5.0% in 2008 compared to 2007. The constant dollar revenue growth in 2009 was driven by Commercial Effectiveness, partially offset by revenue decline in Product & Portfolio Management and New Business Areas. The revenue growth in 2008 was driven approximately one-half by each the Commercial Effectiveness and Product & Portfolio Management business lines.
Operating income in the Asia Pacific region decreased by 0.8% in 2009 compared to 2008 and increased 9.3% in 2008 compared to 2007. The decline in operating income reflects revenue growth in the region offset by increases in operating expenses of $16,000. Excluding the effect of foreign currency translations, operating income declined by 6.5% in 2009 compared to 2008.
How Exchange Rates Affect Our Results
We operate globally, deriving a significant portion of our operating income from non-U.S. operations. As a result, fluctuations in the value of foreign currencies relative to the U.S. dollar may increase the volatility of U.S. dollar operating results. We enter into foreign currency forward contracts to partially offset the effect of currency fluctuations. In 2009, foreign currency translation increased U.S. dollar revenue decline by approximately 1.9 percentage points, while the impact on operating income decline was an approximate decrease of 8.8 percentage points. In 2008, foreign currency translation increased U.S. dollar revenue growth by approximately 3.1 percentage points, while the impact on operating income growth was an approximate increase of 8.4 percentage points.
Non-U.S. monetary assets are maintained in currencies other than the U.S. dollar, principally the Euro, the Japanese Yen and the Swiss Franc. Where monetary assets are held in the functional currency of the local entity, changes in the value of these currencies relative to the U.S. dollar are charged or credited to Cumulative translation adjustment in the Consolidated Statements of Shareholders' Equity (Deficit). The effect of exchange rate changes during 2009 increased the U.S. dollar amount of Cash and cash equivalents by $16,788. The effect of exchange rate changes during 2008 decreased the U.S. dollar amount of Cash and cash equivalents by $14,529. The effect of exchange rate changes during 2007 increased the U.S. dollar amount of Cash and cash equivalents by $17,442.
34
Liquidity and Capital Resources
Cash and cash equivalents increased $164,661 to $380,343 at December 31, 2009 compared to $215,682 at December 31, 2008. The increase reflects cash provided by operating activities of $542,588 and an increase of $16,788 due to the effect of exchange rate changes, partially offset by cash used in investing and financing activities of $119,757 and $274,958, respectively.
We currently expect that we will use our Cash and cash equivalents primarily to fund:
- •
- development of software to be used in our new products and capital expenditures to expand and upgrade our information
technology capabilities and to build or acquire facilities to house our business (we currently expect to spend approximately $95,000 to $115,000 over the next twelve months for software development
and capital expenditures);
- •
- payments of approximately $107,000 related to our restructuring plans and our second quarter 2009 supplier
contract-related charge, of which approximately $79,000 is expected to be paid over the next twelve months (see Note 6 to our Consolidated Financial Statements);
- •
- dividends to our shareholders (we expect that dividends will be $0.12 per share or approximately $22,000 over the next
twelve months);
- •
- pension and other postretirement benefit plan contributions (we currently expect contributions to U.S. and
non-U.S. pension and other postretirement benefit plans to total approximately $13,700 in 2010) (see Note 10 to our Consolidated Financial Statements for information regarding our
pension and postretirement benefit plan expense);
- •
- acquisitions (see Note 4 to our Consolidated Financial Statements); and
- •
- share repurchases (see Note 14 to our Consolidated Financial Statements).
Net cash provided by operating activities amounted to $542,588 for the year ended December 31, 2009, which represented an increase of $121,934 compared to cash provided by operating activities during the comparable period in 2008. The increase relates to higher accrued severance, impairment and other charges (see Note 6 to our Consolidated Financial Statements), higher deferred revenue balances, lower funding of accrued expenses and other current liabilities, lower accounts receivable balances and lower funding of prepaid expenses and other current assets, partially offset by lower accrued taxes, lower net income and higher funding of accounts payable during the year ended December 31, 2009. The decrease in accounts receivable was driven by a decrease in DSO (days sales outstanding), which was six days lower in 2009 as compared to 2008. The decrease in DSO was the result of stronger collections, improved receivables management and lower revenue.
Net cash used in investing activities amounted to $119,757 for the year ended December 31, 2009, a decrease in cash used of $58,357 over the comparable period in 2008. The decrease relates to lower payments for acquisitions and lower capital expenditures, partially offset by higher additions to computer software and an increase in restricted cash (see Note 2 to our Consolidated Financial Statements) during the year ended December 31, 2009 as compared to the comparable period in 2008.
Net cash used in financing activities amounted to $274,958 for the year ended December 31, 2009, an increase of $44,380 compared to cash used in financing activities during the comparable period in 2008. This increase was due to lower net borrowings of debt, the purchase of third-party ownership interests in IMS Health Licensing Associates, L.L.C. (see Note 7 to our Consolidated Financial Statements), a decrease in cash overdrafts and lower proceeds from the exercise of stock options, partially offset by the absence of purchases of treasury stock during the year ended December 31, 2009 as compared to the prior year comparable period.
Our financing activities include cash dividends we paid of $0.03 per share quarterly, which amounted to $21,762 and $22,183 during the year ended December 31, 2009 and 2008, respectively.
35
The payments and level of cash dividends made by us are subject to the discretion of our Board of Directors. Any future dividends will be based on, and affected by, a number of factors, including our operating results and financial requirements.
Capital and Credit Markets
As the capital and credit markets have contracted, we have performed additional assessments to determine the impact, if any, on our financial statements of recent market developments, including the restructuring or merging of certain financial institutions. Our additional assessments included a review of access to liquidity in the capital and credit markets and financial institution counterparty creditworthiness. Based on our assessment, we currently believe we have sufficient liquidity and access to credit despite the current condition of the capital and credit markets.
Liquidity in the Capital and Credit Markets
We fund our liquidity needs for capital investment, working capital, and other financial commitments through cash flow from continuing operations and our diversified credit facility ($571,089 in aggregate commitment available as of December 31, 2009). While not significant to us to date, contraction in capital and credit markets may result in increased borrowing costs in the future.
Credit Concentrations
We continually monitor our positions with, and the credit quality of, the financial institutions which are counterparties to our financial instruments and do not anticipate non-performance by the counterparties. We would not have realized a material loss during the year ended December 31, 2009 in the event of non-performance by any one counterparty. In general, we enter into transactions only with financial institution counterparties that have a credit rating of A or better. In addition, we limit the amount of credit exposure with any one institution. Particularly in light of the current credit environment, management will continue to monitor the status of these counterparties and will take action, as appropriate, to further manage its counterparty credit risk.
We maintain accounts receivable balances ($322,569 and $382,776, net of allowances, at December 31, 2009 and December 31, 2008, respectively), principally from customers in the pharmaceutical industry. Our trade receivables do not represent significant concentrations of credit risk at December 31, 2009 due to the credit worthiness of our customers and their dispersion across many geographic areas.
Tax and Other Contingencies
We are exposed to certain known tax and other contingencies that are material to our investors. The facts and circumstances surrounding these contingencies and a discussion of their effect on us are included in Notes 12 and 15 to our Consolidated Financial Statements.
These contingencies may have a material effect on our liquidity, capital resources or results of operations. In addition, even where our reserves are adequate, the incurrence of any of these liabilities may have a material effect on our liquidity and the amount of cash available to us for other purposes.
Management believes that we have made appropriate arrangements in respect of the future effect on us of these known tax and other contingencies. Management also believes that the amount of cash available to us from our operations, together with cash from financing, will be sufficient for us to pay any known tax and other contingencies as they become due without materially affecting our ability to conduct our operations and invest in the growth of our business.
36
Stock Repurchase Programs
Our share repurchase program has been developed to buy opportunistically, when we believe that our share price provides us with an attractive use of our cash flow and debt capacity.
On December 18, 2007, the Board of Directors authorized a stock repurchase program to buy up to 20,000 shares. As of December 31, 2009, 9,505 shares remained available for repurchase under the December 2007 program.
During 2009, we did not repurchase any shares of outstanding Common Stock under this program.
During 2008, we repurchased 10,495 shares of outstanding Common Stock under this program at a total cost of $238,046.
These shares repurchases positively impacted our diluted earnings per share by $0.06 for the year ended December 31, 2008.
Shares acquired through our repurchase programs described above are open-market purchases or privately negotiated transactions in compliance with SEC Rule 10b-18.
Under our Restated Certificate of Incorporation, as amended, we have the authority to issue 820,000 shares with a par value of $.01 per share of which 800,000 represent shares of Common Stock, 10,000 represent shares of preferred stock and 10,000 represent shares of Series Common Stock. The preferred stock and Series Common Stock can be issued with varying terms, as determined by the Board of Directors.
Debt
In recent years, we have increased debt levels to balance appropriately the objective of generating an attractive cost of capital with providing us with a reasonable amount of financial flexibility. At December 31, 2009, our debt totaled $1,244,653, and management does not believe that this level of debt poses a material risk to us due to the following factors:
- •
- in each of the last three years, we have generated strong net cash provided by operating activities in excess of $400,000;
- •
- at December 31, 2009, we had $380,343 in worldwide cash and cash equivalents;
- •
- at December 31, 2009, we had $571,089 of unused debt capacity under our existing bank credit facilities; and
- •
- we believe that we have the ability to obtain additional debt capacity outside of our existing debt arrangements.
37
The following table summarizes our long-term debt at December 31, 2009 and December 31, 2008:
| |
2009 | 2008 | ||||||
|---|---|---|---|---|---|---|---|---|
5.58% Private Placement Notes, principal payment of $105,000 due January 2015 |
$ | 105,000 | $ | 105,000 | ||||
5.99% Private Placement Notes, principal payment of $135,000 due January 2018 |
135,000 | 135,000 | ||||||
5.55% Private Placement Notes, principal payment of $150,000 due April 2016 |
150,000 | 150,000 | ||||||
1.70% Private Placement Notes, principal payment of 34,395,000 Japanese Yen due January 2013 |
375,742 | 381,304 | ||||||
Revolving Credit Facility: |
||||||||
Japanese Yen denominated borrowings at average floating rates of approximately 0.78% |
359,511 | 435,895 | ||||||
U.S. Dollar denominated borrowings at average floating rates of approximately 1.22% |
69,400 | 147,000 | ||||||
Bank Term Loan, principal payment of $50,000 due June 2011 at average floating rate of approximately 0.54% |
50,000 | 50,000 | ||||||
Total Long-Term Debt |
$ | 1,244,653 | $ | 1,404,199 | ||||
In February 2008, we closed a private placement transaction pursuant to which we issued $105,000 of seven-year debt at a fixed rate of 5.58%, and $135,000 of ten-year debt at a fixed rate of 5.99% to several highly rated insurance companies. We used the proceeds for share repurchases (see Note 14 to our Consolidated Financial Statements) and to refinance existing debt.
In July 2006, we entered into a $1,000,000 revolving credit facility with a syndicate of 12 banks ("Revolving Credit Facility") replacing our existing $700,000 facility. The terms of the Revolving Credit Facility extended the maturity of the facility in its entirety to a term of five years, maturing July 2011, reduced the borrowing margins, and increased subsidiary borrowing limits. Total borrowings under the Revolving Credit Facility were $428,911 and $582,895 at December 31, 2009 and December 31, 2008, respectively, all of which were classified as long-term. We define long-term lines as those where the lines are non-cancellable for more than 365 days from the balance sheet date by the financial institutions except for specified, objectively measurable violations of the provisions of the agreement. In general, rates for borrowing under the Revolving Credit Facility are LIBOR plus 55 basis points and can vary based on our Debt to EBITDA ratio. The weighted average interest rates for our lines were 0.85% and 1.36% at December 31, 2009 and December 31, 2008, respectively. In addition, we are required to pay a commitment fee on any unused portion of the facilities of 0.01%. At December 31, 2009, we had approximately $571,089 available under our existing bank credit facilities.
In June 2006, we closed a $50,000 three-year term loan with a bank. The term loan allows us to borrow at a floating rate with a lower borrowing margin than our revolving credit facility. The term loan also provides us with two one-year options to extend the term at our discretion. In August 2008, we exercised the first one-year option to extend the term through June 2010, and in June 2009 we exercised the second one-year option to extend the term through June 2011. We used the proceeds to refinance existing debt borrowed under the revolving credit facility.
In April 2006, we closed a private placement transaction pursuant to which we issued $150,000 of ten-year notes to two highly rated insurance companies at a fixed rate of 5.55%. We used the proceeds to refinance existing debt of $150,000 drawn under a short-term credit agreement with a bank in January 2006.
In January 2006, we closed a private placement transaction pursuant to which our Japanese subsidiary issued 34,395,000 Japanese Yen seven-year debt (equal to $300,000 at date of issuance) to
38
several highly rated insurance companies at a fixed rate of 1.70%. We used the proceeds to refinance existing debt in Japan.
Our financing arrangements provide for certain covenants and events of default customary for similar instruments, including in the case of our main bank arrangements, the private placement transactions, and the term loan, covenants to maintain specific ratios of consolidated total indebtedness to EBITDA and of EBITDA to certain fixed charges. At December 31, 2009, we were in compliance with these financial debt covenants.
Severance, Impairment and Other Charges
In response to accelerating healthcare marketplace dynamics compounded by a sustained economic downturn, during the third quarter of 2009, we committed to a streamlining program (the "Plan") designed to eliminate approximately 850 positions in all areas of our business and in all regions in which we operate; however, the majority of actions are planned for our EMEA region. As a result of our Plan to reduce and consolidate the number of operating units, the Plan further includes charges for certain real estate lease impairments along with related accelerated depreciation.
The actions under the Plan were intended to: 1) streamline our EMEA region organization, including right-sizing the headquarters function, reducing and consolidating the number of operating units across the region, and improving the productivity of production and development activities; 2) leverage the foundational investments in process improvements we have made to reduce costs and improve productivity in our Sales, Finance, Human Resources and Customer Delivery and Development organizations; 3) reduce capacity and align the size of the Sales and Management Consulting teams in areas of reduced client demand; and 4) continue to build and invest in high-value, strategic growth areas, which include extending our capabilities in specialty and patient-centered insights, in serving payers and governments, and in emerging markets for pharmaceuticals.
During the third quarter of 2009 we recorded $104,301 in Severance, impairment and other charges for employee termination benefits and facility exit costs and $2,024 in accelerated Depreciation and other amortization related to the facility exits. During the fourth quarter of 2009, we recorded an additional $1,272 in Severance, impairment and other charges for facility exit costs and $2,166 in accelerated Depreciation and other amortization related to the facility exits.
The severance benefits were calculated pursuant to the terms of established employee protection plans, in accordance with local statutory minimum requirements or individual employee contracts, as applicable. Employee termination actions under the Plan are expected to be completed by the end of the third quarter of 2010.
| |
Severance Related Reserves |
Facility Exit Charges |
Non-Cash Compensation Charges |
Currency Translation Adjustments |
Total | |||||||||||
|---|---|---|---|---|---|---|---|---|---|---|---|---|---|---|---|---|
Charge at August 31, 2009 |
$ | 100,653 | $ | 2,610 | $ | 1,038 | $ | — | $ | 104,301 | ||||||
Charge at December 31, 2009 |
— | 1,272 | — | — | 1,272 | |||||||||||
2009 utilization |
(9,709 | ) | (154 | ) | (1,038 | ) | — | (10,901 | ) | |||||||
Currency translation adjustments |
— | — | — | 760 | 760 | |||||||||||
Balance at December 31, 2009 |
$ | 90,944 | $ | 3,728 | $ | — | $ | 760 | $ | 95,432 | ||||||
39
We currently expect that cash outlays will be applied against the remaining balance in the 2009 charge at December 31, 2009 as follows:
Year Ended December 31,
|
Outlays | |||
|---|---|---|---|---|
2010 |
$ | 76,315 | ||
2011 |
15,603 | |||
2012 |
931 | |||
2013 |
343 | |||
2014 |
341 | |||
Thereafter |
1,899 | |||
Total |
$ | 95,432 | ||
During the second quarter of 2009, we recorded $25,428 in charges as a component of operating income. Of this amount, $17,210 related to non-cash impairment charges for the write-down of certain capitalized software assets to their net realizable values in our Americas and EMEA regions. The write-downs were the result of the regular review of our capitalized software assets. The remaining $8,218 was for supplier contract-related charges for which we will not realize any future economic benefit.
During the fourth quarter of 2009, we recorded $11,270 in charges as a component of operating income related to non-cash impairment charges for the write-down of certain capitalized software and prepaid assets to their net realizable values in our EMEA and Asia Pacific regions. The write-downs were the result of the regular review of our assets. Additionally, we recorded $2,904 in charges as a component of operating income related to capital contributed by selling shareholders of a previously acquired business.
During the fourth quarter of 2008, we recorded $9,408 of non-cash impairment charges as a component of operating income related to the write-off of certain capitalized software assets in our EMEA and Asia Pacific regions. This was the result of the discontinuation of certain IMS products at the end of 2008.
During the fourth quarter of 2007, we committed to a restructuring plan designed to eliminate approximately 1,070 positions worldwide in production and development, sales, marketing, consulting and services and administration. The plan also included the write-down of two impaired computer software assets and related contract payments to be incurred with no future economic benefit based on our decision to abandon certain products in our EMEA region. As a result, we recorded $88,690 of Severance, impairment and other charges as a component of operating income in the fourth quarter of 2007. The severance benefits were calculated pursuant to the terms of established employee protection plans, in accordance with local statutory minimum requirements or individual employee contracts, as applicable.
These charges were designed to strengthen client-facing operations worldwide, increase our operating efficiencies and streamline our cost structure. Some of the initiatives included in this plan are designed to better align our resources to help clients manage for change in a challenging climate.
40
The severance and contract payments portion of the charge was approximately $75,043 and will all be settled in cash. Termination actions under the plan have been completed.
| |
Severance Related Reserves |
Contract Related Reserves |
Asset Write-Downs |
Currency Translation Adjustments |
Total | |||||||||||
|---|---|---|---|---|---|---|---|---|---|---|---|---|---|---|---|---|
Charge at December 31, 2007 |
$ | 71,583 | $ | 3,460 | $ | 13,647 | $ | — | $ | 88,690 | ||||||
2007 utilization |
— | — | (13,647 | ) | — | (13,647 | ) | |||||||||
2008 utilization |
(48,645 | ) | (2,150 | ) | — | — | (50,795 | ) | ||||||||
2009 utilization |
(17,189 | ) | (817 | ) | — | — | (18,006 | ) | ||||||||
2009 reversals |
(397 | ) | (493 | ) | — | — | (890 | ) | ||||||||
Currency translation adjustments |
— | — | — | (1,825 | ) | (1,825 | ) | |||||||||
Balance at December 31, 2009 |
$ | 5,352 | $ | — | $ | — | $ | (1,825 | ) | $ | 3,527 | |||||
We currently expect that cash outlays will be applied against the remaining balance in the 2007 charge at December 31, 2009 as follows:
Year Ended December 31,
|
Outlays | |||
|---|---|---|---|---|
2010 |
$ | 2,675 | ||
2011 |
717 | |||
2012 |
135 | |||
Total |
$ | 3,527 | ||
Contractual Obligations
Our contractual obligations include facility leases, agreements to purchase data and telecommunications services, leases of certain computer and other equipment and projected pension and other postretirement benefit plan contributions. At December 31, 2009, the minimum annual payment under these agreements and other contracts that have initial or remaining non-cancelable terms in excess of one year are as listed in the following table:
| |
Year | |||||||||||||||||||||
|---|---|---|---|---|---|---|---|---|---|---|---|---|---|---|---|---|---|---|---|---|---|---|
| |
2010 | 2011 | 2012 | 2013 | 2014 | Thereafter | Total | |||||||||||||||
Operating Leases(1) |
$ | 38,467 | $ | 35,784 | $ | 28,930 | $ | 19,246 | $ | 14,492 | $ | 42,987 | $ | 179,906 | ||||||||
Data Acquisition and Telecommunication Services(2) |
178,337 | 125,229 | 81,730 | 43,755 | 23,959 | 1,703 | 454,713 | |||||||||||||||
Computer and Other Equipment Leases(3) |
22,766 | 16,017 | 7,773 | 4,661 | 2,055 | 631 | 53,903 | |||||||||||||||
Projected Pension and Other Postretirement Benefit Plan Contributions(4) |
13,700 | — | — | — | — | — | 13,700 | |||||||||||||||
Long-term Debt(5) |
29,431 | 506,358 | 25,464 | 398,279 | 22,271 | 423,312 | 1,405,115 | |||||||||||||||
Other Long-term Liabilities(6) |
95,909 | 30,054 | 15,748 | 16,040 | 17,301 | 108,156 | 283,208 | |||||||||||||||
Total |
$ | 378,610 | $ | 713,442 | $ | 159,645 | $ | 481,981 | $ | 80,078 | $ | 576,789 | $ | 2,390,545 | ||||||||
- (1)
- Rental
expense under real estate operating leases for the years 2009, 2008 and 2007 was $35,195, $35,028 and $35,646, respectively.
- (2)
- Expense under data and telecommunications contracts for the years 2009, 2008 and 2007 was $211,530, $182,819 and $165,230, respectively.
41
- (3)
- Rental
expense under computer and other equipment leases for the years 2009, 2008 and 2007 was $21,077, $20,723 and $24,299, respectively. These leases are
frequently renegotiated or otherwise changed as advancements in computer technology produce opportunities to lower costs and improve performance.
- (4)
- Our
contributions to pension and other postretirement benefit plans for the years 2009, 2008 and 2007 were $10,231, $12,120 and $9,473, respectively. The
estimated contribution amount shown for 2010 includes both required and discretionary contributions to funded plans as well as benefit payments from unfunded plans. The majority of the expected
contribution shown for 2010 is required.
- (5)
- Amounts
represent the principal balance plus estimated interest expense based on current interest rates under our long-term debt (see
Note 9 to our Consolidated Financial Statements).
- (6)
- Includes estimated future funding requirements related to pension and postretirement benefits (see Note 10 to our Consolidated Financial Statements) and the long-term portions of the 2009 and 2007 severance, impairment and other charges (see Note 6 to our Consolidated Financial Statements). As the timing of future cash outflows is uncertain, the following long-term liabilities (and related balances) are excluded from the above table: deferred taxes ($70,549) and uncertain tax benefits reserve ($69,041).
Under the terms of certain purchase agreements related to acquisitions consummated in 2008 and prior, we may be required to pay additional amounts as contingent consideration based on the achievement of certain performance related targets during 2009. These additional payments will be recorded as compensation expense. We paid approximately $2,400 under such contingencies during 2009. Based on current estimates, we expect that additional contingent consideration under these agreements may total approximately $1,800. It is expected that these contingencies will be resolved during the first half of 2010.
Off-Balance Sheet Obligations
As of December 31, 2009, we did not have any off-balance sheet arrangements (as defined in Item 303(a)(4)(ii) of SEC Regulation S-K) that have or are reasonably likely to have a current or future effect on our financial condition, revenues or expenses, results of operations, liquidity, capital expenditures or capital resources that are material to investors.
Market Risk
Our primary market risks are the impact of foreign exchange fluctuations on non-dollar-denominated revenue and the impact of interest rate fluctuations on interest expense.
We transact business in more than 100 countries and are subject to risks associated with changing foreign exchange rates. Our objective is to reduce earnings and cash flow volatility associated with foreign exchange rate changes. Accordingly, we enter into foreign currency forward contracts to minimize the impact of foreign exchange movements on net income, non-U.S. dollar anticipated royalties, and on the value of non-functional currency assets and liabilities.
It is our policy to enter into foreign currency transactions only to the extent necessary to meet our objectives as stated above. We do not enter into foreign currency transactions for investment or speculative purposes. The principal currencies hedged are the Euro, the Japanese Yen, the British Pound, the Swiss Franc and the Canadian Dollar. See Note 9 to our Consolidated Financial Statements.
42
The contractual value of our hedging instruments was approximately $433,096 at December 31, 2009. The fair value of these hedging instruments is subject to change as a result of potential changes in foreign exchange rates. We assess our market risk based on changes in foreign exchange rates utilizing a sensitivity analysis. The sensitivity analysis measures the potential loss in fair values based on a hypothetical 10% change in currency rates. The potential loss in fair value for foreign exchange rate-sensitive instruments, all of which were foreign currency forward contracts, based on a hypothetical 10% decrease in the value of the U.S. dollar or, in the case of non-dollar-related instruments, the currency being purchased, was $18,880 at December 31, 2009. However, the change in the fair value of foreign exchange rate-sensitive instruments would likely be offset by a change in the fair value of the asset or liability being hedged. The estimated fair values of the foreign exchange risk management contracts were determined based on quoted market prices.
We also borrow funds and since the interest rate associated with those borrowings changes over time, we are subject to interest rate risk. We have not hedged all of this exposure. We assess our market risk based on changes in interest rates utilizing a sensitivity analysis. The sensitivity analysis measures the increase in annual interest expense based on a hypothetical 1% increase in interest rates. This would have amounted to approximately $4,168 at December 31, 2009.
In January 2010, the Venezuelan government announced the devaluation of its currency and established a two-tier foreign exchange structure. The official exchange rate for essential goods was adjusted from 2.15 Venezuelan Bolívars ("Bolívars") to each U.S. Dollar to 2.60 and the official exchange rate for non-essential goods was adjusted from 2.15 Bolívars to each U.S. Dollar to 4.30. We expect that our products will be classified as non-essential. Our Swiss operating subsidiary, IMS AG, maintains certain account balances in Bolívars (mainly Cash and cash equivalents). As these balances are held in a non-functional currency of IMS AG, it is required that we mark-to-market these balances at each reporting date and reflect these movements as gains or losses in income. Separately, Venezuela has been designated hyper-inflationary effective January 1, 2010, and as such, all future foreign currency fluctuations will also be recorded in income for certain account balances at our local Venezuelan operating subsidiary. While we continue to evaluate the impact of these actions by the Venezuelan government, we expect to record a pre-tax charge of approximately $10,000 to Other expense, net in the first quarter of 2010 related to the remeasurement of the IMS AG Bolívar account balances and the remeasurement of certain local Venezuelan account balances under the assumption that the 4.30 rate will apply. In addition to the January 2010 devaluation, Venezuela had imposed currency exchange restrictions in February 2003, and subsequently adjusted its official exchange rates in February 2004 and once again in March 2005, and as a result, we have recognized exchange losses in the past. It is not possible for us to predict the extent to which we may be affected by future changes in exchange rates and exchange controls imposed by the Venezuelan government.
Forward-Looking Statements and Risk Factors
This Annual Report on Form 10-K and documents to which we refer you in this Annual Report, as well as information included in oral statements or other written statements made or to be made by us, contain statements that, in our opinion, may constitute "forward-looking statements" within the meaning of the Private Securities Litigation Reform Act of 1995. The words such as "believe," "expect," "anticipate," "intend," "plan," "foresee," "likely," "project," "estimate," "will," "may," "should," "future," "predicts," "potential," "continue" and similar expressions identify these forward-looking statements, which appear in a number of places in this Annual Report on Form 10-K (and documents to which we refer you in this Annual Report) and include, but are not limited to, all statements relating directly or indirectly to, the timing or likelihood of completing the Merger, plans for future growth and other business development activities as well as capital expenditures, financing sources, dividends and the effects of regulation and competition, foreign currency conversion and all other statements regarding our intent, plans, beliefs or expectations or those of our directors or
43
officers. Investors are cautioned that such forward-looking statements are not assurances for future performance or events and involve risks and uncertainties that could cause actual results and developments to differ materially from those covered in such forward-looking statements. These risks and uncertainties include, but are not limited to the factors or matters contained or incorporated by reference in this document, and the following factors:
- •
- risks associated with operating on a global basis, including fluctuations in the value of foreign currencies relative to
the U.S. dollar, and the ability to successfully hedge such risks—we derived approximately 63% of our operating revenue in 2009 from non-U.S. operations;
- •
- deterioration in economic conditions, particularly in the pharmaceutical, healthcare or other industries in which our
customers operate;
- •
- regulatory, legislative and enforcement initiatives to which we are or may become subject relating particularly to tax and
to medical privacy and the collection and dissemination of data and, specifically, non-patient identifiable information, e.g., prescriber identifiable information, or to the process
of anonymizing data;
- •
- the imposition of additional restrictions on our use of or access to data, or the refusal by data suppliers to provide
data to us;
- •
- uncertainties associated with completion of our restructuring plans discussed in Note 6 to our Consolidated
Financial Statements and under "Severance, Impairment and Other Charges" in Part I. Item 2. Management's Discussion and Analysis of Financial Condition and Results of Operations, and the
impact of the restructuring activities on our business and financial results, including the timing of the activities and the associated costs and the ability to achieve projected cost savings;
- •
- conditions in the securities markets that may affect the value or liquidity of portfolio investments; and management's
estimates of lives of assets, recoverability of assets, fair market value, estimates of liabilities and accrued income tax benefits and liabilities;
- •
- to the extent unforeseen cash needs arise, the ability to obtain financing on favorable terms, or at all during adverse
credit market conditions;
- •
- to the extent we seek growth through acquisitions, alliances or joint ventures, the ability to identify, consummate and
integrate acquisitions, alliances and joint ventures on satisfactory terms;
- •
- our ability to develop new or advanced technologies, including sophisticated information systems, software and other
technology used to deliver our products and services and to do so on a timely and cost-effective basis, and the exposure to the risk of obsolescence or incompatibility of these
technologies with those of our customers or suppliers; our ability to maintain effective security measures for our computer and communications systems; and failures or delays in the operation of our
computer or communications systems;
- •
- consolidation in the pharmaceutical industry and the other industries in which our customers operate;
- •
- our ability to successfully maintain historic effective tax rates;
- •
- our ability to maintain and defend our intellectual property rights in jurisdictions around the world;
- •
- competition, particularly in the markets for pharmaceutical information and consulting and services;
44
- •
- regulatory, legislative and enforcement initiatives to which our customers in the pharmaceutical industry are or may
become subject restricting the prices that may be charged for prescription or other pharmaceutical products or the manner in which such products may be marketed or sold;
- •
- terrorist activity, epidemics, credit market disruptions or other conditions that could disrupt commerce, the threat of
any such conditions, and responses to and results of such conditions and threats, including but not limited to effects, domestically and/or internationally, on us, our personnel and facilities, our
customers and suppliers, financial markets and general economic conditions;
- •
- the occurrence of any event, change or other circumstances that could give rise to the termination of the Merger
Agreement, including a termination under circumstances that could require us to pay a termination fee;
- •
- the failure to obtain the necessary equity and debt financing set forth in commitment letters received in connection with
the Merger or the failure of that financing to be sufficient to complete the Merger and the transactions contemplated thereby;
- •
- the inability to complete the Merger due to the failure to satisfy the conditions to completion of the Merger;
- •
- the failure of the Merger to close for any other reason;
- •
- risks that the proposed transaction disrupts current plans and operations and the potential difficulties in employee
retention as a result of the proposed Merger;
- •
- the outcome of any legal proceedings that have been or may be instituted against us and/or others relating to the Merger
Agreement;
- •
- diversion of management's attention from ongoing business concerns;
- •
- the effect of the announcement of the Merger on our business relationships, operating results and business generally;
and
- •
- the amount of the costs, fees, expenses and charges related to the Merger.
Consequently, all of the forward-looking statements we make in this document are qualified by the information contained herein, including, but not limited to, the information contained under this heading and our Consolidated Financial Statements and notes thereto and by the material set forth under the headings "Business" and "Risk Factors" in Part I, Items 1 and 1A, respectively, of this Annual Report on Form 10-K. We are under no obligation to publicly release any revision to any forward-looking statement contained or incorporated herein to reflect any future events of occurrences. You should carefully consider the cautionary statements contained or referred to in this section in connection with any subsequent written or oral forward-looking statements that may be issued by us or persons acting on our behalf.
Critical Accounting Policies
Note 2 to the Consolidated Financial Statements includes a summary of the significant accounting policies and methods used in the preparation of our Consolidated Financial Statements. Following is a brief discussion of the more significant accounting policies and methods used by us.
Management's discussion and analysis of its financial condition and results of operations are based upon its Consolidated Financial Statements, which have been prepared in accordance with accounting principles generally accepted in the U.S.
The preparation of financial statements and related disclosures in accordance with generally accepted accounting principles in the U.S. require management to make estimates and assumptions that
45
affect the reported amounts of assets and liabilities, revenues and expenses and the related disclosure of contingent assets and liabilities. On an ongoing basis, we evaluate our estimates. The most significant estimates relate to allowances, valuation of work-in-process inventories, investments, depreciation of fixed assets including salvage values, carrying value of goodwill and intangible assets, provision for income taxes and tax assets and liabilities, reserves for severance, pensions, employee benefits, stock-based compensation, contingencies and litigation. We base our estimates on historical experience and on various other assumptions that are believed to be reasonable under the circumstances, the results of which form the basis for making judgments about the carrying values of assets and liabilities that are not readily apparent from other sources. The accounting estimates used in the preparation of our Consolidated Financial Statements will change as new events occur, as more experience is acquired, as additional information is obtained and as our operating environment changes. Actual results could vary from the estimates and assumptions used in the preparation of the accompanying Consolidated Financial Statements.
We believe the following critical policies affect our more significant judgments and estimates used in the preparation of our Consolidated Financial Statements.
REVENUE RECOGNITION. We recognize revenue when the following criteria have been met: 1) persuasive evidence of an arrangement exists; 2) delivery has occurred or services have been rendered; 3) the seller's price to the buyer is fixed or determinable; and 4) collectibility is reasonably assured.
We offer various I&A products developed to meet our customers' needs by using data secured from a worldwide network of suppliers. Our revenue arrangements may include multiple elements. A typical I&A arrangement (primarily under fixed-price contracts) may include an ongoing subscription-based deliverable for which revenue is recognized ratably as earned over the contract period, and/or a one-time delivery of historical data ("backdata") for which revenue is recognized upon delivery, assuming all other criteria are met. These deliverables qualify as separate units of accounting as each has value on a standalone basis to the customer, objective and reliable evidence of fair value for any undelivered item(s) exists, and where the arrangement includes a general right of return relative to the delivered item(s), delivery of the undelivered item(s) is probable and within our control. We allocate revenue to each element within our arrangements based upon their respective relative fair values. Fair values for these elements are based upon the normal pricing practices for ongoing subscriptions and backdata when sold separately. We defer revenue for any undelivered elements, and recognize revenue when the product is delivered or over the period in which the service is performed, in accordance with our revenue recognition policy for such element as noted above. If we cannot objectively determine the fair value of any undelivered element, revenue is deferred until all elements are delivered and services have been performed, or until fair value can objectively be determined for any remaining undelivered elements.
We also offer evidenced-based solutions that allow our clients to make informed business decisions. These C&S offerings provide assistance with the analysis of our I&A products. Revenues for certain of these arrangements are recognized on a straight-line basis over the term of the arrangement. Revenues for time and material contracts are recognized as the services are provided. Revenues for fixed price contracts are recognized either over the contract term based on the ratio of the number of hours incurred for services provided during the period compared to the total estimated hours to be incurred over the entire arrangement (efforts based), or upon delivery.
We enter into barter transactions in the normal course in which we exchange data for data, or data for other services such as advertising, software licenses and panel recruitment. We recognize revenue from barter transactions as our products are delivered or services are performed. The related barter expense is recognized as the products or services are utilized by us, the majority of which is in the same accounting period as the related barter revenue. Barter transactions are valued based on either the fair
46
value of the products or services received by us or the fair value of the information or services delivered to customers, whichever is more clearly evident. Our barter revenues have accounted for approximately 3% to 4% of total consolidated revenues in each of the three years ended December 31, 2009.
We present our revenues net of taxes assessed by government authorities.
Payment terms vary by customer, but are typically stipulated in the contract and are generally net 30 days from date of invoice. We generally do not offer extended payment terms. Advance payments from customers are credited to Deferred revenues and reflected in Operating Revenue as earned over the contract term. Included in Accounts receivable, net in the Consolidated Statements of Financial Position are unbilled receivables, which represent revenues for products delivered or services performed that have not yet been invoiced to the customer. Unbilled receivables are generally invoiced within the following month.
For further discussion of our products and services please refer to the "Our Products and Services" disclosure contained in Part I, Item 1. Business section of this Annual Report on Form 10-K.
OPERATING COSTS OF INFORMATION AND ANALYTICS. Operating costs of I&A include costs of data, data collection and processing and costs attributable to personnel involved in production, data management and delivery of our I&A offerings.
One of our major expenditures is the cost for the data we receive from suppliers. After receipt of the raw data and prior to the data being available for use in any part of our business, we are required to transform the raw data into useful information through a series of comprehensive processes. These processes involve significant employee costs and data processing costs.
Costs associated with our purchases are deferred within work-in-process inventory and recognized as expense as the corresponding data product revenue is recognized by us, generally over a thirty to sixty day period.
DIRECT AND INCREMENTAL COSTS OF CONSULTING AND SERVICES. Direct and incremental costs of C&S include the costs of our consulting staff directly involved with delivering revenue generating engagements, related accommodations and the costs of primary market research data purchased specifically for certain individual C&S engagements. Although our data is used in multiple customer solutions across different offerings within both I&A and C&S, we do not have a meaningful way to allocate the direct cost of the data between I&A and C&S revenues. As such, the direct and incremental costs of C&S do not reflect the total costs incurred to deliver our C&S revenues.
Costs associated with our time and material and fixed-price C&S contracts are recognized as incurred.
PENSIONS AND OTHER POSTRETIREMENT BENEFITS. We provide a number of retirement benefits to our employees, including defined benefit pension plans and postretirement medical plans. The determination of benefit obligations and expense is based on actuarial models. In order to measure benefit costs and obligations using these models, critical assumptions are made with regard to the discount rate, expected return on plan assets, cash balance crediting rate, lump sum conversion rate and the assumed rate of compensation increases. In addition, retiree medical care cost trend rates are a key assumption used exclusively in determining costs for our post retirement health care and life insurance benefits plan. Management reviews these critical assumptions at least annually. Other assumptions involve demographic factors such as the turnover, retirement and mortality rates. Management reviews these assumptions periodically and updates them when our experience deems it appropriate to do so.
47
The discount rate is the rate at which the benefit obligations could be effectively settled and is determined annually by management. For U.S. plans, the discount rate is based on results of a modeling process in which the plans' expected cash flow (determined on a projected benefit obligation basis) is matched with spot rates developed from a yield curve comprised of high-grade (Moody's Aa and above, or Standard and Poor's AA and above) non-callable corporate bonds to develop the present value of the expected cash flow, and then determining the single rate (discount rate) which when applied to the expected cash flow derives that same present value. In the U.K. specifically, the discount rate is set based on the yields available on a universe of approximately of 150 high quality (Aa rated) corporate bonds denominated in UK sterling, appropriate to the duration of the plan liabilities. For the other non-U.S. plans, the discount rate is based on the current yield of an index of high quality corporate bonds. At December 31, 2009, the discount rate was 6.0%, unchanged from December 31, 2008 for our U.S. pension plans and postretirement benefit plan. Similarly, the discount rate for our U.K. pension plan was unchanged at 6.0%. The U.S. and U.K. plans represent 97% of the consolidated benefit obligation as of December 31, 2009. The discount rate in other non-U.S. countries decreased, where the range of applicable discount rates at December 31, 2009 was 2.2%—10.4%. These smaller non-U.S. plans constitute only 3% of the consolidated benefit obligation at December 31, 2009. As a sensitivity measure, a 25 basis point increase in the discount rate for our U.S. plan, absent any offsetting changes in other assumptions would result in a decrease of pension expense of approximately $95 within the Consolidated Statements of Income. For our U.K. plan, a 25 basis point increase in the discount rate, absent any offsetting changes in other assumptions, would result in a decrease in pension expense of approximately $668 within the Consolidated Statements of Income.
Under the U.S. qualified retirement plan, participants have a notional retirement account that increases with pay and investment credits. The rate used to determine the investment credit (cash balance crediting rate) varies monthly and is equal to 1/12th of the yield on 30-year U.S. Government Treasury Bonds, with a minimum of 0.25%. At retirement, the account is converted to a monthly retirement benefit.
In selecting an expected return on plan asset assumption, we consider the returns being earned by each plan investment category in the fund, the rates of return expected to be available for reinvestment and long-term economic forecasts for the type of investments held by the plan. At January 1, 2010, the expected return on plan assets for the U.S. pension plans is 8.5%, which is unchanged versus January 1, 2009. Outside the U.S. the range of applicable expected rates of return is 1.5%—7.25% as of January 1, 2010 versus a range of 1.5%—7.5% as of January 1, 2009. The actual return on plan assets will vary from year to year versus this assumption. We believe it is appropriate to use long-term expected forecasts in selecting the expected return on plan assets. As such, there can be no assurance that our actual return on plan assets will approximate the long-term expected forecasts. The expected return on assets ("EROA") was $24,104 and $31,454 and the actual return on assets was $54,930 and ($90,414), respectively, for the years ended December 31, 2009 and 2008. As a sensitivity measure, a 25 basis point change in the EROA assumption for our U.S. plan, absent any offsetting changes in other assumptions, would result in approximately $397 of an increase or decrease in pension expense within the Consolidated Statements of Income. For our U.K. plan, a 25 basis point change in the EROA assumption, absent any offsetting changes in other assumptions, would result in approximately $374 of an increase or decrease in pension expense within the Consolidated Statements of Income. While we believe that the assumptions used are reasonable, differences in actual experience or changes in assumptions may materially affect our pension and postretirement obligations and future expense.
We utilize a corridor approach to amortizing unrecognized gains and losses in the pension and postretirement plans. Amortization occurs when the accumulated unrecognized net gain or loss balance exceeds the criterion of 10% of the larger of the beginning balances of the projected benefit obligation or the market-related value of the plan assets. The excess unrecognized gain or loss balance is then amortized using the straight-line method over the average remaining service-life of active employees
48
expected to receive benefits. At December 31, 2009, the weighted-average remaining service-life of active employees was 10.67 years.
During fiscal 2009, we contributed $10,231 to our pension and postretirement benefit plans which included voluntary contributions above the minimum requirements for the pension plans. We currently expect to contribute $13,473 in required contributions and $274 in discretionary contributions to our pension and postretirement benefit plans during fiscal 2010. We may make additional contributions into our pension plans in fiscal 2010 depending on, among other factors, how the funded status of those plans changes and in order to meet minimum funding requirements as set forth in employee benefit and tax laws, plus additional amounts we may deem to be appropriate.
At December 31, 2009, the projected benefit obligation exceeded the fair value of assets in our pension plans by $30,353.
As of January 1, 2008, we utilize a fiscal year end measurement date for all plans.
Additional information on pension and other postretirement benefit plans is contained in Note 10 to the Consolidated Financial Statements.
COMPUTER SOFTWARE. Direct costs incurred in the development of our external-use computer software to be sold, leased or otherwise marketed are capitalized. Research and development costs incurred to establish technological feasibility of a computer software product are expensed in the periods in which they are incurred. Capitalization ceases and amortization starts when the product is available for general release to customers. External-use computer software costs are amortized on a product by product basis generally over three to seven years. Annual amortization is the greater of the amount computed using (a) the ratio of current gross revenues for a product to the total of current and anticipated future gross revenues for that product, or (b) the straight-line method over the remaining estimated economic life of the product. We periodically review the unamortized capitalized costs of our computer software based on a comparison of the carrying value of the software with its estimated net realizable value. We recognize immediately any impairment losses on external-use software as a result of our review, or upon our decision to discontinue a product. See Note 5 to our Consolidated Financial Statements.
Capitalized internal-use software costs are amortized on a straight-line basis generally over three to five years.
GOODWILL. Goodwill represents the excess purchase price over the fair value of identifiable net assets of businesses acquired, and is not amortized. We review the recoverability of goodwill annually (or based on any triggering event) by comparing the estimated fair values (based on discounted cash flow analysis) of reporting units with their respective net book values. If the carrying amount of the reporting unit exceeds its fair value, the goodwill impairment loss is measured as the excess of the carrying value of goodwill over its fair value. We completed our annual impairment tests as of September 30, 2009, 2008 and 2007 and were not required to recognize any goodwill impairment charges. Due to market conditions during the fourth quarter of 2008, at December 31, 2008 we reviewed our goodwill impairment analysis and determined that no trigger event had occurred subsequent to September 30, 2008 requiring us to update our goodwill impairment test. See Note 5 of our Consolidated Financial Statements.
OTHER LONG-LIVED ASSETS. We review the recoverability of our long-lived assets and finite-lived identifiable intangibles held and used whenever events or changes in circumstances indicate that the carrying amount of an asset may not be recoverable. In general, the assessment of possible impairment is based on our ability to recover the carrying value of the asset from the undiscounted expected future cash flows of the asset. If the future cash flows are less than the carrying value of such
49
asset, an impairment charge is recognized for the difference between the estimated fair value and the carrying value.
INCOME TAXES. We operate in more than 100 countries around the world and our earnings are taxed at the applicable income tax rate in each of those countries. We provide for income taxes utilizing the asset and liability method of accounting for income taxes. Under this method, deferred income taxes are recorded to reflect the tax consequences in future years of differences between the tax basis of assets and liabilities and their financial reporting amounts at each balance sheet date, based on enacted tax laws and statutory tax rates applicable to the periods in which the differences are expected to affect taxable income. If it is determined that it is more likely than not that future tax benefits associated with a deferred tax asset will not be realized, a valuation allowance is provided. In the event we were to determine that we would be able to realize our deferred tax assets in the future in excess of our net recorded amount, an adjustment to the deferred tax asset would increase income in the period such determination was made. Likewise, should we determine that we would not be able to realize all or part of our net deferred tax asset in the future, an adjustment to the deferred tax asset would be charged to income in the period such determination was made. The effect on deferred tax assets and liabilities of a change in the tax rates is recognized in income in the period that includes the enactment date. While we intend to continue to seek global tax planning initiatives, there can be no assurance that we will be able to successfully identify and implement such initiatives to reduce or maintain our overall tax rate.
FOREIGN CURRENCY TRANSLATION. We have significant investments in non-U.S. countries. Therefore, changes in the value of foreign currencies affect our Consolidated Financial Statements when translated into U.S. dollars. For all operations outside the U.S. where we have designated the local currency as the functional currency, assets and liabilities are translated using end-of-period exchange rates; revenues, expenses and cash flows are translated using average rates of exchange. For these countries, currency translation adjustments are accumulated in a separate component of Shareholders' Equity (Deficit), whereas transaction gains and losses are recognized in Other expense, net. For operations in countries that are considered to be highly inflationary or where the U.S. dollar is designated as the functional currency, monetary assets and liabilities are remeasured using end-of-period exchange rates, whereas non-monetary accounts are remeasured using historical exchange rates, and all remeasurement and transaction adjustments are recognized in Other expense, net.
STOCK-BASED COMPENSATION. We maintain stock incentive plans, which provide for the grant of stock options, stock appreciation rights, restricted stock and restricted stock units to eligible employees and Non-Employee Directors. We are required to estimate the fair value of share-based payment awards on the date of grant using an option-pricing model. The value of the portion of the award that is ultimately expected to vest is recognized as expense on a straight-line basis over the requisite service period of the award in our Consolidated Statements of Income. As the stock-based compensation is based on awards ultimately expected to vest, it has been reduced for estimated forfeitures. We are required to estimate the forfeitures at the time of grant and revise, if necessary, in subsequent periods if actual forfeitures differ from those estimates. Prior to 2006, we accounted for stock-based awards to employees and directors using the intrinsic value method. Under the intrinsic value method, stock-based compensation expense had been recognized in our Consolidated Statements of Income only for stock option modifications and restricted stock units because the exercise price of stock options granted to employees and directors equaled the fair market value of the underlying stock at the date of grant. See Note 11 to our Consolidated Financial Statements for additional information.
COMPUTATION OF NET INCOME PER SHARE. Basic net income per share is computed using the weighted-average number of common shares outstanding during the period. Diluted net income per share is computed using the weighted-average number of common shares and dilutive
50
potential common shares outstanding during the period. Dilutive potential common shares primarily consist of employee stock options and restricted stock units.
Employee equity share options, restricted stock units and similar equity instruments granted by us are treated as potential common shares outstanding in computing diluted earnings per share. Diluted shares outstanding include restricted stock units and the dilutive effect of in-the-money options which is calculated based on the average share price for each fiscal period using the treasury stock method. Under the treasury stock method, the amount the employee must pay for exercising stock options, the amount of compensation cost for future service that we have not yet recognized, and the amount of benefits that would be recorded in additional paid-in capital when the award becomes deductible for tax purposes are assumed to be used to repurchase shares.
LEGAL COSTS. Legal costs in connection with loss contingencies are expensed as incurred.
Recently Issued Accounting Standards
In June 2009, the Financial Accounting Standards Board ("FASB") issued authoritative guidance codifying generally accepted accounting principles in the U.S. ("GAAP"). This guidance was effective for financial statements issued for interim and annual periods ending after September 15, 2009. The adoption of this authoritative guidance did not have a material impact on our financial results.
In September 2006, the FASB issued authoritative guidance defining fair value, establishing a framework for measuring fair value under GAAP, and expanding disclosures about fair value measurements. This guidance was effective for financial statements issued for fiscal years beginning after November 15, 2007, and interim periods within those fiscal years. The adoption of this authoritative guidance did not have a material impact on our financial results. In February 2008, the FASB issued authoritative guidance which delayed the effective date of its previously issued fair value guidance for one year for certain non-financial assets and liabilities and removed certain leasing transactions from its scope. The adoption of this authoritative guidance did not have a material impact on our financial results.
In December 2008, the FASB issued authoritative guidance on an employer's disclosures about plan assets of a defined benefit pension or other postretirement plan. This guidance was effective for fiscal years ending after December 15, 2009, with earlier application permitted. Upon initial application, the provisions of this guidance are not required for earlier periods presented for comparative purposes. As this guidance requires only additional disclosures, its adoption did not have a material impact on our financial results.
In April 2009, the FASB issued authoritative guidance on determining fair values when there is no active market or where the price inputs being used represent distressed sales. It also reaffirmed what previous guidance had stated is the objective of fair value measurement—to reflect how much an asset would be sold for in an orderly transaction (as opposed to a distressed or forced transaction) at the date of the financial statements under current market conditions. This guidance was effective for interim and annual periods ending after September 15, 2009. The adoption of this authoritative guidance did not have a material impact on our financial results.
In April 2009, the FASB issued authoritative guidance which required disclosures about fair value of financial instruments for interim reporting periods of publicly traded companies as well as in annual financial statements. This standard also required those disclosures in summarized financial information at interim reporting periods. This guidance was effective for interim reporting periods ending after September 15, 2009. The adoption of this authoritative guidance did not have a material impact on our financial results.
In May 2009, the FASB issued authoritative guidance establishing general standards of accounting for and disclosures of events that occur after the balance sheet date but before financial statements are
51
issued or are available to be issued. This guidance was effective for interim or annual financial periods ending after September, 15, 2009. The adoption of this authoritative guidance did not have a material impact on our financial results.
In June 2009, the FASB issued authoritative guidance eliminating the concept of qualifying special-purpose entities ("QSPEs"), changing the requirements for derecognizing financial assets and requiring additional disclosures about transfers of financial assets, including securitization transactions, and an entity's continuing involvement in and exposure to the risks related to transferred financial assets. This guidance must be applied as of the beginning of each reporting entity's first annual reporting period that begins after November 15, 2009, for interim periods within that first annual reporting period and for interim and annual reporting periods thereafter. The adoption of this authoritative guidance is not expected to have a material impact on our financial results.
In June 2009, the FASB issued authoritative guidance eliminating the exemption for QSPEs, requiring a new approach for determining who should consolidate variable-interest entities ("VIEs"), and changing when it is necessary to reassess who should consolidate VIEs. This guidance shall be effective as of the beginning of each reporting entity's first annual reporting period that begins after November 15, 2009, for interim periods within that first annual reporting period, and for interim and annual reporting periods thereafter. The adoption of this authoritative guidance is not expected to have a material impact on our financial results.
In October 2009, the FASB issued authoritative guidance revising the current accounting treatment to specifically address how to determine whether an arrangement involving multiple deliverables contains more than one unit of accounting. This guidance is applicable to revenue arrangements entered into or materially modified during the company's first fiscal year that begins after June 15, 2010. The guidance may be applied either prospectively from the beginning of the fiscal year for new or materially modified arrangements or retrospectively. We are currently evaluating this authoritative guidance to determine any potential impact that it may have on our financial results.
In October 2009, the FASB issued authoritative guidance changing the accounting model for revenue arrangements that include both tangible products and software elements. Tangible products containing software components and non-software components that function together to deliver the tangible product's essential functionality, are no longer within the scope of the software revenue guidance. This guidance is applicable to revenue arrangements entered into or materially modified during the company's first fiscal year that begins after June 15, 2010. The guidance may be applied either prospectively from the beginning of the fiscal year for new or materially modified arrangements or retrospectively. We are currently evaluating this authoritative guidance to determine any potential impact that it may have on our financial results.
IMS Health Common Stock Information
IMS's Common Stock is listed on the New York Stock Exchange (symbol "RX"). The number of shareholders of record on December 31, 2009 and 2008 were approximately 3,389 and 3,800, respectively. Total shares outstanding on December 31, 2009 and 2008, were approximately 182,658 and 181,482, respectively. Approximately 99.0% of IMS's shares are held by institutions. The following table shows the high and low sales prices for our Common Stock during the four quarters of 2009 and 2008:
| |
Price Per Share ($) 2009 |
Price Per Share ($) 2008 |
|||||||||||
|---|---|---|---|---|---|---|---|---|---|---|---|---|---|
| |
High | Low | High | Low | |||||||||
First Quarter |
16.42 | 11.12 | 24.88 | 20.01 | |||||||||
Second Quarter |
14.11 | 11.80 | 25.46 | 21.09 | |||||||||
Third Quarter |
15.81 | 11.50 | 23.74 | 17.73 | |||||||||
Fourth Quarter |
21.68 | 14.51 | 19.63 | 9.63 | |||||||||
Year |
21.68 | 11.12 | 25.46 | 9.63 | |||||||||
52
Dividends
The payments and level of cash dividends by IMS are subject to the discretion of the Board of Directors of IMS. For the years ended December 31, 2009 and 2008, IMS declared quarterly dividends of $0.03 per share or $0.12 per share on an annual basis. Any future dividends declared by the Board of Directors of IMS will be based on, and affected by, a number of factors, including the operating results and financial requirements of IMS.
Reconciliation of U.S. GAAP Measures to Non-GAAP Measures(a)
| |
2009 | 2008 | 2007 | ||||||||
|---|---|---|---|---|---|---|---|---|---|---|---|
Selling and administrative expenses |
$ | 661,510 | $ | 650,218 | $ | 626,888 | |||||
Non-GAAP adjustment |
— | (3,748 | )(e) | — | |||||||
Non-GAAP Selling and administrative expenses |
$ | 661,510 | $ | 646,470 | $ | 626,888 | |||||
Operating Income |
$ |
270,888 |
$ |
498,305 |
$ |
393,279 |
|||||
Non-GAAP adjustment |
11,000 | (b) | 3,748 | (e) | 88,690 | (g) | |||||
Non-GAAP adjustment |
105,573 | (c) | 9,408 | (f) | — | ||||||
Non-GAAP adjustment |
4,190 | (c) | — | — | |||||||
Non-GAAP adjustment |
38,712 | (d) | — | — | |||||||
Non-GAAP Operating Income |
$ | 430,363 | $ | 511,461 | $ | 481,969 | |||||
- (a)
- "Non-GAAP"
measures differ from "U.S. GAAP" measures for each year presented by amounts that are detailed above. Non-GAAP
measures are used by management for the purposes of global business decision-making, including developing budgets and managing expenditures. Non-GAAP measures exclude certain
U.S. GAAP measures to the extent that management believes exclusion will facilitate comparisons across periods and more clearly indicate trends. Although we disclose Non-GAAP
measures in order to give investors a view of our business as seen by management, these Non-GAAP measures are not prepared specifically for investors, are not prepared under a
comprehensive set of accounting rules, and are not a replacement for the more comprehensive information for investors included in our U.S. GAAP financial statements. Our Non-GAAP
measures differ in significant respects from U.S. GAAP and are likely to differ from the Non-GAAP measures used by other companies.
- (b)
- Represents
$11,000 of expense for professional services consisting of investment banker, legal and accounting fees related to the proposed acquisition of
IMS by Healthcare Technology Holdings, Inc., an entity created by certain affiliates of TPG Capital, L.P. and the Canada Pension Plan Investment Board (see Note 16 to our
Consolidated Financial Statements).
- (c)
- Represents
$105,573 of severance, impairment and other charges recorded in the second half of 2009 for employee termination benefits and facility exit costs
as a result of the streamlining program we announced in July 2009 in response to accelerating healthcare marketplace dynamics compounded by a sustained economic downturn. Additionally, we recorded
$4,190 of accelerated depreciation and amortization charges related to exited facilities which are included in Depreciation and other amortization. See Note 6 to our Consolidated Financial
Statements. Severance, impairment and other charges were also recorded in 2000, 2001, 2003, 2004 and 2007 and there can be no assurances that such charges will not be recorded in the future.
- (d)
- Represents $38,712 of impairment and other charges recorded in the second and fourth quarters of 2009 for the write-down of certain capitalized software and prepaid assets to their net realizable values, supplier contract-related charges to be incurred with no future economic benefit, capital
53
contributed by selling shareholders of a previously acquired business, partially offset by reversals related to our 2007 restructuring plan (see Note 6 to our Consolidated Financial Statements).
- (e)
- Represents
expense incurred of $3,748 recorded in 2008 related to our Government Solutions subsidiary (see Note 15 to our Consolidated Financial
Statements). This subsidiary had discovered potential noncompliance with various contract clauses and requirements under its General Services Administration Contract which was awarded in 2002 to its
predecessor company, Synchronous Knowledge Inc. (Synchronous Knowledge Inc. was acquired by IMS in May 2005). Upon discovery of the potential noncompliance, we began remediation efforts,
promptly disclosed the potential noncompliance to the U.S. government, and were accepted into the Department of Defense Voluntary Disclosure Program. We filed our Voluntary Disclosure Program Report
("Disclosure Report") on August 29, 2008. Based on our findings as disclosed in the Disclosure Report, we recorded a reserve of approximately $3,748 for this matter in the third quarter of
2008. We are currently unable to determine the outcome of this matter pending the resolution of the Voluntary Disclosure Program process and our ultimate liability arising from this matter could
exceed our current reserve. For geographical reporting purposes, this subsidiary is included in our Americas region.
- (f)
- Represents
$9,408 of impairment charges in 2008 for the write-off of certain capitalized software assets in our EMEA and Asia Pacific regions
resulting from the discontinuation of certain IMS products at the end of 2008 (see Note 6 to our Consolidated Financial Statements).
- (g)
- Represents $88,690 of severance, impairment and other charges in 2007, including severance for approximately 1,070 employees and write-downs of two impaired assets and related contract payments to be incurred with no future economic benefit based on our decision to abandon certain products in our EMEA region (see Note 6 to our Consolidated Financial Statements).
Item 7A. Quantitative and Qualitative Disclosures about Market Risk
Quantitative and qualitative disclosures about market risk are set forth under "Market Risk" in the "Management's Discussion and Analysis of Financial Condition and Results of Operations" in Part II, Item 7 of this Annual Report on Form 10-K, and in "Note 9. Financial Instruments" of Notes to Consolidated Financial Statements in Part II, Item 8 of this Annual Report on Form 10-K.
54
Item 8. Financial Statements and Supplementary Data
Index to Consolidated Financial Statements and Financial Statement Schedule
| |
Page | ||
|---|---|---|---|
Statement of Management's Responsibility for Financial Statements |
56 | ||
Management's Report on Internal Control Over Financial Reporting |
57 | ||
Report of Independent Registered Public Accounting Firm |
58 | ||
FINANCIAL STATEMENTS: |
|||
As of December 31, 2009 and 2008: |
|||
Consolidated Statements of Financial Position |
59 | ||
For the years ended December 31, 2009, 2008 and 2007: |
|||
Consolidated Statements of Income |
60 | ||
Consolidated Statements of Cash Flows |
61 | ||
Consolidated Statements of Shareholders' Equity (Deficit) |
63 | ||
Notes to Consolidated Financial Statements |
66 | ||
OTHER FINANCIAL INFORMATION: |
|||
Quarterly Financial Data (Unaudited) for the years ended December 31, 2009 and 2008 |
114 | ||
Five-Year Selected Financial Data (Unaudited) |
115 | ||
FINANCIAL STATEMENT SCHEDULE: |
|||
Schedule II—Valuation and Qualifying Accounts for the years ended December 31, 2009, 2008 and 2007 |
182 | ||
55
Statement of Management's Responsibility for Financial Statements
To the Shareholders of IMS Health Incorporated:
Management is responsible for the preparation of the consolidated financial statements and related information that are presented in this report. The consolidated financial statements, which include amounts based on management's estimates and judgments, have been prepared in conformity with accounting principles generally accepted in the United States of America. Other financial information in the report to shareholders is consistent with that in the consolidated financial statements.
The Company maintains accounting and internal control systems to provide reasonable assurance at reasonable cost that assets are safeguarded against loss from unauthorized use or disposition, and that the financial records are reliable for preparing financial statements and maintaining accountability for assets. These systems are augmented by written policies, an organizational structure providing division of responsibilities, careful selection and training of qualified personnel and a program of internal audits.
The Company, through its Audit Committee consisting solely of independent directors of the Company, engaged PricewaterhouseCoopers LLP, independent auditors, to audit and render an opinion on the consolidated financial statements in accordance with the standards of the Public Company Accounting Oversight Board (United States). These standards include consideration of the internal control structure and tests of transactions to the extent considered necessary by them to support their opinion.
The Board of Directors, through its Audit Committee consisting solely of independent directors of the Company, meets periodically with management, internal auditors and our independent auditors to ensure that each is meeting its responsibilities and to discuss matters concerning internal controls and financial reporting. PricewaterhouseCoopers LLP and the internal auditors each have full and free access to the Audit Committee.
David
R. Carlucci
Chairman, Chief Executive Officer and President
Leslye
G. Katz
Senior Vice President and Chief Financial Officer
56
Management's Report on Internal Control Over Financial Reporting
Management is responsible for establishing and maintaining adequate internal control over financial reporting for the Company. In order to evaluate the effectiveness of internal control over financial reporting, as required by Section 404 of the Sarbanes-Oxley Act, management has conducted an assessment using the criteria in Internal Control—Integrated Framework, issued by the Committee of Sponsoring Organizations of the Treadway Commission ("COSO"). The Company's internal control over financial reporting is a process designed to provide reasonable assurance regarding the reliability of financial reporting and the preparation of financial statements for external purposes in accordance with accounting principles generally accepted in the United States of America. Because of its inherent limitations, internal control over financial reporting may not prevent or detect misstatements. Also, projections of any evaluation of effectiveness to future periods are subject to the risk that controls may become inadequate because of changes in conditions, or that the degree of compliance with the policies or procedures may deteriorate.
Based on its assessment, management has concluded that the Company maintained effective internal control over financial reporting as of December 31, 2009, based on criteria in Internal Control—Integrated Framework issued by the COSO. The effectiveness of the Company's internal control over financial reporting as of December 31, 2009, has been audited by PricewaterhouseCoopers LLP, the Company's independent registered public accounting firm, as stated in their report included herein.
David
R. Carlucci
Chairman, Chief Executive Officer and President
Leslye
G. Katz
Senior Vice President and Chief Financial Officer
57
Report of Independent Registered Public Accounting Firm
To the Board of Directors and Shareholders of IMS Health Incorporated:
In our opinion, the accompanying consolidated statements of financial position and the related consolidated statements of income, cash flows and shareholders' equity present fairly, in all material respects, the financial position of IMS Health Incorporated and its subsidiaries at December 31, 2009 and 2008, and the results of their operations and their cash flows for each of the three years in the period ended December 31, 2009 in conformity with accounting principles generally accepted in the United States of America. In addition, in our opinion, the financial statement schedule listed in the accompanying index presents fairly, in all material respects, the information set forth therein when read in conjunction with the related consolidated financial statements. Also in our opinion, the Company maintained, in all material respects, effective internal control over financial reporting as of December 31, 2009, based on criteria established in Internal Control—Integrated Framework issued by the Committee of Sponsoring Organizations of the Treadway Commission (COSO). The Company's management is responsible for these financial statements and financial statement schedule, for maintaining effective internal control over financial reporting and for its assessment of the effectiveness of internal control over financial reporting, included in Management's Report on Internal Control over Financial Reporting appearing under Item 8. Our responsibility is to express opinions on these financial statements, on the financial statement schedule, and on the Company's internal control over financial reporting based on our integrated audits. We conducted our audits in accordance with the standards of the Public Company Accounting Oversight Board (United States). Those standards require that we plan and perform the audits to obtain reasonable assurance about whether the financial statements are free of material misstatement and whether effective internal control over financial reporting was maintained in all material respects. Our audits of the financial statements included examining, on a test basis, evidence supporting the amounts and disclosures in the financial statements, assessing the accounting principles used and significant estimates made by management, and evaluating the overall financial statement presentation. Our audit of internal control over financial reporting included obtaining an understanding of internal control over financial reporting, assessing the risk that a material weakness exists, and testing and evaluating the design and operating effectiveness of internal control based on the assessed risk. Our audits also included performing such other procedures as we considered necessary in the circumstances. We believe that our audits provide a reasonable basis for our opinions.
As discussed in Note 12 to the Consolidated Financial Statements, the Company adopted the Uncertainty in Income Taxes standard on January 1, 2007. As discussed in Note 7 to the Consolidated Financial Statements, the Company changed the manner in which it accounts for noncontrolling interests effective January 1, 2009.
A company's internal control over financial reporting is a process designed to provide reasonable assurance regarding the reliability of financial reporting and the preparation of financial statements for external purposes in accordance with generally accepted accounting principles. A company's internal control over financial reporting includes those policies and procedures that (i) pertain to the maintenance of records that, in reasonable detail, accurately and fairly reflect the transactions and dispositions of the assets of the company; (ii) provide reasonable assurance that transactions are recorded as necessary to permit preparation of financial statements in accordance with generally accepted accounting principles, and that receipts and expenditures of the company are being made only in accordance with authorizations of management and directors of the company; and (iii) provide reasonable assurance regarding prevention or timely detection of unauthorized acquisition, use, or disposition of the company's assets that could have a material effect on the financial statements.
Because of its inherent limitations, internal control over financial reporting may not prevent or detect misstatements. Also, projections of any evaluation of effectiveness to future periods are subject to the risk that controls may become inadequate because of changes in conditions, or that the degree of compliance with the policies or procedures may deteriorate.
PricewaterhouseCoopers LLP
New York, New York
February 17, 2010
58
IMS Health Incorporated
Consolidated Statements of Financial Position
| |
As of December 31, | ||||||
|---|---|---|---|---|---|---|---|
| (Dollars and shares in thousands, except per share data) |
2009 | 2008 | |||||
Assets: |
|||||||
Current Assets: |
|||||||
Cash and cash equivalents |
$ | 380,343 | $ | 215,682 | |||
Restricted cash |
4,319 | — | |||||
Accounts receivable, net of allowances of $7,709 and $5,960 in 2009 and 2008 respectively |
322,569 | 382,776 | |||||
Other current assets (Note 17) |
190,445 | 174,099 | |||||
Total Current Assets |
$ | 897,676 | $ | 772,557 | |||
Securities and other investments (Note 8) |
8,324 | 7,121 | |||||
Property, plant and equipment, net of accumulated depreciation of $214,859 and $208,340 in 2009 and 2008, respectively |
181,680 | 183,055 | |||||
Computer software |
254,921 | 253,583 | |||||
Goodwill (Note 5) |
700,250 | 663,532 | |||||
Other assets (Note 17) |
179,864 | 207,289 | |||||
Total Assets |
$ | 2,222,715 | $ | 2,087,137 | |||
Liabilities, Redeemable Noncontrolling Interests and Shareholders' Equity (Deficit): |
|||||||
Current Liabilities: |
|||||||
Accounts payable |
$ | 105,432 | $ | 119,798 | |||
Accrued and other current liabilities |
392,139 | 275,764 | |||||
Accrued income taxes |
12,934 | 47,735 | |||||
Short-term deferred tax liability |
9,510 | 9,444 | |||||
Deferred revenues |
123,395 | 88,484 | |||||
Total Current Liabilities |
$ | 643,410 | $ | 541,225 | |||
Postretirement and postemployment benefits |
112,230 | 109,516 | |||||
Long-term debt (Note 9) |
1,244,653 | 1,404,199 | |||||
Other liabilities (Note 17) |
148,757 | 185,677 | |||||
Total Liabilities |
$ | 2,149,050 | $ | 2,240,617 | |||
Commitments and Contingencies (Notes 13 and 15) |
|||||||
Redeemable Noncontrolling Interests (Note 7) |
$ | — | $ | 100,000 | |||
Shareholders' Equity (Deficit): |
|||||||
Common Stock, par value $.01, authorized 800,000 shares; issued 335,045 shares in 2009 and 2008, respectively |
$ | 3,350 | $ | 3,350 | |||
Capital in excess of par |
547,723 | 546,478 | |||||
Retained earnings |
3,297,038 | 3,060,345 | |||||
Treasury stock, at cost, 152,388 shares and 153,564 shares in 2009 and 2008, respectively |
(3,549,146 | ) | (3,576,446 | ) | |||
Cumulative translation adjustment |
(130,693 | ) | (171,990 | ) | |||
Unamortized postretirement and postemployment balances |
(96,447 | ) | (117,111 | ) | |||
Total IMS Health Shareholders' Equity (Deficit) |
$ | 71,825 | $ | (255,374 | ) | ||
Noncontrolling Interests (Note 7) |
1,840 | 1,894 | |||||
Total Equity (Deficit) |
$ | 73,665 | $ | (253,480 | ) | ||
Total Liabilities, Redeemable Noncontrolling Interests and Shareholders' Equity (Deficit) |
$ | 2,222,715 | $ | 2,087,137 | |||
The accompanying notes are an integral part of the Consolidated Financial Statements.
59
IMS Health Incorporated
Consolidated Statements of Income
| |
Years Ended December 31, | |||||||||
|---|---|---|---|---|---|---|---|---|---|---|
| (Dollars and shares in thousands, except per share data) |
2009 | 2008 | 2007 | |||||||
Information and analytics revenue |
$ | 1,706,744 | $ | 1,787,487 | $ | 1,700,244 | ||||
Consulting and services revenue |
483,001 | 542,041 | 492,327 | |||||||
Operating Revenue |
$ | 2,189,745 | $ | 2,329,528 | $ | 2,192,571 | ||||
Operating costs of information and analytics |
715,766 | 756,987 | 713,168 | |||||||
Direct and incremental costs of consulting and services |
250,411 | 275,246 | 244,289 | |||||||
External-use software amortization |
40,361 | 49,728 | 48,609 | |||||||
Selling and administrative expenses |
661,510 | 650,218 | 626,888 | |||||||
Depreciation and other amortization |
95,524 | 89,636 | 77,648 | |||||||
Severance, impairment and other charges (Note 6) |
144,285 | 9,408 | 88,690 | |||||||
Merger costs (Note 16) |
11,000 | — | — | |||||||
Operating Income |
$ | 270,888 | $ | 498,305 | $ | 393,279 | ||||
Interest income |
3,505 | 12,737 | 8,121 | |||||||
Interest expense |
(36,514 | ) | (47,188 | ) | (37,867 | ) | ||||
Gains from investments, net |
41 | 379 | 2,317 | |||||||
Other expense, net |
(1,306 | ) | (41,441 | ) | (8,459 | ) | ||||
Non-Operating Loss, net |
$ | (34,274 | ) | $ | (75,513 | ) | $ | (35,888 | ) | |
Income before benefit from (provision) for income taxes |
236,614 | 422,792 | 357,391 | |||||||
Benefit from (provision) for income taxes (Note 12) |
24,005 | (106,206 | ) | (117,922 | ) | |||||
Net Income |
$ | 260,619 | $ | 316,586 | $ | 239,469 | ||||
Less: Net income attributable to noncontrolling interests (Note 7) |
2,164 | 5,336 | 5,429 | |||||||
Net Income Attributable to IMS Health |
$ | 258,455 | $ | 311,250 | $ | 234,040 | ||||
Basic Earnings Per Share of Common Stock |
$ | 1.42 | $ | 1.70 | $ | 1.20 | ||||
Diluted Earnings Per Share of Common Stock |
$ | 1.42 | $ | 1.70 | $ | 1.18 | ||||
Weighted average number of shares outstanding—basic |
182,358 |
182,790 |
195,092 |
|||||||
Dilutive effect of shares issuable as of period-end under stock option plans and other |
142 | 792 | 2,770 | |||||||
Adjustment of shares outstanding applicable to exercised and cancelled stock options during the period |
99 | 28 | 810 | |||||||
Weighted Average Number of Shares Outstanding—Diluted |
182,599 | 183,610 | 198,672 | |||||||
The accompanying notes are an integral part of the Consolidated Financial Statements.
60
IMS Health Incorporated
Consolidated Statements of Cash Flows
| |
Years Ended December 31, | ||||||||||
|---|---|---|---|---|---|---|---|---|---|---|---|
| (Dollars in thousands) |
2009 | 2008 | 2007 | ||||||||
Cash Flows from Operating Activities: |
|||||||||||
Net income |
$ | 260,619 | $ | 316,586 | $ | 239,469 | |||||
Adjustments to reconcile net income to net cash provided by operating activities: |
|||||||||||
Depreciation and amortization |
135,885 | 139,364 | 126,257 | ||||||||
Bad debt expense |
2,894 | 2,267 | 3,092 | ||||||||
Deferred income taxes |
(44,861 | ) | (11,931 | ) | (19,743 | ) | |||||
Gains from investments, net |
(41 | ) | (379 | ) | (2,317 | ) | |||||
Gain on sale of assets, net |
(2,342 | ) | (4,041 | ) | (1,278 | ) | |||||
Non-cash stock-based compensation charges |
32,542 | 28,036 | 35,592 | ||||||||
Non-cash portion of severance, impairment and other charges |
32,422 | 9,408 | 13,647 | ||||||||
Net tax (expense) benefit on stock-based compensation |
(4,572 | ) | (499 | ) | 12,304 | ||||||
Excess tax benefits from stock-based compensation |
(54 | ) | (94 | ) | (5,103 | ) | |||||
Change in assets and liabilities, excluding effects from acquisitions and dispositions: |
|||||||||||
Net decrease (increase) in accounts receivable |
52,291 | 31,931 | (48,822 | ) | |||||||
Net decrease (increase) in work-in-process inventory |
1,893 | (1,654 | ) | (5,606 | ) | ||||||
Net decrease (increase) in prepaid expenses and other current assets |
8,760 | (240 | ) | (5,734 | ) | ||||||
Net (decrease) increase in accounts payable |
(15,625 | ) | 1,580 | 28,035 | |||||||
Net increase (decrease) in accrued and other current liabilities |
30,165 | (12,550 | ) | 5,634 | |||||||
Net increase (decrease) in accrued severance, impairment and other charges |
83,730 | (51,057 | ) | 72,951 | |||||||
Net increase (decrease) in deferred revenue |
31,852 | (27,694 | ) | (9,975 | ) | ||||||
Net decrease in accrued income taxes |
(76,920 | ) | (16,698 | ) | 23,439 | ||||||
Net decrease in pension assets (net of liabilities) |
10,009 | 8,352 | 6,444 | ||||||||
Net decrease (increase) in other long-term assets (net of long-term liabilities) |
3,941 | 9,967 | (1,398 | ) | |||||||
Net Cash Provided by Operating Activities |
$ | 542,588 | $ | 420,654 | $ | 466,888 | |||||
The accompanying notes are an integral part of the Consolidated Financial Statements.
61
IMS Health Incorporated
Consolidated Statements of Cash Flows (Continued)
| |
Years Ended December 31, | ||||||||||
|---|---|---|---|---|---|---|---|---|---|---|---|
| (Dollars in thousands) |
2009 | 2008 | 2007 | ||||||||
Cash Flows Used in Investing Activities: |
|||||||||||
Capital expenditures |
$ | (31,604 | ) | $ | (36,352 | ) | $ | (61,182 | ) | ||
Additions to computer software |
(85,787 | ) | (77,642 | ) | (103,954 | ) | |||||
Proceeds from sale of assets |
5,494 | 5,272 | — | ||||||||
Net increase in restricted cash |
(4,319 | ) | — | — | |||||||
Payments for acquisitions of businesses, net of cash acquired |
(3,419 | ) | (63,044 | ) | (102,939 | ) | |||||
Funding of venture capital investments |
(1,400 | ) | (1,700 | ) | (1,600 | ) | |||||
Other investing activities, net |
1,278 | (4,648 | ) | (2,533 | ) | ||||||
Net Cash Used in Investing Activities |
(119,757 | ) | (178,114 | ) | (272,208 | ) | |||||
Cash Flows Used in Financing Activities: |
|||||||||||
Net (decrease) increase in revolving credit facility and other |
(148,662 | ) | (62,554 | ) | 194,581 | ||||||
Proceeds from private placement notes, short-term credit agreement and bank term loan |
— | 240,000 | — | ||||||||
Repayment of private placement notes and short-term credit agreement |
— | (150,000 | ) | — | |||||||
Payments for purchase of treasury stock |
— | (238,046 | ) | (466,479 | ) | ||||||
Proceeds from exercise of stock options |
3,240 | 5,521 | 143,128 | ||||||||
Excess tax benefits from stock-based compensation |
54 | 94 | 5,103 | ||||||||
Dividends paid |
(21,762 | ) | (22,183 | ) | (23,886 | ) | |||||
Proceeds from employee stock purchase plan and other |
— | (25 | ) | 5,719 | |||||||
(Decrease) increase in cash overdrafts |
(3,953 | ) | 3,378 | (2,624 | ) | ||||||
Payments to noncontrolling interests |
(103,875 | ) | (6,763 | ) | (6,761 | ) | |||||
Net Cash Used in Financing Activities |
(274,958 | ) | (230,578 | ) | (151,219 | ) | |||||
Effect of Exchange Rate Changes on Cash and Cash Equivalents |
16,788 | (14,529 | ) | 17,442 | |||||||
Increase (Decrease) in Cash and Cash Equivalents |
164,661 | (2,567 | ) | 60,903 | |||||||
Cash and Cash Equivalents, Beginning of Period |
215,682 | 218,249 | 157,346 | ||||||||
Cash and Cash Equivalents, End of Period |
$ | 380,343 | $ | 215,682 | $ | 218,249 | |||||
Supplemental Disclosure of Cash Flow Information: |
|||||||||||
Cash paid during the period for interest |
$ | 34,642 | $ | 43,435 | $ | 36,021 | |||||
Cash paid during the period for income taxes |
$ | 104,995 | $ | 130,191 | $ | 100,617 | |||||
Cash received from income tax refunds |
$ | 10,121 | $ | 11,997 | $ | 4,982 | |||||
The accompanying notes are an integral part of the Consolidated Financial Statements.
62
IMS Health Incorporated
Consolidated Statements of Shareholders' Equity (Deficit)
| |
|
|
|
|
|
|
Accumulated Other Comprehensive Income (Loss) | |
|
|
||||||||||||||||||||||||||||
|---|---|---|---|---|---|---|---|---|---|---|---|---|---|---|---|---|---|---|---|---|---|---|---|---|---|---|---|---|---|---|---|---|---|---|---|---|---|---|
| |
Shares | |
|
|
|
|
|
|
||||||||||||||||||||||||||||||
| |
|
|
|
|
|
Post Retirement Post Employ Adjust |
Other Compre- hensive Income |
Total IMS Health Shareholders' Equity (Deficit) |
|
|
||||||||||||||||||||||||||||
| (Dollars and shares in thousands, except per share data) |
Common Stock |
Treasury Stock |
Common Stock |
Capital in Excess of Par |
Retained Earnings |
Treasury Stock |
Cumulative Translation Adjustment & Other |
Non Controlling Interest |
Total | |||||||||||||||||||||||||||||
Balance, December 31, 2006 |
335,045 | 134,367 | $ | 3,350 | $ | 497,955 | $ | 2,612,939 | $ | (3,044,996 | ) | $ | 28,925 | $ | (64,264 | ) | $ | 33,909 | $ | 410 | $ | 34,319 | ||||||||||||||||
Net Income Attributable to IMS Health |
234,040 | $ | 234,040 | 234,040 | 1,034 | 235,074 | ||||||||||||||||||||||||||||||||
Cash Dividends ($0.12 per share) |
(23,886 | ) | (23,886 | ) | (23,886 | ) | ||||||||||||||||||||||||||||||||
Stock-Based Compensation Expense |
35,592 | 35,592 | 35,592 | |||||||||||||||||||||||||||||||||||
Net Tax Benefit on Stock-Based Compensation |
12,304 | 12,304 | 12,304 | |||||||||||||||||||||||||||||||||||
Treasury Shares Acquired Under Purchases |
16,241 | 1,306 | (467,785 | ) | (466,479 | ) | (466,479 | ) | ||||||||||||||||||||||||||||||
Treasury Shares Reissued Under: |
||||||||||||||||||||||||||||||||||||||
Exercise of Stock Options |
(6,299 | ) | (2,498 | ) | 145,626 | 143,128 | 143,128 | |||||||||||||||||||||||||||||||
Vesting of Restricted Stock |
(259 | ) | (9,504 | ) | 5,991 | (3,513 | ) | (3,513 | ) | |||||||||||||||||||||||||||||
Employee Stock Purchase Plan |
(232 | ) | 345 | 5,374 | 5,719 | 5,719 | ||||||||||||||||||||||||||||||||
Adoption of accounting for uncertainty in income taxes authoritative guidance |
(51,815 | ) | (51,815 | ) | (51,815 | ) | ||||||||||||||||||||||||||||||||
Cumulative Translation Adjustment |
33,138 | 33,138 | 33,138 | 33,138 | ||||||||||||||||||||||||||||||||||
Postretirement and Postemployment Adjustments |
7,680 | 7,680 | 7,680 | 7,680 | ||||||||||||||||||||||||||||||||||
Unrealized Gains on Other Investments, net |
(132 | ) | (132 | ) | (132 | ) | (132 | ) | ||||||||||||||||||||||||||||||
Total Comprehensive Income |
$ | 274,726 | 1,034 | |||||||||||||||||||||||||||||||||||
Balance, December 31, 2007 |
335,045 | 143,818 | $ | 3,350 | $ | 535,500 | $ | 2,771,278 | $ | (3,355,790 | ) | $ | 61,931 | $ | (56,584 | ) | $ | (40,315 | ) | $ | 1,444 | $ | (38,871 | ) | ||||||||||||||
The accompanying notes are an integral part of the Consolidated Financial Statements.
63
IMS Health Incorporated
Consolidated Statements of Shareholders' Equity (Deficit) (Continued)
| |
|
|
|
|
|
|
Accumulated Other Comprehensive Income (Loss) |
|
|
|
||||||||||||||||||||||||||||
|---|---|---|---|---|---|---|---|---|---|---|---|---|---|---|---|---|---|---|---|---|---|---|---|---|---|---|---|---|---|---|---|---|---|---|---|---|---|---|
| |
Shares | |
|
|
|
|
|
|
||||||||||||||||||||||||||||||
| |
|
|
|
|
|
Post Retirement Post Employ Adjust |
|
Total IMS Health Shareholders' Equity (Deficit) |
|
|
||||||||||||||||||||||||||||
| (Dollars and shares in thousands, except per share data) |
Common Stock |
Treasury Stock |
Common Stock |
Capital in Excess of Par |
Retained Earnings |
Treasury Stock |
Cumulative Translation Adjustment |
Other Comprehensive Income |
Non Controlling Interest |
Total | ||||||||||||||||||||||||||||
Balance, December 31, 2007 |
335,045 | 143,818 | $ | 3,350 | $ | 535,500 | $ | 2,771,278 | $ | (3,355,790 | ) | $ | 61,931 | $ | (56,584 | ) | $ | (40,315 | ) | $ | 1,444 | $ | (38,871 | ) | ||||||||||||||
Net Income Attributable to IMS Health |
311,250 | $ | 311,250 | 311,250 | 940 | 312,190 | ||||||||||||||||||||||||||||||||
Cash Dividends ($0.12 per share) |
(22,183 | ) | (22,183 | ) | (22,183 | ) | ||||||||||||||||||||||||||||||||
Stock-Based Compensation Expense |
28,036 | 28,036 | 28,036 | |||||||||||||||||||||||||||||||||||
Net Tax Benefit on Stock-Based Compensation |
(499 | ) | (499 | ) | (499 | ) | ||||||||||||||||||||||||||||||||
Treasury Shares Acquired Under Purchases |
10,495 | (238,046 | ) | (238,046 | ) | (238,046 | ) | |||||||||||||||||||||||||||||||
Treasury Shares Reissued Under: |
||||||||||||||||||||||||||||||||||||||
Exercise of Stock Options |
(277 | ) | (920 | ) | 6,441 | 5,521 | 5,521 | |||||||||||||||||||||||||||||||
Vesting of Restricted Stock |
(473 | ) | (15,642 | ) | 10,977 | (4,665 | ) | (4,665 | ) | |||||||||||||||||||||||||||||
Employee Stock Purchase Plan |
1 | 3 | (28 | ) | (25 | ) | (25 | ) | ||||||||||||||||||||||||||||||
Cumulative Translation Adjustment |
(233,921 | ) | (233,921 | ) | (233,921 | ) | (490 | ) | (234,411 | ) | ||||||||||||||||||||||||||||
Postretirement and Postemployment Adjustments |
(60,527 | ) | (60,527 | ) | (60,527 | ) | (60,527 | ) | ||||||||||||||||||||||||||||||
Total Comprehensive Income |
$ | 16,802 | 450 | |||||||||||||||||||||||||||||||||||
Balance, December 31, 2008 |
335,045 | 153,564 | $ | 3,350 | $ | 546,478 | $ | 3,060,345 | $ | (3,576,446 | ) | $ | (171,990 | ) | $ | (117,111 | ) | $ | (255,374 | ) | $ | 1,894 | $ | (253,480 | ) | |||||||||||||
The accompanying notes are an integral part of the Consolidated Financial Statements.
64
IMS Health Incorporated
Consolidated Statements of Shareholders' Equity (Deficit) (Continued)
| |
Shares | |
|
|
|
Accumulated Other Comprehensive Income (Loss) |
|
|
|
|||||||||||||||||||||||||||||
|---|---|---|---|---|---|---|---|---|---|---|---|---|---|---|---|---|---|---|---|---|---|---|---|---|---|---|---|---|---|---|---|---|---|---|---|---|---|---|
| (Dollars and shares in thousands, except per share data) |
Common Stock |
Treasury Stock |
Common Stock |
Capital in Excess of Par |
Retained Earnings |
Treasury Stock |
Cumulative Translation Adjustment |
Post Retirement Post Employ Adjust |
Other Comprehensive Income |
Total IMS Health Shareholders' Equity (Deficit) |
Non Controlling Interest |
Total | ||||||||||||||||||||||||||
Balance, December 31, 2008 |
335,045 | 153,564 | $ | 3,350 | $ | 546,478 | $ | 3,060,345 | $ | (3,576,446 | ) | $ | (171,990 | ) | $ | (117,111 | ) | $ | (255,374 | ) | $ | 1,894 | $ | (253,480 | ) | |||||||||||||
Net Income Attributable to IMS Health |
258,455 | $ | 258,455 | 258,455 | 276 | 258,731 | ||||||||||||||||||||||||||||||||
Cash Dividends ($0.12 per share) |
(21,762 | ) | (21,762 | ) | (21,762 | ) | ||||||||||||||||||||||||||||||||
Stock-Based Compensation Expense |
33,580 | 33,580 | 33,580 | |||||||||||||||||||||||||||||||||||
Net Tax Benefit on Stock-Based Compensation |
(4,572 | ) | (4,572 | ) | (4,572 | ) | ||||||||||||||||||||||||||||||||
Capital Contributed by Selling Shareholders of Acquired Business |
2,904 | 2,904 | 2,904 | |||||||||||||||||||||||||||||||||||
Treasury Shares Reissued Under: |
||||||||||||||||||||||||||||||||||||||
Exercise of Stock Options |
(193 | ) | (1,234 | ) | 4,474 | 3,240 | 3,240 | |||||||||||||||||||||||||||||||
Vesting of Restricted Stock |
(983 | ) | (29,433 | ) | 22,826 | (6,607 | ) | (6,607 | ) | |||||||||||||||||||||||||||||
Cumulative Translation Adjustment |
41,297 | 41,297 | 41,297 | (330 | ) | 40,967 | ||||||||||||||||||||||||||||||||
Postretirement and Postemployment Adjustments |
20,664 | 20,664 | 20,664 | 20,664 | ||||||||||||||||||||||||||||||||||
Total Comprehensive Income |
$ | 320,416 | (54 | ) | ||||||||||||||||||||||||||||||||||
Balance, December 31, 2009 |
335,045 | 152,388 | $ | 3,350 | $ | 547,723 | $ | 3,297,038 | $ | (3,549,146 | ) | $ | (130,693 | ) | $ | (96,447 | ) | $ | 71,825 | $ | 1,840 | $ | 73,665 | |||||||||||||||
The accompanying notes are an integral part of the Consolidated Financial Statements.
65
Notes to Consolidated Financial Statements
(Dollars and shares in thousands, except per share data)
Note 1. Basis of Presentation
IMS Health Incorporated ("IMS," or the "Company") is the leading global provider of market intelligence to the pharmaceutical and healthcare industries. The Company offers leading-edge market intelligence products and services that are integral to its clients' day-to-day operations, including product and portfolio management capabilities; commercial effectiveness innovations; managed care and consumer health offerings; and consulting and services solutions that improve productivity and the delivery of quality healthcare worldwide. The Company's information products are developed to meet client needs by using data secured from a worldwide network of suppliers in more than 100 countries. The Company's business lines are:
- •
- Commercial Effectiveness to increase clients' productivity across end-to-end sales, marketing,
promotional and performance management processes;
- •
- Product and Portfolio Management to provide clients with insights into market measurement so they can optimize their
product portfolio and strategies; and
- •
- New Business Areas that support pharmaceutical client business initiatives in managed markets, consumer health, and pricing and market access, and that also serve payer and government audiences.
Within these business lines, the Company provides consulting and services that use in-house capabilities and methodologies to assist clients in analyzing and evaluating market trends, strategies and tactics, and to help in the development and implementation of customized software applications and data warehouse tools.
The Company operates in more than 100 countries.
The Company is managed on a global business model with global leaders for the majority of its critical business processes and accordingly has one reportable segment (see Note 18).
On November 5, 2009, the Company entered into a merger agreement providing for the acquisition of the Company by Healthcare Technology Holdings, Inc., an entity created by certain affiliates of TPG Capital, L.P. ("TPG") and the Canada Pension Plan Investment Board ("CPPIB"). See Note 16 for further details.
Note 2. Summary of Significant Accounting Policies
CONSOLIDATION. The Consolidated Financial Statements of the Company include the accounts of the Company, its subsidiaries and investments in which the Company has control. Intercompany accounts and transactions are eliminated in consolidation. Investments in companies over which the Company has significant influence but not a controlling interest are accounted for under the equity method of accounting. The Company recognizes in the income statement any gains or losses related to the issuance of stock by a consolidated subsidiary or an investment accounted for under the equity method.
CASH AND CASH EQUIVALENTS AND RESTRICTED CASH. Cash and cash equivalents include primarily time and demand deposits in the Company's operating bank accounts. The Company considers all highly liquid investments with a maturity of 90 days or less at the time of purchase to be cash equivalents. Restricted cash consists of amounts not immediately available.
66
Notes to Consolidated Financial Statements (Continued)
(Dollars and shares in thousands, except per share data)
Note 2. Summary of Significant Accounting Policies (Continued)
SECURITIES AND OTHER INVESTMENTS. The Company holds investments in partnership interests in venture capital partnerships. The partnership interests are recorded in the financial statements at cost. On a quarterly basis the Company makes estimates of the market value of these investments and reduces the carrying value of the investments if there is an other-than-temporary decline in the fair value below cost. No investments had an estimated fair value less than the carrying value of the investment as of December 31, 2009 and 2008.
PROPERTY, PLANT AND EQUIPMENT. Buildings, machinery and equipment are recorded at cost and depreciated over their estimated useful lives to their salvage values using the straight-line method. Leasehold improvements are recorded at cost and amortized on a straight-line basis over the shorter of the term of the lease or the estimated useful life of the improvement. See Note 17.
COMPUTER SOFTWARE. Direct costs incurred in the development of the Company's external-use computer software to be sold, leased, or otherwise marketed are capitalized. Research and development costs incurred to establish technological feasibility of a computer software product are expensed in the periods in which they are incurred. Capitalization ceases and amortization starts when the product is available for general release to customers. External-use computer software costs are amortized on a product by product basis generally over three to seven years. Annual amortization is the greater of the amount computed using (a) the ratio of current gross revenues for a product to the total of current and anticipated future gross revenues for that product, or (b) the straight-line method over the remaining estimated economic life of the product. The Company periodically reviews the unamortized capitalized costs of its computer software based on a comparison of the carrying value of the external-use software with its estimated net realizable value. The Company recognizes immediately any impairment losses on software as a result of its review, or upon the Company's decision to discontinue a product. See Note 5.
Capitalized internal-use software costs are amortized on a straight-line basis generally over three to five years.
GOODWILL. Goodwill represents the excess purchase price over the fair value of identifiable net assets of businesses acquired, and is not amortized. The Company reviews the recoverability of goodwill annually (or based on any triggering event) by comparing the estimated fair values (based on discounted cash flow analysis) of reporting units with their respective net book values. If the carrying amount of the reporting unit exceeds its fair value, the goodwill impairment loss is measured as the excess of the carrying value of goodwill over its fair value. See Note 5.
OTHER LONG-LIVED ASSETS. The Company reviews the recoverability of its long-lived assets and finite-lived identifiable intangibles held and used whenever events or changes in circumstances indicate that the carrying amount of an asset may not be recoverable. In general, the assessment of possible impairment is based on the Company's ability to recover the carrying value of the asset from the undiscounted expected future cash flows of the asset. If the future cash flows are less than the carrying value of such asset, an impairment charge is recognized for the difference between the estimated fair value and the carrying value.
REVENUE RECOGNITION. The Company recognizes revenue when the following criteria have been met: 1) persuasive evidence of an arrangement exists; 2) delivery has occurred or services have
67
Notes to Consolidated Financial Statements (Continued)
(Dollars and shares in thousands, except per share data)
Note 2. Summary of Significant Accounting Policies (Continued)
been rendered; 3) the seller's price to the buyer is fixed or determinable; and 4) collectibility is reasonably assured.
The Company offers various information and analytics ("I&A") products developed to meet its customers' needs by using data secured from a worldwide network of suppliers. The Company's revenue arrangements may include multiple elements. A typical I&A arrangement (primarily under fixed-price contracts) may include an ongoing subscription-based deliverable for which revenue is recognized ratably as earned over the contract period, and/or a one-time delivery of historical data ("backdata") for which revenue is recognized upon delivery, assuming all other criteria are met. These deliverables qualify as separate units of accounting as each has value on a standalone basis to the customer, objective and reliable evidence of fair value for any undelivered item(s) exists, and where the arrangement includes a general right of return relative to the delivered item(s), delivery of the undelivered item(s) is probable and within the Company's control. The Company allocates revenue to each element within its arrangements based upon their respective relative fair values. Fair values for these elements are based upon the normal pricing practices for ongoing subscriptions and backdata when sold separately. The Company defers revenue for any undelivered elements, and recognizes revenue when the product is delivered or over the period in which the service is performed, in accordance with its revenue recognition policy for such element as noted above. If the Company cannot objectively determine the fair value of any undelivered element, revenue is deferred until all elements are delivered and services have been performed, or until fair value can objectively be determined for any remaining undelivered elements.
The Company also offers evidenced-based solutions that allow its clients to make informed business decisions. These consulting and services ("C&S") offerings provide assistance with the analysis of the Company's I&A products. Revenues for certain of these arrangements are recognized on a straight-line basis over the term of the arrangement. Revenues for time and material contracts are recognized as the services are provided. Revenues for fixed price contracts are recognized either over the contract term based on the ratio of the number of hours incurred for services provided during the period compared to the total estimated hours to be incurred over the entire arrangement (efforts based), or upon delivery.
The Company enters into barter transactions in the normal course in which it exchanges data for data, or data for other services such as advertising, software licenses and panel recruitment. The Company recognizes revenue from barter transactions as its products are delivered or services are performed. The related barter expense is recognized as the products or services are utilized by the Company, the majority of which is in the same accounting period as the related barter revenue. Barter transactions are valued based on either the fair value of the products or services received by the Company or the fair value of the information or services delivered to customers, whichever is more clearly evident. The Company's barter revenues have accounted for approximately 3% to 4% of total consolidated revenues in each of the three years ended December 31, 2009.
The company presents its revenues net of taxes assessed by government authorities.
Payment terms vary by customer, but are typically stipulated in the contract and are generally net 30 days from date of invoice. The Company generally does not offer extended payment terms. Advance payments from customers are credited to Deferred revenues and reflected in Operating Revenue as earned over the contract term. Included in Accounts receivable, net in the Consolidated Statements of Financial Position are unbilled receivables, which represent revenues for products delivered or services
68
Notes to Consolidated Financial Statements (Continued)
(Dollars and shares in thousands, except per share data)
Note 2. Summary of Significant Accounting Policies (Continued)
performed that have not yet been invoiced to the customer. Unbilled receivables are generally invoiced within the following month.
OPERATING COSTS OF INFORMATION AND ANALYTICS. Operating costs of I&A include costs of data, data collection and processing and costs attributable to personnel involved in production, data management and delivery of the Company's I&A offerings.
One of the Company's major expenditures is the cost for the data it receives from suppliers. After receipt of the raw data and prior to the data being available for use in any part of its business, the Company is required to transform the raw data into useful information through a series of comprehensive processes. These processes involve significant employee costs and data processing costs.
Costs associated with the Company's data purchases are deferred within work-in-process inventory and recognized as expense as the corresponding data product revenue is recognized by the Company, generally over a thirty to sixty day period.
DIRECT AND INCREMENTAL COSTS OF CONSULTING AND SERVICES. Direct and incremental costs of C&S include the costs of the Company's consulting staff directly involved with delivering revenue generating engagements, related accommodations and the costs of primary market research data purchased specifically for certain individual C&S engagements. Although the Company's data is used in multiple customer solutions across different offerings within both I&A and C&S, the Company does not have a meaningful way to allocate the direct cost of the data between I&A and C&S revenues. As such, the direct and incremental costs of C&S do not reflect the total costs incurred to deliver the Company's C&S revenues.
Costs associated with the Company's time and material and fixed-price C&S contracts are recognized as incurred.
PENSIONS AND OTHER POSTRETIREMENT BENEFITS. The Company provides a number of retirement benefits to its employees, including defined benefit pension plans and postretirement medical plans. The determination of benefit obligations and expense is based on actuarial models. In order to measure benefit costs and obligations using these models, critical assumptions are made with regard to the discount rate, expected return on plan assets, cash balance crediting rate, lump sum conversion rate and the assumed rate of compensation increases. In addition, retiree medical care cost trend rates are a key assumption used exclusively in determining costs for the Company's postretirement health care and life insurance benefit plans. Management reviews these critical assumptions at least annually. Other assumptions involve demographic factors such as the turnover, retirement and mortality rates. Management reviews these assumptions periodically and updates them when its experience deems it appropriate to do so.
The discount rate is the rate at which the benefit obligations could be effectively settled and is determined annually by management. For U.S. plans, the discount rate is based on results of a modeling process in which the plans' expected cash flow (determined on a projected benefit obligation basis) is matched with spot rates developed from a yield curve comprised of high-grade (Moody's Aa and above, or Standard and Poor's AA and above) non-callable corporate bonds to develop the present value of the expected cash flow, and then determining the single rate (discount rate) which when applied to the expected cash flow derives that same present value. In the U.K. specifically, the discount rate is set based on the yields on a universe of approximately 150 high quality (Aa rated) corporate
69
Notes to Consolidated Financial Statements (Continued)
(Dollars and shares in thousands, except per share data)
Note 2. Summary of Significant Accounting Policies (Continued)
bonds denominated in UK Sterling, appropriate to the duration of Plan liabilities. For the other non-U.S. plans, the discount rate is based on the current yield of an index of high quality corporate bonds. At December 31, 2009, the discount rate was 6.0%, unchanged from December 31, 2008 for its U.S. pension plans and postretirement benefit plan. Similarly, the discount rate for its U.K. pension plan was unchanged at 6.0%. The U.S. and U.K. plans represent 97% of the consolidated benefit obligation as of December 31, 2009. The discount rate in other non-U.S. countries decreased, where the range of applicable discount rates at December 31, 2009 was 2.2% – 10.4%. These smaller non-U.S. plans constitute only 3% of the consolidated benefit obligation at December 31, 2009. As a sensitivity measure, a 25 basis point increase in the discount rate for the Company's U.S. plan, absent any offsetting changes in other assumptions, would result in a decrease in pension expense of approximately $95 within the Consolidated Statement of Income. For the Company's U.K. plan, a 25 basis point increase in the discount rate, absent any offsetting changes in other assumptions, would result in a decrease in pension expense of approximately $668 within the Consolidated Statements of Income.
Under the U.S. qualified retirement plan, participants have a notional retirement account that increases with pay and investment credits. The rate used to determine the investment credit (cash balance crediting rate) varies monthly and is equal to 1/12th of the yield on 30-year U.S. Government Treasury Bonds, with a minimum of 0.25%. At retirement, the account is converted to a monthly retirement benefit.
In selecting an expected return on plan asset assumption, the Company considers the returns being earned by each plan investment category in the fund, the rates of return expected to be available for reinvestment and long-term economic forecasts for the type of investments held by the plan. At January 1, 2010, the expected return on plan assets for the U.S. pension plans is 8.5%, which is unchanged versus January 1, 2009. Outside the U.S. the range of applicable expected rates of return is 1.5% – 7.25% as of January 1, 2010 versus a range of 1.5% – 7.5% as of January 1, 2009. The actual return on plan assets will vary from year to year versus this assumption. The Company believes it is appropriate to use long-term expected forecasts in selecting the expected return on plan assets. As such, there can be no assurance that the Company's actual return on plan assets will approximate the long-term expected forecasts. The expected return on assets ("EROA") was $24,104 and $31,454 and the actual return on assets was $54,930 and ($90,414), respectively, for the years ended December 31, 2009 and 2008. As a sensitivity measure, a 25 basis point change in the EROA assumption for the Company's U.S. plan, absent any offsetting changes in other assumptions, would result in approximately $397 of an increase or decrease in pension expense within the Consolidated Statements of Income. For the Company's U.K. plan, a 25 basis point change in the EROA assumption, absent any offsetting changes in other assumptions, would result in approximately $374 of an increase or decrease in pension expense within the Consolidated Statements of Income. While the Company believes that the assumptions used are reasonable, differences in actual experience or changes in assumptions may materially affect its pension and postretirement obligations and future expense.
The Company utilizes a corridor approach to amortizing unrecognized gains and losses in the pension and postretirement plans. Amortization occurs when the accumulated unrecognized net gain or loss balance exceeds the criterion of 10% of the larger of the beginning balances of the projected benefit obligation or the market-related value of the plan assets. The excess unrecognized gain or loss balance is then amortized using the straight-line method over the average remaining service-life of active employees expected to receive benefits. At December 31, 2009, the weighted-average remaining service-life of active employees was 10.67 years.
70
Notes to Consolidated Financial Statements (Continued)
(Dollars and shares in thousands, except per share data)
Note 2. Summary of Significant Accounting Policies (Continued)
During fiscal 2009, the Company contributed $10,231 to its pension and postretirement benefit plans which included voluntary contributions above the minimum requirements for the pension plans. The Company currently expects to contribute $13,473 in required contributions and $274 in discretionary contributions to its pension and postretirement benefit plans during fiscal 2010. The Company may make additional contributions into its pension plans in fiscal 2010 depending on, among other factors, how the funded status of those plans changes and in order to meet minimum funding requirements as set forth in employee benefit and tax laws, plus additional amounts the Company may deem to be appropriate.
At December 31, 2009, the projected benefit obligation exceeded the fair value of assets in the Company's pension plans by $30,353.
As of January 1, 2008, the Company utilizes a fiscal year end measurement date for all plans.
Additional information on pension and other postretirement benefit plans is contained in Note 10.
FOREIGN CURRENCY TRANSLATION. The Company has significant investments in non-U.S. countries. Therefore, changes in the value of foreign currencies affect the Company's Consolidated Financial Statements when translated into U.S. dollars. For all operations outside the U.S. where the Company has designated the local currency as the functional currency, assets and liabilities are translated using end-of-period exchange rates; revenues, expenses and cash flows are translated using average rates of exchange. For these countries, currency translation adjustments are accumulated in a separate component of Shareholders' Equity (Deficit), whereas transaction gains and losses are recognized in Other expense, net. For operations in countries that are considered to be highly inflationary or where the U.S. dollar is designated as the functional currency, monetary assets and liabilities are remeasured using end-of-period exchange rates, whereas non-monetary accounts are remeasured using historical exchange rates, and all remeasurement and transaction adjustments are recognized in Other expense, net.
INCOME TAXES. The Company operates in more than 100 countries around the world and its earnings are taxed at the applicable income tax rate in each of those countries. The Company provides for income taxes utilizing the asset and liability method of accounting for income taxes. Under this method, deferred income taxes are recorded to reflect the tax consequences in future years of differences between the tax basis of assets and liabilities and their financial reporting amounts at each balance sheet date, based on enacted tax laws and statutory tax rates applicable to the periods in which the differences are expected to affect taxable income. If it is determined that it is more likely than not that future tax benefits associated with a deferred tax asset will not be realized, a valuation allowance is provided. In the event the Company was to determine that it would be able to realize its deferred tax assets in the future in excess of its net recorded amount, an adjustment to the deferred tax asset would increase income in the period such determination was made. Likewise, should the Company determine that it would not be able to realize all or part of its net deferred tax asset in the future, an adjustment to the deferred tax asset would be charged to income in the period such determination was made. The effect on deferred tax assets and liabilities of a change in the tax rates is recognized in income in the period that includes the enactment date. While the Company intends to continue to seek global tax planning initiatives, there can be no assurance that it will be able to successfully identify and implement such initiatives to reduce or maintain its overall tax rate.
71
Notes to Consolidated Financial Statements (Continued)
(Dollars and shares in thousands, except per share data)
Note 2. Summary of Significant Accounting Policies (Continued)
STOCK-BASED COMPENSATION. The Company maintains stock incentive plans, which provide for the grant of stock options, stock appreciation rights, restricted stock and restricted stock units to eligible employees and Non-Employee Directors. The Company is required to estimate the fair value of share-based payment awards on the date of grant using an option-pricing model. The value of the portion of the award that is ultimately expected to vest is recognized as expense on a straight-line basis over the requisite service period of the award in the Company's Consolidated Statements of Income. As the stock-based compensation is based on awards ultimately expected to vest, it has been reduced for estimated forfeitures. The Company is required to estimate the forfeitures at the time of grant and revise, if necessary, in subsequent periods if actual forfeitures differ from those estimates. Prior to 2006, the Company accounted for stock-based awards to employees and directors using the intrinsic value method. Under the intrinsic value method, stock-based compensation expense had been recognized in the Company's Consolidated Statements of Income only for stock option modifications and restricted stock units because the exercise price of stock options granted to employees and directors equaled the fair market value of the underlying stock at the date of grant. See Note 11 for additional information.
COMPUTATION OF NET INCOME PER SHARE. Basic net income per share is computed using the weighted-average number of common shares outstanding during the period. Diluted net income per share is computed using the weighted-average number of common shares and dilutive potential common shares outstanding during the period. Dilutive potential common shares primarily consist of employee stock options and restricted stock units.
Employee equity share options, restricted stock units and similar equity instruments granted by the Company are treated as potential common shares outstanding in computing diluted earnings per share. Diluted shares outstanding include restricted stock units and the dilutive effect of in-the-money options which is calculated based on the average share price for each fiscal period using the treasury stock method. Under the treasury stock method, the amount the employee must pay for exercising stock options, the amount of compensation cost for future service that the Company has not yet recognized, and the amount of benefits that would be recorded in additional paid-in capital when the award becomes deductible for tax purposes are assumed to be used to repurchase shares.
LEGAL COSTS. Legal costs in connection with loss contingencies are expensed as incurred.
USE OF ESTIMATES. The preparation of financial statements and related disclosures in accordance with generally accepted accounting principles in the U.S. requires management to make estimates and assumptions that affect the reported amounts of assets and liabilities, revenues and expenses and the related disclosure of contingent assets and liabilities. On an ongoing basis, the Company evaluates its estimates. The most significant estimates relate to allowances, valuation of work-in-process inventories, investments, depreciation of fixed assets including salvage values, carrying value of goodwill and intangible assets, provision for income taxes and tax assets and liabilities, reserves for severance, pensions and reserves for employee benefits, stock-based compensation, contingencies and litigation. The Company bases its estimates on historical experience and on various other assumptions that are believed to be reasonable under the circumstances, the results of which form the basis for making judgments about the carrying values of assets and liabilities that are not readily apparent from other sources. The accounting estimates used in the preparation of the Company's Consolidated Financial Statements will change as new events occur, as more experience is acquired, as additional information is obtained and as the Company's operating environment changes. Actual results
72
Notes to Consolidated Financial Statements (Continued)
(Dollars and shares in thousands, except per share data)
Note 2. Summary of Significant Accounting Policies (Continued)
could vary from the estimates and assumptions used in the preparation of the Consolidated Financial Statements.
RECLASSIFICATIONS. Certain prior-year amounts have been reclassified to conform to the 2009 presentation.
SUBSEQUENT EVENTS. The Company has evaluated for disclosure subsequent events that have occurred up to February 17, 2010, the date of issuance of these financial statements. See Note 19.
Note 3. Summary of Recent Accounting Pronouncements
In June 2009, the Financial Accounting Standards Board ("FASB") issued authoritative guidance codifying generally accepted accounting principles in the U.S. ("GAAP"). This guidance was effective for financial statements issued for interim and annual periods ending after September 15, 2009. The adoption of this authoritative guidance did not have a material impact on the financial results of the Company.
In September 2006, the FASB issued authoritative guidance defining fair value, establishing a framework for measuring fair value under GAAP, and expanding disclosures about fair value measurements. This guidance was effective for financial statements issued for fiscal years beginning after November 15, 2007, and interim periods within those fiscal years. The adoption of this authoritative guidance did not have a material impact on the financial results of the Company. In February 2008, the FASB issued authoritative guidance which delayed the effective date of its previously issued fair value guidance for one year for certain non-financial assets and liabilities and removed certain leasing transactions from its scope. The adoption of this authoritative guidance did not have a material impact on the financial results of the Company.
In December 2008, the FASB issued authoritative guidance on an employer's disclosures about plan assets of a defined benefit pension or other postretirement plan. This guidance was effective for fiscal years ending after December 15, 2009, with earlier application permitted. Upon initial application, the provisions of this guidance are not required for earlier periods presented for comparative purposes. As this guidance requires only additional disclosures, its adoption did not have a material impact on the financial results of the Company.
In April 2009, the FASB issued authoritative guidance on determining fair values when there is no active market or where the price inputs being used represent distressed sales. It also reaffirmed what previous guidance had stated is the objective of fair value measurement—to reflect how much an asset would be sold for in an orderly transaction (as opposed to a distressed or forced transaction) at the date of the financial statements under current market conditions. This guidance was effective for interim and annual periods ending after September 15, 2009. The adoption of this authoritative guidance did not have a material impact on the financial results of the Company.
In April 2009, the FASB issued authoritative guidance which required disclosures about fair value of financial instruments for interim reporting periods of publicly traded companies as well as in annual financial statements. This standard also required those disclosures in summarized financial information at interim reporting periods. This guidance was effective for interim reporting periods ending after September 15, 2009. The adoption of this authoritative guidance did not have a material impact on the financial results of the Company.
73
Notes to Consolidated Financial Statements (Continued)
(Dollars and shares in thousands, except per share data)
Note 3. Summary of Recent Accounting Pronouncements (Continued)
In May 2009, the FASB issued authoritative guidance establishing general standards of accounting for and disclosures of events that occur after the balance sheet date but before financial statements are issued or are available to be issued. This guidance was effective for interim or annual financial periods ending after September, 15, 2009. The adoption of this authoritative guidance did not have a material impact on the financial results of the Company.
In June 2009, the FASB issued authoritative guidance eliminating the concept of qualifying special-purpose entities ("QSPEs"), changing the requirements for derecognizing financial assets and requiring additional disclosures about transfers of financial assets, including securitization transactions, and an entity's continuing involvement in and exposure to the risks related to transferred financial assets. This guidance must be applied as of the beginning of each reporting entity's first annual reporting period that begins after November 15, 2009, for interim periods within that first annual reporting period and for interim and annual reporting periods thereafter. The adoption of this authoritative guidance is not expected to have a material impact on the financial results of the Company.
In June 2009, the FASB issued authoritative guidance eliminating the exemption for QSPEs, requiring a new approach for determining who should consolidate variable-interest entities ("VIEs"), and changing when it is necessary to reassess who should consolidate VIEs. This guidance shall be effective as of the beginning of each reporting entity's first annual reporting period that begins after November 15, 2009, for interim periods within that first annual reporting period, and for interim and annual reporting periods thereafter. The adoption of this authoritative guidance is not expected to have a material impact on the financial results of the Company.
In October 2009, the FASB issued authoritative guidance revising the current accounting treatment to specifically address how to determine whether an arrangement involving multiple deliverables contains more than one unit of accounting. This guidance is applicable to revenue arrangements entered into or materially modified during the company's first fiscal year that begins after June 15, 2010. The guidance may be applied either prospectively from the beginning of the fiscal year for new or materially modified arrangements or retrospectively. The Company is currently evaluating this authoritative guidance to determine any potential impact that it may have on the financial results of the Company.
In October 2009, the FASB issued authoritative guidance changing the accounting model for revenue arrangements that include both tangible products and software elements. Tangible products containing software components and non-software components that function together to deliver the tangible product's essential functionality, are no longer within the scope of the software revenue guidance. This guidance is applicable to revenue arrangements entered into or materially modified during the company's first fiscal year that begins after June 15, 2010. The guidance may be applied either prospectively from the beginning of the fiscal year for new or materially modified arrangements or retrospectively. The Company is currently evaluating this authoritative guidance to determine any potential impact that it may have on the financial results of the Company.
Note 4. Acquisitions and Dispositions
ACQUISITIONS
The Company makes acquisitions in order to expand its products, services and geographic reach. On January 1, 2009, the Company adopted authoritative guidance which established principles and
74
Notes to Consolidated Financial Statements (Continued)
(Dollars and shares in thousands, except per share data)
Note 4. Acquisitions and Dispositions (Continued)
requirements for how an acquirer recognizes and measures in its financial statements the identifiable assets acquired, the liabilities assumed, any noncontrolling interest in the acquiree and the goodwill acquired. The impact of the adoption of this authoritative guidance on the Company's financial results will be dependent on the terms and conditions of acquisitions consummated on or after the adoption date.
During the year ended December 31, 2009, the Company did not complete any acquisitions.
During the year ended December 31, 2008, the Company completed five acquisitions at an aggregate cost of approximately $42,000. These acquisitions were Robinson and James Research Pty Limited (Australia), Fourth Hurdle Consulting Limited (U.K.), Health Benchmarks, Inc. (U.S.), RMBC Pharma Limited (Russia), and the services practice group of Skura Corporation, Inc. (Canada, U.S. and U.K.) and were accounted for under the purchase method of accounting. As such, the aggregate purchase price was allocated on a preliminary basis to the assets acquired based on estimated fair values as of the closing date. The purchase price allocations were finalized during 2008 and 2009. The Consolidated Financial Statements include the results of these acquired companies subsequent to the closing of the acquisitions. Had these acquisitions occurred as of January 1, 2008 or 2007, the impact on the Company's results of operations would not have been significant. Goodwill of approximately $32,000 was recorded in connection with these acquisitions, of which approximately $10,000 is deductible for tax purposes.
DISPOSITIONS
During the year ended December 31, 2009, the Company sold a building at its Belgium subsidiary in its EMEA region and realized a net pre-tax gain of $2,282. This transaction resulted in cash proceeds of $4,656 in 2009.
During the year ended December 31, 2008, the Company sold certain assets in its Latin America region and realized a net pre-tax gain of $4,041. This transaction resulted in cash proceeds of $838 in 2009 and $3,880 in 2008.
Note 5. Goodwill and Intangible Assets
Goodwill and intangible assets that have indefinite useful lives are not amortized and are tested at least annually (or based on any triggering event) for impairment. Intangible assets that have finite useful lives are amortized. The Company's goodwill increased by $36,718 to $700,250 at December 31, 2009, from $663,532 at December 31, 2008 mainly due to foreign currency translation adjustments. The Company completed its annual impairment tests as of September 30, 2009, 2008 and 2007 and was not required to recognize any goodwill impairment charges. Due to market conditions during the fourth quarter of 2008, at December 31, 2008 the Company reviewed its goodwill impairment analysis and determined that no trigger event had occurred subsequent to September 30, 2008 requiring the Company to update its goodwill impairment test.
All of the Company's other acquired intangibles are subject to amortization. Intangible asset amortization expense was $17,298, $19,055 and $17,750 during the years ended December 31, 2009, 2008 and 2007, respectively. At December 31, 2009 and 2008, intangible assets were primarily composed of customer relationships, databases and trade names (principally included in Other assets) and computer software. The gross carrying amounts and related accumulated amortization of these
75
Notes to Consolidated Financial Statements (Continued)
(Dollars and shares in thousands, except per share data)
Note 5. Goodwill and Intangible Assets (Continued)
intangibles were $187,889 and $115,924, respectively, at December 31, 2009 and $189,383 and $98,736, respectively, at December 31, 2008.
These intangibles are amortized over periods ranging from two to twenty years. As of December 31, 2009, the weighted average amortization periods of the acquired intangibles by asset class are listed in the following table:
Intangible Asset Type
|
Weighted Average Amortization Period (years) |
|||
|---|---|---|---|---|
Customer Relationships |
10.1 | |||
Computer Software and Algorithms |
7.0 | |||
Databases |
4.7 | |||
Trade Names |
4.3 | |||
Other |
4.0 | |||
Weighted Average |
8.8 | |||
Customer relationships accounted for the largest portion of the Company's acquired intangibles at December 31, 2009. When determining the value of customer relationships for purposes of allocating the purchase price of an acquisition, the Company looks at existing customer contracts of the acquired business to determine if they represent a reliable future source of income and hence, a valuable intangible asset for the Company. The Company determines the fair value of the customer relationships based on the estimated future benefits the Company expects from the acquired customer contracts. In performing its evaluation and estimation of the useful life of customer relationships, the Company looks to the historical growth rate of revenue of the acquired company's existing customers as well as the historical attrition rates.
Based on current estimated useful lives, annual amortization expense associated with intangible assets at December 31, 2009 is estimated to be as follows:
Year Ended December 31,
|
Amortization Expense |
|||
|---|---|---|---|---|
2010 |
$ | 13,298 | ||
2011 |
11,962 | |||
2012 |
10,201 | |||
2013 |
9,925 | |||
2014 |
8,187 | |||
Thereafter |
$ | 18,391 | ||
Note 6. Severance, Impairment and Other Charges
In response to accelerating healthcare marketplace dynamics compounded by a sustained economic downturn, during the third quarter of 2009, the Company committed to a streamlining program (the "Plan") designed to eliminate approximately 850 positions in all areas of the Company's business and in all regions in which the Company operates; however, the majority of actions are planned for the Company's EMEA region. As a result of the Company's Plan to reduce and consolidate the number of operating units, the Plan further includes charges for certain real estate lease impairments along with related accelerated depreciation.
76
Notes to Consolidated Financial Statements (Continued)
(Dollars and shares in thousands, except per share data)
Note 6. Severance, Impairment and Other Charges (Continued)
The actions under the Plan were intended to: 1) streamline the Company's EMEA region organization, including right-sizing the headquarters function, reducing and consolidating the number of operating units across the region, and improving the productivity of production and development activities; 2) leverage the foundational investments in process improvements the Company has made to reduce costs and improve productivity in its Sales, Finance, Human Resources and Customer Delivery and Development organizations; 3) reduce capacity and align the size of the Sales and Management Consulting teams in areas of reduced client demand; and 4) continue to build and invest in high-value, strategic growth areas, which include extending the Company's capabilities in specialty and patient-centered insights, in serving payers and governments, and in emerging markets for pharmaceuticals.
During the third quarter of 2009 the Company recorded $104,301 in Severance, impairment and other charges for employee termination benefits and facility exit costs and $2,024 in accelerated Depreciation and other amortization related to the facility exits. During the fourth quarter of 2009, the Company recorded an additional $1,272 in Severance, impairment and other charges for facility exit costs and $2,166 in accelerated Depreciation and other amortization related to the facility exits.
The severance benefits were calculated pursuant to the terms of established employee protection plans, in accordance with local statutory minimum requirements or individual employee contracts, as applicable. Employee termination actions under the Plan are expected to be completed by the end of the third quarter of 2010.
| |
Severance Related Reserves |
Facility Exit Charges |
Non-Cash Compensation Charges |
Currency Translation Adjustments |
Total | |||||||||||
|---|---|---|---|---|---|---|---|---|---|---|---|---|---|---|---|---|
Charge at August 31, 2009 |
$ | 100,653 | $ | 2,610 | $ | 1,038 | $ | — | $ | 104,301 | ||||||
Charge at December 31, 2009 |
— | 1,272 | — | — | 1,272 | |||||||||||
2009 utilization |
(9,709 | ) | (154 | ) | (1,038 | ) | — | (10,901 | ) | |||||||
Currency translation adjustments |
— | — | — | 760 | 760 | |||||||||||
Balance at December 31, 2009 |
$ | 90,944 | $ | 3,728 | $ | — | $ | 760 | $ | 95,432 | ||||||
The Company currently expects that cash outlays will be applied against the remaining balance in the 2009 charge at December 31, 2009 as follows:
Year Ended December 31,
|
Outlays | |||
|---|---|---|---|---|
2010 |
$ | 76,315 | ||
2011 |
15,603 | |||
2012 |
931 | |||
2013 |
343 | |||
2014 |
341 | |||
Thereafter |
1,899 | |||
Total |
$ | 95,432 | ||
During the second quarter of 2009, the Company recorded $25,428 in charges as a component of operating income. Of this amount, $17,210 related to non-cash impairment charges for the write-down of certain capitalized software assets to their net realizable values in the Company's Americas and EMEA regions. The write-downs were the result of the regular review of the Company's capitalized
77
Notes to Consolidated Financial Statements (Continued)
(Dollars and shares in thousands, except per share data)
Note 6. Severance, Impairment and Other Charges (Continued)
software assets. The remaining $8,218 was for supplier contract-related charges for which the Company will not realize any future economic benefit.
During the fourth quarter of 2009, the Company recorded $11,270 in charges as a component of operating income related to non-cash impairment charges for the write-down of certain capitalized software and prepaid assets to their net realizable values in its EMEA and Asia Pacific regions. The write-downs were the result of the regular review of the Company's assets. Additionally, the Company recorded $2,904 in charges as a component of operating income related to capital contributed by selling shareholders of a previously acquired business.
During the fourth quarter of 2008, the Company recorded $9,408 of non-cash impairment charges as a component of operating income related to the write-off of certain capitalized software assets in the Company's EMEA and Asia Pacific regions. This was the result of the discontinuation of certain IMS products at the end of 2008.
During the fourth quarter of 2007, the Company committed to a restructuring plan designed to eliminate approximately 1,070 positions worldwide in production and development, sales, marketing, consulting and services and administration. The plan also included the write-down of two impaired computer software assets and related contract payments to be incurred with no future economic benefit based on the Company's decision to abandon certain products in the Company's EMEA region. As a result, the Company recorded $88,690 of Severance, impairment and other charges as a component of operating income in the fourth quarter of 2007. The severance benefits were calculated pursuant to the terms of established employee protection plans, in accordance with local statutory minimum requirements or individual employee contracts, as applicable.
These charges were designed to strengthen client-facing operations worldwide, increase the Company's operating efficiencies and streamline the Company's cost structure. Some of the initiatives included in this plan are designed to better align the Company's resources to help clients manage for change in a challenging climate.
The severance and contract payments portion of the charge was approximately $75,043 and will all be settled in cash. Termination actions under the plan have been completed.
| |
Severance Related Reserves |
Contract Related Reserves |
Asset Write- Downs |
Currency Translation Adjustments |
Total | |||||||||||
|---|---|---|---|---|---|---|---|---|---|---|---|---|---|---|---|---|
Charge at December 31, 2007 |
$ | 71,583 | $ | 3,460 | $ | 13,647 | $ | — | $ | 88,690 | ||||||
2007 utilization |
— | — | (13,647 | ) | — | (13,647 | ) | |||||||||
2008 utilization |
(48,645 | ) | (2,150 | ) | — | — | (50,795 | ) | ||||||||
2009 utilization |
(17,189 | ) | (817 | ) | — | — | (18,006 | ) | ||||||||
2009 reversals |
(397 | ) | (493 | ) | — | — | (890 | ) | ||||||||
Currency translation adjustments |
— | — | — | (1,825 | ) | (1,825 | ) | |||||||||
Balance at December 31, 2009 |
$ | 5,352 | $ | — | $ | — | $ | (1,825 | ) | $ | 3,527 | |||||
78
Notes to Consolidated Financial Statements (Continued)
(Dollars and shares in thousands, except per share data)
Note 6. Severance, Impairment and Other Charges (Continued)
The Company currently expects that cash outlays will be applied against the remaining balance in the 2007 charge at December 31, 2009 as follows:
Year Ended December 31,
|
Outlays | |||
|---|---|---|---|---|
2010 |
$ | 2,675 | ||
2011 |
717 | |||
2012 |
135 | |||
Total |
$ | 3,527 | ||
Note 7. Noncontrolling Interests
On January 1, 2009, the Company adopted authoritative guidance which established accounting and reporting standards pertaining to ownership interests in subsidiaries held by parties other than the parent, the amount of net income attributable to the parent and to the noncontrolling interests, changes in a parent's ownership interests, and the valuation of any retained noncontrolling equity investment when a subsidiary is deconsolidated. This guidance also established disclosure requirements that identify and distinguish between the interests of the parent and the interests of the noncontrolling owners. The adoption of this authoritative guidance resulted in the reclassification of amounts previously referred to as minority interests and currently referred to as noncontrolling interests, from mezzanine equity (between Total Liabilities and Shareholders' Equity (Deficit)) to a separate component of Shareholders' Equity (Deficit) in the Company's Consolidated Statements of Financial Position. Additionally, net income attributable to noncontrolling interests, which previously was included in other expense, net on a pretax basis, is shown separately from net income attributable to the Company in the Company's Consolidated Statements of Income. The adoption of this authoritative guidance did not have a material impact on the Company's financial results.
The following table reconciles noncontrolling interests included as a separate component of Shareholders' Equity (Deficit). Prior year amounts have been reclassified to conform to the current year presentation.
| |
As of December 31, | ||||||
|---|---|---|---|---|---|---|---|
| |
2009 | 2008 | |||||
Noncontrolling interests, beginning of period |
$ | 1,894 | $ | 1,444 | |||
Income attributable to noncontrolling interests |
276 | 940 | |||||
Translation adjustments attributable to noncontrolling interests |
(330 | ) | (490 | ) | |||
Noncontrolling interests, end of period |
$ | 1,840 | $ | 1,894 | |||
In July 2006, the Company, together with two of its wholly-owned subsidiaries, entered into an Amended and Restated Agreement of Limited Liability Company of IMS Health Licensing Associates, L.L.C. (the "Amended LLC Agreement"). The Amended LLC Agreement governed the relationship between the Company, its subsidiaries and two third-party investors with respect to their interests in IMS Health Licensing Associates, L.L.C. (the "LLC"). The LLC is a separate and distinct legal entity that is in the business of licensing database assets and computer software. The Company is the sole managing member of the LLC. From 1997 until June 30, 2009, the Company and/or its subsidiaries, or
79
Notes to Consolidated Financial Statements (Continued)
(Dollars and shares in thousands, except per share data)
Note 7. Noncontrolling Interests (Continued)
their predecessors, had contributed assets to, and held a controlling interest (approximately 93% at June 30, 2009) in the LLC, and the third-party investors had contributed $100,000 to, and held a noncontrolling interest (approximately 7% at June 30, 2009) in the LLC. Pursuant to the terms of the Amended LLC Agreement, on May 6, 2009, the third-party investors elected to have their noncontrolling interests in the LLC liquidated or purchased by the Company or its designee. On June 30, 2009, a wholly-owned subsidiary of the Company purchased the third-party investors' noncontrolling interests in the LLC at a cost of $100,970, which the Company financed through a combination of cash on-hand and borrowings under its revolving credit facility. Following the purchase of the noncontrolling interests, the Company, together with its wholly-owned subsidiaries, hold 100% of the membership interest in the LLC. These third-party investor contributions qualified as redeemable noncontrolling interests as their redemption was not solely within the control of the Company. As such, these redeemable noncontrolling interests were presented in mezzanine equity in the Company's Consolidated Statements of Financial Position. Net income related to these redeemable noncontrolling interests amounted to $1,888 and $4,396 for the years ended December 31, 2009 and 2008, respectively, and is included in net income attributable to noncontrolling interests in the Company's Consolidated Statements of Income.
Note 8. Securities
Securities and other investments include the Company's investments in limited partner interests in venture capital partnerships. The limited partner interests are carried in the financial statements at cost, which was $8,324 at December 31, 2009 and $7,121 at December 31, 2008. On a quarterly basis, the Company monitors the realizable value of these investments and makes appropriate reductions in their carrying values when a decline in value is deemed to be other-than-temporary. The Company concluded that no reductions to carrying values were necessary during 2009 and 2008.
Note 9. Financial Instruments
FOREIGN EXCHANGE RISK MANAGEMENT
The Company transacts business in more than 100 countries and is subject to risks associated with changing foreign exchange rates. The Company's objective is to reduce earnings and cash flow volatility associated with foreign exchange rate changes. Accordingly, the Company enters into foreign currency forward contracts to minimize the impact of foreign exchange movements on net income, non-U.S. Dollar anticipated royalties, and on the value of non-functional currency assets and liabilities.
It is the Company's policy to enter into foreign currency transactions only to the extent necessary to meet its objectives as stated above. The Company does not enter into foreign currency transactions for investment or speculative purposes. The principal currencies hedged are the Euro, the Japanese Yen, the British Pound, the Swiss Franc and the Canadian Dollar.
The impact of foreign exchange risk management activities as described above on pre-tax income resulted in net losses of $3,400, $29,260 and $9,565 in 2009, 2008 and 2007, respectively. In addition, during the fourth quarter of 2008, the Company recorded a $16,071 foreign exchange loss related to the liquidation of non-functional currency Venezuelan Bolívars held at the Company's Swiss operating subsidiary. These foreign exchange losses are included in Other expense, net, in the Consolidated Statements of Income.
80
Notes to Consolidated Financial Statements (Continued)
(Dollars and shares in thousands, except per share data)
Note 9. Financial Instruments (Continued)
At December 31, 2009, the Company had assets of approximately $433,096 and liabilities of approximately $438,347 in foreign exchange forward contracts outstanding with various expiration dates through November 2010 relating to non-U.S. Dollar anticipated royalties and non-functional currency assets and liabilities. Foreign exchange forward contracts are recorded at estimated fair value. The estimated fair values of the forward contracts are based on quoted market prices.
Unrealized and realized gains and losses on the contracts hedging net income and non-functional currency assets and liabilities do not qualify for hedge accounting, and therefore are not deferred and are included in the Consolidated Statements of Income in Other expense, net.
Unrealized gains and losses on the contracts hedging non-U.S. Dollar anticipated royalties qualify for hedge accounting, and are therefore deferred and included in OCI ("Other Comprehensive Income").
| |
Fair Value of Derivative Instruments(1) | ||||||||||||
|---|---|---|---|---|---|---|---|---|---|---|---|---|---|
| |
Asset Derivatives | Liability Derivatives | |||||||||||
| |
As of December 31, 2009 |
As of December 31, 2008 |
As of December 31, 2009 |
As of December 31, 2008 |
|||||||||
Derivatives designated as hedging instruments
|
|||||||||||||
Foreign Exchange Contracts |
$ | 170,669 | $ | 172,113 | $ | 175,545 | $ | 179,110 | |||||
Derivatives not designated as hedging instruments
|
|||||||||||||
Foreign Exchange Contracts |
262,427 | 236,977 | 262,802 | 238,023 | |||||||||
Total Derivatives |
$ | 433,096 | $ | 409,090 | $ | 438,347 | $ | 417,133 | |||||
- (1)
- The net amounts of these derivatives are included in Current Assets and Current Liabilities in the Consolidated Statements of Financial Position.
| Effect of Derivatives on Financial Performance for the year Ended December 31, | |||||||||||||||
|---|---|---|---|---|---|---|---|---|---|---|---|---|---|---|---|
Derivatives in Cash Flow Hedging Relationships |
Amount of Gain/ (Loss) Recognized in OCI on Derivatives |
Location of Gain/(Loss) Reclassified from OCI into Income |
Amount of Gain/ (Loss) from OCI into Income |
||||||||||||
| |
2009 | 2008 | |
2009 | 2008 | ||||||||||
Foreign Exchange Contracts |
$ | (1,200 | ) | $ | (14,300 | ) | Other Income (Expense), Net |
$ | (3,300 | ) | $ | (12,300 | ) | ||
FAIR VALUE OF FINANCIAL INSTRUMENTS
At December 31, 2009, the Company's financial instruments included cash, cash equivalents, receivables, accounts payable and long-term debt. At December 31, 2009, the fair values of cash, cash equivalents, receivables and accounts payable approximated carrying values due to the short-term nature of these instruments. At December 31, 2009, the fair value of long-term debt approximated carrying value.
Effective January 1, 2008, the Company adopted authoritative guidance which established a three-level hierarchy for disclosure of fair value measurements as follows:
| Level 1 — | Quoted prices in active markets for identical assets or liabilities. |
81
Notes to Consolidated Financial Statements (Continued)
(Dollars and shares in thousands, except per share data)
Note 9. Financial Instruments (Continued)
| Level 2 — | Quoted prices for similar assets or liabilities in active markets or quoted prices for identical assets or liabilities in inactive markets; and model-derived valuations in which all significant inputs are observable in active markets. | |
Level 3 — |
Unobservable inputs reflecting management's own assumptions about the inputs used in pricing the asset or liability. |
The following table summarizes assets and liabilities measured at fair value on a recurring basis at December 31, 2009:
| |
Basis of Fair Value Measurements | |||||||||||||
|---|---|---|---|---|---|---|---|---|---|---|---|---|---|---|
| |
Level 1 | Level 2 | Level 3 | Total | ||||||||||
Assets |
||||||||||||||
Derivatives(1) |
— | $ | 433,096 | — | $ | 433,096 | ||||||||
Liabilities |
||||||||||||||
Derivatives(1) |
— | $ | 438,347 | — | $ | 438,347 | ||||||||
- (1)
- Derivatives consist of foreign exchange forward contracts based on observable market inputs of spot and forward rates.
CREDIT CONCENTRATIONS
The Company continually monitors its positions with, and the credit quality of, the financial institutions which are counterparties to its financial instruments and does not anticipate non-performance by the counterparties. The Company would not have realized a material loss during the year ended of December 31, 2009 in the event of non-performance by any one counterparty. In general, the Company enters into transactions only with financial institution counterparties that have a credit rating of A or better. In addition, the Company limits the amount of credit exposure with any one institution.
The Company maintains accounts receivable balances ($322,569 and $382,776, net of allowances, at December 31, 2009 and 2008, respectively), principally from customers in the pharmaceutical industry. The Company's trade receivables do not represent significant concentrations of credit risk at December 31, 2009 due to the credit worthiness of its customers and their dispersion across many geographic areas.
82
Notes to Consolidated Financial Statements (Continued)
(Dollars and shares in thousands, except per share data)
Note 9. Financial Instruments (Continued)
DEBT
The following table summarizes the Company's long-term debt at December 31, 2009 and December 31, 2008:
| |
2009 | 2008 | ||||||
|---|---|---|---|---|---|---|---|---|
5.58% Private Placement Notes, principal payment of $105,000 due January 2015 |
$ | 105,000 | $ | 105,000 | ||||
5.99% Private Placement Notes, principal payment of $135,000 due January 2018 |
135,000 | 135,000 | ||||||
5.55% Private Placement Notes, principal payment of $150,000 due April 2016 |
150,000 | 150,000 | ||||||
1.70% Private Placement Notes, principal payment of 34,395,000 Japanese Yen due January 2013 |
375,742 | 381,304 | ||||||
Revolving Credit Facility: |
||||||||
Japanese Yen denominated borrowings at average floating rates of approximately 0.78% |
359,511 | 435,895 | ||||||
U.S. Dollar denominated borrowings at average floating rates of approximately 1.22% |
69,400 | 147,000 | ||||||
Bank Term Loan, principal payment of $50,000 due June 2011 at average floating rate of approximately 0.54% |
50,000 | 50,000 | ||||||
Total Long-Term Debt |
$ | 1,244,653 | $ | 1,404,199 | ||||
In February 2008, the Company closed a private placement transaction pursuant to which it issued $105,000 of seven-year debt at a fixed rate of 5.58%, and $135,000 of ten-year debt at a fixed rate of 5.99% to several highly rated insurance companies. The Company used the proceeds for share repurchases (see Note 14) and to refinance existing debt.
In July 2006, the Company entered into a $1,000,000 revolving credit facility with a syndicate of 12 banks ("Revolving Credit Facility") replacing its existing $700,000 facility. The terms of the Revolving Credit Facility extended the maturity of the facility in its entirety to a term of five years, maturing July 2011, reduced the borrowing margins, and increased subsidiary borrowing limits. Total borrowings under the Revolving Credit Facility were $428,911 and $582,895 at December 31, 2009 and December 31, 2008, respectively, all of which were classified as long-term. The Company defines long-term lines as those where the lines are non-cancellable for more than 365 days from the balance sheet date by the financial institutions except for specified, objectively measurable violations of the provisions of the agreement. In general, rates for borrowing under the Revolving Credit Facility are LIBOR plus 55 basis points and can vary based on the Company's Debt to EBITDA ratio. The weighted average interest rates for the Company's lines were 0.85% and 1.36% at December 31, 2009 and December 31, 2008, respectively. In addition, the Company is required to pay a commitment fee on any unused portion of the facilities of 0.01%. At December 31, 2009, the Company had approximately $571,089 available under its existing bank credit facilities.
In June 2006, the Company closed a $50,000 three-year term loan with a bank. The term loan allows the Company to borrow at a floating rate with a lower borrowing margin than the Company's revolving credit facility. The term loan also provides the Company with two one-year options to extend
83
Notes to Consolidated Financial Statements (Continued)
(Dollars and shares in thousands, except per share data)
Note 9. Financial Instruments (Continued)
the term at the Company's discretion. In August 2008, the Company exercised the first one-year option to extend the term through June 2010, and in June 2009 the Company exercised the second one-year option to extend the term through June 2011. The Company used the proceeds to refinance existing debt borrowed under the revolving credit facility.
In April 2006, the Company closed a private placement transaction pursuant to which it issued $150,000 of ten-year notes to two highly rated insurance companies at a fixed rate of 5.55%. The Company used the proceeds to refinance existing debt of $150,000 drawn under a short-term credit agreement with a bank in January 2006.
In January 2006, the Company closed a private placement transaction pursuant to which its Japanese subsidiary issued 34,395,000 Japanese Yen seven-year debt (equal to $300,000 at date of issuance) to several highly rated insurance companies at a fixed rate of 1.70%. The Company used the proceeds to refinance existing debt in Japan.
The Company's financing arrangements provide for certain covenants and events of default customary for similar instruments, including in the case of its main bank arrangements, the private placement transactions, and the term loan, covenants to maintain specific ratios of consolidated total indebtedness to EBITDA and of EBITDA to certain fixed charges. At December 31, 2009, the Company was in compliance with these financial debt covenants.
Note 10. Pension and Postretirement Benefits
The Company sponsors both funded and unfunded defined benefit pension plans. These plans provide benefits based on various criteria, including, but not limited to, years of service and salary. The Company also sponsors an unfunded postretirement benefit plan in the U.S. that provides health and prescription drug benefits to retirees who meet the eligibility requirements. The Company uses a December 31 measurement date for all pension and postretirement benefit plans. The Company aggregates the disclosures of its U.S. and non-U.S. plans because the material assumptions used for such plans are similar.
84
Notes to Consolidated Financial Statements (Continued)
(Dollars and shares in thousands, except per share data)
Note 10. Pension and Postretirement Benefits (Continued)
The following tables summarize changes in the benefit obligation, the plan assets and the funded status of the Company's pension and postretirement benefit plans as well as the components of net periodic benefit costs, including key assumptions.
| |
Pension Benefits | Other Benefits | |||||||||||
|---|---|---|---|---|---|---|---|---|---|---|---|---|---|
Obligations and Funded Status at December 31,
|
2009 | 2008 | 2009 | 2008 | |||||||||
Change in benefit obligation |
|||||||||||||
Benefit obligation at beginning of year |
$ | 316,864 | $ | 350,672 | $ | 12,391 | $ | 12,629 | |||||
Service cost |
14,153 | 15,429 | — | — | |||||||||
Interest cost |
19,017 | 20,711 | 721 | 766 | |||||||||
Foreign currency exchange adjustment |
12,732 | (44,437 | ) | — | — | ||||||||
Amendments |
1,276 | — | — | (798 | ) | ||||||||
Plan participants' contributions |
6 | 8 | 595 | 627 | |||||||||
Actuarial loss (gain) |
8,233 | (10,115 | ) | (523 | ) | 426 | |||||||
Benefits paid (net of Medicare subsidy of $80 in 2009) |
(11,037 | ) | (14,166 | ) | (1,382 | ) | (1,604 | ) | |||||
Impact of elimination of early measurement date |
246 | — | — | ||||||||||
Curtailments |
— | — | — | 345 | |||||||||
Settlements |
(2,453 | ) | (1,604 | ) | — | — | |||||||
Acquisitions |
— | 121 | — | — | |||||||||
Benefit obligation at end of year |
$ | 358,791 | $ | 316,865 | $ | 11,802 | $ | 12,391 | |||||
Change in plan assets |
|||||||||||||
Fair value of plan assets at beginning of year |
$ | 264,628 | $ | 393,866 | $ | — | $ | — | |||||
Actual return on assets |
54,930 | (90,414 | ) | — | — | ||||||||
Foreign currency exchange adjustment |
10,464 | (36,079 | ) | — | — | ||||||||
Employer contributions |
9,447 | 11,413 | 787 | 978 | |||||||||
Plan participants' contributions |
6 | 8 | 595 | 626 | |||||||||
Benefits paid (net of Medicare subsidy of $80 in 2009) |
(11,037 | ) | (14,166 | ) | (1,382 | ) | (1,604 | ) | |||||
Fair value of plan assets at end of year |
$ | 328,438 | $ | 264,628 | $ | — | $ | — | |||||
Funded status |
$ | (30,353 | ) | $ | (52,237 | ) | $ | (11,802 | ) | $ | (12,391 | ) | |
Amounts recognized in the Consolidated Statements of Financial Position consist of: |
|||||||||||||
Other assets |
$ | 50,275 | $ | 26,525 | $ | — | $ | — | |||||
Accrued and other current liabilities |
(5,654 | ) | (3,649 | ) | (745 | ) | (749 | ) | |||||
Postretirement and postemployment benefits liability |
(74,974 | ) | (75,113 | ) | (11,057 | ) | (11,642 | ) | |||||
Net amount recognized |
$ | (30,353 | ) | $ | (52,237 | ) | $ | (11,802 | ) | $ | (12,391 | ) | |
85
Notes to Consolidated Financial Statements (Continued)
(Dollars and shares in thousands, except per share data)
Note 10. Pension and Postretirement Benefits (Continued)
The accumulated benefit obligation for all defined benefit pension plans was $341,251 and $304,661 at December 31, 2009, and 2008, respectively.
Information for pension plans with an accumulated benefit obligation in excess of plan assets as of December 31, |
2009 | 2008 | |||||
|---|---|---|---|---|---|---|---|
Projected benefit obligation |
$ | 222,778 | $ | 189,193 | |||
Accumulated benefit obligation |
$ | 206,722 | $ | 177,579 | |||
Fair value of plan assets |
$ | 142,150 | $ | 110,432 | |||
The amounts recognized in accumulated other comprehensive income consist of:
Additional Information as of December 31,
|
Pension Benefits 2009 |
Other Benefits 2009 |
Pension Benefits 2008 |
Other Benefits 2008 |
|||||||||
|---|---|---|---|---|---|---|---|---|---|---|---|---|---|
Net actuarial loss |
$ | 153,940 | $ | 2,570 | $ | 186,255 | $ | 3,748 | |||||
Prior service cost (credit) |
1,067 | (353 | ) | (617 | ) | (515 | ) | ||||||
Transition asset |
(60 | ) | — | (63 | ) | — | |||||||
Total |
$ | 154,947 | $ | 2,217 | $ | 185,575 | $ | 3,233 | |||||
| |
Pension Benefits | Other Benefits | |||||||||||||||||
|---|---|---|---|---|---|---|---|---|---|---|---|---|---|---|---|---|---|---|---|
Components of Net Periodic Benefit Cost for years ended December 31,
|
2009 | 2008 | 2007 | 2009 | 2008 | 2007 | |||||||||||||
Service cost |
$ | 14,153 | $ | 15,429 | $ | 13,116 | $ | — | $ | — | $ | 6 | |||||||
Interest cost |
19,017 | 20,711 | 18,452 | 721 | 766 | 720 | |||||||||||||
Expected return on plan assets |
(24,104 | ) | (31,454 | ) | (29,273 | ) | — | — | — | ||||||||||
Amortization of net loss |
9,409 | 2,721 | 4,174 | 655 | 595 | 471 | |||||||||||||
Amortization of prior service (credit) cost |
(99 | ) | 18 | 331 | (162 | ) | (178 | ) | (36 | ) | |||||||||
Amortization of transition (asset) obligation |
(3 | ) | (3 | ) | 9 | — | — | — | |||||||||||
Curtailment loss |
— | — | — | — | 227 | — | |||||||||||||
Settlement gain |
— | — | (51 | ) | — | — | — | ||||||||||||
Net periodic benefit cost |
$ | 18,373 | $ | 7,422 | $ | 6,758 | $ | 1,214 | $ | 1,410 | $ | 1,161 | |||||||
Other Changes in Plan Assets and Benefit Obligations Recognized in Other Comprehensive Income
|
|
|
|
|
|
|
|||||||||||||
|---|---|---|---|---|---|---|---|---|---|---|---|---|---|---|---|---|---|---|---|
Actuarial (gain) loss—current year |
$ | (22,597 | ) | $ | 111,753 | $ | (1,970 | ) | $ | (523 | ) | $ | 427 | $ | 1,026 | ||||
Prior service cost (credit)—current year |
1,276 | — | — | — | (798 | ) | — | ||||||||||||
Amortization of actuarial loss |
(9,409 | ) | (2,721 | ) | (4,174 | ) | (655 | ) | (595 | ) | (472 | ) | |||||||
Amortization of prior service credit (cost) |
99 | (18 | ) | (331 | ) | 162 | 178 | 36 | |||||||||||
Amortization of transition asset (obligation) |
3 | 3 | (9 | ) | — | — | — | ||||||||||||
Curtailment loss |
— | — | — | — | 118 | — | |||||||||||||
Settlement loss |
— | — | 51 | — | — | — | |||||||||||||
Total recognized in other comprehensive income |
$ | (30,628 | ) | $ | 109,017 | $ | (6,433 | ) | $ | (1,016 | ) | $ | (670 | ) | $ | 590 | |||
Total recognized in net periodic benefit cost and other comprehensive income |
$ | (12,255 | ) | $ | 116,439 | $ | 325 | $ | 198 | $ | 740 | $ | 1,751 | ||||||
86
Notes to Consolidated Financial Statements (Continued)
(Dollars and shares in thousands, except per share data)
Note 10. Pension and Postretirement Benefits (Continued)
The amounts in accumulated other comprehensive income that are expected to be recognized as components of net periodic benefit cost (credit) during the next fiscal year are as follows:
| |
Pension Benefits |
Other Benefits |
Total | |||||||
|---|---|---|---|---|---|---|---|---|---|---|
Net actuarial loss |
$ | 6,550 | $ | 370 | $ | 6,920 | ||||
Prior service cost (credit) |
107 | (162 | ) | (55 | ) | |||||
Transition asset |
(3 | ) | — | (3 | ) | |||||
Total |
$ | 6,654 | $ | 208 | $ | 6,862 | ||||
ASSUMPTIONS
| |
Pension Benefits | Other Benefits | |||||||||||
|---|---|---|---|---|---|---|---|---|---|---|---|---|---|
Weighted average assumptions used to determine benefit obligations at December 31, |
2009 | 2008 | 2009 | 2008 | |||||||||
Discount rate |
5.80 | % | 5.91 | % | 6.00 | % | 6.00 | % | |||||
Rate of compensation increase |
3.28 | % | 3.66 | % | N/A | N/A | |||||||
| |
Pension Benefits | Other Benefits | |||||||||||||||||
|---|---|---|---|---|---|---|---|---|---|---|---|---|---|---|---|---|---|---|---|
Weighted average assumptions used to determine net periodic benefit cost for years ended December 31,
|
2009 | 2008 | 2007 | 2009 | 2008 | 2007 | |||||||||||||
Discount rate |
5.91 | % | 5.90 | % | 5.39 | % | 6.00 | % | 6.25 | % | 6.00 | % | |||||||
Expected long-term return on plan assets |
7.91 | % | 7.94 | % | 7.94 | % | N/A | N/A | N/A | ||||||||||
Rate of compensation increase |
3.66 | % | 3.58 | % | 3.49 | % | N/A | N/A | N/A | ||||||||||
Assumed health care cost trend rates at December 31,
|
2009 | 2008 | 2007 | |||||||
|---|---|---|---|---|---|---|---|---|---|---|
Health care cost trend rate assumed for next year |
8.50 | % | 9.25 | % | 10.0 | % | ||||
Rate to which the cost trend rate is assumed to decline (the ultimate trend rate) |
5.0 | % | 5.0 | % | 5.0 | % | ||||
Year that the rate reaches the ultimate trend rate |
2017 | 2015 | 2015 | |||||||
Assumed health care cost trend rates have a significant effect on the amounts reported for the health care plans. A one-percentage-point change in assumed health care cost trend rates would have the following effects:
| |
1-Percentage- Point Increase |
1-Percentage- Point Decrease |
|||||
|---|---|---|---|---|---|---|---|
Effect on total of service and interest cost |
$ | 57 | $ | (49 | ) | ||
Effect on accumulated postretirement benefit obligation |
$ | 933 | $ | (808 | ) | ||
87
Notes to Consolidated Financial Statements (Continued)
(Dollars and shares in thousands, except per share data)
Note 10. Pension and Postretirement Benefits (Continued)
PLAN ASSETS
The Company's pension plan weighted average asset allocations at December 31, 2009, and 2008, by asset category, follows:
| |
Plan Assets at December 31, | ||||||
|---|---|---|---|---|---|---|---|
Asset Category
|
2009 | 2008 | |||||
Equity securities |
67 | % | 65 | % | |||
Debt securities |
26 | 30 | |||||
Real estate |
4 | 4 | |||||
Other |
3 | 1 | |||||
Total |
100 | % | 100 | % | |||
The target asset allocation for the Company's pension plans is as follows:
Asset Category
|
2009 | |||
|---|---|---|---|---|
Equity securities |
60 – 80 | % | ||
Debt securities |
20 – 30 | % | ||
Real estate |
0 – 10 | % | ||
Other |
0 – 1 | % | ||
Effective January 1, 2008, the Company adopted authoritative guidance which established a three-level hierarchy for disclosure of fair value measurements as follows:
| Level 1 — | Quoted prices in active markets for identical assets or liabilities. | |
Level 2 — |
Quoted prices for similar assets or liabilities in active markets or quoted prices for identical assets or liabilities in inactive markets; and model-derived valuations in which all significant inputs are observable in active markets. |
|
Level 3 — |
Unobservable inputs reflecting management's own assumptions about the inputs used in pricing the asset or liability. |
The following table summarizes plan assets measured at fair value on December 31, 2009:
| |
Fair Value Measurements at December 31, 2009 | ||||||||||||||
|---|---|---|---|---|---|---|---|---|---|---|---|---|---|---|---|
| |
Total | Level 1 | Level 2 | Level 3 | |||||||||||
Asset Category |
|||||||||||||||
Investment Funds |
|||||||||||||||
Cash and Equivalents(1) |
$ | 644 | $ | 644 | $ | — | $ | — | |||||||
Domestic Equities(2) |
121,425 | 24,997 | 96,428 | — | |||||||||||
International Equities(3) |
98,412 | 17,187 | 81,225 | — | |||||||||||
Debt issued by national, state or local govt(4) |
28,321 | 717 | 27,604 | — | |||||||||||
Corporate Bonds(5) |
58,810 | 26,572 | 32,238 | — | |||||||||||
Real Estate(6) |
12,254 | — | — | 12,254 | |||||||||||
Investment Fund(7) |
1,188 | — | 1,188 | — | |||||||||||
Insurance Contracts(8) |
7,384 | — | 7,384 | — | |||||||||||
Total Assets |
$ | 328,438 | $ | 70,117 | $ | 246,067 | $ | 12,254 | |||||||
- (1)
- Comprises funds which hold government securities or high quality money market instruments
88
Notes to Consolidated Financial Statements (Continued)
(Dollars and shares in thousands, except per share data)
Note 10. Pension and Postretirement Benefits (Continued)
- (2)
- Comprises
actively managed mutual funds, passively managed collective trusts and pooled funds investing primarily in companies with market capitalizations
similar to that of the S&P 500, S&P Small Cap 600, Russell 1000 and Russell 2000 indexes. The collective trusts do not participate in securities lending.
- (3)
- Comprises
actively managed mutual funds, passively managed collective trust fund and pooled funds investing primarily in companies in non-U.S.
countries and non-U.S. developed market countries similar to that of the Morgan Stanley Capital International EAFE index. The collective trust does not participate in securities lending.
- (4)
- Comprises
passively managed pooled funds primarily invested in debt instruments from non-U.S. national state or local Governments.
- (5)
- Comprises
actively managed mutual funds, passively managed collective trust fund and pooled funds investing primarily in a diversified portfolio of
investment grade U.S. and non-U.S. fixed income securities. The collective trust does not participate in securities lending.
- (6)
- Comprises
an actively managed pooled fund which primarily invests in real estate, including but not limited to offices, retail warehouses and shopping
centers.
- (7)
- Comprises
an actively managed investment fund which primarily invests in a diversified portfolio consisting of approximately 60% equities and equal parts
fixed income, real estate, insurance policies and cash.
- (8)
- Comprises an insurance product that guarantees principal and a minimum rate of return.
| |
Fair Value Measurements Using Significant Unobservable Inputs (Level 3) |
|||||||||
|---|---|---|---|---|---|---|---|---|---|---|
| |
Total | Property | ||||||||
Asset Description |
||||||||||
Beginning balance, December 31, 2008 |
$ | 10,956 | $ | 10,956 | ||||||
Actual return on plan assets |
||||||||||
— Assets held at end of year |
379 | 379 | ||||||||
— Assets sold during year |
— | — | ||||||||
Purchases, sales and settlements |
— | — | ||||||||
Transfers in and/or out of level 3 |
919 | 919 | ||||||||
Ending balance, December 31, 2009 |
$ | 12,254 | $ | 12,254 | ||||||
INVESTMENT POLICIES AND STRATEGIES
The Company invests primarily in a diversified portfolio of equity and debt securities that provide for long- term growth within reasonable and prudent levels of risk. The asset allocation targets established by the Company are strategic and applicable to the Plan's long-term investing horizon. The portfolio is constructed and maintained to provide adequate liquidity to meet associated liabilities and minimize long-term expense and provide prudent diversification among asset classes in accordance with the principles of modern portfolio theory. The plan employs a diversified mix of actively managed investments around a core of passively managed index exposures in each asset class. Within each asset class, rapid market shifts, changes in economic conditions or an individual fund manager's outlook may cause the asset allocation to fall outside the prescribed targets. The majority of the Company's plan assets are measured quarterly against benchmarks established by the Company's investment advisors and the Company's Asset Management Committee, who reviews actual plan performance and has the
89
Notes to Consolidated Financial Statements (Continued)
(Dollars and shares in thousands, except per share data)
Note 10. Pension and Postretirement Benefits (Continued)
authority to recommend changes as deemed appropriate. Assets are rebalanced periodically to their strategic targets to maintain the Plan's strategic risk/reward characteristics. The Company periodically conducts asset liability modeling studies to ensure that the investment strategy is aligned with the obligations of the plans and that the assets will generate income and capital growth to meet the cost of current and future benefits that the plans provide. The pension plans do not include investments in Company stock at December 31, 2009 or 2008.
The portfolio for the Company's U.K. Pension plan seeks to invest in a range of suitable assets of appropriate liquidity which will generate in the most effective manner possible, income and capital growth to ensure that there are sufficient assets to meet benefit payments when they fall due, while controlling the long-term costs of the plan and avoiding short-term volatility of investment returns. The plan seeks to achieve these objectives by investing in a mixture of real (equities) and monetary (fixed interest) assets. It recognizes that the returns on real assets, while expected to be greater over the long-term than those on monetary assets, are likely to be more volatile. A mixture across asset classes should nevertheless provide the level of returns required by the Plan. The trustee periodically conducts asset liability modeling exercises to ensure the investments are aligned with the appropriate benchmark to better reflect the Plan's liabilities. The trustee also undertakes to review this benchmark on a regular basis.
EXPECTED LONG-TERM RATE-OF-RETURN ON ASSETS
In selecting an expected return on plan asset assumption, the Company considers the returns being earned by each plan investment category in the fund, the rates of return expected to be available for reinvestment and long-term economic forecasts for the type of investments held by the plan. At January 1, 2010 the expected return on plan assets for the U.S. pension plans is 8.50%, which is unchanged from the prior year and the estimated long-term rate of return on the U.K. plan was 7.25% versus 7.50% at January 1, 2009. Outside the U.S., the range of applicable expected rates of return is 1.5% – 7.25% as of January 1, 2010 compared to a range of 1.5%—7.5% at January 1, 2009. The actual return on plan assets will vary from year to year versus this assumption. The Company believes it is appropriate to use long-term expected forecasts in selecting its expected return on plan assets. As such, there can be no assurance that its actual return on plan assets will approximate the long-term expected forecasts. The EROA was $24,104 and $31,454 and the actual return on assets was $54,930 and ($90,414), respectively, for the years ended December 31, 2009 and 2008. The variance between the EROA and the actual return on assets is a function of the methodology used to determine the EROA as mentioned above, specifically the long-term economic forecasts for the type of investments held by the plan. Actual annual return variances to EROA were particularly pronounced in 2009 due to a strong market recovery from the unprecedented downturn in 2008.
The Company's estimated long-term rate of return on plan assets is based on the principles of capital market theory which maintain that over the long run, prudent investment risk taking is rewarded with incremental returns and that combining non correlated assets can maximize risk adjusted portfolio returns. Long-term return estimates are developed by asset category based on actual class return data, historical relationships between asset classes and risk factors and peer plan data. Long-term return estimates for the Company's U.K. pension plan are developed by asset category based on actual class return data, historical relationships between asset classes and risk factors.
90
Notes to Consolidated Financial Statements (Continued)
(Dollars and shares in thousands, except per share data)
Note 10. Pension and Postretirement Benefits (Continued)
CASH FLOWS
CONTRIBUTIONS. During fiscal 2009, the Company contributed $10,231 to its pensions and postretirement benefit plan which included voluntary contributions above the minimum requirements for the pension plans. The Company currently expects to contribute $13,473 in required contributions and $274 in discretionary contributions to its pension and postretirement benefit plans during fiscal 2010. The Company may make additional contributions into its pension plans in fiscal 2010 depending on, among other factors, how the funded status of those plans changes and in order to meet minimum funding requirements as set forth in employee benefit and tax laws, plus additional amounts the Company may deem to be appropriate.
ESTIMATED FUTURE BENEFIT PAYMENTS AND SUBSIDY RECEIPTS. The following benefit payments (net of expected participant contributions), which reflect expected future service and the Medicare Part D subsidy receipts, are expected to be paid or received as follows:
Expected benefit payments/(subsidy receipts)
|
Pension Benefits |
Other Benefits |
Expected Federal Subsidy |
|||||||
|---|---|---|---|---|---|---|---|---|---|---|
2010 |
$ | 15,278 | $ | 1,507 | $ | (128 | ) | |||
2011 |
11,967 | 1,645 | (140 | ) | ||||||
2012 |
12,831 | 1,751 | (162 | ) | ||||||
2013 |
13,933 | 1,884 | (177 | ) | ||||||
2014 |
15,150 | 2,002 | (192 | ) | ||||||
Years 2015 – 2018 |
96,062 | 11,056 | (862 | ) | ||||||
PLANS ACCOUNTED FOR AS DEFERRED COMPENSATION CONTRACTS. The Company provides certain executives with supplemental pension benefits in accordance with their individual employment arrangements. The tables of this Note 10 do not include the Company's expense or obligation associated with providing these benefits. The Company's obligation for these unfunded arrangements was $19,538 at December 31, 2009, and $17,610 at December 31, 2008. Annual expense was approximately $3,097, $2,101 and $2,880 for the years ended December 31, 2009, 2008 and 2007, respectively. The discount rate and rate of compensation increase used to measure year-end obligations was 6.0% and 4.0%, respectively, as of December 31, 2009, and 6.0% and 4.5%, respectively, as of December 31, 2008.
DEFINED CONTRIBUTION PLANS. Certain employees of the Company in the U.S. are eligible to participate in the Company-sponsored defined contribution plan. The Company makes a matching contribution of up to 50% of the employee's contribution based on specified limits of the employee's salary. The Company's expense related to this plan was approximately $4,466, $4,694 and $4,501 for the years ended December 31, 2009, 2008 and 2007, respectively. Approximately 3% and 2% of total plan assets were invested in Company stock at December 31, 2009 and 2008, respectively.
On January 1, 2007, the defined contribution executive retirement plan was established. Participants are certain key executives who are designated by the CEO and approved by the Human Resource Committee of the board. Contributions are defined in the plan document and consist of basic and past service contributions as well as an annual investment credit. Both types of contributions are based on age and service, however, the past service contribution is only granted to the participants for the first ten years of participation in the plan. Each account is credited with an annual investment credit based on the average of the annual yields at the end of each month on the AA-AAA rated
91
Notes to Consolidated Financial Statements (Continued)
(Dollars and shares in thousands, except per share data)
Note 10. Pension and Postretirement Benefits (Continued)
10+ year maturity component of the Merrill Lynch U.S. Corporate Bond Master Index. The plan has no assets, but a liability equal to the contributions credited to the participants is recorded in the balance sheet of the Company. The Company's expense related to this plan was approximately $1,966 and $1,954 for the years ended December 31, 2009 and 2008, respectively.
There are additional Company-sponsored defined contribution arrangements for employees of the Company residing in countries other than the U.S. The Company is required to make contributions based on the specific requirements of the plans. The Company's expense related to these plans was approximately $6,157, $6,562 and $5,818 for the years ended December 31, 2009, 2008 and 2007, respectively. None of the plan assets were invested in Company stock at any time during 2009, 2008, or 2007.
Note 11. Stock-Based Compensation
The Company is required to recognize as stock-based compensation expense all share-based payments to employees, including grants of employee stock options, over the requisite service period (generally the vesting period) in the Consolidated Statements of Income based on their fair values. For options with graded vesting, the Company values the stock option grants and recognizes compensation expense as if each vesting portion of the award was part of the total award and not a separate award. The Company is required to recognize stock-based compensation for the number of awards that are ultimately expected to vest. As a result, for most awards, recognized stock-based compensation is reduced for estimated forfeitures prior to vesting primarily based on historical annual forfeiture rates. Estimated forfeitures will be reassessed in subsequent periods and may change based on new facts and circumstances. The pool of excess tax benefits available to absorb tax deficiencies is calculated by including the net excess tax benefits that would have qualified as such had the entity recognized stock-based compensation expense for stock option awards in the Consolidated Statements of Income from the date of grant. In addition, realized tax benefits in excess of amounts recognized in the Consolidated Statements of Income are recognized as a financing activity rather than an operating activity for purposes of the Consolidated Statement of Cash Flows.
The Company maintains four Stock Incentive Plans, which provide for the grant of stock options, stock appreciation rights, restricted stock and restricted stock units to eligible employees and Non-Employee Directors. At December 31, 2009, there were 59,279 shares of Common Stock reserved for issuance under all of the Company's stock plans, of which 10,791 shares are still available for future grants. Common Stock reserved for issuance includes 18,448 shares from the 2000 Stock Incentive Plan, which the Board of Directors approved during 2000, 36,484 shares from the 1998 Employees' Stock Incentive Plan, 29,784 of which was approved by the shareholders during 1998 and 6,700 of which were approved by the shareholders in May 2006, 3,437 shares from the 1998 Employees' Stock Purchase Plan, which was approved by the shareholders during 1998, and 910 shares from the 1998 Non-Employee Directors' Stock Incentive Plan, 410 shares of which were approved by the shareholders during 1998 and an additional 500 shares of which were approved by the shareholders in May 2003. Historically, stock options have been granted to broad groups of employees on a discretionary basis. Beginning in fiscal 2006, employees generally became eligible to receive restricted stock units with a service condition of four years instead of stock options with a service condition of three years. Certain senior employees continue to be eligible to receive restricted stock units which contain both performance and service conditions and beginning in fiscal 2008, stock appreciation rights with service conditions.
92
Notes to Consolidated Financial Statements (Continued)
(Dollars and shares in thousands, except per share data)
Note 11. Stock-Based Compensation (Continued)
The Employee Stock Purchase Plan ("ESPP") was originally adopted in 1998 with a quarterly purchase period and a price equal to the lesser of 90% of the fair market value on the first trading day or the last trading day of the period. The Company amended its ESPP in 2001 to allow employees to purchase a limited amount of Common Stock at the end of each six-month period at a price equal to the lesser of 85% of fair market value on (a) the first trading day of the period, or (b) the last trading day of the period. Beginning with the first purchase of 2006, the plan was amended to allow employees to purchase a limited amount of Common Stock at the end of each six-month period at a price equal to 85% of the fair market value on the last trading day of the period. Beginning with the first purchase of 2007, the plan was amended to allow employees to purchase a limited amount of Common Stock at the end of each six-month period at a price equal to 90% of the fair market value on the last trading day of the period. Fair market value is defined as the average of the high and low prices of the shares on the relevant day. The 10% discount made the plan compensatory. At the discretion of the Human Resources Committee of the Company's Board of Directors (the "Committee"), the ESPP was discontinued effective with the December 31, 2007 purchase.
Stock options are granted with an exercise price equal to the fair market value of a share of Common Stock on the date of grant. Stock options expire within seven to ten years and generally vest ratably over three years for employees and one to three years for non-employee directors. The vesting period and option term for grants to employees is at the discretion of the Committee.
Stock appreciation rights ("SARs") are granted with an exercise price equal to the fair market value of a share of Common Stock on the date of grant. SARs expire within seven years and will vest ratably over three to four years for employees. The vesting period and option term for grants to employees is at the discretion of the Committee.
Restricted stock units ("RSUs") are granted at a price equal to the fair market value of a share of Common Stock on the date of grant. RSUs with service vesting generally vest ratably over three to four years. The vesting period for grants to employees is at the discretion of the Committee. Non-employee directors and senior executives have the ability to elect to defer settlement of RSUs pursuant to the Company's Stock Incentive Plans. Elections to defer the share distribution date are subject to the requirements of Internal Revenue Code Section 409A.
Participation in the Performance Restricted Stock Units program ("PERS"), under which performance RSUs are granted, is limited to key senior executives. The target award is denominated in cash and is equal to each eligible executive's annual incentive target. These awards are subject to fair value adjustments for any changes in the underlying market value of the Company's Common Stock until the end of the performance period. The performance period is one year during which performance against the established financial criterion is measured. The actual award is quantified and granted to eligible employees in RSUs at the February Committee meeting in the year following the one year performance period. Upon grant, there is an additional two year cliff vest service requirement which begins on the first business day of the year following the performance period. If performance criterion is not met, the award is forfeited and no RSUs are granted. The RSUs granted are determined using the fair market value based on the average high/low stock price for the last 20 trading days of the performance period in accordance with the PERS program. Performance awards are granted at a price equal to the fair market value of a share of Common Stock on the date of grant.
Participation in the Long-Term Incentive program ("LTI"), under which performance RSUs are granted, is at the CEO's discretion with participants varying from year to year. The target awards, by person, are approved by the Committee prior to the end of the first quarter of the performance cycle.
93
Notes to Consolidated Financial Statements (Continued)
(Dollars and shares in thousands, except per share data)
Note 11. Stock-Based Compensation (Continued)
Upon completion of the two year performance period achievement against the established financial criterion is measured and the actual payout percentage is quantified and approved by the Committee following approval of year end results by the Board of Directors. If the performance criterion is not met, the award is forfeited and no RSUs are granted and no cash or unrestricted shares paid. An RSU, if earned, may only be settled by issuance or delivery of a share. For years 2008 and prior, the target LTI awards are denominated 50% in cash or in unrestricted shares of stock, based on the fair market value of IMS Common Stock on the day of grant and are payable after the two year performance period. The remaining 50% of the target LTI awards are payable in RSUs, which are granted after the two year performance period with an additional two year cliff vest service requirement. These awards are subject to fair value adjustments for any changes in the underlying market value of the Company's Common Stock until the end of the two year performance period. The number of RSUs granted for LTI awards prior to 2008 are determined using the fair market value based on the average high/low stock price for the last 20 trading days of the year prior to the beginning of the performance period in accordance with the LTI plan document. The number of RSUs granted under the 2008 and 2009 LTI programs are determined using the fair market value of IMS Common Stock on the day of grant. The target LTI awards granted in 2009 were denominated 100% in RSUs based on the fair market value of IMS Common Stock on the day of grant and are payable after a two year performance period with an additional one year cliff vest service requirement. These awards are not subject to fair value adjustments as the grant agreements were prepared to allow for fixed accounting.
94
Notes to Consolidated Financial Statements (Continued)
(Dollars and shares in thousands, except per share data)
Note 11. Stock-Based Compensation (Continued)
The following table summarizes activity of stock options and stock appreciation rights for the periods indicated:
| |
Shares | Weighted Average Exercise Price Per Share |
Weighted Average Remaining Term |
Aggregate Intrinsic Value |
|||||||||
|---|---|---|---|---|---|---|---|---|---|---|---|---|---|
Options Outstanding, December 31, 2006 |
21,396 | $ | 23.43 | ||||||||||
Granted |
— | — | |||||||||||
Exercised |
(6,299 | ) | $ | 22.72 | |||||||||
Forfeited |
(200 | ) | $ | 24.14 | |||||||||
Cancelled |
(371 | ) | $ | 27.61 | |||||||||
Options Outstanding, December 31, 2007 |
14,526 | $ | 23.62 | ||||||||||
Granted |
1,159 | $ | 22.58 | ||||||||||
Exercised |
(277 | ) | $ | 19.91 | |||||||||
Forfeited |
(88 | ) | $ | 23.86 | |||||||||
Cancelled |
(2,141 | ) | $ | 25.51 | |||||||||
Options Outstanding, December 31, 2008 |
13,179 | $ | 23.29 | ||||||||||
Granted |
1,795 | $ | 13.43 | ||||||||||
Exercised |
(193 | ) | $ | 16.81 | |||||||||
Forfeited |
(87 | ) | $ | 17.50 | |||||||||
Cancelled |
(3,473 | ) | $ | 26.48 | |||||||||
Options Outstanding, December 31, 2009 |
11,221 | $ | 20.89 | 2.45 | $ | 22,163 | |||||||
Options Vested or Expected to Vest, December 31, 2009 |
11,006 | $ | 20.98 | 2.38 | $ | 21,027 | |||||||
Exercisable, December 31, 2009 |
8,750 | $ | 22.17 | 1.45 | $ | 9,147 | |||||||
95
Notes to Consolidated Financial Statements (Continued)
(Dollars and shares in thousands, except per share data)
Note 11. Stock-Based Compensation (Continued)
The intrinsic value for stock options is calculated based on the exercise price of the underlying awards and the market price of the Company's Common Stock as of the end of the period. As of December 31, 2009, approximately $7,831 of unrecognized stock compensation expense related to unvested SARs (net of estimated forfeitures) is expected to be recognized over a weighted-average period of approximately 2.30 years. Proceeds received from the exercise of stock options were $3,240 for the year ended December 31, 2009, and $5,521 for the year ended December 31, 2008. The intrinsic value of stock options that were exercised was $745 for the year ended December 31, 2009, the majority of which is currently deductible for tax purposes, $1,146 for the year ended December 31, 2008, and $50,120 for the year ended December 31, 2007.
The fair value of stock options and stock appreciation rights is estimated using the Black-Scholes option-pricing model. This model requires the input of subjective assumptions that will usually have a significant impact on the fair value estimate. The assumptions for prior year grants were developed based on relevant guidance.
The Company granted SARs on April 21, 2009 and April 15, 2008. The Company did not grant any stock options or SARs during 2007. The following table summarizes the weighted average assumptions used to compute the weighted average fair value of prior year stock option grants:
| |
2009 | 2008 | |||||
|---|---|---|---|---|---|---|---|
Dividend Yield |
0.5 | % | 0.5 | % | |||
Weighted Average Volatility |
31.4 | % | 22.6 | % | |||
Risk Free Interest Rate |
1.92 | % | 2.87 | % | |||
Expected Term |
4.26 years | 5.00 years | |||||
Weighted Average Fair Value of Options Granted |
$ | 3.64 | $ | 5.49 | |||
Weighted Average Grant Price |
$ | 13.43 | $ | 22.58 | |||
- •
- The dividend yield that resulted from dividing the annualized dividend by the closing stock price on the date of payment
in 2009 was higher than the 0.5% yield that has been consistent since the quarterly dividend was increased to $.03 per share in 2006. Since the increase in dividend yield was due to a sharp decrease
in stock price and not a change in the dividend payments, the Black Scholes value for the 2009 grant of stock appreciation rights was calculated using the historical dividend yield of 0.5%. An
increase in the dividend yield will decrease stock compensation expense.
- •
- The weighted average volatility was developed using historical volatility for periods equal to the expected life of the
options. An increase in the weighted average volatility assumption will increase stock compensation expense.
- •
- The risk-free interest rate was developed using the U.S. Treasury yield curve for periods equal to the
expected life of the options on the grant date. An increase in the risk-free interest rate will increase stock compensation expense.
- •
- The expected term was estimated for the 2008 grant of stock appreciation rights by reviewing the historical exercise experience of all past stock option grants with vesting terms of three years. The expected term that resulted from the review of three year awards was adjusted to account for the four year vesting of the stock appreciation rights granted in 2008. The expected term was estimated for the 2009 grant of stock appreciation rights by reviewing the historical exercise
96
Notes to Consolidated Financial Statements (Continued)
(Dollars and shares in thousands, except per share data)
Note 11. Stock-Based Compensation (Continued)
experience of all past stock option grants with vesting terms of three years. Since the vesting period of the 2009 grant of stock appreciation rights was three years, no adjustment to the historical exercise experience was required. An increase in the expected holding period will increase stock compensation expense.
The following table summarizes activity of RSUs with service conditions:
| |
Shares | Weighted Average Grant Date Fair Value | Aggregate Intrinsic Value | |||||||
|---|---|---|---|---|---|---|---|---|---|---|
Unvested, December 31, 2006 |
1,558 | $ | 25.04 | |||||||
Granted |
1,219 | $ | 29.64 | |||||||
Vested |
(296 | ) | $ | 26.06 | ||||||
Forfeited |
(148 | ) | $ | 28.09 | ||||||
Unvested, December 31, 2007 |
2,333 | $ | 27.16 | |||||||
Granted |
1,356 | $ | 22.24 | |||||||
Vested |
(569 | ) | $ | 27.45 | ||||||
Forfeited |
(348 | ) | $ | 26.74 | ||||||
Unvested, December 31, 2008 |
2,772 | $ | 24.75 | |||||||
Granted |
2,146 | $ | 13.53 | |||||||
Vested |
(903 | ) | $ | 25.60 | ||||||
Forfeited |
(267 | ) | $ | 21.91 | ||||||
Unvested, December 31, 2009 |
3,748 | $ | 18.33 | $ | 79,245 | |||||
Vested or Expected to Vest, December 31, 2009 |
3,390 | $ | 18.44 | $ | 71,657 | |||||
The intrinsic value for RSUs is calculated based on the market price of the Company's Common Stock as of the end of the period. As of December 31, 2009, approximately $45,894 of unrecognized stock compensation expense related to unvested RSUs (net of estimated forfeitures) is expected to be recognized over a weighted-average period of 2.58 years. The total fair value of RSUs with service conditions which vested during the periods ended December 31, 2009, 2008 and 2007 was $12,716, $14,496 and $8,716, respectively.
97
Notes to Consolidated Financial Statements (Continued)
(Dollars and shares in thousands, except per share data)
Note 11. Stock-Based Compensation (Continued)
The following table summarizes activity of RSUs with performance conditions:
| |
Shares | Weighted Average Grant Date Fair Value |
Aggregate Intrinsic Value |
|||||||
|---|---|---|---|---|---|---|---|---|---|---|
Unvested, December 31, 2006 |
613 | $ | 24.20 | |||||||
Granted |
402 | $ | 15.77 | |||||||
Vested |
(84 | ) | $ | 18.65 | ||||||
Forfeited |
(6 | ) | $ | 27.00 | ||||||
Unvested, December 31, 2007 |
925 | $ | 21.02 | |||||||
Granted |
357 | $ | 19.61 | |||||||
Vested |
(109 | ) | $ | 23.86 | ||||||
Forfeited |
(12 | ) | $ | 27.26 | ||||||
Unvested, December 31, 2008 |
1,161 | $ | 20.18 | |||||||
Granted |
538 | $ | 13.39 | |||||||
Vested |
(536 | ) | $ | 19.91 | ||||||
Forfeited |
(39 | ) | $ | 15.43 | ||||||
Unvested, December 31, 2009 |
1,124 | $ | 17.22 | $ | 23,759 | |||||
Vested or Expected to Vest, December 31, 2009 |
1,050 | $ | 15.37 | $ | 22,191 | |||||
The intrinsic value for RSUs with performance conditions is calculated based on the market price of the Company's Common Stock as of the end of the period. As of December 31, 2009, approximately $7,900 of unrecognized stock compensation expense related to unvested restricted stock units (net of estimated forfeitures) is expected to be recognized over a weighted-average period of 1.57 years. The total fair value of RSUs with performance conditions which vested during the periods ended December 31, 2009, 2008 and 2007 was $7,510, $1,059 and $2,347, respectively.
The following table summarizes activity of non-employee director deferred stock granted in lieu of board meeting fees:
| |
Shares | Weighted Average Grant Date Fair Value |
|||||
|---|---|---|---|---|---|---|---|
Outstanding, December 31, 2006 |
33 | $ | 22.49 | ||||
Granted |
5 | $ | 29.50 | ||||
Outstanding, December 31, 2007 |
38 | $ | 23.37 | ||||
Granted |
6 | $ | 19.71 | ||||
Outstanding, December 31, 2008 |
44 | $ | 22.81 | ||||
Granted |
10 | $ | 16.02 | ||||
Vested |
(14 | ) | $ | 21.68 | |||
Outstanding, December 31, 2009 |
40 | $ | 21.52 | ||||
98
Notes to Consolidated Financial Statements (Continued)
(Dollars and shares in thousands, except per share data)
Note 11. Stock-Based Compensation (Continued)
The following table summarizes the components and classification of stock-based compensation expense in 2009, 2008 and 2007:
| |
Year ended December 31, | |||||||||
|---|---|---|---|---|---|---|---|---|---|---|
| |
2009 | 2008 | 2007 | |||||||
Stock Options |
$ | 3,240 | $ | 4,030 | $ | 14,143 | ||||
Restricted Stock Units |
30,340 | 24,008 | 20,810 | |||||||
Employee Stock Purchase Plan |
— | (2 | ) | 639 | ||||||
Total Stock-Based Compensation Expense |
$ | 33,580 | $ | 28,036 | $ | 35,592 | ||||
Operating Costs of I&A |
$ | 2,643 | $ | 2,938 | $ | 3,610 | ||||
Direct and Incremental Costs of C&S |
4,494 | 3,616 | 3,762 | |||||||
Selling, & Administrative Expenses |
26,443 | 21,482 | 28,220 | |||||||
Total Stock-Based Compensation Expense |
$ | 33,580 | $ | 28,036 | $ | 35,592 | ||||
Tax Benefit on Stock-Based Compensation Expense |
$ | 10,511 | $ | 8,892 | $ | 10,334 | ||||
Capitalized Stock-Based Compensation Expense |
$ | 200 | $ | 185 | $ | 325 | ||||
The tax benefit realized on stock options exercised and restricted stock issued for the year ended December 31, 2009 was $6,945.
Realized tax benefits in excess of amounts recognized in the Consolidated Statements of Income were recognized as a financing activity rather than an operating activity for purposes of the Consolidated Statement of Cash Flows and were equal to $54, $94 and $5,103 for the years ended December 31, 2009, 2008 and 2007, respectively.
The Company satisfies stock option exercises, vested RSUs and ESPP shares with repurchased treasury stock on hand. For further information regarding the Company's share repurchase programs and shares available for repurchase under such programs, see Note 14.
Note 12. Income Taxes
Income from continuing operations before provision for income taxes consisted of:
| |
2009 | 2008 | 2007 | |||||||
|---|---|---|---|---|---|---|---|---|---|---|
U.S. |
$ | 178,997 | $ | 199,683 | $ | 198,336 | ||||
Non-U.S. |
57,617 | 223,109 | 159,055 | |||||||
|
$ | 236,614 | $ | 422,792 | $ | 357,391 | ||||
99
Notes to Consolidated Financial Statements (Continued)
(Dollars and shares in thousands, except per share data)
Note 12. Income Taxes (Continued)
The provision (benefit) for income taxes consisted of:
| |
2009 | 2008 | 2007 | ||||||||
|---|---|---|---|---|---|---|---|---|---|---|---|
U.S. Federal and State: |
|||||||||||
Current |
$ | (36,389 | ) | $ | 62,025 | $ | 89,250 | ||||
Deferred |
(8,006 | ) | (15,901 | ) | 416 | ||||||
|
$ | (44,395 | ) | $ | 46,124 | $ | 89,666 | ||||
Non-U.S.: |
|||||||||||
Current |
$ | 52,448 | $ | 35,602 | $ | 48,599 | |||||
Deferred |
(32,058 | ) | 24,480 | (20,343 | ) | ||||||
|
20,390 | 60,082 | 28,256 | ||||||||
Total |
$ | (24,005 | ) | $ | 106,206 | $ | 117,922 | ||||
The following table summarizes the significant differences between the U.S. Federal statutory taxes and the Company's provision for income taxes for consolidated financial statement purposes.
| |
2009 | 2008 | 2007 | |||||||
|---|---|---|---|---|---|---|---|---|---|---|
Tax Expense at Statutory Rate |
35.0 | % | 35.0 | % | 35.0 | % | ||||
State and Local Income Taxes, net of Federal Tax Benefit |
0.4 | 1.2 | 1.5 | |||||||
Impact of Non-U.S. Tax Rates and Credit |
(1.7 | ) | (2.7 | ) | (3.0 | ) | ||||
Uncertain Tax Benefit Reserve |
6.7 | 3.6 | 5.3 | |||||||
Reorganization of Non-U.S. Subsidiaries |
(30.1 | ) | (4.9 | ) | (3.5 | ) | ||||
Contract/Statute of Limitation Expirations |
(9.3 | ) | (3.3 | ) | — | |||||
U.S. Audit Settlements |
(6.9 | ) | (2.4 | ) | — | |||||
Pre-Spin Legacy Liability |
(3.1 | ) | (2.1 | ) | — | |||||
Non-U.S. Audit Settlements |
(0.5 | ) | (0.2 | ) | (4.6 | ) | ||||
Impact of Non-U.S. Tax Rate Changes |
— | — | 2.1 | |||||||
Other, net |
(0.8 | ) | 1.0 | 0.4 | ||||||
Total Taxes |
(10.2 | )% | 25.1 | % | 33.0 | % | ||||
In 2009, the Company's effective tax rate of (10.2%) was favorably impacted by $12,200 as a result of reorganizations of certain non-U.S. subsidiaries, $69,300 due to foreign exchange losses recognized for tax purposes, $21,900 as a result of the expiration of certain statutes of limitation and $16,300 from the settlement of a certain state tax matter. For the twelve months ended December 31, 2009, the Company recorded $18,500 of tax expense related to unrecognized tax benefits that if recognized, would favorably affect the effective tax rate. Included in this amount is $3,800 of interest and penalties. As of December 31, 2009, the Company had $10,700 recorded for interest and penalties.
In 2008, the Company's effective tax rate of 25.1% was favorably impacted by $20,700 as a result of a non-U.S. reorganization involving several IMS subsidiaries, $11,000 due to audit settlements with taxing authorities, $9,700 as a result of the termination of a non-U.S. agreement, $9,700 in connection with the resolution of certain legacy tax matters (see Note 15) and $4,400 due to the expiration of certain statutes of limitation. For the twelve months ended December 31, 2008, the Company recorded
100
Notes to Consolidated Financial Statements (Continued)
(Dollars and shares in thousands, except per share data)
Note 12. Income Taxes (Continued)
$18,800 of tax expense related to unrecognized tax benefits that if recognized, would favorably affect the effective tax rate. Included in this amount is $9,200 of interest and penalties. As of December 31, 2008, the Company had $19,600 recorded for interest and penalties.
In 2007, the Company's effective tax rate of 33.0% was impacted by a tax reduction of $16,500 arising from a favorable non-U.S. audit settlement for tax years 1998 through 2002, a tax charge of $7,500 to revalue net deferred tax assets arising from the reduction of the German federal tax rate from 25% to 15% and a tax reduction of $12,440 arising from a reorganization of certain non-U.S. subsidiaries.
On January 1, 2007, the Company adopted authoritative guidance related to accounting for uncertainty in income taxes. As a result of this adoption, the Company recognized an increase in liabilities for uncertain tax positions of $51,800 and a corresponding reduction to the January 1, 2007 retained earnings balance. As of the adoption date, the Company had $117,200 of gross unrecognized tax benefits and interest and penalties of $13,500. For the twelve months ended December 31, 2007, the Company recorded $21,100 of tax expense related to uncertain tax positions that if recognized, would favorably affect the effective tax rate. Included in this amount is $12,600 of interest and penalties. The Company recognizes interest expense and penalties related to unrecognized tax benefits in income tax expense.
The Company files numerous consolidated and separate income tax returns in the U.S. (federal and state) and non-U.S. jurisdictions. The Company is no longer subject to U.S. federal income tax examination by tax authorities for years before 2006. The Company is no longer subject to state and local income tax examination by tax authorities for years before 1997. Further, with few exceptions, the Company is no longer subject to examination by tax authorities in its material non-U.S. jurisdictions prior to 2004. It is reasonably possible that within the next twelve months the Company could realize $32,400 of unrecognized tax benefits as a result of the expiration of certain statutes of limitation.
A reconciliation of the beginning and ending amount of unrecognized tax benefits is as follows:
Tabular Reconciliation of Uncertain Tax Benefits
|
2009 | 2008 | 2007 | |||||||
|---|---|---|---|---|---|---|---|---|---|---|
Gross unrecognized tax benefits at January 1 |
$ | 87,879 | $ | 138,328 | $ | 117,184 | ||||
Gross (decreases) increases—prior period positions |
6,258 | (15,852 | ) | 6,507 | ||||||
Gross increases—current period positions |
5,975 | 7,941 | 15,690 | |||||||
Decreases—settlement with tax authorities |
(15,469 | ) | (27,164 | ) | — | |||||
Reductions—lapse of statute of limitations |
(17,479 | ) | (14,333 | ) | — | |||||
Other |
2,020 | (1,041 | ) | (1,053 | ) | |||||
Gross unrecognized tax benefits at December 31. |
$ | 69,184 | $ | 87,879 | $ | 138,328 | ||||
101
Notes to Consolidated Financial Statements (Continued)
(Dollars and shares in thousands, except per share data)
Note 12. Income Taxes (Continued)
The Company's deferred tax assets (liabilities) are comprised of the following at December 31:
| |
2009 | 2008 | ||||||
|---|---|---|---|---|---|---|---|---|
Deferred Tax Assets: |
||||||||
Net Operating Losses |
$ | 57,330 | $ | 44,898 | ||||
Non-U.S. Intangibles |
31,120 | 32,540 | ||||||
Employment Benefits |
13,429 | 20,685 | ||||||
Equity Compensation |
16,503 | 17,140 | ||||||
Post Employment Benefits |
29,206 | 8,525 | ||||||
Deferred Revenues |
10,033 | 5,206 | ||||||
Accrued Liabilities |
6,569 | — | ||||||
Other |
4,869 | 133 | ||||||
|
169,059 | 129,127 | ||||||
Valuation Allowance |
(46,996 | ) | (35,268 | ) | ||||
|
122,063 | 93,859 | ||||||
Deferred Tax Liabilities: |
||||||||
Computer Software |
(91,394 | ) | (87,150 | ) | ||||
Depreciation |
(9,351 | ) | (13,686 | ) | ||||
Other |
(7,829 | ) | (7,839 | ) | ||||
|
(108,574 | ) | (108,675 | ) | ||||
Net Deferred Tax Asset (Liability) |
$ | 13,489 | $ | (14,816 | ) | |||
The 2009 and 2008 net deferred tax asset and liability consists of a current deferred tax asset of $62,871 and $24,645, a non-current deferred tax asset of $30,678 and $39,254, a current deferred tax liability of $9,510 and $9,444, and a non-current deferred tax liability included in Other liabilities of $70,549 and $69,271, respectively. See Notes 2 and 15.
The Company has federal, state and local, and non-U.S. tax loss carryforwards, the tax effect of which was $57,330 as of December 31, 2009. Of this amount, $14,797 have an indefinite carryforward period, $402 will expire in 2010 and the remaining $42,131 expire at various times beginning in 2011. The Company established valuation allowances against state and local and non-U.S. net operating losses as follows: $46,996 in 2009, $35,268 in 2008 and $32,096 in 2007, that based on available evidence, are more likely than not to expire before they can be utilized.
Undistributed earnings of non-U.S. subsidiaries aggregated $1,261,300 at December 31, 2009. As of December 31, 2009, the Company intends to indefinitely reinvest all unremitted earnings outside the U.S. It is not currently practicable to determine the amount of applicable taxes on this amount.
Note 13. Commitments
The Company's contractual obligations include facility leases, agreements to purchase data and telecommunications services, leases of certain computer and other equipment and projected pension and other postretirement benefit plan contributions. At December 31, 2009, the minimum annual
102
Notes to Consolidated Financial Statements (Continued)
(Dollars and shares in thousands, except per share data)
Note 13. Commitments (Continued)
payment under these agreements and other contracts that have initial or remaining non-cancelable terms in excess of one year are as listed in the following table:
| |
Year | |||||||||||||||||||||
|---|---|---|---|---|---|---|---|---|---|---|---|---|---|---|---|---|---|---|---|---|---|---|
| |
2010 | 2011 | 2012 | 2013 | 2014 | Thereafter | Total | |||||||||||||||
Operating Leases(1) |
$ | 38,467 | $ | 35,784 | $ | 28,930 | $ | 19,246 | $ | 14,492 | $ | 42,987 | $ | 179,906 | ||||||||
Data Acquisition and Telecommunication Services(2) |
178,337 | 125,229 | 81,730 | 43,755 | 23,959 | 1,703 | 454,713 | |||||||||||||||
Computer and Other Equipment Leases(3) |
22,766 | 16,017 | 7,773 | 4,661 | 2,055 | 631 | 53,903 | |||||||||||||||
Projected Pension and Other Postretirement Benefit Plan Contributions(4) |
13,700 | — | — | — | — | — | 13,700 | |||||||||||||||
Long-term Debt(5) |
29,431 | 506,358 | 25,464 | 398,279 | 22,271 | 423,312 | 1,405,115 | |||||||||||||||
Other Long-term Liabilities(6) |
95,909 | 30,054 | 15,748 | 16,040 | 17,301 | 108,156 | 283,208 | |||||||||||||||
Total |
$ | 378,610 | $ | 713,442 | $ | 159,645 | $ | 481,981 | $ | 80,078 | $ | 576,789 | $ | 2,390,545 | ||||||||
- (1)
- Rental
expense under real estate operating leases for the years 2009, 2008 and 2007 was $35,195, $35,028 and $35,646, respectively.
- (2)
- Expense
under data and telecommunications contracts for the years 2009, 2008 and 2007 was $211,530, $182,819 and $165,230, respectively.
- (3)
- Rental
expense under computer and other equipment leases for the years 2009, 2008 and 2007 was $21,077, $20,723 and $24,299, respectively. These leases are
frequently renegotiated or otherwise changed as advancements in computer technology produce opportunities to lower costs and improve performance.
- (4)
- The
Company's contributions to pension and other postretirement benefit plans for the years 2009, 2008 and 2007 were $10,231, $12,120 and $9,473,
respectively. The estimated contribution amount shown for 2010 includes both required and discretionary contributions to funded plans as well as benefit payments from unfunded plans. The majority of
the expected contribution shown for 2010 is required.
- (5)
- Amounts
represent the principal balance plus estimated interest expense based on current interest rates under the Company's long-term debt (see
Note 9).
- (6)
- Includes estimated future funding requirements related to pension and postretirement benefits (see Note 10) and the long-term portions of the 2009 and 2007 severance, impairment and other charges (see Note 6). As the timing of future cash outflows is uncertain, the following long-term liabilities (and related balances) are excluded from the above table: deferred taxes ($70,549) and uncertain tax benefits reserve ($69,041).
Note 14. IMS Health Capital Stock
The Company's share repurchase program has been developed to buy opportunistically, when the Company believes that its share price provides it with an attractive use of its cash flow and debt capacity.
On December 18, 2007, the Board of Directors authorized a stock repurchase program to buy up to 20,000 shares. As of December 31, 2009, 9,505 shares remained available for repurchase under the December 2007 program.
During 2009, the Company did not repurchase any shares of outstanding Common Stock under this program.
103
Notes to Consolidated Financial Statements (Continued)
(Dollars and shares in thousands, except per share data)
Note 14. IMS Health Capital Stock (Continued)
During 2008, the Company repurchased 10,495 shares of outstanding Common Stock under this program at a total cost of $238,046.
These shares repurchases positively impacted the Company's diluted earnings per share by $0.06 for the year ended December 31, 2008.
Shares acquired through the Company's repurchase programs described above are open-market purchases or privately negotiated transactions in compliance with U.S. Securities and Exchange Commission ("SEC") Rule 10b-18.
Under the Company's Restated Certificate of Incorporation, as amended, the Company has the authority to issue 820,000 shares with a par value of $.01 per share of which 800,000 represent shares of Common Stock, 10,000 represent shares of preferred stock and 10,000 represent shares of Series Common Stock. The preferred stock and Series Common Stock can be issued with varying terms, as determined by the Board of Directors.
Note 15. Contingencies
The Company and its subsidiaries are involved in legal and tax proceedings, claims and litigation arising in the ordinary course of business. Management periodically assesses the Company's liabilities and contingencies in connection with these matters based upon the latest information available. For those matters where management currently believes it is probable that the Company will incur a loss and that the probable loss or range of loss can be reasonably estimated, the Company has recorded reserves in the Consolidated Financial Statements based on its best estimates of such loss. In other instances, because of the uncertainties related to either the probable outcome or the amount or range of loss, management is unable to make a reasonable estimate of a liability, if any. However, even in many instances where the Company has recorded a reserve, the Company is unable to predict with certainty the final outcome of the matter or whether resolution of the matter will materially affect the Company's results of operations, financial position or cash flows. As additional information becomes available, the Company adjusts its assessment and estimates of such liabilities accordingly.
The Company routinely enters into agreements with its suppliers to acquire data and with its customers to sell data, all in the normal course of business. In these agreements, the Company sometimes agrees to indemnify and hold harmless the other party for any damages such other party may suffer as a result of potential intellectual property infringement and other claims related to the use of the data. These indemnities typically have terms of approximately two years. The Company has not accrued a liability with respect to these matters, as the exposure is considered remote.
Based on its review of the latest information available, in the opinion of management, the ultimate liability of the Company in connection with pending tax and legal proceedings, claims and litigation will not have a material effect on the Company's results of operations, cash flows or financial position, with the possible exception of the matters described below.
D&B LEGACY AND RELATED TAX MATTERS
SHARING DISPUTES. In 1996, the company then known as The Dun & Bradstreet Corporation ("D&B") and now known as R.H. Donnelley Corporation ("Donnelley") separated into three public companies by spinning off ACNielsen Corporation ("ACNielsen") and the company then known as Cognizant Corporation ("Cognizant") (the "1996 Spin-Off"). Cognizant is now known as Nielsen
104
Notes to Consolidated Financial Statements (Continued)
(Dollars and shares in thousands, except per share data)
Note 15. Contingencies (Continued)
Media Research, Inc., a subsidiary of The Nielsen Company, formerly known as VNU N.V. ("NMR"). The agreements effecting the 1996 Spin-Off allocated tax-related liability with respect to certain prior business transactions between D&B and Cognizant. The D&B portion of such liability is now shared among Donnelley and certain of its former affiliates (the "Donnelley Parties"), and the Cognizant portion of such liability is shared between NMR and the Company pursuant to the agreements effecting Cognizant's spin-off of the Company in 1998 (the "1998 Spin-Off").
The underlying tax controversies with the Internal Revenue Service ("IRS") have substantially all been resolved and the Company paid to the IRS the amounts that it believed were due and owing. In the first quarter of 2006, Donnelley indicated that it disputed the amounts contributed by the Company toward the resolution of these matters based on the Donnelley Parties' interpretation of the allocation of liability under the 1996 Spin-Off agreements. In August 2006, the Donnelley Parties commenced arbitration regarding one of these disputes (referred to herein as the "Dutch Partnership Dispute"). The Dutch Partnership Dispute was resolved during the third quarter of 2008 when the parties consented to the entry of a consent award by the arbitration panel. Pursuant to the terms of the consent award, in the third quarter of 2008, the Company made a payment of $4,600 ($3,100 net of tax benefit) and an additional interest and cost payment of $2,600 ($1,700 net of tax benefit) to the Donnelley Parties. The remaining disputes were resolved during the second quarter of 2009 by agreement among the parties. Pursuant to the 2009 settlement agreement, the Company made a payment of $10,750 ($8,000 net of tax benefit) to the Donnelley Parties in full satisfaction of its liability with respect to the remaining disputes (see Note 12).
THE PARTNERSHIP (TAX YEAR 1997). During the fourth quarter of 2008, the Company entered into a final agreement with the IRS in which the IRS disallowed certain items of partnership expense for tax year 1997 with respect to a partnership now substantially owned by the Company (the "Partnership"). During 1997, the Partnership was substantially owned by Cognizant, but liability for this matter was allocated to the Company pursuant to the agreements effecting the 1998 Spin-Off. Pursuant to the settlement, during the second quarter of 2009, the Company paid $20,400 (tax and interest, net of tax benefit) to the IRS in full satisfaction of its liability with respect to the Partnership for tax year 1997.
In addition to these matters, the Company and its predecessors have entered, and the Company continues to enter, into global tax planning initiatives in the normal course of their businesses. These activities are subject to review by applicable tax authorities. As a result of the review process, uncertainties exist and it is possible that some of these matters could be resolved adversely to the Company.
LITIGATION RELATING TO THE MERGER
In connection with the Merger, between November 6, 2009 and November 10, 2009 three putative stockholder class action lawsuits were filed in the Delaware Court of Chancery and two in the Superior Court of Connecticut, Judicial District of Stamford-Norwalk. These lawsuits generally alleged breaches of fiduciary duty by the Company's directors in connection with the Merger.
On December 2, 2009, the three putative shareholder class action lawsuits filed in Delaware were consolidated into a single action, captioned In re IMS Health Inc. Shareholder Litigation, C.A. No. 5057-CC (the "Delaware Action"). On January 14, 2010, the plaintiffs in the Delaware Action filed
105
Notes to Consolidated Financial Statements (Continued)
(Dollars and shares in thousands, except per share data)
Note 15. Contingencies (Continued)
a Notice and Order of Voluntary Dismissal of all their claims, without prejudice, in which they represented that no compensation in any form has passed directly or indirectly from defendants to plaintiffs or plaintiffs' attorneys and that no promise to give any such compensation has been made. The Court of Chancery granted the dismissal on January 15, 2010.
One of the two putative shareholder class action lawsuits filed in Connecticut, styled Trust for the Benefit of Sylvia B. Piven v. IMS Health Incorporated, et al., CV09-5013110-S, was filed on November 6, 2009, and the other, styled John Felhaber v. David R. Carlucci, et al., CV09-5013139-S, was filed on November 10, 2009. On December 8, 2009, plaintiff Felhaber filed an amended complaint asserting, among other things, that the Company's directors had breached their duty of disclosure in the Preliminary Proxy Statement on Schedule 14A filed with the SEC by the Company on November 25, 2009. On December 18, 2009, the Company director defendants filed motions to dismiss for failure to properly effect service, and on December 21, 2009 the Company filed motions to strike the Piven complaint and the Felhaber amended complaint filed in the Superior Court of Connecticut. On January 5, 2010, plaintiff Felhaber filed an application for temporary injunction seeking, among other things, disclosure-based relief in advance of the February 8, 2010 Special Meeting of the Company's stockholders, and on January 11, 2010, the Company and its directors filed an objection to the application. During a January 13, 2010 hearing before the Superior Court of Connecticut, the Company director defendants withdrew their motions to dismiss.
On January 27, 2010, the Company entered into a memorandum of understanding with the plaintiffs regarding the settlement of the two putative stockholder class action lawsuits filed in the Superior Court of Connecticut, Judicial District of Stamford-Norwalk. The Company believes that no further supplemental disclosure is required under applicable laws; however, to avoid the risk of the putative stockholder class actions delaying or adversely affecting the Merger and to minimize the expense of defending such actions, the Company has agreed, pursuant to the terms of the proposed settlement, to make certain supplemental disclosures related to the proposed Merger. Subject to completion of certain confirmatory discovery by counsel to the plaintiffs, the memorandum of understanding contemplates that the parties will enter into a stipulation of settlement. The stipulation of settlement will be subject to customary conditions, including court approval following notice to the Company's stockholders. In the event that the parties enter into a stipulation of settlement, a hearing will be scheduled at which the Superior Court will consider the fairness, reasonableness, and adequacy of the settlement. If the settlement is finally approved by the court, it will resolve and release all claims in all actions that were or could have been brought challenging any aspect of the proposed Merger, the Merger Agreement, and any disclosure made in connection therewith (but excluding claims for appraisal under Section 262 of the Delaware General Corporation Law), pursuant to terms that will be disclosed to stockholders prior to final approval of the settlement. In addition, in connection with the settlement, the parties contemplate that plaintiffs' counsel will file a petition in the Superior Court for an award of attorneys' fees and expenses to be paid by the Company or its successor, which the defendants may oppose. The Company or its successor shall pay or cause to be paid those attorneys' fees and expenses awarded by the Court. There can be no assurance that the parties will ultimately enter into a stipulation of settlement or that the Superior Court will approve the settlement even if the parties were to enter into such stipulation. In such event, the proposed settlement as contemplated by the memorandum of understanding may be terminated.
106
Notes to Consolidated Financial Statements (Continued)
(Dollars and shares in thousands, except per share data)
Note 15. Contingencies (Continued)
IMS HEALTH GOVERNMENT SOLUTIONS VOLUNTARY DISCLOSURE PROGRAM PARTICIPATION
The Company's wholly-owned subsidiary, IMS Government Solutions Inc., is primarily engaged in providing services and products under contracts with the U.S. government. U.S. government contracts are subject to extensive legal and regulatory requirements and, from time to time, agencies of the U.S. government have the ability to investigate whether contractors' operations are being conducted in accordance with such requirements. U.S. government investigations, whether relating to these contracts or conducted for other reasons, could result in administrative, civil or criminal liabilities, including repayments, fines or penalties being imposed on us, or could lead to suspension or debarment from future U.S. government contracting. U.S. government investigations often take years to complete and may result in no adverse action against the Company.
IMS Government Solutions discovered potential noncompliance with various contract clauses and requirements under its General Services Administration Contract which was awarded in 2002 to its predecessor company, Synchronous Knowledge Inc. (Synchronous Knowledge Inc. was acquired by IMS in May 2005). Upon discovery of the potential noncompliance, the Company began remediation efforts, promptly disclosed the potential noncompliance to the U.S. government, and was accepted into the Department of Defense Voluntary Disclosure Program. The Company filed its Voluntary Disclosure Program Report ("Disclosure Report") on August 29, 2008. Based on the Company's findings as disclosed in the Disclosure Report, the Company recorded a reserve of approximately $3,748 for this matter in the third quarter of 2008. The Company is currently unable to determine the outcome of this matter pending the resolution of the Voluntary Disclosure Program process and its ultimate liability arising from this matter could exceed its current reserve.
OTHER CONTINGENCIES
CONTINGENT CONSIDERATION. Under the terms of certain purchase agreements related to acquisitions consummated in 2008 and prior, the Company may be required to pay additional amounts as contingent consideration based on the achievement of certain performance related targets during 2009. These additional payments will be recorded as compensation expense. The Company paid approximately $2,400 under such contingencies during 2009. Based on current estimates, the Company expects that additional contingent consideration under these agreements may total approximately $1,800. It is expected that these contingencies will be resolved during the first half of 2010.
Note 16. Merger Agreement
On November 5, 2009, the Company entered into an Agreement and Plan of Merger (the "Merger Agreement") with Healthcare Technology Holdings, Inc., a Delaware corporation ("Parent"), and Healthcare Technology Acquisition, Inc., a Delaware corporation and wholly owned subsidiary of Parent ("Merger Sub"), providing for the merger of Merger Sub with and into the Company (the "Merger"), with the Company surviving the Merger as a wholly owned subsidiary of Parent. Parent and Merger Sub are affiliates of TPG and CPPIB.
On February 8, 2010, a special meeting of the stockholders of the Company was held (the "Special Meeting"). At the Special Meeting, the Company's stockholders approved the proposal presented at the Special Meeting to adopt the Merger Agreement.
107
Notes to Consolidated Financial Statements (Continued)
(Dollars and shares in thousands, except per share data)
Note 16. Merger Agreement (Continued)
At the effective time of the Merger, each share of the Company's Common Stock issued and outstanding (except for certain shares held by Parent, the Company and certain of its subsidiaries, and shares held by stockholders who have properly demanded appraisal rights) will convert into the right to receive the per share Merger consideration of $22.00 in cash, without interest, less any applicable withholding taxes.
The respective obligations of the Company, Parent and Merger Sub to consummate the Merger are subject to the satisfaction or waiver of certain customary conditions, including without limitation the absence of any law enacted, issued, enforced or entered by any court or governmental entity of competent jurisdiction that restrains, enjoins or otherwise prohibits the consummation of the Merger or otherwise makes consummation of the Merger illegal, the accuracy of representations and warranties (subject to customary materiality qualifiers) made by the parties to the Merger Agreement, and compliance, in all material respects, with the parties' respective covenants and agreements contained in the Merger Agreement at or prior to the date of the closing of the Merger. The consummation of the Merger is subject to certain other conditions which, as of the date of this Annual Report on Form 10-K, have been satisfied. Completion of the Merger is expected to occur by the end of the first quarter of 2010.
The Company anticipates that the total funds needed to complete the Merger will be approximately $5,900,000. The Company expects this amount to be funded through a combination of:
- •
- equity financing of approximately $2,800,000 to be provided or secured by investment funds affiliated with TPG and a
wholly owned subsidiary of CPPIB, or other parties to whom they assign a portion of their commitments;
- •
- a $2,000,000 senior secured term loan facility;
- •
- the issuance of $1,000,000 in principal amount of senior unsecured notes (supplemented, if some or all of those notes
cannot be sold at closing, by a senior unsecured term loan facility); and
- •
- approximately $100,000 of cash on hand of the Company.
Parent has obtained equity and debt financing commitments. The funding under those commitments is subject to conditions, including conditions that do not relate directly to the Merger Agreement.
Pursuant to a limited guarantee delivered by TPG Partners V, L.P., TPG Partners VI, L.P. and CPP Investment Board Private Holdings Inc. (collectively, the "Guarantors") in favor of the Company, dated November 5, 2009, the Guarantors have agreed to guarantee, severally but not jointly, the due and punctual performance and discharge of the obligations of Parent and Merger Sub under the Merger Agreement to pay a termination fee of $275,000 to the Company, as and when due, the direct expenses incurred by Parent or Merger Sub in connection with the arrangement of the financing of the Merger, and certain reimbursement obligations of Parent and Merger Sub with respect to the Company, which direct expenses and reimbursement obligations shall not in the aggregate exceed $6,000.
The Merger Agreement contains certain termination rights for the Company and Parent. If the Merger Agreement is terminated, under certain specified circumstances in the Merger Agreement, the Company may be required to pay a termination fee equal to $115,000, in addition to reimbursing Parent for all out-of-pocket fees and expenses incurred by Parent or Merger Sub in connection with the Merger Agreement or the transactions contemplated therein up to $5,000. In the event the Company terminates the Merger Agreement due to certain actions or inactions by Parent, Parent must pay the
108
Notes to Consolidated Financial Statements (Continued)
(Dollars and shares in thousands, except per share data)
Note 16. Merger Agreement (Continued)
Company a fee of $275,000, less the sum of amounts paid by Parent with respect to Parent's liability for certain reimbursement obligations and certain direct expenses incurred by Parent in connection with the financing up to $6,000 in the aggregate.
In connection with the proposed merger, the Company incurred and expensed $11,000 during the fourth quarter of 2009 primarily for professional services consisting of investment banker, legal and accounting fees.
Note 17. Supplemental Financial Data
ACCOUNTS RECEIVABLE, NET:
| |
At December 31, | ||||||
|---|---|---|---|---|---|---|---|
| |
2009 | 2008 | |||||
Trade and notes |
$ | 276,779 | $ | 299,219 | |||
Less: Allowances |
(7,709 | ) | (5,960 | ) | |||
Unbilled receivables |
53,499 | 89,517 | |||||
|
$ | 322,569 | $ | 382,776 | |||
OTHER CURRENT ASSETS:
| |
At December 31, | ||||||
|---|---|---|---|---|---|---|---|
| |
2009 | 2008 | |||||
Deferred income taxes |
$ | 62,871 | $ | 24,645 | |||
Prepaid expenses |
42,066 | 56,372 | |||||
Work-in-process inventory |
66,565 | 68,640 | |||||
Other |
18,943 | 24,442 | |||||
|
$ | 190,445 | $ | 174,099 | |||
PROPERTY, PLANT AND EQUIPMENT, NET:
| |
At December 31, | |
||||||||
|---|---|---|---|---|---|---|---|---|---|---|
| |
Estimated Useful Lives |
|||||||||
| |
2009 | 2008 | ||||||||
Buildings |
$ | 71,902 | $ | 77,306 | 40 – 50 years | |||||
Less: Accumulated depreciation |
(20,767 | ) | (24,768 | ) | ||||||
Machinery and equipment |
242,002 | 246,860 | 3 – 12 years | |||||||
Less: Accumulated depreciation |
(163,003 | ) | (161,529 | ) | ||||||
Leasehold improvements, less accumulated amortization of $31,089 and $22,043, respectively |
34,203 | 38,318 | ||||||||
Construction-in-progress |
14,337 | 3,270 | ||||||||
Land |
3,006 | 3,598 | ||||||||
|
$ | 181,680 | $ | 183,055 | ||||||
109
Notes to Consolidated Financial Statements (Continued)
(Dollars and shares in thousands, except per share data)
Note 17. Supplemental Financial Data (Continued)
COMPUTER SOFTWARE AND GOODWILL:
| |
External-Use Software |
Internal-Use Software |
Goodwill | |||||||
|---|---|---|---|---|---|---|---|---|---|---|
January 1, 2008 |
$ | 151,995 | $ | 117,037 | $ | 651,709 | ||||
Additions at cost |
22,805 | 54,951 | 31,900 | |||||||
Amortization |
(49,732 | ) | (36,715 | ) | — | |||||
Impairments, foreign exchange and other |
(7,103 | ) | 345 | (20,077 | ) | |||||
December 31, 2008 |
$ | 117,965 | $ | 135,618 | $ | 663,532 | ||||
Additions at cost |
26,977 | 58,811 | 1,731 | |||||||
Amortization |
(40,362 | ) | (40,894 | ) | — | |||||
Impairments, foreign exchange and other |
(8,932 | ) | 5,738 | 34,987 | ||||||
December 31, 2009 |
$ | 95,648 | $ | 159,273 | $ | 700,250 | ||||
Accumulated amortization of total computer software was $725,405 and $646,668 at December 31, 2009 and 2008, respectively. Accumulated amortization of external-use computer software was $332,202 and $294,949 at December 31, 2009 and 2008, respectively.
OTHER ASSETS:
| |
At December 31, | ||||||
|---|---|---|---|---|---|---|---|
| |
2009 | 2008 | |||||
Long-term pension assets |
$ | 50,282 | $ | 26,512 | |||
Long-term deferred tax asset |
30,678 | 39,254 | |||||
Deferred charges and other intangible assets |
84,049 | 118,144 | |||||
Other |
14,855 | 23,379 | |||||
|
$ | 179,864 | $ | 207,289 | |||
ACCOUNTS PAYABLE:
| |
At December 31, | ||||||
|---|---|---|---|---|---|---|---|
| |
2009 | 2008 | |||||
Trade |
$ | 56,693 | $ | 64,867 | |||
Taxes other than income taxes |
41,375 | 40,193 | |||||
Other |
7,364 | 14,738 | |||||
|
$ | 105,432 | $ | 119,798 | |||
110
Notes to Consolidated Financial Statements (Continued)
(Dollars and shares in thousands, except per share data)
Note 17. Supplemental Financial Data (Continued)