Attached files
Table of Contents
UNITED STATES
SECURITIES AND EXCHANGE COMMISSION
Washington, D.C. 20549
FORM 10-K
| x | ANNUAL REPORT PURSUANT TO SECTION 13 OR 15(d) OF THE SECURITIES EXCHANGE ACT OF 1934 |
For the year ended December 31, 2009
OR
| ¨ | TRANSITION REPORT PURSUANT TO SECTION 13 OR 15(d) OF THE SECURITIES EXCHANGE ACT OF 1934 |
Commission file number: 001-33023
Riverbed Technology, Inc.
(Exact name of registrant as specified in its charter)
| Delaware | 03-0448754 | |
| (State or other jurisdiction of incorporation or organization) |
(I.R.S. employer identification no.) |
199 Fremont Street
San Francisco, CA 94105
(Address of principal executive offices, including zip code)
(415) 247-8800
(Registrant’s telephone number, including area code)
Securities registered pursuant to Section 12(b) of the Act:
| Title of Each Class to be so Registered |
Name of Each Exchange on Which Each Class is to be Registered | |
| Common Stock, $0.0001 par value (Title of Class) |
The NASDAQ Stock Market LLC |
Securities registered pursuant to Section 12(g) of the Act:
None
Indicate by check mark if the registrant is a well-known seasoned issuer, as defined in Rule 405 of the Securities Act. Yes x No ¨
Indicate by check mark if the registrant is not required to file reports pursuant to Section 13 or Section 15(d) of the Act. Yes ¨ No x
Indicate by check mark whether the registrant (1) has filed all reports required to be filed by Section 13 or 15(d) of the Securities Exchange Act of 1934 during the preceding 12 months (or for such shorter period that the registrant was required to file such reports), and (2) has been subject to such filing requirements for the past 90 days. Yes x No ¨
Indicate by checkmark whether the registrant has submitted electronically and posted on its corporate Website, if any, every Interactive Data File Required to be submitted and posted pursuant to Rule 405 of Regulation S-T during the preceding 12 months (or for such shorter period that the registrant was required to submit and post such files). Yes ¨ No ¨
Indicate by check mark if disclosure of delinquent filers pursuant to Item 405 of Regulation S-K is not contained herein and will not be contained, to the best of registrant’s knowledge, in definitive proxy or information statements incorporated by reference in Part III of this Form 10-K or any amendment to this Form 10-K. x
Indicate by check mark whether the registrant is a large accelerated filer, an accelerated filer, a non-accelerated filer or a smaller reporting company. See the definitions of “large accelerated filer,” “accelerated filer,” and “smaller reporting company” in Rule 12b-2 of the Exchange Act.
Large accelerated filer x Accelerated filer ¨ Non-accelerated filer ¨ Smaller reporting company ¨
Indicate by check mark whether the registrant is a shell company (as defined in Rule 12b-2 of the Exchange Act). Yes ¨ No x
As of June 30, 2009, the last business day of our most recently completed second fiscal quarter, the aggregate market value of the voting stock held by non-affiliates was $1,181,802,078 based on the number of shares held by non-affiliates of the registrant as of June 30, 2009, and based on the reported last sale price of common stock on June 30, 2009. This calculation does not reflect a determination that persons are affiliates for any other purposes.
Number of shares of common stock outstanding as of February 2, 2010: 70,175,830.
Documents Incorporated by Reference: Portions of the registrant’s proxy statement relating to its 2010 annual meeting of stockholders are incorporated by reference into Part III of this Annual Report on Form 10-K where indicated.
Table of Contents
RIVERBED TECHNOLOGY, INC.
YEAR ENDED DECEMBER 31, 2009
ANNUAL REPORT ON FORM 10-K
| Page No. | ||||
| PART I. |
||||
| Item 1. |
3 | |||
| Item 1A. |
15 | |||
| Item 1B. |
33 | |||
| Item 2. |
33 | |||
| Item 3. |
33 | |||
| Item 4. |
33 | |||
| PART II. |
||||
| Item 5. |
34 | |||
| Item 6. |
36 | |||
| Item 7. |
Management’s Discussion and Analysis of Financial Condition and Results of Operations |
38 | ||
| Item 7A. |
57 | |||
| Item 8. |
59 | |||
| Item 9. |
Changes In and Disagreements with Accountants on Accounting and Financial Disclosure |
96 | ||
| Item 9A. |
96 | |||
| Item 9B. |
97 | |||
| PART III. |
||||
| Item 10. |
98 | |||
| Item 11. |
98 | |||
| Item 12. |
Security Ownership of Certain Beneficial Owners and Management and Related Stockholder Matters |
98 | ||
| Item 13. |
Certain Relationships and Related Transactions, and Director Independence |
98 | ||
| Item 14. |
98 | |||
| PART IV. |
||||
| Item 15. |
99 | |||
| 102 | ||||
Table of Contents
Part I
| Item 1. | Business |
Overview
Riverbed® has developed innovative and comprehensive solutions to the fundamental problems associated with IT performance across wide area networks (WANs). Historically, computing across WANs has been plagued by poor performance, IT complexity and high cost. Our IT performance products allow organizations to understand the total performance picture; to optimize the yield from their WAN, storage infrastructure and applications; and to consolidate their IT infrastructure in the private cloud, public cloud and at the branch office. Riverbed’s complete family of performance products includes solutions for branch offices, mobile workers, private data centers, private clouds and cloud computing.
Our flagship Steelhead® products enable our customers to improve the performance of their applications and access to their data across WANs, typically increasing transmission speeds by 5 to 50 times and in some cases by up to 100 times. In 2009, with the acquisition of Mazu Networks, Inc. (Mazu), Riverbed added its Cascade® product line, which allows organizations to better assess, accelerate and adapt network performance. The combination of our Steelhead and Cascade products allows organizations to optimize their IT infrastructure to get the maximum ROI from network, storage and application investments.
The IT performance delivered by Riverbed solutions allows organizations to implement key initiatives, including:
| Ÿ | Backup and disaster recovery over the WAN |
| Ÿ | Collaboration between distributed offices and employees |
| Ÿ | Performance management across the WAN |
| Ÿ | Virtualization |
| Ÿ | Cloud computing |
| Ÿ | Application performance across the WAN |
| Ÿ | Consolidation of remote office and data center IT |
Our goal is to establish our solutions as the preeminent performance and efficiency standard for organizations relying on wide-area distributed computing. We believe our products and services can provide significant benefits in millions of locations worldwide.
A common misconception is that increasing or optimizing bandwidth alone can adequately reduce the inefficiencies and performance problems inherent in wide-area distributed computing. Increasing or optimizing bandwidth may allow an organization to increase the amount of data that can traverse a WAN at a given point in time. However, application performance problems resulting from the distance between locations across a WAN and resulting from network and application protocol inefficiencies are not addressed by increasing or optimizing bandwidth alone. Inadequate bandwidth is only one of three inter-related causes of these performance problems. We believe that these problems can best be solved by simultaneously addressing all three inter-related root causes: software application protocol inefficiencies, transport network protocol inefficiencies and insufficient or unavailable bandwidth.
Unlike alternative approaches, our Steelhead products simultaneously address these root causes across a broad range of applications. Our products utilize our proprietary software to improve the performance of applications and access to data over distance by reducing:
| Ÿ | application protocol inefficiencies through our proprietary application streamlining techniques; |
| Ÿ | network protocol inefficiencies through our proprietary transport streamlining techniques; and |
3
Table of Contents
| Ÿ | bandwidth requirements through our proprietary data streamlining techniques and data compression. |
Our Steelhead products are used at both ends of a WAN connection and are designed to be more easily and transparently integrated into existing networks than alternative products. Our products address a broad range of widely used software applications, are scalable across networks of all sizes and address the wide-area distributed computing needs of every major industry.
We were founded in May 2002. Prior to the first commercial shipments of our products in May 2004, our activities were primarily focused on research and development of a comprehensive WAN optimization solution for organizations relying on wide-area distributed computing, development of a customer and partner support program to support our product offerings and the hiring of the personnel needed to sell, market and support our products and services. Since that time, our products have been sold to more than 7,300 customers worldwide, from large global organizations with hundreds or thousands of locations to smaller organizations. We sell our products and support to end users directly through our sales force and indirectly through channel partners, including value-added distributors (VADs), value-added resellers (VARs), systems integrators and service providers. We operate internationally primarily through a number of wholly owned subsidiaries that are designed primarily to support our sales, marketing and support activities outside the U.S.
We have achieved broad industry recognition for our innovative technology. For five consecutive years, InfoWorld named Riverbed Steelhead appliances as a Product of the Year. For the last three years (2007-2009) and since the inception of the report, Gartner has positioned Riverbed in the Leaders’ Quadrant in the “WAN Optimization Controller (WOC) Magic Quadrant,” which positions vendors in one of four quadrants based on the companies’ vision and ability to execute on that vision. Riverbed’s WAN optimization solutions have received industry recognition from Forrester Research, IDC, NetworkWorld, The Wall Street Journal, eWeek, Storage Magazine, Network Computing and Byte & Switch, among others.
In February 2009, we acquired Mazu, for approximately $25 million in cash, with an additional possible payment of up to $22.0 million in cash to be made based on achievement of certain bookings targets in a defined twelve-month period following the closing. Mazu helps organizations manage, secure and optimize the availability and performance of global applications. The acquisition allows us to meet enterprise and service provider customer demands by extending our suite of WAN optimization products to include global application performance, reporting and analytics.
Industry Background
We believe there are at least several million remote offices of companies based within and outside the U.S. Many of these locations represent potential sites for our products.
The WAN optimization market provides global access to data and applications across WANs with local area network (LAN)-like performance. The WAN optimization market is large and growing. The key drivers of demand in this market are the increasingly geographically distributed nature of organizations and employees, the growing business dependence on application performance and real-time access to data, the increasing desirability of IT infrastructure consolidation in order to achieve compelling cost reductions or organizational efficiencies, and management and data protection benefits.
Increasingly Distributed Organizations and Workforces
Organizations are becoming more geographically distributed, placing operations closer to customers and partners to improve efficiency and responsiveness. Businesses are becoming more global by expanding into new markets, migrating manufacturing facilities to lower-cost locations and
4
Table of Contents
outsourcing certain business processes. In addition, mergers, acquisitions, partnerships and joint ventures continue to expand the geographic scope of existing enterprises.
Organizations are Increasingly Dependent on Timely Access to Critical Data and Applications
Application performance and effective access to data are critical to executing, maintaining and expanding business operations. Employees are increasingly dependent on a wide array of software applications to perform their jobs effectively, such as e-mail, document management, enterprise resource planning and customer relationship management.
Benefits of IT Infrastructure Consolidation
As organizations have become more geographically distributed, installing and managing IT infrastructure has become increasingly costly and complex. Accordingly, IT managers often seek to consolidate IT infrastructure resources into headquarters or centralized datacenter locations, which can provide a number of benefits, including:
| Ÿ | reduction in capital costs as IT infrastructure resources (file servers, e-mail servers, web servers, application servers, back-up systems and databases) are consolidated and shared within an organization; |
| Ÿ | reduction in IT support costs as fewer personnel are required to manage more centralized data and applications; |
| Ÿ | more efficient and reliable data back-up and recovery and application and database administration by managing these processes from a central point of control; |
| Ÿ | improved data protection as consolidated IT infrastructure resources are less vulnerable to theft, loss and misuse; and |
| Ÿ | enhanced ability to implement internal controls and comply with other regulatory requirements as centralized data and applications are easier to monitor, store and access. |
Despite these benefits, many organizations have foregone or delayed consolidation projects because of network performance and manageability problems.
Wide-Area Distributed Computing Challenges
Technological advances in computing, networking, semiconductor and storage technologies have improved users’ ability to access data and use applications rapidly across their LANs and store enormous amounts of information economically. However, these same applications and storage technologies, which were often designed to operate optimally on LANs, perform slowly across WANs and frequently exhibit the following performance challenges:
| Ÿ | delays in accessing, saving and transferring files; |
| Ÿ | slow execution of critical software application functions; |
| Ÿ | incomplete or inconsistent back-up and recovery of sensitive data; |
| Ÿ | loss of worker productivity and increased end-user frustration; and |
| Ÿ | limited visibility into performance and security metrics at remote locations. |
5
Table of Contents
Although many companies have attempted to solve these problems solely by adding bandwidth, we believe these performance problems can best be solved by addressing not only bandwidth challenges but also, and usually more importantly, the effects of latency and protocol chattiness:
| Ÿ | Latency and protocol chattiness — “Latency” is the amount of time it takes data to travel distances across a WAN. “Chattiness” refers to the numerous interactions between clients and servers that are often required by applications or network transport protocols to complete an operation or transfer data. When combined in geographically distributed computing environments, latency and chattiness can result in dramatically slower performance. For example, a simple request to open a file may require hundreds if not thousands of sequential round-trip interactions that, when aggregated, can result in substantial delays. This problem arises from two distinct sources: |
| – | Application protocol chattiness — Many business applications were designed for optimal use within LAN environments and employ unique communications procedures that cause high chattiness, resulting in slow performance for the end-user when transmitted over a WAN; and |
| – | Network protocol chattiness — Transmission Control Protocol (TCP), the underlying transport protocol for most WAN traffic, divides data into relatively small packets that are sent sequentially across the WAN, and require return acknowledgement from the recipient. These numerous round trips across the WAN can result in slow performance for the end-user. |
| Ÿ | Bandwidth limitations — Bandwidth is defined as the amount of data that can traverse a network in a given amount of time and is typically measured in megabits per second (Mbps). While most organizations’ LANs typically operate at 100 or 1,000 Mbps, their remote office WAN connections typically operate at 2 Mbps or less. This often results in WAN congestion and poor application and data services performance. In addition, WAN outages limit the effectiveness of workers who are dependent on remote access to data and applications. |
Limitations of Alternative Approaches
Historically, organizations have implemented partial solutions in attempting to improve the performance of wide-area distributed computing, including:
Additional Investment in Bandwidth and IT Infrastructure Resources
| Ÿ | Bandwidth — Organizations often attempt to improve application performance by making costly investments in more bandwidth. While additional bandwidth may reduce network congestion, no amount of bandwidth can address performance issues caused by high latency and application and network protocol chattiness; and |
| Ÿ | IT infrastructure resources — Deploying additional IT infrastructure resources at remote locations can increase selected application and data services performance. However, this approach is expensive, complex to manage and increases the risks of data inconsistency and compromised security. |
Deployment of Point Products
Our competitors have designed products that fail to address all of the root causes of wide-area distributed computing problems for a broad range of applications. Such products, which we refer to as point products, include most WAN optimization products, which typically offer some combination of compression, TCP optimization and quality-of-service functions, and can result in a reduction of network congestion and more efficient utilization of bandwidth. However, such WAN optimization products typically do not address application chattiness as comprehensively as we do and many do not provide for continued access to remote files during WAN failures.
6
Table of Contents
In addition to their limited application, these point products often involve deployment and operational complexities that cause network disruption, inefficiency, and difficulties scaling to large numbers of locations. They may often require server or client re-configuration, or complex pre-installation configuration that demands significant amounts of time from IT personnel. They often do not incorporate the network assessment capabilities that IT organizations need in order to identify the source of performance problems.
Over time, point product vendors have attempted to incorporate additional functionality to solve for their limitations. These legacy approaches with additional layers of features often suffer from the same underlying issues as their legacy underpinnings: insufficient performance improvement over a broad spectrum of data networking traffic, scaling difficulties, and deployment and operational complexity.
Need for a Comprehensive Solution
Alternative approaches have failed to comprehensively address all of the root causes of wide-area distributed computing problems for a broad range of applications, and offer only limited performance enhancement. Some vendors have attempted to combine capabilities of otherwise more limited approaches through partnerships and acquisitions, but the resulting products have been poorly integrated and have failed to improve the performance of a sufficiently wide array of applications. We believe significant demand exists for an integrated, flexible and comprehensive WAN optimization solution that adequately addresses the root causes of the fundamental performance problems of wide-area distributed computing.
The Riverbed Solution
We have developed an innovative and comprehensive solution that broadly addresses the inter-related root causes of poor performance of wide-area distributed computing: latency and protocol chattiness, and bandwidth limitations. By simultaneously addressing these causes, we are able to improve significantly the performance of applications and access to data across WANs and enable the consolidation of costly IT infrastructure. Our WAN optimization solution consists of the Riverbed Optimization System (RiOS®), our proprietary software that is embedded on a purpose-built hardware computing platform to form our Steelhead appliances. We also embed RiOS in our Steelhead Mobile software designed for use on mobile worker laptop computers or desktop computers in locations with very few employees. Our Cascade software adds network and application visibility, giving our customers a closed-loop process for continuously assessing, accelerating and adapting network performance.
Through the application of our proprietary technology, our WAN optimization solution simultaneously addresses each of these root causes of poor WAN performance:
| Ÿ | Application protocol chattiness — Our Application Streamlining technology significantly reduces unnecessary protocol chattiness for a broad range of applications and protocols such as CIFS (Windows file sharing), NFS (UNIX file sharing), MAPI (Microsoft Exchange), Oracle Forms, Lotus Notes, MS-SQL HTTP, SSL and others; |
| Ÿ | Network protocol chattiness — Our Transport Streamlining technology employs a variety of techniques to significantly improve TCP performance. Our technology allows more data to be transmitted in each trip, which reduces the number of trips required; and |
| Ÿ | Bandwidth limitations — Our Data Streamlining technology employs sophisticated data mapping and pattern recognition techniques to minimize the amount of redundant data traversing WAN connections. Our products detect requests for redundant information and send very little more than the data that has actually been modified over the WAN. |
7
Table of Contents
When combined, these key technologies allow us to deliver significant benefits to our customers, including the ability to:
| Ÿ | Accelerate performance of applications and access to data over the WAN — Our solution enables our customers to recognize dramatic increases in performance of applications and access to data across a WAN, typically increasing transmission speeds by five to 50 times and in some cases by up to 100 times. Benefits include increased employee productivity, more efficient collaboration of globally distributed workgroups and more consistent rollout and adoption of enterprise applications; |
| Ÿ | Consolidate geographically distributed IT resources — Our solution enables the consolidation of remote office infrastructure, including servers, storage back-up systems, databases and IT support personnel, while achieving more LAN-like performance. Also, consolidation enhances data security by centralizing IT resources in more secure datacenters; |
| Ÿ | Reduce the need for WAN bandwidth — Our solution nearly eliminates redundant traffic traversing the WAN and enables more efficient use of existing bandwidth, reducing the pressure to add bandwidth, which is often expensive or unavailable, as network traffic increases; |
| Ÿ | Shorten storage back-up and replication time over the WAN — Our solution enables back-up and replication of data over the WAN in a fraction of the time previously allocated to the task. Additional benefits to our solution include reduced IT support needed to execute daily back-up procedures, as well as reduced security concerns related to storing and transporting backed-up data on physical tape media at every remote computing location; |
| Ÿ | Improve productivity and reduce frustration for IT managers and end-users — Our solution allows users in sites linked by a WAN to collaborate and share files and other data without the delays normally caused by WANs. Additional benefits include faster development cycles, better data synchronization, lower error rates and more flexibility with respect to staffing and personnel coordination; and |
| Ÿ | Continuously assess network and application performance — Our solution collects performance information from devices across the WAN, at both optimized and non-optimized sites, and gives operators early warning about any application performance problems. |
Our products are designed to be easily and transparently deployed into our customers’ networks. Our products are also designed to be easily managed with scalability across networks of all sizes, and to address the wide-area distributed computing needs of every major industry.
The Riverbed Strategy
Our goal is to establish our solution as the preeminent performance and efficiency standard for organizations relying on wide-area distributed computing. Key elements of our strategy include:
| Ÿ | Maintain and extend our technological advantages — We believe that we offer the broadest ability to enable rapid, reliable access to applications and data for our customers. We intend to enhance our position as a leader and innovator in the WAN optimization market. We also intend to continue to sell new capabilities into our installed base; |
| Ÿ | Enhance and extend our product line — We plan to introduce enhancements to our product capabilities in order to address our customers’ size and application requirements. We also plan to introduce new products to extend our market and utilize our technology platform to extend our capabilities; |
| Ÿ | Extend our technology partner ecosystem — We plan to enhance our product capabilities via integration of partner technologies, in particular by increasing the selection of third party applications on the Riverbed Services Platform (RSP); |
8
Table of Contents
| Ÿ | Increase market awareness — To generate increased demand for our products, we will continue promoting our brand and the effectiveness of our comprehensive WAN optimization solution; |
| Ÿ | Scale our distribution channels — We intend to leverage and expand our indirect channels to extend our geographic reach and market penetration; and |
| Ÿ | Enhance and extend our support and services capabilities — We plan to enhance and extend our support and services capabilities to continue to support our growing global customer base. |
Products
Our Steelhead appliances consist of our RiOS proprietary software that is embedded on a purpose-built hardware computing platform. We sell different Steelhead appliances to address the needs of customers ranging from small office deployments to large headquarters and datacenter locations. The U.S. list prices for our 14 different Steelhead appliances currently range from $3,495 to $129,995.
In addition to the functionality described for RiOS, all Steelhead appliances now support the RSP, a virtualized environment within Steelhead appliances upon which third party applications can be installed. RSP benefits customers by further enabling branch office IT consolidation; applications or services that require local deployment (for example, print services that must remain functional in the event of a WAN outage) can be deployed on the already installed Steelhead appliance, which enables the decommissioning of a dedicated print server in the branch.
In December 2009, we introduced the latest implementation of RSP in conjunction with version 6.0 of RiOS. RSP runs within the Steelhead appliances, and now supports up to five third-party applications or services, including Microsoft Windows Server, print server, DNS/DHCP, security, video and selected other packages. Over time we expect additional products and services to become available for installation on RSP. The U.S. list prices of our RSP kits currently range from $1,590 to $3,985 and include the software license and memory.
Our Central Management Console (CMC) is an optional product designed to centrally manage many Steelhead appliances distributed across a WAN, simplifying the tasks of deploying, configuring, monitoring, reporting and upgrading large numbers of Steelhead appliances (one CMC can manage up to 500 Steelhead appliances). In 2009, we introduced the Central Management Console-Virtual Edition (CMC-VE), which is a virtualized version of the CMC. The U.S. list prices of our CMC appliances and CMC-VE currently range from $4,995 to $49,995.
Our Interceptor® is a complementary product designed to enable flexible and scalable deployment of a cluster of Steelhead appliances in complex, high-traffic data center environments without requiring complex network reconfiguration, making the deployment of a Riverbed-based solution simpler, faster and more scalable than alternatives. The U.S. list price of our Interceptor appliance is currently $34,995.
Steelhead Mobile is a software-only version of RiOS designed to run on Windows® laptop or desktop machines. Steelhead Mobile has the same architecture as Steelhead appliances, with Data, Transport and Application Streamlining. A purchase of the Steelhead Mobile Controller (SMC) is required when purchasing Steelhead Mobile, as is at least one Steelhead appliance, which is typically deployed in the data center. The SMC includes a license for up to thirty (30) concurrent licenses for Steelhead Mobile software. The SMC handles the licensing and the distribution of Steelhead Mobile software packages. Each SMC has the capacity to manage up to 2,000 concurrent Steelhead Mobile users. Customers may purchase additional concurrent licenses as needed above the default 30 that
9
Table of Contents
come with the SMC. The base list price of our SMC is currently $12,995. In 2009, we introduced the Steelhead Mobile Controller-Virtual Edition (SMC-VE), which is a virtualized version of the SMC. The base list price of our SMC-VE is currently $5,995.
Cascade appliances help organizations manage, secure and optimize the availability and performance of global applications. The Cascade appliances allow us to meet enterprise and service provider customer demands by extending our suite of WAN optimization products to include global application performance, reporting and analytics. The U.S. list prices of our Cascade appliances currently range from $36,995 to $185,000.
In addition to accelerating the performance of applications across the WAN, Steelhead and CMC products utilize our Management Streamlining technology to simplify deployment, configuration, management and ongoing maintenance, thereby lowering the total cost of ownership of our products. Management Streamlining offers the following benefits:
| Ÿ | Ease of deployment — Our products are designed to be more easily and seamlessly integrated into networks than alternative approaches, with full support for most existing routing and networking configurations. Steelhead products can automatically detect each other within an organization’s WAN and can be automatically configured across WAN links to begin optimizing data without the need to manually set up complicated appliance-to-appliance network tunnels; and |
| Ÿ | Simplified management — Our products simplify remote-site appliance management by enabling remote configuration, management and updating of Steelhead products. In addition, our products provide performance reporting capabilities necessary to deliver relevant performance information to centralized IT resources. |
Technology
The Riverbed Optimization System (RiOS) is our proprietary software platform that provides the core intelligence and essential functionality for our Steelhead products. To achieve performance improvements across a broad range of applications, RiOS integrates four key sets of technologies: Data Streamlining, Transport Streamlining, Application Streamlining and Management Streamlining.
Data Streamlining
Our Data Streamlining technologies address bandwidth limitations in existing networks. Our patented approach can be applied to all data and applications that run over TCP to reduce bandwidth consumption by dramatically reducing the need to send the same data multiple times over the WAN. Data Streamlining also supports the classification of individual data packets for quality-of-service and route control.
In a non-optimized WAN setting, each time data is requested by a remote user, all of the data must be sent across the WAN, regardless of whether identical data (or an insignificantly modified version of the data) has previously been sent. In wide-area distributed computing environments where Steelhead products have been deployed, all of the requested data must be sent across the WAN only the first time data is requested by a user, at which time that data is stored by the Steelhead products on both sides of the network. In subsequent requests, redundant data segments will not be sent regardless of what application is requesting the data or which user is making the request. The detection of repetitive data patterns is very granular, with a typical segment of data being as small as approximately 100 bytes. This fine level of granularity enables Steelhead products to detect tiny changes in files, e-mails, web pages and other application data, sending only those changes across the WAN.
10
Table of Contents
Each end-user request for data is sent directly to the intended authoritative application server as opposed to a cache that typically utilizes a copy of the data. Our Steelhead product intercepts the server response, identifies redundant data patterns and then sends only the new segments across the WAN to the end-user. All of the existing segments are represented by references which point to those already existing segments stored on the end-user side of the WAN connection. In this way, significantly less traffic needs to be sent to deliver large amounts of data to the end-user. In addition, this approach eliminates data consistency issues inherent in cache-based approaches.
Transport Streamlining
Transport Streamlining enhances the performance of the TCP protocol by increasing the amount of data carried per TCP round trip, thereby reducing the number of round trips required to move a given amount of data over the WAN. We accomplish this by both increasing the default TCP payload and by filling the window with references to data rather than actual data.
We also enhance TCP performance by reducing the time associated with creating new TCP connections (especially for small, short-lived transfers), adapting transfer parameters based on real-time network characteristics and assigning priority for necessary packet resends due to packet loss. A component of Transport Streamlining, High Speed TCP, also addresses the TCP chattiness and latency that is particularly pronounced in high speed connections (for example, OC-12 (622 Mbps)). Another component of transport streamlining, MXTCP, is designed to address private networks with packet loss.
Application Streamlining
Application Streamlining provides a further mechanism to enhance the performance of specific applications. Many applications were designed for use over a LAN and require hundreds to thousands of interactions between client and server to execute even simple requests, such as opening a file. By understanding the semantics of particular application protocols, Steelhead products reduce chattiness, collapsing hundreds of client-server interactions into a few round trips over the WAN.
While most important business applications that run over TCP immediately benefit from Data Streamlining and Transport Streamlining, Application Streamlining enables us to add additional acceleration for specific applications. We have built specific Application Streamlining modules that support file, e-mail, web, ERP, database application, and thin client protocols (CIFS, MAPI, HTTP, Oracle Forms, SSL, Lotus Notes, NFS and MS-SQL, Citrix, and others). We have also built special modules to address protocol inefficiencies for common storage back-up and replication applications. We believe these applications are especially inefficient in wide-area distributed computing. We have designed our architecture to enable additional Application Streamlining modules to be incorporated easily over time.
Management Streamlining
Management Streamlining allows for simplified implementation and administration of our Steelhead products. Unlike alternative approaches, which usually require changes to clients, servers, routers and switches or the addition of an overlay network of tunnels, Steelhead products are designed to be transparently installed in existing IT infrastructure with minimal administration. The auto-discovery capabilities of RiOS allow our Steelhead products to identify automatically all Steelhead products on the WAN, typically without a need to reconfigure any network infrastructure. Our products automatically intercept WAN traffic without any further configuration requirements to applications, clients or other network infrastructure, while allowing non-optimized traffic to simply pass through.
11
Table of Contents
Our RiOS software provides IT administrators with simplified management of Steelhead products through Command Line Interface (CLI), Graphical User Interface (GUI) and an optional Central Management Console.
Other key elements of Management Streamlining include touchless configuration options, over-the-wire software upgrades for Steelhead products, singular and grouped appliance management and customizable reporting analytics.
Collection of Performance Data
Our Cascade software collects performance data from sources across the network, including switches, routers and WAN optimization devices. This includes flow records, layer 7 application data, and data about optimized links. All information is collected without any server-side agents or modifications to corporate applications.
Performance Metrics and Behavioral Analytics
Cascade presents the information collected from the network as a collection of useful metrics on application and network performance. It feeds these metrics into a behavioral analytics model, which learns the typical performance of applications and alerts an operator whenever performance deviates in a meaningful way from its learned “normal”.
Discovery and Dependency Mapping
Discovery and dependency mapping allows operators involved with performance troubleshooting, as well as IT consolidation initiatives, to rapidly understand all the components and associated interdependencies that are necessary for the delivery of an application to an end user.
Customers
Our products have been sold to over 7,300 customers worldwide in every major industry, including manufacturing, finance, technology, government, architecture, engineering and construction, professional services, utilities, healthcare and pharmaceuticals, media and retail. Our products are deployed in a wide range of organizations, from large global organizations with hundreds or thousands of locations to smaller organizations with few locations. During the years ended December 31, 2009, 2008 and 2007, no single customer accounted for 10% or more of our consolidated revenue.
Sales and Marketing
We sell our products and support through channel partners and our field sales force:
| Ÿ | Channel partners — We have over 1,300 channel partners worldwide, primarily VARs, VADs, service providers and systems integrators. These partners help market and sell our products to a broad array of organizations and allow us to leverage our field sales force; and |
| Ÿ | Field sales force — We have a field sales force that is responsible for managing all direct and indirect sales within each of our geographic territories. |
Our marketing activities include lead generation, advertising, website operations, direct marketing, public relations, technology conferences and trade shows.
Many companies in our industry experience adverse seasonal fluctuations in customer spending patterns, particularly in the first and third quarters. We have experienced these seasonal fluctuations in the past and expect that this trend will continue in the future.
12
Table of Contents
Support and Services
We offer tiered customer support programs depending upon the service needs of our customers’ deployments. Support contracts provide customers the right to receive unspecified software product upgrades and maintenance releases issued when and if available during the support period. Product support includes internet access to technical content, as well as telephone, internet and email access to technical support personnel. Support contracts typically have a one-year term. We have support centers in New York, the San Francisco Bay Area, Amsterdam, London, Singapore, Sydney and Tokyo, which enable us to respond at all times. As we expand internationally, we plan to continue to hire additional technical support personnel to service our growing international customer base.
Primary product support for customers of our channel partners is often provided by the partners themselves and we provide back-up support.
Our product sales include a warranty on hardware and software. Hardware is typically warranted against material defects for 12 months. Software is typically warranted to meet published specifications for a period of 90 days.
Research and Development
Continued investment in research and development is critical to our business. To this end, we have assembled a team of engineers with expertise in various fields, including networking, applications, storage and systems management. We have invested significant time and financial resources into the development of our products. We plan to expand our product offerings and solutions capabilities in the future and plan to dedicate significant resources to these continued research and development efforts. Further, as we expand internationally and into different sectors, we may incur additional costs to conform our products to comply with local laws or local product specifications.
Research and development expenses were $69.2 million, $58.7 million, and $39.7 million in 2009, 2008, and 2007, respectively.
Manufacturing
We outsource manufacturing of all hardware products. Our manufacturers provide us with limited warranties to cover general product failures, and our larger manufacturing partners provide specific quality control processes and replacement cycle time commitments. In addition, the lead times associated with certain components are lengthy and make rapid changes in quantity requirements and delivery schedules difficult. Although we outsource manufacturing operations for cost-effective scale and flexibility, we perform rigorous quality control testing intended to ensure the reliability of Steelhead appliances once deployed. We provide long-term forecasts to our manufacturing partners and we maintain oversight of their supply chain activities.
Shortages in components that we use in our products are possible and our ability to predict the availability of such components may be limited. Some of these components are available only from single or limited sources of supply. Our ability to timely deliver products to our customers would be materially adversely impacted if we needed to qualify replacements for any of a number of the components used in our products.
We outsource our logistics functions to third parties. These third parties ship our products on our behalf and perform certain other shipping and product integration capabilities.
Competition
The WAN optimization market is highly competitive and continually evolving. We believe we compete primarily on the basis of offering a comprehensive WAN optimization solution that broadly
13
Table of Contents
addresses the root causes of poor performance of wide-area distributed computing. We believe other principal competitive factors in our market include product performance, ability to deploy easily into existing networks and ability to remotely manage products. We believe that our solution performs better than competitive products as measured by a broad range of metrics encompassing application performance, compression ratios and data transfer times. Our ability to sustain such a competitive advantage depends on our ability to achieve continuous technological innovation and adapt to the evolving needs of our customers.
We believe we are currently the only provider of a comprehensive WAN optimization solution. However, a large number of vendors have made acquisitions to enter the WAN optimization market and continue to invest in this area.
Our primary competitors include Cisco Systems, Blue Coat Systems, Juniper Networks, Citrix Systems and F5 Networks. We also face competition from a large number of smaller private companies and new market entrants.
We believe that we compete favorably in each of the sub-segments of WAN optimization in addition to being the only provider of a comprehensive WAN optimization solution. As we have a purpose-built architecture, compared to many vendors’ attempts to combine separate technology elements, we believe we have a significant advantage in performance, ease-of-use, and ability to scale to large numbers of locations and employees.
Intellectual Property
Our success as a company depends upon our ability to protect our core technology and intellectual property. To accomplish this, we rely on a combination of intellectual property rights, including patents, trade secrets, copyrights and trademarks, as well as customary contractual protections.
Our worldwide patent portfolio includes nineteen U.S. patents; one European patent with effect in France, Germany, the United Kingdom and Hong Kong; two Republic of India patents; and one People’s Republic of China patent. Patents generally have a term of twenty years from their priority date, which is generally either the date they were initially filed or the filing date of the earliest patent from which priority is claimed. Our issued patents will expire in 2020 through 2026. U.S. patent filings are intended to provide the holder with a right to exclude others from making, using, selling or importing in the U.S. the inventions covered by the claims of granted patents. We have U.S. provisional and non-provisional patent applications pending, as well as counterparts pending in other jurisdictions around the world. We do not know whether any of our pending patent applications will result in the issuance of patents or whether the examination process will require us to narrow our claims. Our granted patents, and to the extent any future patents are issued, any such future patents may be contested, circumvented or invalidated over the course of our business, and we may not be able to prevent third parties from infringing these patents. In addition, the laws of certain countries do not protect our proprietary rights to the same extent as do the laws in the U.S. Therefore, the exact effect of having a patent cannot be predicted with certainty.
Our registered trademarks in the U.S. are Riverbed, Steelhead, Riverbed (stylized), RiOS, Think Fast, Cascade and Interceptor. Our registered trademarks in Japan are Riverbed, Steelhead, Riverbed (stylized) and Think Fast. Our registered trademarks in the European Community are Riverbed, Steelhead, Riverbed (stylized) and Think Fast. We also have a number of trademark applications pending, in the U.S. as well as in other jurisdictions.
In addition to the foregoing protections, we generally control access to and use of our proprietary software and other confidential information through the use of internal and external controls, including
14
Table of Contents
contractual protections with employees, contractors, customers and partners. Our software is also protected by U.S. and international copyright laws.
We also incorporate third-party software programs into our products pursuant to license agreements. These software programs enable us, for example, to configure a storage adapter for specific redundant disk setups, initialize and diagnose hardware on certain products, and help manage statistics and reporting. Any disruption in our access to these software programs could result in significant delays in our product releases and could require substantial effort to locate or develop a replacement program.
Employees
As of December 31, 2009, we had 1,013 employees in offices in all major geographies. Of these, 468 were engaged in sales and marketing, 271 in research and development, 136 in support and services, 120 in general and administration and 18 in manufacturing. None of our U.S. employees are represented by labor unions; however, in certain international subsidiaries workers councils represent our employees. We consider current employee relations to be good.
Available Information
Our Internet address is www.riverbed.com. There we make available, free of charge, our annual reports on Form 10-K, quarterly reports on Form 10-Q, current reports on Form 8-K and any amendments to those reports, as soon as reasonably practicable after we electronically file such material with, or furnish it to, the Securities and Exchange Commission (SEC). Our SEC reports can be accessed through the investor relations section of our website. The information found on our website is not part of this or any other report we file with or furnish to the SEC.
| Item 1A. | Risk Factors |
Set forth below and elsewhere in this Annual Report on Form 10-K, and in other documents we file with the SEC, are risks and uncertainties that could cause actual results to differ materially from the results contemplated by the forward-looking statements contained in this Annual Report on Form 10-K. Because of the following factors, as well as other variables affecting our operating results, past financial performance should not be considered as a reliable indicator of future performance and investors should not use historical trends to anticipate results or trends in future periods.
Risks Related to Our Business and Industry
Our operating results may fluctuate significantly, which makes our future results difficult to predict and could cause our operating results to fall below expectations or our guidance.
Our quarterly and annual operating results have varied significantly in the past and could vary significantly in the future, which makes it difficult for us to predict our future operating results. Our operating results may fluctuate due to a variety of factors, many of which are outside of our control, including the changing and recently volatile U.S. and global economic environment, any of which may cause our stock price to fluctuate. As a result, comparing our operating results on a period-to-period basis may not be meaningful. You should not rely on our past results as an indication of our future performance. In addition, revenues in any quarter are largely dependent on customer contracts entered into during that quarter. Moreover, a significant portion of our quarterly sales typically occurs during the last month of the quarter, and sometimes within the last few weeks or days of the quarter. As a result, our quarterly operating results are difficult to predict even in the near term and a delay in an anticipated sale past the end of a particular quarter may negatively impact our results of operations for that quarter, or in some cases, that year. A delay in the recognition of revenue, even from just one account,
15
Table of Contents
may have a significant negative impact on our results of operations for a given period. If our revenue or operating results fall below the expectations of investors or securities analysts or below any guidance we may provide to the market, as has occurred in the past, the price of our common stock could decline substantially. Such a stock price decline could occur, and has occurred in the past, even when we have met our publicly stated revenue and/or earnings guidance.
In addition to other risks listed in this “Risk Factors” section, factors that may affect our operating results include, but are not limited to:
| Ÿ | fluctuations in demand, including due to seasonality, for our products and services. For example, many companies in our industry experience adverse seasonal fluctuations in customer spending patterns, particularly in the first and third quarters; we have experienced these seasonal fluctuations in the past and expect that this trend will continue in the future; |
| Ÿ | fluctuations in sales cycles and prices for our products and services; |
| Ÿ | reductions in customers’ budgets for information technology purchases and delays in their purchasing cycles; |
| Ÿ | general economic conditions in our domestic and international markets; |
| Ÿ | limited visibility into customer spending plans; |
| Ÿ | changing market conditions, including current and potential customer consolidation; |
| Ÿ | customer concentration; |
| Ÿ | variation in sales channels, product costs or mix of products sold; |
| Ÿ | the timing of recognizing revenue in any given quarter as a result of revenue recognition accounting rules, including the extent to which sales transactions in a given period are unrecognizable until a future period or, conversely, the satisfaction of revenue recognition rules in a given period resulting in the recognition of revenue from transactions initiated in prior periods; |
| Ÿ | the sale of our products in the timeframes we anticipate, including the number and size of orders, and the product mix within any such orders, in each quarter; |
| Ÿ | our ability to develop, introduce and ship in a timely manner new products and product enhancements that meet customer requirements; |
| Ÿ | the timing and execution of product transitions or new product introductions, including any related or resulting inventory costs; |
| Ÿ | the timing of product releases or upgrades by us or by our competitors; |
| Ÿ | any significant changes in the competitive dynamics of our markets, including new entrants or substantial discounting of products; |
| Ÿ | our ability to control costs, including our operating expenses and the costs of the components we purchase; |
| Ÿ | any decision to increase or decrease operating expenses in response to changes in the marketplace or perceived marketplace opportunities; |
| Ÿ | our ability to derive benefits from our investments in sales, marketing, engineering or other activities; |
| Ÿ | our ability to successfully work with partners on combined solutions. For example, where our product features the Riverbed Services Platform (RSP), we are required to work closely with our partners in product validation, marketing, selling and support; |
16
Table of Contents
| Ÿ | volatility in our stock price, which may lead to higher stock compensation expenses; |
| Ÿ | our estimates of the fair value of acquisition-related contingent consideration may change significantly and could have a material effect on earnings and cash flows; and |
| Ÿ | unpredictable fluctuations in our effective tax rate due to disqualifying dispositions of stock from the employee stock purchase plan and stock options, changes in the valuation of our deferred tax assets or liabilities, changes in actual results versus our estimates, or changes in tax laws, regulations, accounting principles, or interpretations thereof. |
We face intense competition that could reduce our revenue and adversely affect our financial results.
The market for our products is highly competitive and we expect competition to intensify in the future. Other companies may introduce new products in the same markets we serve or intend to enter.
This competition could result, and has resulted in the past, in increased pricing pressure, reduced profit margins, increased sales and marketing expenses and failure to increase, or the loss of, market share, any of which would likely seriously harm our business, operating results or financial condition.
Competitive products may in the future have better performance, more and/or better features, lower prices and broader acceptance than our products. Many of our current or potential competitors have longer operating histories, greater name recognition, larger customer bases and significantly greater financial, technical, sales, marketing and other resources than we do. Potential customers may prefer to purchase from their existing suppliers rather than a new supplier regardless of product performance or features. Currently, we face competition from a number of established companies, including Cisco Systems, Blue Coat Systems, Juniper Networks, Citrix Systems, and F5 Networks. We also face competition from a large number of smaller private companies and new market entrants.
We expect increased competition from our current competitors as well as other established and emerging companies if our market continues to develop and expand. For example, third parties currently selling our products could market products and services that compete with our products and services. In addition, some of our competitors have made acquisitions or entered into partnerships or other strategic relationships with one another to offer a more comprehensive solution than they individually had offered. We expect this trend to continue as companies attempt to strengthen or maintain their market positions in an evolving industry and as companies enter into partnerships or are acquired. Many of the companies driving this consolidation trend have significantly greater financial, technical and other resources than we do and are better positioned to acquire and offer complementary products and technologies. The companies resulting from these possible consolidations may create more compelling product offerings and be able to offer greater pricing flexibility, making it more difficult for us to compete effectively, including on the basis of price, sales and marketing programs, technology or product functionality. Continued industry consolidation may adversely impact customers’ perceptions of the viability of smaller and even medium-sized technology companies and consequently customers’ willingness to purchase from such companies. These pressures could materially adversely affect our business, operating results and financial condition.
We also face competitive pressures from other sources. For example, Microsoft has improved, and has announced its intention to further improve, the performance of its software for remote office users. Our products are designed to improve the performance of many applications, including applications that are based on Microsoft protocols. Accordingly, improvements to Microsoft application protocols may reduce the need for our products, adversely affecting our business, operating results and financial condition. Improvement in other application protocols or in the Transmission Control Protocol (TCP), the underlying transport protocol for most WAN traffic, could have a similar effect. In
17
Table of Contents
addition, we market our products, in significant part, on the anticipated cost savings to be realized by organizations if they are able to avoid the purchase of costly IT infrastructure at remote sites by purchasing our products. To the extent other companies are able to reduce the costs associated with purchasing and maintaining servers, storage or applications to be operated at remote sites, our business, operating results and financial condition could be adversely affected.
Continued adverse economic conditions make it difficult to predict revenues for a particular period and may lead to reduced information technology spending, which would harm our business and operating results. In addition, the recent turmoil in credit markets increases our exposure to our customers’ and partners’ credit risk, which could result in reduced revenue or additional write-offs of accounts receivable.
Our business depends on the overall demand for information technology, and in particular for WAN optimization, and on the economic health and general willingness of our current and prospective customers to make capital commitments. If the conditions in the U.S. and global economic environment remain uncertain or continue to be volatile, or if they deteriorate further, our business, operating results, and financial condition would likely be materially adversely affected. Economic weakness, customer financial difficulties and constrained spending on IT initiatives have resulted, and may in the future result, in challenging and delayed sales cycles and could negatively impact our ability to forecast future periods. In addition, the market we serve is emerging and the purchase of our products involves material changes to established purchasing patterns and policies. The purchase of our products is often discretionary and may involve a significant commitment of capital and other resources. In addition, our operating expenses are largely based on anticipated revenue trends and a high percentage of our expenses are, and will continue to be, fixed in the short-term. Uncertainty about future economic conditions makes it difficult to forecast operating results and to make decisions about future investments. Weak or volatile economic conditions would likely harm our business and operating results in a number of ways, including information technology spending reductions among customers and prospects, longer sales cycles, lower prices for our products and services and reduced unit sales. A reduction in information technology spending could occur or persist even if economic conditions improve. In addition, any increase in worldwide commodity prices, such as occurred in 2008, may result in higher component prices and increased shipping costs, both of which may negatively impact our financial results.
Many of our customers and channel partners use third parties to finance their purchases of our products. Any freeze, or reduced liquidity, in the credit markets, such as we experienced in 2009, may result in customers or channel partners either delaying or entirely foregoing planned purchases of our products as they are unable to obtain the required financing. This would result in reduced revenues, and our business, operating results and financial condition would be harmed. In addition, these customers’ and partners’ ability to pay for products already purchased may be adversely affected by the credit market turmoil or an associated downturn in their own business, which in turn could harm our business, operating results and financial condition.
We rely heavily on channel partners to sell our products. Disruptions to, or our failure to effectively implement, develop and manage, our distribution channels and the processes and procedures that support them could harm our business.
Our future success is highly dependent upon establishing and maintaining successful relationships with a variety of channel partners, including value-added resellers, value-added distributors, service providers, and systems integrators. A substantial majority of our revenue is derived from indirect channel sales and we expect indirect channel sales to continue to account for a substantial majority of our total revenue. Recently we announced a two-tier distribution strategy in North America, part of a larger effort to scale our reach and better serve the needs of our channel. Our
18
Table of Contents
revenue depends in large part on the effective performance of these channel partners, and changes to our distribution model, the loss of a channel partner or the reduction in sales to our channel partners could materially reduce our revenues and gross margins. By relying on indirect channels, we may have little or no contact with the ultimate users of our products, thereby making it more difficult for us to establish brand awareness, ensure proper delivery and installation of our products, service ongoing customer requirements and respond to evolving customer needs. In addition, we recognize a large portion of our revenue based on a sell-through model using information regarding the end user customers that is provided by our channel partners. If those channel partners provide us with inaccurate or untimely information, the amount or timing of our revenues could be adversely impacted. For example, we have encountered delays with certain partners where internal processing issues have prevented that partner from providing a purchase order to us in a timely manner.
Recruiting and retaining qualified channel partners and training them in our technology and product offerings requires significant time and resources. In order to develop and expand our distribution channel, we must continue to scale and improve our processes and procedures that support our distribution channel, including investment in systems and training, and those processes and procedures may become increasingly complex and difficult to manage. We have no minimum purchase commitments with any of our value-added resellers or other indirect distributors, and our contracts with these channel partners do not prohibit them from offering products or services that compete with ours. Our competitors may be effective in providing incentives to existing and potential channel partners to favor their products, to choose not to partner with us, or to prevent or reduce sales of our products. Our channel partners may choose not to offer our products exclusively or at all. If we fail to maintain successful relationships with our channel partners, fail to develop new relationships with channel partners in new markets or expand the number of channel partners in existing markets, fail to manage, train or motivate existing channel partners effectively or if these channel partners are not successful in their sales efforts, sales of our products would decrease and our business, operating results and financial condition would be materially adversely affected.
We expect our gross margins to vary over time and our recent level of product gross margin may not be sustainable. In addition, our product gross margins may be adversely affected by our introductions of new products.
Our product gross margins vary from quarter to quarter and the recent level of gross margins may not be sustainable and may be adversely affected in the future by numerous factors, including but not limited to product or sales channel mix shifts, increased price competition, increases in material or labor costs, excess product component or obsolescence charges from our contract manufacturers, write-downs for obsolete or excess inventory, increased costs due to changes in component pricing or charges incurred due to component holding periods if our forecasts do not accurately anticipate product demand, warranty-related issues, product discounting, freight charges, or our introduction of new products or new product platforms or entry into new markets with different pricing and cost structures.
Any introduction of, and transition to, a new product line requires us to forecast customer demand for both legacy and new product lines for a period of time, and to maintain adequate inventory levels to support the sales forecasts for both product lines. If new product line sales exceed our sales forecast, we could possibly experience stock shortages, which would negatively affect our revenues. If legacy product line sales fall short of our sales forecast, we could have excess inventory, as has occurred in prior quarters. Any inventory charges would negatively impact our product gross margins.
19
Table of Contents
We may incur significant fluctuations in acquisition-related costs (credits) associated with changes in fair value of contingent consideration liability in connection with the Mazu acquisition. Any changes would be recognized in our earnings, which may affect the price of our common stock.
The accounting principle for business combinations requires us to estimate the fair value of contingent consideration as of the acquisition date. Subsequent to the acquisition date, any changes in the estimate of the fair value of the contingent consideration is recognized in earnings in the period of the change in estimate. In the year ended December 31, 2009, the estimated fair value of the liability for contingent consideration recognized as a result of the acquisition of Mazu was reduced, which resulted in a net gain of $1.3 million. The contractual earnout formula for the Mazu acquisition is tiered with significant increases in consideration at each tier. If certain bookings are achieved during the three months ended March 31, 2010, the acquisition-related costs would increase by $2.2 million or more. If certain bookings are not achieved during the three months ended March 31, 2010, the acquisition-related costs would decrease by $4.3 million. The resulting increase or decrease in the acquisition-related contingent consideration will be recognized in earnings during the three months ended March 31, 2010. The acquisition-related compensation costs will also increase or decrease based on bookings achievements, and will be recognized in earnings during the three months ended March 31, 2010. Any change in earnings could affect the price of our common stock.
We rely on third parties to perform shipping and other logistics functions on our behalf. A failure or disruption at a logistics partner would harm our business.
Currently, we use third-party logistics partners to perform storage, packaging, shipment and handling for us. Although the logistics services required by us may be readily available from a number of providers, it is time-consuming and costly to qualify and implement these relationships. If one or more of our logistics partners suffers an interruption in its business, or experiences delays, disruptions or quality control problems in its operations, or we choose to change or add additional logistics partners, our ability to ship products to our customers would be delayed and our business, operating results and financial condition would be adversely affected.
We are susceptible to shortages or price fluctuations in our supply chain. Any shortages or price fluctuations in components used in our products could delay shipment of our products or increase our costs and harm our operating results.
Our increase in the use of Riverbed-designed content in our hardware platforms has increased our susceptibility to scarcity or delivery delays for custom components within our systems. Shortages in components that we use in our products are possible and our and our suppliers’ ability to predict the availability of such components may be limited. Some of these components are available only from limited sources of supply. The unavailability of any of these components would prevent us from shipping products because each of these components is necessary to the proper functioning of our appliances. In addition, the lead times associated with certain components are lengthy and preclude rapid changes in quantity requirements and delivery schedules.
Any growth in our business or the economy is likely to create greater pressures on us and our suppliers to project overall component demand accurately and to establish optimal component inventory levels. In addition, increased demand by third parties for the components we use in our products may lead to decreased availability and higher prices for those components. We carry limited inventory of our product components, and we rely on suppliers to deliver components in a timely manner based on forecasts we provide. We rely on both purchase orders and long-term contracts with our suppliers, but we may not be able to secure sufficient components at reasonable prices or of acceptable quality, which would seriously impact our ability to deliver products to our customers and, as a result, adversely impact our revenue.
20
Table of Contents
If we fail to accurately predict our manufacturing requirements, we could incur additional costs or experience manufacturing delays, which would harm our business. We are dependent on contract manufacturers, and changes to those relationships, expected or unexpected, may result in delays or disruptions that could harm our business.
We depend on independent contract manufacturers to manufacture and assemble our products. We rely on purchase orders or long-term contracts with our contract manufacturers. Some of our contract manufacturers are not obligated to supply products to us for any specific period, in any specific quantity or at any specific price. Our orders may represent a relatively small percentage of the overall orders received by our contract manufacturers from their customers. As a result, fulfilling our orders may not be considered a priority by one or more of our contract manufacturers in the event the contract manufacturer is constrained in its ability to fulfill all of its customer obligations in a timely manner. We provide demand forecasts and purchase orders to our contract manufacturers. To the extent that any such demand forecast or purchase order is binding, if we overestimate our requirements, the contract manufacturers may assess charges or we may have liabilities for excess inventory, each of which could negatively affect our gross margins. Conversely, because lead times for required materials and components vary significantly and depend on factors such as the specific supplier, contract terms and the demand for each component at a given time, if we underestimate our requirements, the contract manufacturers may have inadequate materials and components required to produce our products, which could interrupt manufacturing of our products and result in delays in shipments and deferral or loss of revenue.
Although the contract manufacturing services required to manufacture and assemble our products may be readily available from a number of established manufacturers, it is time-consuming and costly to qualify and implement contract manufacturer relationships. Therefore, if one or more of our contract manufacturers suffers an interruption in its business, or experiences delays, disruptions or quality control problems in its manufacturing operations, or we choose to change or add additional contract manufacturers, our ability to ship products to our customers would be delayed and our business, operating results and financial condition would be adversely affected. In addition, a portion of our manufacturing is performed overseas and is therefore subject to risks associated with doing business in other countries.
We are dependent on various information technology systems, and failures of or interruptions to those systems could harm our business.
Some of our business processes depend upon our information technology systems (“IT”), the systems and processes of third parties, and on interfaces with the systems of third parties. For example, our order entry system provides information to the systems of our contract manufacturers, which enables them to build and ship our products. If those systems fail or are interrupted, our processes may function at a diminished level or not at all. This would harm our ability to ship products, and our financial results would likely be harmed.
In addition, reconfiguring our IT systems or other business processes in response to changing business needs may be time-consuming and costly. To the extent this impacted our ability to react timely to specific market or business opportunities, our financial results would likely be harmed.
If we are unable to protect our intellectual property rights, our competitive position could be harmed or we could be required to incur significant expenses to enforce our rights.
We depend on our ability to protect our proprietary technology. We rely on trade secret, patent, copyright and trademark laws and confidentiality agreements with employees and third parties, all of which offer only limited protection. Despite our efforts, the steps we have taken to protect our proprietary rights may not be adequate to preclude misappropriation of our proprietary information or
21
Table of Contents
infringement of our intellectual property rights, and our ability to police such misappropriation or infringement is uncertain, particularly in countries outside of the U.S. Further, with respect to patent rights, we do not know whether any of our pending patent applications will result in the issuance of patents or whether the examination process will require us to narrow our claims, and even if patents are issued, they may be contested, circumvented or invalidated over the course of our business. The invalidation of any of our key patents could benefit our competitors by allowing them to more easily design products similar to ours. Moreover, the rights granted under any issued patents may not provide us with proprietary protection or competitive advantages, and competitors may in any event be able to develop similar or superior technologies to our own now or in the future. Protecting against the unauthorized use of our products, trademarks and other proprietary rights is expensive, difficult and, in some cases, impossible. Litigation has been necessary in the past and may be necessary in the future to enforce or defend our intellectual property rights, to protect our trade secrets or to determine the validity and scope of the proprietary rights of others. For example, in the third quarter of 2008 we settled a patent infringement lawsuit with Quantum Corporation where both we and Quantum asserted that the other party infringed a patent or patents. Intellectual property litigation has resulted, and may in the future result, in substantial costs and diversion of management resources, and may in the future harm our business, operating results and financial condition. Furthermore, many of our current and potential competitors have the ability to dedicate substantially greater resources to enforce their intellectual property rights than we do. Accordingly, despite our efforts, we may not be able to prevent third parties from infringing upon or misappropriating our intellectual property.
Claims by others that we infringe their proprietary technology could harm our business.
Our industry is characterized by the existence of a large number of patents and frequent claims and related litigation regarding patent and other intellectual property rights. In the ordinary course of our business, we are involved in disputes and licensing discussions with others regarding their claimed proprietary rights and we cannot assure you that we will always successfully defend ourselves against such claims. Third parties have claimed and may in the future claim that our products or technology infringe their proprietary rights. For example, in the third quarter of 2008 we settled a patent infringement lawsuit with Quantum Corporation. We expect that infringement claims may increase as the number of products and competitors in our market increases and overlaps occur. In addition, as we have gained greater visibility and market exposure as a public company, we face a higher risk of being the subject of intellectual property infringement claims. Any claim of infringement by a third party, even those without merit, could cause us to incur substantial legal costs defending against the claim, and could distract our management from our business. Furthermore, we could be subject to a judgment or voluntarily enter into a settlement, either of which could require us to pay substantial damages. A judgment or settlement could also include an injunction or other court order that could prevent us from offering our products. In addition, we might elect or be required to seek a license for the use of third-party intellectual property, which may not be available on commercially reasonable terms or at all, or if available, the payments under such license may harm our operating results and financial condition. Alternatively, we may be required to develop non-infringing technology, which could require significant effort and expense and may ultimately not be successful. Any of these events could seriously harm our business, operating results and financial condition. Third parties may also assert infringement claims against our customers and channel partners. Any of these claims would require us to initiate or defend potentially protracted and costly litigation on their behalf, regardless of the merits of these claims, because we generally indemnify our customers and channel partners from claims of infringement of proprietary rights of third parties. If any of these claims succeed, or if we voluntarily enter into a settlement, we may be forced to pay damages on behalf of our customers or channel partners, which could have a material adverse effect on our business, operating results and financial condition.
22
Table of Contents
Our sales cycles can be long and unpredictable, and our sales efforts require considerable time and expense. As a result, our revenue is difficult to predict and may vary substantially from quarter to quarter.
The timing of our revenue is difficult to predict. Our sales efforts involve educating our customers about the use and benefit of our products, including their technical capabilities and potential cost savings to an organization. Customers typically undertake a significant evaluation process that has in the past resulted in a lengthy sales cycle, in some cases over twelve months. Also, as our channel model distribution strategy evolves, utilizing value-added resellers, value-added distributors, systems integrators and service providers, the level of variability in the length of sales cycle across transactions may increase and make it more difficult to predict the timing of many of our sales transactions. We spend substantial time, effort and money in our sales efforts without any assurance that our efforts will produce any sales. Even after making the decision to purchase, customers may deploy our products slowly and deliberately. In addition, product purchases are frequently and increasingly subject to budget constraints, multiple approvals, and unplanned administrative, processing and other delays. Beginning in early 2008 and continuing through 2009, product purchases have in some instances been delayed by the volatile U.S. and global economic environment, which has introduced additional risk into our ability to accurately forecast sales in a particular quarter. If sales expected from a specific customer for a particular quarter are not realized in that quarter or at all, revenue will be harmed and we may miss our stated guidance for that period.
Our international sales and operations subject us to additional risks that may harm our operating results.
In the year ended December 31, 2009, we derived approximately 44% of our revenue from customers outside the U.S. We have personnel in numerous countries worldwide. We expect to continue to add personnel in additional countries. Our international sales and operations subject us to a variety of risks, including:
| Ÿ | the difficulty and cost of managing and staffing international offices and the increased travel, infrastructure, legal and other compliance costs associated with multiple international locations; |
| Ÿ | difficulties in enforcing contracts and collecting accounts receivable, and longer payment cycles, especially in emerging markets; |
| Ÿ | tariffs and trade barriers and other regulatory or contractual limitations on our ability to sell or develop our products in certain foreign markets; |
| Ÿ | unfavorable changes in tax treaties or laws; |
| Ÿ | increased exposure to foreign currency exchange rate risk; and |
| Ÿ | reduced protection for intellectual property rights in some countries. |
Foreign currencies periodically experience rapid fluctuations in value against the U.S. dollar. Any foreign currency devaluation against the U.S. dollar increases the real cost of our products to our customers and partners in foreign markets where we sell in U.S. dollars, which has resulted in the past and may result in the future in delayed or cancelled purchases of our products and, as a result, lower revenues. In addition, this increase in cost increases the risk to us that we will be unable to collect amounts owed to us by such customers or partners, which in turn would impact our revenues and could materially adversely impact our business and financial results. Any devaluation may also lead us to more aggressively discount our prices in foreign markets in order to maintain competitive pricing, which would negatively impact our revenues and gross margins. Conversely, a weakened U.S. dollar could increase the cost of local operating expenses and procurement of raw materials to the extent we purchase components in foreign currencies.
23
Table of Contents
International customers may also require that we localize our products. The product development costs for localizing the user interface of our products, both graphical and textual, could be a material expense to us if the software requires extensive modifications. To date, such changes have not been extensive, and the costs have not been material.
As we continue to expand our business globally, our success will depend, in large part, on our ability to anticipate and effectively manage these and other risks associated with our international sales and operations. Our failure to manage any of these risks successfully could harm our international operations, reduce our international sales and harm our business, operating results and financial condition.
We are investing in engineering, sales, marketing, services and infrastructure, and these investments may achieve delayed or lower than expected benefits, which could harm our operating results.
We intend to continue to add personnel and other resources to our engineering, sales, marketing, services and infrastructure functions as we focus on developing new technologies, growing our market segment, capitalizing on existing or new market opportunities, increasing our market share, and enabling our business operations to meet anticipated demand. We are likely to recognize the costs associated with these investments earlier than some of the anticipated benefits, and the return on these investments may be lower, or may develop more slowly, than we expect. If we do not achieve the benefits anticipated from these investments, or if the achievement of these benefits is delayed, our operating results may be adversely affected.
If we lose key personnel or are unable to attract and retain personnel on a cost-effective basis, our business would be harmed.
Our success is substantially dependent upon the performance of our senior management and key technical and sales personnel. Our management and employees can terminate their employment at any time, and the loss of the services of one or more of our executive officers or other key employees could harm our business. Our success also is substantially dependent upon our ability to attract additional personnel for all areas of our organization, particularly in our sales, research and development and customer service departments. Competition for qualified personnel is intense, and we may not be successful in attracting and retaining such personnel on a timely basis, on competitive terms, or at all. Additionally, fluctuations or a sustained decrease in the price of our stock could affect our ability to attract and retain key personnel. When our stock price declines, our equity incentive awards may lose retention value, which may negatively affect our ability to attract and retain such key personnel. If we are unable to attract and retain the necessary technical, sales and other personnel on a cost-effective basis, our business, operating results and financial condition would be adversely affected.
We may not generate positive returns on our research and development investments.
Developing our products is expensive, and the investment in product development may involve a long payback cycle or may not generate additional revenue at all. In the year ended December 31, 2009, our research and development expenses were $69.2 million, or approximately 18% of our total revenue. Our future plans include significant investments in research and development and related product opportunities. We believe that we must continue to dedicate a significant amount of resources to our research and development efforts to maintain our competitive position. These investments may take several years to generate positive returns, if ever.
24
Table of Contents
Our ability to sell our products is highly dependent on the quality of our support and services offerings, and our failure to offer high quality support and services would harm our operating results and reputation.
Once our products are deployed within our customers’ networks, our customers depend on our support organization to resolve any issues relating to our products. A high level of support is critical for the successful marketing and sale of our products. If we or our channel partners do not effectively assist our customers in deploying our products, succeed in helping our customers quickly resolve post-deployment issues, and provide effective ongoing support, it would adversely affect our ability to sell our products to existing customers and would harm our reputation with potential customers. In addition, as we expand our operations internationally, our support organization will face additional challenges, including those associated with delivering support, training and documentation in languages other than English. Any failure to maintain high quality support and services would harm our operating results and reputation.
If we fail to manage future growth effectively, our business would be harmed.
We have expanded our operations significantly since inception and anticipate that further significant expansion will be required. This future growth, if it occurs, will place significant demands on our management, infrastructure and other resources. To manage any future growth, we will need to hire, integrate and retain highly skilled and motivated employees. We will also need to continue to improve our financial and management controls, reporting systems and procedures. We have an enterprise resource planning software system that supports our finance, sales and inventory management processes. If we were to encounter delays or difficulties as a result of this system, including loss of data and decreases in productivity, our ability to properly run our business could be adversely impacted. If we do not effectively manage our growth, our business would be harmed.
If we do not successfully anticipate market needs and develop products and product enhancements that meet those needs, or if those products do not gain market acceptance, our business and operating results will be harmed.
We may not be able to anticipate future market needs or be able to develop new products or product enhancements to meet such needs, either on a timely basis or at all. For example, our failure to address additional application-specific protocols, particularly if our competitors are able to provide such functionality, could harm our business. In addition, our inability to diversify beyond our current product offerings could adversely affect our business. Any new products or product enhancements that we introduce may not achieve any significant degree of market acceptance or be accepted into our sales channel by our channel partners, which would adversely affect our business and operating results.
Organizations are increasingly concerned with the security of their data, and to the extent they elect to encrypt data being transmitted from the point of the end user in a format that we’re not able to decrypt, rather than only across the WAN, our products will become less effective.
Our products are designed to remove the redundancy associated with repeated data requests over a WAN, either through a private network or a virtual private network (VPN). The ability of our products to reduce such redundancy depends on our products’ ability to recognize the data being requested. Our products currently detect and decrypt some forms of encrypted data. Since most organizations currently encrypt most of their data transmissions only between sites and not on the LAN, the data is not encrypted when it passes through our products. For those organizations that elect to encrypt their data transmissions from the end-user to the server in a format that we’re not able to decrypt, our products will offer limited performance improvement unless we are successful in
25
Table of Contents
incorporating additional functionality into our products that address those encrypted transmissions. Our failure to provide such additional functionality could limit the growth of our business and harm our operating results.
If our products do not interoperate with our customers’ infrastructure, installations could be delayed or cancelled, which would harm our business.
Our products must interoperate with our customers’ existing infrastructure, which often have different specifications, utilize multiple protocol standards, deploy products from multiple vendors, and contain multiple generations of products that have been added over time. If we find errors in the existing software or defects in the hardware used in our customers’ infrastructure or problematic network configurations or settings, as we have in the past, we may have to modify our software or hardware so that our products will interoperate with our customers’ infrastructure. Our products may be unable to provide significant performance improvements for applications deployed in our customers’ infrastructure. These issues could cause longer installation times for our products and could cause order cancellations, either of which would adversely affect our business, operating results and financial condition. In addition, government and other customers may require our products to comply with certain security or other certifications and standards. If our products are late in achieving or fail to achieve compliance with these certifications and standards, or our competitors achieve compliance with these certifications and standards, we may be disqualified from selling our products to such customers, or at a competitive disadvantage, which would harm our business, operating results and financial condition.
If functionality similar to that offered by our products is incorporated into existing network infrastructure products, organizations may decide against adding our products to their network, which would harm our business.
Other providers of network infrastructure products, including our partners, are offering or announcing functionality aimed at addressing the problems addressed by our products. For example, Cisco Systems incorporates WAN optimization functionality into certain of its router blades. The inclusion of, or the announcement of intent to include, functionality perceived to be similar to that offered by our products in products that are already generally accepted as necessary components of network architecture or in products that are sold by more established vendors may have an adverse effect on our ability to market and sell our products. Furthermore, even if the functionality offered by other network infrastructure providers is more limited than our products, a significant number of customers may elect to accept such limited functionality in lieu of adding appliances from an additional vendor. Many organizations have invested substantial personnel and financial resources to design and operate their networks and have established deep relationships with other providers of network infrastructure products, which may make them reluctant to add new components to their networks, particularly from new vendors. In addition, an organization’s existing vendors or new vendors with a broad product offering may be able to offer concessions that we are not able to match because we currently offer a focused line of products and have fewer resources than many of our competitors. If organizations are reluctant to add network infrastructure products from new vendors or otherwise decide to work with their existing vendors, our business, operating results and financial condition will be adversely affected.
Our products are highly technical and may contain undetected software or hardware errors, which could cause harm to our reputation and our business.
Our products, including software product upgrades and releases, are highly technical and complex and, when deployed, are critical to the operation of many networks. Our products have contained and may contain undetected errors, defects or security vulnerabilities. In particular, new
26
Table of Contents
products and product platforms may be subject to increased risk of hardware issues. Some errors in our products may be discovered only after a product has been installed and used by customers. Some of these errors may be attributable to third-party technologies incorporated into our products, which makes us dependent upon the cooperation and expertise of such third parties for the diagnosis and correction of such errors. The diagnosis and correction of third-party technology errors is particularly difficult where our product features the Riverbed Services Platform (RSP), because it is not always immediately clear whether a particular error is attributable to a technology incorporated into our product or to the third-party RSP software deployed on our product. In addition, our RSP solutions, because they involve a third party, are more complex, and the solutions may lead to new technical errors that may prove difficult to diagnose and support. Any delay or mistake in the initial diagnosis of an error will result in a delay in the formulation of an effective action plan to correct such error. Any errors, defects or security vulnerabilities discovered in our products after commercial release could result in loss of revenue or delay in revenue recognition, loss of customers and increased service and warranty cost, any of which could harm our reputation, business, operating results and financial condition. Any such errors, defects or security vulnerabilities could also adversely affect the market’s perception of our products and business. In addition, we could face claims for product liability, tort or breach of warranty, including claims relating to changes to our products made by our channel partners. Our contracts with customers contain provisions relating to warranty disclaimers and liability limitations, which may not be upheld. Defending a lawsuit, regardless of its merit, is costly and may divert management’s attention and harm the market’s perception of us and our products. In addition, if our business liability insurance coverage proves inadequate or future coverage is unavailable on acceptable terms or at all, our business, operating results and financial condition could be adversely impacted.
We may engage in future acquisitions that could disrupt our business and cause dilution to our stockholders.
In February 2009, we acquired Mazu Networks, Inc. In the future we may acquire other businesses, products or technologies. Our ability as an organization to integrate acquisitions is unproven. Any acquisitions that we complete may not ultimately strengthen our competitive position or achieve our goals, or the acquisition may be viewed negatively by customers, financial markets or investors. In addition, we may encounter difficulties in integrating personnel, operations, technologies or products from the acquired businesses and in retaining and motivating key personnel from these businesses. Acquisitions may disrupt our ongoing operations, divert management from day-to-day responsibilities and increase our expenses. Acquisitions may reduce our cash available for operations and other uses and could result in an increase in amortization expense related to identifiable assets acquired, potentially dilutive issuances of equity securities or the incurrence of debt.
Our use of open source and third-party software could impose limitations on our ability to commercialize our products.
We incorporate open source software into our products. Although we monitor our use of open source closely, the terms of many open source licenses have not been interpreted by U.S. courts, and there is a risk that such licenses could be construed in a manner that could impose unanticipated conditions or restrictions on our ability to commercialize our products. In such event, we could be required to seek licenses from third parties in order to continue offering our products, to re-engineer our products or to discontinue the sale of our products in the event re-engineering cannot be accomplished on a timely or successful basis, any of which could adversely affect our business, operating results and financial condition.
We also incorporate certain third-party technologies, including software programs, into our products and may need to utilize additional third-party technologies in the future. However, licenses to relevant third-party technology may not continue to be available to us on commercially reasonable
27
Table of Contents
terms, or at all. Therefore, we could face delays in product releases until equivalent technology can be identified, licensed or developed, and integrated into our current products. These delays, if they occur, could materially adversely affect our business, operating results and financial condition. We currently use third-party software programs in our Steelhead appliances, our Interceptor appliances, our Central Management Console appliances, our Cascade appliances, and our Steelhead Mobile software client and controller. For example, in our Steelhead appliances, we use third-party software to configure a storage adapter for specific redundant disk setups as well as to initialize and diagnose hardware on certain products, and in our Central Management Console and Steelhead Mobile Controller appliances we use third-party software to help manage statistics and reporting. Each of these software programs is currently available from only one vendor. As a result, any disruption in our access to these software programs could result in significant delays in our product releases and could require substantial effort to locate or develop a replacement program. If we decide in the future to incorporate into our products any other software program licensed from a third party, and the use of such software program is necessary for the proper operation of our appliances, then our loss of any such license would similarly adversely affect our ability to release our products in a timely fashion.
We are subject to various regulations that could subject us to liability or impair our ability to sell our products.
Our products are subject to a variety of government regulations, including export controls, import controls, environmental laws and required certifications. For example, our products are subject to U.S. export controls and may be exported outside the U.S. only with the required level of export license or through an export license exception, because we incorporate encryption technology into our products. In addition, various countries regulate the import of certain encryption technology and have enacted laws that could limit our ability to distribute our products or could limit our customers’ ability to implement our products in those countries. Changes in our products or changes in regulations may increase the cost of building and selling our products, create delays in the introduction of our products in international markets, prevent our customers with international operations from deploying our products throughout their global systems or, in some cases, prevent the export or import of our products to certain countries altogether. Any change in regulations, shift in approach to the enforcement or scope of existing regulations, or change in the countries, persons or technologies targeted by such regulations, could result in decreased use of our products by, or in our decreased ability to export or sell our products to, existing or potential customers with international operations. We must comply with various and increasing environmental regulations, both domestic and international, regarding the manufacturing and disposal of our products. For example, we must comply with Waste Electrical and Electronic Equipment Directive laws, which are being adopted by certain European Economic Area countries on a country-by-country basis. Failure to comply with these and similar laws on a timely basis, or at all, could have a material adverse effect on our business, operating results and financial condition. This would also be true if we fail to comply, either on a timely basis or at all, with any U.S. environmental laws regarding the manufacturing or disposal of our products. Any decreased use of our products or limitation on our ability to export or sell our products would harm our business, operating results and financial condition.
We compete in rapidly evolving markets and have a limited operating history, which make it difficult to predict our future operating results.
We were incorporated in May 2002 and shipped our first Steelhead appliance in May 2004. We have a limited operating history and offer a focused line of products in an industry characterized by rapid technological change. It is very difficult to forecast our future operating results. You should consider and evaluate our prospects in light of the risks and uncertainty frequently encountered by companies in rapidly evolving markets characterized by rapid technological change, changing customer needs, increasing competition, evolving industry standards and frequent introductions of new
28
Table of Contents
products and services. As we encounter rapidly changing customer requirements and increasing competitive pressures, we likely will be required to reposition our product and service offerings and introduce new products and services. We may not be successful in doing so in a timely and appropriately responsive manner, or at all. Furthermore, many of our target customers have not purchased products similar to ours and might not have a specific budget for the purchase of our products and services. All of these factors make it difficult to predict our future operating results.
We incur significant costs as a result of operating as a public company, and our management devotes substantial time to new compliance initiatives.
We incur significant legal, accounting and other expenses as a public company, including costs resulting from regulations regarding corporate governance practices and costs relating to compliance with Section 404 of the Sarbanes-Oxley Act. For example, the listing requirements of the Nasdaq Stock Market’s Global Select Market require that we satisfy certain corporate governance requirements relating to independent directors, audit committees, distribution of annual and interim reports, stockholder meetings, stockholder approvals, solicitation of proxies, conflicts of interest, stockholder voting rights and codes of conduct. Our management and other personnel devote a substantial amount of time to these compliance initiatives. Moreover, these rules and regulations have increased our legal and financial compliance costs and will make some activities more time-consuming and costly. For example, these rules and regulations could make it more difficult for us to attract and retain qualified persons to serve on our Board of Directors, our board committees or as executive officers.
While we believe that we currently have adequate internal control over financial reporting, we are exposed to risks from legislation requiring companies to evaluate those internal controls.
The Sarbanes-Oxley Act requires that we test our internal control over financial reporting and disclosure controls and procedures. In particular, for the year ended December 31, 2009, we performed system and process evaluation and testing of our internal control over financial reporting to allow management and our independent registered public accounting firm to report on the effectiveness of our internal control over financial reporting, as required by Section 404 of the Sarbanes-Oxley Act. Our compliance with Section 404 requires that we incur substantial expense and expend significant management time on compliance-related issues. Moreover, if we are not able to comply with the requirements of Section 404 in the future, or if we or our independent registered public accounting firm identify deficiencies in our internal control over financial reporting that are deemed to be material weaknesses, the market price of our stock may decline and we could be subject to sanctions or investigations by the Nasdaq Stock Market’s Global Select Market, the SEC or other regulatory authorities, which would require significant additional financial and management resources.
Changes in financial accounting standards may cause adverse unexpected revenue fluctuations and affect our reported results of operations.
A change in accounting policies can have a significant effect on our reported results and may even affect our reporting of transactions completed before the change is effective. New pronouncements and varying interpretations of existing pronouncements have occurred with frequency and may occur in the future. Changes to existing rules, or changes to the interpretations of existing rules could lead to changes in our accounting practices, and such changes could adversely affect our reported financial results or the way we conduct our business.
In September 2009, the Financial Accounting Standards Board (FASB) amended the accounting standards related to revenue recognition for arrangements with multiple deliverables and arrangements that include software elements (“new accounting principles”). The new accounting principles amend the scope provisions of the accounting guidance for software revenue recognition. The new accounting
29
Table of Contents
principles permit prospective or retrospective adoption, and we currently plan to elect prospective adoption during the first quarter of 2010. Because we intend to adopt the new accounting principles prospectively, our future revenues may be different than what would have been reported using the prior software accounting literature and this may make forecasting, or comparisons to historical results, more difficult. We expect that the majority of our product offerings will be considered non-software deliverables. New accounting principles frequently require significant judgments in their application, and are subject to numerous subsequent clarifications and interpretations, some of which may require changes in the way we recognize revenue and may require restatement of prior period revenue and results, either of which could adversely affect our reported results.
We are required to expense equity compensation given to our employees, which has reduced our reported earnings, will harm our operating results in future periods and may reduce our stock price and our ability to effectively utilize equity compensation to attract and retain employees.
We historically have used stock options, restricted stock units (RSU), and an employee stock purchase plan as significant components of our employee compensation program in order to align employees’ interests with the interests of our stockholders, encourage employee retention, and provide competitive compensation packages. The compensation charges that we are required to record related to these equity awards have reduced, and will continue to reduce, our reported earnings, will harm our operating results in future periods, and may require us to reduce the availability and amount of equity incentives provided to employees, which could make it more difficult for us to attract, retain and motivate key personnel. Moreover, if securities analysts, institutional investors and other investors adopt financial models that include stock option expense in their primary analysis of our financial results, our stock price could decline as a result of reliance on these models with higher expense calculations.
We may have exposure to greater than anticipated tax liabilities.
Our provision for income taxes is subject to volatility and could be adversely affected by nondeductible stock-based compensation, by the expiration of or lapse in the research and development tax credit laws, by earnings being lower than anticipated in jurisdictions where we have lower statutory rates and being higher than anticipated in jurisdictions where we have higher statutory rates, by changes in the valuation of our deferred tax assets and liabilities, changes in actual results versus our estimates, or changes in tax laws, regulations, accounting principles or interpretations thereof. In addition, like other companies, we may be subject to examination of our income tax returns by the Internal Revenue Service and other tax authorities. While we regularly assess the likelihood of adverse outcomes from such examinations and the adequacy of our provision for income taxes, there can be no assurance that such provision is sufficient and that a determination by a tax authority will not have an adverse effect on our results of operations.
If we fail to successfully manage our exposure to the volatility and economic uncertainty in the global financial marketplace, our operating results could be adversely impacted.
We are exposed to financial risk associated with the global financial markets, including volatility in interest rates and uncertainty in the credit markets. Our exposure to market rate risk for changes in interest rates relates primarily to our investment portfolio. The primary objective of our investment activities is to preserve principal, maintain adequate liquidity and portfolio diversification while at the same time maximizing yields without significantly increasing risk. However, the valuation of our investment portfolio is subject to uncertainties that are difficult to predict. Factors that may impact its valuation include changes to credit ratings of the securities that we hold, interest rate changes, the ongoing strength and quality, and recent instability, of the global credit market, and liquidity. If the carrying value of our investments exceeds the fair value, and the decline in fair value is deemed to be
30
Table of Contents
other-than-temporary, we will be required to write down the value of our investments. Additionally, instability and uncertainty in the financial markets, as was experienced in late 2008 through 2009, could result in the incurrence of significant realized or impairment losses associated with certain of our investments, which would reduce our net income.
If we need additional capital in the future, it may not be available to us on favorable terms, or at all.
We have historically relied on outside financing and cash flow from operations to fund our operations, capital expenditures and expansion. We may require additional capital from equity or debt financing in the future to fund our operations or respond to competitive pressures or strategic opportunities. We may not be able to secure timely additional financing on favorable terms, or at all. The terms of any additional financing may place limits on our financial and operating flexibility. If we raise additional funds through further issuances of equity, convertible debt securities or other securities convertible into equity, our existing stockholders could suffer significant dilution in their percentage ownership of our company, and any new securities we issue could have rights, preferences and privileges senior to those of holders of our common stock. If we are unable to obtain adequate financing or financing on terms satisfactory to us, if and when we require it, our ability to grow or support our business and to respond to business challenges could be significantly limited.
Our business is subject to the risks of earthquakes, fire, floods, pandemics and other natural catastrophic events, and to interruption by manmade problems such as computer viruses or terrorism.
Our main operations, including our primary data centers, are located in the San Francisco Bay Area, a region known for seismic activity. A significant natural disaster, such as an earthquake, fire or a flood, could harm our business, operating results and financial condition. In addition, our servers are vulnerable to computer viruses, break-ins and similar disruptions from unauthorized tampering with our computer systems. Acts of terrorism or war could also cause disruptions in our or our customers’ business or the economy as a whole. To the extent that such disruptions result in delays or cancellations of customer orders or the deployment of our products, our business, operating results and financial condition would be adversely affected.
Risks Related to Ownership of Our Common Stock
The trading price of our common stock has been volatile and is likely to be volatile in the future.
The trading prices of the securities of technology companies have been highly volatile. Further, our common stock has a limited trading history. Since our initial public offering in September 2006 through December 31, 2009, our stock price has fluctuated from a low of $7.10 to a high of $52.81. The market price of our common stock has at times reflected a higher multiple of expected future earnings than many other companies. As a result, even small changes in investor expectations regarding our future growth and earnings, whether as a result of actual or rumored financial or operating results, changes in the mix of products and services sold, acquisitions, industry changes, or other factors, could result in, and have in the past resulted in, significant fluctuations in the market price of our common stock.
Factors that could affect the trading price of our common stock include, but are not limited to:
| Ÿ | variations in our operating results; |
| Ÿ | announcements of technological innovations, new services or service enhancements, strategic alliances or significant agreements by us or by our competitors; |
31
Table of Contents
| Ÿ | the gain or loss of significant customers; |
| Ÿ | recruitment or departure of key personnel; |
| Ÿ | providing estimates of our future operating results, or changes of these estimates, either by us or by any securities analysts who follow our common stock, or changes in recommendations by any securities analysts who follow our common stock; |
| Ÿ | significant sales or purchases, or announcement of significant sales or purchases, of our common stock by us or our stockholders, including our directors and executive officers; |
| Ÿ | announcements by or about us regarding events or news adverse to our business; |
| Ÿ | market conditions in our industry, the industries of our customers and the economy as a whole; |
| Ÿ | adoption or modification of regulations, policies, procedures or programs applicable to our business; |
| Ÿ | an announced acquisition of or by a competitor; and |
| Ÿ | an announced acquisition of or by us. |
If the market for technology stocks or the stock market in general experiences loss of investor confidence, the trading price of our common stock could decline for reasons unrelated to our business, operating results or financial condition. The trading price of our common stock might also decline in reaction to events that affect other companies in our industry or the stock market generally even if these events do not directly affect us. Each of these factors, among others, could cause our stock price to decline. Some companies that have had volatile market prices for their securities have had securities class actions filed against them. If a suit were filed against us, regardless of its merits or outcome, it could result in substantial costs and divert management’s attention and resources.
If securities or industry analysts do not publish research or publish inaccurate or unfavorable research about our business, our stock price and trading volume could decline.
The trading market for our common stock will continue to depend in part on the research and reports that securities or industry analysts publish about us or our business. If we do not continue to maintain adequate research coverage or if one or more of the analysts who covers us downgrades our stock or publishes inaccurate or unfavorable research about our business, our stock price would likely decline. If one or more of these analysts ceases coverage of our company or fails to publish reports on us regularly, demand for our stock could decrease, which could cause our stock price and trading volume to decline.
Insiders have substantial control over us and will be able to influence corporate matters.
As of December 31, 2009, our directors and executive officers and their affiliates beneficially owned, in the aggregate, approximately 14.1% of our outstanding common stock. As a result, these stockholders will be able to exercise significant influence over all matters requiring stockholder approval, including the election of directors and approval of significant corporate transactions, such as a merger or other sale of our company or its assets. This concentration of ownership could limit your ability to influence corporate matters and may have the effect of delaying or preventing a third party from acquiring control over us.
Anti-takeover provisions in our charter documents and Delaware law could discourage, delay or prevent a change in control of our company and may affect the trading price of our common stock.
We are a Delaware corporation and the anti-takeover provisions of the Delaware General Corporation Law may discourage, delay or prevent a change in control by prohibiting us from engaging
32
Table of Contents
in a business combination with an interested stockholder for a period of three years after the person becomes an interested stockholder, even if a change in control would be beneficial to our existing stockholders. In addition, our restated certificate of incorporation and amended and restated bylaws contain provisions that may discourage, delay or prevent a change in our management or control over us that stockholders may consider favorable.
| Item 1B. | Unresolved Staff Comments |
None.
| Item 2. | Properties |
We lease approximately 85,000 square feet of office space in San Francisco, California pursuant to a lease that expires in 2014. In addition, we lease approximately 46,000 square feet of office space in Sunnyvale, California pursuant to a lease that expires in 2013. We maintain support centers in New York, the San Francisco Bay Area, Amsterdam, London, Singapore, Sydney and Tokyo, and sales offices in multiple locations worldwide. We believe that our current facilities are suitable and adequate to meet our current needs, and we intend to add new facilities or expand existing facilities as necessary.
| Item 3. | Legal Proceedings |
From time to time, we are subject to various legal proceedings, claims and litigation arising in the ordinary course of business. We do not believe we are party to any currently pending legal proceedings the outcome of which may have a material adverse effect on our financial position, results of operations or cash flows.
There can be no assurance that existing or future legal proceedings arising in the ordinary course of business or otherwise will not have a material adverse effect on our financial position, results of operations or cash flows.
| Item 4. | Submission of Matters to a Vote of Security Holders |
None.
33
Table of Contents
Part II
| Item 5. | Market for Registrant’s Common Equity, Related Stockholder Matters and Issuer Purchases of Equity Securities |
Market Information for Common Stock
Our common stock has traded on Nasdaq under the symbol “RVBD” since our initial public offering on September 20, 2006, first on the Nasdaq Global Market and, since January 1, 2008, on the Nasdaq Global Select Market. Prior to our initial public offering, there was no public market for our common stock.
The following table sets forth for the indicated periods the high and low sales prices of our common stock as reported by the Nasdaq Global Select Market.
| High | Low | |||||
| First Quarter 2008 |
$ | 28.36 | $ | 14.86 | ||
| Second Quarter 2008 |
$ | 18.44 | $ | 10.84 | ||
| Third Quarter 2008 |
$ | 18.68 | $ | 10.40 | ||
| Fourth Quarter 2008 |
$ | 13.51 | $ | 7.10 | ||
| First Quarter 2009 |
$ | 15.47 | $ | 8.85 | ||
| Second Quarter 2009 |
$ | 24.80 | $ | 12.93 | ||
| Third Quarter 2009 |
$ | 25.99 | $ | 18.17 | ||
| Fourth Quarter 2009 |
$ | 25.34 | $ | 19.62 | ||
The last reported sale price for our common stock on the Nasdaq Global Select Market was $24.98 per share on February 11, 2010.
Dividend Policy
We have never paid any cash dividends on our common stock. Our board of directors currently intends to retain any future earnings to support operations and to finance the growth and development of our business and does not intend to pay cash dividends on our common stock for the foreseeable future. Any future determination related to our dividend policy will be made at the discretion of our board of directors.
Stockholders
As of February 2, 2010, there were 98 registered stockholders of record of our common stock.
Stock Performance Graph
The graph set forth below compares the cumulative total stockholder return on our common stock between September 21, 2006 (the date of our initial public offering) and December 31, 2009, with the cumulative total return of (i) the Nasdaq Computer Index and (ii) the Nasdaq Composite Index, over the same period. This graph assumes the investment of $100 on September 21, 2006 in our common stock, the Nasdaq Computer Index and the Nasdaq Composite Index, and assumes the reinvestment of dividends, if any. We have never paid dividends on our common stock and have no present plans to do so. The graph assumes the initial value of our common stock on September 21, 2006 was the closing sales price of $15.30 per share.
34
Table of Contents
The comparisons shown in the graph below are based upon historical data and are not intended to suggest future performance. This performance graph shall not be deemed “filed” for purposes of Section 18 of the Securities Exchange Act of 1934, as amended (the “Exchange Act”), or incorporated by reference into any filing of ours under the Securities Act of 1933, as amended, or the Exchange Act, except as shall be expressly set forth by specific reference in such filing.
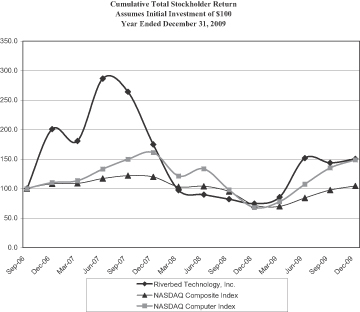
Recent Sales of Unregistered Securities
None.
Purchases of Equity Securities by the Issuer and Affiliated Purchasers
The following table summarizes the stock repurchase activity for the three months ended December 31, 2009 and the approximate dollar value of shares that may yet be purchased pursuant to our stock repurchase program:
| Period |
Total Number of Shares Purchased (1) |
Average Price Paid per Share |
Total Number of Shares Purchased as Part of Publicly Announced Program |
Maximum Approximate Dollar Value of Shares that May Yet be Purchased Under the Program (2) | ||||||
| October 1, 2009 — October 31, 2009 |
— | $ | — | — | $ | 21,016,000 | ||||
| November 1, 2009 — November 30, 2009 |
— | — | — | 21,016,000 | ||||||
| December 1, 2009 — December 31, 2009 |
— | — | — | 21,016,000 | ||||||
| Total |
— | $ | — | — | $ | 21,016,000 | ||||
| (1) | On April 21, 2008, our Board of Directors authorized a Share Repurchase Program, which authorizes us to repurchase up to $100.0 million of our outstanding common stock during a period not to exceed 24 months from the Board authorization date. |
| (2) | During the fourth quarter of 2009, we did not repurchase any shares of common stock under this Program. Shares are generally purchased in open market transactions. The timing and amounts of any purchases are based on market conditions and other factors including price, regulatory requirements and capital availability. The share repurchases are financed by available cash balances and cash from operations. |
35
Table of Contents
| Item 6. | Selected Financial Data |
The following selected consolidated financial data should be read in conjunction with our audited consolidated financial statements and related notes thereto and with Management’s Discussion and Analysis of Financial Condition and Results of Operations, which are included in this Annual Report on Form 10-K. The consolidated statement of operations data for the years ended December 31, 2009, 2008 and 2007, and the selected consolidated balance sheet data as of December 31, 2009 and 2008 are derived from, and are qualified by reference to, the audited consolidated financial statements included in this Annual Report on Form 10-K. The consolidated statement of operations data for the years ended December 31, 2006 and 2005, and the consolidated balance sheet data as of December 31, 2007, 2006 and 2005 are derived from audited consolidated financial statements, which are not included in this Annual Report on Form 10-K.
| Year ended December 31, | ||||||||||||||||||
| (in thousands, except per share amounts) |
2009 | 2008 | 2007 | 2006 | 2005 | |||||||||||||
| Consolidated Statement of Operations Data: |
||||||||||||||||||
| Revenue: |
||||||||||||||||||
| Product |
$ | 267,885 | $ | 252,929 | $ | 196,622 | $ | 77,298 | $ | 20,448 | ||||||||
| Support and services |
126,261 | 80,420 | 39,784 | 12,909 | 2,493 | |||||||||||||
| Total revenue |
394,146 | 333,349 | 236,406 | 90,207 | 22,941 | |||||||||||||
| Cost of revenue: |
||||||||||||||||||
| Cost of product (3) |
61,052 | 60,439 | 51,068 | 25,174 | 6,933 | |||||||||||||
| Cost of support and services |
37,916 | 28,175 | 14,856 | 4,978 | 1,661 | |||||||||||||
| Total cost of revenue (1) (3) |
98,968 | 88,614 | 65,924 | 30,152 | 8,594 | |||||||||||||
| Gross profit |
295,178 | 244,735 | 170,482 | 60,055 | 14,347 | |||||||||||||
| Operating expenses |
||||||||||||||||||
| Sales and marketing (1) (3) |
177,487 | 140,653 | 95,652 | 48,080 | 19,722 | |||||||||||||
| Research and development (1) (3) |
69,164 | 58,658 | 39,696 | 19,215 | 8,108 | |||||||||||||
| General and administrative (1) (3) |
38,080 | 38,669 | 24,834 | 9,294 | 3,531 | |||||||||||||
| Other charges (2) |
— | 11,000 | — | — | — | |||||||||||||
| Acquisition-related costs (3) |
104 | — | — | — | — | |||||||||||||
| Total operating expenses |
284,835 | 248,980 | 160,182 | 76,589 | 31,361 | |||||||||||||
| Operating income (loss) |
10,343 | (4,245 | ) | 10,300 | (16,534 | ) | (17,014 | ) | ||||||||||
| Total other income (expense), net |
1,042 | 6,514 | 9,733 | 992 | (77 | ) | ||||||||||||
| Income (loss) before income taxes |
11,385 | 2,269 | 20,033 | (15,542 | ) | (17,091 | ) | |||||||||||
| Provision (benefit) for income taxes |
4,300 | (8,332 | ) | 5,235 | 303 | 55 | ||||||||||||
| Income (loss) before cumulative change in accounting principle |
7,085 | 10,601 | 14,798 | (15,845 | ) | (17,146 | ) | |||||||||||
| Cumulative effect of change in accounting principle |
— | — | — | — | 280 | |||||||||||||
| Net income (loss) |
$ | 7,085 | $ | 10,601 | $ | 14,798 | $ | (15,845 | ) | $ | (17,426 | ) | ||||||
| Net income (loss) per share: |
||||||||||||||||||
| Basic |
$ | 0.10 | $ | 0.15 | $ | 0.22 | $ | (0.59 | ) | $ | (1.85 | ) | ||||||
| Diluted |
$ | 0.10 | $ | 0.14 | $ | 0.20 | $ | (0.59 | ) | $ | (1.85 | ) | ||||||
| Shares used in computing net income (loss) per common share: |
||||||||||||||||||
| Basic |
69,200 | 70,757 | 68,020 | 26,977 | 9,401 | |||||||||||||
| Diluted |
71,540 | 73,267 | 73,244 | 26,977 | 9,401 | |||||||||||||
36
Table of Contents
| (1) | Includes stock-based compensation and related payroll tax expenses as follows: |
| Year ended December 31, | |||||||||||||||
| (in thousands) |
2009 | 2008 | 2007 | 2006 | 2005 | ||||||||||
| Cost of product |
$ | 453 | $ | 182 | $ | 100 | $ | — | $ | — | |||||
| Cost of support and services |
4,540 | 4,493 | 2,579 | 520 | 40 | ||||||||||
| Sales and marketing |
25,453 | 23,632 | 15,616 | 4,636 | 482 | ||||||||||
| Research and development |
14,389 | 13,080 | 8,814 | 2,541 | 397 | ||||||||||
| General and administrative |
11,873 | 9,202 | 5,482 | 1,521 | 368 | ||||||||||
| Total stock-based compensation and related payroll tax expenses |
$ | 56,708 | $ | 50,589 | $ | 32,591 | $ | 9,218 | $ | 1,287 | |||||
| (2) | Settlement of Quantum litigation. See Note 16 of Notes to Consolidated Financial Statements for details. |
| (3) | Includes acquisition-related costs from amortization of purchased intangibles, contingent consideration to be paid to employees recorded as compensation expense, adjustments to the fair value of contingent consideration to be paid to stockholders and acquisition-related and integration costs as follows: |
| Year ended December 31, | |||||||||||||||
| (in thousands) |
2009 | 2008 | 2007 | 2006 | 2005 | ||||||||||
| Cost of product |
$ | 2,546 | $ | — | $ | — | $ | — | $ | — | |||||
| Sales and marketing |
2,535 | — | — | — | — | ||||||||||
| Research and development |
856 | — | — | — | — | ||||||||||
| General and administrative |
534 | — | — | — | — | ||||||||||
| Acquisition-related costs |
104 | — | — | — | — | ||||||||||
| Total Acquisition-related costs |
$ | 6,575 | $ | — | $ | — | $ | — | $ | — | |||||
| (in thousands) |
As of December 31, | |||||||||||||||
| 2009 | 2008 | 2007 | 2006 | 2005 | ||||||||||||
| Consolidated Balance Sheet Data |
||||||||||||||||
| Cash and cash equivalents, and marketable securities |
$ | 325,687 | $ | 267,776 | $ | 246,082 | $ | 109,329 | $ | 10,410 | ||||||
| Working capital |
281,965 | 254,079 | 243,640 | 102,195 | 6,411 | |||||||||||
| Total assets |
505,279 | 398,517 | 337,602 | 150,769 | 23,644 | |||||||||||
| Current and long-term debt |
— | — | — | — | 2,461 | |||||||||||
| Convertible preferred stock |
— | — | — | — | 36,385 | |||||||||||
| Common stock and additional paid-in-capital |
367,236 | 315,882 | 292,200 | 156,329 | 1,635 | |||||||||||
| Stockholders’ equity (deficit) |
352,307 | 293,829 | 259,718 | 108,980 | (29,911 | ) | ||||||||||
37
Table of Contents
| Item 7. | Management’s Discussion and Analysis of Financial Condition and Results of Operations |
The following discussion and analysis of our financial condition and results of operations should be read in conjunction with the consolidated financial statements and related notes included elsewhere in this Annual Report on Form 10-K. The information in this Annual Report on Form 10-K contains forward-looking statements within the meaning of Section 27A of the Securities Act, and Section 21E of the Exchange Act. Such statements are based upon current expectations that involve risks and uncertainties. Any statements contained herein that are not statements of historical facts may be deemed to be forward-looking statements. For example, words such as “may,” “will,” “should,” “estimates,” “predicts,” “potential,” “continue,” “strategy,” “believes,” “anticipates,” “plans,” “expects,” “intends” and similar expressions are intended to identify forward-looking statements. Our actual results and the timing of certain events may differ significantly from the results discussed in the forward-looking statements. Factors that might cause or contribute to such a discrepancy include, but are not limited to, those discussed elsewhere in this Annual Report on Form 10-K in the section titled “Risk Factors” and the risks discussed in our other SEC filings. We undertake no obligation to publicly release any revisions to the forward-looking statements after the date of this Annual Report on Form 10-K.
Overview
We were founded in May 2002 by experienced industry leaders with a vision to improve the performance of wide-area distributed computing. Having significant experience in caching technology, our executive management team understood that existing approaches failed to address adequately all of the root causes of this poor performance. We determined that these performance problems could be best solved by simultaneously addressing inefficiencies in software applications and wide area networks (WANs) as well as insufficient or unavailable bandwidth. This innovative approach served as the foundation of the development of our products. We began commercial shipments of our products in May 2004 and have since sold our products to over 7,300 customers worldwide. We now offer several product lines including Steelhead appliances, Central Management Console, Interceptor, Steelhead Mobile and Cascade products.
We are headquartered in San Francisco, California. Our personnel are located throughout the U.S. and in approximately thirty countries worldwide. We expect to continue to add personnel in the U.S. and internationally to provide additional geographic sales, research and development, general and administrative and technical support coverage.
Company Strategy
Our goal is to establish our solutions as the preeminent performance and efficiency standard for organizations relying on wide-area distributed computing. Key elements of our strategy include:
Maintain and extend our technological advantages
We believe that we offer the broadest ability to enable rapid, reliable access to applications and data for our customers. We intend to enhance our position as a leader and innovator in the WAN optimization market. We also intend to continue to sell new capabilities into our installed base. Continuing investments in research and development are critical to maintaining our technological advantage.
Enhance and extend our product line
We plan to introduce enhancements to our product capabilities in order to address our customers’ size and application requirements. We also plan to introduce new products to extend our market and utilize our technology platform to extend our capabilities.
38
Table of Contents
In August 2007, we began selling our Steelhead Mobile product line, which includes a software client version of our Steelhead appliances, which delivers LAN-like application performance to any employee laptop, whether on the road, working from home or connected wirelessly in the office.
In February 2008, we announced the introduction of the Riverbed Services Platform (RSP), which enables the delivery of virtualized edge services without the need to deploy additional physical servers at remote or branch offices. RSP allows customers to deploy services from an array of vendors on Steelhead appliances in a self-contained partition to minimize the hardware infrastructure footprint at the branch office.
In August 2008, we introduced the 50 series Steelhead appliances. The 50 series products represent the latest generation of our Steelhead appliances.
In February 2009, we acquired Mazu Networks, Inc. (Mazu). Mazu’s Cascade product line helps organizations manage, secure and optimize the availability and performance of global applications. The acquisition allows us to meet enterprise and service provider customer demands by extending our suite of WAN optimization products to include global application performance, reporting and analytics.
In October 2009, we introduced the Central Management Console — Virtual Edition (CMC-VE) designed for managed service providers (MSPs). The new capabilities of CMC-VE allow MSPs to reduce operational costs, improve visibility, easily scale and flexibly allocate management licenses to enterprise customers through its new multi-tenant capabilities. CMC-VE runs on VMWare ESX, and MSPs can deploy it on any existing server that has capacity.
Increase market awareness
To generate increased demand for our products, we will continue promoting our brand and the effectiveness of our comprehensive WAN optimization solution.
Scale our sales force and distribution channels
Growth in revenue and increase in share of market are key goals for us. We intend to expand our direct sales force and leverage our indirect channels to extend our geographic reach and market penetration. We sell our products directly through our sales force and indirectly through channel partners. We derived 92% of our revenue through indirect channels in 2009. We expect revenue from channel partners to continue to constitute a substantial majority of our future revenue. During 2009, we added 350 new reseller partners, seven large systems integrators and nine managed service providers. Also in 2009, we expanded our direct sales force presence in two new countries.
Enhance and extend our support and services capabilities
We plan to enhance and extend our support and services capabilities to continue to support our growing global customer base. In 2009, we increased our sales focus on service contract renewals on our existing customer base, developed and distributed training programs directed at our partners, and expanded our professional service offering.
Major Trends Affecting Our Financial Results
Company outlook
We believe that our current value proposition, which enables customers to improve the performance of their applications and access to their data across WANs, while also offering the ability to simplify IT infrastructure and realize significant capital and operating cost savings, should allow us to
39
Table of Contents
continue to grow our business. Our product revenue growth rate will depend significantly on continued growth in the WAN optimization market, and our ability to continue to attract new customers in that market and generate additional sales from existing customers. Our growth in support and services revenue is dependent upon increasing the number of products under support contracts, which is dependent on both growing our installed base of customers and renewing existing support contracts. Our future profitability and rate of growth will be directly affected by the continued acceptance of our products in the marketplace, as well as the timing and size of orders, product mix, average selling prices and costs of our products and general economic conditions. Our ability to achieve profitability in the future will also be affected by the extent to which we must incur additional expenses to expand our sales, support, marketing, development, and general and administrative capabilities to grow our business. The largest component of our expenses is personnel costs. Personnel costs consist of salaries, benefits and incentive compensation for our employees, including commissions for sales personnel and stock-based compensation.
Revenue
Our revenue has grown rapidly since we began shipping products in May 2004, increasing from $2.6 million in 2004 to $394.1 million in 2009. Revenue grew by 18% in 2009 to $394.1 million from $333.3 million in 2008. We believe that our revenue growth in 2009, when the global macroeconomic environment negatively impacted many businesses, is a positive sign that our products have a significant value proposition to our customers and that the WAN optimization market is still expanding despite the challenging macroeconomic environment.
Costs and Expenses
Operating expenses consist of sales and marketing, research and development, general and administrative expenses, and acquisition-related costs. Personnel-related costs, including stock-based compensation, are the most significant component of each of these expense categories. As of December 31, 2009, we had 1,013 employees, an increase of 18% from the 857 employees at December 31, 2008. The increase in employees is the most significant driver behind the increase in costs and operating expenses in 2009. The increase in employees was required to support our increased revenue. The timing of additional hires has and could materially affect our operating expenses, both in absolute dollars and as a percentage of revenue, in any particular period.
Stock-based Compensation Expense
Stock-based compensation expense and related payroll taxes were $56.7 million, $50.6 million, and $32.6 million in the years ended December 31, 2009, 2008, and 2007 respectively. We expect to continue to incur significant stock-based compensation expense and anticipate further growth in stock-based compensation expense as our employee base grows because we expect stock-based compensation to continue to play an important part in the overall compensation structure for our employees.
Stock-based compensation expense and related payroll tax was as follows:
| Year ended December 31, | |||||||||
| (in thousands) |
2009 | 2008 | 2007 | ||||||
| Cost of product |
$ | 453 | $ | 182 | $ | 100 | |||
| Cost of support and services |
4,540 | 4,493 | 2,579 | ||||||
| Sales and marketing |
25,453 | 23,632 | 15,616 | ||||||
| Research and development |
14,389 | 13,080 | 8,814 | ||||||
| General and administrative |
11,873 | 9,202 | 5,482 | ||||||
| Total stock-based compensation expense and related payroll taxes |
$ | 56,708 | $ | 50,589 | $ | 32,591 | |||
40
Table of Contents
Acquisition of Mazu
On February 19, 2009, we acquired Mazu Networks, Inc. We made an initial payment totaling $23.1 million in cash; and potentially will make additional payments totaling up to $22.0 million in cash based on achievement of certain bookings targets for the one-year period from April 1, 2009 through March 31, 2010. The estimated fair value of acquisition-related contingent consideration as of the acquisition date to be distributed directly to shareholders was recognized as part of the purchase price of Mazu. Changes in the fair value of this liability are recognized in earnings as acquisition-related costs in the period of the change in estimate. Actual achievement of bookings below $16.0 million would reduce the liability to zero and achievement of bookings of $35.0 million or more would increase the liability to $16.6 million. The achievement of actual bookings has been, and in the future could be, different than our estimates and could have a material effect on the fair value of the acquisition-related contingent consideration which will be recognized in earnings in the period of the change in estimate.
The fair value of the acquisition-related contingent consideration to be distributed directly to shareholders, originally estimated at the acquisition date at $9.9 million, discounted at 13%, excluded the fair value estimate of $3.8 million to be paid to former employees of Mazu. As of December 31, 2009, the estimated fair value of the contingent consideration recognized as a result of the acquisition of Mazu was reduced to $8.6 million, due to a reduction in management’s estimate of the probability-weighted bookings. The change in the estimated fair value of the acquisition-related contingent consideration resulted in a net gain of $1.3 million for the year ended December 31, 2009. The contractual earn-out formula is tiered with significant increases in consideration at each tier. If actual bookings achieve the next tier of consideration, the contingent consideration would increase by $2.2 million or more. If actual bookings do not achieve the next tier of consideration, the contingent consideration would decrease by $4.3 million. The resulting increase or decrease in the acquisition-related contingent consideration will be recognized in earnings during the three months ended March 31, 2010.
The estimated fair value of the acquisition-related contingent consideration to be paid to former employees of Mazu (“acquisition-related compensation costs”) is considered compensatory, which has been and will continue to be recognized over the service period from February 19, 2009 to March 31, 2010. During the year ended December 31, 2009, we recognized $2.4 million of acquisition-related compensation costs. If actual bookings achieve the next tier of consideration per the earn-out formula, the acquisition-related compensation costs would increase by $0.6 million, or more. If actual bookings do not achieve the next tier of consideration, the acquisition-related compensation costs would decrease by $1.4 million. The adjusted remaining unamortized acquisition-related compensation costs will be recognized in earnings during the three months ended March 31, 2010.
The results of operations of Mazu are included in our consolidated results for the period subsequent to the acquisition date of February 19, 2009. In the year ended December 31, 2009, we recognized $9.7 million in revenue from Mazu products and services and recorded $12.9 million in operating expenses, which includes the costs of assuming 60 former Mazu employees.
The following table summarizes the amortization of intangibles recognized in the twelve months ended December 31, 2009:
| (in thousands) |
Year ended December 31, 2009 | ||
| Cost of product |
$ | 2,546 | |
| Sales and marketing |
1,565 | ||
| Total amortization of intangibles |
$ | 4,111 | |
41
Table of Contents
The following table summarizes the acquisition-related compensation costs recognized in operating expenses, and the acquisition-related costs for the twelve months ended December 31, 2009:
| (in thousands) |
Year ended December 31, 2009 | ||
| Sales and marketing |
$ | 970 | |
| Research and development |
856 | ||
| General and administrative |
534 | ||
| Total acquisition-related compensation costs |
2,360 | ||
| Acquisition-related costs |
104 | ||
| Total |
$ | 2,464 | |
Critical Accounting Policies and Estimates
Our consolidated financial statements are prepared in accordance with U.S. generally accepted accounting principles (GAAP). These accounting principles require us to make certain estimates and judgments that can affect the reported amounts of assets and liabilities as of the date of the consolidated financial statements, as well as the reported amounts of revenue and expenses during the periods presented. We believe that the estimates and judgments upon which we rely are reasonable based upon information available to us at the time that these estimates and judgments are made. To the extent there are material differences between these estimates and actual results, our consolidated financial statements could be adversely affected.
The accounting policies that reflect our more significant estimates, judgments and assumptions and which we believe are the most critical to aid in fully understanding and evaluating our reported financial results include the following: revenue recognition, stock-based compensation, accounting for business combinations, accounting for income taxes, inventory valuation and allowances for doubtful accounts. Our critical accounting policies have been discussed with the Audit Committee of the Board of Directors.
Revenue Recognition
For a majority of our products, our software is generally integrated on appliance hardware and functions together with the appliance hardware to provide the essential functionality of the product. As a result, we account for revenue in accordance with Financial Accounting Standards Board (FASB) Accounting Standards Codification (ASC) Topic 985, Software, for all transactions involving the sale of software. We recognize product revenue when all of the following have occurred: (1) we have entered into a legally binding arrangement with a customer; (2) delivery has occurred, which is when product title transfers to the customer; (3) customer payment is deemed fixed or determinable and free of contingencies and significant uncertainties; and (4) collection is probable.
Product revenue consists of revenue from sales of our appliances and software licenses. Product sales include a perpetual license to our software. Product revenue is generally recognized upon transfer of title at shipment, assuming all other revenue recognition criteria are met. Shipping charges billed to customers are included in product revenue and the related shipping costs are included in cost of product revenue. Product revenue on sales to channel partners is recorded once we have received persuasive evidence of an end-user and all other revenue recognition criteria have been met.
Substantially all of our product sales have been sold in combination with support services, which consist of software updates and support. Software updates provide customers with rights to unspecified software product upgrades and to maintenance releases and patches released during the
42
Table of Contents
term of the support period. Support includes access to technical support personnel and content via the internet and telephone. Support services also include an extended warranty for the repair or replacement of defective hardware. Revenue for support services is recognized on a straight-line basis over the service contract term, which is typically one year.
We use the residual method to recognize revenue when a product agreement includes one or more elements to be delivered at a future date and vendor specific objective evidence (VSOE) of the fair value of all undelivered elements exists. Through December 31, 2009, in virtually all of our contracts, the only element that remained undelivered at the time of delivery of the product was support and updates. Under the residual method, the fair value of the undelivered elements is deferred and the remaining portion of the contract fee is recognized as product revenue. If evidence of the fair value of one or more undelivered elements does not exist, all revenue is generally deferred and recognized when delivery of those elements occurs or when fair value can be established. When the undelivered element for which we do not have VSOE of fair value is support, revenue for the entire arrangement is bundled and recognized ratably over the support period. VSOE of fair value for elements of an arrangement is based upon the normal pricing and discounting practices for those services when sold separately, and VSOE for support services is measured by the renewal rate offered to the customer.
Our fees are typically considered to be fixed or determinable at the inception of an arrangement, generally based on specific products and quantities to be delivered. Substantially all of our contracts do not include rights of return or acceptance provisions. To the extent that our agreements contain such terms, we recognize revenue once the acceptance provisions or right of return lapses. Payment terms to customers generally range from net 30 to 60 days. In the event payment terms are provided that differ from our standard business practices, the fees are deemed to not be fixed or determinable and revenue is recognized when the payments become due, provided the remaining criteria for revenue recognition have been met.
We assess the ability to collect from our customers based on a number of factors, including credit worthiness of the customer and past transaction history of the customer. If the customer is not deemed credit worthy, we defer revenue from the arrangement until payment is received and all other revenue recognition criteria have been met.
Stock-Based Compensation
Stock-based awards granted include stock options, restricted stock units (RSUs), and stock purchased under our Employee Stock Purchase Plan (the “Purchase Plan”). Stock-based compensation cost is measured at the grant date, based on the fair value of the awards, and is recognized as expense over the requisite service period. The cash flows resulting from the tax benefits due to tax deductions in excess of the compensation cost recognized for those options (excess tax benefit) are classified as financing activities within our statement of cash flows.
Accounting for Business Combinations
In our business combinations, we are required to recognize the assets acquired, liabilities assumed, contractual contingencies, and contingent consideration at their fair value on the acquisition date. The purchase price allocation process requires management to make significant estimates and assumptions, especially at acquisition date with respect to intangible assets, estimated contingent consideration payments and pre-acquisition contingencies.
Although we believe the assumptions and estimates we have made have been reasonable and appropriate, they are based in part on historical experience and information obtained from the
43
Table of Contents
management of the acquired company and are inherently uncertain. Examples of critical estimates in accounting for acquisitions include but are not limited to:
| Ÿ | the estimated fair value of the acquisition-related contingent consideration, which is performed using a probability-weighted discounted cash flow model based upon the forecasted achievement of post acquisition bookings targets; |
| Ÿ | the future expected cash flows from product sales, support agreements, consulting contracts, other customer contracts and acquired developed technologies and patents; and |
| Ÿ | the discount rates. |
Unanticipated events and circumstances may occur which may affect the accuracy or validity of such assumptions, estimates or actual results. Additionally, any change in the fair value of the acquisition-related contingent consideration subsequent to the acquisition date, including changes from events after the acquisition date, such as changes in our estimate of the bookings that are expected to be achieved, will be recognized in earnings in the period of the estimated fair value change. A change in fair value of the acquisition-related contingent consideration could have a material affect on the statement of operations and financial position in the period of the change in estimate.
Goodwill, Intangible Assets and Impairment Assessments
Goodwill represents the excess of the purchase price of an acquired business over the fair value of the underlying net tangible and intangible assets. Goodwill is tested for impairment at least annually during the fourth quarter (and more frequently if certain indicators are present). In the event that we determine that the carrying value of our single reporting unit is less than the reporting unit’s fair value, we will incur an impairment charge for the amount of the difference during the quarter in which the determination is made. We performed our annual review of goodwill in the fourth quarter of 2009 and concluded that no impairment existed at December 31, 2009.
Intangible assets that are not considered to have an indefinite life are amortized over their useful lives. Each period we evaluate the estimated remaining useful life of purchased intangible assets and whether events or changes in circumstances warrant a revision to the remaining period of amortization. The carrying amounts of these assets are periodically reviewed for impairment whenever events or changes in circumstances indicate that the carrying value of these assets may not be recoverable. Recoverability of these assets is measured by comparison of the carrying amount of each asset to the future undiscounted cash flows the asset is expected to generate. In the event that we determine certain assets are not fully recoverable, we will incur an impairment charge for those assets or portion thereof during the quarter in which the determination is made.
Accounting for Income Taxes
We use the asset and liability method of accounting for income taxes. Under this method, income tax expenses or benefits are recognized for the amount of taxes payable or refundable for the current year and for deferred tax liabilities and assets for the future tax consequences of events that have been recognized in our consolidated financial statements or tax returns. The measurement of current and deferred tax assets and liabilities are based on provisions of currently enacted tax laws. The effects of future changes in tax laws or rates are not contemplated.
As part of the process of preparing our consolidated financial statements, we are required to estimate our income tax expense and tax contingencies in each of the tax jurisdictions in which we operate. This process involves estimating current income tax expense together with assessing temporary differences in the treatment of items for tax purposes versus financial accounting purposes
44
Table of Contents
that may create net deferred tax assets and liabilities. We rely on estimates and assumptions in preparing our income tax provision including forecasted annual income.
We consider many factors when assessing the likelihood of future realization of our deferred tax assets, including our recent earnings experience by jurisdiction, expectations of future taxable income, and the carryforward periods available to us for tax reporting purposes, as well as other relevant factors. We may establish a valuation allowance to reduce deferred tax assets to the amount we believe is more likely than not to be realized. Due to inherent complexities arising from the nature of our businesses, future changes in income tax law, or variances between our actual and anticipated operating results, we make certain judgments and estimates. Therefore, actual income taxes could materially vary from these estimates. As part of our accounting for business combinations, a portion of the purchase price was allocated to goodwill and intangible assets. Amortization expenses associated with acquired intangible assets are generally not tax deductible; however, deferred taxes have been recorded for non-deductible amortization expenses as a part of the purchase price allocation. In the event of an impairment charge associated with goodwill, such charges are generally not tax deductible and would increase the effective tax rate in the quarter any impairment is recorded.
We are subject to periodic audits by the Internal Revenue Service and other taxing authorities. These audits may challenge certain tax positions we have taken, such as the timing and amount of deductions and allocation of taxable income to the various tax jurisdictions. Income tax contingencies are accounted for in accordance with authoritative guidance, and may require significant management judgment in estimating final outcomes. Actual results could materially differ from these estimates and could significantly affect the effective tax rate and cash flows in future years.
Inventory Valuation
Inventory consists of hardware and related component parts and is stated at the lower of cost (on a first-in, first-out basis) or market. A portion of our inventory relates to evaluation units located at customer locations, as some of our customers test our equipment prior to purchasing. Inventory that is obsolete or in excess of our forecasted demand is written down to its estimated realizable value based on historical usage, expected demand, and with respect to evaluation units, the historical conversion rate, age of the units and the estimated loss of utility. Inherent in our estimates of market value in determining inventory valuation are estimates related to economic trends, future demand for our products, the timing of new product introductions and technological obsolescence of our products. Inventory write-downs are reflected as cost of product and amounted to $4.9 million, $6.0 million and $1.1 million in the years ended December 31, 2009, 2008 and 2007, respectively.
Allowances for Doubtful Accounts
We make judgments as to our ability to collect outstanding receivables and provide allowances for the applicable portion of receivables when collection becomes doubtful. Provisions are made based upon a specific review of all significant outstanding receivables. For those receivables not specifically reviewed, provisions are provided at differing rates, based upon the age of the receivable. In determining these percentages, we analyze our historical collection experience and current economic trends. If the historical data we use to calculate the allowance for doubtful accounts does not reflect the future ability to collect outstanding receivables, additional provisions for doubtful accounts may be needed and the future results of operations could be materially affected. The allowance for doubtful accounts was $1.7 million and $0.8 million at December 31, 2009 and 2008, respectively.
45
Table of Contents
Results of Operations
Revenue
We derive our revenue from sales of our appliances and software licenses and from support and services. Product revenue primarily consists of revenue from sales of our Steelhead products and is typically recognized upon shipment. Support and services revenue includes unspecified software license updates and product support. Support revenue is recognized ratably over the contractual period, which is typically one year. Service revenue includes professional services and training, which to date has not been significant, and is recognized as the services are performed.
| Year ended December 31, | |||||||||
| (dollars in thousands) |
2009 | 2008 | 2007 | ||||||
| Total Revenue |
$ | 394,146 | $ | 333,349 | $ | 236,406 | |||
| Total Revenue by Type: |
|||||||||
| Product |
$ | 267,885 | $ | 252,929 | $ | 196,622 | |||
| Support and services |
$ | 126,261 | $ | 80,420 | $ | 39,784 | |||
| % Revenue by Type: |
|||||||||
| Product |
68% | 76% | 83% | ||||||
| Support and services |
32% | 24% | 17% | ||||||
| Total Revenue by Geography: |
|||||||||
| United States |
$ | 221,206 | $ | 193,190 | $ | 148,171 | |||
| Europe, Middle East and Africa |
$ | 104,990 | $ | 87,446 | $ | 49,571 | |||
| Rest of the World |
$ | 67,950 | $ | 52,713 | $ | 38,664 | |||
| % Revenue by Geography: |
|||||||||
| United States |
56% | 58% | 63% | ||||||
| Europe, Middle East and Africa |
27% | 26% | 21% | ||||||
| Rest of the World |
17% | 16% | 16% | ||||||
| Total Revenue by Sales Channel: |
|||||||||
| Direct |
$ | 29,915 | $ | 27,703 | $ | 26,046 | |||
| Indirect |
$ | 364,231 | $ | 305,646 | $ | 210,360 | |||
| % Revenue by Sales Channel: |
|||||||||
| Direct |
8% | 8% | 11% | ||||||
| Indirect |
92% | 92% | 89% | ||||||
2009 Compared to 2008: Product revenue increased by 6% in 2009 due primarily to an increase in unit volume from increasing sales to existing customers and the addition of new customers. As of December 31, 2009, our products had been sold to over 7,300 customers, compared to approximately 5,500 as of December 31, 2008. We believe the market for our products has grown due to increased market awareness of WAN optimization services and distributed organizations, which increases dependence on timely access to data and applications.
Substantially all of our customers purchase support when they purchase our products. The increase in support and services revenue on an absolute basis and as a percentage of total revenues is a result of a larger installed base due to increased product and first year support sales combined with an increase in the renewal rate of support contracts by existing customers. As our customer base grows, we expect the proportion of revenue generated from support and services to increase; however, after increasing our renewal rate over the past year, we expect the renewal rate to remain level.
In each of the years ended December 31, 2009 and 2008, we derived 92% of our revenue from indirect channels. We expect indirect channel revenue to continue to be a substantial majority of our revenue.
46
Table of Contents
We generated 44% of our revenue in the year ended December 31, 2009 from international locations, compared to 42% in the year ended December 31, 2008. We continue to expand into international locations and introduce our products in new markets and expect international revenue to increase in dollar amount over time.
2008 Compared to 2007: Product revenue increased in 2008 due primarily to an increase in unit volume from increasing sales to existing customers and the addition of new customers. As of December 31, 2008, our products had been sold to over 5,500 customers, compared to approximately 3,500 as of December 31, 2007. The increase in support and services revenue on an absolute basis and as a percentage of total revenues is a result of increased product and first year support sales combined with the renewal of support contracts by existing customers. As our customer base grows, we expect the proportion of revenue generated from support and services to increase.
In the year ended December 31, 2008, we derived 92% of our revenue from indirect channels compared to 89% in the year ended December 31, 2007.
We generated 42% of our revenue in the year ended December 31, 2008 from international locations, compared to 37% in the year ended December 31, 2007.
Cost of Revenue and Gross Margin
Cost of product revenue consists of the costs of the appliance hardware, manufacturing, shipping and logistics costs and expenses for inventory obsolescence and warranty obligations. We utilize third parties to assist in the design of and to manufacture our appliance hardware, embed our proprietary software and perform shipping logistics. Cost of support and service revenue consists of personnel costs of technical support and professional services personnel, spare parts and logistics services. As we expand internationally and into other sectors, we may incur additional costs to conform our products to comply with local laws or local product specifications. In addition, as we expand internationally, we will continue to hire additional technical support personnel to support our growing international customer base.
Our gross margin has been and will continue to be affected by a variety of factors, including the mix and average selling prices of our products, new product introductions and enhancements, the cost of our appliance hardware, expenses for inventory obsolescence and warranty obligations, cost of support and service personnel, and the mix of distribution channels through which our products are sold.
| Year ended December 31, | |||||||||
| (dollars in thousands) |
2009 | 2008 | 2007 | ||||||
| Revenue: |
|||||||||
| Product |
$ | 267,885 | $ | 252,929 | $ | 196,622 | |||
| Support and services |
126,261 | 80,420 | 39,784 | ||||||
| Total revenue |
394,146 | 333,349 | 236,406 | ||||||
| Cost of revenue: |
|||||||||
| Cost of product |
61,052 | 60,439 | 51,068 | ||||||
| Cost of support and services |
37,916 | 28,175 | 14,856 | ||||||
| Total cost of revenue |
98,968 | 88,614 | 65,924 | ||||||
| Gross profit |
$ | 295,178 | $ | 244,735 | $ | 170,482 | |||
| Gross margin for product |
77% | 76% | 74% | ||||||
| Gross margin for support and services |
70% | 65% | 63% | ||||||
| Total gross margin |
75% | 73% | 72% | ||||||
47
Table of Contents
2009 Compared to 2008: The increase in cost of product revenue was due primarily to increased unit volume associated with higher revenue. The increase in cost of product revenue was primarily due to increased manufacturing overhead of $3.7 million, and amortization of acquisition related intangibles of $2.5 million. Manufacturing overhead includes costs of manufacturing personnel and related costs, logistics services, and royalties. These increases were offset by lower per unit purchase price of product of $2.4 million, lower inventory write-downs of $1.1 million, lower warranty related costs of $0.6 million, and lower shipping costs of $0.9 million.
Cost of support and services revenue increased as we added more technical support headcount domestically and abroad to support our growing customer base. Technical support and services headcount was 136 employees as of December 31, 2009 compared to 110 employees as of December 31, 2008. Additionally, costs related to freight, logistics, and inventory consumption increased due to increased infrastructure to support the increased installed base.
Product gross margins increased to 77% in the year ended December 31, 2009 from 76% in the year ended December 31, 2008 primarily due lower unit product costs, lower inventory write-downs, lower warranty costs which were partially offset by higher manufacturing overhead and acquisition related intangible amortization. Gross margins for support and services increased to 70% as a result of revenues increasing at a higher rate than support and services costs.
2008 Compared to 2007: The increase in cost of product revenue was due primarily to increased unit volume associated with higher revenue. Cost of product revenue in the year ended December 31, 2008 also includes $6.0 million of a write-down of inventory on hand in excess of forecasted demand compared to inventory obsolescence costs in the year ended December 30, 2007 of $1.1 million. The increase in the write-down of inventory is related to the write down of legacy inventory as we transition to the 50 series Steelhead appliances. Cost of support and services revenue increased as we added more technical support headcount domestically and abroad to support our growing customer base. Technical support and services headcount was 110 employees as of December 31, 2008 compared to 69 employees as of December 31, 2007.
Gross margins increased to 73% in the year ended December 31, 2008 from 72% in the year ended December 31, 2007 primarily due to higher margins on product revenue primarily as a result of lower unit product costs as well as a favorable product mix partially offset by the write-down of inventory. Gross margins for support and services increased to 65% as a result of revenues increasing at a higher rate than support and services costs. This increase was slightly offset by a decrease in support margins of approximately 2% as a result of increased stock-based compensation, which was $4.5 million in the year ended December 31, 2008, compared to $2.6 million in the year ended December 31, 2007.
Sales and Marketing Expenses
Sales and marketing expenses represent the largest component of our operating expenses and include personnel costs, sales commissions, marketing programs and facilities costs. Marketing programs are intended to generate revenue from new and existing customers, and are expensed as incurred. We plan to continue to make investments in sales and marketing with the intent to add new customers and increase penetration within our existing customer base by increasing the number of sales personnel worldwide, expanding our domestic and international sales and marketing activities, increasing channel penetration, building brand awareness and sponsoring additional marketing events. We expect future sales and marketing expenses to continue to increase and continue to be our most significant operating expense. Generally, sales personnel are not immediately productive and sales and marketing expenses do not immediately result in increased revenue. Hiring additional sales personnel reduces short-term operating margins until the sales personnel become productive and
48
Table of Contents
generate revenue. Accordingly, the timing of sales personnel hiring and the rate at which they become productive will affect our future performance.
| Year ended December 31, | |||||||||
| (dollars in thousands) |
2009 | 2008 | 2007 | ||||||
| Sales and marketing expenses |
$ | 177,487 | $ | 140,653 | $ | 95,652 | |||
| Percent of total revenue |
45% | 42% | 40% | ||||||
2009 Compared to 2008: Sales and marketing expenses increased by $36.8 million, or 26%, in the year ended December 31, 2009 compared to the year ended December 31, 2008 primarily due to an increase in the number of sales and marketing employees, as sales and marketing headcount grew to 468 employees as of December 31, 2009 from 404 employees as of December 31, 2008, including 27 Mazu employees. The increase in employees resulted in higher salary expense and employee related benefits. Additionally, commission expense increased in the year ended December 31, 2009 as compared to the year ended December 31, 2008 due to increased revenue, higher attainment of targets and an increase in personnel. Salaries and related benefits, bonuses and commissions accounted for $20.8 million, marketing related activities accounted for $3.1 million, facilities and information technology expenses accounted for $2.0 million, travel and entertainment expenses accounted for $1.1 million, and bad debt expense accounted for $1.2 million of the $36.8 million increase in sales and marketing expenses. Stock-based compensation and related payroll tax expense was $25.5 million in the year ended December 31, 2009 compared to $23.6 million in the year ended December 31, 2008. In addition, in the year ended December 31, 2009, amortization of acquisition-related intangibles and compensation expense of acquisition-related contingent consideration to be paid to former employees of Mazu accounted for $1.6 million and $1.0 million of the increase, respectively.
2008 Compared to 2007: The increase in sales and marketing expenses was primarily due to an increase in the number of sales and marketing employees, as sales and marketing headcount grew to 404 employees as of December 31, 2008 from 285 employees as of December 31, 2007. The increase in employees resulted in higher salary expense and employee related benefits. Additionally, commission expense increased in the year ended December 31, 2008 as compared to the year ended December 31, 2007 due to increased revenue and personnel. Salaries and related benefits, bonuses and commissions accounted for $24.4 million, marketing related activities accounted for $2.8 million, facilities and information technology expenses accounted for $3.2 million and travel and entertainment expenses accounted for $3.3 million of the $45.0 million increase in sales and marketing expenses. Stock-based compensation and related payroll tax expense was $23.6 million in the year ended December 31, 2008 compared to $15.6 million in the year ended December 31, 2007.
Research and Development Expenses
Research and development expenses primarily include personnel costs and facilities costs. We expense research and development expenses as incurred. We are devoting substantial resources to the continued development of additional functionality for existing products and the development of new products. We intend to continue to invest significantly in our research and development efforts because we believe they are essential to maintaining our competitive position. Investments in research and development personnel costs are expected to increase in dollar amount.
| Year ended December 31, | |||||||||
| (dollars in thousands) |
2009 | 2008 | 2007 | ||||||
| Research and development expenses |
$ | 69,164 | $ | 58,658 | $ | 39,696 | |||
| Percent of total revenue |
18% | 18% | 17% | ||||||
49
Table of Contents
2009 Compared to 2008: Research and development expenses increased by $10.5 million, or 18%, in the year ended December 31, 2009 compared to the year ended December 31, 2008 due to an increase in personnel and facility-related costs as a result of research and development headcount increasing to 271 employees as of December 31, 2009 from 240 employees as of December 31, 2008, including 26 Mazu employees. Salaries, bonuses and related benefits accounted for $6.4 million and facilities and related costs accounted for $1.2 million of the $10.5 million increase in research and development expenses. Stock-based compensation and related payroll tax expense was $14.4 million in the year ended December 31, 2009 compared to $13.1 million in the year ended December 31, 2008. Compensation expenses of acquisition-related contingent consideration to be paid to former employees of Mazu were $0.9 million in the year ended December 31, 2009. We plan to continue to invest in research and development as we develop new products and make further enhancements to existing products.
2008 Compared to 2007: Research and development expenses increased in the year ended December 31, 2008 compared to the year ended December 31, 2007 due to an increase in personnel and facility-related costs as a result of research and development headcount increasing to 240 employees as of December 31, 2008 from 181 employees as of December 31, 2007. Salaries, bonuses and related benefits accounted for $9.0 million and facilities and related costs accounted for $2.3 million of the $19.0 million increase in research and development expenses. Stock-based compensation and related payroll tax expense was $13.1 million in the year ended December 31, 2008 compared to $8.8 million in the year ended December 31, 2007.
General and Administrative Expenses
General and administrative expenses consist primarily of compensation for personnel and facilities costs related to our executive, finance, human resources, information technology and legal organizations, and fees for professional services. Professional services include outside legal, audit and information technology consulting costs.
| Year ended December 31, | |||||||||
| (dollars in thousands) |
2009 | 2008 | 2007 | ||||||
| General and administrative expenses |
$ | 38,080 | $ | 38,669 | $ | 24,834 | |||
| Percent of total revenue |
10% | 12% | 11% | ||||||
2009 Compared to 2008: General and administrative expenses decreased by $0.6 million, or 2%, in the year ended December 31, 2009 compared to the year ended December 31, 2008 due to a decrease in legal fees incurred to defend intellectual property (IP) litigation that was settled in the third quarter of 2008, offset by an increase in personnel costs, primarily as a result of headcount increasing to 120 employees as of December 31, 2009 from 98 employees as of December 31, 2008. Of the $0.6 million decrease in general and administrative expenses, legal fees decreased $4.8 million offset by an increase in salaries, bonuses and related benefits of $2.0 million. Legal fees associated with the IP litigation were zero in the year ended December 31, 2009 compared to $4.1 million in the year ended December 31, 2008. Stock-based compensation and related payroll tax expense was $11.9 million in the year ended December 31, 2009 compared to $9.2 million in the year ended December 31, 2008.
2008 Compared to 2007: The increase in general and administrative expenses for the year ended December 31, 2008 compared to the year ended December 31, 2007 is due to an increase in personnel costs, primarily as a result of headcount increasing to 98 employees as of December 31, 2008 from 83 employees as of December 31, 2007, and an increase in professional services fees. Salaries, bonuses and related benefits accounted for $3.2 million and professional service fees accounted for approximately $5.0 million of the $13.8 million increase in general and administrative expenses. Professional service fees increased primarily due to increased IP related legal fees associated with IP litigation. Legal fees associated with the IP litigation were $4.1 million in the year
50
Table of Contents
ended December 31, 2008 compared to zero in the year ended December 31, 2007. Stock-based compensation and related payroll tax expense was $9.2 million in the year ended December 31, 2008 compared to $5.5 million in the year ended December 31, 2007.
Other charges
During the year ended December 31, 2008, we entered into a mutual release and settlement agreement (the “Settlement Agreement”) with Quantum Corporation (“Quantum”) and certain affiliates of Quantum, pursuant to which we jointly executed and filed dismissals of patent infringement actions brought in the United States District Court for the Northern District of California. Pursuant to the terms of the Settlement Agreement, we paid Quantum a lump sum of $11.0 million, and entered into a perpetual covenant not to sue each other or certain other parties related to the patents in question and certain patents related to data de-duplication as well as a three-year covenant not to file any patent infringement lawsuits against each other or certain other parties. In addition, we released each other from any and all claims, demands, losses, liabilities and causes of action relating to any infringement of any patent based on acts occurring prior to the date of the Settlement Agreement. Based on the terms of the Settlement Agreement we recorded operating expense of $11.0 million during 2008. No such expenses were incurred in 2009 or 2007.
Acquisition-Related Costs
Acquisition-related costs include changes in the fair value of the acquisition-related contingent consideration, transaction costs and integration-related costs. As of December 31, 2009, the estimated fair value of the contingent consideration recognized as a result of the acquisition of Mazu was reduced to $8.6 million from our acquisition date estimated fair value of $9.9 million, primarily due to a reduction in the probability-weighted bookings estimate. The change in the estimated fair value of the acquisition-related contingent consideration resulted in a net gain of $1.3 million for the year ended December 31, 2009. During the year ended December 31, 2009, we also recorded transaction costs such as legal, accounting, valuation and other professional services of $0.6 million and integration-related costs of $0.8 million.
The following table summarizes the acquisition-related costs, including changes in the estimated fair value of the acquisition-related contingent consideration to be distributed directly to shareholders of Mazu, transaction costs and integration-related costs, recognized in the year ended December 31, 2009.
| (in thousands) |
Year ended December 31, 2009 |
|||
| Transaction costs |
$ | 595 | ||
| Severance |
412 | |||
| Integration costs |
364 | |||
| Change in fair value of acquisition-related contingent consideration |
(1,267 | ) | ||
| Acquisition-related costs |
$ | 104 | ||
51
Table of Contents
Other Income (Expense), Net
Other income (expense), net consists primarily of interest income on our cash and marketable securities, interest expense, and foreign currency exchange losses. Cash has historically been invested in highly liquid investments such as time deposits held at major banks, commercial paper, U.S. government agency discount notes, money market mutual funds and other money market securities with maturities at the date of purchase of 90 days or less.
| Year ended December 31, | ||||||||||||
| (in thousands) |
2009 | 2008 | 2007 | |||||||||
| Interest income |
$ | 1,945 | $ | 6,806 | $ | 10,068 | ||||||
| Other |
(903 | ) | (292 | ) | (335 | ) | ||||||
| Total other income, net |
$ | 1,042 | $ | 6,514 | $ | 9,733 | ||||||
2009 Compared to 2008: Other income (expense), net, decreased in the year ended December 31, 2009 due to decreased interest income on cash and marketable securities balances as a result of declining interest rates. Weighted average interest rates applicable to our cash and marketable securities balances decreased to 0.7% in the year ended December 31, 2009 compared to 2.6% in the year ended December 31, 2008. Other expense in the year ended December 31, 2009 and 2008 consists primarily of foreign currency losses.
2008 Compared to 2007: Other income (expense), net, decreased in the year ended December 31, 2008 due to decreased interest income on cash and marketable securities balances as a result of declining interest rates. Weighted average interest rates applicable to our cash and marketable securities balances decreased to 2.6% in the year ended December 31, 2008 compared to 5.0% in the year ended December 31, 2007. Other expense in the year ended December 31, 2008 and 2007 consists primarily of foreign currency losses.
Provision (Benefit) for Income Taxes
The provision (benefit) for income taxes was $4.3 million, ($8.3) million, and $5.2 million for the years ended December 31, 2009, 2008, and 2007, respectively. Our income tax provision (benefit) consists of federal, foreign, and state income taxes. Our effective tax rate was 38%, (367%), and 26% for the years ended December 31, 2009, 2008, and 2007, respectively.
The increase in the effective tax rate for 2009 as compared to 2008 was primarily the result of the income tax benefit recorded in 2008 associated with the reversal of the valuation allowance against our domestic deferred tax assets.
Our effective tax rate differs from the federal statutory rate due to state taxes, significant permanent differences and the change in our valuation allowances on our net deferred tax assets. Significant permanent differences arise from the portion of stock-based compensation expense that is not expected to generate a tax deduction, such as stock compensation expense on grants to certain foreign employees, our purchase plan and incentive stock options, offset by the actual tax benefits in the current periods from disqualifying dispositions of those shares.
For years prior to 2008, we recorded a full valuation allowance because of the uncertainty of the realization of the deferred tax assets. Realization of our deferred tax assets is dependent primarily upon future taxable income. In assessing the need for a valuation allowance, we have considered our historical levels of income, expectations of future taxable income and on-going tax planning strategies.
In the year ended December 31, 2008, management reevaluated the need for a full valuation allowance on its deferred tax assets as a result of cumulative profits generated in the most recent three
52
Table of Contents
year period as well as other positive evidence. As a result of this evaluation, we concluded that it is more likely than not that we will realize sufficient earnings to utilize a significant portion of our deferred tax assets. Accordingly, we reversed the valuation allowance against our domestic deferred tax assets and recorded a benefit of $11.7 million. This benefit was partially offset by a provision for income taxes of $3.4 million related to federal, state and local taxes. At December 31, 2008 we maintained a valuation allowance on foreign deferred tax assets.
In the year ended December 31, 2009, management reevaluated the need for a valuation allowance on our foreign deferred tax assets. As a result of this evaluation, we concluded that it is more likely than not that we will realize sufficient future taxable income to utilize our foreign deferred tax assets. Accordingly, we reversed the valuation allowance against our foreign deferred tax assets and recorded an income tax benefit of $0.7 million in 2009.
As part of our accounting for the acquisition of Mazu, we established deferred tax assets for federal net operating loss carryforwards and research and development credit carryforwards that are subject to limitation under Sections 382 and 383 of the Internal Revenue Code. Accordingly, we recorded a valuation allowance of $8.8 million related to a portion of the federal net operating loss carryforwards and research and development credit carryforwards that we do not expect to be realized. Any subsequent reduction of the valuation allowance and the recognition of the associated tax benefits will be recorded to our provision for income taxes.
We are subject to potential income tax audits on open tax years by any taxing jurisdiction which we operate in. The taxing authorities of the most significant jurisdictions are the United States Internal Revenue Service, California Franchise Tax Board and HM Revenue and Customs in the United Kingdom (UK). We do not anticipate any material adjustments to our tax provisions relating to previously filed tax returns. The statute of limitations for federal, state, and UK tax purposes are generally three, four, and three years respectively; however, we continue to carryover tax attributes prior to these periods for federal and state purposes, which would still be open for examination by the respective tax authorities. Accordingly, all years since our inception are open to tax examinations for federal and state purposes. Our UK tax returns from 2006 to the present are open for examination.
53
Table of Contents
Quarterly Results of Operations
The following table sets forth our unaudited quarterly consolidated statement of operations data for each of the eight quarters ended December 31, 2009. In management’s opinion, the data has been prepared on the same basis as the audited consolidated financial statements included in this Annual Report on Form 10-K, and reflects all necessary adjustments, consisting only of normal recurring adjustments, necessary for a fair presentation of this data. The results of historical periods are not necessarily indicative of the results of operations for a full year or any future period.
| For the three months ended | ||||||||||||||||||||||||||||||||
| (in thousands, except per share data) |
2009 | 2008 | ||||||||||||||||||||||||||||||
| Dec. 31 | Sep. 30 | Jun. 30 | Mar. 31 | Dec. 31 | Sep. 30 | Jun. 30 | Mar. 31 | |||||||||||||||||||||||||
| Revenue: |
||||||||||||||||||||||||||||||||
| Product |
$ | 77,563 | $ | 69,543 | $ | 60,314 | $ | 60,465 | $ | 67,355 | $ | 65,238 | $ | 62,607 | $ | 57,729 | ||||||||||||||||
| Support and services |
35,336 | 32,506 | 30,673 | 27,746 | 24,873 | 21,309 | 18,985 | 15,253 | ||||||||||||||||||||||||
| Total revenue |
112,899 | 102,049 | 90,987 | 88,211 | 92,228 | 86,547 | 81,592 | 72,982 | ||||||||||||||||||||||||
| Cost of revenue: |
||||||||||||||||||||||||||||||||
| Cost of product |
17,276 | 14,982 | 14,389 | 14,405 | 15,286 | 16,653 | 14,564 | 13,936 | ||||||||||||||||||||||||
| Cost of support and services |
10,531 | 9,410 | 9,466 | 8,509 | 8,024 | 7,174 | 6,967 | 6,010 | ||||||||||||||||||||||||
| Total cost of revenue |
27,807 | 24,392 | 23,855 | 22,914 | 23,310 | 23,827 | 21,531 | 19,946 | ||||||||||||||||||||||||
| Gross profit |
85,092 | 77,657 | 67,132 | 65,297 | 68,918 | 62,720 | 60,061 | 53,036 | ||||||||||||||||||||||||
| Operating expenses |
84,529 | 67,783 | 65,186 | 67,337 | 63,785 | 70,856 | 60,151 | 54,188 | ||||||||||||||||||||||||
| Operating income (loss) |
563 | 9,874 | 1,946 | (2,040 | ) | 5,133 | (8,136 | ) | (90 | ) | (1,152 | ) | ||||||||||||||||||||
| Other income, net |
218 | 141 | 45 | 638 | 1,455 | 1,287 | 1,472 | 2,300 | ||||||||||||||||||||||||
| Income (loss) before provision for income taxes |
781 | 10,015 | 1,991 | (1,402 | ) | 6,588 | (6,849 | ) | 1,382 | 1,148 | ||||||||||||||||||||||
| Provision (benefit) for income taxes |
(151 | ) | 4,546 | 2,281 | (2,376 | ) | (16,667 | ) | 5,574 | 2,251 | 510 | |||||||||||||||||||||
| Net income (loss) |
$ | 932 | $ | 5,469 | $ | (290 | ) | $ | 974 | $ | 23,255 | $ | (12,423 | ) | $ | (869 | ) | $ | 638 | |||||||||||||
| Net income (loss) per share basic |
$ | 0.01 | $ | 0.08 | $ | — | $ | 0.01 | $ | 0.33 | $ | (0.17 | ) | $ | (0.01 | ) | $ | 0.01 | ||||||||||||||
| Net income (loss) per share diluted |
$ | 0.01 | $ | 0.08 | $ | — | $ | 0.01 | $ | 0.33 | $ | (0.17 | ) | $ | (0.01 | ) | $ | 0.01 | ||||||||||||||
| Stock-based compensation expense and related payroll taxes included in above |
$ | 15,959 | $ | 13,951 | $ | 13,990 | $ | 12,808 | $ | 12,282 | $ | 13,076 | $ | 13,962 | $ | 11,269 | ||||||||||||||||
| Litigation settlement expenses included in above |
$ | — | $ | — | $ | — | $ | — | $ | — | $ | 11,000 | $ | — | $ | — | ||||||||||||||||
| Acquisition-related costs (credits) included in above |
$ | 7,235 | $ | (1,809 | ) | $ | (1,264 | ) | $ | 2,413 | $ | — | $ | — | $ | — | $ | — | ||||||||||||||
Our operating results may fluctuate due to a variety of factors, many of which are outside of our control. As a result, comparing our operating results on a period-to-period basis may not be meaningful. You should not rely on our past results as an indication of our future performance. In addition, a significant portion of our quarterly sales typically occurs during the last month of the quarter, which we believe reflects customer buying patterns of products similar to ours and other products in the technology industry generally. As a result, our quarterly operating results are difficult to predict even in the near term.
Commencing with the first shipment of our products in the second quarter of 2004, revenue has increased sequentially in all but one quarter, due to increases in the number of products and support and services sold to new and existing customers and international expansion. Cost of revenue has increased sequentially each quarter in absolute dollars, but has decreased over time as a percentage of revenue. The increase in gross margins is primarily due to higher margins on product revenue as a result of lower unit product costs. Operating expenses have increased over time, as we continued to add headcount and related costs to accommodate our growing business.
54
Table of Contents
Liquidity and Capital Resources
| (in thousands) |
As of December 31, | |||||||||||
| 2009 | 2008 | 2007 | ||||||||||
| Working capital |
$ | 281,965 | $ | 254,079 | $ | 243,640 | ||||||
| Cash and cash equivalents |
67,749 | 95,378 | 162,979 | |||||||||
| Marketable securities |
257,938 | 172,398 | 83,103 | |||||||||
| Year ended December 31, | ||||||||||||
| (in thousands) |
2009 | 2008 | 2007 | |||||||||
| Cash provided by operating activities |
$ | 96,487 | $ | 67,606 | $ | 46,068 | ||||||
| Cash used in investing activities |
(115,435 | ) | (101,215 | ) | (88,827 | ) | ||||||
| Cash provided by (used in) financing activities |
(8,984 | ) | (33,515 | ) | 100,323 | |||||||
Cash and Cash Equivalents
Cash and cash equivalents consist of money market mutual funds, government sponsored enterprise obligations, treasury bills, commercial paper and other money market securities with remaining maturities at date of purchase of 90 days or less.
Marketable securities consist of government sponsored enterprise obligations, treasury bills and corporate bonds and notes. The fair value of marketable securities is determined as the exit price in the principal market in which we would transact. The fair value of our marketable securities has not materially fluctuated from historical cost. The accumulated unrealized gains (losses), net of tax, on marketable securities recognized in accumulated other comprehensive income (loss) in our stockholders’ equity as of December 31, 2009 is $0.2 million. The recent volatility in the credit markets has increased the risk of material fluctuations in the fair value of marketable securities.
Cash and cash equivalents and marketable securities increased by $57.9 million to $325.7 million in the year ended December 31, 2009. Cash provided by operating activities of $96.5 million and cash provided by issuance of common stock, net of cash used to net settle equity awards under our employee stock plans of $22.2 million was offset by significant cash expenditures in the year ended December 31, 2009, including $29.0 million in share repurchases, $20.5 million paid for the acquisition of Mazu, net of cash acquired, and $5.0 million used to pay down debt acquired in the acquisition of Mazu.
Pursuant to certain lease agreements and as security for our merchant services agreement with our financial institution, we are required to maintain cash reserves, classified as restricted cash. Current restricted cash totaled $1.5 million at December 31, 2009 and $0.1 million at December 31, 2008. Current restricted cash is included in prepaid and other assets in the consolidated balance sheet and consists primarily of collateral for letters of credit for the security deposit on the sublease of our corporate headquarters and is restricted until the end of the term of the sublease on August 30, 2010. Long-term restricted cash totaled $2.6 million at December 31, 2009 and $3.5 million at December 31, 2008. Long-term restricted cash is included in other assets in the consolidated balance sheets and consists primarily of funds held as collateral for letters of credit for the security deposit on the leases of our corporate headquarters and is restricted until the end of the lease terms on July 31, 2014.
Since the fourth quarter of 2004, we have expanded our operations internationally. Our sales contracts are principally denominated in U.S. dollars and therefore changes in foreign exchange rates have not materially affected our cash flows from operations. As we fund our international operations, our cash and cash equivalents are affected by changes in exchange rates. To date, the foreign currency effect on our cash and cash equivalents has not been material.
55
Table of Contents
Cash Flows from Operating Activities
Our largest source of operating cash flows is the cash collections from our customers. Our primary uses of cash from operating activities are for personnel related expenditures, product costs, outside services, and rent payments. Our cash flows from operating activities will continue to be affected principally by the extent to which we grow our revenue and spend on hiring personnel in order to grow our business. The timing of hiring sales personnel in particular affects cash flows as there is a lag between the hiring of sales personnel and the generation of revenue and related cash flows from their sales efforts.
Cash provided by operating activities was $96.5 million in the year ended December 31, 2009 compared to $67.6 million in the year ended December 31, 2008 primarily due to increased profitability after excluding the effects of non-cash stock-based compensation expense and depreciation and amortization.
Cash Flows used in Investing Activities
Cash flows used in investing activities primarily relate to investments in marketable securities, capital expenditures to support our growth and cash used in acquisitions.
Cash used in investing activities increased in the year ended December 31, 2009 compared to the year ended December 31, 2008 primarily due to the $20.5 million paid for the acquisition of Mazu, net of cash and cash equivalents acquired of $2.6 million. This was partially offset by lower purchases of marketable securities and lower capital expenditures.
Cash Flows used in Financing Activities
Cash used in financing activities was $9.0 million in the year ended December 31, 2009. Cash used for repurchases of common stock was $29.0 million in the year ended December 31, 2009 compared to $50.0 million in the year ended December 31, 2008; cash provided from the exercise of stock options was $22.2 million in the year ended December 31, 2009 compared to $11.6 million in the year ended December 31, 2008; and cash used to pay down the debt acquired in the acquisition of Mazu was $5.0 million in the year ended December 31, 2009.
On April 21, 2008, our Board of Directors authorized a Share Repurchase Program, which authorizes us to repurchase up to $100.0 million of our outstanding common stock during a period not to exceed 24 months from the Board authorization date. The Program does not require us to purchase a minimum number of shares, and may be suspended, modified or discontinued at any time. During 2009, we repurchased 1,955,000 shares of common stock under this Program for an aggregate purchase price of $29.0 million, or an average of $14.84 per share. In 2008, we repurchased 4,027,706 shares of common stock under this Program for an aggregate purchase price of approximately $50.0 million, or an average of $12.41 per share. The timing and amounts of these repurchases were based on market conditions and other factors including price, regulatory requirements and capital availability. The share repurchases were financed by available cash balances and cash from operations.
We believe that our net proceeds from operations, together with our cash balance at December 31, 2009, will be sufficient to fund our projected operating requirements for at least the next 12 months. Our future capital requirements will depend on many factors, including our rate of revenue growth, the expansion of our sales and marketing activities, the timing and extent of expansion into new territories, the timing of introductions of new products and enhancements to existing products, and the continuing market acceptance of our products. In February 2009, we acquired Mazu Networks, Inc. for approximately $25 million of cash which was paid for from our existing cash balance. In the future,
56
Table of Contents
we may enter into other arrangements for potential investments in, or acquisitions of, complementary businesses, services or technologies, which could require us to seek additional equity or debt financing. Additional funds may not be available on terms favorable to us or at all.
Contractual Obligations
The following is a summary of our contractual obligations as of December 31, 2009:
| Year ending December 31, | |||||||||||||||||||||
| Total | 2010 | 2011 | 2012 | 2013 | 2014 | Thereafter | |||||||||||||||
| (in thousands) | |||||||||||||||||||||
| Contractual Obligations |
|||||||||||||||||||||
| Operating leases |
$ | 29,496 | $ | 6,282 | $ | 7,773 | $ | 6,726 | $ | 5,562 | $ | 3,153 | $ | — | |||||||
| Purchase obligations (1) |
6,979 | 6,900 | 70 | 9 | — | — | — | ||||||||||||||
| Acquisition-related contingent consideration |
11,002 | 11,002 | — | — | — | — | — | ||||||||||||||
| Total contractual obligations |
$ | 47,477 | $ | 24,134 | $ | 7,843 | $ | 6,735 | $ | 5,562 | $ | 3,153 | $ | — | |||||||
| (1) | Represents amounts associated with agreements that are enforceable, legally binding and specify terms, including: fixed or minimum quantities to be purchased; fixed, minimum or variable price provisions; and the approximate timing of payment. Obligations under contracts that we can cancel without a significant penalty are not included in the table above. |
Off-Balance Sheet Arrangements
At December 31, 2009 and 2008, we did not have any relationships with unconsolidated entities or financial partnerships, such as entities often referred to as structured finance or special purpose entities, which would have been established for the purpose of facilitating off-balance sheet arrangements or other contractually narrow or limited purposes, nor did we have any undisclosed material transactions or commitments involving related persons or entities.
Other
At December 31, 2009 and 2008, we did not have commercial commitments under lines of credit, standby repurchase obligations or other such debt arrangements.
Recent Accounting Pronouncements
See Note 18 of “Notes to Consolidated Financial Statements” for recent accounting pronouncements that could have an effect on us.
| Item 7A. | Quantitative and Qualitative Disclosures about Market Risk |
Foreign Currency Risk
Our sales contracts are principally denominated in U.S. dollars and therefore our revenue and receivables are not subject to significant foreign currency risk. We do incur certain operating expenses in currencies other than the U.S. dollar and therefore are subject to volatility in cash flows due to fluctuations in foreign currency exchange rates, particularly changes in the British pound, Euro, Australian dollar and Singapore dollar. To date, we have not entered into any hedging contracts since
57
Table of Contents
exchange rate fluctuations have had minimal impact on our operating results and cash flows. In addition, sales would be negatively affected if we chose to more heavily discount our product price in foreign markets to maintain competitive pricing.
Interest Rate Sensitivity
We had unrestricted cash and cash equivalents, and marketable securities totaling $325.7 million and $267.8 million at December 31, 2009 and 2008, respectively. Cash and cash equivalents of $67.7 million and $95.4 million at December 31, 2009 and December 31, 2008, respectively, are held for working capital purposes and include highly liquid investments with a maturity of ninety days or less at the time of purchase. Cash equivalents consist primarily of money market mutual funds, government sponsored enterprise obligations, treasury bills, and other money market securities. Marketable securities of $257.9 million and $172.4 million at December 31, 2009 and December 31, 2008, respectively, consist of government-sponsored enterprise obligations, treasury bills, FDIC-backed certificates of deposit and corporate bonds and notes.
We do not enter into investments for trading or speculative purposes. Due to the high investment quality and relatively short duration of these investments, we do not believe that we have any material exposure to changes in the fair market value as a result of changes in interest rates. Declines in interest rates, however, will reduce future investment income. The volatility in the credit markets in late 2008 through mid 2009 caused a macro shift in investments into highly liquid short-term investments such as U.S. Treasury bills. This has caused a significant decline in short-term interest rates, which resulted in a significant reduction in our investment income. In addition, the volatility in the credit markets increases the risk of write-downs of investments to fair market value.
58
Table of Contents
| Item 8. | Financial Statements and Supplementary Data |
INDEX TO CONSOLIDATED FINANCIAL STATEMENTS
The following financial statements are filed as part of this Annual Report on Form 10-K
| Page No. | ||
| Reports of Ernst & Young LLP, Independent Registered Public Accounting Firm |
60 | |
| 62 | ||
| 63 | ||
| 64 | ||
| 65 | ||
| 66 |
59
Table of Contents
INDEPENDENT REGISTERED PUBLIC ACCOUNTING FIRM
The Board of Directors and Stockholders
Riverbed Technology, Inc.
We have audited the accompanying consolidated balance sheets of Riverbed Technology, Inc. as of December 31, 2009 and 2008, and the related consolidated statements of operations, stockholders’ equity and cash flows for each of the three years in the period ended December 31, 2009. Our audits also included the financial statement schedule listed in the index at Item 15(b). These financial statements and schedule are the responsibility of the Company’s management. Our responsibility is to express an opinion on these financial statements and schedule based on our audits.
We conducted our audits in accordance with the standards of the Public Company Accounting Oversight Board (United States). Those standards require that we plan and perform the audit to obtain reasonable assurance about whether the financial statements and schedule are free of material misstatement. An audit includes examining, on a test basis, evidence supporting the amounts and disclosures in the financial statements. An audit also includes assessing the accounting principles used and significant estimates made by management, as well as evaluating the overall financial statement presentation. We believe that our audits provide a reasonable basis for our opinion.
In our opinion, the financial statements referred to above present fairly, in all material respects, the consolidated financial position of Riverbed Technology, Inc. at December 31, 2009 and 2008, and the consolidated results of its operations and its cash flows for each of the three years in the period ended December 31, 2009, in conformity with U.S. generally accepted accounting principles. Also, in our opinion, the related financial statement schedule, when considered in relation to the basic financial statements taken as a whole, presents fairly in all material respects, the information set forth therein.
As discussed in Note 18 to the consolidated financial statements, under the heading New Accounting Pronouncements, the Company adopted FASB Statement No. 141(R) Business Combinations (codified in FASB ASC Topic 805, Business Combinations) effective January 1, 2009.
We also have audited, in accordance with the standards of the Public Company Accounting Oversight Board (United States), Riverbed Technology, Inc.’s internal control over financial reporting as of December 31, 2009, based on criteria established in Internal Control-Integrated Framework issued by the Committee of Sponsoring Organizations of the Treadway Commission and our report dated February 11, 2010 expressed an unqualified opinion thereon.
/s/ Ernst & Young LLP
San Francisco, California
February 11, 2010
60
Table of Contents
REPORT OF ERNST & YOUNG LLP,
INDEPENDENT REGISTERED PUBLIC ACCOUNTING FIRM
The Board of Directors and Stockholders
Riverbed Technology, Inc.
We have audited Riverbed Technology Inc.’s internal control over financial reporting as of December 31, 2009 based on criteria established in Internal Control — Integrated Framework issued by the Committee of Sponsoring Organizations of the Treadway Commission (the COSO criteria). Riverbed Technology, Inc.’s management is responsible for maintaining effective internal control over financial reporting, and for its assessment of the effectiveness of internal control over financial reporting included in Part I, Item 9A of this Annual Report on Form 10-K under the heading “Management’s Report on Internal Control Over Financial Reporting.” Our responsibility is to express an opinion on the Company’s internal control over financial reporting based on our audit.
We conducted our audit in accordance with the standards of the Public Company Accounting Oversight Board (United States). Those standards require that we plan and perform the audit to obtain reasonable assurance about whether effective internal control over financial reporting was maintained in all material respects. Our audit included obtaining an understanding of internal control over financial reporting, assessing the risk that a material weakness exists, testing and evaluating the design and operating effectiveness of internal control based on the assessed risk, and performing such other procedures as we considered necessary in the circumstances. We believe that our audit provides a reasonable basis for our opinion.
A company’s internal control over financial reporting is a process designed to provide reasonable assurance regarding the reliability of financial reporting and the preparation of financial statements for external purposes in accordance with generally accepted accounting principles. A company’s internal control over financial reporting includes those policies and procedures that (1) pertain to the maintenance of records that, in reasonable detail, accurately and fairly reflect the transactions and dispositions of the assets of the company; (2) provide reasonable assurance that transactions are recorded as necessary to permit preparation of financial statements in accordance with generally accepted accounting principles, and that receipts and expenditures of the company are being made only in accordance with authorizations of management and directors of the company; and (3) provide reasonable assurance regarding prevention or timely detection of unauthorized acquisition, use, or disposition of the company’s assets that could have a material effect on the financial statements.
Because of its inherent limitations, internal control over financial reporting may not prevent or detect misstatements. Also, projections of any evaluation of effectiveness to future periods are subject to the risk that controls may become inadequate because of changes in conditions, or that the degree of compliance with the policies or procedures may deteriorate.
In our opinion, Riverbed Technology, Inc. maintained, in all material respects, effective internal control over financial reporting as of December 31, 2009 based on the COSO criteria.
We also have audited, in accordance with the standards of the Public Company Accounting Oversight Board (United States), the consolidated balance sheets of Riverbed Technology, Inc. as of December 31, 2009 and 2008, and the related consolidated statements of operations, stockholders’ equity and cash flows for each of the three years in the period ended December 31, 2009 of Riverbed Technology, Inc. and our report dated February 11, 2010 expressed an unqualified opinion thereon.
/s/ Ernst & Young LLP
San Francisco, California
February 11, 2010
61
Table of Contents
CONSOLIDATED BALANCE SHEETS
(in thousands, except per share data)
| As of December 31, | ||||||||
| 2009 | 2008 | |||||||
| ASSETS | ||||||||
| Current assets: |
||||||||
| Cash and cash equivalents |
$ | 67,749 | $ | 95,378 | ||||
| Marketable securities |
257,938 | 172,398 | ||||||
| Trade receivables, net of allowances of $1,693 and $770 as of December 31, 2009 and 2008, respectively |
48,468 | 46,839 | ||||||
| Inventory |
9,742 | 10,637 | ||||||
| Deferred tax asset |
9,451 | 6,185 | ||||||
| Prepaid expenses and other current assets |
16,816 | 12,605 | ||||||
| Total current assets |
410,164 | 344,042 | ||||||
| Fixed assets, net |
21,698 | 21,993 | ||||||
| Goodwill |
11,312 | — | ||||||
| Intangibles, net |
19,389 | — | ||||||
| Deferred tax assets, non-current |
38,619 | 27,033 | ||||||
| Other assets |
4,097 | 5,449 | ||||||
| Total assets |
$ | 505,279 | $ | 398,517 | ||||
| LIABILITIES AND STOCKHOLDERS’ EQUITY | ||||||||
| Current liabilities: |
||||||||
| Accounts payable |
$ | 19,053 | $ | 18,290 | ||||
| Accrued compensation and benefits |
18,692 | 13,137 | ||||||
| Other accrued liabilities |
25,976 | 13,342 | ||||||
| Deferred revenue |
64,478 | 45,194 | ||||||
| Total current liabilities |
128,199 | 89,963 | ||||||
| Deferred revenue, non-current |
21,972 | 12,967 | ||||||
| Other long-term liabilities |
2,801 | 1,758 | ||||||
| Total long-term liabilities |
24,773 | 14,725 | ||||||
| Commitments and contingencies |
||||||||
| Stockholders’ equity: |
||||||||
| Preferred stock, $0.0001 par value — 30,000 shares authorized, no shares outstanding |
— | — | ||||||
| Common stock and additional paid-in-capital; $0.0001 par value — 600,000 shares authorized; 70,129 and 69,145 shares issued and outstanding as of December 31, 2009 and 2008, respectively |
367,236 | 315,882 | ||||||
| Accumulated deficit |
(14,849 | ) | (21,934 | ) | ||||
| Accumulated other comprehensive loss |
(80 | ) | (119 | ) | ||||
| Total stockholders’ equity |
352,307 | 293,829 | ||||||
| Total liabilities and stockholders’ equity |
$ | 505,279 | $ | 398,517 | ||||
See Notes to Consolidated Financial Statements
62
Table of Contents
CONSOLIDATED STATEMENTS OF OPERATIONS
(in thousands, except per share amounts)
| Year ended December 31, | ||||||||||||
| 2009 | 2008 | 2007 | ||||||||||
| Revenue: |
||||||||||||
| Product |
$ | 267,885 | $ | 252,929 | $ | 196,622 | ||||||
| Support and services |
126,261 | 80,420 | 39,784 | |||||||||
| Total revenue |
394,146 | 333,349 | 236,406 | |||||||||
| Cost of revenue: |
||||||||||||
| Cost of product |
61,052 | 60,439 | 51,068 | |||||||||
| Cost of support and services |
37,916 | 28,175 | 14,856 | |||||||||
| Total cost of revenue |
98,968 | 88,614 | 65,924 | |||||||||
| Gross profit |
295,178 | 244,735 | 170,482 | |||||||||
| Operating expenses: |
||||||||||||
| Sales and marketing |
177,487 | 140,653 | 95,652 | |||||||||
| Research and development |
69,164 | 58,658 | 39,696 | |||||||||
| General and administrative |
38,080 | 38,669 | 24,834 | |||||||||
| Other charges |
— | 11,000 | — | |||||||||
| Acquisition-related costs |
104 | — | — | |||||||||
| Total operating expenses |
284,835 | 248,980 | 160,182 | |||||||||
| Operating income (loss) |
10,343 | (4,245 | ) | 10,300 | ||||||||
| Other income |
||||||||||||
| Interest income |
1,945 | 6,806 | 10,068 | |||||||||
| Other expense, net |
(903 | ) | (292 | ) | (335 | ) | ||||||
| Total other income |
1,042 | 6,514 | 9,733 | |||||||||
| Income before provision for income taxes |
11,385 | 2,269 | 20,033 | |||||||||
| Provision (benefit) for income taxes |
4,300 | (8,332 | ) | 5,235 | ||||||||
| Net income |
$ | 7,085 | $ | 10,601 | $ | 14,798 | ||||||
| Net income per common share: |
||||||||||||
| Basic |
$ | 0.10 | $ | 0.15 | $ | 0.22 | ||||||
| Diluted |
$ | 0.10 | $ | 0.14 | $ | 0.20 | ||||||
| Shares used in computing net income per common share: |
||||||||||||
| Basic |
69,200 | 70,757 | 68,020 | |||||||||
| Diluted |
71,540 | 73,267 | 73,244 | |||||||||
See Notes to Consolidated Financial Statements
63
Table of Contents
CONSOLIDATED STATEMENTS OF STOCKHOLDERS’ EQUITY
For the Years ended December 31, 2009, 2008 and 2007
(in thousands)
| Common stock and additional paid-in-capital |
Accumulated deficit |
Accumulated other comprehensive income (loss) |
Total | ||||||||||||||||
| Shares | Amount | ||||||||||||||||||
| Balance at December 31, 2006 |
66,180 | $ | 156,329 | $ | (47,333 | ) | $ | (16 | ) | $ | 108,980 | ||||||||
| Proceeds from follow-on stock offering, net of expenses |
2,855 | 87,681 | — | — | 87,681 | ||||||||||||||
| Common stock issued under stock plans |
2,265 | 14,063 | — | — | 14,063 | ||||||||||||||
| Reclassification of options exercised but not vested |
— | 313 | — | — | 313 | ||||||||||||||
| Warrant exercise |
32 | — | — | — | — | ||||||||||||||
| Tax benefit from employee stock plans |
— | 4,284 | — | — | 4,284 | ||||||||||||||
| Stock-based compensation |
— | 29,530 | — | — | 29,530 | ||||||||||||||
| Comprehensive income: |
|||||||||||||||||||
| Currency translation adjustments |
— | — | — | 84 | 84 | ||||||||||||||
| Unrealized loss on marketable securities |
— | — | — | (15 | ) | (15 | ) | ||||||||||||
| Net income |
— | — | 14,798 | — | 14,798 | ||||||||||||||
| Comprehensive income |
— | — | — | — | 14,867 | ||||||||||||||
| Balance at December 31, 2007 |
71,332 | 292,200 | (32,535 | ) | 53 | 259,718 | |||||||||||||
| Repurchase of common stock |
(4,028 | ) | (49,992 | ) | — | — | (49,992 | ) | |||||||||||
| Common stock issued under stock plans |
1,883 | 13,550 | — | — | 13,550 | ||||||||||||||
| Stock options repurchased |
(42 | ) | (27 | ) | — | — | (27 | ) | |||||||||||
| Reclassification of options exercised but not vested |
— | 250 | — | — | 250 | ||||||||||||||
| Tax benefit from employee stock plans |
— | 11,451 | — | — | 11,451 | ||||||||||||||
| Stock-based compensation |
— | 48,450 | — | — | 48,450 | ||||||||||||||
| Comprehensive income: |
|||||||||||||||||||
| Currency translation adjustments |
— | — | — | (476 | ) | (476 | ) | ||||||||||||
| Unrealized gain on marketable securities, net of tax |
— | — | — | 304 | 304 | ||||||||||||||
| Net income |
— | — | 10,601 | — | 10,601 | ||||||||||||||
| Comprehensive income |
— | — | — | — | 10,429 | ||||||||||||||
| Balance at December 31, 2008 |
69,145 | 315,882 | (21,934 | ) | (119 | ) | 293,829 | ||||||||||||
| Repurchase of common stock |
(1,955 | ) | (29,016 | ) | — | — | (29,016 | ) | |||||||||||
| Common stock issued under stock plans, net of shares withheld for employee taxes |
2,939 | 23,207 | — | — | 23,207 | ||||||||||||||
| Reclassification of options exercised but not vested |
— | 92 | — | — | 92 | ||||||||||||||
| Tax benefit from employee stock plans |
— | 1,816 | — | — | 1,816 | ||||||||||||||
| Stock-based compensation |
— | 55,255 | — | — | 55,255 | ||||||||||||||
| Comprehensive income: |
|||||||||||||||||||
| Currency translation adjustments |
— | — | — | 497 | 497 | ||||||||||||||
| Unrealized loss on marketable securities, net of tax |
— | — | — | (458 | ) | (458 | ) | ||||||||||||
| Net income |
— | — | 7,085 | — | 7,085 | ||||||||||||||
| Comprehensive income |
— | — | — | — | 7,124 | ||||||||||||||
| Balance at December 31, 2009 |
70,129 | $ | 367,236 | $ | (14,849 | ) | $ | (80 | ) | $ | 352,307 | ||||||||
See Notes to Consolidated Financial Statements
64
Table of Contents
CONSOLIDATED STATEMENTS OF CASH FLOWS
(in thousands)
| Year ended December 31, | ||||||||||||
| 2009 | 2008 | 2007 | ||||||||||
| Operating Activities: |
||||||||||||
| Net income |
$ | 7,085 | $ | 10,601 | $ | 14,798 | ||||||
| Adjustments to reconcile net income to net cash provided by operating activities: |
||||||||||||
| Depreciation and amortization |
14,340 | 7,965 | 4,213 | |||||||||
| Stock-based compensation |
56,218 | 50,408 | 31,801 | |||||||||
| Deferred taxes |
(13,517 | ) | (32,619 | ) | — | |||||||
| Excess tax benefit from employee stock plans |
(2,792 | ) | (4,909 | ) | (850 | ) | ||||||
| Changes in operating assets and liabilities: |
||||||||||||
| Trade receivables |
940 | 1,926 | (32,265 | ) | ||||||||
| Inventory |
1,341 | (6,040 | ) | (5,160 | ) | |||||||
| Prepaid expenses and other assets |
(2,756 | ) | (1,489 | ) | (2,875 | ) | ||||||
| Accounts payable |
(665 | ) | 994 | 4,563 | ||||||||
| Accruals and other liabilities |
7,733 | 3,884 | 12,330 | |||||||||
| Income taxes payable |
1,772 | 11,499 | 4,597 | |||||||||
| Deferred revenue |
26,788 | 25,386 | 14,916 | |||||||||
| Net cash provided by operating activities |
96,487 | 67,606 | 46,068 | |||||||||
| Investing Activities: |
||||||||||||
| Capital expenditures |
(8,978 | ) | (12,406 | ) | (9,709 | ) | ||||||
| Purchase of available for sale securities |
(375,056 | ) | (424,864 | ) | (129,098 | ) | ||||||
| Proceeds from maturities of available for sale securities |
272,818 | 245,312 | 39,000 | |||||||||
| Proceeds from sales of available for sale securities |
16,250 | 90,743 | 10,980 | |||||||||
| Acquisitions, net of cash and cash equivalents acquired |
(20,469 | ) | — | — | ||||||||
| Net cash used in investing activities |
(115,435 | ) | (101,215 | ) | (88,827 | ) | ||||||
| Financing Activities: |
||||||||||||
| Proceeds from public offerings, net of expenses |
— | — | 87,681 | |||||||||
| Proceeds from issuance of common stock under employee stock plans |
25,288 | 11,568 | 11,792 | |||||||||
| Cash used to net share settle equity awards |
(3,044 | ) | — | — | ||||||||
| Payments for repurchases of common stock |
(29,016 | ) | (49,992 | ) | — | |||||||
| Payments of debt |
(5,004 | ) | — | — | ||||||||
| Excess tax benefit from employee stock plans |
2,792 | 4,909 | 850 | |||||||||
| Net cash provided by (used in) financing activities |
(8,984 | ) | (33,515 | ) | 100,323 | |||||||
| Effect of exchange rate changes on cash and cash equivalents |
303 | (477 | ) | 85 | ||||||||
| Net increase (decrease) in cash and cash equivalents |
(27,629 | ) | (67,601 | ) | 57,649 | |||||||
| Cash and cash equivalents at beginning of period |
95,378 | 162,979 | 105,330 | |||||||||
| Cash and cash equivalents at end of period |
$ | 67,749 | $ | 95,378 | $ | 162,979 | ||||||
| Supplemental schedule of cash flow data: |
||||||||||||
| Cash paid for income taxes |
$ | 14,935 | $ | 11,994 | $ | 464 | ||||||
See Notes to Consolidated Financial Statements
65
Table of Contents
NOTES TO CONSOLIDATED FINANCIAL STATEMENTS
1. ORGANIZATION AND SIGNIFICANT ACCOUNTING POLICIES
Organization
Riverbed Technology, Inc. was founded on May 23, 2002 and has developed innovative and comprehensive solutions to the fundamental problems of IT performance across wide area networks (WANs). Our products enable our customers to simply and efficiently improve the performance of their applications and access to their data over WANs, and provide global application performance, reporting and analytics.
Public Offerings
In September 2006, we completed our initial public offering (IPO) of common stock in which we sold and issued 9,990,321 shares of our common stock, including 1,290,321 shares sold by us pursuant to the underwriters’ exercise of their over-allotment option, at an issue price of $9.75 per share. We raised a total of $97.4 million in gross proceeds from the IPO, or approximately $87.5 million in net proceeds after deducting underwriting discounts and commissions of $6.8 million and other offering costs of $3.1 million. Upon the closing of the IPO, all shares of convertible preferred stock outstanding automatically converted into 39,441,439 shares of common stock.
In February 2007, we completed a follow-on public offering of common stock in which we sold and issued 2,854,671 shares of our common stock, including 250,000 shares sold by us pursuant to the underwriters’ partial exercise of their over-allotment option, at an issue price of $32.50 per share. As a result of the offering, we raised a total of $92.8 million in gross proceeds, or approximately $87.7 million in net proceeds after deducting underwriting discounts and commissions of $4.2 million and other offering costs of $0.9 million.
Significant Accounting Policies
Basis of Financial Statements
The consolidated financial statements include our accounts and the accounts of our wholly owned subsidiaries. Intercompany transactions and balances have been eliminated.
Reclassifications
Certain reclassifications have been made to prior year amounts to conform to the current year presentation. Specifically, service inventory as of December 31, 2008 in the amount of $5.9 million has been reclassified from Other long-term assets to Prepaid expenses and other current assets on our consolidated balance sheet.
Use of Estimates
Our consolidated financial statements are prepared in accordance with U.S. generally accepted accounting principles (GAAP). These accounting principles require us to make certain estimates and judgments that can affect the reported amounts of assets and liabilities as of the date of the consolidated financial statements, as well as the reported amounts of revenue and expenses during the periods presented. Significant estimates and assumptions made by management include the determination of the fair value of stock awards issued, the allowance for doubtful accounts, inventory valuation, the accounting for income taxes, including the determination of the timing of the release of
66
Table of Contents
RIVERBED TECHNOLOGY, INC.
NOTES TO CONSOLIDATED FINANCIAL STATEMENTS — (Continued)
our valuation allowance related to our deferred tax asset balances, the accounting for business combinations and the accounting for acquisition-related contingent consideration. We believe that the estimates and judgments upon which we rely are reasonable based upon information available to us at the time that these estimates and judgments are made. To the extent there are material differences between these estimates and actual results, our consolidated financial statements will be affected.
Subsequent Events
We have evaluated subsequent events through February 11, 2010, which is the date these consolidated financial statements were available to be issued.
Cash and Cash Equivalents
We consider all highly liquid investments purchased with original maturities at the date of purchase of three months or less to be cash equivalents. Cash and cash equivalents are stated at cost, which approximates fair value.
Marketable Securities
We determine the appropriate classification of investments in marketable securities at the time of purchase and reevaluate such determination at each balance sheet date. The fair value of our marketable securities is determined as the exit price in the principal market in which we would transact. Securities, which are classified as available for sale at December 31, 2009, 2008 and 2007, are carried at fair value, with the unrealized gains and losses, net of tax, reported as a separate component of stockholders’ equity. Unrealized gains and losses to date have not been material. Realized gains and losses and declines in value judged by us to be other-than-temporary on securities available for sale are included as a component of interest income (expense). The cost of securities sold is based on the specific-identification method. Interest on securities classified as available for sale is included as a component of interest income.
Allowances for Doubtful Accounts
We make judgments as to our ability to collect outstanding receivables and provide allowances for the portion of trade receivables when collection becomes doubtful. Provisions are made based upon a specific review of all significant outstanding receivables. For those receivables not specifically reviewed, provisions are provided at differing rates, based upon the age of the receivable. In determining these rates, we analyze our historical collection experience and current economic trends. The allowance for doubtful accounts was $1.7 million and $0.8 million at December 31, 2009 and 2008, respectively.
Inventory Valuation
Inventory consists of hardware and related component parts and is stated at the lower of cost (on a first-in, first-out basis) or market. A portion of our inventory relates to evaluation units located at customer locations, as some of our customers test our equipment prior to purchasing. Inventory that is obsolete or in excess of our forecasted demand is written down to its estimated realizable value based on historical usage, expected demand, and with respect to evaluation units, the historical conversion rate, the age of the units, and the estimated loss of utility. Inherent in our estimates of market value in determining inventory valuation are estimates related to economic trends, future demand for our
67
Table of Contents
RIVERBED TECHNOLOGY, INC.
NOTES TO CONSOLIDATED FINANCIAL STATEMENTS — (Continued)
products, the timing of new product introductions and technological obsolescence of our products. Inventory write-downs are recognized as cost of product and amounted to approximately $4.9 million, $6.0 million and $1.1 million for the years ended December 31, 2009, 2008 and 2007, respectively.
Service Inventory
We hold service inventory that is used to repair or replace defective hardware reported by our customers who purchase support services. We classify service inventory as prepaid expenses and other current assets. At December 31, 2009 and 2008 our service inventory balance was $6.3 million and $5.9 million, respectively. In the years ended December 31, 2009, 2008 and 2007, we recognized $2.9 million, $2.0 million and $0.7 million, respectively, to cost of support and services relating to service inventory.
Internal-Use Software Development Costs
We capitalize qualifying costs for computer software developed for or obtained for internal-use, which are incurred during the application development stage, and amortize them over the software’s estimated useful life.
We capitalized $5.3 million, $3.5 million and $2.1 million in internal use software during the years ended December 31, 2009, 2008 and 2007, respectively. Amortization expense related to these assets totaled $2.3 million, $1.1 million and $0.3 million during the years ended December 31, 2009, 2008 and 2007, respectively. Software development costs required to be capitalized for software sold, leased, or otherwise marketed have not been material to date.
Impairment of Long-Lived Assets
We review long-lived assets and identifiable intangible assets for impairment whenever events or changes in circumstances indicate that the carrying amount of these assets may not be recoverable. We assess these assets for impairment based on estimated undiscounted future cash flows from these assets. If the carrying value of the assets exceeds the estimated future undiscounted cash flows, a loss is recorded for the excess of the asset’s carrying value over the fair value. To date we have not recognized any impairment loss for long-lived assets.
Goodwill, Intangible Assets and Impairment Assessments
Goodwill represents the excess of the purchase price of an acquired business over the fair value of the underlying net tangible and intangible assets. Goodwill also includes the value of intangible assets that do not qualify for separate recognition, such as expected synergies from the combined operations. Goodwill is tested for impairment at least annually during the fourth quarter (and more frequently if certain indicators are present). In the event that we determine that the carrying value of our single reporting unit is less than the reporting unit’s fair value, we will incur an impairment charge for the amount of the difference during the quarter in which the determination is made. We performed our annual review of goodwill in the fourth quarter of 2009 and concluded that no impairment existed at December 31, 2009.
Intangible assets that are not considered to have an indefinite life are amortized over their useful lives. On a periodic basis, we evaluate the estimated remaining useful life of purchased intangible assets and whether events or changes in circumstances warrant a revision to the remaining period of
68
Table of Contents
RIVERBED TECHNOLOGY, INC.
NOTES TO CONSOLIDATED FINANCIAL STATEMENTS — (Continued)
amortization. The carrying amounts of these assets are periodically reviewed for impairment whenever events or changes in circumstances indicate that the carrying value of these assets may not be recoverable. Recoverability of these assets is measured by comparison of the carrying amount of each asset to the future undiscounted cash flows the asset is expected to generate. In the event that we determine certain assets are not fully recoverable, we will incur an impairment charge for those assets or portion thereof during the quarter in which the determination is made.
Warranty Reserve
Upon shipment of products to our customers, we provide for the estimated cost to repair or replace products that may be returned under warranty. Our warranty period is typically 12 months from the date of shipment to the end-user customer for hardware and 90 days for software. For existing products, the reserve is estimated based on actual historical experience. For new products, the warranty reserve is based on historical experience of similar products until such time as sufficient historical data has been collected for the new product. Our warranty liability was approximately $0.7 million and $1.2 million at December 31, 2009 and 2008, respectively. The following is a summary of the warranty reserve activity for the three years ended December 31, 2009:
| Year ended December 31, | ||||||||||||
| (in thousands) |
2009 | 2008 | 2007 | |||||||||
| Beginning balance |
$ | 1,205 | $ | 1,089 | $ | 735 | ||||||
| Additions charged to operations |
887 | 1,745 | 2,120 | |||||||||
| Warranty costs incurred |
(636 | ) | (1,629 | ) | (1,766 | ) | ||||||
| Adjustments related to pre-existing warranties |
(755 | ) | — | — | ||||||||
| Ending balance |
$ | 701 | $ | 1,205 | $ | 1,089 | ||||||
Revenue Recognition
For the majority of our products, our software is generally integrated on appliance hardware and functions together with the appliance hardware to provide the essential functionality of the product. As a result, we account for revenue in accordance with Financial Accounting Standards Board (FASB) Accounting Standards Codification (ASC) Topic 985-605, Software Revenue Recognition, for all transactions involving the sale of software. We recognize product revenue when all of the following have occurred: (1) we have entered into a legally binding arrangement with a customer; (2) delivery has occurred, which is when product title transfers to the customer; (3) customer payment is deemed fixed or determinable and free of contingencies and significant uncertainties; and (4) collection is probable.
Product revenue consists of revenue from sales of our appliances and software licenses. Product sales include a perpetual license to our software. Product revenue is generally recognized upon transfer of title at shipment, assuming all other revenue recognition criteria are met. Shipping charges billed to customers are included in product revenue and the related shipping costs are included in cost of product revenue. Product revenue on sales to channel partners is recorded once we have received persuasive evidence of an end-user and all other revenue recognition criteria have been met.
Substantially all of our product sales have been sold in combination with support services, which consist of software updates and support. Software updates provide customers with rights to unspecified software product upgrades and to maintenance releases and patches released during the
69
Table of Contents
RIVERBED TECHNOLOGY, INC.
NOTES TO CONSOLIDATED FINANCIAL STATEMENTS — (Continued)
term of the support period. Support includes access to technical support personnel and content via the internet and telephone. Support services also include an extended warranty for the repair or replacement of defective hardware. Revenue for support services is recognized on a straight-line basis over the service contract term, which is typically one year.
We use the residual method to recognize revenue when a product agreement includes one or more elements to be delivered at a future date and vendor specific objective evidence (VSOE) of the fair value of all undelivered elements exists. Through December 31, 2009, in virtually all of our contracts, the only element that remained undelivered at the time of delivery of the product was support and updates. Under the residual method, the fair value of the undelivered elements is deferred and the remaining portion of the contract fee is recognized as product revenue. If evidence of the fair value of one or more undelivered elements does not exist, all revenue is generally deferred and recognized when delivery of those elements occurs or when fair value can be established. When the undelivered element for which we do not have VSOE of fair value is support, revenue for the entire arrangement is bundled and recognized ratably over the support period. VSOE of fair value for elements of an arrangement is based upon the normal pricing and discounting practices for those services when sold separately, and VSOE for support services is measured by the renewal rate offered to the customer.
Our fees are typically considered to be fixed or determinable at the inception of an arrangement, generally based on specific products and quantities to be delivered. Substantially all of our contracts do not include rights of return or acceptance provisions. To the extent that our agreements contain such terms, we recognize revenue once the acceptance provisions or right of return lapses. Payment terms to customers generally range from net 30 to 75 days. In the event payment terms are provided that differ from our standard business practices, the fees are deemed to not be fixed or determinable and revenue is recognized when the payments become due, provided the remaining criteria for revenue recognition have been met.
We assess the ability to collect from our customers based on a number of factors, including credit worthiness of the customer and past transaction history of the customer. If the customer is not deemed credit worthy, we defer revenue from the arrangement until payment is received and all other revenue recognition criteria have been met.
Stock-Based Compensation
Stock-based awards granted include stock options, restricted stock units (RSUs), and stock purchased under our Employee Stock Purchase Plan (the “Purchase Plan”). Stock-based compensation cost is measured at the grant date, based on the fair value of the awards, and is recognized as expense over the requisite service period. The cash flows resulting from the tax benefits due to tax deductions in excess of the compensation cost recognized for those options (excess tax benefit) are classified as financing activities within our statement of cash flows.
Business Combinations
In our business combinations, we are required to recognize the assets acquired, liabilities assumed, contractual contingencies, and contingent consideration at their fair value on the acquisition date. The purchase price allocation process requires management to make significant estimates and assumptions, especially at acquisition date with respect to intangible assets, estimated contingent consideration payments and pre-acquisition contingencies.
70
Table of Contents
RIVERBED TECHNOLOGY, INC.
NOTES TO CONSOLIDATED FINANCIAL STATEMENTS — (Continued)
Although we believe the assumptions and estimates we have made have been reasonable and appropriate, they are based in part on historical experience and information obtained from management of the acquired company and are inherently uncertain. Examples of critical estimates in accounting for acquisitions include but are not limited to:
| Ÿ | the estimated fair value of the acquisition-related contingent consideration, which is performed using a probability-weighted discounted cash flow model based upon the forecasted achievement of post acquisition bookings targets; |
| Ÿ | the future expected cash flows from product sales, support agreements, consulting contracts, other customer contracts and acquired developed technologies and patents; and |
| Ÿ | the discount rates. |
Unanticipated events and circumstances may occur which may affect the accuracy or validity of such assumptions, estimates or actual results. Additionally, any change in the fair value of the acquisition-related contingent consideration subsequent to the acquisition date, including changes from events after the acquisition date, such as changes in our estimate of the bookings targets, will be recognized in earnings in the period of the estimated fair value change. A change in fair value of the acquisition-related contingent consideration could have a material affect on the statement of operations and financial position in the period of the change in estimate.
Accounting for Income Taxes
We use the asset and liability method of accounting for income taxes. Under this method, income tax expenses or benefits are recognized for the amount of taxes payable or refundable for the current year and for deferred tax liabilities and assets for the expected tax consequences of temporary differences between the tax bases of assets and liabilities for financial reporting purposes and amounts recognized for income tax purposes. The measurement of current and deferred tax assets and liabilities are based on provisions of currently enacted tax laws. The effects of future changes in tax laws or rates are not contemplated.
As part of the process of preparing our consolidated financial statements, we are required to estimate our income tax expense and tax contingencies in each of the tax jurisdictions in which we operate. This process involves estimating current income tax expense together with assessing temporary differences in the treatment of items for tax purposes versus financial accounting purposes that may create net deferred tax assets and liabilities. We rely on estimates and assumptions in preparing our income tax provision.
We consider many factors when assessing the likelihood of future realization of our deferred tax assets, including our recent earnings experience by jurisdiction, expectations of future taxable income, and the carryforward periods available to us for tax reporting purposes, as well as other relevant factors. We may establish a valuation allowance to reduce deferred tax assets to the amount we believe is more likely than not to be realized. Due to inherent complexities arising from the nature of our businesses, future changes in income tax law, or variances between our actual and anticipated operating results, we make certain judgments and estimates. Therefore, actual income taxes could materially vary from these estimates.
We are subject to periodic audits by the Internal Revenue Service and other taxing authorities. These audits may challenge certain tax positions we have taken, such as the timing and amount of
71
Table of Contents
RIVERBED TECHNOLOGY, INC.
NOTES TO CONSOLIDATED FINANCIAL STATEMENTS — (Continued)
deductions and allocation of taxable income to the various tax jurisdictions. The accounting for income tax contingencies may require significant management judgment in estimating final outcomes. Actual results could differ materially from these estimates and could significantly affect the effective tax rate and cash flows in future years. As of December 31, 2009, we have $2.6 million recorded for such contingencies and have recognized a decrease in our deferred tax asset of $1.6 million. We have elected to record interest and penalties in the financial statements as a component of income taxes.
Concentrations of Risk
Financial instruments that are potentially subject to concentrations of credit risk consist primarily of cash, cash equivalents, marketable securities, and trade receivables. Investment policies have been implemented that limit investments to investment grade securities and the average portfolio maturity is less than six months. The risk with respect to trade receivables is mitigated by credit evaluations we perform on our customers and by the diversification of our customer base. No customer represented more than 10% of our revenue for the years ended December 31, 2009, 2008 or 2007.
We outsource the production of our inventory to third-party manufacturers. We rely on purchase orders or long-term contracts with our contract manufacturers. At December 31, 2009, we had no long-term contractual commitment with any manufacturer; however, we did have a 90 day commitment totaling $5.8 million.
Foreign Currency Translation
While the majority of our revenue contracts are denominated in U.S. dollars, we incur certain operating expenses in various foreign currencies. The functional currency of our foreign operations is the local country’s currency. Consequently, expenses of operations outside the U.S. are translated into U.S. dollars using average exchange rates for the period reported while assets and liabilities of operations outside the U.S. are translated into U.S. dollars using end of period exchange rates. Foreign currency translation adjustments not affecting net income are included in stockholders’ equity as a component of accumulated other comprehensive income (loss) in the accompanying consolidated balance sheets. The revaluation effect of foreign currency fluctuations on intercompany balances is recorded to foreign currency gain (loss) and included in other income (expense) in the accompanying consolidated statements of operations. Foreign currency losses included in other income (expense) for the years ended December 31, 2009, 2008 and 2007, were $0.7 million, $0.3 million and $0.3 million, respectively.
Advertising
Advertising costs are expensed as incurred. Adverting expenses recorded as marketing expenses were $1.1 million, $1.2 million and $2.4 million for the years ended December 31, 2009, 2008 and 2007, respectively.
Cooperative advertising obligations with customers are accrued and the costs expensed at the time the related revenue is recognized. Cooperative advertising expenses are recorded as marketing expenses to the extent that an advertising benefit separate from the revenue transaction can be identified and the cash paid does not exceed the fair value of that advertising benefit received. Otherwise, such cooperative advertising obligations with customers are recorded as a reduction of revenue. Cooperative advertising expenses recorded as a reduction of revenue were $3.1 million, $0.3 million and zero in the years ended December 31, 2009, 2008 and 2007, respectively.
72
Table of Contents
RIVERBED TECHNOLOGY, INC.
NOTES TO CONSOLIDATED FINANCIAL STATEMENTS — (Continued)
Research and Development
All costs to develop our products are expensed as incurred.
2. ACQUISITION
We acquired Mazu Networks, Inc. (Mazu) on February 19, 2009 (the “acquisition date”), by means of a merger of a wholly-owned subsidiary with and into Mazu, such that Mazu became a wholly-owned subsidiary of ours. The results of Mazu’s operations have been included in the consolidated financial statements since the acquisition date. We acquired Mazu, among other reasons, to meet enterprise and service provider customer demands by extending our suite of WAN optimization products to include global application performance, reporting and analytics. The estimated acquisition date fair value of consideration transferred, assets acquired and the liabilities assumed for Mazu are presented below and represent our best estimates.
Fair Value of Consideration Transferred
Pursuant to the merger agreement we made payments totaling $23.1 million in cash for all of the outstanding securities of Mazu promptly following the closing. In addition, we will potentially make additional payments (“acquisition-related contingent consideration”) totaling up to $22.0 million in cash, based on achievement of certain bookings targets related to Mazu products for the one-year period from April 1, 2009 through March 31, 2010 (the “Earn-Out period”), with up to $16.6 million to be paid to Mazu shareholders and up to $5.4 million to be paid to former employees of Mazu as an incentive bonus provided generally that such former Mazu employees are employees of Riverbed at the time the acquisition-related contingent consideration is earned.
The total acquisition date fair value of the consideration transferred was estimated at $33.0 million, which included the initial payments totaling $23.1 million in cash, of which $3.5 million was paid to escrow to secure the seller’s indemnification obligations, and the estimated fair value of acquisition-related contingent consideration to be paid to Mazu shareholders totaling $9.9 million. The total acquisition date fair value of consideration transferred was estimated as follows:
| (in thousands) |
|||
| Payment to Mazu shareholders |
$ | 23,051 | |
| Acquisition-related contingent consideration |
9,909 | ||
| Total acquisition-date fair value |
$ | 32,960 | |
A liability was recognized for an estimate of the acquisition date fair value of the acquisition-related contingent consideration based on the probability of achievement of the bookings target. Any change in the fair value of the acquisition-related contingent consideration subsequent to the acquisition date, including changes from events after the acquisition date, such as changes in our estimate of the bookings that are expected to be achieved, will be recognized in earnings in the period the estimated fair value changes. The fair value estimate is based on the probability weighted bookings to be achieved over the Earn-Out period. Actual achievement of bookings below $16.0 million would reduce the liability to zero and achievement of bookings of $35.0 million or more would increase the liability to $16.6 million. A change in fair value of the acquisition-related contingent consideration could have a material effect on the statement of operations and financial position in the period of the change in estimate. During the year ended December 31, 2009, we recorded a gain of $1.3 million, due to our change in estimate of the fair value of acquisition-related contingent consideration to stockholders.
73
Table of Contents
RIVERBED TECHNOLOGY, INC.
NOTES TO CONSOLIDATED FINANCIAL STATEMENTS — (Continued)
Allocation of Consideration Transferred
The identifiable assets acquired and liabilities assumed were recognized and measured as of the acquisition date, February 19, 2009, based on their estimated fair values. The excess of the acquisition date fair value of consideration transferred over estimated fair value of the net tangible assets and intangible assets was recorded as goodwill.
The following table summarizes the estimated fair values of the assets and liabilities assumed at the acquisition date.
| (in thousands) |
||||
| Cash and cash equivalents |
$ | 2,582 | ||
| Accounts receivable |
2,569 | |||
| Other tangible assets |
1,900 | |||
| Intangible assets |
23,500 | |||
| Total identifiable assets acquired |
30,551 | |||
| Accounts payable and other liabilities |
(2,399 | ) | ||
| Loan payable |
(5,004 | ) | ||
| Deferred revenue |
(1,500 | ) | ||
| Total liabilities assumed |
(8,903 | ) | ||
| Net identifiable assets acquired |
21,648 | |||
| Goodwill |
11,312 | |||
| Net assets acquired |
$ | 32,960 | ||
Intangible Assets
Management engaged a third-party valuation firm to assist in the determination of the fair value of the intangible assets. In our determination of the fair value of the intangible assets we considered, among other factors, the best use of acquired assets, analyses of historical financial performance and estimates of future performance of Mazu’s products. The fair values of identified intangible assets were calculated considering market participant expectations and using an income approach and estimates and assumptions provided by Mazu’s and our management. The rates utilized to discount net cash flows to their present values were based on a weighted average cost of capital of 19%. This discount rate was determined after consideration of the rate of return on debt capital and equity that typical investors would require in an investment in companies similar in size and operating in similar markets as Mazu. The following table sets forth the components of identified intangible assets associated with the Mazu acquisition and their estimated useful lives:
| (in thousands) |
Useful life | Fair Value | |||
| Existing technology |
5 years | $ | 12,100 | ||
| Patents |
5 years | 2,700 | |||
| Maintenance agreements |
5 years | 6,100 | |||
| Customer contracts |
5 years | 2,000 | |||
| Trademarks |
3 years | 600 | |||
| Total intangible assets |
$ | 23,500 | |||
74
Table of Contents
RIVERBED TECHNOLOGY, INC.
NOTES TO CONSOLIDATED FINANCIAL STATEMENTS — (Continued)
We determined the useful life of intangible assets based on the expected future cash flows associated with the respective asset. Existing technology is comprised of products that have reached technological feasibility and are part of Mazu’s product line. There were no in-process research and development assets as of the acquisition date. Patents are related to the design and development of Mazu’s products and this proprietary know-how may be leveraged to develop new technology and products and improve existing products. Customer contracts represent the underlying relationships and agreements with Mazu’s installed customer base. Trademarks represent the fair value of the brand and name recognition associated with the marketing of Mazu’s products and services. Amortization of existing technology and patents is included in cost of product revenue, and amortization expense for customer relationships and trademarks is included in operating expenses.
Goodwill
Goodwill represents the excess of the purchase price of an acquired business over the fair value of the underlying net tangible and intangible assets. Of the total estimated purchase price, $11.7 million was initially allocated to goodwill. During the year ended December 31, 2009 we finalized the 2008 Mazu income tax return and adjusted goodwill by $0.4 million to $11.3 million.
Deferred Revenue
In connection with the allocation of consideration transferred, we estimated the fair value of the service obligations assumed from Mazu as a consequence of the acquisition. The estimated fair value of the service obligations was determined using a cost build-up approach. The cost build-up approach determines fair value by estimating the costs relating to fulfilling the obligations plus a normal profit margin. The sum of the costs and operating profit approximates, in theory, the amount that we would be required to pay a third party to assume the service obligations. The estimated costs to fulfill the service obligations were based on the historical direct costs and indirect costs related to Mazu’s service agreements with its customers. Direct costs include personnel directly engaged in providing service and support activities, while indirect costs consist of estimated general and administrative expenses based on normalized levels as a percentage of revenue. Profit associated with selling efforts was excluded because Mazu had concluded the selling efforts on the service contracts prior to the date of our acquisition. The estimated research and development costs associated with support contracts have not been included in the fair value determination, as these costs were not deemed to represent a legal obligation at the time of acquisition. We recorded $1.5 million of deferred revenue to reflect the estimate of the fair value of Mazu’s service obligations assumed.
Pre-Acquisition Contingencies
We have evaluated and continue to evaluate the pre-acquisition contingencies related to Mazu that existed as of the acquisition date. If any pre-acquisition contingencies that existed as of the acquisition date become probable in nature and estimable, amounts for such matters will be recorded in our results of operations.
Acquisition-related Contingent Consideration
We estimated the fair value of the acquisition-related contingent consideration using a probability-weighted discounted cash flow model. This fair value measurement is based on significant inputs not observed in the market and thus represents a Level 3 measurement. Level 3 instruments are valued based on unobservable inputs that are supported by little or no market activity and reflect our own
75
Table of Contents
RIVERBED TECHNOLOGY, INC.
NOTES TO CONSOLIDATED FINANCIAL STATEMENTS — (Continued)
assumptions in measuring fair value. The fair value of the acquisition-related contingent consideration to be distributed directly to the Mazu selling shareholders was originally estimated at the acquisition date to be $9.9 million. As of December 31, 2009, the estimated fair value of the acquisition-related contingent consideration liability was reduced to $8.6 million, primarily due to a reduction in the probability-weighted bookings estimate, discounted at 13%. The reduction in our fair value estimate resulted in a net gain of $1.3 million in the year ended December 31, 2009, and was recorded in Acquisition-related costs in the Consolidated Statement of Operations. The contractual earn-out formula is tiered with significant increases in consideration at each tier. If actual bookings achieve the next tier of consideration, the contingent consideration would increase by $2.2 million or more. If actual bookings do not achieve the next tier of consideration, the contingent consideration would decrease by $4.3 million. The resulting increase or decrease in the acquisition-related contingent consideration will be recognized in earnings during the three months ended March 31, 2010.
The fair value of acquisition-related contingent consideration to be paid to the former employees of Mazu (“acquisition-related compensation costs”), originally estimated at $3.8 million at the acquisition date, is considered compensatory and will be recognized as compensation cost recorded in operating expense over the Earn-Out period, provided that such former Mazu employees are employees of Riverbed at the time the acquisition-related compensation costs is earned. As of December 31, 2009 the estimated fair value of the acquisition-related compensation costs was reduced to $3.0 million, due to a reduction in the probability-weighted bookings estimate. The estimated fair value of the acquisition-related compensation costs is considered compensatory and will be recognized over the service period from February 19, 2009 to March 31, 2010. During the year ended December 31, 2009, we recognized $2.4 million of acquisition-related compensation costs. If actual bookings achieve the next tier of consideration per the earn-out formula, the acquisition-related compensation costs would increase by $0.6 million, or more. If actual bookings do not achieve the next tier of consideration, the acquisition-related compensation costs would decrease by $1.4 million. The adjusted remaining unamortized acquisition-related compensation costs will be recognized in earnings during the three months ended March 31, 2010.
The following table shows the acquisition-related compensation costs recognized in operating expenses for the years ended December, 2009, 2008 and 2007, respectively:
| (in thousands) |
Year ended December 31, 2009 | ||
| Sales and marketing |
$ | 970 | |
| Research and development |
856 | ||
| General and administrative |
534 | ||
| Total acquisition-related compensation costs |
$ | 2,360 | |
Acquisition-related Costs
Acquisition-related costs recognized during the year ended December 31, 2009 include changes in the fair value of the acquisition-related contingent consideration, transaction costs and integration-related costs. During the year ended December 31, 2009, we recorded a net charge of $0.1 million, which included the cumulative changes in fair value of the acquisition-related contingent consideration to be paid directly to the Mazu shareholders of $1.3 million, offset by transaction costs such as legal, accounting, valuation and other professional services of $0.6 million and integration-related costs of $0.8 million.
76
Table of Contents
RIVERBED TECHNOLOGY, INC.
NOTES TO CONSOLIDATED FINANCIAL STATEMENTS — (Continued)
The following table summarizes the acquisition-related costs recognized in the year ended December 31, 2009:
| (in thousands) |
Year ended December 31, 2009 |
|||
| Transaction costs |
$ | 595 | ||
| Severance |
412 | |||
| Integration costs |
364 | |||
| Change in fair value of acquisition-related contingent consideration |
(1,267 | ) | ||
| Acquisition-related costs |
$ | 104 | ||
Results of Operations
The amount of revenue and operating loss of Mazu included in our consolidated statement of operations from the acquisition date to the period ended December 31, 2009 were as follows:
| (in thousands) |
Year ended December 31, 2009 |
|||
| Revenue |
$ | 9,713 | ||
| Operating loss |
$ | (5,048 | ) | |
Unaudited Pro Forma Financial Information for Mazu Acquisition
The following table presents our pro forma results (including Mazu) for each of the two years in the period-ended December 31, 2009 as though the companies had been combined as of the beginning of each of the periods presented. The pro forma information is presented for informational purposes only and is not indicative of the results of operations that would have been achieved if the acquisition had taken place at the beginning of each period presented. The pro forma results presented include acquisition-related costs, amortization charges for acquired intangible assets, eliminations of intercompany transactions, adjustments to interest expense and related tax effects.
| Year ended December 31, | |||||||
| (in thousands) |
2009 | 2008 | |||||
| Total revenue |
$ | 395,661 | $ | 347,953 | |||
| Operating income (loss) |
$ | 7,366 | $ | (17,523 | ) | ||
3. NET INCOME PER COMMON SHARE
Basic net income per common share is computed by dividing net income by the weighted average number of vested common shares outstanding during the period. Diluted net income per common share is computed by giving effect to all potential dilutive common shares, including stock awards and common stock subject to repurchase.
77
Table of Contents
RIVERBED TECHNOLOGY, INC.
NOTES TO CONSOLIDATED FINANCIAL STATEMENTS — (Continued)
The following table sets forth the computation of income per share:
| Year ended December 31, | |||||||||
| (in thousands, except per share data) |
2009 | 2008 | 2007 | ||||||
| Net income |
$ | 7,085 | $ | 10,601 | $ | 14,798 | |||
| Weighted average common shares outstanding — basic |
69,200 | 70,757 | 68,020 | ||||||
| Dilutive effect of employee stock plans |
2,340 | 2,510 | 5,224 | ||||||
| Weighted average common shares outstanding — diluted |
71,540 | 73,267 | 73,244 | ||||||
| Basic net income per share |
$ | 0.10 | $ | 0.15 | $ | 0.22 | |||
| Diluted net income per share |
$ | 0.10 | $ | 0.14 | $ | 0.20 | |||
The following weighted average outstanding options and RSUs were excluded from the computation of diluted net income per common share for the periods presented because including them would have had an anti-dilutive effect:
| (in thousands) |
Year ended December 31, | |||||
| 2009 | 2008 | 2007 | ||||
| Total potential shares of common stock excluded from the computation of earning per share (1) |
9,168 | 8,642 | 3,440 | |||
| (1) | Stock options outstanding with an exercise price higher than our average stock price for the periods presented, represent out-of-the-money awards and are excluded from the calculations of the diluted net income per share since the effect would have been anti-dilutive under the treasury stock method. |
4. FAIR VALUE OF ASSETS AND LIABILITIES
As of December 31, 2009, the fair value measurements of our cash and cash equivalents, marketable securities and acquisition-related contingent consideration consisted of the following:
| (in thousands) |
Total | Level 1 | Level 2 | Level 3 | ||||||||
| Assets: |
||||||||||||
| Corporate bonds and notes |
$ | 24,758 | $ | — | $ | 24,758 | $ | — | ||||
| Money market funds |
36,172 | 36,172 | — | — | ||||||||
| Cash |
6,819 | — | — | — | ||||||||
| Total cash and cash equivalents |
$ | 67,749 | $ | 36,172 | $ | 24,758 | $ | — | ||||
| Corporate bonds and notes |
$ | 33,072 | $ | — | $ | 33,072 | $ | — | ||||
| U.S. government backed securities |
48,984 | 48,984 | — | — | ||||||||
| U.S. government-sponsored enterprise obligations |
167,963 | — | 167,963 | — | ||||||||
| FDIC-backed certificates of deposit |
7,919 | 7,919 | — | — | ||||||||
| Total marketable securities |
$ | 257,938 | $ | 56,903 | $ | 201,035 | $ | — | ||||
| Liabilities: |
||||||||||||
| Acquisition-related contingent consideration |
$ | 11,002 | $ | — | $ | — | $ | 11,002 | ||||
78
Table of Contents
RIVERBED TECHNOLOGY, INC.
NOTES TO CONSOLIDATED FINANCIAL STATEMENTS — (Continued)
As of December 31, 2008, the fair value measurements of our cash and cash equivalents, and marketable securities consisted of the following:
| (in thousands) |
Total | Level 1 | Level 2 | Level 3 | ||||||||
| Assets: |
||||||||||||
| Corporate bonds and notes |
$ | 16,783 | $ | — | $ | 16,783 | $ | — | ||||
| Money market funds |
73,877 | 73,877 | — | — | ||||||||
| Cash |
4,718 | — | — | — | ||||||||
| Total cash and cash equivalents |
$ | 95,378 | $ | 73,877 | $ | 16,783 | $ | — | ||||
| Corporate bonds and notes |
$ | 33,487 | $ | — | $ | 33,487 | $ | — | ||||
| U.S. government backed securities |
69,829 | 69,829 | — | — | ||||||||
| U.S. government-sponsored enterprise obligations |
69,082 | — | 69,082 | — | ||||||||
| Total marketable securities |
$ | 172,398 | $ | 69,829 | $ | 102,569 | $ | — | ||||
As of December 31, 2009 and 2008, the marketable securities are recorded at amortized cost, which approximates fair market value. All investments mature in one year or less.
| (in thousands) |
Fair Value | Unrealized Gains |
Unrealized Losses |
|||||||
| Corporate bonds and notes |
$ | 19,570 | $ | 11 | $ | — | ||||
| Corporate bonds and notes |
13,502 | — | (6 | ) | ||||||
| U.S. government backed securities |
27,091 | 17 | — | |||||||
| U.S. government backed securities |
21,893 | — | (8 | ) | ||||||
| U.S. government-sponsored enterprise obligations |
118,366 | 72 | — | |||||||
| U.S. government-sponsored enterprise obligations |
49,597 | — | (61 | ) | ||||||
| FDIC-backed certificates of deposit |
4,083 | 3 | — | |||||||
| FDIC-backed certificates of deposit |
3,836 | — | (4 | ) | ||||||
| Total marketable securities at December 31, 2009 |
$ | 257,938 | $ | 103 | $ | (79 | ) | |||
| Corporate bonds and notes |
$ | 33,487 | $ | 39 | $ | — | ||||
| U.S. government backed securities |
65,839 | 259 | — | |||||||
| U.S. government backed securities |
3,990 | — | (1 | ) | ||||||
| U.S. government-sponsored enterprise obligations |
52,815 | 203 | — | |||||||
| U.S. government-sponsored enterprise obligations |
16,267 | — | (28 | ) | ||||||
| Total marketable securities at December 31, 2008 |
$ | 172,398 | $ | 501 | $ | (29 | ) | |||
Proceeds from the sales of available-for-sale securities were $16.3 million, $90.7 million and $11.0 million in the years ended December 31, 2009, 2008 and 2007, respectively. Gross realized gains or losses recorded on those sales during 2009, 2008 and 2007, were insignificant. Unrealized holding gains and (losses), net of tax, on available-for-sale securities in the amount of ($0.5) million, and $0.3 million and ($15,000) as of December 31, 2009, 2008 and 2007, respectively, have been included in accumulated other comprehensive income (loss).
We evaluate investments with unrealized losses to determine if the losses are other than temporary. The gross unrealized losses were primarily due to changes in interest rates. We have determined that the gross unrealized losses at December 31, 2009 are temporary. In making this determination, we considered the financial condition and near-term prospects of the issuers, the
79
Table of Contents
RIVERBED TECHNOLOGY, INC.
NOTES TO CONSOLIDATED FINANCIAL STATEMENTS — (Continued)
magnitude of the losses compared to the investments’ cost, the length of time the investments have been in an unrealized loss position and our intent and ability to hold the investment to maturity. Investments with unrealized losses have been in an unrealized loss position for less than a year.
Cash, Cash Equivalents and Marketable Securities
Cash and cash equivalents consist primarily of highly liquid investments in money market mutual funds, government sponsored enterprise obligations, treasury bills, commercial paper and other money market securities with remaining maturities at date of purchase of 90 days or less. The carrying value of cash and cash equivalents at December 31, 2009 and 2008 was $67.7 million and $95.4 million, and the weighted average interest rates were 0.4% and 2.6%, respectively. The carrying value approximates fair value at December 31, 2009 and 2008.
Marketable securities, which are classified as available for sale at December 31, 2009, are carried at fair value, with the unrealized gains and losses, net of tax, reported as a separate component of stockholders’ equity. Marketable securities consist of government sponsored enterprise obligations, treasury bills, FDIC-backed certificates of deposit and corporate bonds and notes. The fair value of our marketable securities is determined as the exit price in the principal market in which we would transact. Level 1 instruments are valued based on quoted market prices in active markets and include treasury bills, money market funds and FDIC-backed certificates of deposit. Level 2 instruments are valued based on quoted prices in markets that are not active, broker or dealer quotations, or alternative pricing sources with reasonable levels of price transparency and include corporate bonds and notes and government sponsored enterprise obligations. Level 3 instruments are valued based on unobservable inputs that are supported by little or no market activity and reflect our own assumptions in measuring fair value. We have no marketable securities valued as Level 3 instruments.
Restricted Cash
Pursuant to certain lease agreements and as security for our merchant services agreement with our financial institution, we are required to maintain cash reserves, classified as restricted cash. Current restricted cash totaled $1.5 million at December 31, 2009 and $0.1 million at December 31, 2008. Current restricted cash is included in prepaid and other assets in the consolidated balance sheet and consists primarily of collateral for letters of credit for the security deposit on the sublease of our corporate headquarters and is restricted until the end of the term of the sublease on August 30, 2010. Long-term restricted cash totaled $2.6 million at December 31, 2009 and $3.5 million at December 31, 2008. Long-term restricted cash is included in other assets in the consolidated balance sheets and consists primarily of funds held as collateral for letters of credit for the security deposit on the leases of our corporate headquarters and is restricted until the end of the lease terms on July 31, 2014.
80
Table of Contents
RIVERBED TECHNOLOGY, INC.
NOTES TO CONSOLIDATED FINANCIAL STATEMENTS — (Continued)
5. INVENTORY
Inventories consist primarily of hardware and related component parts and evaluation units located at customer locations, and are stated at the lower of cost (on a first-in, first-out basis) or market. Inventory is comprised of the following:
| (in thousands) |
As of December 31, | |||||
| 2009 | 2008 | |||||
| Raw materials |
$ | 625 | $ | 544 | ||
| Finished goods |
5,892 | 7,545 | ||||
| Evaluation units |
3,225 | 2,548 | ||||
| Total |
$ | 9,742 | $ | 10,637 | ||
6. GOODWILL AND INTANGIBLE ASSETS
Goodwill
Goodwill represents the excess of the purchase price of an acquired business over the fair value of the underlying net tangible and intangible assets. We consider the acquired business an addition to our product portfolio and not an additional reporting unit or operating segment. Goodwill is tested for impairment at least annually (more frequently if certain indicators are present). In the event that management determines that the value of goodwill has become impaired, we will incur an accounting charge for the amount of impairment during the quarter in which the determination is made. We record goodwill adjustments for the effect on goodwill due to changes to net assets acquired during the measurement period, which is generally up to one year from the date of acquisition. Goodwill at December 31, 2009 was $11.3 million. None of the goodwill is expected to be deductible for income tax purposes.
The following is a summary of the goodwill activity during the year ended December 31, 2009:
| (in thousands) |
Year ended December 31, 2009 |
|||
| Beginning balance |
$ | — | ||
| Acquisition of Mazu |
11,711 | |||
| Goodwill adjustments |
(399 | ) | ||
| Ending balance |
$ | 11,312 | ||
Intangible Assets
Intangible assets consisted of the following:
| (in thousands) |
Useful life | As of December 31, 2009 | ||||||||||
| Gross | Accumulated Amortization |
Net | ||||||||||
| Existing technology |
5 years | $ | 12,100 | $ | (2,082 | ) | $ | 10,018 | ||||
| Patents |
5 years | 2,700 | $ | (464 | ) | 2,236 | ||||||
| Maintenance agreements |
5 years | 6,100 | $ | (1,049 | ) | 5,051 | ||||||
| Customer contracts |
5 years | 2,000 | $ | (344 | ) | 1,656 | ||||||
| Trademarks |
3 years | 600 | $ | (172 | ) | 428 | ||||||
| Total intangible assets |
$ | 23,500 | $ | (4,111 | ) | $ | 19,389 | |||||
81
Table of Contents
RIVERBED TECHNOLOGY, INC.
NOTES TO CONSOLIDATED FINANCIAL STATEMENTS — (Continued)
Amortization expense was $4.1 million for the year ended December 31, 2009.
Estimated future amortization expense related to the above intangible assets at December 31, 2009 is as follows:
| Fiscal Year |
In thousands | ||
| 2010 |
$ | 4,780 | |
| 2011 |
4,780 | ||
| 2012 |
4,608 | ||
| 2013 |
4,580 | ||
| 2014 |
641 | ||
| Thereafter |
— | ||
| Total |
$ | 19,389 | |
7. FIXED ASSETS
Fixed assets are stated at cost. Depreciation is calculated using the straight-line method over the estimated useful lives of the respective assets, which is typically two to five years. Leasehold improvements are amortized using the straight-line method over the shorter of the lease term or estimated useful life of the asset. Repair and maintenance costs are expensed as incurred.
Fixed assets consisted of the following:
| (in thousands) |
Estimated Useful Lives |
As of December 31, | ||||||||
| 2009 | 2008 | |||||||||
| Computer hardware and equipment |
3 years | $ | 19,070 | $ | 15,641 | |||||
| Leasehold improvements |
2-5 years | 10,052 | 9,432 | |||||||
| Furniture and fixtures |
3 years | 4,583 | 4,332 | |||||||
| Software |
2-5 years | 12,338 | 7,057 | |||||||
| Total fixed assets |
46,043 | 36,462 | ||||||||
| Accumulated depreciation and amortization |
(24,345 | ) | (14,469 | ) | ||||||
| Fixed assets, net |
$ | 21,698 | $ | 21,993 | ||||||
Depreciation and amortization expense of fixed assets was $10.1 million, $7.9 million and $4.2 million for the years ended December 31, 2009, 2008 and 2007, respectively.
8. OTHER ACCRUED LIABILITIES
Other accrued liabilities consisted of the following:
| (in thousands) |
As of December 31, | |||||
| 2009 | 2008 | |||||
| Deferred rent liability |
$ | 5,684 | $ | 4,783 | ||
| Acquisition-related contingent consideration |
11,002 | — | ||||
| Other accrued liabilities |
9,290 | 8,559 | ||||
| Total other accrued liabilities |
$ | 25,976 | $ | 13,342 | ||
82
Table of Contents
RIVERBED TECHNOLOGY, INC.
NOTES TO CONSOLIDATED FINANCIAL STATEMENTS — (Continued)
9. DEFERRED REVENUE
Deferred revenue consisted of the following:
| (in thousands) |
As of December 31, | |||||
| 2009 | 2008 | |||||
| Product |
$ | 5,264 | $ | 4,987 | ||
| Support and services |
81,186 | 53,174 | ||||
| Total deferred revenue |
$ | 86,450 | $ | 58,161 | ||
| Reported as: |
||||||
| Deferred revenue, current |
$ | 64,478 | $ | 45,194 | ||
| Deferred revenue, non-current |
21,972 | 12,967 | ||||
| Total deferred revenue |
$ | 86,450 | $ | 58,161 | ||
Deferred product revenue relates to arrangements where not all revenue recognition criteria have been met. Deferred support revenue represents customer payments made in advance for support contracts. Support contracts are typically billed on a per annum basis in advance and revenue is recognized ratably over the support period. Deferred revenue, non-current consists primarily of customer payments made in advance for support contracts with terms of more than 12 months.
10. GUARANTEES
Our agreements with customers, as well as our reseller agreements, generally include certain provisions for indemnifying customers and resellers and their affiliated parties against liabilities if our products infringe a third party’s intellectual property rights. To date, we have not incurred any material costs as a result of such indemnifications and have not accrued any liabilities related to such obligations in our consolidated financial statements.
As permitted or required under Delaware law and to the maximum extent allowable under that law, we have certain obligations to indemnify our officers, directors and certain key employees for certain events or occurrences while the officer, director or employee is or was serving at our request in such capacity. These indemnification obligations are valid as long as the director, officer or employee acted in good faith and in a manner the person reasonably believed to be in or not opposed to the best interests of the corporation, and, with respect to any criminal proceeding, had no reasonable cause to believe his or her conduct was unlawful. The maximum potential amount of future payments we could be required to make under these indemnification obligations is unlimited; however, we have a director and officer insurance policy that mitigates our exposure and enables us to recover a portion of any future amounts paid.
83
Table of Contents
RIVERBED TECHNOLOGY, INC.
NOTES TO CONSOLIDATED FINANCIAL STATEMENTS — (Continued)
11. LEASE COMMITMENTS
We lease our facilities under non-cancelable operating lease agreements. Future minimum commitments for these operating leases in place as of December 31, 2009 with a remaining non-cancelable lease term in excess of one year are as follows:
| (in thousands) |
December 31, 2009 | ||
| 2010 |
$ | 6,282 | |
| 2011 |
7,773 | ||
| 2012 |
6,726 | ||
| 2013 |
5,562 | ||
| 2014 |
3,153 | ||
| Thereafter |
— | ||
| Total |
$ | 29,496 | |
The terms of certain lease agreements provide for rental payments on a graduated basis. We recognize rent expense on the straight-line basis over the lease period and have accrued for rent expense incurred but not paid. Rent expense under operating leases was $8.2 million, $7.1 million and $5.3 million for the years ended December 31, 2009, 2008 and 2007, respectively.
On September 26, 2006, we entered into an Agreement of Sublease (Sublease) for our corporate headquarters, and on March 21, 2007 entered into another lease agreement to expand our corporate headquarters as well as extend the term of the existing Sublease mentioned above. The terms of the leases are from February 1, 2007 and March 31, 2007, respectively, to July 31, 2014, with two five year renewal options. The aggregate minimum lease commitment for the combined leases is $16.4 million and is included in the table above. We have entered into two letters of credit totaling $3.5 million to serve as security deposits for the leases, which is included in other current assets and other assets in the consolidated balance sheet.
On July 3, 2007, we entered into a lease agreement for office space in Sunnyvale, California. The term of the lease is for five years and seven months, with two five year renewal options, commencing on January 1, 2008. The aggregate minimum lease commitment is $3.1 million and is reflected in the table above. On July 2, 2007, we entered into a letter of credit in the amount of $0.5 million to serve as the security deposit for the lease.
On February 29, 2009, we entered into a lease agreement for office space in Boston, Massachusetts. The term of the lease is five years, with one five year renewal option, commencing on March 1, 2009. The aggregate minimum lease commitment is $1.9 million and is reflected in the table above.
In the year ended December 31, 2009, we entered into two lease agreements for co-location space. Each of the leases extends five years with an aggregate minimum commitment totaling $4.6 million, which is reflected in the table above.
84
Table of Contents
RIVERBED TECHNOLOGY, INC.
NOTES TO CONSOLIDATED FINANCIAL STATEMENTS — (Continued)
12. COMMON STOCK
Stock Plans
In July 2002, our Board of Directors adopted the 2002 Stock Plan (the “2002 Plan”). In April and May 2006, our Board of Directors approved the 2006 Equity Incentive Plan (the “2006 Plan”), the Purchase Plan and the 2006 Director Stock Option Plan, which became effective upon our IPO. In September 2006, all shares of common stock available for grant under the 2002 Plan transferred to the 2006 Plan.
The Plans provide for automatic replenishments as follows:
| Ÿ | 2006 Plan — increased on January 1 of each year for five years, beginning in 2007, by a number equal to the lesser of (i) 4,000,000 shares or (ii) 5% of the shares of common stock outstanding at that time or (iii) the number of shares determined by the Board. |
| Ÿ | 2006 Employee Stock Purchase Plan — increased on January 1 of each year for the term of the 2006 Employee Stock Purchase Plan by a number of shares equal to the lesser of (i) 750,000 shares or (ii) 1% of the shares of common stock outstanding at that time or (iii) the number of shares determined by the Board. |
| Ÿ | 2006 Director Stock Option Plan — increased on January 1 of each year for the term of the 2006 Director Stock Option Plan by 250,000 shares. |
In February 2009, our Board of Directors adopted the 2009 Inducement Equity Inventive Plan (the “2009 Plan”). The objective of the 2009 Plan is to provide incentives to attract, retain, and motivate eligible persons whose potential contributions are important to promote our long-term success and the creation of stockholder value. The 2009 Plan is intended to comply with NASDAQ Rule 4350(i)(1)(A)(iv), which governs granting certain awards as a material inducement to an individual entering into employment with us. The 2009 Plan may be used for new hire equity grants should the Board of Directors determine to do so in the future.
As of December 31, 2009, 2,152,770 shares were available for grant under the 2006 Plan and the 2006 Director Plan. As of December 31, 2009, 1,173,850 shares were available for grant under the 2009 Plan.
Share-Based Payments Valuation Assumptions
The fair value of options granted and Purchase Plan shares granted was estimated at the date of grant using the following assumptions:
| Year ended December 31, | ||||||
| 2009 | 2008 | 2007 | ||||
| Employee Stock Options (1) |
||||||
| Expected life in years |
4.5 | 4.5 | 4.5 - 6.0 | |||
| Risk-free interest rate |
1.5% - 2.1% | 2.5% - 3.1% | 3.4% - 4.9% | |||
| Volatility |
50% - 52% | 50% - 51% | 51% - 62% | |||
| Weighted average fair value of grants |
$7.14 | $6.84 | $17.54 | |||
| (1) | Assumptions used in 2008 exclude the assumptions used related to the modification accounting associated with the Tender Offer. Such assumptions include an expected life of 2.5 years to 3.6 years, a risk-free interest rate of 2.4% to 2.6% and a volatility of 48% to 49%. |
85
Table of Contents
RIVERBED TECHNOLOGY, INC.
NOTES TO CONSOLIDATED FINANCIAL STATEMENTS — (Continued)
| Year ended December 31, | ||||||
| 2009 | 2008 | 2007 | ||||
| Purchase Plan |
||||||
| Expected life in years |
0.5 - 2.0 | 0.5 - 2.0 | 0.5 - 2.0 | |||
| Risk-free interest rate |
0.15% - 0.93% | 1.3% - 2.4% | 4.0% - 5.0% | |||
| Volatility |
48% - 83% | 47% - 71% | 38% - 46% | |||
| Weighted average fair value of grants |
$8.71 | $5.09 | $11.36 | |||
We estimated the fair value of stock options granted using the Black-Scholes option-pricing formula and a single option award approach. This model utilizes the estimated fair value of common stock and requires that, at the date of grant, we use the expected term of the option, the expected volatility of the price of our common stock, risk-free interest rates and expected dividend yield of our common stock. The fair value is amortized on a straight-line basis over the requisite service periods of the awards, which is generally three to four years.
The expected term represents the period that stock-based awards are expected to be outstanding. For the years ended December 31, 2009, 2008 and 2007, we have elected to use the simplified method of determining the expected term of stock options due to our insufficient historical exercise data. The computation of expected volatility for stock options for the years ended December 31, 2009, 2008 and 2007, is based on the historical volatility of comparable companies from a representative peer group selected based on industry, financial and market capitalization data. The computation of expected volatility for the Purchase Plan for the year ended December 31, 2009, is based on our historical volatility. The computation of expected volatility for the Purchase Plan for the years ended December 31, 2008 and 2007, is based on historical volatility of comparable companies. Management estimated expected forfeitures and is recognizing compensation costs only for those equity awards expected to vest.
Stock Options
Options issued under our stock option plans are generally for periods not to exceed 10 years and are issued with an exercise price equal to the market value of our common stock on the date of grant, as determined by the last sale price of such stock on the Nasdaq Global Select Market. Options typically vest either 25% of the shares one year after the options’ vesting commencement date and the remainder ratably on a monthly basis over the following three years, or ratably on a monthly basis over four years. Options granted under the 2002 Plan prior to May 31, 2006 have a maximum term of ten years, and beginning May 31, 2006 have a maximum term of seven years. Options granted under the 2006 Plan have a maximum term of seven years. Options granted under the 2006 Director Option Plan prior to March 4, 2008 have a maximum term of ten years, and options granted beginning March 4, 2008 have a maximum term of seven years. Options granted under the 2009 Plan have a maximum term of seven years.
Options granted under the 2002 Plan to the employees in the U.S. prior to March 28, 2006 were immediately exercisable. For options granted beginning March 28, 2006, optionees may only exercise vested shares. Any unvested stock issued upon early exercise under the 2002 Plan were subject to repurchase by us. Grants made pursuant to the 2006 Plan do not provide for the early exercise of options. At December 31, 2009, no shares were subject to repurchase.
As of December 31, 2009, total compensation cost related to stock options granted to employees and directors but not yet recognized was $58.8 million, net of estimated forfeitures of $14.6 million.
86
Table of Contents
RIVERBED TECHNOLOGY, INC.
NOTES TO CONSOLIDATED FINANCIAL STATEMENTS — (Continued)
This cost will be recognized on a straight-line basis over the remaining weighted-average service period of 2.27 years. Stock-based compensation recognized in the years ended December 31, 2009, 2008 and 2007 was $39.0 million, $36.9 million and $18.9 million, respectively. In addition, during the years ended December 31, 2009, 2008 and 2007, we amortized $1.0 million, $2.0 million and $2.3 million, respectively, of deferred compensation expense, net of reversals for terminations, related to options valued under the intrinsic method.
The following table summarizes information about stock options activity under all stock option plans:
| (in thousands, except per share amounts) |
Options Outstanding |
Weighted Average Exercise Price |
Weighted Average Remaining Contractual Term (in years) |
Aggregate Intrinsic Value | |||||||
| Balance, December 31, 2008 |
13,285 | $ | 14.67 | 5.49 | $ | 23,174 | |||||
| Granted |
1,519 | $ | 16.24 | ||||||||
| Exercised |
(1,609 | ) | $ | 8.65 | |||||||
| Forfeited or expired |
(728 | ) | $ | 15.02 | |||||||
| Balance, December 31, 2009 |
12,467 | $ | 15.62 | 4.84 | $ | 103,139 | |||||
| Exercisable |
6,337 | $ | 14.73 | 4.63 | $ | 59,360 | |||||
| Vested and expected to vest |
11,935 | $ | 15.58 | 4.83 | $ | 99,571 | |||||
The range of exercise prices for options outstanding at December 31, 2009 was $0.05 to $42.78.
| Options Outstanding | Options Exercisable | |||||||||||
| Range of Exercise Price |
Number Outstanding |
Weighted Average Remaining Contractual Life |
Weighted Average Exercise Price |
Number Exercisable |
Weighted Average Exercise Price | |||||||
| (in years) | ||||||||||||
| $0.05 – $6.50 |
2,262 | 5.60 | $ | 4.90 | 1,937 | $ | 4.71 | |||||
| $6.51 – $14.38 |
3,824 | 5.33 | $ | 13.16 | 1,245 | $ | 13.59 | |||||
| $14.38 – $17.95 |
4,291 | 3.68 | $ | 17.65 | 2,324 | $ | 17.79 | |||||
| $17.96 – $42.78 |
2,090 | 5.50 | $ | 27.56 | 831 | $ | 31.25 | |||||
| $0.05 – $42.78 |
12,467 | 4.84 | $ | 15.62 | 6,337 | $ | 14.73 | |||||
The aggregate intrinsic value is calculated as the difference between the exercise price of the underlying stock option awards and the closing price of our common stock at December 31, 2009. During the years ended December 31, 2009, 2008 and 2007, the aggregate intrinsic value of stock option awards exercised was $15.9 million, $13.7 million, and $50.0 million, respectively, determined at the date of option exercise.
The weighted average grant-date fair value of options granted for the years ended December 31, 2009, 2008 and 2007, was $7.14, $6.84, and $17.54, respectively.
During the second quarter of 2008, we filed a Tender Offer Statement on Schedule TO with the SEC pursuant to which we extended an offer to non-section 16 reporting employees to exchange up to an aggregate of 5,511,495 options to purchase shares of our common stock, whether vested or
87
Table of Contents
RIVERBED TECHNOLOGY, INC.
NOTES TO CONSOLIDATED FINANCIAL STATEMENTS — (Continued)
unvested. Options granted prior to May 1, 2008 with an exercise price greater than 120% of the closing market price on April 30, 2008 were eligible to be tendered pursuant to the offer. The closing market price on April 30, 2008 was $13.67. In accordance with the Tender Offer (the “TO”), the number of new options issued was based on an exchange ratio of 0.85 new shares for each share exchanged based on the number of options tendered. A total of 5,246,325 options were tendered and cancelled, and a total of 4,459,392 options were granted on May 30, 2008 at $17.95 per share. The new options retained the vesting schedule of the options exchanged. The TO was subject to modification accounting whereby the total compensation cost measured at the date of modification was the portion of the grant-date fair value of the original award for which the requisite service was expected to be rendered (or had already been rendered) at that date plus the incremental cost resulting from the modification. The incremental cost resulting from the modification is measured as the excess of the fair value of the modified award over the fair value of the original award immediately before its terms were modified. The incremental fair value of $5.5 million for the new awards was computed using an expected life of 2.5 years to 3.6 years, a risk-free interest rate of 2.4% to 2.6% and a volatility of 48% to 49%. The $407,000 incremental fair value of the vested awards was recognized as compensation expense on the modification date in 2008. The $5.1 million incremental fair value of the unvested awards is being amortized over the remaining service period.
Restricted Stock Units
In the year ended December 31, 2009, we granted RSUs covering 2.5 million shares of common stock to our employees under the 2006 Plan, which included performance-based RSUs to eligible executives covering 1.2 million shares of common stock. We expense the cost of RSUs, which is determined to be the fair market value of the shares of our common stock at the date of grant, ratably over the service period.
The number of performance-based RSUs that vest is variable based upon meeting certain annual performance targets, and require the eligible executives to be employed by us for up to three years from the date of grant. As of December 31, 2009, the annual performance achievement and the related performance-based RSUs that were earned were determined. In connection with the performance-based RSUs, we recorded stock compensation expense in operating expenses in the amount of $3.5 million, for the year ended December 31, 2009. No expense was recorded in 2008 and 2007 for performance-based RSUs.
RSUs generally vest over a period of three to four years from the date of grant. Until vested, RSUs do not have the voting rights of common stock and the shares underlying the awards are not considered issued and outstanding.
As of December 31, 2009, total unrecognized compensation cost related to nonvested RSUs to employees and directors but not yet recognized was $29.6 million, net of estimated forfeitures of $6.1 million. This cost will be recognized over the remaining weighted-average service period of 2.67 years. Amortization in the years ended December 31, 2009, 2008 and 2007 was $9.1 million, $1.9 million and zero, respectively.
88
Table of Contents
RIVERBED TECHNOLOGY, INC.
NOTES TO CONSOLIDATED FINANCIAL STATEMENTS — (Continued)
The following table summarizes information about nonvested stock awards as of December 31, 2009:
| (in thousands, except per share amounts) |
Number of Shares | Weighted Average Grant Date Fair Value | ||||
| Balance, December 31, 2008 |
831 | $ | 14.38 | |||
| Granted |
2,531 | $ | 15.21 | |||
| Vested |
(401 | ) | $ | 13.63 | ||
| Forfeited |
(112 | ) | $ | 16.78 | ||
| Balance, December 31, 2009 |
2,849 | $ | 15.11 | |||
The weighted average grant-date fair value of RSUs granted in the years ended December 31, 2009 and 2008 were $15.21 and $14.38, respectively. No RSUs were granted in the year ended December 31, 2007.
Stock Purchase Plan
Under the Purchase Plan, employees may purchase shares of common stock through payroll deductions at a price per share that is 85% of the lesser of the fair market value of our common stock as of the beginning of an applicable offering period or the applicable purchase date. Offering periods are generally 24 months with purchases generally every six months. Employees’ payroll deductions may not exceed 15% of their compensation. Employees may purchase up to 2,000 shares per purchase period provided that the value of the shares purchased in any calendar year does not exceed IRS limitations.
In the year ended December 31, 2009, there was $6.4 million of total compensation cost, net of estimated forfeitures, left to be amortized under our Purchase Plan, which will be amortized over the remaining Purchase Plan offering period, which is up to 19 months. Amortization in the years ended December 31, 2009, 2008 and 2007 was $7.1 million, $9.6 million and $10.6 million, respectively.
As of December 31, 2009, 839,387 shares were available under the Purchase Plan.
Share Repurchase Program
On April 21, 2008, our Board of Directors authorized a Share Repurchase Program (the “Program”), which authorizes us to repurchase and retire up to $100.0 million of our outstanding common stock during a period not to exceed 24 months from the Board authorization date. The Program does not require us to purchase a minimum number of shares, and may be suspended, modified or discontinued at any time. For the year ended December 31, 2009, we repurchased 1,955,000 shares of common stock under this Program on the open market for an aggregate purchase price of approximately $29.0 million, or an average of $14.84 per share. In 2008, we repurchased 4,027,706 shares of common stock under this Program for an aggregate purchase price of approximately $50.0 million, or an average of $12.41 per share. The timing and amounts of these purchases were based on market conditions and other factors including price, regulatory requirements and capital availability. The share repurchases were financed by available cash balances and cash from operations.
89
Table of Contents
RIVERBED TECHNOLOGY, INC.
NOTES TO CONSOLIDATED FINANCIAL STATEMENTS — (Continued)
13. INCOME TAXES
A geographical breakdown of income before provision for income taxes is shown in the following table:
| Year ended December 31, | ||||||||||||
| (in thousands) |
2009 | 2008 | 2007 | |||||||||
| Domestic |
$ | 19,842 | $ | 8,022 | $ | 23,340 | ||||||
| Foreign |
(8,457 | ) | (5,753 | ) | (3,307 | ) | ||||||
| Total |
$ | 11,385 | $ | 2,269 | $ | 20,033 | ||||||
The provision (benefit) for income tax expense consists of the following:
| Year ended December 31, | |||||||||||
| (in thousands) |
2009 | 2008 | 2007 | ||||||||
| Current: |
|||||||||||
| Federal |
$ | 15,149 | $ | 20,399 | $ | 4,177 | |||||
| State |
2,122 | 2,972 | 768 | ||||||||
| Foreign |
1,336 | 916 | 290 | ||||||||
| Total Current |
$ | 18,607 | $ | 24,287 | $ | 5,235 | |||||
| Deferred: |
|||||||||||
| Federal |
$ | (11,075 | ) | $ | (27,338 | ) | $ | — | |||
| State |
(2,090 | ) | (5,281 | ) | — | ||||||
| Foreign |
(1,142 | ) | — | — | |||||||
| Total Deferred |
$ | (14,307 | ) | $ | (32,619 | ) | $ | — | |||
| Total Provision (Benefit) |
$ | 4,300 | $ | (8,332 | ) | $ | 5,235 | ||||
Our effective tax rate was 38%, (367%), and 26% for the years ended December 31, 2009, 2008 and 2007, respectively. We have not provided U.S. taxes for our foreign earnings because such earnings are intended to be indefinitely reinvested outside the U.S.
The difference between the provision (benefit) for income taxes and the amount computed by applying the federal statutory income tax rate to income before taxes is as follows:
| Year ended December 31, | ||||||||||||
| (in thousands) |
2009 | 2008 | 2007 | |||||||||
| Expected provision at federal statutory rate |
$ | 3,985 | $ | 793 | $ | 7,011 | ||||||
| State taxes, net of federal benefit |
12 | (3,353 | ) | 521 | ||||||||
| Stock-based compensation expense |
3,125 | 4,509 | 3,880 | |||||||||
| Non-deductible expenses |
278 | 274 | 137 | |||||||||
| Foreign rate differential |
14 | 290 | 81 | |||||||||
| Research and development tax credits |
(1,658 | ) | (1,012 | ) | (1,534 | ) | ||||||
| Change in valuation allowance |
(746 | ) | (8,060 | ) | (4,861 | ) | ||||||
| Manufacturing deduction |
(730 | ) | (898 | ) | — | |||||||
| Acquisition related expenses |
(235 | ) | — | — | ||||||||
| Other (net) |
255 | (875 | ) | — | ||||||||
| Total |
$ | 4,300 | $ | (8,332 | ) | $ | 5,235 | |||||
90
Table of Contents
RIVERBED TECHNOLOGY, INC.
NOTES TO CONSOLIDATED FINANCIAL STATEMENTS — (Continued)
The components of the current and deferred tax assets and liabilities consist of the following:
| As of December 31, | ||||||||
| (in thousands) |
2009 | 2008 | ||||||
| Current deferred tax assets: |
||||||||
| Other accrued liabilities and reserves |
$ | 6,231 | $ | 5,039 | ||||
| Deferred compensation |
2,980 | 1,146 | ||||||
| Net operating losses |
1,359 | — | ||||||
| Depreciation and amortization |
747 | — | ||||||
| Deferred revenue |
(399 | ) | — | |||||
| Valuation allowance |
(1,467 | ) | — | |||||
| Total current deferred tax assets |
$ | 9,451 | $ | 6,185 | ||||
| Non-current deferred tax assets: |
||||||||
| Deferred compensation |
$ | 26,903 | $ | 18,655 | ||||
| Net operating losses |
12,979 | — | ||||||
| Deferred revenue |
5,960 | 3,390 | ||||||
| Credit carryforwards |
4,826 | 3,408 | ||||||
| Other accrued liabilities and reserves |
2,124 | 1,855 | ||||||
| State taxes |
(3,258 | ) | (2,589 | ) | ||||
| Depreciation and amortization |
(2,256 | ) | (2,398 | ) | ||||
| Intangible assets |
(1,290 | ) | 5,476 | |||||
| Valuation allowance |
(7,369 | ) | (764 | ) | ||||
| Total non-current deferred tax assets |
$ | 38,619 | $ | 27,033 | ||||
As of December 31, 2009, we had net operating loss carryforwards for federal, state and foreign income tax purposes of $38.9 million, $20.9 million and $2.8 million, respectively. The utilization of the federal loss carryforwards are subject to limitation under Section 382 of the Internal Revenue Code. We also had state research and development tax credit carryforwards of approximately $6.1 million. If not utilized, the federal net operating loss will expire between 2022 and 2027, while the state net operating loss will expire between 2013 and 2016. The state tax credit carryforwards and foreign net operating loss carryforwards do not expire.
For years prior to 2008, we recorded a full valuation allowance because of the uncertainty of the realization of the deferred tax assets. Realization of our deferred tax assets is dependent primarily upon future taxable income. In assessing the need for a valuation allowance, we considered our historical levels of income, expectations of future taxable income and on going tax planning strategies.
In the year ended December 31, 2008, management reevaluated the need for a full valuation allowance on its deferred tax assets as a result of cumulative profits generated in the most recent three year period as well as other positive evidence. As a result of this evaluation, we concluded that it is more likely than not that we will generate sufficient taxable income to realize a significant portion of our deferred tax assets. Accordingly, we reversed the valuation allowance against our domestic deferred tax assets and maintained a valuation allowance on certain foreign deferred tax assets.
In the year ended December 31, 2009, management reevaluated the need for a valuation allowance on our foreign deferred tax assets. As a result of this evaluation, we concluded that it is more likely than not that we will realize sufficient future taxable income to utilize our foreign deferred
91
Table of Contents
RIVERBED TECHNOLOGY, INC.
NOTES TO CONSOLIDATED FINANCIAL STATEMENTS — (Continued)
tax assets. Accordingly, we reversed the valuation allowance against our foreign deferred tax assets and recorded an income tax benefit of $0.7 million in 2009.
As part of our accounting for the acquisition of Mazu, we established deferred tax assets for federal net operating loss carryforwards and research and development credit carryforwards that are subject to limitation under Section 382 of the Internal Revenue Code. Accordingly, we recorded a valuation allowance of $8.8 million related to a portion of the federal net operating loss carryforwards and research and development credit carryforwards that we do not expect to be realized. Any subsequent reduction of the valuation allowance and the recognition of the associated tax benefits will be recorded to our provision for income taxes.
During 2009, we reduced our current federal, foreign and state taxes payable by $1.8 million for the excess tax benefits from stock option exercises, offsetting additional paid-in capital. In addition, we have unrecorded excess tax benefits from stock option exercises of approximately $1.9 million as of December 31, 2009. These amounts will be credited to additional paid-in-capital when such amounts reduce cash taxes payable.
Uncertain Income Tax Positions
A reconciliation of the beginning and ending amount of the consolidated liability for unrecognized income tax benefits during the year is as follows:
| Year ended December 31, | ||||||||||
| (in thousands) |
2009 | 2008 | 2007 | |||||||
| Beginning Balance |
$ | 2,580 | $ | 298 | $ | — | ||||
| Additions for tax positions of prior years |
422 | 1,766 | 298 | |||||||
| Additions for tax positions related to current year |
2,759 | 516 | — | |||||||
| Reductions for tax positions of prior year |
(820 | ) | — | — | ||||||
| Settlements |
— | — | — | |||||||
| Ending Balance |
$ | 4,941 | $ | 2,580 | $ | 298 | ||||
Included in the unrecognized tax benefits of $4.9 million at December 31, 2009 was approximately $4.2 million of tax benefits that, if recognized, would reduce our annual effective tax rate. During 2009, we accrued $0.1 million of interest and penalties associated with uncertain tax positions. Over the next 12 months, we do not expect any part of our unrecognized tax benefits to be reduced. The statute of limitations for federal, state, and United Kingdom (UK) tax purposes are generally three, four, and three years respectively; however, we continue to carryover tax attributes prior to these periods for federal and state purposes, which would still be open for examination by the respective tax authorities. Accordingly, all years since our inception are open to tax examinations for federal and state purposes. Our UK tax returns from 2006 to the present remain open for examination.
14. SEGMENT INFORMATION
Operating segments are defined as components of an enterprise about which separate financial information is available that is evaluated regularly by the chief operating decision maker, or decision making group, in deciding how to allocate resources and in assessing performance. Our chief operating decision maker is our Chief Executive Officer. Our Chief Executive Officer reviews financial information presented on a consolidated basis, accompanied by information about revenue by
92
Table of Contents
RIVERBED TECHNOLOGY, INC.
NOTES TO CONSOLIDATED FINANCIAL STATEMENTS — (Continued)
geographic region for purposes of allocating resources and evaluating financial performance. We have one business activity and there are no segment managers who are held accountable for operations, operating results and plans for levels or components below the consolidated unit level. Accordingly, we are considered to be in a single reporting segment and operating unit structure.
Revenue by geography is based on the billing address of the customer. The following table sets forth revenue by geographic area.
Revenue
| For the year ended December 31, | |||||||||
| (in thousands) |
2009 | 2008 | 2007 | ||||||
| United States |
$ | 221,206 | $ | 193,190 | $ | 148,171 | |||
| Europe, Middle East and Africa |
104,990 | 87,446 | 49,571 | ||||||
| Rest of the World |
67,950 | 52,713 | 38,664 | ||||||
| Total revenue |
$ | 394,146 | $ | 333,349 | $ | 236,406 | |||
15. EMPLOYEE BENEFIT PLAN
We have a 401(k) plan covering all eligible employees. We are not required to contribute to the plan and have made no contributions through December 31, 2009.
16. LEGAL MATTERS
During the year ended December 31, 2008, we entered into a mutual release and settlement agreement (the “Settlement Agreement”) with Quantum Corporation (“Quantum”) and certain affiliates of Quantum, pursuant to which we jointly executed and filed dismissals of patent infringement actions brought in the United States District Court for the Northern District of California. Pursuant to the terms of the Settlement Agreement, we paid Quantum a lump sum of $11.0 million, and entered into a perpetual covenant not to sue each other or certain other parties related to the patents in question and certain patents related to data de-duplication as well as a three-year covenant not to file any patent infringement lawsuits against each other or certain other parties. In addition, we released each other from any and all claims, demands, losses, liabilities and causes of action relating to any infringement of any patent based on acts occurring prior to the date of the Settlement Agreement. Based on the terms of the Settlement Agreement we recorded operating expense of $11.0 million during 2008, which was recorded as Other charges in our consolidated statements of operations.
From time to time, we are involved in various legal proceedings, claims and litigation arising in the ordinary course of business. There are no currently pending legal proceedings at December 31, 2009 that, in the opinion of management, might have a material adverse effect on our financial position, results of operations or cash flows.
17. RELATED PARTIES
No significant related party transactions occurred in the year ended December 31, 2009.
93
Table of Contents
RIVERBED TECHNOLOGY, INC.
NOTES TO CONSOLIDATED FINANCIAL STATEMENTS — (Continued)
18. NEW ACCOUNTING PRONOUNCEMENTS
Effective January 1, 2009, we adopted ASC Topic 805, Business Combinations. Under ASC Topic 805, an acquiring entity is required to recognize all the assets acquired, liabilities assumed, contractual contingencies, and contingent consideration at their fair value on the acquisition date. It further requires that acquisition-related costs be recognized separately from the acquisition and expensed as incurred; that restructuring costs generally be expensed in periods subsequent to the acquisition date; that changes in the estimated fair value of contingent consideration after the initial measurement on the acquisition date be recognized in earnings in the period of the change in estimate; and changes in accounting for deferred tax asset valuation allowances and acquired income tax uncertainties after the measurement period be recognized as a component of provision for taxes. In addition, acquired in-process research and development is capitalized as an intangible asset and amortized over its estimated useful life. See Note 2 for a description of our acquisition of Mazu Networks, Inc.
Effective January 1, 2009, we adopted ASC Topic 350, Intangibles – Goodwill and Other, which amends the factors considered in developing renewal or extension assumptions used to determine the useful life of a recognized intangible asset. ASC Topic 350 requires an entity to consider its own assumptions about renewal or extension of the term of the arrangement, consistent with its expected use of the asset. The adoption did not have a material impact on our consolidated financial statements.
Effective January 1, 2009, we adopted ASC Topic 820, Fair Value Measurements. ASC Topic 820 delayed the effective date of its application for all non-financial assets and non-financial liabilities, except for items that are recognized or disclosed at fair value in the financial statements on a recurring basis (at least annually), until the beginning of the first quarter of fiscal 2009. The adoption of ASC Topic 820 did not have a material impact on our consolidated financial statements.
In April 2009, ASC Topic 825, Financial Instruments, was issued, which requires disclosures about the fair value of our financial instruments for which it is practicable to estimate that value, whether recognized or not recognized in the balance sheets, in the interim reporting periods as well as in the annual reporting periods. In addition, ASC Topic 825 requires disclosures of the methods and significant assumptions used to estimate the fair value of those financial instruments. ASC Topic 825 was effective for us beginning April 1, 2009, and its adoption was not material to our consolidated financial statements.
In May 2009, ASC Topic 855, Subsequent Events, which establishes general standards of accounting for, and requires disclosure of, events that occur after the balance sheet date but before financial statements are issued or are available to be issued. We adopted the provisions of ASC Topic 855 for the quarter ended June 30, 2009. This pronouncement does not have a material effect on our consolidated financial statements.
In June 2009, ASC Topic 105, Generally Accepted Accounting Principles was issued, which supersedes all then-existing non-SEC accounting and reporting standards. All other non-grandfathered, non-SEC accounting literature not included in the Codification will become non-authoritative. ASC Topic 105 is effective for financial statements issued for interim and annual periods ending after September 15, 2009. This pronouncement does not have an impact on our consolidated financial statements.
In September 2009, the FASB amended the ASC as summarized in Accounting Standards Update (ASU) 2009-14, Software (Topic 985): Certain Revenue Arrangements That Include Software
94
Table of Contents
RIVERBED TECHNOLOGY, INC.
NOTES TO CONSOLIDATED FINANCIAL STATEMENTS — (Continued)
Elements, and ASU 2009-13, Revenue Recognition (Topic 605): Multiple-Deliverable Revenue Arrangements. As summarized in ASU 2009-14, ASC Topic 985 has been amended to remove from the scope of industry specific revenue accounting guidance for software and software related transactions, tangible products containing software components and non-software components that function together to deliver the product’s essential functionality. As summarized in ASU 2009-13, ASC Topic 605 has been amended (1) to provide updated guidance on whether multiple deliverables exist, how the deliverables in an arrangement should be separated, and the consideration allocated; (2) to require an entity to allocate revenue in an arrangement using estimated selling prices of deliverables if a vendor does not have VSOE or third-party evidence of selling price; and (3) to eliminate the use of the residual method and require an entity to allocate revenue using the relative selling price method. The accounting changes summarized in ASU 2009-14 and ASU 2009-13 are both effective for fiscal years beginning on or after June 15, 2010, with early adoption permitted. Adoption may either be on a prospective basis or by retrospective application.
We plan to implement the amended guidance under Topics 985 and 605 in the first quarter of 2010 using the prospective method. We are currently assessing the impact of these amendments to the ASC on our accounting and reporting systems and processes; however, at this time we are unable to quantify the impact on our financial statements of its adoption.
95
Table of Contents
| Item 9. | Changes In and Disagreements with Accountants on Accounting and Financial Disclosure |
There have been no disagreements with accountants on any matter of accounting principles or practices, financial statement disclosure or auditing scope or procedures required to be reported under this item.
| Item 9A. | Controls and Procedures |
Evaluation of Disclosure Controls and Procedures
We evaluated the effectiveness of the design and operation of our disclosure controls and procedures as of December 31, 2009, the end of the period covered by this Annual Report on Form 10-K. This controls evaluation was done under the supervision and with the participation of our management, including our Chief Executive Officer (CEO) and Chief Financial Officer (CFO) as defined in Rules 13a-15(e) and 15d-15(e) under the Exchange Act.
Disclosure controls and procedures are designed to provide reasonable assurance that information required to be disclosed in the reports that we file or submit under the Securities Exchange Act of 1934, such as this Annual Report on Form 10-K, is recorded, processed, summarized and reported within the time periods specified in the Securities and Exchange Commission’s rules and forms. Disclosure controls and procedures include, without limitation, controls and procedures designed such that information is accumulated and communicated to our management, including the CEO and CFO, as appropriate to allow timely decisions regarding required disclosure.
Based upon the controls evaluation, our CEO and CFO have concluded that as of December 31, 2009, our disclosure controls and procedures were effective to provide reasonable assurance that information required to be disclosed in our Exchange Act reports is recorded, processed, summarized and reported within the time periods specified by the Securities and Exchange Commission and to ensure that material information relating to us and our consolidated subsidiaries is made known to management, including the CEO and CFO.
Management’s Report on Internal Control Over Financial Reporting
Our management is responsible for establishing and maintaining adequate internal control over our financial reporting as defined in Rules 13a-15(f) and 15d-15(f) under the Exchange Act. Our management, with the participation of our principal executive officer and principal financial officer, has evaluated the effectiveness of our internal control over financial reporting as of December 31, 2009. In making this assessment, management used the framework set forth by the Committee of Sponsoring Organizations of the Treadway Commission (COSO) in Internal Control-Integrated Framework. Based on our assessment, using those criteria, our management concluded that, as of December 31, 2009, our internal control over financial reporting was effective. The attestation report concerning the effectiveness of our internal control over financial reporting as of December 31, 2009, issued by Ernst & Young, LLP, Independent Registered Public Accounting Firm, appears in Part II, Item 8 of the Annual Report on Form 10-K.
Changes in Internal Control over Financial Reporting
There were no changes in our internal control over financial reporting that occurred during the fourth quarter of 2009 that have materially affected, or are reasonably likely to materially affect, our internal control over financial reporting (as defined in Rules 13a-15(f) and 15d-15(f) under the Exchange Act). Internal control over financial reporting means a process designed to provide reasonable assurance regarding the reliability of financial reporting and the preparation of financial statements for external purposes in accordance with generally accepted accounting principles.
96
Table of Contents
Inherent Limitations of Internal Controls
Our management, including our CEO and CFO, does not expect that our disclosure controls and procedures or our internal controls over financial reporting will prevent or detect all error and all fraud. A control system, no matter how well designed and operated, can provide only reasonable, not absolute, assurance that the objectives of the control system will be met. Because of the inherent limitations in all control systems, no evaluation of controls can provide absolute assurance that all control issues and instances of fraud, if any, within the Company have been detected. These inherent limitations include the realities that judgments in decision-making can be faulty, and that breakdowns can occur because of a simple error or mistake. Additionally, controls can be circumvented by the individual acts of some persons, by collusion of two or more people, or by management override of the controls. The design of any system of controls also is based in part upon certain assumptions about the likelihood of future events, and there can be no assurance that any design will succeed in achieving its stated goals under all potential future conditions. Over time, controls may become inadequate because of changes in conditions, or deterioration in the degree of compliance with the policies or procedures. Because of the inherent limitations in a cost-effective control system, misstatements due to error or fraud may occur and not be detected.
| Item 9B. | Other Information |
None.
97
Table of Contents
Part III
| Item 10. | Directors, Executive Officers and Corporate Governance |
The information regarding our directors required by this item is included under the caption “Election of Directors” in Riverbed’s Proxy Statement for its 2010 Annual Meeting of Stockholders to be filed within 120 days after the end of the fiscal year ended December 31, 2009 (the “2010 Proxy Statement”) and is incorporated herein by reference. The information regarding our executive officers required by this item is included under the caption “Executive Officers” in the 2010 Proxy Statement and is incorporated herein by reference. The information regarding compliance with Section 16(a) of the Exchange Act required by this item is included under the caption “Section 16(a) Beneficial Ownership Reporting Compliance” in the 2010 Proxy Statement and is incorporated herein by reference. The information regarding our code of ethics, nominating committee and audit committee required by this item is included under the caption “Corporate Governance” in the 2010 Proxy Statement and is incorporated herein by reference.
| Item 11. | Executive Compensation |
The information regarding executive compensation required by this item is included under the caption “Compensation Executive Officers” in the 2010 Proxy Statement and is incorporated herein by reference.
| Item 12. | Security Ownership of Certain Beneficial Owners and Management and Related Stockholder Matters |
The information regarding securities authorized for issuance under equity compensation plans required by this item is included under the caption “Equity Compensation Plan Information” in the 2010 Proxy Statement and is incorporated herein by reference. The information regarding security ownership of certain beneficial owners and management required by this item is included under the caption “Security Ownership of Certain Beneficial Owners and Management” in the 2010 Proxy Statement and is incorporated herein by reference.
| Item 13. | Certain Relationships and Related Transactions, and Director Independence |
The information regarding transactions with related persons required by this item is included under the caption “Certain Relationships and Related Transactions” in the 2010 Proxy Statement and is incorporated herein by reference. The information regarding director independence required by this item is included under the caption “Corporate Governance” in the 2010 Proxy Statement and is incorporated herein by reference.
| Item 14. | Principal Accountant Fees and Services |
The information required by this item is incorporated under the captions “Independent Registered Public Accounting Firm’s Fees” and “Pre-Approval Policies and Procedures” in the 2010 Proxy Statement and is incorporated herein by reference.
98
Table of Contents
Part IV
| Item 15. | Exhibits and Financial Statement Schedules |
(a) Financial Statements
The financial statements filed as part of this report are listed on the index to financial statements on page 44.
(b) Financial Statement Schedules
The following financial statement schedule is filed as a part of this Annual Report on Form 10-K
Schedule II – Valuation and Qualifying Accounts
SCHEDULE II
Valuation and Qualifying Accounts
| Year ended December 31, |
||||||||||||
| (in thousands) |
2009 | 2008 | 2007 | |||||||||
| Trade Receivable Allowance |
||||||||||||
| Beginning balance |
$ | 770 | $ | 734 | $ | 472 | ||||||
| Additions charged to operations |
1,303 | 95 | 461 | |||||||||
| Write-offs |
(380 | ) | (59 | ) | (199 | ) | ||||||
| Ending balance |
$ | 1,693 | $ | 770 | $ | 734 | ||||||
All other schedules are omitted because they are not required or the required information is shown in the financial statements or notes thereto.
(c) Exhibits
The following exhibits are incorporated by reference or filed herewith.
| Exhibit No. |
Description | |
| 2.1 | Agreement of Merger, dated as of January 20, 2009, among Riverbed Technology, Inc., a Delaware corporation, Maple Acquisition Sub, Inc., a Delaware corporation, Mazu Networks, Inc., a Delaware corporation and Donald A. Sullivan as the Stockholders’ Agent (incorporated by reference to Exhibit 2.1 of Registrant’s Current Report on Form 8-K (No. 001-33023), filed with the SEC on February 20, 2009). | |
| 3.1 | Restated Certificate of Incorporation (incorporated by reference to Exhibit 3.2 of Registrant’s Form S-1 Registration No. 333-133437). | |
| 3.2 | Amended and Restated Bylaws (incorporated by reference to Exhibit 3.1 of Registrant’s Current Report on Form 8-K filed with the SEC on December 18, 2008). | |
| 4.1 | Reference is made to Exhibits 3.1 and 3.2. | |
| 4.2 | Form of Common Stock certificate (incorporated by reference to Exhibit 4.2 of Registrant’s Form S-1 Registration No. 333-133437). | |
| 4.3 | Amended and Restated Investors’ Rights Agreement, dated February 10, 2006, by and among the Registrant and the investors listed on the signature pages thereto (incorporated by reference to Exhibit 4.3 of Registrant’s Form S-1 Registration No. 333-133437). | |
99
Table of Contents
| Exhibit No. |
Description | |
| 10.1 | Form of Indemnification Agreement between the Registrant and each of its directors, executive officers and certain key employees (incorporated by reference to Exhibit 10.1 of Registrant’s Form S-1 Registration No. 333-133437). | |
| 10.2 | Riverbed Technology, Inc. 2002 Stock Plan (incorporated by reference to Exhibit 10.2 of Registrant’s Form S-1 Registration No. 333-133437). * | |
| 10.3 | Form of 2002 Stock Plan Stock Option Agreement (incorporated by reference to Exhibit 10.3 of Registrant’s Form S-1 Registration No. 333-133437). * | |
| 10.4 | Form of 2002 Stock Plan Stock Option Agreement (Officers and Key Employees) (incorporated by reference to Exhibit 10.4 of Registrant’s Form S-1 Registration No. 333-133437). * | |
| 10.5 | Form of 2002 Stock Plan Stock Option Agreement (Installment Vesting) (incorporated by reference to Exhibit 10.34 of Registrant’s Form S-1 Registration No. 333-133437). * | |
| 10.6 | Form of 2002 Stock Plan Stock Option Agreement (Officers and Key Employees) (Installment Vesting) (incorporated by reference to Exhibit 10.35 of Registrant’s Form S-1 Registration No. 333-133437). * | |
| 10.7 | 2006 Equity Incentive Plan and form of agreement thereunder (incorporated by reference to Exhibit 10.5 of Registrant’s Form S-1 Registration No. 333-133437). * | |
| 10.8 | Form of 2006 Equity Incentive Plan Restricted Stock Unit Agreement (incorporated by reference to Exhibit 10.1 of Registrant’s Current Report on Form 8-K (No 001-33023), filed with the SEC on May 7, 2008).* | |
| 10.9 | Form of 2006 Equity Incentive Plan Notice of Stock Option Grant and Stock Option Agreement (incorporated by reference to Exhibit 10.42 of Registrant’s Quarterly Report on Form 10-Q (No 001-33023), filed with the SEC on July 30, 2007). * | |
| 10.10 | 2006 Director Option Plan and forms of agreements thereunder (incorporated by reference to Exhibit 10.6 of Registrant’s Form S-1 Registration No. 333-133437). * | |
| 10.11 | Amendment No. 1 to 2006 Director Option Plan, dated March 4, 2008 (incorporated by reference to Exhibit 10.11 of Registrant’s Annual Report on Form 10-K (No 001-33023), filed with the SEC on February 23, 2009).* | |
| 10.12 | Form of 2006 Director Option Plan Notice of Stock Option Grant (incorporated by reference to Exhibit 10.45 of Registrant’s Quarterly Report on Form 10-Q (No. 001-33023), filed with the SEC on October 25, 2007).* | |
| 10.13 | 2006 Employee Stock Purchase Plan, as amended and restated on April 28, 2009. (incorporated by reference to Exhibit 10.1 of Registrant’s Quarterly Report on Form 10-Q (No. 001-33023), filed with the SEC on July 30, 2009).* | |
| 10.14 | Riverbed Technology, Inc. Management Bonus Plan (incorporated by reference to Exhibit 10.43 of Registrant’s Quarterly Report on Form 10-Q (No. 001-33023), filed with the SEC on July 30, 2007).* | |
| 10.15 | Management Bonus Plan, as amended December 15, 2008 (incorporated by reference to Exhibit 10.15 of Registrant’s Annual Report on Form 10-K (No. 001-33023), filed with the SEC on February 23, 2009).* | |
| 10.16 | Riverbed Technology, Inc. 2009 Inducement Equity Incentive Plan and forms of agreement thereunder (Incorporated by reference to Exhibit 10.1 of Registrant’s Current Report on Form 8-K ( No. 001-33023), filed with the SEC on February 20, 2009).* | |
100
Table of Contents
| Exhibit No. |
Description | |
| 10.17 | Long-Term Incentive Plan (incorporated by reference to Exhibit 10.1 of Registrant’s Current Report on Form 8-K (No. 001-33023), filed with the SEC on February 19, 2009).* | |
| 10.18 | Amended and Restated Change in Control Severance Agreement, dated as of December 19, 2008, with Jerry M. Kennelly (incorporated by reference to Exhibit 10.16 of Registrant’s Annual Report on Form 10-K (No. 001-33023), filed with the SEC on February 23, 2009).* | |
| 10.19 | Amended and Restated Change in Control Severance Agreement, dated as of December 19, 2008, with Randy S. Gottfried (incorporated by reference to Exhibit 10.17 of Registrant’s Annual Report on Form 10-K (No. 001-33023), filed with the SEC on February 23, 2009).* | |
| 10.20 | Offer Letter with David M. Peranich, dated July 7, 2006 (incorporated by reference to Exhibit 10.39 of Registrant’s Form S-1 Registration No. 333-133437). * | |
| 10.21 | Agreement of Sublease dated September 26, 2006 between PricewaterhouseCoopers LLP and the Registrant (incorporated by reference to Exhibit 10.1 of Registrant’s Current Report on Form 8-K (No. 001-33023), filed with the SEC on October 2, 2006). | |
| 10.22 | Lease agreement for 199 Fremont Street dated March 21, 2007 between GLL Fremont Street Partners, Inc. and the Registrant (incorporated by reference to Exhibit 10.22 of Registrant’s Annual Report on Form 10-K (No. 001-33023), filed with the SEC on February 15, 2008). | |
| 10.23 | Lease agreement dated June 28, 2007 between W2005 RPS Realty, L.L.C. and the Registrant (incorporated by reference to Exhibit 10.44 of Registrant’s Quarterly Report on Form 10-Q (No. 001-33023), filed with the SEC on July 30, 2007). | |
| 21.1 | List of subsidiaries. (incorporated by reference to Exhibit 21.1 of Registrant’s Annual Report on Form 10-K, (No. 001-33023), filed with the SEC on February 23, 2009). | |
| 23.1 | Consent of Ernst & Young LLP, Independent Registered Public Accounting Firm. | |
| 31.1 | Certification of the Chief Executive Officer pursuant to Section 302 of the Sarbanes-Oxley Act. | |
| 31.2 | Certification of the Chief Financial Officer pursuant to Section 302 of the Sarbanes-Oxley Act. | |
| 32.1 | Certification of the Chief Executive Officer and Chief Financial Officer pursuant to Section 906 of the Sarbanes-Oxley Act. | |
The certification attached as Exhibit 32.1 that accompanies this Annual Report on Form 10-K is not deemed filed with the Securities and Exchange Commission and is not to be incorporated by reference into any filing of Riverbed Technology, Inc. under the Securities Act of 1933 or the Securities Exchange Act of 1934, whether made before or after the date of this Annual Report on Form 10-K, irrespective of any general incorporation language contained in such filing.
| * | Management contract or compensatory plan or arrangement. |
101
Table of Contents
Pursuant to the requirements of Section 13 or 15(d) of the Securities Exchange Act of 1934, the Registrant has duly caused this report to be signed on its behalf by the undersigned, thereunto duly authorized.
| RIVERBED TECHNOLOGY, INC. | ||
| By: |
/S/ JERRY M. KENNELLY | |
| Jerry M. Kennelly, President and Chief Executive Officer | ||
| Date: February 11, 2010 | ||
| RIVERBED TECHNOLOGY, INC. | ||
| By: |
/S/ RANDY S. GOTTFRIED | |
| Randy S. Gottfried, Chief Financial Officer | ||
| Date: February 11, 2010 | ||
Pursuant to the requirements of the Securities Exchange Act of 1934, this report has been signed below by the following persons on behalf of the Registrant and in the capacities and on the dates indicated.
| Signature |
Title |
Date | ||
| /S/ JERRY M. KENNELLY Jerry M. Kennelly |
President, Chief Executive Officer and Chairman (Principal Executive Officer) |
February 11, 2010 | ||
| /S/ RANDY S. GOTTFRIED Randy S. Gottfried |
Chief Financial Officer (Principal Financial and Accounting Officer) |
February 11, 2010 | ||
|
Michael Boustridge |
Director |
|||
| /S/ STEVEN MCCANNE Steven McCanne |
Director |
February 11, 2010 | ||
| /S/ MARK A. FLOYD Mark A. Floyd |
Director |
February 11, 2010 | ||
| /S/ MICHAEL R. KOUREY Michael R. Kourey |
Director |
February 11, 2010 | ||
|
Mark Lewis |
Director |
|||
| /S/ STANLEY J. MERESMAN Stanley J. Meresman |
Director |
February 11, 2010 | ||
102
Table of Contents
| Signature |
Title |
Date | ||
| /S/ CHRISTOPHER J. SCHAEPE Christopher J. Schaepe |
Director |
February 11, 2010 | ||
| /S/ JAMES R. SWARTZ James R. Swartz |
Director |
February 11, 2010 | ||
103