Attached files
UNITED STATES
SECURITIES AND EXCHANGE COMMISSION
Washington, D.C. 20549
Form 10-K
ANNUAL REPORT PURSUANT TO SECTIONS 13 OR 15(d) OF THE
SECURITIES EXCHANGE ACT OF 1934
(Mark One)
| x | ANNUAL REPORT PURSUANT TO SECTION 13 OR 15(d) OF THE SECURITIES EXCHANGE ACT OF 1934 |
For the fiscal year ended December 31, 2009
OR
| ¨ | TRANSITION REPORT PURSUANT TO SECTION 13 OR 15(d) OF THE SECURITIES EXCHANGE ACT OF 1934 |
Commission File No. 1-14306
BRE PROPERTIES, INC.
(Exact name of registrant as specified in its charter)
| Maryland | 94-1722214 | |
| (State or Other Jurisdiction of Incorporation or Organization) |
(I.R.S. Employer Identification No.) | |
| 525 Market Street, 4th Floor San Francisco, California |
94105-2712 | |
| (Address of Principal Executive Offices) | (Zip Code) | |
(415) 445-6530
(Registrant’s telephone number, including area code)
Securities registered pursuant to Section 12(b) of the Act:
| Title of each class |
Name of each exchange on which registered | |
| Common Stock, $.01 par value |
New York Stock Exchange | |
| 6.75% Series C Preferred Stock |
New York Stock Exchange | |
| 6.75% Series D Preferred Stock |
New York Stock Exchange |
Indicate by check mark if the registrant is a well-known seasoned issuer, as defined in Rule 405 of the Securities Act. xYes ¨ No
Indicate by check mark if the registrant is not required to file reports pursuant to Section 13 or Section 15(d) of the Act. ¨Yes x No
Indicate by check mark whether the registrant: (1) has filed all reports required to be filed by Section 13 or 15(d) of the Securities Exchange Act of 1934 during the preceding 12 months (or for such shorter period that the registrant was required to file such reports), and (2) has been subject to such filing requirements for the past 90 days. xYes ¨ No
Indicate by check mark whether the registrant has submitted electronically and posted on its corporate Web site, if any, every Interactive Data File required to be submitted and posted pursuant to Rule 405 of Regulation S-T during the preceding 12 months (or for such shorter period that the registrant was required to submit and post such files). ¨Yes ¨ No
Indicate by check mark if disclosure of delinquent filers pursuant to Item 405 of Regulation S-K is not contained herein, and will not be contained, to the best of registrant’s knowledge, in definitive proxy or information statements incorporated by reference in Part III of this Form 10-K or any amendment to this Form 10-K. ¨
Indicate by check mark whether the registrant is a large accelerated filer, an accelerated filer, a non-accelerated filer, or a smaller reporting company. See the definitions of “large accelerated filer,” “accelerated filer” and “smaller reporting company” in Rule 12b-2 of the Exchange Act. (Check one):
| Large accelerated filer x | Accelerated filer ¨ | Non-accelerated filer ¨ | Smaller reporting company ¨ |
Indicate by check mark whether the registrant is a shell company (as defined in Rule 12b-2 of the Exchange Act). ¨Yes x No
At June 30, 2009, the aggregate market value of the registrant’s shares of Common Stock, par value $.01 per share, held by non-affiliates of the registrant was approximately $1,255,000,000. At January 31, 2010, 55,186,417 shares of Common Stock were outstanding.
DOCUMENTS INCORPORATED BY REFERENCE
Portions of the Proxy Statement for the Annual Meeting of Shareholders of BRE Properties, Inc. to be filed within 120 days of December 31, 2009 are incorporated by reference in Part III of this report.
FORWARD-LOOKING STATEMENTS
In addition to historical information, we have made forward-looking statements in this Annual Report on Form 10-K. These forward-looking statements pertain to, among other things, our capital resources, portfolio performance and results of operations. Forward-looking statements involve numerous risks and uncertainties. You should not rely on these statements as predictions of future events because we cannot assure you that the events or circumstances reflected in the statements can be achieved or will occur. Forward-looking statements are identified by words such as “believes,” “expects,” “may,” “will,” “should,” “seeks,” “approximately,” “intends,” “plans,” “pro forma,” “estimates” or “anticipates” or their negative form or other variations, or by discussions of strategy, plans or intentions. Forward-looking statements are based on assumptions, data or methods that may be incorrect or imprecise or incapable of being realized. The following factors, among others, could affect actual results and future events: defaults or non-renewal of leases, increased interest rates and operating costs, failure to obtain necessary outside financing, difficulties in identifying properties to acquire and in effecting acquisitions, failure to successfully integrate acquired properties and operations, inability to dispose of assets that no longer meet our investment criteria under acceptable terms and conditions, risks and uncertainties affecting property development and construction (including construction delays, cost overruns, inability to obtain necessary permits and public opposition to such activities), failure to qualify as a real estate investment trust under the Internal Revenue Code of 1986, as amended, environmental uncertainties, risks related to natural disasters, financial market fluctuations, changes in real estate and zoning laws and increases in real property tax rates. Our success also depends on general economic trends, including interest rates, income tax laws, governmental regulation, legislation, population changes and other factors, including those risk factors discussed in the section entitled “Risk Factors” in this report as they may be updated from time to time by our subsequent filings with the Securities and Exchange Commission. Do not rely solely on forward-looking statements, which only reflect management’s analysis. We assume no obligation to update forward-looking statements.
2
BRE PROPERTIES, INC.
PART I
| Item 1. | BUSINESS |
References in this Annual Report on Form 10-K to “BRE,” “Company,” “we” or “us” refer to BRE Properties, Inc., a Maryland corporation.
Corporate Profile
We are a self-administered equity real estate investment trust, or REIT, focused on the development, acquisition and management of multifamily apartment communities in six targeted metropolitan markets of the Western United States. At December 31, 2009, our multifamily portfolio had real estate assets with a net book value of approximately $2.9 billion, which included: 73 wholly or majority owned stabilized multifamily communities, aggregating 21,245 units in California, Washington and Arizona; thirteen stabilized multifamily communities owned through joint ventures comprised of 4,080 apartment units; and six apartment communities in various stages of construction and development. We have been a publicly traded company since our founding in 1970 and have paid 157 consecutive quarterly dividends to our shareholders since inception.
Our business touches one of the most personal aspects of our customers’ lives—the place they call home. We believe this creates not just a responsibility, but an opportunity to set ourselves apart by seeing things from our residents’ point of view and putting them first in all we do. The power of this viewpoint is that what is good for our resident is good for our Company. As we build relationships with the people and communities we serve, we set ourselves apart in the marketplace and create long-term, income-producing investments for our shareholders. Our principal operating objective is to maximize the economic returns of our apartment communities so as to provide our shareholders with the greatest possible total return and value. To achieve this objective, we pursue the following primary strategies and goals:
| • | Communicate a clear, results-oriented strategic direction based on the five-year plan developed by Management and reviewed and approved by the Board of Directors, which is the driver behind all key decisions; |
| • | Manage our business to yield a compelling combination of income and growth by achieving and maintaining high occupancy levels, dynamic pricing, and operating margin expansion through operating efficiencies and cost controls, and deploying new and recycled capital to supply-constrained markets of the Western United States; |
| • | Maintain balance sheet strength and maximize financial flexibility to provide continued access to attractively priced capital for strategic growth opportunities; |
| • | Respond openly and honestly to all investors by disclosing financial results comprehensively and efficiently, and making our business transparent to investors through our public disclosure; and |
| • | Create a valuable customer experience that focuses on services from our residents’ point of view and generates increased profitability from resident retention and referrals. |
We believe we can best achieve our objectives by developing, acquiring and internally managing high-quality apartment communities in high-demand, supply-constrained locations in the most attractive places to live in the Western United States, particularly coastal California. Our communities are generally near the business, transportation, employment and recreation centers essential to customers who value the convenience, service and flexibility of rental living. Recognizing that customers have many housing choices, we focus on developing and acquiring apartment homes with customer-defined amenities and providing professional management services delivered by well-trained associates. We have concentrated our investment and business focus in California and other markets in the Western United States because of certain market characteristics that we find attractive,
3
including the propensity to rent, and the scarcity of undeveloped land. From time to time, we dispose of assets that do not meet our long-term investment criteria, recycling the capital derived from property sales into apartment communities in supply-constrained locations that offer higher long-term return opportunities.
Events During 2009
During 2009, we sold two communities totaling 752 units: Overlook at Blue Ravine, with 512 units located in Folsom, California; and Arbor Pointe, a 240 unit property located in Sacramento, California. The two properties were sold for an aggregate sales price of approximately $67,000,000, resulting in a net gain on sales of approximately $21,574,000. In addition to the two communities, we sold an excess parcel of land in Santa Clara, California, classified as held for sale at December 31, 2008, for gross sales proceeds totaling $17,100,000, approximately equal to the carrying value.
During 2009, we completed construction of three development communities: Taylor 28, with 197 units in Seattle, Washington, 5600 Wilshire, with 284 units in Los Angeles, California and Park Viridian with 320 units in Anaheim, California. The aggregate investment in the three communities totals $282,934,000.
As of December 31, 2009, we owned two sites that were under construction. The aggregate investment in these two sites is expected to total approximately $176,100,000. We had an estimated cost of $16,400,000 to complete existing construction in progress, which will be completed during 2010.
As of December 31, 2009, we owned four parcels of land that are in the process of entitlement and predevelopment.
On July 30, 2009, our Board of Directors approved a reduction in quarterly common dividends to $0.3750 from $0.5625 per share for the third quarter of 2009. The quarterly common dividend payment of $0.3750 is equivalent to $1.5000 per common share on an annualized basis.
On May 14, 2009, we entered into an equity distribution agreement under which we may offer and sell shares of our common stock having an aggregate offering price of up to $125,000,000 over time through our sales agent. During 2009, 3,801,185 shares were issued for gross proceeds of approximately $104,600,000 with an average share price of $27.52. As of February 12, 2010 we have approximately $20,400,000 available to be issued under this distribution plan. Proceeds were used for general corporate purposes, which include reducing borrowings under our unsecured credit facility, the repayment of other indebtedness, the redemption or other repurchase of outstanding securities, and funding for development activities.
On April 7, 2009, the Company closed a $620,000,000 secured credit facility with Deutsche Bank Berkshire Mortgage, Inc. The facility consists of two $310,000,000 tranches. The first tranche has a fixed rate term of 10 years and has a maturity date of May 1, 2019. The second tranche has a maturity date of September 1, 2020, with a fixed rate term for the first 10 years and a variable rate for the remaining one-year period. Together, the effective composite annual cost of debt is 5.6% inclusive of rate hedging transactions. Fifteen multifamily properties totaling 4,651 units with a net carrying value of $607,500,000 secured the credit facility at the time of closing. Proceeds from this facility were used to refinance near term debt maturities, debt tenders and debt repurchases noted below.
On April 15, 2009, we closed a fixed price cash tender offer for any and all of our outstanding 5.750% senior notes due 2009 and any and all of our outstanding 4.875% senior notes due 2010. As a result, $61,407,000 and $119,421,000 in aggregate principal amount of the 5.750% senior notes due 2009 and 4.875% senior notes due 2010, respectively, were validly tendered and we accepted, purchased and subsequently cancelled the notes. After giving effect to the purchase of the tendered notes, an aggregate principal amount of $30,579,000 of the 4.875% senior notes due in 2010, remain outstanding. The remaining principal balance of the 5.750% senior notes due in 2009 was paid in full during September 2009, as the note came due.
4
On April 1, 2009, we closed a fixed price cash tender offer for any and all of our outstanding 7.450% senior notes due 2011 and any and all of our outstanding 7.125% senior notes due 2013. As a result, $201,455,000 and $89,982,000 in aggregate principal amount of the 7.450% senior notes due 2011 and 7.125% senior notes due 2013, respectively, were validly tendered and we accepted, purchased and subsequently cancelled the notes. After giving effect to the purchase of the tendered notes, an aggregate principal amount of $48,545,000 and $40,018,000 of the 7.450% senior notes due 2011 and 7.125% senior notes due 2013, respectively, remain outstanding.
During the course of 2009, we repurchased through open market transactions $78,266,000 of our 4.125% convertible senior unsecured notes for an aggregate price of 92.98% of par, or approximately $72,776,000.
During the course of 2009, we recognized a net gain on the early extinguishment of debt totaling $1,470,000 in connection with the repurchase and tender activity.
During the fourth quarter of 2009, we incurred a charge of approximately $12,900,000 for previously capitalized costs primarily related to development rights for three land sites under option agreements that will not proceed to development. Additionally, in the fourth quarter of 2009, we incurred cash severance charges totaling approximately $600,000.
Events During 2008
During 2008, we sold six communities totaling 1,484 units: Blue Rock Village, with 560 units located in Vallejo, California; The Park at Dash Point, with 280 units located in Seattle, Washington; Pinnacle at Blue Ravine with 260 units, located in Sacramento, California; Canterbury Downs, with 173 units located in Sacramento, California; Rocklin Gold with 121 units located in Sacramento, California; and Quail Chase with 90 units located in Sacramento, California. The six communities were sold for an aggregate sales price of approximately $163,215,000, resulting in a net gain on sale of approximately $65,984,000.
During 2008, we completed construction of three development communities: Avenue 64, with 224 units in Emeryville, California; The Stuart at Sierra Madre with 188 units in Pasadena, California and Renaissance at Uptown Orange with 460 units in Orange, California. The aggregate investment in the three communities totals $249,076,000.
As of December 31, 2008, we owned five sites that were under construction. The aggregate investment in these five sites is expected to total approximately $456,600,000. We had an estimated cost of $105,900,000 to complete existing construction in progress, with completion dates estimated from 2009 through 2010.
As of December 31, 2008, we owned three parcels of land that are going through the pre entitlement process with anticipated construction start dates in 2010.
On December 24, 2008, we repurchased through open market transactions $10,400,000 of our $460,000,000 4.125% convertible senior unsecured notes, resulting in a $2,364,000 net gain on extinguishment of debt.
In the fourth quarter of 2008, we recognized in other income $4,400,000 in proceeds from a legal settlement related to Pinnacle Galleria and a forfeited escrow deposit totaling $1,007,000 from a potential buyer of an asset held for sale that failed to close.
In the fourth quarter of 2008, we recorded a $5,119,000 abandonment charge included in other expenses, related to three sites under option agreements or letters of intent. The abandonment charge is associated with the deceleration of our development program due to current and expected deterioration of economic conditions and credit availability.
5
Subsequent to the year end, we notified 33 employees that their positions had been eliminated. As a result, during the fourth quarter of 2008, we incurred cash severance charges totaling approximately $1,500,000, of which $600,000 was recorded as an expense, and $900,000 was capitalized as development cost. The reduction in force involved management and staff- level associates primarily in the development area, reducing the overall level of employees by 4%, and development personnel by 36%.
Events During 2007
In January of 2007, we acquired a 3.5-acre land site in Los Angeles for approximately $66,500,000. The site represents 470 units of future development, and an estimated total investment of $297,000,000 upon completion.
On March 13, 2007, we completed an offering of $300,000,000 of 10-year senior unsecured notes. The notes will mature on March 15, 2017 and bear interest at a fixed coupon rate of 5.5%. Net proceeds from the offering, after all discounts, commissions, and issuance costs totaled approximately $297,000,000 and were used for general corporate purposes.
On July 11, 2007, we contributed one community with a total value of $52,000,000 and 432 units located in Phoenix, Arizona, classified as held for sale at June 30, 2007, to a newly formed joint venture in exchange for 15% equity interest in the joint venture and approximately $44,000,000 in cash. The joint venture investment is reported as equity interests in investments in rental properties on the consolidated balance sheet. Our net carrying value of the investment in the joint venture is equal to 15% of the total carrying value of the net asset at the time of the contribution, which totaled approximately $20,500,000. In connection with the contribution, we recognized a gain of $26,600,000.
During 2007, we purchased a 15% equity interest in three newly formed joint ventures for approximately $19,500,000. The joint venture partner contributed approximately $110,535,000 for an 85% interest in the joint ventures. These joint ventures own properties having a total of 976 units and are located in Colorado, with a total value of $130,035,000.
On September 14, 2007, we redeemed all 3,000,000 shares of 8.08% Series B Cumulative Redeemable Preferred Stock at a redemption price of $25.42644 per share. The redemption price was equal to the original issuance price of $25.00 per share, plus accrued and unpaid dividends to the redemption date. The initial issuance costs totaling $2,768,000 associated with the Series B Cumulative Redeemable Preferred Stock were included in net income available to common shareholders during the third quarter of 2007.
On September 18, 2007, we amended and restated our credit agreement with a group of 18 lenders, increasing the size of the revolving credit facility from $600,000,000 to $750,000,000 and extending the maturity date from January 18, 2010 to September 18, 2012. The new amended and restated facility has a five-year term. Based on our current debt ratings, the line of credit accrues interest at LIBOR plus 47.5 basis points. In addition, we pay a 0.15% annual facility fee on the capacity of the facility. Borrowings under our revolving unsecured line of credit totaled $288,000,000 at December 31, 2009, compared to $245,000,000 at December 31, 2008. Borrowings under the credit facility are used to fund acquisition and development activities as well as for general corporate purposes. We typically reduce our outstanding balance on the revolving unsecured line of credit with available cash balances.
During 2007, we sold three communities totaling 441 units: Hazel Ranch, with 208 units located in Sacramento, California; Shaliko, with 152 units located in Sacramento, California; and Brentwood Townhomes with 81 units, located in Seattle, Washington. The three communities were sold for an aggregate sales price of approximately $56,400,000, resulting in a net gain on sale of approximately $29,400,000.
6
Competition
All of our communities are located in urban and suburban areas that include other multifamily communities. There are many other multifamily properties and real estate companies within these areas that compete with us for residents and development and acquisition opportunities. Such competition could have a material effect on our ability to lease apartment homes at our communities or at any newly developed or acquired communities and on the rents charged. We may be competing with others that have greater resources than us. In addition, other forms of residential properties, including single-family housing, provide housing alternatives to potential residents of upscale apartment communities.
Structure, Tax Status and Investment Policy
We are organized to operate so as to qualify as a real estate investment trust, or REIT, under Sections 856-860 of the Internal Revenue Code of 1986, as amended. Under the terms of the Internal Revenue Code, we generally will not be subject to Federal income tax to the extent we distribute 100% of our REIT taxable income to our shareholders. REITs are subject to a number of complex organizational and operational requirements. If we fail to qualify as a REIT, our taxable income will be subject to income tax at regular corporate rates. See “Risk Factors—Tax Risks.”
Our long-range investment policy emphasizes the development, construction and acquisition of multifamily communities located in California and other markets in the Western United States. As circumstances warrant, certain properties may be sold and the proceeds reinvested into multifamily communities that our management believes better align with our growth objectives. Among other items, this policy is intended to enable our management to monitor developments in local real estate markets and to take an active role in managing our properties and improving their performance. The policy is subject to ongoing review by our Board of Directors and may be modified in the future to take into account changes in business or economic conditions, as circumstances warrant.
Employees
As of December 31, 2009, we had 737 employees. No employee is covered by collective bargaining agreements.
Company Website
To view our current and periodic reports free of charge, please go to our website at www.breproperties.com. We make these postings as soon as reasonably practicable after our filings with the SEC. Our website contains copies of our Corporate Governance Guidelines, our Code of Business Conduct and Ethics and the charters of each of our Audit, Compensation, and Nominating and Governance Committees. This information is also available in print to any shareholder who requests it by contacting us at BRE Properties, Inc., 525 Market St., 4th Floor, San Francisco, California, 94105, attention: Investor Relations. Information contained on our website is not and should not be deemed a part of this report or a part of any other report or filing with the SEC.
Investment Portfolio
See Part I, Item 2 (“Properties”) and Part II, Item 7 (“Management’s Discussion and Analysis of Financial Condition and Results of Operations”) of this report for a description of our individual investments and certain developments during the year with respect to these investments. See Part IV, Item 15(a) 2, Schedule III (financial statement schedule), for additional information about our portfolio, including locations, costs and encumbrances.
Additionally, see Part II, Item 8 and Part IV, Item 15 of this report for our consolidated financial statements.
7
Executive Officers
The following persons were executive officers of BRE as of February 12, 2010:
| Name |
Age at February 12, 2010 |
Position(s) | ||
| Constance B. Moore |
54 | President, Chief Executive Officer and Director | ||
| Edward F. Lange, Jr. |
50 | Executive Vice President, Chief Operating Officer and Director | ||
| Stephen C. Dominiak |
45 | Executive Vice President, Chief Investment Officer | ||
| Kerry Fanwick |
54 | Executive Vice President, General Counsel | ||
| John A. Schissel |
43 | Executive Vice President, Chief Financial Officer |
Ms. Moore has served as President and Chief Executive Officer since January 2005. Prior to serving as the Company’s Chief Executive Officer, she served as our Chief Operating Officer from July of 2002 through December 2004. Ms. Moore held several executive positions with Security Capital Group & Affiliates, an international real estate operating and investment management company, from 1993 to July 2002, including Co-Chairman and Chief Operating Officer of Archstone-Smith Trust, a Colorado-based multifamily real estate investment trust. Ms. Moore holds a Master of Business Administration Degree from the University of California, Berkeley and a Bachelor’s Degree in Business Administration from San Jose State University.
Mr. Lange has served as Executive Vice President since July 2000 and as Chief Operating Officer since January 2007. In addition to Chief Operating Officer, Mr. Lange held the position of Chief Financial Officer from July 2000 through October 2009. Prior to joining BRE, he served as Executive Vice President and Chief Financial Officer at Health Care REIT, Inc., an Ohio-based senior housing real estate investment trust, from 1996 to June 2000. Prior to joining Health Care REIT, Inc. Mr. Lange was a Senior Vice President of Finance and a member of the executive management team of the Mediplex Group, Inc. and affiliated companies from 1992 to 1996. Mr. Lange holds a Master of Business Administration Degree from the University of Connecticut and a Bachelor’s Degree in Urban Planning from the University of Massachusetts.
Mr. Dominiak has served as Executive Vice President, Chief Investment Officer since August 2008. Prior to joining BRE, Mr. Dominiak was the Division President and Managing Partner for JPI’s western division from 2004 to August 2008, a Division Vice President for BRE’s Southern California region from 2003 to 2004, and a Group Vice President for Archstone-Smith Trust in Southern California from 1995 to 2003. Mr. Dominiak holds a Master of Business Administration Degree from the University of California, Irvine, and both a Master’s Degree in city and regional planning and a Bachelor’s Degree in architecture from the University of Texas, Arlington.
Mr. Fanwick, has served as Executive Vice President, General Counsel since July 2008. Prior to serving as the Company’s Executive Vice President, General Counsel, he served as Senior Vice President, General Counsel from February 2007 through July 2008. Mr. Fanwick was a co-founding partner of Miller & Fanwick, LLP, a law firm specializing in business and financial strategies, where he served as partner from May 1998 to December 2006. Previously, he served as general counsel for First Nationwide Bank from 1990 to 1998; an attorney at the law firm of Wilson, Sonsini, Goodrich & Rosati from 1981 to 1985; and in-house counsel and a member of senior management for various financial services and real estate companies. Mr. Fanwick received his Juris Doctor Degree from Stanford Law School .
Mr. Schissel has served as Executive Vice President, Chief Financial Officer since October, 2009. Prior to joining BRE, he served as Executive Vice President, Chief Financial Officer and Board Member of Carr Properties (and predecessor entities), a Washington D.C. based commercial office REIT, from 2004 to 2009. Prior to joining Carr Properties, Mr. Schissel worked at Wachovia Securities (and predecessor institutions), from 1991 to 2004, serving as Senior Vice President in the REIT Corporate Banking Group, and later as Director in the firm’s Real Estate Corporate Finance Group. Mr. Schissel holds a Bachelor’s degree in Business Administration and Finance from Georgetown University.
There is no family relationship among any of our executive Officers or Directors.
8
Item 1A. RISK FACTORS
The following discussion should be read in conjunction with the consolidated financial statements and notes thereto appearing elsewhere in this Annual Report on Form 10-K.
Risks Due to Current Economic Conditions
If the economic downturn continues in the long-term, our business, results of operations, cash flows and financial condition could be adversely affected.
During the past twenty-four months, a confluence of many factors have contributed to diminished expectations for the U.S. economy and increased market volatility for publicly traded securities, including the price of our shares. These factors include decreased availability of credit, increased cost of credit, limited liquidity in the U.S. home mortgage market, deteriorating real estate fundamentals and market valuations, declining business and consumer confidence, and increased unemployment. These trends affect our revenues from our apartment communities and could have a negative impact on our profitability and liquidity. As a result, we may need to find alternative ways to increase liquidity. Such alternatives may include, without limitation:
| • | divesting properties, whether or not they otherwise meet our long-term strategic objectives; |
| • | issuing and selling debt and equity securities in public or private transactions under less than optimal conditions; |
| • | entering into leases with our tenants at lower rental rates or less than optimal terms; |
| • | entering into lease renewals with our existing tenants without an increase in rental rates at turnover; and /or |
| • | reducing the levels of dividends to common shareholders to the minimum level necessary to maintain our corporate REIT status under the Internal Revenue Code. |
We cannot assure you, however, that such alternative ways to increase liquidity will be available to us. If we do not have sufficient cash flows and income from operations to meet our financial commitments and our lenders are not able to meet their funding commitments to us or we are not able to secure additional financing, our results of operations and our ability to make distributions to our shareholders and pay amounts due on our debt obligations could be adversely affected.
Risks Due to Investment in Real Estate
Decreased revenues or increased operating expenses may cause decreased yields from an investment in real property.
Real property investments are subject to varying degrees of risk. The yields available from investments in real estate depend upon the amount of revenues generated and expenses incurred. If properties do not generate revenues sufficient to meet operating expenses, including debt service and capital expenditures, our results from operations and our ability to make distributions to our shareholders and pay amounts due on our debt will be adversely affected. The performance of the economy in each of the areas in which the properties are located affects occupancy, market rental rates and expenses. These factors consequently can have an impact on revenues from the properties and their underlying values. The financial results and labor decisions of major local employers may also have an impact on the revenues from and value of certain properties.
Other factors may further adversely affect revenues from and values of our properties. These factors include the general economic climate, local conditions in the areas in which properties are located such as an oversupply of apartment units or a reduction in the demand for apartment units, the attractiveness of the properties to residents, competition from other multifamily communities and our ability to provide adequate facilities maintenance, services and amenities. Our revenues would also be adversely affected if residents were unable to
9
pay rent or we were unable to rent apartments on favorable terms. If we were unable to promptly relet or renew the leases for a significant number of apartment units, or if the rental rates upon renewal or reletting were significantly lower than expected rates, then our funds from operations and our ability to make expected distributions to our shareholders and pay amounts due on our debt could be adversely affected. There is also a risk that, as leases on the properties expire, residents will vacate or enter into new leases on terms that are less favorable to us. Operating costs, including real estate taxes, insurance and maintenance costs, and mortgage payments, if any, do not, in general, decline when circumstances cause a reduction in income from a property. We could sustain a loss as a result of foreclosure on the property, if a property is mortgaged to secure payment of indebtedness and we were unable to meet our mortgage payments. In addition, applicable laws, including tax laws, interest rate levels and the availability of financing also affect revenues from properties and real estate values.
If we are unable to implement our growth strategy, or if we fail to identify, acquire or integrate new acquisitions, our results may suffer.
Our future growth will be dependent upon a number of factors, including our ability to identify acceptable properties for development and acquisition, complete acquisitions and developments on favorable terms, successfully integrate acquired and newly developed properties, and obtain financing to support expansion. We cannot assure you that we will be successful in implementing our growth strategy, that growth will continue at historical levels or at all, or that any expansion will improve operating results. The failure to identify, acquire and integrate new properties effectively could have a material adverse effect on us and our ability to make distributions to our shareholders and pay amounts due on our debt.
Development and construction projects may not be completed or completed successfully.
As a general matter, property development and construction projects typically have a higher, and sometimes substantially higher, level of risk than the acquisition of existing properties. We intend to actively pursue development and construction of multifamily apartment communities. We cannot assure you that we will complete development of the properties currently under development or any other development project that we may undertake. Risks associated with our development and construction activities may include the following:
| • | development opportunities may be abandoned; |
| • | construction costs of multifamily apartment communities may exceed original estimates, possibly making the communities uneconomical; |
| • | occupancy rates and rents at newly completed communities may not be sufficient to make the communities profitable; |
| • | financing for the construction and development of projects may not be available on favorable terms or at all; |
| • | construction and lease-up may not be completed on schedule; and |
| • | expenses of operating a completed community may be higher than anticipated. |
Development and construction activities are also subject to risks relating to the inability to obtain, or delays in obtaining, all necessary zoning, land-use, building, occupancy, and other required governmental permits and authorizations.
Investments in newly acquired properties may not perform in accordance with our expectations.
In the normal course of business, we typically evaluate potential acquisitions, enter into non-binding letters of intent, and may, at any time, enter into contracts to acquire and may acquire additional properties. However, we cannot assure you that we will have the financial resources to make suitable acquisitions or that properties
10
satisfying our investment policies will be available for acquisition. Acquisitions of properties entail risks that investments will fail to perform in accordance with expectations. Estimates of the costs of improvements to bring an acquired property up to standards established for the market position intended for that property might prove inaccurate. Other risks may include rehabilitation costs exceeding original estimates, possibly making a project uneconomical; financing not being available on favorable terms or at all; rehabilitation and lease-up not being completed on schedule; and, in the event we invest in new markets, a lack of extensive knowledge of the market or the local economy. In addition, there are general real estate investment risks associated with any new real estate investment, including environmental risks. Although we undertake an evaluation of the physical condition of each new property before it is acquired, certain defects or necessary repairs may not be detected until after the property is acquired. This could significantly increase our total acquisition costs, which could have a material adverse effect on us and our ability to make distributions to our shareholders and pay amounts due on our debt.
Illiquidity of real estate and reinvestment risk may reduce economic returns to investors.
Real estate investments are relatively illiquid and, therefore, tend to limit our ability to adjust our portfolio in response to changes in economic or other conditions. Additionally, the Internal Revenue Code places certain limits on the number of properties a REIT may sell without adverse tax consequences. To effect our current operating strategy, we have in the past raised, and will seek to continue to raise additional funds, both through outside financing and through the orderly disposition of assets that no longer meet our investment criteria. However, we cannot assure you that we will be able to dispose of these assets, particularly during periods of decline in the real estate market, and the inability to make these dispositions may prevent us from executing our operating strategy and could have a material adverse effect on us and our ability to make distributions to our shareholders and pay amounts due on our debt. Depending upon interest rates, current development and acquisition opportunities and other factors, generally we will reinvest the proceeds from any property dispositions in additional multifamily properties, although such funds may be employed in other uses. We cannot assure you that the proceeds realized from the disposition of assets which no longer meet our investment criteria can be reinvested to produce economic returns comparable to those being realized from the properties disposed of, or that we will be able to acquire properties meeting our investment criteria. If we are unable to reinvest proceeds from the disposition of properties or if properties acquired with any such proceeds produce a lower rate of return than the properties disposed of, our results of operations and our ability to make distributions to our shareholders and pay amounts due on our debt could be adversely affected. In addition, a delay in reinvestment of any such proceeds could also have a material adverse effect on us and our ability to make distributions to our shareholders and pay amounts due on our debt.
We may seek to structure future dispositions as tax-free exchanges, where appropriate, utilizing the non-recognition provisions of Section 1031 of the Internal Revenue Code to defer income taxation on the disposition of the exchanged property. For an exchange of these properties to qualify for tax-free treatment under Section 1031 of the Internal Revenue Code, certain technical requirements must be met. Given the competition for properties meeting our investment criteria, it may be difficult for us to identify suitable properties within the applicable time frames in order to meet the requirements of Section 1031. Even if we can structure a suitable tax-deferred exchange, as noted above, we cannot assure you that we will reinvest the proceeds of any of these dispositions to produce economic returns comparable to those currently being realized from the properties which were disposed of.
Substantial competition among multifamily properties and real estate companies may adversely affect our rental revenues and development and acquisition opportunities.
All of the properties currently owned by us are located in defined urban and suburban locations. There are numerous other multifamily properties and real estate companies, many of which have greater financial and other resources than we have, within the market area of each of our properties which compete with us for residents and development and acquisition opportunities. The number of competitive multifamily properties and real estate companies in these areas could have a material effect on (1) our ability to rent the apartments and the rents
11
charged, and (2) development and acquisition opportunities. The activities of these competitors could cause us to pay a higher price for a new property than we otherwise would have paid or may prevent us from purchasing a desired property at all, which could have a material adverse effect on us and our ability to make distributions to our shareholders and pay amounts due on our debt.
Our operations are concentrated in the Western United States; we are subject to general economic conditions in the regions in which we operate.
Our portfolio is primarily located in the San Francisco Bay Area, Los Angeles, Orange County, Inland Empire, San Diego, and Seattle. Our performance could be adversely affected by economic conditions in, and other factors relating to, these geographic areas, including supply and demand for apartments in these areas, zoning and other regulatory conditions and competition from other properties and alternative forms of housing. In that regard, these areas are currently experiencing economic recessions, increased levels of unemployment, and depressed conditions in the local real estate and rental markets. To the extent general economic or social conditions in any of these areas further deteriorate or any of these areas experiences natural disasters, the value of the portfolio, our results of operations and our ability to make distributions to our shareholders and pay amounts due on our debt could be materially adversely affected.
Our insurance coverage is limited and may not cover all losses to our properties.
We carry comprehensive liability, fire, mold, extended coverage and rental loss insurance with respect to our properties with certain policy specifications, limits and deductibles. While as of December 31, 2009, we carried flood and earthquake insurance for our properties with an aggregate annual limit of $90,000,000, subject to substantial deductibles, we cannot assure you that this coverage will be available on acceptable terms or at an acceptable cost, or at all, in the future, or if obtained, that the limits of those policies will cover the full cost of repair or replacement of covered properties. In addition, there may be certain extraordinary losses (such as those resulting from civil unrest or terrorist acts) that are not generally insured (or fully insured against) or underinsured losses (such as those resulting from claims in connection with the occurrence of mold, asbestos, and lead) because they are either uninsurable or not economically insurable. Should an uninsured or underinsured loss occur to a property, we could be required to use our own funds for restoration or lose all or part of our investment in, and anticipated revenues from, the property and would continue to be obligated on any mortgage indebtedness on the property. Any such loss could have a material effect on us and our ability to make distributions to our shareholders and pay amounts due on our debt. In addition, a failure of any of our insurers to comply with their obligations to us could have a material adverse effect on us and our ability to make distributions to our shareholders and pay amounts due on our debt
Adverse changes in laws may affect our liability relating to our properties and our operations.
Increases in real estate taxes and income, service and transfer taxes cannot always be passed through to residents or users in the form of higher rents, and may adversely affect our cash available for distribution and our ability to make distributions to our shareholders and pay amounts due on our debt. Similarly, changes in laws increasing the potential liability for environmental conditions existing on properties or increasing the restrictions on discharges or other conditions, as well as changes in laws affecting development, construction and safety requirements, may result in significant unanticipated expenditures, which could have a material adverse effect on us and our ability to make distributions to our shareholders and pay amounts due on our debt. In addition, future enactment of rent control or rent stabilization laws or other laws regulating multifamily housing may reduce rental revenues or increase operating costs.
12
Compliance with laws benefiting disabled persons may require us to make significant unanticipated expenditures or impact our investment strategy.
A number of federal, state and local laws (including the Americans with Disabilities Act) and regulations exist that may require modifications to existing buildings or restrict certain renovations by requiring improved access to such buildings by disabled persons and may require other structural features which add to the cost of buildings under construction. Legislation or regulations adopted in the future may impose further burdens or restrictions on us with respect to improved access by disabled persons. The costs of compliance with these laws and regulations may be substantial, and limits or restrictions on construction or completion of certain renovations may limit implementation of our investment strategy in certain instances or reduce overall returns on our investments, which could have a material adverse effect on us and our ability to make distributions to our shareholders and pay amounts due on our debt. We review our properties periodically to determine the level of compliance and, if necessary, take appropriate action to bring such properties into compliance.
The operations of BRE Property Investors LLC are limited.
Six of our properties are held by BRE Property Investors LLC, which is referred to in this Annual Report on Form 10-K as the operating company. We are the sole managing member of the operating company and, as of December 31, 2009, held approximately a 94% equity interest in it. Third parties as non-managing members hold the remaining equity interests in the operating company.
Under the terms of the limited liability company agreement governing the operations of the operating company, the operating company is required to maintain certain debt service coverage, debt-to-asset and other financial ratios intended to protect the members’ rights to receive distributions. The requirement to maintain financial ratios and the restrictions on the actions of the operating company and us as managing member could have a material adverse effect on us and our ability to make distributions to our shareholders and pay amounts due on our debt.
Further, under the terms of the operating company’s limited liability company agreement, the operating company must obtain the consent of a majority in interest of the non-managing members in order to dissolve the operating company other than in certain limited circumstances specified in the operating company’s limited liability company agreement, such as a sale of all or substantially all of our assets, or any merger, consolidation or other combination by us with or into another person, or reclassification, recapitalization or change of our outstanding equity interests.
These restrictions on our ability to dissolve the operating company, even when such a disposition or dissolution of the operating company would be in our best interest, could have a material adverse effect on us and our ability to make distributions to our shareholders and pay amounts due on our debt.
The operating company also must distribute all available cash (as defined in the operating company’s limited liability company agreement) on a quarterly basis as follows: first, a priority distribution to members (other than us) until each member has received, cumulatively on a per operating company unit basis, distributions equal to the cumulative dividends declared with respect to one share of BRE common stock over the corresponding period (subject to adjustment from time to time as applicable to account for stock dividends, stock splits and similar transactions affecting BRE common stock); and second, the balance to us.
If the operating company’s available cash in any quarterly period is insufficient to permit distribution of the full amount of the priority distribution described above for that quarter, we are required to make a capital contribution to the operating company in an amount equal to the lesser of:
| • | the amount necessary to permit the full priority distribution, or |
| • | an amount equal to the sum of any capital expenditures made by the operating company plus the sum of any payments made by the operating company on account of any loans to or investments in, or any guarantees of the obligations of, BRE or our affiliates for that quarterly period. |
13
We may not voluntarily withdraw from the operating company or transfer all or any portion of our interest in the operating company without the consent of all of the non-managing members, except in certain limited circumstances, such as a sale of all or substantially all of our assets, or any merger, consolidation or other combination by us with or into another person, or any reclassification, recapitalization or change of our outstanding equity interests. Such restrictions on our withdrawal as the managing member of the operating company, and on our ability to transfer our interest in the operating company, could have a material adverse effect on us and our ability to make distributions to our shareholders and pay amounts due on our debt.
Survey exceptions to certain title insurance policies may result in incomplete coverage in the event of a claim.
We have not obtained updated surveys for all of the properties we have acquired or developed. Because updated surveys were not always obtained, the title insurance policies obtained by us may contain exceptions for matters that an updated survey might have disclosed. Such matters might include such things as boundary encroachments, unrecorded easements or similar matters, which would have been reflected on a survey. Moreover, because no updated surveys were prepared for some properties, we cannot assure you that the title insurance policies in fact cover the entirety of the real property, buildings, fixtures, and improvements which we believe they cover. Incomplete coverage in the event of a claim could have a material adverse effect on our ability to make distributions to our shareholders and pay amounts due on our debt.
Risks Due to Real Estate Financing
We anticipate that future developments and acquisitions will be financed, in whole or in part, under various construction loans, lines of credit, and other forms of secured or unsecured financing or through the issuance of additional debt or equity by us. The credit markets have experienced unprecedented volatility over the past twenty-four months impacting our access to and cost of financing. We expect periodically to review our financing options regarding the appropriate mix of debt and equity financing. Equity, rather than debt, financing of future developments or acquisitions could have a dilutive effect on the interests of our existing shareholders. Similarly, there are certain risks involved with financing future developments and acquisitions with debt, including those described below. In addition, if new developments are financed through construction loans, there is a risk that, upon completion of construction, permanent financing for such properties may not be available or may be available only on disadvantageous terms or that the cash flow from new properties will be insufficient to cover debt service. If a newly developed or acquired property is unsuccessful, our losses may exceed our investment in the property. Any of the foregoing could have a negative impact on operations and our ability to make distributions to our shareholders and pay amounts due on our debt.
We may be unable to renew, repay or refinance our outstanding debt.
We are subject to the normal risks associated with debt financing, including the risk that our cash flow will be insufficient to meet required payments of principal and interest, the risk that indebtedness on our properties, or unsecured indebtedness, will not be able to be renewed, repaid or refinanced when due or that the terms of any renewal or refinancing will not be as favorable as the existing terms of such indebtedness. If we were unable to refinance our indebtedness on acceptable terms, or at all, we might be forced to dispose of one or more of our properties on disadvantageous terms, which might result in losses to us. Such losses could have a material adverse effect on us and our ability to make distributions to our shareholders and pay amounts due on our debt. Furthermore, if a property is mortgaged to secure payment of indebtedness and we are unable to meet mortgage payments, the mortgagee could foreclose upon the property, appoint a receiver and receive an assignment of rents and leases or pursue other remedies, all with a consequent loss of our revenues and asset value. Foreclosures could also create taxable income without accompanying cash proceeds, thereby hindering our ability to meet the REIT distribution requirements of the Internal Revenue Code.
14
Rising interest rates would increase the cost of our variable rate debt.
We have incurred and expect in the future to incur indebtedness and interest rate hedges that bear interest at variable rates. Accordingly, increases in interest rates would increase our interest costs, which could have a material adverse effect on us and our ability to make distributions to our shareholders and pay amounts due on our debt or cause us to be in default under certain debt instruments. In addition, an increase in market interest rates may lead holders of our common shares to demand a higher yield on their shares from distributions by us, which could adversely affect the market price for our common stock.
We may incur additional debt in the future.
We currently fund the acquisition and development of multifamily communities partially through borrowings (including our lines of credit) as well as from other sources such as sales of properties which no longer meet our investment criteria or the contribution of property to joint ventures which may in turn secure debt. Our organizational documents do not contain any limitation on the amount of indebtedness that we may incur. Accordingly, subject to limitations on indebtedness set forth in various loan agreements, we could become more highly leveraged, resulting in an increase in debt service, which could have a material adverse effect on us and our ability to make distributions to our shareholders and pay amounts due on our debt and in an increased risk of default on our obligations.
The restrictive terms of certain of our indebtedness may cause acceleration of debt payments.
At December 31, 2009, we had outstanding borrowings of approximately $1.9 billion. Our indebtedness contains financial covenants as to minimum net worth, interest coverage ratios, maximum secured debt, and total debt to capital, among others. In the event that an event of default occurs, our lenders may declare borrowings under the respective loan agreements to be due and payable immediately, which could have a material adverse effect on us and our ability to make distributions to our shareholders and pay amounts due on our debt.
Failure to hedge effectively against interest rates may adversely affect results of operations.
We seek to manage our exposure to interest rate volatility by using interest rate hedging arrangements, such as interest rate cap agreements and interest rate swap agreements. These agreements involve risks, such as the risk that the counterparties may fail to honor their obligations under these arrangements, that these arrangements may not be effective in reducing our exposure to interest rate changes and that a court could rule that such an agreement is not legally enforceable. Hedging may reduce overall returns on our investments. Failure to hedge effectively against interest rate changes could have a material adverse effect on us and our ability to make distributions to our shareholders and pay amounts due on our debt.
Potential Liability under Environmental Laws
Under various federal, state and local laws, ordinances and regulations, a current or previous owner or operator of real estate may be liable for the costs of removal or remediation of certain hazardous or toxic substances in, on, around or under such property. Such laws often impose such liability without regard to whether the owner or operator knew of, or was responsible for, the presence of such hazardous or toxic substances. The presence of, or failure to remediate properly, hazardous or toxic substances may adversely effect the owner’s or operator’s ability to sell or rent the affected property or to borrow using the property as collateral. Persons who arrange for the disposal or treatment of hazardous or toxic substances may also be liable for the costs of removal or remediation of hazardous or toxic substances at a disposal or treatment facility, whether or not the facility is owned or operated by the person. Certain environmental laws impose liability for release of asbestos-containing materials into the air, and third parties may also seek recovery from owners or operators of real properties for personal injury associated with asbestos-containing materials and other hazardous or toxic substances. Federal and state laws also regulate the operation and subsequent removal of certain underground storage tanks. In
15
connection with the current or former ownership (direct or indirect), operation, management, development or control of real properties, we may be considered an owner or operator of such properties or as having arranged for the disposal or treatment of hazardous or toxic substances and, therefore, may be potentially liable for removal or remediation costs, as well as certain other costs, including governmental fines, and claims for injuries to persons and property.
Our current policy is to obtain a Phase I environmental study on each property we seek to acquire and to proceed accordingly. We cannot assure you, however, that the Phase I environmental studies or other environmental studies undertaken with respect to any of our current or future properties will reveal:
| • | all or the full extent of potential environmental liabilities; |
| • | that any prior owner or operator of a property did not create any material environmental condition unknown to us; |
| • | that a material environmental condition does not otherwise exist as to any one or more of such properties; or |
| • | that environmental matters will not have a material adverse effect on us and our ability to make distributions to our shareholders and pay amounts due on our debt. |
Certain environmental laws impose liability on a previous owner of property to the extent that hazardous or toxic substances were present during the prior ownership period. A transfer of the property does not relieve an owner of such liability. Thus, we may have liability with respect to properties previously sold by our predecessors or by us.
There have been a number of lawsuits against owners and managers of multifamily properties alleging personal injury and property damage caused by the presence of mold in residential real estate. Some of these lawsuits have resulted in substantial monetary judgments or settlements. Insurance carriers have reacted to these liability awards by excluding mold related claims from standard policies and pricing mold endorsements separately. We have obtained a separate pollution insurance policy that covers mold-related claims and have adopted programs designed to minimize the existence of mold in any of our properties as well as guidelines for promptly addressing and resolving reports of mold. To the extent not covered by our pollution policy, the presence of significant mold could expose us to liability from residents and others if property damage, health concerns, or allegations thereof, arise.
Risks Associated with U.S. Federal Income Tax Liabilities
We may in the future choose to pay dividends in our own stock, in which case you may be required to pay tax in excess of the cash you receive.
We may distribute taxable dividends that are partially payable in cash and partially payable in our stock. Under recent IRS guidance, up to 90% of any such taxable dividend with respect to calendar years 2008 through 2011, and in some cases declared as late as December 31, 2012, could be payable in our stock if certain conditions are met. Taxable stockholders receiving such dividends will be required to include the full amount of the dividend as ordinary income to the extent of our current and accumulated earnings and profits for United States federal income tax purposes. As a result, a U.S. stockholder may be required to pay tax with respect to such dividends in excess of the cash received. If a U.S. stockholder sells the stock it receives as a dividend in order to pay this tax, the sales proceeds may be less than the amount included in income with respect to the dividend, depending on the market price of our stock at the time of the sale. Furthermore, with respect to non-U.S. stockholders, we may be required to withhold U.S. tax with respect to such dividends, including in respect of all or a portion of such dividend that is payable in stock. In addition, if a significant number of our stockholders determine to sell shares of our stock in order to pay taxes owed on dividends, such sales may put downward pressure on the trading price of our stock.
16
Risks Associated with Our Disclosure Controls and Procedures and Internal Control over Financial Reporting
Our business could be adversely impacted if we have deficiencies in our disclosure controls and procedures or internal control over financial reporting.
The design and effectiveness of our disclosure controls and procedures and internal control over financial reporting may not prevent all errors, misstatements or misrepresentations. While management continues to review the effectiveness of our disclosure controls and procedures and internal control over financial reporting, we can not assure you that our disclosure controls and procedures or internal control over financial reporting will be effective in accomplishing all control objectives all of the time. Deficiencies, particularly material weaknesses, in internal control over financial reporting which may occur in the future could result in misstatements of our results of operations, restatements of our financial statements, a decline in our stock price, or otherwise materially adversely affect our business, reputation, results of operation, financial condition or liquidity.
Ranking of Securities and Subordination of Claims
A portion of our operations is conducted through our subsidiaries, including the operating company. Our cash flow and the consequent ability to make distributions and other payments on our equity securities and to service our debt will be partially dependent upon the earnings of our subsidiaries and the distribution of those earnings to us, or upon loans or other payments of funds made by our subsidiaries to us. In addition, debt or other arrangements of our subsidiaries may impose restrictions that affect, among other things, our subsidiaries’ ability to pay dividends or make other distributions or loans to us.
Likewise, a portion of our consolidated assets is owned by our subsidiaries, effectively subordinating certain of our unsecured indebtedness to all existing and future liabilities, including indebtedness, trade payables, lease obligations and guarantees of our subsidiaries. The operating company has guaranteed amounts due under our unsecured credit facility with a syndicate of banks. The operating company and other of our subsidiaries may also, from time to time, guarantee other of our indebtedness. Therefore, our rights and the rights of our creditors, including the holders of other unsecured indebtedness, to participate in the assets of any subsidiary upon the latter’s liquidation or reorganization will be subject to the prior claims of such subsidiary’s creditors, except to the extent that we may ourselves be a creditor with recognized claims against the subsidiary, in which case our claims would still be effectively subordinate to any security interests in or mortgages or other liens on the assets of such subsidiary and would be subordinate to any indebtedness of such subsidiary senior to that held by us.
Provisions in our Charter and Bylaws that Could Limit a Change in Control or Deter a Takeover
In order to maintain our qualification as a REIT, not more than 50% in value of our outstanding capital stock may be owned, actually or constructively, by five or fewer individuals (as defined in the Internal Revenue Code to include certain entities). In order to protect us against risk of losing our status as a REIT due to a concentration of ownership among our shareholders, our charter provides that any shareholder must, upon demand, disclose to our board of directors in writing such information with respect to such shareholder’s direct and indirect ownership of the shares of our stock as we deem necessary to permit us to comply or to verify compliance with the REIT provisions of the Internal Revenue Code, or the requirements of any other taxing authority. Our charter further provides, among other things, that if our board of directors determines, in good faith, that direct or indirect ownership of BRE stock has or may become concentrated to an extent that would prevent us from qualifying as a REIT, our board of directors may prevent the transfer of BRE stock or call for redemption (by lot or other means affecting one or more shareholders selected in the sole discretion of our board of directors) a number of shares of BRE stock sufficient in the opinion of our board of directors to maintain or bring the direct or indirect ownership of BRE stock into conformity with the requirements for maintaining REIT status. These limitations may have the effect of precluding acquisition of control of us by a third party without consent of our board of directors.
17
In addition, certain other provisions contained in our charter and bylaws may have the effect of discouraging a third-party from making an acquisition proposal for us and may thereby inhibit a change in control. Our charter includes provisions granting our board of directors the authority to issue preferred stock from time to time and to establish the terms, preferences and rights of such preferred stock without the approval of our shareholders, restrictions on our shareholders’ ability to remove directors and fill vacancies on our board of directors, restrictions on unsolicited business combinations and restrictions on our shareholders’ ability to amend our charter. Our bylaws contain restrictions on our shareholders’ ability to call special meetings of our board of directors and to take action without a meeting, provisions granting our board of directors the power to amend our bylaws, provisions allowing our board of directors to increase its size, and restrictions on the transfer of shares of our capital stock with respect to the preservation of our REIT status. Such provisions may deter tender offers for BRE stock, which offers may be attractive to our shareholders, or deter purchases of large blocks of BRE stock, thereby limiting the opportunity for shareholders to receive a premium for their shares of BRE stock over then-prevailing market prices.
Tax Risks
Risks related to our REIT status.
We believe we have operated and intend to continue operating in a manner that will allow us to qualify as a REIT for federal income tax purposes under the Internal Revenue Code. However, we cannot assure you that we have in fact operated, or will be able to continue to operate, in a manner so as to qualify, or remain qualified, as a REIT. Qualification as a REIT involves the application of highly technical and complex Internal Revenue Code provisions for which there are only limited judicial or administrative interpretations and the determination of various factual matters and circumstances not entirely within our control. For example, in order to qualify as a REIT, we must satisfy a number of requirements, including requirements regarding the composition of our assets and a requirement that at least 95% of our gross income in any year must be derived from qualifying sources, such as “rents from real property.” Also, we must make distributions to shareholders aggregating annually at least 90% of our net taxable income, excluding net capital gains. In addition, legislation, new regulations, administrative interpretations or court decisions may materially adversely affect our investors, our ability to qualify as a REIT for federal income tax purposes or the desirability of an investment in a REIT relative to other investments.
Even if we qualify as a REIT for federal income tax purposes, we may be subject to some federal, state and local taxes on our income or property and, in certain cases, a 100% penalty tax, in the event we sell property as a dealer.
If we fail to qualify as a REIT, we will be subject to federal income tax (including any applicable alternative minimum tax) on our taxable income at corporate rates, which would likely have a material adverse effect on us, our share price and our ability to make distributions to our shareholders and pay amounts due on our debt. In addition, unless entitled to relief under certain statutory provisions, we would also be disqualified from treatment as a REIT for the four taxable years following the year during which qualification was lost. This treatment would reduce funds available for investment or distribution to our shareholders because of the additional tax liability to us for the year or years involved. In addition, we would no longer be required to make distributions to our shareholders. To the extent that distributions to our shareholders would have been made in anticipation of qualifying as a REIT, we might be required to borrow funds or to liquidate certain investments to pay the applicable tax. Finally, we cannot assure you that new legislation, new regulations, administrative interpretations or court decisions will not change the tax laws with respect to qualification as a REIT or the federal income tax consequences of such qualification.
| Item 1B. | UNRESOLVED STAFF COMMENTS |
None.
18
| Item 2. | PROPERTIES |
General
In addition to the information in this Item 2, certain information regarding our property portfolio is contained in Schedule III (financial statement schedule) under Part IV, Item 15(a) (2).
Multifamily Property Data
Our multifamily properties represent 99% of our real estate portfolio and 99% of our total revenue.
| Multifamily Properties |
2009 | 2008 | 2007 | 2006 | 2005 | ||||||||||
| Percentage of total portfolio at cost, as of December 31 |
99 | % | 99 | % | 99 | % | 99 | % | 99 | % | |||||
| Percentage of total revenues, for the year ended December 31 |
99 | % | 99 | % | 99 | % | 99 | % | 99 | % |
No single multifamily property accounted for more than 10% of total revenues in any of the five years ended December 31, 2009.
This table summarizes information about our 2009 operating multifamily properties:
| Market |
Number of Communities |
Units | Percentage of Revenue(1) |
Percentage of NOI(1) |
Occupancy(2) | Market Rent(3) | ||||||||||
| San Diego |
13 | 3,958 | 20 | % | 21 | % | 97 | % | $ | 1,516 | ||||||
| San Francisco Bay Area |
10 | 3,152 | 18 | % | 19 | % | 95 | % | $ | 1,791 | ||||||
| Orange County |
10 | 3,325 | 16 | % | 16 | % | 95 | % | $ | 1,587 | ||||||
| Inland Empire |
12 | 3,553 | 14 | % | 14 | % | 95 | % | $ | 1,217 | ||||||
| Seattle |
13 | 3,408 | 14 | % | 14 | % | 92 | % | $ | 1,256 | ||||||
| Los Angeles |
12 | 2,547 | 13 | % | 13 | % | 96 | % | $ | 1,778 | ||||||
| Sacramento |
1 | 400 | 2 | % | 1 | % | 96 | % | $ | 1,184 | ||||||
| Phoenix |
2 | 902 | 3 | % | 2 | % | 92 | % | $ | 894 | ||||||
| Total/Weighted Average |
73 | 21,245 | 100 | % | 100 | % | 95 | % | $ | 1,475 | ||||||
The following table discloses certain operating data about our consolidated multifamily units:
| December 31, | ||||||||||||||||||||
| 2009 | 2008 | 2007 | 2006 | 2005 | ||||||||||||||||
| Total number of units |
21,245 | 21,196 | 21,808 | 22,680 | 23,954 | |||||||||||||||
| Portfolio occupancy(4) |
95 | % | 94 | % | 94 | % | 94 | % | 94 | % | ||||||||||
| Average monthly rent per unit |
$ | 1,475 | $ | 1,528 | $ | 1,424 | $ | 1,363 | $ | 1,191 | ||||||||||
| Total number of properties |
73 | 72 | 77 | 81 | 85 | |||||||||||||||
| (1) | Represents the aggregate revenue and net operating income (NOI) from properties in each market divided by the total revenue and net operating income of multifamily properties for the year ended December 31, 2009. Excludes revenue and NOI from properties sold in 2009 and income from unconsolidated joint ventures. |
| (2) | Represents average physical occupancy for all stabilized properties for the twelve months ended December 31, 2009. The total is a weighted average by units for all communities shown. |
| (3) | Represents average prevailing gross market rent per unit for the twelve months ended December 31, 2009. The total is a weighted average by units for all communities shown. |
| (4) | Portfolio occupancy is calculated by dividing the total occupied units by the total units in the portfolio at the end of the year. Apartment units are generally leased to residents for rental terms not exceeding one year. |
19
The following table summarizes our “same-store” operating results. “Same-store” properties are defined as properties that have been completed, stabilized and owned by us for at least two years.
| December 31, | |||||||||||||||
| 2009 | 2008 | 2007 | 2006 | 2005 | |||||||||||
| Number of same-store units |
19,572 | 19,053 | 19,233 | 19,104 | 18,286 | ||||||||||
| Same-store units % of total units |
92 | % | 90 | % | 89 | % | 84 | % | 76 | % | |||||
| Same-store revenue (decrease)/increase |
(3.9 | %) | 3.4 | % | 5.0 | % | 6.2 | % | 4.2 | % | |||||
| Same-store expense increase |
1.9 | % | 4.0 | % | 1.5 | % | 7.0 | % | 2.1 | % | |||||
| Same-store NOI (decrease)/increase |
(6.4 | %) | 3.2 | % | 6.5 | % | 5.9 | % | 5.2 | % | |||||
Our business focus is the ownership, development and operation of multifamily communities; we evaluate performance and allocate resources primarily based on the net operating income (“NOI”) of an individual multifamily community. We define NOI as the excess of all revenue generated by the community (primarily rental revenue) less direct real estate expenses. Accordingly, NOI does not take into account community-specific costs such as depreciation, capitalized expenditures and interest expense. NOI, including NOI from discontinued operations, totaled approximately $243,000,000, $268,000,000, and $255,000,000 for the years ended December 31, 2009, 2008, and 2007, respectively.
A reconciliation of net income available to common shareholders to NOI for the three years ended December 31 is as follows:
| Years ended December 31 | ||||||||||||
| 2009 | 2008(1) | 2007(1) | ||||||||||
| (amounts in thousands) | ||||||||||||
| Net income available to common shareholders |
$ | 50,642 | $ | 122,760 | $ | 103,607 | ||||||
| Interest expense, including discontinued operations |
82,734 | 92,067 | 88,336 | |||||||||
| Provision for depreciation, including discontinued operations |
88,419 | 81,459 | 79,949 | |||||||||
| Redeemable noncontrolling interests in income |
1,885 | 2,291 | 2,279 | |||||||||
| Net gain on sales of discontinued operations |
(21,574 | ) | (65,984 | ) | (55,957 | ) | ||||||
| General and administrative expense |
17,390 | 20,578 | 18,241 | |||||||||
| Dividends attributable to preferred stock |
11,813 | 11,813 | 16,122 | |||||||||
| Other expenses |
13,522 | 5,719 | — | |||||||||
| Net gain on extinguishment of debt |
(1,470 | ) | (2,364 | ) | — | |||||||
| Redemption related preferred stock issuance cost |
— | — | 2,768 | |||||||||
| Net operating income |
$ | 243,361 | $ | 268,339 | $ | 255,345 | ||||||
| (1) | Restated to reflect the adoption of new accounting guidance requiring retroactive application (Note 2). |
We consider community level and portfolio-wide NOI to be an appropriate supplemental measure to net income because it helps both investors and management to understand the core property operations prior to the allocation of any corporate-level property management overhead or general and administrative costs. This is more reflective of the operating performance of the real estate, and allows for an easier comparison of the operating performance of single assets or groups of assets. In addition, because prospective buyers of real estate have different overhead structures, with varying marginal impact to overhead by acquiring real estate, NOI is considered by many in the real estate industry to be a useful measure for determining the value of a real estate asset or groups of assets.
However, because NOI excludes depreciation and does not capture the change in the value of our communities resulting from operational use and market conditions, nor the level of capital expenditures required to adequately maintain the communities (all of which have real economic effect and could materially impact our results from operations), the utility of NOI as a measure of our performance is limited. Other equity REITs may
20
not calculate NOI consistently with our definition and, accordingly, our NOI may not be comparable to such other REITs’ NOI. As a result, NOI should be considered only as a supplement to net income as a measure of our performance. NOI should not be used as a measure of our liquidity, nor is it indicative of funds available to fund our cash needs, including our ability to pay dividends or make distributions. NOI also should not be used as a supplement to or substitute for cash flow from operating activities (computed in accordance with generally accepted accounting principles in the United States “GAAP”).
Development Properties
The following table provides data on our six multifamily properties that were under various stages of development and construction at December 31, 2009. Completion of the development properties is subject to a number of risks and uncertainties, including construction delays and cost overruns. We cannot assure that these properties will be completed, or that they will be completed by the estimated dates, or for the estimated amounts, or will contain the number of proposed units shown in the table below. In addition to the properties below, we have made predevelopment investments and deposits on land under contract for potential projects totaling approximately $14,128,000.
| (Dollar amounts in millions)
Property Name |
Location | Proposed Number of Units |
Costs Incurred to Date— December 31, 2009(1) |
Estimated Total Cost |
Estimated Cost to Complete |
Estimated Completion Date(2) | |||||||||
| Construction in Progress |
|||||||||||||||
| Belcarra Apartments |
Bellevue, WA | 296 | $ | 86.1 | $ | 86.4 | $ | 0.3 | 1Q/2010 | ||||||
| Villa Granada |
Santa Clara, CA | 270 | 73.6 | 89.7 | 16.1 | 3Q/2010 | |||||||||
| Total Construction in Progress |
566 | $ | 159.7 | $ | 176.1 | $ | 16.4 | ||||||||
| Property Name |
Location | Proposed Number of Units |
Costs Incurred to Date— December 31, 2009 |
Estimated Total Cost(5) |
|||||||||||
| Land Owned(3) |
|||||||||||||||
| Wilshire La Brea(4) |
Los Angeles, CA | 470 | $ | 97.1 | TBR | ||||||||||
| Pleasanton |
Pleasanton, CA | 240 | 14.8 | TBR | |||||||||||
| Stadium Park II |
Anaheim, CA | 250 | 24.5 | TBR | |||||||||||
| Lawrence Station |
Sunnyvale, CA | 338 | 19.1 | TBR | |||||||||||
| Total Land Owned |
1,298 | $ | 155.5 | $ | 580.4 | ||||||||||
| (1) | Reflects all recorded costs incurred as of December 31, 2009, recorded on our consolidated balance sheets as “direct investments in real estate-construction in progress. “ Included in this amount is $58.3 million of costs for the 203 completed units on Belcarra which are reflected on our consolidated balance sheet as “direct investments in real estate-investments in rental properties.” |
| (2) | “Completion” is defined as our estimate of when an entire project will have a final certificate of occupancy issued and be ready for occupancy. Completion dates have been updated to reflect our current estimates of receipt of final certificates of occupancy, which are dependent on several factors, including construction delays and the inability to obtain necessary public approvals. |
| (3) | Land owned represents projects in various stages of entitlement, pre-development, development, and initial construction, for which construction or supply contracts have not yet been finalized. As these contracts are finalized, projects are transferred to construction in progress on our consolidated balance sheet. |
| (4) | Project’s estimated cost reflects the construction of 470 units and 40,000 square feet of retail. The estimated unit count and costs reflect the current underlying entitlements associated with the site. |
| (5) | Reflects the aggregate cost estimates; specific property cost estimates to be reported (TBR) once entitlement approvals are received and the company is prepared to begin construction. |
21
Insurance, Property Taxes and Income Tax Basis
We carry comprehensive liability, fire, pollution, extended coverage and rental loss insurance on our properties with certain policy specifications, limits and deductibles. In addition, at December 31, 2009, we carried flood and earthquake coverage with an annual aggregate limit of $90,000,000 (after policy deductibles ranging from 2%-5% of damages). Management believes the properties are adequately covered by such insurance.
Property taxes on portfolio properties are assessed on asset values based on the valuation method and tax rate used by the respective jurisdictions. The gross carrying value of our direct investments in operating rental properties was $3,180,633,000 as of December 31, 2009. On the same date our assets had an underlying federal income tax basis of approximately $3,078,963,000, reflecting, among other factors, the carryover of basis on tax-deferred exchanges.
Headquarters
We lease our corporate headquarters at 525 Market Street, 4th Floor, San Francisco, California, 94105-2712, from Knickerbocker Properties, Inc., a Delaware corporation. The lease covers 28,339 rentable square feet at annual per square foot rents, which were $24.00 as of December 31, 2009. The lease term ends on February 1, 2016. We also maintain regional offices in: Seattle, Washington; Emeryville, Irvine and San Diego, California; Phoenix, Arizona; and Denver, Colorado.
| Item 3. | LEGAL PROCEEDINGS |
The Company is involved in various legal actions arising in the ordinary course of business. As of December 31, 2009, there were no pending legal proceedings to which we are a party or of which any of our properties is the subject, which management anticipates would have a material adverse effect upon our consolidated financial condition and results of operations. See Note 16 to the consolidated financial statements for further detail or recent legal proceedings.
| Item 4. | SUBMISSION OF MATTERS TO A VOTE OF SECURITY HOLDERS |
None.
22
PART II
| Item 5. | MARKET FOR REGISTRANT’S COMMON EQUITY, RELATED SHAREHOLDER MATTERS AND ISSUER PURCHASES OF EQUITY SECURITIES |
Our common stock is traded on the New York Stock Exchange under the symbol “BRE”. As of January 29, 2010, there were approximately 3,388 recordholders of BRE’s common stock and the last reported sales price on the NYSE was $32.07. The number of holders does not include shares held of record by a broker or clearing agency, but does include each such broker or clearing agency as one recordholder. As of January 30, 2010, there were approximately 17,280 beneficial holders of BRE’s common stock.
This table shows the high and low sales prices of our common stock reported on the NYSE Composite Tape and the dividends we paid for each common share:
| Years ended December 31, | ||||||||||||||||||
| 2009 | 2008 | |||||||||||||||||
| Stock Price | Dividends Paid |
Stock Price | Dividends Paid | |||||||||||||||
| High | Low | High | Low | |||||||||||||||
| First Quarter |
$ | 28.70 | $ | 17.04 | $ | 0.5625 | $ | 48.84 | $ | 34.01 | $ | 0.5625 | ||||||
| Second Quarter |
$ | 26.81 | $ | 18.92 | $ | 0.5625 | $ | 51.87 | $ | 42.59 | $ | 0.5625 | ||||||
| Third Quarter |
$ | 32.77 | $ | 20.01 | $ | 0.3750 | $ | 52.50 | $ | 40.13 | $ | 0.5625 | ||||||
| Fourth Quarter |
$ | 35.21 | $ | 26.77 | $ | 0.3750 | $ | 49.19 | $ | 18.06 | $ | 0.5625 | ||||||
Since 1970, when BRE was founded, we have made regular and uninterrupted quarterly distributions to shareholders. The payment of distributions by BRE is at the discretion of the Board of Directors and depends on numerous factors, including our cash flow, financial condition and capital requirements, REIT provisions of the Internal Revenue Code and other factors.
Operating company units in BRE Property Investors LLC exchanged for shares of BRE common stock or cash totaled 10,674 and 63,600 for the years ended December 31, 2009 and 2008, respectively.
Equity Compensation Plan Information
The following table sets forth information as of December 31, 2009 for all of our equity compensation plans, including our Amended and Restated 1992 Employee Stock Plan, our 1999 Stock Incentive Plan and our Fifth Amended and Restated Non-Employee Director Stock Option and Restricted Stock Plan:
| Number of Securities to be Issued upon Exercise of Outstanding Options, Warrants and Rights |
Weighted Average Exercise Price of Outstanding Options, Warrants and Rights ($) |
Number of Securities Remaining Available for Future Issuance under Equity Compensation Plans Excluding Securities Reflected in Column (a) | |||||
| (a) | (b) | (c) | |||||
| Plan Category |
|||||||
| Equity compensation plans approved by security holders |
1,388,978 | $ | 32.85 | 1,092,998 | |||
| Equity compensation plans not approved by security holders |
— | — | — | ||||
| Total |
1,388,978 | $ | 32.85 | 1,092,998 | |||
23
COMPARATIVE STOCK PERFORMANCE
The line graph below compares the cumulative total shareholder return on BRE Common Stock for the last five years with the cumulative total return on the S&P 500 Index and the Morgan Stanley REIT Index over the same period. This comparison assumes that the value of the investment in the Common Stock and in each index was $100 on December 31, 2004 and that all dividends were reinvested (1).
BRE Properties, Inc.
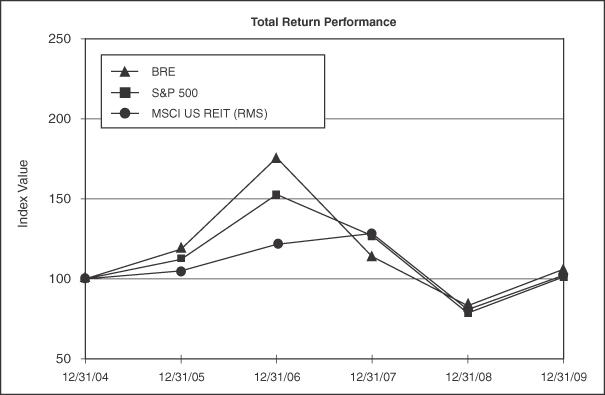
| Index |
12/31/2004 | 12/31/2005 | 12/31/2006 | 12/31/2007 | 12/31/2008 | 12/31/2009 | ||||||
| BRE Properties, Inc. |
100.00 | 118.37 | 175.42 | 113.80 | 83.12 | 105.92 | ||||||
| S&P 500 |
100.00 | 112.13 | 152.41 | 126.78 | 78.64 | 101.14 | ||||||
| MSCI US REIT (RMS) |
100.00 | 104.91 | 121.48 | 128.16 | 80.74 | 102.11 |
| (1) | Common Stock performance data is provided by SNL Securities and is calculated using the ex-dividend date. |
| (2) | Indicates appreciation of $100 invested on December 31, 2004 in BRE Common Stock, S&P 500, and Morgan Stanley REIT Index securities, assuming reinvestment of dividends discussed above. |
24
Recent Sales of Unregistered Securities; Use of Proceeds from Unregistered Securities
During the year ended December 31, 2009, an aggregate 10,674 limited partnership units in BRE Property Investors LLC were exchanged for cash equaling the value shares of BRE common stock with a one to one exchange ratio.
Issuer Purchases of Equity Securities
| (a) Total Number of Shares (or Units) Purchased(1) |
(b) Average Price Paid per Share (or Unit)(2) |
(c) Total Number of Shares (or Units) Purchased as Part of Publicly Traded Announced Plans or Programs |
(d) Maximum Number (or Approximate Dollar Value) of Shares (or Units) that May Yet Be Purchased Under the Plans or Programs | |||||
| January 1, 2009 though March 31, 2009 |
5,053 | 25.37 | — | — | ||||
| April 1, 2009 though June 30, 2009 |
731,673 | 55.26 | — | — | ||||
| July 1, 2009 though September 30, 2009 |
89,526 | 55.85 | — | — | ||||
| October 1, 2009 though December 31, 2009 |
594,038 | 55.85 | — | — | ||||
| Total |
1,420,290 | 55.44 | — | — |
| (1) | Includes an aggregate of 18,928 shares withheld to pay taxes and 1,401,361 shares of common stock, which represents the maximum number of shares of common stock that could be issuable upon conversion of the $78,266,000 4.125% convertible senior notes that were purchased during 2009 at a maximum conversion rate of 17.9051 common shares per $1,000 principal amount of notes. |
| (2) | Average price paid per share owned and forfeited by shareholder. |
25
| Item 6. | SELECTED FINANCIAL DATA |
The selected financial data below should be read in conjunction with “Management’s Discussion and Analysis of Financial Condition and Results of Operations” and the consolidated financial statements and notes. The results are affected by numerous acquisitions and dispositions as discussed in “Management’s Discussion and Analysis of Financial Condition and Results of Operations.” Therefore, the consolidated financial statements and notes thereto included elsewhere in this report are not directly comparable to prior years.
| 2009 | 2008(1) | 2007(1) | 2006(1) | 2005(1) | ||||||||||||||||
| (Amounts in thousands, except per share data) | ||||||||||||||||||||
| Operating Results |
||||||||||||||||||||
| Rental and ancillary revenues |
$ | 344,604 | $ | 345,285 | $ | 321,771 | $ | 295,457 | $ | 265,277 | ||||||||||
| Revenues from discontinued operations |
4,242 | 23,813 | 32,870 | 41,157 | 56,028 | |||||||||||||||
| Income from unconsolidated entities and other income |
5,788 | 10,445 | 7,920 | 27,972 | 7,960 | |||||||||||||||
| Total revenues |
$ | 354,634 | $ | 379,543 | $ | 362,561 | $ | 364,586 | $ | 329,265 | ||||||||||
| Net income available to common shareholders |
$ | 50,642 | $ | 122,760 | $ | 103,607 | $ | 100,350 | $ | 63,075 | ||||||||||
| Plus: |
||||||||||||||||||||
| Net gain on sales of discontinued operations |
(21,574 | ) | (65,984 | ) | (55,957 | ) | (38,302 | ) | (26,897 | ) | ||||||||||
| Depreciation from continuing operations |
88,260 | 79,107 | 74,184 | 67,973 | 64,364 | |||||||||||||||
| Depreciation from discontinued operations |
159 | 2,352 | 5,765 | 6,861 | 9,912 | |||||||||||||||
| Depreciation related to unconsolidated entities |
1,841 | 1,715 | 1,285 | 844 | 836 | |||||||||||||||
| Redeemable noncontrolling interest in income |
1,461 | 1,868 | 1,857 | 1,976 | 2,040 | |||||||||||||||
| Funds from operations (FFO)(2) |
$ | 120,789 | $ | 141,818 | $ | 130,741 | $ | 139,702 | $ | 113,330 | ||||||||||
| Other expenses(3) |
$ | 13,522 | $ | 5,719 | $ | — | $ | 1,138 | $ | 2,670 | ||||||||||
| Redemption related preferred stock issuance cost(4) |
$ | — | $ | — | $ | 2,768 | $ | — | $ | — | ||||||||||
| Net cash flows generated by operating activities |
$ | 130,683 | $ | 167,010 | $ | 157,896 | $ | 171,641 | $ | 125,428 | ||||||||||
| Net cash flows used in investing activities |
$ | (80,537 | ) | $ | (47,820 | ) | $ | (216,391 | ) | $ | (97,077 | ) | $ | (144,214 | ) | |||||
| Net cash flows (used in) generated by financing activities |
$ | (52,214 | ) | $ | (118,418 | ) | $ | 55,365 | $ | (83,025 | ) | $ | 37,329 | |||||||
| Dividends paid to common and preferred shareholders and distributions to noncontrolling interests |
$ | 114,379 | $ | 130,129 | $ | 128,092 | $ | 125,994 | $ | 123,041 | ||||||||||
| Weighted average shares outstanding—basic |
52,760 | 51,050 | 50,735 | 50,925 | 50,930 | |||||||||||||||
| Dilutive effect of stock based awards |
1 | 390 | 790 | 1,045 | 860 | |||||||||||||||
| Weighted average shares outstanding—diluted (EPS) |
52,761 | 51,440 | 51,525 | 51,970 | 51,790 | |||||||||||||||
| Plus—Operating Company Units(5) |
780 | 830 | 870 | 975 | 1,020 | |||||||||||||||
| Weighted average shares outstanding—diluted (FFO) |
53,541 | 52,270 | 52,395 | 52,945 | 52,810 | |||||||||||||||
| Operating company units outstanding at end of period |
771 | 780 | 845 | 959 | 1,020 | |||||||||||||||
| Net income per share—basic |
$ | 0.95 | $ | 2.38 | $ | 2.03 | $ | 1.96 | $ | 1.23 | ||||||||||
| Net income per share—assuming dilution |
$ | 0.95 | $ | 2.36 | $ | 2.00 | $ | 1.92 | $ | 1.21 | ||||||||||
| Dividends paid to common shareholders |
$ | 1.88 | $ | 2.25 | $ | 2.15 | $ | 2.05 | $ | 2.00 | ||||||||||
| Balance sheet information and other data |
||||||||||||||||||||
| Real estate portfolio, net of depreciation |
$ | 2,915,565 | $ | 2,911,295 | $ | 2,884,206 | $ | 2,752,913 | $ | 2,639,395 | ||||||||||
| Total assets |
$ | 2,980,008 | $ | 2,992,744 | $ | 2,954,166 | $ | 2,823,023 | $ | 2,704,390 | ||||||||||
| Total debt |
$ | 1,867,075 | $ | 1,902,401 | $ | 1,887,862 | $ | 1,631,132 | $ | 1,560,574 | ||||||||||
| Redeemable noncontrolling interests |
$ | 33,605 | $ | 29,972 | $ | 42,357 | $ | 136,948 | $ | 80,468 | ||||||||||
| Shareholders’ equity |
$ | 1,022,919 | $ | 969,204 | $ | 943,542 | $ | 977,750 | $ | 1,007,349 | ||||||||||
26
| (1) | Restated to reflect the adoption of new accounting guidance requiring retroactive application (Note 2 to our audited financial statements). |
| (2) | FFO is used by industry analysts and investors as a supplemental performance measure of an equity REIT. FFO is defined by the National Association of Real Estate Investment Trusts as net income or loss (computed in accordance with accounting principles generally accepted in the United States) excluding extraordinary items as defined under GAAP and gains or losses from sales of previously depreciated real estate assets, plus depreciation and amortization of real estate assets and adjustments for unconsolidated partnerships and joint ventures. We calculate FFO in accordance with the NAREIT definition. |
| We believe that FFO is a meaningful supplemental measure of our operating performance because historical cost accounting for real estate assets in accordance with GAAP assumes that the value of real estate assets diminishes predictably over time, as reflected through depreciation. Because real estate values have historically risen or fallen with market conditions, management considers FFO an appropriate supplemental performance measure because it excludes historical cost depreciation, as well as gains or losses related to sales of previously depreciated property, from GAAP net income. By excluding depreciation and gains or losses on sales of real estate, management uses FFO to measure returns on its investments in real estate assets. However, because FFO excludes depreciation and amortization and captures neither the changes in the value of our properties that result from use or market conditions nor the level of capital expenditures to maintain the operating performance of our properties, all of which have real economic effect and could materially impact our results from operations, the utility of FFO as a measure of our performance is limited. Management also believes that FFO, combined with the required GAAP presentations, is useful to investors in providing more meaningful comparisons of the operating performance of a company’s real estate between periods or as compared to other companies. FFO does not represent net income or cash flows from operations as defined by GAAP and is not intended to indicate whether cash flows will be sufficient to fund cash needs. It should not be considered an alternative to net income as an indicator of a REIT’s operating performance or to cash flows as a measure of liquidity. Our FFO may not be comparable to the FFO of other REITs due to the fact that not all REITs use the NAREIT definition or apply/interpret the definition differently. |
| (3) | Other expenses for 2009 total $13,522,000, which represent a $12,900,000 abandonment charge related to three sites under option agreements or letters of intent and a $600,000 severance charge. Other expenses for 2008 total $5,719,000, which represent a $5,119,000 abandonment charge related to three sites under option agreements or letters of intent and a $600,000 severance charge. Other expenses for 2006 total $1,138,000, which represent $576,000 of prepayment charges associated with the early retirement of $150,000,000 of senior unsecured notes scheduled to mature March 2007 and the remaining $562,000 related to litigation and consulting costs incurred in connection with the construction defect litigation related to our Red Hawk Ranch Community, located in Fremont, California and various subcontractors. Other expenses for 2005 represent Red Hawk Ranch litigation and consulting costs. |
| (4) | Represents preferred stock issuance costs related to the redemption of our 8.08% Series B Cumulative Redeemable Preferred Stock during the quarter ended September 30, 2007. |
| (5) | Under earnings per share guidance, common share equivalents deemed to be anti-dilutive are excluded from the diluted per share calculations. |
27
| Item 7. | MANAGEMENT’S DISCUSSION AND ANALYSIS OF FINANCIAL CONDITION AND RESULTS OF OPERATIONS |
Executive Summary
We are a self-administered equity real estate investment trust or REIT focused on the development, acquisition and management of apartment communities in six metropolitan markets of the Western United States. At December 31, 2009, our portfolio had real estate assets with a net book value of approximately $2.9 billion that included 73 wholly or majority owned completed apartment communities, aggregating 21,245 units; thirteen multifamily communities owned in joint ventures, comprised of 4,080 apartment units; and six apartment communities in various stages of construction and development. We earn revenue and generate operating cash flow primarily by collecting monthly rent from our apartment residents.
Our annual results reflect the impact of a severe economic recession that extended into 2009 and affected both the operating and capital markets in which we conduct our business. In recognition of the weakened economic environment, we focused our enterprise priorities on employing a defensive operating posture, scaling back our development activities, enhancing liquidity and preserving capital.
During 2009, approximately 4.8 million jobs were removed from the national economy. In our operating markets – California, Washington and Arizona – year-over-year job losses totaled 420,000 jobs. At the end of 2009, unemployment in California totaled 12.4%.
Consistent with management’s belief that high levels of unemployment, declining single – family home values and other deflationary pressures will pressure operating results into the second half of 2010, we introduced in early 2009 a tactical plan that sought to increase occupancy levels and minimize the effect of a decline in future rental rates. We believe this strategy supported our ability to end 2009 with an average occupancy level in excess of 95% at our same store properties.
Carrying forward actions taken in the fourth quarter of 2008 in which we decelerated our development program, we did not start any new developments in 2009. We do not anticipate commencing any new projects until the second half of 2010, at the earliest, and any potential projects will be evaluated based on our assessment of economic and capital market conditions at that time.
During 2009, we also took measures to strengthen our financial condition and preserve capital. Through a combination of secured financing, common equity issuance and property dispositions, we raised over $800 million in capital. The proceeds from these activities were used to refinance near-term debt maturities and reduce our overall level of leverage. Effective with the quarterly distribution for the third quarter, we reduced our quarterly common dividends to $0.3750 from $0.5625 per share, or the equivalent of $1.50 per common share on an annualized basis.
To better understand our overall results, our 73 wholly or majority owned apartment communities can be characterized as follows:
| • | 19,572 units in 67 communities were completed and stabilized for all of 2009 and 2008 (“same-store” communities); |
| • | 1,673 units in six development communities were experiencing lease up and stabilization during 2009 and 2008 and as a result did not have comparable year-over-year operating results. |
In addition to year-over-year economic operating performance, our results of operations for the three years ended December 31, 2009 were affected by income derived from acquisitions and completions of apartment communities, offset by the cost of capital associated with financing these transactions. Our book capitalization grew to $2.9 billion at December 31, 2009 from $2.8 billion at December 31, 2006, reflecting capital raised through offerings of debt.
28
RESULTS OF OPERATIONS
Comparison of the Years ended December 31, 2009, 2008 and 2007
Revenues
Total revenues were $354,634,000 in 2009, $379,543,000 in 2008 and $362,561,000 in 2007, including revenues from discontinued operations. A summary of revenues for the years ended December 31, 2009, 2008 and 2007 follows:
| 2009 Total | % of Total Revenues |
2008 Total | % of Total Revenues |
2007 Total | % of Total Revenues |
|||||||||||||
| Rental income |
$ | 331,709,000 | 94 | % | $ | 331,704,000 | 87 | % | $ | 308,571,000 | 85 | % | ||||||
| Ancillary income |
12,895,000 | 4 | % | 13,581,000 | 4 | % | 13,200,000 | 4 | % | |||||||||
| Revenues from discontinued operations |
4,242,000 | 1 | % | 23,813,000 | 6 | % | 32,870,000 | 9 | % | |||||||||
| Unconsolidated income |
2,329,000 | — | % | 2,560,000 | 1 | % | 2,133,000 | 1 | % | |||||||||
| Other income |
3,459,000 | 1 | % | 7,885,000 | 2 | % | 5,787,000 | 1 | % | |||||||||
| Total revenue |
$ | 354,634,000 | 100 | % | $ | 379,543,000 | 100 | % | $ | 362,561,000 | 100 | % | ||||||
Rental and Ancillary Income
A portion of the change in rental and ancillary revenues relates to changes in the makeup of our portfolio. The following table summarizes our multifamily property development completed and dispositions:
| Year Ended December 31, | |||||||||
| 2009 | 2008 | 2007 | |||||||
| Total cost of development properties completed |
$ | 282,934,000 | $ | 249,076,000 | — | ||||
| # of units completed |
801 | 872 | — | ||||||
| Net proceeds from property dispositions |
$ | 65,669,000 | $ | 163,215,000 | $ | 99,147,000 | |||
| # of units sold |
752 | 1,484 | 873 | ||||||
The property acquisitions and development properties completed, as noted above, are considered “Non same-store communities” and increased rental and ancillary revenues by $12,321,000 and $12,980,000 for the years ended December 31, 2009 and 2008, respectively. In 2009, on a “same-store” basis, rental and ancillary revenues decreased $13,002,000, or 3.9%, primarily due to negative market rent trends. Average monthly market rents in the “same-store” portfolio decreased to $1,434 per unit from $1,517, or 5.5%, per unit in 2009. In 2008, on a “same-store” basis, rental and ancillary revenues increased $10,534,000 or 3.4%.
| 2009 (Decrease)/Increase |
2008 Increase | ||||||
| Same-store Communities |
$ | (13,002,000 | ) | $ | 10,534,000 | ||
| Non Same-store Communities |
12,321,000 | 12,980,000 | |||||
| Total increase in rental and ancillary revenues from continuing operations |
$ | (681,000 | ) | $ | 23,514,000 | ||
| 2009 | 2008 | 2007 | |||||||
| Number of wholly or majority owned operating properties at December 31, |
73 | 72 | 77 | ||||||
| Average portfolio occupancy rates for operating properties |
95 | % | 94 | % | 94 | % |
Portfolio occupancy is calculated by dividing the total occupied units by the total units in stabilized communities in the portfolio.
29
Other income
Other income totaled $3,459,000, $7,885,000 and $5,787,000 for the years ended December 31, 2009, 2008 and 2007, respectively. The primary components of other income in 2009 includes: 1) $1,700,000 in management fees, 2) $650,000 in interest income, and 3) $640,000 related to litigation and insurance settlements. The 2008 total includes: 1) $4,400,000 in litigation settlement proceeds related to Pinnacle Galleria, 2) $1,726,000 in management fees, 3) $1,007,000 from a forfeited escrow deposit on an asset held for sale that failed to close and 4) $580,000 in interest income. The 2007 total includes: 1) $1,900,000 in litigation settlement proceeds related to Pinnacle Galleria, 2) $1,400,000 in management fees and 3) interest income of $1,900,000.
Net gain from extinguishment of debt
Net gain on extinguishment of debt totaled $1,470,000, $2,364,000 and zero for the years ended December 31, 2009, 2008 and 2007, respectively. The primary drivers of the gain were debt tenders and open market debt repurchases described below.
On April 15, 2009, we closed a fixed price cash tender offer for any and all of our outstanding 5.750% senior notes due 2009 and any and all of our outstanding 4.875% senior notes due 2010. As a result, $61,407,000 and $119,421,000 in aggregate principal amount of the 5.750% senior notes due 2009 and 4.875% senior notes due 2010, respectively, were validly tendered and we accepted, purchased and subsequently cancelled the notes. After giving effect to the purchase of the tendered notes, an aggregate principal amount of $30,579,000 of the 4.875% senior notes due in 2010, remain outstanding. The remaining principal balance of the 5.750% senior notes due in 2009 was paid in full during September 2009, as the note came due.
On April 1, 2009, we closed a fixed price cash tender offer for any and all of our outstanding 7.450% senior notes due 2011 and any and all of our outstanding 7.125% senior notes due 2013. As a result, $201,455,000 and $89,982,000 in aggregate principal amount of the 7.450% senior notes due 2011 and 7.125% senior notes due 2013, respectively, were validly tendered and we accepted, purchased and subsequently cancelled the notes. After giving effect to the purchase of the tendered notes, an aggregate principal amount of $48,545,000 and $40,018,000 of the 7.450% senior notes due 2011 and 7.125% senior notes due 2013, respectively, remain outstanding.
During 2009, we repurchased through open market transactions $78,266,000 of our 4.125% convertible senior unsecured notes for an aggregate price of 92.99% of par, or approximately $72,776,000.
During 2008 we repurchased through open market transactions $10,400,000 of our 4.125% convertible senior unsecured notes for an aggregate price of 74.88% of par, or approximately $8,000,000.
Income from unconsolidated entities
Income from unconsolidated entities totaled $2,329,000, $2,560,000 and $2,133,000 for the years ended December 31, 2009, 2008 and 2007, respectively. The totals for each year include our share of income from thirteen joint ventures we formed, with eight in Denver, four Phoenix, and one in California.
Expenses
Real estate expenses
The summary of real estate expenses, excluding discontinued operations is as follows:
| Year ended December 31, | ||||||||||||
| 2009 | 2008 | 2007 | ||||||||||
| Real estate expenses |
$ | 109,486,000 | $ | 102,405,000 | $ | 95,367,000 | ||||||
| Real estate expenses as a percent of rental and ancillary income from continuing operations |
32 | % | 30 | % | 30 | % | ||||||
| “Same-store” expense % increase |
1.9 | % | 4.0 | % | 1.5 | % | ||||||
30
Real estate expenses for multifamily rental properties (which include repairs and maintenance, utilities, on-site staff payroll, property taxes, insurance, advertising and other direct operating expenses) increased $7,081,000, or 6.9%, for the year ended December 31, 2009, as compared to the prior year. The primary driver of overall expense increase was non same store properties that were recently delivered. Same-store expenses increased $1,831,000, or 1.9%, $3,580,000, or 4.0%, and $1,327,000, or 1.5%, in 2009, 2008 and 2007, respectively. Real estate expenses shown in the table above exclude real estate expense from discontinued operations which totaled $1,787,000, $8,799,000 and $11,849,000 for 2009, 2008 and 2007, respectively.
Provision for depreciation
The provision for depreciation totaled $88,260,000, an increase of $9,153,000, or 11.6%, for the year ended December 31, 2009 compared to 2008, and increased $4,923,000, or 6.6%, for the year ended December 31, 2008 compared to 2007. The increases in 2009 and 2008 resulted from higher depreciable bases on development properties completed.
Interest expense
During the past year, our interest expense decreased due to debt tender and repurchase activity, along with lower average debt balances to support our acquisition and development activities. On April 7, 2009, we closed a $620,000,000 secured credit facility with Deutsche Bank Berkshire Mortgage, Inc. The facility consists of two $310,000,000 tranches. The first tranche has a fixed rate term of 10 years and has a maturity date of May 1, 2019. The second tranche has a maturity date of September 1, 2020, with a fixed rate term for the first 10 years and a variable rate for the remaining one-year period. Together, the effective composite annual cost of debt is 5.6% inclusive of rate hedging transactions. Fifteen multifamily properties totaling 4,651 units with a net carrying value of $607,500,000 secured the credit facility at the time of closing. On March 13, 2007 we completed an offering of $300,000,000 of 10-year senior unsecured notes with a fixed coupon of 5.50%. Capitalized interest is tied to average development balances and the weighted average cost of debt. Average development balances outstanding totaled $307,559,000, $403,469,000 and, $425,761,000 for the years ended December 31, 2009, 2008 and 2007, respectively. Weighted average cost of debt was 5.2%, 5.9% and 6.2% for the years ended December 31, 2009, 2008 and 2007, respectively. The summary of interest expense is as follows:
| Year ended December 31, | ||||||||||||
| 2009 | 2008(1) | 2007(1) | ||||||||||
| Interest on unsecured senior notes |
$ | 40,681,000 | $ | 66,785,000 | $ | 65,126,000 | ||||||
| Interest on convertible debt |
24,986,000 | 26,885,000 | 26,491,000 | |||||||||
| Interest on mortgage loans payable |
28,163,000 | 9,755,000 | 10,394,000 | |||||||||
| Interest on lines of credit |
5,234,000 | 11,731,000 | 11,611,000 | |||||||||
| Total interest incurred |
$ | 99,064,000 | $ | 115,156,000 | $ | 113,622,000 | ||||||
| Capitalized interest |
(16,330,000 | ) | (23,124,000 | ) | (26,029,000 | ) | ||||||
| Total interest expense |
$ | 82,734,000 | $ | 92,032,000 | $ | 87,593,000 | ||||||
| (1) | Restated to reflect the adoption of new accounting guidance requiring retroactive application (Note 2 to our audited financial statements). |
31
Year-end debt balances at December 31, 2009, 2008 and 2007 were as follows:
| 2009 | 2008(1) | 2007(1) | ||||||||||
| Unsecured senior notes |
$ | 469,142,000 | $ | 1,080,000,000 | $ | 1,080,000,000 | ||||||
| Convertible debt |
357,776,000 | 425,905,000 | 428,780,000 | |||||||||
| Mortgage loans payable |
752,157,000 | 151,496,000 | 174,082,000 | |||||||||
| Lines of credit |
288,000,000 | 245,000,000 | 205,000,000 | |||||||||
| Total debt |
$ | 1,867,075,000 | $ | 1,902,401,000 | $ | 1,887,862,000 | ||||||
| Weighted average interest rate for all debt at end of period |
5.2 | % | 5.9 | % | 6.2 | % | ||||||
| (1) | Restated to reflect the adoption of new accounting guidance requiring retroactive application (Note 2 to our audited financial statements). |
General and administrative expenses
General and administrative expenses for the three years ended December 31, were as follows:
| 2009 | 2008 | 2007 | ||||||||||
| General and administrative expenses |
$ | 17,390,000 | $ | 20,578,000 | $ | 18,241,000 | ||||||
| Annual (decrease)/increase as a percentage |
(15.5 | )% | 12.8 | % | 2.0 | % | ||||||
| As a percentage of rental and ancillary revenues (including revenues from discontinued operations) |
5.0 | % | 5.6 | % | 5.1 | % | ||||||
The 16% expense decrease in 2009 is due to the elimination of $1,500,000 in legal fees primarily related to Pinnacle Galleria litigation incurred during 2008 and approximately a $1,300,000 decrease in compensation and benefits during the current year.
Stock based compensation expense included in general and administrative expense totaled $2,596,000, $3,530,000 and $3,868,000 for the years ended December 31, 2009, 2008 and 2007, respectively.
Office rent totaling $1,405,000, $1,164,000 and $1,032,000 for the years ended December 31, 2009, 2008 and 2007, respectively, is included in general and administrative expense.
Other expenses
Other expenses totaled $13,522,000, $5,719,000 and zero for the years ended December 31, 2009, 2008 and 2007, respectively. Other expenses in 2009 represents a $12,900,000 abandonment charge related to three potential development sites under option agreements and a $600,000 severance charge. Other expenses in 2008 represents a $5,119,000 abandonment charge related to three potential development sites under option agreements or letters of intent and a $600,000 severance charge.
Redeemable noncontrolling interest in income
Redeemable noncontrolling interest in income represent the earnings attributable to the minority members of our consolidated subsidiaries and totaled $1,885,000, $2,291,000, and $2,279,000 for the years ended December 31, 2009, 2008 and 2007, respectively. Redeemable noncontrolling interests in income, primarily decreased in 2009 as a result of the reduction of the quarterly common divided from $0.5625 to $0.375 during the third quarter of 2009. Conversions of operating company units to common shares or cash totaled 10,674, 63,600, and 113,737 for the years ended December 31, 2009, 2008 and 2007, respectively.
32
Discontinued operations
FASB guidance requires the results of operations for properties sold during the period or designated as held for sale at the end of the period to be classified as discontinued operations. The property-specific components of net earnings that are classified as discontinued operations include all property-related revenues and operating expenses, depreciation expense recognized prior to the classification as held for sale, and property-specific interest expense to the extent there is secured debt on the property. In addition, the net gain or loss on the eventual disposal of properties held for sale is reported as discontinued operations.
During 2009, we sold two communities totaling 752 units: Overlook at Blue Ravine, with 512 units located in Folsom, California; and Arbor Pointe, a 240 unit community located in Sacramento, California. The two communities were sold for an aggregate sales price of approximately $67,000,000, resulting in a net gain on sales of approximately $21,574,000. In addition to the two communities, we sold an excess parcel of land in Santa Clara, California, classified as held for sale at December 31, 2008, for gross sales proceeds totaling $17,100,000, approximately equal to the carrying value.
During 2008, we sold six communities totaling 1,484 units: Blue Rock Village, with 560 units located in Vallejo, California; The Park at Dash Point, with 280 units located in Seattle, Washington; Pinnacle at Blue Ravine with 260 units, located in Sacramento, California; Canterbury Downs, with 173 units located in Sacramento, California; Rocklin Gold with 121 units located in Sacramento, California; and Quail Chase with 90 units located in Sacramento, California. The six communities were sold for an aggregate sales price of approximately $163,215,000, resulting in a net gain on sale of approximately $65,984,000.
On July 11, 2007, we contributed one community with a total value of $52,000,000 and 432 units located in Phoenix, Arizona, classified as held for sale at June 30, 2007, to a newly formed joint venture in exchange for 15% equity interest in the joint venture and approximately $44,000,000 in cash. The joint venture investment is reported as equity interests in investments in rental properties on the consolidated balance sheet. Our net carrying value of the investment in the joint venture is equal to 15% of the total carrying value of the net asset contributed, at the time of the contribution, which totaled approximately $20,500,000. In connection with the contribution, the Company recognized a gain of $26,600,000.
During 2007, we sold three communities totaling 441 units: Hazel Ranch, with 208 units located in Sacramento, California; Shaliko, with 152 units located in Sacramento, California; and Brentwood Townhomes with 81 units, located in Seattle, Washington. The three communities were sold for an aggregate sales price of approximately $56,400,000, resulting in a net gain on sale of approximately $29,400,000.
The net gain on sale and the combined results of operations for these 12 properties for each year presented are included in discontinued operations on the consolidated statements of income. These amounts totaled $23,870,000, $78,611,000 and $70,470,000 for the year ended December 31, 2009, 2008 and 2007, respectively. There were no operating properties held for sale at December 31, 2009.
Dividends attributable to preferred stock
Dividends for the years ended December 31, 2009, and 2008 attributable to preferred stock represent the dividends on our 6.75% Series C and 6.75% Series D Cumulative Redeemable Preferred Stock. Dividends for the year ended December 31, 2007 attributable to preferred stock also include dividends on our 8.08% Series B preferred stock outstanding at those dates. Dividends for the Series B preferred stock for 2007 reflect the dividends earned from January 1, 2007 to the September 14, 2007 redemption date. Dividend payments totaled $11,813,000, $11,813,000 and $16,122,000 for the years 2009, 2008 and 2007, respectively. All of our currently outstanding series of preferred stock have a $25.00 per share liquidation preference.
33
Net income available to common shareholders
As a result of the various factors mentioned above, net income available to common shareholders for the year ended December 31, 2009 was $50,642,000, or $0.95 per diluted share, as compared with $122,760,000, or $2.36 per diluted share, for the year ended December 31, 2008 and $103,607,000, or $2.00 per diluted share for the year ended December 31, 2007.
Liquidity and Capital Resources
During the past twenty-four months, a confluence of many factors have contributed to diminished expectations for the U.S. economy and increased market volatility for publicly traded securities, including the price of our shares. These factors include decreased availability of credit, increased cost of credit, limited liquidity in the U.S. home mortgage market, deteriorating real estate fundamentals and market valuations, declining business and consumer confidence, and increased unemployment. These trends affect our revenue from our apartment communities and could have a negative impact on our profitability and liquidity.
As a result of these market conditions, the cost and availability of credit has been and may continue to be adversely affected by illiquid credit markets and wider credit spreads. Our access to funds under our credit facility is dependent on the ability of the lenders that are party to the facility to meet their funding commitments to us. In addition, we may not be able to obtain other financing on terms satisfactory to us or at all.
In the event that we do not have sufficient cash available to us from our operations to continue operating our business as usual, we may need to find alternative ways to increase our liquidity. Such alternatives may include, without limitation; (a) divesting ourselves of properties at less than optimal terms; (b) issuing and selling our debt and equity in public or private transactions under less than optimal conditions; (c) entering into leases with new tenants at lower rental rates or less than optimal terms; (d) entering into lease renewals with our existing tenants without an increase in rental rates at turnover; or (e) reducing the level of dividends to common shareholders to the minimum level necessary to maintain our corporate REIT status under the Internal Revenue Code. Taking such measures to increase liquidity may have a materially adverse effect on us and our ability to make distributions to our shareholders and pay amounts due on our debt
On July 30, 2009, our Board of Directors approved a reduction on quarterly common dividends to $0.3750 from $0.5625 per share for the third quarter of 2009. The quarterly common dividend payment of $0.3750 is equivalent to $1.5000 per common share on an annualized basis.
Depending upon the availability and cost of external capital, we anticipate making additional investments in multifamily apartment communities. These investments are expected to be funded through a variety of sources. These sources may include internally generated cash, temporary borrowings under our revolving unsecured line of credit, proceeds from asset sales, public and private offerings of debt and equity securities, and in some cases the assumption of secured borrowings. To the extent that these additional investments are initially financed with temporary borrowings under our revolving unsecured line of credit, we anticipate that permanent financing will be provided through a combination of public and private offerings of debt and equity securities, proceeds from asset sales and secured debt. We believe our liquidity and various sources of available capital are sufficient to fund operations, meet debt service and dividend requirements, and finance future investments. Annual cash flows from operating activities exceed annual distributions to common shareholders, preferred shareholders and minority members by approximately $16,000,000, $37,000,000 and $30,000,000 for the years ended December 31, 2009, 2008 and 2007, respectively. Due to the timing associated with operating cash flows, there may be certain periods where cash flows generated by operating activities are less than distributions. We believe our unsecured credit facility provides adequate liquidity to address temporary cash shortfalls.
On April 7, 2009, we closed a $620,000,000 secured credit facility with Deutsche Bank Berkshire Mortgage, Inc. The facility consists of two $310,000,000 tranches. The first tranche has a fixed rate term of 10 years and has a maturity date of May 1, 2019. The second tranche has a maturity date of September 1, 2020, with a fixed rate
34
term for the first 10 years and a variable rate for the remaining one-year period. Together, the effective composite annual cost of debt is 5.6% inclusive of rate hedging transactions. Fifteen multifamily properties totaling 4,651 units with a net carrying value of $607,500,000 secured the credit facility at the time of closing. Proceeds from this facility were used to refinance near term debt maturities, debt tenders and debt repurchases noted below.
On May 14, 2009, we entered into an equity distribution agreement under which we may offer and sell shares of our common stock having an aggregate offering price of up to $125,000,000 over time through our sales agent. During 2009, 3,801,185 shares were issued for approximately $104,600,000 with an average share price of $27.52. As of February 12, 2010 we have approximately $20,400,000 available to be issued under the distribution plan.
Tender Offers and Repurchase Activity
On April 15, 2009, we closed a fixed price cash tender offer for any and all of our outstanding 5.750% senior notes due 2009 and any and all of our outstanding 4.875% senior notes due 2010. As a result, $61,407,000 and $119,421,000 in aggregate principal amount of the 5.750% senior notes due 2009 and 4.875% senior notes due 2010, respectively, were validly tendered and we accepted, purchased and subsequently cancelled the notes. After giving effect to the purchase of the tendered notes, an aggregate principal amount of $30,579,000 of the 4.875% senior notes due in 2010, respectively, remain outstanding. The remaining principal balance of the 5.750% senior notes due in 2009 was paid in full during September 2009, as the note came due.
On April 1, 2009, we closed a fixed price cash tender offer for any and all of our outstanding 7.450% senior notes due 2011 and any and all of our outstanding 7.125% senior notes due 2013. As a result, $201,455,000 and $89,982,000 in aggregate principal amount of the 7.450% senior notes due 2011 and 7.125% senior notes due 2013, respectively, were validly tendered and we accepted, purchased and subsequently cancelled the notes. After giving effect to the purchase of the tendered notes, an aggregate principal amount of $48,545,000 and $40,018,000 of the 7.450% senior notes due 2011 and 7.125% senior notes due 2013, respectively, remain outstanding.
During 2009, we repurchased $78,266,000 of our 4.125% convertible senior unsecured notes for an aggregate price of 92.99% of par, or approximately $72,776,000.
Net gain on extinguishment of debt totaled $1,470,000 for the year ended December 31, 2009. The primary drivers of the gain are as follows:
2009 Debt Tender/Repurchase Summary
| Security |
Cash Principal Outstanding |
Bonds Retired |
Cash Paid |
Principal Amount Remaining |
% of Par | Extinguishment Gain |
Write off of Unamortized Discounts / Fees / Equity |
Net Gain (Loss) |
||||||||||||||||||
| (Amounts in thousands) | ||||||||||||||||||||||||||
| 2011 7.45% Senior Notes |
$ | 250,000 | $ | 201,455 | $ | 201,455 | $ | 48,545 | 100.00 | % | $ | — | $ | (1,023 | ) | $ | (1,023 | ) | ||||||||
| 2013 7.125% Senior Notes |
130,000 | 89,982 | 88,182 | 40,018 | 98.00 | % | 1,800 | (1,127 | ) | 673 | ||||||||||||||||
| 2009 5.75% Senior Notes |
150,000 | 61,407 | 61,407 | 88,593 | 100.00 | % | — | (294 | ) | (294 | ) | |||||||||||||||
| 2010 4.875% Senior Notes |
150,000 | 119,421 | 119,421 | 30,579 | 100.00 | % | — | (756 | ) | (756 | ) | |||||||||||||||
| Debt tender total |
$ | 680,000 | $ | 472,265 | $ | 470,465 | $ | 207,735 | 99.62 | % | $ | 1,800 | $ | (3,200 | ) | $ | (1,400 | ) | ||||||||
| 4.125% Convertible Senior Notes |
449,600 | 78,266 | 72,776 | 371,334 | 92.99 | % | 5,490 | (2,620 | ) | 2,870 | ||||||||||||||||
| Total Tender/Repurchase |
$ | 1,129,600 | $ | 550,531 | $ | 543,241 | $ | 579,069 | 98.68 | % | $ | 7,290 | $ | (5,820 | ) | $ | 1,470 | |||||||||
On December 24, 2008, we repurchased $10,400,000 of our $460,000,000 convertible senior unsecured notes with a fixed coupon rate of 4.125% for an aggregate price of 74.88%, or approximately $8,000,000, resulting in a $2,364,000 net gain on extinguishment of debt.
35
Preferred Stock
On September 14, 2007, we redeemed all 3,000,000 shares of 8.08% Series B Cumulative Redeemable Preferred Stock at a redemption price of $25.42644 per share. The redemption price was equal to the original issuance price of $25.00 per share, plus accrued and unpaid dividends to the redemption date. The initial issuance costs totaling $2,768,000 associated with the Series B Cumulative Preferred Stock was included in net income available to common shareholders during the third quarter of 2007.
Fixed Rate Unsecured Notes
On March 13, 2007, we completed an offering of $300,000,000 10-year senior unsecured notes. The notes will mature on March 15, 2017 and bear interest at a fixed coupon rate of 5.50%. Net proceeds from the offering, after all discounts, commissions, and issuance costs totaled approximately $297,000,000.
Proceeds from these offerings have been used for general corporate purposes, including the repayment of debt, redemption of equity securities, funding for development activities and financing for acquisitions. Pending these uses, we initially used the proceeds from these offerings to reduce borrowings under our revolving unsecured credit facility.
Unsecured Line of Credit
The Company maintains its revolving credit facility with a capacity of $750,000,000. Based on the Company’s current debt ratings, the line of credit accrues interest at LIBOR plus 47.5 basis points. In addition, the Company pays a 0.15% annual facility fee on the capacity of the facility. Borrowings under our revolving unsecured line of credit totaled $288,000,000 at December 31, 2009, compared to $245,000,000 at December 31, 2008. Borrowings under the credit facility are used to fund acquisition and development activities as well as for general corporate purposes. Balances on the revolving unsecured line of credit are typically reduced with available cash balances. The facility matures on September 18, 2012.
We had a total of $826,918,000 principal amount in unsecured senior notes outstanding at December 31, 2009, consisting of the following:
| Maturity |
Unsecured Senior Note Balance |
Interest Rate |
||||
| May 2010 |
$ | 30,579,000 | 4.875 | % | ||
| January 2011 |
48,545,000 | 7.450 | % | |||
| February 2012(1) |
357,776,000 | 6.005 | % | |||
| February 2013 |
40,018,000 | 7.125 | % | |||
| March 2014 |
50,000,000 | 4.700 | % | |||
| March 2017 |
300,000,000 | 5.500 | % | |||
| Total/Weighted Average Interest Rate |
$ | 826,918,000 | 5.840 | % | ||
| (1) | The notes are putable by holders on February 21, 2012, August 15, 2013, August 15, 2016, and August 15, 2021. This principal amount is the $371,300,000 of our 4.125% convertible unsecured debt with a final contractual maturity of August 15, 2026. The notes are callable by us on or after February 21, 2012. The interest rate and note balance have been adjusted in accordance with the FASB guidance on convertible debt instruments. |
In addition, at December 31, 2009, we had mortgage loans and a secured credit facility with a total principal amount outstanding of $752,157,000, at an effective interest rate of 5.70%, and remaining terms ranging from one year to eleven years.
36
As of December 31, 2009, we had total outstanding debt balances of $1,867,075,000 and total outstanding shareholders’ equity and redeemable noncontrolling interests of $1,056,524,000, representing a debt to total book capitalization ratio of approximately 64%.
We may from time to time seek to retire or purchase our outstanding debt through cash purchases and/or exchanges for equity securities, in open market purchases or privately negotiated transactions. Such repurchases or exchanges, if any, will depend on prevailing market conditions, our liquidity requirements, contractual restrictions and other factors. The amounts involved may be material.
Our indebtedness contains financial covenants as to minimum net worth, interest coverage ratios, maximum secured debt and total debt to capital, among others. We were in compliance with all such financial covenants throughout the year ended December 31, 2009.
We anticipate that we will continue to require outside sources of financing to meet all our long-term liquidity needs beyond 2009, including scheduled debt repayments, construction funding and property acquisitions. At December 31, 2009, we had an estimated cost of $16,400,000 to complete existing construction in progress, with funding estimated to be incurred in 2010.
Scheduled contractual obligations required for the next five years and thereafter are as follows:
| Contractual Obligations |
Total | Less than 1 year |
1-3 years | 3-5 years | More than 5 years | ||||||||||
| (amounts in thousands) | |||||||||||||||
| Long-Term Debt Obligations |
$ | 1,867,075 | $ | 63,850 | $ | 763,094 | $ | 123,251 | $ | 916,880 | |||||
| Operating Lease Obligations |
5,705 | 1,257 | 1,884 | 1,612 | 952 | ||||||||||
| Total |
$ | 1,872,780 | $ | 65,107 | $ | 764,978 | $ | 124,863 | $ | 917,832 | |||||
We manage joint venture investments that are accounted for under the equity method of accounting with total assets of approximately $480,980,000 as of December 31, 2009. These joint ventures carry debt totaling approximately $17,697,000, none of which is guaranteed by us at December 31, 2009.
During the third quarter of 2007, we filed a new shelf registration statement with the Securities and Exchange Commission under which we may issue securities, including debt securities, common stock and preferred stock. Depending upon market conditions, we may issue securities under this or under future registration statements. Proceeds from issuances under our existing shelf registration statement may be used for general corporate purposes, including investing in additional multifamily communities, funding development activities, capital expenditures, redemption of securities, increasing our working capital and repaying indebtedness. Pending the application of the net proceeds, we may invest the proceeds in investment-grade, interest-bearing securities or temporarily reduce borrowings under our revolving unsecured line of credit.
On April 26, 2007, our Board of Directors authorized us to purchase an aggregate of up to $100,000,000 in shares of our common stock. As of February 12, 2010, we have not purchased any shares under this authorization.
We continue to consider other sources of possible funding, including further joint ventures and additional secured construction debt. We own unencumbered real estate assets that could be sold, contributed to joint ventures or used as collateral for financing purposes (subject to certain lender restrictions) and have encumbered assets with significant equity that could be further encumbered should other sources of capital not be available.
The Company has joint venture co-investments in various properties that are unconsolidated and accounted for under the equity method of accounting. Management does not believe these investments have a materially different impact upon the Company’s liquidity, cash flows, capital resources, credit or market risk than its
37
property management and ownership activities. These joint ventures are discussed in Note 4 of the Company’s Consolidated Financial Statements.
Critical Accounting Policies
We define critical accounting policies as those that require management’s most difficult, subjective or complex judgments. A summary of our critical accounting policies follows. Additional discussion of accounting policies that we consider significant, including further discussion of the critical accounting policies described below, can be found in the notes to our consolidated financial statements.
Investments in Rental Properties
Rental properties are recorded at cost, less accumulated depreciation, less an adjustment, if any, for impairment. A land value is assigned based on the purchase price if land is acquired separately, or based on market research if acquired in a merger or in an operating community acquisition. We have a development group which manages the design, development and construction of our apartment communities. Projects under development are carried at cost, including direct and indirect costs incurred to ready the assets for their intended use and which are specifically identifiable, including capitalized interest and property taxes until units are placed in service. Direct investment development projects are considered placed in service as certificates of occupancy are issued and the units become ready for occupancy. Depreciation begins as units are placed in service. Land acquired for development is capitalized and reported as “Land under development” until the development plan for the land is formalized. Once the development plan is finalized and construction contracts are signed, the costs are transferred to the balance sheet line item “Construction in progress.” Interest is capitalized on the construction in progress at a rate equal to our weighted average cost of debt. The capitalization of interest ends when the assets are readied for their intended use. Expenditures for ordinary maintenance and repairs are expensed to operations as incurred and significant renovations and improvements that increase the value of the property or extend its useful life are capitalized.
Depreciation is computed on a straight-line basis over the estimated useful lives of the assets, which generally range from 35 to 40 years for buildings and three to ten years for other property. The determination as to whether expenditures should be capitalized or expensed, and the period over which depreciation is recognized, requires management’s judgment.
In accordance FASB guidance on accounting for the impairment or disposal of long-lived assets, our investments in real estate are periodically evaluated for indicators of impairment. The evaluation of impairment and the determination of estimated fair value is based on several factors, and future events could occur which would cause management to conclude that indicators of impairment exist and a reduction in carrying value to estimated fair value is warranted. There were no assets for which an adjustment for impairment in value was made in 2009, 2008 or 2007.
In the normal course of business, we will receive offers for sale of our properties, either solicited or unsolicited. For those offers that are accepted, the prospective buyer will usually require a due diligence period before consummation of the transaction. It is not unusual for matters to arise that result in the withdrawal or rejection of the offer during this process. We classify real estate as “held for sale” when all criteria under the FASB guidance has been met.
The guidance also requires that the results of operations of any communities that have been sold, or otherwise qualify as held for sale, be presented as discontinued operations in our consolidated financial statements in all periods presented. The community specific real estate classified as held for sale is stated at the lower of its carrying amount or estimated fair value less disposal costs. Depreciation is not recorded on assets once classified as held for sale.
38
Stock-Based Compensation
FASB guidance requires all share-based payments to employees, including grants of employee stock options, to be recognized in the income statement based on their fair values.
Stock-based compensation cost is measured at the grant date based on the fair value of the award and is recognized as expense over the requisite service period, which is generally the vesting period. The cost related to stock-based compensation included in the determination of consolidated net income includes all awards outstanding that vested during these periods.
Under the 1992 Stock Option Plan and the 1999 BRE stock Incentive Plan, as amended, and the Fifth Amended and Restated Non-Employee Director Stock Option and Restricted Stock Plan, we award service and performance based restricted stock. We measure the value of the restricted stock at fair value on the grant date, based on the number of units granted and the market value of our common stock on that date. Guidance requires compensation expense to be recognized with respect to the restricted stock if it is probable that the service or performance condition will be achieved. As a result, we amortize the fair value, net of estimated forfeitures, as stock-based compensation expense on a straight-line basis over the vesting period. For service based restricted stock awards, we evaluate our forfeiture rate at the end of each reporting period based on the probability of the service condition being met. For performance based restricted stock awards, we evaluate our forfeiture rate at the end of each reporting period based on the specific performance targets for each award and the level of performance criteria expected to be achieved during the performance period.
Consolidation
Arrangements that are not controlled through voting or similar rights are reviewed under the guidance of variable interest entities “VIEs”. A Company is required to consolidate the assets, liabilities and operations of a VIE if it is determined to be the primary beneficiary of the VIE.
A VIE is created when (i) the equity investment at risk is not sufficient to permit the entity to finance its activities without additional subordinated financial support from other parties or (ii) the entity’s equity holders as a group lack one of the following three characteristics of a controlling financial interest: (a) the direct or indirect ability to make decisions about the entity through voting or similar rights, (b) the obligation to absorb expected losses of the entity if they occur or (c) the right to receive the expected residual returns of the entity if they occur. If an entity is deemed to be a VIE, the enterprise that is deemed to absorb a majority of the expected losses or receive a majority of expected residual returns of the VIE is considered the primary beneficiary and must consolidate the VIE.
The Company has concluded that under certain circumstances when the Company (i) enters into option agreements for the purchase of land or communities from an entity and pays a non-refundable deposit, or (ii) enters into arrangements for the formation of joint ventures, a VIE may be created under condition (ii) (b) or (c) of the previous paragraph. For each VIE created, the Company has computed expected losses and residual returns based on the probability of future cash flows. If the Company is determined to be the primary beneficiary of the VIE, the assets, liabilities and operations of the VIE are consolidated with the Company’s financial statements.
The Company consolidates entities not deemed as VIEs that it has the ability to control. The accompanying consolidated financial statements include the accounts of the Company and other controlled subsidiaries. All significant intercompany balances and transactions have been eliminated in consolidation.
Under applicable accounting guidance, the managing member of a limited liability company, or LLC, is presumed to control the LLC and must prove non-managing member(s) have certain rights that preclude the managing member from exercising unilateral control. The Company has reviewed its control as the General
39
Partner of the Company’s joint venture assets and concluded that it does not have control over any of the LLCs managed by the Company. The Company has applied the equity method of accounting to its investments in joint ventures.
Impact of Inflation
Approximately 99% of our total revenues for 2009 were derived from apartment properties. Due to the short-term nature of most apartment unit leases (typically one year or less), we may seek to adjust rents to mitigate the impact of inflation upon renewal of existing leases or commencement of new leases, although we cannot assure that we will be able to adjust rents in response to inflation. In addition, market rates may also fluctuate due to short-term leases and other permitted and non-permitted lease terminations.
Dividends Paid to Common and Preferred Shareholders and Distributions to Minority Members
A cash dividend has been paid to common shareholders each quarter since our inception in 1970. The payment of distributions by BRE is at the discretion of the Board of Directors and depends on numerous factors, including our cash flow, financial condition and capital requirements, REIT provisions of the Internal Revenue Code and other factors. On July 30, 2009, our Board of Directors approved a reduction in quarterly common dividends to $0.3750 from $0.5625 per share for the third quarter of 2009. The quarterly common dividend payment of $0.3750 is equivalent to $1.5000 per common share on an annualized basis. Cash dividends per common share were $1.875 in 2009, $2.25 in 2008, and $2.15 in 2007. Total cash dividends paid to common shareholders for the three years ended December 31, 2009, 2008 and 2007 were $100,681,000, $116,025,000, and $109,811,000, respectively. In 2009, 2008 and 2007 $11,813,000, $11,813,000, and $16,122,000, respectively, in dividends were paid to preferred shareholders.
Distributions to noncontrolling interests were $1,885,000 in 2009, $2,291,000 in 2008, and $2,279,000 in 2007.
| Item 7A. | QUANTITATIVE AND QUALITATIVE DISCLOSURES ABOUT MARKET RISK |
Market risks relating to our operations result primarily from changes in short-term LIBOR interest rates. We do not have any direct foreign exchange or other significant market risk.
Our exposure to market risk for changes in interest rates relates primarily to our line of credit. We primarily enter into fixed and variable rate debt obligations to support general corporate purposes, including acquisitions and development, capital expenditures and working capital needs. We continuously evaluate our level of variable rate debt with respect to total debt and other factors, including our assessment of the current and future economic environment.
We seek to limit the risk of interest rate exposure by following established risk management policies and procedures including the use of derivatives to hedge interest rate risk on debt instruments. We do not engage in hedging activities for speculative purposes.
We have a policy of only entering into derivative contracts with major financial institutions based primarily on their credit ratings. When viewed in conjunction with the underlying and offsetting exposure that the derivatives are designed to hedge, we have not sustained a material loss from those instruments nor do we it anticipate any material adverse effect on our net income or financial position in the future from the use of derivatives currently in place.
The fair values of our financial instruments (including such items in the financial statement captions as cash, other assets, accounts payable and accrued expenses, and lines of credit) approximate their carrying or contract values based on their nature, terms and interest rates that approximate current market rates. The fair value of
40
mortgage loans payable and unsecured senior notes is estimated using discounted cash flow analyses with an interest rate similar to that of current market borrowing arrangements. The estimated fair value of our mortgage loans and unsecured senior notes is approximately $1,853,000,000 at December 31, 2009, as compared with a carrying value of $1,592,633,000 at that date.
We had $288,000,000 and $245,000,000 in variable rate debt outstanding at December 31, 2009 and 2008, respectively. A hypothetical 10% adverse change in interest rates would have had an annualized unfavorable impact of approximately $445,000 and $1,100,000 on our earnings and cash flows based on these period-end debt levels and our average variable interest rates for the twelve months ended December 31, 2009 and 2008, respectively. We cannot predict the effect of adverse changes in interest rates on our variable rate debt and, therefore, our exposure to market risk, nor can we assure that fixed rate, long-term debt will be available to us at advantageous pricing. Consequently, future results may differ materially from the estimated adverse changes discussed above.
| Item 8. | FINANCIAL STATEMENTS AND SUPPLEMENTARY DATA |
See Part IV, Item 15. Our Consolidated Financial Statements and Schedules are incorporated herein by reference.
| Item 9. | CHANGES IN AND DISAGREEMENTS WITH ACCOUNTANTS ON ACCOUNTING AND FINANCIAL DISCLOSURE |
None.
| Item 9A. | CONTROLS AND PROCEDURES |
We maintain disclosure controls and procedures that are designed to ensure that information required to be disclosed in our Exchange Act reports is recorded, processed, summarized and reported within the time periods specified in the Securities and Exchange Commission’s rules and forms, and that such information is accumulated and communicated to our management, including our Chief Executive Officer and Chief Financial Officer, as appropriate, to allow timely decisions regarding required disclosure. In designing and evaluating the disclosure controls and procedures, management recognized that any controls and procedures, no matter how well designed and operated, can provide only reasonable assurance of achieving the desired control objectives, and management necessarily was required to apply its judgment in evaluating the cost-benefit relationship of possible controls and procedures. Also, we have investments in certain unconsolidated entities. As we do not control these entities, our disclosure controls and procedures with respect to such entities are necessarily substantially more limited than those we maintain with respect to our consolidated subsidiaries.
As of December 31, 2009, the end of the quarter and fiscal year covered by this report, management conducted an evaluation, under the supervision and with the participation of our Chief Executive Officer and our Chief Financial Officer, of the effectiveness of the design and operation of our disclosure controls and procedures. Based upon that evaluation, the Chief Executive Officer and Chief Financial Officer concluded that the Company’s disclosure controls and procedures are effective to ensure that information required to be disclosed by the Company on the reports it files or submits under the Exchange Act is recorded, processed, summarized and reported within the time periods specified in the Securities and Exchange Commission’s rules and forms. We continue to review and document our disclosure controls and procedures, including our internal control over financial reporting, and may from time to time make changes aimed at enhancing their effectiveness and to ensure that our systems evolve with our business.
41
Management’s Annual Report on Internal Control over Financial Reporting
Management is responsible for establishing and maintaining adequate internal control over financial reporting for the Company. Internal control over financial reporting refers to the process designed by, or under the supervision of, our Chief Executive Officer and Chief Financial Officer, and effected by our Board of Directors, management and other personnel, to provide reasonable assurance regarding the reliability of financial reporting and the preparation of financial statements for external purposes in accordance with generally accepted accounting principles, and includes those policies and procedures that:
| (1) | pertain to the maintenance of records that in reasonable detail accurately and fairly reflect the transactions and dispositions of the assets of our company; |
| (2) | provide reasonable assurance that transactions are recorded as necessary to permit preparation of financial statements in accordance with generally accepted accounting principles, and that receipts and expenditures of our company are being made only in accordance with authorizations of management and our board of directors; and |
| (3) | provide reasonable assurance regarding prevention or timely detection of unauthorized acquisition, use or disposition of company assets that could have a material effect on our financial statements. |
Internal control over financial reporting cannot provide absolute assurance of achieving financial reporting objectives because of its inherent limitations. Internal control over financial reporting is a process that involves human diligence and compliance and is subject to lapses in judgment and breakdowns resulting from human failures. Internal control over financial reporting also can be circumvented by collusion or improper management override. Because of such limitations, there is a risk that material misstatements may not be prevented or detected on a timely basis by internal control over financial reporting. However, these inherent limitations are known features of the financial reporting process. Therefore, it is possible to design into the process safeguards to reduce, though not eliminate, this risk.
Management has assessed the effectiveness of our internal control over financial reporting as of December 31, 2009, using the framework set forth in the report entitled (“Internal Control—Integrated Framework”) published by the Committee of Sponsoring Organizations (“COSO”) of the Treadway Commission. Based on our evaluation under the framework in Internal Control—Integrated Framework management concluded that our internal control over financial reporting was effective as of December 31, 2009.
Ernst & Young LLP, the registered accounting firm that audited the financial statements included in this annual report, has issued an attestation report on our internal control over financial reporting.
Changes in Internal Control over Financial Reporting
There was no change in our internal control over financial reporting that occurred during the fourth quarter of the period covered by this Annual Report on Form 10-K that has materially affected, or is reasonable likely to materially affect, our internal control over financial reporting.
42
REPORT OF INDEPENDENT REGISTERED PUBLIC ACCOUNTING FIRM
The Board of Directors and Shareholders of
BRE Properties, Inc.
We have audited BRE Properties, Inc.’s internal control over financial reporting as of December 31, 2009, based on criteria established in Internal Control—Integrated Framework issued by the Committee of Sponsoring Organizations of the Treadway Commission (the COSO criteria). BRE Properties, Inc.’s management is responsible for maintaining effective internal control over financial reporting, and for its assessment of the effectiveness of internal control over financial reporting included in the accompanying Management’s Annual Report on Internal Control over Financial Reporting. Our responsibility is to express an opinion on the company’s internal control over financial reporting based on our audit.
We conducted our audit in accordance with the standards of the Public Company Accounting Oversight Board (United States). Those standards require that we plan and perform the audit to obtain reasonable assurance about whether effective internal control over financial reporting was maintained in all material respects. Our audit included obtaining an understanding of internal control over financial reporting, assessing the risk that a material weakness exists, testing and evaluating the design and operating effectiveness of internal control based on the assessed risk, and performing such other procedures as we considered necessary in the circumstances. We believe that our audit provides a reasonable basis for our opinion.
A company’s internal control over financial reporting is a process designed to provide reasonable assurance regarding the reliability of financial reporting and the preparation of financial statements for external purposes in accordance with generally accepted accounting principles. A company’s internal control over financial reporting includes those policies and procedures that (1) pertain to the maintenance of records that, in reasonable detail, accurately and fairly reflect the transactions and dispositions of the assets of the company; (2) provide reasonable assurance that transactions are recorded as necessary to permit preparation of financial statements in accordance with generally accepted accounting principles, and that receipts and expenditures of the company are being made only in accordance with authorizations of management and directors of the company; and (3) provide reasonable assurance regarding prevention or timely detection of unauthorized acquisition, use or disposition of the company’s assets that could have a material effect on the financial statements.
Because of its inherent limitations, internal control over financial reporting may not prevent or detect misstatements. Also, projections of any evaluation of effectiveness to future periods are subject to the risk that controls may become inadequate because of changes in conditions, or that the degree of compliance with the policies or procedures may deteriorate.
In our opinion, BRE Properties, Inc. maintained, in all material respects, effective internal control over financial reporting as of December 31, 2009, based on the COSO criteria.
We also have audited, in accordance with the standards of the Public Company Accounting Oversight Board (United States), the consolidated balance sheets of BRE Properties, Inc. as of December 31, 2009 and 2008, and the related consolidated statements of income, shareholders’ equity and cash flows for each of the three years in the period ended December 31, 2009 of BRE Properties, Inc. and our report dated February 12, 2010 expressed an unqualified opinion thereon.
/s/ Ernst & Young LLP
San Francisco, CA
February 12, 2010
43
Item 9B. Other Information
Pursuant to Section 303A.12(a) of the New York Stock Exchange’s Corporate Governance Standards, the Chief Executive Officer has certified to the NYSE that she is not aware of any violation by the Company of NYSE corporate governance listing standards. This certification was submitted to the NYSE and was not qualified in any respect. Additionally, certifications by our Chief Executive Officer and Chief Financial Officer required under Sections 302 and 906 of the Sarbanes-Oxley Act of 2002 are filed and furnished, respectively, with the Securities and Exchange Commission as exhibits to this report.
44
PART III
| Item 10. | DIRECTORS AND EXECUTIVE OFFICERS OF THE REGISTRANT |
| (a) | Identification of Directors. The information required by this Item is incorporated herein by reference to our Proxy Statement relating to our 2010 Annual Meeting of Shareholders, under the headings “Election of Directors” and “Section 16(a) Beneficial Ownership Reporting Compliance,” to be filed with the Securities and Exchange Commission within 120 days of December 31, 2009. A summary of the directors and their principal business for the last five years follows: |
| Paula F. Downey |
Ms. Downey has been our Director since March 2008. Ms. Downey is president of AAA Northern California, Nevada and Utah (CSAA), a position she has held since 2005. She was Chief Operations Officer from 2003 through 2005 and Senior Vice President and Chief Financial Officer from 2000 to 2003. Ms. Downey serves as an officer of California State Automobile Association, California State Automobile Association Inter-Insurance Bureau, and as a director of their subsidiaries including Pacific Lighthouse Reinsurance Ltd., Western United Insurance Company, CSAA Life and Financial Services, Inc., ACA Insurance Company, ACA Member Services Company, and Ceres Reinsurance, Inc. Ms. Downey is 54 years old. | |
| Edward F. Lange, Jr. |
Mr. Lange has been our Director since July 2008. Mr. Lange has served as Chief Operating Officer since January 2007. Mr. Lange served as Chief Financial Officer from July 2000 through April 2008 and from November 2008 through October 2009. Prior to joining BRE, Mr. Lange served as Executive Vice President and Chief Financial Officer at Health Care REIT, Inc., an Ohio-based senior housing real estate investment trust, from 1996 to June 2000. Prior to joining Health Care REIT, Inc. Mr. Lange was a Senior Vice President of Finance and a member of the executive management team of the Mediplex Group, Inc. and affiliated companies from 1992 to 1996. Mr. Lange holds a Master of Business Administration Degree from the University of Connecticut and a Bachelor’s Degree in Urban Planning from the University of Massachusetts. Mr. Lange is 50 years old. | |
| Irving F. Lyons, III |
Mr. Lyons has been our Director since 2006. Mr. Lyons currently serves on the Board of Directors of Equinix, Inc. and Prologis. He served as Vice Chairman of ProLogis, a global provider of distribution facilities and services, from 2001 through May 2006. He was Chief Investment Officer from March 1997 to December 2004, and held several other executive positions since joining ProLogis in 1993. Prior to joining ProLogis, he was a Managing Partner of King & Lyons, a San Francisco Bay Area industrial real estate development and management company, since its inception in 1979. Mr. Lyons is 60 years old. | |
| Edward E. Mace |
Mr. Mace has been our Director since 1998. Mr. Mace has served as Chairman of Mace Pacific Holding Company, LLC, A Private Investment Company, since 2006. From 2001 to 2006, he served as President, Vail Resorts Lodging Company and Rock Resorts International LLC (both subsidiaries of Vail Resorts, Inc., an owner, manager and developer of ski resorts and related lodging.) Mr. Mace served as President and Chief Executive Officer of Fairmont Hotels & Resorts-U.S./Mexico division from 2000 to 2001 and was President & Chief Executive Officer, Fairmont Hotels from 1996 to 2000. Mr. Mace is 58 years old. | |
45
| Christopher J. McGurk |
Mr. McGurk has been our Director since 2006. Currently, Mr. McGurk serves as CEO of Overture Films, a motion picture studio. Prior to his post at Overture Films, Mr. McGurk served as Vice Chairman and COO of Metro-Goldwyn-Mayer, Inc. (MGM), a motion picture, television, home video, and theatrical production and distribution company, from 1999 to 2005. From 1996 to 1999, Mr. McGurk served in executive capacities with Universal Pictures, a division of Universal Studios Inc., most recently as President and COO. Mr. McGurk is 53 years old. | |
| Matthew T. Medeiros |
Mr. Medeiros has been our Director since 2005. Mr. Medeiros has served as President, Chief Executive Officer and Director of SonicWALL, a global Internet security company, since March 2003. From 1998 to December 2002, he served as Chief Executive Officer of Philips Components, a division of Royal Philips Electronics, a consumer electronics company. Mr. Medeiros served as Chairman of the Board, LG.Philips LCD, a liquid crystal display joint venture, from 2001 to 2002. Mr. Medeiros is 53 years old. | |
| Constance B. Moore |
Ms. Moore has been our Director since 2002. Ms. Moore has served as President and Chief Executive Officer of the Company since January 1, 2005, and was President and Chief Operating Officer in 2004. Ms. Moore was Executive Vice President and Chief Operating Officer of BRE from July 2002 through December 2003. She held several executive positions with Security Capital Group & Affiliates, an international real estate operating and investment management company, from 1993 to 2002, including Co-Chairman and Chief Operating Officer of Archstone-Smith Trust. Ms. Moore is 54 years old. | |
| Jeanne R. Myerson |
Ms. Myerson has been our Director since 2002. Ms. Myerson has served as President and Chief Executive Officer of The Swig Company, a private real estate investment firm, since 1997. She served as President and Chief Executive Officer of The Bailard, Biehl & Kaiser REIT from 1993 to 1997. Ms. Myerson is 56 years old. | |
| Jeffrey T. Pero |
Mr. Pero was appointed as Director of BRE on December 1, 2009. He is a retired partner of Latham & Watkins LLP, an international law firm, and has been engaged in the practice of law since 1971. As partner, his focus was public and private debt and equity financings, mergers and acquisitions, corporate governance, and compliance with U.S. securities laws. Prior to his retirement, Mr. Pero served as primary outside counsel to several publicly traded companies, including BRE. Mr. Pero currently serves on the Board of Directors of Redwood Trust, Inc. Mr. Pero is 63 years old. | |
| Thomas E. Robinson |
Mr. Robinson has been our Director since 2007. Currently, Mr. Robinson is senior advisor to the real estate investment banking group at Stifel, Nicolaus & Company, Inc., St. Louis, MO and its prior affiliate Legg Mason, where he was previously a managing director. Prior to that position he served as the president and chief financial officer of Storage USA, Inc., from 1994-1997. Mr. Robinson currently serves on the Tanger Factory Outlet Centers, Inc. board of directors, is a former trustee/director of Centerpoint Properties Trust and Legg Mason Real Estate Investors, Inc., and a past member of the board of governors of the National Association of Real Estate Investment Trusts (NAREIT). Mr. Robinson is 62 years old. | |
46
| Dennis E. Singleton |
Mr. Singleton was appointed as a Director of BRE on March 1, 2009. Mr. Singleton currently serves on the Board of Directors of Digital Realty Trust, Inc; as vice chairman of the board of trustees of Lehigh University; and is a board member and past president of the Glaucoma Research Foundation. Mr. Singleton was a founding partner of Spieker Properties, Inc., a Northern California-based commercial real estate investment trust (REIT), which was acquired by Equity Office Properties, Inc. in 2003. Mr. Singleton served as Chief Financial Officer and Director of Spieker Properties, Inc. from 1993 to 1995, Chief Investment Officer and Director from 1995 to 1997, and Vice Chairman and Director from 1998 to 2001. Mr. Singleton is 64 years old. | |
| Thomas P. Sullivan |
Mr. Sullivan was appointed as Director of BRE on December 1, 2009. He is a founding partner of Wilson Meany Sullivan (WMS), a San Francisco-based, privately owned real estate investment and development firm focused on urban infill locations in the Western United States. At WMS, Mr. Sullivan’s focus is company management, identification of investment opportunities, major transactions, and debt and equity financing. Mr. Sullivan played a major role in the development of large-scale, technologically innovative projects in San Francisco, most notably Foundry Square, the Ferry Building and 250 Embarcadero (headquarters of Gap Inc.). Prior to WMS, Mr. Sullivan served as president of Wilson/Equity Office, a joint venture with Equity Office Properties Trust; and as senior vice president at William Wilson & Associates. Both companies were predecessors of WMS, which was formed by development partners of each entity in 2003. Mr. Sullivan is 52 years old. | |
| (b) | Identification of Executive Officers. See “Executive Officers of the Registrant” in Part I of this report. |
| Item 11. | EXECUTIVE COMPENSATION |
The information required by this Item is incorporated herein by reference from our Proxy Statement, relating to our 2009 Annual Meeting of Shareholders, under the headings “Executive Compensation and Other Information” and “Election of Directors—Governance, Board and Committee Meetings; Compensation of Directors,” to be filed with the Securities and Exchange Commission within 120 days of December 31, 2009.
| Item 12. | SECURITY OWNERSHIP OF CERTAIN BENEFICIAL HOLDERS AND MANAGEMENT |
The information required by this Item is incorporated herein by reference from our Proxy Statement, relating to our 2010 Annual Meeting of Shareholders, under the heading “Security Ownership of Certain Beneficial Owners and Management,” to be filed with the Securities and Exchange Commission within 120 days of December 31, 2009.
| Item 13. | CERTAIN RELATIONSHIPS AND RELATED TRANSACTIONS |
The information required by this Item is incorporated herein by reference from our Proxy Statement, relating to our 2010 Annual Meeting of Shareholders, under the headings “Certain Relationships and Related Transactions,” to be filed with the Securities and Exchange Commission within 120 days of December 31, 2009.
| Item 14. | PRINCIPAL ACCOUNTANT FEES AND SERVICES |
The information required by this Item is incorporated by reference from our Proxy Statement, relating to our 2010 Annual Meeting of Shareholders, under the headings “Report of the Audit Committee” and “Fees of Ernst & Young LLP,” to be filed with the Securities and Exchange Commission within 120 days of December 31, 2009.
47
PART IV
| Item 15. | EXHIBITS, FINANCIAL STATEMENT SCHEDULES AND REPORTS ON FORM 8-K |
(a) Financial Statements
| 1. Financial | Statements: |
| Report of Independent Registered Public Accounting Firm |
| Consolidated Balance Sheets at December 31, 2009 and 2008 |
| Consolidated Statements of Income for the years ended December 31, 2009, 2008, and 2007 |
| Consolidated Statements of Cash Flows for the years ended December 31, 2009, 2008, and 2007 |
| Consolidated Statements of Shareholders’ Equity for the years ended December 31, 2009, 2008, and 2007 |
| Notes to Consolidated Financial Statements |
| 2. Financial | Statement Schedule: |
| Schedule III—Real Estate and Accumulated Depreciation |
| All other schedules for which provision is made in the applicable accounting regulations of the Securities and Exchange Commission are not required under the related instructions or are inapplicable, and, therefore, have been omitted. |
| 3. See | Index to Exhibits immediately following the Consolidated Financial Statements. Each of the exhibits listed is incorporated herein by reference. |
(b) Exhibits
See Index to Exhibits.
(c) Financial Statement Schedules
See Index to Financial Statements and Financial Statement Schedule.
48
SIGNATURES
Pursuant to the requirements of Section 13 or 15(d) of the Securities Exchange Act of 1934, the Registrant has duly caused this report to be signed on its behalf by the undersigned, thereunto duly authorized.
Dated February 12, 2010
| BRE PROPERTIES, INC. | ||
| By: | /S/ CONSTANCE B. MOORE | |
| Constance B. Moore President and Chief Executive Officer | ||
Pursuant to the requirements of the Securities and Exchange Act of 1934, this report has been signed below by the following persons on behalf of the registrant and in the capacities and on the dates indicated:
| Name |
Title |
Date | ||
| /S/ CONSTANCE B. MOORE Constance B. Moore |
President, Chief Executive Officer and Director (Principal Executive Officer) |
February 12, 2010 | ||
| /S/ JOHN A. SCHISSEL John A. Schissel |
Executive Vice President, Chief Financial Officer (Principal Financial and Accounting Officer) |
February 12, 2010 | ||
| /S/ EDWARD F. LANGE, JR. Edward F. Lange, Jr. |
Executive Vice President, Chief Operating Officer, and Director |
February 12, 2010 | ||
| /S/ PAULA F. DOWNEY Paula Downey |
Director |
February 12, 2010 | ||
| /S/ IRVING F. LYONS, III Irving F. Lyons, III |
Director |
February 12, 2010 | ||
| /S/ EDWARD E. MACE Edward E. Mace |
Director |
February 12, 2010 | ||
| /S/ CHRISTOPHER J. MCGURK Christopher J. McGurk |
Director |
February 12, 2010 | ||
| /S/ MATTHEW T. MEDEIROS Matthew T. Medeiros |
Director |
February 12, 2010 | ||
| /S/ JEANNE R. MYERSON Jeanne R. Myerson |
Director |
February 12, 2010 | ||
| /S/ JEFFREY T. PERO Jeffrey T. Pero |
Director |
February 12, 2010 | ||
49
| Name |
Title |
Date | ||
| /S/ THOMAS E. ROBINSON Thomas E. Robinson |
Director |
February 12, 2010 | ||
| /S/ DENNIS E. SINGLETON Dennis E. Singleton |
Director |
February 12, 2010 | ||
| /S/ THOMAS P. SULLIVAN Thomas P. Sullivan |
Director |
February 12, 2010 | ||
50
REPORT OF INDEPENDENT REGISTERED PUBLIC ACCOUNTING FIRM
The Board of Directors and Shareholders of
BRE Properties, Inc.
We have audited the accompanying consolidated balance sheets of BRE Properties, Inc. as of December 31, 2009 and 2008, and the related consolidated statements of income, shareholders' equity, and cash flows for each of the three years in the period ended December 31, 2009. Our audits also included the financial statement schedule listed in the Index at Item 15(a). These financial statements and schedule are the responsibility of the Company's management. Our responsibility is to express an opinion on these financial statements and schedule based on our audits.
We conducted our audits in accordance with the standards of the Public Company Accounting Oversight Board (United States). Those standards require that we plan and perform the audit to obtain reasonable assurance about whether the financial statements are free of material misstatement. An audit includes examining, on a test basis, evidence supporting the amounts and disclosures in the financial statements. An audit also includes assessing the accounting principles used and significant estimates made by management, as well as evaluating the overall financial statement presentation. We believe that our audits provide a reasonable basis for our opinion.
In our opinion, the financial statements referred to above present fairly, in all material respects, the consolidated financial position of BRE Properties, Inc. at December 31, 2009 and 2008, and the consolidated results of its operations and its cash flows for each of the three years in the period ended December 31, 2009, in conformity with U.S. generally accepted accounting principles. Also, in our opinion, the related financial statement schedule, when considered in relation to the basic financial statements taken as a whole, presents fairly, in all material respects the information set forth therein.
As discussed in Note 2 to the consolidated financial statements, the Company changed its method of accounting for convertible debt instruments, noncontrolling interests, and earnings per share with the adoption of the guidance originally issued in FASB Staff Position APB 14-1, Accounting for Convertible Debt Instruments That May Be Settled in Cash upon Conversion (Including Partial Cash Settlement) (codified primarily in FASB ASC Topic 470, Debt), FASB Statement No. 160, Noncontrolling Interests in Consolidated Financial Statements, an amendment of ARB No. 51 (codified primarily in FASB ASC Topic 810, Consolidation), and EITF 03-6-1, Determining Whether Instruments Granted in Share-Based Payment Transactions Are Participating Securities, (codified primarily in FASB ASC Topic 260, Earnings per Share), respectively, effective January 1, 2009 and applied retroactively.
We also have audited, in accordance with the standards of the Public Company Accounting Oversight Board (United States), BRE Properties, Inc.’s internal control over financial reporting as of December 31, 2009, based on criteria established in Internal Control-Integrated Framework issued by the Committee of Sponsoring Organizations of the Treadway Commission and our report dated February 12, 2010 expressed an unqualified opinion thereon.
/s/ Ernst & Young LLP
San Francisco, California
February 12, 2010
51
BRE PROPERTIES, INC.
CONSOLIDATED BALANCE SHEETS
(Dollar amounts in thousands, except per share data)
| December 31, | ||||||||
| 2009 | 2008(1) | |||||||
| A S S E T S | ||||||||
| Real estate portfolio |
||||||||
| Direct investments in real estate: |
||||||||
| Investments in rental properties |
$ | 3,180,633 | $ | 2,927,481 | ||||
| Construction in progress |
101,354 | 295,074 | ||||||
| Less: Accumulated depreciation |
(583,953 | ) | (514,388 | ) | ||||
| 2,698,034 | 2,708,167 | |||||||
| Equity interests in and advances to real estate joint ventures: |
||||||||
| Investments in rental properties |
61,999 | 62,497 | ||||||
| Real estate held for sale, net |
— | 17,022 | ||||||
| Land under development |
155,532 | 123,609 | ||||||
| Total real estate portfolio |
2,915,565 | 2,911,295 | ||||||
| Cash |
5,656 | 7,724 | ||||||
| Other assets |
58,787 | 73,725 | ||||||
| Total assets |
$ | 2,980,008 | $ | 2,992,744 | ||||
| L I A B I L I T I E S A N D S H A R E H O L D E R S’ E Q U I T Y | ||||||||
| Unsecured senior notes |
$ | 826,918 | $ | 1,505,905 | ||||
| Unsecured line of credit |
288,000 | 245,000 | ||||||
| Mortgage loans payable |
752,157 | 151,496 | ||||||
| Accounts payable and accrued expenses |
56,409 | 91,167 | ||||||
| Total liabilities |
1,923,484 | 1,993,568 | ||||||
| Redeemable noncontrolling interests |
33,605 | 29,972 | ||||||
| Shareholders’ equity: |
||||||||
| Preferred stock, $0.01 par value; 20,000,000 shares authorized at both December 31 2009 and 2008; 7,000,000 shares with $25 liquidation preference; issued and outstanding at December 31, 2009 and December 31, 2008. |
70 | 70 | ||||||
| Common stock, $0.01 par value; 100,000,000 shares authorized at both December 31, 2009 and 2008; 55,136,359 and 51,149,745 shares issued and outstanding at December 31, 2009 and December 31, 2008, respectively. |
551 | 511 | ||||||
| Additional paid-in capital |
1,135,505 | 1,031,791 | ||||||
| Accumulated net income less than cumulative dividends |
(113,207 | ) | (63,168 | ) | ||||
| Total shareholders’ equity |
1,022,919 | 969,204 | ||||||
| Total liabilities and shareholders’ equity |
$ | 2,980,008 | $ | 2,992,744 | ||||
| (1) | Restated to reflect the adoption of new accounting guidance requiring retroactive application (Note 2 to our audited financial statements). |
See Accompanying Notes to Consolidated Financial Statements
52
BRE PROPERTIES, INC.
CONSOLIDATED STATEMENTS OF INCOME
(Amounts in thousands, except per share data)
| Years ended December 31, | |||||||||
| 2009 | 2008(1) | 2007(1) | |||||||
| Revenue |
|||||||||
| Rental income |
$ | 331,709 | $ | 331,704 | $ | 308,571 | |||
| Ancillary income |
12,895 | 13,581 | 13,200 | ||||||
| Total rental revenue |
344,604 | 345,285 | 321,771 | ||||||
| Expenses |
|||||||||
| Real estate |
109,486 | 102,405 | 95,367 | ||||||
| Provision for depreciation |
88,260 | 79,107 | 74,184 | ||||||
| Interest |
82,734 | 92,032 | 87,593 | ||||||
| General and administrative |
17,390 | 20,578 | 18,241 | ||||||
| Other expenses |
13,522 | 5,719 | — | ||||||
| Total expenses |
311,392 | 299,841 | 275,385 | ||||||
| Other income |
3,459 | 7,885 | 5,787 | ||||||
| Net gain on extinguishment of debt |
1,470 | 2,364 | — | ||||||
| Income before noncontrolling interests, partnership income and discontinued operations |
38,141 | 55,693 | 52,173 | ||||||
| Income from unconsolidated entities |
2,329 | 2,560 | 2,133 | ||||||
| Income from continuing operations |
40,470 | 58,253 | 54,306 | ||||||
| Net gain on sales of discontinued operations |
21,574 | 65,984 | 55,957 | ||||||
| Discontinued operations, net |
2,296 | 12,627 | 14,513 | ||||||
| Income from discontinued operations |
23,870 | 78,611 | 70,470 | ||||||
| Net Income |
$ | 64,340 | $ | 136,864 | $ | 124,776 | |||
| Redeemable noncontrolling interest in income |
1,885 | 2,291 | 2,279 | ||||||
| Net Income attributable to controlling interests |
62,455 | 134,573 | 122,497 | ||||||
| Redemption related preferred stock issuance cost |
— | — | 2,768 | ||||||
| Dividends attributable to preferred stock |
11,813 | 11,813 | 16,122 | ||||||
| Net income available to common shareholders |
$ | 50,642 | $ | 122,760 | $ | 103,607 | |||
| Per common share data—Basic |
|||||||||
| Income from continuing operations (net of preferred dividends and redeemable noncontrolling interest in income) |
$ | 0.50 | $ | 0.84 | $ | 0.64 | |||
| Income from discontinued operations |
$ | 0.45 | $ | 1.54 | $ | 1.39 | |||
| Net income available to common shareholders |
$ | 0.95 | $ | 2.38 | $ | 2.03 | |||
| Weighted average common shares outstanding—basic |
52,760 | 51,050 | 50,735 | ||||||
| Per common share data—Diluted |
|||||||||
| Income from continuing operations (net of preferred dividends and redeemable noncontrolling interest in income) |
$ | 0.50 | $ | 0.83 | $ | 0.63 | |||
| Income from discontinued operations |
$ | 0.45 | $ | 1.53 | $ | 1.37 | |||
| Net income available to common shareholders |
$ | 0.95 | $ | 2.36 | $ | 2.00 | |||
| Weighted average common shares outstanding—diluted |
52,761 | 51,440 | 51,525 | ||||||
| (1) | Restated to reflect the adoption of new accounting guidance requiring retroactive application (Note 2 to our audited financial statements). |
See Accompanying Notes to Consolidated Financial Statements
53
BRE PROPERTIES, INC.
CONSOLIDATED STATEMENTS OF CASH FLOWS
(Amounts in thousands)
| Years ended December 31, | ||||||||||||
| 2009 | 2008(1) | 2007(1) | ||||||||||
| Cash flows from operating activities |
||||||||||||
| Net income attributable to controlling interests |
$ | 62,455 | $ | 134,573 | $ | 122,497 | ||||||
| Adjustments to reconcile net income to net cash flows generated by operating activities: |
||||||||||||
| Net gain on sales of discontinued operations |
(21,574 | ) | (65,984 | ) | (55,957 | ) | ||||||
| Net gain on sales of land |
(121 | ) | — | — | ||||||||
| Net gain on sales of investments |
— | — | (65 | ) | ||||||||
| Net gain on extinguishment of debt |
(1,470 | ) | (2,364 | ) | — | |||||||
| Noncash abandonment of development pursuits |
10,703 | 3,452 | — | |||||||||
| Noncash interest on convertible debt |
6,404 | 6,234 | 5,584 | |||||||||
| Income from unconsolidated entities |
(2,329 | ) | (2,560 | ) | (2,133 | ) | ||||||
| Distributions of earnings from unconsolidated entities |
2,857 | 2,628 | 2,643 | |||||||||
| Provision for depreciation |
88,260 | 79,107 | 74,184 | |||||||||
| Provision for depreciation from discontinued operations |
159 | 2,352 | 5,765 | |||||||||
| Noncash stock based compensation expense |
2,596 | 3,530 | 3,868 | |||||||||
| Redeemable noncontrolling interests in income |
1,885 | 2,291 | 2,279 | |||||||||
| Decrease (increase) in other assets |
1,594 | 469 | (2,805 | ) | ||||||||
| (Decrease) increase in accounts payable and accrued expenses |
(20,736 | ) | 3,282 | 2,036 | ||||||||
| Net cash flows generated by operating activities |
130,683 | 167,010 | 157,896 | |||||||||
| Cash flows from investing activities |
||||||||||||
| Additions to land under development and predevelopment costs |
(18,223 | ) | (16,432 | ) | (91,714 | ) | ||||||
| Additions to direct investment construction in progress |
(96,879 | ) | (148,916 | ) | (151,175 | ) | ||||||
| Acquisition of equity interest in real estate joint ventures |
— | — | (19,618 | ) | ||||||||
| Rehabilitation expenditures and other |
(7,097 | ) | (16,806 | ) | (29,140 | ) | ||||||
| Capital expenditures |
(20,240 | ) | (18,596 | ) | (17,503 | ) | ||||||
| Purchase of land |
(12,800 | ) | — | (3,964 | ) | |||||||
| Deposits on property under contract to be purchased |
(250 | ) | (11,493 | ) | (1,382 | ) | ||||||
| Deposits on land under contract to be sold |
— | 7,000 | — | |||||||||
| Improvements to real estate joint ventures |
(212 | ) | (336 | ) | (4,605 | ) | ||||||
| Proceeds from sale of land |
10,100 | — | — | |||||||||
| Additions to furniture fixture and equipment |
(605 | ) | (5,456 | ) | (642 | ) | ||||||
| Proceeds from sales of rental property, net of closing costs |
65,669 | 163,215 | 99,147 | |||||||||
| Proceeds from sales of investments, net of closing costs |
— | — | 4,205 | |||||||||
| Net cash flows used in investing activities |
(80,537 | ) | (47,820 | ) | (216,391 | ) | ||||||
| Cash flows from financing activities |
||||||||||||
| Principal payments on mortgage loans |
(19,339 | ) | (22,586 | ) | (64,828 | ) | ||||||
| Proceeds from new mortgage loans, net |
617,144 | — | — | |||||||||
| Proceeds from issuance of unsecured senior notes, net |
— | — | 297,099 | |||||||||
| Repayment of unsecured notes |
(683,639 | ) | (8,031 | ) | — | |||||||
| Lines of credit: |
||||||||||||
| Advances |
923,000 | 664,000 | 898,000 | |||||||||
| Repayments |
(880,000 | ) | (624,000 | ) | (883,000 | ) | ||||||
| Proceeds from exercises of stock options and other |
1,741 | 462 | 9,410 | |||||||||
| Proceeds from dividend reinvestment plan |
1,367 | 1,866 | 1,776 | |||||||||
| Redemption of preferred stock |
— | — | (75,000 | ) | ||||||||
| Proceeds from issuance of common stock, net |
101,891 | — | — | |||||||||
| Cash dividends paid to common shareholders |
(100,681 | ) | (116,025 | ) | (109,811 | ) | ||||||
| Cash dividends paid to preferred shareholders |
(11,813 | ) | (11,813 | ) | (16,122 | ) | ||||||
| Distributions to redeemable nontcontrolling interests convertible to common stock |
(1,461 | ) | (1,739 | ) | (1,736 | ) | ||||||
| Distributions to other redeemable noncontrolling interests |
(424 | ) | (552 | ) | (423 | ) | ||||||
| Net cash flows (used in) generated by financing activities |
(52,214 | ) | (118,418 | ) | 55,365 | |||||||
| (Decrease) increase in cash |
(2,068 | ) | 772 | (3,130 | ) | |||||||
| Balance at beginning of year |
7,724 | 6,952 | 10,082 | |||||||||
| Balance at end of year |
$ | 5,656 | $ | 7,724 | $ | 6,952 | ||||||
| (1) | Restated to reflect the adoption of new accounting guidance requiring retroactive application (Note 2 to our audited financial statements). |
See Accompanying Notes to Consolidated Financial Statement
54
BRE PROPERTIES, INC.
CONSOLIDATED STATEMENTS OF CASH FLOWS
(Amounts in thousands)
| Years ended December 31, | ||||||||||
| 2009 | 2008 | 2007 | ||||||||
| Supplemental disclosure of non cash investing and financing activities |
||||||||||
| Transfers of direct investments in real estate-construction in progress to investments in rental properties |
$ | 283,434 | $ | 177,246 | $ | 129,937 | ||||
| Transfer of land under development to direct investments in real estate—construction in progress |
$ | — | $ | 19,865 | $ | 31,082 | ||||
| Change in accrued development costs for construction in progress and land under development |
$ | 7,015 | $ | 2,922 | $ | 1,337 | ||||
| Change in redeemable interest units |
$ | — | $ | 1,712 | $ | 3,063 | ||||
| Transfer of investment in rental properties to held for sale |
$ | 43,038 | $ | 105,351 | $ | 77,119 | ||||
| Transfer of land under development to real estate held for sale |
$ | — | $ | — | $ | 17,186 | ||||
| Transfer from real estate held for sale to investment in unconsolidated entities |
$ | — | $ | — | $ | 3,074 | ||||
| Change in accrued improvements to direct investments in real estate cost |
$ | (80 | ) | $ | 1,304 | $ | 573 | |||
| Application of deposits against acquisition cost |
$ | — | $ | — | $ | 7,089 | ||||
| Change in redemption value of redeemable noncontrolling interests |
$ | (3,920 | ) | $ | 10,672 | $ | 25,027 | |||
| Change in redemption related preferred stock issuance cost |
$ | — | $ | — | $ | 2,768 | ||||
See Accompanying Notes to Consolidated Financial Statements
55
BRE PROPERTIES, INC.
CONSOLIDATED STATEMENTS OF SHAREHOLDERS’ EQUITY
(Dollar amounts in thousands, except share and per share data)
| Years ended December 31, | ||||||||||||
| 2009 | 2008(1) | 2007(1) | ||||||||||
| Common stock shares |
||||||||||||
| Balance at beginning of year |
51,149,745 | 50,968,459 | 50,484,614 | |||||||||
| Stock options exercised, net of shares tendered |
9,500 | 30,821 | 320,316 | |||||||||
| Conversion of operating company units to common shares |
— | 63,600 | 113,737 | |||||||||
| Vested restricted shares net of shares tendered |
120,561 | 40,578 | 18,964 | |||||||||
| Shares issued pursuant to dividend reinvestment plan |
55,368 | 46,287 | 32,859 | |||||||||
| Common stock issuance |
3,801,185 | — | — | |||||||||
| Other |
— | — | (2,031 | ) | ||||||||
| Balance at end of year |
55,136,359 | 51,149,745 | 50,968,459 | |||||||||
| Preferred stock shares |
||||||||||||
| Balance at beginning of year |
7,000,000 | 7,000,000 | 10,000,000 | |||||||||
| Redemption of 8.08% Series B Cumulative Redeemable |
— | — | (3,000,000 | ) | ||||||||
| Balance at end of year |
7,000,000 | 7,000,000 | 7,000,000 | |||||||||
| Common stock |
||||||||||||
| Balance at beginning of year |
$ | 511 | $ | 510 | $ | 505 | ||||||
| Stock options exercised |
— | — | 3 | |||||||||
| Conversion of operating company units to common shares |
— | 1 | 1 | |||||||||
| Vested restricted shares |
1 | — | — | |||||||||
| Common stock issuance |
38 | — | — | |||||||||
| Shares issued pursuant to dividend reinvestment plan |
1 | — | 1 | |||||||||
| Balance at end of year |
$ | 551 | $ | 511 | $ | 510 | ||||||
| Preferred stock |
||||||||||||
| Balance at beginning of year |
$ | 70 | $ | 70 | $ | 100 | ||||||
| Redemption of 8.08% Series B Cumulative Redeemable |
— | — | (30 | ) | ||||||||
| Balance at end of year |
$ | 70 | $ | 70 | $ | 70 | ||||||
| Additional paid-in capital |
||||||||||||
| Balance at beginning of year |
$ | 1,031,791 | $ | 1,012,865 | $ | 1,041,478 | ||||||
| Stock based compensation |
3,782 | 5,182 | 13,924 | |||||||||
| Conversion of operating company units to common shares |
— | 1,712 | 3,062 | |||||||||
| Redemption of preferred stock |
— | — | (72,261 | ) | ||||||||
| Change in redemption value on redeemable noncontrolling interests |
(3,920 | ) | 10,672 | 25,027 | ||||||||
| Convertible debt repurchase |
(1,624 | ) | (506 | ) | — | |||||||
| Dividend reinvestment plan |
1,367 | 1,866 | 1,776 | |||||||||
| Common stock issuance |
101,853 | — | — | |||||||||
| Other |
2,256 | — | (141 | ) | ||||||||
| Balance at end of year |
$ | 1,135,505 | $ | 1,031,791 | $ | 1,012,865 | ||||||
See Accompanying Notes to Consolidated Financial Statements
56
BRE PROPERTIES, INC.
CONSOLIDATED STATEMENTS OF SHAREHOLDERS’ EQUITY
(Dollar amounts in thousands, except share and per share data)
| Years ended December 31, | ||||||||||||
| 2009 | 2008(1) | 2007(1) | ||||||||||
| Accumulated net income less than cumulative dividends |
||||||||||||
| Balance at beginning of year |
$ | (63,168 | ) | $ | (69,903 | ) | $ | (63,699 | ) | |||
| Net income for year |
64,340 | 136,864 | 124,776 | |||||||||
| Cash dividends declared to common shareholders: $1.875 per common share for the year ended December 31, 2009, $2.25 per common share for the year ended December 31, 2008 and $2.15 per common share for the year ended December 31, 2007 |
(100,681 | ) | (116,025 | ) | (109,811 | ) | ||||||
| Cash dividends declared to preferred shareholders (see Note 10) |
(11,813 | ) | (11,813 | ) | (16,122 | ) | ||||||
| Redemption related preferred stock issuance cost |
— | — | (2,768 | ) | ||||||||
| Redeemable noncontrolling interest in income |
(1,885 | ) | (2,291 | ) | (2,279 | ) | ||||||
| Balance at end of year |
$ | (113,207 | ) | $ | (63,168 | ) | $ | (69,903 | ) | |||
| Stock purchase loans to executives |
||||||||||||
| Balance at beginning of year |
$ | — | $ | — | $ | (632 | ) | |||||
| Loan maturities |
— | — | 632 | |||||||||
| Balance at end of year |
$ | — | $ | — | $ | — | ||||||
| Total shareholders’ equity |
$ | 1,022,919 | $ | 969,204 | $ | 943,542 | ||||||
| Redeemable noncontrolling interests |
||||||||||||
| Balance at beginning of year |
$ | 29,972 | $ | 42,357 | $ | 136,948 | ||||||
| Redeemable noncontrolling interest in income |
1,885 | 2,291 | 2,279 | |||||||||
| Distributions to redeemable noncontrolling interests |
(1,885 | ) | (2,291 | ) | (2,279 | ) | ||||||
| Consolidation of variable interest entity |
— | — | (66,500 | ) | ||||||||
| Conversion/ Redemption activity |
(287 | ) | (1,713 | ) | (3,064 | ) | ||||||
| Change in redemption value of redeemable noncontrolling interests |
3,920 | (10,672 | ) | (25,027 | ) | |||||||
| Balance at end of year |
$ | 33,605 | $ | 29,972 | $ | 42,357 | ||||||
| (1) | Restated to reflect the adoption of new accounting guidance requiring retroactive application (Note 2 to our audited financial statements). |
See Accompanying Notes to Consolidated Financial Statements
57
BRE PROPERTIES, INC.
NOTES TO CONSOLIDATED FINANCIAL STATEMENTS
1. Company
BRE Properties, Inc., a Maryland corporation (“BRE” or the “Company”), was formed in 1970. BRE is a self-administered real estate investment trust (“REIT”) focused on the development, acquisition and management of multifamily apartment communities in the Western United States. At December 31, 2009, BRE’s portfolio, owned directly or through wholly or majority owned subsidiaries, consisted of 73 multifamily communities (aggregating 21,245 units), classified as direct investments in real estate-investments in rental properties on the accompanying consolidated balance sheets. Of these properties, 58 were located in California, 13 in Washington, and two in Arizona. In addition, at December 31, 2009, there were six properties under various stages of construction and development, including two directly owned properties with 566 units classified as direct investments in real estate-construction in progress and four land parcels which are classified as land under development. BRE also holds a 35% interest in two real estate joint ventures that own two multifamily properties with a total of 488 units and a 15% interest in eleven joint ventures that own eleven multifamily properties with a total of 3,592 units at December 31, 2009.
The Operating Company
In November 1997, BRE acquired 16 completed properties and eight development properties from certain entities of Trammell Crow Residential-West (the “Transaction”) pursuant to a definitive agreement (the “Contribution Agreement”). BRE paid a total of approximately $160,000,000 in cash and issued $100,000,000 in common stock based on a stock price of $26.93 per share, as provided for in the Contribution Agreement. In addition, certain entities received Operating Company Units (“OC Units”) valued at $76,000,000 in BRE Property Investors LLC (the “Operating Company”), a Delaware limited liability company and a majority owned subsidiary of BRE. The Operating Company assumed approximately $120,000,000 in debt in connection with this purchase. BRE is the sole managing member and majority owner of the Operating Company at December 31, 2009. Substantially all of the properties acquired in the Transaction are owned by the Operating Company, which was formed by BRE for the purpose of acquiring the properties in the Transaction.
The OC Units held by non-managing members are included in redeemable noncontrolling interests in the Company’s consolidated financial statements. Starting in November 1999, non-managing members of the Operating Company can exchange their units for cash in an amount equal to the market value of common stock at the time of the exchange or, at the option of the Company, common stock of BRE on a 1:1 basis. As of December 31, 2009, 2,459,074 OC Units have been exchanged for common stock or cash. There are 770,789 operating company units outstanding as of December 31, 2009. The non-managing members are entitled to priority distributions regardless of the cash flows of the Operating Company. The Operating Company is also required to maintain certain financial ratios to protect the non-managing members’ distributions. Further, the Company had restrictions from selling certain assets of the Operating Company in a taxable sale for a ten year period from the date of the Transaction. The ten year period lapsed November 18, 2007. The Operating Company will continue until the earlier of conversion of all non-managing member OC Units, or September 25, 2012. The Operating Company has also guaranteed the repayment of the Company’s $750,000,000 unsecured line of credit.
2. Summary of Significant Accounting Policies
Consolidation
Under FASB guidance, arrangements that are not controlled through voting or similar rights are accounted for as VIEs. An enterprise is required to consolidate a VIE if it is the primary beneficiary of the VIE.
A VIE is created when (i) the equity investment at risk is not sufficient to permit the entity to finance its activities without additional subordinated financial support from other parties or (ii) the entity’s equity holders as
58
a group lack one of the following three characteristics of a controlling financial interest: (a) the direct or indirect ability to make decisions about the entity through voting or similar rights, (b) the obligation to absorb expected losses of the entity if they occur or (c) the right to receive the expected residual returns of the entity if they occur. If an entity is deemed to be a VIE, the enterprise that is deemed to absorb a majority of the expected losses or receive a majority of expected residual returns of the VIE is considered the primary beneficiary and must consolidate the VIE.
The Company has concluded that under certain circumstances when the Company (i) enters into option agreements for the purchase of land or communities from an entity and pays a non-refundable deposit, or (ii) enters into arrangements for the formation of joint ventures, a VIE may be created under condition (ii) (b) or (c) of the previous paragraph. For each VIE created, the Company has computed expected losses and residual returns based on the probability of future cash flows. If the Company is determined to be the primary beneficiary of the VIE, the assets, liabilities and operations of the VIE are consolidated with the Company’s financial statements.
For any unconsolidated joint venture arrangements existing as of January 1, 2004, the Company has evaluated whether such joint venture arrangements represent variable interest entities in which the Company is the primary beneficiary.
Under applicable accounting guidance, the managing member of a limited liability company, or LLC, is presumed to control the LLC and must prove non-managing member(s) have certain rights that preclude the managing member from exercising unilateral control. The Company has reviewed its control as the General Partner of the Company’s joint venture assets and concluded that it does not have control over any of the LLCs managed by the Company. The Company has applied the equity method of accounting to its investments in joint ventures.
At December 31, 2009, the Company has no non-refundable cash deposits for land purchase option agreements.
BRE consolidates entities not deemed as VIEs that it has the ability to control. The accompanying consolidated financial statements include the accounts of the Company, the Operating Company and other controlled subsidiaries. At December 31, 2009, BRE owned 94% of the Operating Company. All significant intercompany balances and transactions have been eliminated in consolidation.
Use of Estimates
The preparation of consolidated financial statements, in accordance with accounting principles generally accepted in the United States of America, requires the Company to make estimates and judgments that affect the reported amounts of assets, liabilities, revenues and expenses and related disclosures of contingent assets and liabilities. On an on-going basis, the Company evaluates its estimates, including those related to acquiring, developing and assessing the carrying values of its real estate properties, its investments in and advances to joint ventures and affiliates, its accrued liabilities, its performance-based equity compensation plans, and its qualification as a REIT. The Company bases its estimates on historical experience, current market conditions, and various other assumptions that are believed to be reasonable under the circumstances. Actual results may vary from those estimates and those estimates could vary under different assumptions or conditions.
Investments in Rental Properties
Rental properties are recorded at cost, less accumulated depreciation, less an adjustment, if any, for impairment. All properties are held for leasing activities. A land value is assigned based on the purchase price if land is acquired separately, or based on estimated market rates if acquired in a merger or in an operating community acquisition. BRE has a development group which manages the design, development and construction
59
of its apartment communities. Projects under development are carried at cost, including direct and indirect costs incurred to ready the assets for their intended use and which are specifically identifiable, including capitalized interest and property taxes until units are placed in service. Direct investment development projects are considered placed in service as certificates of occupancy are issued and the units become ready for occupancy. Depreciation begins as units are placed in service. Land acquired for development is capitalized and reported as “Land under development” until the development plan for the land is formalized. Once the development plan is determined and construction contracts are signed, the costs are transferred to the balance sheet line item “Construction in progress.” Interest is capitalized on the construction in progress and land under development at a rate equal to the Company’s weighted average cost of debt. The capitalization of interest ends when the assets are readied for their intended use. Expenditures for ordinary maintenance and repairs are expensed to operations as incurred and significant renovations and improvements that increase the value of the property or extend its useful life are capitalized.
Under subcontractor agreements during the development and construction of an apartment community, a designated percentage of the subcontracted fee is retained until the end of the project to ensure the subcontractor completes their task to the Company’s approval. The Company records retention payable when the amount becomes a probable and estimable liability. Because the nature of the contracted work is to extend the useful life or make ready the subject property for its intended use, the offsetting debit upon recording the liability is to the basis of the community. The retention liability is relieved when paid upon satisfaction of the contract.
Depreciation is computed on a straight-line basis over the estimated useful lives of the assets, which generally range from 35 to 40 years for buildings and three to ten years for other property.
The Company evaluates its long-lived assets for impairment under FASB guidance and requires that the results of operations of any communities that have been sold, or otherwise qualify as “held for sale,” be presented as discontinued operations in all periods presented.
The Company periodically evaluates its long-lived assets, including its investments in rental properties, for impairment indicators. The judgments regarding the existence of impairment indicators are based on factors such as operational performance, market conditions, the expected holding period of each asset and legal and environmental concerns. Future events could occur which would cause the Company to conclude that impairment indicators exist and an impairment loss is warranted. There were no assets for which an adjustment for impairment in value was made in 2009, 2008 or 2007.
In the normal course of business, BRE will receive offers for sale of its properties, either solicited or unsolicited. For those offers that are accepted, the prospective buyer will usually require a due diligence period before consummation of the transaction. It is not unusual for matters to arise that result in the withdrawal or rejection of the offer during this process. The Company classifies real estate as “held for sale” when all of the following criteria have been met: management has committed to a plan to sell the asset, the asset is available for immediate sale in its present condition, an active program to locate a buyer has been initiated, the sale of the asset is probable within one year, the asset is being actively marketed for sale at a price that is reasonable in relation to its current fair value, and actions required to complete the plan indicate that it is unlikely that significant changes to the plan will be made or that the plan will be withdrawn.
Specific components of net income that are presented as discontinued operations include the held for sale communities’ operating results, depreciation and interest expense to the extent there is a secured loan on the property. In addition, the net gain or loss on the eventual disposal of communities held for sale will be presented as income from discontinued operations when recognized. Real estate assets held for sale are measured at the lower of the carrying amount or the fair value less the cost to sell. Subsequent to classification of a community as held for sale, no further depreciation is recorded on the assets. Communities are presented as held for sale on the accompanying consolidated balance sheets only in the period that they qualify for such treatment. Sales are generally recorded after title has been transferred to the buyer and after appropriate payments have been received and other criteria met.
60
Equity Interests in Real Estate Joint Ventures
The Company’s investments in non-controlled real estate joint ventures and joint ventures which are VIEs in which the Company is not the primary beneficiary are accounted for under the equity method of accounting on the accompanying consolidated financial statements. Investments in real estate joint ventures that are managed by the Company are included in Equity interests in and advances to real estate joint ventures.
Redeemable Noncontrolling Interests
Redeemable noncontrolling interests includes our redeemable OC Units and are recorded at their current redemption value. Increases or decreases in the redemption value of the redeemable OC Units are recorded against additional paid-in capital. The redeemable noncontrolling interest amount related to the OC Unit is reclassified to Common stock and Additional paid-in capital at conversion.
Rental Revenue
Rental income is recorded when due from residents and recognized monthly as it is earned and realizable, under lease terms which are generally for periods of one year or less. There were no contingent rental payments or percentage rents in the three years ended December 31, 2009, 2008 and 2007. Rent concessions are amortized over the lives of the related leases.
Other income
Other income totaled $3,459,000, $7,885,000 and $5,787,000 for the years ended December 31, 2009, 2008 and 2007, respectively. The primary components of other income in 2009 includes: 1) $1,700,000 in management fees, 2) $650,000 in interest income, 3) $640,000 related to a litigation and insurance settlements. The 2008 total includes: 1) $4,400,000 in litigation settlement proceeds related to Pinnacle Galleria, 2) $1,726,000 in management fees, 3) $1,007,000 from a forfeited escrow deposit on an asset held for sale that failed to close and 4) $580,000 in interest income. The 2007 total includes: 1) $1,900,000 in litigation settlement proceeds related to Pinnacle Galleria, 2) $1,400,000 in management fees and 3) interest income of $1,900,000.
Other expenses
Other expenses totaled $13,522,000, $5,719,000 and zero for the years ended December 31, 2009, 2008 and 2007, respectively. Other expenses in 2009 represents a $12,900,000 abandonment charge related to three potential development sites under option agreements and a $600,000 severance charge. Other expenses in 2008 represents a $5,119,000 abandonment charge related to three potential development sites under option agreements or letters of intent and a $600,000 severance charge.
Cash
Cash and cash equivalents include all cash and liquid investments with an original maturity of three months or less from the date acquired. The Company maintains its cash at financial institutions. The combined account balances at one or more institutions periodically exceed the Federal Depository Insurance Corporation (“FDIC”) insurance coverage, and, as a result, there is a concentration of credit risk related to amounts on deposit in excess of FDIC insurance coverage. The Company believes that the risk is not significant, as the Company places its cash deposits and temporary cash investments with financial institutions believed by management to be creditworthy and of high quality.
Derivative Instruments
The Company utilizes derivative financial instruments to manage interest rate risk and generally designates these financial instruments as cash flow hedges in accordance with FASB Derivative and Hedging Activity guidance.
61
Deferred Costs
Included in Other assets are costs incurred in obtaining debt financing that are deferred and amortized over the terms of the respective debt agreements as interest expense. Related amortization expense is included in Interest expense in the accompanying consolidated statements of income. Net deferred financing costs included in Other assets in the accompanying consolidated balance sheets are $10,723,000, $13,572,000, and $18,114,000 as of December 31, 2009, 2008 and 2007, respectively. Amortization of deferred costs totaled $3,570,000, $4,371,000 and $4,485,000 for the years ended December 31, 2009, 2008 and 2007, respectively.
Income Taxes
BRE has elected to be taxed as a REIT under the Internal Revenue Code of 1986, as amended (the “Code”). As a result, BRE will not be subject to federal taxation at the corporate level to the extent it distributes, annually, 100% of its REIT taxable income, as defined by the Code, to its shareholders and satisfies certain other requirements. In addition, the states in which BRE owns and operates real estate properties have provisions equivalent to the federal REIT provisions. Accordingly, no provision has been made for federal or state income taxes at the REIT level in the accompanying consolidated financial statements.
Fair Value of Financial Instruments
In April 2009, the FASB extended disclosure requirements on the fair value of financial instruments to interim financial statements of publicly traded companies. The requirements are effective for interim reporting periods ending after June 15, 2009, with early adoption permitted for periods ending after March 15, 2009. The guidance does not require disclosures for the earlier periods presented for comparative purposes at initial adoption. The guidance requires comparative disclosures only for periods ending after the initial adoption.
The Company adopted the new provisions related to fair value measurements and disclosures effective January 1, 2008. Under these provisions, fair value is defined as the price that would be received to sell an asset or paid to transfer a liability (i.e. the “exit price”) in an orderly transaction between market participants at the measurement date.
Where available, fair value is based on observable market prices or parameters or derived from such prices or parameters. Where observable prices or inputs are not available, valuation models are applied. These valuation techniques involve some level of management estimation and judgment, the degree of which is dependent on the price transparency for the instruments or market and the instruments’ complexity. Assets and liabilities recorded at fair value in the consolidated statement of financial condition are categorized based upon the level of judgment associated with the inputs used to measure their fair value. Hierarchical levels, defined by the FASB and directly related to the amount of subjectivity associated with the inputs to fair valuation of these assets and liabilities, are as follows:
Level 1 — Inputs are unadjusted, quoted prices in active markets for identical assets or liabilities at the measurement date. The types of assets and liabilities carried at Level 1 fair value generally are G-7 government and agency securities, equities listed in active markets, investments in publicly traded mutual funds with quoted market prices and listed derivatives.
Level 2 — Inputs (other than quoted prices included in Level 1) are either directly or indirectly observable for the asset or liability through correlation with market data at the measurement date and for the duration of the instrument’s anticipated life. Fair valued assets that are generally included in this category are stock warrants for which there are market-based implied volatilities, unregistered common stock and thinly traded common stock.
Level 3 — Inputs reflect management’s best estimate of what market participants would use in pricing the asset or liability at the measurement date. Consideration is given to the risk inherent in the valuation technique and the risk inherent in the inputs to the model. Generally, assets carried at fair value and included in this category include stock warrants for which market-based implied volatilities are not available.
62
Redeemable noncontrolling interests that have a conversion feature are required to be marked to redemption value. The maximum redemption amount of the noncontrolling interests is contingent on the fair value of the Company’s common stock at the redemption date, and therefore the amount reported is calculated based on the fair value of the Company’s common stock as of the balance sheet date. Since the valuation is based on observable inputs such as quoted prices for similar instruments in active markets, redeemable noncontrolling interests are classified as Level 2.
The fair values of BRE’s financial instruments, including such items in the consolidated financial statement captions as other assets, cash, mortgages receivable, and lines of credit, approximate their carrying or contract values based on their nature, terms and interest rates that approximate current market rates. The fair value of mortgage loans payable and unsecured senior notes is estimated using discounted cash flow analyses with an interest rate similar to that of current market borrowing arrangements. The fair value of the Company’s mortgage loans payable and unsecured senior notes was approximately $1,853,000,000 (compared to a carrying value of $1,592,633,000) and $1,388,000,000 (compared to a carrying value of $1,681,096,000) at December 31, 2009 and 2008, respectively.
The estimated fair values of investment securities classified as deferred compensation plan investments are based on quoted market prices utilizing public information for the same transactions or information provided through third-party advisors. Our deferred compensation plan investments are recorded in other assets and totaled $2,604,000 and $2,114,000 for the years at December 31, 2009 and 2008, respectively.
Stock-based compensation
FASB guidance requires all share-based payments to employees, including grants of employee stock options, to be recognized in the income statement based on their fair values.
Effective January 1, 2006, the Company adopted the modified prospective method. This method requires the recognition of compensation cost for all share based payments that are unvested as of January 1, 2006. The cost related to stock-based compensation included in the determination of consolidated net income for the twelve months ended December 31, 2009, 2008 and 2007 includes all awards outstanding that are vesting during the period. From January 1, 2003 through December 31, 2005, the Company applied fair value recognition provisions The Company adopted the prospective method as provided for in FASB guidance and applied them prospectively to all awards granted, modified or settled after January 1, 2003.
Stock based compensation awards under BRE’s plans vest over periods ranging from one to four years. The Company recognizes expense for awards with graded vesting on a straight line basis. At December 31, 2009, compensation cost related to non-vested awards not yet recognized totaled approximately $12,724,000 and the weighted average period over which it is expected to be recognized is 2.1 years. During the twelve months ended December 31, 2009, 369,061 restricted shares and zero stock options were awarded.
Reclassifications
Certain reclassifications and adjustments have been made to the prior years’ consolidated financial statements to conform to the presentation of the current year’s consolidated financial statements due to discontinued operations. The prior years’ consolidated financial statements also reflect the adoption of new accounting guidance requiring retroactive application (see Recently Issued Accounting Pronouncements).
Reportable Segments
FASB guidance requires certain descriptive information to be provided about an enterprise’s reportable segments. BRE has determined that it has only one operating and reportable segment, multifamily communities, which comprised 99% of BRE’s consolidated assets at December 31, 2009 and 2008 and approximately 99% of its total consolidated revenues for the three years ended December 31, 2009.
63
Concentration Risk
All multifamily communities owned by the Company are located in the Western United States, in three general markets that it defines as California, Pacific Northwest, and Mountain/Desert States. All revenues are from external customers and there are no revenues from transactions with other segments. There are no residents that contributed 10% or more of BRE’s total revenues in the years ended December 31, 2009, 2008 or 2007.
Recently Issued Accounting Pronouncements
Effective July 1, 2009, the FASB Accounting Standards Codification (FASB ASC or the Codification) is the single source of authoritative accounting principles recognized by the FASB to be applied by non-governmental entities in the preparation of financial statements in conformity with GAAP. The adoption of the FASB ASC does not impact the Company’s financial statements, however the Company’s references to accounting literature within its notes to the condensed consolidated financial statements have been revised to conform to the Codification beginning with the quarter ended September 30, 2009.
In May 2009, the FASB required the disclosure of the date through which an entity has evaluated subsequent events and the basis for that date. The basis for the date through which the entity has evaluated subsequent events represents the date the financial statements were issued or were available to be issued. This statement is effective for the interim or annual financial periods ending after June 15, 2009 and should be applied prospectively. The adoption of the new guidance on April 1, 2009 did not have an impact on the Company’s financial position and results of operations. The Company determined that the basis for the date through which the entity has evaluated subsequent events represents the date the financial statements were issued, February 12, 2009.
In December 2007, the FASB issued new guidance with respect to noncontrolling interests in consolidated financial statements. The guidance requires that the noncontrolling interest in the equity of a subsidiary be accounted for and reported as equity, revises guidance on the treatment of net income and losses attributable to the noncontrolling interest, changes in ownership interests in a subsidiary and requires additional disclosures that identify and distinguish between the interests of the controlling and noncontrolling owners. Companies must also look at their classification and measurement of redeemable securities to determine if redeemable noncontrolling interests still require presentation in the mezzanine section of the statement of financial position. The new guidance is effective for fiscal years, and interim periods within those fiscal years, beginning on or after December 15, 2008. The Company adopted the new guidance on January 1, 2009. The guidance requires that the Company restate prior period information to give retroactive effect to the adoption. The Company determined that certain noncontrolling minority interest should continue to be presented in the mezzanine section on the consolidated balance sheet and that the noncontrolling interests that have a conversion feature be marked to the redemption value at the reporting date. In addition, the Company determined that redeemable noncontrolling interest in income, which was previously reported before net income, should be presented below net income and above net income available to common shareholders. The impact of the new guidance was an increase of redeemable noncontrolling interests of $4,624,000 and $704,000 for the years ended December 31, 2009 and 2008, to adjust the noncontrolling interest to its redemption value with an offsetting change against additional paid-in capital.
In June 2008, the FASB issued new guidance to clarify that unvested share-based payment awards with a right to receive non-forfeitable dividends are considered participating securities, and to provide guidance on how to allocate earnings to these participating securities and compute earnings per share using the two-class method. The guidance is effective for the fiscal years beginning after December 15, 2008. This guidance was adopted by the Company on January 1, 2009, and required that that the Company restate prior period information to give retroactive effect to the adoption. The impact of the adoption to net income per common share—basic totaled ($0.02) and ($0.01) for the years ended December 31, 2008 and 2007, respectively. The impact of the adoption to net income per common share—diluted totaled ($0.01), and $0.00 for the years ended December 31, 2008 and 2007, respectively.
64
In May 2008, the FASB issued new guidance on accounting for convertible debt instruments that may be settled in cash upon conversion (including partial cash settlement). The guidance requires the issuer of certain convertible debt instruments that may be settled in cash (or other assets) upon conversion to separately account for the liability (debt) and equity (conversion option) components of the instruments in a manner that reflects the issuer’s nonconvertible debt borrowing rate. The guidance also requires the initial debt proceeds from the sale of a company’s convertible debt instrument to be allocated between the liability component and the equity component. The resulting debt discount will be amortized over the debt instrument’s expected life as additional interest expense. As a result of the aforementioned additional interest expense, net income will be lower. The additional interest expense recorded will result in an increased level of capitalized interest. The guidance is effective for fiscal years, and interim periods within those fiscal years, beginning on or after December 15, 2008. The Company adopted the guidance on January 1, 2009, which requires that the Company restate prior period information to give retroactive effect to the adoption. The Company’s 4.125% convertible senior notes are within the scope of the guidance.
Following is a summary of the Consolidated Balance Sheets as previously reported (in thousands):
| December 31, 2008 As Reported |
||||
| Assets |
||||
| Investments in rental properties |
$ | 2,906,722 | ||
| Construction in progress |
$ | 292,996 | ||
| Land under development |
$ | 122,616 | ||
| Other assets |
$ | 76,485 | ||
| Total Assets |
$ | 2,991,329 | ||
| Minority interests |
$ | 29,268 | ||
| Liabilities and Shareholders’ Equity |
||||
| Unsecured senior notes |
$ | 1,529,600 | ||
| Additional paid-in capital |
$ | 993,718 | ||
| Accumulated NI less than cumulative dividends |
$ | (49,373 | ) | |
| Total shareholders’ equity |
$ | 944,926 | ||
| Total Liabilities and Shareholders’ Equity |
$ | 2,991,329 | ||
Following is a summary of the restated Consolidated Balance Sheets for the accounts impacted, which reflects the adoption of new convertible debt and convertible noncontrolling interest in income guidance (excludes the impact of reclassification of assets held for sale—See Note 9).
| December 31, 2008 As Restated |
||||
| Assets |
||||
| Investments in rental properties |
$ | 2,907,902 | ||
| Construction in progress |
$ | 295,074 | ||
| Land under development |
$ | 123,609 | ||
| Other assets |
$ | 73,521 | ||
| Total Assets |
$ | 2,992,616 | ||
| Redeemable noncontrolling interests |
$ | 29,972 | ||
| Liabilities and Shareholders’ Equity |
||||
| Unsecured senior notes |
$ | 1,505,905 | ||
| Additional paid-in capital |
$ | 1,031,791 | ||
| Accumulated NI less than cumulative dividends |
$ | (63,168 | ) | |
| Total shareholders’ equity |
$ | 969,204 | ||
| Total Liabilities and Shareholders’ Equity |
$ | 2,992,616 | ||
65
Following is a summary of the Consolidated Statements of Income as previously reported (in thousands, except per share data):
| Years ended December 31, | ||||||
| As Reported | 2008 | 2007 | ||||
| Interest Expense |
$ | 85,799 | $ | 82,009 | ||
| Net gain from extinguishment of debt |
$ | 2,369 | — | |||
| Net income available to common shareholders |
$ | 128,998 | $ | 109,191 | ||
| Allocation to participating securities—basic |
N/A | N/A | ||||
| Allocation to participating securities—diluted |
N/A | N/A | ||||
| Shares outstanding—basic |
51,050 | 50,735 | ||||
| Shares outstanding—diluted |
51,700 | 51,780 | ||||
| Net income per common share—basic |
$ | 2.53 | $ | 2.15 | ||
| Net income per common share—diluted |
$ | 2.50 | $ | 2.11 | ||
Following is a summary of the restated Consolidated Statements of Income reflecting the adoption of new convertible debt and earnings per share guidance (in thousands, except per share data).
| Years ended December 31, | ||||||||
| As Restated | 2008 | 2007 | ||||||
| Interest Expense |
$ | 92,032 | $ | 87,593 | ||||
| Net gain from extinguishment of debt |
$ | 2,364 | — | |||||
| Net income available to common shareholders |
$ | 122,760 | $ | 103,607 | ||||
| Allocation to participating securities—basic |
(1,265 | ) | (503 | ) | ||||
| Allocation to participating securities—diluted |
(1,265 | ) | (504 | ) | ||||
| Shares outstanding—basic |
51,050 | 50,735 | ||||||
| Shares outstanding—diluted |
51,440 | 51,525 | ||||||
| Net income per common share—basic |
$ | 2.38 | $ | 2.03 | ||||
| Net income per common share – diluted |
$ | 2.36 | $ | 2.00 | ||||
In December 2007, the FASB issued new guidance on business combinations which requires the acquiring entity in a business combination to recognize the fair value of assets acquired and liabilities assumed in the transaction and recognize contingent consideration arrangements and pre-acquisition loss and gain contingencies at their acquisition-date fair value. The acquirer is required to capitalize in-process research and development assets acquired and expense, as incurred, acquisition related transaction costs. The guidance requires the acquirer to disclose to investors and other users of the financial statements all of the information they need to evaluate and understand the nature and financial effect of the business combination. The guidance is effective for fiscal years, and interim periods within those fiscal years, beginning on or after December 15, 2008. The adoption of the guidance on January 1, 2009 did not have an impact on the Company’s financial position and results of operations.
In March 2008, the FASB issued new guidance on disclosures about derivative instruments and hedging activities. The guidance requires disclosures of how and why an entity uses derivative instruments, how derivative instruments and related hedged items are accounted for and how derivative instruments and related hedged items affect an entity’s financial position, financial performance, and cash flows. The guidance is effective for fiscal years and interim periods beginning after November 15, 2008, with early application encouraged. The adoption of the disclosure related guidance on January 1, 2009 did not have any impact on the Company’s financial position and results of operations.
66
In June 2009, the FASB amended guidance related to transfers of financial assets and extinguishment of liabilities to remove the concept of a qualifying special purpose entity, and clarifies and amends the derecognition criteria for determining whether a transfer of a financial asset or portion of a financial asset qualifies for sale accounting. Expanded disclosures regarding transferred assets and how they affect the reporting entity are now required. The new guidance is effective for the Company beginning January 1, 2010. The Company does not expect a material impact on the consolidated financial statements as a result of the new guidance.
In June 2009, the FASB changed the consolidation analysis for VIEs to require a qualitative analysis to determine the primary beneficiary of the VIE. The determination of the primary beneficiary of a VIE is based on whether the entity has the power to direct matters which most significantly impact the activities of the VIE and has the obligation to absorb losses, or the right to receive benefits, of the VIE which could potentially be significant to the VIE. The guidance requires an ongoing reconsideration of the primary beneficiary and also amends the events triggering a reassessment. Additional disclosures for VIEs are required, including a description about a reporting entity’s involvement with VIEs, how a reporting entity’s involvement with a VIE affects the reporting entity’s financial statements, and significant judgments and assumptions made by the reporting entity to determine whether it must consolidate the VIE. The new guidance is effective for the Company beginning January 1, 2010. The Company does not expect a material impact on the consolidated financial statements as a result of the new guidance.
3. Real Estate Portfolio
During 2009, BRE sold two communities totaling 752 units: Overlook at Blue Ravine, with 512 units located in Folsom, California; and Arbor Pointe, a 240 unit property located in Sacramento, California. During 2009 BRE completed construction of three development communities: Taylor 28, with 197 units in Seattle, Washington, 5600 Wilshire, with 284 units in Los Angeles California and Park Viridian with 320 units in Anaheim, California. The aggregate investment in the three communities totals $282,934,000.
During 2008, BRE sold six communities totaling 1,484 units: Blue Rock Village, with 560 units located in Vallejo, California; The Park at Dash Point, with 280 units located in Seattle, Washington; Pinnacle at Blue Ravine with 260 units, located in Sacramento, California; Canterbury Downs, with 173 units located in Sacramento, California; Rocklin Gold with 121 units located in Sacramento, California; and Quail Chase with 90 units located in Sacramento, California. During 2008, BRE completed construction of three development communities: Avenue 64, with 224 units in Emeryville, California; The Stuart at Sierra Madre with 188 units in Pasadena, California and Renaissance at Uptown Orange with 460 units in Orange, California. The aggregate investment in the three communities totals $249,076,000.
The components of direct investments in real estate—investments in rental properties follow:
| December 31 | ||||||||
| 2009 | 2008 | |||||||
| Land |
$ | 561,865,000 | $ | 520,158,000 | ||||
| Buildings and improvements |
2,618,768,000 | 2,407,323,000 | ||||||
| Subtotal |
3,180,633,000 | 2,927,481,000 | ||||||
| Accumulated depreciation |
(583,953,000 | ) | (514,388,000 | ) | ||||
| Total |
$ | 2,596,680,000 | $ | 2,413,093,000 | ||||
BRE’s carrying value of its assets exceeded the tax basis by approximately $101,670,000 (unaudited) at December 31, 2009, reflecting, among other factors, the carryover of basis on tax-deferred exchanges.
67
A roll-forward of direct investments in real estate construction in progress follows:
| December 31 | ||||||||
| 2009 | 2008 | |||||||
| Opening balance |
$ | 295,074,000 | $ | 298,910,000 | ||||
| Costs incurred to projects under construction |
89,714,000 | 153,545,000 | ||||||
| Transfers of construction in progress to direct investments in real estate—investments in rental properties |
(283,434,000 | ) | (177,246,000 | ) | ||||
| Transfers from land under development to direct investments in real estate—construction in progress |
— | 19,865,000 | ||||||
| Ending balance |
$ | 101,354,000 | $ | 295,074,000 | ||||
At December 31, 2009, BRE had an estimated cost of $16,400,000 to complete existing construction in progress, with funding estimated through the third quarter of 2010.
4. Equity Interests in and Advances to Real Estate Joint Ventures
As of December 31, 2009, BRE had thirteen joint venture arrangements in which its capital interest in two of the joint ventures is 35% and its ownership interest in eleven of the joint ventures is 15%; these joint ventures are managed by the Company (the “joint ventures”). The Company accounts for its investments in these joint ventures under the equity method of accounting.
Each of the joint ventures in which the Company has a capital interest of 35% contains a single multifamily community that was developed by BRE and completed in 2001. BRE’s investment in these joint ventures totals $11,419,000 and $11,730,000 as of December 31, 2009 and 2008, respectively, and is shown as “Equity interests in and advances to real estate joint ventures-investments in rental properties” on BRE’s consolidated balance sheets. The communities had a total cost of approximately $46,030,000. The joint ventures carry secured, non-recourse loans totaling $17,697,000 that mature in 2011 and bear interest at rates of 7.25% and 8.0%.
Each of the joint ventures in which the Company has an ownership interest of 15%, contain a single multifamily community. Eight of the eleven joint venture communities were previously owned by the Company and were contributed into the joint ventures, upon their respective formation. The remaining three joint venture communities were acquired by the Company and its joint venture partner through arms length transactions with non affiliated third parties. BRE’s investment in these eleven joint ventures totals $50,580,000 and $50,767,000 as of December 31, 2009 and 2008, respectively, and is shown as “Equity interests in and advances in real estate joint ventures-investments in rental properties” on BRE’s consolidated balance sheets. The communities had a total cost of approximately $434,950,000. All of the eleven joint ventures in which our ownership interest is 15% are un-leveraged.
The Company’s maximum exposure to loss on joint ventures is the total investment along with the BRE’s proportionate share in any debt held by the joint ventures. BRE’s investment in joint venture totaled $61,999,000 and $62,497,000 as of December 31, 2009 and 2008, respectively. BRE’s share in joint venture debt was $8,849,000 and $8,998,000 as of December 31, 2009 and 2008, respectively.
The Company’s income from unconsolidated entities totaled $2,329,000, $2,560,000 and $2,133,000 for the years ended December 31, 2009, 2008 and 2007, respectively.
68
5. Other Assets
The components of Other assets follow:
| December 31 | ||||||
| 2009 | 2008 | |||||
| Predevelopment and escrow deposits |
$ | 14,128,000 | $ | 24,390,000 | ||
| Prepaid loan fees |
10,723,000 | 13,572,000 | ||||
| Accounts and mortgages receivable, net |
12,119,000 | 10,455,000 | ||||
| Furniture and equipment |
7,244,000 | 8,718,000 | ||||
| Prepaid insurance |
4,273,000 | 4,628,000 | ||||
| Deferred compensation plan |
2,604,000 | 2,114,000 | ||||
| Other |
7,696,000 | 9,848,000 | ||||
| Total Other Assets |
$ | 58,787,000 | $ | 73,725,000 | ||
In the fourth quarter of 2009 and 2008, the Company wrote off $12,900,000 and $5,119,000 of predevelopment cost and escrow deposits, respectively, each related to three sites under option agreements as the Company has abandoned plans to acquire and develop these properties.
6. Secured Debt
The following data pertain to BRE’s secured debt:
| December 31, | ||||||||
| 2009 | 2008 | |||||||
| Fixed rate secured mortgage loans |
$ | 752,157,000 | $ | 151,496,000 | ||||
| Net book value of investments in real estate collateralizing secured debt |
$ | 820,676,000 | $ | 253,911,000 | ||||
| Remaining terms of mortgage loans payable |
1-10 years | 1-5 years | ||||||
| Weighted average interest rate on fixed rate mortgages |
5.7 | % | 6.1 | % | ||||
On April 7, 2009, the Company closed a $620,000,000 secured credit facility with Deutsche Bank Berkshire Mortgage, Inc. The facility consists of two $310,000,000 tranches. The first tranche has a fixed rate term of 10 years and has a maturity date of May 1, 2019. The second tranche has a maturity date of September 1, 2020, with a fixed rate term for the first 10 years and a variable rate for the remaining one-year period. Together, the effective composite annual cost of debt is 5.6% inclusive of rate hedging transactions. Fifteen multifamily properties totaling 4,651 units with a net carrying value of $607,500,000 secured the credit facility at the time of closing.
7. Unsecured Senior Notes and Unsecured Line of Credit
The following table pertains to BRE’s unsecured senior notes and unsecured line of credit:
| December 31, | ||||||||
| 2009 | 2008 | |||||||
| Fixed rate unsecured notes |
$ | 469,142,000 | $ | 1,080,000,000 | ||||
| Convertible Notes(1) |
357,776,000 | 425,905,000 | ||||||
| Unsecured line of credit |
288,000,000 | 245,000,000 | ||||||
| Total unsecured debt |
$ | 1,114,918,000 | $ | 1,750,905,000 | ||||
| Weighted average interest rate on fixed rate unsecured notes |
5.84 | % | 6.20 | % | ||||
| Weighted average interest rate on convertible notes(1) |
6.01 | % | 6.01 | % | ||||
| Weighted average interest rate on unsecured line of credit |
1.54 | % | 4.45 | % | ||||
| (1) | Represents $371,300,000 and $449,600,000 cash principal as of December 31, 2009 and 2008, respectively, with 4.125% coupon adjusted to reflect new convertible debt accounting guidance. |
69
Tender Offers and Repurchase Activity
On April 15, 2009, the Company closed a fixed price cash tender offer for any and all of our outstanding 5.750% senior notes due 2009 and any and all of our outstanding 4.875% senior notes due 2010. As a result, $61,407,000 and $119,421,000 in aggregate principal amount of the 5.750% senior notes due 2009 and 4.875% senior notes due 2010, respectively, were validly tendered and we accepted, purchased and subsequently cancelled the notes. After giving effect to the purchase of the tendered notes, an aggregate principal amount of $30,579,000 of the 4.875% senior notes due in 2010, respectively, remain outstanding. The remaining principal balance of the 5.750% senior notes due in 2009 was paid in full during September 2009, as the note came due.
On April 1, 2009, the Company closed a fixed price cash tender offer for any and all of our outstanding 7.450% senior notes due 2011 and any and all of our outstanding 7.125% senior notes due 2013. As a result, $201,455,000 and $89,982,000 in aggregate principal amount of the 7.450% senior notes due 2011 and 7.125% senior notes due 2013, respectively, were validly tendered and we accepted, purchased and subsequently cancelled the notes. After giving effect to the purchase of the tendered notes, an aggregate principal amount of $48,545,000 and $40,018,000 of the 7.450% senior notes due 2011 and 7.125% senior notes due 2013, respectively, remain outstanding.
During 2009, the Company repurchased through open market transactions $78,266,000 of our 4.125% convertible senior unsecured notes for an aggregate price of 92.99% of par, or approximately $72,776,000.
During 2009, the Company recognized a net gain of $1,470,000 in connection with the repurchase and tender activity.
2009 Debt Tender/Repurchase Summary
| Security |
Cash Principal Outstanding |
Bonds Retired |
Cash Paid |
Principal Amount Remaining |
% of Par | Extinguishment Gain |
Write off of Unamortized Discounts / Fees / Equity |
Net Gain (Loss) |
||||||||||||||||||
| (Amounts in thousands) | ||||||||||||||||||||||||||
| 2011 7.45% Senior Notes |
$ | 250,000 | $ | 201,455 | $ | 201,455 | $ | 48,545 | 100.00 | % | $ | — | $ | (1,023 | ) | $ | (1,023 | ) | ||||||||
| 2013 7.125% Senior Notes |
130,000 | 89,982 | 88,182 | 40,018 | 98.00 | % | 1,800 | (1,127 | ) | 673 | ||||||||||||||||
| 2009 5.75% Senior Notes |
150,000 | 61,407 | 61,407 | 88,593 | 100.00 | % | — | (294 | ) | (294 | ) | |||||||||||||||
| 2010 4.875% Senior Notes |
150,000 | 119,421 | 119,421 | 30,579 | 100.00 | % | — | (756 | ) | (756 | ) | |||||||||||||||
| Debt tender total |
$ | 680,000 | $ | 472,265 | $ | 470,465 | $ | 207,735 | 99.62 | % | $ | 1,800 | $ | (3,200 | ) | $ | (1,400 | ) | ||||||||
| 4.125% Convertible Senior Notes |
449,600 | 78,266 | 72,776 | 371,334 | 92.99 | % | 5,490 | (2,620 | ) | 2,870 | ||||||||||||||||
| Total Tender/Repurchase |
$ | 1,129,600 | $ | 550,531 | $ | 543,241 | $ | 579,069 | 98.68 | % | $ | 7,290 | $ | (5,820 | ) | $ | 1,470 | |||||||||
On December 24, 2008, the Company repurchased through open market transactions $10,400,000 of our 4.125% convertible senior unsecured notes for approximately $8,000,000, resulting in a $2,364,000 net gain on extinguishment of debt.
Unsecured Line of Credit
The Company maintains its revolving credit facility of $750,000,000. Based on the Company’s current debt ratings, the line of credit accrues interest at LIBOR plus 47.5 basis points. In addition, the Company pays a 0.15% annual facility fee on the capacity of the facility. Borrowings under our revolving unsecured line of credit totaled $288,000,000 at December 31, 2009, compared to $245,000,000 at December 31, 2008. Borrowings under the credit facility are used to fund acquisition and development activities as well as for general corporate purposes. Balances on the revolving unsecured line of credit are typically reduced with available cash balances.
70
Fixed Rate Unsecured Notes
On March 13, 2007, the Company completed an offering of $300,000,000 of 10-year senior unsecured notes. The notes will mature on March 15, 2017 and bear interest at a fixed coupon rate of 5.50%. Net proceeds from the offering, after all discounts, commissions, and issuance costs totaled approximately $297,000,000 and were used for general corporate purposes.
Convertible Notes
On August 15, 2006, the Company completed a private offering of $460,000,000 aggregate principal amount of convertible senior unsecured notes that mature on August 15, 2026. The notes bear interest at a fixed coupon rate of 4.125%. The notes may be converted into shares of BRE common stock (“Common Shares”), at the option of the holder, under specific circumstances, on or after July 15, 2026, at an initial conversion rate of 14.0432 shares per $1,000 principal amount of notes. This is equivalent to an initial conversion price of $71.21 per share, which represents a 27.50% premium over the $55.85 closing price of the Company’s stock at the time the transaction was priced. The number of shares of common stock that may be issuable upon conversion of the notes is based on a conversion price of approximately $55.85 per share, which is based on a maximum conversion rate of 17.9051 shares per $1,000 principal amount of notes. On or after February 21, 2012, the Company may redeem the notes at a redemption price equal to the principal amount of the notes plus any accrued but unpaid interest thereon, and in certain circumstances, any additional conversion value.
| Convertible debt detail as of December 31, |
||||||||
| 2009 | 2008 | |||||||
| Carrying amount of equity component |
$ | 37,153,000 | $ | 38,777,000 | ||||
| Principal amount of debt |
$ | 371,334,000 | $ | 449,600,000 | ||||
| Unamortized debt discount |
(13,558,000 | ) | (23,695,000 | ) | ||||
| Net carrying amount of convertible debt |
$ | 357,776,000 | $ | 425,905,000 | ||||
| Remaining expected term of convertible debt |
2.14 years | 3.14 years | ||||||
| Maximum potential amount of shares to be delivered upon conversion |
6,649,000 | 8,050,000 | ||||||
| Years Ended December 31, | ||||||||||||
| 2009 | 2008 | 2007 | ||||||||||
| Fixed coupon rate on notes |
4.125 | % | 4.125 | % | 4.125 | % | ||||||
| Effective interest rate on notes |
6.01 | % | 6.01 | % | 6.01 | % | ||||||
| Contractual interest expense based on coupon of 4.125% |
$ | 17,374,000 | $ | 18,966,000 | 18,975,000 | |||||||
| Noncash interest expense on effective coupon of 6.01% |
7,612,000 | 7,918,000 | 7,516,000 | |||||||||
| Noncash capitalized interest on effective coupon of 6.01% |
(1,209,000 | ) | (1,685,000 | ) | (1,932,000 | ) | ||||||
| Total net interest recognized on convertible debt |
$ | 23,777,000 | $ | 25,199,000 | $ | 24,559,000 | ||||||
The unsecured line of credit and unsecured senior note agreements contain various covenants that include, among other factors, tangible net worth and requirements to maintain certain financial ratios. BRE was in compliance with all such financial covenants throughout the years ended December 31, 2009 and 2008.
Scheduled principal payments required on the line of credit, unsecured senior notes payable and mortgage loans payable for the next five years and thereafter are as follows:
| 2010 |
$ | 63,850,000 | |
| 2011 |
50,673,000 | ||
| 2012 |
712,421,000 | ||
| 2013 |
70,131,000 | ||
| 2014 |
53,120,000 | ||
| Thereafter |
916,880,000 | ||
| Total |
$ | 1,867,075,000 | |
71
The following is a summary of interest expense on mortgage loans, lines of credit and unsecured senior notes, including amortization of related issuance costs:
| Year ended December 31, | ||||||||||||
| 2009 | 2008 | 2007 | ||||||||||
| Total interest incurred |
$ | 99,064,000 | $ | 115,156,000 | $ | 113,622,000 | ||||||
| Capitalized interest |
(16,330,000 | ) | (23,124,000 | ) | (26,029,000 | ) | ||||||
| Total interest expense |
$ | 82,734,000 | $ | 92,032,000 | $ | 87,593,000 | ||||||
| Total cash paid for interest |
$ | 94,637,000 | $ | 86,077,000 | $ | 76,277,000 | ||||||
8. Accounts Payable and Accrued Expenses
The components of accounts payable and accrued expenses:
| December 31, | ||||||
| 2009 | 2008 | |||||
| Accrued interest payable |
$ | 17,458,000 | $ | 29,467,000 | ||
| Accrued employee and non employee director benefits |
8,082,000 | 8,962,000 | ||||
| Security deposit |
8,543,000 | 8,879,000 | ||||
| Accrued development costs and real estate improvements |
5,765,000 | 13,856,000 | ||||
| Retention payable |
4,415,000 | 9,977,000 | ||||
| Prepaid rent |
3,993,000 | 4,127,000 | ||||
| Deferred compensation plan |
2,604,000 | 2,108,000 | ||||
| Escrow fund liability |
— | 7,075,000 | ||||
| Other |
5,549,000 | 6,716,000 | ||||
| Total Accounts Payable and Accrued Expenses |
$ | 56,409,000 | $ | 91,167,000 | ||
9. Discontinued Operations
The results of operations for properties sold during the period or designated as held for sale at the end of the period are required to be classified as discontinued operations if deemed a component of an entity. The property-specific components of net earnings that are classified as discontinued operations include operating results, depreciation expense recognized prior to the classification as held for sale, and the net gain or loss on disposal.
During 2009, the Company sold two communities totaling 752 units: Overlook at Blue Ravine, with 512 units located in Folsom, California; and Arbor Pointe, a 240 unit property located in Sacramento, California. The two properties were sold for an aggregate sales price of approximately $67,000,000, resulting in a net gain on sales of approximately $21,574,000. In addition to the two communities, we sold an excess parcel of land in Santa Clara, California, classified as held for sale at December 31, 2008, for gross sales proceeds totaling $17,100,000, approximately equal to the carrying value.
During the second quarter 2009, the Company reclassified one operating community previously classified as Real estate held for sale to Investments in rental properties as the assets no longer met the held for sale guidance criteria. At December 31, 2008 the assets had a net carrying value of approximately $14,900,000. The asset values as of June 30, 2009, was $14,300,000, which reflected the carrying amounts, adjusted for depreciation expense that would have been recognized had the communities been continuously classified as Investments in rental properties.
During 2008, the Company sold six communities totaling 1,484 units: Blue Rock Village, with 560 units located in Vallejo, California; The Park at Dash Point, with 280 units located in Seattle, Washington; Pinnacle at Blue Ravine with 260 units, located in Sacramento, California; Canterbury Downs, with 173 units located in Sacramento, California; Rocklin Gold with 121 units located in Sacramento, California; and Quail Chase with 90 units located in Sacramento, California. The six communities were sold for net proceeds totaling approximately $163,215,000, resulting in a net gain on sale of approximately $65,984,000.
72
On July 11, 2007, the Company contributed one community with a total value of $52,000,000 and 432 units located in Phoenix, Arizona, classified as held for sale at June 30, 2007, to a newly formed joint venture in exchange for 15% equity interest in the joint venture and approximately $44,000,000 in cash. The joint venture investment is reported as equity interests in investments in rental properties on the consolidated balance sheet. The net carrying value of the investment in the joint venture is equal to 15% of the total carrying value of the net asset, at the time of the contribution, which totaled approximately $20,500,000. In connection with the contribution, the Company recognized a gain of $26,600,000.
During 2007, the Company sold three communities totaling 441 units: Hazel Ranch, with 208 units located in Sacramento, California; Shaliko, with 152 units located in Sacramento, California; and Brentwood Townhomes with 81 units, located in Seattle, Washington. The three communities were sold for an aggregate sales price of approximately $56,400,000, resulting in a net gain on sale of approximately $29,400,000.
The net gain on sale and the combined results of operations for these 12 operating properties are included in discontinued operations on the consolidated statements of income for each twelve month ended period presented. These amounts totaled $23,870,000, $78,611,000 and $70,470,000 for the twelve months ended December 31, 2009, 2008 and 2007, respectively.
The following is a breakdown of the net gain on sales and the combined results of operations for the properties included in discontinued operations:
| Years ended December 31 | ||||||||||||
| 2009 | 2008 | 2007 | ||||||||||
| Rental income |
$ | 4,242,000 | $ | 23,813,000 | $ | 32,870,000 | ||||||
| Real estate expenses |
(1,787,000 | ) | (8,799,000 | ) | (11,849,000 | ) | ||||||
| Provision for depreciation |
(159,000 | ) | (2,352,000 | ) | (5,765,000 | ) | ||||||
| Interest expense(1) |
— | (35,000 | ) | (743,000 | ) | |||||||
| Net gain on sales of discontinued operations |
21,574,000 | 65,984,000 | 55,957,000 | |||||||||
| Total discontinued operations |
$ | 23,870,000 | $ | 78,611,000 | $ | 70,470,000 | ||||||
| (1) | Includes only interest expense specific to secured mortgage notes payable for properties sold and/or held for sale. |
10. Preferred Stock
The following table presents the Company’s issued and outstanding Preferred Shares as of December 31, 2009 and 2008:
| Optional Redemption Date(1) |
Annual Dividend Rate per Share(2) |
Outstanding at December 31, 2009 |
Outstanding at December 31, 2008 | ||||||||
| Preferred Stock, nonvoting, $0.01 par value; 20,000,000 shares authorized: |
|||||||||||
| 6.75% Series C cumulative redeemable, liquidation preference $25.00 per share, 4,000,000 shares outstanding at December 31, 2009 and 2008 |
March 2009 | $ | 1.6875 | $ | 100,000,000 | $ | 100,000,000 | ||||
| 6.75% Series D cumulative redeemable, liquidation preference $25.00 per share, 3,000,000 shares outstanding at December 31, 2009 and 2008 |
December 2009 | $ | 1.6875 | 75,000,000 | 75,000,000 | ||||||
| $ | 175,000,000 | $ | 175,000,000 | ||||||||
| (1) | On or after the redemption date, all series may be redeemed for cash at the option of the Company, in whole or in part, at a redemption price equal to the liquidation price per share, plus accrued and unpaid dividends, if any. |
73
| (2) | Dividends on all series of Preferred Shares are payable quarterly. All series of preferred stock rank prior to the Company’s common stock with respect to the payment of dividends and the distribution of assets in the event of liquidation, dissolution or winding up. Each series of preferred stock ranks on parity with the others. |
On September 14, 2007, we redeemed all 3,000,000 shares of 8.08% Series B Cumulative Redeemable Preferred Stock at a redemption price of $25.42644 per share. The redemption price was equal to the original issuance price of $25.00 per share, plus accrued and unpaid dividends to the redemption date. The initial issuance costs totaling $2,768,000 associated with the Series B Cumulative Redeemable Preferred Stock were expensed during the third quarter of 2007.
11. Stock Option Plans
Employee Plans
The 1992 Stock Option Plan and the 1999 BRE Stock Incentive Plan, as amended (the “Plans”) provide for the issuance of incentive stock options, non-qualified stock options, share appreciation rights, restricted shares and other grants. The maximum number of shares that may be issued under the Plans is 6,850,000. The option price may not be less than the fair market value of a share on the date that the option is granted and the options generally vest over three to five years. Shareholders initially adopted the 1999 BRE Stock Incentive Plan in 1999 and approved the plan as amended in 2007. The 1999 BRE Stock Incentive Plan, as amended, allows for grants of up to 4,500,000 shares. Changes in options outstanding were as follows:
| Years ended December 31 | ||||||||||||||||||
| 2009 | 2008 | 2007 | ||||||||||||||||
| Shares under option |
Weighted average exercise price |
Shares under option |
Weighted average exercise price |
Shares under option |
Weighted average exercise price | |||||||||||||
| Balance at beginning of period |
692,311 | $ | 30.80 | 713,426 | $ | 30.80 | 855,910 | $ | 30.66 | |||||||||
| Exercised |
(9,500 | ) | $ | 22.40 | (14,967 | ) | $ | 31.48 | (140,984 | ) | $ | 29.93 | ||||||
| Cancelled |
(61,900 | ) | $ | 30.96 | (6,148 | ) | $ | 28.65 | (1,500 | ) | $ | 32.45 | ||||||
| Balance at end of period |
620,911 | $ | 30.92 | 692,311 | $ | 30.80 | 713,426 | $ | 30.80 | |||||||||
| Exercisable |
620,911 | $ | 30.92 | 643,911 | $ | 30.68 | 588,626 | $ | 30.57 | |||||||||
| Weighted average estimated fair value of options granted during the year |
— | $ | — | — | $ | — | — | $ | — | |||||||||
At December 31, 2009, the exercise price of shares under option ranged from $22.40 to $32.45, with a weighted average exercise price of $30.92. Expiration dates range from 2010 through 2014; the weighted average remaining contractual life of these options is three years. Stock options were exercised during 2009 on options originally granted with exercise prices of $22.40.
At December 31, 2009, there were 792,704 restricted shares outstanding under the Plans with an average grant date fair value price of $35.43. There were 336,450, 339,753 and 21,016 restricted shares granted in 2009, 2008 and 2007, respectively. The fair value of restricted shares awarded totaled $8,882,000, $15,430,000 and $1,418,000 in 2009, 2008 and 2007, respectively. During 2009, certain executive officers were granted 68,826 restricted shares with a performance based component, 45,116 restricted shares with market conditions and 115,419 restricted shares which are service based. During 2008, certain executive officers were granted 20,788 restricted shares with a performance based component, 7,124 restricted shares with market conditions and 42,492 restricted shares which are service based. There were no share awards to executive officers in 2007.
The intrinsic value of options exercised and restricted shares vested totaled $5,068,000, $1,440,000 and $4,295,000 during 2009, 2008 and 2007, respectively. The aggregate intrinsic value of options currently
74
exercisable at December 31, 2009, 2008 and 2007 was $1,828,000, $63,860 and $5,860,000, respectively. The total compensation cost capitalized in connection with development activity totaled $1,416,000, $1,191,000 and $1,081,000 for the years ended December 31, 2009, 2008 and 2007, respectively.
Non-Employee Director Stock Option and Restricted Stock Plan
The Fifth Amended and Restated Non-Employee Director Stock Option and Restricted Stock Plan provides for: (1) annual grants of restricted stock with a market price-based value of $91,000 per year per non-employee director; (2) discretionary annual grants for service as Chairman of the Board or Lead Director of restricted stock with an aggregate value of up to $35,000 per year; and (3) annual grants for service as a Board committee chairman of restricted stock with an aggregate value of $10,500 per year per committee chairman. Under the plan, equity compensation for 2009 and all future service periods are to be paid in the form of restricted share grants and no new options are to be issued. The maximum number of shares that may be issued under this plan is 2,650,000. As with the Plans, the option price may not be less than the fair market value of a share on the date the option is granted. Changes in options outstanding were as follows:
| Years ended December 31 | ||||||||||||||||||
| 2009 | 2008 | 2007 | ||||||||||||||||
| Shares under option |
Weighted average exercise price |
Shares under option |
Weighted average exercise price |
Shares under option |
Weighted average exercise price | |||||||||||||
| Balance at beginning of period |
844,920 | $ | 33.95 | 878,752 | $ | 33.64 | 1,040,129 | $ | 32.84 | |||||||||
| Granted |
— | — | — | — | 35,613 | $ | 63.22 | |||||||||||
| Exercised |
— | — | (33,832 | ) | $ | 26.09 | (193,216 | ) | $ | 29.11 | ||||||||
| Cancelled |
(76,853 | ) | $ | 29.28 | — | — | (3,774 | ) | $ | 63.22 | ||||||||
| Balance at end of period |
768,067 | $ | 34.41 | 844,920 | $ | 33.95 | 878,752 | $ | 33.64 | |||||||||
| Exercisable |
768,067 | $ | 34.41 | 831,920 | $ | 33.66 | 819,082 | $ | 32.39 | |||||||||
| Weighted average estimated fair value of options granted during the year |
— | — | $ | 8.50 | ||||||||||||||
At December 31, 2009, the exercise prices of shares under option ranged between $27.73 and $63.22, with expiration dates from 2010 to 2017. The weighted average remaining contractual life of these options is three years. At December 31, 2009, there were 32,611 restricted shares outstanding under the Plan with an average award price of $25.38. There were 32,611, 17,304 and 9,910 restricted shares granted in 2009, 2008 and 2007, respectively. The fair value of restricted shares awarded totaled $828,000, $838,000 and $564,000 in 2009, 2008 and 2007, respectively.
The intrinsic value of options exercised and restricted shares vested totaled $464,000, $1,265,000 and $6,261,000 in 2009, 2008 and 2007, respectively. The aggregate intrinsic value of options currently exercisable at December 31, 2009, 2008 and 2007 was $1,805,000, $69,493 and $6,667,000.
Direct Stock Purchase and Dividend Reinvestment Plan
In 1996, the Company instituted a direct stock purchase and dividend reinvestment plan (the “DRIP”) in which shareholders may purchase either newly issued or previously issued shares. There is no discount on shares purchased through the DRIP. The total amount of shares authorized under the DRIP is 1,500,000; from inception through December 31, 2009, 366,653 new shares have been issued.
75
12. Earnings per Share
The following table sets forth the computation of basic and diluted earnings per share with respect to income from continuing operations:
| For the years ended, | ||||||||||||
| 2009 | 2008(2) | 2007(2) | ||||||||||
| Numerator: |
||||||||||||
| Net income available to common shareholders |
$ | 50,642,000 | $ | 122,760,000 | $ | 103,607,000 | ||||||
| Less adjustment for earnings and gains from discontinued operations |
(23,870,000 | ) | (78,611,000 | ) | (70,470,000 | ) | ||||||
| Less allocation to participating securities for basic EPS(1) |
(458,000 | ) | (1,265,000 | ) | (503,000 | ) | ||||||
| Numerator for basic earnings per share from continuing operations |
$ | 26,314,000 | $ | 42,844,000 | $ | 32,634,000 | ||||||
| Less allocation to participating securities for diluted EPS(1) |
— | — | (1,000 | ) | ||||||||
| Numerator for diluted earnings per share from continuing operations |
$ | 26,314,000 | $ | 42,844,000 | $ | 32,633,000 | ||||||
| Denominator |
||||||||||||
| Denominator for basic earnings per share—weighted average shares |
52,760,000 | 51,050,000 | 50,735,000 | |||||||||
| Effect of dilutive securities: |
||||||||||||
| Stock based awards |
1,000 | 390,000 | 790,000 | |||||||||
| Denominator for diluted earnings per share adjusted for weighted average shares and assumed conversion |
52,761,000 | 51,440,000 | 51,525,000 | |||||||||
| Basic earnings per share from continuing operations |
$ | 0.50 | $ | 0.84 | $ | 0.64 | ||||||
| Basic earnings per share from discontinued operations |
0.45 | 1.54 | 1.39 | |||||||||
| Basic earnings per share |
$ | 0.95 | $ | 2.38 | $ | 2.03 | ||||||
| Diluted earnings per share from continuing operations |
$ | 0.50 | $ | 0.83 | $ | 0.63 | ||||||
| Diluted earnings per share from discontinued operations |
0.45 | 1.53 | 1.37 | |||||||||
| Diluted earnings per share |
$ | 0.95 | $ | 2.36 | $ | 2.00 | ||||||
| (1) | Adjustment to the numerators for diluted net income per share calculations when applying the two class method of calculating earnings per share. |
| (2) | Restated to reflect the adoption of new accounting guidance requiring retroactive application (Note 2 to our audited financial statements). |
Under FASB guidance the effect of anti-dilutive Operating Company units and shares under option have been excluded from the diluted earnings per share calculation. Weighted average Operating Company units totaled 780,000, 830,000, and 870,000 for the years ended December 31, 2009, 2008 and 2007, respectively. The anti-dilutive shares under option totaled 242,831, 82,198 and 32,326 for the years ended December 31, 2009, 2008 and 2007, respectively.
13. Retirement Plan
BRE has a 401K defined contribution retirement plan covering all employees with more than six months of continuous full-time employment. In addition to employee elective deferrals, in 2009, 2008 and 2007, BRE contributed up to 3% of the employee’s contributions up to $7,350 per employee in 2009 from $6,900 per employee in 2008 and $6,750 per employee in 2007. The aggregate amounts contributed and recognized as expense by BRE were $518,000, $414,000 and $463,000 for the years ended December 31, 2009, 2008 and 2007, respectively.
76
14. Related Party Transactions
BRE has notes receivable from third party non-controlling interest members of limited liability company subsidiaries of the Company totaling $7,363,000 and $7,418,000 at December 31, 2009 and 2008, respectively. The amounts are recorded in Other assets on the consolidated balance sheets. These notes mature in 2013 and have a weighted average interest rate of approximately 5%. Interest income from the notes totaled $374,000, $378,000 and $381,000 for the years ended December 31, 2009, 2008 and 2007, respectively. The Company has recourse to take over the ownership in the underlying assets from the third party non-controlling interest member in the event of default.
15. Commitments and Contingencies
Commitments
During the years ended December 31, 2009, 2008 and 2007, total operating lease payments incurred for office space, including real estate taxes, insurance, repairs and utilities, aggregated $1,405,000, $1,164,000, and $1,032,000 respectively.
The minimum future basic aggregate rental commitment under the Company’s operating leases is as follows:
| 2010 |
$ | 1,257,000 | |
| 2011 |
979,000 | ||
| 2012 |
905,000 | ||
| 2013 |
783,000 | ||
| 2014 |
829,000 | ||
| Thereafter |
952,000 | ||
| Total |
$ | 5,705,000 | |
The Company entered into an operating lease for office space in Denver, CO commencing on February 1, 2008 and ending on January 31, 2013. The Company has one option to extend the lease for either 3 or 5 years. The Company entered into an operating lease for office space in Seattle, WA commencing on June 1, 2007 and ending September 1, 2012. The Company has one option to extend the lease for 5 years. The Company entered into an operating lease for the corporate office located in San Francisco, CA commencing on August 1, 2005 and ending on February 1, 2016. BRE has two options to extend the term of the lease for an additional 5 years for each option. BRE entered into an operating lease for office space in Irvine, CA commencing on December 1, 2005 and ending on December 1, 2010. The Company has one option to extend the lease for 5 years. Over the term of each lease, rent is based on fixed contractual increases to the base rent and expense is recognized on a straight line basis.
Contingencies
The Company is involved in various legal actions arising in the ordinary course of business. As of December 31, 2009, there were no pending legal proceedings to which the Company is a party or of which any of its properties is the subject, the adverse determination of which the Company anticipates would have a material adverse effect upon its consolidated financial condition and results of operations.
16. Legal Settlements
Pinnacle Galleria
During 2001, the Company completed the Pinnacle Galleria joint venture development, a 236 unit operating community in Roseville, California.
77
During 2007, it was determined that breezeways and stair casings needed replacement as a result of construction defects and product failure. The Company requested that the various responsible subcontractors replace the original construction but not all subcontractors elected to participate. As a result, the Company hired an unrelated subcontractor to perform the repairs and a claim was filed against the original subcontractors. During the second quarter of 2007, the Company reached a binding settlement with one subcontractor for $1,900,000, which was recognized in Other income.
On December 3, 2008, the Company closed this legal matter by reaching a $4,400,000 settlement with the remaining subcontractors. The settlement was not subject to a good faith hearing and the full amount was recognized in Other income during the fourth quarter of 2008.
17. Subsequent Events
The Company has evaluated and disclosed subsequent events through February 12, 2010, the date of issuance of the financial statements.
18. Supplemental Financial Data (Unaudited)
Quarterly financial information follows:
| 2009 | ||||||||||||||||
| Quarter ended March 31 |
Quarter ended June 30 |
Quarter ended September 30 |
Quarter ended December 31 |
|||||||||||||
| (amounts in thousands, except per share data) | ||||||||||||||||
| Revenues* |
$ | 86,381 | $ | 86,257 | $ | 86,484 | $ | 85,482 | ||||||||
| Income/ (loss) from continuing operations |
15,189 | 16,451 | 12,639 | (3,809 | ) | |||||||||||
| Discontinued operations |
1,302 | 15,269 | 7,299 | — | ||||||||||||
| Redeemable noncontrolling interests in income |
(545 | ) | (545 | ) | (401 | ) | (394 | ) | ||||||||
| Preferred stock dividends |
(2,953 | ) | (2,953 | ) | (2,953 | ) | (2,953 | ) | ||||||||
| Net income/ (loss) available to common shareholders |
$ | 12,993 | $ | 28,222 | $ | 16,584 | $ | (7,156 | ) | |||||||
| Basic earnings (loss) per share from continuing operations |
$ | 0.22 | $ | 0.25 | $ | 0.17 | $ | (0.13 | ) | |||||||
| Basic earnings (loss) per share from discontinued operations |
0.03 | 0.29 | 0.14 | 0.00 | ||||||||||||
| Basic earnings (loss) per share |
$ | 0.25 | $ | 0.54 | $ | 0.31 | $ | (0.13 | ) | |||||||
| Diluted earnings (loss) per share from continuing operations |
$ | 0.22 | $ | 0.25 | $ | 0.17 | $ | (0.13 | ) | |||||||
| Diluted earnings (loss) per share from discontinued operations |
0.03 | 0.29 | 0.14 | 0.00 | ||||||||||||
| Diluted earnings (loss) per share |
$ | 0.25 | $ | 0.54 | $ | 0.31 | $ | (0.13 | ) | |||||||
78
| 2008(1) | ||||||||||||||||
| Quarter ended March 31 |
Quarter ended June 30 |
Quarter ended September 30 |
Quarter ended December 31 |
|||||||||||||
| (amounts in thousands, except per share data) | ||||||||||||||||
| Revenues* |
$ | 84,278 | $ | 86,133 | $ | 87,947 | $ | 86,926 | ||||||||
| Income from continuing operations |
12,917 | 13,946 | 15,319 | 16,069 | ||||||||||||
| Discontinued operations |
3,320 | 3,968 | 28,209 | 43,114 | ||||||||||||
| Redeemable noncontrolling interests in income |
(580 | ) | (580 | ) | (580 | ) | (550 | ) | ||||||||
| Preferred stock dividends |
(2,953 | ) | (2,953 | ) | (2,953 | ) | (2,953 | ) | ||||||||
| Net income available to common shareholders |
$ | 12,704 | $ | 14,381 | $ | 39,995 | $ | 55,680 | ||||||||
| Basic earnings per share from continuing operations |
$ | 0.18 | $ | 0.20 | $ | 0.23 | $ | 0.24 | ||||||||
| Basic earnings per share from discontinued operations |
0.07 | 0.08 | 0.55 | 0.84 | ||||||||||||
| Basic earnings per share |
$ | 0.25 | $ | 0.28 | $ | 0.78 | $ | 1.08 | ||||||||
| Diluted earnings per share from continuing operations |
$ | 0.19 | $ | 0.20 | $ | 0.22 | $ | 0.24 | ||||||||
| Diluted earnings per share from discontinued operations |
0.06 | 0.08 | 0.55 | 0.84 | ||||||||||||
| Diluted earnings per share |
$ | 0.25 | $ | 0.28 | $ | 0.77 | $ | 1.08 | ||||||||
| * | Revenue totals do not include revenues from discontinued operations, other income and partnership income. |
| (1) | Restated to reflect the adoption of new accounting guidance requiring retroactive application (Note 2 to our audited financial statements). |
For the years ended December 31, 2009, 2008 and 2007, the federal income tax components of the Company’s dividends on the common and preferred stock were as follows (unaudited).
| Ordinary Income |
Long Term Capital Gain |
Unrecaptured Section 1250 Gain |
Return of Capital |
|||||||||
| Common Stock |
||||||||||||
| December 31, 2009 |
86 | % | — | % | 14 | % | — | % | ||||
| December 31, 2008 |
28 | % | 52 | % | 20 | % | — | % | ||||
| December 31, 2007 |
41 | % | 51 | % | 8 | % | — | % | ||||
| Ordinary Income |
Long Term Capital Gain |
Unrecaptured Section 1250 Gain |
Return of Capital |
|||||||||
| Cumulative Redeemable Preferred Stock (all series) |
||||||||||||
| December 31, 2009 |
86 | % | — | % | 14 | % | — | % | ||||
| December 31, 2008 |
28 | % | 52 | % | 20 | % | — | % | ||||
| December 31, 2007 |
41 | % | 51 | % | 8 | % | — | % | ||||
79
BRE PROPERTIES, INC.
SCHEDULE III—REAL ESTATE AND ACCUMULATED DEPRECIATION
December 31, 2009
(Dollar amounts in thousands)
| Property Name |
Location |
Dates Acquired/ Constructed |
Initial Cost to Company | Costs Capitalized Subsequent to Acquisition |
Depreciable Lives-Years |
Gross Amount at Which Carried at December 31, 2009 | |||||||||||||||||||||||||
| Land | Building & Improvements |
Land | Building & Improvements |
Total | Accumulated Depreciation |
Encumbrances | |||||||||||||||||||||||||
| APARTMENTS |
|||||||||||||||||||||||||||||||
| Sharon Green |
Menlo Park, CA | 1971/1970 | $ | 1,250 | $ | 5,770 | $ | 11,368 | 40 | $ | 1,250 | $ | 17,138 | $ | 18,388 | $ | (13,159 | ) | * | * | |||||||||||
| Verandas |
Union City, CA | 1993/1989 | 3,233 | 12,932 | 4,556 | 40 | 3,233 | 17,488 | 20,721 | (7,949 | ) | ||||||||||||||||||||
| Foster’s Landing |
Foster City, CA | 1996/1987 | 11,742 | 47,846 | 12,166 | 40 | 11,742 | 60,012 | 71,754 | (21,745 | ) | ||||||||||||||||||||
| Pinnacle Crow Canyon |
San Ramon, CA | 1996/1992 | 8,724 | 34,895 | 9,228 | 40 | 8,724 | 44,123 | 52,847 | (16,307 | ) | ||||||||||||||||||||
| Lakeshore Landing |
San Mateo, CA | 1997/1988 | 8,547 | 34,228 | 7,050 | 40 | 8,547 | 41,278 | 49,825 | (14,715 | ) | ||||||||||||||||||||
| Mission Peaks |
Fremont ,CA | 1997/1995 | 11,747 | 47,082 | 34,000 | 40 | 11,747 | 81,082 | 92,829 | (29,792 | ) | ||||||||||||||||||||
| Deer Valley* |
San Rafael, CA | 1997/1996 | 6,042 | 24,169 | 3,281 | 40 | 6,042 | 27,450 | 33,492 | (9,331 | ) | ||||||||||||||||||||
| Pinnacle City Centre* |
Hayward, CA | 2000/2000 | 4,903 | 22,999 | 817 | 40 | 4,903 | 23,816 | 28,719 | (5,846 | ) | ||||||||||||||||||||
| Sun Pointe Village |
Fremont ,CA | 2000/1989 | 12,639 | 50,690 | 7,365 | 40 | 12,639 | 58,055 | 70,694 | (14,499 | ) | ||||||||||||||||||||
| Avenue 64 |
Emeryville, CA | 2007/2007 | 10,364 | 58,100 | 687 | 40 | 10,364 | 58,787 | 69,151 | (3,100 | ) | * | * | ||||||||||||||||||
| San Francisco Bay Area |
79,191 | 338,711 | 90,518 | 79,191 | 429,229 | 508,420 | (136,443 | ) | — | ||||||||||||||||||||||
| Montanosa |
San Diego, CA | 1992/1989-90 | 6,005 | 24,065 | 8,293 | 40 | 6,005 | 32,358 | 38,363 | (15,835 | ) | 31,256 | |||||||||||||||||||
| Esplanade |
San Diego, CA | 1993/1985 | 6,350 | 25,421 | 5,796 | 40 | 6,350 | 31,217 | 37,567 | (13,923 | ) | ||||||||||||||||||||
| Terra Nova Villas |
Chula Vista, CA | 1994/1985 | 2,925 | 11,699 | 3,395 | 40 | 2,925 | 15,094 | 18,019 | (6,517 | ) | ||||||||||||||||||||
| Canyon Villas |
Chula Vista, CA | 1996/1981 | 3,064 | 12,258 | 3,018 | 40 | 3,064 | 15,276 | 18,340 | (5,881 | ) | ||||||||||||||||||||
| Lakeview Village |
Spring Valley, CA | 1996/1985 | 3,977 | 15,910 | 3,922 | 40 | 3,977 | 19,832 | 23,809 | (7,552 | ) | ||||||||||||||||||||
| Countryside Village |
El Cajon, CA | 1996/1989 | 1,002 | 4,007 | 1,223 | 40 | 1,002 | 5,230 | 6,232 | (2,063 | ) | ||||||||||||||||||||
| Cambridge Park |
San Diego, CA | 1998/1998 | 7,628 | 30,521 | 5,888 | 40 | 7,628 | 36,409 | 44,037 | (12,240 | ) | ||||||||||||||||||||
| Carmel Landing |
San Diego, CA | 1999/1989 | 6,928 | 27,686 | 7,081 | 40 | 6,928 | 34,767 | 41,695 | (9,837 | ) | ||||||||||||||||||||
| Pinnacle at Carmel Creek |
San Diego, CA | 2000/2000 | 4,744 | 45,430 | 5,971 | 40 | 4,744 | 51,401 | 56,145 | (12,592 | ) | * | * | ||||||||||||||||||
| Pinnacle at Otay Ranch I & II |
Chula Vista, CA | 2001/2001 | 8,928 | 43,388 | 4,736 | 40 | 8,928 | 48,124 | 57,052 | (10,605 | ) | * | * | ||||||||||||||||||
| Mission Trails |
San Diego, CA | 2002/1987 | 5,315 | 21,310 | 2,223 | 40 | 5,315 | 23,533 | 28,848 | (5,270 | ) | ||||||||||||||||||||
| Bernardo Crest |
San Diego, CA | 2002/1988 | 6,016 | 24,115 | 3,535 | 40 | 6,016 | 27,650 | 33,666 | (6,504 | ) | ||||||||||||||||||||
| Carmel Summit |
San Diego, CA | 2006/1989 | 16,025 | 36,611 | 7,458 | 40 | 16,025 | 44,069 | 60,094 | (5,557 | ) | ||||||||||||||||||||
| San Diego |
78,907 | 322,421 | 62,539 | 78,907 | 384,960 | 463,867 | (114,376 | ) | 31,256 | ||||||||||||||||||||||
| Village Green |
La Habra, CA | 1972/1971 | 372 | 2,763 | 2,869 | 40 | 372 | 5,632 | 6,004 | (4,218 | ) | ||||||||||||||||||||
| Sycamore Valley |
Fountain Valley, CA | 1996/1969 | 4,617 | 18,691 | 5,275 | 40 | 4,617 | 23,966 | 28,583 | (9,320 | ) | ||||||||||||||||||||
| Villa Santana* |
Santa Ana, CA | 1997/1986 | 3,016 | 12,180 | 2,436 | 40 | 3,016 | 14,616 | 17,632 | (5,295 | ) | ||||||||||||||||||||
| Parkside Court* |
Santa Ana, CA | 1997/1987 | 2,013 | 8,632 | 2,087 | 40 | 2,013 | 10,719 | 12,732 | (3,835 | ) | ||||||||||||||||||||
| Villa Siena |
Costa Mesa, CA | 1999/1974 | 4,853 | 19,739 | 10,610 | 40 | 4,853 | 30,349 | 35,202 | (8,148 | ) | ||||||||||||||||||||
| Cortesia at Rancho Santa Margarita |
Rancho Santa Margarita, CA |
2000/1999 | 7,740 | 30,982 | 3,682 | 40 | 7,740 | 34,664 | 42,404 | (8,543 | ) | ||||||||||||||||||||
80
BRE PROPERTIES, INC.
SCHEDULE III—REAL ESTATE AND ACCUMULATED DEPRECIATION
December 31, 2009
(Dollar amounts in thousands)
| Property Name |
Location |
Dates Acquired/ Constructed |
Initial Cost to Company | Costs Capitalized Subsequent to Acquisition |
Depreciable Lives-Years |
Gross Amount at Which Carried at December 31, 2009 | ||||||||||||||||||
| Land | Building & Improvements |
Land | Building & Improvements |
Total | Accumulated Depreciation |
Encumbrances | ||||||||||||||||||
| The Palms at Laguna Niguel |
Rancho Niguel, CA | 2001/1988 | 12,572 | 50,308 | 4,245 | 40 | 12,572 | 54,553 | 67,125 | (12,751 | ) | * | * | |||||||||||
| Pinnacle at MacArthur Place |
South Coast Metro, CA | 2002/2002 | 8,155 | 54,257 | 4,254 | 40 | 8,155 | 58,511 | 66,666 | (10,880 | ) | * | * | |||||||||||
| Pinnacle at Fullerton |
Fullerton, CA | 2004/2004 | 7,087 | 36,869 | 900 | 40 | 7,087 | 37,769 | 44,856 | (5,403 | ) | * | * | |||||||||||
| Pinnacle at Talega |
San Clemente, CA | 2004/2003 | 17,125 | 48,171 | 3,015 | 40 | 17,125 | 51,186 | 68,311 | (8,794 | ) | * | * | |||||||||||
| Renaissance at Uptown Orange |
Orange | 2007/2007 | 16,603 | 99,175 | 996 | 40 | 16,603 | 100,171 | 116,774 | (5,623 | ) | |||||||||||||
| Park Viridian |
Anaheim, CA | 2009/2009 | 9,629 | 79,042 | 56 | 40 | 9,629 | 79,098 | 88,727 | (1,215 | ) | |||||||||||||
| Orange County |
93,782 | 460,809 | 40,425 | 93,782 | 501,234 | 595,016 | (84,025 | ) | — | |||||||||||||||
| Windrush Village |
Colton, CA | 1996/1985 | 3,747 | 14,989 | 2,977 | 40 | 3,747 | 17,966 | 21,713 | (6,599 | ) | |||||||||||||
| The Summit |
Chino Hills, CA | 1996/1989 | 1,838 | 7,354 | 3,044 | 40 | 1,838 | 10,398 | 12,236 | (3,811 | ) | |||||||||||||
| Parkside Village* |
Riverside, CA | 1997/1987 | 3,417 | 13,674 | 2,970 | 40 | 3,417 | 16,644 | 20,061 | (5,706 | ) | |||||||||||||
| Boulder Creek |
Riverside, CA | 2002/1985 | 3,564 | 14,306 | 3,177 | 40 | 3,564 | 17,483 | 21,047 | (4,324 | ) | |||||||||||||
| Emerald Pointe* |
Diamond Bar, CA | 2002/1989 | 5,052 | 20,248 | 2,329 | 40 | 5,052 | 22,577 | 27,629 | (5,150 | ) | |||||||||||||
| Pinnacle at Riverwalk |
Riverside, CA | 2003/1986 | 14,603 | 58,237 | 9,841 | 40 | 14,603 | 68,078 | 82,681 | (14,162 | ) | |||||||||||||
| Enclave at Town Square |
Chino Hills, CA | 2003/1987 | 2,473 | 10,069 | 2,344 | 40 | 2,473 | 12,413 | 14,886 | (3,138 | ) | |||||||||||||
| Mission Grove Park |
Riverside, CA | 2005 | 15,120 | 61,873 | 1,824 | 40 | 15,120 | 63,697 | 78,817 | (8,167 | ) | 32,332 | ||||||||||||
| The Heights I & II |
Chino Hills, CA | 2004/2005 | 9,132 | 58,844 | 1,286 | 40 | 9,132 | 60,130 | 69,262 | (6,952 | ) | |||||||||||||
| Galleria at Towngate |
Moreno Valley, CA | 2006 | 3,640 | 35,579 | 706 | 40 | 3,640 | 36,285 | 39,925 | (3,516 | ) | |||||||||||||
| Inland Empire |
62,586 | 295,173 | 30,498 | 62,586 | 325,671 | 388,257 | (61,525 | ) | 32,332 | |||||||||||||||
| Candlewood North |
Northridge, CA | 1996/1964-95 | 2,110 | 8,477 | 2,004 | 40 | 2,110 | 10,481 | 12,591 | (3,940 | ) | |||||||||||||
| Pinnacle at Westridge |
Valencia, CA | 2002/2004 | 11,253 | 31,465 | 823 | 40 | 11,253 | 32,288 | 43,541 | (4,444 | ) | * | * | |||||||||||
| Canyon Creek |
Northridge, CA | 2003/1986 | 6,152 | 24,650 | 3,176 | 40 | 6,152 | 27,826 | 33,978 | (5,488 | ) | |||||||||||||
| Summerwind Townhomes |
Harbor City, CA | 2004/1987 | 6,950 | 27,879 | 4,052 | 40 | 6,950 | 31,931 | 38,881 | (6,332 | ) | |||||||||||||
| Regency Palm Court |
Los Angeles, CA | 2004/1987 | 2,049 | 8,277 | 1,269 | 40 | 2,049 | 9,546 | 11,595 | (1,908 | ) | |||||||||||||
| Windsor Court |
Los Angeles, CA | 2004/1987 | 1,638 | 6,631 | 1,206 | 40 | 1,638 | 7,837 | 9,475 | (1,632 | ) | |||||||||||||
| Tiffany Court |
Los Angeles, CA | 2004/1987 | 3,033 | 12,211 | 2,376 | 40 | 3,033 | 14,587 | 17,620 | (2,980 | ) | |||||||||||||
| Villa Azure |
Los Angeles, CA | 2004/2001 | 40,560 | 96,565 | 6,105 | 40 | 40,560 | 102,670 | 143,230 | (14,717 | ) | 68,569 | ||||||||||||
| Catalina Gardens |
Los Angeles, CA | 2005/1987 | 6,400 | 20,309 | 921 | 40 | 6,400 | 21,230 | 27,630 | (2,485 | ) | |||||||||||||
| Bridgeport Coast |
Santa Clarita, CA | 2006 | 11,500 | 28,741 | 291 | 40 | 11,500 | 29,032 | 40,532 | (2,619 | ) | * | * | |||||||||||
| The Stuart at Sierra Madre* |
Pasadena | 2007/2007 | 7,926 | 55,733 | 517 | 40 | 7,926 | 56,250 | 64,176 | (2,786 | ) | |||||||||||||
| 5600 Wilshire |
Los Angeles, CA | 2008/2008 | 32,825 | 100,993 | 131 | 40 | 32,825 | 101,124 | 133,949 | (2,547 | ) | |||||||||||||
| Los Angeles |
132,396 | 421,931 | 22,871 | 132,396 | 444,802 | 577,198 | (51,878 | ) | 68,569 | |||||||||||||||
| Selby Ranch |
Sacramento, CA | 1986/1971-74 | 2,660 | 18,340 | 11,262 | 40 | 2,660 | 29,602 | 32,262 | (16,315 | ) | * | * | |||||||||||
| Sacramento |
2,660 | 18,340 | 11,262 | 2,660 | 29,602 | 32,262 | (16,315 | ) | — | |||||||||||||||
81
BRE PROPERTIES, INC.
SCHEDULE III—REAL ESTATE AND ACCUMULATED DEPRECIATION
December 31, 2009
(Dollar amounts in thousands)
| Property Name |
Location |
Dates Acquired/ Constructed |
Initial Cost to Company | Costs Capitalized Subsequent to Acquisition |
Depreciable Lives-Years |
Gross Amount at Which Carried at December 31, 2009 | ||||||||||||||||||||||||||
| Land | Building & Improvements |
Land | Building & Improvements |
Total | Accumulated Depreciation |
Encumbrances | ||||||||||||||||||||||||||
| Pinnacle at South Mountain I & II* |
Phoenix, AZ | 1997/1996 | 11,062 | 44,257 | 3,065 | 40 | 11,062 | 47,322 | 58,384 | (15,003 | ) | * | * | |||||||||||||||||||
| Pinnacle Towne Center* |
Phoenix, AZ | 1998/1998 | 6,688 | 27,631 | 1,773 | 40 | 6,688 | 29,404 | 36,092 | (8,893 | ) | * | * | |||||||||||||||||||
| Phoenix |
17,750 | 71,888 | 4,838 | 17,750 | 76,726 | 94,476 | (23,896 | ) | — | |||||||||||||||||||||||
| Parkwood at Mill Creek |
Mill Creek, WA | 1989/1989 | 3,947 | 15,811 | 2,212 | 40 | 3,947 | 18,023 | 21,970 | (9,088 | ) | |||||||||||||||||||||
| Shadowbrook |
Redmond, WA | 1987-98/1986 | 4,776 | 17,415 | 4,618 | 40 | 4,776 | 22,033 | 26,809 | (12,137 | ) | |||||||||||||||||||||
| Citywalk |
Seattle, WA | 1988/1988 | 1,123 | 4,276 | 899 | 40 | 1,123 | 5,175 | 6,298 | (2,783 | ) | |||||||||||||||||||||
| Thrasher’s Mill |
Bothell, WA | 1996/1988 | 2,031 | 8,223 | 1,988 | 40 | 2,031 | 10,211 | 12,242 | (3,970 | ) | |||||||||||||||||||||
| Ballinger Commons |
Seattle, WA | 1996/1989 | 5,824 | 23,519 | 4,581 | 40 | 5,824 | 28,100 | 33,924 | (10,671 | ) | |||||||||||||||||||||
| Montebello |
Kirkland, WA | 1998/1998 | 6,680 | 27,274 | 1,343 | 40 | 6,680 | 28,617 | 35,297 | (8,754 | ) | |||||||||||||||||||||
| Park Highland |
Bellevue, WA | 1998/1993 | 5,602 | 22,483 | 2,906 | 40 | 5,602 | 25,389 | 30,991 | (7,882 | ) | |||||||||||||||||||||
| Pinnacle Belle Centre |
Bellevue, WA | 2000/2000 | 11,163 | 32,821 | 1,575 | 40 | 11,163 | 34,396 | 45,559 | (7,834 | ) | * | * | |||||||||||||||||||
| Pinnacle Sonata |
Bothell, WA | 2002/2000 | 8,576 | 39,067 | 592 | 40 | 8,576 | 39,659 | 48,235 | (8,213 | ) | |||||||||||||||||||||
| Pinnacle at Lake Washington |
Renton, WA | 2001/2001 | 4,878 | 26,184 | 1,903 | 40 | 4,878 | 28,087 | 32,965 | (5,652 | ) | * | * | |||||||||||||||||||
| The Audrey at Belltown |
Seattle, WA | 2001/1992 | 4,279 | 17,259 | 2,638 | 40 | 4,279 | 19,897 | 24,176 | (4,627 | ) | |||||||||||||||||||||
| The Trails of Redmond |
Redmond, WA | 2004/1985 | 17,413 | 45,013 | 8,981 | 40 | 17,413 | 53,994 | 71,407 | (10,600 | ) | |||||||||||||||||||||
| Taylor 28 |
Seattle, WA | 2009/2009 | 8,100 | 52,101 | 57 | 40 | 8,100 | 52,158 | 60,258 | (852 | ) | |||||||||||||||||||||
| Seattle |
84,392 | 331,446 | 34,293 | 84,392 | 365,739 | 450,131 | (93,063 | ) | — | |||||||||||||||||||||||
| Partially Completed Multi Family |
— | 58,327 | — | 40 | — | 58,327 | 58,327 | (104 | ) | |||||||||||||||||||||||
| Non-Multi |
||||||||||||||||||||||||||||||||
| Gateway at Emeryville |
Emeryville, CA | 10,201 | 2,328 | 150 | 2 | 10,201 | 2,478 | 12,679 | (2,328 | ) | — | |||||||||||||||||||||
| TOTAL |
$ | 561,865 | $ | 2,321,374 | $ | 297,394 | $ | 561,865 | $ | 2,618,768 | $ | 3,180,633 | $ | (583,953 | ) | $ | 752,157 | |||||||||||||||
| * | Property held by a consolidated subsidiary of the Company |
| ** | Properties secure the Company’s $620,000,000 credit facility with Deutsche Bank Berkshire Mortgage, Inc. |
82
BRE PROPERTIES, INC.
SCHEDULE III—REAL ESTATE AND ACCUMULATED DEPRECIATION
December 31, 2009
(Amounts in thousands)
The activity in investments in rental properties and related depreciation for the three-year period ended December 31, 2009 is as follows:
Investments in rental properties:
| Years ended December 31, | ||||||||||||
| 2009 | 2008(1) | 2007(1) | ||||||||||
| Balance at beginning of year |
$ | 2,927,481 | $ | 2,824,383 | $ | 2,726,501 | ||||||
| Transfers from construction in progress |
283,434 | 177,246 | 129,973 | |||||||||
| Transfers of rental property to other assets |
— | (1,646 | ) | — | ||||||||
| Capital expenditures |
20,240 | 18,596 | 17,503 | |||||||||
| Rehabilitation expenditures |
7,097 | 16,806 | 29,140 | |||||||||
| Investments sold |
(59,663 | ) | (105,034 | ) | (60,227 | ) | ||||||
| Investments classified as held for sale |
— | — | (16,892 | ) | ||||||||
| Change in accrued improvements to direct investment in real estate costs |
2,044 | (2,870 | ) | (1,615 | ) | |||||||
| Balance at end of year |
$ | 3,180,633 | $ | 2,927,481 | $ | 2,824,383 | ||||||
Accumulated depreciation on rental properties:
| Years ended December 31, | ||||||||||||
| 2009 | 2008(1) | 2007(1) | ||||||||||
| Balance at beginning of year |
$ | 514,388 | $ | 458,474 | $ | 401,893 | ||||||
| Provision for depreciation, including discontinued operations |
88,419 | 81,459 | 79,949 | |||||||||
| Dispositions |
(18,854 | ) | (25,545 | ) | (23,368 | ) | ||||||
| Balance at end of year |
$ | 583,953 | $ | 514,388 | $ | 458,474 | ||||||
Certain balances have been reclassified to real estate held for sale, net.
| (1) | Restated to reflect the adoption of new accounting guidance requiring retroactive application (Note 2 to our audited financial statements). |
83
INDEX TO EXHIBITS
| Exhibit No. |
Description | |
| 3.0 | Amended and Restated Articles of Incorporation (previously filed on April 1, 1996 as Exhibit 3.1 to the Registrant’s Current Report on Form 8-K and incorporated by reference herein) | |
| 3.1 | Articles of Amendment of BRE Properties, Inc., incorporated by reference to Annex A to the Definitive Proxy Statement filed by the Registrant with the Commission on April 5, 2005. | |
| 3.2 | Articles Supplementary of the Registrant, reclassifying all 2,300,000 shares of 8.50% Series A Cumulative Redeemable Preferred Stock as Preferred Stock and classifying and designating the terms of the 6.75% Series C Cumulative Redeemable Preferred Stock (previously filed on March 1, 2004 as Exhibit 3.4 of the Registrant’s Form 8-A and incorporated by reference herein) | |
| 3.3 | Articles Supplementary of the Registrant, classifying and designating the terms of the 6.75% Series D Cumulative Redeemable Preferred Stock (previously filed on December 8, 2004 as Exhibit 1.5 of the Registrant’s Form 8-A and incorporated by reference herein) | |
| 3.4 | Certificate of Correction of the Registrant (previously filed on January 29, 1999 as Exhibit 1.3 to the Registrant’s Form 8-A and incorporated by reference herein) | |
| 3.5 | Second Amended and Restated By-Laws of the Registrant (previously filed on May 23, 2007 as Exhibit 3.1 to the Registrant’s Current Report on Form 8-K and incorporated by reference herein) | |
| 4.0 | Indenture dated as of June 23, 1997 between the Registrant and Chase Trust Company of California (previously filed on June 23, 1997 as Exhibit 4.1 to the Registrant’s Current Report on Form 8-K and incorporated by reference herein) | |
| 4.1 | First Supplemental Indenture dated as of April 23, 1998 between the Registrant and Chase Manhattan Bank and Trust Company, National Association, as successor trustee (previously filed on May 14, 1998 as Exhibit 4.1 to the Registrant’s Quarterly Report on Form 10-Q for the quarter ended March 31, 1998 and incorporated by reference herein) | |
| 4.2 | Second Supplemental Indenture, dated as of August 15, 2006, between BRE Properties, Inc. and J.P. Morgan Trust Company, National Association, as trustee, including the form of 4.125% Convertible Senior Notes due 2026 (previously filed on August 21, 2006 as Exhibit 4.1 to the Registrant’s Current Report on Form 8-K and incorporated by reference herein) | |
| 4.3 | Third Supplemental Indenture, dated as of November 3, 2006, between BRE Properties, Inc. and The Bank of New York Trust Company, National Association (successor to J.P. Morgan Trust Company, National Association) (previously filed on November 8, 2006 as Exhibit 4.1 to the Registrant’s Current Report on Form 8-K and incorporated by reference herein) | |
| 4.4 | Form of Note due 2013 (previously filed on February 24, 1998 as Exhibit 4.2 to the Registrant’s Current Report on Form 8-K and incorporated by reference herein) | |
| 4.5 | Form of Note due 2011 (previously filed on January 12, 2001 as Exhibit 4.1 to the Registrant’s Current Report on Form 8-K and incorporated by reference herein) | |
| 4.6 | $310,000,000 Fixed Facility Note (Standard Maturity), dated as of April 7, 2009 (previously filed on April 7, 2009 as Exhibit 10.2 to the Registrant’s Current Report on Form 8-K and incorporated by reference herein). | |
| 4.7 | Equity Distribution Agreement, dated as of May 14, 2009, between the Registrant and Goldman Sachs & Co. (previously filed on May 14, 2009 as Exhibit 1.1 to the Registrants Current Report on the Form 8-K and incorporated by reference herein). | |
| Exhibit No. |
Description | |
| 4.8 | Form of Note due 2014 (previously filed on March 16, 2004 as Exhibit 4.2 to the Registrant’s Current Report on Form 8-K and incorporated by reference herein) | |
| 4.9 | Form of Note due 2010 (previously filed on May 18, 2005 as Exhibit 4.3 to the Registrant’s Current Report on Form 8-K and incorporated by reference herein) | |
| 4.10 | Specimen Common Stock Certificate (previously filed on February 17, 2004 as Exhibit 4.7 to the Registrant’s Annual Report on Form 10-K for the year ended December 31, 2003 and incorporated by reference herein) | |
| 4.11 | Specimen 6.75% Series C Cumulative Redeemable Preferred Stock Certificate (previously filed on March 1, 2004 as Exhibit 4.1 to the Registrant’s Form 8-A and incorporated by reference herein) | |
| 4.12 | Specimen 6.75% Series D Cumulative Redeemable Preferred Stock Certificate (previously filed on December 8, 2004 as Exhibit 1.6 to the Registrant’s Form 8-A and incorporated by reference herein) | |
| 10.0* | Amended and Restated 1992 Employee Stock Plan (previously filed on November 14, 1997 as Exhibit 10.45 to the Registrant’s Quarterly Report on Form 10-Q for the quarter ended September 30, 1997 and incorporated by reference herein) | |
| 10.1 | $310,000,000 Fixed Facility Note (Fixed + 1 Maturity), dated as of August 3, 2009 (previously filed on August 5, 2009 as Exhibit 10.1 to the Registrant’s Current Report on Form 8-K and incorporated by reference herein). | |
| 10.2 | Employment Agreement, dated as of August 7, 2009, between the registrant and John A. Schissel (previously filed on August 13, 2009 as Exhibit 10.1 to the Registrant’s Current Report on Form 8-K and incorporated by reference herein). | |
| 10.3 | Fifth Amended and Restated Non-Employee Director Stock Option and Restricted Stock Plan (previously filed on November 5, 2007 as Exhibit 10.2 to the Registrant’s Quarterly Report on From 10-Q for the quarter ended September 30, 2007 and incorporated by reference herein) | |
| 10.4* | Amended and Restated 1999 BRE Stock Incentive Plan (previously filed on March 17, 2008 as Annex D to the Registrant’s Proxy Statement on Schedule 14A and incorporated by reference herein) | |
| 10.5 | Dividend Reinvestment Plan (previously filed on August 9, 1996 in the Registrant’s Registration Statement on Form S-3 (File No. 333-09945) and incorporated by reference herein) | |
| 10.6* | BRE Properties Inc. Deferred Compensation Plan effective January 1, 2000 (previously filed on March 24, 2000 as Exhibit 10.44 to the Registrant’s Annual Report on Form 10-K for the year ended December 31, 1999, as amended by the Annual Report on Form 10-K/A filed on August 4, 2000 and incorporated by reference herein) | |
| 10.7* | Amended and Restated Employment agreement with Constance B. Moore dated November 20, 2006 (previously filed November 21, 2006 as Exhibit 10.1 to the Registrant’s Current Report on Form 8-K and incorporated by reference herein) | |
| 10.8* | First Amendment to the Amended and Restated Employment Agreement with Constance B. Moore dated December 31, 2008 (previously filed on February 18, 2009 as Exhibit 10.8 to the Registrant’s Annual Report on Form 10-K for the year ended December 31, 2008 and incorporated by reference herein) | |
| 10.9* | Amended and Restated Employment Agreement with Edward F. Lange, Jr. dated November 20, 2006 (previously filed on November 21, 2006 as Exhibit 10.2 to the Registrant’s Current Report on Form 8-K and incorporated by reference herein) | |
| 10.10* | First Amendment to the Amended and Restated Employment Agreement with Edward F. Lange, Jr. dated December 31, 2008 (previously filed on February 18, 2009 as Exhibit 10.10 to the Registrant’s Annual Report on Form 10-K for the year ended December 31, 2008 and incorporated by reference herein) | |
| Exhibit No. |
Description | |
| 10.11* | Employment Agreement with Stephen C. Dominiak dated August 12, 2008 (previously filed on August 13, 2008—Exhibit 99.2 to the Registrant’s current Report on Form 8-K and incorporated by reference herein) | |
| 10.12* | First Amendment to the Employment Agreement with Stephen C. Dominiak dated December 31, 2008 (previously filed on February 18, 2009 as Exhibit 10.12 to the Registrant’s Annual Report on Form 10-K for the year ended December 31, 2008 and incorporated by reference herein) | |
| 10.13* | Employment Agreement with Kerry Fanwick dated January 2, 2007 (previously filed on November 6, 2008 as Exhibit 10.2 to the Registrant’s Quarterly Report on Form 10-Q and incorporated by reference herein) | |
| 10.14* | First Amendment to the Employment Agreement with Kerry Fanwick dated December 31, 2008 (previously filed on February 18, 2009 as Exhibit 10.14 to the Registrant’s Annual Report on Form 10-K for the year ended December 31, 2008 and incorporated by reference herein) | |
| 10.15* | Form of Indemnification Agreement (previously filed on February 27, 2002 as Exhibit 10.54 to the Registrant’s Annual Report on Form 10-K and incorporated by reference herein) | |
| 10.16 | Treasury rate guarantee hedge with Morgan Stanley, dated November 21, 1997 (previously filed on March 26, 1998 as Exhibit 10.36 to the Registrant’s Annual Report on Form 10-K for the year ended December 31, 1997 and incorporated by reference herein) | |
| 10.17 | Amended and Restated Limited Liability Company Agreement of BRE Property Investors LLC, dated as November 18, 1997 (previously filed on December 18, 1997 as Exhibit 10.1 to the Registrant’s Current Report on Form 8-K and incorporated by reference herein) | |
| 10.18 | Contribution Agreement dated as of September 29, 1997 between the Registrant, BRE Property Investors LLC and the TCR Signatories (previously filed on November 14, 1997 as Exhibit 10.44 to the Registrant’s Quarterly Report on Form 10-Q for the quarter ended September 30, 1997 and incorporated by reference herein) | |
| 10.19 | Registration Rights Agreement among the Registrant, BRE Property Investors LLC and the other signatories thereto dated November 18, 1997 (previously filed on December 3, 1997 as Exhibit 4.6 to the Registrant’s Registration Statement on Form S-3 (No. 333-41433), as amended, and incorporated by reference herein) | |
| 10.20 | Registration Rights Agreement between the Registrant and Legg Mason Unit Investment Trust Series 7, Legg Mason REIT Trust, December 1998 Series, dated as of December 23, 1997, (previously filed on January 27, 1998 as Exhibit 4.6 of the Registrant’s Registration Statement on Form S-3 (No. 333-44997), as amended, and incorporated by reference herein) | |
| 10.21* | Retirement Plan for Employees of BRE Properties, Inc. (previously filed on March 12, 2003 as Exhibit 10.45 to the Registrant’s Annual Report on Form 10-K for the year ended December 31, 2002, as amended by the Annual Report on the Registrant’s Form 10-K/A on June 12, 2003 and incorporated by reference herein) | |
| 10.22* | Form of option agreement for the 1999 BRE Stock Incentive Plan (previously filed on March 16, 2005 as Exhibit 10.48 to the Registrant’s Annual Report on Form 10-K for the year ended December 31, 2004 and incorporated by reference herein) | |
| 10.23* | Form of option agreement for the Second Amended and Restated Non-Employee Directors Stock Option and Restricted Stock Plan (previously filed on March 16, 2005 as Exhibit 10.49 to the Registrant’s Annual Report on Form 10-K for the year ended December 31, 2004 and incorporated by reference herein) | |
| 10.24* | Form of performance stock award for the 1999 BRE Stock Incentive Plan (previously filed on March 16, 2005 as Exhibit 10.50 to the Registrant’s Annual Report on Form 10-K for the year ended December 31, 2004 and incorporated by reference herein) | |
| Exhibit No. |
Description | |
| 10.25* | Form of 2005 performance stock award for the 1999 BRE Stock Incentive Plan (previously filed on March 1, 2007 as Exhibit 10.45 to the Registrant’s Annual Report on Form 10-K for the year ended December 31, 2006 and incorporated by reference herein) | |
| 10.26* | Performance stock award agreement with Edward F. Lange, Jr., dated as of October 23, 2008 under the 1999 BRE Stock Incentive Plan (previously filed on October 29, 2008 as Exhibit 99.1 to the Registrant’s current report on Form 8-K and incorporated by reference herein) | |
| 10.27* | Form of restricted stock award agreement for the Second Amended and Restated Non-Employee Directors Stock Option and Restricted Stock Plan (previously filed on March 16, 2005 as Exhibit 10.51 to the Registrant’s Annual Report on Form 10-K for the year ended December 31, 2004 and incorporated by reference herein) | |
| 10.28* | Form of certificate of stock option grant for 1999 BRE Stock Incentive Plan (previously filed on February 2, 2010 as Exhibit 10.2 to the Registrant’s Current Report on Form 8-K and incorporated by reference herein) | |
| 10.29* | Form of performance stock award agreement for the 1999 BRE Stock Incentive Plan (previously filed on February 2, 2010 as Exhibit 10.1 to the Registrant’s Current Report on Form 8-K and incorporated by reference herein) | |
| 10.30* | Form of restricted stock award agreement for the Fifth Amended and Restated Non-Employee Directors Stock Option and Restricted Stock Plan | |
| 10.31* | Form of restricted stock award agreement for the 1999 BRE Stock Incentive Plan | |
| 10.32 | Amended and Restated Credit Agreement by and among BRE Properties, Inc., as borrower, the lenders party thereto and each of Wachovia Capital Markets, LLC and RBS Securities Corporation, as joint lead arrangers and joint book managers, Wachovia Bank, National Association, as administrative agent, The Royal Bank of Scotland, plc, as syndication agent, and Bank of America, N.A., JPMorgan Chase Bank, N.A. and Deutsche Bank Securities, Inc., as co-documentation agents, entered into as of September 18, 2007 (previously filed on September 20, 2007 as Exhibit 10.1 to the Registrant’s Current Report on Form 8-K and incorporated by reference herein). | |
| 12 | Statements re: computation of ratios | |
| 14 | Code of Ethics (previously filed on March 7, 2006 as Exhibit 14 to the Registrant’s Annual Report on Form 10-K for the year ended December 31, 2005 and incorporated by reference herein) | |
| 21 | Subsidiaries of the Registrant | |
| 23 | Consent of Ernst & Young LLP | |
| 31.1 | Certification of Chief Executive Officer pursuant to Section 302 of the Sarbanes-Oxley Act of 2002 | |
| 31.2 | Certification of Chief Financial Officer pursuant to section 302 of the Sarbanes-Oxley Act of 2002. | |
| 32.1 | Certification of Chief Executive Officer pursuant to Section 906 of the Sarbanes-Oxley Act of 2002 | |
| 32.2 | Certification of Chief Financial Officer pursuant to Section 906 of the Sarbanes-Oxley Act of 2002 | |
| * | Management contract, or compensatory plan or agreement. |